KAZAKHSTAN - Reproductive Health Supplies Coalition
238
KAZAKHSTAN MULTIPLE INDICATOR CLUSTER SURVEY (MICS), 2006 I KAZAKHSTAN Multiple Indicator Cluster Survey 2006 Monitoring the situation of children and women United Nations Children’s Fund Agency of the Republic of Kazakhstan on Statistics United States Agency for International Development United Nations Population Fund United Nations Resident Coordinator International Labour Organization
-
Upload
khangminh22 -
Category
Documents
-
view
0 -
download
0
Transcript of KAZAKHSTAN - Reproductive Health Supplies Coalition

KAZAKHSTAN MULTIPLE INDICATOR CLUSTER SURVEY (MICS), 2006 I
KAZAKHSTAN
Multiple Indicator Cluster Survey 2006
Monitoring the situation of children and women
United Nations Children’s Fund
Agency of the Republic of Kazakhstan on Statistics
United States Agency for International Development
United Nations Population Fund
United Nations Resident Coordinator
International Labour Organization

Contributor’s to the Report: Erbolat MussabekGyulnar KukanovaGaziza Moldakulova
Kazakhstan Multiple Indicator Cluster Survey (MICS) first conducted in Kazakhstan in 2006 by the Agency of the Republic of Kazakhstan on Statistic in collaboration with the Republican State Enterprise “Data Computing Centre”. Financial, methodological and technical support was provided by the United Nations Children’s Fund (UNICEF) and with financial support of United States Agency for International Development (USAID), United Nations Population Fund (UNFPA), UN Resident Coordinator Fund (UN ResCor) and International Labour Organization (ILO).
The survey has been conducted as part of the third round of MICS surveys (MICS3), carried out around the world in more than 50 countries, in 2005-2006, following the first two rounds of MICS surveys that were conducted in 1995 and the year 2000. Survey tools are based on the models and standards developed by the global MICS project, designed to collect information on the situation of children and women in countries around the world. Additional information on the global MICS project may be obtained from www.childinfo.org.
Suggested citation:United Nations Children’s Fund (UNICEF), Agency of the Republic of Kazakhstan on Statistic
© Agency of the Republic of Kazakhstan on Statistics, 2007
© UNICEF, Kazakhstan 2007
Any information from this publication may be freely reproduced, but proper acknowledgement of the source must be provided.
The publication is not for sale
Agency of the Republic of Kazakhstan on Statistics 010000, Astana City, Left Bank of Ishim River The House of Ministries, 35th Street, 4th Gate Fax: (7172) 74-94-94 E-Mail: [email protected]
United Nations Children’s Fund (UNICEF) in the Republic of Kazakhstan 010000, Astana City, 10A, Beibitshilik str., Block 1 Tel: (+7 7172) 32-17-97, 32-29-69 Fax: (+7 7172) 32-18-03 Web: www.unicef.org

KAZAKHSTAN
Multiple Indicator Cluster Survey
2006
Final Report
Astana, 2007

MONITORING THE SITUATION OF CHILDREN AND WOMENii
Summary Table of FindingsMultiple Indicator Cluster Surveys (MICS) and Millennium Development Goals (MDG) Indicators, Kazakhstan, 2006
TopicMICS
Indicator Number
MDG Indicator Number
Indicator Value
CHILD MORTALITY
Child mortality 1 13 Under-five mortality rate 36.3 per thousand
2 14 Infant mortality rate 31.8 per thousand
NUTRITION
Nutritional status 6 4 Underweight prevalence 4.0 percent
7 Stunting prevalence 12.8 percent
8 Wasting prevalence 3.8 percent
Breastfeeding 45 Timely initiation of breastfeeding 64.2 percent
15 Exclusive breastfeeding rate 16.8 Percent
16 Continued breastfeeding rate
at 12-15 months
at 20-23 months
57.1
16.2
percent
percent
17 Timely complementary feeding rate 39.1 percent
18 Frequency of complementary feeding 24.0 percent
19 Adequately fed infants 20.7 percent
Salt iodization 41 Iodized salt consumption 92.0 percent
Low birth weight 9 Low birth weight infants 5.8 percent
10 Infants weighed at birth 99.4 percent
CHILD HEALTH
Immunization 25 Tuberculosis immunization coverage 97.9 percent
26 Polio immunization coverage 93.9 percent
27 DPT immunization coverage 91.7 percent
28 15 Measles immunization coverage 94.7 percent
31 Fully immunized children 81.0 percent
29 Hepatitis B immunization coverage 92.3 percent

KAZAKHSTAN MULTIPLE INDICATOR CLUSTER SURVEY (MICS), 2006 iii
Care of illness 33 Use of oral rehydration therapy (ORT) 74.0 percent
34 Home management of diarrhoea 21.8 percent
35 Received ORT or increased fluids, and continued feeding
48.0 percent
23 Care seeking for suspected pneumonia 70.5 percent
22 Antibiotic treatment of suspected pneumonia
31.7 percent
Solid fuel use 24 29 Solid fuels 19.0 percent
ENVIRONMENT
Water and Sanitation
11 30 Use of improved drinking water sources 93.7 percent
13 Water treatment 70.8 percent
12 31 Use of improved sanitation facilities 99.2 percent
14 Disposal of child’s faeces 31.4 percent
REPRODUCTIVE HEALTH
Contraception 21 19c Contraceptive prevalence 50.7 percent
Maternal and newborn health
20 Antenatal care 99.9 percent
44 Content of antenatal care
Weight measured
Blood pressure measured
Urine specimen taken
Blood test taken
99.5
99.5
99.5
99.5
percent
percent
percent
percent
4 17 Skilled attendant at delivery 99.8 percent
5 Institutional deliveries 99.8 percent
Maternal mortality 3 16 Maternal mortality ratio 70 per 100 000
CHILD DEVELOPMENT
Child development 46 Support for learning 81.0 percent
47 Father’s support for learning 46.9 percent
48 Support for learning: children’s books 66.4 percent
49 Support for learning: non-children’s books
89.1 percent
50 Support for learning: materials for play 19.8 percent
51 Non-adult care 9.8 percent

MONITORING THE SITUATION OF CHILDREN AND WOMENiv
EDUCATION
Education 52 Pre-school attendance 16.0 percent
53 School readiness 39.5 percent
54 Net intake rate in primary education 92.9 percent
55 6 Net primary school attendance rate 98.0 percent
56 Net secondary school attendance rate 95.3 percent
57 7 Children reaching grade five 99.7 percent
58 Transition rate to secondary school 99.7 percent
59 7b Primary completion rate 88.4 percent
60 8 Adult literacy rate 99.8 percent
61 9 Gender parity index
primary school
secondary school
0.99
1.00
ratio
ratio
CHILD PROTECTION
Birth registration 62 Birth registration 99.2 percent
Child labor 71 Child labor 2.2 percent
72 Laborer students 94.3 percent
73 Student laborers 2.3 percent
Child discipline 74 Child discipline
Any psychological/physical punishment 52.2 percent
Early marriage 67 Marriage before age 15
Marriage before age 18
0.4
8.5
percent
percent
68 Young women aged 15-19 currently married/in union
4.9 percent
69 Spousal age difference (>10 years)
Women aged 20-24 7.4 percent
Domestic violence 100 Attitudes towards domestic violence 10.4 percent

KAZAKHSTAN MULTIPLE INDICATOR CLUSTER SURVEY (MICS), 2006 v
HIV/AIDS
HIV/AIDS knowl-edge and attitudes
83 19b Comprehensive knowledge about HIV prevention among young people
22.4 percent
89 Knowledge of mother- to-child trans-mission of HIV
54.5 percent
86 Attitude towards people with HIV/AIDS 3.8 percent
87 Women who know where to be tested for HIV
83.5 percent
88 Women who have been tested for HIV 61.7 percent
90 Counselling coverage for the preven-tion of mother-to-child transmission of HIV
82.4 percent
91 Testing coverage for the prevention of mother-to-child transmission of HIV
78.8 percent
TUBERCULOSIS
Tuberculosis knowledge
Awareness of tuberculosis 99.4 percent
Knowledge of TB transmission by air 94.9 percent
Knowledge of recovery after tuberculo-sis at proper treatment
79.0 percent
Women who were sick or have a family member with TB
5.0 percent
Women who communicate with neighbours, colleagues or close friends suffering from TB
7.5 percent
INFORMATION SOURCES
Sources of main information for households
Households receiving information from TV
97.7 percent
Households receiving information from newspapers
66.4 percent
Households receiving information from friends, relatives, neighbours and col-leagues
54.1 percent

MONITORING THE SITUATION OF CHILDREN AND WOMENvi
Summary Table of Findings . . . . . . . . . . . . . . . . . . . . .ii
List of Tables . . . . . . . . . . . . . . . . . . . . . . . . . . . . . . . . . . . vii
List of Figures . . . . . . . . . . . . . . . . . . . . . . . . . . . . . . . . . . . .x
List of Abbreviations . . . . . . . . . . . . . . . . . . . . . . . . . . . . xi
Foreword and Acknowledgments . . . . . . . . . . . . xii
Executive Summary . . . . . . . . . . . . . . . . . . . . . 1
I. Introduction . . . . . . . . . . . . . . . . . . . . . . . . . 7 Background . . . . . . . . . . . . . . . . . . . . . . . . . . . . . . . . . .8 Survey objectives . . . . . . . . . . . . . . . . . . . . . . . . . . . . .9
II. Sample and Survey Methodology . . . .10 Sample design . . . . . . . . . . . . . . . . . . . . . . . . . . . . . . 11 Questionnaires . . . . . . . . . . . . . . . . . . . . . . . . . . . . . 12 Training and fieldwork . . . . . . . . . . . . . . . . . . . . 14 Data Processing . . . . . . . . . . . . . . . . . . . . . . . . . . . . 15
III. Sample Coverage and the Characteristics of Households and Respondents . . . . . . . . . . . . . . . . . . . . . . . . . . . .16 Sample Coverage . . . . . . . . . . . . . . . . . . . . . . . . . . 17 Characteristics of Households . . . . . . . . . . . . 17 Characteristics of Respondents . . . . . . . . . . . 19 Sources of information for the family . . . . 20
IV. Child mortality . . . . . . . . . . . . . . . . . . . . . .21
V. Nutrition . . . . . . . . . . . . . . . . . . . . . . . . . . . .24 Nutritional Status . . . . . . . . . . . . . . . . . . . . . . . . . . 25 Breastfeeding . . . . . . . . . . . . . . . . . . . . . . . . . . . . . . 27 Salt iodization . . . . . . . . . . . . . . . . . . . . . . . . . . . . . . 29 Low Birth Weight . . . . . . . . . . . . . . . . . . . . . . . . . . 30
VI. Child Health . . . . . . . . . . . . . . . . . . . . . . . . .32 Immunization . . . . . . . . . . . . . . . . . . . . . . . . . . . . . . 33 Oral Rehydration Treatment . . . . . . . . . . . . . . 35 Care Seeking and Antibiotic Treatment of Pneumonia . . . . . . . . . . . . . . . . . . . . . . . . . . . . . . 37 Solid Fuel Use . . . . . . . . . . . . . . . . . . . . . . . . . . . . . . 38
VII. Environment . . . . . . . . . . . . . . . . . . . . . . .39 Water and Sanitation . . . . . . . . . . . . . . . . . . . . . . 40
VIII. Reproductive Health . . . . . . . . . . . . . .43 Contraception . . . . . . . . . . . . . . . . . . . . . . . . . . . . . 44 Reproductive Behavior . . . . . . . . . . . . . . . . . . . . 44 Antenatal Care . . . . . . . . . . . . . . . . . . . . . . . . . . . . . 46 Assistance at Delivery . . . . . . . . . . . . . . . . . . . . . . 46 Maternal Mortality . . . . . . . . . . . . . . . . . . . . . . . . . 47
IX. Child Development . . . . . . . . . . . . . . . . .48
X. Education . . . . . . . . . . . . . . . . . . . . . . . . . . . .51 Pre-School Attendance and School Readiness . . . . . . . . . . . . . . . . . . . . . . . . . . . . . . . . . . . 52 Primary and Secondary School Participation . . . . . . . . . . . . . . . . . . . . . . . . . . . . . . . 52 Adult Literacy . . . . . . . . . . . . . . . . . . . . . . . . . . . . . . 54
XI. Child Protection . . . . . . . . . . . . . . . . . . . . .55 Birth Registration . . . . . . . . . . . . . . . . . . . . . . . . . . 56 Child Labor . . . . . . . . . . . . . . . . . . . . . . . . . . . . . . . . . 56 Child Discipline . . . . . . . . . . . . . . . . . . . . . . . . . . . . 57 Early Marriage . . . . . . . . . . . . . . . . . . . . . . . . . . . . . . 58 Domestic Violence . . . . . . . . . . . . . . . . . . . . . . . . 60
XII. HIV/AIDS . . . . . . . . . . . . . . . . . . . . . . . . . . .61 Knowledge of HIV Transmission . . . . . . . . . . 61
XIII. Tuberculosis . . . . . . . . . . . . . . . . . . . . . .64 Knowledge of Tuberculosis . . . . . . . . . . . . . . . . 64
List of References . . . . . . . . . . . . . . . . . . . . . . .66
Appendix A. Sample design . . . . . . . . . . . . . . . . .154
Appendix B. List of Personnel Involved in the Survey . . . . . . . . . . . . . . . . . . . . . . . . . . . . . . . . . .158
Appendix C. Estimates of Sampling Errors . .162
Appendix D. Data Quality Tables . . . . . . . . . . .183
Appendix E. MICS indicators: Numerators and Denominators . . . . . . . . . . . . . . . . . . . . . . . . . . .190
Appendix F. Questionnaires . . . . . . . . . . . . . . . .194
Table of Contents

KAZAKHSTAN MULTIPLE INDICATOR CLUSTER SURVEY (MICS), 2006 vii
List of TablesTable HH.1: Results of household and individual interviews . . . . . . . . . . . . . . . . . . . . . . . . . . . . . . . . . . . . . . . . . . . 67
Table HH.2: Household age distribution by sex . . . . . . . . . . . . . . . . . . . . . . . . . . . . . . . . . . . . . . . . . . . . . . . . . . . . . . . . . 68
Table HH.3: Household composition . . . . . . . . . . . . . . . . . . . . . . . . . . . . . . . . . . . . . . . . . . . . . . . . . . . . . . . . . . . . . . . . . . . . 69
Table HH.4: Women’s background characteristics . . . . . . . . . . . . . . . . . . . . . . . . . . . . . . . . . . . . . . . . . . . . . . . . . . . . . . 70
Table HH.5: Children’s background characteristics . . . . . . . . . . . . . . . . . . . . . . . . . . . . . . . . . . . . . . . . . . . . . . . . . . . . . 71
Table !!. 6: Resources of the main information for households . . . . . . . . . . . . . . . . . . . . . . . . . . . . . . . . . . . . . . . 72
Table CM.1: Early child mortality . . . . . . . . . . . . . . . . . . . . . . . . . . . . . . . . . . . . . . . . . . . . . . . . . . . . . . . . . . . . . . . . . . . . . . . . 73
Table CM.2: Children ever born and proportion dead . . . . . . . . . . . . . . . . . . . . . . . . . . . . . . . . . . . . . . . . . . . . . . . . . . 73
Table NU.1: Child malnourishment . . . . . . . . . . . . . . . . . . . . . . . . . . . . . . . . . . . . . . . . . . . . . . . . . . . . . . . . . . . . . . . . . . . . . 74
Table NU.2: Initial breastfeeding . . . . . . . . . . . . . . . . . . . . . . . . . . . . . . . . . . . . . . . . . . . . . . . . . . . . . . . . . . . . . . . . . . . . . . . . 76
Table NU.3: Breastfeeding . . . . . . . . . . . . . . . . . . . . . . . . . . . . . . . . . . . . . . . . . . . . . . . . . . . . . . . . . . . . . . . . . . . . . . . . . . . . . . . 77
Table NU.4: Adequately fed infants . . . . . . . . . . . . . . . . . . . . . . . . . . . . . . . . . . . . . . . . . . . . . . . . . . . . . . . . . . . . . . . . . . . . . . 78
Table NU.5: Iodized salt consumption . . . . . . . . . . . . . . . . . . . . . . . . . . . . . . . . . . . . . . . . . . . . . . . . . . . . . . . . . . . . . . . . . . 79
Table NU.8: Low birth weight infants . . . . . . . . . . . . . . . . . . . . . . . . . . . . . . . . . . . . . . . . . . . . . . . . . . . . . . . . . . . . . . . . . . . 80
Table CH.1: Vaccinations in first year of life . . . . . . . . . . . . . . . . . . . . . . . . . . . . . . . . . . . . . . . . . . . . . . . . . . . . . . . . . . . . . 81
Table CH.1C: Vaccinations in first year of life (continued) . . . . . . . . . . . . . . . . . . . . . . . . . . . . . . . . . . . . . . . . . . . . . . . 81
Table CH.2: Vaccinations by background characteristics . . . . . . . . . . . . . . . . . . . . . . . . . . . . . . . . . . . . . . . . . . . . . . 82
Table CH.2C: Vaccinations by background characteristics (continued) . . . . . . . . . . . . . . . . . . . . . . . . . . . . . . . . 84
Table CH.4: Oral rehydration treatment . . . . . . . . . . . . . . . . . . . . . . . . . . . . . . . . . . . . . . . . . . . . . . . . . . . . . . . . . . . . . . . . 85
Table CH.5: Home management of diarrhoea . . . . . . . . . . . . . . . . . . . . . . . . . . . . . . . . . . . . . . . . . . . . . . . . . . . . . . . . . . 86
Table CH.6: Care seeking for suspected pneumonia . . . . . . . . . . . . . . . . . . . . . . . . . . . . . . . . . . . . . . . . . . . . . . . . . . . . 87
Table CH.7: Antibiotic treatment of pneumonia . . . . . . . . . . . . . . . . . . . . . . . . . . . . . . . . . . . . . . . . . . . . . . . . . . . . . . . 88
Table CH.7A: Knowledge of the two danger signs of pneumonia . . . . . . . . . . . . . . . . . . . . . . . . . . . . . . . . . . . . . . . 89
Table CH.8: Solid fuel use . . . . . . . . . . . . . . . . . . . . . . . . . . . . . . . . . . . . . . . . . . . . . . . . . . . . . . . . . . . . . . . . . . . . . . . . . . . . . . . . 90
Table CH.9: Solid fuel use by type of stove or fire . . . . . . . . . . . . . . . . . . . . . . . . . . . . . . . . . . . . . . . . . . . . . . . . . . . . . . . 91
Table EN.1: Use of improved water sources . . . . . . . . . . . . . . . . . . . . . . . . . . . . . . . . . . . . . . . . . . . . . . . . . . . . . . . . . . . . . 92
Table EN.2: Household water treatment . . . . . . . . . . . . . . . . . . . . . . . . . . . . . . . . . . . . . . . . . . . . . . . . . . . . . . . . . . . . . . . . 94
Table EN.3: Time to source of water . . . . . . . . . . . . . . . . . . . . . . . . . . . . . . . . . . . . . . . . . . . . . . . . . . . . . . . . . . . . . . . . . . . . 96
Table EN.4: Person collecting water . . . . . . . . . . . . . . . . . . . . . . . . . . . . . . . . . . . . . . . . . . . . . . . . . . . . . . . . . . . . . . . . . . . . . 97
Table EN.5: Use of sanitary means of excreta disposal . . . . . . . . . . . . . . . . . . . . . . . . . . . . . . . . . . . . . . . . . . . . . . . . . 98
Table EN.5W: Number of households using improved sanitation facilities (worksheet) . . . . . . . . . . . . . .100
Table EN.6: Disposal of child’s faeces . . . . . . . . . . . . . . . . . . . . . . . . . . . . . . . . . . . . . . . . . . . . . . . . . . . . . . . . . . . . . . . . . .102
Table EN.7: Use of improved water sources and improved sanitation . . . . . . . . . . . . . . . . . . . . . . . . . . . . . . .103

MONITORING THE SITUATION OF CHILDREN AND WOMENviii
Table RH.1: Use of contraception . . . . . . . . . . . . . . . . . . . . . . . . . . . . . . . . . . . . . . . . . . . . . . . . . . . . . . . . . . . . . . . . . . . . . .104
Table RH.2A: Reproductive behavior of women . . . . . . . . . . . . . . . . . . . . . . . . . . . . . . . . . . . . . . . . . . . . . . . . . . . . . . . .106
Table RH.2B: Factors limiting birth rate . . . . . . . . . . . . . . . . . . . . . . . . . . . . . . . . . . . . . . . . . . . . . . . . . . . . . . . . . . . . . . . . .108
Table RH.2C: Factors stimulating birth rate . . . . . . . . . . . . . . . . . . . . . . . . . . . . . . . . . . . . . . . . . . . . . . . . . . . . . . . . . . . . .110
Table RH.3: Antenatal care provider. . . . . . . . . . . . . . . . . . . . . . . . . . . . . . . . . . . . . . . . . . . . . . . . . . . . . . . . . . . . . . . . . . . .112
Table RH.4: Antenatal care . . . . . . . . . . . . . . . . . . . . . . . . . . . . . . . . . . . . . . . . . . . . . . . . . . . . . . . . . . . . . . . . . . . . . . . . . . . . . .114
Table RH.5: Assistance during delivery . . . . . . . . . . . . . . . . . . . . . . . . . . . . . . . . . . . . . . . . . . . . . . . . . . . . . . . . . . . . . . . . .116
Table RH.6: Maternal mortality ratio . . . . . . . . . . . . . . . . . . . . . . . . . . . . . . . . . . . . . . . . . . . . . . . . . . . . . . . . . . . . . . . . . . .118
Table CD.1: Family support for learning . . . . . . . . . . . . . . . . . . . . . . . . . . . . . . . . . . . . . . . . . . . . . . . . . . . . . . . . . . . . . . .119
Table CD.2: Learning materials . . . . . . . . . . . . . . . . . . . . . . . . . . . . . . . . . . . . . . . . . . . . . . . . . . . . . . . . . . . . . . . . . . . . . . . . .121
Table CD.3: Children left alone or with other children . . . . . . . . . . . . . . . . . . . . . . . . . . . . . . . . . . . . . . . . . . . . . . . .123
Table ED.1: Early childhood education . . . . . . . . . . . . . . . . . . . . . . . . . . . . . . . . . . . . . . . . . . . . . . . . . . . . . . . . . . . . . . . .124
Table ED.2: Primary school entry . . . . . . . . . . . . . . . . . . . . . . . . . . . . . . . . . . . . . . . . . . . . . . . . . . . . . . . . . . . . . . . . . . . . . . .125
Table ED.3: Primary school net attendance ratio . . . . . . . . . . . . . . . . . . . . . . . . . . . . . . . . . . . . . . . . . . . . . . . . . . . . . .126
Table ED.4: Secondary school net attendance ratio . . . . . . . . . . . . . . . . . . . . . . . . . . . . . . . . . . . . . . . . . . . . . . . . . . .127
Table ED.4W: Secondary school age children attending primary school . . . . . . . . . . . . . . . . . . . . . . . . . . . . . . .128
Table ED.5: Children reaching grade 5 . . . . . . . . . . . . . . . . . . . . . . . . . . . . . . . . . . . . . . . . . . . . . . . . . . . . . . . . . . . . . . . . .129
Table ED.6: Primary school completion and transition to secondary education . . . . . . . . . . . . . . . . . . . .130
Table ED.7: Education gender parity . . . . . . . . . . . . . . . . . . . . . . . . . . . . . . . . . . . . . . . . . . . . . . . . . . . . . . . . . . . . . . . . . . .131
Table ED.8: Adult literacy . . . . . . . . . . . . . . . . . . . . . . . . . . . . . . . . . . . . . . . . . . . . . . . . . . . . . . . . . . . . . . . . . . . . . . . . . . . . . . .132
Table CP.1: Birth registration . . . . . . . . . . . . . . . . . . . . . . . . . . . . . . . . . . . . . . . . . . . . . . . . . . . . . . . . . . . . . . . . . . . . . . . . . . .133
Table CP.2: Child labor . . . . . . . . . . . . . . . . . . . . . . . . . . . . . . . . . . . . . . . . . . . . . . . . . . . . . . . . . . . . . . . . . . . . . . . . . . . . . . . . .134
Table CP.3: Laborer students and student laborers . . . . . . . . . . . . . . . . . . . . . . . . . . . . . . . . . . . . . . . . . . . . . . . . . . . .135
Table CP.4: Child discipline . . . . . . . . . . . . . . . . . . . . . . . . . . . . . . . . . . . . . . . . . . . . . . . . . . . . . . . . . . . . . . . . . . . . . . . . . . . .136
Table CP.5: Early marriage . . . . . . . . . . . . . . . . . . . . . . . . . . . . . . . . . . . . . . . . . . . . . . . . . . . . . . . . . . . . . . . . . . . . . . . . . . . . . .137
Table CP.6: Spousal age difference . . . . . . . . . . . . . . . . . . . . . . . . . . . . . . . . . . . . . . . . . . . . . . . . . . . . . . . . . . . . . . . . . . . . .138
Table CP.9: Attitudes toward domestic violence . . . . . . . . . . . . . . . . . . . . . . . . . . . . . . . . . . . . . . . . . . . . . . . . . . . . . .139
Table HA.1: Knowledge of preventing HIV transmission . . . . . . . . . . . . . . . . . . . . . . . . . . . . . . . . . . . . . . . . . . . . .140
Table HA.2: Identifying misconceptions about HIV/AIDS . . . . . . . . . . . . . . . . . . . . . . . . . . . . . . . . . . . . . . . . . . . .141
Table HA.3: Comprehensive knowledge of HIV/AIDS transmission . . . . . . . . . . . . . . . . . . . . . . . . . . . . . . . . . .142
Table HA.4: Knowledge of mother-to-child HIV transmission . . . . . . . . . . . . . . . . . . . . . . . . . . . . . . . . . . . . . . .143
Table HA.5: Attitudes toward people living with HIV/AIDS . . . . . . . . . . . . . . . . . . . . . . . . . . . . . . . . . . . . . . . . . . .144
Table HA.6: Knowledge of a facility for HIV testing . . . . . . . . . . . . . . . . . . . . . . . . . . . . . . . . . . . . . . . . . . . . . . . . . . .145
Table HA.7: HIV testing and counseling coverage during antenatal care . . . . . . . . . . . . . . . . . . . . . . . . . . . . .146
Table TB.1: Knowledge about tuberculosis . . . . . . . . . . . . . . . . . . . . . . . . . . . . . . . . . . . . . . . . . . . . . . . . . . . . . . . . . . . .147

KAZAKHSTAN MULTIPLE INDICATOR CLUSTER SURVEY (MICS), 2006 ix
Table TB.2: Symptoms of suspected tuberculosis . . . . . . . . . . . . . . . . . . . . . . . . . . . . . . . . . . . . . . . . . . . . . . . . . . . . .149
Table TB.3: TB symptoms, which require seeing a doctor . . . . . . . . . . . . . . . . . . . . . . . . . . . . . . . . . . . . . . . . . . . .151
Table TB.4: Attitudes towards people with TB. . . . . . . . . . . . . . . . . . . . . . . . . . . . . . . . . . . . . . . . . . . . . . . . . . . . . . . . .153
Table SD.1. Allocation of sample clusters (primary sampling units) to Sampling Domains . . . . . . . . .155
Table SE.1. Indicators selected for sampling error calculations . . . . . . . . . . . . . . . . . . . . . . . . . . . . . . . . . . . . . .163
Table SE.2. Sampling errors: total sample . . . . . . . . . . . . . . . . . . . . . . . . . . . . . . . . . . . . . . . . . . . . . . . . . . . . . . . . . . . . .164
Table SE.3. Sampling errors: urban areas . . . . . . . . . . . . . . . . . . . . . . . . . . . . . . . . . . . . . . . . . . . . . . . . . . . . . . . . . . . . . .165
Table SE.4. Sampling errors: rural areas . . . . . . . . . . . . . . . . . . . . . . . . . . . . . . . . . . . . . . . . . . . . . . . . . . . . . . . . . . . . . . . .166
Table SE.5. Sampling errors: Akmola Oblast . . . . . . . . . . . . . . . . . . . . . . . . . . . . . . . . . . . . . . . . . . . . . . . . . . . . . . . . . . .167
Table SE.6. Sampling errors: Aktobe Oblast . . . . . . . . . . . . . . . . . . . . . . . . . . . . . . . . . . . . . . . . . . . . . . . . . . . . . . . . . . .168
Table SE.7. Sampling errors: Almaty Oblast . . . . . . . . . . . . . . . . . . . . . . . . . . . . . . . . . . . . . . . . . . . . . . . . . . . . . . . . . . .169
Table SE.8. Sampling errors: Atyrau Oblast . . . . . . . . . . . . . . . . . . . . . . . . . . . . . . . . . . . . . . . . . . . . . . . . . . . . . . . . . . . .170
Table SE.9. Sampling errors: West Kazakhstan Oblast . . . . . . . . . . . . . . . . . . . . . . . . . . . . . . . . . . . . . . . . . . . . . . . .171
Table SE.10. Sampling errors: Zhambyl Oblast . . . . . . . . . . . . . . . . . . . . . . . . . . . . . . . . . . . . . . . . . . . . . . . . . . . . . . . . .172
Table SE.11. Sampling errors: Karagandy Oblast . . . . . . . . . . . . . . . . . . . . . . . . . . . . . . . . . . . . . . . . . . . . . . . . . . . . . . .173
Table SE.12. Sampling errors: Kostanai Oblast . . . . . . . . . . . . . . . . . . . . . . . . . . . . . . . . . . . . . . . . . . . . . . . . . . . . . . . . .174
Table SE.13. Sampling errors: Kyzylorda Oblast . . . . . . . . . . . . . . . . . . . . . . . . . . . . . . . . . . . . . . . . . . . . . . . . . . . . . . . .175
Table SE.14. Sampling errors: Mangistau Oblast . . . . . . . . . . . . . . . . . . . . . . . . . . . . . . . . . . . . . . . . . . . . . . . . . . . . . . . .176
Table SE.15. Sampling errors: South Kazakhstan Oblast . . . . . . . . . . . . . . . . . . . . . . . . . . . . . . . . . . . . . . . . . . . . . . .177
Table SE.16. Sampling errors: Pavlodar Oblast . . . . . . . . . . . . . . . . . . . . . . . . . . . . . . . . . . . . . . . . . . . . . . . . . . . . . . . . .178
Table SE.17. Sampling errors: North Kazakhstan Oblast . . . . . . . . . . . . . . . . . . . . . . . . . . . . . . . . . . . . . . . . . . . . . . .179
Table SE.18. Sampling errors: East Kazakhstan Oblast . . . . . . . . . . . . . . . . . . . . . . . . . . . . . . . . . . . . . . . . . . . . . . . . .180
Table SE.19. Sampling errors: Astana City . . . . . . . . . . . . . . . . . . . . . . . . . . . . . . . . . . . . . . . . . . . . . . . . . . . . . . . . . . . . . . .181
Table SE.20. Sample errors: Almaty City . . . . . . . . . . . . . . . . . . . . . . . . . . . . . . . . . . . . . . . . . . . . . . . . . . . . . . . . . . . . . . . . .182
Table DQ.1. Age distribution of household members . . . . . . . . . . . . . . . . . . . . . . . . . . . . . . . . . . . . . . . . . . . . . . . . . .183
Table DQ.2. Age distribution of eligible and interviewed women . . . . . . . . . . . . . . . . . . . . . . . . . . . . . . . . . . . .184
Table DQ.3. Age distribution of eligible and interviewed under-5s . . . . . . . . . . . . . . . . . . . . . . . . . . . . . . . . . . .184
Table DQ.4. Age distribution of under 5 children . . . . . . . . . . . . . . . . . . . . . . . . . . . . . . . . . . . . . . . . . . . . . . . . . . . . .185
Table DQ.5. Heaping on ages and periods . . . . . . . . . . . . . . . . . . . . . . . . . . . . . . . . . . . . . . . . . . . . . . . . . . . . . . . . . . . . . .186
Table DQ.6. Completeness of reporting . . . . . . . . . . . . . . . . . . . . . . . . . . . . . . . . . . . . . . . . . . . . . . . . . . . . . . . . . . . . . . . .187
Table DQ.7. Presence of mother in the household and the person interviewed for the under-5 questionnaire . . . . . . . . . . . . . . . . . . . . . . . . . . . . . . . . . . . . . . . . . . . . . . . . . . . . . . . . . . . . . . . . . . . .188
Table DQ.8. School attendance by single age . . . . . . . . . . . . . . . . . . . . . . . . . . . . . . . . . . . . . . . . . . . . . . . . . . . . . . . . . .188
Table DQ.9. Sex ratio at birth among children ever born and living . . . . . . . . . . . . . . . . . . . . . . . . . . . . . . . . . .189
Table DQ.10. Distribution of women by time since last birth . . . . . . . . . . . . . . . . . . . . . . . . . . . . . . . . . . . . . . . . . . .189

MONITORING THE SITUATION OF CHILDREN AND WOMENx
List of FiguresFigure HH.2. Age and sex distribution of household population, %, Kazakhstan, 2006 . . . . . . . . 18
Figure CM.1. Infant Mortality by Sources, Kazakhstan, 2006 . . . . . . . . . . . . . . . . . . . . . . . . . . . . . . . . . . . . 22
Figure CM.1". Under Five Mortality Rate, Kazakhstan, 2006 . . . . . . . . . . . . . . . . . . . . . . . . . . . . . . . . . . . . . . 23
Figure CM.1#. Under Five Mortality Tendency, Kazakhstan, 2006 . . . . . . . . . . . . . . . . . . . . . . . . . . . . . . . . 23
Figure NU.1. Percentage of children under 5 who are undernourished, Kazakhstan, 2006 . . . . 26
Figure NU.2. Percentage of mothers who started breastfeeding within one hour and within one day of birth, Kazakhstan, 2006 . . . . . . . . . . . . . . . . . . . . . . . . . . . . . . . . . . . . . . . . . . . . . . . . . 28
Figure NU.3. Infant feeding patterns by age: Percent distribution of children aged under 3 years by feeding pattern by age group, Kazakhstan, 2006 . . . . . . . . . . . . . . . . . . . . . . . . . .29
Figure NU.5. Percentage of households consuming adequately iodized salt, Kazakhstan, 2006 . . . . . . . . . . . . . . . . . . . . . . . . . . . . . . . . . . . . . . . . . . . . . . . . . . . . . . . . . . . . . . . . . . . . . . . . . . . . . . . . . . 30
Figure NU.8. Percentage of Infants Weighing Less Than 2500 Grams at Birth, Kazakhstan, 2006 . . . . . . . . . . . . . . . . . . . . . . . . . . . . . . . . . . . . . . . . . . . . . . . . . . . . . . . . . . . . . . . . . . . . . . . . . . . . . . . . . 31
Figure CH.1. Percentage of children aged 15-26 months who received the recommended vaccinations by 12 months, Kazakhstan, 2006 . . . . . . . . . . . . . . . . . . . . . . . . . . . . . . . . . . . . 34
Figure CH.5. Percentage of children aged 0-59 with diarrhoea who received ORT or increased fluids, AND continued feeding, Kazakhstan, 2006, % . . . . . . . . . . . . . . . . 36
Figure EN.1. Percentage distribution of population by source of drinking water, Kazakhstan, 2006 . . . . . . . . . . . . . . . . . . . . . . . . . . . . . . . . . . . . . . . . . . . . . . . . . . . . . . . . . . . . . . . . . . . . 41
Figure HA.1. Percent of women who have comprehensive knowledge of HIV/AIDS transmission, Kazakhstan, 2006 . . . . . . . . . . . . . . . . . . . . . . . . . . . . . . . . . . . . . . . . . . . . . . . . . . . . 62

KAZAKHSTAN MULTIPLE INDICATOR CLUSTER SURVEY (MICS), 2006 xi
ADB Asian Development Bank
AIDS Acquired Immune Deficiency Syndrome
BCG Bacillis-Cereus-Geuerin (Tuberculosis)
DHS Demography and Health Survey
DPT Diphtheria Pertussis Tetanus vaccine
EPI Expanded Programme on Immunization
GCR Gender Correlation Rate
GPI Gender Parity Index
HIV Human Immunodeficiency Virus
HMRS Home-made Rehydration Solution
IDD Iodine Deficiency Disorders
ILO International Labour Organization
IQ Intelligence Quotient
IMR Infant Mortality Rate
IUD Intrauterine Device
MDG Millennium Development Goals
MICS Multiple Indicator Cluster Survey
MMR Mumps, Measles, Rubella
MoH Ministry of Health
NAR Net Attendance Rate
ORT Oral Rehydration Therapy
ORS Oral Rehydration Salt
PLWHA People Living with HIV/AIDS
PPS Packed Powder Solution
ppm Parts Per Million
PSU Primary Sampling Units
ResCor UN Resident Coordinator Fund
RSE DCC AS Republican State Enterprise, Data Computing Centre of the Agency RK on Statistics
AS RK Agency of the Republic of Kazakhstan on Statistic
SPSS Statistical Package for Social Sciences
STI Sexually Transmitted Infections
UNAIDS United Nations Programme on HIV/AIDS
UNDAF United Nations Development Assistance Framework
UNDP United Nations Development Programme
UNFPA United Nations Population Fund
UNGASS United Nations General Assembly Special Session on HIV/AIDS
UNICEF United Nations Children’s Fund
U5MR Under-Five Mortality Rate
WFFC World Fit for Children
WHO World Health Organization
List of Abbreviations

MONITORING THE SITUATION OF CHILDREN AND WOMENxii
Foreword and AcknowledgmentsThe Kazakhstan Multiple Indicator Cluster Survey (MICS) was first conducted in 2006 with the pur-pose of obtaining information to assess progress towards the situation of children and women in Kazakhstan required for monitoring the Millennium Development Goals (MDGs) and objectives of the World Fit for Children document (WFFC) and other documents agreed at international level.
Because of significant discrepancies in social and economic development of the regions of the coun-try, the Kazakhstan MICS was conducted at sub-national level as well, which makes it unique. I hope the survey findings will be useful for the Government and civil society institutes in planning and de-veloping social programs that meet the requirements of the real situations and needs of women and children both at national level and at the level of each region and oblast.
The success of MICS and publication of the current Report is the work of many experts at different levels. We would like to mention the following international organizations working in Kazakhstan: United Nations Children’s Fund (UNICEF) for methodological, technical and financial support as well as the US Agency for International Development (USAID), the United Nations Population Fund (UNFPA), the UN Resident Coordinator’s Fund (ResCor) and the UN International Labor Organization (ILO) for their significant financial support.
I also express thanks to the staff of the UNICEF Office in Kazakhstan in the person of Mr. Alexander Zouev, UNICEF Representative in Kazakhstan and Mr. Raimbek Sissemaliev, Head of Almaty Zone Office, UNICEF Project Coordinator, Kazakhstan, for technical, methodical and financial sup-port during training of staff from the Agency RK on Statistics and permanent support in preparation and implementation of the current survey; great thanks to Ms. Gaziza Moldakulova, MICS Project Coordinator, UNFPA Kazakhstan, for coordination of UN agencies involved in the MICS Project as well as for collaboration in preparation of financial reports and the current MICS report.
I express thanks to UNICEF staff members, who conducted training workshops, developed question-naires and programs for data entry and calculation of indicators, accomplished general manage-ment as well as provided consultations during preparation, implementation and processing the out-comes of current global survey, in particular: MICS-3 Project Coordinator from UNICEF Regional Office Mr. George Sakvarelidze (Geneva, Switzerland) for his maximal assistance to the staff of the Agency in preparation and carrying out this survey in Kazakhstan.
We express special gratitude to Mr. Anthony Turner, International Consultant on Sampling (USA) for his expert assistance in Kazakhstan MICS sampling and Mr. Muktar Minbayev, Project Coordinator on Monitoring and Evaluation, UNICEF, Kyrgyzstan, who provided invaluable assist-ance during sampling.
Moreover, I would like to highlight local authorities of all levels who provided support during the im-plementation of the project, who provided valuable assistant to MICS field teams during the survey and data collection.
In addition, I would like to express high appreciation to members of Coordination Committee on MICS preparation and implementation in Kazakhstan, ministries and agencies of the Republic, the non-governmental sector and international institutions concerned with MICS findings, which ex-pressed their comments and proposals to the current report.
Chair Anar MeshimbayevaAgency of the Republic of Kazakhstan
KAZAKHSTAN MULTIPLE INDICATOR CLUSTER SURVEY (MICS), 2006 xiii
1 Project participants occupied these positions the years MICS was prepared and implemented (2005-2007).
Foreword and Acknowledgments
I have great pleasure in presenting the Final Report on findings of Multiple Indicator Cluster Survey first held in Kazakhstan in 2006. This is a unique survey based on methodology developed and used by UNICEF in many countries in the world but has an essential feature, since it was conducted not only at the national scale. Unlike in many other countries focusing mainly on the national level, MICS in Kazakhstan was conducted at the sub-national level, which allowed obtaining more complete and reliable picture on social status of children, women and families in the entire country as well as in every region.The survey was based, in large part, on the need to monitor progress towards goals and targets emanat-ing from recent international agreements – the Millennium Declaration, adopted by all United Nations Member States in September 2000, and the Plan of Action of a “World Fit For Children”, adopted by 189 Member States at the United Nations Special Session on Children in May 2002. The success of MICS is the work of many experts from the Agency RK on Statistic and its territorial divi-sions as well as structural subdivision of RSE Data Computing Center.In this regard I sincerely appreciate the assistance of Mr. Kali Abdiyev, the Chair of the Agency RK on Statistics, who launched this Project, made all the necessary arrangements and established an environ-ment for successful Project implementation, Mr. Bakhyt Sultanov and Ms. Anar Meshimbayeva, who provided support to the MICS as Chairs of the Agency RK on Statistics, and express particular ap-preciation and gratitude to Mr. Yuri Shokamanov, Deputy Chair for their ongoing support in further MICS implementation.1
I would like to specially thank Mr. Yerbolat Mussabek, Deputy Director of Social and Demography Statistics Department of the Agency RK on Statistics, National MICS Coordinator, for coordination of all structures involved in the Project as well as planning of MICS preparation and implementation, formation of field teams for data collection, development of training techniques and arrangement of training workshops and Ms. Gulnar Kukanova, Head of the Population Statistics Division of the Social and Demography Statistics Department of the Agency RK on Statistics for training of field teams staff at regional training workshops and assistance in development and adaptation of MICS tools, and also Ms. Zinagul Dzhumanbayeva, Director of the Republican State Enterprise «Data Computing Centre» of the Agency RK on Statistics (RSE DCC AS) and her team for leading arrangements and work-ing with the financial reports of the executive partner of the Project; Ms. Aigul Kapisheva, Head of the Department on Databases Processing (RSE DCC AS) for adaptation of MICS software to the condi-tions of Kazakhstan and its accommodation; Ms. Saule Dauylbayeva, Head of Population Register Dataware Division (RSE DCC AS) and her team for the high quality entering of primary data and for-mation of the MICS database.In addition to the main activities of the Agency RK on Statistics within the current survey, the staff of the Kazakh Academy of Nutrition, our long standing and reliable partner, conducted study on food con-sumption frequency, prevalence of IDD and IDA among women and prevalence of Vitamin A Deficiency among children under 5. Findings of this study will be presented in second volume of the MICS Report due in the beginning 2008. Having this opportunity I would like to thank personally Professor Toregeldy Sharmanov, the President of the Kazakh Academy of Nutrition, and his staff, particularly Professor Shamil Tajibayev for successful completion of this work. I highly appreciate the assistance of the Heads of Oblast/City Departments on Statistics of the Republic of Kazakhstan for provision of human resources – state servants – for fieldwork and their invalu-able contribution to arranging the survey as well as work of the staff of the Regional Departments on Statistics, involved in fieldwork on data collection in the severe winter conditions in 2006. I would like to specially acknowledge the work of field team supervisors for due level of fieldwork arrangement and implementation, development of optimal routes for the teams; interviewers for high-quality and
MONITORING THE SITUATION OF CHILDREN AND WOMENxiv
timely fieldwork on data collection in compliance with MICS requirements, editors – for quality ques-tionnaires editing, anthropometric measurements and timely delivery of questionnaires to the central office, drivers for timely and safe delivery of teams to remote settlements as per tight schedule.I have to emphasize that implementation of the MICS project became possible in Kazakhstan not only due to financial and overall support of UNICEF but also due to substantial contribution of our reliable UN family partners into the process, primarily United Nations Population Fund (UNFPA) and also UN Resident Coordinator Fund, International Labor Organization (ILO), and certainly our main donor partner the United States Agency for International Development (USAID).Implementation of MICS allowed to train many relevant professionals and technical staff in the coun-try. I believe that state agencies would continue use their capacity and the methodology in other similar surveys concerning social and economical issues of the country as well as to measure their progress.The report contains a lot of interesting information about the status of women and children in Kazakhstan and will be of use for state bodies, non-governmental organizations, international insti-tutes, professors and students as well as the general public.
UNICEF Representative in the Republic of Kazakhstan Alexandre Zouev

KAZAKHSTAN MULTIPLE INDICATOR CLUSTER SURVEY (MICS), 2006 1
EXECUTIVE SUMMARY

MONITORING THE SITUATION OF CHILDREN AND WOMEN2
Characteristics of householdsIn 14,564 surveyed households resided 51,261 people. Of them 48.2 percent were males and 51.8 percent females. The average household size was 3.5 people. The major number of households con-sisted of 2-3 people (41 percent) and 4-5 people (32.4 percent).
The proportion of households with at least one child under 18 was 56.7 percent; in 21.8 percent of households lived children under 5, the proportion of households with at least one woman aged 15-49 was 70.6 percent.
The proportion of children under 15 years made 24.1 percent, persons aged 15-64 – 67.2 percent, people over 65 – 8.7 percent and the number of children aged 0-17 years made 30.3 percent of the total number of surveyed household members.
In total, the number of reproductive age women (15-49 years) made 54.9 percent. At the time of the sur-vey, 57.4 percent of interviewed women were married or in union, 14.1 percent – divorced/separated/widowers and 28.6 percent – never married. According to maternal status – 66.8 percent women had given birth. 13.4 percent of reproductive age women have primary or incomplete secondary education, 33.6 percent have completed secondary education, 27.1 percent have specialized secondary and 25.9 percent – higher education. As for wealth levels the poorest and poor quintiles are represented approxi-mately by the same indicator 18.5-18.7 percent, middle – 19.4 percent, rich – 20 percent and richest 23.4 percent, where reproductive age women resided. Among interviewed women 59.1 percent were Kazakhs, and 30.8 percent Russians.
The number of children under 5 was 7.8 percent. 51 percent of children lived in urban areas and 49 percent – in rural areas. Age of children: under 6 months – 8.7 percent, 6-11 months – 10.5 percent, 12-23 months – 21.9 percent, 24-35 months –21.5 percent, 36-47 months – 19.4 percent and 48-59 months – 18 percent.
Sources of Information for FamilyAlmost all residents (over 97 percent) of Kazakhstan obtain information for the family, mainly from TV. The second source of information for 66 percent of the population is newspapers. The third prevalent source of information for Kazakhstan citizens are friends, siblings, neighbors and col-leagues. The next source of information reported by over one quarter (25.4 percent) of population was radio. Over 18 percent of Kazakhstan people get information from magazines. Outdoor adver-tisement and posters (9.4 percent), as well as the Internet (4.7 percent) are not very popular among respondents. The popularity of some information sources mainly depends on education level and wealth of population as well as regions and area of residence, and of course, access to some sources, for instance, the Internet.
Infant and child mortalityThe infant mortality rate (IMR) is estimated at 31.8 per thousand life births, while the probability of dying before the age 5 is around 36.3 per thousand live births. Boys’ mortality significantly exceeds girls’ and makes 36.6 and 26.6 per thousand respectively for IMR, and 41.7 and 30.3 per thousand livebirths respectively for under 5 mortality.
Nutrition StatusIn Kazakhstan 4 percent of children under 5 are moderately underweight (weight for age) and 0.8 percent are classified as severely underweight, at that, 3.8 percent of children are wasted (weight for height) and 1 percent severely wasted. At the same time, 12.8 percent of children in the country are stunted for their age and the height of 4 percent is too short for their age.

KAZAKHSTAN MULTIPLE INDICATOR CLUSTER SURVEY (MICS), 2006 3
Breastfeeding64.2 percent started breastfeeding within one hour of birth; the urban-rural difference was 4.4 per-cent – urban women 66.3 percent and 61.9 of rural women. 87.8 percent started breastfeeding with-in one day of birth (which includes those who started within one hour), the percentage of such women in urban and rural settlements is almost the same (87.7 and 88 percent respectively).
16.8 percent of children aged less than six months are exclusively breastfed, a level considerably lower than recommended. At aged 6-9 months, 39.1 percent of children are receiving breast milk and solid or semi-solid foods. By age 12-15 months, 57.1 percent of children are still being breastfed and by age 20-23 months, 16.2 percent are still breastfed. Girls were more likely to be exclusively breastfed than boys were, while boys had higher levels than girls for timely complementary feeding.
Salt IodizationIn 98.8 percent of households, salt used for cooking was tested for iodine content by using salt test kits and testing for the presence of potassium iodate. In 92 percent of households, salt was found to contain 15 ppm or more of iodine. The above data proves that Kazakhstan is ready for certification as a country that has achieved universal salt iodization.
Low Birth WeightOverall, 99.4 percent of babies were weighed at birth and approximately 5.8 percent of infants are estimated to weigh less than 2,500 grams at birth.
Immunization97.9 percent of children in Kazakhstan aged 15-26 months received a BCG vaccination and the first dose of DPT by the age of 12 months. The percentage declines for subsequent doses of DPT to 96.7 percent for the second dose, and 91.7 percent for the third dose. Similarly, 99 percent of children received Polio 1 (OPV) by age 12 months and this declines to 93.9 percent by the third dose. The coverage for measles vaccine by 15 months is a bit lower than for the other vaccines at 94.7 percent. This is primarily because, although 99.4 percent of children received the vaccine, only 94.7 percent received it by their first birthday. Despite the fact that by the age of 12 months coverage with some vaccines exceeds 94 percent, the percentage of children who had all the recommended vaccina-tions by their first birthday (by 15 months for measles) is low at only 81 percent.
Solid FuelsOverall, 19 percent of all households in Kazakhstan are using solid fuels for cooking. Use of solid fu-els is very high in rural areas, where 40.8 percent of households are using solid fuels and very low in urban areas – 6.8 percent. The highest percent of households using solid fuels for cooking was found in South Kazakhstan (40.7 percent) and Kyzylorda (39.8 percent) Oblasts. The total percentage of solid fuels is too high due to high use of coal for cooking.
Use of improved sources of drinking water and water treatmentOverall, 93.7 percent of the population in Kazakhstan is using an improved source of drinking wa-ter – 98.1 percent in urban areas and 87.7 percent in rural areas. The situation with drinking water received from improved sources is worse in North Kazakhstan Oblast (81.7 percent), Kostanai (83.2 percent), South Kazakhstan (85.7 percent) and Atyrau (89.3 percent) Oblasts. In Atyrau and South Kazakhstan Oblasts 8.1 and 6.8 percent of population respectively use surface water.

MONITORING THE SITUATION OF CHILDREN AND WOMEN4
70.8 percent of the population uses any way to treat drinking water obtained from all sources. The main method of water treatment used almost by 70 percent of the population is boiling; 24.7 per-cent of the population let the water to settle before consuming it. The urban population more often uses water treatment methods than the rural one.
Use of improved sanitationAlmost all the population of Kazakhstan (99.2 percent) are living in households with improved sani-tation facilities. In urban areas modern lavatory pans are more popular – over 60 percent of house-holds use them – as well as pit latrines with slab (35.5 percent). In rural areas about 95 percent of households use latrines with slab.
The proportion of children aged 0-2 years whose last faeces was safely disposed of was 31.4 percent, at that, this indicator in urban area made 54.3 percent against 8.7 percent of rural area.
ContraceptionCurrent use of contraception was reported by 50.7 percent of women currently married or in union. The most popular method is IUD (intrauterine device) which is used by one in three married women (36.2 percent of married women) in Kazakhstan. The next most popular but of limited occurrence method is pills, which accounts for 6.6 percent. 4.8 percent of women reported use of the condom.
Reproductive BehaviorOver one-third (37.7 percent) of women wanted to have 2 children, almost one in three (28.7 per-cent) women – three children and 17.0 percent – four children. Less than 9 percent (8.7 percent) of women in the survey wanted to have 5 to 9 children and only 0.5 percent of women – 10 or more.
Factors limiting the birth of another child reported by women were low salary (25 percent) and health status (19.7 percent). The factors encouraging the birth of another baby reported by women were ma-ternity leave with sufficient pay (21.4 percent) and reduced age of retirement (19.8 percent).
Antenatal CareCoverage of antenatal care (by a doctor, nurse, or midwife) is relatively high in Kazakhstan with 99.9 percent of women receiving antenatal care at least once during the pregnancy. All interviewed women had blood testing, blood pressure measurement; urine testing and were weighted (by 99.5 percent).
Assistance at DeliveryAlmost all births in Kazakhstan (99.8 percent) were delivered by skilled personnel in health facilities. 80.9 percent of births were delivered by doctors, 18.2 percent – by nurses/obstetricians.
Maternal MortalityIn MICS, the maternal mortality ratio in Kazakhstan over the past 10-14 years was 70 cases per 100,000 of life births.
School Readiness and Pre-School Attendance At the time of the survey, only 16 percent of children aged 36-59 months were attending pre-school institutions. Overall, 39.5 percent of children attending the first grade of primary school were at-tending pre-school the previous year. The proportion of males and females was almost the same, while 46.4 percent of children in urban areas had attended pre-school the previous year compared

KAZAKHSTAN MULTIPLE INDICATOR CLUSTER SURVEY (MICS), 2006 5
to 33 percent among children living in rural areas. Urban-rural differentials are very significant as well as mother’s educational level. Socioeconomic status appears to have a significant impact on school readiness.
Primary and Secondary School ParticipationOf children who are of primary school entry age (age 7) in Kazakhstan, 92.9 percent are attending the first grade of primary school. By gender indicator boys (95.1 percent) prevail over girls (90.4 per-cent). Gender Parity Index for primary school is 0.99, indicating no difference in the attendance of girls and boys to primary school. This indicator is kept for secondary education (1.00).
Birth RegistrationThe birth of 99.2 percent of sampled children aged under 5 in Kazakhstan was registered. There are no significant variations in birth registration across sex, age, or education categories.
Child LaborIn Kazakhstan, 2.2 percent of children aged 5-14 years are involved in child labor of different types, such as work in a household, family business or outside of the household.
Child DisciplineIn Kazakhstan, 52.2 percent of children aged 2-14 years were subjected to at least one form of psy-chological or physical punishment by their mothers/caretakers or other household members. Less than one percent of children were subjected to severe physical punishment; in urban area percent-age of such children is twice as much as in rural. Only 7.4 percent of mothers/caretakers believed that children should be physically punished, when in practice over 20 percent indicated the opposite.
Early MarriageIn Kazakhstan 57.4 percent of women aged 15-49 years sampled for MICS, are married/in union.
It is necessary to note that around 5 percent of young women aged 15-19 years are married. Only 0.4 percents of women aged 15-49 were married or lived with man before they turned 15 years of age and 8.5 percents of women aged 20-49 years got married before they turned 18 years of age.
Domestic Violence10.4 percent of women aged 15-49 years said that a partner might beat his wife for the following reasons:
• Goes out for long without telling her husband;
• Neglects her children;
• Contradicts her husband;
• Refuses sex with him;
• Burns food.
The highest percentage of women (7.1 percent) recognized that partner can beat his wife if she neglects their children or does not care for them; at the same time, the percentage of women cur-rently and previously married was 8.3 and 7.7 percents respectively against 4.6 percent of women

MONITORING THE SITUATION OF CHILDREN AND WOMEN6
never married/in union. Least percentage of women (1.5 percent) accepts this situation in case if wife refuses sex with her partner. Distribution of causes justifying, according to interviewed women, domestic violence from the partner and the number of women who accept such situation is almost the same in urban and rural areas.
Knowledge of HIV transmissionIn Kazakhstan, almost all interviewed women (98.7 percent) have heard of AIDS. However, the per-centage of women who know all three main ways of preventing HIV transmission is only 30 per-cent. Almost 66 percent of women know of having one faithful uninfected sex partner, 62.9 percent know of using a condom every time, and 42.7 percent know of abstaining from sex as the main ways of preventing HIV transmission. While 80 percent of women know at least one way, a high propor-tion of women (20 percent) do not know any of the three ways.
Misconceptions about HIV/AIDSOf the interviewed women, 36.3 percent reject the two most common misconceptions and know that a healthy-looking person can be infected. 68.7 percent of women know that HIV cannot be transmitted by sharing food, and 60.6 percent of women know that HIV cannot be transmitted by mosquito bites, while 67.5 percent of women know that a healthy-looking person can be infected. 79.8 percent of women know that HIV cannot be transmitted by supernatural means, and 96.2 per-cent of women know that HIV can be transmitted by multiple uses of needles.
Attitudes toward people living with HIV96.2 percent of women in survey agree with at least one discriminatory statement concerning peo-ple with HIV; urban as well as rural population, irrespective of education level, wealth of household, and age were unanimous. 82.7 percent of people would not buy foodstuffs from HIV-positive ven-dor, 65.9 percent of respondents would want to keep HIV status of a family member a secret, 60.1 percent of population of Kazakhstan believes that HIV positive teacher should not be allowed to teach in school. Interviewing revealed that 9.4 percent of population in general would not take care of family member with HIV (AIDS), there were found no significant urban-rural differences.
Knowledge of Tuberculosis99.4 percent of population of the country is aware of tuberculosis, equally in urban and rural areas. 79 percent of women know about tuberculosis patients’ recovery if it is properly treated. 83.2 per-cent of interviewed females reported that TB should be treated in the hospital. Almost all respond-ents regardless of the place of residence, education level and wealth knew about TB transmission by air during coughing. About 42 percent of parents in urban and rural areas responded that they will seek medical care in TB dispensary with suspected TB in children. About 39 percent parents in rural area and 25.5 percents of parents in urban area will seek hospital care. The latter prefer to apply to the clinic (32 percent).
Almost 53 percent of interviewed women correctly named ‘coughing for more than three weeks’ as a TB symptom and 58.5 percent of women reported seeking the medical care if this sign appears. Among other symptoms almost 43 percent of women named blood with phlegm, 38 percent – fever and 37 percent – night sweating.
Overall in the country over 12 percent of respondents were sick or have family members suffering from TB and communicated with people with TB outside of the family. This shows quite high disease prevalence within the Republic. At the same time the population is well informed on the ways of disease transmission and symptoms.

KAZAKHSTAN MULTIPLE INDICATOR CLUSTER SURVEY (MICS), 2006 7
I. Introduction

MONITORING THE SITUATION OF CHILDREN AND WOMEN8
BackgroundThis report is based on the Kazakhstan Multiple Indicator Cluster Survey (hereinafter MICS), first conducted in Kazakhstan in 2006 by the Agency of Kazakhstan on Statistics. The survey provides valu-able information on the situation of children and women in Kazakhstan and was based, in large part, on the need to monitor progress towards goals and targets emanating from recent international agree-ments: the Millennium Declaration, adopted by all 191 United Nations Member States in September 2000, and the Plan of Action of a “World Fit For Children”, adopted by 189 Member States at the United Nations Special Session on Children in May 2002. Both of these commitments build upon promises made by the international community at the 1990 World Summit for Children.
By signing these international agreements, govern-ments committed themselves to improving condi-tions for their children and to monitor progress towards that end. UNICEF was assigned a support-ing role in this task (see below).
After the President of the Republic of Kazakhstan (RK) signed the Declaration, the Government of RK committed itself to monitor progress towards the Millennium Development Goals (MDGs) to 2015. Assessment of follow-up indicators is essen-tial in view of information provision for further ac-tion and assessment of changes.
The long-term strategic development of Kazakhstan associates with the Millennium Development Goals. State and sectoral programs as well as development strategies of the Republic reflect all MDG goals and objectives. The long-term National Strategy ‘Kazakhstan-2030’ and the Mid-Term Development Plan ‘Kazakhstan-2010’ also reflect the strategic development priorities of Kazakhstan focused on reducing gaps between rich and poor people, strengthening human se-curity through a decrease in social vulnerability, improvement of social services quality, environ-mental sanitation, civil society participation in development and strengthening the institutional potential of state bodies.
During the last years Kazakhstan made certain progress towards the MDGs achievement. The Republic has developed a number of strategies and state programs for achieving national goals and priorities, such as:
• Program on Combating Poverty and Unemployment in the Republic of Kazakhstan for 2000-2002;
A Commitment to Action: National and International Reporting Responsibilities
The governments that signed the Millennium Declaration and the World Fit for Children Declaration and Plan of Action World Fit for Children also committed themselves to moni-toring progress towards the goals and objec-tives they contained:
“We will monitor regularly at the national lev-el and, where appropriate, at the regional lev-el and assess progress towards the goals and targets of the present Plan of Action at the na-tional, regional and global levels. Accordingly, we will strengthen our national statistical capacity to collect, analyse and disaggregate data, including by sex, age and other relevant factors that may lead to disparities, and sup-port a wide range of child-focused research. We will enhance international cooperation to support statistical capacity-building efforts and build community capacity for monitor-ing, assessment and planning.” (A World Fit for Children, paragraph 60)
“…We will conduct periodic reviews at the na-tional and subnational levels of progress in order to address obstacles more effectively and accelerate actions.…” (A World Fit for Children, paragraph 61)
The Plan of Action (paragraph 61) also calls for the specific involvement of UNICEF in the preparation of periodic progress reports:
“… As the world’s lead agency for children, the United Nations Children’s Fund is requested to continue to prepare and disseminate, in close collaboration with Governments, relevant funds, programmes and the specialized agen-cies of the United Nations system, and all other relevant actors, as appropriate, information on the progress made in the implementation of the Declaration and the Plan of Action.”
Similarly, the Millennium Declaration (paragraph 31) calls for periodic reporting on progress:
“…We request the General Assembly to review on a regular basis the progress made in im-plementing the provisions of this Declaration, and ask the Secretary-General to issue peri-odic reports for consideration by the General Assembly and as a basis for further action.”

KAZAKHSTAN MULTIPLE INDICATOR CLUSTER SURVEY (MICS), 2006 9
• State Program on Poverty Reduction for 2003-2005;
• State Program on Reforming and Development of Public Health RK for 2005-2010;
• State Education Program in Kazakhstan for 2005-2010;
• Gender Equality Strategy of the Republic of Kazakhstan for 2005-2015;
• Program on Development of Rural Areas for 2004-2010;
• Branch Program «Drinking waters» for 2002-2010;
• Program on Counteracting AIDS Epidemics in the Republic of Kazakhstan for 2001-2005.
In frames of assistance to the Government of Kazakhstan in achievement of the global goals and national priorities, UN System coordinates and consolidates efforts of individual UN agen-cies at country level through a strategic tool called the United Nations Development Assistance Framework for 2005-2009 (UNDAF).
Better access to quality basic social services, in particular, reduction of child mortality, improve-ment of maternal health and reduction of HIV/AIDS, tuberculosis and other dangerous diseases in Kazakhstan is directly linked to expected UNDAF outcome. UN assistance in achieving these goals focuses on:
• Strengthening of legislative base for better public health and education services;
• Improvement of public health management;
• Improvement and expansion of key health services: MCH, reproductive health and HIV/AIDS especially to vulnerable groups;
• Dissemination and improvement of knowl-edge, behavior skills and practices in the area of MCH, reproductive health, HIV/AIDS and child care to the community and family levels;
• Capacity building of education management at the republican and regional level;
• Establishment of child and youth-friendly edu-cation environment focused at development of vital skills and HIV/AIDS prevention in pilot regions.
Based on the Situation Analysis of Status of Chilren and its own experience UNICEF identified in 2001 five priority areas, where the most impact on chil-dren’s life could be achieved: girl’s education; in-tegrated development in childhood and adolec-
sence; immunization «plus»; combating HIV/AIDS; and enforced protection of children against do-mestic violence, exploitation and discrimination.
For the first time, the 2006 Kazakhstan Multiple Indicator Cluster Survey (MICS) was conducted in order to analyze and assess progress in the area of mother and child situation in Kazakhstan as well as progress towards Millennium Development Goals. Agency of the Republic of Kazakhstan on Statistics represented the Government RK in the survey conducted under methodological, technical and financial support of UNICEF and financial sup-port of US Agency for International Development (USAID), UN Population Fund (UNFPA), UN Resident Coordinator Fund and International Labor Organization (ILO).
Because of significant discrepancies in social and economical development of the regions of the country, Kazakhstan MICS was conducted at sub-national level, which makes it unique; thus, the results of the survey might encourage the Government and civil society institutes to plan and develop social programs that will meet de-mands of real situation and needs of women and children both at national level and at the level of each region.
In addition, MICS improves the quality of statisti-cal information and monitoring of situation of children and mothers in Kazakhstan and progress towards Millennium Development Goals as well as strengthens technical and qualification potential of the Agency RK on Statistic staff on such surveys.
This final report presents the results of the indica-tors and topics covered in the survey.
Survey objectives2006 Kazakhstan Multiple Indicator Cluster Survey has as its primary objectives:
• To provide up-to-date information for assess-ing the situation of children and women in Kazakhstan;
• To furnish data needed for monitoring progress toward goals established by the Millennium Development Goals in the Millennium Declaration, the goals of A World Fit For Children (WFFC), and other internationally agreed upon goals, as a basis for future action;
• To contribute to the improvement of data and monitoring systems in Kazakhstan and to strengthen technical expertise in the design, implementation, and analysis of such systems.

MONITORING THE SITUATION OF CHILDREN AND WOMEN10
II. Sample and Survey Methodology

KAZAKHSTAN MULTIPLE INDICATOR CLUSTER SURVEY (MICS), 2006 11
Sample designThe sample for the Kazakhstan Multiple Indicator Cluster Survey (MICS) was designed to provide es-timates on a large number of indicators on the situation of children and women at the national level, for urban and rural areas, as well as at sub-national level for 16 regions – 14 Oblasts and 2 cities:
Akmola Oblast
Aktobe Oblast
Almaty Oblast
Atyrau Oblast
West Kazakhstan Oblast
Zhambyl Oblast
Karaganda Oblast
Kostanai Oblast
Kyzylorda Oblast
Mangistau Oblast
South Kazakhstan Oblast
Pavlodar Oblast
North Kazakhstan Oblast
East Kazakhstan Oblast
Astana City
Almaty City
Regions were identified as the main sampling domains and the sample was selected in two stages. The sample was stratified by urban and rural areas (which represent second level territorial and ad-ministrative units). 1999 Population Census enumeration areas were selected as Primary Sampling Units (PSUs). The number of primary sampling units (PSUs) for oblast and main cities depended on the total population at the beginning of 2005.
At the first stage, mentioned number of PSUs was randomly selected for each stratum. In general, 625 PSUs were selected within the country. At the second stage, 24 households were systematically se-lected in each sampled primary sampling unit. Thus, the total number of sampled households made 15,000.
The sample was stratified by region and is not self-weighting. For reporting national level re-sults, sample weights are used. A more detailed description of the sample design can be found in Appendix A.

MONITORING THE SITUATION OF CHILDREN AND WOMEN12
2 Children under-5 and children aged 0–4 years and children aged 0–59 months are used as interchangeable in this report.
In addition to the main activities of the Agency RK on Statistics within the current survey, the staff of the Kazakh Academy of Nutrition conducted study on micronutrients. To do so a sub-sample of 5,000 households was made based upon main sample. This study envisaged interviewing of 5,000 women aged 15-49 on food consumption frequency, blood pressure measurement, taking blood samples for haemoglobin, and collection of urine for iodine excretion measurement. Moreover, within the 5,000 households a sub-sample of 1,000 households with children under 5 was identified to measure the contents of Vitamin A in their blood and to collect edible salt for iodine level meas-urement in laboratory.
The findings of this study will be presented in the second volume of the MICS report due early 2008.
QuestionnairesThree sets of questionnaires were used in the survey: 1) a household questionnaire which was used to collect information on all de jure household members, the household, and the dwelling; 2) a women’s questionnaire administered in each household to all women aged 15-49 years; and 3) an under-5 questionnaire2 administered to mothers or caretakers of all children under 5 living in the household.
The questionnaires included the following modules:
• The Household Questionnaire included the following modules
• Household Listing
• Education
• Water and Sanitation
• Household Characteristics
• Child Labor
• Child Discipline
• Maternal Mortality
• Consumption of Iodized Salt
• The Questionnaire for Individual Woman included the following modules
• Child Mortality
• Maternal and Newborn Health
• Marriage and Union
• Contraception
• Attitudes Towards Domestic Violence
• HIV/AIDS
• The Questionnaire for Children Under Five included the following modules
• Birth Registration and Early Learning
• Child Development
• Breastfeeding
• Care of Illness

KAZAKHSTAN MULTIPLE INDICATOR CLUSTER SURVEY (MICS), 2006 13
• Immunization
• Anthropometry
Moreover, household questionnaires were supplemented with following modules:
• UNICEF Module (knowledge about UNICEF, Convention on the Rights of the Child, sources of information for families);
• Health Care System Information Module;
• Primary Health Care Accessibility Module;
• Accessibility of In-patient and Specialized Care Module
Individual questionnaire for women was added with specially developed modules on:
• Reproductive Behavior
• Tuberculosis
Also the Mother and Newborn Health Module was supplemented by a number of questions on smok-ing and alcohol consumption by women in general and those pregnant in particular.
Out of the 3 questions of UNICEF Module this report only provides findings on sources of informa-tion for family as ones having substantial significance for the public.
Unfortunately, it was not possible to process data from the modules on health care system, accessibility of primary health care and in-pa-tient and specialized care within the framework of this exercise. In this regard it was decided to leave the collected data for further research.
Due to very low response on ques-tions about tobacco and alcohol consumption the findings are not presented.
The questionnaires are based on the MICS3 model questionnaire3; how-ever, some Modules were adapt-ed to Kazakhstan (in particular, Education Module, which was con-siderably changed). English ques-tionnaires were translated into Russian and Kazakh. Questionnaires were pre-tested in Fabrichnyi (Almaty Oblast) and Kordai (Zhambyl Oblast) settlements in November 2005. Based on the results of the pre-test, modifications were made to the wording and translation of the questionnaires. MICS Questionnaires for Kazakhstan are presented in Appendix F.
In addition to the administration of questionnaires, fieldwork teams tested the salt used for cooking in the households for iodine content, and measured the weight and height of children age under 5 years. Details and findings of these measurements are provided in the respective sections of the report.
3 The model MICS3 questionnaire can be found at www.childinfo.org, or in UNICEF, 2006.

MONITORING THE SITUATION OF CHILDREN AND WOMEN14
received a certificate upon completion of the workshop.
Prior to fieldwork, supervisors developed spe-cial routes and schedules for teams moving by clusters. Before fieldwork mass media (newspa-pers, TV and radio) in the fields elucidated MICS targets and terms to population.
The data were collected by 16 teams; each com-prised of six female interviewers, two drivers, one editor and one supervisor – head of team. Qualitative composition of fieldworkers was very high; each team comprised of state serv-ants, supervisors were deputy heads of Oblast/City Statistics Departments, editors – director or deputy director FSE DCC AS RK, interview-ers – senior specialists and heads of depart-ments. Special badge with colored photo, full name, MICS and AS RK logos was prepared for each team member.
Fieldwork began in January and concluded in March 2006.
Preparatory work and coordination of all struc-tures involved in the Project was agreed with MICS coordinators from the Agency RK on Statistics with close cooperation of UNICEF and UNFPA MICS coordinators.
Central office of RSE DCC of the Agency RK on Statistics dispatched all necessary tools and equipment required for MICS fieldwork ahead of time.
During the fieldwork, Project Coordinators had
Training and fieldworkThe list of team members for 16 domains was composed from Oblast/City Statistics Departments staff. Training on data collec-tion techniques in the fields was conducted in November-December 2005. Four regional train-ing workshops 6 days long each were conduct-ed in Petropavlovsk City (21-26 November), Shymkent City (28 November – 3 December), Semipalatinsk City (5-10 December) and Aktobe City (20-25 December) for the staff of regional departments involved in fieldwork. In total, 129 Statistic Division’s staff members were trained.
Four teams of eight people from each Oblast par-ticipated in each workshop, in total 32 people. Training included lectures on interviewing tech-niques, contents of the questionnaires and mock interviews between trainees in practice inter-viewing. By the end of the training participants spent two days in practicing interviewing at the venue of training workshops. With the purpose of practical training, teams of interviewers and respondents were established that had mock in-terviews and answered each questionnaire fol-lowed with discussion of completed question-naires, correction of mistakes and amendment of some questions for better comprehension. In addition, training on anthropometric measure-ments of children under 5 and testing of iodine in salt by testers was conducted in small groups. In the frames of the same workshops, special 2-day training workshops were conducted for su-pervisors and editors on monitoring in the fields and editing of questionnaires. Each participant

KAZAKHSTAN MULTIPLE INDICATOR CLUSTER SURVEY (MICS), 2006 15
a few monitoring visits to the following Oblasts in accordance with schedule for field teams: Akmola, Karaganda, Mangistau, Atyrau, Almaty, Zhambyl, Kyzylorda and South Kazakhstan. Representative from UNICEF Regional Office (Geneva, Switzerland) took part in monitoring in the first two Oblasts.
Heads of Oblast, city (rayon and rural) Akimates, health workers as well as statisticians provided efficient assistance to MICS teams in the fields. After completion of fieldwork teams presented reports, photo/video materials, comments and suggestions for MICS to the Central Office of AS RK.
Data Processinging entered data. Data were entered on twelve personal computers by 24 operators in two shifts. Four editors, four controllers (operators) and two supervisors monitored the question-naires quality and data entry. In order to ensure quality control, all questionnaires were double entered and internal consistency checks were performed. Procedures and standard programs developed under the global MICS-3 project and adapted to the Kazakhstan questionnaires were used throughout. Data processing began simul-taneously with data collection in January 2006 and finished at the beginning of April 2006. Data were analysed using the Statistical Package for Social Sciences (SPSS) software program, ver-sion 14, and the model syntax and tabulation plans developed by UNICEF for this purpose.
Data were centrally processed in Data Computing Center of the Agency RK on Statistics (DCC AS RK). Editors responsible for checking complete-ness and correctness of completed question-naires as well as controllers responsible for data verification and operators entering data passed special training. Field editors checked complet-ed questionnaires for completeness and quality, composed questionnaires for households with-in clusters and sent them to the Central Office AS RK for data entry and establishment of data-base.
Fourteen computers were installed in the ap-propriate premises in DCC AS RK, 12 of these computers had CSPro software for data entry and 2 – CSPro software for controllers verify-

MONITORING THE SITUATION OF CHILDREN AND WOMEN16
III. Sample Coverage and the Characteristics of Households and Respondents

KAZAKHSTAN MULTIPLE INDICATOR CLUSTER SURVEY (MICS), 2006 17
Sample CoverageOf the 15,000 households selected for the sample, 14,984 were found to be occupied. Of these 14,564 were successfully interviewed for a household response rate of 97.2 percent. In the inter-viewed households, 14,719 women (age 15-49) were identified. Of these, 14,570 were successfully interviewed, yielding a response rate of 99.0 percent. In addition, 4,424 children under age five were listed in the household questionnaire. Of these, questionnaires were completed for 4,416, which correspond to a response rate of 99.8 percent. Overall response rates calculated for the interviews of women 15-49 years of age and children under-5 were 96.2 and 97.0 percent respectively (Table HH.1).
Household response rates in rural areas were higher than in urban – 99.4 percent and 95.6 percent respectively.
The overall household response rate throughout the country was high and varied from 91.6 percent in Almaty City up to 99 percent in Zhambyl Oblast.
Characteristics of Households The age and sex distribution of survey population is provided in HH.2. The distribution is also used to produce the population pyramid by sex and age in Figure HH.2. In 14,564 households successfully interviewed in the survey 51,261 household members were listed. Of these 24,724 (48.2 percent) were males and 26,537 (51.8 percent) were females. These data also indicate that the survey esti-mated the average household size at 3.5 people.
Population aged 0-14 years made up 12,344 people or 24.1 percent, of these 6,405 were males (25.9 percent of all males), 5,939 were females (22.4 percent of all females). Population aged 15-64 years made 34,428 people or 67.2 percent, of these 16,621 were males (67.2 percent of all males) and 17,807 were females (67.1 percent of all females). People older 65 were 4,488 or 8.7 percent, of these 1,698 were males (6.9 percent of all males) and 2,790 were females (10.5 percent of all females). Children aged 0-17 years were 15,538 or 30.3 percent of total number of survey household mem-bers, of these 8,090 were males (32.7 percent of all males) and 7,448 were females (28.1 percent of all females).
According to official statistics , as of 1 January 2006, the distribution of the population of the Republic of Kazakhstan by sex and age was as follows: percentage of males was 48.1 and females – 51,9 per-

MONITORING THE SITUATION OF CHILDREN AND WOMEN18
Figure HH.2. Age and sex distribution of household population, %, Kazakhstan, 2006
vey and official statistics of Kazakhstan as of 1 January 2006, deviation makes 0.1 percent to 1.1 percent.
Table HH.3 provides basic background infor-mation on the households. Within households, the sex of the household head, region, urban/rural status, number of household members, and ethnicity4 group of the household head are shown in the table. These background charac-teristics are also used in subsequent tables in this report; the figures in the table are also in-tended to show the numbers of observations by major categories of analysis in the report.
The weighted and unweighted numbers of households are equal, since sample weights were normalized (See Appendix A). The ta-ble also shows the proportions of households where at least one child under 18, at least one child under 5, and at least one eligible woman age 15-49 were found. The proportion of house-hold with at least one child under 18 made 56.7 percent, in 21.8 percent of households were children under 5, proportion of households with at least one woman aged 15-49 made 70.6 percent.
13 percent of households had one member, 41 percent had 2-3 members, 32.4 percent had 4-5 members, 10.5 percent had 6-7 members, 2.4 percent had 8-9 members and 0.8 percent had 10 and more household members.
cent. Population aged 0-14 years made 24.2 per-cent, of this age group 25.7 percent were males and 22.8 percent females. Population aged 15-64 years of age made 68 percent, of this age group 68.5 percent were males and 67.5 percent were females. The age group of people older than 65 made 7.8 percent, of these 5.8 percent were males and 9.7 percent females. Percentage of children aged 0-17 years made 30.3 percent; of these 32.2 percent were males, 28.6 percent were females of total number of males and fe-males respectively.
This data proves there is an insignificant diver-gence in distribution of population by sex and age (wide age group) between the current sur-
4 This was determined by asking about native language of household head
Males Females
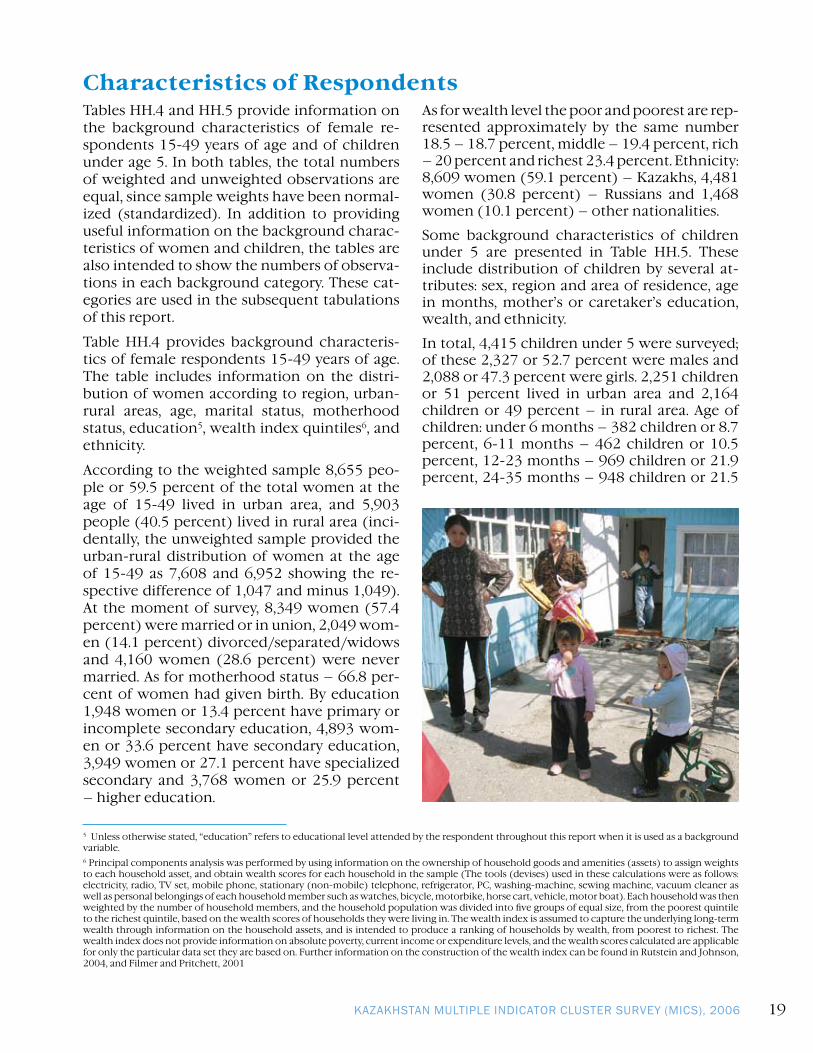
KAZAKHSTAN MULTIPLE INDICATOR CLUSTER SURVEY (MICS), 2006 19
Tables HH.4 and HH.5 provide information on the background characteristics of female re-spondents 15-49 years of age and of children under age 5. In both tables, the total numbers of weighted and unweighted observations are equal, since sample weights have been normal-ized (standardized). In addition to providing useful information on the background charac-teristics of women and children, the tables are also intended to show the numbers of observa-tions in each background category. These cat-egories are used in the subsequent tabulations of this report.
Table HH.4 provides background characteris-tics of female respondents 15-49 years of age. The table includes information on the distri-bution of women according to region, urban-rural areas, age, marital status, motherhood status, education5, wealth index quintiles6, and ethnicity.
According to the weighted sample 8,655 peo-ple or 59.5 percent of the total women at the age of 15-49 lived in urban area, and 5,903 people (40.5 percent) lived in rural area (inci-dentally, the unweighted sample provided the urban-rural distribution of women at the age of 15-49 as 7,608 and 6,952 showing the re-spective difference of 1,047 and minus 1,049). At the moment of survey, 8,349 women (57.4 percent) were married or in union, 2,049 wom-en (14.1 percent) divorced/separated/widows and 4,160 women (28.6 percent) were never married. As for motherhood status – 66.8 per-cent of women had given birth. By education 1,948 women or 13.4 percent have primary or incomplete secondary education, 4,893 wom-en or 33.6 percent have secondary education, 3,949 women or 27.1 percent have specialized secondary and 3,768 women or 25.9 percent – higher education.
As for wealth level the poor and poorest are rep-resented approximately by the same number 18.5 – 18.7 percent, middle – 19.4 percent, rich – 20 percent and richest 23.4 percent. Ethnicity: 8,609 women (59.1 percent) – Kazakhs, 4,481 women (30.8 percent) – Russians and 1,468 women (10.1 percent) – other nationalities.
Some background characteristics of children under 5 are presented in Table HH.5. These include distribution of children by several at-tributes: sex, region and area of residence, age in months, mother’s or caretaker’s education, wealth, and ethnicity.
In total, 4,415 children under 5 were surveyed; of these 2,327 or 52.7 percent were males and 2,088 or 47.3 percent were girls. 2,251 children or 51 percent lived in urban area and 2,164 children or 49 percent – in rural area. Age of children: under 6 months – 382 children or 8.7 percent, 6-11 months – 462 children or 10.5 percent, 12-23 months – 969 children or 21.9 percent, 24-35 months – 948 children or 21.5
5 Unless otherwise stated, “education” refers to educational level attended by the respondent throughout this report when it is used as a background variable.6 Principal components analysis was performed by using information on the ownership of household goods and amenities (assets) to assign weights to each household asset, and obtain wealth scores for each household in the sample (The tools (devises) used in these calculations were as follows: electricity, radio, TV set, mobile phone, stationary (non-mobile) telephone, refrigerator, PC, washing-machine, sewing machine, vacuum cleaner as well as personal belongings of each household member such as watches, bicycle, motorbike, horse cart, vehicle, motor boat). Each household was then weighted by the number of household members, and the household population was divided into five groups of equal size, from the poorest quintile to the richest quintile, based on the wealth scores of households they were living in. The wealth index is assumed to capture the underlying long-term wealth through information on the household assets, and is intended to produce a ranking of households by wealth, from poorest to richest. The wealth index does not provide information on absolute poverty, current income or expenditure levels, and the wealth scores calculated are applicable for only the particular data set they are based on. Further information on the construction of the wealth index can be found in Rutstein and Johnson, 2004, and Filmer and Pritchett, 2001
Characteristics of Respondents

MONITORING THE SITUATION OF CHILDREN AND WOMEN20
percent, 36-47 months – 858 children or 19.4 percent and 48-59 months – 796 children or 18 percent. Mothers with children under 5 had the following educational level: primary and incomplete secondary 7 percent or 309 moth-ers, 45.3 percent or 2,000 mothers had second-ary education, 23.3 percent or 1,030 mothers
had specialized secondary and 24.4 percent or 1,076 mothers had higher education.
Households with children under 5 were distrib-uted by wealth quintiles as the following: poor-est – 26.9 percent, poor – 20.9 percent, mid-dle 19.7 percent, rich – 16 percent and richest – 16.4 percent.
tively, while in Aktobe, Mangistau and Atyrau Oblasts – from 82 to 89 percent of population. The next popular source of information report-ed by over one fourth (25.4 percent) of popula-tion was radio, at that, the proportion of urban population is twice as much as rural one.
The popularity of radio also varies by region: 62 percent of the population of Almaty City and over 40 percent of the population in Aktobe and Atyrau Oblasts reported radio as one of the source of information for family, while in 8 regions of the Republic proportion of such respondents is below 20 percent. Over 18 per-cent of Kazakhstan’s population gets informa-tion from magazines, with a higher proportion among the urban population. Outdoor adver-tisement and posters (9.4 percent) as well as Internet (4.7 percent) are not very popular among respondents. Internet was mentioned by 7 percent of the urban population and 13.7 percent of respondents with higher education, at that, the largest proportion of respondents live in the cities of Astana (21.9 percent) and Almaty (13.5 percent). Overall, the popular-ity of some sources of information depends mainly on the level of education and wealth of the population as well as regions and place of residence, and, of course, access to some sources, for instance, to Internet.
During the survey, household members were asked about the main sources of information for the family. Respondents proposed the fol-lowing sources: newspaper, TV, radio, maga-zines, Internet, outdoor advertisement and posters, siblings, friends, neighbors, colleagues.
Almost all the population (over 97 percent) of Kazakhstan was found to be receiving infor-mation for the family, mainly, from TV, with no large difference by the place of residence, level of education, wealth, ethnicity and region. The second source of information for the popula-tion is newspapers (66 percent), with a higher proportion of the urban population; propor-tion of respondents with higher education lev-els prevails over those with lower education levels. Less than half of the population gets in-formation from the newspapers in Kyzylorda (44.1 percent) and South Kazakhstan (49.1 per-cent) Oblasts. The third predominant source of information for over half of Kazakhstan’s population (54.3 percent) are friends, relatives, neighbors and colleagues – equally used by ur-ban and rural population irrespective of edu-cational level, wealth and ethnicity. Popularity of this source varies significantly by region: in Kostanai and North Kazakhstan Oblasts only 38 and 41 percent of population gets information from friends, relatives, and colleagues respec-
Sources of information for the family

KAZAKHSTAN MULTIPLE INDICATOR CLUSTER SURVEY (MICS), 2006 21
IV. Child mortality

MONITORING THE SITUATION OF CHILDREN AND WOMEN22
1990b). The data used in the estimation are: the mean number of children ever born for five-year age groups of women from age 15 to 49, and the proportion of these children who are dead, also for five-year age groups of wom-en. The technique converts these data into probabilities of dying by taking into account both the mortality risks to which children are exposed and their length of exposure to the risk of dying, assuming a particular model age pattern of mortality. Based on previous infor-mation on mortality in Kazakhstan the stand-ard East model life table was selected as most appropriate and more accurately reflecting mortality in age groups 20-24, 25-29 and 30-34 years.
Table CM.1 provides estimates of child mortal-ity by various background characteristics, while Table CM.2 provides the basic data used in the calculation of the mortality rates for the na-tional total. IMR and U5MR estimates provided for the national level by sex, place of residence and ethnicity.
The infant mortality rate is estimated at 32 per thousand, while the probability of dying under-5 mortality rate (U5MR) is around 36 per thousand livebirths. These estimates have been calculated by averaging mortality esti-mates obtained from women aged 20-24, 25-29 and 30-34. There is a difference between the probabilities of dying among males and females. Boy’s mortality significantly exceeds
One of the overarching goals of the Millennium Development Goals (MDGs) and the World Fit for Children (WFFC) is to reduce in-
fant and under-five mortality. Specifically, the MDGs call for the reduction in under-five mor-tality by two-thirds between 1990 and 2015. Monitoring progress towards this goal is an important but difficult objective. Measuring childhood mortality may seem easy, but at-tempts using direct questions, such as “Has an-yone in this household died in the last year?” give inaccurate results. Using direct measures of child mortality from birth histories is time consuming, more expensive, and requires greater attention to training and supervision. Alternatively, indirect methods developed to measure child mortality produce robust esti-mates that are comparable with the ones ob-tained from other sources. Indirect methods minimize the pitfalls of memory lapses, inex-act or misinterpreted definitions, and poor in-terviewing technique.
The infant mortality rate is the probability of dying before the first birthday (during the first year of life). The under-five mortality rate (U5MR – under 5 mortality rate) is the prob-ability of dying before the fifth birthday (aged 0-4 years). In MICS surveys, infant and under five mortality rates are calculated based on an indirect estimation technique known as the Brass method (United Nations, 1983; 1990a;
Figure CM.1. Infant Mortality by Sources, Kazakhstan, 2006
DHS(1995, 1999), MICS(2006) AS RK Linear (DHS(1995, 1999), MICS(2006))

KAZAKHSTAN MULTIPLE INDICATOR CLUSTER SURVEY (MICS), 2006 23
Figure CM.1". Under Five Mortality Rate, Kazakhstan, 2006
Figure CM.1#. Under Five Mortality Tendency, Kazakhstan, 2006
7 Nutrition Institute MoH-SA RK, Academy of Preventive Medicine, Demography and Health Survey Department, Macro International Inc. Kazakhstan Demography and Health Survey, 1995. Almaty, 1996. 8 Academy of Preventive Medicine, and Macro International Inc., 2000. Kazakhstan Demography and Health Survey, 1999. Almaty, 2000.
girl’s and makes 36.6 and 26.6 per thousand respectively. In rural area infant mortality rates are almost 1.5 times higher than in ur-ban areas.
Figure CM.1 reflects infant mortality rates by different sources – there are obvious significant differences between official data and data ob-tained from surveys7 conducted in Kazakhstan. According to official statistics, in 1985-1994 infant mortality was on average approximately 27 per 1,000 live births, gradually declining in 1996-2005 reaching over 19 cases per 1,000 of births.
Under-5 mortality rates are provided in Figure CM.1A. U5MR is a bit higher in rural than in urban areas and mortality among boys is sig-nificantly higher than among girls. Moreover, U5MR is higher among Kazakh population.
Figure CM.1B shows the series of U5MR es-timates of the survey, based on responses of women in different age groups, and referring to various points in time, thus showing the esti-mated trend in U5MR based on DHS-1995 and MICS-2006 as well as country’s official statis-tics8. The MICS estimates indicate a decline in mortality during the last 15 years.
Area
Urban
Rural
Sex
Boys
Girls
EthnicityKazakhs
Russians
Kazakhstan
Per 1,000 livebirths
DHS 1995 AS RK MICS 2006 Linear (DHS 1995) Linear (MICS 2006)
Different approaches to life birth definitions and child’s mortality assessment techniques cause discrepancies between different sources. Further qualification of these apparent declines and differences as well as its determinants should be taken up in a more detailed and sep-arate analysis.
30.2
42.6
41.7
30.3
36.2
31.0
36.3

MONITORING THE SITUATION OF CHILDREN AND WOMEN24
V. Nutrition

KAZAKHSTAN MULTIPLE INDICATOR CLUSTER SURVEY (MICS), 2006 25
Nutritional StatusChildren’s nutritional status is a reflection of their overall health. When children have access to an adequate food supply, are not exposed to repeated illness, and are well cared for, they reach their growth potential and are considered well nourished.
Malnutrition is associated with more than half of all children deaths worldwide. Undernourished children are more likely to die from common childhood ailments, and for those who survive, have recurring sicknesses and faltering growth. Three-quarters of the children who die from causes re-lated to malnutrition were only mildly or moderately malnourished – showing no outward sign of their vulnerability. The Millennium Development target is to reduce by half the proportion of people who suffer from hunger between 1990 and 2015. The World Fit for Children goal is to re-duce the prevalence of malnutrition among children under five years of age by at least one-third (between 2000 and 2010), with special attention to children under 2 years of age. A reduction in the prevalence of malnutrition will assist in the goal of reducing child mortality.
In a well-nourished population, there is a reference distribution of height and weight for children under five. Under-nourishment in a population can be gauged by comparing children to a refer-ence population. The reference population used in this report is the WHO/CDC/NCHS reference, which was recommended for use by UNICEF and the World Health Organization (WHO) at the time the survey was implemented. Each of the three nutritional status indicators can be expressed in standard deviation units (z-scores) from the median of the reference population.
Weight-for-age is a measure of both acute and chronic malnutrition. Children whose weight-for-age is more than two standard deviations below the median of the reference population are con-sidered moderately or severely underweight while those whose weight-for-age is more than three standard deviations below the median are classified as severely underweight.
Height-for-age is a measure of linear height of children. Children whose height-for-age is more than two standard deviations below the median of the reference population are considered short for their age and are classified as moderately or severely stunted. Those whose height-for-age is more than three standard deviations below the median are classified as severely stunted. Stunting is a reflection of chronic malnutrition as a result of failure to receive adequate nutrition over a long period and recurrent or chronic illness.
Finally, children whose weight-for-height is more than two standard deviations below the median of the reference population are classified as moderately or severely wasted, while those who fall more than three standard deviations below the median are severely wasted. Wasting is usually the result of a recent nutritional deficiency. The indicator may exhibit lack of foodstuffs in popula-tion or might be related to the high prevalence of illnesses among children from that particular

MONITORING THE SITUATION OF CHILDREN AND WOMEN26
children are stunted for their age and 4 percent are too short (Table NU.1).
Children in the West Kazakhstan (8.8 percent) and Almaty Oblasts (8.1 percent) are more likely to be underweight for their age than other chil-dren; as for height to age – Aktobe Oblast (23.5 percent), Kyzylorda Oblast (23.3 percent) and Almaty Oblast (22.1 percent). The highest propor-tion of moderately stunted children for their age was found in West Kazakhstan (12.5 percent) and Mangistau Oblasts (9.3 percent). Those children whose mothers have higher levels of education are the least likely to be underweight and stunted compared to children of mothers with primary/incomplete secondary education. Boys appear more likely to be underweight and stunted.
A higher percentage of stunted and under-weight for their age children are found in the age group 12-23 months (Figure NU.1). This pattern may well be expected as it relates to the age at which many children cease to be breast-fed, which coupled with inadequate comple-mentary feeding, lead to high risk of disease development due to exposure to contaminated water, food and other environmental factors. The worst underweight for age was found in age group below 6 months.
In addition, 11.3 percent of children are over-weighed; percentage of boys and girls as well as children in urban and rural areas is almost the same.
Figure NU.1. Percentage of children under 5 who are undernourished, Kazakhstan, 2006
age group (for example, diarrhoea, HIV/AIDS, etc.). An increase in this indicator by 5 percent requires certain measures as growth of infant mortality could be expected afterwards.
In MICS, weights and heights of all children un-der 5 years of age were measured using anthro-pometric equipment recommended by UNICEF (UNICEF, 2006). Findings in this section are based on the results of these measurements.
Table NU.1 shows percentages of children clas-sified into each of these categories, based on the anthropometric measurements that were taken during fieldwork. Additionally, the table includes the percentage of children who are overweight, which takes into account those children whose weight for height is above 2 standard deviations from the median of the reference population.
In Table NU.1, children who were not weighed and measured (about 2.6 percent of children) and those whose measurements are outside a plausible range are excluded. In addition, a small number of children whose birth dates are not known are excluded.
In Kazakhstan 4 percent of children under 5 are moderately underweight (weight for age) and 0.8 percent are classified as severely un-derweight, at that, 3.8 percent of children are wasted (weight for height) and 1 percent – se-vere wasted. At the same time, 12.8 percent of
Underweight Stunted Wasted
Age (months)
%

KAZAKHSTAN MULTIPLE INDICATOR CLUSTER SURVEY (MICS), 2006 27
Breastfeeding for the first few years of life pro-tects children from infection, provides an ide-al source of nutrients, and is economical and safe. However, many mothers stop breastfeed-ing too soon and there are often pressures to switch to infant formula, which can contribute to growth faltering and micronutrient malnu-trition and is unsafe if clean water is not readily available. The World Fit for Children goal states that children should be exclusively breastfed for 6 months and continue to be breastfed in addition to nutritious, safe and adequate com-plementary feeding for up to 2 years of age and beyond.
WHO/UNICEF have the following feeding recommendations:
• Exclusive breastfeeding for first six months
• Continued breastfeeding for two years or more
• Timely introduction of nutritious and safe complementary foods beginning at 6 months
• Frequency of complementary feeding should be: 2 times per day for 6-8 month olds; 3 times per day for 9-11 month old children
It is also recommended that breastfeeding be ini-tiated within one hour of birth.
Quality of child feeding is evaluated by the following indicators:
• Exclusive breastfeeding rate (< 6 months & < 4 months)
• Timely complementary feeding rate (6-9 months)
• Continued breastfeeding rate (12-15 & 20-23 months)
• Timely initiation of breastfeeding (within 1 hour of birth)
• Frequency of complementary feeding (6-11 months)
• Proportion of adequately fed infants (0-11 months)
Table NU.2 provides the proportion of women who started breastfeeding their infants with-in one hour of birth, and women who started
Breastfeeding
The percentage of women with higher educa-tion who timely started breastfeeding (within 1 hour after birth) almost by 10 percent exceeded the percentage of women with lower education level. The highest proportion of women who started breastfeeding within one hour of birth was in Kyzylorda (95.5 percent) and Karaganda (91.6 percent) Oblasts, the lowest proportion were found in Aktobe Oblast (31.5 percent) and North Kazakhstan (36.6 percent) Oblasts.
87.8 percent started breastfeeding within one day of birth (which includes those who started within one hour), percentage of such women in urban and rural settlements is almost the same – 87.7 and 88 percent respectively (Figures NU.2). In almost all regions of Kazakhstan over 90 percent of wom-en started breastfeeding their infants within one day of birth, with the exception of women from Pavlodar, Akmola and East Kazakhstan Oblasts (68.6, 77.3 and 80.6 percent respectively).
In Table NU.3, breastfeeding status is based on the reports of mothers/caretakers of children’s consumption of food and fluids in the 24 hours prior to the interview. Exclusively breastfed re-fers to infants who received only breast milk (and vitamins, mineral supplements, or medi-cine). The table shows exclusive breastfeed-
breastfeeding within one day of birth (which in-cludes those who started within one hour).
In total 1,719 women who gave birth to a live baby during two years before the survey were interviewed about breastfeeding. Of them 64.2 percent started breastfeeding within one hour of birth, the difference between urban and ru-ral women was 4.4 percent – urban women 66.3 percent and 61.9 of rural women respectively.

MONITORING THE SITUATION OF CHILDREN AND WOMEN28
Figure NU.2. Percentage of mothers who started breastfeeding within one hour and within one day of birth, Kazakhstan, 2006
Regi
ons
Akm
ola
Akt
obe
Alm
aty
Aty
rau
Wes
t Kaz
akhs
tan
Zham
byl
Kara
gand
a
Kost
anai
Kyzy
lord
a
Sout
h Ka
zakh
stan
Pavl
odar
Nor
th K
azak
hsta
n
East
Kaz
akhs
tan
Alm
aty
City
Urb
an
Rura
l
Kaz
akhs
tan
Within one hour
Within one day
are receiving liquids or foods other than breast milk. By the end of the sixth month, the percent-age of children exclusively breastfed is below 10 percent. Only over 16 percent of children are re-ceiving breast milk after 2 years.
The adequacy of infant feeding in children less than 12 months is provided in Table NU.4. Different criteria of adequate feeding are used depending on the age of the child. For infants aged 0-5 months, exclusive breastfeeding is considered as adequate practice. Infants aged 6-8 months and 9-11 months are considered to be adequately fed if they are receiving breastmilk at least two-three times a day (excluding night feeding) in addition to adequate quality and quantity feeding. 16.8 children aged below 6 month are adequately fed, girls more often than boys. Percentage of exclusively breastfed chil-dren aged 0-5 months in urban and rural areas and by mother’s education is almost the same.
28.8 percent of babies aged 6-8 months receive adequate feeding; boys were slightly more likely to be adequately fed than girls were. The propor-tion of such children in urban and rural areas is 30.3 and 27.1 percent respectively. By age 9-11 months 19.7 percent of children are adequately fed, there is almost no difference between boys and girls. However, the proportion of such chil-dren in rural area is higher than in urban.
ing of infants during the first six months of life (separately for 0-3 months and 0-5 months), as well as complementary feeding of children 6-9 months and continued breastfeeding of chil-dren at 12-15 and 20-23 months of age.
16.8 percent of children aged less than six months are exclusively breastfed, which is an extremely low figure. Timely introduction of complemen-tary feeding at age 6-9 months was found in 39.1 percent of children (receive breast milk and solid or semi-solid foods). By age 12-15 months, 57.1 percent of children are still being breastfed and by age 20-23 months, 16.2 percent are still breastfed. Girls were more likely to be exclusively breastfed than boys, while boys had higher levels than girls for timely complementary feeding.
In rural area, the percentage of exclusively breast-fed children aged below six months is higher than in urban areas, the same trend is found in children aged 12-15 months and 20-23 months who still receive breast milk. Percentage of chil-dren receiving timely complementary feeding aged 6-9 months is higher than in urban areas and less wealthy households.
Figure NU.3 shows the detailed pattern of breast-feeding by the child’s age in months. [This figure is obtained by using data from Table NU.3W]. Even at the earliest ages, the majority of children
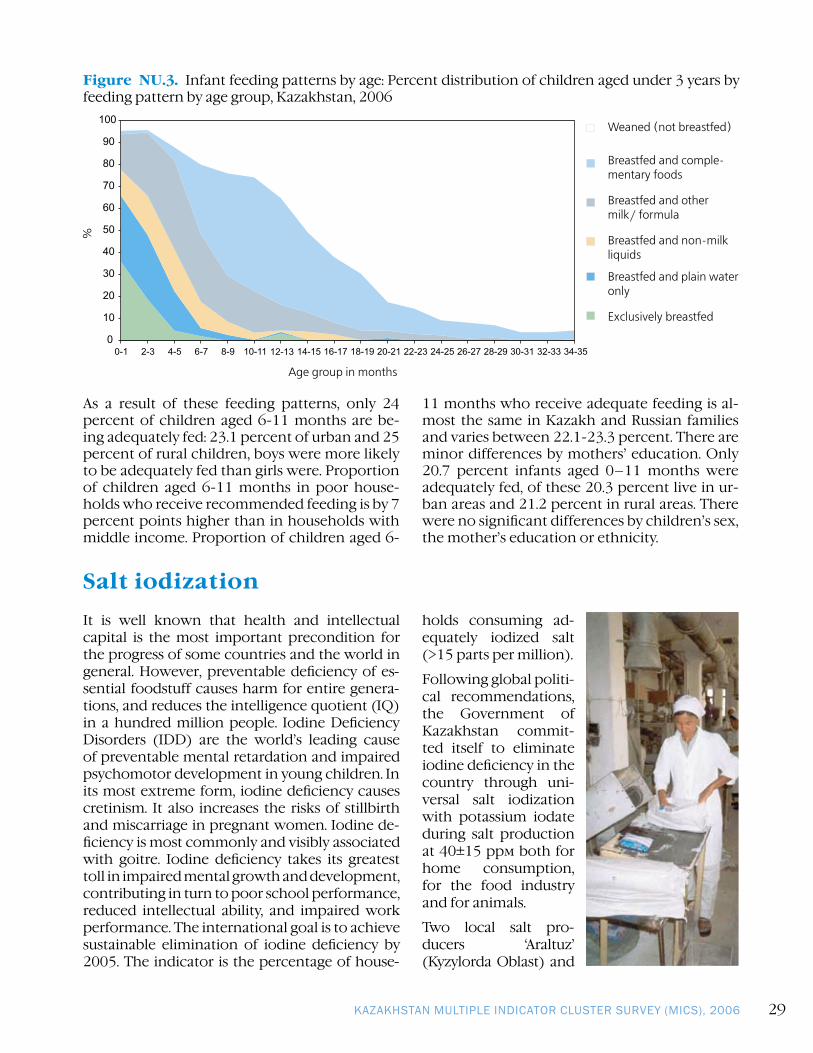
KAZAKHSTAN MULTIPLE INDICATOR CLUSTER SURVEY (MICS), 2006 29
As a result of these feeding patterns, only 24 percent of children aged 6-11 months are be-ing adequately fed: 23.1 percent of urban and 25 percent of rural children, boys were more likely to be adequately fed than girls were. Proportion of children aged 6-11 months in poor house-holds who receive recommended feeding is by 7 percent points higher than in households with middle income. Proportion of children aged 6-
Figure NU.3. Infant feeding patterns by age: Percent distribution of children aged under 3 years by feeding pattern by age group, Kazakhstan, 2006
Weaned (not breastfed)
Breastfed and comple-mentary foods
Breastfed and other milk/ formula
Breastfed and non-milk liquids
Breastfed and plain water only
Exclusively breastfed
Age group in months
%
11 months who receive adequate feeding is al-most the same in Kazakh and Russian families and varies between 22.1-23.3 percent. There are minor differences by mothers’ education. Only 20.7 percent infants aged 0–11 months were adequately fed, of these 20.3 percent live in ur-ban areas and 21.2 percent in rural areas. There were no significant differences by children’s sex, the mother’s education or ethnicity.
It is well known that health and intellectual capital is the most important precondition for the progress of some countries and the world in general. However, preventable deficiency of es-sential foodstuff causes harm for entire genera-tions, and reduces the intelligence quotient (IQ) in a hundred million people. Iodine Deficiency Disorders (IDD) are the world’s leading cause of preventable mental retardation and impaired psychomotor development in young children. In its most extreme form, iodine deficiency causes cretinism. It also increases the risks of stillbirth and miscarriage in pregnant women. Iodine de-ficiency is most commonly and visibly associated with goitre. Iodine deficiency takes its greatest toll in impaired mental growth and development, contributing in turn to poor school performance, reduced intellectual ability, and impaired work performance. The international goal is to achieve sustainable elimination of iodine deficiency by 2005. The indicator is the percentage of house-
holds consuming ad-equately iodized salt (>15 parts per million).
Following global politi-cal recommendations, the Government of Kazakhstan commit-ted itself to eliminate iodine deficiency in the country through uni-versal salt iodization with potassium iodate during salt production at 40±15 !!" both for home consumption, for the food industry and for animals.
Two local salt pro-ducers ‘Araltuz’ (Kyzylorda Oblast) and
Salt iodization

MONITORING THE SITUATION OF CHILDREN AND WOMEN30
‘Pavlodarsol’ (Pavlodar Oblast) have the techni-cal capacity to supply the internal market with adequately iodized salt in sufficient quantity. Sanitary-epidemiological services of the Ministry of Healthcare of the Republic of Kazakhstan bear the responsibility for inspection and monitoring of foodstuffs. Success of the Republic of Kazakhstan recent years was based on effective cooperation between the government, salt producers, non-governmental sector and international organiza-tions (UNICEF and ADB). Today, the children of Kazakhstan are better protected against mental retardation due to increased access to iodized salt. Today Kazakhstan joins the elite nations that have achieved comprehensive salt iodization9.
In 98.8 percent of households, salt used for cook-ing was tested for iodine content by using salt test
ished, with reduced muscle strength, through-out their lives, and suffer a higher incidence of diabetes and heart disease in later life. Children born underweight also tend to have a lower IQ and cognitive disabilities, affecting their per-formance in school and their job opportunities as adults.
In the developing world, low birth weight stems primarily from the mother’s poor health and nutrition. Three factors have most impact: the
Figure NU.5. Percentage of households consuming adequately iodized salt, Kazakhstan, 2006
Weight at birth is an obvious indicator not only of a mother’s health and nutritional status but also the newborn’s chances for survival, growth, long-term health and psychosocial develop-ment. Low birth weight (less than 2,500 grams) carries a range of grave health risks for children. Babies who were undernourished in the womb face a greatly increased risk of dying during their early months and years. Those who survive have impaired immune function and increased risk of disease; they are likely to remain undernour-9 UNICEF, Kazakhstan. Assessment of Salt Iodization Adequacy and Its Consumption in Kazakhstan, Almaty, 2005.
Low Birth Weight
kits and testing for the presence of potassium io-date. Table NU.5 shows that in a very small pro-portion of households (0.3 percent), there was no salt available. In 92 percent of households, salt was found to contain 15 ppm or more of iodine. Use of iodized salt was lowest in Pavlodar Obast (only 68.3 percent) and highest in Almaty (99.7 percent) and Mangistau (99.5 percent) Oblasts. The difference between urban and rural house-holds in terms of iodized salt consumption is much less than expected (Figure NU.5).
The above data proves that Kazakhstan should be ready for certification as a country that has achieved universal salt iodization. In addi-tion, monitoring of iodized salt quality as well as monitoring of iodine deficiency prevalence among population should be enforced.
Regi
ons
Akm
ola
Akt
obe
Alm
aty
Aty
rau
Wes
t Kaz
akhs
tan
Zham
byl
Kara
gand
a
Kost
anai
Kyzy
lord
a
Man
gist
au
Sout
h Ka
zakh
stan
Pavl
odar
Nor
th K
azak
hsta
n
East
Kaz
akhs
tan
Ast
ana
City
Alm
aty
City
Urb
an
Rura
l
Kaz
akhs
tan

KAZAKHSTAN MULTIPLE INDICATOR CLUSTER SURVEY (MICS), 2006 31
10 For a detailed description of the methodology, see Boerma, Weinstein, Rutstein and Sommerfelt, 1996.
Urb
an
Rura
l
Prim
ary/
inco
m-
plet
e se
cond
ary
Seco
ndar
y
Spec
ializ
ed
seco
ndar
y
Hig
her
Poor
est
Seco
nd
Mid
dle
Four
th
Rich
est
Kaz
akhs
tan
Figure NU.8. Percentage of Infants Weighing Less Than 2500 Grams at Birth, Kazakhstan, 2006
mother’s poor nutritional status before concep-tion, short stature (due mostly to undernourish-ment and infections during her childhood), and poor nutrition during the pregnancy. Inadequate weight gain during pregnancy is particularly im-portant since it accounts for a large proportion of foetal growth retardation. Moreover, diseases such as diarrhoea and malaria, which are com-mon in many developing countries, can signifi-cantly impair foetal growth if the mother be-comes infected while pregnant.
In the industrialized world, cigarette smok-ing during pregnancy is the leading cause of low birth weight. In developed and developing countries alike, teenagers who give birth when their own bodies have yet to finish growing run the risk of bearing underweight babies.
Because many infants are not weighed at birth and those who are weighed may be a biased sam-ple of all births, the reported birth weights usu-ally cannot be used to estimate the prevalence of low birth weight among all children. Therefore, the percentage of births weighing below 2,500 grams is estimated from two items in the ques-tionnaire: the mother’s assessment of the child’s size at birth (i.e., very small, smaller than aver-age, average, larger than average, very large) and the mother’s recall of the child’s weight or the weight as recorded on a health card if the child was weighed at birth10.
In Kazakhstan almost all babies were weighed at birth (99.4 percent) and 5.8 percent of infants are estimated to weigh less than 2500 grams at birth (Table NU.8 and Figure NU.8). There was significant variation by region: the highest pro-portion of children with low weight was found in Pavlodar Oblast (19.4 percent), and in 9 Oblasts number of such children was between 4.1 – 4.8 percents. The percentage of low birth weight does not vary much by urban and rural areas, but the percentage of children with low weight was higher if mothers had primary/in-complete secondary education comparing to women with higher levels of education.

MONITORING THE SITUATION OF CHILDREN AND WOMEN32
VI. Child Health

KAZAKHSTAN MULTIPLE INDICATOR CLUSTER SURVEY (MICS), 2006 33
ImmunizationMillennium Development Goal (MDG) 4 aims to reduce child mortality by two thirds between 1990 and 2015. Immunization plays a key part in this goal. Immunization has saved the lives of millions of children in the three decades since the launch of the Expanded Programme on Immunization (EPI) in 1974. Worldwide there are still 27 million children overlooked by routine immunization and as a result, vaccine-preventable diseases cause more than 2 million deaths every year.
A World Fit for Children goal is to ensure full immunization of children under one year of age at 90 percent nationally, with at least 80 percent coverage in every district or equivalent administrative unit.
One of the major achievements of Kazakhstan is acquiring of status of Vaccine Independent Country as well as Country Free from Poliomyelitis.
Below is Extraction from Schedule for Preventive Vaccination of children under age of 24 months in Kazakhstan.
Terms of Vaccination (children under 2 years old)
Age
Vaccination against:
Tuberculosis (BCG) Hepatitis “#” Poliomyelitis
(OPV)
Pertussis, diphtheria,
tetanus (DPT)Measles
1-4 weeks + + +
2 months + + +
3 months + +
4 months + + +
12-15 months +
18 months +
Extraction from Annex to the Rules for Vaccination, approved by the Decree of the Government of the Republic of Kazakhstan as of 23 May 2003 N 488

MONITORING THE SITUATION OF CHILDREN AND WOMEN34
of main questionnaire for children under-5 (Immunization Module) – was prepared, which included home address of child in survey, his/her personalized data and address of health fa-cility indicating number of district. Interviewers copied vaccination data into these forms from vaccination cards available in health facilities.
Overall, 95.1 percent of surveyed children in Kazakhstan had immunization cards (Table CH.2).
The percentage of children aged 15 to 26 months who received all recommended vacci-nations is shown in Table CH.1. The denomina-tor for the table is comprised of children aged 15-26 months so that only children who are old enough to be fully vaccinated are counted. In the top panel, the numerator includes all chil-dren who were vaccinated at any time before the survey according to the vaccination card or the mother’s report. In the bottom panel, only those who were vaccinated before their first birthday, as recommended, are included (by 15 months for measles). For children without vaccination cards, the proportion of vaccina-tions given before the first birthday is assumed to be the same as for children with vaccination cards.
97.9 percent of children aged 15-26 months re-ceived a BCG vaccination and the first dose of DPT by the age of 12 months. The percentage declines for subsequent doses of DPT to 96.7 percent for the second dose, and 91.7 percent for the third dose (Figure CH.1). Similarly, 99 percent of children received Polio 1 (OPV) and this declines to 93.9 percent by the third dose by age 12 months. The coverage for measles vaccine by 15 months is a bit lower than for the other vaccines at 94.7 percent. This is primarily because, although 99.4 percent of children re-ceived the vaccine, only 94.7 percent received it by their first birthday. Despite the fact that by the age of 12 months coverage with some vaccines exceeds 94 percent, the percentage of children who had all the recommended vacci-nations by their first birthday is low at only 81 percent.
In Kazakhstan, Hepatitis B vaccination is also recommended as part of the immunization schedule. The first HepB vaccine is introduced at age of 1-4 days of birth, the second one at age of 2 months and the third one at age of 4
Figure CH.1. Percentage of children aged 15-26 months who received the recommended vaccinations by 12 months, Kazakhstan, 2006
In Kazakhstan since 1 October 2005, children 1 year old and above receive complex vac-cination against measles, mumps and rubella (MMR). The schedule of vaccination against communicable diseases complies with interna-tional standards.
According to UNICEF and WHO guidelines, a child should receive a BCG vaccination to pro-tect against tuberculosis, three doses of DPT to protect against diphtheria, pertussis, and teta-nus, three doses of polio vaccine by the age of 12 months, and a measles vaccination by the age of 15 months. Mothers were asked to pro-vide vaccination cards for children (f. 063-$) under the age of five. If the card was available in the household, interviewers copied vaccina-tion information from the cards onto the MICS questionnaire.
If the child did not have a card, the mother was asked to recall whether or not the child had received each of the vaccinations and, for DPT and Polio, how many times.
In Kazakhstan, health cards of children includ-ing vaccination cards are usually kept in health facilities. Therefore, interviewers visited health facilities to fill in an Immunization Module for each child irrespective of immunization card availability in the household or the mother’s re-port. With this purpose, a special form – copy
Total
Measles
Polio-3
Polio-2
Polio-1
DPT-3
DPT-2
DPT-1
BCG

KAZAKHSTAN MULTIPLE INDICATOR CLUSTER SURVEY (MICS), 2006 35
months. By the age of 12 month 94.3 percent of children in survey received first dose of HepB vaccine. Percentage of coverage with the sec-ond dose was 94.4 percent and 92.3 percent with the third one (Tables CH.1.C and CH.2.C).
Tables CH.2 and CH.2C show vaccination cov-erage rates among children 15-26 months by background characteristics. Data indicate chil-dren receiving the vaccinations at any time up to the date of the survey, and are based on in-formation from both the vaccination cards and mothers’/caretakers’ reports.
In Kazakhstan, 96.2 percent of children had all recommended vaccinations by age of 2 years. There are almost no differences by sex; the per-centage of vaccinated children in urban areas is a bit higher than in rural area. Low immuniza-tion coverage was found in Almaty Oblast (82 percent). There was no difference in coverage with BCG vaccination by sex, place of resi-dence, mother’s education, household wealth and almost all children aged 15-26 months were vaccinated with BCG (99.6 percent).
By the age of 26 months, 99.4 percent of chil-dren received first dose of DPT. The percentage declines for subsequent doses of DPT to 99.3 percent for the second dose, and 98 percent for the third dose; boys were slightly more likely to be vaccinated with DPT than girls were. By third dose of DPT, percentage of vaccinated children in rural area was by 2 percent points lower than in urban area. Similarly, over 99 percent of children received Polio 1 and this declines to 95.5 percent of vaccinated rural children by the third dose, which is by 2.4 percent points lower than urban children.
The coverage for measles vaccine was found to be almost 100 percent in each Oblast of Kazakhstan, except Karaganda (97.7 percent) and Almaty (97.9 percent) Oblasts.
95 percent of children received HepB vaccine by the age of 26 months; at that, percentage of urban children was a bit higher than rural chil-dren (97.1 and 93.0 percent respectively). Low immunization with Hep. B vaccine was found in Almaty Oblast (75.1 percent).
The highest percentage of children who re-ceived no vaccination by 26 months was found in Karaganda Oblast (2.3 percent). The per-centage of girls who are not vaccinated is high-er than the boys.
The goals are to: 1) reduce by one half death due to diarrhoea among children under five by 2010 compared to 2000 (A World Fit for Children); and 2) reduce by two thirds the mor-tality rate among children under five by 2015 compared to 1990 (Millennium Development Goals). In addition, the World Fit for Children calls for a reduction in the incidence of diar-rhoea by 25 percent.
The indicators are:• Prevalence of diarrhoea• Oral rehydration therapy (ORT)
Oral Rehydration TreatmentDiarrhoea is the second leading cause of death among children under five worldwide. Most diarrhoea-related deaths in children are due to dehydration from loss of large quantities of water and electrolytes from the body in liq-uid stools. Management of diarrhoea – either through oral rehydration salts (ORS) or a rec-ommended home fluid (RHF) – can prevent many of these deaths. Preventing dehydration and malnutrition by increasing fluid intake and continuing to feed the child are also important strategies for managing diarrhoea.

MONITORING THE SITUATION OF CHILDREN AND WOMEN36
• Home management of diarrhoea
• (ORT or increased fluids) AND continued feeding
In the MICS questionnaire, mothers (or care-takers) were asked to report whether their child had had diarrhoea in the two weeks prior to the survey. If so, the mother was asked a se-ries of questions about what the child had to drink and eat during the episode and whether this was more or less than the child usually ate and drank.
Overall, only 1.8 percent or 80 of under five children had diarrhoea in the two weeks pre-ceding the survey (Table CH.4). Due to small number of cases, data is distributed by resi-dence and sex of children. Diarrhoea preva-lence was a bit different in rural and urban areas as well as between girls and boys. The peak of diarrhoea among children aged 6-23 months observed during a period when moth-ers stop breastfeeding.
Table CH.4 also shows the percentage of chil-dren receiving various types of recommended liquids during the episode of diarrhoea. In Kazakhstan, the most popular medicine for home treatment of diarrhoea is packed pow-der Smekta and Regidron, which should be dissolved with water. In addition, herbal teas
and extracts are widely used. Since mothers were able to name more than one type of liq-uid, the percentages do not necessarily add to 100.
73.3 percent of mothers used fluids from ORS packets for diarrhoea treatment in their chil-dren; 16.4 percent used pre-packaged ORS fluids, and 17.9 percent used recommended homemade fluids. Twenty six percent of chil-dren who had diarrhoea received no treat-ment.
The rate of ORT use overall in the country was 74 percent. 21.8 percent of children with di-arrhoea received one or more of the recom-mended home treatments.
Less than one half (45.3 percent) of under five children with diarrhoea drank more than usual while 53 percent drank the same or less (Table CH.5). About 59 percent ate somewhat less, same or more (continued feeding), but 41 percent ate much less or ate almost none. Given these figures, 48 percent of children received ORT and increased fluids and at the same time continued feeding as recommend-ed.
There are significant differences in the home management of diarrhoea by background characteristics: 55.5 percent of rural children received ORT or increased fluids and contin-ued feeding, while urban children – only 42.2 percent, boys a bit less than girls received such diarrhoea treatment (Figure CH.5).
Figure CH.5. Percentage of children aged 0-59 with diarrhoea who received ORT or increased fluids, AND continued feeding, Kazakhstan, 2006, %
Sex
Male
Female
Residence
Urban
Rural
Kazakhstan

KAZAKHSTAN MULTIPLE INDICATOR CLUSTER SURVEY (MICS), 2006 37
Pneumonia is the leading cause of death in children and the use of antibiotics for under-5s with suspected pneumonia is a key interven-tion. A World Fit for Children goal is to reduce by one-third deaths due to acute respiratory in-fections.
Children with suspected pneumonia are those who had an illness with a cough accompanied by rapid or difficult breathing and whose symp-toms were not due to a problem in the chest and a blocked nose. The indicators are:
• Prevalence of suspected pneumonia
• Care seeking for suspected pneumonia
• Antibiotic treatment for suspected pneu-monia
• Knowledge of the danger signs of pneumo-nia
Table CH.6 presents the prevalence of suspect-ed pneumonia and, if care was sought outside the home, the site of care.
Only 1.5 percent of children 0-59 months were reported to have had symptoms of pneumo-nia (acute respiratory infection) during the two weeks preceding the survey. Due to small number of cases data is distributed by sex and residence only. Approximately 70 percent of ill children were admitted to different health institutions, of them over 40 percent to pub-lic policlinic facilities and 18 percent to public hospitals.
Table CH.7 presents the use of antibiotics for the treatment of suspected pneumonia in un-der-5s by sex and residence. In Kazakhstan, 31.7 percent of under-5 children with sus-pected pneumonia had received an antibiotic during the two weeks prior to the survey with urban population more often than the rural one.
Issues related to knowledge of danger signs of pneumonia are presented in Table CH.7A. Obviously, mothers’ knowledge of the danger signs is an important determinant of care-seek-ing behaviour. Overall, 31.7 percent of women know of the two danger signs of pneumonia – fast and difficult breathing. The most com-monly identified symptom for taking a child to a health facility is high fever (89.2 percent).
44.7 percent of mothers identified fast breath-ing and 56.2 percent of mothers identified diffi-cult breathing as symptoms for taking children immediately to a health care provider. For over 55.5 percent of mothers danger sign for seek-ing care is if the child becomes weaker, for 45.8 percent of mothers danger signs is blood in stool, for 25.2 percent of mothers – if a child is not able to drink or breastfeed. Only 11.3 per-cent of mothers will seek care if a child drinks poorly.
The highest percentage of mothers aware of two danger signs of pneumonia was found in Mangistau (93.4 percent), followed by Pavlodar (71.4 percent) and North Kazakhstan (52.6 percent) Oblasts, the least was in Kyzylorda (8.7 percent) and Almaty (10.6 percent) Oblasts. 36.3 percent of mothers in urban and 26.9 per-cent in rural area are aware of main pneumonia symptoms.
Women with higher education are slightly bet-ter aware of two symptoms of pneumonia, their percentage increase depending on wealth of household (from 22 percent – in poorest to 43.4 percent – in richest). Mothers in Russian families are somewhat better informed about two symptoms of pneumonia than in Kazakh families and make 39.5 percent vs. 30.9 per-cent.
Care Seeking and Antibiotic Treatment of Pneumonia
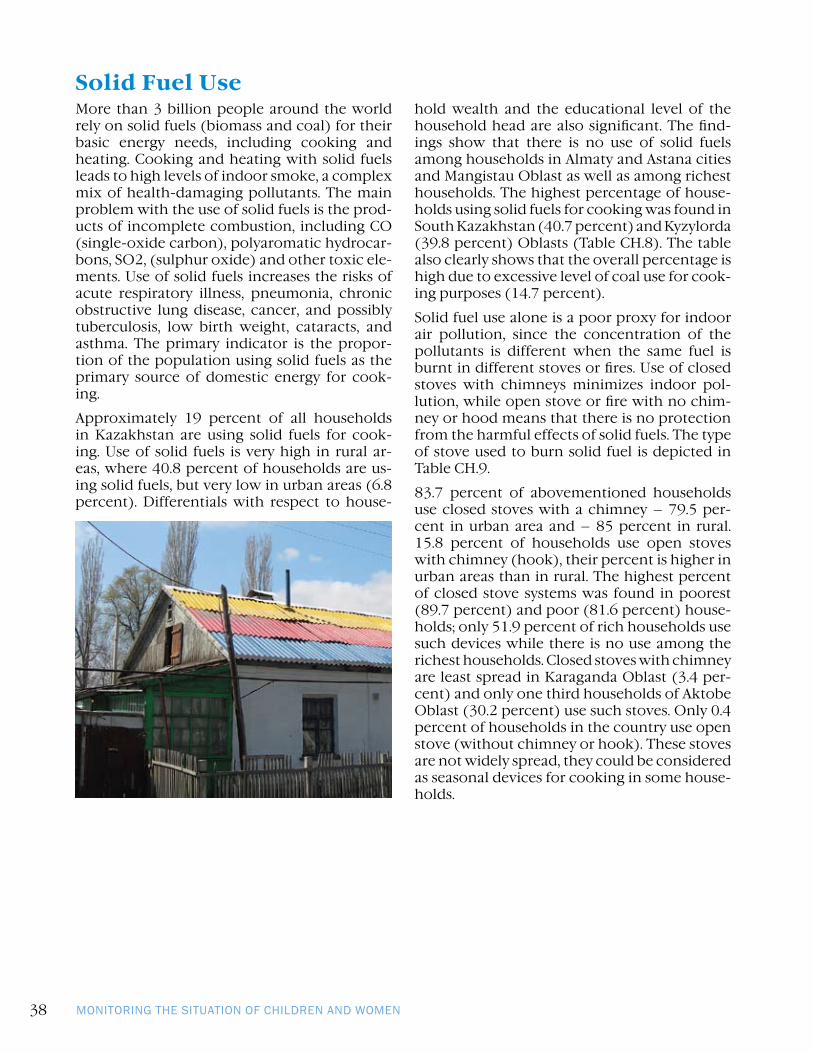
MONITORING THE SITUATION OF CHILDREN AND WOMEN38
More than 3 billion people around the world rely on solid fuels (biomass and coal) for their basic energy needs, including cooking and heating. Cooking and heating with solid fuels leads to high levels of indoor smoke, a complex mix of health-damaging pollutants. The main problem with the use of solid fuels is the prod-ucts of incomplete combustion, including CO (single-oxide carbon), polyaromatic hydrocar-bons, SO2, (sulphur oxide) and other toxic ele-ments. Use of solid fuels increases the risks of acute respiratory illness, pneumonia, chronic obstructive lung disease, cancer, and possibly tuberculosis, low birth weight, cataracts, and asthma. The primary indicator is the propor-tion of the population using solid fuels as the primary source of domestic energy for cook-ing.
Approximately 19 percent of all households in Kazakhstan are using solid fuels for cook-ing. Use of solid fuels is very high in rural ar-eas, where 40.8 percent of households are us-ing solid fuels, but very low in urban areas (6.8 percent). Differentials with respect to house-
hold wealth and the educational level of the household head are also significant. The find-ings show that there is no use of solid fuels among households in Almaty and Astana cities and Mangistau Oblast as well as among richest households. The highest percentage of house-holds using solid fuels for cooking was found in South Kazakhstan (40.7 percent) and Kyzylorda (39.8 percent) Oblasts (Table CH.8). The table also clearly shows that the overall percentage is high due to excessive level of coal use for cook-ing purposes (14.7 percent).
Solid fuel use alone is a poor proxy for indoor air pollution, since the concentration of the pollutants is different when the same fuel is burnt in different stoves or fires. Use of closed stoves with chimneys minimizes indoor pol-lution, while open stove or fire with no chim-ney or hood means that there is no protection from the harmful effects of solid fuels. The type of stove used to burn solid fuel is depicted in Table CH.9.
83.7 percent of abovementioned households use closed stoves with a chimney – 79.5 per-cent in urban area and – 85 percent in rural. 15.8 percent of households use open stoves with chimney (hook), their percent is higher in urban areas than in rural. The highest percent of closed stove systems was found in poorest (89.7 percent) and poor (81.6 percent) house-holds; only 51.9 percent of rich households use such devices while there is no use among the richest households. Closed stoves with chimney are least spread in Karaganda Oblast (3.4 per-cent) and only one third households of Aktobe Oblast (30.2 percent) use such stoves. Only 0.4 percent of households in the country use open stove (without chimney or hook). These stoves are not widely spread, they could be considered as seasonal devices for cooking in some house-holds.
Solid Fuel Use

KAZAKHSTAN MULTIPLE INDICATOR CLUSTER SURVEY (MICS), 2006 39
VII. Environment

MONITORING THE SITUATION OF CHILDREN AND WOMEN40
Water and SanitationSafe drinking water is a basic necessity for good health. Unsafe drinking water can be a signifi-cant carrier of diseases such as trachoma, chol-era, typhoid, and schistosomiasis. Drinking wa-ter can also be tainted with chemical, physical and radiological contaminants with harmful effects on human health. In addition to its as-sociation with disease, access to drinking water may be particularly important for women and children, especially in rural areas, who bear the primary responsibility for carrying water, often over long distances.
The MDG goal is to reduce by half, between 1990 and 2015, the proportion of people without sus-tainable access to safe drinking water and basic sanitation. The World Fit for Children goal calls for a reduction in the proportion of households without access to hygienic sanitation facilities and affordable and safe drinking water by at least one-third.
The list of indicators used in MICS are as follows:Water
• Use of improved drinking water sources
• Use of adequate water treatment method
• Time to source of drinking water
• Person collecting drinking water
Sanitation
• Use of improved sanitation facilities
• Sanitary disposal of child’s faeces
The distribution of the population by source of drinking water is shown in Table EN.1 and Figure EN.1. The population using improved sources of drinking water are those using any of the follow-
ing types of supply: piped water (into dwelling, yard or plot), public tap/standpipe, tubewell/borehole, protected well, protected spring, rain-water collection. Bottled water is considered as an improved water source only if the household is using an improved water source for other pur-poses, such as hand washing and cooking.
Overall, 93.7 percent of the population in Kazakhstan is using an improved source of drinking water – 98.1 percent in urban areas and 87.7 percent in rural areas. The situation in North Kazakhstan (81.7 percent), Kostanai (83.2 percent), South Kazakhstan (85.7 per-cent) and Atyrau (89.3 percent) Oblasts is a bit worse. The population of capital city Astana and Almaty gets water only from improved sources. Population with higher education level more of-ten uses improved sources of drinking water.
The source of drinking water for the popula-tion varies strongly by region (Table EN.1). In Karaganda, Almaty, Mangistau and East Kazakhstan Oblasts (75.7, 64.9, 64.4 and 62.7 percents respectively) and in Almaty and Astana cities (98.5 and 84.8 percent respectively) use drinking water piped into dwelling, yard or plot. In contrast, only about 27.5 percent of house-holds in North Kazakhstan, 32.3 percent in Akmola and 32.8 percent in West Kazakhstan Oblasts have water piped into dwelling or yard. Almost half (48 percent) of the households in Zhambyl Oblast obtains drinking water from tube-well/borehole, about 35-38 percent of households in Mangystau, West-Kazakhstan and Atyrau Oblasts use water from protected wells, and 33.4 percent of households in Kyzylorda and 38.2 percent – in Akmola Oblasts use public taps/standpipes. Six percent of households use carried water in the North Kazakhstan Oblast. In Atyrau and South Kazakhstan Oblasts 8.1 and 6.8 percent of population respectively use sur-face water sources.
Use of in-house water treatment is presented in Table EN.2. Households were asked about ways they may be treating water at home to make it safer to drink – boiling, adding bleach or chlo-rine, using a water filter, and using solar disin-fection were considered as proper treatment of drinking water. The table shows the percentages of household members using appropriate water treatment methods, separately for all house-holds, for households using improved and un-improved drinking water sources.

KAZAKHSTAN MULTIPLE INDICATOR CLUSTER SURVEY (MICS), 2006 41
In Kazakhstan, 70.8 percent of the population uses an appropriate way to treat drinking wa-ter obtained from all sources, including 70.2 percent of those who appropriately treat drink-ing water obtained from improved sources and 80.7 percent of those who obtains water from unimproved sources use an appropriate wa-ter treatment method. The urban population and population with higher levels of education use treatment methods more often. Wealthier households more often treat drinking water compared to less wealthy households. Overall, 69 percent of population boils water as the main method of water treatment, 24.7 percent of population let the water stay and settle. Other methods of water treatment are not very much popular. 23.7 percent of population use no treat-ment of drinking water, 0.1 percent of popula-tion knows neither method of water treatment. The percentage of households using appropri-ate method of water treatment from improved and unimproved drinking water sources is high in Mangistau (98.5 percent), South Kazakhstan (93.4 percent), Atyrau (93.1 percent) Oblasts and Almaty City (95.9 percent). Low percentage of water treatment was found in households of Zhambyl (24.9 percent), East Kazakhstan (53.2 percent) and Almaty (54.3 percent) Oblasts.
Water treatment from unimproved sources for drinking purpose was found very high in Atyrau (100 percent), South Kazakhstan (96 percent) and West Kazakhstan (83.6 percent) Oblasts. Notable is the fact that the urban and the poor households used water treatment more often than those in rural areas and regardless of their
education levels. Moreover, Kazakh households resort to water treatment more often than Russian households (84.9 percent and 66.1 per-cent respectively).
Water treatment from improved sources for drink-ing purpose was reported by respectively 74 and 65 percent of urban and rural households. Water treatment practice shows direct correlation with education and welfare levels i.e. the higher edu-cation and welfare the higher use of water treat-ment. Almaty city reported the highest utilization of water treatment followed by Mangistau, South Kazakhstan, and Atyrau Oblasts, and the least wa-ter treatment practice was reported by Zhambyl, Almaty and East Kazakhstan Oblasts.
The amount of time it takes to obtain water is presented in Table EN.3 and the person who usually collected the water in Table EN.4. Note that these results refer to one roundtrip from home to the drinking water source. Information on the number of trips made in one day was not collected.
Figure EN.1. Percentage distribution of population by source of drinking water, Kazakhstan, 2006
Piped into dwelling, yard or plot 56,6%
Public tap/stand pipe 15,6%
Tube-well/bore-hole 9,2%
Protected spring 12,1%
Unprotectd spring 1,2%
Surface water 1,6%
Other unimproved sources 3,7%

MONITORING THE SITUATION OF CHILDREN AND WOMEN42
Table EN.3 shows that for 73.4 percent of house-holds, the drinking water source is on the premises. For 20.3 percent of households, it takes less than 30 minutes to get to the water source and bring water, while 4.7 percent of households spend from 30 minutes to one hour and 1.4 percent spend over one hour for this purpose. Excluding those households with water on the premises, the average time to the source of drinking water is 19 minutes. The time spent in rural areas in collect-ing water is slightly higher than in urban areas. The high average time spent in Kostanai and Kyzylorda Oblasts in collecting water is over 25 minutes.
Table EN.4 shows that for the majority of house-holds, an adult male is usually the person collect-ing the water, when the source of drinking water is not on the premises. Adult men collect water almost in 65 percent of cases, while for the rest of the households, about 30 percent of adult females and 5.5 percent of female or male children under age 15 collect water. In poor households male children under 15 years more often collect water than in middle income and rich households.
Inadequate disposal of human excreta and poor personal hygiene is associated with a range of diseases including diarrhoeal diseases and polio. Improved sanitation facilities for excreta disposal include: flush or pour flush to a piped sewer system, septic tank, or latrine; ventilated improved pit la-trine, pit latrine with slab, and composting toilet.
99.2 percent of the population of Kazakhstan is living in households using improved sanitation facilities (Table EN.5). This percentage is 99.5 in urban areas and 98.9 percent in rural areas. A high proportion of the population almost in all regions of the country uses improved sanitation facilities – 98.3 percent or higher, the lowest is in Aktobe Oblast with 93.6 percent. The table indicates that use of improved sanitation facili-ties is strongly correlated with wealth and is pro-foundly different between urban and rural areas. In rural areas, the population is mostly using pit latrines with slabs, while for urban population, on the contrary, the most common facilities are flush toilets connected to a sewage system or septic tank. Residents of urban areas are much more likely than in rural areas to use modern flush toilets (60 percent of households) and pit latrine with slab (35.5 percent of household); in rural areas about 95 percent of households use pit latrine with slab. By wealth level, 73.3 percent of rich and 99.8 percent of richest households
use modern flush toilets, while over 98 percent of poorest and poor households use pit latrines with slab. Use of modern sanitation facilities at large depends on the level of education; popula-tion with lower levels of education uses simpli-fied types of facilities (pit latrines with slab).
Residents of Almaty and South Kazakhstan Oblasts are less likely than others to use flush toilets and more pit latrines with slab, which is related mainly to the rural type of dwelling.
It could be noted that only 2 percent of im-proved sanitation facilities are used jointly by several households (Table EN.5W).
Safe disposal of a child’s faeces is the last stool by the child was disposed of by use of a toilet or rinsed into toilet or latrine. Disposal of faeces of children 0-2 years of age is presented in Table EN.6.
Mothers reported only 3.1 percent of children aged 0-2 years visiting toilet, in 28.3 percent of cases faeces were disposed/flushed to the toilet, in 38.2 percent – disposed or flushed to sewer-age, 25.3 percent thrown to garbage, and in 0.5 percent – buried. Percentage of children whose latest faeces were safely disposed made 31.4 per-cent; this indicator in urban area was 54.3 per-cent against 8.7 percent in rural area. Proportion of proper disposal of children’s faeces is higher in rich and richest households (65.7-89.4 percents respectively), while in the less wealthy house-holds this indicator made 5.2 to 15.9 percent. Percentage of children whose faeces were prop-erly disposed is higher if mother has higher level of education – 46.6 percent against 19.2 percent of mothers with primary/incomplete secondary education. There also was significant difference by regions, for instance, very low level of safe fae-ces disposal was found in Almaty (6.1 percent), South Kazakhstan (11.2 percent) Oblasts, as ru-ral population prevails in these regions (as men-tioned above only 8.7 percent of children’s faeces are disposed safely in rural area). High level of safe children’s faeces disposal was found in Astana (77.7 percent) and Almaty (83.3 percent) Cities as well as in Pavlodar Oblast (61.9 percent).
As summarized in Table EN.7, 93.7 percent of population of Kazakhstan use improved sources of drinking water. And 99.2 percent use sanitary means of excreta disposal. Overall, 93 percent of population of Kazakhstan use improved sources of drinking water and improved sanitation facil-ities for faeces disposal.

KAZAKHSTAN MULTIPLE INDICATOR CLUSTER SURVEY (MICS), 2006 43
VIII. Reproductive Health

MONITORING THE SITUATION OF CHILDREN AND WOMEN44
Appropriate family planning is important to the health of women and children for: 1) preventing pregnancies that are too early or too late; 2) ex-tending the period between births; and 3) limiting the number of children. A World Fit for Children goal is access by all couples to information and services to prevent pregnancies that are too early, too closely spaced, too late or too frequent.
Current use of contraception was reported by 50.7 percent of women currently married or in union (Table RH.1). The most popular method is IUD (intrauterine device) which is used by one in three married women (36.2 percent) in Kazakhstan. The next most popular but of lim-ited occurrence method is pills, which accounts for 6.7 percent. 4.8 percent of women reported use of the condom. Less than one percent use periodic abstinence, withdrawal, female sterili-zation, vaginal methods, or the lactation amen-orrhea method (LAM).
Prevalence of contraception is highest in West Kazakhstan, North Kazakhstan, Pavlodar, Kostanai, Akmola and East Kazakhstan Oblasts and Astana City at over 60 percent. The high-est prevalence of pills was found in urban areas where women use them about three times more often than in rural area. In large cities of Astana and Almaty, almost each seventh married wom-an uses contraception pills.
Younger women use less contraception than adult women do. Current use of contraception was reported by only 31.7 percent of women aged 15-19 currently married or in union com-paring to 53.7 percent of women aged 25–29 years and 61.5 percent of women aged 30-34.
Women’s education level is strongly associated with contraceptive prevalence. The percentage of women using any method of contraception rises from 43 percent among those with pri-mary/incomplete secondary education to 53.3 percent among women with higher education. Education level also corresponds with method of contraception.
48.7 percent of women use modern methods of contraception, while only 2 percent of inter-viewed women used traditional methods. Over 60 percent of women use modern contracep-tion in Astana city and East Kazakhstan Oblast. The percentage of women using contraception is higher among women with two (61.2 percent) and three (51.6 percent) children. Percentage of women without children using contraception was 11.7 percent.
Contraception
Reproductive behavior is a component of Reproductive Health Program. Family planning as a reserve for the health of woman and com-ponent of Reproductive Health Program is es-sential for birth of wanted children. Based on this thesis WHO Alma-Ata Declaration (1978) considers protection of mother and child health as essential part of primary healthcare needed to ensure health of family.
Major provisions related to reproductive health rising from reproductive rights and reproductive behavior were approved by Platform for Action of IV World Conference on Status of Women (Beijing, 1995).
Reproductive BehaviorReproductive behavior is the system of human actions and attitudes stipulating birth or refuse birth. The conceive age for woman is considered 15–49 years, called reproductive (fertile) age. This age limitation is conditional; therefore, re-productive period is a part of woman’s life when she is able to give birth.
Essential component of Reproductive Health Program is family plannng, which helps to en-sure wanted number of children in the family, safe them and select the best time for birth taking into account age of parents and social-economic conditions, avoid unwanted preg-nancy, plan birth, it reduces maternal and in-

KAZAKHSTAN MULTIPLE INDICATOR CLUSTER SURVEY (MICS), 2006 45
fant mortality, improves health of mother and child.
Over one-third (37.7 percent) women wanted to have 2 children, almost one in three (28.7 percent) women – three children and 17.0 per-cent – four children (Table RH.2A). Less than 9 percent of women in the survey wanted to have 5 to 9 children and only 0.5 percent of women wanted 10 and more children. More ur-ban women prefer having two (44.1 percent) and three (28.4 percent) children. Less than one-third of rural women wanted to have two children (28.5 percent) and approximately the same percentage wanted to have three chil-dren (29.2 percent). Only 13.3 percent of urban women wanted to have four children, while 22.5 percent of rural women wanted to have the same number of children. The largest differ-ence was found among women willing to have 5-9 children: their percentage in rural areas is almost three times greater than the percentage of urban women – 14.0 percent and 5.0 percent respectively.
Major number of women regulates the number of children and time for birth of the next baby, i.e. follow certain birth interval. Thus, almost 37.3 percent of interviewed women would pre-fer to have a three-year birth space, 32.6 percent – two years, about 11 percent believe birth space should be 4 – 5 and more years. Least number of women (7.4 percent) wanted to wait for one year before the next birth.
Almost half of women in survey (49.3 percent) in Kyzylorda Oblast prefer to have two-year birth space and over half (50.7 percent) women in South Kazakhstan Oblast – three-year. The best birth interval both for urban and rural women is three years (36 percent of urban and 39.3 per-cent of rural women).
Reproductive aims of women aged 15 – 49 years differ by Oblasts. Thus, 39.1 percent of women in South Kazakhstan Oblast wish to have four chil-dren and 22.5 percent want to have 5 to 9 chil-dren, while in North Kazakhstan Oblast more women want to have two children (more than half – 50.4 percent), and one-fourth of women (25.3 percent) wanted to have three children (Table RH.2A). Reproductive aims of women slightly differ (by few percent) in Kostanai, Karaganda, East Kazakhstan Oblasts and Astana and Almaty Cities. Percentage of women will-
ing to have 5 to 9 children prevails in South Kazakhstan (22.5 percent), Kyzylorda (17.4 per-cent), Zhambyl (14.1 percent) Oblasts and by 10 percents in Atyrau and Mangistau Oblasts.
Wealth level is not much associated with per-centage of women willing to have three children and makes around 30 percent in each group sampled by wealth level, while percentage of women planning to have four children declines from 27.2 percent in poorest families to 9.2 per-cent in richer families. The highest percentage of women willing to have 5 to 9 children was found in poorest families – 18.4 percent, the least percentage (2.6 percent) in richer families.
As shown in Table RH.2B, women reported on the following factors limiting the number of children:
• Low salary – 25 percent. The highest per-centage of women who mentioned this fac-tor was found in South Kazakhstan (48.1 per-cent) and Karaganda (36.8 percent) Oblasts.
• Health status – 19.7 percent – almost half of respondents mentioned this factor (46 per-cent) in Almaty Oblast.
• Uncertainty about future of children – 14.4 percent;
• No job – 9.8 percent. Almost every fifth wom-an (by 21.8 percent) mentioned this factor in Kyzylorda and South Kazakhstan Oblast.
The percentage of a restricting factor such as absence of housing and regular work made 6.2 percent and 5.3 percent respectively all over the country.
Similarly, the following factors were mentioned as stimuli for birth of another baby (Table RH.2C):
• maternity leave with sufficient pay– 21.4 percent;
• reducing age of retirement – 19.8 percent.
• sufficient family allowance – 16.2 percent;
• mortgage and credits – 12.1 percent;
About 8 percent of women would give birth to another baby in case of shortened working day for breastfeeding mothers. Maternity leave with sufficient pay and reduction of retirement age are the most popular birth stimulus mentioned by 26 to 38 percent of women.

MONITORING THE SITUATION OF CHILDREN AND WOMEN46
The antenatal period presents important op-portunities for reaching pregnant women with a number of interventions that may be vital to their health and well-being and that of their in-fants. Better understanding of foetal growth and development and its relationship to the mother’s health has resulted in increased attention to the potential of antenatal care as an intervention to improve both maternal and newborn health. For example, if the antenatal period is used to inform women and families about the danger signs and symptoms and about the risks of labour and de-livery, it may provide the route for ensuring that pregnant women do, in practice, deliver with the assistance of a skilled health care provider. The antenatal period also provides an opportunity to provide information on birth control, which is recognized as an important factor in improving infant survival. The prevention and treatment of malaria among pregnant women, management anaemia during pregnancy and treatment of STIs can significantly improve foetal outcomes and improve maternal health. Adverse outcomes such as low birth weight can be reduced through a combination of interventions to improve wom-en’s nutritional status and prevent infections (e.g., malaria and STIs) during pregnancy. More recently, the potential of the antenatal period as
an entry point for HIV prevention and care, in particular for the prevention of HIV transmission from mother to child, has led to renewed interest in access to and use of antenatal services.
WHO recommends a minimum of four antena-tal visits based on a review of the effectiveness of different models of antenatal care. WHO guide-lines are specific on the content of antenatal care visits, which include:• Blood pressure measurement• Urine testing for bacteriuria and proteinuria• Blood testing to detect syphilis and severe
anaemia• Weight/height measurement (optional)
Coverage of antenatal care (by a doctor, nurse, or midwife) is high in Kazakhstan with 99.9 percent of women receiving antenatal care at least once during the pregnancy (Table RH.3). Antenatal care in all regions of Kazakhstan is 100 percent. Coverage of antenatal care in ur-ban area is 100 percent, while in rural areas this indicator is lower by only 0.3 percent points.
The type of personnel providing antenatal care to women aged 15-49 years who gave birth in the two years preceding is also presented in Table RH.3.
Mainly doctors provide antenatal care in Kazakhstan (88.9 percent); in 9.1 percent nurses/midwives, 0.2 percent – auxiliary midwives and 1.7 percent – feldshers provide antenatal care.
The types of services pregnant women received are shown in table RH.4. As mentioned above, 99.9 percent of pregnant women in Kazakhstan re-ceived antenatal care. In fact, all women had blood testing, blood pressure measurement; urine test-ing and weight measurement (by 99.5 percent). Antenatal care content varies across the Oblasts.
Three quarters of all maternal deaths occur dur-ing delivery and the immediate post-partum period. The single most critical intervention for safe motherhood is to ensure a competent health worker with midwifery skills is present at every birth, and transport is available to a referral facili-ty for obstetric care in case of emergency. A World Fit for Children goal is to ensure that women have ready and affordable access to skilled attendance
at delivery. The indicators are the proportion of births with a skilled attendant and proportion of institutional deliveries. The skilled attendant at delivery indicator is also used to track progress toward the Millennium Development target of reducing the maternal mortality ratio by three quarters between 1990 and 2015.
The MICS included a number of questions to
Antenatal Care
Assistance at Delivery

KAZAKHSTAN MULTIPLE INDICATOR CLUSTER SURVEY (MICS), 2006 47
number of maternal deaths per 100,000 live births. In MICS, the maternal mortality ratio is estimated by using indirect sisterhood method, which allows obtaining maternal mortality es-timates for past 10-14 years before the survey. To collect the information needed for the use of this estimation method in Kazakhstan, adult household members were asked a few questions regarding the survival of their sisters and the timing of death relative to pregnancy, childbirth and the postpartum period for deceased sisters. The information collected is then converted to lifetime risks of maternal death and maternal mortality ratios11.
MICS results on maternal mortality are shown in Table RH.6. The results are also presented only for the national total, since maternal mortality ratios generally have very large sampling errors. In total, 38,818 respondents were interviewed, they had 62,823 sisters aged 15 years and older. In survey, in Kazakhstan mortality rate within past 10-14 years was 70 cases per 100,000 of life birth in average. As per official data of the Ministry of Health of the Republic of Kazakhstan, maternal mortality in Kazakhstan was 36.9 in 2004 and 40.5 per 100,000 life births in 2005. In the 1995 and 1999 Demography and Health Surveys (DHS), the level of maternal mortality was 77 and 62.5 per 100,000 life births respec-tively12.
Maternal MortalityThe complications of pregnancy and child-birth are a leading cause of death and disability among women of reproductive age in devel-oping countries. It is estimated worldwide that around 529,000 women die each year from ma-ternal causes. And for every woman who dies, approximately 20 more suffer injuries, infection and disabilities in pregnancy or childbirth. This means that at least 10 million women a year suf-fer from these type of injuries.
The most common fatal complication is post-partum haemorrhage. Sepsis, complications of unsafe abortion, prolonged or obstructed labour and the hypertensive disorders of preg-nancy, especially eclampsia, claim further lives. These complications, which can occur at any time during pregnancy and childbirth without forewarning, require prompt access to quality obstetric services equipped to provide lifesav-ing drugs, antibiotics and transfusions and to perform the caesarean sections and other surgi-cal interventions that prevent deaths from ob-structed labour, eclampsia and haemorrhage. One MDG target is to reduce by three quarters, between 1990 and 2015, the maternal mortality ratio.
Maternal mortality is defined as the death of a woman from pregnancy-related causes, when pregnant or within 42 days of termination of pregnancy. The maternal mortality ratio is the
11 For more information on the indirect sisterhood method, see WHO and UNICEF, 1997.12 Nutrition Institute MoH-SA RK, Academy of Preventive Medicine, Demography and Health Survey Department, Macro International Inc. Kazakhstan Demography and Health Survey, 1995. Almaty, 1996.
Academy of Preventive Medicine, and Macro International Inc., 2000. Kazakhstan Demography and Health Survey, 1999. Almaty, 2000
assess the proportion of births attended by a skilled attendant. A skilled attendant includes a doctor, nurse, midwife or auxiliary midwife.
In Kazakhstan, almost all births (99.8 percent) were delivered by skilled personnel (Table RH.5). This percentage is 100 percent almost in each Oblast of the country, except in North Kazakhstan Oblast (96.4 percent) and in Astana City (98.8 percent). No significant differences between women delivered with the assistance of skilled attendant was found by education lev-el of woman, wealth and ethnicity. 80.9 percent of deliveries were attended by doctors, while 18.2 percent of deliveries attended nurses/ob-stetricians.

MONITORING THE SITUATION OF CHILDREN AND WOMEN48
IX. Child Development

KAZAKHSTAN MULTIPLE INDICATOR CLUSTER SURVEY (MICS), 2006 49
It is well recognized that a period of rapid brain development occurs in the first 3-4 years of life, and the quality of home care is the major determinant of the child’s
development during this period. In this con-text, adult activities with children, presence of books in the home, for the child, and the conditions of care are important indicators of quality of home care. A World Fit for Children goal is that “children should be physically healthy, mentally alert, emotionally secure, so-cially competent and ready to learn.”
Information on a number of activities that sup-port early learning was collected in the survey. These included the involvement of adults with children in the following activities: reading books or looking at picture books, telling sto-ries, singing songs, taking children outside the home, compound or yard, playing with chil-dren, and spending time with children nam-ing, counting, or drawing things.
For 81 percent of under-five children, an adult engaged in more than four activities that pro-mote learning and school readiness during the 3 days preceding the survey (Table CD.1). The average number of activities that adults engaged with children was 4.9. Father’s and mother’s involvement in such activities are almost the same (81.1 and 80.9 percent re-spectively). Father’s involvement with one or more activities was 46.9 percent. 13.6 percent of total number of children in households had no father. Average number of activities that fa-thers are engaged with their children was 1.2.
There are no gender differentials in terms of adult activities with children; however, a larg-er proportion of fathers engaged in activities with male children (47.7 percent) than with female children (46 percent). Larger propor-tions of adults engaged in learning and school readiness activities with children in urban areas (82.9 percent) than in rural areas (79.1 percent). Strong differentials by region and socio-economic status are also observed: adult engagement in activities with children was greatest in South Kazakhstan Oblast (94.3 per-cent) and lowest in Almaty Oblast (60.4 per-cent), while the proportion was 86.9 percent for children living in the richest households, as opposed to almost 80 percent among those living in the poorer households. Father’s in-volvement showed a similar pattern in terms
of adults’ engagement in such activities. More educated mothers and fathers engaged more in such activities with children than those with less education.
Exposure to books in the early years not only provides the child with greater understanding of the nature of print, but may also give the child opportunities to see others reading, such as older siblings doing school work. Presence of books is important for later school perform-ance and IQ scores.
In Kazakhstan, 89.1 percent of children are living in households where at least 3 non-chil-dren’s books are available (Table CD.2). 66.4 percent of children aged 0-59 months have children’s books. Median number of non-chil-dren’s books is twice as many as children’s books (10 and 5 books respectively). While no gender differentials are observed, urban chil-dren appear to have more access to all types of books than those living in rural households. Ninety one percent of under-5 children living in urban areas live in households with more than 3 non-children’s books, while the figure is 87.1 percent in rural households. The pro-portion of under 5 children who have 3 or more children’s books is 76.9 percent in urban areas, compared to 55.5 percent in rural areas.
The presence of children’s books is positively correlated with the child’s age: in the homes of 71.2 of children aged 24-59 months there are 3 and more children’s book, while the figure is only 59.6 for children aged 0-23 months.
Table CD.2 also shows that 19.8 percent of chil-dren aged 0-59 months had 3 or more playthings to play with in their homes, while 4.5 percent

MONITORING THE SITUATION OF CHILDREN AND WOMEN50
had none of the playthings asked to the moth-ers/caretakers (Table CD.2). The playthings in MICS included household objects, homemade toys, toys that came from a store, and objects and materials found outside the home. It is in-teresting to note that 93.5 percent of children play with toys that come from a store; however, the percentages for other types of toys is be-low 7 percent. The proportion of children who have 3 or more playthings to play with is 19.4 percent among male children and 20.2 percent among female children. No urban-rural differ-entials are observed in this respect; some differ-ences are observed in terms of mother’s educa-tion: approximately 20-24 percent of children whose mother’s have primary/incomplete secondary and secondary education have 3 or more playthings, while the proportion is 16.8 and 19.7 percent for children whose mother’s have specialized secondary and higher educa-tion. Differentials are small by socioeconomic status of the households, and regions. The only background variable which appears to have a strong correlation with the number of play-things children have is the age of the child, a somewhat expected result, for instance, only 11.2 percent of children aged 0-23 months and
25.7 percent of children aged 24-59 have 3 and more playthings.
Leaving children alone or in the presence of other young children is known to increase the risk of accidents. In MICS, two questions were asked to find out whether children aged 0-59 months had been left alone during the week preceding the interview, and whether children were left in the care of other children under 10 years of age.
Table CD.3 shows that 9 percent of children aged 0-59 months were left in the care of oth-er children, while 2.3 percent were left alone during the week preceding the interview. Combining the two care indicators, it is cal-culated that 9.8 percent of children were left with inadequate care during the week preced-ing the survey. No differences were observed by the sex of the child (9.9 and 9.6 percent re-spectively), while there were some difference between urban and rural areas: in urban area 10.4 percent of children were left alone and 9.2 percent in rural area. On the other hand, inadequate care was more prevalent among children whose mothers had primary/ incom-plete secondary education (10 percent) and secondary completed education (11.4 per-cent), as opposed to children whose mothers had higher education (8.3 percent). Children aged 24-59 months were left with inadequate care more (12.7 percent) than those who were aged 0-23 months (5.6 percent). No differenc-es are observed in regard to socioeconomic status and ethnicity of the household (except poorest households – 7.6 percent).
In Aktobe (27.3 percent) and Akmola (24.9 percent) Oblasts children were left with in-adequate care more than in other oblasts and this indicator was the lowest in Almaty city (1.9 percent), Almaty (2 percent) and South Kazakhstan (3.7 percent) Oblasts.

KAZAKHSTAN MULTIPLE INDICATOR CLUSTER SURVEY (MICS), 2006 51
X. Education

MONITORING THE SITUATION OF CHILDREN AND WOMEN52
Attendance to pre-school education in an or-ganized learning or child education program is important for the readiness of children to school. One of the World Fit for Children goals is the promotion of early childhood education.
Only 16 percent of children aged 36-59 months are attending pre-school institutions (Table ED.1). Urban-rural and regional differentials are significant – the figure is as high as 24.1 per-cent in urban areas, compared to 7 percent in rural areas. Proportion of children attending pre-school facilities at age of 36-47 months and 48-59 months is almost the same (15.4-16.7 percent). Among children aged 36-59 months, attendance to pre-school is more prevalent in Karaganda (33.4 percent) Oblast compared to Almaty (7.1 percent), Kyzylorda (8.2 percent)
and South Kazakhstan (8.1 percent) Oblasts. Boys more often than girls attend pre-school institutions (17.8 percent vs. 14.1 percent re-spectively); also differentials by socioeconomic status are significant. 44.8 and 22.5 percent of children living in the richest and rich house-holds respectively attend pre-school facilities, while the figure drops to 8.6 and 2.8 percent in poor and poorest households.
Early education of children at large depends on the level of mother’s education. In the survey, proportion of children attending pre-school institutions, whose mothers had specialized secondary or higher education was 20 and 32.5 percent respectively comparing to children of mothers with primary of secondary education (3.2 and 7.5 percent respectively).
The table also shows the proportion of children in the first grade of primary school who attend-ed pre-school the previous year (Table ED.1), an important indicator of school readiness. Overall, 39.5 percent of children who currently attend the first grade of primary school were attending pre-school the previous year. This indicator is al-most the same for boys and girls, 46.4 percent of children in urban areas had attended pre-school the previous year compared to 33 percent of in rural areas. Regional differentials are also very significant. Socioeconomic status appears to have a positive correlation with school readi-ness – while the indicator is only 19.2 percent among the poorest households, it increases to 59.2 percent among those children living in the richest households.
Pre-School Attendance and School Readiness
Universal access to basic education and the achievement of primary education by the world’s children is one of the most important goals of the Millennium Development Goals and A World Fit for Children. Education is a vital prerequisite for combating poverty, empowering women, pro-tecting children from hazardous and exploita-tive labour and sexual exploitation, promoting human rights and democracy, protecting the en-vironment, and influencing population growth.
The indicators for primary and secondary school attendance include:• Net intake rate in primary education
Primary and Secondary School Participation• Net primary school attendance rate• Net secondary school attendance rate• Net primary school attendance rate of chil-
dren of secondary school age• Female to male education ratio (gender par-
ity index – GPI)
The indicators of school progression in-clude:• Survival rate to grade five• Transition rate to secondary school• Net primary completion rate

KAZAKHSTAN MULTIPLE INDICATOR CLUSTER SURVEY (MICS), 2006 53
Of children who are of primary school entry age (age 7) in Kazakhstan, 92.9 percent are at-tending the first grade of primary school (Table ED.2). By gender indicator boys (95.1 percent) prevail over girls (90.4 percent); significant dif-ferentials are present by region, but there are no much differences between urban-rural areas. In South Kazakhstan, for instance, all children at-tended primary school, while in East Kazakhstan the value of the indicator reaches only 80.4 per-cent. Children’s participation to primary school is higher in urban areas (93.5 percent) than in rural areas (92.2 percent). A positive correlation with mother’s education and socioeconomic status is observed; for children aged 7 whose mothers have high level of education, 93.9 per-cent were attending the first grade.
Table ED.3 provides the percentage of children of primary school age attending primary or second-ary school. The majority of children of primary school age are attending school (98 percent). However, 2 percent of the children are out of school when they are expected to be participating in school. The primary school net attendance ra-tio is almost the same in urban and rural area (98 percent); however, there are small differentials be-tween school attendance by boys and girls (98.5 and 97.5 percent respectively). Some correlation with mother’s education is found – 98.4 percent of children whose mothers have higher level of edu-cation attended primary school, opposed to 94.8 percent of children whose mothers have lower level of education. The primary school net attend-ance increases depending on the age of children – from 93.6 percent at age 7 years to 99.7 percent – at age 8-10 years. The primary school net attend-ance of children from Kazakh families (98.9 per-cent) is higher than children from Russian families (95.4 percent), especially among girls (difference in 5.5 percent). Wealth differentials almost are not present; the indicator varies from 97.6-98.5 percent. There are some differences by regions, for instance, the primary school net attendance is below than in any regions of the Republic only in East Kazakhstan Oblast – 93.6 percent (boys – 97.7, girls – 90.1 percent).
The secondary school net attendance ratio is presented in Table ED.4.
95.3 percent of secondary school age children at-tend secondary school. There were no large differ-ences found by sex of children. Attendance ratio is slightly higher among urban children; attend-
ance ratio among girls in rural area is higher than among boys. There are significant differences by age of children: 87.4 percent of 11-year-olds and 85.6 percent of 17-year-old children attend sec-ondary school as opposed to 99 percent of chil-dren aged 12-16 years. 90.9 percent of children, whose mothers were missing in the households, attend secondary school. Attendance rate among children, whose mothers have higher level of education, is higher than among those children, whose mothers have primary or incomplete sec-ondary education. The same trend was found by household wealth. The highest attendance rate was found in Mangistau (98.7 percent) and East Kazakhstan (97.9 percent) Oblasts and Astana (97.5 percent) and Almaty (96.2 percent) Cities and lower in Almaty Oblast (93.3 percent).
The primary school net attendance ratio of chil-dren of secondary school age is presented in Table ED.4W. 1.6 percent of the children of secondary school age are attending primary school when they should be attending secondary school. The remaining 3.1 percent are not attending school at all; they are children out of school since we already indicated that 95.3 percent of children were attending secondary school. Secondary school age includes children aged 11 years, al-most no children attending primary school were found by other age groups, except 12 years – 0.2 percent of them, by 0.2 percent of boys and girls of secondary school age attend primary school. Percentage of rural boys is higher than urban ones opposed to girls; overall, the percentage of rural children is higher than percentage of ur-ban children (1.7 and 1.4 percent respectively). Percentage of these children is higher at moth-

MONITORING THE SITUATION OF CHILDREN AND WOMEN54
ers having primary education and in households with low wealth level. The highest percent of children of secondary school age, who attended primary school at the moment of survey, was found in Pavlodar Oblast (3.1 percent) and the lowest in Atyrau and Mangistau Oblasts, where their percentage made only by 0.3 percent.
The percentage of children entering first grade who eventually reach grade 5 is presented in Table ED.5. Of all children starting grade one, almost all of them (99.7 percent) will eventu-ally reach grade five. Notice that this number includes children that repeat grades and that eventually move up to reach grade five. Boys and girls almost with the same probability reach grade five, with slight difference in favor of girls and urban schoolchildren. Almost 100 percent of children, whose mothers have primary and secondary education, reach grade five, while for mothers with specialized secondary and higher education only 98.9—99.7 percent of children reach grade five. Percentage of children entered the first grade and reached grade five in poorest households is slightly lower than in households with higher wealth levels. The lowest indicator was found in Astana City (97.1 percent) and in Almaty Oblast (97.6 percent), in all other re-gions 100 percent of children reach grade five, both boys and girls.
The net primary school completion rate and transition rate to secondary education is pre-sented in Table ED.6. At the moment of the sur-vey, 88.4 percent of the children of primary com-pletion age (11 years) were attending the fourth grade of primary education. This value should
be distinguished from the gross primary com-pletion ratio, which includes children of any age attending the last grade of primary school. The net primary school completion rate in urban and rural area is almost the same (88 percent) and increasing depending on the level of their mothers’ education from 87 percent for moth-ers with secondary education to 92.8 percent for mothers with higher education. The net pri-mary school completion rate is lower in poorest household (86.6 percent).
99.7 percent of children who successfully com-pleted the last grade of primary school (4th grade), at the moment of survey attended grade 5 of secondary school. Transition rate to second-ary education is 99.7 percent all over Kazakhstan, by 100 percent in 8 regions of the country. There were found no significant differences by child’s sex and residence, mother’s education level, eth-nicity and household wealth level.
The ratio of girls to boys attending primary and secondary education is provided in Table ED.7. These ratios are better known as the Gender Parity Index (GPI). Notice that the ratios includ-ed here are obtained from net attendance ratios rather than gross attendance ratios. The last ra-tios provide an erroneous description of the GPI mainly because in most of the cases the majority of over-aged children attending primary educa-tion tend to be boys. The table shows that gen-der parity for secondary school is 1.0, indicating no difference in the attendance of girls and boys to secondary school. This indicator value is kept almost the same for primary education (0.99).
There were no significant differentials found at the primary/secondary school attendance level and between boys and girls by residence, moth-er’s education and wealth of household.
Adult LiteracyOne of the World Fit for Children goals is to as-sure adult literacy. Adult literacy is also an MDG indicator, relating to both men and women. In MICS, since only a women’s questionnaire was administered, the results are based only on fe-males age 15-24. Woman’s literacy was assessed on the attendance of any education institutions and made 99.8 percent. In Kazakhstan, literacy is comprehensive, thus, no significant differences by residence, region, level of education, wealth and ethnicity of women were found (Table ED.8).

KAZAKHSTAN MULTIPLE INDICATOR CLUSTER SURVEY (MICS), 2006 55
XI. Child Protection

MONITORING THE SITUATION OF CHILDREN AND WOMEN56
The Convention on the Rights of the Child states that every child has the right to a name and a na-tionality and the right to protection from being deprived of his or her identity. Birth registration is a fundamental means of securing these rights for children. The World Fit for Children states the goal to develop systems to ensure the reg-istration of every child at or shortly after birth, and fulfil his or her right to acquire a name and a nationality, in accordance with national laws and relevant international instruments. The in-dicator is the percentage of children under 5 years of age whose birth is registered.
In Kazakhstan, the Law About Marriage and Family regulates order and terms of birth regis-
tration. According to the Law, parents or caretak-ers should register the birth within two months. There are no governmental charges for birth registration. Indirect stimulus for birth timely registration is one time birth allowance as well as monthly childcare allowances to mothers/care-takers paid until 1 year of age. Birth of 99.2 per-cent of children aged under 5 in Kazakhstan was registered (Table CP.1). There are no variations in birth registration across sex, age, or educa-tion categories. Children in Kostanai, Zhambyl, Akmola, Almaty and Karaganda Oblasts (98.5-98.9 percent) are somewhat less likely to have their births registered than other children but this appears to be due primarily to the long jour-ney to the registration office.
Birth Registration
Article 32 of the Convention on the Rights of the Child states: “States Parties recognize the right of the child to be protected from economic ex-ploitation and from performing any work that is likely to be hazardous or to interfere with the child’s education, or to be harmful to the child’s health or physical, mental, spiritual, moral or so-cial development...” The World Fit for Children mentions nine strategies to combat child labor and the MDGs call for the protection of children
Child Laboragainst exploitation. In the MICS questionnaire, a number of questions addressed the issue of child labor, that is, children 5-14 years of age in-volved in labour activities. A child is considered to be involved in child labor activities at the time of the survey if during the week preceding the survey:
• Ages 5-11: at least one hour of economic work or 28 hours of domestic work per week.
• Ages 12-14: at least 14 hours of economic work or 28 hours of domestic work per week.
This definition allows us to differentiate be-tween child labor and child work to identify the type of work that should be eliminated. As such, the estimate provided here is a minimum of the prevalence of child labor since some children may be involved in hazardous labor activities for a number of hours that could be less than the numbers specified in the criteria explained before. Table CP.2 presents the results of child labor by the type of work.
In Kazakhstan 2.2 percent of children aged 5-14 years are involved in child labor of different type, such as work in household, family busi-ness or outside of household (Table CP.2). 0.5 percent of children in this age group helped to perform domestic work during 4 and more hours per day (28 hours a week). One percent of

KAZAKHSTAN MULTIPLE INDICATOR CLUSTER SURVEY (MICS), 2006 57
children helped during a week with family busi-ness. One percent of children were involved in unpaid labor outside of the household. In gen-eral, boys were more often involved in labor activity than the girls were (2.4 and 2.1 percent respectively). While boys were more often busy with family business and with unpaid work out-side the household, the girls helped more in do-mestic work. Urban children were more loaded with work than rural children (2.5 and 1.9 per-cent respectively). A higher workload for chil-dren was found in Kyzylorda (7.2 percent) and Pavlodar (5.9 percent) Oblasts, the lowest – in Atyrau (0.2 percent), Karaganda (0.5 percent) and Almaty (0.9 percent) Oblasts. 0.1 percent of children were involved in economic work out-side the household. No significant differences were found by regions, sex of child and educa-tion of mother.
Table CP.3 presents the percentage of children classified as student laborers or as laborer stu-dents. Student laborers are categorized as chil-dren attending school that were involved in child labor activities at the moment of the sur-veys. More specifically, of the 90.7 percent of the children 5-14 years of age attending school, 2.3 percent are also involved in child labor activities. On the other hand, out of the 2.2 percent of the children classified as child laborers, almost all of them attend school (94.3 percent). The percent-age of student laborers is lower in urban area than in rural area (90.3 and 99.5 percent respectively). There are differences depending on the level of the mother’s education: 100 percent of working children of mothers with primary/incomplete secondary education attend school compared to 93.8 percent of children whose mothers have higher and specialized secondary education.
which implies an interesting contrast with the actual prevalence of physical discipline. The largest number of children age 2-14 years (47.8 percent) in Kazakhstan are exposed to psycho-logical pressure. 30.5 percent of children are subjected only to nonviolent punishment and 22.9 percent of children – to minor physical punishment.
In turn, almost every fifth child (17.3 percent) experiences neither discipline methods nor pun-ishment; the percentage of children, who expe-rienced neither form of disciplining, is higher in rural area. Male children were subjected more to both minor and severe physical discipline (25.3 and 1.1 percent) than female children (20.3 and 0.4 percent respectively). Girls are more exposed to non-violent methods of discipline.
More children were subjected to severe physical punishment in Kyzylorda Oblast (5.6 percent), where the largest number of mothers/caretakers (14.4 percent) believes that the child should be physically punished. In Almaty City and Almaty Oblast no cases of severe physical punishment of children were found.
The number of children who experience non-violent methods, psychological punishment and minor physical punishment as well as se-vere physical punishment is higher in urban area than in rural one.
Child DisciplineAs stated in A World Fit for Children, “children must be protected against any acts of violence…” and the Millennium Declaration calls for the pro-tection of children against abuse, exploitation and violence. In the Kazakhstan MICS survey, mothers/caretakers of children age 2-14 years were asked a series of questions on the ways parents tend to use to discipline their children when they misbe-have. Note that for the child discipline module, one child aged 2-14 per household was selected randomly during fieldwork. Out of these ques-tions, three indicators used to describe aspects of child discipline are: 1) the number of children 2-14 years that experience psychological aggression as punishment or minor physical punishment or severe physical punishment; and 2) the number of parents/caretakers of children 2-14 years of age that believe that in order to raise their children properly, they need to physically punish them.
In Kazakhstan, over 52 percent of children aged 2-14 years were subjected to at least one form of psychological or physical punishment by their mothers/caretakers or other household mem-bers (Table CP.4). Less than one percent of chil-dren were subjected to severe physical punish-ment; in urban area percentage of such children is almost twice as much as in rural (0.9 and 0.5 percent respectively). On the other hand, 7.4 percent of mothers/caretakers who believed that children should be physically punished,

MONITORING THE SITUATION OF CHILDREN AND WOMEN58
It is very interesting to note that differentials with respect to many of the background vari-ables were relatively small. Despite the fact that over 50 percent of elder children (5-9 and 10-14 years), and those living in urban areas, were subjected to at least one psychological or physi-cal punishment, the differentials in terms of severe physical punishment were high only in rich households – 1 percent. In addition, pun-ishment of children (any) is more prevalent if mothers have primary education (60.7 percent). It is of importance also to indicate that far fewer parents/caretakers believe that in order to raise their children properly, they need to physically punish them (7.4 percent), in practice over 20 percent indicated the opposite.
legislation, shall be taken to specify a minimum age for marriage...” While marriage is not consid-ered directly in the Convention on the Rights of the Child, child marriage is linked to other rights – such as the right to express their views freely, the right to protection from all forms of abuse, and the right to be protected from harmful tradi-tional practices – and is frequently addressed by the Committee on the Rights of the Child. Other international agreements related to child mar-riage are the Convention on Consent to Marriage, Minimum Age for Marriage and Registration of Marriages and the African Charter on the Rights and Welfare of the Child and the Protocol to the African Charter on Human and People’s Rights on the Rights of Women in Africa. Child marriage was also identified by the Pan-African Forum against the Sexual Exploitation of Children as a type of commercial sexual exploitation of chil-dren.
Young married girls are a unique, though often invisible, group. They are often required to per-form heavy amounts of domestic work, under pressure to demonstrate fertility, and respon-sible for raising children while still children themselves, married girls and child mothers face constrained decision-making and reduced life choices. Boys are also affected by child marriage but the issue impacts on girls in far larger num-bers and with more intensity.
Cohabitation – when a couple lives together as if married – raises the same human rights con-cerns as marriage. Where a girl lives with a man
Marriage before the age of 18 is a reality for many young girls. According to UNICEF’s world-wide estimates, over 60 million women aged 20-24 were married/in union before the age of 18. Factors that influence child marriage rates include: the state of the country’s civil registra-tion system, which provides proof of age for children; the existence of an adequate legislative framework with an accompanying enforcement mechanism to address cases of child marriage; and the existence of customary or religious laws that condone the practice.
In many parts of the world parents encourage the marriage of their daughters while they are still children in the hope that the marriage will benefit them both financially and socially, while also relieving financial burdens on the family. In actual fact, child marriage is a violation of hu-man rights, compromising the development of girls and often resulting in early pregnancy and social isolation, with little education and poor vocational training reinforcing the gendered nature of poverty. The right to ‘free and full’ con-sent to a marriage is recognized in the Universal Declaration of Human Rights – with the recogni-tion that consent cannot be ‘free and full’ when one of the parties involved is not sufficiently mature to make an informed decision about a life partner. The Convention on the Elimination of all Forms of Discrimination against Women (CEDAW) mentions the right to protection from child marriage in article 16, which states: “The betrothal and the marriage of a child shall have no legal effect, and all necessary action, including
Early Marriage

KAZAKHSTAN MULTIPLE INDICATOR CLUSTER SURVEY (MICS), 2006 59
and takes on the role of caregiver for him, the as-sumption is often that she has become an adult woman, even if she has not yet reached the age of 18. Additional concerns due to the informal-ity of the relationship – for example, inherit-ance, citizenship and social recognition – might make girls in informal unions vulnerable in dif-ferent ways than those who are in formally rec-ognized marriages.
Research suggests that many factors interact to place a child at risk of marriage. Poverty, pro-tection of girls, family honor and the provision of stability during unstable social periods are considered as significant factors in determin-ing a girl’s risk of becoming married while still a child. Women who married at younger ages were more likely to believe that it is sometimes acceptable for a husband to beat his wife and were more likely to experience domestic vio-lence themselves. The age gap between partners is thought to contribute to these abusive power dynamics and to increase the risk of untimely widowhood.
Closely related to the issue of child marriage is the age at which girls become sexually active. Women who are married before the age of 18 tend to have more children than those who marry later in life. Pregnancy related deaths are known to be a leading cause of mortality for both married and unmarried girls between the ages of 15 and 19, particularly among the youngest of this cohort.
Two of the indictors are to estimate the percent-age of women married before 15 years of age and percentage married before 18 years of age. The percentage of women married at various ages is provided in Table CP.5
In Kazakhstan the Law “On Marriage and Family” determines the age of 18 as legal for marriage for both men and women. In exceptional cases the state registrar’s offices have the authority to reg-ister marriage at the earlier age of spouses but not younger than 16.
In Kazakhstan 57.4 percent of women at the age of 15-49 years selected in the sample for MICS, are either married or live in union. Noteworthy is the fact that among young women in the age group of 15-19 only 5 percent reported of being married. The proportion of women at the age of 15-49 who had got married or lived in union with men before they turned 15 was 0.4 percent,
and 8.5 percent of the 20-49 age group had got married before the age of 18.
The results show that early marriages at the age below 15 years are not widely spread in Kazakhstan. In Aktobe, West Kazakhstan and Mangistau Oblasts there were found no such marriages. In the remaining Oblasts, number of marriages below 15 years of age does not exceed 0.5 percent. Only in East Kazakhstan Oblast, the number of such marriages was one percent. This indicator does not differ by urban and rural are-as, making 0.3-0.4 percent. There is small differ-ence by the level of education – this indicator is higher among women with primary education (0.7 percent).
More often young women marry at the age below 18 in Zhambyl (12 percent), North Kazakhstan (11.3 percent) and Karaganda (11.1 percent) Oblasts. The least percentage of such marriages was found in Atyrau (4.2 percent) and Mangistau (4.6 percent) Oblasts. Below full 18 years, Russian women, women in rural area and with primary education married more often. A lower percent-age of women from the richest households got married at young age (6 percent).
Another component is the spousal age differ-ence with an indicator being the percentage of married/in union women with a difference of 10 or more years of age compared to their current spouse. Table CP.6 presents the results of the age difference between husbands and wives.
In Kazakhstan the major proportion of marriages have the age difference between spouses at 0 to 9 years. For instance, the proportion of women

MONITORING THE SITUATION OF CHILDREN AND WOMEN60
at the age of 20-24 years with a husband/part-ner’s age of 0-4 years older made 56.5 percent and those of 5-9 years older were 29.7 percent. Only 7.4 percent of young women of this age group married to men of 10 and/or more years older, at the same time, 5.7 percent of women were married to younger men.
The percentage of marriages, when husband is by 5-9 years and 10 and more years older than his wife is more prevalent in rural area and among poorest households. Marriages, when husband is by 0-4 years older are more prevalent among women with higher levels of education and in rich households, it is also more often among Russian women than among Kazakh women.
this regard, where 47.6 percent of women rec-ognized this fact (of these 28.6 percent believe husband can beat his wife if she argues with him). Negative attitudes to domestic violence (below 5 percent) expressed women of Almaty, Mangistau and South Kazakhstan Oblasts and Astana city.
12.3 percent of women married at the time of the survey and 10.4 percent of previously mar-ried/in union women believe that husband can sometimes beat his wife, 6.5 percent of never married women expressed negative attitudes to beating by partner/husband. Women aged 15-19 years (6.8 percent) expressed less negative attitude towards domestic violence, in other age groups percentage of women was distributed al-most the same (by 10-12 percent). Interestingly, women with secondary education have more positive attitudes to beating by husband (12.9 percents), than women with primary and higher education (8.4 -9.8 percent).
The highest percentage of women (7.1 percent) recognized that partner can beat his wife if she neglects their children and under-cares of them. The percentage for women currently and previ-ously married was 8.3 and 7.7 percents respec-tively while it is 4.6 percent for women never married/in union. Least percentage of women (1.5 percent) accepts this situation in case if wife refuses sex with her partner. Distribution of causes justifying, according to interviewed wom-en, domestic violence from the partner and the number of women who accept such situation is almost the same in urban and rural areas.
A number of questions were asked of women age 15-49 years to assess their attitudes towards whether husbands are justified to hit or beat their wives/partners for a variety of reasons. These questions were asked to get an indication of cul-tural beliefs that tend to be associated with the prevalence of violence against women by their husbands/partners. The main assumption here is that women that agree with the statements in-dicating that husbands/partners are justified to beat their wives/partners under the situations described in reality tend to be abused by their own husbands/partners. The responses to these questions can be found in Table CP.9.
To study attitudes of women aged 15-49 years towards domestic violence within MICS this group of women were presented with the fol-lowing situations that might cause her husband/partner beating his wife/partner and they were asked proposed to specify in which of the below she presumed this outcome:
• Goes out for long without telling her hus-band;
• Neglects her children;
• Contradicts her husband;
• Refuses sex with him;
• Burns food.
10.4 percent of women aged 15-49 years rec-ognized that partner might beat his wife due to one of the above causes (Table CP.9).
Kyzylorda Oblast was the most unfavorable in
Domestic Violence

KAZAKHSTAN MULTIPLE INDICATOR CLUSTER SURVEY (MICS), 2006 61
XII. HIV/AIDS
Knowledge of HIV TransmissionOne of the most important prerequisites for reducing the rate of HIV infection is accurate knowl-edge of how HIV is transmitted and strategies for preventing transmission. Correct information is the first step toward raising awareness and giving young people the tools to protect themselves from infection. Misconceptions about HIV are common and can confuse young people and hinder pre-vention efforts. Different regions are likely to have variations in misconceptions although some ap-pear to be universal (for example that sharing food can transmit HIV or mosquito bites can transmit HIV). The UN General Assembly Special Session on HIV/AIDS (UNGASS) called on governments to improve the knowledge and skills of young people to protect themselves from HIV. The indicators to measure this goal as well as the MDG of reducing HIV infections by half include improving the level of knowledge of HIV and its prevention, and changing behaviours to prevent further spread of the disease. The HIV module was administered to women 15-49 years of age.
One indicator which is both an MDG and UNGASS indicator is the percent of young women who have comprehensive and correct knowledge of HIV prevention and transmission. Women were asked whether they knew of the three main ways of HIV transmission – having only one faithful uninfected partner, using a condom every time, and abstaining from sex. The results are presented in Table HA.1.
In Kazakhstan, almost all interviewed women (98.7 percent) have heard of AIDS. However, the per-centage of women who know of all three main ways of preventing HIV transmission is only 30 per-cent. Almost 66 percent of women know of having one faithful uninfected sex partner, 62.9 percent know of using a condom every time, and 42.7 percent know of abstaining from sex as main ways of preventing HIV transmission. While almost 80 percent of women know at least one way, a high proportion of women (20.1 percent) do not know any of the three ways.
Knowledge of HIV and HIV transmission is higher in urban area and associates with education – the higher education level of woman, the higher knowledge of HIV. Percentage of women aware of three ways of HIV prevention is higher in 35-39 and 40-44 age groups (about 32 percent), and lower in 15-19 age group (27.6 percent). The percentage of women who do not know any way of HIV pre-vention is high in 15 - 19 age group (28.2 percent). Half of interviewed women in Mangistau and 42 percent in Kyzylorda Oblasts know neither way of HIV transmission.
Table HA.2 presents the percentage of women who can correctly identify misconceptions concerning HIV. The indicator is based on the two most common and relevant misconceptions in Kazakhstan, that HIV can be transmitted by sharing food and mosquito bites. The table also provides information on whether women know that HIV cannot be transmitted by supernatural means, and that HIV can be transmitted by sharing needles. Of the interviewed women, 36.3 percent reject the two most common misconceptions and know that a healthy-looking person can be infected. 68.7 percent of women know that HIV cannot be transmitted by sharing food, and 60.6 percent of women know that HIV cannot be transmitted by mosquito bites, while 67.5 percent of women know that a healthy-looking person can be infected. 79.8 percent of women know that HIV cannot be transmitted by supernatural means,
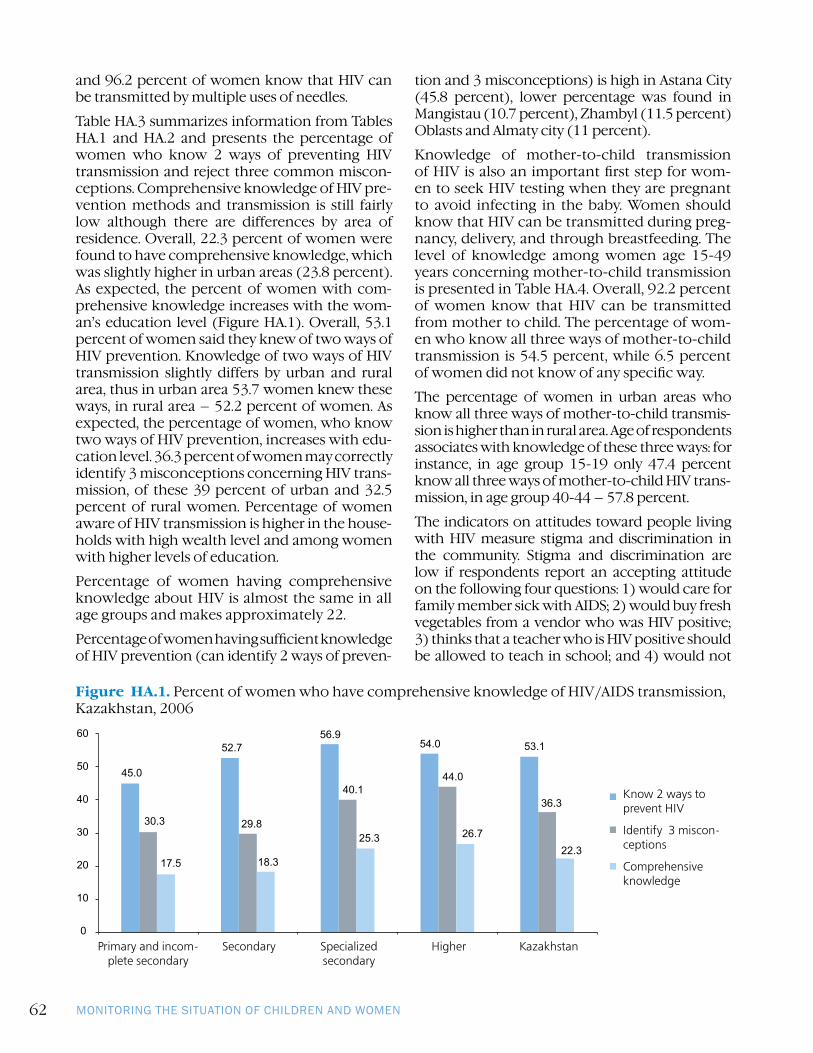
MONITORING THE SITUATION OF CHILDREN AND WOMEN62
and 96.2 percent of women know that HIV can be transmitted by multiple uses of needles.
Table HA.3 summarizes information from Tables HA.1 and HA.2 and presents the percentage of women who know 2 ways of preventing HIV transmission and reject three common miscon-ceptions. Comprehensive knowledge of HIV pre-vention methods and transmission is still fairly low although there are differences by area of residence. Overall, 22.3 percent of women were found to have comprehensive knowledge, which was slightly higher in urban areas (23.8 percent). As expected, the percent of women with com-prehensive knowledge increases with the wom-an’s education level (Figure HA.1). Overall, 53.1 percent of women said they knew of two ways of HIV prevention. Knowledge of two ways of HIV transmission slightly differs by urban and rural area, thus in urban area 53.7 women knew these ways, in rural area – 52.2 percent of women. As expected, the percentage of women, who know two ways of HIV prevention, increases with edu-cation level. 36.3 percent of women may correctly identify 3 misconceptions concerning HIV trans-mission, of these 39 percent of urban and 32.5 percent of rural women. Percentage of women aware of HIV transmission is higher in the house-holds with high wealth level and among women with higher levels of education.
Percentage of women having comprehensive knowledge about HIV is almost the same in all age groups and makes approximately 22.
Percentage of women having sufficient knowledge of HIV prevention (can identify 2 ways of preven-
tion and 3 misconceptions) is high in Astana City (45.8 percent), lower percentage was found in Mangistau (10.7 percent), Zhambyl (11.5 percent) Oblasts and Almaty city (11 percent).
Knowledge of mother-to-child transmission of HIV is also an important first step for wom-en to seek HIV testing when they are pregnant to avoid infecting in the baby. Women should know that HIV can be transmitted during preg-nancy, delivery, and through breastfeeding. The level of knowledge among women age 15-49 years concerning mother-to-child transmission is presented in Table HA.4. Overall, 92.2 percent of women know that HIV can be transmitted from mother to child. The percentage of wom-en who know all three ways of mother-to-child transmission is 54.5 percent, while 6.5 percent of women did not know of any specific way.
The percentage of women in urban areas who know all three ways of mother-to-child transmis-sion is higher than in rural area. Age of respondents associates with knowledge of these three ways: for instance, in age group 15-19 only 47.4 percent know all three ways of mother-to-child HIV trans-mission, in age group 40-44 – 57.8 percent.
The indicators on attitudes toward people living with HIV measure stigma and discrimination in the community. Stigma and discrimination are low if respondents report an accepting attitude on the following four questions: 1) would care for family member sick with AIDS; 2) would buy fresh vegetables from a vendor who was HIV positive; 3) thinks that a teacher who is HIV positive should be allowed to teach in school; and 4) would not
Figure HA.1. Percent of women who have comprehensive knowledge of HIV/AIDS transmission, Kazakhstan, 2006
Know 2 ways to prevent HIV
Identify 3 miscon-ceptions
Comprehensive knowledge
Primary and incom-plete secondary
Secondary Specialized secondary
Higher Kazakhstan

KAZAKHSTAN MULTIPLE INDICATOR CLUSTER SURVEY (MICS), 2006 63
want to keep HIV status of a family member a se-cret. Table HA.5 presents the attitudes of women towards people living with HIV/AIDS.
Interviewing revealed that 9.4 percent of the pop-ulation in general would not care of family mem-ber sick with HIV (AIDS); there were found no sig-nificant differences by urban and rural areas (9.3 and 9.5 percent respectively). However, the high-est proportion of such population was found in Aktobe (28.7 percent), Kyzylorda (27.5 percent) and Atyrau (23.8 percent) Oblasts, the least pro-portion – in Almaty (1.9 percent), Kostanai (2.4 percent), Zhambyl (3.6 percent), Karaganda (4.2 percent) Oblasts and Almaty city (3 percent).
65.9 percent of respondents would want to keep the HIV status of a family member a secret, the percentage of such respondents is almost by 10 percent higher in urban area than in rural area. 60.1 percent of population of Kazakhstan believe that HIV positive teacher should not be allowed to teach in school; rural people are more cate-gorical than urban (65 and 56.8 percent respec-tively), the highest percentage of such answers was found in 30-34 age group of respondents, people with primary, secondary and specialized secondary education, in poorest households and among Kazakh women. 82.7 percent of people would not buy foodstuffs from HIV-positive ven-dor; again the percentage of such respondents is higher among rural population than among ur-ban population (84.9 and 81.2 percent respec-tively) and in poorest households (86.3 percent).
96.2 percent of women in survey agreed with one of the proposed discriminatory statements re-garding people living with HIV/AIDS (PLWHA); women of urban as well as rural areas, irrespec-tively to their education level, age and wealth of their households were unanimous in their an-swers. The lowest number of women who agreed with a proposed discriminatory statement were noted in Atyrau (92.4 percent), Akmola (92.7 percent) Oblasts and Almaty City (92.6 percent). Only 3.8 percent of women agreed with none of the discriminatory statements regarding PLWHA and the majority of those women were with pri-mary and/or incomplete secondary education (4.7 percent) and from Akmola Oblast (7.3 per-cent) and Almaty City (7.4 percent).
Another important indicator is the knowledge of where to be tested for HIV and use of such servic-es. Questions related to knowledge among wom-en of a facility for HIV testing and whether they
have ever been tested is presented in Table HA.6. In Kazakhstan, 83.5 percent of women know where to be tested; percentage of such women is higher in urban area and among respondents with higher levels of education. Moreover, a high-er percentage of knowledge of where to be tested for HIV was found in more wealthy households (88-89 percent) and and among Russian women (89.7 percent), the lower percentage was preva-lent in age group 15-19 (64.9 percent) compared to 25-29 age group (88.9 percent) and 30-34 age group (89.6 percent). The lowest percent was found in Zhambyl Oblast (61.4 percent), the highest – in Pavlodar Oblast (96.5 percent).
Of 83.5 percent of women knowing where to be tested, 61.7 percent were actually tested. Of these, significant part (87.2 percent) received the test results. The percentage of those who have been tested for HIV and received the results is higher in urban area (89.8 percent) than in rural area (83 percent). In Mangistau Oblast only 49 percent of women had been told the test results, which is the lowest indicator among all regions.
Among women who had given birth within the two years preceding the survey, the percentage who received counselling and HIV testing dur-ing antenatal care is presented in Table HA.7.
98.1 percent of women in Kazakhstan received antenatal care during last pregnancy, of them 82.4 percent in any way obtained information about HIV prevention during antenatal care. There were found no significant differences between urban and rural women (82.7 and 82.1 percent respec-tively), however, this indicator was associated with education level of women and wealth of house-holds. Only 71.5 percent of women with primary and incomplete secondary education received in-formation about HIV opposed to over 84 percent of women with higher education and 79 percent of women from poorest households against 88 percent of women from richest households. 92.9 percent of interviewed women were tested for HIV during antenatal care, 78.8 percent of them received their test results. This percentage was higher among urban women (82.3 percent) com-pared to rural (75 percent). The largest proportion of women received results of HIV test is higher in 15-19 age group (93 percent), among women with higher level of education and in households with higher wealth level. In Almaty City all women received HIV test results, the lowest indicator val-ue was found in Aktobe Oblast (49 percent).

MONITORING THE SITUATION OF CHILDREN AND WOMEN64
XIII. Tuberculosis
Knowledge of TuberculosisTask 8 of Sixth Millennium Development Goal (MDG) is to reduce TB incidence by 2015 and initiate a trend to TB reduction.
Tuberculosis seriously threatens the health of the population. In 1993, World Health Organization (WHO) announced tuberculosis the global world problem and it is still a serious healthcare problem in Kazakhstan. Prevalence of TB multi-resistant forms caused by strains resistant to the majority of TB medicines is of great danger to the population. These TB forms result from inadequate and in-complete treatment or irregularly taking medicines by patients.
The high growth in disease may become a factor threatening social and economic development of the country, which in turn establishes environment for tuberculosis prevalence.
Domestic and social levels of population are the major factors influencing tuberculosis prevalence. Volume of public expenditures in health care, provision with TB health personnel and equipment of health facilities with diagnostic equipment and medicines is essential.
Fight against TB is closely linked to literacy of population, awareness of symptoms, ways of TB trans-mission and access to qualified health assistance, which promotes TB prevention, seeking timely care in health facility and following doctor’s recommendations.
In 2006 MICS women aged 15-49 were asked about their knowledge of TB symptoms, ways of trans-mission and possibility to treat TB. Thus, respondents were asked if they knew such disease as tu-berculosis, if they knew that TB could be treated if proper treatment selected, the main ways of treatment, ways of infection transmission and the site where the parent would take the child with suspected TB.
99.4 percent of country’s population is aware of tuberculosis with no difference by urban and rural areas (Table TB.1). 79 percent of women know about tuberculosis patients’ recovery if it is properly treated. The highest percent of women knowing about this were found in Pavlodar (89.1 percent) fol-lowed by Kostanai (88.5 percent) and East Kazakhstan (88.4 percent) Oblasts. The lowest percentage was seen in Karaganda, Mangistau, South Kazakhstan Oblasts and Almaty City (around 72 percent).
83.2 percent of women noted that TB should be treated in hospital. In general, ranging from 70 percent of women in Pavlodar Oblast to 99.7 percent in Mangistau Oblast agreed with this opin-ion. Almost each third woman (about 28 percent) in Pavlodar and Zhambyl Oblasts and each fifth (about 20 percent) in Karaganda and West Kazakhstan Oblasts believe that TB requires hospitaliza-tion at initial stage with following treatment at home. In Mangistau and Atyrau Oblasts almost all interviewed women accepted only hospital treatment.

KAZAKHSTAN MULTIPLE INDICATOR CLUSTER SURVEY (MICS), 2006 65
Lower percentages of respondents knew nei-ther ways of TB treatment – from 0.1 percent in Karaganda and Atyrau Oblasts to 1.2 percent and 1.6 percent respectively in North Kazakhstan and Akmola Oblasts.
Almost all respondents irrespectively to their place of residence, level of education and wealth knew about TB transmission by air during coughing.
The largest number of parents who reported on taking child with suspected TB to TB dis-pensary was found in Atyrau (80 percent), West Kazakhstan (64.3 percent) and South Kazakhstan (61 percent) Oblasts. About 50 percent of par-ents in Akmola Oblast and Almaty City and 56.3 percent of respondents in Almaty Oblast would refer to the hospital (in-patient) in this situation, and 64.5 percent of parents in Karaganda Oblast would seek care in polyclinic (out-patient).
About 42 percent of parents in urban and rural areas responded they would refer to a TB dispen-sary with suspected TB in children. Respondents with higher education more often mentioned TB dispensary as the place of seeking care. These facilities provide diagnostics and medical treat-ment to the patients directly referred for first medical aid and those who were referred there with suspected TB after medical examination in other health facilities.
About 39 percent of parents in rural area and 25.5 percent of urban population would refer to hospi-tal. The latter would refer to a Polyclinic (32 pere-cent). It could be explained by high coverage of ur-ban population with polyclinic care, while due to lack of polyclinics in rural areas the rural popula-tion is forced to seek care in the nearest hospital.
In order to identify the level of population awareness of disease symptoms respondents were asked about symptoms of suspected TB that would make them seeking medical care.
Thus, almost 53 percent of interviewed women correctly named “coughing over three weeks” as a TB sign (Table %#.2). At the same time the high-est awareness level was found in Kostanai (78.3 percent), Pavlodar (75.7 percent), Mangistau and Aktobe Oblasts as well as in Almaty city (around 70 percent).
Among other symptoms almost 43 percent of women listed blood with phlegm, 38 percent – fever and 37 percent – night sweating.
Overall, the urban population is more aware of TB
signs than the rural population. Similarly, the level of awareness by each TB symptom grows along with respondents’ level of education and wealth.
Table %#.3 provides information on what TB symptoms would require women to see a doc-tor. Over 58.5 percent of women reported that they would be forced to see a doctor if they would have cough over three weeks, 43.9 per-cent if they would lose weight; 41.3 percent – fe-ver, 39.0 percent – blood with phlegm and 39.8 percent women – pain in the chest.
In the survey women were asked about their con-tacts with people who had TB (family members or anybody who suffers from TB, such as neigh-bors, colleagues or close friends) and whether they would take care of a family member after TB treatment.
Five percent of interviewed women informed that they were sick or have family members with TB and 7.5 percent often communicate with neighbors, colleagues or close friends suffering from TB (Table TB.4). The largest percent of peo-ple contacting with persons suffering from TB (including siblings, colleagues and friends) live in Pavlodar (25 percent), Akmola (21.2 percent), North Kazakhstan (19.3 percent), Kyzylorda (18.6 percent), West Kazakhstan (17.8 percent), Kostanai (17.7 percent), Karaganda (19.4 per-cent) Oblasts and Astana city (21.6 percent).
The proportion of respondents who denied care to family member who had TB treatment increas-es with growth of family wealth from 3.4 percent in poorest households to 5.4 percent in the richer ones. Proportion of such respondents increases with education level from 3.5 percent in women with primary/incomplete secondary education to 4.5 percent in women with higher education. Overall about 4 percent of interviewed women reported that they would not take care of family member who had TB treatment.
Overall 12.5 percent of the population in the country had TB or had family members suffer-ing from tuberculosis and/or have frequent con-tacts with people who have TB outside of their families. The population is well informed about ways of TB transmission and the disease’s symp-toms. Better knowledge about proper treatment of tuberculosis would allow improvement of references to health facilities at earlier stages. This would promote more effective treatment and better TB prevention.

MONITORING THE SITUATION OF CHILDREN AND WOMEN66
List of References
Boerma, J. T., Weinstein, K. I., Rutstein, S.O., and Sommerfelt, A. E. , 1996. Data on Birth Weight in Developing Countries: Can Surveys Help? Bulletin of the World Health Organization, 74(2), 209-16.
Rutstein, S.O. and Johnson, K., 2004. The DHS Wealth Index. DHS Comparative Reports No. 6. Calverton, Maryland: ORC Macro.
Filmer, D. and Pritchett, L., 2001. Estimating wealth effects without expenditure data – or tears: An application to educational enrolments in states of India. Demography 38(1): 115-132.
UNICEF, 2006. Monitoring the Situation of Children and Women. Multiple Indicator Cluster Survey Manual, New York.
United Nations, 1983. Manual X: Indirect Techniques for Demographic Estimation (United Nations publication, Sales No. E.83.XIII.2).
United Nations, 1990a. QFIVE, United Nations Program for Child Mortality Estimation. New York, UN Population Division
United Nations, 1990b. Step-by-step Guide to the Estimation of Child Mortality. New York, UN &&'.
WHO and UNICEF, 1997. The Sisterhood Method for Estimating Maternal Mortality. Guidance notes for potential users, Geneva.
UNICEF, Kazakhstan. Assessment of Salt Iodization Adequacy and Its Consumption in Kazakhstan, Almaty, 2005.
Nutrition Institute MoH-SA RK, Academy of Preventive Medicine, Demography and Health Survey Department, Macro International Inc. Kazakhstan Demography and Health Survey, 1995. Almaty, 1996.
Academy of Preventive Medicine, and Macro International Inc., 2000. Kazakhstan Demography and Health Survey, 1999. Almaty, 2000.
Agency of the Republic of Kazakhstan on Statistics. Demography Yearbook of Kazakhstan, Almaty, 2005.
Agency of the Republic of Kazakhstan on Statistics. Ethnic and Demography Yearbook of Kazakhstan, Almaty, 2006.
www.childinfo.org.

KAZAKHSTAN MULTIPLE INDICATOR CLUSTER SURVEY (MICS), 2006 67
Tab
le H
H.1
: Res
ults
of h
ous
eho
ld a
nd
ind
ivid
ual i
nte
rvie
ws
Num
ber
of h
ous
eho
lds,
wo
men
, an
d c
hild
ren
un
der
5 b
y re
sult
s o
f th
e h
ous
eho
ld, w
om
en’s
an
d u
nd
er-fi
ve’s
inte
rvie
ws,
an
d h
ous
eho
ld, w
om
en’s
an
d u
nd
er-
five’
s re
spo
nse
rat
es, K
azak
hst
an, 2
006
RESI
DEN
CE
TOTA
L
INCL
UD
ING
OBL
AST
S
Urban
Rural
Akmola
Aktobe
Almaty
Atyrau
West Kazakhstan
Zhambyl
Karagandy
Kostanai
Kyzylorda
Mangistau
South Kazakhstan
Pavlodar
North Kazakhstan
East Kazakhstan
Astana City
Almaty City
Num
ber o
f hou
seho
lds
Sam
pled
8 64
06
360
15 0
0088
886
41
128
792
840
984
1 08
093
684
076
81
152
888
864
1 10
481
61
056
Occ
upie
d8
630
6 35
414
984
885
864
1 12
379
184
098
41
078
934
840
767
1 15
288
886
31
104
816
1 05
5
Inte
rvie
wed
8 24
66
318
14 5
6484
683
71
096
782
820
974
1 05
292
183
075
81
125
873
847
1 08
275
596
6
Resp
onse
rate
95.6
99.4
97.2
95.6
96.9
97.6
98.9
97.6
99.0
97.6
98.6
98.8
98.8
97.7
98.3
98.1
98.0
92.5
91.6
Num
ber o
f wom
en
Elig
ible
7 68
17
038
14 7
1973
488
71
162
1 03
692
51
002
925
783
1 02
593
81
358
759
682
941
793
769
Inte
rvie
wed
7 61
16
959
14 5
7066
688
71
159
1 02
690
599
992
478
21
022
938
1 35
575
668
194
076
676
4
Resp
onse
rate
99.1
98.9
99.0
90.7
100.
099
.799
.097
.899
.799
.999
.999
.710
0.0
99.8
99.6
99.9
99.9
96.6
99.3
Ove
rall
resp
onse
rate
94.7
98.3
96.2
86.7
96.9
97.3
97.9
95.5
98.7
97.5
98.5
98.5
98.8
97.4
97.9
98.0
97.9
89.4
91.0
Num
ber o
f chi
ldre
n un
der 5
Elig
ible
1 94
42
480
4 42
421
623
441
531
420
338
819
120
139
831
961
917
416
119
518
521
1
Mot
her/
Care
take
r in
terv
iew
ed1
942
2 47
44
416
213
234
413
314
203
387
191
201
397
319
619
173
161
195
185
211
Resp
onse
rate
99.9
99.8
99.8
98.6
100.
099
.510
0.0
100.
099
.710
0.0
100.
099
.710
0.0
100.
099
.410
0.0
100.
010
0.0
100.
0
Ove
rall
resp
onse
rate
95.5
99.2
97.0
94.3
96.9
97.1
98.9
97.6
98.7
97.6
98.6
98.6
98.8
97.7
97.7
98.1
98.0
92.5
91.6
Den
om
inat
or
for
ho
useh
old
res
po
nse
rat
e –
is
the
num
ber
of
ho
useh
old
s id
enti
fied
as
occ
upie
d d
urin
g th
e fie
ldw
ork
(H
H9
= 1,
2, 3
); n
umer
ato
r –
is
the
num
ber
of
ho
useh
old
s en
tere
d in
to t
he
ho
useh
old
que
stio
nn
aire
s (H
H9
= 1)
. Den
om
inat
or
for
wo
men
’s r
esp
on
se r
ate
– is
th
e n
umb
er o
f el
igib
le w
om
en in
th
e h
ous
eho
ld li
stin
g (i
.e. w
om
en 1
5–49
yea
rs o
ld, H
H12
); n
umer
ato
r –
is t
he
num
ber
of
succ
essf
ully
inte
rvie
wed
wo
men
(H
H13
). D
eno
min
ato
r fo
r un
der
fiv
e ch
ildre
n r
esp
on
se –
is t
he
num
ber
of c
hild
ren
un
der
five
in t
he
ho
useh
old
list
ing
(HH
14);
num
erat
or
– is
th
e n
umb
er o
f fille
d q
uest
ion
nai
res
for
child
ren
un
der
five
(H
H15
).O
vera
ll re
spo
nse
rat
es in
terv
iew
s ar
e o
btai
ned
thro
ugh
mul
tip
lyin
g th
e h
ous
eho
ld r
esp
on
ses
rate
s by
wo
men
an
d c
hild
ren
un
der
five
res
po
nse
rat
es a
cco
rdin
gly.

MONITORING THE SITUATION OF CHILDREN AND WOMEN68
Table HH.2: Household age distribution by sexPercent distribution of the household population by five-year age groups and interdependent age groups, and number of children aged 0-17 years, by sex, Kazakhstan, 2006
MALES FEMALES TOTAL
Number Percent Number Number Percent Number
Age
0-4 2 125 8.6 1 898 7.1 4 023 7.8
5-9 1 863 7.5 1 686 6.4 3 549 6.9
10-14 2 417 9.8 2 355 8.9 4 772 9.3
15-19 2 665 10.8 2 360 8.9 5 025 9.8
20-24 2 104 8.5 2 022 7.6 4 126 8.0
25-29 1 981 8.0 1 809 6.8 3 790 7.4
30-34 1 685 6.8 1 814 6.8 3 499 6.8
35-39 1 660 6.7 1 956 7.4 3 616 7.1
40-44 1 845 7.5 1 978 7.5 3 823 7.5
45-49 1 711 6.9 1 968 7.4 3 679 7.2
50-54 1 349 5.5 1 805 6.8 3 154 6.1
55-59 1 073 4.3 1 327 5.0 2 400 4.7
60-64 548 2.2 768 2.9 1 316 2.6
65-69 773 3.1 1 173 4.4 1 946 3.8
70+ 925 3.8 1 617 6.1 2 542 5.0
Interdependent age groups
< 15 6 405 25.9 5 939 22.4 12 344 24.1
15-64 16 621 67.2 17 807 67.1 34 428 67.2
65 + 1 698 6.9 2 790 10.5 4 488 8.7
Missing/DK 0 0.0 1 0.0 1 0.0
Children aged 0-17 8 090 32.7 7 448 28.1 15 538 30.3
Adults 18+/Missing/ DK 16 634 67.3 19 089 71.9 35 723 69.7
Total 24 724 100.0 26 537 100.0 51 261 100.0

KAZAKHSTAN MULTIPLE INDICATOR CLUSTER SURVEY (MICS), 2006 69
Table HH.3: Household compositionPercent distribution of households by selected characteristics. Kazakhstan, 2006
WEIGHTED PERCENT
NUMBER OF HOUSEHOLDS
Weighted Unweighted
Sex of household head
Male 64.5 9 396 9 703
Female 35.5 5 168 4 861
Oblast
Akmola 6.0 879 846
Aktobe 4.3 629 837
Almaty 9.3 1 352 1 096
Atyrau 2.3 334 782
West Kazakhstan 4.1 600 820
Zhambyl 5.7 834 974
Karagandy 11.1 1 614 1 052
Kostanai 8.0 1 170 921
Kyzylorda 2.8 409 830
Mangistau 1.9 273 758
South Kazakhstan 9.7 1 415 1 125
Pavlodar 6.3 911 873
North Kazakhstan 5.5 805 847
East Kazakhstan 11.4 1 652 1 082
Astana City 2.3 334 755
Almaty City 9.3 1 353 966
Residence
Urban 64.1 9 339 8 246
Rural 35.9 5 225 6 318
Number of household members
1 13.0 1 894 1 675
2-3 41.0 5 965 5 560
4-5 32.4 4 723 4 935
6-7 10.4 1 522 1 799
8-9 2.4 349 447
10+ 0.8 111 148
Ethnicity/language
Kazakh 49.1 7 145 8 071
Russian 41.2 6 007 5 242
Other 9.7 1 412 1 251
Total 100.0 14 564 14 564
At least one child aged < 18 years 56.7 14 564 14 564
At least one child aged < 5 years 21.8 14 564 14 564
At least one woman aged 15-49 years 70.6 14 564 14 564

MONITORING THE SITUATION OF CHILDREN AND WOMEN70
Table HH.4: Women’s background characteristicsPercent distribution of women aged 15-49 years by background characteristics, Kazakhstan, 2006
WEIGHTED PERCENTNUMBER OF WOMEN
Weighted Weighted OblastAkmola 5.5 797 666Aktobe 4.6 675 887Almaty 10.1 1 475 1 155Atyrau 3.2 458 1 026West Kazakhstan 4.8 699 905Zhambyl 6.0 877 998Karagandy 10.2 1 476 924Kostanai 7.0 1 016 782Kyzylorda 3.6 528 1 022Mangistau 2.3 335 938South Kazakhstan 12.2 1 767 1 352Pavlodar 5.6 820 756North Kazakhstan 4.6 674 681East Kazakhstan 10.1 1 467 940Astana City 2.5 368 766Almaty City 7.7 1 126 762ResidenceUrban 59.5 8 655 7 608Rural 40.5 5 903 6 952Age15–19 17.0 2 469 2 52820–24 14.5 2 108 2 16925–29 13.0 1 894 1 92430–34 13.1 1 900 1 87735–39 14.1 2 055 2 02140–44 14.2 2 076 2 06645–49 14.1 2 056 1 975Marital/Union statusCurrently married/in union 57.4 8 349 8 370Formerly married/in union 14.1 2 049 1 857Never married/in union 28.6 4 160 4 333Motherhood statusEver gave birth 66.8 9 727 9 595Never gave birth 33.2 4 831 4 965EducationPrimary/incomplete secondary 13.4 1 948 1 955Secondary 33.6 4 893 5 004Specialized secondary 27.1 3 949 3 919Higher 25.9 3 768 3 682Wealth index quintilesPoorest 18.5 2 689 3 041Poor 18.7 2 728 2 977Middle 19.4 2 824 2 840Rich 20.0 2 915 2 513Richest 23.4 3 402 3 189Ethnicity/languageKazakh 59.1 8 609 9 553Russian 30.8 4 481 3 761Other 10.1 1 468 1 246Total 100.0 14 558 14 558

KAZAKHSTAN MULTIPLE INDICATOR CLUSTER SURVEY (MICS), 2006 71
Table HH.5: Children’s background characteristicsPercent distribution of children under five years of age by background characteristics, Kazakhstan, 2006
WEIGHTED PERCENT
NUMBER OF UNDER-5 CHILDRENWeighted Unweighted
SexMale 52.7 2 327 2 323Female 47.3 2 088 2 092OblastAkmola 5.5 243 213Aktobe 4.1 181 234Almaty 12.3 545 412Atyrau 3.3 143 314West Kazakhstan 3.4 152 203Zhambyl 7.8 345 387Karagandy 7.2 316 191Kostanai 6.1 267 201Kyzylorda 4.7 209 397Mangistau 2.5 109 319South Kazakhstan 18.7 827 619Pavlodar 4.5 197 173North Kazakhstan 3.7 163 161East Kazakhstan 6.9 304 195Astana City 2.0 90 185Almaty City 7.3 324 211ResidenceUrban 51.0 2 251 1 942Rural 49.0 2 164 2 473Age< 6 months 8.7 382 3876-11 months 10.5 462 47712-23 months 21.9 969 96024-35 months 21.5 948 93636-47 months 19.4 858 86148-59 months 18.0 796 794Mother’s educationPrimary/incomplete secondary 7.0 309 272Secondary 45.3 2 000 2 047Specialized secondary 23.3 1 030 1 052Higher 24.4 1 076 1 044Wealth index quintilesPoorest 27.0 1 189 1 266Poor 20.9 924 998Middle 19.7 868 875Rich 16.0 707 598Richest 16.4 725 678Ethnicity/languageKazakh 66.2 2 924 3 193Russian 21.1 931 771Other 12.7 560 451Total 100.0 4 415 4 415

MONITORING THE SITUATION OF CHILDREN AND WOMEN72
Table !!. 6: Resources of the main information for householdsPercent distribution of households using any sources (mean) of information, Kazakhstan, 2006
SOURCE OF INFORMATION FOR FAMILY
NU
MBE
R O
F H
OU
SEH
OLD
S
New
spap
er
TV
Radi
o
Mag
azin
es
Inte
rnet
Out
door
ad
vert
isin
g an
d po
ster
s
Sibl
ings
, fr
iend
s an
d co
lleag
ues
Oth
er
Oblast
Akmola 69.8 97.0 22.3 21.8 4.0 10.0 56.5 1.2 879
Aktobe 81.6 97.5 40.8 41.8 6.2 24.1 82.4 3.4 629
Almaty 59.8 98.5 14.4 4.6 1.5 9.6 60.0 0.4 1 352
Atyrau 91.0 98.4 45.7 16.4 5.1 11.7 88.9 0.8 334
West Kazakhstan 64.9 97.3 29.5 23.1 2.7 3.1 51.6 0.3 600
Zhambyl 52.0 95.2 8.8 8.5 0.9 2.1 23.9 0.4 834
Karagandy 67.1 97.4 17.1 18.2 6.1 7.1 52.2 0.5 1 614
Kostanai 71.1 97.8 26.1 15.4 5.6 6.0 38.0 0.2 1 170
Kyzylorda 44.1 97.0 18.4 7.1 1.3 5.8 55.4 2.9 409
Mangistau 89.5 99.5 33.9 38.1 8.1 23.4 84.4 4.1 273
South Kazakhstan 49.1 98.3 19.8 4.7 1.5 11.3 54.6 0.2 1 415
Pavlodar 69.7 98.3 34.8 18.4 3.8 2.3 50.0 0.2 911
North Kazakhstan 69.9 96.6 17.3 9.6 2.2 3.8 41.1 0.1 805
East Kazakhstan 62.7 97.9 12.1 11.1 1.8 5.5 50.8 5.1 1 652
Astana City 84.0 96.7 36.3 42.3 21.9 17.0 40.1 (*) 334
Almaty City 78.7 98.7 62.4 48.1 13.5 21.8 71.2 0.5 1 353
Residence
Urban 70.7 97.7 30.8 23.2 7.0 12.2 54.3 1.0 9 339
Rural 58.8 97.6 15.7 9.6 (0.6) 4.5 53.7 1.6 5 225
Education of household head
Primary/incomplete secondary 51.1 95.6 17.2 6.2 (*) 4.6 48.1 (1.4) 2 407
Secondary 61.6 97.8 21.1 12.9 2.0 7.3 54.8 1.2 5 224
Specialized secondary 73.2 98.4 27.4 21.0 4.0 10.2 52.7 (1.1) 3 744
Higher 80.3 98.5 37.6 34.9 13.7 16.2 59.4 (1.2) 3 048
Missing/ DK (*) (*) (*) (*) (*) (*) (*) (*) 2
Wealth index quintiles
Poorest 43.2 94.5 10.0 4.0 (*) 3.9 52.9 (1.5) 2 208
Poor 60.4 98.1 15.6 8.8 (*) 5.9 53.4 (1.4) 2 554
Middle 67.2 98.1 22.3 12.8 (1.3) 5.1 51.4 (1.3) 2 751
Rich 70.6 97.8 30.2 21.9 3.8 9.7 52.9 (*) 3 560
Richest 80.6 98.9 39.9 35.3 14.5 18.7 58.5 1.3 3 491
Ethnicity/language
Kazakh 66.3 98.0 24.7 18.6 4.2 9.6 58.1 1.4 7 145
Russian 68.2 97.4 26.6 19.3 5.7 8.9 49.1 1.1 6 007
Other 60.0 97.1 23.9 13.1 3.0 10.8 54.4 0.7 1 412
Total 66.4 97.7 25.4 18.4 4.7 9.4 54.1 1.2 14 564
Note: ( ) – indicators are based on 25 – 49 cases of unweighted observations (*) – indicators are based on less than 25 cases of unweighted observations

KAZAKHSTAN MULTIPLE INDICATOR CLUSTER SURVEY (MICS), 2006 73
Table CM.1: Early child mortalityDistribution of infant mortality and under fife mortality rates by key characteristics, Kazakhstan, 2006
INFANT MORTALITY RATE* UNDER-FIVE MORTALITY RATE**
Sex
Male 36.6 41.7
Female 26.6 30.3
Residence
Urban 26.8 30.2
Rural 37.0 42.6
Ethnicity/language
Kazakh 31.8 36.2
Russian 27.3 31.0
Total 31.8 36.3
* MICS indicator 2; MDG indicator 14** MICS indicator 1; MDG indicator 13
Table CM.2: Children ever born and proportion deadMean number of children ever born, survived and proportion dead by age of women, Kazakhstan, 2006
MEAN NUMBER OF CHILDREN EVER BORN PROPORTION DEAD RATIO OF SURVIVED
AND DEAD NUMBER OF WOMEN
Age
15–19 0.031 0.030 0.039 2 469
20–24 0.507 0.497 0.020 2 108
25–29 1.309 1.258 0.038 1 894
30–34 1.895 1.811 0.044 1 900
35–39 2.230 2.132 0.044 2 055
40–44 2.562 2.425 0.053 2 076
45–49 2.737 2.544 0.071 2 056
Total 1.563 1.483 0.051 14 558

MONITORING THE SITUATION OF CHILDREN AND WOMEN74
Tab
le N
U.1
: Ch
ild m
aln
our
ish
men
tPe
rcen
tage
of c
hild
ren
age
d 0
-59
mo
nth
s w
ho
are
sev
erel
y o
r m
od
erat
ely
mal
no
uris
hed
, Kaz
akh
stan
, 200
6
W
EIG
HT
FOR
AG
EH
EIG
HT
FOR
AG
EW
EIG
HT
FOR
HEI
GH
TN
umbe
r of c
hild
ren
aged
0–
59 m
onth
sPe
rcen
t bel
owPe
rcen
t bel
owPe
rcen
t bel
owPe
rcen
t bel
owPe
rcen
t bel
owPe
rcen
t bel
owPe
rcen
t abo
ve
– 2
SD
*–
3 S
D–
2 S
D**
– 3
SD
– 2
SD
***
– 3
SD
+ 2
SD
Sex
Mal
e4.
30.
813
.44.
54.
41.
311
.12
200
Fem
ale
3.6
0.7
12.1
3.5
3.2
0.6
11.6
1 99
0
Obl
ast
Akm
ola
3.7
0.4
4.6
0.4
1.4
1.4
8.8
242
Akt
obe
5.7
1.0
23.5
8.6
1.7
0.6
15.6
171
Alm
aty
8.1
2.0
22.1
6.2
5.0
1.4
13.9
506
Aty
rau
2.2
0.0
14.2
3.9
4.4
0.4
10.7
134
Wes
t Kaz
akhs
tan
8.8
0.9
9.8
4.1
12.5
3.3
11.9
149
Zham
byl
2.1
0.0
9.5
1.5
1.3
0.2
7.6
337
Kara
gand
y 3.
21.
413
.32.
85.
81.
811
.329
6
Kost
anai
3.
90.
510
.82.
83.
40.
510
.825
4
Kyzy
lord
a 3.
91.
023
.311
.43.
70.
915
.618
7
Man
gist
au
2.7
0.5
14.4
4.1
9.3
2.0
11.0
102
Sout
h Ka
zakh
stan
2.
80.
310
.02.
52.
60.
710
.980
7
Pavl
odar
2.
10.
08.
83.
21.
40.
010
.919
0
Nor
th K
azak
hsta
n 2.
80.
06.
61.
70.
00.
08.
215
8
East
Kaz
akhs
tan
5.6
1.2
18.4
9.2
4.9
0.7
10.5
282
Ast
ana
City
3.5
0.6
11.6
4.1
4.7
0.6
14.0
84
Alm
aty
City
2.1
1.6
4.2
2.1
5.3
1.6
11.6
291
Resi
denc
e
Urb
an3.
00.
610
.73.
54.
41.
311
.02
126
Rura
l5.
11.
014
.94.
63.
20.
611
.72
064
* M
ICS
indi
cato
r 6; M
DG
indi
cato
r 4**
MIC
S in
dica
tor 7
**
* M
ICS
indi
cato
r 8

KAZAKHSTAN MULTIPLE INDICATOR CLUSTER SURVEY (MICS), 2006 75
Tab
le N
U.1
: Ch
ild m
aln
our
ish
men
t (co
nti
nue
d)
W
EIG
HT
FOR
AG
EH
EIG
HT
FOR
AG
EW
EIG
HT
FOR
HEI
GH
TN
umbe
r of c
hild
ren
aged
0–
59 m
onth
sPe
rcen
t bel
owPe
rcen
t bel
owPe
rcen
t bel
owPe
rcen
t bel
owPe
rcen
t bel
owPe
rcen
t bel
owPe
rcen
t abo
ve
– 2
SD
*–
3 S
D–
2 S
D**
– 3
SD
– 2
SD
***
– 3
SD
+ 2
SD
Age
< 6
mon
ths
3.3
1.2
5.8
2.1
6.7
2.5
12.7
361
6-11
mon
ths
3.5
0.7
8.2
3.4
5.1
0.6
16.5
433
12-2
3 m
onth
s4.
90.
716
.64.
73.
10.
716
.690
1
24-3
5 m
onth
s4.
40.
812
.54.
22.
70.
68.
989
1
36-4
7 m
onth
s2.
70.
413
.94.
33.
20.
98.
883
3
48-5
9 m
onth
s4.
51.
113
.43.
94.
41.
27.
277
1
Mot
her’
s ed
ucat
ion
Prim
ary/
inco
mpl
ete
seco
ndar
y5.
10.
815
.43.
03.
51.
39.
329
3
Seco
ndar
y 4.
81.
014
.85.
03.
80.
710
.71
893
Spec
ializ
ed s
econ
dary
3.9
0.4
11.8
3.5
3.2
1.1
11.5
988
Hig
her
2.4
0.8
9.3
3.0
4.5
1.3
12.8
1 01
6
Wea
lth
inde
x qu
inti
les
Poor
est
4.7
1.0
15.7
4.9
3.3
0.8
12.5
1 14
6
Poor
5.0
0.8
13.7
4.4
3.3
1.0
10.6
879
Mid
dle
4.5
0.5
13.8
4.5
4.1
0.8
11.0
821
Rich
4.1
1.4
9.9
3.2
4.9
1.4
12.0
668
Rich
est
0.8
0.1
8.4
2.2
4.0
1.2
9.9
676
Ethn
icit
y/la
ngua
ge
Kaza
kh4.
40.
914
.54.
94.
20.
912
.12
781
Russ
ian
2.8
0.7
7.9
1.7
3.6
1.1
8.5
878
Oth
er4.
00.
511
.73.
61.
81.
011
.953
1
Tota
l4.
00.
812
.84.
03.
81.
011
.34
190
* M
ICS
indi
cato
r 6; M
DG
indi
cato
r 4**
MIC
S in
dica
tor 7
**
* M
ICS
indi
cato
r 8

MONITORING THE SITUATION OF CHILDREN AND WOMEN76
Table NU.2: Initial breastfeedingPercentage of women aged 15-49 years with a birth in the two years preceding the survey who attached their baby to the breast within one hour of birth and within one day of birth, Kazakhstan, 2006
Percentage who started breastfeeding within one
hour of birth*
Percentage who started breastfeeding within one day
of birth
Number of women with a life birth in the two years preced-
ing the survey
OblastAkmola 49.3 77.3 80
Aktobe 31.5 92.3 68
Almaty 50.5 91.3 225
Atyrau 76.7 94.8 53
West Kazakhstan 65.7 91.0 58
Zhambyl 66.7 91.6 139
Karagandy 91.6 91.6 129
Kostanai 58.7 88.7 84
Kyzylorda 95.5 98.5 80
Mangistau (85.6) (93.1) 45
South Kazakhstan 75.4 84.2 309
Pavlodar 47.6 68.6 83
North Kazakhstan 36.6 85.6 61
East Kazakhstan 49.6 80.6 141
Astana City (82.1) (91.7) 40
Almaty City 63.1 94.0 124
ResidenceUrban 66.3 87.7 890
Rural 61.9 88.0 829
Months since birth< 6 months 62.6 87.3 379
6-11 months 67.5 87.5 449
12-23 months 63.3 88.3 891
Mother’s educationPrimary/incomplete secondary 56.1 84.3 112
Secondary 65.4 88.2 734
Specialized secondary 61.5 85.0 416
Higher 66.7 90.8 457
Wealth index quintilesPoorest 66.5 86.6 458
Poor 59.6 88.4 348
Middle 62.5 88.7 330
Rich 66.9 91.7 280
Richest 65.5 84.7 303
Ethnicity/languageKazakh 65.9 89.1 1 163
Russian 56.2 84.8 343
Other 68.0 85.7 213
Total 64.2 87.8 1 719
* MICS indicator 45( ) – indicators are based on 25-49 cases of unweighted observations
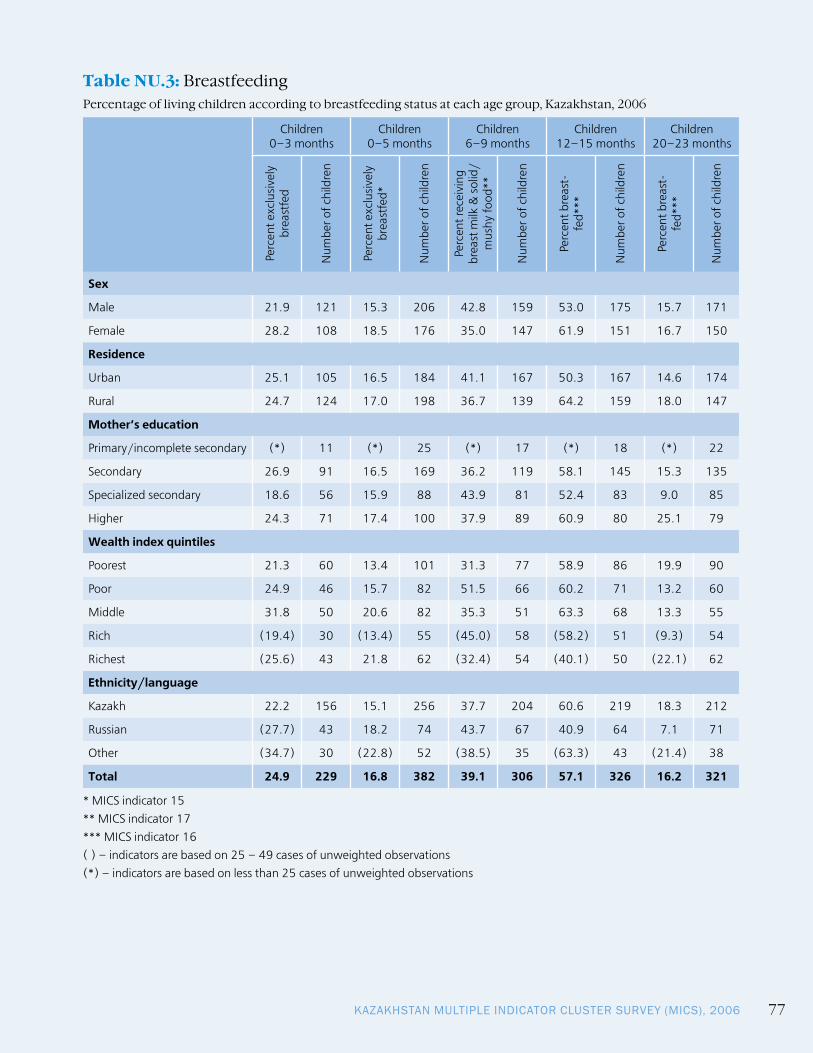
KAZAKHSTAN MULTIPLE INDICATOR CLUSTER SURVEY (MICS), 2006 77
Table NU.3: BreastfeedingPercentage of living children according to breastfeeding status at each age group, Kazakhstan, 2006
Children 0–3 months
Children 0–5 months
Children 6–9 months
Children 12–15 months
Children 20–23 months
Perc
ent e
xclu
sive
ly
brea
stfe
d
Num
ber o
f chi
ldre
n
Perc
ent e
xclu
sive
ly
brea
stfe
d*
Num
ber o
f chi
ldre
n
Perc
ent r
ecei
ving
br
east
milk
& s
olid
/ m
ushy
food
**
Num
ber o
f chi
ldre
n
Perc
ent b
reas
t-fe
d***
Num
ber o
f chi
ldre
n
Perc
ent b
reas
t-fe
d***
Num
ber o
f chi
ldre
n
Sex
Male 21.9 121 15.3 206 42.8 159 53.0 175 15.7 171
Female 28.2 108 18.5 176 35.0 147 61.9 151 16.7 150
Residence
Urban 25.1 105 16.5 184 41.1 167 50.3 167 14.6 174
Rural 24.7 124 17.0 198 36.7 139 64.2 159 18.0 147
Mother’s education
Primary/incomplete secondary (*) 11 (*) 25 (*) 17 (*) 18 (*) 22
Secondary 26.9 91 16.5 169 36.2 119 58.1 145 15.3 135
Specialized secondary 18.6 56 15.9 88 43.9 81 52.4 83 9.0 85
Higher 24.3 71 17.4 100 37.9 89 60.9 80 25.1 79
Wealth index quintiles
Poorest 21.3 60 13.4 101 31.3 77 58.9 86 19.9 90
Poor 24.9 46 15.7 82 51.5 66 60.2 71 13.2 60
Middle 31.8 50 20.6 82 35.3 51 63.3 68 13.3 55
Rich (19.4) 30 (13.4) 55 (45.0) 58 (58.2) 51 (9.3) 54
Richest (25.6) 43 21.8 62 (32.4) 54 (40.1) 50 (22.1) 62
Ethnicity/language
Kazakh 22.2 156 15.1 256 37.7 204 60.6 219 18.3 212
Russian (27.7) 43 18.2 74 43.7 67 40.9 64 7.1 71
Other (34.7) 30 (22.8) 52 (38.5) 35 (63.3) 43 (21.4) 38
Total 24.9 229 16.8 382 39.1 306 57.1 326 16.2 321
* MICS indicator 15** MICS indicator 17*** MICS indicator 16( ) – indicators are based on 25 – 49 cases of unweighted observations(*) – indicators are based on less than 25 cases of unweighted observations

MONITORING THE SITUATION OF CHILDREN AND WOMEN78
Table NU.4: Adequately fed infantsPercentage of infants under 6 months of age exclusively breastfed, percentage of infants 6-11 months who are breast-fed and who ate solid/semi-solid food at least the minimum recommended number of times yesterday and percent-age of infants adequately fed, Kazakhstan, 2006
PERCENT OF INFANTS
NUMBER OF INFANTS
0–11 MONTHS
0-5 months
exclusively breastfed
6-8 months who received
breast milk and comple-mentary food
at least 2 times in prior
24 hours
9-11 months who received
breast milk and comple-mentary food
at least 3 times in prior
24 hours
6-11 months who received
breast milk and complementary food at least the
minimum recom-mended number of times per day*
0-11 months
who were appropri-
ately fed**
Sex
Male 15.3 30.7 19.9 25.0 20.6 451
Female 18.5 26.6 19.4 22.9 20.9 392
Residence
Urban 16.5 30.3 16.7 23.1 20.3 427
Rural 17.0 27.1 23.0 25.0 21.2 416
Mother’s education
Primary/incomplete secondary (19.4) (44.4) (25.3) (35.8) (27.2) 48
Secondary 16.5 25.6 22.4 23.8 20.3 356
Specialized secondary 15.9 29.2 17.7 23.8 20.3 198
Higher 17.4 29.4 16.4 22.6 20.4 241
Wealth index quintiles
Poorest 13.4 24.8 23.4 24.0 19.3 229
Poor 15.7 34.8 20.2 27.0 21.9 180
Middle 20.6 22.6 17.2 19.9 20.3 160
Rich 13.4 28.4 15.3 22.5 18.6 129
Richest 21.8 34.3 18.6 25.7 24.0 145
Ethnicity/language
Kazakh 15.1 29.3 18.3 23.3 19.7 582
Russian 18.2 23.1 20.8 22.1 20.3 162
Other 22.8 36.5 28.8 33.0 27.6 99
Total 16.8 28.8 19.7 24.0 20.7 843
* MICS indicator 18** MICS indicator 19( ) – indicators are based on 25-49 cases of unweighted observations

KAZAKHSTAN MULTIPLE INDICATOR CLUSTER SURVEY (MICS), 2006 79
Table NU.5: Iodized salt consumptionPercentage of households consuming adequately iodized salt, Kazakhstan, 2006
Percent of
households in which salt was tested
Number of households interviewed
PERCENT OF HOUSEHOLDS WITH
TOTAL
Number of house-holds in which salt was tested or with no (iodized) salt
No saltSalt test result
< 15 PPM 15 and + PPM*
Oblast
Akmola 99.8 879 0.2 15.9 83.9 100.0 879
Aktobe 99.2 629 0.2 8.6 91.2 100.0 626
Almaty 98.4 1 352 0.1 0.2 99.7 100.0 1 332
Atyrau 100.0 334 0.0 13.0 87.0 100.0 334
West Kazakhstan 100.0 600 0.0 9.5 90.5 100.0 600
Zhambyl 97.9 834 0.6 8.2 91.2 100.0 821
Karagandy 99.4 1 614 0.6 9.9 89.5 100.0 1 614
Kostanai 99.7 1 170 0.2 1.5 98.3 100.0 1 168
Kyzylorda 100.0 409 0.0 5.4 94.6 100.0 409
Mangistau 99.8 273 0.1 0.4 99.5 100.0 273
South Kazakhstan 99.9 1 415 0.0 5.4 94.6 100.0 1 414
Pavlodar 99.7 911 0.1 31.6 68.3 100.0 909
North Kazakhstan 100.0 805 0.0 3.3 96.7 100.0 805
East Kazakhstan 100.0 1 652 0.0 7.2 92.8 100.0 1 652
Astana City 98.8 334 1.1 4.6 94.3 100.0 333
Almaty City 91.6 1 353 1.3 2.0 96.7 100.0 1 257
Residence
Urban 98.2 9 339 0.4 7.5 92.1 100.0 9 211
Rural 99.7 5 225 0.1 8.1 91.8 100.0 5 215
Wealth index quintiles
Poorest 99.6 2 208 0.2 9.1 90.7 100.0 2 204
Poor 99.5 2 554 0.2 7.7 92.1 100.0 2 545
Middle 99.2 2 751 0.2 6.5 93.3 100.0 2 735
Rich 98.3 3 560 0.3 7.2 92.5 100.0 3 510
Richest 97.8 3 491 0.5 8.4 91.1 100.0 3 432
Total 98.8 14 564 0.3 7.7 92.0 100.0 14 426
* MICS indicator 41

MONITORING THE SITUATION OF CHILDREN AND WOMEN80
Table NU.8: Low birth weight infantsPercentage of live births in the 2 years preceding the survey that weighed below 2500 grams at birth, Kazakhstan, 2006
PERCENT OF LIVE BIRTH:NUMBER OF LIVE BIRTH
Below 2500 grams* Weighted at birth**
Oblast
Akmola 4.8 100.0 80
Aktobe 4.4 96.8 68
Almaty 4.5 99.5 225
Atyrau 4.2 100.0 53
West Kazakhstan 4.6 100.0 58
Zhambyl 6.3 100.0 139
Karagandy 4.4 99.1 129
Kostanai 4.1 98.7 84
Kyzylorda 4.4 100.0 80
Mangistau (4.0) (98.0) 45
South Kazakhstan 4.6 99.6 309
Pavlodar 19.4 100.0 83
North Kazakhstan 7.7 98.6 61
East Kazakhstan 6.9 99.1 141
Astana City (6.4) (100.0) 40
Almaty City 5.8 98.8 124
Residence
Urban 6.2 99.6 890
Rural 5.4 99.1 829
Mother’s education
Primary/incomplete secondary 7.2 98.0 112
Secondary 5.4 99.2 734
Specialized secondary 6.9 99.5 416
Higher 5.1 99.9 457
Wealth index quintiles
Poorest 5.0 99.3 458
Poor 6.0 99.3 348
Middle 5.4 99.4 330
Rich 7.4 99.0 280
Richest 5.8 99.9 303
Ethnicity/language
Kazakh 5.7 99.5 1 163
Russian 5.2 99.4 343
Other 7.0 98.2 213
Total 5.8 99.4 1 719
* MICS indicator 9** MICS indicator 10( ) – indicators are based on 25-49 cases of unweighted observations

KAZAKHSTAN MULTIPLE INDICATOR CLUSTER SURVEY (MICS), 2006 81
Table CH.1: Vaccinations in first year of lifePercentage of children aged 15-26 months immunized against childhood diseases at any time before the survey and before the first birthday (15 months for Measles), Kazakhstan, 2006
PERCENTAGE OF CHILDREN WHO RECEIVED
Num
ber o
f ch
ildre
n15-
26
mon
ths
BCG
*
DPT
1
DPT
2
DPT
3**
Polio
0
Polio
1
Polio
2
Polio
3***
Mea
sles
****
All*
****
Non
e
Vaccinated at any time before the survey According to:
Vaccination card 95.1 95.5 95.7 95.7 95.2 95.2 95.3 95.3 95.6 95.4 0.0 991
Mother’s report 4.5 4.0 3.7 2.4 3.0 4.3 3.3 1.4 3.8 0.8 0.4 991
Either 99.6 99.4 99.3 98.0 98.2 99.5 98.6 96.7 99.4 96.2 0.4 991
Vaccinated by 12 months of age 97.9 97.9 96.7 91.7 97.6 99.0 96.9 93.9 94.7 81.0 0.4 991
* MICS Indicator 25** MICS Indicator 27*** MICS Indicator 26**** MICS Indicator 28; MTG Indicator 15***** MICS Indicator 31
Table CH.1C: Vaccinations in first year of life (continued)Percentage of children aged 15-26 months immunized against childhood diseases at any time before the survey and before the first birthday, Kazakhstan, 2006
PERCENTAGE OF CHILDREN WHO RECEIVED: Number of children aged 15-26 monthsHep !1 Hep !2 Hep !3*
Vaccinated at any time before the survey According to:
Vaccination card 95.1 95.1 95.1 991
Mother’s report 0.0 0.0 0.0 991
Either 95.1 95.1 95.1 991
Vaccinated by 12 months of age 94.3 94.4 92.3 991
* MICS indicator 29

MONITORING THE SITUATION OF CHILDREN AND WOMEN82
Tab
le C
H.2
: Vac
cin
atio
ns
by
bac
kgro
und
ch
arac
teri
stic
sPe
rcen
tage
of c
hild
ren
age
d 1
5-26
mo
nth
s cu
rren
tly
vacc
inat
ed a
gain
st c
hild
ho
od
dis
ease
s, K
azak
hst
an, 2
006
PE
RCEN
TAG
E O
F CH
ILD
REN
WH
O R
ECEI
VED
Perc
ent
with
vac
-ci
natio
n ca
rd
Num
ber
of c
hil-
dren
age
d 15
-26
mon
ths
BCG
DPT
1D
PT2
DPT
3Po
lio0
Polio
1Po
lio2
Polio
3M
easl
esA
llN
one
Sex
Mal
e99
.899
.899
.898
.898
.699
.898
.597
.299
.696
.40.
295
.552
3
Fem
ale
99.5
99.1
98.8
97.2
97.8
99.2
98.7
96.2
99.2
96.0
0.5
94.7
468
Obl
ast
Akm
ola
(100
.0)
(100
.0)
(100
.0)
(100
.0)
(100
.0)
(100
.0)
(96.
7)(9
6.7)
(100
.0)
(96.
7)(0
.0)
(96.
7)38
Akt
obe
(100
.0)
(100
.0)
(100
.0)
(100
.0)
(100
.0)
(100
.0)
(100
.0)
(100
.0)
(100
.0)
(100
.0)
(0.0
)(1
00.0
)43
Alm
aty
99.0
98.9
97.9
88.2
91.6
97.9
91.6
84.3
97.9
82.0
1.0
75.1
119
Aty
rau
(100
.0)
(100
.0)
(100
.0)
(100
.0)
(100
.0)
(100
.0)
(100
.0)
(100
.0)
(100
.0)
(100
.0)
(0.0
)(1
00.0
)26
Wes
t Kaz
akhs
tan
(97.
8)(9
7.8)
(97.
8)(9
7.8)
(92.
5)(9
7.8)
(97.
8)(9
7.8)
(94.
7)(9
4.6)
(2.2
)(9
2.5)
31
Zham
byl
100.
010
0.0
100.
010
0.0
100.
010
0.0
100.
010
0.0
100.
010
0.0
0.0
100.
078
Kara
gand
y 97
.797
.797
.797
.797
.797
.797
.797
.797
.797
.72.
397
.779
Kost
anai
10
0.0
100.
010
0.0
100.
010
0.0
100.
010
0.0
100.
010
0.0
100.
00.
010
0.0
54
Kyzy
lord
a (1
00.0
)(1
00.0
)(1
00.0
)(1
00.0
)(1
00.0
)(1
00.0
)(1
00.0
)(1
00.0
)(1
00.0
)(1
00.0
)(0
.0)
(100
.0)
44
Man
gist
au
(100
.0)
(100
.0)
(100
.0)
(100
.0)
(100
.0)
(100
.0)
(100
.0)
(100
.0)
(100
.0)
(100
.0)
(0.0
)(1
00.0
)26
Sout
h Ka
zakh
stan
10
0.0
99.0
99.0
99.0
98.1
100.
010
0.0
99.0
100.
099
.00.
098
.118
4
Pavl
odar
(1
00.0
)(1
00.0
)(1
00.0
)(1
00.0
)(1
00.0
)(1
00.0
)(1
00.0
)(1
00.0
)(1
00.0
)(1
00.0
)(0
.0)
(100
.0)
47
Nor
th K
azak
hsta
n (1
00.0
)(1
00.0
)(1
00.0
)(1
00.0
)(1
00.0
)(1
00.0
)(1
00.0
)(1
00.0
)(1
00.0
)(1
00.0
)(0
.0)
(100
.0)
28
East
Kaz
akhs
tan
100.
010
0.0
100.
010
0.0
100.
010
0.0
100.
094
.810
0.0
94.8
0.0
94.8
87
Ast
ana
City
(*)
(*)
(*)
(*)
(*)
(*)
(*)
(*)
(*)
(*)
(*)
(*)
19
Alm
aty
City
100.
010
0.0
100.
010
0.0
100.
010
0.0
100.
010
0.0
100.
010
0.0
0.0
100.
088
( )
– in
dica
tors
are
bas
ed o
n 25
-49
cas
es o
f unw
eigh
ted
obse
rvat
ions
(*)
– in
dica
tors
are
bas
ed o
n le
ss th
an 2
5 ca
ses
of u
nwei
ghte
d ob
serv
atio
ns

KAZAKHSTAN MULTIPLE INDICATOR CLUSTER SURVEY (MICS), 2006 83
Tab
le C
H.2
: Vac
cin
atio
ns
by
bac
kgro
und
ch
arac
teri
stic
s (c
on
tin
ued
)
PE
RCEN
TAG
E O
F CH
ILD
REN
WH
O R
ECEI
VED
Perc
ent
with
vac
-ci
natio
n ca
rd
Num
ber
of c
hild
ren
aged
15
-26
mon
ths
BCG
DPT
1D
PT2
DPT
3Po
lio0
Polio
1Po
lio2
Polio
3M
easl
esA
llN
one
Resi
denc
e
Urb
an99
.699
.399
.399
.098
.899
.699
.397
.999
.597
.40.
497
.150
9
Rura
l99
.699
.699
.397
.097
.799
.397
.895
.599
.394
.90.
493
.048
2
Mot
her’
s ed
ucat
ion
Prim
ary/
inco
mpl
ete
seco
ndar
y10
0.0
100.
010
0.0
100.
010
0.0
100.
098
.294
.510
0.0
94.5
0.0
92.8
69
Seco
ndar
y 99
.499
.499
.197
.497
.399
.198
.596
.999
.196
.30.
694
.842
7
Spec
ializ
ed s
econ
dary
99.5
99.5
99.5
98.5
98.7
99.5
98.0
95.9
99.5
95.9
0.5
95.1
248
Hig
her
100.
099
.399
.398
.298
.910
0.0
99.3
97.8
99.6
96.8
0.0
96.3
247
Wea
lth
inde
x qu
inti
les
Poor
est
100.
010
0.0
99.5
98.6
98.4
99.5
99.1
97.7
100.
097
.70.
095
.727
0
Poor
99.6
99.6
99.6
97.6
98.6
99.6
97.6
96.2
99.6
95.5
0.4
95.2
182
Mid
dle
99.4
99.4
99.4
97.2
96.9
99.4
98.1
96.3
98.7
95.4
0.6
92.9
198
Rich
100.
098
.998
.998
.298
.310
0.0
100.
096
.399
.495
.70.
095
.716
3
Rich
est
99.0
99.0
99.0
98.4
99.0
99.0
98.0
96.7
99.0
96.1
1.0
96.1
178
Ethn
icit
y/la
ngua
ge
Kaza
kh99
.799
.599
.398
.198
.499
.598
.496
.899
.596
.30.
395
.567
6
Russ
ian
99.1
99.1
99.1
98.6
99.1
99.1
99.1
97.7
99.1
97.3
0.9
97.3
201
Oth
er10
0.0
100.
010
0.0
96.8
95.5
100.
098
.994
.699
.293
.80.
089
.011
4
Tota
l99
.699
.499
.398
.098
.299
.598
.696
.799
.496
.20.
495
.199
1
( )
– in
dica
tors
are
bas
ed o
n 25
– 4
9 ca
ses
of u
nwei
ghte
d ob
serv
atio
ns(*
) –
indi
cato
rs a
re b
ased
on
less
than
25
case
s of
unw
eigh
ted
obse
rvat
ions

MONITORING THE SITUATION OF CHILDREN AND WOMEN84
Table CH.2C: Vaccinations by background characteristics (continued) Percentage of children aged 15-26 months currently vaccinated against childhood diseases, Kazakhstan, 2006
PERCENTAGE OF CHILDREN WHO RECEIVED: Percent with vac-cination card
Number of chil-dren aged
15-26 monthsHep !1 Hep !2 Hep !3
Sex
Male 95.5 95.5 95.5 95.5 523
Female 94.7 94.7 94.7 94.7 468
Oblast
Akmola (96.7) (96.7) (96.7) (96.7) 38
Aktobe (100.0) (100.0) (100.0) (100.0) 43
Almaty 75.1 75.1 75.1 75.1 119
Atyrau (100.0) (100.0) (100.0) (100.0) 26
West Kazakhstan (92.5) (92.5) (92.5) (92.5) 31
Zhambyl 100.0 100.0 100.0 100.0 78
Karagandy 97.7 97.7 97.7 97.7 79
Kostanai 100.0 100.0 100.0 100.0 54
Kyzylorda (100.0) (100.0) (100.0) (100.0) 44
Mangistau (100.0) (100.0) (100.0) (100.0) 26
South Kazakhstan 98.1 98.1 98.1 98.1 184
Pavlodar (100.0) (100.0) (100.0) (100.0) 47
North Kazakhstan (100.0) (100.0) (100.0) (100.0) 28
East Kazakhstan 94.8 94.8 94.8 94.8 87
Astana City (*) (*) (*) (*) 19
Almaty City 100.0 100.0 100.0 100.0 88
Residence
Urban 97.1 97.1 97.1 97.1 509
Rural 93.0 93.0 93.0 93.0 482
Mother’s education
Primary/incomplete secondary 92.8 92.8 92.8 92.8 69
Secondary 94.8 94.8 94.8 94.8 427
Specialized secondary 95.1 95.1 95.1 95.1 248
Higher 96.3 96.3 96.3 96.3 247
Wealth index quintiles
Poorest 95.7 95.7 95.7 95.7 270
Poor 95.2 95.2 95.2 95.2 182
Middle 92.9 92.9 92.9 92.9 198
Rich 95.7 95.7 95.7 95.7 163
Richest 96.1 96.1 96.1 96.1 178
Ethnicity/language
Kazakh 95.5 95.5 95.5 95.5 676
Russian 97.3 97.3 97.3 97.3 201
Other 89.0 89.0 89.0 89.0 114
Total 95.1 95.1 95.1 95.1 991
( ) – indicators are based on 25 – 49 cases of unweighted observations(*) – indicators are based on less than 25 cases of unweighted observations

KAZAKHSTAN MULTIPLE INDICATOR CLUSTER SURVEY (MICS), 2006 85
Table CH.4: Oral rehydration treatmentPercentage of children aged 0-59 months with diarrhoea in the last two weeks and treatment with oral rehydration solution (ORS) or other oral rehydration treatment (ORT), Kazakhstan, 2006
Had
dia
rrho
ea in
la
st tw
o w
eeks
Num
ber o
f chi
l-dr
en a
ged
0-
59 m
onth
s
Children with diarrhoea who received:
Ort
use
rate
*
Num
ber o
f chi
l-dr
en a
ged
0–59
m
onth
s w
ith d
iar-
rhoe
a
Flui
d fr
om O
RS
pack
et
Reco
mm
ende
d ho
mem
ade
fluid
Pre-
pack
aged
O
RS fl
uid
No
trea
tmen
t
Sex
Male 2.1 2 327 (73.1) (23.9) (21.3) (25.6) (74.4) 49
Female 1.5 2 088 (73.5) (8.6) (8.6) (26.5) (73.5) 31
Residence
Urban 2.0 2 251 (67.7) (12.3) (13.7) (30.9) (69.1) 45
Rural 1.6 2 164 (80.4) (25.1) (19.8) (19.6) (80.4) 35
Age
< 6 months 2.5 382 (*) (*) (*) (*) (*) 10
6–11 months 2.5 462 (*) (*) (*) (*) (*) 11
12–23 months 3.0 969 (78.0) (12.7) (14.2) (19.8) (80.2) 29
24–35 months 1.1 948 (*) (*) (*) (*) (*) 11
36–47 months 0.4 858 (*) (*) (*) (*) (*) 3
48–59 months 2.0 796 (*) (*) (*) (*) (*) 16
Mother’s education
Primary/incomplete secondary 3.5 309 (*) (*) (*) (*) (*) 11
Secondary 1.6 2 000 (70.5) (19.9) (19.0) (27.5) (72.5) 32
Specialized secondary 1.8 1 030 (*) (*) (*) (*) (*) 19
Higher 1.7 1 076 (*) (*) (*) (*) (*) 18
Wealth index quintiles
Poorest 1.1 1 189 (*) (*) (*) (*) (*) 13
Poor 2.2 924 (*) (*) (*) (*) (*) 20
Middle 1.3 869 (*) (*) (*) (*) (*) 11
Rich 2.8 708 (*) (*) (*) (*) (*) 20
Richest 2.2 725 (*) (*) (*) (*) (*) 16
Ethnicity/language
Kazakh 1.5 2 924 (79.6) (18.7) (20.0) (18.9) (81.1) 44
Russian 3.3 931 (*) (*) (*) (*) (*) 30
Other 1.0 560 (*) (*) (*) (*) (*) 6
Total 1.8 4 415 73.3 17.9 16.4 26.0 74.0 80
* MICS indicator 33( ) – indicators are based on 25-49 cases of unweighted observations(*) – indicators are based on less than 25 cases of unweighted observations

MONITORING THE SITUATION OF CHILDREN AND WOMEN86
Table CH.5: Home management of diarrhoeaPercentage of children aged 0-59 months with diarrhoea in the last two weeks who took increased fluids and contin-ued to feed during the episode, Kazakhstan, 2006
Had
dia
rrho
ea in
last
tw
o w
eeks
Num
ber o
f chi
ldre
n ag
ed 0
-59
mon
ths Children with diarrhoea who received:
Hom
e m
anag
emen
t of
dia
rrho
ea*
Rece
ived
ort
or
incr
ease
d flu
ids
and
cont
inue
d fe
edin
g**
Num
ber o
f chi
ldre
n ag
ed 0
-59
mon
ths
with
dia
rrho
ea
Dra
nk m
ore
Dra
nk th
e sa
me
or le
ss
Ate
som
ewha
t le
ss, s
ame
or
mor
e
Ate
muc
h le
ss o
r no
ne
Sex
Male 2.1 2 327 (49.2) (50.8) (57.5) (42.5) (20.0) (47.8) 49
Female 1.5 2 088 (39.2) (56.3) (61.2) (38.8) (24.6) (48.4) 31
Residence
Urban 2.0 2 251 (46.0) (50.8) (51.4) (48.6) (19.8) (42.2) 45
Rural 1.6 2 164 (44.3) (55.7) (68.6) (31.4) (24.3) (55.5) 35
Age
0–11 months 2.5 843 (*) (*) (*) (*) (*) (*) 21
12–23 months 3.0 969 (39.5) (60.5) (57.1) (42.9) (27.5) (48.3) 29
24–35 months 1.1 948 (*) (*) (*) (*) (*) (*) 11
36–47 months 0.4 858 (*) (*) (*) (*) (*) (*) 3
48–59 months 2.0 796 (*) (*) (*) (*) (*) (*) 16
Mother’s education
Primary/incomplete secondary 3.5 309 (*) (*) (*) (*) (*) (*) 11
Secondary 1.6 2 000 (44.6) (51.1) (58.6) (41.4) (18.8) (52.3) 32
Specialized secondary 1.8 1 030 (*) (*) (*) (*) (*) (*) 19
Higher 1.7 1 076 (*) (*) (*) (*) (*) (*) 18
Wealth index quintiles
Poorest 1.1 1 189 (*) (*) (*) (*) (*) (*) 13
Poor 2.2 924 (*) (*) (*) (*) (*) (*) 20
Middle 1.3 869 (*) (*) (*) (*) (*) (*) 11
Rich 2.8 708 (*) (*) (*) (*) (*) (*) 20
Richest 2.2 725 (*) (*) (*) (*) (*) (*) 16
Ethnicity/language
Kazakh 1.5 2 924 (47.3) (52.7) (58.9) (41.1) (23.5) (46.9) 44
Russian 3.3 931 (*) (*) (*) (*) (*) (*) 30
Other 1.0 560 (*) (*) (*) (*) (*) (*) 6
Total 1.8 4 415 45.3 53.0 58.9 41.1 21.8 48.0 80
* MICS indicator 34** MICS indicator 35( ) – indicators are based on 25-49 cases of unweighted observations(*) – indicators are based on less than 25 cases of unweighted observations

KAZAKHSTAN MULTIPLE INDICATOR CLUSTER SURVEY (MICS), 2006 87
Table CH.6: Care seeking for suspected pneumoniaPercentage of children aged 0-59 months with suspected pneumonia in the last two weeks taken to a health pro-vider, Kazakhstan, 2006
Had
acu
te re
spira
tory
in
fect
ion
Num
ber o
f chi
ldre
n ag
ed 0
–59
mon
ths
CHILDREN WITH SUSPECTED PNEUMONIA WHO WERE TAKEN TO:
Public health facilities Private health
facilitiesOther
Any
app
ropr
iate
pr
ovid
er*
Num
ber o
f chi
ldre
n ag
ed 0
–59
mon
ths
with
sus
pect
ed
pneu
mon
ia
Gov
t. H
ospi
tal
Gov
t. he
alth
ce
ntre
Gov
t. he
alth
po
st
Villa
ge h
ealth
w
orke
r
Mob
ile/
out-
reac
h cl
inic
Other private health
facilities
Relative or
friend
Sex
Male 1.8 2 327 (23.7) (5.9) (37.7) (3.2) (4.9) (0.0) (1.5) (73.3) 42
Female 1.2 2 088 (9.4) (0.0) (49.4) (0.0) (1.4) (7.2) (0.0) (65.9) 25
Residence
Urban 1.8 2 251 (18.2) (0.0) (49.0) (0.0) (0.0) (4.5) (0.0) (71.7) 40
Rural 1.2 2 164 (18.5) (9.2) (31.9) (4.9) (8.9) (0.0) (2.3) (68.8) 27
Age
0–11 months 1.8 844 (*) (*) (*) (*) (*) (*) (*) (*) 15
12–23 months 1.2 969 (*) (*) (*) (*) (*) (*) (*) (*) 12
24–35 months 1.1 948 (*) (*) (*) (*) (*) (*) (*) (*) 11
36–47 months 2.1 858 (*) (*) (*) (*) (*) (*) (*) (*) 18
48–59 months 1.4 796 (*) (*) (*) (*) (*) (*) (*) (*) 11
Mother’s education
Primary/incomplete secondary 2.9 309 (*) (*) (*) (*) (*) (*) (*) (*) 9
Secondary 1.2 2 000 (11.8) (5.5) (52.5) (2.7) (6.4) (0.0) (2.6) (73.7) 24
Specialized secondary 2.1 1 030 (*) (*) (*) (*) (*) (*) (*) (*) 22
Higher 1.1 1 076 (*) (*) (*) (*) (*) (*) (*) (*) 12
Wealth index quintiles
Poorest 0.8 1 189 (*) (*) (*) (*) (*) (*) (*) (*) 9
Poor 1.6 924 (*) (*) (*) (*) (*) (*) (*) (*) 15
Middle 1.4 869 (*) (*) (*) (*) (*) (*) (*) (*) 12
Rich 2.0 708 (*) (*) (*) (*) (*) (*) (*) (*) 14
Richest 2.3 725 (*) (*) (*) (*) (*) (*) (*) (*) 17
Ethnicity/language
Kazakh 1.3 2 924 (16.5) (6.4) (51.8) (1.6) (0.9) (0.0) (1.6) (74.0) 39
Russian 2.4 931 (*) (*) (*) (*) (*) (*) (*) (*) 22
Other 1.1 560 (*) (*) (*) (*) (*) (*) (*) (*) 6
Total 1.5 4 415 18.3 3.7 42.1 2.0 3.6 2.7 0.9 70.5 67
* MICS indicator 23( ) – indicators are based on 25 – 49 cases of unweighted observations(*) – indicators are based on less than 25 cases of unweighted observations

MONITORING THE SITUATION OF CHILDREN AND WOMEN88
Table CH.7: Antibiotic treatment of pneumoniaPercentage of children aged 0-59 months with suspected pneumonia who received antibiotic treatment, Kazakhstan, 2006
PERCENTAGE OF UNDER FIVES WITH SUSPECTED PNEUMONIA WHO
RECEIVED ANTIBIOTICS IN THE LAST TWO WEEKS*
NUMBER OF CHILDREN AGED 0-59 MONTHS WITH SUSPECTED
PNEUMONIA IN THE TWO WEEKS PRIOR TO THE SURVEY
Sex
Male (25.5) 42
Female (41.9) 25
Residence
Urban (32.3) 40
Rural (30.8) 27
Age
0–11 months (*) 15
12–23 months (*) 12
24–35 months (*) 11
36–47 months (*) 18
48–59 months (*) 11
Mother’s education
Primary/incomplete secondary (*) 9
Secondary (41.8) 24
Specialized secondary (*) 22
Higher (*) 12
Wealth index quintiles
Poorest (*) 9
Poor (*) 15
Middle (*) 12
Rich (*) 14
Richest (*) 17
Ethnicity/language
Kazakh (30.8) 39
Russian (*) 22
Other (*) 6
Total 31.7 67
* MICS indicator 22( ) – indicators are based on 25 – 49 cases of unweighted observations(*) – indicators are based on less than 25 cases of unweighted observations

KAZAKHSTAN MULTIPLE INDICATOR CLUSTER SURVEY (MICS), 2006 89
Table CH.7A: Knowledge of the two danger signs of pneumoniaPercentage of mothers/caretakers of children aged 0-59 months by knowledge of types of symptoms for taking a child immediately to a health facility, and percentage of mothers/caretakers who recognize fast and difficult breath-ing as signs for seeking care immediately, Kazakhstan, 2006
Percentage of mothers/caretakers of children aged 0-59 months who think that a child should be taken immediately to a health facil-
ity if the child:
Mot
hers
/car
etak
ers
who
reco
gniz
e th
e tw
o da
nger
sig
ns o
f pn
eum
onia
Num
ber o
f mot
hers
/ca
reta
kers
of c
hild
ren
aged
0-5
9 m
onth
s
Is n
ot a
ble
to d
rink
or
brea
stfe
ed
Beco
mes
si
cker
Dev
elop
s a
feve
r
Has
fast
br
eath
ing
Has
diffi
cult
brea
thin
g
Has
blo
od in
st
ool
Is d
rinki
ng
poor
ly
Has
oth
er
sym
ptom
s
OblastAkmola 23.6 51.1 92.0 45.9 50.7 47.5 11.2 14.5 40.3 243
Aktobe 36.7 63.5 73.6 77.4 74.5 72.6 8.7 5.3 60.0 181
Almaty 16.1 42.0 93.4 18.0 32.7 21.4 2.5 0.3 10.6 545
Atyrau 54.4 57.6 93.3 52.2 70.0 75.8 33.8 8.7 44.8 143
West Kazakhstan 35.6 42.2 80.7 39.6 51.3 50.8 3.3 23.2 24.9 152
Zhambyl 17.5 46.9 93.0 37.7 47.6 30.4 6.8 15.0 27.1 345
Karagandy 40.3 52.0 92.8 59.5 61.4 58.2 19.7 26.5 45.6 316
Kostanai 28.1 41.6 86.9 41.4 65.9 57.2 7.1 0.0 30.5 267
Kyzylorda 35.7 55.1 69.4 19.7 36.2 28.4 3.9 2.2 8.7 209
Mangistau 54.9 68.2 93.3 96.7 95.0 93.9 77.4 0.0 93.4 109
South Kazakhstan 5.6 66.5 91.4 41.6 56.7 32.9 1.6 7.8 17.6 827
Pavlodar 55.4 74.5 87.8 75.7 84.4 84.7 34.6 28.1 71.4 197
North Kazakhstan 43.0 58.4 78.7 60.6 77.8 72.1 16.4 25.5 52.6 163
East Kazakhstan 20.0 45.4 91.8 46.5 51.3 41.8 2.6 5.3 28.1 304
Astana City 35.7 48.1 81.6 54.6 47.0 52.4 18.4 24.9 38.9 90
Almaty City 17.1 72.5 96.7 40.3 60.2 43.1 18.5 1.9 31.3 324
ResidenceUrban 27.3 56.8 89.0 47.7 61.0 52.6 16.3 11.5 36.3 2 251
Rural 23.1 54.1 89.5 41.6 51.3 38.8 6.2 8.4 26.9 2 164
Mother’s educationPrimary/incomplete secondary 20.1 47.6 89.2 49.6 59.3 44.4 10.7 11.7 31.1 309
Secondary 23.2 56.9 88.2 42.7 53.9 43.0 8.9 8.8 29.1 2 000
Specialized secondary 28.9 54.6 90.8 44.3 55.5 48.8 13.1 11.1 33.9 1 030
Higher 27.1 55.8 89.5 47.4 60.4 48.7 14.3 10.6 34.5 1 076
Wealth index quintilesPoorest 19.2 59.3 88.8 37.3 51.1 36.3 4.1 7.7 22.0 1 189
Poor 23.3 49.5 88.2 42.6 48.6 39.3 8.6 7.7 27.1 924
Middle 27.8 53.3 90.3 46.1 57.7 46.1 13.1 9.8 33.7 869
Rich 28.5 56.4 89.8 50.5 62.0 53.3 12.8 15.5 39.5 708
Richest 31.5 58.5 89.3 52.2 67.0 62.3 23.0 11.3 43.4 725
Ethnicity/languageKazakh 25.8 55.6 89.0 44.2 55.2 44.2 11.4 9.3 30.9 2 924
Russian 29.3 55.3 89.2 49.7 62.5 57.6 13.2 14.3 39.5 931
Other 15.4 55.3 90.1 38.6 51.5 35.0 7.8 6.1 22.7 560
Total 25.2 55.5 89.2 44.7 56.2 45.8 11.3 10.0 31.7 4 415

MONITORING THE SITUATION OF CHILDREN AND WOMEN90
Table CH.8: Solid fuel usePercent distribution of households according to type of cooking fuel and percentage of households using solid fuels for cooking, Kazakhstan, 2006
PERCENTAGE OF HOUSEHOLDS USING:
Solid
fuel
s fo
r coo
king
*
Num
ber o
f ho
useh
olds
Elec
tric
ity
Liqu
ified
ga
z/pr
o-pa
ne
Nat
ural
ga
s
Kero
sene
Coal
Char
coal
Woo
d
Ani
mal
du
ng
Tota
l
Oblast
Akmola 5.2 76.0 0.1 0.0 14.6 0.5 3.4 0.2 100.0 18.7 879
Aktobe 0.4 7.4 65.6 0.1 17.1 0.0 2.4 7.0 100.0 26.5 629
Almaty 0.5 74.8 7.2 0.3 14.7 0.2 2.3 0.0 100.0 17.2 1 352
Atyrau 0.0 19.9 73.0 0.1 0.5 0.0 0.0 6.5 100.0 7.0 334
West Kazakhstan 0.3 11.7 61.3 0.0 1.8 0.1 10.2 14.7 100.0 26.7 600
Zhambyl 1.1 18.5 50.2 0.0 24.7 0.3 4.9 0.4 100.0 30.3 834
Karagandy 40.6 42.6 0.0 0.0 16.7 0.1 0.0 0.0 100.0 16.8 1 614
Kostanai 3.9 38.9 43.6 0.0 11.8 0.3 1.2 0.3 100.0 13.6 1 170
Kyzylorda 0.9 44.0 15.3 0.0 14.1 1.6 24.1 0.0 100.0 39.8 409
Mangistau 0.2 6.5 93.3 0.0 0.0 0.0 0.0 0.0 100.0 0.0 273
South Kazakhstan 0.1 22.5 36.7 0.1 36.6 0.4 3.0 0.6 100.0 40.7 1 415
Pavlodar 64.1 27.8 0.0 0.0 7.2 0.3 0.6 0.0 100.0 8.2 911
North Kazakhstan 4.5 90.9 0.1 0.0 1.9 0.0 2.4 0.0 100.0 4.4 805
East Kazakhstan 33.6 35.9 0.7 0.0 25.2 0.1 3.5 1.0 100.0 29.8 1 652
Astana City 8.4 91.5 0.1 0.0 0.0 0.0 0.0 0.0 100.0 0.0 334
Almaty City 4.1 23.5 72.4 0.0 0.0 0.0 0.0 0.0 100.0 0.0 1 353
Residence
Urban 20.5 36.5 36.1 0.0 6.2 0.1 0.6 0.0 100.0 6.8 9 339
Rural 2.2 47.2 9.8 0.0 29.8 0.4 7.0 3.6 100.0 40.8 5 225
Education of household head
Primary/incomplete secondary 13.1 42.8 17.6 0.1 20.6 0.3 4.1 1.4 100.0 26.4 2 407
Secondary 11.0 41.5 20.9 0.1 19.5 0.3 4.4 2.3 100.0 26.5 5 224
Specialized secondary 16.8 41.7 29.4 0.0 9.8 0.1 1.5 0.7 100.0 12.1 3 744
Higher 16.4 35.0 40.8 0.0 6.7 0.1 0.7 0.3 100.0 7.8 3 048
Wealth index quintiles
Poorest 0.2 27.0 3.2 0.2 48.2 0.9 13.3 7.0 100.0 69.4 2 208
Poor 1.8 56.0 11.4 0.1 25.5 0.4 3.8 1.0 100.0 30.8 2 554
Middle 4.8 59.2 21.6 0.1 13.2 0.1 0.8 0.2 100.0 14.4 2 751
Rich 21.0 42.5 34.9 0.0 1.5 0.0 0.1 0.0 100.0 1.6 3 560
Richest 31.5 20.3 48.2 0.0 0.0 0.0 0.0 0.0 100.0 0.0 3 491
Ethnicity/language
Kazakh 10.2 35.9 26.4 0.0 20.2 0.4 4.3 2.6 100.0 27.4 7 145
Russian 19.9 44.3 26.4 0.0 8.0 0.0 1.4 0.0 100.0 9.4 6 007
Other 7.6 46.0 28.9 0.1 15.3 0.1 1.8 0.2 100.0 17.4 1 412
Total 14.0 40.3 26.6 0.0 14.7 0.2 2.9 1.3 100.0 19.0 14 564
* MICS indicator 24; MDG indicator 29

KAZAKHSTAN MULTIPLE INDICATOR CLUSTER SURVEY (MICS), 2006 91
Table CH.9: Solid fuel use by type of stove or firePercentage of households using solid fuels for cooking by type of stove or fire, Kazakhstan, 2006
Percentage of households using solid fuels for cooking:
Total
Number of house-
holds using solid fuels for
cooking
Closed stove with chim-
ney
Open stove or fire with chimney or
hood
Open stove or fire with no chimney or
hood
Other stove
Oblast
Akmola 99.3 0.7 0.0 0.0 100.0 164
Aktobe 30.2 69.8 0.0 0.0 100.0 167
Almaty 84.6 14.4 1.0 0.0 100.0 233
Atyrau (*) (*) (*) (*) 100.0 23
West Kazakhstan 98.0 2.0 0.0 0.0 100.0 160
Zhambyl 99.5 0.5 0.0 0.0 100.0 253
Karagandy 3.4 94.2 2.4 0.0 100.0 271
Kostanai 98.6 0.7 0.0 0.7 100.0 159
Kyzylorda 99.8 0.0 0.0 0.2 100.0 163
South Kazakhstan 96.9 3.1 0.0 0.0 100.0 575
Pavlodar 98.9 1.1 0.0 0.0 100.0 74
North Kazakhstan (100.0) (0.0) (0.0) (0.0) (100.0) 35
East Kazakhstan 98.0 1.4 0.6 0.0 100.0 492
Residence
Urban 79.5 19.7 0.8 0.0 100.0 638
Rural 85.0 14.6 0.3 0.1 100.0 2 131
Education of household head
Primary/incomplete secondary 85.2 14.8 0.0 0.0 100.0 635
Secondary 83.3 16.2 0.4 0.1 100.0 1 382
Specialized secondary 82.7 16.0 1.3 0.0 100.0 454
Higher 84.5 15.0 0.5 0.0 100.0 239
None/DK (*) (*) (*) (*) 100.0 1
Wealth index quintiles
Poorest 89.7 10.1 0.1 0.1 100.0 1 532
Poor 81.6 17.8 0.6 0.0 100.0 786
Middle 69.3 29.8 0.9 0.0 100.0 395
Rich 51.9 46.2 1.9 0.0 100.0 56
Ethnicity/language
Kazakh 84.0 15.6 0.3 0.1 100.0 1 959
Russian 80.8 18.2 1.0 0.0 100.0 564
Other 88.2 11.8 0.0 0.0 100.0 246
Total 83.7 15.8 0.4 0.1 100.0 2 769
( ) – indicators are based on 25 – 49 cases of unweighted observations(*) – indicators are based on less than 25 cases of unweighted observations

MONITORING THE SITUATION OF CHILDREN AND WOMEN92
Tab
le E
N.1
: Use
of i
mp
rove
d w
ater
so
urce
sPe
rcen
t dis
trib
utio
n o
f ho
useh
old
mem
ber
s acc
ord
ing
to m
ain
sour
ce o
f dri
nki
ng
wat
er a
nd
per
cen
tage
of h
ous
eho
ld m
emb
ers u
sin
g im
pro
ved
dri
nki
ng
wat
er
sour
ces,
Kaz
akh
stan
, 200
6
MA
IN S
OU
RCE
OF
DRI
NKI
NG
WAT
ER
Total
Improved source of drinking water *
Number of household members
IMPR
OV
ED S
OU
RCES
UN
IMPR
OV
ED S
OU
RCES
Piped into dwelling
Piped into yard/ plot
Public tap/ stand-pipe
Tube-well/ bore-hole
Protected well
Protected spring
Bottled water
Unprotected well
Unprotected spring
Tanker truck
Cart with tank/ drum
Surface water (river, spring, dam, lake, pool)
Bottled water
Other
Obl
ast
Akm
ola
30.3
2.0
38.2
18.4
9.1
0.2
0.2
0.0
0.3
0.4
0.2
0.0
0.0
0.7
100.
098
.42
924
Akt
obe
42.7
3.3
18.1
6.9
22.7
0.0
1.3
0.7
1.6
0.0
0.7
0.0
0.0
2.0
100.
095
.02
292
Alm
aty
28.1
36.8
27.8
2.6
2.1
0.2
0.0
0.4
0.4
0.5
0.2
0.5
0.0
0.4
100.
097
.65
474
Aty
rau
39.4
9.1
2.0
0.7
37.8
0.3
0.0
0.3
0.0
0.5
0.0
8.1
0.0
1.8
100.
089
.31
511
Wes
t Kaz
akhs
tan
31.8
1.1
22.1
0.3
34.5
0.1
0.6
4.2
0.1
4.8
0.2
0.2
0.0
0.0
100.
090
.52
264
Zham
byl
30.5
8.0
9.6
48.4
2.8
0.3
0.0
0.1
0.0
0.0
0.1
0.2
0.0
0.0
100.
099
.63
190
Kara
gand
y 74
.90.
85.
59.
45.
50.
00.
00.
00.
03.
30.
20.
00.
20.
210
0.0
96.1
4 95
8
Kost
anai
38
.60.
516
.112
.215
.10.
40.
24.
10.
22.
40.
12.
10.
08.
010
0.0
83.2
3 61
7
Kyzy
lord
a 29
.27.
233
.40.
226
.40.
30.
00.
50.
02.
80.
00.
00.
00.
010
0.0
96.7
1 92
1
Man
gist
au
64.1
0.3
0.4
0.0
34.8
0.2
0.0
0.2
0.0
0.0
0.0
0.0
0.0
0.0
100.
099
.81
127
Sout
h Ka
zakh
stan
22
.734
.76.
310
.311
.30.
30.
10.
02.
43.
21.
96.
80.
00.
010
0.0
85.7
6 79
1
Pavl
odar
60
.60.
710
.011
.413
.60.
00.
00.
10.
00.
00.
10.
30.
03.
210
0.0
96.3
2 75
4
Nor
th K
azak
hsta
n 26
.90.
623
.49.
419
.61.
10.
71.
20.
56.
00.
11.
00.
09.
510
0.0
81.7
2 43
9
East
Kaz
akhs
tan
46.7
16.0
21.8
3.3
8.3
0.3
0.0
0.1
0.3
0.0
0.0
1.7
0.0
1.5
100.
096
.45
097
Ast
ana
City
84.3
0.5
15.2
0.0
0.0
0.0
0.0
0.0
0.0
0.0
0.0
0.0
0.0
0.0
100.
010
0.0
1 06
3
Alm
aty
City
92.8
5.7
1.5
0.0
0.0
0.0
0.0
0.0
0.0
0.0
0.0
0.0
0.0
0.0
100.
010
0.0
3 83
9
* M
ICS
indi
cato
r 11;
MD
G in
dica
tor 3
0(*
) –
indi
cato
rs a
re b
ased
on
less
than
25
case
s of
unw
eigh
ted
obse
rvat
ions

KAZAKHSTAN MULTIPLE INDICATOR CLUSTER SURVEY (MICS), 2006 93
Tab
le E
N.1
: Use
of i
mp
rove
d w
ater
so
urce
s (c
on
tin
ued
)
MA
IN S
OU
RCE
OF
DRI
NKI
NG
WAT
ER
Total
Improved source of drinking water *
Number of household members
IMPR
OV
ED S
OU
RCES
UN
IMPR
OV
ED S
OU
RCES
Piped into dwelling
Piped into yard/ plot
Public tap/ stand-pipe
Tube-well/ bore-hole
Protected well
Protected spring
Bottled water
Unprotected well
Unprotected spring
Tanker truck
Cart with tank/ drum
Surface water (river, spring, dam, lake, pool)
Bottled water
Other
Resi
denc
e
Urb
an71
.97.
710
.44.
03.
80.
10.
20.
10.
11.
00.
20.
30.
00.
210
0.0
98.1
29 1
72
Rura
l8.
317
.922
.416
.122
.60.
40.
01.
51.
12.
40.
63.
40.
03.
310
0.0
87.7
22 0
89
Educ
atio
n of
hou
seho
ld h
ead
Prim
ary/
inco
mpl
ete
seco
ndar
y30
.015
.817
.113
.614
.00.
30.
00.
60.
92.
50.
33.
10.
01.
810
0.0
90.9
7 87
4
Seco
ndar
y 32
.614
.819
.910
.115
.00.
30.
10.
90.
81.
50.
51.
60.
01.
910
0.0
92.8
20 6
07
Spec
ializ
ed s
econ
dary
55.1
8.8
12.9
7.6
10.1
0.2
0.2
0.7
0.2
1.5
0.3
0.9
0.0
1.5
100.
094
.912
296
Hig
her
69.2
6.7
8.0
5.8
5.8
0.1
0.5
0.1
0.2
1.3
0.2
1.2
0.0
0.9
100.
096
.09
857
Non
e/D
K(*
)(*
)(*
)(*
)(*
)(*
)(*
)(*
)(*
)(*
)(*
)(*
)(*
)(*
)10
0.0
100.
010
Wea
lth
inde
x qu
inti
les
Poor
est
0.3
22.2
24.9
15.8
24.7
0.4
0.0
1.7
1.5
2.6
0.9
3.9
0.0
1.1
100.
088
.410
253
Poor
4.2
21.2
29.4
15.1
19.8
0.1
0.0
1.1
0.8
2.4
0.4
2.8
0.0
2.7
100.
089
.810
253
Mid
dle
28.3
15.5
21.1
12.4
13.1
0.5
0.0
0.6
0.3
2.6
0.5
1.1
0.1
3.9
100.
090
.910
251
Rich
90.0
1.6
2.5
2.8
1.9
0.2
0.2
0.0
0.1
0.4
0.0
0.1
0.0
0.2
100.
099
.110
252
Rich
est
99.5
0.0
0.0
0.0
0.0
0.0
0.5
0.0
0.0
0.0
0.0
0.0
0.0
0.0
100.
010
0.0
10 2
52
Ethn
icit
y/la
ngua
ge
Kaza
kh34
.614
.318
.69.
615
.40.
20.
10.
60.
62.
00.
52.
00.
01.
510
0.0
92.8
29 3
41
Russ
ian
64.0
4.5
11.6
7.7
7.1
0.3
0.2
0.8
0.1
1.2
0.1
0.3
0.0
2.1
100.
095
.316
389
Oth
er38
.823
.011
.512
.07.
50.
10.
10.
51.
10.
80.
53.
40.
00.
710
0.0
93.1
5 53
1
Tota
l44
.512
.115
.69.
211
.90.
20.
10.
70.
51.
60.
41.
60.
01.
610
0.0
93.7
51 2
61
* M
ICS
indi
cato
r 11;
MD
G in
dica
tor 3
0(*
) –
indi
cato
rs a
re b
ased
on
less
than
25
case
s of
unw
eigh
ted
obse
rvat
ions

MONITORING THE SITUATION OF CHILDREN AND WOMEN94
Tab
le E
N.2
: Ho
useh
old
wat
er tr
eatm
ent
Perc
ent d
istr
ibut
ion
of h
ous
eho
ld p
op
ulat
ion
acc
ord
ing
to d
rin
kin
g w
ater
trea
tmen
t met
ho
d u
sed
in th
e h
ous
eho
ld, a
nd
per
cen
tage
of h
ous
eho
ld p
op
ulat
ion
th
at a
pp
lied
an
ap
pro
pri
ate
wat
er tr
eatm
ent m
eth
od
, Kaz
akh
stan
, 200
6
W
ater
trea
tmen
t met
hod
used
in th
e ho
useh
old
All
drin
king
wat
er
sour
ces
Impr
oved
drin
king
w
ater
sou
rces
Uni
mpr
oved
drin
k-in
g w
ater
sou
rces
None
Boil
Add bleach/ chlorine
Strain through a cloth
Use water filter
Solar dis-infec-tion
Let it stand and settle
Other
Don’t know
Appropriate water treat-
ment method*
Number of household members
Appropriate water treat-
ment method
Number of household members
Appropriate water treat-
ment method
Number of household members
Obl
ast
Akm
ola
28.7
66.5
0.2
0.6
3.6
0.3
12.6
0.0
0.1
69.0
2 92
468
.82
876
(*)
48
Akt
obe
18.3
65.5
0.0
0.1
1.3
0.0
42.9
0.1
0.0
66.3
2 29
267
.42
177
(46.
3)11
5
Alm
aty
43.6
54.2
0.0
0.3
0.3
0.1
10.3
0.0
0.2
54.3
5 47
453
.75
344
(*)
130
Aty
rau
2.7
92.9
0.0
0.1
0.2
0.0
83.8
0.3
0.0
93.1
1 51
192
.31
349
100.
016
2
Wes
t Kaz
akhs
tan
19.7
67.2
1.1
0.0
2.9
0.0
47.0
0.0
0.0
68.7
2 26
467
.12
048
83.8
215
Zham
byl
73.9
24.6
0.0
0.2
0.3
0.0
5.9
0.1
0.0
24.9
3 19
024
.93
177
(*)
13
Kara
gand
y 16
.675
.70.
10.
45.
90.
024
.43.
30.
178
.74
958
79.2
4 76
5(6
6.2)
193
Kost
anai
22
.066
.50.
50.
34.
60.
026
.70.
20.
270
.53
617
70.7
3 00
969
.360
9
Kyzy
lord
a 25
.365
.10.
00.
00.
50.
930
.30.
00.
065
.61
921
66.0
1 85
9(5
5.0)
63
Man
gist
au
0.7
98.5
0.3
11.7
26.4
0.2
69.3
0.3
0.0
98.5
1 12
798
.51
124
(*)
3
Sout
h Ka
zakh
stan
3.
793
.10.
00.
00.
40.
010
.80.
00.
093
.46
790
92.9
5 82
196
.096
9
Pavl
odar
23
.568
.10.
00.
04.
30.
332
.10.
10.
171
.32
754
71.4
2 65
2(6
6.8)
102
Nor
th K
azak
hsta
n 20
.567
.70.
70.
16.
90.
015
.20.
50.
073
.32
439
72.5
1 99
276
.944
7
East
Kaz
akhs
tan
36.9
50.6
0.2
0.0
2.5
0.0
13.3
0.1
0.0
53.2
5 09
752
.24
913
(80.
8)18
4
Ast
ana
City
11.4
58.7
0.0
0.0
17.9
0.2
46.0
10.7
0.4
68.6
1 06
368
.61
063
na0
Alm
aty
City
3.8
95.7
0.0
0.0
12.8
0.9
39.3
1.9
0.0
95.9
3 83
995
.93
839
na0
* M
ICS
indi
cato
r 13
( )
– in
dica
tors
are
bas
ed o
n 25
– 4
9 ca
ses
of u
nwei
ghte
d ob
serv
atio
ns(*
) –
indi
cato
rs a
re b
ased
on
less
than
25
case
s of
unw
eigh
ted
obse
rvat
ions
na: n
ot a
pplic
able
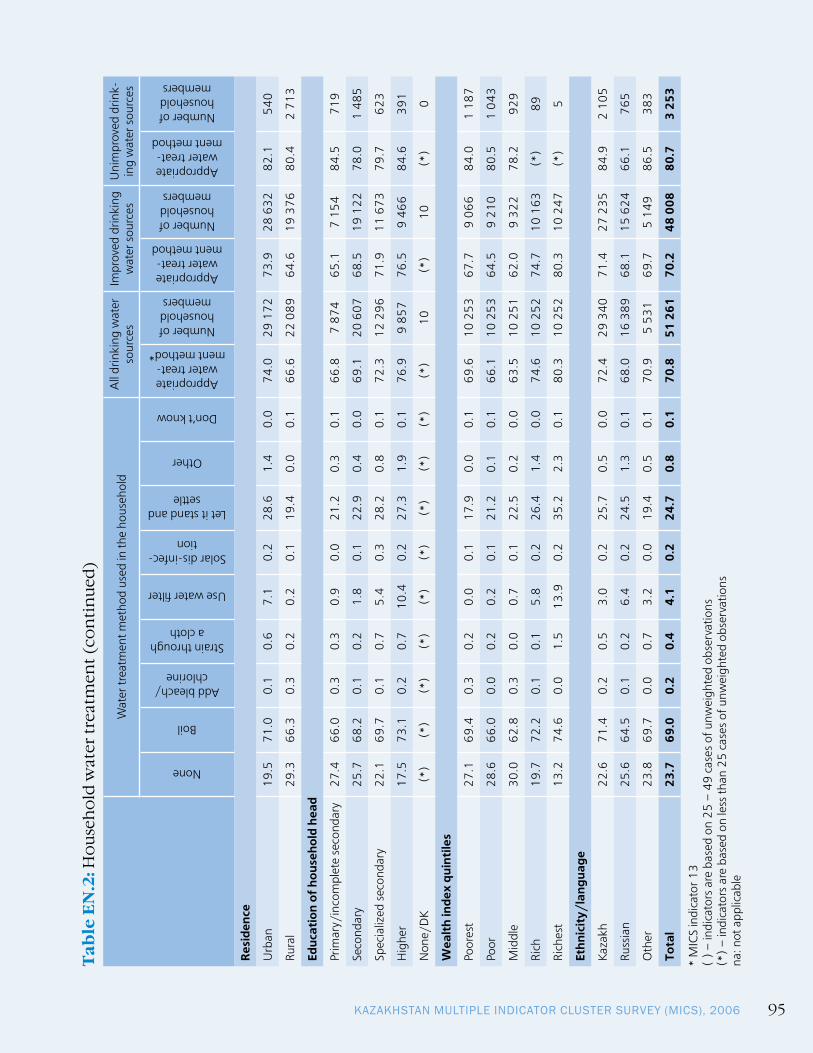
KAZAKHSTAN MULTIPLE INDICATOR CLUSTER SURVEY (MICS), 2006 95
Tab
le E
N.2
: Ho
useh
old
wat
er tr
eatm
ent (
con
tin
ued
)
Wat
er tr
eatm
ent m
etho
d us
ed in
the
hous
ehol
dA
ll dr
inki
ng w
ater
so
urce
sIm
prov
ed d
rinki
ng
wat
er s
ourc
esU
nim
prov
ed d
rink-
ing
wat
er s
ourc
es
None
Boil
Add bleach/ chlorine
Strain through a cloth
Use water filter
Solar dis-infec-tion
Let it stand and settle
Other
Don’t know
Appropriate water treat-
ment method*
Number of household members
Appropriate water treat-
ment method
Number of household members
Appropriate water treat-
ment method
Number of household members
Resi
denc
e
Urb
an19
.571
.00.
10.
67.
10.
228
.61.
40.
074
.029
172
73.9
28 6
3282
.154
0
Rura
l29
.366
.30.
30.
20.
20.
119
.40.
00.
166
.622
089
64.6
19 3
7680
.42
713
Educ
atio
n of
hou
seho
ld h
ead
Prim
ary/
inco
mpl
ete
seco
ndar
y27
.466
.00.
30.
30.
90.
021
.20.
30.
166
.87
874
65.1
7 15
484
.571
9
Seco
ndar
y 25
.768
.20.
10.
21.
80.
122
.90.
40.
069
.120
607
68.5
19 1
2278
.01
485
Spec
ializ
ed s
econ
dary
22.1
69.7
0.1
0.7
5.4
0.3
28.2
0.8
0.1
72.3
12 2
9671
.911
673
79.7
623
Hig
her
17.5
73.1
0.2
0.7
10.4
0.2
27.3
1.9
0.1
76.9
9 85
776
.59
466
84.6
391
Non
e/D
K(*
)(*
)(*
)(*
)(*
)(*
)(*
)(*
)(*
)(*
)10
(*)
10(*
)0
Wea
lth
inde
x qu
inti
les
Poor
est
27.1
69.4
0.3
0.2
0.0
0.1
17.9
0.0
0.1
69.6
10 2
5367
.79
066
84.0
1 18
7
Poor
28.6
66.0
0.0
0.2
0.2
0.1
21.2
0.1
0.1
66.1
10 2
5364
.59
210
80.5
1 04
3
Mid
dle
30.0
62.8
0.3
0.0
0.7
0.1
22.5
0.2
0.0
63.5
10 2
5162
.09
322
78.2
929
Rich
19.7
72.2
0.1
0.1
5.8
0.2
26.4
1.4
0.0
74.6
10 2
5274
.710
163
(*)
89
Rich
est
13.2
74.6
0.0
1.5
13.9
0.2
35.2
2.3
0.1
80.3
10 2
5280
.310
247
(*)
5
Ethn
icit
y/la
ngua
ge
Kaza
kh22
.671
.40.
20.
53.
00.
225
.70.
50.
072
.429
340
71.4
27 2
3584
.92
105
Russ
ian
25.6
64.5
0.1
0.2
6.4
0.2
24.5
1.3
0.1
68.0
16 3
8968
.115
624
66.1
765
Oth
er23
.869
.70.
00.
73.
20.
019
.40.
50.
170
.95
531
69.7
5 14
986
.538
3
Tota
l23
.769
.00.
20.
44.
10.
224
.70.
80.
170
.851
261
70.2
48 0
0880
.73
253
* M
ICS
indi
cato
r 13
( )
– in
dica
tors
are
bas
ed o
n 25
– 4
9 ca
ses
of u
nwei
ghte
d ob
serv
atio
ns(*
) –
indi
cato
rs a
re b
ased
on
less
than
25
case
s of
unw
eigh
ted
obse
rvat
ions
na: n
ot a
pplic
able

MONITORING THE SITUATION OF CHILDREN AND WOMEN96
Table EN.3: Time to source of waterPercent distribution of households according to time to go to source of drinking water, get water and return, and mean time to source of drinking water, Kazakhstan, 2006
TIME TO SOURCE OF DRINKING WATER
Mea
n tim
e to
so
urce
of d
rink-
ing
wat
er*
Num
ber o
f ho
useh
olds
Water on
premises
Less than 15 minutes
15 min-utes to less
than 30 minutes
30 min-utes to
less than 1 hour
1 hour or
more
Don’t know Total
Oblast Akmola 51.5 22.9 14.4 7.5 3.1 0.6 100.0 18.0 879Aktobe 68.4 13.2 12.0 5.5 0.9 0.0 100.0 17.7 629Almaty 70.4 13.4 9.2 5.8 0.9 0.3 100.0 18.1 1 352Atyrau 66.6 15.3 15.1 2.9 0.1 0.0 100.0 14.7 334West Kazakhstan 55.1 12.8 18.2 11.1 2.7 0.1 100.0 22.2 600Zhambyl 83.0 7.7 5.9 2.6 0.5 0.3 100.0 16.7 834Karagandy 91.1 3.4 3.8 1.2 0.5 0.0 100.0 19.5 1 614Kostanai 65.7 10.5 10.0 8.5 4.4 0.9 100.0 25.8 1 170Kyzylorda 58.3 11.8 14.9 10.1 4.9 0.0 100.0 25.6 409Mangistau 99.4 0.5 0.1 0.0 0.0 0.0 100.0 10.6 273South Kazakhstan 66.7 15.9 15.0 2.1 0.3 0.0 100.0 14.2 1 415Pavlodar 76.6 10.7 8.0 4.4 0.3 0.0 100.0 16.5 911North Kazakhstan 43.7 22.3 14.9 13.0 5.7 0.4 100.0 22.0 805East Kazakhstan 74.8 12.4 8.0 4.0 0.7 0.1 100.0 16.9 1 652Astana City 87.5 8.1 4.1 0.3 0.0 0.0 100.0 12.1 334Almaty City 98.7 1.1 0.0 0.2 0.0 0.0 100.0 15.4 1 353ResidenceUrban 87.4 5.7 4.3 2.0 0.5 0.1 100.0 17.9 9 339Rural 48.5 21.1 17.5 9.5 3.0 0.4 100.0 19.5 5 225Education of household headPrimary/incomplete secondary 65.4 14.8 11.5 6.3 1.6 0.4 100.0 18.7 2 407Secondary 65.1 14.3 12.3 6.1 2.0 0.2 100.0 19.3 5 224Specialized secondary 79.6 8.4 6.8 3.9 1.2 0.1 100.0 19.7 3 744Higher 87.0 6.4 4.2 1.8 0.6 0.0 100.0 17.4 3 048None/DK (*) (*) (*) (*) (*) (*) 100.0 (*) 2Wealth index quintilesPoorest 40.0 22.3 23.2 11.0 3.3 0.2 100.0 19.7 2 208Poor 45.1 24.7 17.6 9.4 2.8 0.4 100.0 18.7 2 554Middle 63.3 16.9 11.4 6.1 2.0 0.3 100.0 18.4 2 751Rich 96.4 1.2 1.3 0.7 0.3 0.1 100.0 21.4 3 560Richest 100.0 0.0 0.0 0.0 0.0 0.0 100.0 na 3 491Ethnicity/languageKazakh 66.6 13.6 12.0 5.9 1.8 0.1 100.0 19.2 7 145Russian 80.9 8.6 5.7 3.4 1.1 0.3 100.0 18.9 6 007Other 75.7 10.4 8.6 4.0 1.0 0.3 100.0 18.0 1 412Total 73.4 11.2 9.1 4.7 1.4 0.2 100.0 19.0 14 564
* The mean time to source of drinking water is calculated based on those households that do not have water on the premises(*) – indicators are based on less than 25 cases of unweighted observationsna: not applicable
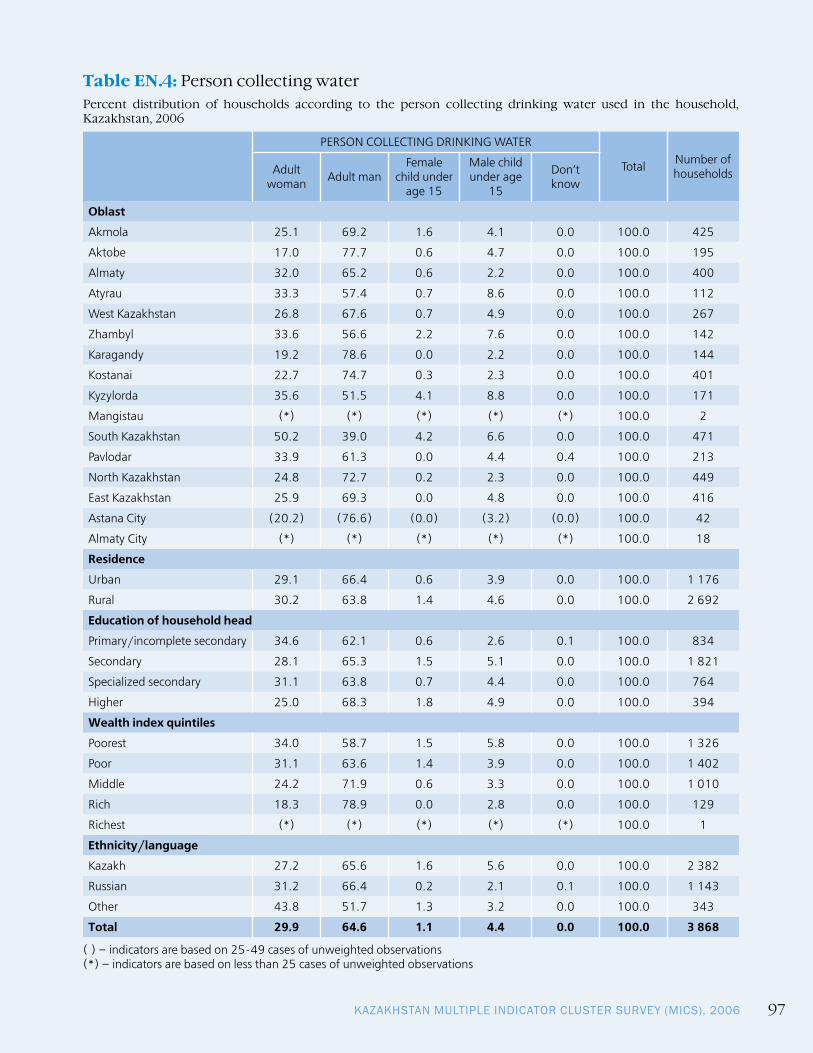
KAZAKHSTAN MULTIPLE INDICATOR CLUSTER SURVEY (MICS), 2006 97
Table EN.4: Person collecting waterPercent distribution of households according to the person collecting drinking water used in the household, Kazakhstan, 2006
PERSON COLLECTING DRINKING WATER
Total Number of householdsAdult
woman Adult manFemale
child under age 15
Male child under age
15
Don’t know
Oblast
Akmola 25.1 69.2 1.6 4.1 0.0 100.0 425
Aktobe 17.0 77.7 0.6 4.7 0.0 100.0 195
Almaty 32.0 65.2 0.6 2.2 0.0 100.0 400
Atyrau 33.3 57.4 0.7 8.6 0.0 100.0 112
West Kazakhstan 26.8 67.6 0.7 4.9 0.0 100.0 267
Zhambyl 33.6 56.6 2.2 7.6 0.0 100.0 142
Karagandy 19.2 78.6 0.0 2.2 0.0 100.0 144
Kostanai 22.7 74.7 0.3 2.3 0.0 100.0 401
Kyzylorda 35.6 51.5 4.1 8.8 0.0 100.0 171
Mangistau (*) (*) (*) (*) (*) 100.0 2
South Kazakhstan 50.2 39.0 4.2 6.6 0.0 100.0 471
Pavlodar 33.9 61.3 0.0 4.4 0.4 100.0 213
North Kazakhstan 24.8 72.7 0.2 2.3 0.0 100.0 449
East Kazakhstan 25.9 69.3 0.0 4.8 0.0 100.0 416
Astana City (20.2) (76.6) (0.0) (3.2) (0.0) 100.0 42
Almaty City (*) (*) (*) (*) (*) 100.0 18
Residence
Urban 29.1 66.4 0.6 3.9 0.0 100.0 1 176
Rural 30.2 63.8 1.4 4.6 0.0 100.0 2 692
Education of household head
Primary/incomplete secondary 34.6 62.1 0.6 2.6 0.1 100.0 834
Secondary 28.1 65.3 1.5 5.1 0.0 100.0 1 821
Specialized secondary 31.1 63.8 0.7 4.4 0.0 100.0 764
Higher 25.0 68.3 1.8 4.9 0.0 100.0 394
Wealth index quintiles
Poorest 34.0 58.7 1.5 5.8 0.0 100.0 1 326
Poor 31.1 63.6 1.4 3.9 0.0 100.0 1 402
Middle 24.2 71.9 0.6 3.3 0.0 100.0 1 010
Rich 18.3 78.9 0.0 2.8 0.0 100.0 129
Richest (*) (*) (*) (*) (*) 100.0 1
Ethnicity/language
Kazakh 27.2 65.6 1.6 5.6 0.0 100.0 2 382
Russian 31.2 66.4 0.2 2.1 0.1 100.0 1 143
Other 43.8 51.7 1.3 3.2 0.0 100.0 343
Total 29.9 64.6 1.1 4.4 0.0 100.0 3 868
( ) – indicators are based on 25-49 cases of unweighted observations(*) – indicators are based on less than 25 cases of unweighted observations

MONITORING THE SITUATION OF CHILDREN AND WOMEN98
Tab
le E
N.5
: Use
of s
anit
ary
mea
ns
of e
xcre
ta d
isp
osa
lPe
rcen
t dis
trib
utio
n o
f ho
useh
old
mem
ber
s ac
cord
ing
to ty
pe
of t
oile
t fac
ility
use
d b
y th
e h
ous
eho
ld, a
nd
the
per
cen
tage
of h
ous
eho
ld m
emb
ers
usin
g sa
nit
ary
mea
ns
of e
xcre
ta d
isp
osa
l, K
azak
hst
an, 2
006
TYPE
OF
TOIL
ET F
ACI
LITY
USE
D B
Y H
OU
SEH
OLD
Total
Percentage of popula-tion using sanitary means of excreta
disposal*
Number of household members
IMPR
OV
ED S
AN
ITAT
ION
FA
CILI
TYU
NIM
PRO
VED
SA
NIT
ATIO
N F
ACI
LITY
Flus
h/po
ur fl
ush
to:
Ventilated improved pit
latrine
Pit latrine with slab
Compos-ting toilet
Pit latrine without
slab/ open pit
Bucket
Hanging toi-let/ hanging
latrine
No facilities/bush/field
Other
Pipe
d se
wer
sy
stem
Sept
ic
tank
Pit
latr
ine
Obl
ast
Akm
ola
23.0
3.4
0.0
1.0
71.5
0.0
0.1
0.2
0.0
0.1
0.7
100.
098
.92
924
Akt
obe
39.7
0.0
1.6
0.0
52.2
0.0
0.4
0.0
6.1
0.0
0.0
100.
093
.62
292
Alm
aty
10.5
0.7
0.1
0.2
87.7
0.2
0.2
0.0
0.4
0.0
0.0
100.
099
.45
474
Aty
rau
32.9
0.0
0.0
0.0
67.1
0.0
0.0
0.0
0.0
0.0
0.0
100.
010
0.0
1 51
1
Wes
t Kaz
akhs
tan
29.1
0.7
0.0
0.0
69.6
0.3
0.3
0.0
0.0
0.0
0.0
100.
099
.82
264
Zham
byl
23.5
0.0
0.0
0.0
75.3
0.0
1.1
0.0
0.1
0.0
0.0
100.
098
.83
190
Kara
gand
y 64
.05.
10.
30.
029
.80.
10.
00.
10.
10.
20.
310
0.0
99.3
4 95
8
Kost
anai
35
.36.
50.
00.
058
.20.
00.
00.
00.
00.
00.
010
0.0
100.
03
617
Kyzy
lord
a 21
.30.
00.
00.
078
.60.
10.
00.
00.
00.
00.
010
0.0
100.
01
921
Man
gist
au
64.1
0.0
0.0
0.0
35.8
0.0
0.1
0.0
0.0
0.0
0.0
100.
099
.91
127
Sout
h Ka
zakh
stan
12
.80.
34.
00.
182
.70.
00.
10.
00.
00.
00.
010
0.0
99.9
6 79
1
Pavl
odar
60
.20.
40.
70.
038
.30.
40.
00.
00.
00.
00.
010
0.0
100.
02
754
Nor
th K
azak
hsta
n 26
.34.
50.
20.
268
.00.
00.
10.
60.
00.
10.
010
0.0
99.2
2 43
9
East
Kaz
akhs
tan
28.0
0.2
1.1
0.1
70.6
0.0
0.0
0.0
0.0
0.0
0.0
100.
010
0.0
5 09
7
Ast
ana
City
82.6
0.0
0.0
0.2
17.2
0.0
0.0
0.0
0.0
0.0
0.0
100.
010
0.0
1 06
3
Alm
aty
City
79.4
0.0
0.5
2.1
16.2
0.1
0.1
0.0
1.6
0.0
0.0
100.
098
.33
839
*MIC
S in
dica
tor 1
2; M
DG
indi
cato
r 31
(*)
– in
dica
tors
are
bas
ed o
n le
ss th
an 2
5 ca
ses
of u
nwei
ghte
d ob
serv
atio
ns

KAZAKHSTAN MULTIPLE INDICATOR CLUSTER SURVEY (MICS), 2006 99
Tab
le E
N.5
: Use
of s
anit
ary
mea
ns
of e
xcre
ta d
isp
osa
l (co
nti
nue
d)
TYPE
OF
TOIL
ET F
ACI
LITY
USE
D B
Y H
OU
SEH
OLD
Total
Percentage of popula-tion using sanitary means of excreta
disposal*
Number of household members
IMPR
OV
ED S
AN
ITAT
ION
FA
CILI
TYU
NIM
PRO
VED
SA
NIT
ATIO
N F
ACI
LITY
Flus
h/po
ur fl
ush
to:
Ventilated improved pit
latrine
Pit latrine with slab
Compos-ting toilet
Pit latrine without
slab/ open pit
Bucket
Hanging toi-let/ hanging
latrine
No facilities/bush/field
Other
Pipe
d se
wer
sy
stem
Sept
ic
tank
Pit
latr
ine
Resi
denc
e
Urb
an60
.71.
61.
30.
435
.50.
00.
00.
10.
40.
00.
010
0.0
99.5
29 1
72
Rura
l2.
11.
50.
20.
194
.80.
10.
30.
10.
50.
10.
210
0.0
98.9
22 0
89
Educ
atio
n
Prim
ary/
inco
mpl
ete
seco
ndar
y20
.11.
01.
10.
376
.80.
10.
10.
20.
20.
00.
110
0.0
99.3
7 87
4
Seco
ndar
y 24
.11.
60.
80.
272
.40.
00.
10.
00.
60.
10.
110
0.0
99.1
20 6
07
Spec
ializ
ed s
econ
dary
45.5
1.7
0.7
0.2
51.1
0.1
0.2
0.1
0.4
0.0
0.0
100.
099
.312
296
Hig
her
60.4
1.8
1.0
0.5
35.7
0.1
0.3
0.0
0.2
0.0
0.0
100.
099
.59
857
Non
e/D
K(*
)(*
)(*
)(*
)(*
)(*
)(*
)(*
)(*
)(*
)(*
)(*
)(*
)10
Wea
lth
inde
x qu
inti
les
Poor
est
0.0
0.0
0.1
0.0
99.1
0.1
0.0
0.0
0.6
0.1
0.0
100.
099
.210
253
Poor
0.2
0.1
0.4
0.0
98.1
0.1
0.4
0.2
0.4
0.0
0.1
100.
098
.910
253
Mid
dle
4.0
2.8
1.7
0.7
89.8
0.1
0.2
0.1
0.5
0.0
0.1
100.
099
.110
251
Rich
73.2
4.6
2.0
0.7
18.4
0.1
0.1
0.0
0.8
0.0
0.1
100.
099
.010
252
Rich
est
99.8
0.2
0.0
0.0
0.0
0.0
0.0
0.0
0.0
0.0
0.0
100.
010
0.0
10 2
52
Ethn
icit
y/la
ngua
ge
Kaza
kh28
.10.
60.
30.
269
.90.
10.
20.
00.
50.
00.
110
0.0
99.2
29 3
41
Russ
ian
52.1
3.4
1.4
0.4
42.0
0.1
0.0
0.1
0.4
0.0
0.1
100.
099
.316
389
Oth
er25
.01.
01.
80.
370
.90.
20.
20.
10.
40.
00.
110
0.0
99.2
5 53
1
Tota
l35
.41.
50.
80.
361
.10.
10.
10.
10.
50.
00.
110
0.0
99.2
51 2
61
*MIC
S in
dica
tor 1
2; M
DG
indi
cato
r 31
(*)
– in
dica
tors
are
bas
ed o
n le
ss th
an 2
5 ca
ses
of u
nwei
ghte
d ob
serv
atio
ns

MONITORING THE SITUATION OF CHILDREN AND WOMEN100
Tab
le E
N.5
W: N
umb
er o
f ho
useh
old
s us
ing
imp
rove
d s
anit
atio
n fa
cilit
ies
(wo
rksh
eet)
Perc
ent d
istr
ibut
ion
of h
ous
eho
lds
usin
g im
pro
ved
san
itar
y m
ean
s (p
ilot a
rea)
acc
ord
ing
to th
e n
umbe
r o
f ho
useh
old
s us
ing
mea
ns
(obj
ect)
, Kaz
akh
stan
, 200
6
NU
MBE
R O
F H
OU
SEH
OLD
S U
SIN
G IM
PRO
VED
SA
NIT
ARY
MEA
NS
TOTA
LN
umbe
r of
hous
ehol
d m
embe
rsO
neTw
oTh
ree
Four
Five
Six
Seve
nEi
ght
Nin
e10
Or
Mor
eD
oes
not
Know
Type
of t
oile
t
Lava
tory
pan
/sew
erag
e98
.20.
40.
30.
30.
10.
10.
10.
20.
00.
30.
010
0.0
18 1
63
Sept
ic ta
nk98
.30.
70.
00.
00.
00.
00.
00.
00.
00.
01.
010
0.0
795
Pit l
atrin
e95
.70.
00.
00.
50.
00.
00.
00.
00.
00.
63.
210
0.0
424
Vent
ilate
d im
prov
ed p
it la
trin
e88
.53.
60.
00.
00.
00.
00.
00.
00.
01.
06.
910
0.0
142
Pit l
atrin
e w
ith s
lab
97.9
1.1
0.2
0.1
0.1
0.1
0.0
0.2
0.0
0.2
0.1
100.
031
313
Com
pos-
ting
toile
t(7
9.6)
(14.
3)(0
.0)
(0.0
)(0
.0)
(0.0
)(0
.0)
(0.0
)(0
.0)
(0.0
)(6
.1)
100.
041
Obl
ast
Akm
ola
98.1
0.7
0.2
0.2
0.0
0.0
0.0
0.2
0.0
0.4
0.2
100.
02
892
Akt
obe
99.7
0.0
0.0
0.1
0.0
0.2
0.0
0.0
0.0
0.0
0.0
100.
02
145
Alm
aty
99.4
0.2
0.2
0.0
0.1
0.0
0.0
0.0
0.1
0.0
0.0
100.
05
440
Aty
rau
98.2
0.6
0.2
0.4
0.0
0.3
0.0
0.2
0.0
0.0
0.1
100.
01
511
Wes
t Kaz
akhs
tan
95.7
2.2
0.3
0.5
0.1
0.0
0.0
0.6
0.0
0.5
0.1
100.
02
258
Zham
byl
98.0
0.7
0.3
0.0
0.0
0.1
0.0
0.1
0.0
0.7
0.1
100.
03
151
Kara
gand
y 99
.70.
10.
10.
00.
00.
00.
00.
00.
00.
10.
010
0.0
4 92
3
Kost
anai
99
.50.
20.
00.
00.
00.
00.
10.
00.
00.
00.
210
0.0
3 61
7
Kyzy
lord
a 96
.60.
70.
41.
10.
40.
00.
00.
70.
00.
10.
010
0.0
1 92
1
Man
gist
au
97.0
2.6
0.2
0.1
0.0
0.1
0.0
0.0
0.0
0.0
0.0
100.
01
126
Sout
h Ka
zakh
stan
97
.91.
20.
20.
10.
00.
00.
00.
10.
00.
40.
110
0.0
6 78
6
Pavl
odar
97
.50.
40.
60.
10.
10.
10.
00.
50.
00.
40.
310
0.0
2 75
4
Nor
th K
azak
hsta
n 95
.31.
31.
00.
40.
20.
90.
20.
10.
20.
30.
110
0.0
2 42
0
East
Kaz
akhs
tan
96.8
2.5
0.2
0.2
0.1
0.0
0.0
0.2
0.0
0.0
0.0
100.
05
097
Ast
ana
City
93.0
0.3
0.6
1.7
1.0
0.3
0.4
1.3
0.1
1.3
0.0
100.
01
063
Alm
aty
City
98.5
0.6
0.1
0.0
0.0
0.0
0.0
0.0
0.0
0.4
0.4
100.
03
773
( )
– in
dica
tors
are
bas
ed o
n 25
– 4
9 ca
ses
of u
nwei
ghte
d ob
serv
atio
ns(*
) –
indi
cato
rs a
re b
ased
on
less
than
25
case
s of
unw
eigh
ted
obse
rvat
ions

KAZAKHSTAN MULTIPLE INDICATOR CLUSTER SURVEY (MICS), 2006 101
Tab
le E
N.5
w: N
umb
er o
f ho
useh
old
s us
ing
imp
rove
d s
anit
atio
n fa
cilit
ies
(wo
rksh
eet)
(co
nti
nue
d)
NU
MBE
R O
F H
OU
SEH
OLD
S U
SIN
G IM
PRO
VED
SA
NIT
ARY
MEA
NS
TOTA
LN
umbe
r of
hous
ehol
d m
embe
rsO
neTw
oTh
ree
Four
Five
Six
Seve
nEi
ght
Nin
e10
Or
Mor
eD
oes
not
Know
Resi
denc
e
Urb
an97
.31.
10.
30.
30.
10.
10.
10.
20.
00.
40.
110
0.0
29 0
26
Rura
l98
.90.
60.
20.
00.
00.
00.
00.
10.
00.
10.
110
0.0
21 8
51
Educ
atio
n
Prim
ary/
inco
mpl
ete
seco
ndar
y98
.20.
90.
20.
10.
10.
00.
00.
10.
00.
20.
210
0.0
7 81
9
Seco
ndar
y 97
.81.
10.
20.
20.
10.
10.
00.
20.
00.
20.
110
0.0
20 4
17
Spec
ializ
ed s
econ
dary
97.5
0.8
0.3
0.3
0.1
0.2
0.1
0.2
0.1
0.4
0.0
100.
012
209
Hig
her
98.7
0.5
0.2
0.1
0.0
0.0
0.0
0.1
0.0
0.2
0.2
100.
09
807
Non
e/D
K(*
)(*
)(*
)(*
)(*
)(*
)(*
)(*
)(*
)(*
)(*
)(*
)10
Wea
lth
inde
x qu
inti
les
Poor
est
98.0
1.1
0.2
0.0
0.1
0.1
0.0
0.2
0.0
0.2
0.1
100.
010
175
Poor
97.3
1.6
0.2
0.3
0.0
0.0
0.0
0.3
0.0
0.2
0.1
100.
010
140
Mid
dle
97.6
1.0
0.2
0.2
0.1
0.1
0.0
0.1
0.1
0.5
0.1
100.
010
161
Rich
97.5
0.6
0.5
0.4
0.1
0.2
0.0
0.3
0.0
0.3
0.1
100.
010
149
Rich
est
99.5
0.1
0.1
0.1
0.0
0.0
0.0
0.1
0.0
0.0
0.1
100.
010
252
Ethn
icit
y/la
ngua
ge
Kaza
kh97
.51.
20.
30.
20.
10.
10.
00.
20.
00.
30.
110
0.0
29 1
06
Russ
ian
98.3
0.6
0.2
0.1
0.0
0.2
0.0
0.2
0.1
0.1
0.2
100.
016
282
Oth
er99
.40.
20.
00.
00.
00.
00.
00.
00.
00.
30.
110
0.0
5 48
9
Tota
l98
.00.
90.
20.
20.
10.
10.
00.
20.
00.
20.
110
0.0
50 8
77
( )
– in
dica
tors
are
bas
ed o
n 25
– 4
9 ca
ses
of u
nwei
ghte
d ob
serv
atio
ns(*
) –
indi
cato
rs a
re b
ased
on
less
than
25
case
s of
unw
eigh
ted
obse
rvat
ions

MONITORING THE SITUATION OF CHILDREN AND WOMEN102
Table EN.6: Disposal of child’s faecesPercent distribution of children aged 0-2 years according to place of disposal of child’s faeces, and the percentage of children aged 0-2 years whose stools are disposed of safely, Kazakhstan, 2006
PLACE OF DISPOSAL OF CHILD’S FAECES
Prop
ortio
n of
ch
ildre
n w
hose
la
test
stoo
ls w
ere
disp
osed
of s
afel
y*
Num
ber o
f chi
l-dr
en a
ged
0–2
year
s
Child
use
d to
ilet
Put/
rinse
d in
to
toile
t or l
atrin
e
Put/
rinse
d in
to
drai
n or
ditc
h
Thro
wn
into
ga
rbag
e
Burie
d
Left
in th
e op
en
Oth
er
DK
Tota
l
Oblast
Akmola 9.5 24.7 33.7 16.0 0.8 0.0 12.0 3.3 100.0 34.2 134
Aktobe 4.7 31.0 29.3 32.0 0.6 0.0 1.5 0.9 100.0 35.7 110
Almaty 0.3 5.8 16.7 70.7 1.0 0.0 1.5 4.0 100.0 6.1 373
Atyrau 0.0 20.7 8.1 68.0 0.7 0.4 1.3 0.8 100.0 20.7 85
West Kazakhstan 13.8 12.2 38.6 31.8 0.0 0.0 2.9 0.7 100.0 26.0 95
Zhambyl 1.7 30.1 42.0 12.5 2.5 0.0 4.9 6.3 100.0 31.8 225
Karagandy 4.6 50.1 24.3 21.0 0.0 0.0 0.0 0.0 100.0 54.6 196
Kostanai 1.0 28.8 26.0 39.8 1.7 0.0 2.7 0.0 100.0 29.8 160
Kyzylorda 0.0 19.1 70.2 9.2 0.0 0.0 0.0 1.5 100.0 19.1 130
Mangistau 12.8 25.3 0.0 61.9 0.0 0.0 0.0 0.0 100.0 38.1 70
South Kazakhstan 2.8 8.4 82.6 1.2 0.0 0.0 4.0 1.0 100.0 11.2 524
Pavlodar 1.0 61.0 27.4 7.8 0.0 0.0 2.1 0.7 100.0 61.9 131
North Kazakhstan 0.0 28.9 34.6 27.3 0.0 0.0 8.3 0.9 100.0 28.8 95
East Kazakhstan 6.2 25.1 39.6 26.3 0.0 0.0 0.0 2.8 100.0 31.4 191
Astana City 5.0 72.7 0.0 19.8 0.0 0.0 1.7 0.8 100.0 77.7 59
Almaty City 0.7 82.6 13.8 2.2 0.0 0.0 0.0 0.7 100.0 83.3 212
Residence
Urban 4.4 49.9 23.3 17.5 0.2 0.0 3.2 1.5 100.0 54.3 1 394
Rural 1.9 6.7 53.0 33.1 0.8 0.0 2.2 2.3 100.0 8.7 1 396
Mother’s education
Primary/incomplete secondary 3.1 16.1 47.4 29.6 0.0 0.0 3.2 0.6 100.0 19.2 195
Secondary 2.7 18.8 46.4 26.8 0.8 0.0 2.6 1.9 100.0 21.5 1 245
Specialized secondary 3.2 34.8 30.1 25.9 0.5 0.1 3.2 2.2 100.0 38.0 658
Higher 3.9 42.6 28.4 20.7 0.2 0.0 2.3 1.9 100.0 46.6 692
Wealth index quintiles
Poorest 2.3 2.9 65.0 26.1 1.1 0.0 1.0 1.6 100.0 5.2 759
Poor 2.0 6.4 47.7 37.7 0.9 0.0 2.6 2.7 100.0 8.4 579
Middle 3.4 12.5 43.1 34.9 0.2 0.1 4.2 1.6 100.0 15.9 551
Rich 4.3 61.4 12.3 14.1 0.0 0.0 5.6 2.3 100.0 65.7 438
Richest 4.7 84.7 0.8 7.6 0.0 0.0 1.1 1.1 100.0 89.4 463
Ethnicity/language
Kazakh 2.9 24.2 41.1 27.8 0.5 0.0 1.8 1.7 100.0 27.1 1 873
Russian 3.5 46.0 21.2 21.0 0.2 0.0 5.9 2.2 100.0 49.5 557
Other 3.6 22.4 49.1 19.2 1.0 0.0 2.5 2.2 100.0 26.0 360
Total 3.1 28.3 38.2 25.3 0.5 0.0 2.7 1.9 100.0 31.4 2 790
* MICS indicator 14

KAZAKHSTAN MULTIPLE INDICATOR CLUSTER SURVEY (MICS), 2006 103
Table EN.7: Use of improved water sources and improved sanitationPercentage of household population using both improved drinking water sources and sanitary means of excreta disposal, Kazakhstan, 2006
Percentage of household population:
Number of house-hold members
Using improved sources of drinking
water *
Using sanitary means of excreta disposal
**
Using improved sources of drinking water and
using sanitary means of excreta disposal
OblastAkmola 98.4 98.9 97.3 2 924
Aktobe 95.0 93.6 89.4 2 292
Almaty 97.6 99.4 97.0 5 474
Atyrau 89.3 100.0 89.3 1 511
West Kazakhstan 90.5 99.8 90.2 2 264
Zhambyl 99.6 98.8 98.3 3 190
Karagandy 96.1 99.3 95.6 4 958
Kostanai 83.2 100.0 83.2 3 617
Kyzylorda 96.7 100.0 96.7 1 922
Mangistau 99.8 99.9 99.7 1 127
South Kazakhstan 85.7 99.9 85.7 6 790
Pavlodar 96.3 100.0 96.3 2 754
North Kazakhstan 81.7 99.2 81.1 2 439
East Kazakhstan 96.4 100.0 96.4 5 097
Astana City 100.0 100.0 100.0 1 063
Almaty City 100.0 98.3 98.3 3 839
ResidenceUrban 98.1 99.5 97.7 29 172
Rural 87.7 98.9 86.8 22 089
Education of household headPrimary/incomplete secondary 90.9 99.3 90.2 7 874
Secondary 92.8 99.1 92.0 20 607
Specialized secondary 94.9 99.3 94.3 12 296
Higher 96.0 99.5 95.5 9 857
None/DK (*) (*) (*) 10
Wealth index quintilesPoorest 88.4 99.2 87.8 10 253
Poor 89.8 98.9 88.8 10 253
Middle 90.9 99.1 90.2 10 251
Rich 99.1 99.0 98.2 10 252
Richest 100.0 100.0 100.0 10 252
Ethnicity/languageKazakh 92.8 99.2 92.1 29 340
Russian 95.3 99.3 94.7 16 389
Other 93.1 99.2 92.4 5 532
Total 93.7 99.2 93.0 51 261
* MICS indicator 11; MDG indicator 30** MICS indicator 12; MDC indicator 31(*) – indicators are based on less than 25 cases of unweighted observations

MONITORING THE SITUATION OF CHILDREN AND WOMEN104
Tab
le R
H.1
: Use
of c
on
trac
epti
on
Perc
enta
ge o
f mar
ried
or
in u
nio
n w
om
en a
ged
15-
49 w
ho
are
usi
ng
(or
wh
ose
par
tner
is u
sin
g) a
co
ntr
acep
tive
met
ho
d, K
azak
hst
an, 2
006
Not using any method
PERC
ENT
OF
WO
MEN
(CU
RREN
TLY
MA
RRIE
D O
R IN
UN
ION
) W
HO
ARE
USI
NG
:
TOTAL
Any modern method
Any tradi-tional method
Any method*
Number of women currently
married or in union
Female steri-lization
Male sterili-zation
Pills
IUD
Injections
Implants
Condom
Female con-dom
Diaphragm/ foam/ jelly
LAM
Periodic abstinence
With-drawal
Other
Obl
ast
Akm
ola
39.4
1.5
0.3
7.2
41.1
0.0
0.0
7.3
0.2
0.0
0.0
0.9
0.9
1.2
100.
057
.62.
960
.652
9
Akt
obe
52.1
0.6
0.0
3.5
38.0
2.2
0.0
1.3
0.0
0.2
0.7
0.8
0.3
0.3
100.
045
.82.
147
.934
8
Alm
aty
59.8
0.1
0.0
6.8
26.9
0.0
0.0
2.2
0.0
0.2
2.6
0.8
0.5
0.1
100.
036
.14.
140
.287
5
Aty
rau
47.6
0.0
0.0
2.8
47.4
0.5
0.0
1.1
0.0
0.0
0.4
0.0
0.0
0.2
100.
051
.70.
752
.423
6
Wes
t Kaz
akhs
tan
37.7
0.4
0.0
7.6
49.2
0.0
0.0
2.1
0.0
0.0
1.5
0.0
1.0
0.5
100.
059
.23.
062
.338
8
Zham
byl
57.2
0.0
0.0
1.8
39.2
0.2
0.0
1.2
0.0
0.0
0.0
0.2
0.2
0.0
100.
042
.40.
442
.851
0
Kara
gand
y 45
.01.
00.
05.
837
.20.
50.
27.
50.
00.
01.
10.
80.
30.
610
0.0
52.2
2.9
55.0
799
Kost
anai
39
.61.
00.
09.
639
.90.
20.
05.
60.
00.
30.
70.
70.
71.
710
0.0
56.6
3.8
60.4
584
Kyzy
lord
a 42
.80.
00.
01.
752
.22.
10.
00.
50.
00.
00.
00.
00.
70.
010
0.0
56.5
0.7
57.1
301
Man
gist
au
46.6
0.0
0.0
5.8
44.1
0.0
0.0
3.2
0.0
0.0
0.2
0.0
0.0
0.1
100.
053
.10.
453
.418
3
Sout
h Ka
zakh
stan
73
.40.
30.
02.
621
.50.
20.
01.
40.
00.
10.
20.
10.
20.
010
0.0
26.1
0.5
26.6
1 15
5
Pavl
odar
39
.00.
70.
05.
741
.90.
30.
09.
50.
00.
50.
50.
70.
60.
610
0.0
58.6
2.4
61.0
463
Nor
th K
azak
hsta
n 44
.50.
60.
08.
036
.80.
30.
36.
60.
00.
30.
00.
70.
61.
310
0.0
53.0
2.6
55.5
418
East
Kaz
akhs
tan
38.9
0.5
0.0
9.4
41.5
0.0
0.0
8.5
0.0
0.2
0.6
0.2
0.2
0.0
100.
060
.11.
061
.180
9
Ast
ana
City
38.3
0.0
0.0
16.4
37.3
0.3
0.0
6.3
0.0
0.0
0.0
0.2
0.0
1.2
100.
060
.31.
461
.720
4
Alm
aty
City
44.0
0.8
0.3
15.1
29.2
0.0
0.0
9.7
0.0
0.3
0.0
0.3
0.0
0.3
100.
055
.40.
555
.954
7
Resi
denc
e
Urb
an46
.00.
50.
19.
235
.70.
40.
16.
00.
00.
20.
50.
40.
30.
610
0.0
52.2
1.8
54.0
4 65
2
Rura
l53
.50.
60.
03.
536
.80.
20.
03.
30.
00.
00.
90.
40.
50.
310
0.0
44.4
2.1
46.5
3 69
7
* M
ICS
indi
cato
r 21;
MD
G in
dica
tor 1
9C
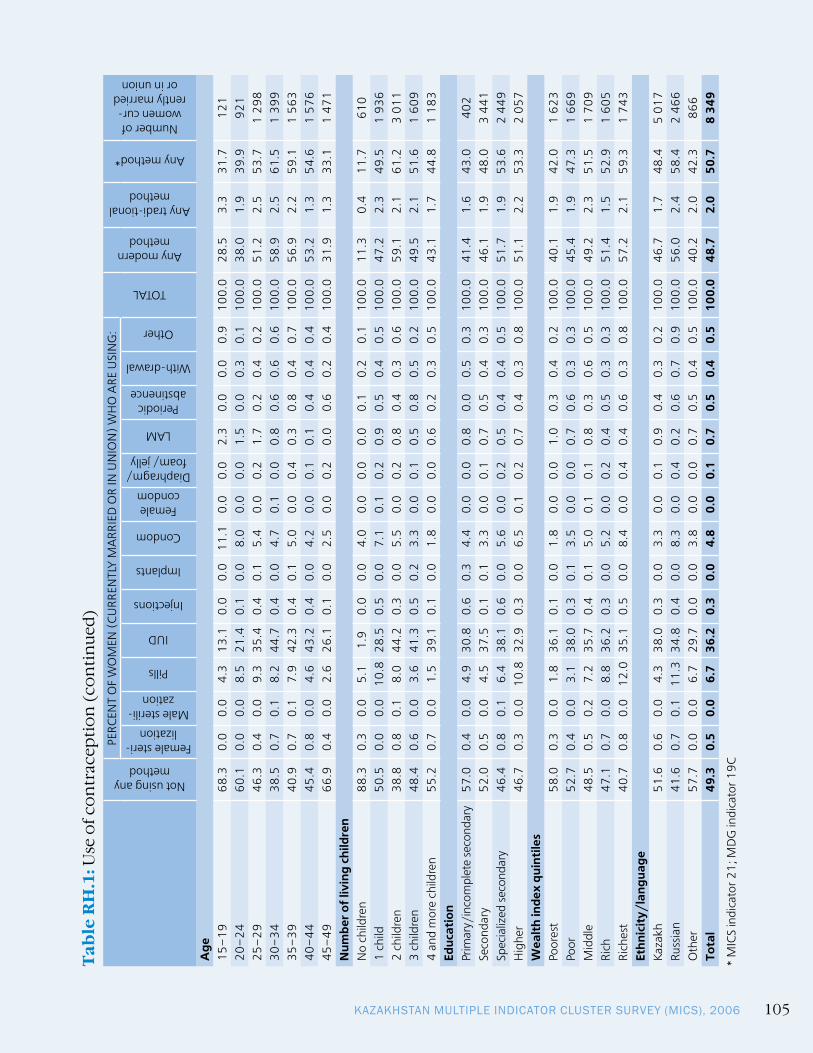
KAZAKHSTAN MULTIPLE INDICATOR CLUSTER SURVEY (MICS), 2006 105
Tab
le R
H.1
: Use
of c
on
trac
epti
on
(co
nti
nue
d)
Not using any method
PERC
ENT
OF
WO
MEN
(CU
RREN
TLY
MA
RRIE
D O
R IN
UN
ION
) W
HO
ARE
USI
NG
:
TOTAL
Any modern method
Any tradi-tional method
Any method*
Number of women cur-
rently married or in union
Female steri-lization
Male sterili-zation
Pills
IUD
Injections
Implants
Condom
Female condom
Diaphragm/ foam/ jelly
LAM
Periodic abstinence
With-drawal
Other
Age
15–
19
68.3
0.0
0.0
4.3
13.1
0.0
0.0
11.1
0.0
0.0
2.3
0.0
0.0
0.9
100.
028
.53.
331
.712
120
–24
60
.10.
00.
08.
521
.40.
10.
08.
00.
00.
01.
50.
00.
30.
110
0.0
38.0
1.9
39.9
921
25–
29
46.3
0.4
0.0
9.3
35.4
0.4
0.1
5.4
0.0
0.2
1.7
0.2
0.4
0.2
100.
051
.22.
553
.71
298
30–
34
38.5
0.7
0.1
8.2
44.7
0.4
0.0
4.7
0.1
0.0
0.8
0.6
0.6
0.6
100.
058
.92.
561
.51
399
35–
39
40.9
0.7
0.1
7.9
42.3
0.4
0.1
5.0
0.0
0.4
0.3
0.8
0.4
0.7
100.
056
.92.
259
.11
563
40–
44
45.4
0.8
0.0
4.6
43.2
0.4
0.0
4.2
0.0
0.1
0.1
0.4
0.4
0.4
100.
053
.21.
354
.61
576
45–
49
66.9
0.4
0.0
2.6
26.1
0.1
0.0
2.5
0.0
0.2
0.0
0.6
0.2
0.4
100.
031
.91.
333
.11
471
Num
ber o
f liv
ing
child
ren
No
child
ren
88.3
0.3
0.0
5.1
1.9
0.0
0.0
4.0
0.0
0.0
0.0
0.1
0.2
0.1
100.
011
.30.
411
.761
01
child
50.5
0.0
0.0
10.8
28.5
0.5
0.0
7.1
0.1
0.2
0.9
0.5
0.4
0.5
100.
047
.22.
349
.51
936
2 ch
ildre
n38
.80.
80.
18.
044
.20.
30.
05.
50.
00.
20.
80.
40.
30.
610
0.0
59.1
2.1
61.2
3 01
13
child
ren
48.4
0.6
0.0
3.6
41.3
0.5
0.2
3.3
0.0
0.1
0.5
0.8
0.5
0.2
100.
049
.52.
151
.61
609
4 an
d m
ore
child
ren
55.2
0.7
0.0
1.5
39.1
0.1
0.0
1.8
0.0
0.0
0.6
0.2
0.3
0.5
100.
043
.11.
744
.81
183
Educ
atio
nPr
imar
y/in
com
plet
e se
cond
ary
57.0
0.4
0.0
4.9
30.8
0.6
0.3
4.4
0.0
0.0
0.8
0.0
0.5
0.3
100.
041
.41.
643
.040
2Se
cond
ary
52.0
0.5
0.0
4.5
37.5
0.1
0.1
3.3
0.0
0.1
0.7
0.5
0.4
0.3
100.
046
.11.
948
.03
441
Spec
ializ
ed s
econ
dary
46.4
0.8
0.1
6.4
38.1
0.6
0.0
5.6
0.0
0.2
0.5
0.4
0.4
0.5
100.
051
.71.
953
.62
449
Hig
her
46.7
0.3
0.0
10.8
32.9
0.3
0.0
6.5
0.1
0.2
0.7
0.4
0.3
0.8
100.
051
.12.
253
.32
057
Wea
lth
inde
x qu
inti
les
Poor
est
58.0
0.3
0.0
1.8
36.1
0.1
0.0
1.8
0.0
0.0
1.0
0.3
0.4
0.2
100.
040
.11.
942
.01
623
Poor
52.7
0.4
0.0
3.1
38.0
0.3
0.1
3.5
0.0
0.0
0.7
0.6
0.3
0.3
100.
045
.41.
947
.31
669
Mid
dle
48.5
0.5
0.2
7.2
35.7
0.4
0.1
5.0
0.1
0.1
0.8
0.3
0.6
0.5
100.
049
.22.
351
.51
709
Rich
47.1
0.7
0.0
8.8
36.2
0.3
0.0
5.2
0.0
0.2
0.4
0.5
0.3
0.3
100.
051
.41.
552
.91
605
Rich
est
40.7
0.8
0.0
12.0
35.1
0.5
0.0
8.4
0.0
0.4
0.4
0.6
0.3
0.8
100.
057
.22.
159
.31
743
Ethn
icit
y/la
ngua
geKa
zakh
51.6
0.6
0.0
4.3
38.0
0.3
0.0
3.3
0.0
0.1
0.9
0.4
0.3
0.2
100.
046
.71.
748
.45
017
Russ
ian
41.6
0.7
0.1
11.3
34.8
0.4
0.0
8.3
0.0
0.4
0.2
0.6
0.7
0.9
100.
056
.02.
458
.42
466
Oth
er57
.70.
00.
06.
729
.70.
00.
03.
80.
00.
00.
70.
50.
40.
510
0.0
40.2
2.0
42.3
866
Tota
l49
.30.
50.
06.
736
.20.
30.
04.
80.
00.
10.
70.
50.
40.
510
0.0
48.7
2.0
50.7
8 34
9
* M
ICS
indi
cato
r 21;
MD
G in
dica
tor 1
9C

MONITORING THE SITUATION OF CHILDREN AND WOMEN106
Tab
le R
H.2
A: R
epro
duc
tive
beh
avio
r o
f wo
men
Perc
enta
ge o
f wo
men
age
d 1
5–49
exp
ress
ed w
illin
gnes
s to
giv
e (o
ne
mo
re)
bir
th a
nd
ab
out
des
irab
le b
irth
sp
ace,
Kaz
akh
stan
, 200
6
Perc
ent o
f wom
en a
ged
15-4
9 w
illin
g to
giv
e bi
rth
Pref
erab
le b
irth
spac
eN
umbe
r of
wom
en
aged
15-4
91
child
2 ch
il-dr
en3
chil-
dren
4 ch
il-dr
en5-
9 ch
ildre
n10
and
mor
e ch
ildre
nN
o ch
il-dr
en1
year
2 ye
ars
3 ye
ars
4 ye
ars
5 an
d m
ore
year
s
Obl
ast
Akm
ola
(3.9
)41
.233
.212
.78.
1(*
)(*
)(9
.1)
28.5
29.1
(9.1
)24
.179
7
Akt
obe
6.1
39.1
29.1
17.2
7.7
(*)
(*)
(4.1
)31
.836
.313
.314
.567
5
Alm
aty
5.3
37.1
33.0
14.8
6.8
(*)
(2.7
)(5
.2)
29.5
46.9
13.2
(5.2
)1
475
Aty
rau
(*)
19.8
37.8
27.3
10.1
(*)
(*)
(*)
32.1
38.7
15.3
12.3
458
Wes
t Kaz
akhs
tan
(3.6
)41
.634
.514
.7(4
.5)
(*)
(*)
(5.0
)33
.542
.710
.58.
269
9
Zham
byl
(*)
25.2
29.2
27.2
14.1
(*)
(*)
8.4
41.0
35.2
7.7
7.6
877
Kara
gand
y 7.
946
.330
.78.
8(5
.0)
(*)
(*)
(5.4
)32
.241
.810
.89.
81
476
Kost
anai
9.
247
.625
.78.
17.
1(*
)(*
)(7
.2)
34.4
32.2
11.4
14.8
1 01
6
Kyzy
lord
a (3
.3)
21.8
21.1
34.1
17.4
(*)
(*)
14.3
49.3
27.5
(3.7
)(5
.1)
528
Man
gist
au
(*)
16.1
36.9
34.8
10.2
(*)
(*)
(5.1
)29
.041
.715
.68.
633
5
Sout
h Ka
zakh
stan
(*
)12
.323
.339
.122
.5(*
)(*
)(3
.6)
32.3
50.7
8.6
(4.9
)1
767
Pavl
odar
6.
944
.331
.410
.7(5
.0)
(*)
(*)
9.7
32.4
32.9
13.0
12.0
820
Nor
th K
azak
hsta
n 10
.850
.425
.38.
0(4
.4)
(*)
(*)
(12.
9)27
.825
.3(1
2.0)
21.9
674
East
Kaz
akhs
tan
9.5
47.7
26.3
8.5
(4.5
)(*
)(3
.5)
10.4
25.3
25.5
15.1
23.8
1 46
7
Ast
ana
City
10.4
52.1
26.0
8.6
(*)
(*)
(*)
17.6
29.9
24.4
12.2
15.8
368
Alm
aty
City
8.3
53.8
26.1
7.1
(*)
(*)
(*)
11.5
35.0
31.2
(9.4
)12
.81
126
Resi
denc
e
Urb
an7.
444
.128
.413
.35.
0(0
.4)
1.3
7.7
32.0
36.0
11.4
12.9
8 65
5
Rura
l3.
728
.529
.222
.514
.0(0
.6)
1.5
6.9
33.4
39.3
10.5
9.9
5 90
3
( )
– in
dica
tors
are
bas
ed o
n 25
-49
case
s of
unw
eigh
ted
obse
rvat
ions
(*)
– in
dica
tors
are
bas
ed o
n le
ss th
an 2
5 ca
ses
of u
nwei
ghte
d ob
serv
atio
ns

KAZAKHSTAN MULTIPLE INDICATOR CLUSTER SURVEY (MICS), 2006 107
Tab
le R
H.2
A: R
epro
duc
tive
beh
avio
r o
f wo
men
(co
nti
nue
d)
Perc
ent o
f wom
en a
ged
15-4
9 w
illin
g to
giv
e bi
rth
Pref
erab
le b
irth
spac
eN
umbe
r of
wom
en
aged
15-4
91
child
2 ch
il-dr
en3
chil-
dren
4 ch
il-dr
en5-
9 ch
ildre
n10
and
mor
e ch
ildre
nN
o ch
il-dr
en1
year
2 ye
ars
3 ye
ars
4 ye
ars
5 an
d m
ore
year
s
Educ
atio
n
Prim
ary/
inco
mpl
ete
seco
ndar
y7.
145
.126
.312
.45.
11.
03.
05.
429
.835
.19.
420
.21
948
Seco
ndar
y 4.
429
.129
.421
.913
.4(0
.7)
1.2
8.2
33.5
37.8
11.6
8.9
4 89
3
Spec
ializ
ed s
econ
dary
6.8
39.9
28.9
15.5
7.5
(*)
(1.1
)7.
334
.236
.711
.010
.83
949
Hig
her
6.4
42.9
29.1
14.8
5.5
(*)
(1.1
)7.
631
.738
.711
.410
.53
768
Age
15-1
96.
652
.526
.510
.12.
2(*
)2.
04.
029
.936
.211
.318
.72
469
20-2
46.
642
.930
.415
.03.
6(*
)1.
16.
532
.739
.112
.69.
12
108
25-2
96.
638
.530
.917
.35.
5(*
)1.
08.
733
.234
.310
.313
.51
894
30-3
45.
233
.830
.119
.89.
4(*
)1.
29.
131
.836
.710
.611
.81
900
35-3
95.
931
.228
.720
.811
.5(*
)1.
312
.031
.536
.511
.98.
12
055
40-4
45.
229
.329
.520
.313
.3(*
)1.
87.
437
.840
.49.
7(4
.7)
2 07
6
45-4
95.
232
.625
.817
.516
.3(1
.3)
1.3
6.0
36.1
41.7
9.2
7.1
2 05
6
Wea
lth
inde
x qu
inti
les
Poor
est
2.9
22.0
27.0
27.2
18.4
(0.7
)(1
.8)
6.5
35.8
40.6
9.7
7.4
2 68
9
Poor
4.7
28.0
30.2
22.2
12.4
(*)
(1.7
)7.
433
.737
.611
.110
.12
728
Mid
dle
4.8
37.7
31.3
17.1
7.2
(*)
(1.4
)6.
532
.037
.112
.212
.32
824
Rich
7.2
46.5
27.7
12.0
4.7
(*)
(1.3
)8.
132
.936
.09.
913
.12
915
Rich
est
9.1
50.5
27.7
9.2
2.6
(*)
(*)
8.1
29.3
35.8
12.2
14.7
3 40
2
Ethn
icit
y/la
ngua
ge
Kaza
kh3.
228
.831
.622
.711
.80.
61.
27.
034
.838
.510
.19.
78
609
Russ
ian
11.4
57.1
23.2
4.3
2.4
0.2
1.4
8.3
27.6
33.3
13.2
17.6
4 48
1
Oth
er5.
031
.229
.122
.59.
30.
62.
47.
133
.041
.410
.87.
71
468
Tota
l5.
937
.728
.717
.08.
70.
51.
47.
432
.637
.311
.111
.714
558
( )
– in
dica
tors
are
bas
ed o
n 25
-49
case
s of
unw
eigh
ted
obse
rvat
ions
(*)
– in
dica
tors
are
bas
ed o
n le
ss th
an 2
5 ca
ses
of u
nwei
ghte
d ob
serv
atio
ns
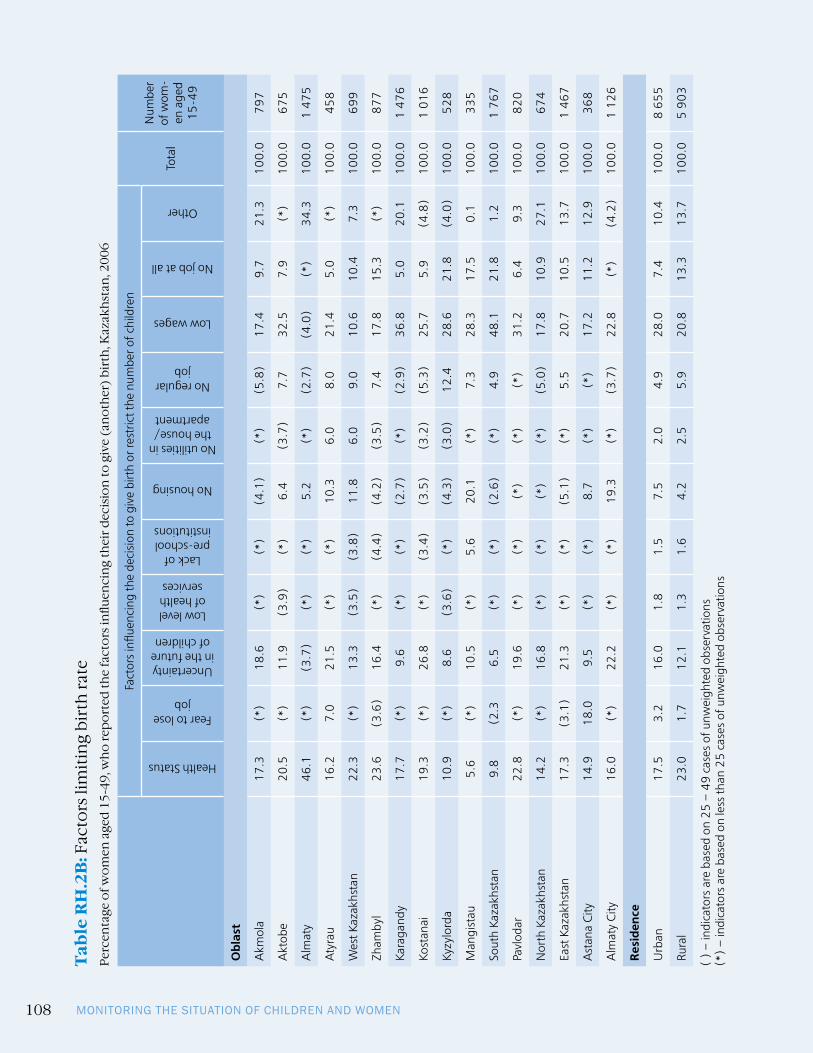
MONITORING THE SITUATION OF CHILDREN AND WOMEN108
Tab
le R
H.2
B: F
acto
rs li
mit
ing
bir
th r
ate
Perc
enta
ge o
f wo
men
age
d 1
5-49
, wh
o r
epo
rted
the
fact
ors
influ
enci
ng
thei
r d
ecis
ion
to g
ive
(an
oth
er)
bir
th, K
azak
hst
an, 2
006
Fact
ors
influ
enci
ng th
e de
cisi
on to
giv
e bi
rth
or re
stric
t the
num
ber o
f chi
ldre
n
Tota
l
Num
ber
of w
om-
en a
ged
15-4
9
Health Status
Fear to lose job
Uncertainty in the future of children
Low level of health services
Lack of pre-school institutions
No housing
No utilities in the house/apartment
No regular job
Low wages
No job at all
Other
Obl
ast
Akm
ola
17.3
(*)
18.6
(*)
(*)
(4.1
)(*
)(5
.8)
17.4
9.7
21.3
100.
079
7
Akt
obe
20.5
(*)
11.9
(3.9
)(*
)6.
4(3
.7)
7.7
32.5
7.9
(*)
100.
067
5
Alm
aty
46.1
(*)
(3.7
)(*
)(*
)5.
2(*
)(2
.7)
(4.0
)(*
)34
.310
0.0
1 47
5
Aty
rau
16.2
7.0
21.5
(*)
(*)
10.3
6.0
8.0
21.4
5.0
(*)
100.
045
8
Wes
t Kaz
akhs
tan
22.3
(*)
13.3
(3.5
)(3
.8)
11.8
6.0
9.0
10.6
10.4
7.3
100.
069
9
Zham
byl
23.6
(3.6
)16
.4(*
)(4
.4)
(4.2
)(3
.5)
7.4
17.8
15.3
(*)
100.
087
7
Kara
gand
y 17
.7(*
)9.
6(*
)(*
)(2
.7)
(*)
(2.9
)36
.85.
020
.110
0.0
1 47
6
Kost
anai
19
.3(*
)26
.8(*
)(3
.4)
(3.5
)(3
.2)
(5.3
)25
.75.
9(4
.8)
100.
01
016
Kyzy
lord
a 10
.9(*
)8.
6(3
.6)
(*)
(4.3
)(3
.0)
12.4
28.6
21.8
(4.0
)10
0.0
528
Man
gist
au
5.6
(*)
10.5
(*)
5.6
20.1
(*)
7.3
28.3
17.5
0.1
100.
033
5
Sout
h Ka
zakh
stan
9.
8(2
.36.
5(*
)(*
)(2
.6)
(*)
4.9
48.1
21.8
1.2
100.
01
767
Pavl
odar
22
.8(*
)19
.6(*
)(*
)(*
)(*
)(*
)31
.26.
49.
310
0.0
820
Nor
th K
azak
hsta
n 14
.2(*
)16
.8(*
)(*
)(*
)(*
)(5
.0)
17.8
10.9
27.1
100.
067
4
East
Kaz
akhs
tan
17.3
(3.1
)21
.3(*
)(*
)(5
.1)
(*)
5.5
20.7
10.5
13.7
100.
01
467
Ast
ana
City
14.9
18.0
9.5
(*)
(*)
8.7
(*)
(*)
17.2
11.2
12.9
100.
036
8
Alm
aty
City
16.0
(*)
22.2
(*)
(*)
19.3
(*)
(3.7
)22
.8(*
)(4
.2)
100.
01
126
Resi
denc
e
Urb
an17
.53.
216
.01.
81.
57.
52.
04.
928
.07.
410
.410
0.0
8 65
5
Rura
l23
.01.
712
.11.
31.
64.
22.
55.
920
.813
.313
.710
0.0
5 90
3
( )
– in
dica
tors
are
bas
ed o
n 25
– 4
9 ca
ses
of u
nwei
ghte
d ob
serv
atio
ns(*
) –
indi
cato
rs a
re b
ased
on
less
than
25
case
s of
unw
eigh
ted
obse
rvat
ions
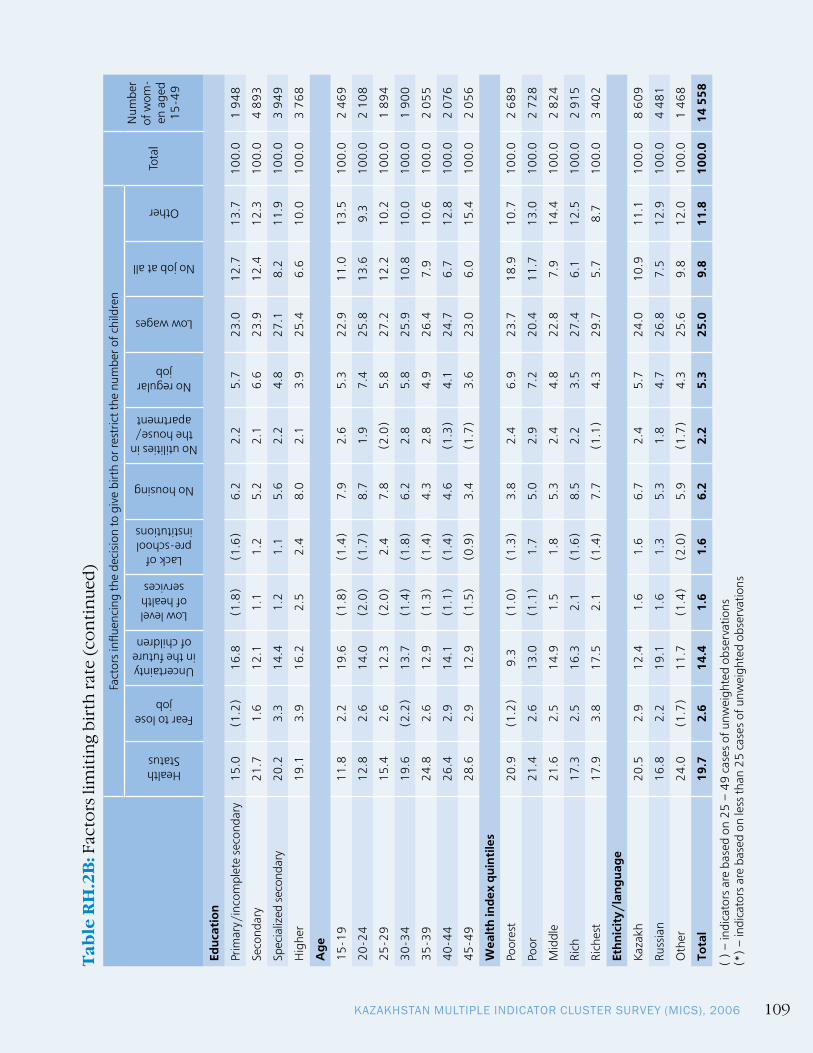
KAZAKHSTAN MULTIPLE INDICATOR CLUSTER SURVEY (MICS), 2006 109
Tab
le R
H.2
B: F
acto
rs li
mit
ing
bir
th r
ate
(co
nti
nue
d)
Fact
ors
influ
enci
ng th
e de
cisi
on to
giv
e bi
rth
or re
stric
t the
num
ber o
f chi
ldre
n
Tota
l
Num
ber
of w
om-
en a
ged
15-4
9
Health Status
Fear to lose job
Uncertainty in the future of children
Low level of health services
Lack of pre-school institutions
No housing
No utilities in the house/apartment
No regular job
Low wages
No job at all
Other
Educ
atio
n
Prim
ary/
inco
mpl
ete
seco
ndar
y15
.0(1
.2)
16.8
(1.8
)(1
.6)
6.2
2.2
5.7
23.0
12.7
13.7
100.
01
948
Seco
ndar
y 21
.71.
612
.11.
11.
25.
22.
16.
623
.912
.412
.310
0.0
4 89
3
Spec
ializ
ed s
econ
dary
20.2
3.3
14.4
1.2
1.1
5.6
2.2
4.8
27.1
8.2
11.9
100.
03
949
Hig
her
19.1
3.9
16.2
2.5
2.4
8.0
2.1
3.9
25.4
6.6
10.0
100.
03
768
Age
15-1
911
.82.
219
.6(1
.8)
(1.4
)7.
92.
65.
322
.911
.013
.510
0.0
2 46
9
20-2
412
.82.
614
.0(2
.0)
(1.7
)8.
71.
97.
425
.813
.69.
310
0.0
2 10
8
25-2
915
.42.
612
.3(2
.0)
2.4
7.8
(2.0
)5.
827
.212
.210
.210
0.0
1 89
4
30-3
419
.6(2
.2)
13.7
(1.4
)(1
.8)
6.2
2.8
5.8
25.9
10.8
10.0
100.
01
900
35-3
924
.82.
612
.9(1
.3)
(1.4
)4.
32.
84.
926
.47.
910
.610
0.0
2 05
5
40-4
426
.42.
914
.1(1
.1)
(1.4
)4.
6(1
.3)
4.1
24.7
6.7
12.8
100.
02
076
45-4
928
.62.
912
.9(1
.5)
(0.9
)3.
4(1
.7)
3.6
23.0
6.0
15.4
100.
02
056
Wea
lth
inde
x qu
inti
les
Poor
est
20.9
(1.2
)9.
3(1
.0)
(1.3
)3.
82.
46.
923
.718
.910
.710
0.0
2 68
9
Poor
21.4
2.6
13.0
(1.1
)1.
75.
02.
97.
220
.411
.713
.010
0.0
2 72
8
Mid
dle
21.6
2.5
14.9
1.5
1.8
5.3
2.4
4.8
22.8
7.9
14.4
100.
02
824
Rich
17.3
2.5
16.3
2.1
(1.6
)8.
52.
23.
527
.46.
112
.510
0.0
2 91
5
Rich
est
17.9
3.8
17.5
2.1
(1.4
)7.
7(1
.1)
4.3
29.7
5.7
8.7
100.
03
402
Ethn
icit
y/la
ngua
ge
Kaza
kh20
.52.
912
.41.
61.
66.
72.
45.
724
.010
.911
.110
0.0
8 60
9
Russ
ian
16.8
2.2
19.1
1.6
1.3
5.3
1.8
4.7
26.8
7.5
12.9
100.
04
481
Oth
er24
.0(1
.7)
11.7
(1.4
)(2
.0)
5.9
(1.7
)4.
325
.69.
812
.010
0.0
1 46
8
Tota
l19
.72.
614
.41.
61.
66.
22.
25.
325
.09.
811
.810
0.0
14 5
58
( )
– in
dica
tors
are
bas
ed o
n 25
– 4
9 ca
ses
of u
nwei
ghte
d ob
serv
atio
ns(*
) –
indi
cato
rs a
re b
ased
on
less
than
25
case
s of
unw
eigh
ted
obse
rvat
ions

MONITORING THE SITUATION OF CHILDREN AND WOMEN110
Tab
le R
H.2
C: F
acto
rs s
tim
ulat
ing
bir
th r
ate
Perc
enta
ge o
f wo
men
age
d 1
5–49
, wh
o r
epo
rted
the
fact
ors
influ
enci
ng
thei
r d
ecis
ion
to g
ive
(an
oth
er)
bir
th, K
azak
hst
an, 2
006
Mea
sure
s in
fluen
cing
the
deci
sion
to g
ive
(ano
ther
) bi
rth
Tota
lN
umbe
r of
wom
en a
ged
15-4
9 Su
ffici
ent f
am-
ily a
llow
ance
sSu
ffici
ent p
aid
mat
erni
ty le
ave
Gra
ntin
g cr
ed-
its a
nd lo
ans
Shor
tene
d w
orki
ng d
ay fo
r br
east
feed
ing
mot
hers
Redu
sing
of
retir
emen
t age
fo
r mot
hers
O
ther
Obl
ast
Akm
ola
19.1
13.8
(7.6
)(*
)12
.446
.210
0.0
797
Akt
obe
13.5
26.8
12.6
14.5
20.2
12.3
100.
067
5
Alm
aty
19.4
18.6
5.7
(*)
(2.5
)52
.110
0.0
1 47
5
Aty
rau
9.3
32.1
11.9
6.8
23.2
16.7
100.
045
8
Wes
t Kaz
akhs
tan
16.4
29.7
21.6
5.8
13.4
13.1
100.
069
9
Zham
byl
26.3
36.9
13.4
5.2
13.2
4.9
100.
087
7
Kara
gand
y 11
.831
.26.
99.
828
.212
.110
0.0
1 47
6
Kost
anai
33
.730
.26.
8(3
.1)
17.3
8.9
100.
01
016
Kyzy
lord
a 19
.631
.76.
610
.222
.79.
310
0.0
528
Man
gist
au
(*)
(3.4
)18
.830
.938
.36.
110
0.0
335
Sout
h Ka
zakh
stan
14
.518
.322
.04.
136
.24.
910
0.0
1 76
7
Pavl
odar
(5
.0)
10.4
13.2
17.4
22.9
31.0
100.
082
0
Nor
th K
azak
hsta
n 11
.712
.6(6
.8)
(*)
10.5
56.6
100.
067
4
East
Kaz
akhs
tan
23.2
13.0
(4.6
)(*
)16
.641
.610
0.0
1 46
7
Ast
ana
City
10.1
23.0
16.6
(5.2
)30
.215
.010
0.0
368
Alm
aty
City
(5.4
)14
.324
.430
.418
.17.
310
0.0
1 12
6
Resi
denc
e
Urb
an13
.821
.913
.510
.720
.919
.210
0.0
8 65
5
Rura
l19
.720
.710
.24.
418
.326
.710
0.0
5 90
3
( )
– in
dica
tors
are
bas
ed o
n 25
-49
case
s of
unw
eigh
ted
obse
rvat
ions
(*)
– in
dica
tors
are
bas
ed o
n le
ss th
an 2
5 ca
ses
of u
nwei
ghte
d ob
serv
atio
ns

KAZAKHSTAN MULTIPLE INDICATOR CLUSTER SURVEY (MICS), 2006 111
Tab
le R
H.2
C: F
acto
rs s
tim
ulat
ing
bir
th r
ate
(co
nti
nue
d)
Mea
sure
s in
fluen
cing
the
deci
sion
to g
ive
(ano
ther
) bi
rth
Tota
lN
umbe
r of
wom
en a
ged
15-4
9 Su
ffici
ent f
am-
ily a
llow
ance
sSu
ffici
ent p
aid
mat
erni
ty le
ave
Gra
ntin
g cr
ed-
its a
nd lo
ans
Shor
tene
d w
orki
ng d
ay fo
r br
east
feed
ing
mot
hers
Redu
sing
of
retir
emen
t age
fo
r mot
hers
O
ther
Educ
atio
n
Prim
ary/
inco
mpl
ete
seco
ndar
y21
.222
.212
.46.
614
.822
.710
0.0
1 94
8
Seco
ndar
y 17
.820
.311
.96.
120
.523
.310
0.0
4 89
3
Spec
ializ
ed s
econ
dary
15.0
21.1
11.5
7.8
20.4
24.1
100.
03
949
Hig
her
12.8
22.8
12.9
11.9
20.8
18.7
100.
03
768
Age
15-1
918
.825
.115
.68.
313
.119
.010
0.0
2 46
9
20-2
417
.622
.816
.410
.917
.514
.810
0.0
2 10
8
25-2
917
.325
.313
.98.
718
.416
.410
0.0
1 89
4
30-3
417
.821
.611
.88.
320
.020
.510
0.0
1 90
0
35-3
915
.920
.010
.67.
621
.624
.310
0.0
2 05
5
40-4
413
.719
.27.
96.
525
.327
.410
0.0
2 07
6
45-4
912
.115
.58.
26.
624
.033
.610
0.0
2 05
6
Wea
lth
inde
x qu
inti
les
Poor
est
19.9
20.0
14.0
4.0
21.5
20.6
100.
02
689
Poor
20.6
22.3
9.0
4.6
18.2
25.4
100.
02
728
Mid
dle
16.2
21.1
9.9
7.2
18.1
27.6
100.
02
824
Rich
14.0
21.0
13.6
9.7
20.6
21.1
100.
02
915
Rich
est
11.6
22.6
13.9
13.7
20.6
17.7
100.
03
402
Ethn
icit
y/la
ngua
ge
Kaza
kh15
.821
.812
.78.
021
.420
.210
0.0
8 60
9
Russ
ian
16.4
20.9
10.9
8.6
16.2
26.9
100.
04
481
Oth
er17
.820
.812
.57.
621
.519
.810
0.0
1 46
8
Tota
l16
.221
.412
.18.
119
.822
.310
0.0
14 5
58
( )
– in
dica
tors
are
bas
ed o
n 25
-49
case
s of
unw
eigh
ted
obse
rvat
ions
(*)
– in
dica
tors
are
bas
ed o
n le
ss th
an 2
5 ca
ses
of u
nwei
ghte
d ob
serv
atio
ns

MONITORING THE SITUATION OF CHILDREN AND WOMEN112
Tab
le R
H.3
: An
ten
atal
car
e p
rovi
der
Perc
ent d
istr
ibut
ion
of w
omen
age
d 15
-49
wh
o ga
ve b
irth
in th
e tw
o ye
ars
pre
cedi
ng
the
surv
ey b
y ty
pe
of p
erso
nn
el p
rovi
din
g an
ten
atal
car
e, K
azak
hst
an, 2
006
Pe
rson
pro
vidi
ng a
nten
atal
car
eN
o an
te-
nata
l car
e re
ceiv
edTo
tal
Any
ski
lled
pers
onne
l*
Num
ber o
f wom
en
who
gav
e bi
rth
in th
e pr
eced
ing
two
year
sM
edic
al
doct
orN
urse
/ m
idw
ifeA
uxili
ary
mid
wife
Trad
ition
al
birt
h at
tend
ant
Oth
er
Obl
ast
Akm
ola
79.9
17.3
0.0
2.8
0.0
0.0
100.
010
0.0
80
Akt
obe
88.3
10.0
0.0
1.7
0.0
0.0
100.
010
0.0
68
Alm
aty
83.8
14.1
0.0
1.6
0.5
0.0
100.
099
.522
5
Aty
rau
88.0
12.0
0.0
0.0
0.0
0.0
100.
010
0.0
53
Wes
t Kaz
akhs
tan
89.5
4.7
1.1
4.7
0.0
0.0
100.
010
0.0
58
Zham
byl
84.2
12.6
1.6
1.6
0.0
0.0
100.
010
0.0
139
Kara
gand
y 95
.14.
00.
00.
90.
00.
010
0.0
100.
012
9
Kost
anai
79
.512
.50.
08.
00.
00.
010
0.0
100.
084
Kyzy
lord
a 86
.510
.90.
02.
60.
00.
010
0.0
100.
080
Man
gist
au
(95.
3)(4
.7)
(0.0
)(0
.0)
(0.0
)(0
.0)
100.
010
0.0
45
Sout
h Ka
zakh
stan
94
.25.
80.
00.
00.
00.
010
0.0
100.
030
9
Pavl
odar
88
.910
.10.
01.
00.
00.
010
0.0
100.
083
Nor
th K
azak
hsta
n 98
.60.
00.
01.
40.
00.
010
0.0
100.
061
East
Kaz
akhs
tan
83.8
11.0
0.0
4.3
0.0
0.9
100.
099
.114
1
Ast
ana
City
(92.
9)(7
.1)
(0.0
)(0
.0)
(0.0
)(0
.0)
100.
010
0.0
40
Alm
aty
City
95.2
4.8
0.0
0.0
0.0
0.0
100.
010
0.0
124
Resi
denc
e
Urb
an95
.24.
80.
00.
00.
00.
010
0.0
100.
089
0
Rura
l82
.113
.70.
33.
60.
10.
210
0.0
99.7
829
* M
ICS
indi
cato
r 20
( )
– in
dica
tors
are
bas
ed o
n 25
-49
case
s of
unw
eigh
ted
obse
rvat
ions
(*)
– in
dica
tors
are
bas
ed o
n le
ss th
an 2
5 ca
ses
of u
nwei
ghte
d ob
serv
atio
ns

KAZAKHSTAN MULTIPLE INDICATOR CLUSTER SURVEY (MICS), 2006 113
Tab
le R
H.3
: An
ten
atal
car
e p
rovi
der
(co
nti
nue
d)
Pe
rson
pro
vidi
ng a
nten
atal
car
eN
o an
te-
nata
l car
e re
ceiv
edTo
tal
Any
ski
lled
pers
onne
l*
Num
ber o
f wom
en
who
gav
e bi
rth
in th
e pr
eced
ing
two
year
sM
edic
al
doct
orN
urse
/ m
idw
ifeA
uxili
ary
mid
wife
Trad
ition
al
birt
h at
tend
ant
Oth
er
Age
15–
19
85.7
8.8
0.0
5.5
0.0
0.0
100.
010
0.0
64
20–
24
88.2
9.9
0.3
1.4
0.2
0.0
100.
099
.850
7
25–
29
91.3
7.4
0.3
0.7
0.0
0.3
100.
099
.850
1
30–
34
88.5
8.8
0.0
2.7
0.0
0.0
100.
010
0.0
369
35–
39
85.4
12.7
0.0
1.9
0.0
0.0
100.
010
0.0
208
40–
44
92.1
5.9
0.0
2.0
0.0
0.0
100.
010
0.0
61
45–
49
(*)
(*)
(*)
(*)
(*)
(*)
100.
010
0.0
9
Educ
atio
n
Prim
ary/
inco
mpl
ete
seco
ndar
y79
.614
.20.
05.
10.
01.
110
0.0
98.9
112
Seco
ndar
y 87
.110
.80.
31.
70.
10.
010
0.0
99.8
734
Spec
ializ
ed s
econ
dary
91.0
7.3
0.0
1.7
0.0
0.0
100.
010
0.0
416
Hig
her
92.2
6.7
0.1
1.0
0.0
0.0
100.
010
0.0
457
Wea
lth
inde
x qu
inti
les
Poor
est
80.9
15.3
0.2
3.3
0.3
0.0
100.
099
.745
8
Poor
88.1
8.1
0.6
2.9
0.0
0.3
100.
099
.634
8
Mid
dle
90.0
9.1
0.0
0.9
0.0
0.0
100.
010
0.0
330
Rich
95.6
4.0
0.0
0.4
0.0
0.0
100.
010
0.0
280
Rich
est
94.5
5.5
0.0
0.0
0.0
0.0
100.
010
0.0
303
Ethn
icit
y/la
ngua
ge
Kaza
kh88
.79.
80.
21.
20.
10.
010
0.0
99.9
1 16
3
Russ
ian
89.3
6.7
0.0
3.7
0.0
0.3
100.
099
.634
3
Oth
er89
.39.
30.
01.
40.
00.
010
0.0
100.
021
3
Tota
l88
.99.
10.
11.
70.
10.
110
0.0
99.9
1 71
9
* M
ICS
indi
cato
r 20
( )
– in
dica
tors
are
bas
ed o
n 25
-49
case
s of
unw
eigh
ted
obse
rvat
ions
(*)
– in
dica
tors
are
bas
ed o
n le
ss th
an 2
5 ca
ses
of u
nwei
ghte
d ob
serv
atio
ns

MONITORING THE SITUATION OF CHILDREN AND WOMEN114
Tab
le R
H.4
: An
ten
atal
car
ePe
rcen
tage
of p
regn
ant w
om
en r
ecei
vin
g an
ten
atal
car
e am
on
g w
om
en a
ged
15-
49 y
ears
wh
o g
ave
bir
th in
two
yea
rs p
rece
din
g th
e su
rvey
an
d p
erce
nta
ge o
f p
regn
ant w
om
en r
ecei
vin
g sp
ecifi
c ca
re a
s p
art o
f th
e an
ten
atal
car
e re
ceiv
ed, K
azak
hst
an, 2
006
Pe
rcen
t of w
omen
re
ceiv
ing
anc
one
or
mor
e tim
es d
urin
g pr
egna
ncy
PERC
ENTA
GE
OF
PREG
NA
NT
WO
MEN
REC
EIV
ING
AN
TEN
ATA
L CA
REN
umbe
r of w
omen
w
ho g
ave
birt
h in
tw
o ye
ars
prec
edin
g su
rvey
Bloo
d te
st ta
ken*
Bloo
d pr
essu
re
mea
sure
d*U
rine
spec
imen
ta
ken*
Wei
ght m
easu
red*
Obl
ast
Akm
ola
100.
010
0.0
100.
010
0.0
100.
080
Akt
obe
100.
010
0.0
100.
010
0.0
97.7
68
Alm
aty
100.
098
.398
.398
.398
.322
5
Aty
rau
100.
097
.410
0.0
97.4
100.
053
Wes
t Kaz
akhs
tan
100.
010
0.0
100.
010
0.0
100.
058
Zham
byl
100.
010
0.0
100.
010
0.0
100.
013
9
Kara
gand
y 10
0.0
100.
010
0.0
100.
010
0.0
129
Kost
anai
10
0.0
100.
010
0.0
100.
098
.784
Kyzy
lord
a 10
0.0
100.
010
0.0
100.
010
0.0
80
Man
gist
au
100.
0(1
00.0
)(1
00.0
)(1
00.0
)(1
00.0
)45
Sout
h Ka
zakh
stan
10
0.0
99.6
99.6
99.6
99.6
309
Pavl
odar
10
0.0
100.
010
0.0
100.
010
0.0
83
Nor
th K
azak
hsta
n 10
0.0
100.
096
.410
0.0
100.
061
East
Kaz
akhs
tan
99.1
99.1
99.1
99.1
99.1
141
Ast
ana
City
100.
0(9
8.8)
(98.
8)(9
8.8)
(98.
8)40
Alm
aty
City
100.
010
0.0
100.
010
0.0
100.
012
4
Resi
denc
e
Urb
an10
0.0
99.8
99.6
99.8
99.7
890
Rura
l99
.999
.399
.399
.399
.282
9
* M
ICS
indi
cato
r 44
( )
– in
dica
tors
are
bas
ed o
n 25
-49
case
s of
unw
eigh
ted
obse
rvat
ions
(*)
– in
dica
tors
are
bas
ed o
n le
ss th
an 2
5 ca
ses
of u
nwei
ghte
d ob
serv
atio
ns

KAZAKHSTAN MULTIPLE INDICATOR CLUSTER SURVEY (MICS), 2006 115
Tab
le R
H.4
: An
ten
atal
car
e (c
on
tin
ued
)
Perc
ent o
f wom
en
rece
ivin
g an
c on
e or
m
ore
times
dur
ing
preg
nanc
y
Perc
enta
ge o
f pre
gnan
t wom
en re
ceiv
ing
ante
nata
l car
eN
umbe
r of w
omen
w
ho g
ave
birt
h in
tw
o ye
ars
prec
edin
g su
rvey
Bloo
d te
st ta
ken*
Bloo
d pr
essu
re
mea
sure
d*U
rine
spec
imen
ta
ken*
Wei
ght m
easu
red*
Age
15–
19
100.
010
0.0
100.
010
0.0
100.
064
20–
24
100.
010
0.0
99.8
100.
010
0.0
507
25–
29
99.8
99.1
99.2
99.1
98.9
501
30–
34
100.
099
.599
.799
.599
.736
9
35–
39
100.
099
.298
.699
.299
.220
8
40–
44
100.
010
0.0
100.
010
0.0
98.2
61
45–
49
(*)
(*)
(*)
(*)
(*)
9
Educ
atio
n
Prim
ary/
inco
mpl
ete
seco
ndar
y98
.997
.996
.797
.997
.911
2
Seco
ndar
y 10
0.0
99.3
99.4
99.3
99.3
734
Spec
ializ
ed s
econ
dary
100.
099
.999
.999
.999
.941
6
Hig
her
100.
010
0.0
100.
010
0.0
99.7
457
Wea
lth
inde
x qu
inti
les
Poor
est
100.
098
.998
.998
.998
.845
8
Poor
99.6
99.5
99.3
99.5
99.3
348
Mid
dle
100.
099
.599
.699
.599
.933
0
Rich
100.
010
0.0
100.
010
0.0
100.
028
0
Rich
est
100.
010
0.0
100.
010
0.0
99.7
303
Ethn
icit
y/la
ngua
ge
Kaza
kh10
0.0
99.5
99.5
99.5
99.6
1 16
3
Russ
ian
99.6
99.6
99.3
99.6
99.3
343
Oth
er10
0.0
99.5
99.5
99.5
99.0
213
Tota
l99
.999
.599
.599
.599
.51
719
* M
ICS
indi
cato
r 44
( )
– in
dica
tors
are
bas
ed o
n 25
-49
case
s of
unw
eigh
ted
obse
rvat
ions
(*)
– in
dica
tors
are
bas
ed o
n le
ss th
an 2
5 ca
ses
of u
nwei
ghte
d ob
serv
atio
ns

MONITORING THE SITUATION OF CHILDREN AND WOMEN116
Tab
le R
H.5
: Ass
ista
nce
dur
ing
del
iver
yPe
rcen
t dis
trib
utio
n o
f wo
men
age
d 1
5-49
wit
h a
bir
th in
two
yea
rs p
rece
din
g th
e su
rvey
by
typ
e o
f per
son
nel
ass
isti
ng
at d
eliv
ery,
Kaz
akh
stan
, 200
6
Pe
rson
ass
istin
g at
del
iver
yTo
tal
Any
ski
lled
pers
onne
l*
Del
iver
ed in
he
alth
faci
l-ity
**
Num
ber o
f wom
en
who
gav
e bi
rth
in
prec
edin
g tw
o ye
ars
Med
ical
do
ctor
Nur
se/
mid
wife
Aux
iliar
y m
idw
ifeTr
aditi
onal
bi
rth
atte
ndan
tO
ther
Obl
ast
Akm
ola
82.6
17.4
0.0
0.0
0.0
100.
010
0.0
98.6
80
Akt
obe
56.7
41.9
1.4
0.0
0.0
100.
010
0.0
100.
068
Alm
aty
58.1
38.8
3.1
0.0
0.0
100.
010
0.0
100.
022
5
Aty
rau
86.4
13.0
0.6
0.0
0.0
100.
010
0.0
100.
053
Wes
t Kaz
akhs
tan
98.8
1.2
0.0
0.0
0.0
100.
010
0.0
100.
058
Zham
byl
80.8
17.1
2.1
0.0
0.0
100.
010
0.0
100.
013
9
Kara
gand
y 95
.64.
40.
00.
00.
010
0.0
100.
010
0.0
129
Kost
anai
92
.47.
60.
00.
00.
010
0.0
100.
010
0.0
84
Kyzy
lord
a 50
.849
.20.
00.
00.
010
0.0
100.
010
0.0
80
Man
gist
au
(99.
0)(1
.0)
(0.0
)(0
.0)
(0.0
)(1
00.0
)(1
00.0
)(9
9.6)
45
Sout
h Ka
zakh
stan
81
.917
.20.
90.
00.
010
0.0
100.
010
0.0
309
Pavl
odar
94
.45.
60.
00.
00.
010
0.0
100.
010
0.0
83
Nor
th K
azak
hsta
n 87
.98.
50.
00.
03.
610
0.0
96.4
98.6
61
East
Kaz
akhs
tan
84.9
15.1
0.0
0.0
0.0
100.
010
0.0
100.
014
1
Ast
ana
City
(61.
9)(3
6.9)
(0.0
)(1
.2)
(0.0
)(1
00.0
)(9
8.8)
(98.
8)40
Alm
aty
City
100.
00.
00.
00.
00.
010
0.0
100.
098
.812
4
Resi
denc
e
Urb
an88
.710
.80.
30.
10.
110
0.0
99.8
99.8
890
Rura
l72
.526
.01.
40.
00.
110
0.0
99.9
99.7
829
* M
ICS
indi
cato
r 4; M
DG
indi
cato
r 17
** M
ICS
indi
cato
r 5(
) –
indi
cato
rs a
re b
ased
on
25-4
9 ca
ses
of u
nwei
ghte
d ob
serv
atio
ns(*
) –
indi
cato
rs a
re b
ased
on
less
than
25
case
s of
unw
eigh
ted
obse
rvat
ions

KAZAKHSTAN MULTIPLE INDICATOR CLUSTER SURVEY (MICS), 2006 117
Tab
le R
H.5
: Ass
ista
nce
dur
ing
del
iver
y (c
on
tin
ued
)
Pers
on a
ssist
ing
at d
eliv
ery
Tota
lA
ny s
kille
d pe
rson
nel*
Del
iver
ed in
he
alth
faci
l-ity
**
Num
ber o
f wom
en
who
gav
e bi
rth
in
prec
edin
g tw
o ye
ars
Med
ical
do
ctor
Nur
se/
mid
wife
Aux
iliar
y m
idw
ifeTr
aditi
onal
bi
rth
atte
ndan
tO
ther
Age
15–
19
75.3
22.9
1.8
0.0
0.0
100.
010
0.0
100.
064
20–
24
80.7
18.4
0.8
0.0
0.1
100.
099
.899
.850
7
25–
29
79.9
19.1
1.0
0.0
0.0
100.
010
0.0
99.4
501
30–
34
80.1
19.0
0.8
0.1
0.0
100.
099
.910
0.0
369
35–
39
84.4
15.0
0.0
0.0
0.6
100.
099
.499
.920
8
40–
44
86.2
11.9
1.9
0.0
0.0
100.
010
0.0
100.
061
45–
49
(*)
(*)
(*)
(*)
(*)
(*)
(*)
(*)
9
Educ
atio
n
Prim
ary/
inco
mpl
ete
seco
ndar
y81
.117
.21.
70.
00.
010
0.0
100.
010
0.0
112
Seco
ndar
y 77
.621
.60.
70.
00.
110
0.0
99.9
99.7
734
Spec
ializ
ed s
econ
dary
84.7
14.7
0.6
0.0
0.0
100.
010
0.0
100.
041
6
Hig
her
82.6
16.0
1.0
0.1
0.3
100.
099
.699
.645
7
Wea
lth
inde
x qu
inti
les
Poor
est
73.0
26.2
0.8
0.0
0.0
100.
010
0.0
100.
045
8
Poor
76.7
21.9
1.4
0.0
0.0
100.
010
0.0
100.
034
8
Mid
dle
80.5
18.2
1.3
0.0
0.0
100.
010
0.0
99.6
330
Rich
90.0
9.2
0.0
0.0
0.8
100.
099
.299
.728
0
Rich
est
89.5
10.0
0.3
0.2
0.0
100.
099
.899
.430
3
Ethn
icit
y/la
ngua
ge
Kaza
kh78
.820
.40.
70.
00.
110
0.0
99.9
99.8
1 16
3
Russ
ian
87.8
11.8
0.0
0.1
0.3
100.
099
.699
.334
3
Oth
er81
.116
.32.
60.
00.
010
0.0
100.
010
0.0
213
Tota
l80
.918
.20.
80.
00.
110
0.0
99.8
99.8
1 71
9
* M
ICS
indi
cato
r 4; M
DG
indi
cato
r 17
** M
ICS
indi
cato
r 5(
) –
indi
cato
rs a
re b
ased
on
25-4
9 ca
ses
of u
nwei
ghte
d ob
serv
atio
ns(*
) –
indi
cato
rs a
re b
ased
on
less
than
25
case
s of
unw
eigh
ted
obse
rvat
ions
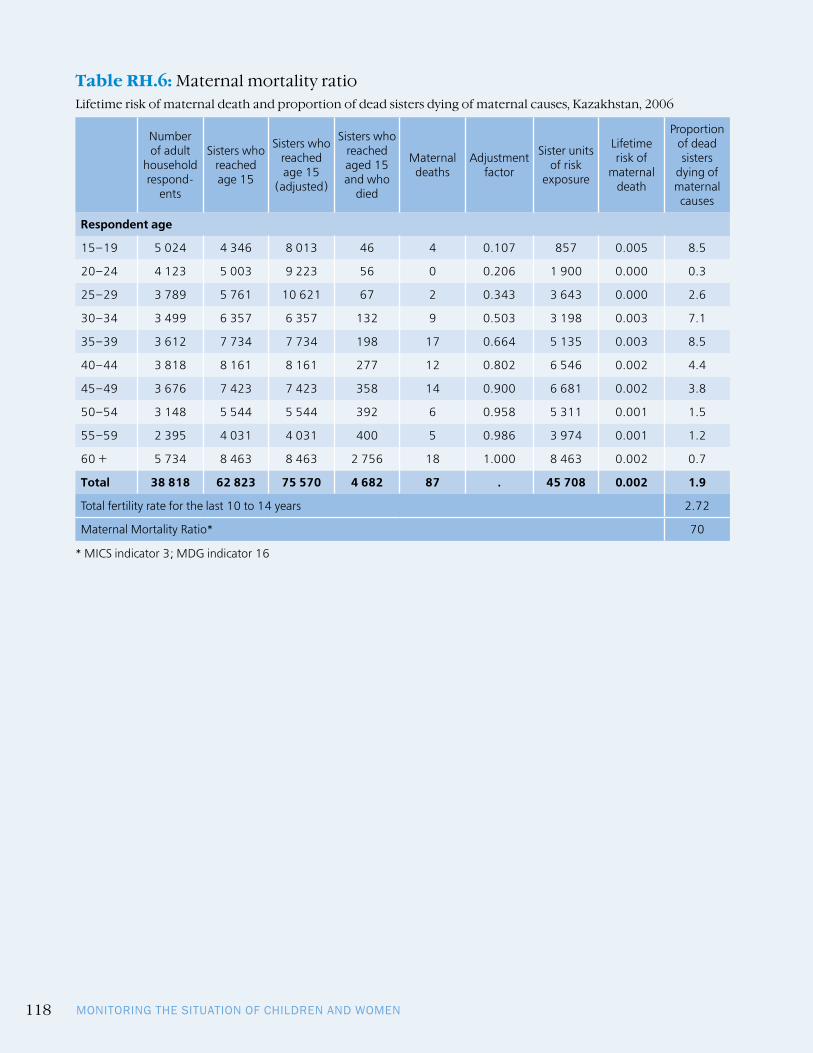
MONITORING THE SITUATION OF CHILDREN AND WOMEN118
Table RH.6: Maternal mortality ratioLifetime risk of maternal death and proportion of dead sisters dying of maternal causes, Kazakhstan, 2006
Number of adult
household respond-
ents
Sisters who reached age 15
Sisters who reached age 15
(adjusted)
Sisters who reached aged 15 and who
died
Maternal deaths
Adjustment factor
Sister units of risk
exposure
Lifetime risk of
maternal death
Proportion of dead sisters
dying of maternal
causes
Respondent age
15–19 5 024 4 346 8 013 46 4 0.107 857 0.005 8.5
20–24 4 123 5 003 9 223 56 0 0.206 1 900 0.000 0.3
25–29 3 789 5 761 10 621 67 2 0.343 3 643 0.000 2.6
30–34 3 499 6 357 6 357 132 9 0.503 3 198 0.003 7.1
35–39 3 612 7 734 7 734 198 17 0.664 5 135 0.003 8.5
40–44 3 818 8 161 8 161 277 12 0.802 6 546 0.002 4.4
45–49 3 676 7 423 7 423 358 14 0.900 6 681 0.002 3.8
50–54 3 148 5 544 5 544 392 6 0.958 5 311 0.001 1.5
55–59 2 395 4 031 4 031 400 5 0.986 3 974 0.001 1.2
60 + 5 734 8 463 8 463 2 756 18 1.000 8 463 0.002 0.7
Total 38 818 62 823 75 570 4 682 87 . 45 708 0.002 1.9
Total fertility rate for the last 10 to 14 years 2.72
Maternal Mortality Ratio* 70
* MICS indicator 3; MDG indicator 16

KAZAKHSTAN MULTIPLE INDICATOR CLUSTER SURVEY (MICS), 2006 119
Tab
le C
D.1
: Fam
ily s
upp
ort
for
lear
nin
gPe
rcen
tage
of c
hild
ren
age
d 0-
59 m
onth
s fo
r wh
om h
ouse
hol
d m
embe
rs a
re e
nga
ged
in a
ctiv
itie
s th
at p
rom
ote
lear
nin
g an
d sc
hoo
l rea
din
ess,
Kaz
akh
stan
, 200
6
PERC
ENTA
GE
OF
CHIL
DRE
N A
GED
0–
59 M
ON
THS
Num
ber o
f ch
ildre
n ag
ed
0–59
mon
ths
For w
hom
hou
seho
ld m
em-
bers
eng
aged
in fo
ur o
r mor
e ac
tiviti
es th
at p
rom
ote
lear
n-in
g an
d sc
hool
read
ines
s*
Mea
n nu
mbe
r of
activ
ities
hou
seho
ld
mem
bers
eng
age
in
with
the
child
For w
hom
the
fath
er e
n-ga
ged
in o
ne o
r mor
e ac
tivi-
ties
that
pro
mot
e le
arni
ng
and
scho
ol re
adin
ess*
*
Mea
n nu
mbe
r of
activ
ities
the
fath
er
enga
ged
in w
ith
the
child
Livi
ng in
a
hous
ehol
d w
ithou
t the
ir na
tura
l fat
her
Sex
Mal
e81
.14.
847
.71.
213
.32
327
Fem
ale
80.9
4.9
46.0
1.1
14.0
2 08
8
Obl
ast
Akm
ola
80.1
4.8
51.6
1.1
15.7
243
Akt
obe
78.7
4.8
59.6
1.1
9.5
181
Alm
aty
60.4
4.0
28.3
0.5
16.4
545
Aty
rau
79.4
4.7
54.6
1.0
8.9
143
Wes
t Kaz
akhs
tan
87.3
5.3
59.0
1.3
14.9
152
Zham
byl
69.7
4.4
32.8
0.8
15.1
345
Kara
gand
y 85
.35.
068
.82.
119
.531
6
Kost
anai
87
.95.
366
.61.
915
.626
7
Kyzy
lord
a 71
.74.
363
.21.
28.
520
9
Man
gist
au
84.3
4.9
83.0
2.0
5.1
109
Sout
h Ka
zakh
stan
94
.35.
411
.70.
25.
582
7
Pavl
odar
86
.15.
172
.52.
417
.119
7
Nor
th K
azak
hsta
n 77
.94.
764
.31.
620
.816
3
East
Kaz
akhs
tan
76.3
4.7
37.6
0.8
20.5
304
Ast
ana
City
88.1
5.2
75.1
2.4
13.5
90
Alm
aty
City
89.6
5.1
79.6
2.4
16.6
324
Resi
denc
e
Urb
an82
.94.
956
.11.
515
.02
251
Rura
l79
.14.
837
.30.
812
.22
164
* M
ICS
indi
cato
r 46
**
MIC
S in
dica
tor 4
7

MONITORING THE SITUATION OF CHILDREN AND WOMEN120
Tab
le C
D.1
: Fam
ily s
upp
ort
for
lear
nin
g (c
on
tin
ued
)PE
RCEN
TAG
E O
F CH
ILD
REN
AG
ED 0
–59
MO
NTH
SN
umbe
r of
child
ren
aged
0–
59 m
onth
s
For w
hom
hou
seho
ld m
em-
bers
eng
aged
in fo
ur o
r mor
e ac
tiviti
es th
at p
rom
ote
lear
n-in
g an
d sc
hool
read
ines
s*
Mea
n nu
mbe
r of
activ
ities
hou
seho
ld
mem
bers
eng
age
in
with
the
child
For w
hom
the
fath
er e
n-ga
ged
in o
ne o
r mor
e ac
tivi-
ties
that
pro
mot
e le
arni
ng
and
scho
ol re
adin
ess*
*
Mea
n nu
mbe
r of
activ
ities
the
fath
er
enga
ged
in w
ith
the
child
Livi
ng in
a
hous
ehol
d w
ithou
t the
ir na
tura
l fat
her
Age
0–23
mon
th63
.14.
045
.11.
011
.41
813
24–
59 m
onth
s93
.55.
448
.11.
315
.12
602
Mot
her’
s ed
ucat
ion
Prim
ary/
inco
mpl
ete
seco
ndar
y81
.64.
930
.50.
721
.730
9
Seco
ndar
y 81
.04.
842
.61.
013
.02
000
Spec
ializ
ed s
econ
dary
79.3
4.8
51.8
1.3
13.8
1 03
0
Hig
her
82.5
5.0
55.0
1.5
12.2
1 07
6
Fath
er’s
edu
cati
on
Prim
ary/
inco
mpl
ete
seco
ndar
y78
.34.
842
.91.
00.
028
0
Seco
ndar
y 81
.04.
846
.71.
10.
01
912
Spec
ializ
ed s
econ
dary
78.3
4.8
61.9
1.6
0.0
765
Hig
her
81.9
4.9
65.1
1.8
0.0
845
Fath
er n
ot in
HH
85.2
5.0
5.3
0.1
100.
060
0
Wea
lth
inde
x qu
inti
les
Poor
est
79.7
4.8
30.0
0.6
11.6
1 18
9
Poor
79.2
4.8
40.9
0.9
13.2
924
Mid
dle
78.5
4.8
46.9
1.1
13.4
869
Rich
82.7
5.0
60.7
1.7
15.1
708
Rich
est
86.9
5.1
68.8
2.0
16.2
725
Ethn
icit
y/la
ngua
ge
Kaza
kh79
.54.
846
.61.
110
.02
924
Russ
ian
84.6
5.1
57.7
1.7
25.1
931
Oth
er83
.14.
930
.60.
713
.256
0
Tota
l81
.04.
946
.91.
213
.64
415
* M
ICS
indi
cato
r 46
**
MIC
S in
dica
tor 4
7

KAZAKHSTAN MULTIPLE INDICATOR CLUSTER SURVEY (MICS), 2006 121
Tab
le C
D.2
: Lea
rnin
g m
ater
ials
Perc
enta
ge o
f ch
ildre
n a
ged
0-5
9 m
on
ths
livin
g in
ho
useh
old
s co
nta
inin
g le
arn
ing
mat
eria
ls, K
azak
hst
an, 2
006
CH
ILD
REN
LIV
ING
IN
HO
USE
HO
LDS
WIT
H:
CHIL
D H
AS:
CHIL
D P
LAYS
WIT
H:
3 or
mor
e ty
pes
of
play
-th
ings
***
Num
ber
of c
hil-
dren
age
d 0–
59
mon
ths
3 or
mor
e no
n-ch
il-dr
en’s
bo
oks*
Med
ian
num
ber
of n
on-
child
ren’
s bo
oks
3 or
mor
e ch
ildre
n’s
book
s**
Med
ian
num
ber o
f ch
ildre
n’s
book
s
Hou
se-
hold
ob
ject
s
Obj
ects
an
d m
ater
i-al
s fo
und
outs
ide
the
hom
e
Hom
e-m
ade
toys
Toys
that
ca
me
from
a
stor
e
No
play
-th
ings
m
en-
tione
d
Sex
Mal
e89
.310
66.1
530
.427
.118
.093
.94.
119
.42
327
Fem
ale
88.9
1066
.85
38.1
23.8
16.3
92.9
5.0
20.2
2 08
8
Obl
ast
Akm
ola
85.5
1071
.35
44.8
37.8
16.5
97.3
2.3
24.0
243
Akt
obe
89.9
1060
.23
23.7
10.3
16.9
96.3
2.3
9.4
181
Alm
aty
86.8
1055
.43
8.0
0.7
6.4
90.2
7.7
0.5
545
Aty
rau
87.3
1063
.24
28.5
14.7
5.5
92.3
5.5
3.8
143
Wes
t Kaz
akhs
tan
91.6
1076
.910
41.4
27.1
19.8
90.8
4.4
24.5
152
Zham
byl
78.7
1050
.23
25.9
28.3
31.3
90.2
5.4
24.0
345
Kara
gand
y 80
.510
79.2
1048
.220
.07.
493
.65.
514
.231
6
Kost
anai
93
.410
87.1
1032
.913
.15.
996
.92.
713
.326
7
Kyzy
lord
a 94
.110
52.6
342
.426
.021
.887
.54.
722
.620
9
Man
gist
au
97.5
1086
.510
56.7
24.8
13.6
95.7
4.0
23.4
109
Sout
h Ka
zakh
stan
90
.710
49.1
236
.944
.235
.893
.34.
334
.882
7
Pavl
odar
94
.610
81.0
1041
.431
.415
.695
.73.
427
.319
7
Nor
th K
azak
hsta
n 85
.310
72.4
751
.934
.820
.495
.43.
731
.116
3
East
Kaz
akhs
tan
91.9
1072
.16
41.0
20.7
9.8
93.6
4.7
16.0
304
Ast
ana
City
98.4
1095
.710
38.4
20.0
12.4
93.5
5.4
17.3
90
Alm
aty
City
93.8
1090
.010
28.4
33.2
1.9
97.6
2.4
18.5
324
* M
ICS
indi
cato
r 49
** M
ICS
indi
cato
r 48
***
MIC
S in
dica
tor 5
0

MONITORING THE SITUATION OF CHILDREN AND WOMEN122
Tab
le C
D.2
: Lea
rnin
g m
ater
ials
(co
nti
nue
d)
CH
ILD
REN
LIV
ING
IN
HO
USE
HO
LDS
WIT
H:
CHIL
D H
AS:
CHIL
D P
LAYS
WIT
H:
3 or
mor
e ty
pes
of
play
-th
ings
***
Num
ber
of c
hil-
dren
age
d 0–
59
mon
ths
3 or
mor
e no
n-ch
il-dr
en’s
bo
oks*
Med
ian
num
ber
of n
on-
child
ren’
s bo
oks
3 or
mor
e ch
ildre
n’s
book
s**
Med
ian
num
ber o
f ch
ildre
n’s
book
s
Hou
se-
hold
ob
ject
s
Obj
ects
an
d m
ater
i-al
s fo
und
outs
ide
the
hom
e
Hom
e-m
ade
toys
Toys
that
ca
me
from
a
stor
e
No
play
-th
ings
m
en-
tione
d
Resi
denc
e
Urb
an91
.010
76.9
1036
.826
.415
.395
.13.
819
.92
251
Rura
l87
.110
55.5
331
.224
.619
.191
.75.
219
.62
164
Age
0–23
mon
ths
88.0
1059
.64
30.7
11.8
10.6
88.9
9.7
11.2
1 81
3
24–
59 m
onth
s89
.910
71.2
636
.435
.121
.796
.60.
925
.72
602
Mot
her’
s ed
ucat
ion
Prim
ary/
inco
mpl
ete
seco
ndar
y76
.010
51.0
337
.729
.323
.689
.75.
924
.130
9
Seco
ndar
y 86
.110
57.8
331
.827
.418
.092
.85.
020
.72
000
Spec
ializ
ed s
econ
dary
92.1
1072
.96
34.9
22.3
15.6
94.1
3.8
16.8
1 03
0
Hig
her
95.7
1080
.510
36.3
24.1
15.2
95.1
3.8
19.7
1 07
6
Wea
lth
inde
x qu
inti
les
Poor
est
84.2
1043
.82
29.8
27.8
20.8
89.5
6.0
20.6
1 18
9
Poor
88.1
1061
.34
31.6
26.2
20.7
94.6
4.1
20.5
924
Mid
dle
90.7
1075
.56
36.1
24.5
16.9
94.3
4.7
19.8
869
Rich
91.4
1077
.010
35.6
24.0
15.4
95.2
3.6
19.1
708
Rich
est
94.2
1088
.710
39.9
23.6
8.7
95.9
3.5
18.1
725
Ethn
icit
y/la
ngua
ge
Kaza
kh88
.910
61.7
434
.224
.417
.992
.74.
819
.42
924
Russ
ian
92.3
1086
.110
35.3
26.1
12.2
96.4
3.3
18.5
931
Oth
er84
.610
58.4
331
.230
.421
.792
.85.
123
.956
0
Tota
l89
.110
66.4
534
.025
.517
.293
.54.
519
.84
415
* M
ICS
indi
cato
r 49
** M
ICS
indi
cato
r 48
***
MIC
S in
dica
tor 5
0
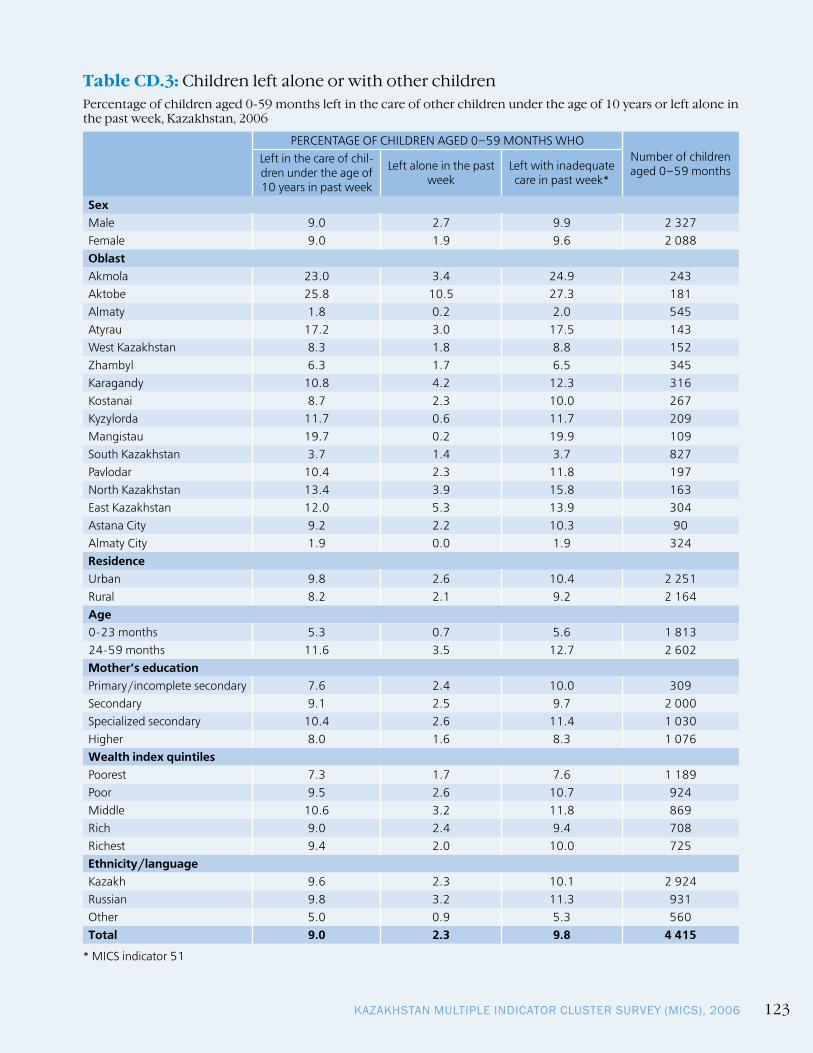
KAZAKHSTAN MULTIPLE INDICATOR CLUSTER SURVEY (MICS), 2006 123
Table CD.3: Children left alone or with other childrenPercentage of children aged 0-59 months left in the care of other children under the age of 10 years or left alone in the past week, Kazakhstan, 2006
PERCENTAGE OF CHILDREN AGED 0–59 MONTHS WHONumber of children aged 0–59 months
Left in the care of chil-dren under the age of 10 years in past week
Left alone in the past week
Left with inadequate care in past week*
SexMale 9.0 2.7 9.9 2 327Female 9.0 1.9 9.6 2 088OblastAkmola 23.0 3.4 24.9 243Aktobe 25.8 10.5 27.3 181Almaty 1.8 0.2 2.0 545Atyrau 17.2 3.0 17.5 143West Kazakhstan 8.3 1.8 8.8 152Zhambyl 6.3 1.7 6.5 345Karagandy 10.8 4.2 12.3 316Kostanai 8.7 2.3 10.0 267Kyzylorda 11.7 0.6 11.7 209Mangistau 19.7 0.2 19.9 109South Kazakhstan 3.7 1.4 3.7 827Pavlodar 10.4 2.3 11.8 197North Kazakhstan 13.4 3.9 15.8 163East Kazakhstan 12.0 5.3 13.9 304Astana City 9.2 2.2 10.3 90Almaty City 1.9 0.0 1.9 324ResidenceUrban 9.8 2.6 10.4 2 251Rural 8.2 2.1 9.2 2 164Age0-23 months 5.3 0.7 5.6 1 81324-59 months 11.6 3.5 12.7 2 602Mother’s educationPrimary/incomplete secondary 7.6 2.4 10.0 309Secondary 9.1 2.5 9.7 2 000Specialized secondary 10.4 2.6 11.4 1 030Higher 8.0 1.6 8.3 1 076Wealth index quintilesPoorest 7.3 1.7 7.6 1 189Poor 9.5 2.6 10.7 924Middle 10.6 3.2 11.8 869Rich 9.0 2.4 9.4 708Richest 9.4 2.0 10.0 725Ethnicity/languageKazakh 9.6 2.3 10.1 2 924Russian 9.8 3.2 11.3 931Other 5.0 0.9 5.3 560Total 9.0 2.3 9.8 4 415
* MICS indicator 51

MONITORING THE SITUATION OF CHILDREN AND WOMEN124
Table ED.1: Early childhood educationPercentage of children aged 36-59 months who are attending some form of organized early childhood education programme and percentage of first graders who attended pre-school, Kazakhstan, 2006
Percentage of children aged 36-59 months
currently attending early childhood education *
Number of chil-dren aged 36-59
months
Percentage of children attending first grade who attended preschool pro-gram in previous year **
Number of chil-dren attending
first grade
SexMale 17.8 860 39.8 363Female 14.1 794 39.2 324OblastAkmola 8.8 110 (56.8) 38Aktobe 12.0 75 (29.0) 46Almaty 7.1 175 22.9 82Atyrau 11.1 60 (39.2) 31West Kazakhstan 23.2 57 (40.1) 30Zhambyl 15.7 121 (35.2) 45Karagandy 33.4 122 (63.2) 47Kostanai 16.2 107 (76.8) 44Kyzylorda 8.2 80 (9.1) 40Mangistau (17.4) 40 (*) 16South Kazakhstan 8.1 311 14.5 125Pavlodar 26.8 66 (76.0) 27North Kazakhstan 20.2 70 (77.3) 34East Kazakhstan 15.6 114 (47.9) 37Astana City (47.0) 32 (*) 9Almaty City 29.7 114 (57.7) 36ResidenceUrban 24.1 873 46.4 335Rural 7.0 781 33.0 352Age of child36–47 months 15.4 858 na Na48–59 months 16.7 796 na Na6 years na na 23.7 2357 years na na 47.8 452Mother’s educationPrimary/incomplete secondary 3.2 112 43.8 50Secondary 7.5 770 31.3 320Specialized secondary 20.0 376 45.6 174Higher 32.5 394 50.0 140Wealth index quintilesPoorest 2.8 438 19.2 185Poor 8.6 355 37.3 146Middle 12.5 318 44.6 130Rich 22.5 273 49.7 108Richest 44.8 270 59.2 118Ethnicity/languageKazakh 12.4 1 072 32.0 460Russian 29.4 377 70.3 145Other 10.1 205 27.5 82Total 16.0 1 654 39.5 687
* MICS indicator 52, ** MICS indicator 53( ) – indicators are based on 25 – 49 cases of unweighted observations(*) – indicators are based on less than 25 cases of unweighted observationsna: not applicable

KAZAKHSTAN MULTIPLE INDICATOR CLUSTER SURVEY (MICS), 2006 125
Table ED.2: Primary school entryPercentage of children of primary school entry age attending grade 1, Kazakhstan, 2006
Percentage of children of primary school entry age currently attending grade 1*
Number of children of primary school entry age
SexMale 95.1 361Female 90.4 340OblastAkmola (90.1) 42Aktobe (95.7) 35Almaty 91.9 83Atyrau (97.9) 25West Kazakhstan (97.2) 31Zhambyl 89.3 50Karagandy 94.0 54Kostanai (90.3) 44Kyzylorda (97.0) 39Mangistau (*) 21South Kazakhstan 100.0 116Pavlodar (83.2) 28North Kazakhstan (90.9) 32East Kazakhstan 80.4 51Astana City (*) 14Almaty City (96.2) 36ResidenceUrban 92.2 362Rural 93.5 339Age of child7 years 92.9 701Mother’s educationPrimary/incomplete secondary 88.4 51Secondary 93.2 335Specialized secondary 92.6 164Higher 93.9 148Wealth index quintilesPoorest 97.3 166Poor 92.1 157Middle 90.6 144Rich 92.0 117Richest 91.1 117Ethnicity/languageKazakh 96.4 445Russian 83.5 165Other 92.3 91Total 92.9 701
* MICS indicator 54( ) – indicators are based on 25-49 cases of unweighted observations(*) – indicators are based on less than 25 cases of unweighted observations

MONITORING THE SITUATION OF CHILDREN AND WOMEN126
Table ED.3: Primary school net attendance ratioPercentage of children of primary school age attending primary or secondary school (NAR), Kazakhstan, 2006
MALE FEMALE TOTALNet attend-ance ratio
Number of children
Net attend-ance ratio
Number of children
Net attend-ance ratio*
Number of children
OblastAkmola 100.0 91 94.2 91 97.1 181Aktobe 98.3 86 99.1 66 98.7 152Almaty 97.8 203 99.3 166 98.5 368Atyrau 98.5 55 (99.3) 46 98.9 101West Kazakhstan 100.0 51 99.0 63 99.4 113Zhambyl 98.3 106 96.0 106 97.2 212Karagandy 98.8 142 98.7 129 98.8 271Kostanai 98.2 118 97.3 80 97.9 198Kyzylorda 97.2 75 100.0 67 98.5 143Mangistau (99.0) 43 (99.5) 41 99.3 84South Kazakhstan 99.3 315 99.6 257 99.4 572Pavlodar 96.8 73 96.5 67 96.6 140North Kazakhstan 98.7 61 96.3 57 97.6 117East Kazakhstan 97.7 100 90.1 113 93.6 213Astana City (95.2) 28 (91.5) 26 93.4 54Almaty City 100.0 87 97.9 67 99.1 154ResidenceUrban 98.8 837 97.3 721 98.1 1 558Rural 98.3 797 97.7 721 98.0 1 518Age7 95.8 361 91.3 340 93.6 7008 99.3 372 98.7 351 99.0 7239 99.5 448 100.0 357 99.7 80510 99.2 452 99.4 394 99.3 847Mother’s educationPrimary/incomplete secondary 96.4 108 93.0 94 94.8 202Secondary 98.5 765 98.1 687 98.3 1 453Specialized secondary 98.7 430 97.3 378 98.1 809Higher 99.1 320 97.6 278 98.4 598Wealth index quintilesPoorest 98.1 429 99.0 382 98.5 811Poor 98.7 358 97.2 308 98.0 666Middle 98.7 311 96.5 275 97.6 586Rich 98.3 292 97.8 248 98.1 539Richest 99.1 244 96.2 230 97.7 473Ethnicity/languageKazakh 99.2 1 080 98.6 977 98.9 2 058Russian 97.5 348 93.1 313 95.4 661Other 97.0 206 99.4 151 98.0 357Total 98.5 1 634 97.5 1 442 98.0 3 076
* MICS indicator 55; MDG indicator 6( ) – indicators are based on 25-49 cases of unweighted observations

KAZAKHSTAN MULTIPLE INDICATOR CLUSTER SURVEY (MICS), 2006 127
Table ED.4: Secondary school net attendance ratioPercentage of children of secondary school age attending secondary school or higher (NAR), Kazakhstan, 2006
MALE FEMALE TOTALNet attend-ance ratio
Number of children
Net attend-ance ratio
Number of children
Net attend-ance ratio*
Number of children
OblastAkmola 92.9 204 95.8 188 94.3 392Aktobe 94.9 168 95.0 153 94.9 321Almaty 92.4 367 94.1 383 93.3 750Atyrau 97.0 123 94.8 122 95.9 245West Kazakhstan 93.8 169 95.3 166 94.5 335Zhambyl 96.5 239 94.6 239 95.5 478Karagandy 96.6 337 95.2 321 95.9 658Kostanai 94.4 258 97.3 208 95.7 466Kyzylorda 94.6 171 96.6 162 95.6 333Mangistau 99.3 86 98.1 78 98.7 164South Kazakhstan 93.7 578 94.3 538 94.0 1 116Pavlodar 94.0 193 95.3 171 94.6 364North Kazakhstan 95.5 162 94.6 153 95.0 315East Kazakhstan 97.9 316 97.8 331 97.9 647Astana City 96.6 64 98.5 60 97.5 124Almaty City 97.4 216 95.0 195 96.2 411ResidenceUrban 95.7 1 884 95.6 1 789 95.6 3 673Rural 94.4 1 767 95.3 1 679 94.9 3 446Age11 86.2 412 88.4 469 87.4 88112 99.3 518 99.5 502 99.4 1 02013 99.2 515 99.3 489 99.3 1 00414 99.2 520 99.2 499 99.2 1 01915 98.6 543 98.6 486 98.6 1 02916 96.5 574 97.2 519 96.8 1 09317 85.5 569 85.6 504 85.6 1 073Mother’s educationPrimary/incomplete secondary 90.7 161 95.1 186 93.1 347Secondary 93.5 1 519 95.2 1 488 94.4 3 007Specialized secondary 96.1 1 115 96.2 1 003 96.1 2 118Higher 97.7 718 96.8 649 97.3 1 367Mother is not in HH 95.8 126 86.2 130 90.9 256Wealth index quintilesPoorest 93.6 884 94.5 820 94.0 1 704Poor 94.3 775 95.6 793 94.9 1 568Middle 95.5 745 96.1 679 95.8 1 424Rich 96.0 584 94.7 581 95.4 1 165Richest 96.9 663 96.5 595 96.7 1 258Ethnicity/languageKazakh 95.7 2 441 96.3 2 270 96.0 4 711Russian 94.5 842 95.6 865 95.1 1 707Other 92.3 368 89.1 333 90.8 701Total 95.1 3 651 95.4 3 468 95.3 7 119
* MICS indicator 56

MONITORING THE SITUATION OF CHILDREN AND WOMEN128
Table ED.4W: Secondary school age children attending primary schoolPercentage of children of secondary school age attending primary school, Kazakhstan, 2006
MALE FEMALE TOTALPercent at-tending pri-mary school
Number of children
Percent at-tending pri-mary school
Percent at-tending pri-mary school
Number of children
Percent at-tending pri-mary school
OblastAkmola 3.1 204 1.5 188 2.3 392Aktobe 1.6 168 0.6 153 1.1 321Almaty 3.0 367 1.6 383 2.2 750Atyrau 0.3 123 0.4 122 0.3 245West Kazakhstan 2.4 169 2.0 166 2.2 335Zhambyl 1.3 239 2.8 239 2.1 478Karagandy 0.8 337 1.4 321 1.1 658Kostanai 1.7 258 1.0 208 1.4 466Kyzylorda 1.1 171 0.4 162 0.7 333Mangistau 0.0 86 0.5 78 0.3 164South Kazakhstan 1.1 578 2.5 538 1.8 1 116Pavlodar 4.1 193 2.1 171 3.1 364North Kazakhstan 1.5 162 2.7 153 2.1 315East Kazakhstan 0.6 316 0.4 331 0.5 647Astana City 1.4 64 1.5 60 1.4 124Almaty City 0.6 216 1.4 195 1.0 411ResidenceUrban 1.2 1 884 1.6 1 789 1.4 3 673Rural 1.9 1 767 1.5 1 679 1.7 3 446Age11 13.5 412 11.2 469 12.3 88112 0.2 518 0.2 502 0.2 1 02013 0.0 515 0.0 489 0.0 1 00414 0.0 520 0.0 499 0.0 1 01915 0.0 543 0.0 486 0.0 1 02916 0.0 574 0.0 519 0.0 1 09317 0.0 569 0.0 504 0.0 1 073Mother’s educationPrimary/incomplete secondary 4.1 161 2.4 186 3.2 347Secondary 1.7 1 519 1.3 1 488 1.5 3 007Specialized secondary 1.4 1 115 1.6 1 003 1.5 2 118Higher 1.3 718 2.1 649 1.7 1 367Mother in not in HH 0.0 126 0.0 130 0.0 256None/DK 0.0 0 0.0 1 0.0 1Wealth index quintilesPoorest 1.9 884 1.8 820 1.9 1 704Poor 1.7 775 0.9 793 1.3 1 568Middle 1.7 745 1.3 679 1.5 1 424Rich 0.9 584 2.3 581 1.6 1 165Richest 1.4 663 1.6 595 1.5 1 258Ethnicity/languageKazakh 1.4 2 441 1.4 2 270 1.4 4 711Russian 1.9 842 1.7 865 1.8 1 707Other 1.6 368 2.3 333 2.0 701Total 1.6 3 651 1.5 3 468 1.6 7 119

KAZAKHSTAN MULTIPLE INDICATOR CLUSTER SURVEY (MICS), 2006 129
Table ED.5: Children reaching grade 5Percentage of children entering first grade of primary school who eventually reach grade 5, Kazakhstan, 2006
Percent attend-ing 2nd grade
who were in 1st grade last year
Percent attend-ing 3rd grade
who were in 2nd grade last year
Percent attend-ing 4th grade
who were in 3rd grade last year
Percent attend-ing 5th grade
who were in 4th grade last year
Percent who reach grade 5 of those who enter
1st grade*
Sex
Male 99.7 99.7 100.0 100.0 99.5
Female 100.0 100.0 99.9 100.0 99.9
Oblast
Akmola 100.0 100.0 100.0 100.0 100.0
Aktobe 100.0 100.0 100.0 100.0 100.0
Almaty 98.9 98.8 100.0 100.0 97.6
Atyrau 100.0 100.0 100.0 100.0 100.0
West Kazakhstan 100.0 100.0 100.0 100.0 100.0
Zhambyl 100.0 100.0 100.0 100.0 100.0
Karagandy 100.0 100.0 100.0 100.0 100.0
Kostanai 100.0 100.0 100.0 100.0 100.0
Kyzylorda 100.0 100.0 100.0 100.0 100.0
Mangistau 100.0 100.0 100.0 100.0 100.0
South Kazakhstan 100.0 100.0 100.0 100.0 100.0
Pavlodar 100.0 100.0 100.0 100.0 100.0
North Kazakhstan 100.0 100.0 100.0 100.0 100.0
East Kazakhstan 100.0 100.0 100.0 100.0 100.0
Astana City 100.0 100.0 97.1 100.0 97.1
Almaty City 100.0 100.0 100.0 100.0 100.0
Residence
Urban 100.0 100.0 99.9 100.0 99.9
Rural 99.7 99.7 100.0 100.0 99.4
Mother’s education
Primary/incomplete secondary 100.0 100.0 100.0 100.0 100.0
Secondary 100.0 100.0 100.0 100.0 100.0
Specialized secondary 99.4 99.5 100.0 100.0 98.9
Higher 100.0 100.0 99.7 100.0 99.7
Wealth index quintiles
Poorest 99.4 99.5 100.0 100.0 98.9
Poor 100.0 100.0 100.0 100.0 100.0
Middle 100.0 100.0 100.0 100.0 100.0
Rich 100.0 100.0 100.0 100.0 100.0
Richest 100.0 100.0 99.7 100.0 99.7
Ethnicity/language
Kazakh 100.0 100.0 99.9 100.0 99.9
Russian 100.0 100.0 100.0 100.0 100.0
Other 98.9 98.6 100.0 100.0 97.6
Total 99.9 99.9 99.9 100.0 99.7
* MICS indicator 57; MDG indicator 7

MONITORING THE SITUATION OF CHILDREN AND WOMEN130
Table ED.6: Primary school completion and transition to secondary educationPrimary school completion rate and transition rate to secondary education, Kazakhstan, 2006
Net primary school completion rate*
Number of children of primary school completion age
Transition rate to secondary educa-
tion**
Number of children who were in the last grade of primary
school the previous year
SexMale 87.9 452 99.5 458
Female 88.9 394 99.9 501
OblastAkmola (85.7) 42 (97.7) 43
Aktobe 88.5 41 98.5 38
Almaty 79.7 105 100.0 98
Atyrau 90.4 28 100.0 33
West Kazakhstan (95.6) 28 (98.6) 45
Zhambyl 89.5 63 100.0 78
Karagandy (90.2) 67 100.0 82
Kostanai 88.0 66 100.0 70
Kyzylorda 95.2 40 99.2 51
Mangistau 91.1 21 100.0 23
South Kazakhstan 95.3 169 100.0 166
Pavlodar (81.5) 34 (100.0) 48
North Kazakhstan (*) 22 (100.0) 39
East Kazakhstan (79.3) 63 100.0 74
Astana City (88.2) 15 (97.2) 16
Almaty City (90.0) 42 (100.0) 55
ResidenceUrban 88.6 419 99.9 471
Rural 88.2 427 99.5 488
Mother’s educationPrimary/incomplete secondary (80.8) 47 (100.0) 42
Secondary 87.0 405 99.7 442
Specialized secondary 90.1 236 99.7 278
Higher 92.8 154 99.7 192
Wealth index quintilesPoorest 86.6 238 99.4 250
Poor 88.2 188 99.7 214
Middle 89.1 152 100.0 187
Rich 89.6 148 99.5 157
Richest 90.1 120 100.0 151
Ethnicity/languageKazakh 89.4 582 99.6 648
Russian 82.8 169 100.0 204
Other 92.2 95 99.6 107
Total 88.4 846 99.7 959
* MICS indicator 59; MDG indicator 7b** MICS indicator 58( ) – indicators are based on 25-49 cases of unweighted observations(*) – indicators are based on less than 25 cases of unweighted observations

KAZAKHSTAN MULTIPLE INDICATOR CLUSTER SURVEY (MICS), 2006 131
Table ED.7: Education gender parityRatio of girls to boys attending primary education and ratio of girls to boys attending secondary education, Kazakhstan, 2006
Primary school net attend-ance ratio
(NAR), girls
Primary school net attend-ance ratio
(NAR), boys
Gender parity index (GPI) for primary
school NAR*
Secondary school net at-tendance ratio
(NAR), girls
Secondary school net at-tendance ratio (NAR), boys
Gender parity index (GPI)
for secondary school NAR*
Oblast
Akmola 94.2 100.0 0.94 95.8 92.9 1.03
Aktobe 99.1 98.3 1.01 95.0 94.9 1.00
Almaty 99.3 97.8 1.02 94.1 92.4 1.02
Atyrau 99.3 98.5 1.01 94.8 97.0 0.98
West Kazakhstan 99.0 100.0 0.99 95.3 93.8 1.02
Zhambyl 96.0 98.3 0.98 94.6 96.5 0.98
Karagandy 98.7 98.8 1.00 95.2 96.6 0.99
Kostanai 97.3 98.2 0.99 97.3 94.4 1.03
Kyzylorda 100.0 97.2 1.03 96.6 94.6 1.02
Mangistau 99.5 99.0 1.01 98.1 99.3 0.99
South Kazakhstan 99.6 99.3 1.00 94.3 93.7 1.01
Pavlodar 96.5 96.8 1.00 95.3 94.0 1.01
North Kazakhstan 96.3 98.7 0.98 94.6 95.5 0.99
East Kazakhstan 90.1 97.7 0.92 97.8 97.9 1.00
Astana City 91.5 95.2 0.96 98.5 96.6 1.02
Almaty City 97.9 100.0 0.98 95.0 97.4 0.97
Residence
Urban 97.3 98.8 0.98 95.6 95.7 1.00
Rural 97.7 98.3 0.99 95.3 94.4 1.01
Mother’s education
Primary/incomplete secondary 93.0 96.4 0.96 95.1 90.7 1.05
Secondary 98.1 98.5 1.00 95.2 93.5 1.02
Specialized secondary 97.3 98.7 0.99 96.2 96.1 1.00
Higher 97.6 99.1 0.98 96.8 97.7 0.99
Mother in not in HH na na na 86.2 95.8 0.90
Absent/DK na na na 100.0 na na
Wealth index quintiles
Poorest 99.0 98.1 1.01 94.5 93.6 1.01
Poor 97.2 98.7 0.98 95.6 94.3 1.01
Middle 96.5 98.7 0.98 96.1 95.5 1.01
Rich 97.8 98.3 0.99 94.7 96.0 0.99
Richest 96.2 99.1 0.97 96.5 96.9 1.00
Ethnicity/language
Kazakh 98.6 99.2 0.99 96.3 95.7 1.01
Russian 93.1 97.5 0.95 95.6 94.5 1.01
Other 99.4 97.0 1.02 89.1 92.3 0.97
Total 97.5 98.5 0.99 95.4 95.1 1.00
* MICS indicator 61; MDG indicator 9na: not applicable

MONITORING THE SITUATION OF CHILDREN AND WOMEN132
Table ED.8: Adult literacyPercentage of women aged 15-24 years that are literate, Kazakhstan, 2006
Percentage literate* Number of women aged 15-24 years
Oblast
Akmola 100.0 221
Aktobe 99.7 217
Almaty 99.7 451
Atyrau 100.0 175
West Kazakhstan 99.3 239
Zhambyl 99.7 276
Karagandy 100.0 486
Kostanai 99.5 296
Kyzylorda 99.4 177
Mangistau 100.0 117
South Kazakhstan 99.8 602
Pavlodar 99.5 255
North Kazakhstan 100.0 175
East Kazakhstan 99.6 469
Astana City 99.6 109
Almaty City 100.0 312
Residence
Urban 99.7 2 627
Rural 99.8 1 950
Education
Primary/incomplete secondary 99.2 1 502
Secondary 100.0 1 034
Specialized secondary 100.0 844
Higher 100.0 1 197
Age
15–19 99.7 2 469
20–24 99.8 2 108
Wealth index quintiles
Poorest 99.8 964
Poor 99.7 878
Middle 99.7 870
Rich 99.5 846
Richest 100.0 1 019
Ethnicity/language
Kazakh 99.8 2 752
Russian 99.9 1 304
Other 99.5 521
Total 99.8 4 577
* MICS indicator 60; MDG indicator 8

KAZAKHSTAN MULTIPLE INDICATOR CLUSTER SURVEY (MICS), 2006 133
Table CP.1: Birth registrationPercent distribution of children aged 0-59 months by whether birth is registered and reasons for non-registration, Kazakhstan, 2006
Birth is registered* Number of children aged 0-59 months SexMale 99.3 2 327Female 99.2 2 088OblastAkmola 98.7 243Aktobe 99.7 181Almaty 98.8 545Atyrau 100.0 143West Kazakhstan 99.5 152Zhambyl 98.6 345Karagandy 98.9 316Kostanai 98.5 267Kyzylorda 99.7 209Mangistau 99.4 109South Kazakhstan 99.2 827Pavlodar 99.3 197North Kazakhstan 99.1 163East Kazakhstan 100.0 304Astana City 100.0 90Almaty City 100.0 324ResidenceUrban 99.2 2 251Rural 99.2 2 164Age0–11 months 98.4 84412–23 months 99.7 96924–35 months 99.4 94836–47 months 99.4 85848–59 months 99.2 796Mother’s educationPrimary/incomplete secondary 98.6 309Secondary 99.0 2 000Specialized secondary 99.2 1 030Higher 99.8 1 076Wealth index quintilesPoorest 99.0 1 189Poor 99.3 924Middle 99.3 869Rich 99.1 708Richest 99.6 725Ethnicity/languageKazakh 99.3 2 924Russian 99.4 931Other 98.6 560Total 99.2 4 415
* MICS indicator 62

MONITORING THE SITUATION OF CHILDREN AND WOMEN134
Table CP.2: Child labor Percentage of children aged 5-14 years who are involved in child labor activities by type of work, Kazakhstan, 2006
Working outside household Household chores for 28+
hours/ week
Working for family busi-
ness
Total child labor*
Number of children aged
5-14 yearsPaid work Unpaid work
SexMale 0.1 1.1 0.4 1.2 2.4 4 280Female 0.1 0.9 0.6 0.9 2.1 4 041OblastAkmola 0.0 0.9 0.2 0.9 1.1 471Aktobe 0.0 2.4 0.1 0.7 2.6 390Almaty 0.0 0.2 0.6 0.1 0.9 954Atyrau 0.0 0.0 0.0 0.2 0.2 274West Kazakhstan 0.0 1.0 0.0 2.1 2.4 344Zhambyl 0.0 0.8 0.0 0.3 1.0 604Karagandy 0.2 0.2 0.0 0.0 0.5 718Kostanai 0.0 2.9 0.6 1.9 4.8 514Kyzylorda 0.2 1.6 2.6 4.0 7.2 403Mangistau 0.0 1.2 0.0 1.0 1.8 207South Kazakhstan 0.2 0.5 0.3 1.1 1.6 1 481Pavlodar 0.3 4.6 0.0 3.1 5.9 382North Kazakhstan 0.2 0.7 0.4 3.0 4.2 345East Kazakhstan 0.0 0.2 0.4 0.4 1.0 611Astana City 0.0 1.1 3.4 0.6 4.6 155Almaty City 0.0 0.9 1.5 0.0 2.4 468ResidenceUrban 0.1 1.2 0.7 1.1 2.5 4 203Rural 0.1 0.8 0.3 1.0 1.9 4 118Age5–11years 0.0 1.5 0.4 1.4 2.7 5 27712–14 years 0.2 0.1 0.7 0.5 1.4 3 044School participationYes 0.1 1.0 0.5 1.1 2.3 7 545No 0.2 0.9 0.3 0.2 1.4 776Mother’s educationPrimary/incomplete secondary 0.2 0.2 0.3 1.3 1.9 498Secondary 0.1 0.9 0.4 1.3 2.3 3 794Specialized secondary 0.1 1.0 0.6 0.7 2.0 2 319Higher 0.1 1.5 0.7 1.0 2.6 1 677Wealth index quintilesPoorest 0.1 0.4 0.5 0.9 1.8 2 139Poor 0.0 0.8 0.5 1.1 2.1 1 860Middle 0.0 1.3 0.3 1.7 2.8 1 589Rich 0.2 1.7 0.2 1.0 2.4 1 401Richest 0.1 1.1 1.0 0.4 2.2 1 332Ethnicity/languageKazakh 0.1 1.0 0.5 1.0 2.1 5 583Russian 0.0 1.3 0.5 1.1 2.5 1 812Other 0.3 0.4 0.7 1.2 2.4 926Total 0.1 1.0 0.5 1.0 2.2 8 321
* MICS indicator 71

KAZAKHSTAN MULTIPLE INDICATOR CLUSTER SURVEY (MICS), 2006 135
Table CP.3: Laborer students and student laborersPercentage of children aged 5-14 years who are laborer students and student laborers, Kazakhstan, 2006
Percentage of children
in child labor
Percentage of children attending
school
Number of children 5-14 years
of age
Percentage of child laborers who are also
attending school*
Number of child lab-
orers aged 5-14
Percentage of students
who are also involved in
child labor**
Number of stu-dents
aged 5-14
SexMale 2.4 90.4 4 281 97.7 101 2.5 3 871Female 2.1 90.9 4 040 90.1 84 2.1 3 674OblastAkmola 1.1 92.7 471 100.0 5 1.2 436Aktobe 2.6 92.6 390 100.0 10 2.8 362Almaty 0.9 87.8 954 100.0 9 1.0 838Atyrau 0.2 92.5 274 100.0 1 0.2 254West Kazakhstan 2.4 92.5 344 89.5 8 2.4 318Zhambyl 1.0 91.2 604 100.0 6 1.1 550Karagandy 0.5 92.7 718 50.0 3 0.2 666Kostanai 4.8 92.8 514 94.1 25 4.9 477Kyzylorda 7.2 88.3 403 94.7 29 7.7 356Mangistau 1.8 90.6 207 100.0 4 2.0 187South Kazakhstan 1.6 89.0 1 481 100.0 24 1.8 1 317Pavlodar 5.9 92.3 382 100.0 22 6.3 353North Kazakhstan 4.2 95.6 345 100.0 15 4.4 330East Kazakhstan 1.0 88.8 611 100.0 6 1.1 543Astana City 4.6 92.0 155 87.5 7 4.4 142Almaty City 2.4 88.9 468 62.5 11 1.7 416ResidenceUrban 2.5 90.9 4 203 90.3 106 2.5 3 821Rural 1.9 90.5 4 118 99.5 79 2.1 3 724Age5–9 years 2.7 85.7 5 277 94.1 142 3.0 4 52010–14 years 1.4 99.4 3 044 94.8 43 1.3 3 025Mother’s educationPrimary/incomplete secondary 1.9 89.4 498 100.0 10 2.1 445Secondary 2.3 89.6 3 794 93.1 86 2.4 3 400Specialized secondary 2.0 91.4 2 319 95.7 46 2.1 2 218Higher 2.6 92.6 1 677 93.8 43 2.6 1 552Wealth index quintilesPoorest 1.8 89.0 2 139 99.0 38 2.0 1 905Poor 2.1 90.0 1 860 96.3 40 2.3 1 673Middle 2.8 91.2 1 589 96.9 45 3.0 1 449Rich 2.4 92.3 1 401 86.5 33 2.2 1 292Richest 2.2 92.0 1 332 90.2 29 2.1 1 226Ethnicity/languageKazakh 2.1 91.1 5 583 92.8 118 2.1 5 089Russian 2.5 91.4 1 812 99.0 45 2.7 1 656Other 2.4 86.5 926 92.7 22 2.6 800Total 2.2 90.7 8 321 94.3 185 2.3 7 545
* MICS indicator 72** MICS indicator 73

MONITORING THE SITUATION OF CHILDREN AND WOMEN136
Table CP.4: Child disciplinePercentage of children aged 2-14 years according to method of disciplining the child, Kazakhstan, 2006
Percentage of children 2-14 years of age who experience:
Mot
her/
care
ta
ker b
elie
ves
that
the
child
ne
eds
to b
e ph
ysic
ally
pun
-is
hed
Num
ber o
f chi
l-dr
en a
ged
2-14
ye
ars
Onl
y no
n-vi
olen
t di
scip
line
Psyc
holo
gica
l pu
nish
men
t
Min
or p
hysi
-ca
l pun
ish-
men
t
Seve
re p
hysi
-ca
l pun
ish-
men
t
Any
psy
-ch
olog
ical
or
phy
sica
l pu
nish
men
t*
No
disc
iplin
e or
pun
ish-
men
t
SexMale 8.5 3 376 25.3 1.1 55.1 16.8 8.5 3 376Female 6.3 3 034 20.3 0.4 48.9 17.9 6.3 3 035OblastAkmola 4.1 298 23.8 0.8 54.0 23.8 11.1 382Aktobe 5.7 705 11.5 0.8 39.5 9.6 4.1 298Almaty 0.0 184 7.3 0.0 24.6 32.6 5.7 705Atyrau 7.0 276 25.8 0.6 55.4 25.5 0.0 184West Kazakhstan 7.4 441 20.9 0.3 57.0 12.7 7.0 276Zhambyl 10.6 614 39.9 1.0 62.5 11.5 7.4 441Karagandy 8.7 452 32.9 0.5 68.8 0.9 10.6 614Kostanai 14.4 265 18.5 0.2 44.9 35.2 8.7 452Kyzylorda 0.6 142 32.1 5.6 58.7 17.4 14.4 265Mangistau 3.6 899 20.2 0.4 40.9 19.7 0.6 141South Kazakhstan 7.2 332 18.5 0.2 55.7 23.6 3.6 899Pavlodar 12.7 298 40.3 1.0 71.5 1.0 7.2 332North Kazakhstan 12.5 558 29.6 2.0 65.9 12.4 12.7 298East Kazakhstan 8.7 142 24.2 0.4 52.9 10.1 12.5 558Astana City 2.3 424 37.4 1.6 61.1 21.2 8.7 142Almaty City 50.2 35.3 8.9 0.0 37.3 12.5 2.3 424ResidenceUrban 31.2 49.6 25.9 0.9 54.7 14.0 7.5 3 525Rural 29.5 45.7 19.3 0.5 49.1 21.4 7.3 2 886Age of child2-4 years 31.0 37.3 29.8 0.5 46.4 22.7 6.8 1 3985-9 years 28.0 52.4 27.2 1.0 56.3 15.7 8.2 2 08210-14 years 32.0 49.6 16.6 0.6 52.1 16.0 7.2 2 931Mother’s educationPrimary/incomplete secondary 22.7 54.6 30.7 0.8 60.7 16.6 10.8 397Secondary 29.9 48.7 22.5 0.8 52.9 17.2 7.7 2 717Specialized secondary 30.7 48.5 23.8 0.6 52.7 16.6 7.6 1 831Higher 33.4 43.4 20.6 0.7 47.7 18.9 5.8 1 452Wealth index quintilesPoorest 29.2 47.6 21.0 0.7 51.0 19.8 5.6 1 385Poor 28.3 45.1 21.0 0.8 49.1 22.6 8.1 1 323Middle 28.5 49.9 23.8 0.7 54.5 17.0 8.1 1 264Rich 34.7 47.1 22.5 1.0 52.6 12.7 8.8 1 197Richest 32.0 49.6 26.6 0.4 54.2 13.8 6.7 1 242Ethnicity/languageKazakh 32.5 44.9 21.7 0.8 49.1 18.4 6.5 4 012Russian 26.1 54.9 26.9 0.6 59.9 14.0 10.6 1 725Other 29.2 47.2 20.1 0.6 51.1 19.7 5.0 674Total 30.5 47.8 22.9 0.7 52.2 17.3 7.4 6 411
* MICS indicator 74

KAZAKHSTAN MULTIPLE INDICATOR CLUSTER SURVEY (MICS), 2006 137
Table CP.5: Early marriagePercentage of women aged 15-49 years in marriage or union before their 15th birthday, percentage of women aged 20-49 years in marriage or union before their 18th birthday, percentage of women aged 15-19 years currently mar-ried or in union, Kazakhstan, 2006
Percentage married
before age 15*
Number of women
aged 15-49 years
Percentage married
before age 18*
Number of women
aged 20-49 years
Percentage of women
15-19 married/in
union**
Number of women
aged 15-19 years
Number of women aged 15-49 years
currently mar-ried/in union
OblastAkmola 0.4 797 9.6 668 3.8 129 529Aktobe 0.0 675 5.8 560 2.0 115 348Almaty 0.3 1 475 9.0 1 225 5.8 250 875Atyrau 0.2 458 4.2 356 3.3 102 236West Kazakhstan 0.0 699 5.4 565 4.4 134 388Zhambyl 0.3 877 12.0 725 6.0 152 510Karagandy 0.4 1 476 11.1 1 207 7.0 269 799Kostanai 0.3 1 015 10.1 851 7.4 164 584Kyzylorda 0.2 528 6.9 430 2.3 98 301Mangistau 0.0 335 4.6 279 3.5 56 183South Kazakhstan 0.2 1 768 7.8 1 459 6.0 309 1 155Pavlodar 0.3 820 9.0 686 5.0 134 463North Kazakhstan 0.4 674 11.3 573 2.7 101 418East Kazakhstan 1.0 1 467 9.3 1 217 3.0 250 809Astana City 0.7 368 5.6 319 (2.0) 49 204Almaty City 0.5 1 126 5.8 969 5.7 157 547ResidenceUrban 0.4 8 655 7.8 7 271 4.7 1 384 4 652Rural 0.3 5 903 9.5 4 818 5.1 1 085 3 697Age15–19 0.2 2 469 Na Na 4.9 2 469 12120–24 0.5 2 108 7.3 2 108 Na Na 92125–29 0.3 1 894 13.4 1 894 Na Na 1 29830–34 0.4 1 900 11.0 1 900 Na Na 1 39935–39 0.5 2 055 7.4 2 055 Na Na 1 56340–44 0.3 2 076 6.5 2 076 Na Na 1 57645–49 0.5 2 056 6.1 2 056 Na Na 1 471EducationPrimary/incomplete secondary 0.7 1 948 24.8 582 1.7 1 366 402Secondary 0.4 4 892 12.4 4 555 20.6 337 3 441Specialized secondary 0.3 3 950 5.9 3 533 5.2 417 2 449Higher 0.2 3 768 3.2 3 419 1.6 349 2 057Wealth index quintilesPoorest 0.3 2 689 9.7 2 162 4.5 527 1 623Poor 0.4 2 728 9.1 2 237 4.7 491 1 669Middle 0.4 2 824 9.1 2 348 4.9 476 1 709Rich 0.3 2 915 9.0 2 484 6.1 431 1 605Richest 0.3 3 402 6.3 2 858 4.4 544 1 743Ethnicity/languageKazakh 0.2 8 608 5.8 7 081 3.7 1 527 5 017Russian 0.7 4 481 11.9 3 801 5.8 680 2 466Other 0.4 1 469 13.6 1 207 9.4 262 866Total 0.4 14 558 8.5 12 089 4.9 2 469 8 349
* MICS indicator 67** MICS indicator 68( ) – indicators are based on 25 – 49 cases of unweighted observationsna: not applicable

MONITORING THE SITUATION OF CHILDREN AND WOMEN138
Table CP.6: Spousal age differencePercent distribution of currently married/in union women aged 20-24 years according to the age difference with their husband or partner, Kazakhstan, 2006
PERCENTAGE OF CURRENTLY MARRIED/IN UNION WOMEN AGED 20-24 YEARS WHOSE HUSBAND OR PARTNER IS:
Total
Number of women aged 20-24 years
currently mar-ried/ in union
Younger 0-4 years older
5-9 years older
10+ years older*
Husband/partner’s age
unknown
Oblast
Akmola (10.7) (48.9) (33.1) (7.4) (0.0) 100.0 46
Aktobe (3.7) (60.8) (30.0) (5.5) (0.0) 100.0 42
Almaty 4.5 50.2 32.2 10.2 2.9 100.0 96
Atyrau (8.4) (63.5) (24.5) (3.5) (0.0) 100.0 25
West Kazakhstan (14.0) (55.4) (24.6) (5.9) (0.0) 100.0 34
Zhambyl 5.5 40.9 41.4 12.1 0.0 100.0 67
Karagandy 7.4 62.0 22.1 8.6 0.0 100.0 93
Kostanai 5.4 55.9 32.7 5.9 0.0 100.0 56
Kyzylorda (2.1) (64.1) (27.4) (6.4) (0.0) 100.0 29
Mangistau (*) (*) (*) (*) (*) 100.0 21
South Kazakhstan 1.6 59.0 34.6 4.2 0.6 100.0 175
Pavlodar 4.8 58.8 30.2 6.2 0.0 100.0 54
North Kazakhstan (14.5) (53.3) (21.5) (10.7) (0.0) 100.0 36
East Kazakhstan 9.6 57.0 27.4 6.0 0.0 100.0 73
Astana City (5.8) (53.8) (26.9) (11.5) (1.9) 100.0 25
Almaty City (3.0) (63.6) (18.2) (12.1) (3.0) 100.0 49
Residence
Urban 7.5 60.5 25.1 6.1 0.8 100.0 472
Rural 3.9 52.4 34.4 8.8 0.5 100.0 449
Education
Primary/incomplete secondary 4.4 44.4 42.1 9.1 0.0 100.0 73
Secondary 3.7 52.2 31.3 11.7 1.1 100.0 382
Specialized secondary 7.4 67.4 20.5 4.0 0.7 100.0 171
Higher 7.7 58.9 29.8 3.5 0.2 100.0 295
Wealth index quintiles
Poorest 3.1 47.7 39.1 9.0 1.1 100.0 213
Poor 5.3 56.8 28.8 9.1 0.0 100.0 197
Middle 3.3 55.2 30.4 9.0 2.0 100.0 177
Rich 9.5 61.7 24.6 4.2 0.0 100.0 178
Richest 8.2 63.8 22.8 5.1 0.0 100.0 156
Ethnicity/language
Kazakh 4.2 55.9 32.8 6.3 0.8 100.0 527
Russian 11.5 58.0 22.0 8.5 0.0 100.0 255
Other 0.9 56.3 31.9 9.7 1.1 100.0 139
Total 5.7 56.5 29.7 7.4 0.6 100.0 921
* MICS indicator 69( ) – indicators are based on 25 – 49 cases of unweighted observations(*) – indicators are based on less than 25 cases of unweighted observations

KAZAKHSTAN MULTIPLE INDICATOR CLUSTER SURVEY (MICS), 2006 139
Table CP.9: Attitudes toward domestic violencePercentage of women aged 15-49 years who believe a husband is justified in beating his wife/partner in various cir-cumstances, Kazakhstan, 2006
PERCENTAGE OF WOMEN AGED 15-49 YEARS WHO BELIEVE A HUSBAND IS JUSTIFIED IN BEATING HIS WIFE/PARTNER: Number of
women aged 15-49 years
When she goes out without telling him
When she neglects the
children
When she argues
with him
When she refuses sex with him
When she burns the
food
For any of these reasons*
OblastAkmola 3.2 17.8 7.2 2.2 3.3 22.2 797Aktobe 1.7 6.3 4.4 2.1 1.3 9.2 675Almaty 0.2 2.1 0.6 0.3 0.0 2.2 1 475Atyrau 7.9 10.0 12.5 1.4 2.2 16.5 458West Kazakhstan 0.6 5.1 1.3 2.2 0.4 7.1 699Zhambyl 2.0 5.6 4.9 1.8 1.8 9.9 877Karagandy 2.2 10.0 4.6 2.2 4.6 13.2 1 476Kostanai 0.6 4.2 1.7 0.8 0.3 5.2 1 015Kyzylorda 24.1 17.6 28.6 9.4 13.1 47.6 528Mangistau 1.5 1.9 2.3 0.6 0.7 3.6 335South Kazakhstan 1.7 1.5 2.1 0.9 0.3 3.9 1 768Pavlodar 2.2 11.2 4.5 1.7 1.3 14.4 820North Kazakhstan 1.5 7.4 2.7 1.2 1.9 8.7 674East Kazakhstan 1.4 8.6 2.7 0.9 1.4 10.1 1 467Astana City 0.5 2.3 1.0 0.1 0.3 3.3 368Almaty City 0.8 8.8 3.1 0.4 0.4 10.0 1 126ResidenceUrban 2.5 7.0 4.2 1.5 1.9 10.3 8 655Rural 2.4 7.3 4.4 1.7 1.7 10.4 5 903Age15–19 1.1 4.8 2.3 0.6 1.2 6.8 2 46920–24 1.7 6.8 3.2 1.4 1.6 9.3 2 10825–29 3.1 7.2 4.4 2.3 2.5 11.2 1 89430–34 3.4 8.0 5.5 1.7 1.6 12.0 1 90035–39 3.2 8.1 5.9 1.9 2.1 12.0 2 05540–44 2.6 7.8 4.8 1.8 1.8 11.5 2 07645–49 2.6 7.7 4.3 1.3 1.9 10.7 2 056Marital/Union statusCurrently married/in union 3.2 8.3 5.3 1.8 2.1 12.3 8 349Formerly married/in union 2.5 7.7 4.2 2.1 2.0 10.4 2 049Never married/in union 1.1 4.6 2.3 0.7 1.1 6.5 4 160EducationPrimary/incomplete secondary 1.8 6.0 3.2 1.1 1.6 8.4 1 948Secondary 3.5 9.2 5.2 2.0 2.5 12.9 4 892Specialized secondary 2.3 6.2 4.1 1.8 1.7 9.8 3 950Higher 1.7 6.0 3.7 0.9 1.1 8.7 3 768Wealth index quintilesPoorest 3.4 6.8 5.0 2.2 2.2 10.7 2 689Poor 3.1 7.8 5.0 2.1 2.4 11.6 2 728Middle 3.0 8.1 4.6 1.5 1.6 12.1 2 824Rich 2.0 7.7 3.9 1.3 1.6 10.3 2 915Richest 1.2 5.5 3.0 0.9 1.3 7.8 3 402Ethnicity/languageKazakh 3.3 7.4 5.6 1.9 2.1 11.6 8 608Russian 1.1 7.0 2.1 1.0 1.2 8.7 4 481Other 2.2 5.9 3.3 1.3 1.6 8.3 1 469Total 2.5 7.1 4.3 1.5 1.8 10.4 14 558
* MICS indicator 100

MONITORING THE SITUATION OF CHILDREN AND WOMEN140
Table HA.1: Knowledge of preventing HIV transmissionPercentage of women aged 15-49 years who know the main ways of preventing HIV transmission, Kazakhstan, 2006
Heard of HIV/AIDS
Percentage who know HIV transmis-sion can be prevented by:
Knows all three
ways
Knows at least
one way
Doesn’t know
any way
Number of women aged 15-49 years
Having only one faithful uninfected sex partner
Using a condom
every time
Abstaining from sex
OblastAkmola 98.5 78.4 73.0 51.6 35.8 91.4 8.6 797Aktobe 97.6 74.1 59.9 41.1 28.3 84.4 15.6 675Almaty 97.3 79.7 76.4 52.8 45.4 87.9 12.1 1 475Atyrau 98.0 53.5 67.1 53.6 36.9 77.8 22.2 458West Kazakhstan 99.3 71.0 70.1 42.6 34.9 81.4 18.6 699Zhambyl 97.4 51.9 48.9 35.8 22.0 67.1 32.9 877Karagandy 99.8 78.4 73.1 45.6 34.3 88.3 11.7 1 476Kostanai 98.6 59.5 53.8 32.2 22.6 71.9 28.1 1 015Kyzylorda 94.1 43.8 34.6 31.4 16.2 58.0 42.0 528Mangistau 99.1 36.8 31.6 38.7 20.5 50.0 50.0 335South Kazakhstan 99.4 52.4 50.5 40.8 30.8 65.3 34.7 1 768Pavlodar 99.2 80.8 72.8 30.4 20.4 90.4 9.6 820North Kazakhstan 99.6 79.4 77.7 44.9 32.8 93.5 6.5 674East Kazakhstan 99.1 75.1 69.1 40.8 27.7 89.1 10.9 1 467Astana City 98.8 78.5 76.2 54.4 43.2 90.5 9.5 368Almaty City 99.9 41.5 52.5 47.1 22.4 76.0 24.0 1 126ResidenceUrban 99.2 66.5 63.7 43.1 29.6 81.7 18.3 8 655Rural 97.8 65.0 61.6 42.3 31.0 77.4 22.6 5 903Age15–19 97.3 58.4 56.0 39.8 27.6 71.8 28.2 2 46920–24 99.4 65.9 63.6 42.0 29.9 80.6 19.4 2 10825–29 98.9 65.7 63.5 43.0 30.5 80.4 19.6 1 89430–34 98.9 69.1 64.5 42.6 30.2 82.4 17.6 1 90035–39 99.1 69.2 65.9 44.0 31.9 82.6 17.4 2 05540–44 98.9 67.1 64.8 44.6 31.5 81.8 18.2 2 07645–49 98.4 67.6 63.3 43.7 30.2 81.8 18.2 2 056EducationPrimary/incomplete secondary 95.7 56.7 54.1 36.9 25.9 69.7 30.3 1 948Secondary 98.4 65.9 62.7 43.4 31.0 79.7 20.3 4 892Specialized secondary 99.5 69.8 66.8 43.4 30.6 83.6 16.4 3 950Higher 99.7 66.6 63.4 44.2 30.8 81.7 18.3 3 768Wealth index quintilesPoorest 96.7 57.3 55.4 39.4 27.9 70.8 29.2 2 689Poor 98.1 67.5 62.3 43.9 32.0 80.5 19.5 2 728Middle 99.1 69.6 66.1 43.7 32.3 82.0 18.0 2 824Rich 99.3 67.7 63.9 43.8 30.6 81.9 18.1 2 915Richest 99.7 66.8 65.6 42.7 28.5 83.3 16.7 3 402Ethnicity/languageKazakh 98.2 63.9 59.9 43.2 30.2 77.4 22.6 8 608Russian 99.7 70.9 69.9 42.0 30.0 85.8 14.2 4 481Other 98.4 62.6 58.8 42.3 31.0 76.8 23.2 1 469Total 98.7 65.9 62.9 42.7 30.2 79.9 20.1 14 558
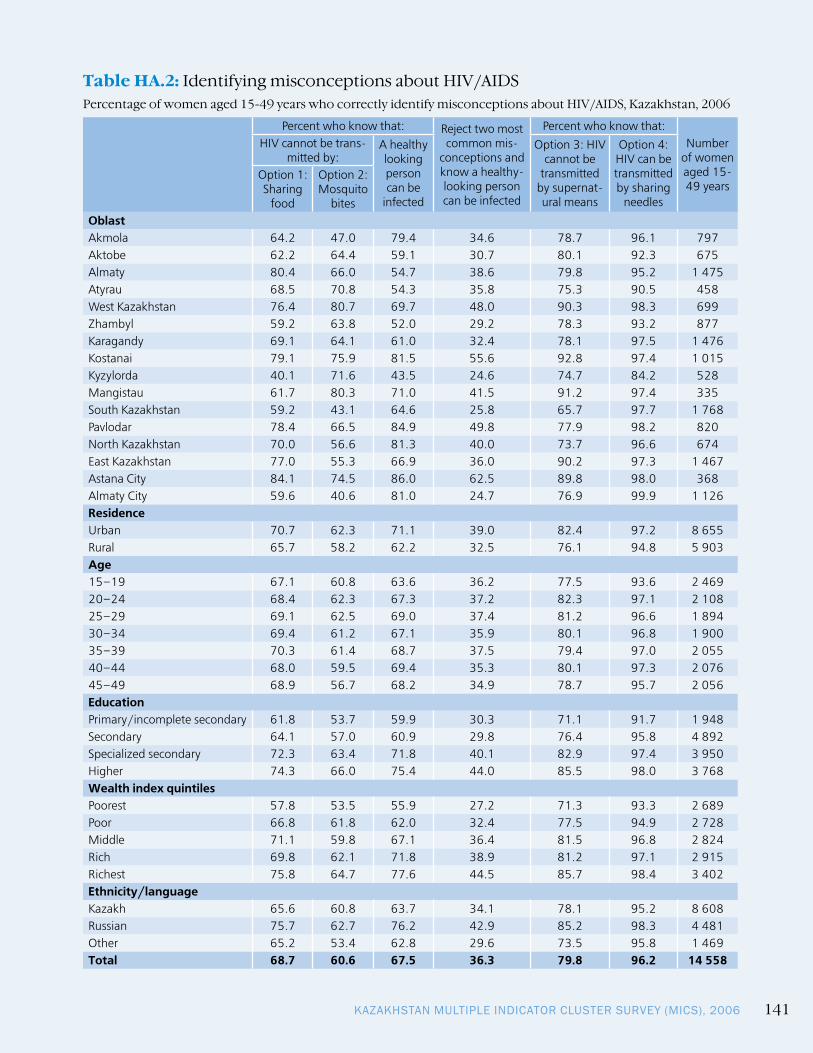
KAZAKHSTAN MULTIPLE INDICATOR CLUSTER SURVEY (MICS), 2006 141
Table HA.2: Identifying misconceptions about HIV/AIDSPercentage of women aged 15-49 years who correctly identify misconceptions about HIV/AIDS, Kazakhstan, 2006
Percent who know that: Reject two most common mis-
conceptions and know a healthy-looking person can be infected
Percent who know that:Number
of women aged 15-49 years
HIV cannot be trans-mitted by:
A healthy looking person can be
infected
Option 3: HIV cannot be
transmitted by supernat-ural means
Option 4: HIV can be transmitted by sharing
needles
Option 1: Sharing
food
Option 2: Mosquito
bitesOblast Akmola 64.2 47.0 79.4 34.6 78.7 96.1 797Aktobe 62.2 64.4 59.1 30.7 80.1 92.3 675Almaty 80.4 66.0 54.7 38.6 79.8 95.2 1 475Atyrau 68.5 70.8 54.3 35.8 75.3 90.5 458West Kazakhstan 76.4 80.7 69.7 48.0 90.3 98.3 699Zhambyl 59.2 63.8 52.0 29.2 78.3 93.2 877Karagandy 69.1 64.1 61.0 32.4 78.1 97.5 1 476Kostanai 79.1 75.9 81.5 55.6 92.8 97.4 1 015Kyzylorda 40.1 71.6 43.5 24.6 74.7 84.2 528Mangistau 61.7 80.3 71.0 41.5 91.2 97.4 335South Kazakhstan 59.2 43.1 64.6 25.8 65.7 97.7 1 768Pavlodar 78.4 66.5 84.9 49.8 77.9 98.2 820North Kazakhstan 70.0 56.6 81.3 40.0 73.7 96.6 674East Kazakhstan 77.0 55.3 66.9 36.0 90.2 97.3 1 467Astana City 84.1 74.5 86.0 62.5 89.8 98.0 368Almaty City 59.6 40.6 81.0 24.7 76.9 99.9 1 126ResidenceUrban 70.7 62.3 71.1 39.0 82.4 97.2 8 655Rural 65.7 58.2 62.2 32.5 76.1 94.8 5 903Age15–19 67.1 60.8 63.6 36.2 77.5 93.6 2 46920–24 68.4 62.3 67.3 37.2 82.3 97.1 2 10825–29 69.1 62.5 69.0 37.4 81.2 96.6 1 89430–34 69.4 61.2 67.1 35.9 80.1 96.8 1 90035–39 70.3 61.4 68.7 37.5 79.4 97.0 2 05540–44 68.0 59.5 69.4 35.3 80.1 97.3 2 07645–49 68.9 56.7 68.2 34.9 78.7 95.7 2 056EducationPrimary/incomplete secondary 61.8 53.7 59.9 30.3 71.1 91.7 1 948Secondary 64.1 57.0 60.9 29.8 76.4 95.8 4 892Specialized secondary 72.3 63.4 71.8 40.1 82.9 97.4 3 950Higher 74.3 66.0 75.4 44.0 85.5 98.0 3 768Wealth index quintilesPoorest 57.8 53.5 55.9 27.2 71.3 93.3 2 689Poor 66.8 61.8 62.0 32.4 77.5 94.9 2 728Middle 71.1 59.8 67.1 36.4 81.5 96.8 2 824Rich 69.8 62.1 71.8 38.9 81.2 97.1 2 915Richest 75.8 64.7 77.6 44.5 85.7 98.4 3 402Ethnicity/languageKazakh 65.6 60.8 63.7 34.1 78.1 95.2 8 608Russian 75.7 62.7 76.2 42.9 85.2 98.3 4 481Other 65.2 53.4 62.8 29.6 73.5 95.8 1 469Total 68.7 60.6 67.5 36.3 79.8 96.2 14 558
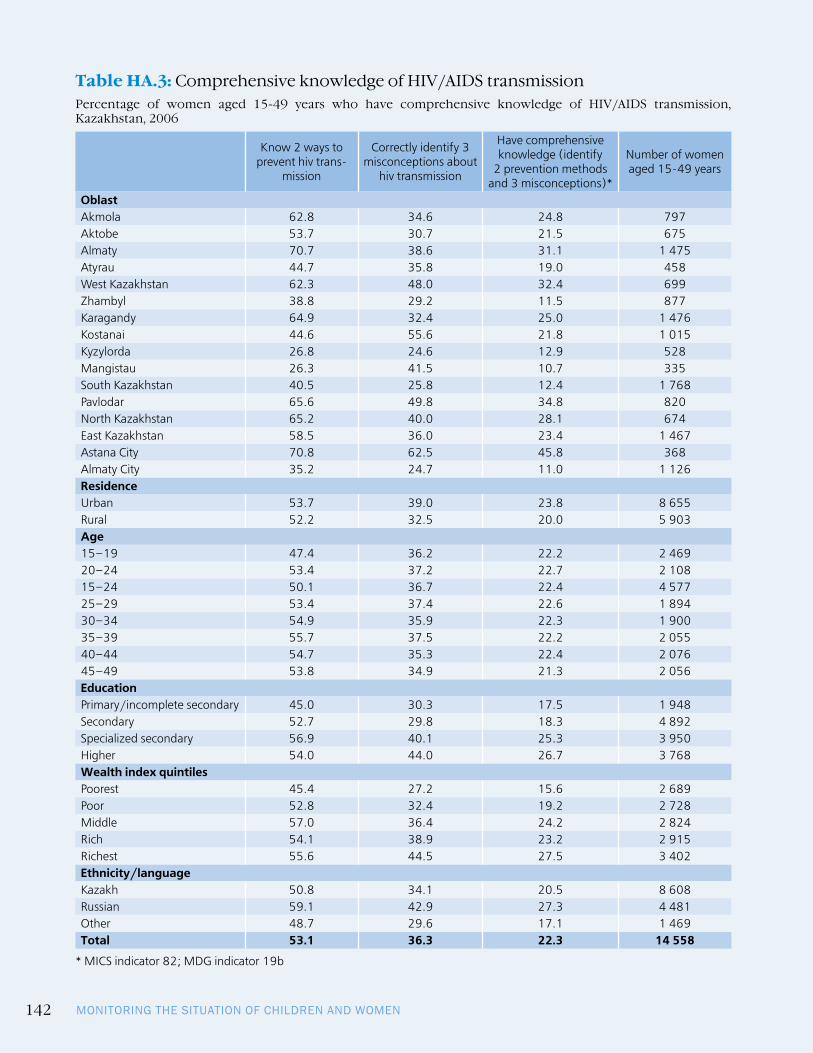
MONITORING THE SITUATION OF CHILDREN AND WOMEN142
Table HA.3: Comprehensive knowledge of HIV/AIDS transmissionPercentage of women aged 15-49 years who have comprehensive knowledge of HIV/AIDS transmission, Kazakhstan, 2006
Know 2 ways to prevent hiv trans-
mission
Correctly identify 3 misconceptions about
hiv transmission
Have comprehensive knowledge (identify
2 prevention methods and 3 misconceptions)*
Number of women aged 15-49 years
OblastAkmola 62.8 34.6 24.8 797Aktobe 53.7 30.7 21.5 675Almaty 70.7 38.6 31.1 1 475Atyrau 44.7 35.8 19.0 458West Kazakhstan 62.3 48.0 32.4 699Zhambyl 38.8 29.2 11.5 877Karagandy 64.9 32.4 25.0 1 476Kostanai 44.6 55.6 21.8 1 015Kyzylorda 26.8 24.6 12.9 528Mangistau 26.3 41.5 10.7 335South Kazakhstan 40.5 25.8 12.4 1 768Pavlodar 65.6 49.8 34.8 820North Kazakhstan 65.2 40.0 28.1 674East Kazakhstan 58.5 36.0 23.4 1 467Astana City 70.8 62.5 45.8 368Almaty City 35.2 24.7 11.0 1 126ResidenceUrban 53.7 39.0 23.8 8 655Rural 52.2 32.5 20.0 5 903Age15–19 47.4 36.2 22.2 2 46920–24 53.4 37.2 22.7 2 10815–24 50.1 36.7 22.4 4 57725–29 53.4 37.4 22.6 1 89430–34 54.9 35.9 22.3 1 90035–39 55.7 37.5 22.2 2 05540–44 54.7 35.3 22.4 2 07645–49 53.8 34.9 21.3 2 056EducationPrimary/incomplete secondary 45.0 30.3 17.5 1 948Secondary 52.7 29.8 18.3 4 892Specialized secondary 56.9 40.1 25.3 3 950Higher 54.0 44.0 26.7 3 768Wealth index quintilesPoorest 45.4 27.2 15.6 2 689Poor 52.8 32.4 19.2 2 728Middle 57.0 36.4 24.2 2 824Rich 54.1 38.9 23.2 2 915Richest 55.6 44.5 27.5 3 402Ethnicity/languageKazakh 50.8 34.1 20.5 8 608Russian 59.1 42.9 27.3 4 481Other 48.7 29.6 17.1 1 469Total 53.1 36.3 22.3 14 558
* MICS indicator 82; MDG indicator 19b

KAZAKHSTAN MULTIPLE INDICATOR CLUSTER SURVEY (MICS), 2006 143
Table HA.4: Knowledge of mother-to-child HIV transmissionPercentage of women aged 15-49 years who correctly identify means of HIV transmission from mother to child, Kazakhstan, 2006
Know aids can be transmitted from mother
to child
Percent who know aids can be transmitted: Did not know any
specific way
Number of women aged 15-49 years
During pregnancy
At deliv-ery
Through breast milk
All three ways*
OblastAkmola 92.3 87.7 72.3 56.6 47.0 6.2 797Aktobe 87.3 82.9 72.0 52.9 48.9 10.3 675Almaty 81.3 78.4 67.5 47.8 46.1 16.0 1 475Atyrau 81.9 81.0 58.1 52.6 39.8 16.1 458West Kazakhstan 98.0 84.7 93.1 62.4 56.0 1.3 699Zhambyl 87.5 86.0 77.5 67.4 64.7 9.9 877Karagandy 92.9 90.9 79.0 59.6 53.5 6.9 1 476Kostanai 96.3 91.7 92.1 58.1 55.7 2.3 1 015Kyzylorda 80.1 73.7 68.3 69.7 60.7 13.9 528Mangistau 98.3 96.6 89.9 65.2 61.2 0.8 335South Kazakhstan 96.0 95.7 88.9 61.6 60.6 3.4 1 768Pavlodar 95.8 92.7 85.0 71.5 65.0 3.4 820North Kazakhstan 95.2 91.6 73.0 52.7 41.4 4.4 674East Kazakhstan 93.5 88.3 87.0 52.7 49.5 5.6 1 467Astana City 96.6 95.3 94.8 60.2 59.4 2.2 368Almaty City 99.3 98.7 92.9 63.1 62.5 0.5 1 126ResidenceUrban 93.5 90.1 83.7 60.0 55.8 5.8 8 655Rural 90.4 87.2 78.0 57.3 52.7 7.4 5 903Age15–19 85.6 81.7 72.3 52.4 47.4 11.8 2 46920–24 92.2 88.8 81.3 58.3 53.8 7.1 2 10825–29 94.2 91.4 83.1 60.1 56.1 4.7 1 89430–34 94.1 90.8 83.2 60.7 56.4 4.8 1 90035–39 94.0 91.1 84.0 60.4 56.4 5.1 2 05540–44 94.4 91.7 85.1 61.9 57.8 4.5 2 07645–49 92.5 88.8 82.7 59.9 55.5 5.9 2 056EducationPrimary/incomplete secondary 83.8 80.6 69.9 51.5 46.3 11.9 1 948Secondary 92.2 89.3 80.8 59.6 55.3 6.2 4 892Specialized secondary 94.0 90.9 83.7 59.9 55.4 5.6 3 950Higher 94.7 90.7 85.6 60.8 56.8 5.0 3 768Wealth index quintilesPoorest 87.7 84.6 76.7 56.7 53.1 9.0 2 689Poor 90.7 87.6 77.5 58.9 53.5 7.4 2 728Middle 92.0 88.6 80.7 58.8 53.6 7.1 2 824Rich 94.5 90.9 84.6 59.3 55.1 4.8 2 915Richest 95.1 92.0 86.0 60.3 56.8 4.6 3 402Ethnicity/languageKazakh 90.6 87.2 79.2 59.1 54.3 7.5 8 608Russian 95.5 92.0 85.4 58.1 53.8 4.2 4 481Other 91.3 89.7 82.1 59.9 58.0 7.1 1 469Total 92.2 88.9 81.4 58.9 54.5 6.5 14 558
* MICS indicator 89

MONITORING THE SITUATION OF CHILDREN AND WOMEN144
Table HA.5: Attitudes toward people living with HIV/AIDSPercentage of women aged 15-49 years who have heard of AIDS who express a discriminatory attitude towards peo-ple living with HIV/AIDS, Kazakhstan, 2006
PERCENT OF WOMEN WHO:Number
of women who have heard of
aids
Would not care for a
family mem-ber who was
sick with AIDS
If a family member had HIV
would want to keep it a
secret
Believe that a teacher with HIV
should not be allowed
to work
Would not buy
food from a person
with HIV/AIDS
Agree with at
least one discrimi-
natory statement
Agree with none of the dis-crimina-
tory state-ments*
OblastAkmola 12.9 58.6 54.7 78.7 92.7 7.3 797Aktobe 28.7 63.5 68.9 84.8 93.9 6.1 675Almaty 1.9 59.7 51.7 87.0 96.1 3.9 1 475Atyrau 23.8 75.7 54.2 70.6 92.4 7.6 458West Kazakhstan 12.0 52.4 67.0 93.2 97.2 2.8 699Zhambyl 3.6 63.4 69.2 77.7 98.1 1.9 877Karagandy 4.2 83.1 56.3 82.7 98.3 1.7 1 476Kostanai 2.4 77.5 48.4 79.7 96.7 3.3 1 015Kyzylorda 27.5 50.2 73.0 90.4 97.0 3.0 528Mangistau 10.0 79.8 79.9 93.1 98.5 1.5 335South Kazakhstan 13.8 58.3 77.6 86.1 98.0 2.0 1 768Pavlodar 7.1 60.6 46.5 78.1 94.8 5.2 820North Kazakhstan 11.6 62.4 55.7 80.2 94.7 5.3 674East Kazakhstan 5.1 72.5 64.5 89.0 97.6 2.4 1 467Astana City 18.9 87.7 52.3 76.0 97.4 2.6 368Almaty City 3.0 58.3 46.8 70.6 92.6 7.4 1 126ResidenceUrban 9.3 69.4 56.8 81.2 96.2 3.8 8 655Rural 9.5 60.6 65.0 84.9 96.3 3.7 5 903Age15–19 9.8 63.2 58.3 81.3 94.8 5.2 2 46920–24 9.5 68.4 60.3 82.0 96.3 3.7 2 10825–29 9.9 64.6 60.5 82.3 95.5 4.5 1 89430–34 10.1 66.5 63.8 83.8 97.6 2.4 1 90035–39 10.0 64.5 59.8 83.2 96.6 3.4 2 05540–44 9.0 67.2 60.2 82.9 96.6 3.4 2 07645–49 7.4 66.9 58.8 83.7 96.4 3.6 2 056EducationPrimary/incomplete secondary 9.6 62.8 61.5 82.3 95.3 4.7 1 948Secondary 10.1 62.8 65.0 84.7 96.5 3.5 4 892Specialized secondary 9.2 68.3 58.4 82.4 96.4 3.6 3 950Higher 8.6 68.7 55.1 80.5 96.1 3.9 3 768Wealth index quintilesPoorest 10.8 56.6 69.2 86.3 96.3 3.7 2 689Poor 9.5 62.7 64.2 84.2 96.4 3.6 2 728Middle 9.2 65.7 61.3 83.9 96.3 3.7 2 824Rich 9.5 69.0 56.5 81.4 96.4 3.6 2 915Richest 8.3 72.9 52.1 78.7 95.8 4.2 3 402Ethnicity/languageKazakh 11.3 62.6 64.6 84.4 96.2 3.8 8 608Russian 6.4 71.5 51.1 79.4 96.3 3.7 4 481Other 7.3 67.6 62.0 82.6 96.3 3.7 1 469Total 9.4 65.9 60.1 82.7 96.2 3.8 14 362
* MICS indicator 86

KAZAKHSTAN MULTIPLE INDICATOR CLUSTER SURVEY (MICS), 2006 145
Table HA.6: Knowledge of a facility for HIV testingPercentage of women aged 15-49 years who know where to get an HIV test, percentage of women who have been tested and, of those tested the percentage who have been told the result, Kazakhstan, 2006
Know a place to get tested*
Have been tested**
Number of women
If tested, have been told result
Number of women who have been tested for HIV
OblastAkmola 87.5 66.6 797 83.0 531Aktobe 82.6 58.7 675 71.3 396Almaty 73.3 42.7 1 475 83.6 630Atyrau 78.6 45.8 458 94.5 210West Kazakhstan 93.9 83.6 699 95.6 584Zhambyl 61.4 42.0 877 93.6 368Karagandy 82.0 71.1 1 476 88.4 1 049Kostanai 91.5 69.4 1 015 97.8 705Kyzylorda 81.6 53.3 528 73.1 281Mangistau 87.5 52.8 335 49.0 177South Kazakhstan 82.4 56.1 1 768 78.2 992Pavlodar 96.5 90.3 820 84.6 740North Kazakhstan 92.5 75.3 674 92.4 508East Kazakhstan 82.3 50.0 1 467 87.6 733Astana City 90.7 70.9 368 94.8 261Almaty City 87.4 73.0 1 126 99.1 821ResidenceUrban 86.4 63.8 8 655 89.8 5 524Rural 79.2 58.6 5 903 83.0 3 462Age15–19 64.9 29.5 2 469 87.7 72920–24 84.1 61.9 2 108 85.4 1 30525–29 88.9 74.5 1 894 85.9 1 41130–34 89.6 73.1 1 900 87.3 1 38835–39 88.6 71.0 2 055 88.0 1 45840–44 87.4 68.9 2 076 87.4 1 42945–49 85.2 61.6 2 056 88.8 1 266EducationPrimary/incomplete secondary 63.6 34.3 1 948 89.5 668Secondary 83.4 64.3 4 892 84.5 3 144Specialized secondary 87.7 67.9 3 950 88.2 2 682Higher 89.4 66.1 3 768 88.8 2 492Wealth index quintilesPoorest 74.8 55.1 2 689 81.2 1 482Poor 81.2 57.3 2 728 84.6 1 563Middle 82.1 60.8 2 824 85.5 1 716Rich 88.1 66.0 2 915 88.7 1 925Richest 89.3 67.6 3 402 92.8 2 300Ethnicity/languageKazakh 80.9 58.4 8 608 84.5 5 024Russian 89.7 69.5 4 481 91.2 3 116Other 79.3 57.6 1 469 88.3 846Total 83.5 61.7 14 558 87.2 8 986
* MICS indicator 87** MICS indicator 88

MONITORING THE SITUATION OF CHILDREN AND WOMEN146
Table HA.7: HIV testing and counseling coverage during antenatal carePercentage of women aged 15-49 years who gave birth in the two years preceding the survey who were offered HIV testing and counseling with their antenatal care, Kazakhstan, 2006
PERCENT OF WOMEN WHO: Number of women who
gave birth in the 2 years preced-ing the survey
Received antenatal care from a health care professional
for last pregnancy
Were provided information about
HIV prevention during ANC visit*
Were tested for HIV at ANC visit
Received results of HIV test at ANC visit**
OblastAkmola 97.1 70.2 94.0 78.1 80Aktobe 98.3 84.5 71.1 49.0 68Almaty 97.9 78.0 83.3 70.2 225Atyrau 100.0 98.3 89.3 84.3 53West Kazakhstan 95.3 96.5 97.7 93.0 58Zhambyl 98.4 78.9 89.2 82.3 139Karagandy 99.1 75.6 98.7 74.8 129Kostanai 92.0 81.6 97.3 93.3 84Kyzylorda 97.4 86.8 90.6 69.3 80Mangistau (100.0) (99.0) (98.6) (39.8) 45South Kazakhstan 100.0 80.3 95.5 76.4 309Pavlodar 99.0 86.1 99.0 81.5 83North Kazakhstan 98.6 54.5 95.0 87.9 61East Kazakhstan 94.8 82.7 95.2 84.6 141Astana City (100.0) (94.0) (98.8) (96.4) 40Almaty City 100.0 98.8 100.0 100.0 124ResidenceUrban 100.0 82.7 95.8 82.3 890Rural 96.1 82.1 89.8 75.0 829Age15–19 94.5 87.6 100.0 93.0 6420–24 98.4 78.8 93.9 76.5 50725–29 99.0 82.3 92.3 77.9 50130–34 97.3 82.7 90.9 75.7 36935–49 98.0 87.5 93.3 85.4 278EducationPrimary/incomplete secondary 93.8 71.5 87.4 77.5 112Secondary 98.2 81.7 91.4 74.5 734Specialized secondary 98.3 84.7 94.2 83.3 416Higher 99.0 84.1 95.6 81.9 457Wealth index quintilesPoorest 96.4 79.0 87.8 71.5 458Poor 96.8 81.9 92.7 78.7 348Middle 99.1 83.7 94.0 77.7 330Rich 99.6 80.7 96.4 82.4 280Richest 100.0 88.2 96.6 87.7 303Ethnicity/languageKazakh 98.7 84.9 92.7 77.0 1 163Russian 96.0 79.1 95.9 85.8 343Other 98.6 73.9 89.2 77.5 213Total 98.1 82.4 92.9 78.8 1 719
* MICS indicator 90** MICS indicator 91( ) – indicators are based on 25 – 49 cases of unweighted observations

KAZAKHSTAN MULTIPLE INDICATOR CLUSTER SURVEY (MICS), 2006 147
Tab
le T
B.1
: Kn
ow
led
ge a
bo
ut tu
ber
culo
sis
Perc
ent o
f wo
men
age
d 1
5-49
wh
o h
ave
gen
eral
kn
ow
led
ge o
f tub
ercu
losi
s, K
azak
hst
an, 2
006
Heard of tubercu-losis
Know about recov-ery after tuber-
culosis at proper treatment
Know
ledg
e of
maj
or tr
eatm
ent
Know
ledg
e of
tube
r-cu
losi
s tr
ansm
issio
nPa
rent
s w
ould
take
a c
hild
with
su
spec
ted
tube
rcul
osis
to:
Total
Number of women aged 15-49 years
In hospital
At home
In hospital at initial stage with further treatment at
home
Other
By air when coughing
Other
DK
Hospital
Polyclinic
Feldsher
TB dispen-sary
Obl
ast
Akm
ola
99.3
84.0
83.2
1.4
13.8
(*)
83.9
(7.2
)8.
949
.121
.6(7
.1)
21.4
100.
079
7
Akt
obe
99.8
84.5
88.9
0.3
10.8
na
95.9
(*)
(3.4
)33
.216
.8(*
)48
.310
0.0
675
Alm
aty
98.3
74.1
88.8
0.1
10.8
(*)
96.8
(*)
(*)
56.3
12.3
4.5
26.7
100.
01
475
Aty
rau
99.9
83.1
91.1
8.
8(*
)97
.2(*
)(2
.7)
11.1
7.9
(*)
79.8
100.
045
8
Wes
t Kaz
akhs
tan
99.5
83.9
79.2
0.1
20.6
na
98.4
(*)
(*)
15.7
14.3
5.7
64.3
100.
069
9
Zham
byl
99.1
73.6
70.8
0.3
27.6
(*)
89.4
5.7
5.0
25.7
19.5
(*)
54.0
100.
087
7
Kara
gand
y 99
.972
.078
.31.
220
.3(*
)94
.2(2
.6)
(3.3
)11
.064
.5(*
)24
.110
0.0
1 47
6
Kost
anai
99
.188
.581
.00.
317
.5(*
)97
.7(*
)(*
)21
.919
.8(4
.6)
53.5
100.
01
016
Kyzy
lord
a 99
.276
.575
.00.
324
.4(*
)93
.2(3
.1)
(3.8
)27
.915
.1(*
)56
.110
0.0
528
Man
gist
au
99.7
72.4
99.7
0.3
(*)
na
100.
0na
na25
.727
.4(*
)45
.210
0.0
335
Sout
h Ka
zakh
stan
99
.872
.688
.20.
511
.2(*
)98
.2(*
)(*
)19
.017
.9(1
.7)
61.2
100.
01
767
Pavl
odar
99
.889
.169
.91.
827
.7(*
)93
.6(*
)(3
.8)
31.5
28.0
(*)
39.1
100.
082
0
Nor
th K
azak
hsta
n 99
.876
.886
.01.
011
.7(*
)88
.8(5
.8)
(5.4
)48
.523
.1(3
.7)
24.5
100.
067
4
East
Kaz
akhs
tan
99.6
88.4
87.6
0.4
11.6
(*)
94.9
(*)
(3.0
)36
.223
.4(2
.1)
38.0
100.
01
467
Ast
ana
City
99.7
85.5
83.1
0.1
15.7
(*)
98.3
(*)
(*)
11.5
41.0
na47
.410
0.0
368
Alm
aty
City
98.6
71.8
83.1
0.3
15.8
(*)
97.5
(*)
(*)
49.8
28.2
na21
.810
0.0
1 12
6
Resi
denc
e
Urb
an99
.479
.282
.0(0
.6)
16.9
(0.5
)95
.71.
92.
425
.531
.9(*
)42
.110
0.0
8 65
5
Rura
l99
.378
.885
.0(0
.5)
14.0
(0.5
)93
.82.
83.
438
.814
.55.
341
.210
0.0
5 90
3
( )
– in
dica
tors
are
bas
ed o
n 25
– 4
9 ca
ses
of u
nwei
ghte
d ob
serv
atio
ns(*
) –
indi
cato
rs a
re b
ased
on
less
than
25
case
s of
unw
eigh
ted
obse
rvat
ions
na: n
ot a
pplic
able

MONITORING THE SITUATION OF CHILDREN AND WOMEN148
Tab
le T
B.1
: Kn
ow
led
ge a
bo
ut tu
ber
culo
sis
(co
nti
nue
d)
Heard of tubercu-losis
Know about recov-ery after tuber-
culosis at proper treatment
Know
ledg
e of
maj
or tr
eatm
ent
Know
ledg
e of
tube
r-cu
losi
s tr
ansm
issio
nPa
rent
s w
ould
take
a c
hild
with
su
spec
ted
tube
rcul
osis
to:
Total
Number of women aged 15-49 years
In hospital
At home
In hospital at initial stage with further treatment at
home
Other
By air when coughing
Other
DK
Hospital
Polyclinic
Feldsher
TB dispen-sary
Educ
atio
n
Prim
ary/
inco
mpl
ete
seco
ndar
y97
.973
.083
.5(*
)14
.4(1
.6)
91.2
3.3
5.4
36.3
22.0
3.0
38.2
100.
01
948
Seco
ndar
y 99
.377
.084
.7(*
)14
.5(*
)94
.42.
63.
035
.321
.83.
039
.810
0.0
4 89
3
Spec
ializ
ed s
econ
dary
99.9
81.0
83.8
(0.7
)15
.1(*
)95
.42.
02.
627
.327
.32.
242
.910
0.0
3 94
9
Hig
her
99.8
82.7
80.5
(*)
18.6
(*)
97.1
(1.5
)1.
526
.227
.7(1
.2)
44.8
100.
03
768
Age
15-1
998
.374
.583
.5(*
)15
.1(*
)94
.52.
13.
433
.323
.52.
140
.710
0.0
2 46
9
20-2
499
.878
.183
.7(*
)15
.8(*
)95
.9(2
.0)
2.1
30.7
22.8
2.5
43.9
100.
02
108
25-2
999
.577
.280
.8(*
)17
.7(*
)94
.3(2
.7)
3.0
31.7
24.5
(2.2
)41
.310
0.0
1 89
4
30-3
499
.279
.884
.4(*
)14
.5(*
)94
.9(2
.1)
3.0
31.3
25.1
(2.2
)41
.110
0.0
1 90
0
35-3
999
.781
.784
.9(*
)14
.2(*
)94
.42.
92.
729
.527
.2(1
.7)
41.5
100.
02
055
40-4
499
.881
.182
.5(*
)16
.3(*
)95
.8(1
.8)
2.4
29.6
25.8
3.0
41.4
100.
02
076
45-4
999
.681
.782
.4(*
)16
.5(*
)94
.7(2
.2)
3.0
29.9
25.2
(2.3
42.3
100.
02
056
Wea
lth
inde
x qu
inti
les
Poor
est
99.1
74.7
84.1
(*)
14.8
(*)
93.6
2.5
3.9
37.3
13.7
3.8
45.0
100.
02
689
Poor
99.4
81.1
85.7
(*)
13.4
(*)
94.6
2.1
3.2
39.0
15.9
4.5
40.5
100.
02
728
Mid
dle
99.2
78.8
85.8
(*)
13.1
(*)
94.2
2.5
3.3
33.2
23.1
2.9
40.5
100.
02
824
Rich
99.4
79.0
82.9
(*)
16.2
(*)
94.7
2.9
2.4
26.7
31.4
(*)
40.9
100.
02
916
Rich
est
99.7
81.0
78.5
(*)
20.0
(*)
97.0
(1.4
)(1
.5)
21.0
36.6
(*)
42.0
100.
03
402
Ethn
icit
y/la
ngua
ge
Kaza
kh99
.378
.983
.5(0
.5)
15.6
(0.4
)95
.51.
931
.122
.42.
743
.643
.510
0.0
8 60
9
Russ
ian
99.8
80.9
81.6
(0.7
)16
.9(*
)93
.92.
729
.729
.41.
639
.039
.810
0.0
4 48
1
Oth
er98
.374
.286
.2(*
)12
.7(*
)94
.92.
833
.225
.22.
1(3
9.1)
37.9
100.
01
468
Tota
l99
.479
.083
.20.
615
.70.
594
.92.
32.
830
.924
.82.
341
.710
0.0
14 5
58
( )
– in
dica
tors
are
bas
ed o
n 25
– 4
9 ca
ses
of u
nwei
ghte
d ob
serv
atio
ns(*
) –
indi
cato
rs a
re b
ased
on
less
than
25
case
s of
unw
eigh
ted
obse
rvat
ions
na: n
ot a
pplic
able

KAZAKHSTAN MULTIPLE INDICATOR CLUSTER SURVEY (MICS), 2006 149
Tab
le T
B.2
: Sym
pto
ms
of s
usp
ecte
d tu
ber
culo
sis
Perc
ent o
f wo
men
age
d 1
5–49
wh
o k
no
w m
ajo
r sy
mp
tom
s o
f sus
pec
ted
tub
ercu
losi
s, K
azak
hst
an, 2
006
SYM
PTO
MS
OF
SUSP
ECTE
D T
UBE
RCU
LOSI
S
TOTAL
Number of women aged 15-49 years
Cough
Cough with
phlegm
Cough over three
weeks
Fever
Blood with phlegm
Appetite loss
Night sweating
Chest pain
Fatigue, tiredness
Weight loss
Inertia, apathy
Other
Do not know
Obl
ast
Akm
ola
29.7
40.5
44.6
23.8
18.9
22.7
32.2
16.0
25.4
36.9
21.0
(5.4
)(5
.8)
100.
079
7
Akt
obe
31.0
54.2
69.9
29.6
58.4
22.1
34.2
55.1
27.9
56.7
18.0
(*)
(*)
100.
067
5
Alm
aty
32.9
34.4
27.8
19.2
24.5
18.5
12.1
43.5
16.6
30.2
19.9
na
(*)
100.
01
475
Aty
rau
33.3
16.9
40.8
49.4
52.8
43.7
43.1
45.9
30.9
50.8
13.1
(*)
(*)
100.
045
8
Wes
t Kaz
akhs
tan
6.2
43.2
49.1
35.1
47.9
17.3
47.2
40.4
19.7
43.9
8.9
na
(*)
100.
069
9
Zham
byl
31.8
37.0
46.3
42.7
31.5
19.2
29.8
18.7
24.5
35.1
17.5
(*)
(*)
100.
087
7
Kara
gand
y 24
.330
.958
.827
.839
.519
.930
.920
.023
.349
.521
.0(*
)(*
)10
0.0
1 47
6
Kost
anai
5.
836
.078
.349
.246
.224
.838
.749
.232
.145
.820
.4na
(*
)10
0.0
1 01
6
Kyzy
lord
a 27
.635
.136
.416
.116
.235
.135
.344
.428
.741
.18.
4(*
)(*
)10
0.0
528
Man
gist
au
14.3
66.9
71.7
59.9
98.2
61.8
54.4
78.7
52.1
60.5
15.1
nana
100.
033
5
Sout
h Ka
zakh
stan
24
.043
.239
.834
.235
.840
.542
.936
.122
.454
.413
.0(*
)(*
)10
0.0
1 76
7
Pavl
odar
7.
442
.275
.751
.955
.438
.151
.541
.539
.060
.524
.5na
(*
)10
0.0
820
Nor
th K
azak
hsta
n 18
.445
.643
.731
.835
.324
.041
.024
.727
.442
.922
.9(*
)(*
)10
0.0
674
East
Kaz
akhs
tan
27.9
43.8
56.2
51.1
34.4
22.4
34.0
26.2
23.0
41.6
11.8
na
(*)
100.
01
467
Ast
ana
City
16.0
62.6
61.4
55.0
60.3
23.0
37.6
41.4
31.4
42.5
19.1
(*)
(*)
100.
036
8
Alm
aty
City
29.2
50.9
68.3
38.1
34.2
22.0
38.5
39.1
20.8
57.4
18.0
(*)
(*)
100.
01
126
Resi
denc
e
Urb
an23
.143
.754
.739
.646
.530
.439
.540
.929
.049
.017
.7(0
.5)
1.2
100.
08
655
Rura
l23
.140
.450
.836
.138
.727
.635
.037
.525
.844
.315
.3(0
.4)
1.6
100.
05
903
( )
– in
dica
tors
are
bas
ed o
n 25
– 4
9 ca
ses
of u
nwei
ghte
d ob
serv
atio
ns(*
) –
indi
cato
rs a
re b
ased
on
less
than
25
case
s of
unw
eigh
ted
obse
rvat
ions
na: n
ot a
pplic
able

MONITORING THE SITUATION OF CHILDREN AND WOMEN150
Tab
le T
B.2
: Sym
pto
ms
of s
usp
ecte
d tu
ber
culo
sis
(co
nti
nue
d)
SYM
PTO
MS
OF
SUSP
ECTE
D T
UBE
RCU
LOSI
S
TOTAL
Number of women aged 15-49 years
Cough
Cough with
phlegm
Cough over three
weeks
Fever
Blood with phlegm
Appetite loss
Night sweating
Chest pain
Fatigue, tiredness
Weight loss
Inertia, apathy
Other
Do not know
Educ
atio
n
Prim
ary/
inco
mpl
ete
seco
ndar
y25
.740
.650
.336
.037
.924
.432
.135
.624
.842
.413
.1(*
)2.
810
0.0
1 94
8
Seco
ndar
y 23
.441
.351
.036
.439
.328
.035
.737
.424
.543
.915
.6(0
.5)
1.4
100.
04
893
Spec
ializ
ed s
econ
dary
22.4
42.5
54.4
39.8
45.4
30.3
39.4
41.1
30.4
49.2
18.3
(*)
(0.8
)10
0.0
3 94
9
Hig
her
22.1
43.5
55.0
39.2
47.2
31.7
40.1
41.8
29.7
50.4
17.8
(*)
(1.0
)10
0.0
3 76
8
Age
15-1
924
.239
.951
.838
.441
.727
.532
.939
.324
.944
.914
.4(*
)(1
.9)
100.
02
469
20-2
422
.740
.253
.438
.544
.429
.635
.640
.725
.745
.913
.7(*
)(*
)10
0.0
2 10
8
25-2
923
.144
.152
.738
.443
.829
.036
.940
.627
.144
.317
.3(*
)(*
)10
0.0
1 89
4
30-3
423
.543
.254
.436
.842
.629
.838
.939
.228
.547
.616
.1(*
)(*
)10
0.0
1 90
0
35-3
923
.444
.252
.838
.041
.729
.139
.738
.328
.847
.518
.2(*
)(1
.3)
100.
02
055
40-4
421
.942
.453
.338
.741
.129
.339
.338
.028
.448
.618
.5(*
)(1
.4)
100.
02
076
45-4
922
.841
.551
.936
.744
.129
.539
.338
.729
.849
.118
.4(*
)(1
.2)
100.
02
056
Wea
lth
inde
x qu
inti
les
Poor
est
24.8
41.2
46.4
33.6
35.6
28.1
36.4
38.6
23.2
42.3
13.1
(*)
(1.4
)10
0.0
2 68
9
Poor
22.6
39.2
52.3
36.1
37.6
27.3
35.1
35.6
26.6
43.9
15.4
(*)
(1.6
)10
0.0
2 72
8
Mid
dle
24.3
39.4
52.7
40.9
41.9
30.2
36.1
37.4
28.2
46.7
17.0
(*)
(1.3
)10
0.0
2 82
4
Rich
22.9
43.2
54.9
37.8
44.8
27.4
39.3
40.0
26.1
50.3
18.2
(*)
(1.4
)10
0.0
2 91
6
Rich
est
21.1
47.2
58.0
41.3
53.5
31.9
39.9
44.4
32.7
51.0
19.1
(*)
(1.0
)10
0.0
3 40
2
Ethn
icit
y/la
ngua
ge
Kaza
kh24
.241
.152
.137
.339
.328
.536
.038
.025
.446
.416
.10.
31.
210
0.0
8 60
9
Russ
ian
22.1
41.6
56.7
37.1
41.4
24.1
38.6
33.3
27.9
47.5
20.5
1.2
1.5
100.
04
481
Oth
er23
.840
.943
.931
.532
.525
.727
.531
.820
.544
.114
.90.
61.
310
0.0
1 46
8
Tota
l23
.142
.152
.838
.042
.829
.137
.339
.327
.546
.816
.60.
51.
310
0.0
14 5
58
( )
– in
dica
tors
are
bas
ed o
n 25
– 4
9 ca
ses
of u
nwei
ghte
d ob
serv
atio
ns(*
) –
indi
cato
rs a
re b
ased
on
less
than
25
case
s of
unw
eigh
ted
obse
rvat
ions
na: n
ot a
pplic
able

KAZAKHSTAN MULTIPLE INDICATOR CLUSTER SURVEY (MICS), 2006 151
Tab
le T
B.3
: TB
sym
pto
ms,
wh
ich
req
uire
see
ing
a d
oct
or
Perc
ent o
f wo
men
age
d 1
5–49
wh
o w
ill s
ee a
do
cto
r if
so
me
TB
sym
pto
ms
app
ear,
Kaz
akh
stan
, 200
6
SYM
PTO
MS
OF
TUBE
RCU
LOSI
S RE
QU
IRIN
G S
EEIN
G A
DO
CTO
R
TOTA
L
Number of women aged 15-49 years
Cough
Cough with
phlegm
Cough over three
weeks
Fever
Blood with
phlegm
Appetite loss
Night sweating
Chest pain
Fatigue, tiredness
Weight loss
Inertia, apathy
Other
DK
Obl
ast
Akm
ola
25.6
37.6
50.7
30.3
21.9
22.6
31.0
19.4
24.8
35.0
19.1
(*)
(5.4
)10
0.0
797
Akt
obe
32.6
50.8
75.2
37.6
58.5
18.4
35.8
54.3
21.8
49.3
18.2
(*)
(*)
100.
067
5
Alm
aty
31.1
29.6
30.7
30.8
23.9
21.6
14.8
43.2
17.0
31.2
20.8
(*)
(*)
100.
01
475
Aty
rau
34.1
17.3
39.2
50.5
52.0
44.2
43.4
46.7
31.5
50.6
13.7
(*)
(*)
100.
045
8
Wes
t Kaz
akhs
tan
7.2
39.8
55.7
38.2
49.1
16.3
59.1
43.8
19.1
40.9
6.5
(*)
(*)
100.
069
9
Zham
byl
27.8
31.3
47.0
39.9
27.5
14.0
22.7
14.8
16.7
28.9
15.1
(*)
(*)
100.
087
7
Kara
gand
y 13
.224
.680
.749
.252
.323
.245
.942
.523
.950
.121
.6(*
)(*
)10
0.0
1 47
6
Kost
anai
5.
637
.278
.349
.447
.624
.838
.750
.231
.446
.519
.4(*
)(*
)10
0.0
1 01
6
Kyzy
lord
a 25
.933
.040
.418
.221
.134
.837
.751
.130
.751
.19.
4(*
)(*
)10
0.0
528
Man
gist
au
9.6
53.3
62.0
52.0
97.0
48.2
43.5
81.2
38.9
61.6
10.4
(*)
(*)
100.
033
5
Sout
h Ka
zakh
stan
23
.943
.738
.934
.035
.640
.441
.535
.523
.354
.913
.1(*
)(*
)10
0.0
1 76
7
Pavl
odar
10
.235
.378
.049
.847
.629
.343
.437
.232
.244
.217
.5(*
)(*
)10
0.0
820
Nor
th K
azak
hsta
n 14
.233
.457
.544
.035
.817
.234
.330
.221
.730
.418
.3(*
)(*
)10
0.0
674
East
Kaz
akhs
tan
19.7
30.2
64.3
53.3
24.5
12.8
26.6
37.6
18.9
33.6
12.7
(*)
(*)
100.
01
467
Ast
ana
City
14.3
53.5
72.3
50.7
64.0
20.4
33.1
41.8
28.5
51.3
22.9
(*)
(*)
100.
036
8
Alm
aty
City
29.6
49.8
74.0
38.7
33.6
22.5
38.5
41.4
20.0
57.1
19.2
(*)
(*)
100.
01
126
Resi
denc
e
Urb
an20
.937
.661
.642
.542
.625
.237
.941
.324
.546
.317
.4(0
.4)
0.8
100.
08
655
Rura
l20
.634
.554
.039
.533
.723
.932
.637
.622
.040
.415
.2(*
)1.
410
0.0
5 90
3
( )
– in
dica
tors
are
bas
ed o
n 25
– 4
9 ca
ses
of u
nwei
ghte
d ob
serv
atio
ns(*
) –
indi
cato
rs a
re b
ased
on
less
than
25
case
s of
unw
eigh
ted
obse
rvat
ions

MONITORING THE SITUATION OF CHILDREN AND WOMEN152
Tab
le T
B.3
: TB
sym
pto
ms,
wh
ich
req
uire
see
ing
a d
oct
or
(co
nti
nue
d)
SYM
PTO
MS
OF
TUBE
RCU
LOSI
S RE
QU
IRIN
G S
EEIN
G A
DO
CTO
R
TOTA
L
Number of women aged 15-49 years
Cough
Cough with
phlegm
Cough over three
weeks
Fever
Blood with
phlegm
Appetite loss
Night sweating
Chest pain
Fatigue, tiredness
Weight loss
Inertia, apathy
Other
DK
Educ
atio
n
Prim
ary/
inco
mpl
ete
seco
ndar
y22
.536
.454
.340
.536
.621
.631
.036
.820
.339
.912
.5(*
)(2
.4)
100.
01
948
Seco
ndar
y 21
.035
.956
.141
.036
.324
.334
.337
.721
.841
.115
.7(*
)1.
010
0.0
4 89
3
Spec
ializ
ed s
econ
dary
19.2
35.8
61.1
42.9
40.9
24.9
37.6
41.0
24.9
44.9
18.0
(*)
(0.8
)10
0.0
3 94
9
Hig
her
21.3
37.5
61.1
40.4
41.8
26.6
38.1
42.9
25.6
48.6
18.1
(*)
(*)
100.
03
768
Age
15-1
921
.136
.655
.342
.638
.622
.632
.839
.420
.241
.814
.1(*
)(1
.8)
100.
02
469
20-2
420
.634
.259
.739
.939
.025
.433
.340
.521
.642
.314
.1(*
)(*
)10
0.0
2 10
8
25-2
921
.138
.358
.541
.339
.824
.534
.941
.523
.042
.517
.3(*
)(*
)10
0.0
1 89
4
30-3
422
.236
.359
.739
.439
.125
.538
.039
.824
.843
.916
.0(*
)(*
)10
0.0
1 90
0
35-3
919
.937
.259
.240
.737
.825
.538
.138
.725
.045
.018
.0(*
)(*
)10
0.0
2 05
5
40-4
420
.637
.158
.942
.538
.425
.435
.939
.424
.845
.318
.5(*
)(*
)10
0.0
2 07
6
45-4
920
.235
.058
.842
.340
.524
.238
.139
.525
.547
.018
.3(*
)(*
)10
0.0
2 05
6
Wea
lth
inde
x qu
inti
les
Poor
est
23.4
37.4
49.1
38.1
32.8
28.2
36.0
39.9
20.7
41.2
13.6
(*)
(1.3
)10
0.0
2 68
9
Poor
20.0
34.5
55.0
39.6
33.5
23.0
32.1
36.1
23.0
40.0
15.5
(*)
(1.1
)10
0.0
2 72
8
Mid
dle
21.0
34.7
56.5
43.4
37.1
23.1
32.3
36.6
22.8
41.4
15.6
(*)
(1.2
)10
0.0
2 82
4
Rich
19.8
35.8
61.2
40.9
40.3
23.5
36.8
41.5
21.7
46.9
17.3
(*)
(*)
100.
02
916
Rich
est
20.1
38.8
67.9
43.6
48.7
25.5
40.3
43.9
27.9
48.8
19.7
(*)
(*)
100.
03
402
Ethn
icit
y/la
ngua
ge
Kaza
kh22
.036
.756
.641
.038
.725
.836
.241
.623
.244
.615
.60.
21.
010
0.0
8 60
9
Russ
ian
18.8
35.1
64.8
43.3
41.9
21.7
36.8
37.9
25.0
41.9
18.7
0.4
1.1
100.
04
481
Oth
er19
.738
.350
.236
.532
.127
.329
.934
.920
.145
.915
.20.
30.
910
0.0
1 46
8
Tota
l20
.836
.458
.541
.339
.024
.735
.839
.823
.543
.916
.5(0
.3)
1.0
100.
014
558
( )
– in
dica
tors
are
bas
ed o
n 25
– 4
9 ca
ses
of u
nwei
ghte
d ob
serv
atio
ns(*
) –
indi
cato
rs a
re b
ased
on
less
than
25
case
s of
unw
eigh
ted
obse
rvat
ions

KAZAKHSTAN MULTIPLE INDICATOR CLUSTER SURVEY (MICS), 2006 153
Table TB.4: Attitudes towards people with TB.Percent of women aged 15–49 who express a discriminatory attitude towards people with TB, Kazakhstan, 2006
RESPONDENTS WHO:Percentage of women aged
15-49
Number of women aged 15-49 years
Had TB or have family members
with TB
Communicate with neighbors,
colleagues or close friends with TB
Would not care for a family
member who was treated against TB
OblastAkmola 8.1 13.1 (4.3) 5.5 797Aktobe (3.1) 6.6 14.4 4.6 675Almaty (2.9) (2.5) (2.4) 10.1 1 475Atyrau (3.3) 12.8 8.9 3.1 458West Kazakhstan 6.9 10.9 11.4 4.8 699Zhambyl 5.3 (4.8) (*) 6.0 877Karagandy (4.8) 7.1 (2.8) 10.1 1 476Kostanai 7.8 9.9 (*) 7.0 1 016Kyzylorda 7.1 11.5 (4.2) 3.6 528Mangistau (3.1) (4.5) 6.7 2.3 335South Kazakhstan 3.1 (2.7) (2.7) 12.1 1 767Pavlodar 12.4 12.6 (*) 5.6 820North Kazakhstan 5.3 14.0 (*) 4.6 674East Kazakhstan 4.4 7.0 (*) 10.1 1 467Astana City 5.5 16.1 14.4 2.5 368Almaty City 1.3 (3.0) (*) 7.7 1 126ResidenceUrban 4.7 7.5 4.6 59.5 8 655Rural 5.5 7.5 2.9 40.5 5 903EducationPrimary/incomplete secondary 6.4 5.4 3.5 13.4 1 948Secondary 5.3 7.1 3.5 33.6 4 893Specialized secondary 5.2 9.0 3.9 27.1 3 949Higher 3.6 7.3 4.5 25.9 3 768Age15-19 4.5 4.5 3.7 17.0 2 46920-24 4.9 5.4 4.7 14.5 2 10825-29 4.7 8.5 4.7 13.0 1 89430-34 4.7 7.8 4.5 13.0 1 90035-39 4.9 8.1 3.3 14.1 2 05540-44 5.0 9.3 3.6 14.3 2 07645-49 6.1 9.5 2.7 14.1 2 056Wealth index quintiles Poorest 5.6 5.9 3.4 18.5 2 689Poor 5.3 7.3 2.7 18.7 2 728Middle 5.1 7.8 3.2 19.4 2 824Rich 4.5 7.6 4.2 20.0 2 916Richest 4.6 8.4 5.4 23.4 3 402Ethnicity/language Kazakh 5.0 7.1 4.1 59.1 8 609Russian 5.1 8.5 3.8 30.8 4 481Other 4.5 6.1 2.7 10.1 1 468Total 5.0 7.5 3.9 100.0 14 558
( ) – indicators are based on 25-49 cases of unweighted observations(*) – indicators are based on less than 25 cases of unweighted observations

MONITORING THE SITUATION OF CHILDREN AND WOMEN154
Appendix A
Sample designThe sample for the Kazakhstan Multiple Indicator Cluster Survey (MICS) was designed to provide estimates of a large number of indicators on the situation of children and women at national level, for urban and rural areas, as well as at sub-national level for 16 regions – 14 Oblasts and 2 cities.
Akmola Oblast
Aktobe Oblast
Almaty Oblast
Atyrau Oblast
West Kazakhstan Oblast
Zhambyl Oblast
Karaganda Oblast
Kostanai Oblast
Kyzylorda Oblast
Mangistau Oblast
South Kazakhstan Oblast
Pavlodar Oblast
North Kazakhstan Oblast
East Kazakhstan Oblast
Astana City
Almaty City
The major features of sample design are described in this appendix. Sample design features include target sample size, sample allocation, sample frame and listing, choice of domains, sampling stages, stratification, and the calculation of sample weights.
The primary objective of the sample design for the Kazakhstan Multiple Indicator Cluster Survey (MICS) was to produce statistically reliable estimates of most indicators, at the national level, for urban and rural areas, and for the above 16 regions of the country.
A multi-stage, stratified cluster sampling approach was used for the selection of the survey sample.
Sample Size and Sample AllocationThe target sample size for the Kazakhstan MICS was calculated as 15,000 households. For the calcu-lation of the sample size, the key indicator used was immunization prevalence among children aged 0-4 years. The following formula was used to estimate the required sample size for these indicators:
where
n is the required sample size, expressed as number of households
4 is a factor to achieve the 95 percent level of confidence
r is the predicted or anticipated prevalence (coverage rate) of the indicator
1.1 is the factor necessary to raise the sample size by 10 percent for non-response
f is the shortened symbol for deff (design effect)
0.12r is the margin of error to be tolerated at the 95 percent level of confidence, defined as 12 per-cent of r (relative sampling error of r)
p is the proportion of the total population upon which the indicator, r, is based
nh is the average household size.

KAZAKHSTAN MULTIPLE INDICATOR CLUSTER SURVEY (MICS), 2006 155
In this case, the sample size provides 12 percent error for identifying the indicator (at 95 percent of the level of confidence). Identification of sample size based on indicators related to the smallest groups of population guarantees sampling representation for other indicators related to the larger groups of population.
For the calculation, r (immunization prevalence) was assumed to be 25 percent (0.25). The value of deff (design effect) was taken as 1.5, based on estimates from previous surveys, p (percentage of children aged 0-4 years in the total population) was taken as 8 percent, and nh (average household size) was taken as 3.6 people.
The resulting number of households from this exercise was 4,775. This number of households is sufficient for producing estimates of indicators at national level; however, sample volume should be tripled in order to provide representation of sample for urban and rural area. At the same time, some indicators will be obtained with good accuracy and at regional level. In order to increase the number of these indicators, a compromise decision was taken to increase the sample size up to 15,000 households considering financial and human resources.
The average cluster size in the Kazakhstan MICS was determined as 24 households, based on a number of considerations, including the budget available, and the time that would be needed per team to complete one cluster. Dividing the total number of households by the number of households per cluster, we have 625 clusters to be surveyed. In each region, the clusters (primary sampling units – PSU) were distributed to urban and rural areas, proportional to the size of urban and rural popula-tions in that region. The table below shows the allocation of clusters to the sampling domains.
Table SD.1. Allocation of sample clusters (primary sampling units) to Sampling Domains
OblastPopulation (2005 estimates) Number of Clusters
Total Urban Rural Total Urban Rural
KAZAKHSTAN 15,074,767 8,614,651 6,460,116 625 360 265
Akmola 747,185 352,204 394,981 37 18 19
Aktobe 678,607 374,775 303,832 36 19 17
Almaty 1,589,751 473,978 1,115,773 47 14 33
Atyrau 463,466 261,702 201,764 33 18 15
West Kazakhstan 606,534 262,518 344,016 35 15 20
Zhambyl 992,089 447,406 544,683 41 18 23
Karaganda 1,331,702 1,116,456 215,246 45 37 8
Kostanai 907,396 498,630 408,766 39 21 18
Kyzylorda 612,048 364,248 247,800 35 20 15
Mangistau 361,754 274,628 87,126 32 23 9
South Kazakhstan 2,193,556 880,663 1,312,893 48 18 30
Pavlodar 743,826 487,817 256,009 37 23 14
North Kazakhstan 665,936 227,440 438,496 36 12 24
East Kazakhstan 1442,097 853,366 588,731 46 26 20
Astana City 529,335 529,335 0 34 34 0
Almaty City 1,209,485 1,209,485 0 44 44 0

MONITORING THE SITUATION OF CHILDREN AND WOMEN156
Sampling Frame and Selection of ClustersThe 1999 census frame was used for the selection of clusters. Census enumeration areas were defined as primary sampling units (PSUs). 14 Oblasts were divided up in accordance with existing territorial and administrative divisions and 625 clusters were distributed between the districts and Almaty and Astana cities based on the population density as of the beginning of 2005. Then, the given number of PSUs in each region was randomly selected with equal probability.
Listing activities and selection of householdsSince the sample frame (the 1999 Population Census) was not up to date, household lists in all se-lected enumeration areas were updated prior to the selection of households. For this purpose, listing teams were formed, who visited each enumeration area, and listed the occupied households.
The staff of territorial statistical bodies listed the households in their territories; rural statisticians, staff of rayon, city and Oblast Statistic Departments visited each sampled census area and listed all inhabited households. Listing was based on the list of sampled households in accordance with the 1999 Population Census, prepared by the DCC AS RK, from 10 November to 25 December 2005. As a result, the real addresses and the number of inhabitants in each cluster was established. For each PSU, 24 households were selected out of a general list of households using systematic selection pro-cedures.
Calculation of Sample WeightsThe Kazakhstan Multiple Indicator Cluster Survey sample is not self-weighted. In general, by allocat-ing equal numbers of households to each of the regions, different sampling fractions were used in each region since the size of the regions varied. For this reason, sample weights were calculated and these were used in the subsequent analyses of the survey data.
The major component of the weight is the reciprocation of the sampling fraction employed in se-lecting the number of sample households in that particular sampling domain:
Wh = 1 / fh
where fh, the sampling fraction at the h-th stratum, is the product of probabilities of selection at every stage in each sampling domain:
fh = Pih * P2h * P3h,where Pih is the probability of selection of the sampling unit in the i-th stage for the h-th sampling domain.
Since the estimated numbers of households per enumeration area prior to the first stage selection (selection of primary sampling units) and the updated number of households per enumeration area were different, individual sampling fractions for households in each enumeration area (cluster) were calculated. The sampling fractions for households in each cluster therefore included the probability of selection of the enumeration area in that particular sampling domain and the probability of selec-tion of a household in the sample enumeration area (cluster).
A second component which has to be taken into account in the calculation of sample weights is the level of non-response for the household and individual interviews. The adjustment for household non-response is equal to the inverse value of:
RR = Number of interviewed households / Number of occupied households listed
After the completion of fieldwork, response rates were calculated for each area. These were used to adjust the sample weights calculated for each cluster. Response rates in Kazakhstan Multiple Indicator Cluster Survey are shown in Table HH.1 in this report.

KAZAKHSTAN MULTIPLE INDICATOR CLUSTER SURVEY (MICS), 2006 157
Similarly, the adjustment for non-response at the individual level (women and children under 5) is equal to the inverse value of:
RR = Completed women’s (or under-5’s) questionnaires / Eligible women (or under-5s)
Numbers of eligible women and under-5 children were obtained from the household listing in the Household Questionnaire in households where interviews were completed.
The unadjusted weights for the households were calculated by multiplying the above factors for each enumeration area. These weights were then standardized (or normalized), one purpose of which is to make the sum of the interviewed sample units equal the total sample size at the national level. Normalization is performed by multiplying the aforementioned unadjusted weights by the ratio of the number of completed households to the total unadjusted weighted number of households. A similar standardization procedure was followed in obtaining standardized weights for the women’s and under-5’s questionnaires. Corrected (standardized) weights of households varied in 625 clusters from 0.187 to 1.814.
Sample weights were appended to all data sets and analyses were performed by weighting each household, woman or under-5 with these sample weights.
Number of population at the begin-ning of 2005
Number of households
Number of clusters

MONITORING THE SITUATION OF CHILDREN AND WOMEN158
Appendix B
List of Personnel Involved in the SurveySupervisory personnel14 Mr. Kali Abdiyev – Chair of the Agency RK on Statistics (2006, February), Director of RSE «Data Computing Centre» of the Statistic Agency of the Republic of Kazakhstan (2006, February-2007, July)
Mr. Bakhyt Sultanov – Chair of the Agency RK on Statistics (2006, February – 2007, February)
Ms. Anar Meshimbayeva – Chair of the Agency RK on Statistics (2007, February)
Mr. Yury Shokamanov – Deputy Chair of the Agency RK on Statistic
Mr. Yerbolat Mussabek – MICS National Project Coordinator, from the Agency RK on Statistic, Deputy Director of Social and Demography Statistics Department
Ms. Gulnara Kukanova – MICS Technical Coordinator, Head of Population Statistics Department, Agency RK on Statistics
Mr. Asankhan Mamedaliyev – specialist on MISC sampling, Head of Registers Division, Coordination Department, AS RK
International OrganizationsMr. Alexandre Zouev –UNICEF Representative in Kazakhstan
Mr. Raimbek Sissemaliev – Head of UNICEF Almaty Zone Office, Programme Officer
Ms. Gaziza Moldakulova – MICS Project Coordinator, UNFPA Office in Kazakhstan
ConsultantsMr. Trevor Croft – International expert on data processing (USA)
Mr. George Sakvarelidze – UNICEF Regional Office (Switzerland)
Mr. Turgay Unalan – UNICEF International Consultant (Turkey)
Mr. Anthony Turner – UNICEF International Sampling Expert (USA)
Mr. Mukhtar Minbayev – Project Coordinator on Monitoring and Evaluation, UNICEF Office in the Kyrgyz Republic
RSE DCC staffMs. Zinagul Dzhumanbayeva – Director, RSE DCC AS (2005 – 2006, February), Deputy Director, RSE DCC AS (2006, February till present)
Mr. Bakhytbek Kulekeyev – Deputy Director, RSE DCC AS
Ms. Aigul Kapisheva – Head of Division for Processing Databases
Ms. Gulnara Nurunova – Head of Personnel Department
Ms. Aigerim Kaliakbarova – Head of Financial and Accounting Division
Mr. Orynbassar Dzhunisbayev – Head of Transport Service
Ms. Hamia Iskakova – Head of General Service Division
14 All positions are indicated at the moment of MICS (2005-2007)

KAZAKHSTAN MULTIPLE INDICATOR CLUSTER SURVEY (MICS), 2006 159
Staff processing and entering the dataMs. Saule Dauylbayeva – Supervisor of data control and entry and formation of MICS database, Head of Dataware Division of the Department of Population Register and Survey
Editors ControllersBeibit Ibraimov
Gulzat Nusipzhanova
Olga Bikmeyeva
Arman Zhantileuov
Mukhamed Shakhzadayev
Zhanat Ordakhanov
Madiar Ordakhanov
Nurgul Moldakhmetova
Data Entry Operators
Gulmira Zhumanbayeva
Sanzhar Zhumanbayev
Sanzhar Dauylbayev
Takhir Nuritdinov
Nikolay Stepin
Azamat Marat
Yerlan Aidynbayev
Azhar Beibit
Marzhan Parmenova
Ayauzhan Bazgalamova
Assem Abikeyeva
Timur Kanlybayev
Lyazzat Aimukhanova
Bayan Dautaliyeva
Assel Beissenova
Zhanna Kanlybayeva
Assem Alchikanova
Yekaterina Konstantinova
Arailym Imanbayeva
Elmira Umarkodzhayeva
Marina Novikova
Ainur Zhambylbayeva
Kanat Imanaliyev
Azhar Bapysheva
Oblast teams for fieldwork
Akmola OblastAltyn Kassymova – supervisorAltynai Kazybayeva – editor
Interviewers:Zhanna Sagindykova Anargul MakizhanovaRoza Ordabayeva Gulim KozhanovaAizhan AissabayevaBakytgul Nurusheva
Aktobe OblastKairat Zhekeyev – supervisorZholdaskali Beissov – editor
Interviewers:Kunbibi Kazmukhanbetova Laura SuyundukovaAisaule Adbenova Klara KurganbayevaGulmira Yeralina Kadisha Tulegenova
Almaty OblastLyudmila Saveko – supervisorBolatkan Nukezhanov – editor
Interviewers:Vera Tobolich Svetlana MalogolovayaSvetlana Imirova Lyudmila IvanovaShargul TokhtarbekovaMarzhan Issayeva
Atyrau OblastGalya Mukhangaliyeva – supervisorAmankos Tuleuov – editor
Interviewers:Maira ShershekbayevaKunsulu IskaliyevaLazgul KuzembayevaBayan KurmangaliyevaZhanar MukushevaMarzhan Anessova

MONITORING THE SITUATION OF CHILDREN AND WOMEN160
West Kazakhstan OblastAmanzhan Zhumanov – supervisorMargulan Hugmanov – editor
Interviewers:Dzhamilya Hussainova Zoya Klimenko Gulnara ShukalovaMaria Sagitova Roza Kozhbayeva Assiya Yesekenova
Zhambyl OblastInga Shevtsova – supervisorMubara Rakhimova – editor
Interviewers:Natalia Pak Zhanyl KurmanbekovaZhanat UstabayevaGalina ShestakovaMarianna Tigai
Karaganda OblastGalia Kaskirbayeva – supervisorSayagul Konakbayeva – editor
Interviewers:Tatiana Zeinollina Bayan BekpayevaAlla Lysenko Aisha BelgibayevaNatalia Nechet Nina Balakina
Kostanai OblastAltyn Nuralenova – supervisorAibek Galymzhanov – editor
Interviewers:Dina Kurganbekova Svetlana LevitskayaLilia Lodyanaya Tatiana ZhartayevaAnar Kassenova Tatiana Matushevich
Kyzylorda OblastLidiya Kim – supervisorOndash Mashenbayev – editor
Interviewers:Galina Yermekova Assel DoszhanovaBakhyt Mulikova Roza AbshakirovaZaida AbdrakhmanovaZhuldyz Tokanova
Mangistau OblastSholpan Shakabayeva – supervisorAkdary Narinbayeva – editor
Interviewers:Shyrailym KetebayevaAkmaral Bekkaliyeva Natalia ChetyrinaGulna AyupovaAssel BekzhanovaFatima Kanatova

KAZAKHSTAN MULTIPLE INDICATOR CLUSTER SURVEY (MICS), 2006 161
Almaty City Gulnara Kerimkhanova – supervisorAikhan Bokhanov – editor
Interviewers:Aigul TurganbayevaGulbanu EshzhanovaGulmira Saitova Lyazzat NysanbayevaIndira KassymkhanovaNurgul Abdiyeva
South Kazakhstan OblastYernazar Kultayev – supervisorMirakhmet Tasbolatov – editor
Interviewers:Lyudmila Karbysheva Bagila ShaulenovaBakhyt TuyebalovaZhanat BuribekovaAurika KhanGulmira Syzdykova
North Kazakhstan OblastGulziyan Izbassova – supervisorLyubov Zelevova – editor
Interviewers:Guzalia PermyakovaLyazzat ZhetpissovaIrina Vdovina Natalia SolopovaErmek KairzhanovaAssel Kermbayeva
Pavlodar OblastKumar Alseitov – supervisorKulzhan Issenova– editor
Interviewers:Aigul NurgaliyevaZhanar AbishevaLarissa ShalukhoLyudmila BerezhnayaMarina NoskoIrina Penko
Astana CityKenzhebulat Bekpenbet – supervisorSara Aubakirova– editor
InterviewersSvetlana Orezkhova Roza TazhikenovaRoza Taibasarova Lyubov AkinshinaAlmagul ZhumagulovaLyazzat Boldurukova
East Kazakhstan OblastBogdan Grinishin – supervisorYury Komarov – editor
Interviewers:Zinazaip DzhabossinovaSvetlana Dolgikh Nazgul OrazayevaGulyaim KassenovaArdak AkhmadievaLaura Uskabayeva

MONITORING THE SITUATION OF CHILDREN AND WOMEN162
Appendix C
Estimates of Sampling Errors The sample of respondents selected in the Kazakhstan Multiple Indicator Cluster Survey is only one of the samples that could have been selected from the same population, using the same design and size. Each of these samples would yield results that differ somewhat from the results of the actual sample selected. Sampling errors are a measure of the variability between all possible samples. The extent of variability is not known exactly, but can be estimated statistically from the survey results.
The following sampling error measures are presented in this appendix for each of the selected indi-cators:
Standard error (se): Sampling errors are usually measured in terms of standard errors for par-ticular indicators (means, proportions etc). Standard error is the square root of the variance. The Taylor linearization method is used for the estimation of standard errors.
Coefficient of variation (se/r) is the ratio of the standard error to the value of the indicator.
Design effect (deff) is the ratio of the actual variance of an indicator, under the sampling method used in the survey, to the variance calculated under the assumption of simple random sampling. The square root of the design effect (deft) is used to show the efficiency of the sample design. A deft value of 1.0 indicates that the sample design is as efficient as a simple random sample, while a deft value above 1.0 indicates the increase in the standard error due to the use of a more complex sample design.
Confidence limits are calculated to show the interval within which the true value for the popu-lation can be reasonably assumed to fall. For any given statistic calculated from the survey, the value of that statistics will fall within a range of plus or minus two times the standard error (p + 2.se or p – 2.se) of the statistic in 95 percent of all possible samples of identical size and design.
For the calculation of sampling errors from MICS data, SPSS Version 14 Complex Samples module has been used. The results are shown in the tables that follow. In addition to the sampling error measures described above, the tables also include weighted and unweighted counts of denomina-tors for each indicator.
Sampling errors are calculated for indicators of primary interest, for the national total, for the re-gions, and for urban and rural areas. Two of the selected indicators are based on households, 6 are based on household members, 9 are based on women, and 12 are based on children under 5. All indicators presented here are in the form of proportions. Table SE.1 shows the list of indicators for which sampling errors are calculated, including the base population (denominator) for each indica-tor. Tables SE.2 to SE.9 show the calculated sampling errors.

KAZAKHSTAN MULTIPLE INDICATOR CLUSTER SURVEY (MICS), 2006 163
Table SE.1. Indicators selected for sampling error calculationsList of indicators selected for sampling error calculations, and base populations (denominators) for each indicator, Kazakhstan, 2006
MICS Indicator Base PopulationHOUSEHOLDS
41 Iodized salt consumption All households74 Child discipline Children aged 2-14 years selected
HOUSEHOLD MEMBERS11 Use of improved drinking water sources All household members12 Use of improved sanitation facilities All household members55 Net primary school attendance rate Children of primary school age56 Net secondary school attendance rate Children of secondary school age59 Primary completion rate Children of primary school completion age71 Child labor Children aged 5-14 years
WOMEN 4 Skilled attendant at delivery Women aged 15-49 years with a live birth in
the last 2 years20 Antenatal care Women aged 15-49 years with a live birth in
the last 2 years21 Contraceptive prevalence Women aged 15-49 currently married/in
union60 Adult literacy Women aged 15-24 years67 Marriage before age 18 Women aged 20-49 years82 Comprehensive knowledge about HIV pre-
vention among young peopleWomen aged 15-24 years
86 Attitude towards people with HIV/AIDS Women aged 15-49 years88 Women who have been tested for HIV Women aged 15-49 years89 Knowledge of mother- to-child transmission
of HIV Women aged 15-49 years
UNDER-5s6 Underweight prevalence Children under age 5
25 Tuberculosis immunization coverage Children aged 12-23 months 26 Polio immunization coverage Children aged 12-23 months 27 Immunization coverage for DPT Children aged 12-23 months 28 Measles immunization coverage Children aged 12-23 months 31 Fully immunized children Children aged 12-23 months - Acute respiratory infection in last two weeks Children under age 5
22 Antibiotic treatment of suspected pneumo-nia
Children under age 5 with suspected pneu-monia in the last 2 weeks
- Diarrhoea in last two weeks Children under age 535 Received ORT or increased fluids and contin-
ued feedingChildren under age 5 with diarrhoea in the last 2 weeks
46 Support for learning Children under age 562 Birth registration Children under age 5

MONITORING THE SITUATION OF CHILDREN AND WOMEN164
Tab
le S
E.2
. Sam
plin
g er
rors
: to
tal s
amp
leSt
anda
rd e
rror
s, co
effic
ien
ts o
f var
iati
on, d
esig
n e
ffec
ts (
deff
), s
quar
e ro
ot o
f des
ign
eff
ects
(de
ft)
and
con
fiden
ce in
terv
als
for s
elec
ted
indi
cato
rs, K
azak
hst
an, 2
006
Tabl
eVa
lue
®St
anda
rd
erro
r (se
)
Coef
ficie
nt
of v
aria
-tio
n (s
e/r)
Des
ign
ef-
fect
(de
ff)
Squa
re ro
ot
of d
esig
n ef
fect
(de
ft)
Wei
ghte
d co
unt
Unw
eigh
ted
coun
t
Confi
denc
e lim
its
r – 2
se
r+ 2
se
HO
USE
HO
LDS
Iodi
zed
salt
cons
umpt
ion
NU
.50.
920
0.00
30.
004
2.35
61.
535
1442
614
458
0.91
30.
927
Child
dis
cipl
ine
CP.4
0.52
20.
008
0.01
51.
649
1.28
464
1168
640.
506
0.53
7H
OU
SEH
OLD
MEM
BERS
Use
of i
mpr
oved
drin
king
wat
er s
ourc
esEN
.10.
937
0.00
60.
006
8.13
72.
853
5126
114
564
0.92
50.
948
Use
of i
mpr
oved
san
itatio
n fa
cilit
ies
EN.5
0.99
20.
002
0.00
27.
348
2.71
151
261
1456
40.
989
0.99
6N
et p
rimar
y sc
hool
atte
ndan
ce ra
teED
.30.
980
0.00
30.
003
1.25
21.
119
3076
3387
0.97
50.
986
Net
sec
onda
ry s
choo
l atte
ndan
ce ra
teED
.40.
953
0.00
30.
003
1.38
31.
176
7119
7804
0.94
70.
958
Prim
ary
com
plet
ion
rate
ED.6
0.88
40.
010
0.01
10.
831
0.91
184
792
80.
865
0.90
3Ch
ild la
bor
CP.2
0.02
20.
002
0.08
51.
523
1.23
483
2191
920.
018
0.02
6W
OM
ENSk
illed
atte
ndan
t at d
eliv
ery
RH.5
0.99
80.
001
0.00
10.
801
0.89
517
1917
840.
997
1.00
0A
nten
atal
car
eRH
.30.
999
0.00
10.
001
0.59
20.
770
1719
1784
0.99
71.
000
Cont
race
ptiv
e pr
eval
ence
RH.1
0.50
70.
007
0.01
31.
542
1.24
283
4983
700.
493
0.52
1A
dult
liter
acy
ED.8
0.99
80.
001
0.00
11.
181
1.08
745
7746
970.
996
0.99
9M
arria
ge b
efor
e ag
e 18
CP.5
0.08
50.
003
0.03
71.
561
1.24
912
089
1203
20.
079
0.09
2Co
mpr
ehen
sive
kno
wle
dge
abou
t HIV
pre
vent
ion
amon
g yo
ung
peop
leH
A.3
0.22
30.
006
0.02
52.
675
1.63
514
558
1456
00.
211
0.23
4
Atti
tude
tow
ards
peo
ple
with
HIV
/AID
SH
A.5
0.03
80.
003
0.07
02.
733
1.65
314
362
1431
00.
032
0.04
3W
omen
who
hav
e be
en te
sted
for H
IVH
A.6
0.61
70.
007
0.01
12.
788
1.67
014
558
1456
00.
604
0.63
1Kn
owle
dge
of m
othe
r- to
-chi
ld tr
ansm
issio
n of
HIV
HA
.40.
545
0.00
70.
013
2.86
91.
694
1455
814
560
0.53
10.
559
UN
DER
-5s
Und
erw
eigh
t pre
vale
nce
NU
.10.
040
0.00
30.
085
1.26
91.
127
4190
4181
0.03
30.
047
Tube
rcul
osis
imm
uniz
atio
n co
vera
geCH
.20.
996
0.00
20.
002
1.37
61.
173
991
976
0.99
21.
000
Polio
imm
uniz
atio
n co
vera
geCH
.20.
967
0.00
80.
008
1.77
41.
332
989
974
0.95
20.
982
Imm
uniz
atio
n co
vera
ge fo
r DPT
CH.2
0.98
00.
006
0.00
61.
634
1.27
898
697
10.
969
0.99
2M
easl
es im
mun
izat
ion
cove
rage
CH.2
0.99
40.
003
0.00
31.
110
1.05
498
697
20.
989
0.99
9Fu
lly im
mun
ized
chi
ldre
nCH
.20.
962
0.00
80.
008
1.64
41.
282
988
973
0.94
70.
978
Acu
te re
spira
tory
infe
ctio
n in
last
two
wee
ksCH
.60.
015
0.00
20.
146
1.45
51.
206
4415
4415
0.01
10.
020
Ant
ibio
tic tr
eatm
ent o
f sus
pect
ed p
neum
onia
CH.7
0.31
70.
010
0.03
20.
032
0.17
867
660.
296
0.33
7D
iarr
hoea
in la
st tw
o w
eeks
CH.4
0.01
80.
002
0.12
51.
267
1.12
644
1544
150.
014
0.02
3Re
ceiv
ed O
RT o
r inc
reas
ed fl
uids
and
Con
tinue
d fe
edin
g CH
.50.
480
0.01
20.
025
0.04
10.
203
8075
0.45
60.
504
Supp
ort f
or le
arni
ngCD
.10.
810
0.00
70.
008
1.26
41.
124
4415
4415
0.79
70.
823
Birt
h re
gist
ratio
nCP
.10.
992
0.00
10.
001
1.15
31.
074
4415
4415
0.98
90.
995
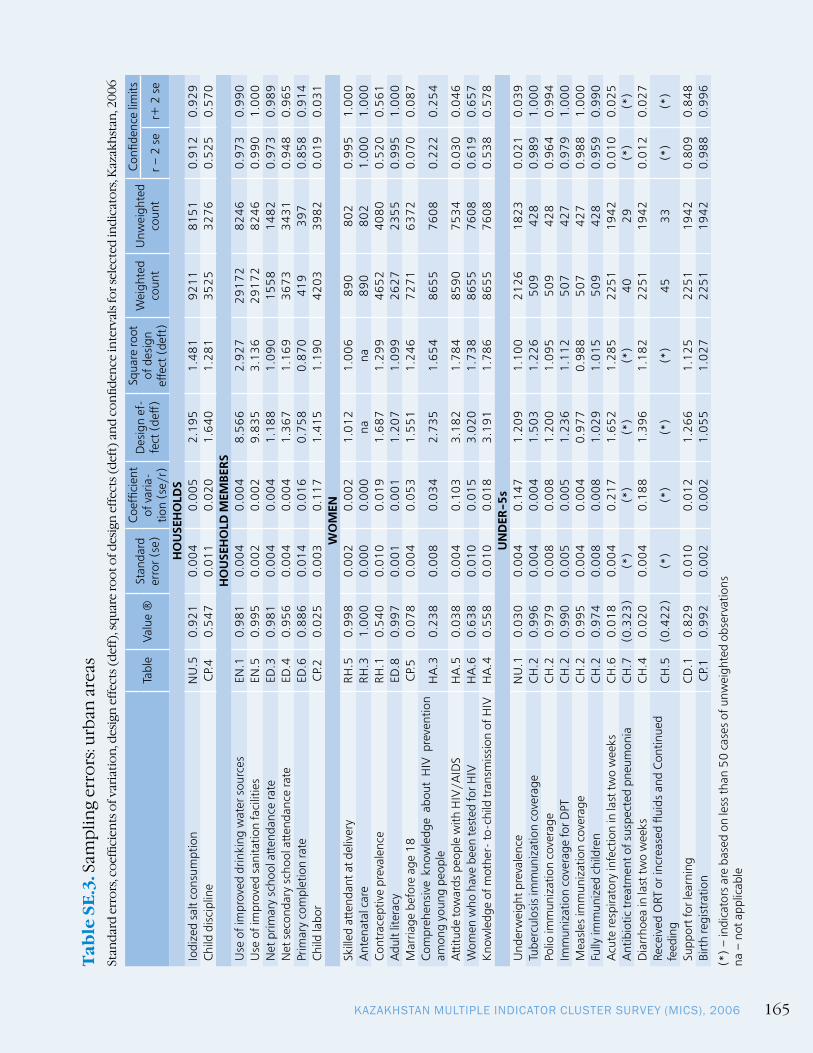
KAZAKHSTAN MULTIPLE INDICATOR CLUSTER SURVEY (MICS), 2006 165
Tab
le S
E.3
. Sam
plin
g er
rors
: urb
an a
reas
Stan
dard
err
ors,
coef
ficie
nts
of v
aria
tion
, des
ign
eff
ects
(de
ff),
squ
are
root
of d
esig
n e
ffec
ts (
deft
) an
d co
nfid
ence
inte
rval
s fo
r sel
ecte
d in
dica
tors
, Kaz
akh
stan
, 200
6
Tabl
eVa
lue
®St
anda
rd
erro
r (se
)
Coef
ficie
nt
of v
aria
-tio
n (s
e/r)
Des
ign
ef-
fect
(de
ff)
Squa
re ro
ot
of d
esig
n ef
fect
(de
ft)
Wei
ghte
d co
unt
Unw
eigh
ted
coun
t
Confi
denc
e lim
its
r – 2
se
r+ 2
se
HO
USE
HO
LDS
Iodi
zed
salt
cons
umpt
ion
NU
.50.
921
0.00
40.
005
2.19
51.
481
9211
8151
0.91
20.
929
Child
dis
cipl
ine
CP.4
0.54
70.
011
0.02
01.
640
1.28
135
2532
760.
525
0.57
0H
OU
SEH
OLD
MEM
BERS
Use
of i
mpr
oved
drin
king
wat
er s
ourc
esEN
.10.
981
0.00
40.
004
8.56
62.
927
2917
282
460.
973
0.99
0U
se o
f im
prov
ed s
anita
tion
faci
litie
sEN
.50.
995
0.00
20.
002
9.83
53.
136
2917
282
460.
990
1.00
0N
et p
rimar
y sc
hool
atte
ndan
ce ra
teED
.30.
981
0.00
40.
004
1.18
81.
090
1558
1482
0.97
30.
989
Net
sec
onda
ry s
choo
l atte
ndan
ce ra
teED
.40.
956
0.00
40.
004
1.36
71.
169
3673
3431
0.94
80.
965
Prim
ary
com
plet
ion
rate
ED.6
0.88
60.
014
0.01
60.
758
0.87
041
939
70.
858
0.91
4Ch
ild la
bor
CP.2
0.02
50.
003
0.11
71.
415
1.19
042
0339
820.
019
0.03
1W
OM
ENSk
illed
atte
ndan
t at d
eliv
ery
RH.5
0.99
80.
002
0.00
21.
012
1.00
689
080
20.
995
1.00
0A
nten
atal
car
eRH
.31.
000
0.00
00.
000
nana
890
802
1.00
01.
000
Cont
race
ptiv
e pr
eval
ence
RH.1
0.54
00.
010
0.01
91.
687
1.29
946
5240
800.
520
0.56
1A
dult
liter
acy
ED.8
0.99
70.
001
0.00
11.
207
1.09
926
2723
550.
995
1.00
0M
arria
ge b
efor
e ag
e 18
CP.5
0.07
80.
004
0.05
31.
551
1.24
672
7163
720.
070
0.08
7Co
mpr
ehen
sive
kno
wle
dge
abou
t H
IV p
reve
ntio
n am
ong
youn
g pe
ople
HA
.30.
238
0.00
80.
034
2.73
51.
654
8655
7608
0.22
20.
254
Atti
tude
tow
ards
peo
ple
with
HIV
/AID
SH
A.5
0.03
80.
004
0.10
33.
182
1.78
485
9075
340.
030
0.04
6W
omen
who
hav
e be
en te
sted
for H
IVH
A.6
0.63
80.
010
0.01
53.
020
1.73
886
5576
080.
619
0.65
7Kn
owle
dge
of m
othe
r- to
-chi
ld tr
ansm
issio
n of
HIV
HA
.40.
558
0.01
00.
018
3.19
11.
786
8655
7608
0.53
80.
578
UN
DER
-5s
Und
erw
eigh
t pre
vale
nce
NU
.10.
030
0.00
40.
147
1.20
91.
100
2126
1823
0.02
10.
039
Tube
rcul
osis
imm
uniz
atio
n co
vera
geCH
.20.
996
0.00
40.
004
1.50
31.
226
509
428
0.98
91.
000
Polio
imm
uniz
atio
n co
vera
geCH
.20.
979
0.00
80.
008
1.20
01.
095
509
428
0.96
40.
994
Imm
uniz
atio
n co
vera
ge fo
r DPT
CH.2
0.99
00.
005
0.00
51.
236
1.11
250
742
70.
979
1.00
0M
easl
es im
mun
izat
ion
cove
rage
CH.2
0.99
50.
004
0.00
40.
977
0.98
850
742
70.
988
1.00
0Fu
lly im
mun
ized
chi
ldre
nCH
.20.
974
0.00
80.
008
1.02
91.
015
509
428
0.95
90.
990
Acu
te re
spira
tory
infe
ctio
n in
last
two
wee
ksCH
.60.
018
0.00
40.
217
1.65
21.
285
2251
1942
0.01
00.
025
Ant
ibio
tic tr
eatm
ent o
f sus
pect
ed p
neum
onia
CH.7
(0.3
23)
(*)
(*)
(*)
(*)
4029
(*)
(*)
Dia
rrho
ea in
last
two
wee
ksCH
.40.
020
0.00
40.
188
1.39
61.
182
2251
1942
0.01
20.
027
Rece
ived
ORT
or i
ncre
ased
flui
ds a
nd C
ontin
ued
feed
ing
CH.5
(0.4
22)
(*)
(*)
(*)
(*)
4533
(*)
(*)
Supp
ort f
or le
arni
ngCD
.10.
829
0.01
00.
012
1.26
61.
125
2251
1942
0.80
90.
848
Birt
h re
gist
ratio
nCP
.10.
992
0.00
20.
002
1.05
51.
027
2251
1942
0.98
80.
996
(*)
– in
dica
tors
are
bas
ed o
n le
ss th
an 5
0 ca
ses
of u
nwei
ghte
d ob
serv
atio
nsna
– n
ot a
pplic
able

MONITORING THE SITUATION OF CHILDREN AND WOMEN166
Tab
le S
E.4
. Sam
plin
g er
rors
: rur
al a
reas
Stan
dard
err
ors,
coef
ficie
nts
of v
aria
tion
, des
ign
eff
ects
(de
ff),
squ
are
root
of d
esig
n e
ffec
ts (
deft
) an
d co
nfid
ence
inte
rval
s fo
r sel
ecte
d in
dica
tors
, Kaz
akh
stan
, 200
6
Tabl
eVa
lue
®St
anda
rd
erro
r (se
)
Coef
ficie
nt
of v
aria
-tio
n (s
e/r)
Des
ign
ef-
fect
(de
ff)
Squa
re ro
ot
of d
esig
n ef
fect
(de
ft)
Wei
ghte
d co
unt
Unw
eigh
ted
coun
t
Confi
denc
e lim
its
r – 2
se
r+ 2
se
HO
USE
HO
LDS
Iodi
zed
salt
cons
umpt
ion
NU
.50.
918
0.00
60.
006
2.57
31.
604
5215
6307
0.90
70.
929
Child
dis
cipl
ine
CP.4
0.49
10.
011
0.02
11.
583
1.25
828
8635
880.
470
0.51
2H
OU
SEH
OLD
MEM
BERS
Use
of i
mpr
oved
drin
king
wat
er s
ourc
esEN
.10.
877
0.01
20.
014
8.33
72.
887
2208
963
180.
853
0.90
1U
se o
f im
prov
ed s
anita
tion
faci
litie
sEN
.50.
989
0.00
30.
003
5.84
42.
417
2208
963
180.
983
0.99
6N
et p
rimar
y sc
hool
atte
ndan
ce ra
teED
.30.
980
0.00
40.
004
1.28
91.
136
1518
1905
0.97
30.
987
Net
sec
onda
ry s
choo
l atte
ndan
ce ra
teED
.40.
949
0.00
40.
004
1.35
81.
165
3446
4373
0.94
10.
956
Prim
ary
com
plet
ion
rate
ED.6
0.88
20.
013
0.01
50.
889
0.94
342
753
10.
856
0.90
8Ch
ild la
bor
CP.2
0.01
90.
002
0.12
41.
555
1.24
741
1852
100.
014
0.02
4W
OM
ENSk
illed
atte
ndan
t at d
eliv
ery
RH.5
0.99
90.
000
0.00
00.
001
0.03
382
998
20.
999
0.99
9A
nten
atal
car
eRH
.30.
997
0.00
10.
001
0.67
00.
819
829
982
0.99
41.
000
Cont
race
ptiv
e pr
eval
ence
RH.1
0.46
50.
008
0.01
81.
226
1.10
736
9742
900.
448
0.48
2A
dult
liter
acy
ED.8
0.99
80.
001
0.00
11.
049
1.02
419
5123
420.
996
1.00
0M
arria
ge b
efor
e ag
e 18
CP.5
0.09
50.
005
0.05
11.
533
1.23
848
1856
600.
086
0.10
5Co
mpr
ehen
sive
kno
wle
dge
abou
t H
IV p
reve
ntio
n am
ong
youn
g pe
ople
HA
.30.
200
0.00
70.
036
2.31
71.
522
5903
6952
0.18
60.
215
Atti
tude
tow
ards
peo
ple
with
HIV
/AID
SH
A.5
0.03
70.
003
0.07
91.
647
1.28
357
7367
760.
031
0.04
3W
omen
who
hav
e be
en te
sted
for H
IVH
A.6
0.58
60.
009
0.01
52.
305
1.51
859
0369
520.
569
0.60
4Kn
owle
dge
of m
othe
r- to
-chi
ld tr
ansm
issio
n of
HIV
HA
.40.
527
0.00
90.
016
2.10
01.
449
5903
6952
0.50
90.
544
UN
DER
-5s
Und
erw
eigh
t pre
vale
nce
NU
.10.
051
0.00
50.
104
1.35
81.
165
2064
2358
0.04
00.
061
Tube
rcul
osis
imm
uniz
atio
n co
vera
geCH
.20.
996
0.00
30.
003
1.17
01.
082
483
548
0.99
01.
000
Polio
imm
uniz
atio
n co
vera
geCH
.20.
955
0.01
30.
014
2.23
41.
495
481
546
0.92
80.
981
Imm
uniz
atio
n co
vera
ge fo
r DPT
CH.2
0.97
00.
010
0.01
11.
966
1.40
247
854
40.
950
0.99
1M
easl
es im
mun
izat
ion
cove
rage
CH.2
0.99
30.
004
0.00
41.
244
1.11
547
954
50.
986
1.00
0Fu
lly im
mun
ized
chi
ldre
nCH
.20.
949
0.01
40.
015
2.15
11.
467
479
545
0.92
20.
977
Acu
te re
spira
tory
infe
ctio
n in
last
two
wee
ksCH
.60.
012
0.00
20.
169
0.88
70.
942
2164
2473
0.00
80.
017
Ant
ibio
tic tr
eatm
ent o
f sus
pect
ed p
neum
onia
CH.7
(0.3
08)
(*)
(*)
(*)
(*)
2737
(*)
(*)
Dia
rrho
ea in
last
two
wee
ksCH
.40.
016
0.00
20.
152
0.94
10.
970
2164
2473
0.01
10.
021
Rece
ived
ORT
or i
ncre
ased
flui
ds a
nd
Cont
inue
d fe
edin
g CH
.5(0
.555
)(*
)(*
)(*
)(*
)35
42(*
)(*
)
Supp
ort f
or le
arni
ngCD
.10.
791
0.00
90.
011
1.21
91.
104
2164
2473
0.77
30.
809
Birt
h re
gist
ratio
nCP
.10.
992
0.00
20.
002
1.23
51.
111
2164
2473
0.98
80.
996
(*)
– in
dica
tors
are
bas
ed o
n le
ss th
an 5
0 ca
ses
of u
nwei
ghte
d ob
serv
atio
ns

KAZAKHSTAN MULTIPLE INDICATOR CLUSTER SURVEY (MICS), 2006 167
Tab
le S
E.5
. Sam
plin
g er
rors
: Akm
ola
Ob
last
Stan
dard
err
ors,
coef
ficie
nts
of v
aria
tion
, des
ign
eff
ects
(de
ff),
squ
are
root
of d
esig
n e
ffec
ts (
deft
) an
d co
nfid
ence
inte
rval
s fo
r sel
ecte
d in
dica
tors
, Kaz
akh
stan
, 200
6
Tabl
eVa
lue
®St
anda
rd
erro
r (se
)
Coef
ficie
nt
of v
aria
-tio
n (s
e/r)
Des
ign
ef-
fect
(de
ff)
Squa
re ro
ot
of d
esig
n ef
fect
(de
ft)
Wei
ghte
d co
unt
Unw
eigh
ted
coun
t
Confi
denc
e lim
its
r – 2
se
r+ 2
se
HO
USE
HO
LDS
Iodi
zed
salt
cons
umpt
ion
NU
.50.
839
0.01
70.
020
1.81
11.
346
879
846
0.80
50.
873
Child
dis
cipl
ine
CP.4
0.54
00.
034
0.06
21.
688
1.29
938
237
30.
473
0.60
8H
OU
SEH
OLD
MEM
BERS
Use
of i
mpr
oved
drin
king
wat
er s
ourc
esEN
.10.
984
0.00
70.
007
2.67
01.
634
2924
846
0.96
90.
998
Use
of i
mpr
oved
san
itatio
n fa
cilit
ies
EN.5
0.98
90.
006
0.00
62.
498
1.58
129
2484
60.
977
1.00
0N
et p
rimar
y sc
hool
atte
ndan
ce ra
teED
.30.
971
0.01
60.
016
1.51
41.
230
181
178
0.94
01.
000
Net
sec
onda
ry s
choo
l atte
ndan
ce ra
teED
.40.
943
0.01
20.
013
1.09
61.
047
392
382
0.91
80.
968
Prim
ary
com
plet
ion
rate
ED.6
(0.8
57)
(*)
(*)
(*)
(*)
4241
(*)
(*)
Child
labo
rCP
.20.
011
0.00
50.
433
0.95
10.
975
471
461
0.00
10.
020
WO
MEN
Skill
ed a
ttend
ant a
t del
iver
yRH
.51.
000
0.00
00.
000
nana
8067
1.00
01.
000
Ant
enat
al c
are
RH.3
1.00
00.
000
0.00
0na
na80
671.
000
1.00
0Co
ntra
cept
ive
prev
alen
ceRH
.10.
606
0.02
20.
036
0.89
50.
946
529
443
0.56
20.
650
Adu
lt lit
erac
yED
.81.
000
0.00
00.
000
nana
221
184
1.00
01.
000
Mar
riage
bef
ore
age
18CP
.50.
096
0.01
30.
137
1.11
01.
054
668
558
0.07
00.
122
Com
preh
ensi
ve k
now
ledg
e ab
out H
IV p
reve
ntio
n am
ong
youn
g pe
ople
HA
.30.
248
0.01
80.
074
1.21
11.
100
797
666
0.21
10.
285
Atti
tude
tow
ards
peo
ple
with
HIV
/AID
SH
A.5
0.07
30.
010
0.13
50.
947
0.97
378
565
60.
053
0.09
3W
omen
who
hav
e be
en te
sted
for H
IVH
A.6
0.66
60.
027
0.04
02.
133
1.46
179
766
60.
613
0.71
9Kn
owle
dge
of m
othe
r- to
-chi
ld tr
ansm
issio
n of
HIV
HA
.40.
470
0.02
80.
060
2.09
81.
449
797
666
0.41
40.
526
UN
DER
-5s
Und
erw
eigh
t pre
vale
nce
NU
.10.
037
0.01
40.
380
1.17
31.
083
242
212
0.00
90.
065
Tube
rcul
osis
imm
uniz
atio
n co
vera
geCH
.2(1
.000
)(*
)(*
)na
na38
33(*
)(*
)Po
lio im
mun
izat
ion
cove
rage
CH.2
(0.9
67)
(*)
(*)
(*)
(*)
3833
(*)
(*)
Imm
uniz
atio
n co
vera
ge fo
r DPT
CH.2
(1.0
00)
(*)
(*)
nana
3632
(*)
(*)
Mea
sles
imm
uniz
atio
n co
vera
geCH
.2(1
.000
)(*
)(*
)na
na38
33(*
)(*
)Fu
lly im
mun
ized
chi
ldre
nCH
.2(0
.967
)(*
)(*
)(*
)(*
)38
33(*
)(*
)A
cute
resp
irato
ry in
fect
ion
in la
st tw
o w
eeks
CH.6
0.00
90.
006
0.69
80.
927
0.96
324
321
30.
000
0.02
1D
iarr
hoea
in la
st tw
o w
eeks
CH.4
0.00
90.
006
0.67
90.
877
0.93
624
321
30.
000
0.02
1Su
ppor
t for
lear
ning
CD.1
0.80
10.
026
0.03
20.
886
0.94
124
321
30.
749
0.85
2Bi
rth
regi
stra
tion
CP.1
0.98
70.
010
0.01
01.
527
1.23
624
321
30.
967
1.00
0
(*)
– in
dica
tors
are
bas
ed o
n le
ss th
an 5
0 ca
ses
of u
nwei
ghte
d ob
serv
atio
nsna
– n
ot a
pplic
able

MONITORING THE SITUATION OF CHILDREN AND WOMEN168
Tab
le S
E.6
. Sam
plin
g er
rors
: Akt
ob
e O
bla
stSt
anda
rd e
rror
s, co
effic
ien
ts o
f var
iati
on, d
esig
n e
ffec
ts (
deff
), s
quar
e ro
ot o
f des
ign
eff
ects
(de
ft)
and
con
fiden
ce in
terv
als
for s
elec
ted
indi
cato
rs, K
azak
hst
an, 2
006
Tabl
eVa
lue
®St
anda
rd
erro
r (se
)
Coef
ficie
nt
of v
aria
-tio
n (s
e/r)
Des
ign
ef-
fect
(de
ff)
Squa
re ro
ot
of d
esig
n ef
fect
(de
ft)
Wei
ghte
d co
unt
Unw
eigh
ted
coun
t
Confi
denc
e lim
its
r – 2
se
r+ 2
se
HO
USE
HO
LDS
Iodi
zed
salt
cons
umpt
ion
NU
.50.
912
0.02
00.
022
4.19
52.
048
626
833
0.87
10.
952
Child
dis
cipl
ine
CP.4
0.39
50.
045
0.11
53.
567
1.88
929
841
60.
304
0.48
5H
OU
SEH
OLD
MEM
BERS
Use
of i
mpr
oved
drin
king
wat
er s
ourc
esEN
.10.
950
0.02
60.
027
11.9
673.
459
2292
837
0.89
81.
000
Use
of i
mpr
oved
san
itatio
n fa
cilit
ies
EN.5
0.93
60.
031
0.03
312
.908
3.59
322
9283
70.
875
0.99
7N
et p
rimar
y sc
hool
atte
ndan
ce ra
teED
.30.
987
0.00
80.
008
1.01
01.
005
152
216
0.97
11.
000
Net
sec
onda
ry s
choo
l atte
ndan
ce ra
teED
.40.
949
0.00
90.
009
0.76
10.
872
321
461
0.93
20.
967
Prim
ary
com
plet
ion
rate
ED.6
0.88
50.
031
0.03
50.
560
0.74
941
600.
823
0.94
7Ch
ild la
bor
CP.2
0.02
60.
010
0.39
12.
248
1.49
939
055
70.
006
0.04
6W
OM
ENSk
illed
atte
ndan
t at d
eliv
ery
RH.5
1.00
00.
000
0.00
0na
na68
931.
000
1.00
0A
nten
atal
car
eRH
.31.
000
0.00
00.
000
nana
6893
1.00
01.
000
Cont
race
ptiv
e pr
eval
ence
RH.1
0.47
90.
040
0.08
42.
998
1.73
134
846
10.
398
0.56
0A
dult
liter
acy
ED.8
0.99
70.
003
0.00
30.
837
0.91
521
729
60.
992
1.00
0M
arria
ge b
efor
e ag
e 18
CP.5
0.05
80.
012
0.20
21.
829
1.35
356
072
90.
034
0.08
1Co
mpr
ehen
sive
kno
wle
dge
abou
t H
IV p
reve
ntio
n am
ong
youn
g pe
ople
HA
.30.
215
0.04
40.
207
10.3
823.
222
675
887
0.12
60.
303
Atti
tude
tow
ards
peo
ple
with
HIV
/AID
SH
A.5
0.06
10.
018
0.29
14.
707
2.17
065
986
10.
025
0.09
6W
omen
who
hav
e be
en te
sted
for H
IVH
A.6
0.58
70.
029
0.05
03.
100
1.76
167
588
70.
529
0.64
6Kn
owle
dge
of m
othe
r- to
-chi
ld tr
ansm
issio
n of
HIV
HA
.40.
489
0.04
40.
089
6.76
62.
601
675
887
0.40
10.
576
UN
DER
-5s
Und
erw
eigh
t pre
vale
nce
NU
.10.
057
0.02
30.
404
2.18
51.
478
171
221
0.01
10.
104
Tube
rcul
osis
imm
uniz
atio
n co
vera
geCH
.21.
000
0.00
00.
000
nana
4356
1.00
01.
000
Polio
imm
uniz
atio
n co
vera
geCH
.21.
000
0.00
00.
000
nana
4356
1.00
01.
000
Imm
uniz
atio
n co
vera
ge fo
r DPT
CH.2
1.00
00.
000
0.00
0na
na43
561.
000
1.00
0M
easl
es im
mun
izat
ion
cove
rage
CH.2
1.00
00.
000
0.00
0na
na43
561.
000
1.00
0Fu
lly im
mun
ized
chi
ldre
nCH
.21.
000
0.00
00.
000
nana
4356
1.00
01.
000
Acu
te re
spira
tory
infe
ctio
n in
last
two
wee
ksCH
.60.
010
0.00
60.
576
0.79
60.
892
181
234
0.00
00.
022
Dia
rrho
ea in
last
two
wee
ksCH
.40.
023
0.01
00.
453
1.11
21.
054
181
234
0.00
20.
043
Supp
ort f
or le
arni
ngCD
.10.
787
0.02
90.
037
1.20
01.
095
181
234
0.72
80.
846
Birt
h re
gist
ratio
nCP
.10.
997
0.00
30.
003
0.81
40.
902
181
234
0.99
01.
000
na –
not
app
licab
le

KAZAKHSTAN MULTIPLE INDICATOR CLUSTER SURVEY (MICS), 2006 169
Tab
le S
E.7
. Sam
plin
g er
rors
: Alm
aty
Ob
last
Stan
dard
err
ors,
coef
ficie
nts
of v
aria
tion
, des
ign
eff
ects
(de
ff),
squ
are
root
of d
esig
n e
ffec
ts (
deft
) an
d co
nfid
ence
inte
rval
s fo
r sel
ecte
d in
dica
tors
, Kaz
akh
stan
, 200
6
Tabl
eVa
lue
®St
anda
rd
erro
r (se
)
Coef
ficie
nt
of v
aria
-tio
n (s
e/r)
Des
ign
ef-
fect
(de
ff)
Squa
re ro
ot
of d
esig
n ef
fect
(de
ft)
Wei
ghte
d co
unt
Unw
eigh
ted
coun
t
Confi
denc
e lim
its
r – 2
se
r+ 2
se
HO
USE
HO
LDS
Iodi
zed
salt
cons
umpt
ion
NU
.50.
997
0.00
20.
002
2.05
21.
433
1332
1081
0.99
21.
000
Child
dis
cipl
ine
CP.4
0.24
60.
022
0.09
11.
575
1.25
570
558
20.
201
0.29
1H
OU
SEH
OLD
MEM
BERS
Use
of i
mpr
oved
drin
king
wat
er s
ourc
esEN
.10.
976
0.00
70.
007
2.13
01.
459
5474
1096
0.96
30.
990
Use
of i
mpr
oved
san
itatio
n fa
cilit
ies
EN.5
0.99
40.
004
0.00
43.
055
1.74
854
7410
960.
986
1.00
0N
et p
rimar
y sc
hool
atte
ndan
ce ra
teED
.30.
985
0.00
80.
008
1.27
01.
127
368
304
0.96
91.
000
Net
sec
onda
ry s
choo
l atte
ndan
ce ra
teED
.40.
933
0.00
90.
010
0.84
70.
921
750
624
0.91
40.
951
Prim
ary
com
plet
ion
rate
ED.6
0.79
70.
039
0.04
90.
811
0.90
110
587
0.71
80.
875
Child
labo
rCP
.20.
009
0.00
40.
420
1.27
01.
127
954
790
0.00
10.
017
WO
MEN
Skill
ed a
ttend
ant a
t del
iver
yRH
.51.
000
0.00
00.
000
nana
225
179
1.00
01.
000
Ant
enat
al c
are
RH.3
0.99
50.
005
0.00
50.
897
0.94
722
517
90.
985
1.00
0Co
ntra
cept
ive
prev
alen
ceRH
.10.
402
0.02
00.
051
1.18
11.
087
875
686
0.36
20.
443
Adu
lt lit
erac
yED
.80.
997
0.00
30.
003
0.92
40.
961
451
357
0.99
21.
000
Mar
riage
bef
ore
age
18CP
.50.
090
0.00
90.
105
1.03
51.
017
1225
956
0.07
10.
109
Com
preh
ensi
ve k
now
ledg
e ab
out
HIV
pre
vent
ion
amon
g yo
ung
peop
leH
A.3
0.31
10.
020
0.06
62.
244
1.49
814
7511
550.
270
0.35
1
Atti
tude
tow
ards
peo
ple
with
HIV
/AID
SH
A.5
0.03
90.
007
0.18
61.
587
1.26
014
3511
230.
025
0.05
4W
omen
who
hav
e be
en te
sted
for H
IVH
A.6
0.42
70.
016
0.03
71.
207
1.09
914
7511
550.
395
0.45
9Kn
owle
dge
of m
othe
r- to
-chi
ld tr
ansm
issio
n of
HIV
HA
.40.
461
0.02
00.
043
1.83
31.
354
1475
1155
0.42
20.
501
UN
DER
-5s
Und
erw
eigh
t pre
vale
nce
NU
.10.
081
0.01
30.
165
0.92
30.
961
506
383
0.05
40.
108
Tube
rcul
osis
imm
uniz
atio
n co
vera
geCH
.20.
990
0.01
00.
010
0.90
70.
953
119
910.
969
1.00
0Po
lio im
mun
izat
ion
cove
rage
CH.2
0.84
30.
045
0.05
41.
390
1.17
911
890
0.75
20.
934
Imm
uniz
atio
n co
vera
ge fo
r DPT
CH.2
0.88
20.
039
0.04
51.
294
1.13
711
588
0.80
40.
961
Mea
sles
imm
uniz
atio
n co
vera
geCH
.20.
979
0.01
40.
015
0.85
80.
926
115
880.
950
1.00
0Fu
lly im
mun
ized
chi
ldre
nCH
.20.
820
0.04
70.
058
1.33
01.
153
117
890.
726
0.91
5A
cute
resp
irato
ry in
fect
ion
in la
st tw
o w
eeks
CH.6
0.00
00.
000
0.00
0na
na54
541
20.
000
0.00
0D
iarr
hoea
in la
st tw
o w
eeks
CH.4
0.00
20.
002
0.98
80.
911
0.95
454
541
20.
000
0.00
7Su
ppor
t for
lear
ning
CD.1
0.60
40.
028
0.04
61.
313
1.14
654
541
20.
549
0.65
9Bi
rth
regi
stra
tion
CP.1
0.98
80.
004
0.00
40.
639
0.80
054
541
20.
979
0.99
7
(*)
– in
dica
tors
are
bas
ed o
n le
ss th
an 5
0 ca
ses
of u
nwei
ghte
d ob
serv
atio
nsna
– n
ot a
pplic
able

MONITORING THE SITUATION OF CHILDREN AND WOMEN170
Tab
le S
E.8
. Sam
plin
g er
rors
: Aty
rau
Ob
last
Stan
dard
err
ors,
coef
ficie
nts
of v
aria
tion
, des
ign
eff
ects
(de
ff),
squ
are
root
of d
esig
n e
ffec
ts (
deft
) an
d co
nfid
ence
inte
rval
s fo
r sel
ecte
d in
dica
tors
, Kaz
akh
stan
, 200
6
Tabl
eVa
lue
®St
anda
rd
erro
r (se
)
Coef
ficie
nt
of v
aria
-tio
n (s
e/r)
Des
ign
ef-
fect
(de
ff)
Squa
re ro
ot
of d
esig
n ef
fect
(de
ft)
Wei
ghte
d co
unt
Unw
eigh
ted
coun
t
Confi
denc
e lim
its
r – 2
se
r+ 2
se
HO
USE
HO
LDS
Iodi
zed
salt
cons
umpt
ion
NU
.50.
870
0.01
00.
012
0.75
00.
866
334
782
0.84
90.
891
Child
dis
cipl
ine
CP.4
0.55
40.
023
0.04
10.
916
0.95
718
444
40.
508
0.59
9H
OU
SEH
OLD
MEM
BERS
Use
of i
mpr
oved
drin
king
wat
er s
ourc
esEN
.10.
893
0.03
50.
039
9.80
13.
131
1511
782
0.82
30.
962
Use
of i
mpr
oved
san
itatio
n fa
cilit
ies
EN.5
1.00
00.
000
0.00
0na
na15
1178
21.
000
1.00
0N
et p
rimar
y sc
hool
atte
ndan
ce ra
teED
.30.
989
0.00
70.
007
0.92
20.
960
101
247
0.97
61.
000
Net
sec
onda
ry s
choo
l atte
ndan
ce ra
teED
.40.
959
0.01
30.
013
2.48
31.
576
245
610
0.93
40.
984
Prim
ary
com
plet
ion
rate
ED.6
0.90
40.
032
0.03
60.
809
0.89
928
690.
840
0.96
8Ch
ild la
bor
CP.2
0.00
20.
002
1.02
31.
344
1.15
927
468
10.
000
0.00
6W
OM
ENSk
illed
atte
ndan
t at d
eliv
ery
RH.5
1.00
00.
000
0.00
0na
na53
124
1.00
01.
000
Ant
enat
al c
are
RH.3
1.00
00.
000
0.00
0na
na53
124
1.00
01.
000
Cont
race
ptiv
e pr
eval
ence
RH.1
0.52
40.
028
0.05
41.
698
1.30
323
653
20.
467
0.58
0A
dult
liter
acy
ED.8
1.00
00.
000
0.00
0na
na17
539
61.
000
1.00
0M
arria
ge b
efor
e ag
e 18
CP.5
0.04
20.
005
0.12
90.
579
0.76
135
679
80.
031
0.05
3Co
mpr
ehen
sive
kno
wle
dge
abou
t H
IV p
reve
ntio
n am
ong
youn
g pe
ople
HA
.30.
190.
023
0.12
23.
555
1.88
645
810
260.
144
0.23
6
Atti
tude
tow
ards
peo
ple
with
HIV
/AID
SH
A.5
0.07
60.
023
0.30
07.
487
2.73
645
010
040.
030
0.12
2W
omen
who
hav
e be
en te
sted
for H
IVH
A.6
0.45
80.
029
0.06
43.
490
1.86
845
810
260.
399
0.51
6Kn
owle
dge
of m
othe
r- to
-chi
ld tr
ansm
issio
n of
HIV
HA
.40.
398
0.03
20.
081
4.45
42.
110
458
1026
0.33
40.
463
UN
DER
-5s
Und
erw
eigh
t pre
vale
nce
NU
.10.
022
0.00
90.
435
1.22
31.
106
134
292
0.00
30.
041
Tube
rcul
osis
imm
uniz
atio
n co
vera
geCH
.21.
000
0.00
00.
000
nana
2659
1.00
01.
000
Polio
imm
uniz
atio
n co
vera
geCH
.21.
000
0.00
00.
000
nana
2659
1.00
01.
000
Imm
uniz
atio
n co
vera
ge fo
r DPT
CH.2
1.00
00.
000
0.00
0na
na26
591.
000
1.00
0M
easl
es im
mun
izat
ion
cove
rage
CH.2
1.00
00.
000
0.00
0na
na26
591.
000
1.00
0Fu
lly im
mun
ized
chi
ldre
nCH
.21.
000
0.00
00.
000
nana
2659
1.00
01.
000
Acu
te re
spira
tory
infe
ctio
n in
last
two
wee
ksCH
.60.
014
0.00
60.
437
0.84
00.
917
143
314
0.00
20.
026
Dia
rrho
ea in
last
two
wee
ksCH
.40.
009
0.00
50.
604
1.02
81.
014
143
314
0.00
00.
020
Supp
ort f
or le
arni
ngCD
.10.
794
0.02
50.
032
1.24
21.
114
143
314
0.74
30.
845
Birt
h re
gist
ratio
nCP
.11.
000
0.00
00.
000
nana
143
314
1.00
01.
000
(*)
– in
dica
tors
are
bas
ed o
n le
ss th
an 5
0 ca
ses
of u
nwei
ghte
d ob
serv
atio
nsna
– n
ot a
pplic
able

KAZAKHSTAN MULTIPLE INDICATOR CLUSTER SURVEY (MICS), 2006 171
Tab
le S
E.9
. Sam
plin
g er
rors
: Wes
t Kaz
akh
stan
Ob
last
Stan
dard
err
ors,
coef
ficie
nts
of v
aria
tion
, des
ign
eff
ects
(de
ff),
squ
are
root
of d
esig
n e
ffec
ts (
deft
) an
d co
nfid
ence
inte
rval
s fo
r sel
ecte
d in
dica
tors
, Kaz
akh
stan
, 200
6
Tabl
eVa
lue
®St
anda
rd
erro
r (se
)
Coef
ficie
nt
of v
aria
-tio
n (s
e/r)
Des
ign
ef-
fect
(de
ff)
Squa
re ro
ot
of d
esig
n ef
fect
(de
ft)
Wei
ghte
d co
unt
Unw
eigh
ted
coun
t
Confi
denc
e lim
its
r – 2
se
r+ 2
se
HO
USE
HO
LDS
Iodi
zed
salt
cons
umpt
ion
NU
.50.
905
0.02
80.
031
7.57
52.
752
600
820
0.84
80.
961
Child
dis
cipl
ine
CP.4
0.57
00.
032
0.05
61.
649
1.28
427
639
50.
506
0.63
4H
OU
SEH
OLD
MEM
BERS
Use
of i
mpr
oved
drin
king
wat
er s
ourc
esEN
.10.
905
0.04
40.
049
18.4
044.
290
2264
820
0.81
70.
993
Use
of i
mpr
oved
san
itatio
n fa
cilit
ies
EN.5
0.99
80.
001
0.00
10.
210
0.45
822
6482
00.
996
0.99
9N
et p
rimar
y sc
hool
atte
ndan
ce ra
teED
.30.
994
0.00
60.
006
0.91
30.
955
113
163
0.98
31.
000
Net
sec
onda
ry s
choo
l atte
ndan
ce ra
teED
.40.
945
0.00
80.
008
0.54
70.
740
335
485
0.93
00.
961
Prim
ary
com
plet
ion
rate
ED.6
(0.9
56)
(*)
(*)
(*)
(*)
2840
(*)
(*)
Child
labo
rCP
.20.
024
0.00
90.
386
1.86
11.
364
344
501
0.00
60.
043
WO
MEN
Skill
ed a
ttend
ant a
t del
iver
yRH
.51.
000
0.00
00.
000
nana
5879
1.00
01.
000
Ant
enat
al c
are
RH.3
1.00
00.
000
0.00
0na
na58
791.
000
1.00
0Co
ntra
cept
ive
prev
alen
ceRH
.10.
623
0.02
40.
039
1.25
61.
121
388
509
0.57
50.
671
Adu
lt lit
erac
yED
.80.
993
0.00
50.
005
0.99
50.
998
239
307
0.98
41.
000
Mar
riage
bef
ore
age
18CP
.50.
054
0.00
80.
151
0.93
90.
969
565
731
0.03
80.
070
Com
preh
ensi
ve k
now
ledg
e ab
out
HIV
pre
vent
ion
amon
g yo
ung
peop
leH
A.3
0.32
40.
029
0.09
03.
529
1.87
869
990
50.
265
0.38
2
Atti
tude
tow
ards
peo
ple
with
HIV
/AID
SH
A.5
0.02
80.
006
0.21
81.
214
1.10
269
489
80.
016
0.04
0W
omen
who
hav
e be
en te
sted
for H
IVH
A.6
0.83
60.
015
0.01
81.
503
1.22
669
990
50.
806
0.86
6Kn
owle
dge
of m
othe
r- to
-chi
ld tr
ansm
issio
n of
HIV
HA
.40.
560
0.02
60.
046
2.44
41.
563
699
905
0.50
90.
612
UN
DER
-5s
Und
erw
eigh
t pre
vale
nce
NU
.10.
088
0.01
90.
217
0.90
20.
950
149
200
0.04
90.
126
Tube
rcul
osis
imm
uniz
atio
n co
vera
geCH
.2(0
.978
)(*
)(*
)(*
)(*
)31
42(*
)(*
)Po
lio im
mun
izat
ion
cove
rage
CH.2
(0.9
78)
(*)
(*)
(*)
(*)
3141
(*)
(*)
Imm
uniz
atio
n co
vera
ge fo
r DPT
CH.2
(0.9
78)
(*)
(*)
(*)
(*)
3141
(*)
(*)
Mea
sles
imm
uniz
atio
n co
vera
geCH
.2(0
.947
)(*
)(*
)(*
)(*
)31
42(*
)(*
)Fu
lly im
mun
ized
chi
ldre
nCH
.2(0
.946
)(*
)(*
)(*
)(*
)31
41(*
)(*
)A
cute
resp
irato
ry in
fect
ion
in la
st tw
o w
eeks
CH.6
0.04
70.
010
0.21
20.
448
0.66
915
220
30.
027
0.06
7D
iarr
hoea
in la
st tw
o w
eeks
CH.4
0.03
80.
012
0.32
30.
832
0.91
215
220
30.
013
0.06
3Su
ppor
t for
lear
ning
CD.1
0.87
30.
023
0.02
60.
927
0.96
315
220
30.
828
0.91
8Bi
rth
regi
stra
tion
CP.1
0.99
50.
005
0.00
50.
925
0.96
215
220
30.
986
1.00
0
(*)
– in
dica
tors
are
bas
ed o
n le
ss th
an 5
0 ca
ses
of u
nwei
ghte
d ob
serv
atio
nsna
– n
ot a
pplic
able

MONITORING THE SITUATION OF CHILDREN AND WOMEN172
Tab
le S
E.1
0. S
amp
ling
erro
rs: Z
ham
byl
Ob
last
Stan
dard
err
ors,
coef
ficie
nts
of v
aria
tion
, des
ign
eff
ects
(de
ff),
squ
are
root
of d
esig
n e
ffec
ts (
deft
) an
d co
nfid
ence
inte
rval
s fo
r sel
ecte
d in
dica
tors
, Kaz
akh
stan
, 200
6
Tabl
eVa
lue
®St
anda
rd
erro
r (se
)
Coef
ficie
nt
of v
aria
-tio
n (s
e/r)
Des
ign
ef-
fect
(de
ff)
Squa
re ro
ot
of d
esig
n ef
fect
(de
ft)
Wei
ghte
d co
unt
Unw
eigh
ted
coun
t
Confi
denc
e lim
its
r – 2
se
r+ 2
se
HO
USE
HO
LDS
Iodi
zed
salt
cons
umpt
ion
NU
.50.
912
0.01
50.
016
2.57
51.
605
821
961
0.88
30.
941
Child
dis
cipl
ine
CP.4
0.62
50.
025
0.04
01.
426
1.19
444
152
70.
575
0.67
6H
OU
SEH
OLD
MEM
BERS
Use
of i
mpr
oved
drin
king
wat
er s
ourc
esEN
.10.
996
0.00
30.
003
1.60
21.
266
3190
974
0.99
11.
000
Use
of i
mpr
oved
san
itatio
n fa
cilit
ies
EN.5
0.98
80.
004
0.00
51.
587
1.26
031
9097
40.
979
0.99
7N
et p
rimar
y sc
hool
atte
ndan
ce ra
teED
.30.
972
0.01
30.
014
1.68
11.
296
212
257
0.94
50.
999
Net
sec
onda
ry s
choo
l atte
ndan
ce ra
teED
.40.
955
0.00
90.
009
1.09
01.
044
478
577
0.93
70.
973
Prim
ary
com
plet
ion
rate
ED.6
0.89
50.
026
0.03
00.
563
0.75
063
770.
842
0.94
8Ch
ild la
bor
CP.2
0.01
00.
005
0.55
72.
254
1.50
160
373
40.
000
0.02
1W
OM
ENSk
illed
atte
ndan
t at d
eliv
ery
RH.5
1.00
00.
000
0.00
0na
na13
916
51.
000
1.00
0A
nten
atal
car
eRH
.31.
000
0.00
00.
000
nana
139
165
1.00
01.
000
Cont
race
ptiv
e pr
eval
ence
RH.1
0.42
80.
023
0.05
31.
255
1.12
051
059
20.
382
0.47
4A
dult
liter
acy
ED.8
0.99
70.
003
0.00
30.
824
0.90
727
631
60.
992
1.00
0M
arria
ge b
efor
e ag
e 18
CP.5
0.12
00.
012
0.10
21.
177
1.08
572
582
60.
096
0.14
5Co
mpr
ehen
sive
kno
wle
dge
abou
t H
IV p
reve
ntio
n am
ong
youn
g pe
ople
HA
.30.
115
0.01
70.
151
2.97
41.
724
877
998
0.08
00.
150
Atti
tude
tow
ards
peo
ple
with
HIV
/AID
SH
A.5
0.01
90.
006
0.31
11.
773
1.33
285
496
80.
007
0.03
0W
omen
who
hav
e be
en te
sted
for H
IVH
A.6
0.42
00.
021
0.05
01.
835
1.35
587
799
80.
377
0.46
2Kn
owle
dge
of m
othe
r- to
-chi
ld tr
ansm
issio
n of
HIV
HA
.40.
647
0.03
00.
046
3.87
01.
967
877
998
0.58
70.
706
UN
DER
-5s
Und
erw
eigh
t pre
vale
nce
NU
.10.
021
0.00
70.
333
0.88
60.
942
337
379
0.00
70.
035
Tube
rcul
osis
imm
uniz
atio
n co
vera
geCH
.21.
000
0.00
00.
000
nana
7889
1.00
01.
000
Polio
imm
uniz
atio
n co
vera
geCH
.21.
000
0.00
00.
000
nana
7889
1.00
01.
000
Imm
uniz
atio
n co
vera
ge fo
r DPT
CH.2
1.00
00.
000
0.00
0na
na78
891.
000
1.00
0M
easl
es im
mun
izat
ion
cove
rage
CH.2
1.00
00.
000
0.00
0na
na78
891.
000
1.00
0Fu
lly im
mun
ized
chi
ldre
nCH
.21.
000
0.00
00.
000
nana
7889
1.00
01.
000
Acu
te re
spira
tory
infe
ctio
n in
last
two
wee
ksCH
.60.
013
0.00
60.
475
1.18
91.
090
345
387
0.00
10.
026
Dia
rrho
ea in
last
two
wee
ksCH
.40.
025
0.00
80.
307
0.91
40.
956
345
387
0.00
90.
040
Supp
ort f
or le
arni
ngCD
.10.
697
0.03
10.
045
1.80
91.
345
345
387
0.63
40.
760
Birt
h re
gist
ratio
nCP
.10.
986
0.00
70.
007
1.46
01.
208
345
387
0.97
11.
000
na –
not
app
licab
le

KAZAKHSTAN MULTIPLE INDICATOR CLUSTER SURVEY (MICS), 2006 173
Tab
le S
E.1
1. S
amp
ling
erro
rs: K
arag
and
y O
bla
stSt
anda
rd e
rror
s, co
effic
ien
ts o
f var
iati
on, d
esig
n e
ffec
ts (
deff
), s
quar
e ro
ot o
f des
ign
eff
ects
(de
ft)
and
con
fiden
ce in
terv
als
for s
elec
ted
indi
cato
rs, K
azak
hst
an, 2
006
Tabl
eVa
lue
®St
anda
rd
erro
r (se
)
Coef
ficie
nt
of v
aria
-tio
n (s
e/r)
Des
ign
ef-
fect
(de
ff)
Squa
re ro
ot
of d
esig
n ef
fect
(de
ft)
Wei
ghte
d co
unt
Unw
eigh
ted
coun
t
Confi
denc
e lim
its
r – 2
se
r+ 2
se
HO
USE
HO
LDS
Iodi
zed
salt
cons
umpt
ion
NU
.50.
895
0.01
20.
013
1.62
81.
276
1614
1052
0.87
10.
919
Child
dis
cipl
ine
CP.4
0.68
80.
022
0.03
10.
874
0.93
561
440
40.
645
0.73
1H
OU
SEH
OLD
MEM
BERS
Use
of i
mpr
oved
drin
king
wat
er s
ourc
esEN
.10.
961
0.01
90.
020
10.6
163.
258
4958
1052
0.92
21.
000
Use
of i
mpr
oved
san
itatio
n fa
cilit
ies
EN.5
0.99
30.
002
0.00
20.
551
0.74
249
5810
520.
989
0.99
7N
et p
rimar
y sc
hool
atte
ndan
ce ra
teED
.30.
988
0.00
80.
008
1.04
01.
020
271
180
0.97
11.
000
Net
sec
onda
ry s
choo
l atte
ndan
ce ra
teED
.40.
959
0.01
10.
011
1.35
41.
163
657
440
0.93
80.
981
Prim
ary
com
plet
ion
rate
ED.6
(0.9
02)
(*)
(*)
(*)
(*)
6744
(*)
(*)
Child
labo
rCP
.20.
005
0.00
30.
698
1.06
41.
032
718
478
0.00
00.
011
WO
MEN
Skill
ed a
ttend
ant a
t del
iver
yRH
.51.
000
0.00
00.
000
nana
129
811.
000
1.00
0A
nten
atal
car
eRH
.31.
000
0.00
00.
000
nana
129
811.
000
1.00
0Co
ntra
cept
ive
prev
alen
ceRH
.10.
550
0.02
10.
038
0.90
90.
954
799
505
0.50
80.
593
Adu
lt lit
erac
yED
.81.
000
0.00
00.
000
nana
486
305
1.00
01.
000
Mar
riage
bef
ore
age
18CP
.50.
111
0.01
30.
118
1.31
21.
145
1207
757
0.08
50.
137
Com
preh
ensi
ve k
now
ledg
e ab
out
HIV
pre
vent
ion
amon
g yo
ung
peop
leH
A.3
0.25
00.
020
0.08
12.
009
1.41
714
7692
40.
210
0.29
1
Atti
tude
tow
ards
peo
ple
with
HIV
/AID
SH
A.5
0.01
70.
005
0.28
31.
314
1.14
614
7392
20.
008
0.02
7W
omen
who
hav
e be
en te
sted
for H
IVH
A.6
0.71
10.
020
0.02
81.
771
1.33
114
7692
40.
671
0.75
0Kn
owle
dge
of m
othe
r- to
-chi
ld tr
ansm
issio
n of
HIV
HA
.40.
535
0.02
50.
047
2.34
31.
531
1476
924
0.48
50.
586
WO
MEN
Und
erw
eigh
t pre
vale
nce
NU
.10.
032
0.01
60.
496
1.45
61.
207
296
179
0.00
00.
064
Tube
rcul
osis
imm
uniz
atio
n co
vera
geCH
.2(0
.977
)(*
)(*
)(*
)(*
)79
46(*
)(*
)Po
lio im
mun
izat
ion
cove
rage
CH.2
(0.9
77)
(*)
(*)
(*)
(*)
7946
(*)
(*)
Imm
uniz
atio
n co
vera
ge fo
r DPT
CH.2
(0.9
77)
(*)
(*)
(*)
(*)
7946
(*)
(*)
Mea
sles
imm
uniz
atio
n co
vera
geCH
.2(0
.977
)(*
)(*
)(*
)(*
)79
46(*
)(*
)Fu
lly im
mun
ized
chi
ldre
nCH
.2(0
.977
)(*
)(*
)(*
)(*
)79
46(*
)(*
)A
cute
resp
irato
ry in
fect
ion
in la
st tw
o w
eeks
CH.6
0.05
30.
019
0.35
31.
322
1.15
031
619
10.
016
0.09
0D
iarr
hoea
in la
st tw
o w
eeks
CH.4
0.04
00.
016
0.39
81.
245
1.11
631
619
10.
008
0.07
1Su
ppor
t for
lear
ning
CD.1
0.85
30.
024
0.02
80.
852
0.92
331
619
10.
805
0.90
0Bi
rth
regi
stra
tion
CP.1
0.98
90.
008
0.00
81.
121
1.05
931
619
10.
972
1.00
0
(*)
– in
dica
tors
are
bas
ed o
n le
ss th
an 5
0 ca
ses
of u
nwei
ghte
d ob
serv
atio
nsna
– n
ot a
pplic
able

MONITORING THE SITUATION OF CHILDREN AND WOMEN174
Tab
le S
E.1
2. S
amp
ling
erro
rs: K
ost
anai
Ob
last
Stan
dard
err
ors,
coef
ficie
nts
of v
aria
tion
, des
ign
eff
ects
(de
ff),
squ
are
root
of d
esig
n e
ffec
ts (
deft
) an
d co
nfid
ence
inte
rval
s fo
r sel
ecte
d in
dica
tors
, Kaz
akh
stan
, 200
6
Tabl
eVa
lue
®St
anda
rd
erro
r (se
)
Coef
ficie
nt
of v
aria
-tio
n (s
e/r)
Des
ign
ef-
fect
(de
ff)
Squa
re ro
ot
of d
esig
n ef
fect
(de
ft)
Wei
ghte
d co
unt
Unw
eigh
ted
coun
t
Confi
denc
e lim
its
r – 2
se
r+ 2
se
HO
USE
HO
LDS
Iodi
zed
salt
cons
umpt
ion
NU
.50.
983
0.00
60.
006
1.72
51.
313
1168
920
0.97
20.
994
Child
dis
cipl
ine
CP.4
0.44
90.
029
0.06
41.
241
1.11
445
237
10.
391
0.50
6H
OU
SEH
OLD
MEM
BERS
Use
of i
mpr
oved
drin
king
wat
er s
ourc
esEN
.10.
832
0.03
90.
047
10.1
573.
187
3617
921
0.75
30.
910
Use
of i
mpr
oved
san
itatio
n fa
cilit
ies
EN.5
1.00
00.
000
0.00
0na
na36
1792
11.
000
1.00
0N
et p
rimar
y sc
hool
atte
ndan
ce ra
teED
.30.
979
0.00
80.
008
0.44
70.
669
198
165
0.96
30.
994
Net
sec
onda
ry s
choo
l atte
ndan
ce ra
teED
.40.
957
0.01
30.
014
1.59
11.
261
466
387
0.93
10.
983
Prim
ary
com
plet
ion
rate
ED.6
0.88
00.
045
0.05
11.
000
1.00
066
540.
791
0.96
9Ch
ild la
bor
CP.2
0.04
80.
012
0.25
01.
359
1.16
651
443
00.
024
0.07
2W
OM
ENSk
illed
atte
ndan
t at d
eliv
ery
RH.5
1.00
00.
000
0.00
0na
na84
671.
000
1.00
0A
nten
atal
car
eRH
.31.
000
0.00
00.
000
nana
8467
1.00
01.
000
Cont
race
ptiv
e pr
eval
ence
RH.1
0.60
40.
032
0.05
21.
902
1.37
958
445
60.
541
0.66
8A
dult
liter
acy
ED.8
0.99
50.
005
0.00
51.
202
1.09
629
622
80.
984
1.00
0M
arria
ge b
efor
e ag
e 18
CP.5
0.10
10.
013
0.13
31.
304
1.14
285
165
30.
074
0.12
8Co
mpr
ehen
sive
kno
wle
dge
abou
t H
IV p
reve
ntio
n am
ong
youn
g pe
ople
HA
.30.
218
0.01
90.
087
1.65
81.
288
1016
782
0.18
00.
256
Atti
tude
tow
ards
peo
ple
with
HIV
/AID
SH
A.5
0.03
30.
010
0.30
42.
409
1.55
210
0277
10.
013
0.05
3W
omen
who
hav
e be
en te
sted
for H
IVH
A.6
0.69
40.
020
0.02
81.
419
1.19
110
1678
20.
655
0.73
4Kn
owle
dge
of m
othe
r- to
-chi
ld tr
ansm
issio
n of
HIV
HA
.40.
557
0.02
50.
045
1.99
11.
411
1016
782
0.50
60.
607
UN
DER
-5s
Und
erw
eigh
t pre
vale
nce
NU
.10.
039
0.01
30.
331
0.83
60.
914
254
191
0.01
30.
064
Tube
rcul
osis
imm
uniz
atio
n co
vera
geCH
.2(1
.000
)(*
)(*
)na
na54
42(*
)(*
)Po
lio im
mun
izat
ion
cove
rage
CH.2
(1.0
00)
(*)
(*)
nana
5442
(*)
(*)
Imm
uniz
atio
n co
vera
ge fo
r DPT
CH.2
(1.0
00)
(*)
(*)
nana
5442
(*)
(*)
Mea
sles
imm
uniz
atio
n co
vera
geCH
.2(1
.000
)(*
)(*
)na
na54
42(*
)(*
)Fu
lly im
mun
ized
chi
ldre
nCH
.2(1
.000
)(*
)(*
)na
na54
42(*
)(*
)A
cute
resp
irato
ry in
fect
ion
in la
st tw
o w
eeks
CH.6
0.02
20.
011
0.50
01.
137
1.06
626
720
10.
000
0.04
4D
iarr
hoea
in la
st tw
o w
eeks
CH.4
0.02
90.
013
0.45
31.
245
1.11
626
720
10.
003
0.05
6Su
ppor
t for
lear
ning
CD.1
0.87
90.
017
0.01
90.
538
0.73
426
720
10.
845
0.91
3Bi
rth
regi
stra
tion
CP.1
0.98
50.
008
0.00
80.
951
0.97
526
720
10.
969
1.00
0
(*)
– in
dica
tors
are
bas
ed o
n le
ss th
an 5
0 ca
ses
of u
nwei
ghte
d ob
serv
atio
nsna
– n
ot a
pplic
able

KAZAKHSTAN MULTIPLE INDICATOR CLUSTER SURVEY (MICS), 2006 175
Tab
le S
E.1
3. S
amp
ling
erro
rs: K
yzyl
ord
a O
bla
stSt
anda
rd e
rror
s, co
effic
ien
ts o
f var
iati
on, d
esig
n e
ffec
ts (
deff
), s
quar
e ro
ot o
f des
ign
eff
ects
(de
ft)
and
con
fiden
ce in
terv
als
for s
elec
ted
indi
cato
rs, K
azak
hst
an, 2
006
Tabl
eVa
lue
®St
anda
rd
erro
r (se
)
Coef
ficie
nt
of v
aria
-tio
n (s
e/r)
Des
ign
ef-
fect
(de
ff)
Squa
re ro
ot
of d
esig
n ef
fect
(de
ft)
Wei
ghte
d co
unt
Unw
eigh
ted
coun
t
Confi
denc
e lim
its
r – 2
se
r+ 2
se
HO
USE
HO
LDS
Iodi
zed
salt
cons
umpt
ion
NU
.50.
946
0.01
30.
013
2.52
01.
587
409
830
0.92
10.
971
Child
dis
cipl
ine
CP.4
0.58
70.
021
0.03
50.
960
0.98
026
554
70.
546
0.62
8H
OU
SEH
OLD
MEM
BERS
Use
of i
mpr
oved
drin
king
wat
er s
ourc
esEN
.10.
967
0.02
60.
027
17.6
434.
200
1921
830
0.91
51.
000
Use
of i
mpr
oved
san
itatio
n fa
cilit
ies
EN.5
1.00
00.
000
0.00
0na
na19
2183
01.
000
1.00
0N
et p
rimar
y sc
hool
atte
ndan
ce ra
teED
.30.
985
0.00
50.
005
0.54
90.
741
143
297
0.97
50.
996
Net
sec
onda
ry s
choo
l atte
ndan
ce ra
teED
.40.
956
0.00
80.
008
1.02
61.
013
333
695
0.94
00.
971
Prim
ary
com
plet
ion
rate
ED.6
0.95
20.
024
0.02
51.
066
1.03
340
840.
904
1.00
0Ch
ild la
bor
CP.2
0.07
20.
013
0.17
51.
997
1.41
340
384
20.
047
0.09
7W
OM
ENSk
illed
atte
ndan
t at d
eliv
ery
RH.5
1.00
00.
000
0.00
0na
na80
156
1.00
01.
000
Ant
enat
al c
are
RH.3
1.00
00.
000
0.00
0na
na80
156
1.00
01.
000
Cont
race
ptiv
e pr
eval
ence
RH.1
0.57
10.
022
0.03
91.
215
1.10
230
159
20.
527
0.61
6A
dult
liter
acy
ED.8
0.99
40.
004
0.00
40.
968
0.98
417
734
10.
986
1.00
0M
arria
ge b
efor
e ag
e 18
CP.5
0.06
90.
010
0.13
81.
174
1.08
342
983
20.
050
0.08
8Co
mpr
ehen
sive
kno
wle
dge
abou
t H
IV p
reve
ntio
n am
ong
youn
g pe
ople
HA
.30.
1285
0.01
30.
101
1.53
31.
238
528
1022
0.10
30.
154
Atti
tude
tow
ards
peo
ple
with
HIV
/AID
SH
A.5
0.03
00.
005
0.17
40.
896
0.94
749
795
70.
020
0.04
1W
omen
who
hav
e be
en te
sted
for H
IVH
A.6
0.53
30.
019
0.03
61.
500
1.22
552
810
220.
495
0.57
1Kn
owle
dge
of m
othe
r- to
-chi
ld tr
ansm
issio
n of
HIV
HA
.40.
607
0.02
50.
042
2.72
31.
650
528
1022
0.55
70.
658
UN
DER
-5s
Und
erw
eigh
t pre
vale
nce
NU
.10.
039
0.01
00.
257
0.94
60.
973
188
359
0.01
90.
058
Tube
rcul
osis
imm
uniz
atio
n co
vera
geCH
.21.
000
0.00
00.
000
nana
4482
1.00
01.
000
Polio
imm
uniz
atio
n co
vera
geCH
.21.
000
0.00
00.
000
nana
4482
1.00
01.
000
Imm
uniz
atio
n co
vera
ge fo
r DPT
CH.2
1.00
00.
000
0.00
0na
na44
821.
000
1.00
0M
easl
es im
mun
izat
ion
cove
rage
CH.2
1.00
00.
000
0.00
0na
na44
821.
000
1.00
0Fu
lly im
mun
ized
chi
ldre
nCH
.21.
000
0.00
00.
000
nana
4482
1.00
01.
000
Acu
te re
spira
tory
infe
ctio
n in
last
two
wee
ksCH
.60.
010
0.00
50.
502
1.01
91.
009
209
397
0.00
00.
020
Dia
rrho
ea in
last
two
wee
ksCH
.40.
005
0.00
30.
688
0.95
40.
977
209
397
0.00
00.
012
Supp
ort f
or le
arni
ngCD
.10.
717
0.02
40.
033
1.10
31.
050
209
397
0.66
90.
764
Birt
h re
gist
ratio
nCP
.10.
997
0.00
30.
003
1.18
61.
089
209
397
0.99
11.
000
na –
not
app
licab
le

MONITORING THE SITUATION OF CHILDREN AND WOMEN176
Tab
le S
E.1
4. S
amp
ling
erro
rs: M
angi
stau
Ob
last
Stan
dard
err
ors,
coef
ficie
nts
of v
aria
tion
, des
ign
eff
ects
(de
ff),
squ
are
root
of d
esig
n e
ffec
ts (
deft
) an
d co
nfid
ence
inte
rval
s fo
r sel
ecte
d in
dica
tors
, Kaz
akh
stan
, 200
6
Tabl
eVa
lue
®St
anda
rd
erro
r (se
)
Coef
ficie
nt
of v
aria
-tio
n (s
e/r)
Des
ign
ef-
fect
(de
ff)
Squa
re ro
ot
of d
esig
n ef
fect
(de
ft)
Wei
ghte
d co
unt
Unw
eigh
ted
coun
t
Confi
denc
e lim
its
r – 2
se
r+ 2
se
HO
USE
HO
LDS
Iodi
zed
salt
cons
umpt
ion
NU
.50.
995
0.00
20.
002
0.41
10.
641
273
758
0.99
10.
998
Child
dis
cipl
ine
CP.4
0.40
90.
027
0.06
61.
283
1.13
314
242
10.
355
0.46
4H
OU
SEH
OLD
MEM
BERS
Use
of i
mpr
oved
drin
king
wat
er s
ourc
esEN
.10.
998
0.00
20.
002
1.74
81.
322
1127
758
0.99
31.
000
Use
of i
mpr
oved
san
itatio
n fa
cilit
ies
EN.5
0.99
90.
001
0.00
10.
635
0.79
711
2775
80.
998
1.00
0N
et p
rimar
y sc
hool
atte
ndan
ce ra
teED
.30.
993
0.00
50.
005
1.01
41.
007
8425
90.
982
1.00
0N
et s
econ
dary
sch
ool a
ttend
ance
rate
ED.4
0.98
70.
005
0.00
51.
133
1.06
416
449
70.
977
0.99
8Pr
imar
y co
mpl
etio
n ra
teED
.60.
911
0.04
50.
050
1.62
11.
273
2165
0.82
01.
000
Child
labo
rCP
.20.
018
0.01
20.
639
4.83
12.
198
207
632
0.00
00.
042
WO
MEN
Skill
ed a
ttend
ant a
t del
iver
yRH
.51.
000
0.00
00.
000
nana
4513
31.
000
1.00
0A
nten
atal
car
eRH
.31.
000
0.00
00.
000
nana
4513
31.
000
1.00
0Co
ntra
cept
ive
prev
alen
ceRH
.10.
534
0.02
00.
037
0.83
50.
914
183
519
0.49
40.
574
Adu
lt lit
erac
yED
.81.
000
0.00
00.
000
nana
117
339
1.00
01.
000
Mar
riage
bef
ore
age
18CP
.50.
046
0.01
00.
213
1.67
81.
296
279
778
0.02
60.
065
Com
preh
ensi
ve k
now
ledg
e ab
out
HIV
pre
vent
ion
amon
g yo
ung
peop
leH
A.3
0.10
70.
029
0.27
08.
164
2.85
733
593
80.
049
0.16
5
Atti
tude
tow
ards
peo
ple
with
HIV
/AID
SH
A.5
0.01
50.
002
0.10
40.
153
0.39
133
293
10.
012
0.01
8W
omen
who
hav
e be
en te
sted
for H
IVH
A.6
0.52
80.
028
0.05
32.
961
1.72
133
593
80.
472
0.58
5Kn
owle
dge
of m
othe
r- to
-chi
ld tr
ansm
issio
n of
HIV
HA
.40.
612
0.04
50.
073
7.92
62.
815
335
938
0.52
30.
702
UN
DER
-5s
Und
erw
eigh
t pre
vale
nce
NU
.10.
027
0.01
30.
468
1.81
71.
348
102
298
0.00
20.
053
Tube
rcul
osis
imm
uniz
atio
n co
vera
geCH
.21.
000
0.00
00.
000
nana
2676
1.00
01.
000
Polio
imm
uniz
atio
n co
vera
geCH
.21.
000
0.00
00.
000
nana
2676
1.00
01.
000
Imm
uniz
atio
n co
vera
ge fo
r DPT
CH.2
1.00
00.
000
0.00
0na
na26
761.
000
1.00
0M
easl
es im
mun
izat
ion
cove
rage
CH.2
1.00
00.
000
0.00
0na
na26
761.
000
1.00
0Fu
lly im
mun
ized
chi
ldre
nCH
.21.
000
0.00
00.
000
nana
2676
1.00
01.
000
Acu
te re
spira
tory
infe
ctio
n in
last
two
wee
ksCH
.60.
019
0.00
90.
480
1.38
31.
176
109
319
0.00
10.
036
Dia
rrho
ea in
last
two
wee
ksCH
.40.
004
0.00
40.
946
1.23
01.
109
109
319
0.00
00.
012
Supp
ort f
or le
arni
ngCD
.10.
843
0.02
40.
028
1.34
01.
158
109
319
0.79
60.
890
Birt
h re
gist
ratio
nCP
.10.
994
0.00
50.
005
1.12
91.
063
109
319
0.98
41.
000
na –
not
app
licab
le
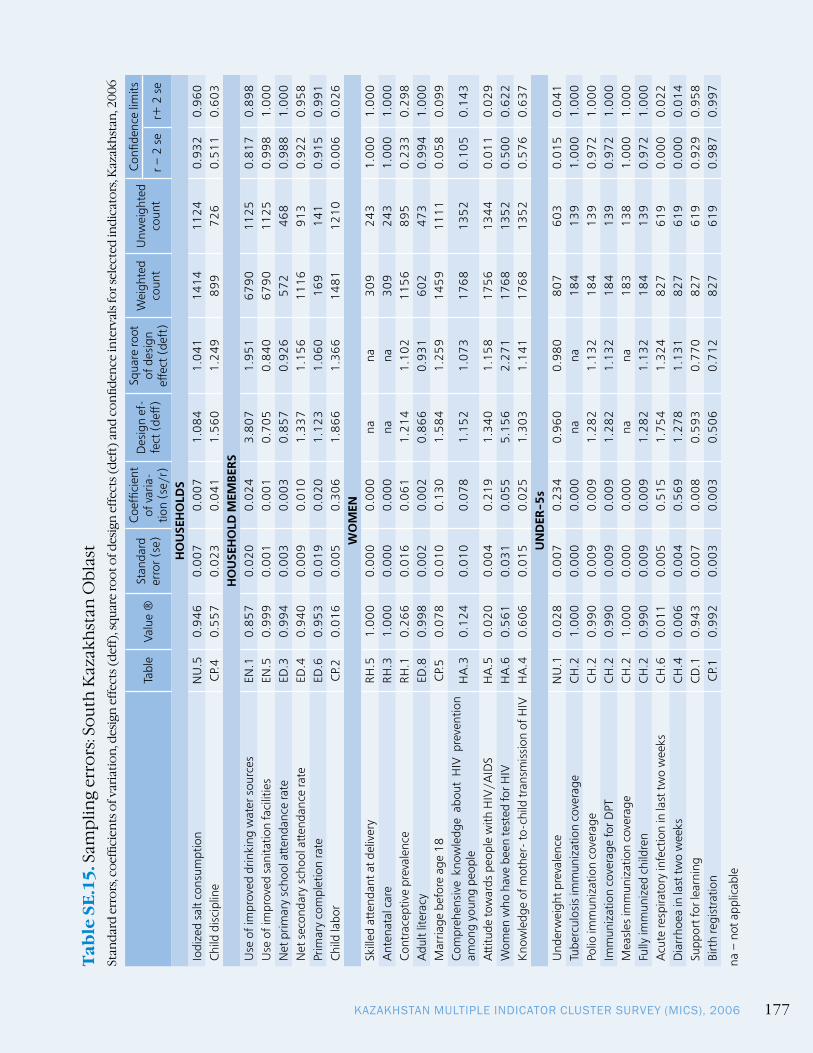
KAZAKHSTAN MULTIPLE INDICATOR CLUSTER SURVEY (MICS), 2006 177
Tab
le S
E.1
5. S
amp
ling
erro
rs: S
out
h K
azak
hst
an O
bla
stSt
anda
rd e
rror
s, co
effic
ien
ts o
f var
iati
on, d
esig
n e
ffec
ts (
deff
), s
quar
e ro
ot o
f des
ign
eff
ects
(de
ft)
and
con
fiden
ce in
terv
als
for s
elec
ted
indi
cato
rs, K
azak
hst
an, 2
006
Tabl
eVa
lue
®St
anda
rd
erro
r (se
)
Coef
ficie
nt
of v
aria
-tio
n (s
e/r)
Des
ign
ef-
fect
(de
ff)
Squa
re ro
ot
of d
esig
n ef
fect
(de
ft)
Wei
ghte
d co
unt
Unw
eigh
ted
coun
t
Confi
denc
e lim
its
r – 2
se
r+ 2
se
HO
USE
HO
LDS
Iodi
zed
salt
cons
umpt
ion
NU
.50.
946
0.00
70.
007
1.08
41.
041
1414
1124
0.93
20.
960
Child
dis
cipl
ine
CP.4
0.55
70.
023
0.04
11.
560
1.24
989
972
60.
511
0.60
3H
OU
SEH
OLD
MEM
BERS
Use
of i
mpr
oved
drin
king
wat
er s
ourc
esEN
.10.
857
0.02
00.
024
3.80
71.
951
6790
1125
0.81
70.
898
Use
of i
mpr
oved
san
itatio
n fa
cilit
ies
EN.5
0.99
90.
001
0.00
10.
705
0.84
067
9011
250.
998
1.00
0N
et p
rimar
y sc
hool
atte
ndan
ce ra
teED
.30.
994
0.00
30.
003
0.85
70.
926
572
468
0.98
81.
000
Net
sec
onda
ry s
choo
l atte
ndan
ce ra
teED
.40.
940
0.00
90.
010
1.33
71.
156
1116
913
0.92
20.
958
Prim
ary
com
plet
ion
rate
ED.6
0.95
30.
019
0.02
01.
123
1.06
016
914
10.
915
0.99
1Ch
ild la
bor
CP.2
0.01
60.
005
0.30
61.
866
1.36
614
8112
100.
006
0.02
6W
OM
ENSk
illed
atte
ndan
t at d
eliv
ery
RH.5
1.00
00.
000
0.00
0na
na30
924
31.
000
1.00
0A
nten
atal
car
eRH
.31.
000
0.00
00.
000
nana
309
243
1.00
01.
000
Cont
race
ptiv
e pr
eval
ence
RH.1
0.26
60.
016
0.06
11.
214
1.10
211
5689
50.
233
0.29
8A
dult
liter
acy
ED.8
0.99
80.
002
0.00
20.
866
0.93
160
247
30.
994
1.00
0M
arria
ge b
efor
e ag
e 18
CP.5
0.07
80.
010
0.13
01.
584
1.25
914
5911
110.
058
0.09
9Co
mpr
ehen
sive
kno
wle
dge
abou
t H
IV p
reve
ntio
n am
ong
youn
g pe
ople
HA
.30.
124
0.01
00.
078
1.15
21.
073
1768
1352
0.10
50.
143
Atti
tude
tow
ards
peo
ple
with
HIV
/AID
SH
A.5
0.02
00.
004
0.21
91.
340
1.15
817
5613
440.
011
0.02
9W
omen
who
hav
e be
en te
sted
for H
IVH
A.6
0.56
10.
031
0.05
55.
156
2.27
117
6813
520.
500
0.62
2Kn
owle
dge
of m
othe
r- to
-chi
ld tr
ansm
issio
n of
HIV
HA
.40.
606
0.01
50.
025
1.30
31.
141
1768
1352
0.57
60.
637
UN
DER
-5s
Und
erw
eigh
t pre
vale
nce
NU
.10.
028
0.00
70.
234
0.96
00.
980
807
603
0.01
50.
041
Tube
rcul
osis
imm
uniz
atio
n co
vera
geCH
.21.
000
0.00
00.
000
nana
184
139
1.00
01.
000
Polio
imm
uniz
atio
n co
vera
geCH
.20.
990
0.00
90.
009
1.28
21.
132
184
139
0.97
21.
000
Imm
uniz
atio
n co
vera
ge fo
r DPT
CH.2
0.99
00.
009
0.00
91.
282
1.13
218
413
90.
972
1.00
0M
easl
es im
mun
izat
ion
cove
rage
CH.2
1.00
00.
000
0.00
0na
na18
313
81.
000
1.00
0Fu
lly im
mun
ized
chi
ldre
nCH
.20.
990
0.00
90.
009
1.28
21.
132
184
139
0.97
21.
000
Acu
te re
spira
tory
infe
ctio
n in
last
two
wee
ksCH
.60.
011
0.00
50.
515
1.75
41.
324
827
619
0.00
00.
022
Dia
rrho
ea in
last
two
wee
ksCH
.40.
006
0.00
40.
569
1.27
81.
131
827
619
0.00
00.
014
Supp
ort f
or le
arni
ngCD
.10.
943
0.00
70.
008
0.59
30.
770
827
619
0.92
90.
958
Birt
h re
gist
ratio
nCP
.10.
992
0.00
30.
003
0.50
60.
712
827
619
0.98
70.
997
na –
not
app
licab
le

MONITORING THE SITUATION OF CHILDREN AND WOMEN178
Tab
le S
E.1
6. S
amp
ling
erro
rs: P
avlo
dar
Ob
last
Stan
dard
err
ors,
coef
ficie
nts
of v
aria
tion
, des
ign
eff
ects
(de
ff),
squ
are
root
of d
esig
n e
ffec
ts (
deft
) an
d co
nfid
ence
inte
rval
s fo
r sel
ecte
d in
dica
tors
, Kaz
akh
stan
, 200
6
Tabl
eVa
lue
®St
anda
rd
erro
r (se
)
Coef
ficie
nt
of v
aria
-tio
n (s
e/r)
Des
ign
ef-
fect
(de
ff)
Squa
re ro
ot
of d
esig
n ef
fect
(de
ft)
Wei
ghte
d co
unt
Unw
eigh
ted
coun
t
Confi
denc
e lim
its
r – 2
se
r+ 2
se
HO
USE
HO
LDS
Iodi
zed
salt
cons
umpt
ion
NU
.50.
683
0.02
00.
029
1.55
41.
247
909
871
0.64
30.
722
Child
dis
cipl
ine
CP.4
0.71
50.
023
0.03
20.
815
0.90
333
232
80.
670
0.76
0H
OU
SEH
OLD
MEM
BERS
Use
of i
mpr
oved
drin
king
wat
er s
ourc
esEN
.10.
963
0.01
20.
012
3.33
01.
825
2754
873
0.94
00.
986
Use
of i
mpr
oved
san
itatio
n fa
cilit
ies
EN.5
1.00
00.
000
0.00
0na
na27
5487
31.
000
1.00
0N
et p
rimar
y sc
hool
atte
ndan
ce ra
teED
.30.
966
0.01
20.
012
0.62
00.
787
140
140
0.94
20.
990
Net
sec
onda
ry s
choo
l atte
ndan
ce ra
teED
.40.
946
0.01
20.
013
1.01
81.
009
364
366
0.92
30.
970
Prim
ary
com
plet
ion
rate
ED.6
(0.8
15)
(*)
(*)
(*)
(*)
3436
(*)
(*)
Child
labo
rCP
.20.
059
0.01
20.
211
1.06
31.
031
382
384
0.03
40.
083
WO
MEN
Skill
ed a
ttend
ant a
t del
iver
yRH
.51.
000
0.00
00.
000
nana
8475
1.00
01.
000
Ant
enat
al c
are
RH.3
1.00
00.
000
0.00
0na
na84
751.
000
1.00
0Co
ntra
cept
ive
prev
alen
ceRH
.10.
610
0.02
30.
038
0.97
40.
987
463
433
0.56
40.
656
Adu
lt lit
erac
yED
.80.
995
0.00
50.
005
1.15
91.
077
255
234
0.98
51.
000
Mar
riage
bef
ore
age
18CP
.50.
090
0.01
00.
108
0.72
30.
850
686
630
0.07
10.
110
Com
preh
ensi
ve k
now
ledg
e ab
out
HIV
pre
vent
ion
amon
g yo
ung
peop
leH
A.3
0.34
80.
015
0.04
20.
727
0.85
282
075
60.
319
0.37
8
Atti
tude
tow
ards
peo
ple
with
HIV
/AID
SH
A.5
0.05
20.
007
0.13
80.
775
0.88
081
374
90.
037
0.06
6W
omen
who
hav
e be
en te
sted
for H
IVH
A.6
0.90
30.
010
0.01
20.
943
0.97
182
075
60.
882
0.92
4Kn
owle
dge
of m
othe
r- to
-chi
ld tr
ansm
issio
n of
HIV
HA
.40.
650
0.01
80.
027
1.02
71.
014
820
756
0.61
50.
685
UN
DER
-5s
Und
erw
eigh
t pre
vale
nce
NU
.10.
021
0.01
10.
496
0.88
90.
943
190
168
0.00
00.
042
Tube
rcul
osis
imm
uniz
atio
n co
vera
geCH
.2(1
.000
)(*
)(*
)na
na47
41(*
)(*
)Po
lio im
mun
izat
ion
cove
rage
CH.2
(1.0
00)
(*)
(*)
nana
4741
(*)
(*)
Imm
uniz
atio
n co
vera
ge fo
r DPT
CH.2
(1.0
00)
(*)
(*)
nana
4741
(*)
(*)
Mea
sles
imm
uniz
atio
n co
vera
geCH
.2(1
.000
)(*
)(*
)na
na47
41(*
)(*
)Fu
lly im
mun
ized
chi
ldre
nCH
.2(1
.000
)(*
)(*
)na
na47
41(*
)(*
)A
cute
resp
irato
ry in
fect
ion
in la
st tw
o w
eeks
CH.6
0.02
70.
012
0.44
60.
953
0.97
619
717
30.
003
0.05
1D
iarr
hoea
in la
st tw
o w
eeks
CH.4
0.03
60.
016
0.44
11.
239
1.11
319
717
30.
004
0.06
7Su
ppor
t for
lear
ning
CD.1
0.86
10.
025
0.03
00.
932
0.96
619
717
30.
810
0.91
2Bi
rth
regi
stra
tion
CP.1
0.99
30.
007
0.00
71.
207
1.09
919
717
30.
980
1.00
0
(*)
– in
dica
tors
are
bas
ed o
n le
ss th
an 5
0 ca
ses
of u
nwei
ghte
d ob
serv
atio
nsna
– n
ot a
pplic
able

KAZAKHSTAN MULTIPLE INDICATOR CLUSTER SURVEY (MICS), 2006 179
Tab
le S
E.1
7. S
amp
ling
erro
rs: N
ort
h K
azak
hst
an O
bla
stSt
anda
rd e
rror
s, co
effic
ien
ts o
f var
iati
on, d
esig
n e
ffec
ts (
deff
), s
quar
e ro
ot o
f des
ign
eff
ects
(de
ft)
and
con
fiden
ce in
terv
als
for s
elec
ted
indi
cato
rs, K
azak
hst
an, 2
006
Tabl
eVa
lue
®St
anda
rd
erro
r (se
)
Coef
ficie
nt
of v
aria
-tio
n (s
e/r)
Des
ign
ef-
fect
(de
ff)
Squa
re ro
ot
of d
esig
n ef
fect
(de
ft)
Wei
ghte
d co
unt
Unw
eigh
ted
coun
t
Confi
denc
e lim
its
r – 2
se
r+ 2
se
HO
USE
HO
LDS
Iodi
zed
salt
cons
umpt
ion
NU
.50,
967
0,00
50,
006
0,75
60,
870
805
847
0,95
60,
977
Child
dis
cipl
ine
CP.4
0,65
90,
035
0,05
31,
714
1,30
929
832
10,
590
0,72
9H
OU
SEH
OLD
MEM
BERS
Use
of i
mpr
oved
drin
king
wat
er s
ourc
esEN
.10,
817
0,04
60,
056
11,9
103,
451
2439
847
0,72
50,
909
Use
of i
mpr
oved
san
itatio
n fa
cilit
ies
EN.5
0,99
20,
004
0,00
42,
026
1,42
324
3984
70,
983
1,00
0N
et p
rimar
y sc
hool
atte
ndan
ce ra
teED
.30,
976
0,01
50,
015
1,15
21,
073
117
130
0,94
61,
000
Net
sec
onda
ry s
choo
l atte
ndan
ce ra
teED
.40,
950
0,01
40,
015
1,49
51,
223
315
343
0,92
20,
979
Prim
ary
com
plet
ion
rate
ED.6
(*)
(*)
(*)
(*)
(*)
2223
(*)
(*)
Child
labo
rCP
.20,
042
0,00
80,
183
0,55
50,
745
345
376
0,02
70,
058
WO
MEN
Skill
ed a
ttend
ant a
t del
iver
yRH
.50,
964
0,02
20,
023
0,85
70,
926
6160
0,91
91,
000
Ant
enat
al c
are
RH.3
1.00
00.
000
0.00
0na
na61
601,
000
1,00
0Co
ntra
cept
ive
prev
alen
ceRH
.10,
555
0,02
70,
049
1,26
11,
123
418
427
0,50
10,
609
Adu
lt lit
erac
yED
.81.
000
0.00
00.
000
nana
175
177
1,00
01,
000
Mar
riage
bef
ore
age
18CP
.50,
113
0,01
60,
143
1,50
01,
225
573
576
0,08
10,
146
Com
preh
ensi
ve k
now
ledg
e ab
out
HIV
pre
vent
ion
amon
g yo
ung
peop
leH
A.3
0,28
10,
026
0,09
42,
362
1,53
767
468
10,
228
0,33
4
Atti
tude
tow
ards
peo
ple
with
HIV
/AID
SH
A.5
0,05
30,
012
0,21
81,
802
1,34
267
267
80,
030
0,07
6W
omen
who
hav
e be
en te
sted
for H
IVH
A.6
0,75
30,
015
0,01
90,
788
0,88
767
468
10,
724
0,78
3Kn
owle
dge
of m
othe
r- to
-chi
ld tr
ansm
issio
n of
HIV
HA
.40,
414
0,01
50,
036
0,61
60,
785
674
681
0,38
40,
443
UN
DER
-5s
Und
erw
eigh
t pre
vale
nce
NU
.10.
028
0.01
40.
514
1.16
11.
077
158
156
0.00
00.
056
Tube
rcul
osis
imm
uniz
atio
n co
vera
geCH
.2(1
.000
)(*
)(*
)na
na28
28(*
)(*
)Po
lio im
mun
izat
ion
cove
rage
CH.2
(1.0
00)
(*)
(*)
nana
2828
(*)
(*)
Imm
uniz
atio
n co
vera
ge fo
r DPT
CH.2
(1.0
00)
(*)
(*)
nana
2828
(*)
(*)
Mea
sles
imm
uniz
atio
n co
vera
geCH
.2(1
.000
)(*
)(*
)na
na28
28(*
)(*
)Fu
lly im
mun
ized
chi
ldre
nCH
.2(1
.000
)(*
)(*
)na
na28
28(*
)(*
)A
cute
resp
irato
ry in
fect
ion
in la
st tw
o w
eeks
CH.6
0.02
80.
014
0.51
71.
229
1.10
816
316
10.
000
0.05
7D
iarr
hoea
in la
st tw
o w
eeks
CH.4
0.06
30.
017
0.26
40.
753
0.86
816
316
10.
030
0.09
7Su
ppor
t for
lear
ning
CD.1
0.77
90.
030
0.03
80.
832
0.91
216
316
10.
719
0.83
9Bi
rth
regi
stra
tion
CP.1
0.99
10.
009
0.00
91.
380
1.17
516
316
10.
974
1.00
0
(*)
– in
dica
tors
are
bas
ed o
n le
ss th
an 5
0 ca
ses
of u
nwei
ghte
d ob
serv
atio
nsna
– n
ot a
pplic
able

MONITORING THE SITUATION OF CHILDREN AND WOMEN180
Tab
le S
E.1
8. S
amp
ling
erro
rs: E
ast K
azak
hst
an O
bla
stSt
anda
rd e
rror
s, co
effic
ien
ts o
f var
iati
on, d
esig
n e
ffec
ts (
deff
), s
quar
e ro
ot o
f des
ign
eff
ects
(de
ft)
and
con
fiden
ce in
terv
als
for s
elec
ted
indi
cato
rs, K
azak
hst
an, 2
006
Tabl
eVa
lue
®St
anda
rd
erro
r (se
)
Coef
ficie
nt
of v
aria
-tio
n (s
e/r)
Des
ign
ef-
fect
(de
ff)
Squa
re ro
ot
of d
esig
n ef
fect
(de
ft)
Wei
ghte
d co
unt
Unw
eigh
ted
coun
t
Confi
denc
e lim
its
r – 2
se
r+ 2
se
HO
USE
HO
LDS
Iodi
zed
salt
cons
umpt
ion
NU
.50.
928
0.01
60.
017
3.96
71.
992
1652
1082
0.89
60.
959
Child
dis
cipl
ine
CP.4
0.52
90.
031
0.05
91.
511
1.22
955
838
50.
467
0.59
2H
OU
SEH
OLD
MEM
BERS
Use
of i
mpr
oved
drin
king
wat
er s
ourc
esEN
.10.
964
0.01
20.
013
4.55
62.
135
5097
1082
0.94
00.
988
Use
of i
mpr
oved
san
itatio
n fa
cilit
ies
EN.5
1.00
00.
000
0.00
0na
na50
9710
821.
000
1.00
0N
et p
rimar
y sc
hool
atte
ndan
ce ra
teED
.30.
936
0.02
10.
022
1.09
81.
048
213
151
0.89
40.
978
Net
sec
onda
ry s
choo
l atte
ndan
ce ra
teED
.40.
979
0.00
80.
008
1.33
81.
157
647
450
0.96
30.
995
Prim
ary
com
plet
ion
rate
ED.6
(0.7
93)
(*)
(*)
(*)
(*)
6343
(*)
(*)
Child
labo
rCP
.20.
010
0.00
30.
342
0.48
70.
698
611
433
0.00
30.
016
WO
MEN
Skill
ed a
ttend
ant a
t del
iver
yRH
.51.
000
0.00
00.
000
nana
141
941.
000
1.00
0A
nten
atal
car
eRH
.30.
991
0.00
10.
001
0.00
40.
065
141
940.
990
0.99
3Co
ntra
cept
ive
prev
alen
ceRH
.10.
611
0.03
00.
048
1.92
11.
386
809
524
0.55
20.
670
Adu
lt lit
erac
yED
.80.
996
0.00
40.
004
1.24
61.
116
469
305
0.98
81.
000
Mar
riage
bef
ore
age
18CP
.50.
093
0.01
30.
136
1.47
01.
212
1216
777
0.06
70.
118
Com
preh
ensi
ve k
now
ledg
e ab
out
HIV
pre
vent
ion
amon
g yo
ung
peop
leH
A.3
0.23
40.
023
0.10
02.
854
1.68
914
6794
00.
187
0.28
0
Atti
tude
tow
ards
peo
ple
with
HIV
/AID
SH
A.5
0.02
40.
006
0.25
71.
507
1.22
714
5393
00.
012
0.03
6W
omen
who
hav
e be
en te
sted
for H
IVH
A.6
0.50
00.
024
0.04
72.
085
1.44
414
6794
00.
452
0.54
7Kn
owle
dge
of m
othe
r- to
-chi
ld tr
ansm
issio
n of
HIV
HA
.40.
495
0.03
20.
064
3.79
81.
949
1467
940
0.43
10.
558
UN
DER
-5s
Und
erw
eigh
t pre
vale
nce
NU
.10.
056
0.01
70.
306
0.98
00.
990
282
179
0.02
20.
090
Tube
rcul
osis
imm
uniz
atio
n co
vera
geCH
.21.
000
0.00
00.
000
nana
8756
1.00
01.
000
Polio
imm
uniz
atio
n co
vera
geCH
.20.
948
0.03
80.
040
1.58
11.
257
8756
0.87
31.
000
Imm
uniz
atio
n co
vera
ge fo
r DPT
CH.2
1.00
00.
000
0.00
0na
na87
561.
000
1.00
0M
easl
es im
mun
izat
ion
cove
rage
CH.2
1.00
00.
000
0.00
0na
na87
561.
000
1.00
0Fu
lly im
mun
ized
chi
ldre
nCH
.20.
948
0.03
80.
040
1.58
11.
257
8756
0.87
31.
000
Acu
te re
spira
tory
infe
ctio
n in
last
two
wee
ksCH
.60.
007
0.00
71.
009
1.30
01.
140
304
195
0.00
00.
020
Dia
rrho
ea in
last
two
wee
ksCH
.40.
026
0.01
10.
442
0.99
91.
000
304
195
0.00
30.
048
Supp
ort f
or le
arni
ngCD
.10.
763
0.03
10.
040
1.02
01.
010
304
195
0.70
10.
824
Birt
h re
gist
ratio
nCP
.11.
000
0.00
00.
000
nana
304
195
1.00
01.
000
(*)
– in
dica
tors
are
bas
ed o
n le
ss th
an 5
0 ca
ses
of u
nwei
ghte
d ob
serv
atio
nsna
– n
ot a
pplic
able

KAZAKHSTAN MULTIPLE INDICATOR CLUSTER SURVEY (MICS), 2006 181
Tab
le S
E.1
9. S
amp
ling
erro
rs: A
stan
a C
ity
Stan
dard
err
ors,
coef
ficie
nts
of v
aria
tion
, des
ign
eff
ects
(de
ff),
squ
are
root
of d
esig
n e
ffec
ts (
deft
) an
d co
nfid
ence
inte
rval
s fo
r sel
ecte
d in
dica
tors
, Kaz
akh
stan
, 200
6
Tabl
eVa
lue
®St
anda
rd
erro
r (se
)
Coef
ficie
nt
of v
aria
-tio
n (s
e/r)
Des
ign
ef-
fect
(de
ff)
Squa
re ro
ot
of d
esig
n ef
fect
(de
ft)
Wei
ghte
d co
unt
Unw
eigh
ted
coun
t
Confi
denc
e lim
its
r – 2
se
r+ 2
se
HO
USE
HO
LDS
Iodi
zed
salt
cons
umpt
ion
NU
.50.
943
0.00
80.
009
0.97
20.
986
334
754
0.92
60.
960
Child
dis
cipl
ine
CP.4
0.61
10.
035
0.05
81.
664
1.29
014
232
10.
540
0.68
1H
OU
SEH
OLD
MEM
BERS
Use
of i
mpr
oved
drin
king
wat
er s
ourc
esEN
.11.
000
0.00
00.
000
nana
1063
755
1.00
01.
000
Use
of i
mpr
oved
san
itatio
n fa
cilit
ies
EN.5
1.00
00.
000
0.00
0na
na10
6375
51.
000
1.00
0N
et p
rimar
y sc
hool
atte
ndan
ce ra
teED
.30.
934
0.02
30.
025
1.06
91.
034
5412
20.
888
0.98
1N
et s
econ
dary
sch
ool a
ttend
ance
rate
ED.4
0.97
50.
010
0.01
01.
190
1.09
112
428
10.
955
0.99
5Pr
imar
y co
mpl
etio
n ra
teED
.6(0
.882
)(*
)(*
)(*
)(*
)15
34(*
)(*
)Ch
ild la
bor
CP.2
0.04
60.
022
0.47
03.
700
1.92
315
434
90.
003
0.08
9W
OM
ENSk
illed
atte
ndan
t at d
eliv
ery
RH.5
0.98
80.
012
0.01
20.
990
0.99
540
840.
964
1.00
0A
nten
atal
car
eRH
.31.
000
0.00
00.
000
nana
4084
1.00
01.
000
Cont
race
ptiv
e pr
eval
ence
RH.1
0.61
70.
035
0.05
72.
200
1.48
320
442
60.
547
0.68
7A
dult
liter
acy
ED.8
0.99
60.
004
0.00
41.
037
1.01
910
922
80.
987
1.00
0M
arria
ge b
efor
e ag
e 18
CP.5
0.05
60.
014
0.24
52.
341
1.53
031
966
40.
028
0.08
3Co
mpr
ehen
sive
kno
wle
dge
abou
t H
IV p
reve
ntio
n am
ong
youn
g pe
ople
HA
.30.
458
0.03
90.
084
4.60
42.
146
368
766
0.38
10.
536
Atti
tude
tow
ards
peo
ple
with
HIV
/AID
SH
A.5
0.02
60.
008
0.31
11.
990
1.41
136
375
70.
010
0.04
3W
omen
who
hav
e be
en te
sted
for H
IVH
A.6
0.70
90.
037
0.05
25.
007
2.23
836
876
60.
635
0.78
2Kn
owle
dge
of m
othe
r- to
-chi
ld tr
ansm
issio
n of
HIV
HA
.40.
594
0.04
90.
083
7.63
02.
762
368
766
0.49
60.
692
UN
DER
-5s
Und
erw
eigh
t pre
vale
nce
NU
.10.
035
0.01
50.
435
1.16
91.
081
8417
20.
005
0.06
5Tu
berc
ulos
is im
mun
izat
ion
cove
rage
CH.2
(1.0
00)
(*)
(*)
nana
1939
(*)
(*)
Polio
imm
uniz
atio
n co
vera
geCH
.2(0
.795
)(*
)(*
)(*
)(*
)19
39(*
)(*
)Im
mun
izat
ion
cove
rage
for D
PTCH
.2(0
.923
)(*
)(*
)(*
)(*
)19
39(*
)(*
)M
easl
es im
mun
izat
ion
cove
rage
CH.2
(1.0
00)
(*)
(*)
nana
1939
(*)
(*)
Fully
imm
uniz
ed c
hild
ren
CH.2
(0.7
18)
(*)
(*)
(*)
(*)
1939
(*)
(*)
Acu
te re
spira
tory
infe
ctio
n in
last
two
wee
ksCH
.60.
000
0.00
00.
000
nana
9018
50.
000
0.00
0D
iarr
hoea
in la
st tw
o w
eeks
CH.4
0.01
60.
009
0.57
91.
018
1.00
990
185
0.00
00.
035
Supp
ort f
or le
arni
ngCD
.10.
881
0.02
40.
028
1.03
31.
016
9018
50.
833
0.93
0Bi
rth
regi
stra
tion
CP.1
1.00
00.
000
0.00
0na
na90
185
1.00
01.
000
(*)
– in
dica
tors
are
bas
ed o
n le
ss th
an 5
0 ca
ses
of u
nwei
ghte
d ob
serv
atio
nsna
– n
ot a
pplic
able

MONITORING THE SITUATION OF CHILDREN AND WOMEN182
Tab
le S
E.2
0. S
amp
le e
rro
rs: A
lmat
y C
ity
Stan
dard
err
ors,
coef
ficie
nts
of v
aria
tion
, des
ign
eff
ects
(de
ff),
squ
are
root
of d
esig
n e
ffec
ts (
deft
) an
d co
nfid
ence
inte
rval
s fo
r sel
ecte
d in
dica
tors
, Kaz
akh
stan
, 200
6
Tabl
eVa
lue
®St
anda
rd
erro
r (se
)
Coef
ficie
nt
of v
aria
-tio
n (s
e/r)
Des
ign
ef-
fect
(de
ff)
Squa
re ro
ot
of d
esig
n ef
fect
(de
ft)
Wei
ghte
d co
unt
Unw
eigh
ted
coun
t
Confi
denc
e lim
its
r – 2
se
r+ 2
se
HO
USE
HO
LDS
Iodi
zed
salt
cons
umpt
ion
NU
.50.
967
0.00
80.
008
1.68
61.
298
1257
897
0.95
10.
982
Child
dis
cipl
ine
CP.4
0.37
30.
038
0.10
21.
857
1.36
342
430
30.
297
0.44
9H
OU
SEH
OLD
MEM
BERS
Use
of i
mpr
oved
drin
king
wat
er s
ourc
esEN
.11.
000
0.00
00.
000
nana
3839
966
1.00
01.
000
Use
of i
mpr
oved
san
itatio
n fa
cilit
ies
EN.5
0.98
30.
016
0.01
614
.330
3.78
638
3996
60.
951
1.00
0N
et p
rimar
y sc
hool
atte
ndan
ce ra
teED
.30.
991
0.00
90.
009
1.03
21.
016
154
110
0.97
21.
000
Net
sec
onda
ry s
choo
l atte
ndan
ce ra
teED
.40.
962
0.01
20.
012
1.11
91.
058
410
293
0.93
90.
986
Prim
ary
com
plet
ion
rate
ED.6
(0.9
00)
(*)
(*)
(*)
(*)
4230
(*)
(*)
Child
labo
rCP
.20.
024
0.00
60.
268
0.58
60.
765
468
334
0.01
10.
037
WO
MEN
Skill
ed a
ttend
ant a
t del
iver
yRH
.51.
000
0.00
00.
000
nana
124
841.
000
1.00
0A
nten
atal
car
eRH
.31.
000
0.00
00.
000
nana
124
841.
000
1.00
0Co
ntra
cept
ive
prev
alen
ceRH
.10.
559
0.03
70.
066
2.06
81.
438
547
370
0.48
50.
634
Adu
lt lit
erac
yED
.81.
000
0.00
00.
000
nana
312
211
1.00
01.
000
Mar
riage
bef
ore
age
18CP
.50.
058
0.01
10.
186
1.40
11.
184
969
656
0.03
60.
080
Com
preh
ensi
ve k
now
ledg
e ab
out
HIV
pre
vent
ion
amon
g yo
ung
peop
leH
A.3
0.11
00.
019
0.17
52.
904
1.70
411
2676
20.
072
0.14
9
Atti
tude
tow
ards
peo
ple
with
HIV
/AID
SH
A.5
0.07
40.
021
0.28
95.
052
2.24
811
2476
10.
031
0.11
6W
omen
who
hav
e be
en te
sted
for H
IVH
A.6
0.73
00.
032
0.04
43.
896
1.97
411
2676
20.
666
0.79
3Kn
owle
dge
of m
othe
r- to
-chi
ld tr
ansm
issio
n of
HIV
HA
.40.
625
0.02
90.
047
2.74
81.
658
1126
762
0.56
60.
683
UN
DER
-5s
Und
erw
eigh
t pre
vale
nce
NU
.10.
021
0.01
40.
684
1.90
21.
379
291
189
0.00
00.
050
Tube
rcul
osis
imm
uniz
atio
n co
vera
geCH
.21.
000
0.00
00.
000
nana
8857
1.00
01.
000
Polio
imm
uniz
atio
n co
vera
geCH
.21.
000
0.00
00.
000
nana
8857
1.00
01.
000
Imm
uniz
atio
n co
vera
ge fo
r DPT
CH.2
1.00
00.
000
0.00
0na
na88
571.
000
1.00
0M
easl
es im
mun
izat
ion
cove
rage
CH.2
1.00
00.
000
0.00
0na
na88
571.
000
1.00
0Fu
lly im
mun
ized
chi
ldre
nCH
.21.
000
0.00
00.
000
nana
8857
1.00
01.
000
Acu
te re
spira
tory
infe
ctio
n in
last
two
wee
ksCH
.60.
005
0.00
51.
003
1.00
71.
003
324
211
0.00
00.
014
Dia
rrho
ea in
last
two
wee
ksCH
.40.
009
0.00
70.
712
1.01
81.
009
324
211
0.00
00.
023
Supp
ort f
or le
arni
ngCD
.10.
896
0.02
90.
033
1.92
41.
387
324
211
0.83
70.
954
Birt
h re
gist
ratio
nCP
.11.
000
0.00
00.
000
nana
324
211
1.00
01.
000
(*)
– in
dica
tors
are
bas
ed o
n le
ss th
an 5
0 ca
ses
of u
nwei
ghte
d ob
serv
atio
nsna
– n
ot a
pplic
able

KAZAKHSTAN MULTIPLE INDICATOR CLUSTER SURVEY (MICS), 2006 183
Appendix D
Data Quality TablesTable DQ.1. Age distribution of household membersSingle-year age distribution of household population by sex (weighted), Kazakhstan, 2006
ageMales Females
ageMales Females
Number Percent Number Percent Number Percent Number Percent0 427 1.7 377 1.4 42 377 1.5 419 1.61 470 1.9 411 1.6 43 395 1.6 408 1.52 460 1.9 398 1.5 44 378 1.5 424 1.63 408 1.7 375 1.4 45 426 1.7 465 1.84 360 1.5 337 1.3 46 320 1.3 402 1.55 338 1.4 318 1.2 47 295 1.2 410 1.56 344 1.4 320 1.2 48 340 1.4 374 1.47 361 1.5 340 1.3 49 330 1.3 317 1.28 372 1.5 351 1.3 50 331 1.3 471 1.89 448 1.8 357 1.3 51 247 1.0 299 1.1
10 452 1.8 395 1.5 52 272 1.1 348 1.311 412 1.7 469 1.8 53 271 1.1 347 1.312 518 2.1 502 1.9 54 228 0.9 340 1.313 515 2.1 489 1.8 55 251 1.0 322 1.214 520 2.1 500 1.9 56 235 1.0 280 1.115 543 2.2 486 1.8 57 207 0.8 260 1.016 573 2.3 519 2.0 58 201 0.8 267 1.017 569 2.3 504 1.9 59 179 0.7 198 0.718 521 2.1 425 1.6 60 117 0.5 161 0.619 459 1.9 426 1.6 61 51 0.2 96 0.420 431 1.7 417 1.6 62 97 0.4 138 0.521 456 1.8 399 1.5 63 139 0.6 169 0.622 414 1.7 395 1.5 64 144 0.6 204 0.823 390 1.6 458 1.7 65 162 0.7 303 1.124 413 1.7 353 1.3 66 140 0.6 195 0.725 432 1.7 395 1.5 67 149 0.6 263 1.026 398 1.6 365 1.4 68 162 0.7 198 0.827 408 1.7 354 1.3 69 160 0.6 214 0.828 392 1.6 365 1.4 70 138 0.6 218 0.829 351 1.4 330 1.2 71 86 0.3 96 0.430 382 1.5 436 1.6 72 57 0.2 116 0.431 330 1.3 340 1.3 73 69 0.3 134 0.532 328 1.3 368 1.4 74 60 0.2 94 0.433 336 1.4 337 1.3 75 88 0.4 134 0.534 309 1.2 333 1.3 76 90 0.4 89 0.335 367 1.5 403 1.5 77 56 0.2 94 0.436 332 1.3 388 1.5 78 60 0.2 112 0.437 316 1.3 366 1.4 79 41 0.2 98 0.438 338 1.4 404 1.5 80 + 180 0.7 432 1.639 307 1.2 395 1.5 DK/
Missing 0 0.0 1 0.040 355 1.4 373 1.441 340 1.4 354 1.3 Total 24 724 100.0 26 537 100.0

MONITORING THE SITUATION OF CHILDREN AND WOMEN184
Table DQ.2. Age distribution of eligible and interviewed women Household population of women age 10-54, interviewed women age 15-49, and percentage of eligi-ble women who were interviewed (weighted), by five-year age group, Kazakhstan, 2006
AgeHousehold population of women age 10-54 Interviewed women age 15-49 Percentage of eligible
women interviewedNumber Number Percent
10–14 2 353 na na na
15–19 2 360 2 336 17.0 99.0
20–24 2 022 1 996 14.5 98.7
25–29 1 809 1 791 13.0 99.0
30–34 1 814 1 797 13.1 99.1
35–39 1 956 1 944 14.1 99.4
40–44 1 978 1 962 14.2 99.2
45–49 1 968 1 944 14.1 98.8
50–54 1 805 na na na
15–49 13 907 13 770 100,0 99,0
na: not applicable Note. Weights for both household population of women and interviewed women are household weights. Age is based on the household schedule.
Table DQ.3. Age distribution of eligible and interviewed under-5sHousehold population of children age 0-4, children whose mothers/caretakers were interviewed, and percentage of under-5 children whose mothers/caretakers were interviewed (weighted), by five-year age group, Kazakhstan, 2006
AgeHousehold population
of children age 0-7 Interviewed children age 0-4 Percentage of eligible children interviewed
Number Number Percent
0 804 803 20.0 99.9
1 881 877 21.8 99.5
2 858 857 21.3 99.9
3 783 781 19.5 99.7
4 697 697 17.4 100.0
5 656 na na na
6 664 na na na
7 701 na na na
0–4 4 023 4 015 100,0 99,8
na: not applicable Note: Weights for both household population of children and interviewed children are household weights. Age is based on the household schedule.

KAZAKHSTAN MULTIPLE INDICATOR CLUSTER SURVEY (MICS), 2006 185
Table DQ.4. Age distribution of under 5 children Age distribution of under-5 children by 3-month groups (weighted), Kazakhstan, 2006
Age in monthsMales Females Total
Number Percent Number Percent Number Percent
0–2 77 3.3 73 3.5 150 3.4
3–5 129 5.6 103 4.9 232 5.3
6–8 115 4.9 105 5.0 220 5.0
9–11 131 5.6 111 5.3 242 5.5
12–14 120 5.2 116 5.6 236 5.3
15–17 138 5.9 112 5.4 250 5.7
18–20 117 5.0 119 5.7 236 5.3
21–23 135 5.8 111 5.3 246 5.6
24–26 133 5.7 125 6.0 258 5.8
27–29 130 5.6 119 5.7 249 5.6
30–32 122 5.3 84 4.0 206 4.7
33–35 119 5.1 115 5.5 234 5.3
36–38 111 4.8 97 4.7 208 4.7
39–41 108 4.6 115 5.5 223 5.1
42–44 117 5.0 113 5.4 230 5.2
45–47 113 4.9 85 4.1 198 4.5
48–50 93 4.0 86 4.1 179 4.1
51–53 90 3.9 91 4.4 181 4.1
54–56 107 4.6 107 5.1 214 4.8
57–59 122 5.2 101 4.8 223 5.0
Total 2 327 100.0 2 088 100.0 4 415 100.0

MONITORING THE SITUATION OF CHILDREN AND WOMEN186
Table DQ.5. Heaping on ages and periodsAge and period ratios at boundaries of eligibility by type of information collected (weighted), Kazakhstan, 2006
Age in household questionnaire
Age and period ratios * Eligibility boundary (lower-upper) Module or questionnaire
Males Females Total
1 1.04 1.04 1.04
2 1.03 1.01 1.02 Lower Child discipline and child disability
3 1.00 1.01 1.00
4 0.98 0.98 0.98 Upper Under-5 questionnaire
5 0.97 0.98 0.98 Lower Child labour and education
6 0.99 0.98 0.99
8 0.95 1.01 0.97
10 1.03 0.97 1.00
13 1.00 0.98 0.99
14 0.99 1.02 1.00 Upper Child labour and child discipline
15 1.00 0.97 0.98 Lower Women’s questionnaire
16 1.02 1.03 1.03
18 1.10 1.12 1.11
23 0.96 1.14 1.05
24 1.00 0.88 0.94 Upper Education
25 1.04 1.06 1.05
48 1.06 1.02 1.04
49 0.99 0.82 0.90 Upper Women’s questionnaire
50 1.10 1.30 1.21
Age in women’s questionnaire
23 na 1.14 na
25 na 1.06 na
Months since last birth in women’s questionnaire
6–11 na 1.06 na
12–17 na 1.02 na
18–23
24–29 na 1.04 na
30–35 na 0.94 na
na: not applicable Age or period ratios are calculated as x / ((xn-1 + xn + xn+1) / 3), where x – is age or period.
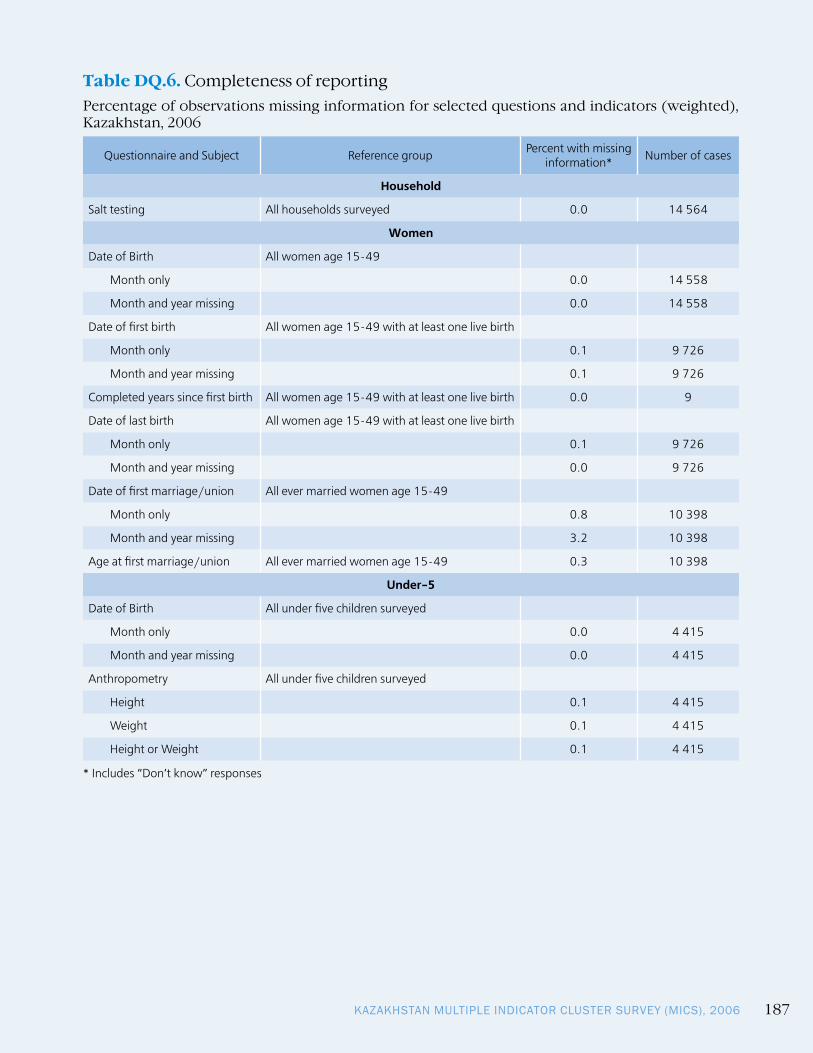
KAZAKHSTAN MULTIPLE INDICATOR CLUSTER SURVEY (MICS), 2006 187
Table DQ.6. Completeness of reportingPercentage of observations missing information for selected questions and indicators (weighted), Kazakhstan, 2006
Questionnaire and Subject Reference group Percent with missing information* Number of cases
Household
Salt testing All households surveyed 0.0 14 564
Women
Date of Birth All women age 15-49
Month only 0.0 14 558
Month and year missing 0.0 14 558
Date of first birth All women age 15-49 with at least one live birth
Month only 0.1 9 726
Month and year missing 0.1 9 726
Completed years since first birth All women age 15-49 with at least one live birth 0.0 9
Date of last birth All women age 15-49 with at least one live birth
Month only 0.1 9 726
Month and year missing 0.0 9 726
Date of first marriage/union All ever married women age 15-49
Month only 0.8 10 398
Month and year missing 3.2 10 398
Age at first marriage/union All ever married women age 15-49 0.3 10 398
Under-5
Date of Birth All under five children surveyed
Month only 0.0 4 415
Month and year missing 0.0 4 415
Anthropometry All under five children surveyed
Height 0.1 4 415
Weight 0.1 4 415
Height or Weight 0.1 4 415
* Includes “Don’t know” responses

MONITORING THE SITUATION OF CHILDREN AND WOMEN188
Table DQ.7. Presence of mother in the household and the person interviewed for the under-5 questionnaire Distribution of children under five by whether the mother lives in the same household, and the per-son interviewed for the under-5 questionnaire (weighted), Kazakhstan, 2006
Age
Mother in the household Mother not in the household
Total
Number of children aged 0-4
years
Mother inter-
viewed
Father in-terviewed
Other adult
female interview
ed
Other adult male
inter-viewed
Father in-terviewed
Other adult
female in-terviewed
Other adult male
inter-viewed
0 98.9 0.0 0.9 0.2 100.0 804
1 98.0 0.0 2.0 0.0 100.0 881
2 96.8 0.2 3.0 0.0 100.0 858
3 97.0 0.4 2.6 0.0 100.0 783
4 97.5 0.0 2.4 0.1 100.0 697
Total 97.6 0.1 2.2 0.1 100.0 4 023
Table DQ.8. School attendance by single ageDistribution of household population age 5-24 by educational level and grade attended in the cur-rent year (weighted), Kazakhstan, 2006
Age
Pres
choo
l Primary school Secondary school
Spec
ializ
ed
seco
ndar
y
Hig
her
Not
atte
nd-
ing
scho
ol
Tota
l
Num
ber
Grade Grade
0 1 2 3 4 5 6 7 8 9 10 11
5 18.7 2.4 1.3 0.0 0.0 0.0 0.0 0.0 0.0 0.0 0.0 0.0 0.0 0.0 0.0 77.6 100.0 656
6 27.5 5.5 35.3 0.7 0.0 0.0 0.0 0.0 0.0 0.0 0.0 0.0 0.0 0.0 0.0 31.0 100.0 664
7 2.9 0.4 64.6 28.3 0.3 0.0 0.0 0.0 0.0 0.0 0.0 0.0 0.0 0.0 0.0 3.5 100.0 700
8 0.2 0.2 5.8 70.2 22.4 0.4 0.0 0.0 0.0 0.0 0.0 0.0 0.0 0.0 0.0 0.8 100.0 724
9 0.0 0.0 0.2 11.3 65.4 22.3 0.5 0.0 0.0 0.0 0.0 0.0 0.0 0.0 0.0 0.3 100.0 805
10 0.0 0.0 0.1 0.0 10.6 64.7 23.7 0.2 0.0 0.0 0.0 0.0 0.0 0.0 0.0 0.7 100.0 847
11 0.0 0.0 0.0 0.0 0.1 12.2 69.1 17.9 0.3 0.0 0.0 0.0 0.0 0.0 0.0 0.4 100.0 881
12 0.0 0.0 0.0 0.1 0.0 0.1 13.6 71.2 14.6 0.0 0.0 0.0 0.0 0.0 0.0 0.4 100.0 1 020
13 0.0 0.0 0.0 0.0 0.0 0.0 0.0 14.6 68.8 15.4 0.5 0.0 0.0 0.0 0.0 0.7 100.0 1 004
14 0.0 0.0 0.0 0.0 0.0 0.0 0.0 1.2 13.2 66.8 17.0 1.0 0.0 0.0 0.0 0.8 100.0 1 019
15 0.0 0.0 0.0 0.0 0.0 0.0 0.0 0.0 0.3 12.9 64.3 17.7 0.7 2.7 0.0 1.4 100.0 1 029
16 0.0 0.0 0.0 0.0 0.0 0.0 0.0 0.0 0.0 0.0 12.8 48.5 18.0 17.1 0.4 3.2 100.0 1 093
17 0.0 0.0 0.0 0.0 0.0 0.0 0.0 0.0 0.0 0.0 0.0 7.9 51.0 20.5 6.2 14.4 100.0 1 073
18 0.0 0.0 0.0 0.0 0.0 0.0 0.0 0.0 0.0 0.0 0.0 1.1 8.3 24.2 28.7 37.7 100.0 946
19 0.0 0.0 0.0 0.0 0.0 0.0 0.0 0.0 0.0 0.0 0.0 0.0 0.4 16.0 31.6 52.0 100.0 885
20 0.0 0.0 0.0 0.0 0.0 0.0 0.0 0.0 0.0 0.0 0.0 0.0 0.0 7.1 30.7 62.2 100.0 848
21 0.0 0.0 0.0 0.0 0.0 0.0 0.0 0.0 0.0 0.0 0.0 0.0 0.1 2.4 21.8 75.7 100.0 855
22 0.0 0.0 0.0 0.0 0.0 0.0 0.0 0.0 0.0 0.0 0.0 0.0 0.0 1.2 11.7 87.1 100.0 809
23 0.0 0.0 0.0 0.0 0.0 0.0 0.0 0.0 0.0 0.0 0.0 0.0 0.0 1.4 7.0 91.6 100.0 847
24 0.0 0.0 0.0 0.0 0.0 0.0 0.0 0.0 0.0 0.0 0.0 0.0 0.0 0.6 5.0 94.4 100.0 766
Total 1.9 0.3 4.2 4.6 4.5 4.8 5.5 6.0 5.6 5.5 5.6 4.7 4.8 5.2 7.2 29.6 100.0 17 471

KAZAKHSTAN MULTIPLE INDICATOR CLUSTER SURVEY (MICS), 2006 189
Table DQ.9. Sex ratio at birth among children ever born and livingSex ratio at birth among children ever born, children living, and deceased children, by age of women (weighted), Kazakhstan, 2006
Age
Children Ever Born Children Living Children deceased
Number of
womenNumber of sons
ever born
Number of
daugh-ters ever
born
Sex ratioNumber of sons living
Number of
daugh-ters living
Sex ratio
Number of de-ceased
sons
Number of de-ceased daugh-
ters
Sex ratio
15–19 43 34 1.26 42 32 1.31 1 2 0.50 2 469
20–24 570 499 1.14 559 489 1.14 11 10 1.10 2 108
25–29 1 288 1 191 1.08 1 239 1 144 1.08 49 46 1.07 1 894
30–34 1 878 1 721 1.09 1 764 1 677 1.05 114 44 2.59 1 900
35–39 2 367 2 216 1.07 2 250 2 133 1.05 117 84 1.39 2 055
40–44 2 785 2 532 1.10 2 614 2 419 1.08 172 113 1.52 2 076
45–49 2 895 2 733 1.06 2 664 2 566 1.04 231 167 1.38 2 056
Total 11 826 10 926 1.08 11 132 10 460 1.06 695 466 1.49 14 558
Note: Sex ratios are calculated as number of males/ number of females.
Table DQ.10. Distribution of women by time since last birthDistribution of women aged 15-49 with at least one live birth, by months since last birth (weighted), Kazakhstan, 2006
AgeMonths since last birth
Age (continued)Months since last birth
Number Percent Number Percent
0 18 0.8 19 77 3.2
1 64 2.7 20 62 2.6
2 68 2.8 21 82 3.4
3 80 3.4 22 59 2.5
4 83 3.5 23 67 2.8
5 66 2.8 24 69 2.9
6 84 3.5 25 79 3.3
7 64 2.7 26 56 2.3
8 64 2.7 27 58 2.4
9 83 3.5 28 56 2.3
10 81 3.4 29 68 2.8
11 74 3.1 30 47 2.0
12 66 2.8 31 50 2.1
13 83 3.5 32 57 2.4
14 63 2.6 33 45 1.9
15 81 3.4 34 56 2.3
16 80 3.3 35 55 2.3
17 74 3.1
18 70 2.9 Total 2 389 100.0

MONITORING THE SITUATION OF CHILDREN AND WOMEN190
Appendix E
MICS indicators: Numerators and Denominators
INDICATOR NUMERATOR DENOMINATOR
1 Under-five mortality rate Probability of dying by exact age 5 years
2 Infant mortality rate Probability of dying by exact age 1 year
3 Maternal mortality ratio Number of deaths of women from pregnancy-related causes in a given year
Number of live births in the year (ex-pressed per 100,000 births)
4 Skilled attendant at delivery
Number of women aged 15-49 years with a birth in the 2 years preceding the survey that were attended during childbirth by skilled health personnel
Total number of women surveyed aged 15-49 years with a birth in the 2 years preceding the survey
5 Institutional deliveries Number of women aged 15-49 years with a birth in the 2 years preceding the survey that delivered in a health facility
Total number of women surveyed aged 15-49 years with a birth in 2 years preceding the survey
6 Underweight prevalence Number of children under age five that fall below mi-nus two standard deviations from the median weight for age of the NCHS/WHO standard (moderate and severe); number that fall below minus three standard deviations (severe)
Total number of children under age five that were weighed
7 Stunting prevalence Number of children under age five that fall below mi-nus two standard deviations from the median height for age of the NCHS/WHO standard (moderate and severe); number that fall below minus three standard deviations (severe)
Total number of children under age five measured
8 Wasting prevalence Number of children under age five that fall below mi-nus two standard deviations from the median weight for height of the NCHS/WHO standard (moderate and severe); number that fall below minus three standard deviations (severe)
Total number of children under age five weighed and measured
9 Low-birthweight infants Number of last live births in the 2 years preceding the survey weighing below 2,500 grams
Total number of last live births in the 2 years preceding the survey
10 Infants weighed at birth Number of last live births in the 2 years preceding the survey that were weighed at birth
Total number of last live births in the 2 years preceding the survey
11 Use of improved drink-ing water sources
Number of household members living in households using improved sources of drinking water
Total number of household members in households surveyed
12 Use of improved sanita-tion facilities
Number of household members using improved sani-tation facilities
Total number of household members in households surveyed
13 Water treatment Number of household members using water that has been treated
Total number of household members in households surveyed
14 Disposal of child’s faeces Number of children under age three whose (last) stools were disposed of safely
Total number of children under age three surveyed
15 Exclusive breastfeeding rate
Number of infants aged 0-5 months that are exclu-sively breastfed
Total number of infants aged 0-5 months surveyed
16 Continued breastfeed-ing rate
Number of infants aged 12-15 months, and 20-23 months, that are currently breastfeeding
Total number of children aged 12-15 months and 20-23 months surveyed

KAZAKHSTAN MULTIPLE INDICATOR CLUSTER SURVEY (MICS), 2006 191
17 Timely complementary feeding rate
Number of infants aged 6-9 months that are receiv-ing breastmilk and complementary foods
Total number of infants aged 6-9 months surveyed
18 Frequency of comple-mentary feeding
Number of infants aged 6-11 months that receive breastmilk and complementary food at least the mini-mum recommended number of times per day (two times per day for infants aged 6-8 months, three times per day for infants aged 9-11 months)
Total number of infants aged 6-11 months surveyed
19 Adequately fed infants Number of infants aged 0-11 months that are appro-priately fed: infants aged 0-5 months that are exclu-sively breastfed and infants aged 6-11 months that are breastfed and ate solid or semi-solid foods the ap-propriate number of times (see above) yesterday
Total number of infants aged 0-11 months surveyed
20 Antenatal care Number of women aged 15-49 years that were at-tended at least once during pregnancy in the 2 years preceding the survey by skilled health personnel
Total number of women surveyed aged 15-49 years with a birth in the 2 years preceding the survey
21 Contraceptive preva-lence
Number of women currently married or in union aged 15-49 years that are using (or whose partner is using) a contraceptive method (either modern or traditional)
Total number of women aged 15-49 years that are currently married or in union
22 Antibiotic treatment of suspected pneumonia
Number of children aged 0-59 months with sus-pected pneumonia in the previous 2 weeks receiving antibiotics
Total number of children aged 0-59 months with suspected pneumonia in the previous 2 weeks
23 Care-seeking for sus-pected pneumonia
Number of children aged 0-59 months with suspect-ed pneumonia in the previous 2 weeks that are taken to an appropriate health provider
Total number of children aged 0-59 months with suspected pneumonia in the previous 2 weeks
24 Solid fuels Number of residents in households that use solid fuels (wood, charcoal, crop residues and dung) as the pri-mary source of domestic energy to cook
Total number of residents in house-holds surveyed
25 Tuberculosis immuniza-tion coverage
Number of children aged 12-23 months receiving BCG vaccine before their first birthday
Total number of children aged 12-23 months surveyed
26 Polio immunization coverage
Number of children aged 12-23 months receiving OPV3 vaccine before their first birthday
Total number of children aged 12-23 months surveyed
27 Immunization coverage for diphtheria, pertussis and tetanus (DPT)
Number of children aged 12-23 months receiving DPT3 vaccine before their first birthday
Total number of children aged 12-23 months surveyed
28 Measles immunization coverage
Number of children aged 12-23 months receiving measles vaccine before their first birthday
Total number of children aged 12-23 months surveyed
29 Hepatitis B immuniza-tion coverage
Number of children aged 12-23 months immunized against hepatitis before their first birthday
Total number of children aged 12-23 months surveyed
31 Fully immunized children Number of children aged 12-23 months receiving DPT1-3, OPV-1-3, BCG and measles vaccines before their first birthday
Total number of children aged 12-23 months surveyed
33 Use of oral rehydration therapy (ORT)
Number of children aged 0-59 months with diarrhoea in the previous 2 weeks that received oral rehydration salts and/or an appropriate household solution
Total number of children aged 0-59 months with diarrhoea in the previ-ous 2 weeks
34 Home management of diarrhoea
Number of children aged 0-59 months with diar-rhoea in the previous 2 weeks that received more flu-ids AND continued eating somewhat less, the same or more food
Total number of children aged 0-59 months with diarrhoea in the previ-ous 2 weeks
35 Received ORT or increased fluids and con-tinued feeding
Number of children aged 0-59 months with diarrhoea that received ORT (oral rehydration salts or an appro-priate household solution) or received more fluids AND continued eating somewhat less, the same or more food
Total number of children aged 0-59 months with diarrhoea in the previ-ous 2 weeks

MONITORING THE SITUATION OF CHILDREN AND WOMEN192
41 Iodized salt consump-tion
Number of households with salt testing 15 parts per million or more of iodine/iodate
Total number of households surveyed
44 Content of antenatal care
Number of women with a live birth in the 2 years pre-ceding the survey that received antenatal care during the last pregnancy
Total number of women with a live birth in the 2 years preceding the sur-vey
45 Timely initiation of breastfeeding
Number of women with a live birth in the 2 years pre-ceding the survey that put the newborn infant to the breast within 1 hour of birth
Total number of women with a live birth in the 2 years preceding the sur-vey
46 Support for learning Number of children aged 0-59 months living in households in which an adult has engaged in four or more activities to promote learning and school readi-ness in the past 3 days
Total number of children aged 0-59 months surveyed
47 Father’s support for learning
Number of children aged 0-59 months whose father has engaged in one or more activities to promote learning and school readiness in the past 3 days
Total number of children aged 0-59 months
48 Support for learning: children’s books
Number of households with three or more children’s books
Total number of households surveyed
49 Support for learning: non-children’s books
Number of households with three or more non-chil-dren’s books
Total number of households surveyed
50 Support for learning: materials for play
Number of households with three or more materials intended for play
Total number of households surveyed
51 Non-adult care Number of children aged 0-59 months left alone or in the care of another child younger than 10 years of age in the past week
Total number of children aged 0-59 months surveyed
52 Pre-school attendance Number of children aged 36-59 months that attend some form of early childhood education programme
Total number of children aged 36-59 months surveyed
53 School readiness Number of children in first grade that attended some form of pre-school the previous year
Total number of children in the first grade surveyed
54 Net intake rate in pri-mary education
Number of children of school-entry age that are cur-rently attending first grade
Total number of children of primary- school entry age surveyed
55 Net primary school at-tendance rate
Number of children of primary-school age currently attending primary or secondary school
Total number of children of primary- school age surveyed
56 Net secondary school attendance rate
Number of children of secondary-school age current-ly attending secondary school or higher
Total number of children of second-ary-school age surveyed
57 Children reaching grade five
Proportion of children entering the first grade of pri-mary school that eventually reach grade five
58 Transition rate to sec-ondary school
Number of children that were in the last grade of pri-mary school during the previous school year that at-tend secondary school
Total number of children that were in the last grade of primary school dur-ing the previous school year surveyed
59 Primary completion rate Number of children (of any age) attending the last grade of primary school (excluding repeaters)
Total number of children of primary school completion age (age appropri-ate to final grade of primary school) surveyed
60 Adult literacy rate Number of women aged 15-24 years that are able to read a short simple statement about everyday life
Total number of women aged 15-24 years surveyed
61 Gender parity index Proportion of girls in primary and secondary educa-tion
Proportion of boys in primary and secondary education
62 Birth registration Number of children aged 0-59 months whose births are reported registered
Total number of children aged 0-59 months surveyed

KAZAKHSTAN MULTIPLE INDICATOR CLUSTER SURVEY (MICS), 2006 193
67 Marriage before age 15 and age 18
Number of women that were first married or in union by the exact age of 15 and the exact age of 18, by age groups
Total number of women aged 15-49 years and 20-49 years surveyed, by age groups
68 Young women aged 15-19 years currently married or in union
Number of women aged 15-19 years currently mar-ried or in union
Total number of women aged 15-19 years surveyed
69 Spousal age difference Number of women married/in union aged 20-24 years with a difference in age of 10 or more years be-tween them and their current spouse
Total number of women aged 20-24 years surveyed that are currently mar-ried or in union
71 Child labour Number of children aged 5-14 years that are involved in child labour
Total number of children aged 5-14 years surveyed
72 Labourer students Number of children aged 5-14 years involved in child labour activities that attend school
Total number of children aged 5-14 years involved in child labour activi-ties
73 Student labourers Number of children aged 5-14 years attending school that are involved in child labour activities
Total number of children aged 5-14 years attending school
74 Child discipline Number of children aged 2-14 years that (1) expe-rience only non-violent aggression, (2) experience psychological aggression as punishment, (3) experi-ence minor physical punishment, (4) experience se-vere physical punishment
Total number of children aged 2-14 years selected and surveyed
82 Comprehensive knowl-edge about HIV preven-tion among young people
Number of women aged 15-24 years that correctly identify two ways of avoiding HIV infection and reject three common misconceptions about HIV transmis-sion
Total number of women aged 15-24 years surveyed
86 Attitude towards people with HIV/AIDS
Number of women expressing acceptance on all four questions about people with HIV or AIDS
Total number of women surveyed
87 Women who know where to be tested for HIV
Number of women that state knowledge of a place to be tested for HIV
Total number of women surveyed
88 Women who have been tested for HIV
Number of women that report being tested for HIV Total number of women surveyed
89 Knowledge of mother-to-child transmission of HIV
Number of women that correctly identify all three means of vertical transmission
Total number of women surveyed
90 Counselling coverage for the prevention of mother-to-child trans-mission of HIV
Number of women that gave birth in the previous 24 months and received antenatal care reporting that they received counselling on HIV/AIDS during this care
Total number of women that gave birth in the previous 24 months sur-veyed
91 Testing coverage for the prevention of mother-to-child transmission of HIV
Number of women that gave birth in the previous 24 months and received antenatal care reporting that they received the results of an HIV test during this care
Total number of women that gave birth in the previous 24 months sur-veyed
100 Attitudes towards do-mestic violence
Number of women that consider that a husband/partner is justified in hitting or beating his wife in at least one of the following circumstances: (1) she goes out without telling him, (2) she neglects the children, (3) she argues with him, (4) she refuses sex with him, (5) she burns the food
Total number of women surveyed

MONITORING THE SITUATION OF CHILDREN AND WOMEN194
Appendix F. QuestionnairesHOUSEHOLD QUESTIONNAIRE
BEGIN WITH WELCOMING:
WE ARE FROM THE AGENCY OF THE REPUBLIC OF KAZAKHSTAN ON STATISTIC. WE WORK ON THE FAMILY HEALTH AND EDUCATION PROJECT. I WANT TO DISCUSS THIS WITH YOU. ALL RECEIVED INFORMATION IS STRICTLY CONFIDENTIAL; NO ONE WILL LEARN BELOW ANSWERS ARE YOURS. I WANT TO SPEAK WITH THE HOUSEHOLD HEAD AND EVERY MOTHER OR CHILD CARETAKER IN THE HOUSEHOLD. SHALL I START?
If Yes, begin the interview.
HOUSEHOLD INFORMATION HHHH1. Cluster number: HH2. Household number:___ ___ ___ ___ ___ HH3. Interviewer’s name and number: HH4. Supervisor’s name and number:Name _________________________________ Name _________________________________HH5. Interview day/month/year: ___ ___ / ___ ___ / ___ ___ ___ ___ HH6. LocationCities and villages 1Rural settlements 2
HH7. OblastAkmola 01Aktobe 02Almaty 03Atyrau 04West Kazakhstan 05Zambylskaya 06Karaganda 07Kostanai 08Kyzylorda 09Mangistau 10South Kazakhstan 11Pavlodar 12North Kazakhstan 13East Kazakhstan 14Astana City 15Almaty City 16
HH 8. Name of household head: ________________________________________________________After completing all household questionnaires enter the following:
HH9. HH interview outcomes:Interviewed 1Absent 2Refused 3HH not found/demolished 4Other (specify)___________________________ 6
HH10. HH questionnaire respondent:Name:
Line number: __ ___HH11. Number of household members: ___ ___
HH12. Number of eligible women: HH13. Number of completed women’s questionnaires: ___ ___ ___ ___
HH14. Number of under-5s: HH15. Number of completed under-5 questionnaires: ___ ___ ___ ___
Interviewer/supervisor’s note: Use this field for notes on household members interviews, such as: additional telephone calls, individual incomplete interview forms, number of visits for interview etc.
HH 16. Data entry operator: ___ __________________________________

KAZAKHSTAN MULTIPLE INDICATOR CLUSTER SURVEY (MICS), 2006 195
HOUSEHOLD LISTING HLPLEASE, NAME ALL PEOPLE WHO USUALLY RESIDE HERE. START FROM THE HOUSEHOLD HEAD.Write down the name of household head at line 01. List all household members (HL2), their relationship to the household head (HL3) and their sex (HL4).Question: DO ANY OTHER PEOPLE, WHO ARE CURRENTLY OUT, RESIDE HERE? (These could be children or adults at school or work). If there are any, include them into the Questionnaire. Then, interview every person by turn, starting from HL5.
Eligible membersFor household members ages 0-17 years
women child labor
child health
HL1 HL2. HL3. HL4. HL5. HL6. HL7. HL8. HL9. HL10. HL11. HL12.
"
Nam
e
RELA
TIO
NSH
IP T
O H
H
HEA
D
See
code
s be
low
SEX
1
-MA
LE 2
– F
EMA
LE
AG
E: F
ULL
YEA
RSIf
97*
+, w
rite
«97»
Circ
le a
ppro
pria
te n
umbe
r fo
r wom
en a
ged
15-4
9 ye
ars
For each child
aged 5-14 year:
For each under-5
child:
IS M
OTH
ER A
LIV
E?1
YES
2 N
O
HL1
1 8
DK
HL1
1
If al
ive:
DO
ES M
OTH
ER
RESI
DE
IN T
HIS
HH
? YE
S-
line
" o
f mot
her,
NO
- 00
IS F
ATH
ER A
LIV
E?1
YES
2 N
O
NEX
T LI
NE
8 D
KN
EXT
LIN
E
If al
ive:
DO
ES F
ATH
ER
RESI
DE
IN T
HIS
HH
? YE
S-
line
" o
f fat
her,
NO
- 00
CHILD’S MOTHER OR CARE-TAKER
write line number of mother/caretaker
LINE NAME RELAT. M F YEARS 15-49 MOTHER MOTHER Y N DK MOTHER Y N DK FATHER01 0 1 1 2 __ __ 01 __ __ __ __ 1 2 8 __ __ 1 2 8 __ __02 __ __ 1 2 __ __ 02 __ __ __ __ 1 2 8 __ __ 1 2 8 __ __03 __ __ 1 2 __ __ 03 __ __ __ __ 1 2 8 __ __ 1 2 8 __ __04 __ __ 1 2 __ __ 04 __ __ __ __ 1 2 8 __ __ 1 2 8 __ __05 __ __ 1 2 __ __ 05 __ __ __ __ 1 2 8 __ __ 1 2 8 __ __06 __ __ 1 2 __ __ 06 __ __ __ __ 1 2 8 __ __ 1 2 8 __ __07 __ __ 1 2 __ __ 07 __ __ __ __ 1 2 8 __ __ 1 2 8 __ __08 __ __ 1 2 __ __ 08 __ __ __ __ 1 2 8 __ __ 1 2 8 __ __09 __ __ 1 2 __ __ 09 __ __ __ __ 1 2 8 __ __ 1 2 8 __ __10 __ __ 1 2 __ __ 10 __ __ __ __ 1 2 8 __ __ 1 2 8 __ __11 __ __ 1 2 __ __ 11 __ __ __ __ 1 2 8 __ __ 1 2 8 __ __12 __ __ 1 2 __ __ 12 __ __ __ __ 1 2 8 __ __ 1 2 8 __ __13 __ __ 1 2 __ __ 13 __ __ __ __ 1 2 8 __ __ 1 2 8 __ __14 __ __ 1 2 __ __ 14 __ __ __ __ 1 2 8 __ __ 1 2 8 __ __15 __ __ 1 2 __ __ 15 __ __ __ __ 1 2 8 __ __ 1 2 8 __ __16 __ __ 1 2 __ __ 16 __ __ __ __ 1 2 8 __ __ 1 2 8 __ __
Question: DO ANY OTHER CHILDREN RESIDE IN YOUR HOUSEHOLD, EVEN IF THEY ARE NOT YOUR FAMILY MEMBERS OR ORPHANED (INCLUDING THOSE IN SCHOOL OR AT WORK)?If ‘Yes’, write down child’s name and complete listing. Then enter total number.
Total: Women aged 15-49 years Children aged 5-14 years Under-5s__ __ __ __ __ __
CODES to question HL301 = HEAD 09 = BROTHER/SISTER IN LAW02 = SPOUSE 10 = UNCLE/AUNT03 = SON/DAUGHTER 11 = BLOOD NEPHEW/NIECE04 = SON/DAUGHTER IN LAW 12 = NEPHEW/NIECE IN LAW05 = GRANDSON/GRANDDAUGHTER 13 = OTHER RELATIVE06 = MOTHER/FATHER 14 = ADOPTED CHILD, STEPSON/STEPDAUGHTER07 = FATHER/MOTHER IN LAW 15 = NON RELATIVE08 = BROTHER/SISTER 98 = DO NOT KNOW (dk)
*) 97 – Only for aged household members.

MONITORING THE SITUATION OF CHILDREN AND WOMEN196
EDUCATION ED
For household members aged 5 years + For household members aged 5-24 years
ED1 ED1A ED2 ED3 ED4 ED5 ED6 ED7 ED8
"
Nam
e
HAV
E (N
AM
E) A
TTEN
DED
PR
ESCH
OO
L IN
STIT
UTI
ON
, SC
HO
OL
AN
D O
THER
ED
UCA
TIO
NA
L IN
STIT
UTI
ON
? 1
YES
2 N
O
NEX
T LI
NE
THE
HIG
HES
T LE
VEL
(N
AM
E)
ATTE
ND
ED G
RAD
E/CO
URS
E (S
)HE
COM
PLET
ED A
T TH
IS
LEV
EL L
EVEL
: S
ee c
odes
be
low
: GRA
DE/
COU
RSE
98
= D
K
HA
S (S
)HE
ATTE
ND
ED
EDU
CATI
ON
AL
OR
PRE-
SCH
OO
L IN
STIT
UTI
ON
D
URI
NG
(20
05/2
006)
? 1
– Y
ES 2
– N
O
ED
7
NU
MBE
R O
F D
AYS
(NA
ME)
AT
TEN
DED
ED
UCA
TIO
N
FACI
LITY
SIN
CE L
AST
DAY
OF
SCH
OO
L W
EEK
(DO
W)
(DAY
S)
LEV
EL A
ND
GRA
DE
(NA
ME)
AT
TEN
DED
DU
RIN
G T
HIS
SC
HO
OL
YEA
R (2
005/
2006
) LE
VEL
: S
ee c
odes
bel
ow
GRA
DE/
COU
RSE:
98
= D
K
HA
S (N
AM
E) A
TTEN
DED
ED
UCA
TIO
NA
L IN
STIT
UTI
ON
PR
EVIO
US
SCH
OO
L YE
AR
– 2
004/
2005
? 1
– Y
ES 2
–
NO
N
EXT
LIN
E 8
DK
N
ext l
ine
WH
AT L
EVEL
AN
D G
RAD
E/CO
URS
E AT
TEN
DED
(N
AM
E)
PREV
IOU
S SC
HO
OL
YEA
R (2
004/
2005
)? L
EVEL
: S
ee
code
s be
low
#$
%&&
/#'(
& 98
=
DK
line name yes no level grade yes no days level grade y no dk level grade
01 1 2 012348 __ 1 2 __ 012348 __ 1 2 8 012348 __
02 1 2 012348 __ 1 2 __ 012348 __ 1 2 8 012348 __
03 1 2 012348 __ 1 2 __ 012348 __ 1 2 8 012348 __
04 1 2 012348 __ 1 2 __ 012348 __ 1 2 8 012348 __
05 1 2 012348 __ 1 2 __ 012348 __ 1 2 8 012348 __
06 1 2 012348 __ 1 2 __ 012348 __ 1 2 8 012348 __
07 1 2 012348 __ 1 2 __ 012348 __ 1 2 8 012348 __
08 1 2 012348 __ 1 2 __ 012348 __ 1 2 8 012348 __
09 1 2 012348 __ 1 2 __ 012348 __ 1 2 8 012348 __
10 1 2 012348 __ 1 2 __ 012348 __ 1 2 8 012348 __
11 1 2 012348 __ 1 2 __ 012348 __ 1 2 8 012348 __
12 1 2 012348 __ 1 2 __ 012348 __ 1 2 8 012348 __
13 1 2 012348 __ 1 2 __ 012348 __ 1 2 8 012348 __
14 1 2 012348 __ 1 2 __ 012348 __ 1 2 8 012348 __
15 1 2 012348 __ 1 2 __ 012348 __ 1 2 8 012348 __
16 1 2 012348 __ 1 2 __ 012348 __ 1 2 8 012348 __
For questions ED3, ED6, ED8
Education level Code of education levelgrade/course
(for interviewer)Schooling years(for operator)
PRESCHOOL/KINDERGARTEN 0 0 – 4 0 – 4
PRIMARY 1 0 – 4 0 – 4
SECONDARY 2 5 – 11 0 – 7
SPECIALIZED SECONDARY 3 0 – 3 0 – 3
HIGHER 4 0 – 6 0 – 6
DK (DOES NOT KNOW) 8

KAZAKHSTAN MULTIPLE INDICATOR CLUSTER SURVEY (MICS), 2006 197
WATER AND SANITATION WS
WS1. WHAT MAIN SOURCE OF DRINKING WATER DO YOUR HOUSEHOLD MEMBERS USE?
Piped water
Piped into dwelling …11 11 WS5
Piped into yard/plot 12 12 WS5
Public tap 13 WS3
Tube well/bore-hole 21
Dug well
Protected (fenced) well 31
Unprotected (no fence) well 32
Spring water
Protected (fenced) spring 41
Unprotected (no fence) spring 42
Rain water 51
Tank 61
Cart with tank 71
Surface water (river, stream, dam,
lake, pool, canal) 81
Bottled water 91 91 WS2
Other (specify) 96 96 WS3
WS2. WHAT MAIN SOURCE OF WATER DO YOUR HOUSEHOLD MEMBERS USE FOR COOKING AND HAND WASHING?
Piped water
Piped into dwelling 11 11 WS5
Piped into yard/plot 12 12 WS5
Public tap 13
Tube well/bore-hole 21
Dug well
Protected (fenced) well 31
Unprotected (no fence) well 32
Spring water
Protected (fenced) spring 41
Unprotected (no fence) spring 42
Rain water 51
Tank 61
Cart with tank 71
Surface water (river, stream, dam, lake, pool, canal) 81
Bottled water 91
Other (specify) 96
WS3. HOW MUCH TIME IS NEEDED TO GO TO SOURCE OF DRINKING WATER, GET WATER AND RETURN?
Minutes __ __ __
Piped to dwelling, yard 995 995 WS5
DK 998
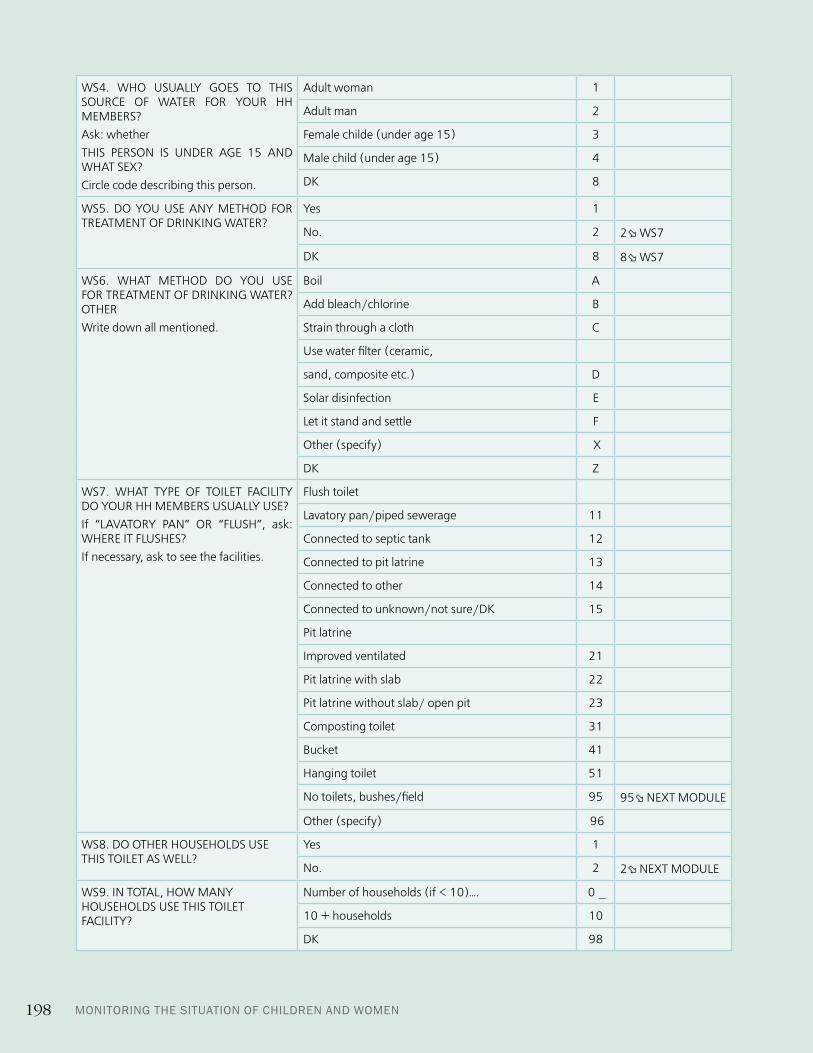
MONITORING THE SITUATION OF CHILDREN AND WOMEN198
WS4. WHO USUALLY GOES TO THIS SOURCE OF WATER FOR YOUR HH MEMBERS?Ask: whether THIS PERSON IS UNDER AGE 15 AND WHAT SEX? Circle code describing this person.
Adult woman 1
Adult man 2
Female childe (under age 15) 3
Male child (under age 15) 4
DK 8
WS5. DO YOU USE ANY METHOD FOR TREATMENT OF DRINKING WATER?
Yes 1
No. 2 2 WS7
DK 8 8 WS7
WS6. WHAT METHOD DO YOU USE FOR TREATMENT OF DRINKING WATER? OTHERWrite down all mentioned.
Boil A
Add bleach/chlorine B
Strain through a cloth C
Use water filter (ceramic,
sand, composite etc.) D
Solar disinfection E
Let it stand and settle F
Other (specify) X
DK Z
WS7. WHAT TYPE OF TOILET FACILITY DO YOUR HH MEMBERS USUALLY USE? If “LAVATORY PAN” OR “FLUSH”, ask: WHERE IT FLUSHES?If necessary, ask to see the facilities.
Flush toilet
Lavatory pan/piped sewerage 11
Connected to septic tank 12
Connected to pit latrine 13
Connected to other 14
Connected to unknown/not sure/DK 15
Pit latrine
Improved ventilated 21
Pit latrine with slab 22
Pit latrine without slab/ open pit 23
Composting toilet 31
Bucket 41
Hanging toilet 51
No toilets, bushes/field 95 95 NEXT MODULE
Other (specify) 96
WS8. DO OTHER HOUSEHOLDS USE THIS TOILET AS WELL?
Yes 1
No. 2 2 NEXT MODULE
WS9. IN TOTAL, HOW MANY HOUSEHOLDS USE THIS TOILET FACILITY?
Number of households (if < 10)…. 0 _
10 + households 10
DK 98

KAZAKHSTAN MULTIPLE INDICATOR CLUSTER SURVEY (MICS), 2006 199
HOUSEHOLD CHARACTERISTICS HCHC1B. NATIVE LANGUAGE OF THE HOUSEHOLD HEAD Kazakh 1
Russian 2Other (specify) 6
HC1C. NATIONALITY OF THE HOUSEHOLD HEAD Kazakh 1Russian 2Other (specify) 6
HC2. HOW MANY ROOMS ARE USED AS BEDROOMS IN THE HOUSEHOLD?
Number of rooms __ __
HC3. FLOOR MATERIALWrite down your observations.
Regular floorFloor boards 21Finished floorParquet or polished wood 31Vinyl or asphalt strips 32Ceramic tiles 33Cement 34Carpet 35Laminate 36Carpet type 37Linoleum 38Other (specify) 96
HC4 ROOF MATERIALWrite down your observations.
Regular roofRoof boards 23Finished roofMetal 31Wood 32Calamine/cement fiber 33Ceramic tile 34Cement 35Shingles 36Roofing slate 37Tiling 38Ruberoid/Tar 39Other (specify) 96
HC5. WALLS MATERIALWrite down your observations.
Regular wallsStone with clay 22Crude clay 23Processed wood 26Reed-fiber 27Finished wallsCement, concrete, slag 31Stone with lime/cement 32Bricks 33Cement modules 34Processed clay 35Boards/lath 36Monolith 37Other (specify) 96

MONITORING THE SITUATION OF CHILDREN AND WOMEN200
HC6. POWER (FUEL) SOURCE HOUSEHOLD MEMBERS USUALLY USE FOR COOKING
Electricity 01 01 HC8
Liquified gas/propane 02 02 HC8
Natural gas 03 03 HC8
Kerosene 05
Coal 06
Charcoal 07
Woods 08
Animal dung 10
Other (specify) 96
HC7. COOKING IN THIS HOUSEHOLD BY TYPE OF STOVE OR FIRE Identify type
Open stove 1
Open fire 2
Closed stove 3
Other (specify) 6
HC7A. AVAILABILITY OF CHIMNEY OR HOOD FOR FIRE/STOVE
Yes 1
No 2
HC8. TYPE OF COOKING: INSIDE THE HOUSE, IN SEPARATE PREMISES OR OUTSIDE
Inside 1
In separate premises 2
Outside 3
Other (specify) 6
HC9. IS THERE IN YOUR HOUSEHOLD: Yes No
Electricity 1 2
Radio 1 2
TV set 1 2
Cellular phone 1 2
Stationery telephone 1 2
Refrigerator 1 2
Personal computer 1 2
Washing machine 1 2
Sewing machine 1 2
Vacuum cleaner 1 2
HC10. DOES ANY MEMBER OF YOUR HOUSEHOLD OWN: Yes No
Watches 1 2
Bicycle 1 2
Motorbike 1 2
Horse-cart 1 2
Vehicle 1 2
Motor boat 1 2
HC11. WHERE DO YOU GET THE MAIN INFORMATION FOR YOUR FAMILY FROM?
Newspapers A
TV B
Radion C
Magazines D
Internet E
Outdoor advertising and posters F
Siblings, friends and colleagues G
Other (specify) H

KAZAKHSTAN MULTIPLE INDICATOR CLUSTER SURVEY (MICS), 2006 201
CHILD LABOR CL
Questions to caretakers of children aged 5–14 years residing in the household.Copy the line number of each eligible child from the Household Listing.Now I shall inquire about the labor activity children might be involved in this household.
CL1. CL2. CL3. CL4. CL5. CL6. CL7. CL8. CL9.
"
NA
ME
JOB FOR NON-MEMBER OF THIS HOUSEHOLD HOUSEHOLD CHORES IN THE FAMILYW
AS
THE
CHIL
D IN
VOLV
ED IN
LA
BOR
ACT
IVIT
Y D
URI
NG
PA
ST W
EEK?
If ‘Y
es:
WA
S IT
PA
ID?
1 –
YES
, (CA
SH O
R IN
KI
ND
) 2
– Y
ES, U
NPA
ID 3
– N
O
CL5
APP
ROX
IMAT
E N
UM
BER
OF
HO
URS
W
ORK
ED D
URI
NG
PA
ST W
EEK
IF M
ORE
TH
AN
ON
E W
ORK
DO
NE,
SPE
CIFY
TO
TAL
HO
URS
WO
RKED
AT
ALL
JOBS
CL
6
WA
S (S
)HE
INVO
LVED
IN A
NY
LABO
R A
CTIV
ITY
DU
RIN
G P
REV
IOU
S YE
AR?
If
‘Yes
: WA
S IT
PA
ID?
1 –
YES
, (CA
SH O
R IN
KI
ND
) 2
– Y
ES, U
NPA
ID 3
– N
O
DU
RIN
G P
AST
WEE
K W
AS
(S)H
E IN
VOLV
ED IN
HO
USE
HO
LD C
HO
RES,
SU
CH A
S SH
OPP
ING
, CO
LLEC
TIO
N O
F FI
REW
OO
D, C
LEA
NIN
G, C
ARR
YIN
G
WAT
ER O
R CH
ILD
CA
RE?
1 –
YES
2 –
NO
CL8
APP
ROX
IMAT
E N
UM
BER
OF
HO
URS
IN
VOLV
ED IN
TH
IS H
OU
SEH
OLD
CH
ORE
S D
URI
NG
PA
ST W
EEK
DU
RIN
G P
AST
WEE
K W
AS
(S)H
E IN
VOLV
ED IN
AN
Y O
THER
LA
BOR
ACT
IVIT
Y IN
TH
E FA
MILY
(FA
RM, F
AM
ILY
BUSI
NES
S)?
1 –
YES
2 –
NO
N
EXT
LIN
E
APP
ROX
IMAT
E N
UM
BER
OF
HO
URS
IN
VOLV
ED IN
TH
IS A
CTIV
ITY
DU
RIN
G
PAST
WEE
K?
line name paid un-paid no number of
hours paid un-paid no yes no number of
hours yes no number of hours
01 1 2 3 ___ ___ 1 2 3 1 2 ___ ___ 1 2 ___ ___
02 1 2 3 ___ ___ 1 2 3 1 2 ___ ___ 1 2 ___ ___
03 1 2 3 ___ ___ 1 2 3 1 2 ___ ___ 1 2 ___ ___
04 1 2 3 ___ ___ 1 2 3 1 2 ___ ___ 1 2 ___ ___
05 1 2 3 ___ ___ 1 2 3 1 2 ___ ___ 1 2 ___ ___
06 1 2 3 ___ ___ 1 2 3 1 2 ___ ___ 1 2 ___ ___
07 1 2 3 ___ ___ 1 2 3 1 2 ___ ___ 1 2 ___ ___
08 1 2 3 ___ ___ 1 2 3 1 2 ___ ___ 1 2 ___ ___
09 1 2 3 ___ ___ 1 2 3 1 2 ___ ___ 1 2 ___ ___
10 1 2 ___ ___ 1 2 3 1 2 ___ ___ 1 2 ___ ___
11 1 2 3 ___ ___ 1 2 3 1 2 ___ ___ 1 2 ___ ___
12 1 2 3 ___ ___ 1 2 3 1 2 ___ ___ 1 2 ___ ___
13 1 2 3 ___ ___ 1 2 3 1 2 ___ ___ 1 2 ___ ___
14 1 2 3 ___ ___ 1 2 3 1 2 ___ ___ 1 2 ___ ___
15 1 2 3 ___ ___ 1 2 3 1 2 ___ ___ 1 2 ___ ___
16 1 2 3 ___ ___ 1 2 3 1 2 ___ ___ 1 2 ___ ___

MONITORING THE SITUATION OF CHILDREN AND WOMEN202
TABLES FOR IDENTIFYING CHILDREN AGED 2-14 FOR CHILD DISCIPLINE MODULE
Table 1: Eligible children aged 2-14 yearsList below all children aged 2-14 years out of the Household Listing in accordance with the line number (HL1). Exclude other household members who are not aged 2-14 years. Write down line number, name, sex, age and line number for mother or each child caretaker. Then write down total number of children aged 2-14 years in the table below (CD7).
CD1. CD2. CD3. CD4. CD5. CD6.
" Line number (from HL1)
Name (from HL2) Sex (from HL4) Age (from
HL5)Line number of mother/care-
taker (from HL7 or HL8)
LINE LINE NAME M F AGE MOTHER/CARETAKER
01 __ __ 1 2 __ __ __ __
02 __ __ 1 2 __ __ __ __
03 __ __ 1 2 __ __ __ __
04 __ __ 1 2 __ __ __ __
05 __ __ 1 2 __ __ __ __
06 __ __ 1 2 __ __ __ __
07 __ __ 1 2 __ __ __ __
08 __ __ 1 2 __ __ __ __
CD7. TOTAL NUMBER OF CHILDREN AGED 2-14 YEARS __ __
If there is only one child aged 2-14 years in the household, go to CD9 and CD11, if more than one child – continue with CD8.
Table 2: random selection of child for discipline interview This table should be used to select one child aged 2-14 years, if there is more than one child of current age group in the household. See the last figure of the household number on the cover page. This is the line number to which you should go in the below table. Check the total number of eligible children in CD7(above). This is the column number from the table to which you should go. Find the cell, in which line and column cross and circle the figure in the cell. This is the serial number of child you will question about. Write down serial number in CD9 below. Finally, write down line number and name of selected child in CD11 next page. Then find mother/care-taker and start interview from CD12.
CD8. Total number of eligible children in household (from cd7)
Last figure of questionnaire 1 2 3 4 5 6 7 8+
0 1 2 2 4 3 6 5 4
1 1 1 3 1 4 1 6 5
2 1 2 1 2 5 2 7 6
3 1 1 2 3 1 3 1 7
4 1 2 3 4 2 4 2 8
5 1 1 1 1 3 5 3 1
6 1 2 2 2 4 6 4 2
7 1 1 3 3 5 1 5 3
8 1 2 1 4 1 2 6 4
9 1 1 2 1 2 3 7 5
CD9. Write down serial number of selected child from Table 2 Serial number of child __ __
CD10. Identify eligible child in the household aged 2-14 years using tables in the previous page in accordance with instruc-tions. Ask mother/caretaker about interview (identified by the line number CD6).
CD11. Write down name and line number of a child selected for module from CD3 and CD2, on the basis of serial number in CD9.
Name LINE NUMBER __ __

KAZAKHSTAN MULTIPLE INDICATOR CLUSTER SURVEY (MICS), 2006 203
CHILD DISCIPLINE CDCD12. ADULTS USE DIFFERENT METHODS OF DISCIPLINING THE CHILD.I AM GOING TO LIST DIFFERENT METHODS AND ASK YOU IF YOU OR ANY MEMBER OF YOUR HOUSEHOLD USED THESE METHODS DURING PAST MONTH.
Yes NoCD12A. DEPRIVED (NAME) PRIVILEGES, PLEASURES, BANNED ANYTHING OR GOING OUT 1 2CD12B. EXPLAINED TO (NAME) INCORRECTNESS OF SUCH (ACTION) BEHAVIOR 1 2CD12C. SHAKE HIM/HER 1 2CD12D. SCREAM AT HIM/HER 1 2CD12E. FORCED HIM/HER ACTING AGAINST HIS/HER WILL 1 2CD12F. SLAPPED, BEAT OT HIT HIS BACK WITH YOUR HAND 1 2CD12G. BEAT HIS/HER BACK OR OTHER PARTS OF THE BODY WITH ANY HARD THINGS SUCH AS BELT 1 2CD12H. CALLED HIM/HER SILLY, LAZY OR OTHER SIMILAR WORDS 1 2CD12I. BEAT HIS/HER FACE, HEAD OR EARS 1 2CD12J. BEAT HIS HANDS, SHOULDERS, LEGS 1 2CD12K. BEAT HIM/HER WITH ANY STUFF (AGAIN AND AGAIN STRONGER) 1 2CD13. DO YOU BELIEVE THAT THE CHILD NEEDS TO BE PHYSICALLY PUNISHED FOR PROPER DISCIPLINE?
Yes 1No 2DK/no opinion 8
MATERNAL MORTALITY MMApplicable to each adult member of household aged 15 years +. Copy the name and the line number of each adult (15 +) member of household. Any adult member might give answers for missing adult member. In this case, put ‘1’ in MM3, and specify line number of authorized respondent in MM4.Leave blank lines for members of household aged < 15 years.MM1. MM2. MM3. MM4. MM5. MM6. MM7. MM8. MM9.
LINE " NAME
IS IT «AUTHORI-
ZED» REPORT? 1. YES MM4 2. NO MM5
LINE NUMBER OF AUTHORIZED RESPONDENT (FROM THE HH LISTING
HL1)
NUMBER OF SISTERS
(FROM THE SAME MOTHER) YOU EVER HAD 98=
DON’T KNOW
SISTERS WHO
REACHED AGE 15 YEARS 98=
DON’T KNOW
SISTERS (AT THE AGE AT
LEAST 15 YEARS)
STILL ALIVE 98=
DON’T KNOW
SISTERS WHO
REACHED AGE 15 + AND WHO DIED 98=
DON’T KNOW
NUMBER OF DEAD SISTERS
DYING DURING PREGNANCY OR
DELIVERY OR WITHIN 6 WEEKS
AFTER PREGNANCY FINISHED 98= DON’T KNOW
LINE NAME YES NO LINE01 1 2 __ __ __ __ __ __ __ __ __ __ __ __02 1 2 __ __ __ __ __ __ __ __ __ __ __ __03 1 2 __ __ __ __ __ __ __ __ __ __ __ __04 1 2 __ __ __ __ __ __ __ __ __ __ __ __05 1 2 __ __ __ __ __ __ __ __ __ __ __ __06 1 2 __ __ __ __ __ __ __ __ __ __ __ __07 1 2 __ __ __ __ __ __ __ __ __ __ __ __08 1 2 __ __ __ __ __ __ __ __ __ __ __ __09 1 2 __ __ __ __ __ __ __ __ __ __ __ __10 1 2 __ __ __ __ __ __ __ __ __ __ __ __11 1 2 __ __ __ __ __ __ __ __ __ __ __ __12 1 2 __ __ __ __ __ __ __ __ __ __ __ __13 1 2 __ __ __ __ __ __ __ __ __ __ __ __14 1 2 __ __ __ __ __ __ __ __ __ __ __ __15 1 2 __ __ __ __ __ __ __ __ __ __ __ __16 1 2 __ __ __ __ __ __ __ __ __ __ __ __

MONITORING THE SITUATION OF CHILDREN AND WOMEN204
CONSUMPTION OF IODIZED SALT SI
SI1. WE WANT TO SEE IF MEMBERS OF YOUR HOUSEHOLD USE IODIZED SALT. MAY I SEE SALT THE MEMBERS OF YOUR HOUSEHOLD USED FOR COOKING AND CONSUMED LAST NIGHT?After testing salt, circle the number, which corresponds to the test result.
Not iodized 0 (() 1
< 15 (() 2
15 PPM + 3
No salt 6
Not tested 7
SI2. IS THERE ELIGIBLE WOMAN AGED 15-49 YEARS IN THE HOUSEHOLD?Check the HL6 column in the Household Listing. You must have question-naire containing Informational Module completed for each eligible woman.
Yes. Go to WOMEN’S QUESTIONNAIRE for interviewing the first eligible woman.
No. Continue.
SI3. ARE THERE UNDER-5 CHILDREN IN THE HOUSEHOLD?Check the HL8 column in the Household Listing. You must have question-naire containing Informational Module completed for each eligible child.
Yes. Go to UNDER-5 QUESTIONNAIRE for interviewing caretaker of the first eligible child.
No. Finish the interview, thank respondent for cooperation.
Collect all questionnaires for current household and write down the total number of completed interviews on the cover page.

KAZAKHSTAN MULTIPLE INDICATOR CLUSTER SURVEY (MICS), 2006 205
QUESTIONNAIRE FOR INDIVIDUAL WOMEN WOMAN’S INFORMATION WM
This module should be completed for each woman aged 15 – 49 years (see column HL6 of the Household Listing).Complete separate Questionnaire for each eligible woman.Write down cluster number, household number, name and line number of woman in correspondent cell. Write down your name, number and date of interview
WM1. Cluster number: WM2. Household number:
___ ___ ___ ___ ___
WM3. Name woman: WM4. Line number of woman:
_________ ___ ___
WM5. Name and number of interviewer: WM6. Interview day/month /year:
__ ___ ___ ___ ___ / ___ ___ / ___ ___ ___ ___
WM7. Outcome of interview with woman: Interviewed 1
Missing 2
Refused 3
Partially interviewed 4
Recognized not eligible 5
Other (Specify) 6
Repeat welcoming if not read for woman earlier:WE ARE FROM THE STATISTIC AGENCY OF THE REPUBLIC OF KAZAKHSTAN. WE WORK WITHIN THE FAMILY HEALTH AND EDUCATION PROJECT. I WANT TO DISCUSS THIS WITH YOU. ALL RECEIVED INFORMATION IS STRICTLY CONFIDENTIAL; NO ONE WILL LEARN BELOW ANSWERS ARE YOURS. SHALL I START? If agreed start interview.If woman disagrees with interview, thank her, finish with WM7, and go to the next interview. Discuss the result with your su-pervisor for further additional visit to household for interviewing the woman.
WM8. WHAT MONTH WERE YOU BORN? Date of Birth: __________________
month __ __
DK months 98
year __ __ __ ___________
DK year 9998
WM9. HOW OLD WERE YOU AT YOUR PREVIOUS BIRTHDAY?
Age (full years) __ __
WM10. HAVE YOU EVER STUDIED IN ANY EDUCATIONAL INSTITUTION?
Yes 1
No 2
WM11. WHAT HIGHEST LEVEL DID YOU ATTEND: PRIMARY, SECONDARY, SPECIALIZED SECONDARY OR HIGHER?
Primary 1
Secondary 2
Specialized secondary 3
Higher 4
DK 8
WM12. WHAT HIGHEST GRADE/COURSE HAVE YOU COMPLETED AT THIS LEVEL?
Grade/course __ __

MONITORING THE SITUATION OF CHILDREN AND WOMEN206
CHILD MORTALITY CMThis module should be completed for each woman aged 15-49 years.All questions should be asked only about LIVE BIRTHS.
CM1. NOW I WILL ASK YOU ABOUT BIRTHS YOU GAVE DURING YOUR LIFE.DID YOU EVER GIVE BIRTH?If “NO”, try to clarify:I MEAN BABY WHO WAS BREATHING, CRYING OR HAVING OTHER SIGNS OF LIFE, EVEN THOUGH (S)HE LIVED FOR SEVERAL MINUTES OR HOURS?
Yes 1
No 2 2 MODULE MA
CM2A. WHEN DID YOU GIVE BIRTH FOR THE FIRST TIME?I MEAN THE VERY FIRST BIRTH, EVEN IF THE BABY DIED LATER OR WAS BORN TO A MAN WHO DOES NOT LIVE WITH YOU ANYMORE.Go to CM3 only if the year of first birth is specified.Otherwise, continue with CM2B.
Date of first delivery
Day __ __
DK day 98
Month __ __
DK month 98
Year __ __ CM3
DK year 9998 CM2B
CM2B. HOW MANY YEARS AGO DID YOU GIVE BIRTH FIRST TIME?
Full years after first birth __ __
CM3. DO ANY OF YOUR OWN SONS OR DAUGHTERS RESIDE WITH YOU CURRENTLY?
Yes 1
No 2 2 CM5
CM4. HOW MANY OF YOUR OWN SONS RESIDE WITH YOU?HOW MANY OF YOUR OWN DAUGHTERS RESIDE WITH YOU?
Sons residing with mother __ __
Daughters residing with mother __ __
CM5. ARE THERE ANY OF YOUR LIVING SONS AND DAUGHTER WHO DO NOT RESIDE WITH YOU?
Yes 1
No 2 2 CM7
CM6. HOW MANY OF YOUR LIVING SONS DO NOT RESIDE WITH YOU?HOW MANY OF YOUR LIVING DAUGHTERS DO NOT RESIDE WITH YOU?
Sons residing separately __ __
Daughters residing separately __ __
CM7. HAVE YOU EVER GIVEN BIRTH TO A LIVE BOY OR GIRL WHO DIED LATER?
Yes 1
No 2 2 CM9
CM8. HOW MANY BOYS HAVE DIED?HOW MANY GIRLS HAVE DIED?
Number of dead boys __ __
Number of dead girls __ __
CM9. SUM UP ANSWERS FOR CM4, CM6, CM8. Total __ __
CM10. TO CHECK MY NOTES, DURING YOUR LIFE YOU GAVE BIRTH (total number) OF TIMES. IS IT TRUE? Yes. Go to CM11 No. Check answers and make corrections before going to CM11
CM11. WHEN DID YOU GIVE LAST BIRTH OUT OF (total number) BIRTHS (EVEN IF THIS BABY DIED LATER)?If day is unknown, enter ‘98’ for the date.
Date of last birth
Day/Month/Year__ __/__ __/__ __ __ __
CM12. Check CM11: Did you give last birth during past 2 years, namely from «_____» ____________ 2004 and later?If the child died, pay special attention to the questions about this child in the next module. No births during 2 years preceding interview. Go to MARITAL/UNION STATUS MODULE. Yes, birth during 2 years preceding interview. Continue with CM13Name of the child____________________________________________
CM13. WHEN YOU BECOME PREGNANT WITH (NAME), WAS IT WANTED PREGNANCY, YOU WANTED IT COME LATER OR YOU WANTED NO (MORE) CHILDREN?
Wanted pregnancy 1
Wanted later 2
Unwanted pregnancy 3

KAZAKHSTAN MULTIPLE INDICATOR CLUSTER SURVEY (MICS), 2006 207
MATERNAL AND NEWBORN HEALTH MN
This module should be completed for each woman who gave live birth during two years preceding the interview.Check the Child Mortality Module CM12 and write down the name of the last child _______________________Use the name of this child in the following questions
MN2. DID YOU SEEK ANTENATAL CARE DURING THIS PREGNANCY?If yes: WHO PROVIDED ANTENATAL CARE TO YOU?ANY OTHER STAFF?Ask additional questions to clarify personnel providing an-tenatal care and circle all mentioned persons.
Health staff:
Medical doctor A
Nurse/midwife B
Auxiliary midwife C
Feldsher D
Other
Traditional birth attendant F
Public health worker G
Relative/friend H
Other (specify) X
No one Y Y MN7
MN2%. HOW MANY TIMES DID YOU SEEK ANTENATAL CARE DURING THIS PREGNANCY?
Regularly 1
1 time 2
2-3 times 3
Did not seek 4 4 MN7
MN3. AS A PART OF YOUR ANTENATAL CARE, HAVE YOU RECEIVED ONE OF THE FOLLOWING SPECIFIC CARE, AT LEAST, ONCE? Yes No
MN3A. WEIGHT MEASURED Weight 1 2
MN3B. BLOOD PRESSURE MEASURED Blood pressure 1 2
MN3C. URINE TESTED Urine test 1 2
MN3D. BLOOD TESTED Blood test 1 2
MN4. DURING ANTENATAL VISITS, DID ANYBODY SPEAK WITH ABOUT AIDS AND HIV?
Yes 1
No 2
DK 8
MN5. I DO NOT WANT TO KNOW THE RESULTS, BUT WERE YOU TESTED FOR AIDS AS A PART OF ANTENATAL CARE?
Yes 1
No 2 2 MN7
DK 8 8 MN7
MN6. I DO NOT WANT TO KNOW THE RESULTS, BUT DID YOU GET THE RESULTS OF THE TEST?
Yes 1
No 2
DK 8
MN7. WHO ASSISTED YOU DURING DELIVERY OF YOUR LAST CHILD (name)?ANYBODY ELSE?Ask additional questions to clarify the person assisted dur-ing delivery and circle all mentioned persons.
Health staff:
Medical doctor A
Nurse/midwife B
Auxiliary midwife C
Feldsher D
Other
Traditional birth attendant F
Public health worker G
Relative/friend H
Other (specify) X
No one Y

MONITORING THE SITUATION OF CHILDREN AND WOMEN208
MN8. WHERE DID YOU GIVE BIRTH TO (NAME)?If the source is hospital, health center or clinic, write down the name of institution on below line. Ask type of institu-tion and circle correspondent code. __________________________________________(name of institution)
Home
At her home 11
Not at her home 12
Public sector
Public hospital/maternity 21
Public clinic/Health center 22
Other health facility (specify) 26
Private health sector
Private hospital 31
Private clinic 32
Private maternity 33
Other health facility (specify) 36
Other (specify) 96
MN9. WHEN YOU GAVE BIRTH TO YOUR LAST BABY (NAME), WAS HE LARGE, MORE THAN AVERAGE, AVERAGE, BELOW AVERAGE OR VERY LITTLE?
Large 1
More than average 2
Average 3
Below average 4
Very little 5
DK 8
MN10. WAS (name) WEIGHTED IMMEDIATELY AFTER BIRTH?
Yes 1
No 2 2 MN12
DK 8 8 MN12
MN11. WHAT WAS (name) WEIGHT?Copy weight from child development card if available.
Card (grams) 1 __ __
From memory (grams) 2 __ __
DK 8 99998
MN12. HAVE YOU EVER BREASTFED (name)? Yes 1
No 2 2 next module
MN13. HOW MUCH TIME AFTER BIRTH YOU BREASTFED (NAME) FOR THE FIRST TIME?If < 1 hour, write down ‘00’ hours.If < 24 hours, write down number of hours.If other write down days.
Immediately 000
Hours 1 __ __
or Days 2 __ __
DK/does not remember 998
MN14. DO YOU SMOKE? Yes 1
No 2 2 MN16
MN14A. WERE YOU SMOKING DURING THE PREGNANCY?
Yes 1
No 2
MN15. HOW MANY TIMES DID YOU SMOKE DURING LAST 24 HOUR?
1-2 times 1
3-5 times 2
5 + 3
MN16. HAVE YOU EVER CONSUMED ALCOHOL BEVERAGES?
Yes 1
No 2 2 next module
MN17. HAVE YOU EVER BECOME DRUNK WHEN CONSUMING ALCOHOL BEVERAGES?
Yes 1
No 2
MN18. HOW MANY DAYS HAVE YOU CONSUMED ALCOHOL BEVERAGES DURING LAST 3 MONTHS
Days __ __
No/never 0_0
MN19. HOW MANY TIMES WERE YOU DRUNK DURING LAST 3 MONTHS?
Days __ __
No/never 0_0

KAZAKHSTAN MULTIPLE INDICATOR CLUSTER SURVEY (MICS), 2006 209
MARRIAGE AND UNION MAMA1. ARE YOU CURRENTLY MARRIED/IN UNION? Yes, married 1
Yes, in union 2Not in union 3 3 MA3
MA2. HOW OLD WAS YOUR HUSBAND/PARTNER AT HIS LAST BIRTHDAY?
Age in years MA5DK 98 MA5
MA3. HAVE YOU EVER BEEN MARRIED/IN UNION? Yes, was married 1Yes, was in union 2No. 3 3 next module
MA4. WHAT IS YOUR MARITAL STATUS AT PRESENT: WIDOW, DIVORCED OR SEPARATED?
Widow 1Divorced 2Separated 3
MA5. HAVE YOU BEEN MARRIED/IN UNION ONLY ONCE OR MORE THAN ONCE?
Only once 1More than once 2
MA6. WHAT MONTH AND YEAR YOU MARRIED OR STARTED LIVING IN UNION FIRST TIME?
Month __ __DK month 98Year __ __ DK year 9998
MA7. Check MA6: Month and year of marriage/union is known? go to the next Module. Or month and year of marriage/union is not known? continue with MA8MA8. AT WHAT AGE HAVE YOU STARTED LIVING WITH YOUR FIRST HUSBAND/PARTNER?
Age in years __ __
REPRODUCTIVE BEHAVIOR RPRP1. I WANT TO DISCUSS YOUR REPRODUCTIVE BEHAVIOR.IF YOU HAVE CHOICE, HOW MANY CHILDREN WOULD YOU HAVE DURING YOUR LIFE?
One ATwo BThree CFour DFive-nine ETen + FNone G
RP2. YOUR DECISION TO HAVE NO CHILDREN OR RESTRICT THEIR NUMBER WOULD DEPEND ON:
Health status AFear to lose job BUncertainty in children’s future CLow level of health service DLack of preschool institutions ENo housing FNo utilities in dwelling GNo regular job HLow salary INo job in general JOther (specify) K
RP3. YOUR DECISION TO HAVE (MORE) CHILDREN WOULD DEPEND ON:
Sufficient family allowances ASufficient maternity leave BAvailability of mortgage and credits CShort working day for breastfeeding mothers DYounger retirement age for mothers (of how many children?) EOther (specify) F
RP4. WHAT IS PREFERABLE BIRTH INTERVAL BEFORE YOU WOULD HAVE (ANOTHER) BABY?
One year ATwo years BThree years CFour years DFive + ENo more kids F
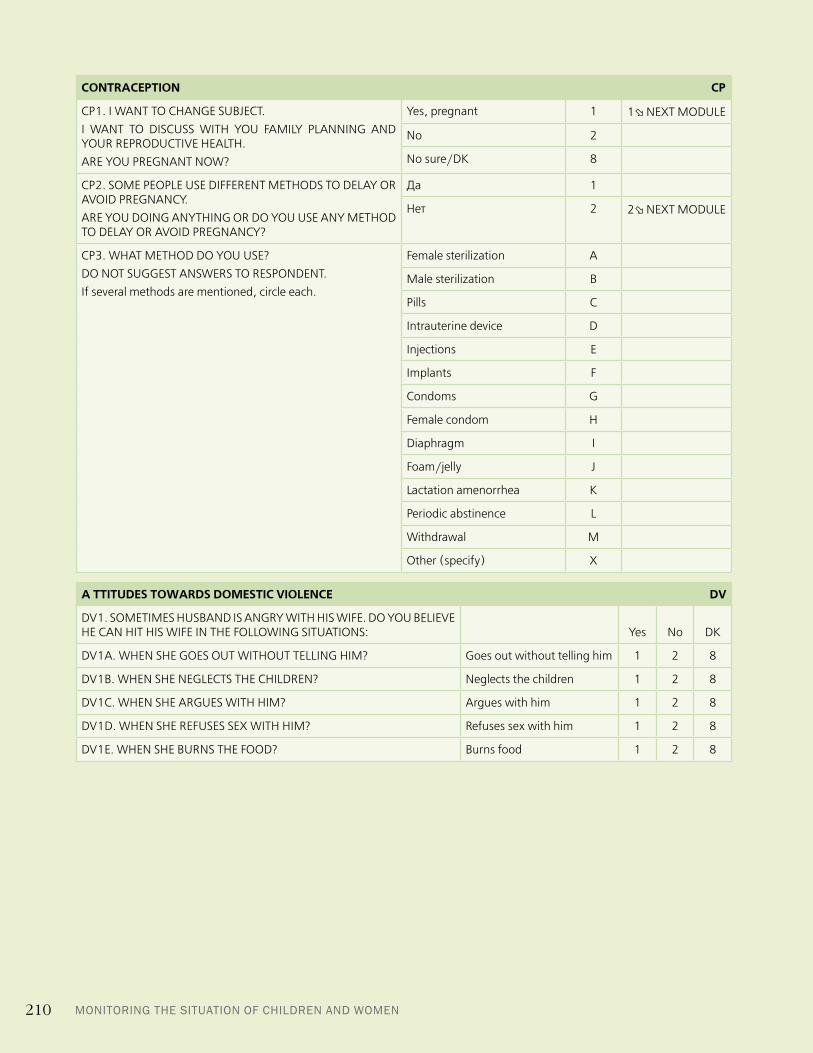
MONITORING THE SITUATION OF CHILDREN AND WOMEN210
CONTRACEPTION CP
CP1. I WANT TO CHANGE SUBJECT.I WANT TO DISCUSS WITH YOU FAMILY PLANNING AND YOUR REPRODUCTIVE HEALTH.ARE YOU PREGNANT NOW?
Yes, pregnant 1 1 NEXT MODULE
No 2
No sure/DK 8
CP2. SOME PEOPLE USE DIFFERENT METHODS TO DELAY OR AVOID PREGNANCY.ARE YOU DOING ANYTHING OR DO YOU USE ANY METHOD TO DELAY OR AVOID PREGNANCY?
*+ 1
,-. 2 2 NEXT MODULE
CP3. WHAT METHOD DO YOU USE?DO NOT SUGGEST ANSWERS TO RESPONDENT.If several methods are mentioned, circle each.
Female sterilization A
Male sterilization B
Pills C
Intrauterine device D
Injections E
Implants F
Condoms G
Female condom H
Diaphragm I
Foam/jelly J
Lactation amenorrhea K
Periodic abstinence L
Withdrawal M
Other (specify) X
A TTITUDES TOWARDS DOMESTIC VIOLENCE DV
DV1. SOMETIMES HUSBAND IS ANGRY WITH HIS WIFE. DO YOU BELIEVE HE CAN HIT HIS WIFE IN THE FOLLOWING SITUATIONS: Yes No DK
DV1A. WHEN SHE GOES OUT WITHOUT TELLING HIM? Goes out without telling him 1 2 8
DV1B. WHEN SHE NEGLECTS THE CHILDREN? Neglects the children 1 2 8
DV1C. WHEN SHE ARGUES WITH HIM? Argues with him 1 2 8
DV1D. WHEN SHE REFUSES SEX WITH HIM? Refuses sex with him 1 2 8
DV1E. WHEN SHE BURNS THE FOOD? Burns food 1 2 8

KAZAKHSTAN MULTIPLE INDICATOR CLUSTER SURVEY (MICS), 2006 211
TUBERCULOSIS HTHT1. HAVE YOU EVER HEARD ABOUT TUBERCULOSIS? Yes 1
No 2 2 NEXT MODULEHT2. DO YOU KNOW ABOUT FULL RECOVERY AFTER TUBERCULOSIS IF PROPER TREATMENTS RECEIVED?
Yes 1No 2DK 8
HT3. HAVE YOU OR ANY MEMBER OF YOUR FAMILY EVER HAD TUBERCULOSIS?
Yes 1No 2DK 8
HT4. IN ADDITION TO YOUR FAMILY MEMBERS DO YOU OFTEN COMMUNICATE TO ANYBODY (NEIGHBORS, COLLEAGUES OR CLOSE FRIENDS) SUFFERING FROM TUBERCULOSIS?
Yes 1No 2DK 8
HT5. WHAT SYMPTOMS HELP TO IDENTIFY TUBERCULOSIS?
Cough 1Cough with phlegm 2Cough over 3 weeks 3Fever 4Blood with phlegm 5Appetite loss 6Sweating at night 7Chest pain 8Fatigue, tirelessness 9Weight loss 10Apathy, inertia 11Other (specify) 96DK 98
HT6. WHICH TB SYMPTOMS REQUIRE SEEING A DOCTOR?
Cough 1Cough with phlegm 2Cough over 3 weeks 3Fever 4Blood with phlegm 5Appetite loss .6Sweating at night 7Chest pain 8Fatigue, tirelessness 9Weight loss 10Apathy, inertia 11Other (specify) 96DK 98
HT7. WHAT TREATMENT SHOULD HAVE THE PERSON WITH TB DIAGNOSED FIST TIME?
Hospital 1Home 2Initially in the hospital, later at home 3Other (specify) 6DK 8
HT8. HOW IS TB TRANSMITTED BETWEEN PEOPLE? By air when coughing 1Other (specify) 6DK 8
HT9. WHERE WOULD YOU TAKE YOUR CHILD WITH SUSPECTED TB?
Hospital 1Policlinic 2Feldsher 3NB dispensary 4Other (specify) 6DK 8
HT10. WOULD YOU TAKE CARE OF YOUR FAMILY MEMBER, WHO, LET US ASSUME, HAD TB TREATMENT IN THE HOSPITAL, DURING FURTHER TREATMENT AT HOME?
Yes 1No 2DK/not sure 8
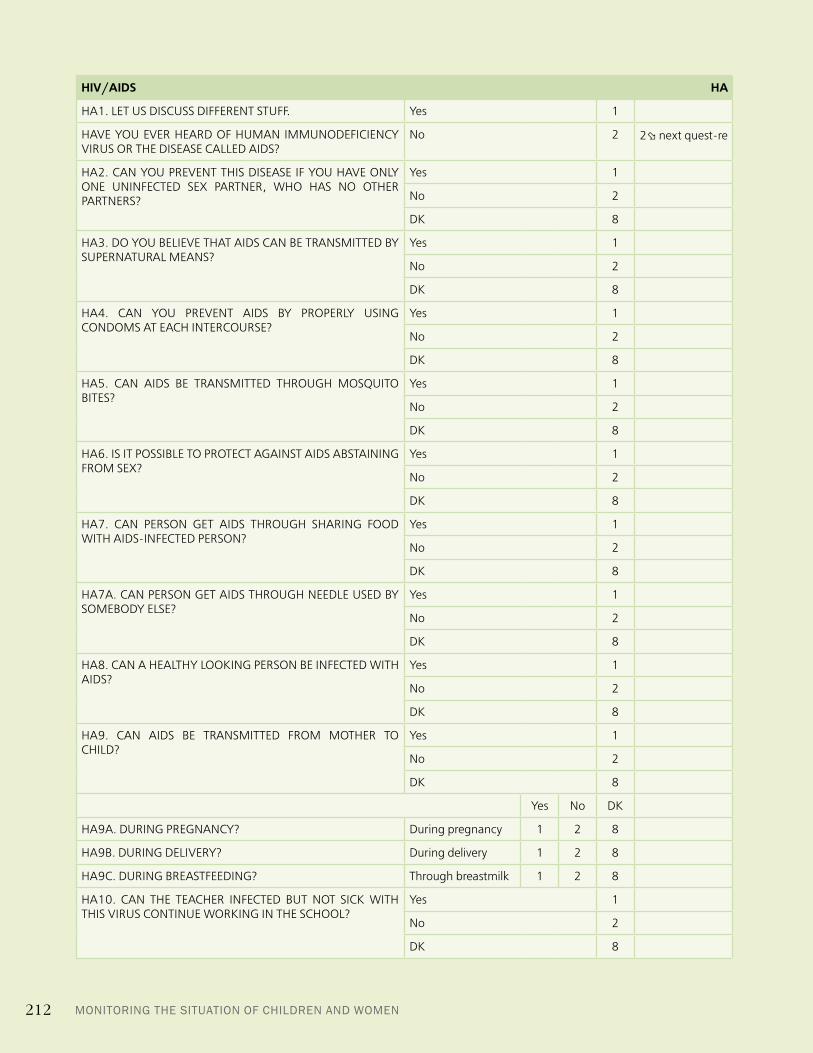
MONITORING THE SITUATION OF CHILDREN AND WOMEN212
HIV/AIDS HA
HA1. LET US DISCUSS DIFFERENT STUFF. Yes 1
HAVE YOU EVER HEARD OF HUMAN IMMUNODEFICIENCY VIRUS OR THE DISEASE CALLED AIDS?
No 2 2 next quest-re
HA2. CAN YOU PREVENT THIS DISEASE IF YOU HAVE ONLY ONE UNINFECTED SEX PARTNER, WHO HAS NO OTHER PARTNERS?
Yes 1
No 2
DK 8
HA3. DO YOU BELIEVE THAT AIDS CAN BE TRANSMITTED BY SUPERNATURAL MEANS?
Yes 1
No 2
DK 8
HA4. CAN YOU PREVENT AIDS BY PROPERLY USING CONDOMS AT EACH INTERCOURSE?
Yes 1
No 2
DK 8
HA5. CAN AIDS BE TRANSMITTED THROUGH MOSQUITO BITES?
Yes 1
No 2
DK 8
HA6. IS IT POSSIBLE TO PROTECT AGAINST AIDS ABSTAINING FROM SEX?
Yes 1
No 2
DK 8
HA7. CAN PERSON GET AIDS THROUGH SHARING FOOD WITH AIDS-INFECTED PERSON?
Yes 1
No 2
DK 8
HA7A. CAN PERSON GET AIDS THROUGH NEEDLE USED BY SOMEBODY ELSE?
Yes 1
No 2
DK 8
HA8. CAN A HEALTHY LOOKING PERSON BE INFECTED WITH AIDS?
Yes 1
No 2
DK 8
HA9. CAN AIDS BE TRANSMITTED FROM MOTHER TO CHILD?
Yes 1
No 2
DK 8
Yes No DK
HA9A. DURING PREGNANCY? During pregnancy 1 2 8
HA9B. DURING DELIVERY? During delivery 1 2 8
HA9C. DURING BREASTFEEDING? Through breastmilk 1 2 8
HA10. CAN THE TEACHER INFECTED BUT NOT SICK WITH THIS VIRUS CONTINUE WORKING IN THE SCHOOL?
Yes 1
No 2
DK 8

KAZAKHSTAN MULTIPLE INDICATOR CLUSTER SURVEY (MICS), 2006 213
HA11. WOULD YOU BUY FRESH VEGETABLES FROM THE SELLER KNOWING (S)HE IS SICK OR INFECTED WITH VIRUS?
Yes 1
No 2
DK 8
HA12. WOULD YOU KEEP IN A SECRET IF ONE OF YOUR FAMILY MEMBERS WOULD BE INFECTED WITH AIDS?
Yes 1
No 2
DK 8
HA13. WOULD YOU TAKE CARE OF YOUR FAMILY MEMBER AT HOME KNOWING (S)HE IS SICK WITH AIDS?
Yes 1
No 2
DK 8
HA14. Check MN5: WAS THE WOMAN TESTED FOR AIDS AS A PART OF ANTENATAL CARE? Yes. Go to HA18% No. Continue with HA15
HA15. I DO NOT WANT TO KNOW A RESULT, BUT HAVE YOU EVER BEEN TESTED FOR AIDS?
Yes 1
No 2 2 HA18
DK 8 8 HA18
HA16. I DO NOT WANT TO KNOW A RESULT, BUT WERE YOU INFORMED ON THE RESULTS OF YOUR TEST?
Yes 1
No 2
HA17. DID YOU REQUEST TEST OR IT WAS PROPOSED TO YOU AND AGREED OR IT WAS OBLIGATORY?
Requested test 1 1 next quest-re
Proposed and agreed 2 2 next quest-re
Obligatory 3 3 next quest-re
HA18. AT PRESENT TIME, ARE YOU AWARE OF PLACE WHERE YOU CAN GET TESTED FOR AIDS?
Yes 1
No 2
HA18%. If was tested for AIDS virus as a part of antenatal care: DO YOU KNOW ABOUT ANY PLACE IN ADDITION TO ANC PLACE WHERE YOU CAN BE TESTED FOR AIDS?
Yes 1
No 2

MONITORING THE SITUATION OF WOMEN AND CHILDREN214
QUESTIONNAIRE FOR CHILDREN UNDER-5UNDER-5 INFORMATION UF
This questionnaire should be filled for all women (see household listing, column HL8), who takes care of children aged under-5 living with them (see household listing, column HL5).Separate Questionnaire should be filled for each child.Write down cluster and household number, name and line number of the child and his/her mother or caretaker. Write down your name, number and day of interview
UF1. Cluster number: UF2. Household number:
_____________________________________ _____________________________________
UF3. Name of child: UF4. Line number of child:
_____________________________________ _____________________________________
UF5. Name of mother/caretaker: UF6. Line number of mother/caretaker:
_____________________________________ _____________________________________
UF7. Name and number of interviewer: UF8. Day/month /year of interview:
_____________________________________ ___ ___ / ___ ___ / ___ ___ ___ ___
UF9. Outcome of Under-5 interview (Codes relate mothers/caretaker)
Interviewed 1
Missing 2
Refused 3
Partially interviewed 4
Recognized unfit 5
Other (Specify) 6
Repeat welcome if not read for woman earlier:WE ARE FROM THE STATISTIC AGENCY OF THE REPUBLIC OF KAZAKHSTAN. WE WORK WITHIN THE FAMILY HEALTH AND EDUCATION PROJECT. I WANT TO DISCUSS THIS WITH YOU. ALL RECEIVED INFORMATION IS STRICTLY CONFIDENTIAL; NO ONE WILL LEARN BELOW ANSWERS ARE YOURS. SHALL I START? If agreed start interview.If respondent disagrees with interview, thank him/her, and go to the next interview. Discuss the result with your supervisor for further additional visit to household for getting information about the child.
UF10. NOW I WILL INQUIRE YOU ABOUT HEALTH OF EACH UNDER-5 CHILD WHO YOU TAKE CARE OF AND WHO LIVES WITH YOU. PLEASE, TELL HIS/HER (name).WHAT IS HIS/HER MONTHS AND YEAR OF BIRTH (NAME)?Continue: WHAT IS HIS/HER BIRTHDAY?If mother/caretaker knows exact date of birth, write it down; otherwise circle number 98 for birthday.
Birthday:
Day __ __
DK day 98
Month __ __
Year __ __ __ __
UF11. HOW OLD BECAME (name)AT HER/HIS LAST BIRTHDAY? Write down age in full years. Age in full years __

KAZAKHSTAN MULTIPLE INDICATOR CLUSTER SURVEY (MICS), 2006 215
BIRTH REGISTRATION AND EARLY LEARNING BR
BR1. HAS (name) BIRTH CERTIFICATE? MAY I SEE IT? Yes, certificate was shown 1 1 BR5
Yes, no certificate shown 2
No….. 3
DK 8
BR2. WAS BIRTH OF (name) REGISTERED IN THE REGISTRY OFFICE?
Yes 1 1 BR5
No 2 2 BR3
DK 8 8 BR4
BR3. WHY BIRTH OF (name) WAS NOT REGISTERED? Too expensive 1
Too far to go 2
Did not know 3
Did not want to pay fine 4
Did not know where to go 5
Other (specify) 6
DK 8
BR4. DO YOU KNOW HOW TO REGISTER BIRTH? Yes 1
No 2
BR5. Check age of the child in UF11: IS CHILD 3 – 4 YEARS? Yes. Continue with BR6 No. Go to BR8
BR6. DOES (name) ATTEND ANY FORM OF EARLY CHILDHOOD EDUCATION PROGRAM IN PRIVATE OR PUBLIC INSTITUTION, SUCH AS KINDERGARTEN OR OTHER CHILD CARE GROUP?
Yes 1
No 2 2 BR8
DK 8 8 BR8
BR7. HOW MANY HOURS (APPROXIMATELY) OF THIS PROGRAM HAS (name) ATTENDED IN THE PAST WEEK? Number of hours __ __
BR8. WERE YOU OR ANY HOUSEHOLD MEMBER OLDER 15 YEAS ENGAGED IN THE FOLLOWING ACTIVITIES WITH (name) DURING LAST 3 DAYS: If Yes, ask: WHO WAS ENGAGED IN THESE ACTIVITIES – MOTHER, FATHER OR OTHER ADULT HOUSEHOLD MEMBER (INCLUDING ADULT CARETAKER/RESPONDENT)?Circle appropriate. Mother Father
Other HH
mem-ber Nobody
BR8A. READ BOOKS OR WATCHED PICTURES IN THE BOOKS WITH (name)
Read books A B X Y
BR8B. TOLD STORIES TO (name) Told stories A B X Y
BR8C. SANG SONGS WITH (NAME) Sang sons A B X Y
BR8D WENT OUT WITH (name) Went out A B X Y
BR8E. PLAYED & (/01) Played A B X Y
BR8F. SPENT TIME WITH (name) NAMING WORDS, COUNTING AND/OR DRAWING
Spent time A B X Y

MONITORING THE SITUATION OF WOMEN AND CHILDREN216
CHILD DEVELOPMENT CEAsk question CE1 to each caretaker only onceCE1. HOW MANY BOOKS ARE THERE IN YOUR HOUSEHOLD? PLEASE INCLUDE SCHOOLBOOKS, BUT NOT OTHER, FOR INSTANCE, ILLUSTRATED CHILDREN’S BOOKS. If no, write down 00
Number on non-children’s books (< 10) 0_10 + non-children’s books 10
CE2. HOW MANY CHILDREN’S BOOKS OR ILLUSTRATED BOOKS DO YOU HAVE FOR (/01)? If no, write down 00
Number on non-children’s books (< 10) 0__10 + non-children’s books 10
CE3. I AM INTERESTED TO LEARN WITH WHAT (name) PLAYS WHEN (S)HE IS AT HOME. WITH WHAT DOES (name) PLAY?DOES (S)HE PLAY WITHHOUSEHOLD OBJECTS, SUCH AS BOWLS, DISHES, CUPS AND PANSOBJECTS AND MATERIALS FOUND OUTSIDE THE HOME, SUCH AS STICKS, STONES, SEASHELLS OR LEAVESHOMEMADE TOYS, SUCH AS DOLLS, CARS AND OTHERTOYS THAT COME FROM STOREDOMESTIC ANIMALSIf respondent answers ‘YES’ to mentioned category, try to specify the object with that the child plays. Circle Y, if child plays with neither listed item.
Household objects (bowls, dishes, cups, pots AObjects and materials found outside the home (sticks, stones, sea-shells, leaves)
B
Homemade toys (dolls, cars and other toys) CToys that come from store DDomestic animals ENo toys listed Y
CE4. SOMETIMES ADULT CARETAKERS SHOULD GO SHOPPING, FOR LAUNDRY OR SOME OTHER BUSINESS LEAVING LITTLE CHILDREN IN CARE OF OTHERS. HOW MANY TIMES IN THE PAST WEEK (name) WAS LEFT IN CARE OF ANOTHER CHILD (BELOW 10 YEARS)?If ‘no’, write down 00 Number of times __CE5. HOW MANY TIMES (name) WAS LEFT ALONE IN THE PAST WEEK?If ‘no’, write down 00 Number of times __
BREASTFEEDING BFBF1. WAS (name) EVER BREASTFED? Yes 1
No 2 2 BF3DK 8 8 BF3
BF2. IS THE BABY STILL BREASTFED? Yes 1No 2DK 8
BF3. WAS ANY OF THE BELOW GIVEN TO THE CHILD SINCE THE SAME HOUR YESTERDAY:Name loudly each product and write down the answer be-fore going to the next item. Yes No DKBF3A. VITAMINS, MINERAL SUPPLEMENTS OR MEDICINES?
A. Vitamins, mineral supple-ments or medicines
1 2 8
BF3B. PLAIN WATER? B. Plain water 1 2 8BF3C. SWEETENED, AROMATIZED WATER OR FRUIT JUICE, TEA OR EXTRACT?
C. Sweetened water, tea or juice 1 2 8
BF3D. ORAL REHYDRATION SOLUTION (ORS)? D. ORS (oral rehydration solution) 1 2 8BF3E. INFANT FORMULA? E. Infant formula 1 2 8BF3F. TINNED, POWDER OR FRESH MILK? F. Milk and diary products 1 2 8BF3G. OTHER FLUIDS? G. Other fluids (soup, broth) 1 2 8BF3H. SOLID/SEMI-SOLID (SHABBY) FOOD? H. Solid/semi-solid (shabby) food 1 2 8BF4. Check BF3H: WAS THE CHILD RECEIVING SOLID/SEMI-SOLID (SHABBY) FOOD? Yes. Go to BF5 No or DK. Go to the next ModuleBF5. SINCE THE SAME HOUR YESTERDAY, HOW MANY TIMES (name) RECEIVED SOLID/SEMI-SOLID (SHABBY) FOOD, EXCLUDING FLUIDS?If 7 or more times, write own ‘7’.
Number of times ___DK 8
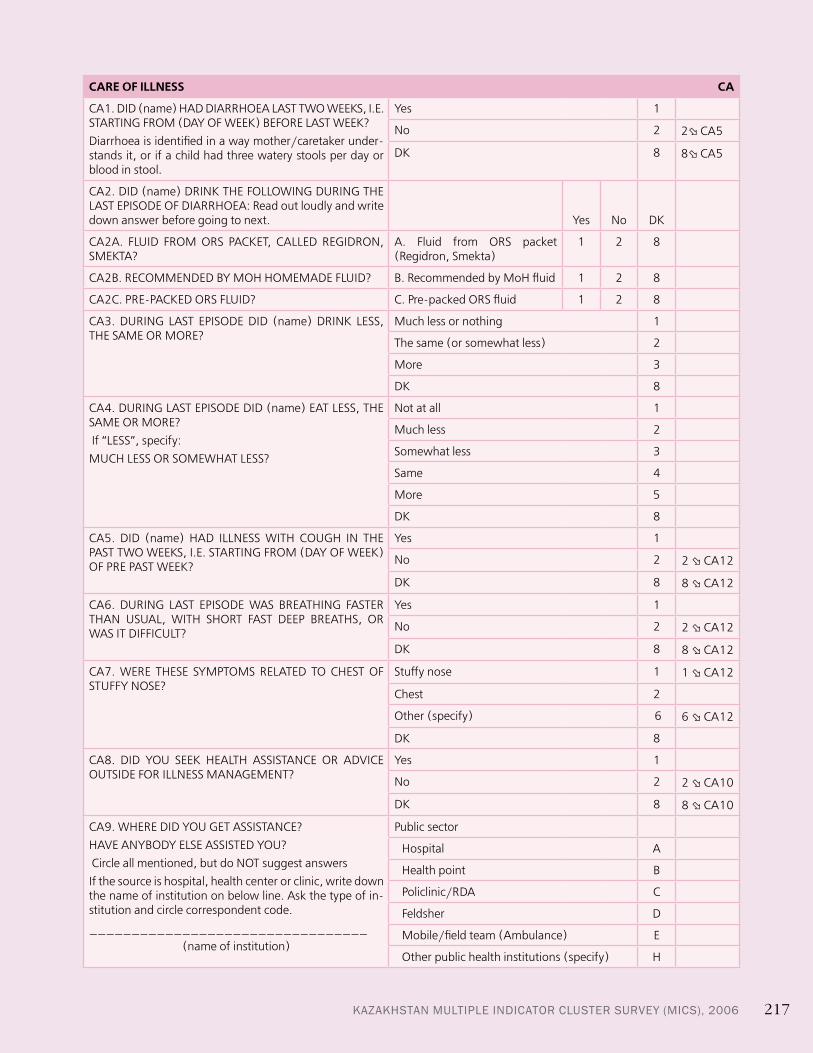
KAZAKHSTAN MULTIPLE INDICATOR CLUSTER SURVEY (MICS), 2006 217
CARE OF ILLNESS CA
CA1. DID (name) HAD DIARRHOEA LAST TWO WEEKS, I.E. STARTING FROM (DAY OF WEEK) BEFORE LAST WEEK?Diarrhoea is identified in a way mother/caretaker under-stands it, or if a child had three watery stools per day or blood in stool.
Yes 1
No 2 2 CA5
DK 8 8 CA5
CA2. DID (name) DRINK THE FOLLOWING DURING THE LAST EPISODE OF DIARRHOEA: Read out loudly and write down answer before going to next. Yes No DK
CA2A. FLUID FROM ORS PACKET, CALLED REGIDRON, SMEKTA?
A. Fluid from ORS packet (Regidron, Smekta)
1 2 8
CA2B. RECOMMENDED BY MOH HOMEMADE FLUID? B. Recommended by MoH fluid 1 2 8
CA2C. PRE-PACKED ORS FLUID? C. Pre-packed ORS fluid 1 2 8
CA3. DURING LAST EPISODE DID (name) DRINK LESS, THE SAME OR MORE?
Much less or nothing 1
The same (or somewhat less) 2
More 3
DK 8
CA4. DURING LAST EPISODE DID (name) EAT LESS, THE SAME OR MORE? If “LESS”, specify:MUCH LESS OR SOMEWHAT LESS?
Not at all 1
Much less 2
Somewhat less 3
Same 4
More 5
DK 8
CA5. DID (name) HAD ILLNESS WITH COUGH IN THE PAST TWO WEEKS, I.E. STARTING FROM (DAY OF WEEK) OF PRE PAST WEEK?
Yes 1
No 2 2 CA12
DK 8 8 CA12
CA6. DURING LAST EPISODE WAS BREATHING FASTER THAN USUAL, WITH SHORT FAST DEEP BREATHS, OR WAS IT DIFFICULT?
Yes 1
No 2 2 CA12
DK 8 8 CA12
CA7. WERE THESE SYMPTOMS RELATED TO CHEST OF STUFFY NOSE?
Stuffy nose 1 1 CA12
Chest 2
Other (specify) 6 6 CA12
DK 8
CA8. DID YOU SEEK HEALTH ASSISTANCE OR ADVICE OUTSIDE FOR ILLNESS MANAGEMENT?
Yes 1
No 2 2 CA10
DK 8 8 CA10
CA9. WHERE DID YOU GET ASSISTANCE?HAVE ANYBODY ELSE ASSISTED YOU? Circle all mentioned, but do NOT suggest answersIf the source is hospital, health center or clinic, write down the name of institution on below line. Ask the type of in-stitution and circle correspondent code. _________________________________
(name of institution)
Public sector
Hospital A
Health point B
Policlinic/RDA C
Feldsher D
Mobile/field team (Ambulance) E
Other public health institutions (specify) H
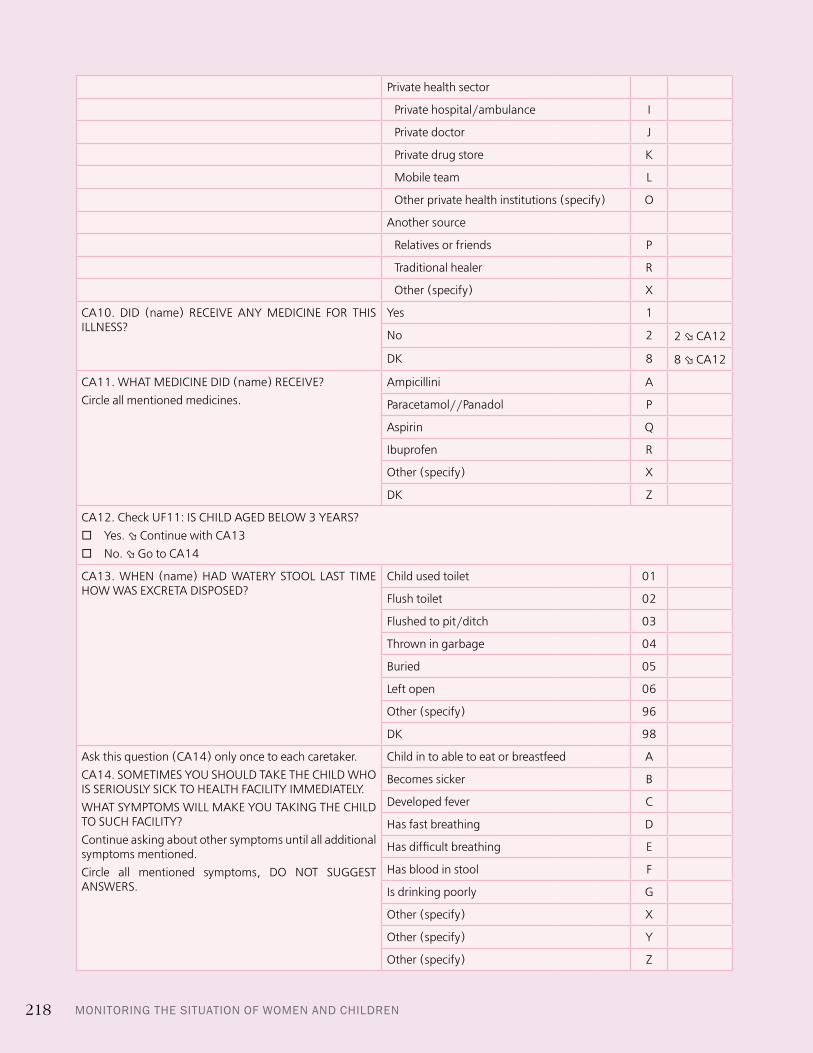
MONITORING THE SITUATION OF WOMEN AND CHILDREN218
Private health sector
Private hospital/ambulance I
Private doctor J
Private drug store K
Mobile team L
Other private health institutions (specify) O
Another source
Relatives or friends P
Traditional healer R
Other (specify) X
CA10. DID (name) RECEIVE ANY MEDICINE FOR THIS ILLNESS?
Yes 1
No 2 2 CA12
DK 8 8 CA12
CA11. WHAT MEDICINE DID (name) RECEIVE?Circle all mentioned medicines.
Ampicillini A
Paracetamol//Panadol P
Aspirin Q
Ibuprofen R
Other (specify) X
DK Z
CA12. Check UF11: IS CHILD AGED BELOW 3 YEARS? Yes. Continue with CA13 No. Go to CA14
CA13. WHEN (name) HAD WATERY STOOL LAST TIME HOW WAS EXCRETA DISPOSED?
Child used toilet 01
Flush toilet 02
Flushed to pit/ditch 03
Thrown in garbage 04
Buried 05
Left open 06
Other (specify) 96
DK 98
Ask this question (CA14) only once to each caretaker. CA14. SOMETIMES YOU SHOULD TAKE THE CHILD WHO IS SERIOUSLY SICK TO HEALTH FACILITY IMMEDIATELY.WHAT SYMPTOMS WILL MAKE YOU TAKING THE CHILD TO SUCH FACILITY?Continue asking about other symptoms until all additional symptoms mentioned.Circle all mentioned symptoms, DO NOT SUGGEST ANSWERS.
Child in to able to eat or breastfeed A
Becomes sicker B
Developed fever C
Has fast breathing D
Has difficult breathing E
Has blood in stool F
Is drinking poorly G
Other (specify) X
Other (specify) Y
Other (specify) Z

KAZAKHSTAN MULTIPLE INDICATOR CLUSTER SURVEY (MICS), 2006 219
IMMUNIZATION IM
If the child has immunization card, copy from IM2- IM6 dates of immunization given in the card.IM10- IM17 cover vaccination not in the card.IM10- IM17 should be asked if child has no immunization card.
IM1. DO YOU HAVE IMMUNIZATION CARD FOR (name)? Yes, presented 1
No, not presented 2 2 IM10
No 3 3 IM10
A. Copy dates of every vaccination from card.B. Put ‘44’ in the ‘Day” column if date of vaccination is not avail-able, but there is note about vaccination.
Date of immunization
DAY MONTH YEAR
IM2. BCG (TUBERCULOSIS) BCG
IM3A. POLIO 2 (POLIOMYELITIS) POLIO 2
IM3B. POLIO 1 ((POLIOMYELITIS) POLIO 1
IM3C. POLIO 2 ((POLIOMYELITIS) POLIO 2
IM3D. POLIO 3 ((POLIOMYELITIS) POLIO 3
IM4A. DPT1 (PERTUSIS, DIPHTHERIA, TETANUS) DPT 1
IM4B. DPT2 (PERTUSIS, DIPHTHERIA, TETANUS) DPT 2
IM4C. DPT3 (PERTUSIS, DIPHTHERIA, TETANUS) DPT 3
IM5A. HEP B1 (OR DPTHEPB 1) (DPT)H1
IM5B. HEP B2 (OR DPTHEPB 2) (DPT)H 2
IM5C. HEP (OR DPTHEPB 3) (DPT)H 3
IM6. MEASLES (OR MUMPS) MEASLES
IM6.1. MMR (MEASLES, MUMPS, RUBELLA) MMR
IM9. IN ADDITION TO VACCINES MENTIONED IN THE CARD, DID (name) RECEIVE ANY OTHER VACCINATION INCLUDING THOSE DURING NATIONAL DAYS OF IMMUNIZATION? Write down ‘Yes’ only if respondent names BCG, Polio 0-3, DPT 1-3, and/or Hep B 1-3, Measles
Yes (Continue asking about vac-cines and put ’66’ in correspond-ent column ‘Day’ in IM2 – IM6B.)
1 1 IM20
No 2 2 IM20
DK 8 8 IM20
IM10. WAS (name) VACCINATED AGAINST DISEASES, INCLUDING VACCINATION DURING NATIONAL IMMUNIZATION DAYS?
Yes 1
No 2 2 IM20
DK 8 8 IM20
IM11. HAS (name) EVER RECEIVED BCG AGAINST TUBERCULOSIS, WHICH IS INJECTED INTO THE LEFT SHOULDER LEAVING SCAR?
Yes 1
No 2
DK 8
IM12. HAS (name) EVER RECEIVED “VACCINE IN A FORM OF DROPS” TO PREVENT POLIOMYELITIS?
Yes 1
No 2 2 IM15
DK 8 8 IM15

MONITORING THE SITUATION OF WOMEN AND CHILDREN220
IM13. DID THE BABY RECEIVE THESE DROPS IMMEDIATELY AFTER BIRTH (WITHIN 2 WEEKS) OR LATER?
Immediately after birth (within 2 weeks) 1
Later 2
DK 8 8 IM15
IM14. HOW MANY TIMES DID (S)HE RECEIVE DROPS? Number of times __
DK 8
IM15. DID (name) RECEIVE DPT VACCINE INJECTION INTO HIP OR BUTTOCK TO PREVENT TETANUS, PERTUSIS AND DIPHTHERIA? (SOMETIMES THESE VACCINES ARE ADMINISTERED ALONG WITH POLIO VACCINE)
Yes 1
No 2 2 IM17
DK 8 8 IM17
IM16. HOW MANY TIMES? Number of times __ __
DK 8
IM17. DID (name) EVER RECEIVE “INJECTION OF MEASLES VACCINE”, MEANS, INJECTION INTO ARM AT THE AGE OF 9 MONTHS AND OLDER TO PREVENT MEASLES?
Yes 1
No 2
DK 8
IM20. IS THERE ANY OTHER CHILD LIVING IN THE HOUSEHOLD UNDER CARE OF RESPONDENT?Check Household Listing, column HL8. Yes. Complete this questionnaire, thenGo to UNDER-5 QUESTIONNAIRE for another child. No. Complete interview with respondent thanking for help.If this is the last child in interviewed household go to ANTHROPOMETRY MODULE.
ANTHROPOMETRY AN
After competing questionnaires for all children, weight and measure each child.Write down weight and height, check accuracy of notes. Check name and serial number with the Household Listing before recording measures.
AN1. Weight of child Kilograms (kg)
AN2. HEIGHT OF CHILDCheck age of child in UF11: Child < 2 years. Measure height (when lying). Child 2 years +. Measure height (standing). Height (cm) Lying 1
Height (cm) Standing 2
AN3. Identification code of person taken measures. Code __ __
AN4. RESULT. Measured 1
Missing 2
Refused 3
Other (specify) 6
AN5. IS THERE ANOTHER ELIGIBLE CHILD IN THE FAMILY? Yes. Write down measures for the next child. No. Finish interview with household. Thank all participants for their assistance.Collect all questionnaires of this household and make sure identification numbers are available on the top of each pageWrite down the number of completed interviews in the Household Characteristics Module.