Chapter 2, Existing Ecological Conditions - State Water Board
145
Chapter 2 1 Existing Ecological Conditions 2 3 Contents 4 Chapter 2 Existing Ecological Conditions ........................................................................................... 2-1 5 2.1 Introduction............................................................................................................................ 2-1 6 2.2 Historical Conditions .............................................................................................................. 2-1 7 2.2.1 Hydrologic and Geomorphic Conditions....................................................................... 2-1 8 2.2.2 Biological Conditions .................................................................................................... 2-5 9 2.3 Existing Ecological Conditions ................................................................................................ 2-6 10 2.3.1 Data Sources and Natural Community Classification ................................................... 2-6 11 2.3.1.1 Data Sources .......................................................................................................... 2-6 12 2.3.1.2 Vegetation Dataset Sources for the Legal Delta .................................................... 2-8 13 2.3.1.3 Vegetation Dataset Sources for Suisun Marsh ...................................................... 2-9 14 2.3.1.4 Vegetation Dataset Sources for the Upper Yolo Bypass ...................................... 2-10 15 2.3.1.5 Vernal Pool Complex Dataset Development ........................................................ 2-10 16 2.3.1.6 Natural Community Classification in the Expanded Plan Area ............................ 2-10 17 2.3.2 Ecosystem Processes .................................................................................................. 2-11 18 2.3.2.1 Aquatic Ecosystem Processes .............................................................................. 2-11 19 2.3.2.2 Terrestrial Ecosystem Processes .......................................................................... 2-18 20 2.3.3 Physical Environment ................................................................................................. 2-19 21 2.3.3.1 Geomorphic Setting ............................................................................................. 2-19 22 2.3.3.2 Climate ................................................................................................................. 2-24 23 2.3.3.3 Hydrologic Conditions .......................................................................................... 2-25 24 2.3.3.4 Non-Water Supply Plan Area Infrastructure and Uses ........................................ 2-30 25 2.3.4 Natural Communities.................................................................................................. 2-30 26 2.3.4.1 Tidal Perennial Aquatic ........................................................................................ 2-37 27 2.3.4.2 Tidal Mudflat ........................................................................................................ 2-44 28 2.3.4.3 Tidal Brackish Emergent Wetland ........................................................................ 2-46 29 2.3.4.4 Tidal Freshwater Emergent Wetland ................................................................... 2-52 30 2.3.4.5 Valley/Foothill Riparian ........................................................................................ 2-56 31 2.3.4.6 Nontidal Perennial Aquatic .................................................................................. 2-62 32 2.3.4.7 Nontidal Freshwater Perennial Emergent Wetland ............................................. 2-65 33 2.3.4.8 Alkali Seasonal Wetland Complex ........................................................................ 2-68 34 2.3.4.9 Vernal Pool Complex ............................................................................................ 2-71 35 2.3.4.10 Managed Wetland................................................................................................ 2-76 36 2.3.4.11 Other Natural Seasonal Wetland ......................................................................... 2-82 37 2.3.4.12 Grassland.............................................................................................................. 2-83 38 2.3.4.13 Inland Dune Scrub ................................................................................................ 2-88 39 2.3.4.14 Cultivated Lands ................................................................................................... 2-91 40 2.4 Biological Diversity ............................................................................................................... 2-99 41 2.5 References Cited ................................................................................................................ 2-100 42 2.5.1 Literature Cited ......................................................................................................... 2-100 43 2.5.2 Personal Communications ........................................................................................ 2-124 44 Bay Delta Conservation Plan Public Draft 2-i November 2013 ICF 00343.12
-
Upload
khangminh22 -
Category
Documents
-
view
1 -
download
0
Transcript of Chapter 2, Existing Ecological Conditions - State Water Board
Chapter 2 1
Existing Ecological Conditions 2
3 Contents 4
Chapter 2 Existing Ecological Conditions ........................................................................................... 2-1 5 2.1 Introduction ............................................................................................................................ 2-1 6 2.2 Historical Conditions .............................................................................................................. 2-1 7
2.2.1 Hydrologic and Geomorphic Conditions....................................................................... 2-1 8 2.2.2 Biological Conditions .................................................................................................... 2-5 9
2.3 Existing Ecological Conditions ................................................................................................ 2-6 10 2.3.1 Data Sources and Natural Community Classification ................................................... 2-6 11
2.3.1.1 Data Sources .......................................................................................................... 2-6 12 2.3.1.2 Vegetation Dataset Sources for the Legal Delta .................................................... 2-8 13 2.3.1.3 Vegetation Dataset Sources for Suisun Marsh ...................................................... 2-9 14 2.3.1.4 Vegetation Dataset Sources for the Upper Yolo Bypass ...................................... 2-10 15 2.3.1.5 Vernal Pool Complex Dataset Development ........................................................ 2-10 16 2.3.1.6 Natural Community Classification in the Expanded Plan Area ............................ 2-10 17
2.3.2 Ecosystem Processes .................................................................................................. 2-11 18 2.3.2.1 Aquatic Ecosystem Processes .............................................................................. 2-11 19 2.3.2.2 Terrestrial Ecosystem Processes .......................................................................... 2-18 20
2.3.3 Physical Environment ................................................................................................. 2-19 21 2.3.3.1 Geomorphic Setting ............................................................................................. 2-19 22 2.3.3.2 Climate ................................................................................................................. 2-24 23 2.3.3.3 Hydrologic Conditions .......................................................................................... 2-25 24 2.3.3.4 Non-Water Supply Plan Area Infrastructure and Uses ........................................ 2-30 25
2.3.4 Natural Communities .................................................................................................. 2-30 26 2.3.4.1 Tidal Perennial Aquatic ........................................................................................ 2-37 27 2.3.4.2 Tidal Mudflat ........................................................................................................ 2-44 28 2.3.4.3 Tidal Brackish Emergent Wetland ........................................................................ 2-46 29 2.3.4.4 Tidal Freshwater Emergent Wetland ................................................................... 2-52 30 2.3.4.5 Valley/Foothill Riparian ........................................................................................ 2-56 31 2.3.4.6 Nontidal Perennial Aquatic .................................................................................. 2-62 32 2.3.4.7 Nontidal Freshwater Perennial Emergent Wetland ............................................. 2-65 33 2.3.4.8 Alkali Seasonal Wetland Complex ........................................................................ 2-68 34 2.3.4.9 Vernal Pool Complex ............................................................................................ 2-71 35 2.3.4.10 Managed Wetland................................................................................................ 2-76 36 2.3.4.11 Other Natural Seasonal Wetland ......................................................................... 2-82 37 2.3.4.12 Grassland .............................................................................................................. 2-83 38 2.3.4.13 Inland Dune Scrub ................................................................................................ 2-88 39 2.3.4.14 Cultivated Lands ................................................................................................... 2-91 40
2.4 Biological Diversity ............................................................................................................... 2-99 41 2.5 References Cited ................................................................................................................ 2-100 42
2.5.1 Literature Cited ......................................................................................................... 2-100 43 2.5.2 Personal Communications ........................................................................................ 2-124 44
Bay Delta Conservation Plan Public Draft 2-i November 2013
ICF 00343.12

Contents
Chapter 2
Tables 1
2-1 Spatial Data Sources ............................................................................................................... 2-7 2 2-2 EcoAtlas Land Use Classifications of Suisun Marsh and Equivalent Natural 3
Community Type .................................................................................................................. 2-10 4 2-3 Extent of Natural Communities in the Plan Area ................................................................. 2-31 5 2-4 Covered Species that Are Present In or Are Supported By the Natural Communities 6
of the Plan Area .................................................................................................................... 2-32 7 2-5 Map Classifications in the Tidal Perennial Aquatic Natural Community in the Plan 8
Area ...................................................................................................................................... 2-38 9 2-6 Native and Nonnative Fish Species Found in the Plan Area ................................................. 2-39 10 2-7 Map Classifications in Tidal Brackish Emergent Wetland Natural Community in the 11
Plan Area .............................................................................................................................. 2-46 12 2-8 Map Classifications in the Tidal Freshwater Emergent Wetland Natural Community 13
in the Plan Area .................................................................................................................... 2-52 14 2-9 Map Classifications in the Valley/Foothill Riparian Natural Community in the Plan 15
Area ...................................................................................................................................... 2-57 16 2-10 Map Classifications in the Nontidal Perennial Aquatic Natural Community in the Plan 17
Area ...................................................................................................................................... 2-63 18 2-11 Map Classifications in the Nontidal Freshwater Perennial Emergent Wetland Natural 19
Community in the Plan Area ................................................................................................ 2-66 20 2-12 Map Classifications in the Alkali Seasonal Wetland Complex Natural Community in 21
the Plan rea .......................................................................................................................... 2-69 22 2-13 Map Classifications in the Vernal Pool Complex Natural Community in the Plan Area ....... 2-72 23 2-14 Map Classifications in the Managed Wetland Natural Community in the Plan Area .......... 2-77 24 2-15 Map Classifications in the Other Natural Seasonal Wetland Natural Community in 25
the Plan Area ........................................................................................................................ 2-82 26 2-16 Map Classifications in the Grassland Natural Community in the Plan Area ........................ 2-86 27 2-17 Map Classifications in the Inland Dune Scrub Natural Community in the Plan Area ........... 2-90 28 2-18 Map Classifications in the Cultivated Lands in the Plan Area .............................................. 2-93 29 2-19 Acreages of Cultivated Land Categories in the Plan Area .................................................... 2-96 30 2-20 Number of Vertebrate and Vascular Plant Species Present in the Plan Area 31
Compared with Number in California ................................................................................ 2-100 32
Bay Delta Conservation Plan Public Draft 2-ii November 2013
ICF 00343.12

Contents
Chapter 2
Figures 1
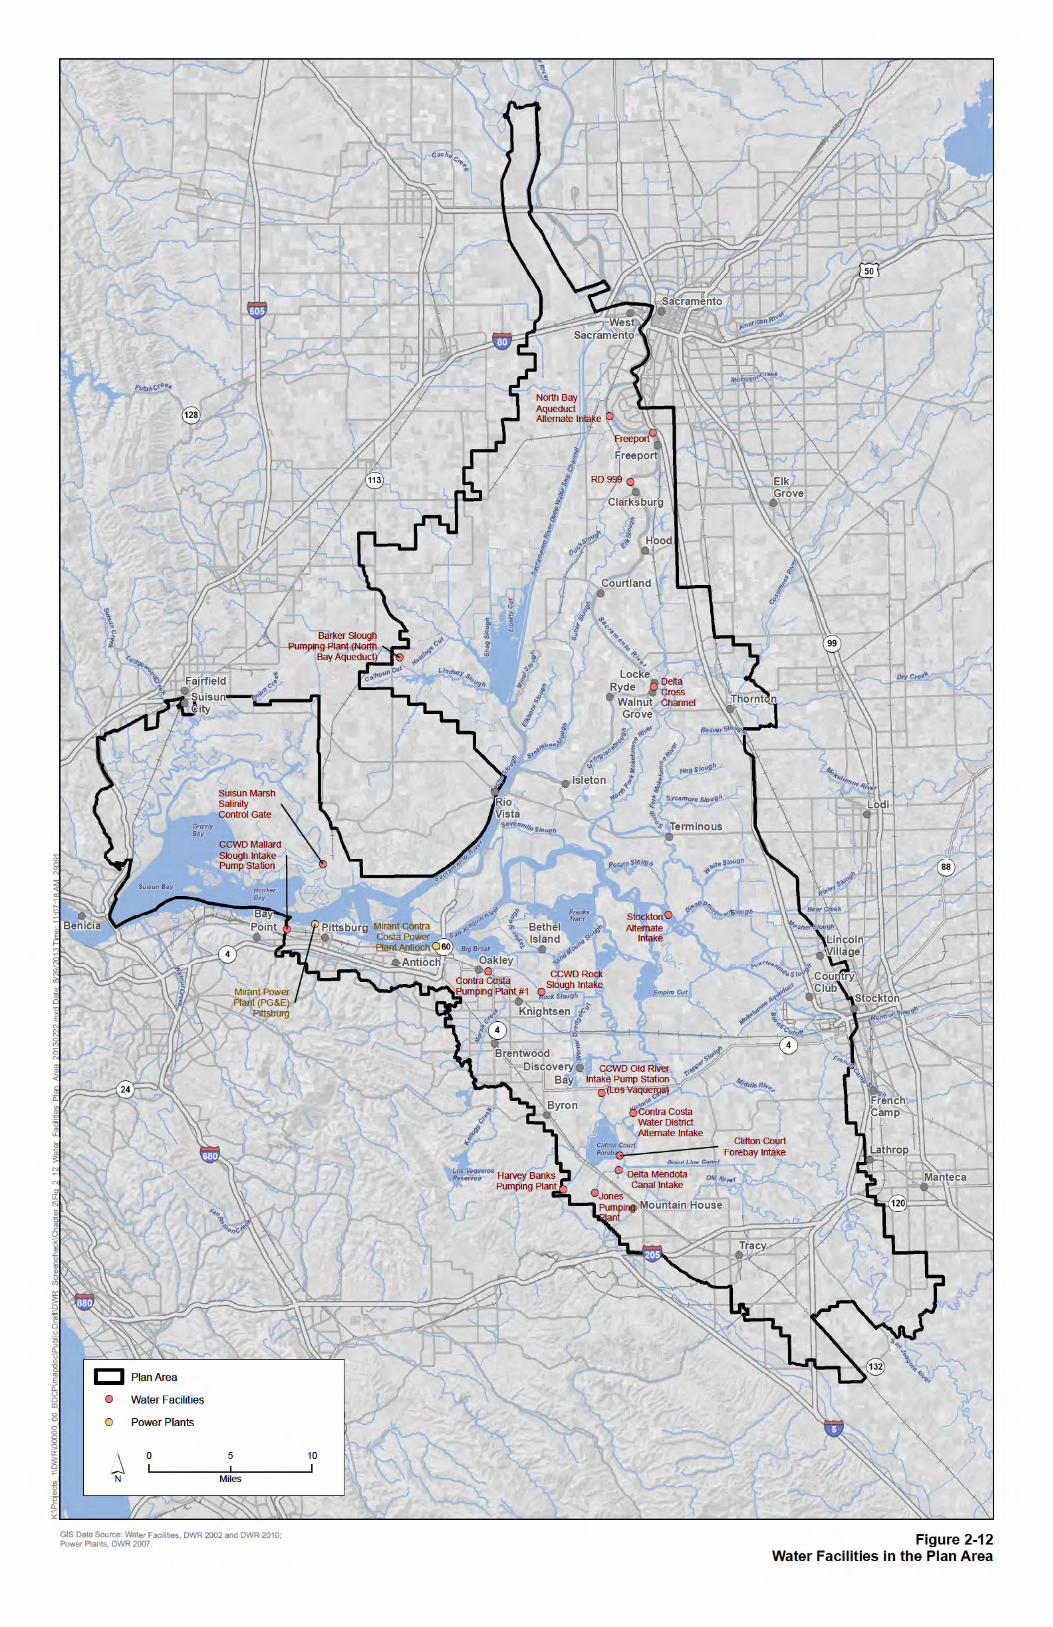
All figures appear at the end of the chapter. 2 2-1a Land Cover Change in the Delta between the Early 1800s and Early 2000s 3 2-1b Land Cover Change in the Delta between the Early 1800s and Early 2000s 4 2-2 Ecosystem Processes in the Delta 5 2-3 Geology of the Plan Area 6 2-4 Soil Types of the Plan Area 7 2-5 Bathymetry and Elevation Data 8 2-6 Major California Waterways Influencing the Plan Area 9 2-7 Example Delta Water Balance for 1998 Water Year, a Wet Water Year—All Inflow and 10
Outflow Values Represent Unimpaired Flows 11 2-8 Example Delta Water Balance for 2000 Water Year, an Above Normal Water Year—All Inflow 12
and Outflow Values Represent Unimpaired Flows 13 2-9 Example Delta Water Balance for 2001 Water Year, a Dry Water Year—All Inflow and 14
Outflow Values Represent Unimpaired Flows 15 2-10 Average Monthly Flow Rates in San Joaquin, Mokelumne and Cosumnes, and Sacramento 16
Rivers by Water Year Type between 1956 and 2006 17 2-11 Yolo Bypass Intakes and Effluents 18 2-12 Water Facilities in the Plan Area 19 2-13 Infrastructure in the Plan Area 20 2-14 Distribution of Natural Communities and Urban Land Cover in the Plan Area 21 2-15 Generalized Schematic of Valley/Foothill Riparian, Tidal Freshwater Emergent Wetland, and 22
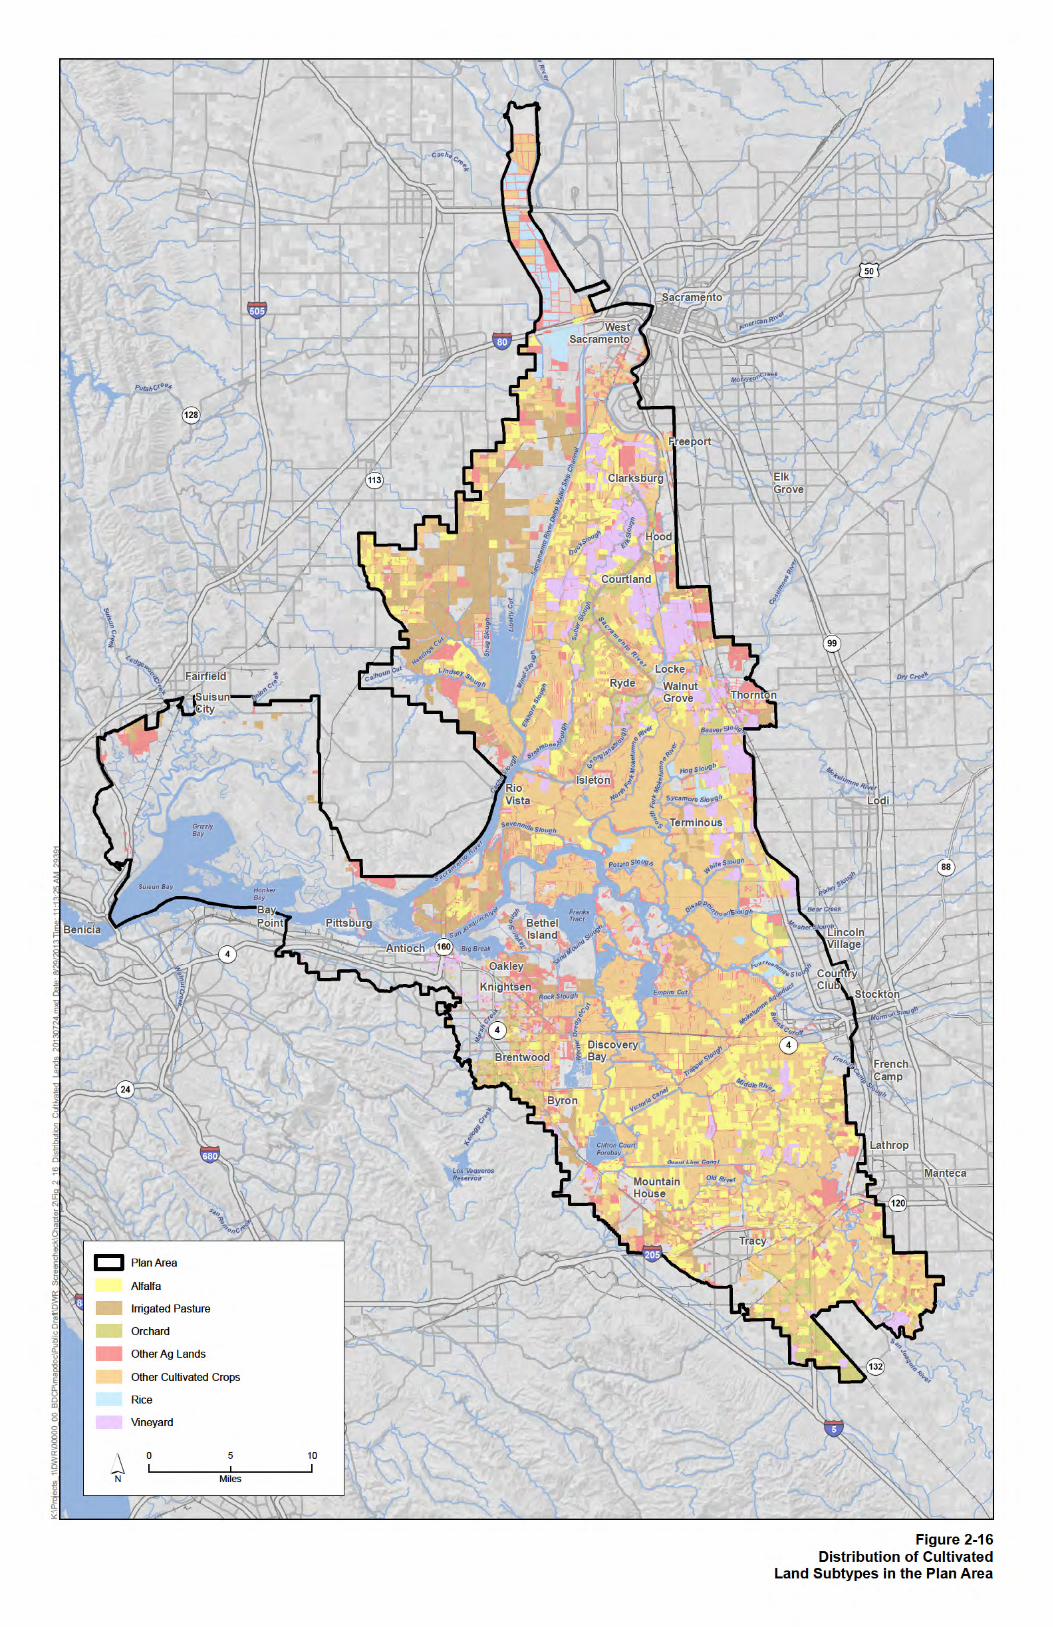
Tidal Perennial Aquatic Natural Communities 23 2-16 Distribution of Cultivated Land Subtypes in the Plan Area 24
Bay Delta Conservation Plan Public Draft 2-iii November 2013
ICF 00343.12

Contents
Chapter 2
Acronyms and Abbreviations 1
°C degrees Celsius °F degrees Fahrenheit af acre-feet BDCP or the Plan Bay Delta Conservation Plan BiOp biological opinion CDFW California Department of Fish and Wildlife Central Valley Water Board Central Valley Regional Water Quality Control Board cfs cubic feet per second CNPS California Native Plant Society CVP Central Valley Project DPS distinct population segment DRERIP Delta Regional Ecosystem Restoration Implementation Plan DWR California Department of Water Resources ESA Endangered Species Act GIS geographic information system LiDAR Light Detection and Ranging LSZ low-salinity zone mg/L milligrams per liter MHHW mean higher high water MLLW mean lower low water MMU minimum mapping units NAIP National Agriculture Imagery Program NCCPA California Natural Community Conservation Planning Act NWR National Wildlife Refuge PG&E Pacific Gas and Electric POD pelagic organism decline ppt parts per thousand Reclamation Bureau of Reclamation SAIC Science Applications International Corporation SR State Route SWP State Water Project TMDL total maximum daily load USACE U.S. Army Corps of Engineers USFWS U.S. Fish and Wildlife Service USGS U.S. Geological Survey 2
Bay Delta Conservation Plan Public Draft 2-iv November 2013
ICF 00343.12

Chapter 2 1
Existing Ecological Conditions 2
2.1 Introduction 3
This chapter describes the existing ecological conditions present in the Bay Delta Conservation Plan 4 (BDCP or the Plan) Plan Area, including specific information to meet the requirements of the federal 5 Endangered Species Act (ESA) and the California Natural Community Conservation Planning Act 6 (NCCPA). The Plan Area encompasses approximately 862,703 acres, and includes the statutory Delta 7 as defined in the California Water Code, Section 12220, Suisun Marsh (approximately 8 107,837 acres), and the upper Yolo Bypass (approximately 16,762 acres) (Figure 1-1, Plan Area 9 Location, in Chapter 1, Introduction). 10
Section 2.2, Historical Conditions, provides a brief summary of the physical and biological conditions 11 that were historically present within the Plan Area, as well as historical conditions upstream and 12 downstream of the Delta as they relate to supporting conditions of the historical Delta. Current 13 physical and biological conditions of the Plan Area are described in Section 2.3, Existing Ecological 14 Conditions, which provides descriptions of natural processes in the Plan Area, its physical 15 environment, and its biological communities. Section 2.4, Biological Diversity, provides a summary of 16 the biological diversity within the Plan Area. 17
A total of 56 species are proposed for coverage under the BDCP. Detailed information about each of 18 these species is provided in Appendix 2.A, Covered Species Accounts, including life-history 19 characteristics, historical and current distribution, designated critical habitat, essential habitat, and 20 key stressors that affect species distribution and abundance. 21
The ecological information presented in this chapter and in Appendix 2.A support the evaluation of 22 the potential effects of covered activities on proposed covered species and natural communities and 23 for the development of measures to address the conservation of covered species and natural 24 communities. 25
2.2 Historical Conditions 26
This section provides a brief overview of historical physical and biological environmental conditions 27 of the Plan Area and environmental conditions present upstream and downstream of the Plan Area 28 as they relate to supporting the description of conditions within the Plan Area. 29
2.2.1 Hydrologic and Geomorphic Conditions 30
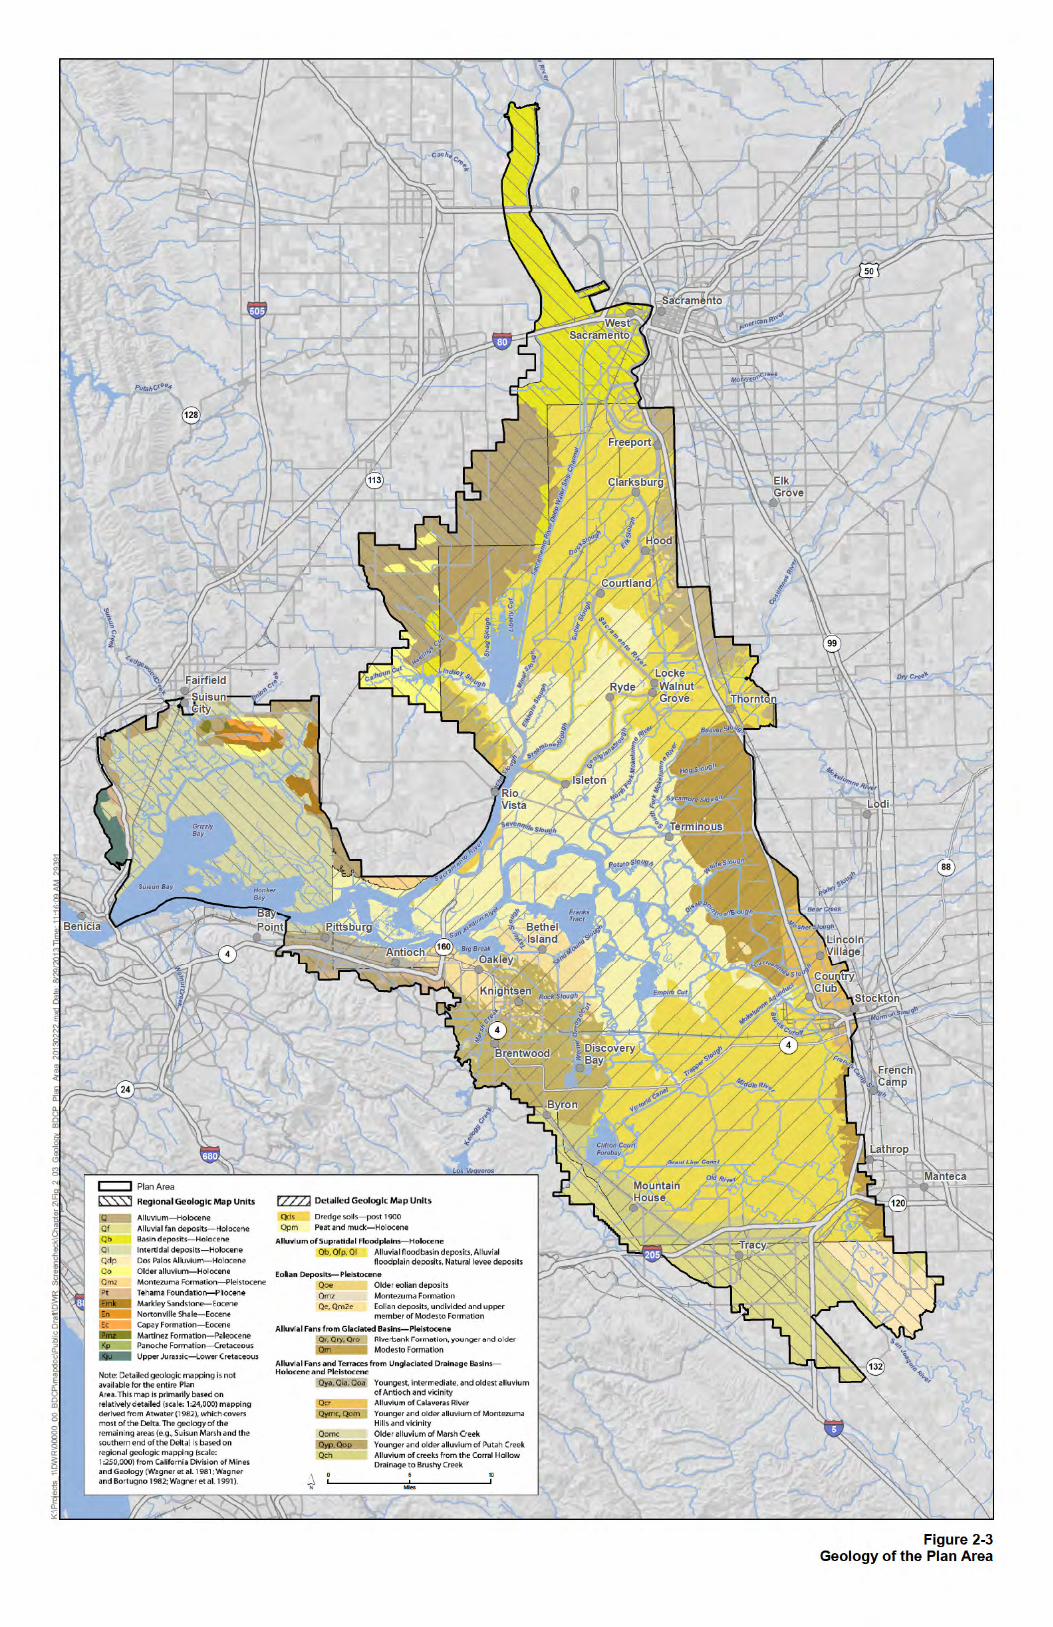
Much of the broad scale geology of the Central Valley, Delta, and Suisun Marsh was formed before 31 the Pleistocene epoch (more than 2 million years ago), while finer details wrought by younger 32 geologic formations, including the recent uplift and movement of the Coast Range and the deposition 33 of broad alluvial fans along both sides of the Central Valley, formed during the Pleistocene epoch 34 from 2 million to 15,000 years ago (Loudeback 1951; Olmsted and Davis 1961; Lydon 1968, 35 Shelmon 1971; Atwater et al. 1979; Marchandt and Allwardt 1981; Helley and Harwood 1985; 36
Bay Delta Conservation Plan Public Draft 2-1 November 2013
ICF 00343.12

Existing Ecological Conditions
Chapter 2
Sarna-Wojcicki et al. 1985; Weber-Band 1998; Unruh and Hector 1999; Graymer et al. 2002; 1 Weissmann et al. 2005; Unruh and Hitchcock 2009). Approximately 21,000 years ago, the last glacial 2 maximum ended and the eustatic (worldwide) sea level began to rise from the lowstand (lowest sea 3 level bathymetric position or depth during a geologic time) of -394 feet (-120 meters) in a series of 4 large meltwater pulses interspersed by periods of constant rising elevation. The rise continued until 5 the Laurentide ice sheet had completely melted 6,500 years ago and the rate of sea level rise slowed 6 dramatically (Edwards 2006; Peltier and Fairbanks 2006). During this change from glacial to 7 interglacial period, runoff brought enormous quantities of sediment from the Sierra Nevada and 8 Coast Range that formed alluvial fans and altered stream channels in the Central Valley (Olmsted 9 and Davis 1961; Shelmon 1971; Marchandt and Allwardt 1981; Helley and Harwood 1985; 10 Weissmann et al. 2005). 11
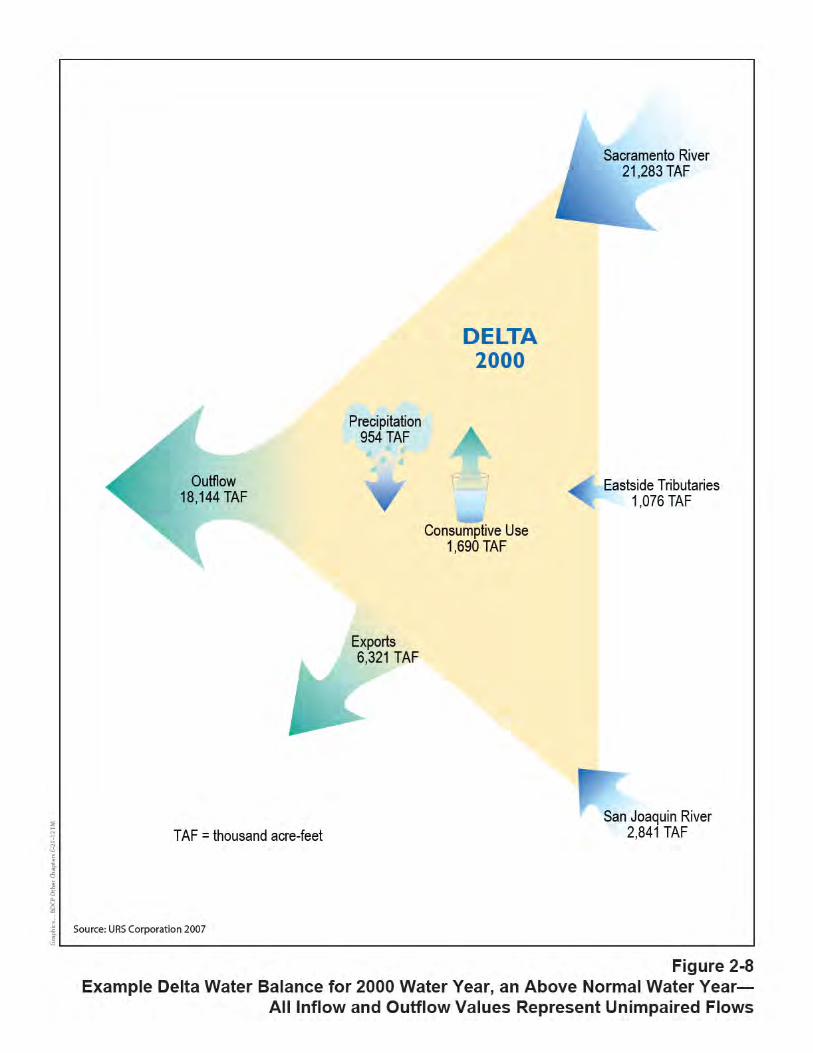
The modern Delta formed sometime between 10,000 and 6,000 years ago when the rising sea level 12 inundated a broad valley that occupied the Plan Area region. Despite its name, the Sacramento-San 13 Joaquin Delta is not simply the merging of two river deltas, but is instead an elongated and complex 14 network of deltas and flood basins with flow sources that include Cache Creek, Putah Creek, 15 Sacramento River, Mokelumne River, San Joaquin River, and Marsh Creek. Based on current 16 unimpaired flow estimates, the Sacramento River is the largest source of flows and has contributed 17 an average of 73% of historical inflows into the Delta. The eastside tributaries, including the 18 Mokelumne River, contribute about 6%, and the San Joaquin River contributes 21% (California 19 Department of Water Resources 2007a). 20
Currently, during high-flow events, approximately 80% of flows from the Sacramento River pass 21 through the Yolo Bypass (Roos 2006). The flood stage flows can have many sources, including direct 22 flows from tributaries such as the Feather and American Rivers, as well as through a system of 23 passive and active weirs (James and Singer 2008; Singer et al. 2008; Singer and Aalto 2009). The 24 Yolo Bypass also serves as a conduit for Cache Creek and Putah Creek as their waters do not reach 25 the Sacramento River until they pass through Cache Slough at the southern end of the Yolo Bypass. 26 The San Joaquin River discharges into a broad network of sloughs and channels, and the Mokelumne 27 River delta merges with the San Joaquin River delta on the eastern side of the Delta. On the 28 southwest side of the Delta, the Marsh Creek delta merges with the San Joaquin River delta. 29
While flooding has always been a regular occurrence along the Sacramento River (Thompson 1957, 30 1960, 1961, 1965), the natural geomorphic processes and hydrologic regimes were completely 31 disrupted through the enormous increase in sediment and debris supply generated by hydraulic 32 mining operations in the central Sierra Nevada from 1853 to 1884 (Gilbert 1917; Mount 1995). 33 Large volumes of mining sediment remain in the tributaries today (James 2004a, 2004b). The 34 portion of the estimated 1.5 billion cubic feet of sediment that poured into the Sacramento Valley 35 filled river channels and increased flooding severity and peak flows (Gilbert 1917; Kelley 1989; 36 Mount 1995; James 2004a; Hitchcock et al. 2005; William Lettis & Associates 2005; James 2006; 37 Central Valley Regional Water Quality Control Board 2008; James and Singer 2008; James et al. 38 2009). In the 1900s, another pulse of mining sediment was discharged into the Sacramento River 39 watershed (James 1999). While it is often assumed the mining sediment has already passed through 40 the Delta or is stored behind dams, large amounts remain within the system (James 1999, 2004a, 41 2004b, 2006; James and Singer 2008; James et al. 2009). Other Central Valley streams, such as the 42 Cosumnes River, have been affected to a lesser extent by similar mining or agriculture-derived 43 sources of sediment (Florsheim and Mount 2003). The initial pulse of sediment made its way into 44 the San Francisco Estuary where it filled shallow tidal bays, but with current reduced sediment 45
Bay Delta Conservation Plan Public Draft 2-2 November 2013
ICF 00343.12
Existing Ecological Conditions
Chapter 2
loads, these sediments are being eroded and transported into the Pacific Ocean (Cappiella et al. 1 1999; Ganju and Schoellhamer 2010). 2
Soils in the Plan Area are extremely variable in texture and chemical composition. In the interior of 3 the Delta, soils are generally a combination of peat beds in the center of islands with relatively 4 coarse textured inorganic sediments deposited in the channels and along the margins of the islands 5 (William Lettis & Associates 2005; Unruh and Hitchcock 2009; Deverel and Leighton 2010). Ancient 6 dune deposits on the islands and shoreline of the western Delta near the San Joaquin River predate 7 the peat beds (Carpenter and Cosby 1939; San Francisco Estuary Institute 2010). The soils in the 8 Suisun Marsh area are generally peat or fine textured mineral soils in and along the islands closest 9 to Suisun Bay, and fine textured mineral soils are found closer to the border of the marsh where it 10 abuts the uplands. The soils of the Cache Slough area are primarily mineral soils that are either fine-11 textured and of local origin, or coarse-textured material that is a legacy of gold mining in the Sierra 12 Nevada and streams leading from the Sierra Nevada. The uplands north of Suisun Marsh and west of 13 the Sacramento River are generally alkaline clays (Mann et al. 1911; Bryan 1923; Thomasson Jr. et 14 al. 1960; State of California 1987; Graymer et al. 2002). The soils of the Yolo Basin are alkaline clays 15 on the west side, a mixture of clay, sand and peat on the bottom of the basin, and silts with sand 16 splays on the natural levee of the Sacramento River (Anonymous 1870; Mann et al. 1911; Andrews 17 1970). The soils along the southwestern border of the Delta are sands to the north and alkaline clays 18 to the south (Carpenter and Cosby 1939; Natural Resources Conservation Service 2009; San 19 Francisco Estuary Institute 2010). Along the eastern border of the Plan Area, the soils are 20 heterogeneous patches of clays, loams, and peat (Florsheim and Mount 2003; Natural Resources 21 Conservation Service 2009). 22
It is estimated that prior to reclamation actions (filling, levee construction, diking, and draining), 23 nearly 60% of the Delta was inundated by daily tides. The tidal portion of the Delta consisted of 24 backwater areas, tidal sloughs, and a network of channels that supported highly productive 25 freshwater tidal marsh and other wetland habitats (CALFED Bay-Delta Program 2000). Similar 26 complex drainage networks, ponds, and salt panes existed in tidal brackish marshes in Suisun Marsh 27 and along the north shore of east Contra Costa County (Suisun Ecological Workgroup 2001; Brown 28 2004; Grossinger 2004; San Francisco Estuary Institute 2010). The soils in these marshes were 29 generally peat beds that accumulated and were preserved under anoxic conditions. In contrast, soils 30 in channels and along the higher energy channel margins of islands tend to be comprised primarily 31 of mineral sediment (William Lettis & Associates 2005; Unruh and Hitchcock 2009). 32
Reclamation occurred over vast areas in the Delta, Yolo Basin, Suisun Marsh, and the south shore of 33 Suisun Bay between the 1850s and the early 1930s, completely transforming their physical 34 structure (Figure 2-1) (Thompson 1957, 1965; Suisun Ecological Workgroup 2001; Brown 2004; 35 Grossinger 2004; San Francisco Estuary Institute 2010; Whipple et al. 2012). Levee ditches were 36 built to drain land for agriculture, human habitation, mosquito control, and other human uses while 37 channels were straightened, widened, and dredged to improve shipping access to the Central Valley 38 and to improve downstream water conveyance for flood management. During this period, over 39 300,000 acres of tidal marshes in the Delta were diked, drained, and converted to agriculture 40 (Anonymous 2012:4-5). Thus, the complex, shallow, and dendritic marshlands were replaced by 41 simplified, deep, and barren channels. This hydrogeomorphic modification fragmented aquatic and 42 terrestrial habitats, and decreased the value and quantity of available estuarine habitat (Herbold 43 and Vendlinski 2012; Whipple et al. 2012). 44
Bay Delta Conservation Plan Public Draft 2-3 November 2013
ICF 00343.12

Existing Ecological Conditions
Chapter 2
Floodplain includes areas that are inundated by overbank flow during the winter and spring peak 1 flows. Inundation can last for up to several months. In presettlement times, floodplain was arguably 2 one of the most productive natural communities in the Delta and its loss can be linked to the decline 3 of many native Delta species. Reclamation, channel modification for flood control, and water 4 removals for agriculture and export have resulted in a substantial reduction in floodplain areas. 5 Floodplains provide important habitat for rearing, migrating, and adult fish; migratory waterfowl; 6 and terrestrial amphibians, reptiles, and mammals native to the Delta. 7
Under natural conditions, inflows from both the Sacramento and San Joaquin Rivers were much 8 lower from July through November compared to the December to June period (The Bay Institute 9 1998) and in drought periods likely lead to salinity intrusions. This difference was more dramatic in 10 the San Joaquin River. The San Joaquin River has an upper watershed consisting of impermeable 11 granitic rock that does not support dry season groundwater discharge. In contrast, the upper 12 watershed of the Sacramento River is composed of permeable volcanic rock. As a result, 13 groundwater discharge from this volcanic system historically maintained a summer base flow at Red 14 Bluff of approximately 4,000 cubic feet per second (cfs) without which the Sacramento River would 15 have nearly dried up each fall (The Bay Institute 1998). 16
Water diversions in the San Joaquin Valley began earlier than those in the Sacramento Valley; and by 17 1870, flows of the San Joaquin River were significantly reduced (California Department of Water 18 Resources 1931; Jackson and Patterson 1977). Sacramento River diversions, particularly late spring 19 and summer diversions for rice irrigation, increased dramatically from 1912 to 1929. The 20 combination of significant drought periods and increased diversion during the annual low-flow 21 period resulted in an unprecedented salinity intrusion into the Delta in fall 1918 (California 22 Department of Water Resources 1931; Jackson and Patterson 1977; The Bay Institute 1998; Contra 23 Costa Water District 2010). The economic impacts of these diversion-caused saltwater intrusions 24 ultimately led to the creation of the Central Valley Project (CVP) and the construction of dams for the 25 storage and release of fresh water to prevent salinity intrusion (Jackson and Patterson 1977). 26 Construction of dams and diversions on all major rivers contributing to the Delta between the 1930s 27 and 1960s resulted in substantial changes to Delta hydrodynamics (The Bay Institute 1998; Contra 28 Costa Water District 2010). Four dams (Shasta, Oroville, Trinity, and Monticello) in the Sacramento 29 Valley have a storage capacity greater than 1 million acre-feet (af) (12 million af total); an additional 30 four dams (New Melones, Don Pedro, New Exchequer, and Pine Flat) with storage capacity greater 31 than 1 million af (6.5 million af total) drain into the San Joaquin Valley (California Department of 32 Water Resources 1993). 33
The main effect of this upstream water development was the dampening of the seasonal high and 34 low flows into the Plan Area (Contra Costa Water District 2010). Reclamation of the Delta and 35 upstream water development also accentuated salinity intrusions into the Plan Area. Current water 36 management regulations have reduced the annual fluctuations in saltwater intrusion, but have also 37 shifted the boundary between fresh and salt water significantly further into the Delta (Contra Costa 38 Water District 2010). In combination with dam construction, flood management and water 39 operations have greatly transformed the geometry and hydrology of the Delta, as well as for 40 downstream locations including Suisun Bay and Suisun Marsh (Section 2.3.2, Ecosystem Processes). 41
Bay Delta Conservation Plan Public Draft 2-4 November 2013
ICF 00343.12

Existing Ecological Conditions
Chapter 2
2.2.2 Biological Conditions 1
Prior to the Gold Rush era (c. 1850), the predominant vegetation of the Delta consisted of bulrushes 2 and tules (Schoenoplectus1 spp.), which are adapted to the range of salinity present in the Delta from 3 fresh water to as much as 2 parts per thousand (ppt) in the western Delta in the later summer 4 (Thompson 1957; Atwater and Belknap 1980). The area was described as a vast, sea-level swamp 5 with tracts of intertidal wetland and a network of channels of various sizes. The characterization of 6 the historical Delta as a vast tule marsh, however, is an oversimplification from an ecological 7 standpoint, and fails to reflect the considerable habitat complexity and diversity that allowed the 8 Delta ecosystem to support such an unusually rich and diverse native biological community (The 9 Bay Institute 1998). 10
Generally, the current vegetation of the Delta is similar to the historical vegetation, and the 11 vegetation of the tidal freshwater areas of the central Delta down to about 18 inches below mean 12 lower low water (MLLW) falls into two general categories. Tules (generally Schoenoplectus 13 californicus), cattails (Typha spp.), and willows (Salix spp.) dominate the vegetation along the 14 Sacramento River, while throughout the San Joaquin River area of the Delta bulrushes (generally 15 Schoenoplectus acutus), tules, common reed (Phragmites australis), and willows are more often the 16 dominant species (Atwater 1980; Simenstad et al. 2000; Watson 2006; EDAW 2007a; Hickson and 17 Keeler-Wolf 2007; Watson and Byrne 2009). 18
Further west, from about the vicinity of Collinsville, the tidal brackish marsh vegetation is 19 characterized by bulrush, tules, common reed, and cattail (Culberson 2001; Suisun Ecological 20 Workgroup 2001; Watson and Byrne 2009; San Francisco Estuary Institute 2010). These same large 21 species occur as clumps in the tidal channel to the marsh plain transition zone and share that zone 22 with many other species such as saltgrass (Distichlis spicata), Baltic rush (Juncus balticus), and 23 seaside arrowgrass (Triglochin maritima). The borders of the smallest channels (first order channels 24 and mosquito ditches) are also habitat for Suisun thistle (Cirsium hydrophilum var. hydrophilum), 25 which is a covered species. The boundary between the distant edge of the transition zone and marsh 26 plain is gradual as there is very little change in the elevation of the marsh plain; and this is where 27 soft bird’s-beak (Cordylanthus mollis ssp. mollis), a covered species, occurs with pickleweed 28 (Salicornia pacifica, formerly Salicornia virginica or Sarcocornia pacifica), saltgrass, salt marsh 29 dodder (Cuscuta salina), and spearscale (Atriplex triangularis). The marsh plain proper is dominated 30 by a variable mixture of pickleweed and saltgrass. 31
Historically, the perimeter of the Plan Area consisted of tidal and nontidal wetlands and mudflats 32 that merged with upland vegetation types that included nontidal wetlands, meadows, oak savanna, 33 alkali grasslands, vernal pools, and alkali sink scrub. Due to their productivity and heterogeneity, 34 vegetation in the uplands formed complex physical habitats that consisted of herbaceous species 35 (grasses and dicots), shrub species (willows, blackberries [Rubus], wild roses [Rosa]), and a mixture 36 of tree species such as oak (Quercus), sycamore (Platanus), alder (Alnus), walnut (Juglans), and 37 cottonwood (Populus). Mammals using these upland habitats included tule elk (Cervus elaphus 38 nannodes), mule deer (Odocoileus hemionus), pronghorn (Antilocapra americana), grizzly (Ursus 39 arctos), coyote (Canis latrans), American badger (Taxidea taxus), ground squirrel (many spp.), 40 pocket gopher (Thomomys), cottontail (Sylvilagus audubonii), and black-tailed jackrabbit (Lepus 41 californicus) in drier areas (Grinnell et al. 1937; Thompson 1957). Much of this flora and fauna was 42
1 The genus was formerly Scirpus.
Bay Delta Conservation Plan Public Draft 2-5 November 2013
ICF 00343.12

Existing Ecological Conditions
Chapter 2
severely reduced with reclamation and the development of agriculture that began in the early 1 1850s. 2
High tule productivity combined with the rich organic sediments of the basins along the Sacramento 3 and San Joaquin Rivers and the channels and channel-to-marsh plain transition zones of Suisun 4 Marsh provided large amounts of organic matter support for the aquatic foodweb. This organic 5 matter input probably resulted in abundant biomass of zooplankton (detritivores, scavengers, and 6 filter-feeding planktivores) (The Bay Institute 1998). The large and complex foodweb also likely 7 supported an abundant assemblage of fishes. 8
Because the Delta environment and its fish species assemblage has changed significantly and was 9 not documented prior to the changes, there is limited knowledge of the ecology of native fishes in 10 the past (Moyle 2002). It is known that the historical assemblage of fish in the Delta was very 11 different from the current assemblage. For example, thicktail chub (Gila crassicauda) was driven to 12 extinction in the 1950s, most likely due to marsh reclamation impacts and the introduction of 13 nonnative fish species (Schulz and Simons 1973). Also, the Sacramento perch (Archoplites 14 interruptus), once very abundant in sloughs off main channels, was extirpated from the Delta for the 15 same reasons (Rutter 1908). Conversely, a large number of nonnative species of fish have been 16 deliberately introduced (e.g., striped bass [Morone saxatilis], channel catfish [Ictalurus punctatus], 17 and largemouth bass [Micropterus salmoides]), or introduced into the system as cast offs (e.g., 18 goldfish [Carassius auratus auratus]). Further, the abundance of many species of native fish was 19 much greater historically than currently. For example, Chinook salmon (Oncorhynchus tshawytscha) 20 were once very abundant throughout the Delta and Sacramento‒San Joaquin Rivers and tributaries, 21 but today their abundance is low for many reasons (Appendix 2.A, Covered Species Accounts). The 22 freshwater range of anadromous fish, such as salmonids (Salmonidae) and sturgeon (Acipenser) was 23 much greater historically before the construction of dams, and the degradation of suitable habitat 24 below dams significantly reduced the extent of spawning habitat. Fish likely fed on dominant 25 crustaceans, such as the mysid Neomysis, the amphipod Corophium, and cyclopoid copepods (Moyle 26 2002), which have been replaced as dominant species by multiple nonnative copepod species, 27 including Limnoithona, Pseudodiaptomus, and Acanthomysis (Sommer et al. 2007). 28
2.3 Existing Ecological Conditions 29
2.3.1 Data Sources and Natural Community Classification 30
2.3.1.1 Data Sources 31
Background data for the BDCP were collected through an extensive search of various sources, 32 including current scientific literature, reports, technical documents, agency-maintained data (e.g., 33 CALFED, Interagency Ecological Program, California Department of Fish and Wildlife [CDFW], and 34 California Department of Water Resources [DWR]), and BDCP documents (e.g., BDCP Independent 35 Science Advisors Report [Reed et al. 2007]). A full list of background data sources is provided in 36 Section 2.5, References Cited. Where data were not available, or where significant uncertainties were 37 identified through initial data gathering and synthesis, technical experts were engaged to provide 38 unpublished data and best professional scientific judgment. Various technical experts participated in 39 developing, writing, and reviewing the descriptions of the natural communities (Section 2.3.4, 40 Natural Communities) and the accounts of covered species (Appendix 2.A, Covered Species Accounts). 41
Bay Delta Conservation Plan Public Draft 2-6 November 2013
ICF 00343.12

Existing Ecological Conditions
Chapter 2
Citations and references pertaining to individual covered species are embedded in the species 1 accounts in Appendix 2.A. 2
Map data layers were compiled from existing spatial datasets, primarily produced by state and 3 federal agencies and available on their websites, or by data transfer. Modifications that have been 4 made to help refine the map data layers (particularly for the vernal pool complex) are summarized 5 in Appendix 2.B, Vernal Pool Complex Mapping and Modifications to Natural Community Mapping. 6 The sources and types of spatial information used in this report are presented in Table 2-1. 7
Table 2-1. Spatial Data Sources 8
Map Layer Data Type Data Source Bathymetry Raster DWR, USGS Conservation lands Vector CPAD, CDFW, CaSIL Geology Vector USGS Hydrography Vector USGS, CDFW, CaSIL Land cover type/vegetation community type Vector CDFW, Yolo County, DWR Land ownership Vector DWR, CDFW, CPAD Land use/farmland Vector DWR, USDA Levees and major water projects Vector DWR Major water operations Vector DWR, CaSIL NAIP aerial imagery Raster USDA Parcel boundaries Vector Solano, Sacramento, Yolo, San Joaquin,
Alameda, and Contra Costa Counties Physical geography/Delta legal boundary Vector CaSIL Road, rail and communication infrastructure Vector CaSIL, DWR, TIGER Soils Vector NRCS Species distribution and habitat range Vector CDFW, USFWS Topography/elevation Vector/raster DWR, USGS, CDC Vernal pool complex Vector DWR, SSURGO, CDFW Water diversions Vector CDFW, DWR Notes: CaSIL = California Spatial Information Library CDFW = California Department of Fish and Wildlife
DWR = California Department of Water Resources USDA = U.S. Department of Agriculture SSURGO = Soil Survey Geographic Database NRCS = Natural Resources Conservation Service USGS = U.S. Geological Survey CDC = California Department of Conservation TIGER = Topologically Integrated Geographic Encoding and Referencing CPAD = California Protected Areas Database NAIP = National Agriculture Imagery Program
9
Natural communities (Section 2.3.4) were defined and described using the CALFED Bay-Delta 10 Program (2000) Ecosystem Restoration Program Volume 1 and the Multi-Species Conservation 11
Bay Delta Conservation Plan Public Draft 2-7 November 2013
ICF 00343.12

Existing Ecological Conditions
Chapter 2
Strategy, and were further refined and augmented by input from CDFW staff participating in the 1 BDCP Terrestrial Resources subgroup in 2009. 2
Data sources for the legal Delta, Suisun Marsh, and the Upper Yolo Bypass (each described below) 3 were merged to generate a single, compiled vegetation cover dataset for the entire Plan Area. The 4 finer scale vegetation classifications in these datasets were rolled up to create the 13 natural 5 community types described in Section 2.3.4, Natural Communities, and these data were also used to 6 model the habitat of covered species (Appendix 2.A, Covered Species Accounts). 7
2.3.1.2 Vegetation Dataset Sources for the Legal Delta 8
The Vegetation and Land Use Classification map of Sacramento-San Joaquin River Delta and 9 associated geographic information system (GIS) shape files (Hickson and Keeler-Wolf 2007) were 10 used to create the initial vegetation dataset for the legal Delta portion of the Plan Area. CDFW has 11 classified and mapped vegetation within the legal Delta, excluding Chipps Island and Van Sickle 12 Island in the far western portion of the Delta, for use in conjunction with the Delta Regional 13 Ecosystem Restoration Implementation Plan. 14
The 2007 CDFW map was produced by conducting vegetation sampling using the California Native 15 Plant Society Rapid Assessment Protocol (California Native Plant Society 2007). In the area sampled, 16 377 rapid assessments were conducted in the field and 52 vegetation alliances were identified by a 17 clustering algorithm, including 45 plant associations defined by Sawyer and Keeler-Wolf (1995)2. 18 When positive association identification was not possible, vegetation was identified to alliance or 19 phase. 20
These field-surveyed classification units were directly or indirectly used to develop 129 fine-scale to 21 mid-scale geospatial map classifications. Due to issues of scale or remote sensing limitations, in 22 some cases field data were condensed or aggregated to create the map classifications. Therefore, 23 these map classifications represent a mix of field vegetation identification levels including 24 association, suballiance (aggregation of associations), alliance, phase, generic, stand, and mapping 25 unit. For a crosswalk between the vegetation classification of field-surveyed data and related map 26 classification of geospatial data in the Legal Delta, see Hickson and Keeler-Wolf (2007). 27
Land cover features were mapped by CDFW using minimum mapping units (MMU) as follows. 28
Land use: MMU = 2 acres (minimum width of 25 meters). 29
Isolated land use: MMU = 1 acre (minimum width of 10 meters). 30
Water: MMU = 1 acre (minimum width of 10 meters). 31
Vegetation: MMU = 2 acres (minimum width of 10 meters). 32
Critical vegetation: MMU = 1 acre (minimum width of 10 meters). 33
Features were occasionally mapped below MMU or minimum width because those features were so 34 distinct or important compared to their surroundings that omitting them would have distorted the 35
2 A Manual of California Vegetation by Sawyer and Keeler-Wolf published in 1995 has since been superseded by a 2009 edition. However, because habitat modeling and mapping began prior to the release of the 2009 version, the BDCP will continue to use the 1995 version for consistency purposes. The 1995 document is referenced throughout Chapter 2; however, this footnote will only appear once.
Bay Delta Conservation Plan Public Draft 2-8 November 2013
ICF 00343.12

Existing Ecological Conditions
Chapter 2
representation of the area. Each polygon was coded with both a vegetation type and one of 25 land 1 use types. Base imagery used to map the vegetation was true color 1-foot resolution aerial 2 photography from spring 2002, and additional marginal areas of the mapped area were 3 supplemented by aerial photography from summer 2005. A more detailed description of the 4 classification and mapping process is available in Hickson and Keeler-Wolf (2007). 5
The vegetation categories produced by CDFW were combined into the corresponding broad 6 biological community classifications used in the BDCP. Polygons from the fine-scale CDFW map were 7 combined using GIS. Science Applications International Corporation (SAIC) ecologists used U.S. 8 Department of Agriculture National Agriculture Imagery Program 1-meter resolution color aerial 9 photography to delineate the portion of the Plan Area not sampled by CDFW during the Delta 10 mapping project into a GIS (U.S. Department of Agriculture 2005). This imagery was 11 photographically interpreted to identify the natural communities present in portions of the Plan 12 Area that were not sampled by CDFW. 13
2.3.1.3 Vegetation Dataset Sources for Suisun Marsh 14
The Vegetation Mapping of Suisun Marsh, Solano County California GIS dataset from 2006 (Boul and 15 Keeler-Wolf 2008), in which CDFW classified and mapped vegetation within Suisun Marsh, as well 16 as Chipps Island and Van Sickle Island, was used to create the initial vegetation dataset for Suisun 17 Marsh. This dataset represents the most comprehensive and detailed vegetation survey available for 18 the Suisun Marsh region3. The Manual of California Vegetation (Sawyer and Keeler-Wolf 1995) was 19 used as the classification protocol and is based on the National Vegetation Classification System 20 (Grossman et. al. 1998). The vegetation classification process described by Keeler-Wolf and Vaghti 21 (2000) was reapplied in 2003 and 2006 in an effort to document vegetation changes within the 22 Suisun Marsh. It should be noted that this dataset has registration issues when comparing it to the 23 National Agriculture Imagery Program (NAIP) or the U.S. Geological Survey (USGS) standardized 24 regional imagery. The original dataset was developed in 1999. It involved registering and “rubber 25 sheeting” over 100 1:9,600 true color photos. The aerial photos were rectified to a registered SPOT 26 base satellite image and the mapping was then tied to these registered and mosaic-defined 27 photographs. 28
Developing the relationships and equivalencies of the Suisun Marsh mapped vegetation cover types 29 and the corresponding natural community classifications used in the Plan Area proved problematic. 30 The classification of communities within the Suisun Marsh was primarily driven by changes in 31 species compositions due to wetland management strategies being applied in the region. Because of 32 the presence of these management strategies, vegetation classes could be found to occur within 33 multiple natural communities types. For example, the Distichlis spicata vegetation type was often 34 found within both the managed wetland and the tidal brackish emergent wetland communities. 35 Therefore, instead of developing a procedure to link the Suisun Marsh vegetation classes to the 36 natural communities, the spatial extents of wetland management strategies were used to categorize 37 the 2006 Suisun Marsh mapped vegetation. 38
The EcoAtlas (San Francisco Estuary Institute 1998) GIS dataset provides a reasonable estimate of 39 land use classifications, and was used to support the categorization of Suisun Marsh vegetation 40
3 Users will observe that internal alignment inconsistencies are present when comparing the mapped land cover features to standardized imagery (e.g., USGS Digital Orthophoto Quarter Quadrangles, NAIP). Currently, there is no work planned to refine the alignment inconsistencies (Keeler-Wolf pers. comm.).
Bay Delta Conservation Plan Public Draft 2-9 November 2013
ICF 00343.12

Existing Ecological Conditions
Chapter 2
classes into the natural communities. The EcoAtlas mapped Suisun Marsh using general categories 1 that were loosely lumped into high-elevation tidal marsh, low- to mid-elevation tidal marsh, muted 2 tidal marsh, managed marsh, diked marsh, farmed bayland, grazed bayland, ruderal, storage basins, 3 deep bay or ocean, and shallow bay. These land use categories were grouped into the equivalent 4 natural community types (Table 2-2). The resulting categorized Suisun Marsh vegetation dataset 5 was then visually compared to NAIP 2005 aerial imagery (U.S. Department of Agriculture 2005) and 6 refined as necessary. 7
Table 2-2. EcoAtlas Land Use Classifications of Suisun Marsh and Equivalent Natural Community 8 Type 9
EcoAtlas Land Use Classification of Suisun Marsh Equivalent Natural Community Designation Tidal marsh Tidal brackish emergent wetland Managed marsh Diked marsh Storage basin
Managed wetland
Farmed bayland Ruderal Cultivated land
Deep bay or ocean Shallow bay Tidal perennial aquatic
Grazed bayland Grassland 10
2.3.1.4 Vegetation Dataset Sources for the Upper Yolo Bypass 11
The Yolo Natural Heritage Program’s Regional Vegetation GIS dataset (Technology Associates 12 International Corporation 2008) was used to define vegetation cover for the upper Yolo Bypass that 13 extends from the north legal Delta boundary northward to the Sacramento River. The dataset was 14 clipped to the boundaries established for the Yolo Bypass. The vegetation classification categories 15 assigned to the Yolo County dataset were evaluated to determine the appropriate corresponding 16 natural community with which each vegetation category should be associated. 17
2.3.1.5 Vernal Pool Complex Dataset Development 18
In addition to the BDCP vegetation cover dataset, a vernal pool complex natural community dataset 19 was separately generated to more effectively capture the vernal pool complex natural community 20 (pools and supporting uplands) present within the Plan Area. Details of the process used to map the 21 vernal pool complex can be found in Appendix 2.B, Vernal Pool Complex Mapping and Modifications 22 to Natural Community Mapping. 23
2.3.1.6 Natural Community Classification in the Expanded Plan Area 24
The Plan Area was expanded in 2012 by 4,332 acres (less than 1%) to capture several additional 25 areas targeted for restoration and other covered activities. These expansion areas included land 26 adjacent to Conservation Zone 2 west of Yolo Bypass and land adjacent to Conservation Zones 1, 8, 27 and 11. Additionally, a small portion of the Plan Area (18,422 acres), previously unmapped, was 28 mapped by ICF ecologists in 2011. Detailed vegetation alliance data were not available for the plan 29 expansion areas or the previously unmapped areas, so natural communities were mapped in these 30 areas based on aerial imagery, GIS-based vegetation data from Solano and Yolo Counties, and 31
Bay Delta Conservation Plan Public Draft 2-10 November 2013
ICF 00343.12

Existing Ecological Conditions
Chapter 2
ground-truthing (ICF 2012). Land use data for the cultivated land natural community in the 1 expansion areas were obtained from publicly available California Department of Water Resources 2 GIS datasets (California Department of Water Resources 2000, 2003, 2004, and 2008). 3
2.3.2 Ecosystem Processes 4
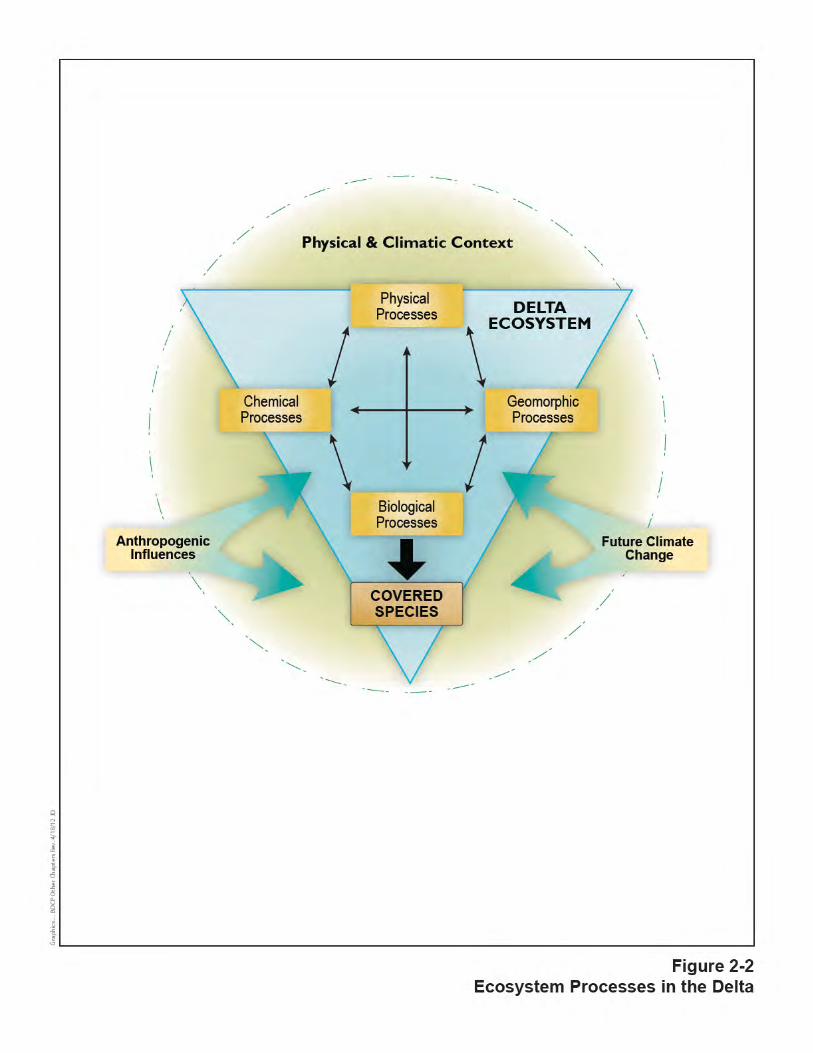
The ecosystems of the Plan Area are dynamic and driven by a complex set of interacting physical, 5 chemical, geomorphical, and biological processes that originate from internal and external causes 6 (Figure 2-2). These processes vary at multiple spatial and temporal scales, typically along gradients 7 rather than at well-defined boundaries (Kimmerer 2004). Organisms that evolved in these 8 ecosystems are adapted to this variability as it historically existed. Anthropogenic factors have 9 altered the ecosystems in many ways and global climate change is expected to alter it further. 10
2.3.2.1 Aquatic Ecosystem Processes 11
2.3.2.1.1 Physical Processes 12
Major physical factors driving ecological conditions in the Plan Area include water flow, salinity, and 13 turbidity. The most conspicuous physical forcing factor is water flow, which varies daily, seasonally, 14 and annually. Water flow directly or indirectly influences nearly all other ecosystem processes in the 15 Plan Area. Large-scale hydrodynamics in the Plan Area are driven largely by tides, freshwater 16 inflows, water exports, cumulative effects of local diversions, and atmospheric forcing. Local 17 hydrodynamics are driven by water depth, channel geometry, and bathymetry at bends and channel 18 junctions. Local conditions are not static and the cross-sections and beds of most Delta channels are 19 dynamic and change at time scales of years to decades in response to flow rates, wind, and other 20 physical drivers. 21
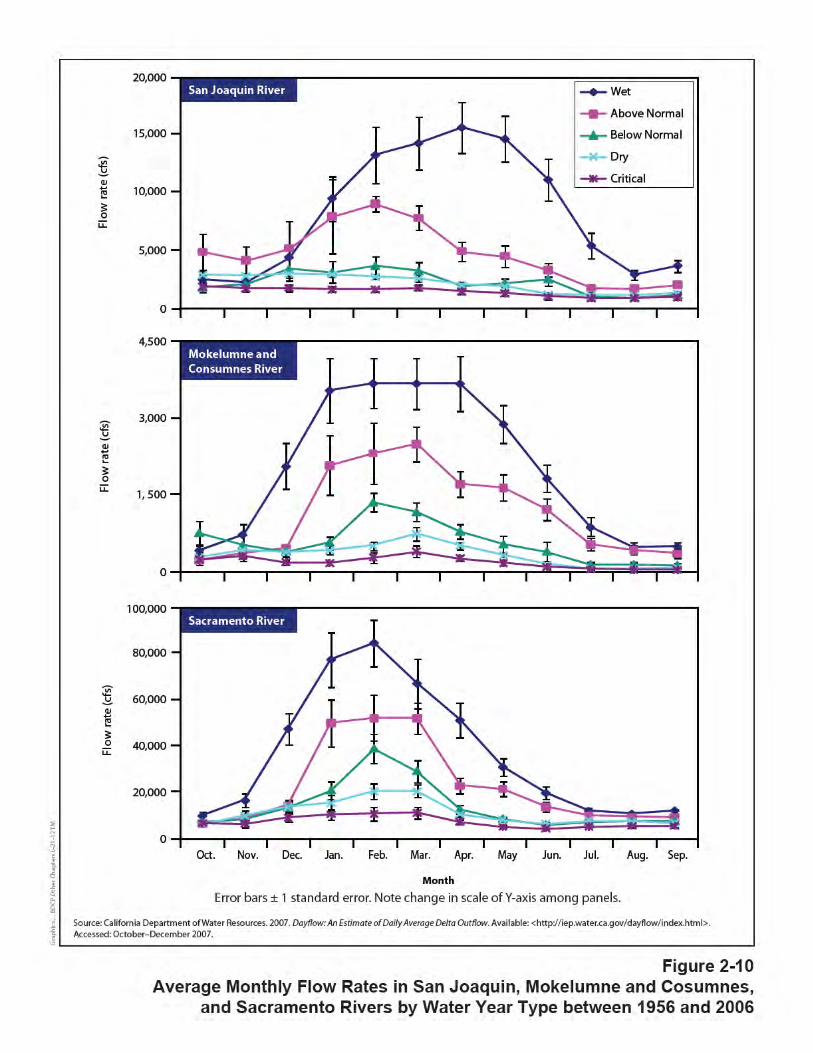
Flow patterns are driven by the interaction between upstream (freshwater) flows entering the Delta 22 and oceanic tides moving in and out of the Delta twice a day. While tidal flows drive the large 23 majority of water movement in the Delta (Kimmerer 2004), they contribute little to net flow out of 24 the Plan Area. Average tidal flow rates are 170,000 cfs, but can exceed 300,000 cfs during high tidal 25 flow events (Mount 1995). In contrast, inflows from the upstream rivers average an order of 26 magnitude lower. The average daily total Delta outflow from 1955 to 2007 was 33,715 cfs and has 27 been as low as 4,200 cfs during dry periods (California Department of Water Resources 2007a). 28 While tidal influence dissipates at approximately the same location upstream on both the 29 Sacramento and San Joaquin Rivers (at approximately river mile 50), because freshwater inflow 30 from the Sacramento River is much larger than inflow from the San Joaquin River (Section 2.3.3.3, 31 Hydrologic Conditions) a much larger tidally driven volume of water or tidal prism moves in and out 32 of the San Joaquin River. The overall pattern shows that hydrodynamic processes (e.g., transport, 33 dispersion, etc.) in the western portion of the Delta are governed primarily by tidal exchange, while 34 hydrodynamics in the northern and southern portions of the Delta are governed primarily by river 35 flow. 36
In the region where fresh and oceanic waters first mix a longitudinal salinity gradient is formed. 37 This gradient is intensively monitored and is spatially indexed by X2, which is the distance (in 38 kilometers) from the Golden Gate Bridge at which channel-bottom water salinity is 2 ppt (Jassby 39 et al. 1995). The spatial and temporal characteristics of this gradient vary daily and seasonally and 40 are driven by freshwater inflow and tidal action. X2 shifts upstream during a flood tide and 41 downstream during an ebb tide. Similarly, X2 is farther downstream during high Delta outflows and 42
Bay Delta Conservation Plan Public Draft 2-11 November 2013
ICF 00343.12

Existing Ecological Conditions
Chapter 2
farther upstream during periods of low outflows. Theoretically, within the salinity gradient, an 1 estuarine salinity field and density gradient, also called a salt wedge, may form in which denser salt 2 water is located at the bottom farther upstream and fresh water is located at the surface farther 3 downstream; however, due to turbulent mixing, this rarely occurs in the Delta or Suisun Bay 4 (Kimmerer 2004). 5
Temporal and spatial patterns in flow can directly affect the concentration and distribution of 6 nutrients and contaminants, water density, salinity gradients, and floodplain inundation frequency 7 and duration (Kimmerer 2004). Flow patterns also directly affect the transport of dissolved and 8 suspended particles, including nutrients, gases, organic matter, toxics, sediment, and organisms 9 (Kimmerer 2002; Jassby 2008). Although concentrations of particles do not necessarily increase 10 with higher flows (but often do because of resuspension), the overall load (i.e., delivery) of particles 11 increases with higher flow rates. The residence time of particles, the duration that they occur in a 12 defined area, is inversely related to water flow rates. There are both positive and negative effects of 13 increased residence time, depending on the effect of the particle on the biological process. Longer 14 residence time of nutrients and organic matter may have beneficial effects on biological processes, 15 but some of those processes (e.g., feeding by invasive bivalves, discussed in Section 2.3.2.1.4, 16 Ecosystem Energetics and Productivity) may not be beneficial to native organisms. Longer residence 17 times may also allow greater uptake of toxics such as methylmercury (discussed in Section 2.3.2.1.5, 18 Effects of Anthropogenic Influence and Future Climate Change), resulting in harmful effects on 19 biological processes. When residence time is too great, biological consumption of dissolved oxygen 20 at particular depths in the water column may exceed oxygen supply rates that are driven by 21 atmospheric exchange processes and mixing at different depths and lead to anoxic conditions, which 22 are lethal for many organisms. Conversely, short residence time of nutrients and organic matter in 23 the Delta may not allow organisms sufficient time to optimally use the resources to support primary 24 and secondary productivity. 25
Turbidity is an indirect method for quantifying how the transmission of light through water is 26 attenuated by particles and dissolved substances, and is influenced primarily by suspended 27 sediments and secondarily by suspended and dissolved organic material and plankton (Kimmerer 28 2004). Although still high relative to other aquatic ecosystems, turbidity in the western region of the 29 Delta (in and near the low-salinity zone [LSZ]) has declined tenfold over the past three decades 30 (Lehman 2000; Kimmerer 2004). This may be due to reduced sediment supply, reduced 31 phytoplankton biomass, or the localized trapping of particles caused by an increase in the extent of 32 submerged aquatic vegetation, particularly the nonnative and highly invasive Brazilian waterweed 33 (Egeria densa) (Grimaldo and Hymanson 1999; Kimmerer 2004). This decrease is an indicator of 34 extensive changes in the aquatic foodweb that may be manifested in a number of ways. Regardless 35 of current declines in turbidity, primary productivity in the Delta is limited by low light transmission 36 through the still relatively turbid water column (Cole and Cloern 1984; Kimmerer 2004). 37
2.3.2.1.2 Chemical Processes 38
Major chemical processes driving ecological conditions in the Delta include the cycling of nutrients, 39 carbon, and other organic matter. Some important dissolved inorganic nutrients include, but are not 40 limited to, nitrogen in the form of nitrate, nitrite, and ammonia4 (chemical species varies with pH), 41 phosphorus in the form of phosphate, and silicate (Kimmerer 2004). The relative proportions of 42
4 Ammonia in water generally forms some amount of ammonium. Therefore, the use of the term ammonia implies that both ammonia and ammonium may be present.
Bay Delta Conservation Plan Public Draft 2-12 November 2013
ICF 00343.12
Existing Ecological Conditions
Chapter 2
total nitrogen and total phosphorus are also very important, as discussed in Section 2.3.2.1.3, 1 Geomorphic Processes. Dissolved organic nitrogen and phosphorus are also present in the system 2 and can be easily recycled by the consumption of organic material by animals and microbes. Sources 3 of nitrogen and phosphorus to the Delta include sewage, urban runoff, oceanic inputs, and 4 agricultural runoff. As noted above, it is generally accepted that, for most of the year in most 5 locations of the Delta, primary productivity is not nutrient-limited; instead, turbidity appears to 6 limit primary productivity as a result of low light levels (Section 2.3.2.1.4, Ecosystem Energetics and 7 Productivity) (Cole and Cloern 1984; Kimmerer 2004). High nutrient concentrations in the Delta are 8 not necessarily beneficial and can cause blooms of harmful phytoplankton species that pose risks to 9 both the aquatic ecosystem and humans, as has occurred in other estuaries (Anderson et al. 2002). 10 For example, blooms of the toxic cyanobacteria, Microcystis, have increased since it was first 11 documented in the Delta in 1999 (Lehman and Waller 2003, cited in Lehman et al. 2005), and the 12 blooms may contribute to the reduced concentrations of zooplankton (pelagic organism decline 13 [POD]) (Resources Agency et al. 2007). However, recent work suggests that nutrient concentration 14 explains a small percentage of Microcystis abundance patterns (Lehman et al. 2008). 15
The primary sources of organic carbon for the Delta are its upstream tributaries (Jassby and Cloern 16 2000). Secondary sources include local phytoplankton and bacterial production and agricultural 17 drainage within the Delta. Most organic carbon from agricultural drainage is derived from peat soils 18 (Jassby et al. 2003). Tertiary sources include discharges from wastewater treatment plants, exports 19 from tidal marsh areas, and possibly aquatic macrophyte production. Benthic microalgal production, 20 urban runoff, and other sources appear to be negligible throughout the Delta. 21
Organic carbon concentrations are generally reported as particulate until below a threshold size, 22 where they are considered dissolved. Within the Delta, biological production of particulate organic 23 carbon is derived primarily from phytoplankton, although heterotrophic bacteria may contribute a 24 significant proportion of organic carbon to the foodweb, particularly in the Delta and Suisun Marsh. 25 Jassby et al. (2002) identified declines in phytoplankton biomass in Suisun Bay from 1975–1995, but 26 Jassby 2008 has seen increases in phytoplankton biomass in the Delta and no change in Suisun Bay 27 since 1996. Unlike particulate organic carbon, most dissolved organic carbon (i.e., extremely small 28 particles of organic matter) must be consumed and transformed into larger particles by bacteria 29 before it can be consumed by larger organisms. Since it is a transformation of existing organic 30 carbon and not the production of new organic carbon through photosynthesis by cyanobacteria or 31 phytoplankton, the bacterial transformation of dissolved organic carbon does not add new organic 32 carbon to the foodweb (Jassby et al. 2003). 33
Seasonally inundated floodplains such as those in the Yolo Bypass and adjacent to the Cosumnes 34 River provide an allochthonous (export) subsidy of organic matter to other regions of the Delta. 35 Some of this floodplain-generated organic carbon, such as phytoplankton, is especially labile 36 (available to organisms) (Jassby and Cloern 2000; Moyle et al. 2007). Also, since these floodplains 37 are shallower, have longer residence times, and are generally warmer than the mainstem river, they 38 have greater rates of phytoplankton production than do the channels of the rivers (Sommer et al. 39 2001a). 40
The oxygen concentration of the aquatic environment is influenced by exchange with the 41 atmosphere, photosynthesis, aerobic and anaerobic respiration, vertical exchange, water 42 temperature, and wind and wave action (Kimmerer 2004). In general, the water in the channels of 43 the Delta is saturated (at equilibrium with the atmosphere) with dissolved oxygen in most areas 44 during most of the year. One common exception occurs during late summer and early fall in the 45
Bay Delta Conservation Plan Public Draft 2-13 November 2013
ICF 00343.12

Existing Ecological Conditions
Chapter 2
Stockton Deep Water Ship Channel on the San Joaquin River. At that particular location the 1 combination of low river flows, high concentrations of oxygen-demanding organisms (algae from 2 upstream, bacterial uptake of effluent from the City of Stockton Regional Wastewater Control 3 Facility, and other unknown sources), and channel geometry causes rates of biological oxygen 4 demand to exceed rates of gas exchange with the atmosphere and results in a sag (locally depleted 5 concentration) in dissolved oxygen concentration in the Stockton Deep Water Ship Channel (Lee and 6 Jones-Lee 2002; Kimmerer 2004; Jassby and Van Nieuwenhuyse 2005). An oxygen diffuser 7 experiment is currently being conducted in the Stockton Deep Water Ship Channel to meet total 8 maximum daily load (TMDL) objectives for dissolved oxygen concentrations established by the 9 Central Valley Regional Water Quality Control Board (Central Valley Water Board) (2005) (above 10 6.0 milligrams per liter [mg/L]) from September 1 through November 30 and above 5.0 mg/L at all 11 times). Low dissolved oxygen concentrations have also been documented in Old River near the 12 Tracy Boulevard Bridge and occur in multiple dead-end sloughs near Stockton (e.g., Pixley Slough, 13 Mosher Slough, and Five Mile Slough) (Central Valley Regional Water Quality Control Board 2009). 14
Chemical processes can also be important drivers of physical process. For example, low oxygen 15 concentrations in areas with dense growth of tidal emergent vegetation leads to peat formation, 16 which allows the surface of the submerged soil to accumulate peat at a rate that maintains its 17 surface at the same relative elevation to sea level. Prior to reclamation activities, natural peat 18 formation was widespread in the Plan Area, and it remains important for maintaining the elevation 19 of the marsh plain of Suisun Marsh. Additionally, in tidal areas of the western Delta and Suisun 20 Marsh, salinity levels, as well as water and soil water oxygen concentrations, are responsive to the 21 frequency and timing of inundation. In these areas, salinity and dissolved oxygen concentrations are 22 the primary factors that determine the physical structure and species composition of tidal marsh 23 plant communities, and the rate of peat accumulation. In the Suisun Marsh, changes in salinity cause 24 corresponding changes in species composition, which in turn cause different rates of belowground 25 productivity that then leads to different rates of peat accumulation in the marsh plain (Culberson 26 2001; Culberson et al. 2004). Variation in peat accumulation rates is likely to result in variation in 27 the rate the marsh can respond to sea level rise. 28
2.3.2.1.3 Geomorphic Processes 29
Major geomorphic processes driving ecological conditions in the Delta include sediment transport 30 and erosion. Fluvial and tidal forces (hydrodynamics) directly influence terrestrial as well as aquatic 31 communities. Geomorphic attributes of the Delta are largely determined by the interactions among 32 sediment sources, water flow, and aquatic and terrestrial biota. 33
The rate of sediment transport into the Delta depends on the magnitude of upstream erosion and 34 downstream transport. Sediment loads increase with higher flows both because the delivery rate is 35 higher and because sediment concentrations in the water column increase due to greater turbulent 36 mixing and scour, leading to resuspension of sediment (Ruhl and Schoellhamer 2004; McKee et al. 37 2006). Sediment can act as a sink of multiple biologically active materials, including toxics such as 38 pyrethroids and mercury that have settled into or are bound to the sediment. These biologically 39 active materials are then moved with resuspended sediment. Sediment inputs in the Delta are not in 40 equilibrium with exports to the San Francisco Bay and Pacific Ocean, and there are active areas of 41 erosion within the Delta (Ruhl and Schoellhamer 2004; McKee et al. 2006; Cappiella et al. 1999; 42 Ganju and Schoellhamer 2010). Local sediment deposition occurs in low-velocity waters, such as 43 near emergent vegetation or in shallower backwaters. These relatively stable deposits can provide 44 suitable substrate for colonization by plants and ultimately may develop into an emergent 45
Bay Delta Conservation Plan Public Draft 2-14 November 2013
ICF 00343.12

Existing Ecological Conditions
Chapter 2
vegetation community that traps sediment at greater rates by impeding flow and reducing wave 1 energy (Simenstad pers. comm.). This vegetation-sedimentation feedback loop leads to gradients of 2 natural community types that correspond to characteristic bathymetric profiles. 3
Sediment yields have declined by about 50% since 1957 through the depletion of erodible sediments 4 that were deposited by mining activity in the 1800s and 1900s, sediment trapping within reservoirs, 5 riverbank erosion protection, levees, and altered land uses (e.g., agriculture) (James 1999, 2004a, 6 2004b; Wright and Schoellhamer 2004; James 2006; McKee et al. 2006; James and Singer 2008; Singer 7 et al. 2008; James et al. 2009; Singer and Aalto 2009; Ganju and Schoellhamer 2010). This sediment 8 supply reduction may become particularly problematic under predicted future climate change models 9 as it may prevent marsh surface elevations from tracking sea level rise (Section 2.3.2.1.5, Effects of 10 Anthropogenic Influence and Future Climate Change). 11
2.3.2.1.4 Ecosystem Energetics and Productivity 12
This section focuses on aquatic environments in the channels of the tidal waters of the Delta 13 (biological processes for each of the natural communities are discussed in Section 2.3.4, Natural 14 Communities). Primary and secondary productivity and energy transfer to higher trophic levels are 15 the biological processes that fuel the ecosystems of the Delta. In the channel waters of the Delta, 16 phytoplankton biomass and production are low relative to other larger estuaries around the world 17 (Jassby et al. 2002). Historically, chlorophyll concentration, a measure of phytoplankton biomass, 18 decreased significantly in each season except spring (April through June) from 1975 to 1995 (Jassby 19 et al. 2002, 2003), and remains low (Kimmerer 2004). A major driver of this decline may be the 20 1986 invasion of the overbite clam (Potamocorbula amurensis) (Kimmerer and Orsi 1996) (Section 21 2.3.2.1.5, Effects of Anthropogenic Influence and Future Climate Change), but various other drivers 22 doubtless have contributed to the decline, at least at some sites and in some timeframes. Among 23 these are human-caused additions of nitrogen and pesticides to Delta waters (Dugdale et al. 2007; 24 Weston and Lydy 2010). There are spatial gradients within the Delta as chlorophyll concentrations 25 are greater in the southern and eastern Delta, presumably due to longer residence time and greater 26 water clarity (Kimmerer 2004). 27
In the absence of other factors such as Potamocorbula, nutrients do not limit the development of 28 primary producers in the Delta; instead, light levels within the water column appear to control 29 primary productivity (Cole and Cloern 1984; Kimmerer 2004). Light penetration through the water 30 column has an inverse exponential relationship with suspended particulate matter at a given depth. 31 Therefore, the large majority of phytoplankton production occurs near the surface. If the current 32 pattern holds and water clarity continues to increase in the Delta as it has done over the past few 33 decades (Lehman 2000), higher phytoplankton production is expected. However, the growth rate, 34 depth distribution, and extent of Egeria and other nonnative invasive aquatic plants may respond 35 positively to increasing water clarity due to reduced particulate matter concentrations and their 36 dense and extensive canopies may drive down light levels (Kimmerer 2004). High concentrations of 37 ammonia and ammonium, which are derived primarily from wastewater treatment plants, may also 38 contribute to reduced productivity in the Delta and bays of the Plan Area by suppressing the uptake 39 of nitrate by diatoms and phytoplankton (Dugdale et al. 2007; Dugdale 2008). Elevated ammonium 40 concentrations may also directly impair primary productivity (Parker et al. 2010). Glibert (2010) 41 has found evidence that spatio-temporal patterns in ratios of ammonia, nitrate, and phosphate 42 concentrations can explain spatial and temporal patterns in algal functional groups (i.e., diatoms, 43 and flagellates), and cyanobacteria in the Delta, and may also explain zooplankton and pelagic fish 44 abundance. 45
Bay Delta Conservation Plan Public Draft 2-15 November 2013
ICF 00343.12

Existing Ecological Conditions
Chapter 2
A high abundance of benthic microalgae occurs in shallow subtidal habitat and intertidal mudflats, 1 which compose a significant portion of aquatic habitats in the Delta. While this appears to be a 2 potential source of primary productivity, the actual contribution of benthic microalgae to overall 3 organic carbon production appears to be small (Jassby and Cloern 2000; Kimmerer 2004). 4
Benthic dwelling filter-feeders, particularly Potamocorbula, may be responsible for major inter- and 5 intra-annual variation in phytoplankton abundance in the brackish water areas of the western Plan 6 Area. Similarly, in the freshwater areas of the central and eastern Delta the abundance of the Asian 7 clam is inversely related to phytoplankton biomass in subsided islands that have flooded. Together, 8 the combined grazing impacts of these clams may have a major influence in the Delta foodweb 9 (Lucas et al. 2002). Conversely, grazing on phytoplankton by zooplankton does not appear to be a 10 major sink for primary production in the Delta (Kimmerer 2004). 11
Within the Delta, the general foodweb is highly complex and variable at multiple spatial and 12 temporal scales, and no attempt has been made to fully reconstruct it. Zooplankton play a critical 13 role in the foodweb as they represent an important link between primary producers and higher 14 trophic levels. Zooplankton population sizes are very dynamic at short time scales (i.e., weeks to 15 months) (Kimmerer 2004). They are also dynamic over longer time scales as there has been a large 16 decline in zooplankton abundance throughout the Delta since the mid-1970s, and it is hypothesized 17 that the decline is due to a combination of factors that include reduced organic inputs, increased 18 water exports, reduced phytoplankton biomass, and toxic substances in the water (Kimmerer 2004). 19
Zooplankton community composition varies spatially where copepods are numerically dominant in 20 the brackish water region of the Plan Area, while cladocerans dominate the freshwater region. In the 21 LSZ between those two regions, macrozooplankton, including mysids and epibenthic amphipods, are 22 important food items for many fish species (Kimmerer 2004) as most fish species consume 23 zooplankton for at least part of their lives. Changes in the composition and abundance of the 24 zooplankton community of the Plan Area that are driven by biological invasions and changing water 25 conditions have forced native fish species to adapt to new prey species and caused a reduction of 26 overall carrying capacity of fish in the Plan Area (Bennett 2005). 27
Both fish and larger epibenthic invertebrates (e.g., crabs and shrimp) have complex life cycles, and 28 their abundances are regulated by multiple environmental factors (Kimmerer 2004). For example, 29 many fish species, because of their anadromous life history, respond to both oceanic and Delta 30 conditions and transfer energy between both foodwebs. Additionally, a diverse species assemblage 31 of birds, mammals, amphibians, and reptiles comprise higher trophic levels of the Delta’s aquatic 32 foodweb and consume a variety of invertebrate and fish species. While predation impacts by these 33 species are significant, their overall impact on prey populations is less well understood compared to 34 other sources of mortality (Sommer et al. 2007). 35
2.3.2.1.5 Effects of Anthropogenic Influence and Future Climate Change 36
This section focuses on aquatic environments in tidal channels of the Plan Area (biological processes 37 for each of the natural communities are discussed in Section 2.3.4, Natural Communities). 38
Ecosystem processes within the Delta have been greatly modified by a variety of anthropogenic 39 influences and are predicted to continue to be modified with future sea level rise and climatic 40 changes. The large extent of wetland reclamation, flood management infrastructure, and channel 41 modifications have transformed the geometry of the Delta from one with a complex structure of 42 branching channels to one of interconnected channels around leveed and diked islands. These 43
Bay Delta Conservation Plan Public Draft 2-16 November 2013
ICF 00343.12

Existing Ecological Conditions
Chapter 2
channels have created linear and circular flow patterns that are different from the dendritic channel 1 structure that existed before these modifications occurred (Grossinger 2004; Grossinger et al. 2 2008). Flow rates through the modified channels tend to be greater than in dendritic channels, 3 reducing residence time and leading to a reduction in overall productivity of the Delta. Levees have 4 removed important elevational gradients that historically existed at the interface between aquatic 5 and terrestrial ecosystems. 6
The construction of dams and reservoirs has dampened the variation that was present in the 7 historical hydrograph of the Delta and has changed the timing of flows through the Delta. Upstream 8 diversions reduce flows into the Delta and in-Delta diversions, including State Water Project (SWP) 9 and CVP facilities and over 2,200 nonproject diversions, have reduced flow out of the Delta. 10 Operations of the SWP/CVP facilities (including the Delta Cross Channel, Victoria Canal, and the 11 pumping stations) have altered in-Delta hydrodynamics by altering the direction of water flow such 12 that east to west flows are lower than they were historically, and north to south flows are greater 13 than they were historically. 14
Return flows from wastewater treatment plants, island drainage, and groundwater seepage have 15 introduced toxic substances into the Delta. Barriers and new channels that were constructed and are 16 operated to maintain water quality (e.g., Head of Old River barrier, and Delta Cross Channel) have 17 significantly altered flow, transport, and mixing of suspended particles, dissolved gases, and 18 dissolved salts in the Delta. 19
In conjunction with the depletion of erodible sediments from mining, riverbank protection and 20 levees, and altered land uses, the dams and reservoirs have also greatly reduced loads of sediment 21 transported to the Delta and suspended in the water column. Lower sediment load is of particular 22 concern in relation to future climate change because current sediment loads may be insufficient to 23 support a rate of accretion that will keep pace with projected sea level rise. 24
Nonnative invasive species introductions and population expansions have altered a variety of 25 ecosystem processes in the Delta. Potamocorbula has, since its introduction in 1986, had a 26 substantial impact on the aquatic ecosystem (Kimmerer and Orsi 1996; Kimmerer 2004) and that 27 impact has had a greater effect on the Delta’s foodweb than any other known invasion since long-28 term monitoring in the Delta began. As described above, the clam has caused a loss of summertime 29 phytoplankton in Suisun Bay, declines in phytoplankton in the Delta, reductions in turbidity in both 30 regions, changes in species composition and abundance of zooplankton, alterations of pathways and 31 efficiencies of energy transfer through the foodweb, and restructuring of the benthic community in 32 downstream bays. Serial invasions and numerical dominance of multiple zooplankton species (e.g., 33 copepods and mysids) have changed the diet composition and breadth of multiple fish species. The 34 introductions of multiple centrarchids species (e.g., largemouth bass and sunfishes) are thought to 35 have directly contributed to the local extinction of Sacramento perch in the Delta (Cohen and 36 Carlton 1995). The introduction of two nonnative invasive aquatic plants, water hyacinth and 37 Egeria, has reduced habitat quantity and value for many native fishes in the Plan Area. Because 38 water hyacinth forms dense floating mats that greatly reduce light penetration into the water 39 column, it can significantly reduce primary productivity in the underlying water column (National 40 Marine Fisheries Service 2004). Egeria grows along the margins of channels in dense stands that 41 prohibit access by native juvenile fish to shallow water habitat. In addition, the thick cover of these 42 two invasive plants provides excellent habitat for nonnative ambush predators, such as bass and 43 sunfish, which prey on native fish species. Egeria is thought to reduce turbidity through a reduction 44
Bay Delta Conservation Plan Public Draft 2-17 November 2013
ICF 00343.12
Existing Ecological Conditions
Chapter 2
in water velocity, resulting in higher local particle sediment rates, which has been hypothesized to 1 increase predation rates on native fish (Brown and Michniuk 2007). 2
Toxic substances can interfere with ecosystem processes by reducing growth, reproduction, and 3 survival of species. Herbicide applications can locally limit phytoplankton growth and production 4 rates (Jassby et al. 2003). Many of the pesticides used to control agricultural pests are also toxic to 5 zooplankton. Other sources of flows of toxic substances in the ecosystems of the Plan Area include 6 wastewater treatment plants, urban runoff, and upstream sources. Although there is considerable 7 uncertainty regarding the effects of some of these toxics on fish, at least three mechanisms have 8 been identified through which toxics could affect fish. First, direct exposure to toxics could have 9 negative impacts on fish, especially to more vulnerable life stages such as eggs and larvae. Second, 10 toxic substance-induced mortality of zooplankton, a source of food for nearly all fish species at one 11 or more life stages, could limit food to fish species and result in reduced growth rates, reproductive 12 output, and survival rates. Third, the bioaccumulation of toxics such as mercury and selenium by 13 Potamocorbula is well documented, and likely occurs in other organisms as well. Because some fish 14 (e.g., sturgeon and splittail) and aquatic birds (e.g., surf scoter, American coot, and scaup) forage on 15 organisms that bioaccumulate mercury and/or selenium, their tissue can bioaccumulate these 16 toxics, thus reducing growth, reproduction, and survival (Luoma and Presser 2000). 17
If the reduced dry season flows into the Delta and increased sea level due to global climate change 18 occur as predicted by climate models, they will combine to cause saltwater intrusion and tidal 19 influence to shift farther upstream. This shift will likely affect biological processes that are 20 dependent on salinity (e.g., rearing habitat for delta native fishes). Reduced flow into the Delta 21 during summer and fall could lead to substantial increases in residence time during those seasons, 22 which would increase water temperature and reduce dissolved oxygen levels to the detriment of 23 native fish and other organisms. With reduced flows into and out of the Delta, toxic substances may 24 accumulate in channels during the summer and fall. The predicted effects of global climate change 25 are discussed in more detail in Section 2.3.3.2, Climate. 26
2.3.2.2 Terrestrial Ecosystem Processes 27
Terrestrial ecosystems dominate the Plan Area. The present extent of the aquatic ecosystem, as 28 defined by the tidal perennial aquatic natural community, is a relatively small 86,236-acre portion 29 (11%) of the 786,125-acre Plan Area. Most of the terrestrial portion of the Plan Area, however, is 30 dominated by human-modified landscape. Intensively managed cultivated lands and managed 31 wetlands comprise 572,623 acres (73%) of the Plan Area. Grassland, which is primarily composed of 32 managed and cultivated grasslands on Delta islands and levees, constitutes another 77,495 acres. 33 Together, these three human-managed communities constitute 81% of the Plan Area. The ecosystem 34 processes of these communities are almost entirely controlled by human management activities that 35 include disturbance by tilling and disking; regulation of the water cycle by irrigation; chemical 36 enhancement of soil fertility with fertilizers; and control of species composition with herbicides, 37 pesticides, and cultivation. 38
Cultivated lands retain some natural ecosystem functions. For example, flooded rice fields provide 39 surrogate wetland habitats for species such as the giant garter snake, a covered species. Hay crops 40 and some annually cultivated crops provide important foraging habitat for raptors. Winter-flooded 41 croplands provide essential foraging and roosting habitat for the greater sandhill crane, a covered 42 species, as well as waterfowl and shore birds. Managed wetlands provide productive seasonal 43 wetlands interspersed with permanent wetlands. These wetlands feed large populations of 44
Bay Delta Conservation Plan Public Draft 2-18 November 2013
ICF 00343.12
Existing Ecological Conditions
Chapter 2
waterfowl and shorebirds through the production of seeds and invertebrates; and their structure is 1 managed to provide nesting, resting, and loafing areas. Managed wetlands also provide habitat for 2 covered species such as salt marsh harvest mouse, sandhill crane, and giant garter snake. The 3 majority of the grassland natural community is managed as vacant, typically abandoned croplands, 4 while a small portion is managed as a source of primary productivity to feed domestic grazing 5 animals. 6
The other terrestrial and wetland natural communities in the Plan Area support more natural 7 ecological processes and native species but constitute only a small portion of the Plan Area relative 8 to human-managed communities. The Plan Area supports 17,930 acres of valley/foothill riparian 9 natural community and 17,298 acres of combined tidal freshwater and tidal brackish emergent 10 wetlands. These three natural communities constitute 4% of the Plan Area. The valley/foothill 11 riparian natural community provides a number of ecological functions. It serves as the hydrologic 12 connection between terrestrial uplands and aquatic ecosystems and provides water quality benefits 13 by processing and filtering runoff. It is a source for organic material (e.g., falling leaves), insect food, 14 and woody debris in waterways, and can influence channel dynamics. Riparian forest and scrub 15 provides habitat for the greatest diversity of any terrestrial community in the Plan Area. In the Delta, 16 these riparian functions are greatly diminished, as most riparian habitat is present on levees and 17 within cultivated lands separated from floodplains and natural hydrodynamics and substrates. Most 18 of the riparian areas remaining in the Plan Area consist of long and narrow patches that do not 19 provide functional habitat for riparian obligate species such a western yellow-billed cuckoo, which 20 need riparian patch sizes of greater than 100 acres (Laymon 1998). Tidal freshwater and brackish 21 emergent wetland communities provide ecosystem functions as wildlife habitat, natural chemical 22 filters, and buffers to wave action, and provide resources to adjacent aquatic ecosystems through 23 their contributions of nutrients and organic material to the shared foodweb. Tidal wetlands also 24 accumulate peat, which controls the surface elevation and productivity of the Delta’s wetlands. Tidal 25 freshwater and brackish emergent wetland vegetation provides rearing habitat for fish species. 26
Several specialized natural communities of limited distribution in the Plan Area and statewide 27 provide unique ecological conditions that support unique assemblages of plants and wildlife, 28 including many rare species that are covered species under the BDCP. These communities include 29 vernal pool complex, alkali seasonal wetlands complex, and inland dune scrub; collectively they 30 constitute approximately 1% of the Plan Area. 31
2.3.3 Physical Environment 32
2.3.3.1 Geomorphic Setting 33
The Delta, Yolo Bypass, and Suisun Marsh are the expression of numerous spatial and temporal 34 variations in regional and local physical processes that, in combination, have established the 35 hydrologic and geomorphic conditions that are present today. One of the most visually apparent 36 physical features is the enormous north-south Central Valley that is nearly surrounded by 37 mountains and has a single westerly outlet near its midpoint. In and around this valley, tectonic 38 activity has assembled a diverse mixture of elements and minerals, raised the surrounding 39 mountains, and elevated or subsided various sections of the valley floor and regulated its connection 40 to the ocean. 41
The Central Valley and its surrounding mountains are perched on the Sierra Nevada/Great Valley 42 tectonic microplate, which is more or less solidly attached to the North American tectonic plate to its 43
Bay Delta Conservation Plan Public Draft 2-19 November 2013
ICF 00343.12

Existing Ecological Conditions
Chapter 2
east. Its western boundary is being distorted by friction caused by the contrary motion of the North 1 American and Pacific tectonic plates as they slide past and buffet each other with the microplate 2 trapped in between (Argus and Gordon 2001; Fay and Humphreys 2008). The distortion of the 3 western margin of the microplate has led to bursts of mountain building in the Coast Range as well 4 as extensive networks of faults that serve to release the built up strains. Both the Coast Range and 5 faults are features that are expressed by the microplate through a thick pavement of oddly shaped 6 and sized blocks composed of shallower and younger layers of the earth’s crust. Two of these blocks, 7 the Suisun and the Montezuma Hills, together gave birth to the current opening of the Central Valley 8 to the Pacific Ocean approximately 500,000 years ago and have maintained the opening in the face 9 of extensive tectonic activity in the Coast Range on either side of the gap in the mountains 10 (Loudeback 1951; Sarna-Wojcicki et al. 1985; Weber-Band 1998). 11
The geology of the mountain ranges that surround the Central Valley is extremely complex and 12 beyond the scope of this document (Jennings et al. 1977; Alt and Hyndman 2000, U.S. Geological 13 Survey 2005). However, generally described, the geology and rock of the bordering mountains differ 14 when comparing the southern San Joaquin Valley with the northern San Joaquin and Sacramento 15 valleys. The Sierra Nevada range to the east of southern San Joaquin Valley consists primarily of 16 granitic rock while the Coast Range to the west is composed of marine sedimentary rock. 17 Northward, the Sierra Nevada is composed of volcanic lahars near the valley floor, metamorphic and 18 mixed types of igneous rock in the foothills, granitic rocks in the mountains, and a cap of volcanic 19 rock along the crest of the Sierra Nevada. The Coast Range consists of two bands of very different 20 rock. Immediately along the border of the valley is the Great Valley sequence of marine sedimentary 21 rock whereas to the west is the Franciscan complex consisting of marine sedimentary rock, 22 metamorphic rock, igneous rock, and patches of volcanic rock. 23
Sediment is produced in the mountains and delivered to the Central Valley as locally and regionally 24 heterogeneous mixtures that correspond to the geology of the four mountainous regions described 25 above (Wakabayashi and Sawyer 2001; Curtis et al. 2005). These sediments have different physical 26 and chemical attributes that directly affect the geomorphology of the rivers and streams both 27 upstream and within the Delta, as well as the quality of the water that they deliver to the Delta. 28 Additionally, the rate at which the sediments are delivered to the Delta is partially determined by 29 whether they are detained or trapped in a subsiding region of the valley floor. Precipitation, which 30 produces and transports the sediment, occurs less in the south and varies from east to west as the 31 parallel set of north-south trending mountain ranges along the longitudinal axis of the valley creates 32 precipitation shadows on their lee faces and large orographic increases on their windward faces 33 (Dettinger et al. 2004; National Atlas of the United States 2009). The amount and type of 34 precipitation intercepted by the mountains is also greatly influenced by glacial/interglacial climatic 35 variation and by periodic deviations from seasonal averages. When precipitation accumulates high 36 in the southern and north-central Sierra Nevada as glaciers, the glaciers grind away at the granitic 37 rock, which is delivered to the Valley as fine material in glacial meltwaters. In contrast, during warm 38 humid periods, chemical weathering of the granitic rock leads to deep and unstable deposits of a 39 sand-like material called grus that is delivered to the valley as deep and permeable alluvial fans 40 (Wahrhaftig 1965; Weissmann et al. 2005). In the central and northern Sierra Nevada, glacial effects 41 have been smaller and erosion is the primary force that delivers material from its diverse rock types 42 to the Valley (James et al. 2002; James 2003; Curtis et al. 2005) and supplies sediment from a 43 diversity of rock types to the Sacramento River (Singer and Dunne 2001). Along the entire Coast 44 Range, erosion attacks the southern marine mudstone and sandstone, Great Valley sequence, and 45 Franciscan complex and delivers fine clay material and a mixture of dissolved elements (mercury, 46
Bay Delta Conservation Plan Public Draft 2-20 November 2013
ICF 00343.12

Existing Ecological Conditions
Chapter 2
chrome, sodium, magnesium, boron, and selenium) to the Central Valley where they settle out in 1 broad and relatively impermeable alkaline clay plains (Bureau of Soils 1909; California State Mining 2 Bureau 1918; Bryan 1923; Belitz 1988; Deverel and Gallanthine 1989; Peters 1991; Donnelly-Nolan 3 et al. 1993; Davisson et al. 1994; Graymer et al. 1994; Graymer et al. 2002; The Natural Heritage 4 Institute 2003; Domagalski et al. 2004a; Domagalski et al. 2004b; Williamson et al. 2005; Hothem 5 et al. 2007; Sommer et al. 2008). 6
Subtle surface and hidden subsurface factors also directly control the rate and type of sediment and 7 dissolved chemical delivery to the Delta. Underlying the more recent alluvium in the San Joaquin 8 Valley and southernmost region of the Sacramento Valley to near the Dunnigan Hills is the thick and 9 impermeable Corcoran clay that formed the bed of Corcoran Lake, which covered the San Joaquin 10 Valley and southernmost Sacramento Valley until it drained through the new opening of the Central 11 Valley to the Pacific Ocean approximately 500,000 years ago (Thomasson Jr. et al. 1960; Sarna-12 Wojcicki et al. 1985; Belitz 1988). This relatively shallow clay layer controls groundwater/surface 13 water interactions that affect the hydrology and selenium content of the overlying San Joaquin River. 14 Underlying the majority of the Sacramento Valley is the thick and relatively permeable Tuscan 15 Formation that was derived from volcanic ash and mudflows (Olmsted and Davis 1961; Lydon 1968; 16 Jennings et al. 1977; Helley and Harwood 1985; Page 1985; U.S. Geological Survey 2005). Because 17 the Tuscan Formation lies on top of the surface of the lower Sierra Nevada foothills before steeply 18 dipping under the Sacramento Valley, and because it is permeable, it intercepts and stores some 19 surface flow as well as deeply percolating water from local sources. Both the Corcoran Clay and the 20 Tuscan Formation contain or control regional aquifers that are used as alternatives to surface flows. 21 Because of tectonic controls and alluvial deposition that are associated with the Sierra Nevada, the 22 San Joaquin River flows northward over its sandy bed along the western border of its valley to the 23 Delta (Weissmann et al. 2005). In contrast, the Sacramento River shifts back and forth across its 24 valley as it flows southward along the Willows Fault, is deflected to the east by the subsurface 25 Colusa Dome, and is deflected to the east again by the delta of Cache Creek (Larsen et al. 2002; 26 Singer 2008; Singer et al. 2008). Gravels are largely trapped upstream of the Colusa Dome while 27 sand and finer sediment are carried downstream (Singer 2008). 28
Because of its lesser gradient, greater proportion of sand to finer sediment, and smaller flows, the 29 San Joaquin River is a braided river with numerous sloughs as it flows northward toward the Delta. 30 In contrast, the Sacramento River is bordered by broad and high natural levees that isolate it from 31 seven adjacent flood basins as it flows southward to the Delta, and its single channel becomes 32 increasingly stable as it approaches and enters the Delta (Hitchcock et al. 2005; Singer et al. 2008). 33 The natural levees were formed when overbank flow deposited suspended sediment. When the 34 deposits were made into floodplain waters at equal elevation to the main channel, the result was 35 steep levees with coarse material that rapidly graded into fine deposits in the floodplain 36 (Adams et al. 2004). Alternatively, when sediment was deposited by floodplain waters at lower 37 levels than the main channel, the result was more gently sloped broad levees where sediment 38 texture fined less rapidly (Adams et al. 2004). The banks of the levees can be stabilized by 39 vegetation (Thompson 1961; Stainstreet and McCarthy 1993; Larsen et al. 2002; Adams et al. 2004) 40 and channels or crevasses connecting the channel to the river can exist for hundreds to thousands of 41 years (Rowland et al. 2009). The Sacramento River levee from the upper end of the Yolo Basin to 42 Cache Slough has a number of crevasses with characteristic sand splays and connecting sloughs 43 (Thompson 1960; Robertson 1987; Hitchcock et al. 2005; Singer et al. 2008). Both Cache Creek and 44 Putah Creek discharge into the Yolo Basin, and their waters do not join the channel of the 45 Sacramento River until Cache Slough near the center of the Delta. Under historical flood conditions, 46
Bay Delta Conservation Plan Public Draft 2-21 November 2013
ICF 00343.12

Existing Ecological Conditions
Chapter 2
the combined flow through Cache Slough was often greater than the flow in the Sacramento River 1 Channel and under natural conditions created a hydraulic dam at their confluence, which backed up 2 the Sacramento River (Thompson 1960, Roos 2006, James and Singer 2008, Singer et al. 2008). The 3 Mokelumne River discharges into the San Joaquin River on the eastern side of the Delta and only 4 became tidally influenced within the last 1,000 years compared to approximately 6,000 years ago 5 for the rest of the Delta (Shelmon 1971; Brown and Pasternack 2005). Marsh Creek, on the 6 southwestern edge of the delta, has migrated back and forth across its broad alkaline clay alluvial 7 plain and has discharged at different points into that area of the Delta (The Natural Heritage 8 Institute 2003; San Francisco Estuary Institute 2010). 9
Approximately 21,000 years ago, the last glacial maximum ended and eustatic sea level began to rise 10 from the lowstand of -394 feet (-120 meters) in a series of large meltwater pulses interspersed by 11 periods of constant rising elevation until the Laurentide ice sheet had completely melted 6,500 years 12 ago and the rate of sea level rise slowed dramatically (Edwards 2006; Peltier and Fairbanks 2006). 13 The modern Delta formed sometime between 10,000 and 6,000 years ago when rising sea level 14 flooded a broad valley. The inlet elevation to the valley is constrained by river-cut notches in the 15 bedrock under the Carquinez Strait and the east end of Sherman Island at depths of -131 feet (-40 16 meters) and -121 feet (-37 meters) below current sea level respectively, which are elevations that 17 would have been flooded by rising sea levels approximately 10,000 years ago (Shelmon 1971; 18 Peltier and Fairbanks 2006; Drexler et al. 2009a). Until approximately 6,700 years ago, sediment 19 deposits in the central and western Delta were primarily composed of mineral alluvium. Since that 20 time, peat has accumulated from depths of approximately -30 feet (-9 meters) to the current sea 21 level (Goman and Wells 2000; Drexler et al. 2009a). These deposits could have only accumulated 22 under anaerobic conditions present in a permanently flooded Delta, likely maintained by high sea 23 levels (Drexler et al. 2009a). This hypothesis is supported by fluctuating levels of oceanic-derived 24 salinity as indicated by shifts in the dominance of aquatic plant species that are adapted to either 25 brackish or freshwater conditions (Goman and Wells 2000; Byrne et al. 2001; Malamud-Roam and 26 Ingram 2004; Malamud-Roam et al. 2006; Malamud-Roam et al. 2007; Watson and Byrne 2009). 27
At Browns Island in the western Delta, the transition to peat was apparently interspersed with 28 periods dominated by fine mineral sediments, whereas peat developed abruptly and continuously in 29 the central Delta (Drexler et al. 2009a). Sea level would have been approximately -13 feet (-4 30 meters) below its current level 6,000 years ago (Peltier and Fairbanks 2006). There is currently no 31 explanation for the approximately 13 feet (4 meters) of additional peat in the central Delta, the 32 difference between sea level 6,000 years ago and peat deposits that extend to a depth of 33 approximately -26 feet (-8 meters) (Drexler et al. 2009a), although at least a portion of this 34 difference could be attributed to tectonic subsidence as there is a 10-foot-high scarp along the 35 Midland Fault in this area (Unruh and Hitchcock 2009). 36
Although the geomorphology of the Delta has often been described as a typical “bird’s foot” delta, 37 this description inaccurately describes the complex system of alluvial fans and flood basins that 38 were converted into multiple deltas when they were drowned by rising sea level and that are 39 visually apparent when viewing historical maps and aerial photographs (Hitchcock et al. 2005; 40 Grossinger et al. 2008). The complex geomorphology of sea level induced deltas is just beginning to 41 be studied and understood (Shelmon 1971; Blum and Tornqvist 2000; Parker et al. 2008). Under 42 these dynamic conditions, deltas can be single-thread linear channels, large fans, or complex 43 combinations of different forms (Atwater et al. 1979; Blum and Tornqvist 2000; Hitchcock et al. 44 2005; Kim et al. 2009; Van Dijk et al. 2009). 45
Bay Delta Conservation Plan Public Draft 2-22 November 2013
ICF 00343.12

Existing Ecological Conditions
Chapter 2
Suisun Marsh lies immediately to the west of the Delta in a subsiding basin (Unruh and Hector 1999) 1 between the bedrock notches of Carquinez Strait and Sherman Island, and because the base 2 elevation of Suisun Bay is controlled by the bedrock notches upstream and downstream, it probably 3 was flooded by rising sea level at the same time as the central Delta. Two studies conducted at Rush 4 Ranch, which is at the northern end of the marsh and distant from the main channel that runs from 5 Suisun Bay to the San Francisco Bay, indicate that marsh vegetation at that location established 6 between approximately 3,000 and 2,500 years ago (Byrne et al. 2001; Malamud-Roam and Ingram 7 2004). Suisun Marsh is unique in that its water is brackish with salinities that have varied from fresh 8 at its eastern end to nearly saline at its western end depending on the combined flow volume of the 9 Sacramento and San Joaquin Rivers (Goman and Wells 2000; Byrne et al. 2001; Malamud-Roam and 10 Ingram 2004; Malamud-Roam et al. 2006; Malamud-Roam et al. 2007; Watson and Byrne 2009). 11 Additionally, flows into the north end of the marsh from Green Valley Creek can reach 5,000 cfs and 12 can affect the salinity of the water both in the channels and on the marsh plain (Burau 2004). 13 Increasing salinity levels can shift the species composition from highly productive freshwater-14 adapted plants to much less productive salt-adapted plants (Byrne et al. 2001; Culberson 2001; Boul 15 and Keeler-Wolf 2008; Watson and Byrne 2009), influencing the rate of peat bed development and 16 the elevation of the marsh surface above sea level (Culberson et al. 2004). Early charts of the marsh 17 display classic tidal channel geomorphology with channels interspersed with ponds and the 18 boundary of the upper margin of the marsh traced with salt pannes (Grossinger 2004). A salinity 19 gradient exists as salt accumulates in areas more distant from channels that are not flushed by the 20 tides during the rainless summer months (Sanderson et al. 2000; Culberson 2001; Culberson et al. 21 2004; Watson and Byrne 2009). The duration of tidal inundation also affects the distribution of 22 plant species at the upper margin of the marsh (Culberson 2001; Watson and Byrne 2009) and 23 establishes bare mudflats at the lowest areas of the marsh adjacent to Suisun Bay (Cappiella et al. 24 1999). 25
The natural geomorphology of the Delta, Yolo Bypass, and Suisun Marsh has been greatly altered by 26 anthropogenic changes in sediment supply, flood management projects including levee building and 27 draining, mosquito ditches in Suisun Marsh, and by large water dam and diversion projects 28 throughout its watershed. The impact of the enormous pulse of sediment produced by hydraulic 29 mining from 1853 to 1884 has been well-documented (Gilbert 1917; Kelley 1989; Mount 1995; 30 Kimmerer 2004; Shvidchenko et al. 2004; James and Singer 2008; Keller 2009), but it is less well-31 known that additional mining sediment was produced between 1893 and 1953, and that large 32 quantities of sediment still remain in reaches below dams (James 1999, 2006; James et al. 2009). 33 The initial pulse of sediment increased flooding along the Sacramento River and built extensive 34 mudflats on the outer margin of Suisun Marsh as the sediment made its way to the San Francisco 35 Bay (Gilbert 1917; Kelley 1989; Mount 1995; Keller 2009). Current sediment supply rates are too 36 low to sustain those mudflats and other features that were created prior to the building of large 37 debris dams and water storage dams, and those features have been eroding for many years 38 (Cappiella et al. 1999; Kimmerer 2004; Wright and Schoellhamer 2004; McKee et al. 2006; Ganju 39 and Schoellhamer 2010). Levee building has affected the Plan Area in diverse ways. Upstream of the 40 Delta along the Sacramento River and in the various flood basins, levee building has both trapped 41 and sped the delivery of sediment to the Delta (James 1999; Singer and Dunne 2001; James 2004a, 42 2004b, 2006; Mikhailov et al. 2006; James and Singer 2008; Singer 2008; Singer et al. 2008; James et 43 al. 2009; Singer and Aalto 2009). In the Delta proper, levees and various land uses have reduced the 44 depth of peat soils within the confines of the levees to depths of -24 feet (-7.25 meters) (Drexler et 45 al. 2009b), which creates an enormous volume of accommodation space that, in the event of a levee 46
Bay Delta Conservation Plan Public Draft 2-23 November 2013
ICF 00343.12
Existing Ecological Conditions
Chapter 2
break, will bring saline and brackish water from the west further into the Delta (Mount and Twiss 1 2005). 2
As noted above, the alluvium underlying the Sacramento-San Joaquin Delta is dominated by 3 Quaternary alluvial deposits in the channels and on the levees and peat beds in the center of the 4 islands (Figure 2-3). The peat beds, combined with historical floodwater alluvial deposits of fine 5 mineral particles, have provided highly fertile and productive soils to support the agriculture 6 industry throughout the Plan Area (Figure 2-4). The smaller extent of mineral soils, including soils in 7 the map units Zamora-Rincon-Capay-Brentwood, Veritas-Tinnin-Delhi, and Willows-Waukena-8 Pescadero-Fresno, are located primarily along the western and southern edges of the Plan Area 9 (Figure 2-4). 10
Prior to reclamation for agriculture, much of the vegetation of the Delta (approximately 11 380,000 acres; 1538 square kilometers was dominated by tidal marshes (Atwater 1980; The Bay 12 Institute 1998). By 1930, island reclamation was complete, and by 1980, only about 16,000 acres 13 (65 square kilometers) of marshes remained (Atwater 1980; The Bay Institute 1998). Today, these 14 areas of former tidal marshes consist primarily of channelized waterways surrounding highly 15 productive row-cropped agricultural islands that are protected from flooding by over 1,300 miles 16 (2,093 kilometers) of levees. Dewatering of the marshes and plowing the peat soils for farming have 17 led to peat oxidation losses, soil compaction, and erosion of the islands, resulting in surface 18 subsidence. The result is that the interiors of many Delta islands have substantially subsided and are 19 now depressions well below the level of the surrounding water, protected only by a ring of levees 20 (Figure 2-5). 21
2.3.3.2 Climate 22
The climate in the Sacramento-San Joaquin Delta region is spatially variable, but is generally 23 characterized as hot Mediterranean (Köppen climate classification) (McKnight and Hess 2005). The 24 general climate becomes milder from east to west due to marine influence as it is affected by 25 influxes of winds off the Pacific Ocean. 26
Summers are hot with average summer highs in the upper 80 degrees Fahrenheit (°F) to lower 90°F, 27 with little to no precipitation and low humidity. Heat waves are common in summer months, during 28 which temperatures can reach triple digits for consecutive days. Periodically, a “Delta breeze” of cool 29 and humid air from the ocean moves onshore and cools the Central Valley in the vicinity of the Delta 30 by up to 7°F (3.9 degrees Celsius [°C]) (Pierce and Gaushell 2005). Winters are mild (average daily 31 highs during November through March are in the mid-50 to mid-60°F) and wet. Approximately 80% 32 of annual precipitation occurs between November and March. The primary origin of precipitation is 33 the seasonal arrival of low-pressure systems from the Pacific Ocean. Very dense ground fog (tule 34 fog) is common between periods of precipitation in the Plan Area from November through March. 35
The climate of the Plan Area is predicted to change in complex ways. Although there is high 36 uncertainty, temperatures in the Plan Area are projected to increase at an accelerating pace from 37 3.6 to 9°F (2 to 5°C) by the end of the century (Cayan et al. 2009). Depending upon the general-38 circulation model used, there are variable predictions for precipitation change, with most models 39 simulating a slight decrease in average precipitation (Dettinger 2005, California Climate Change 40 Center 2006). The Mediterranean seasonal precipitation experienced in the Plan Area is expected to 41 continue, with most precipitation falling during the winter season and originating from North Pacific 42 storms. Although the amount of precipitation is not expected to change dramatically over the next 43
Bay Delta Conservation Plan Public Draft 2-24 November 2013
ICF 00343.12

Existing Ecological Conditions
Chapter 2
century, seasonal and interannual variation in precipitation will likely increase as it has over the 1 past century (California Department of Water Resources 2006). This could lead to more intense 2 winter flooding, greater erosion of riparian habitats, and increased sedimentation in wetland 3 habitats (Field et al. 1999; Hayhoe et al. 2004). 4
Global sea level rise predictions vary. One model predicts that by the end of this century, global sea 5 level will increase by 7 to 23 inches (18 to 59 centimeters); with an additional 6 inches (15 6 centimeters) of sea level rise if the rate of Greenland ice-melt intensifies (Intergovernmental Panel 7 on Climate Change 2007). Another model projection for sea level rise has produced middle range 8 estimates from 28 to 39 inches (70 to 100 centimeters) by the end of this century, with a full range 9 of variability from 20 to 55 inches (50 to 140 centimeters) (Rahmstorf 2007). Recently issued U.S. 10 Army Corps of Engineers (USACE) guidance on incorporation of sea level rise in civil works projects 11 suggests end of century sea level rise in the range of 20 to 59 inches (50 to 150 centimeters) (U.S. 12 Army Corps of Engineers 2009). 13
Predicted warmer temperatures will affect the rate of snow accumulation and melting in the 14 snowpack of the Sierra Nevada. Some projections predict reductions in the Sierra Nevada spring 15 snowpack of as much as 70 to 90% by the end of the century (California Climate Change Center 16 2006). Knowles and Cayan (2002) estimated that a projected warming of 3°F (1.6°C) by 2060 would 17 cause the loss of one-third of the watershed’s total April snowpack, whereas a 4°F (2.1°C) warming 18 by 2090 would reduce April snowpack by 50%. The loss of snowpack is predicted to be greater in 19 the northern Sierra Nevada than in the southern Sierra Nevada because of differences in the relative 20 amounts of low- and mid-elevation snowpack (California Department of Water Resources 2006). 21 Measurements taken to track the water content of snow (snow water equivalent) since 1930 show 22 that peak snow mass in the Sierra Nevada has been occurring earlier in the year by 0.6 day per 23 decade (Kapnick and Hall 2009). These predicted changes in the dynamics of the snowpack will 24 influence the timing, duration, and magnitude of inflow from the Sacramento and San Joaquin River 25 watersheds. For example, with more precipitation falling as rain instead of snow and the snowpack 26 melting earlier, greater peak flows will result during the rainy season and lower flows during the 27 dry season. Knowles and Cayan (2004) predict that inflows will increase by 20% from October 28 through February and decrease by 20% from March through September. Storm surges (tidal and 29 wind-driven) associated with the more intense storms predicted for the future will also exacerbate 30 Delta flooding. 31
2.3.3.3 Hydrologic Conditions 32
2.3.3.3.1 River Hydrology 33
The hydrology of the Plan Area is primarily influenced by freshwater inflows from the Sacramento 34 River from the north and the San Joaquin River from the south (Figure 2-6). Eastside streams, 35 particularly the Mokelumne River, also contribute inflows to the Plan Area. Numerous upstream 36 dams and diversions greatly influence the timing and volume of water flowing into the Delta. 37 Multiple upstream tributaries to the Sacramento and San Joaquin Rivers influence flow into the Plan 38 Area. The Feather and American Rivers and many large creeks drain directly into the Sacramento 39 River while the Cache and Putah Creeks drain into the Yolo Bypass, which joins the Sacramento 40 River in the Cache Slough area. The Yuba and Bear Rivers drain into the Feather River before its 41 confluence with the Sacramento River. The Calaveras, Stanislaus, Tuolumne, Merced, and Kings 42 Rivers drain into the San Joaquin River upstream of the Delta. The Cosumnes River drains directly 43 into the Mokelumne River, and both drain into the San Joaquin River after entering the Delta. In 44
Bay Delta Conservation Plan Public Draft 2-25 November 2013
ICF 00343.12

Existing Ecological Conditions
Chapter 2
addition to the Sacramento and San Joaquin Deltas, the Mokelumne Delta in some ways can be 1 viewed as a third important river delta. 2
Regardless of water-year type, the large majority of unimpaired upstream flow into the Delta 3 originates from the Sacramento River and its tributaries, and a lesser extent originates from the San 4 Joaquin River and its tributaries (Figures 2-7, 2-8, and 2-9). The Cosumnes and Mokelumne Rivers 5 and other smaller tributaries, collectively called the eastside tributaries in Figures 2-7, 2-8, and 2-9, 6 contribute only a small percentage of inflows. Upstream diversions reduce the total inflow from 7 upstream rivers and tributaries. Only a small proportion of water, relative to upstream flows, enters 8 the Plan Area through precipitation. In the 2000 water year, an above-normal water year, 69% of 9 water entering the Delta passed through the system as outflow, 6% was consumed within the Delta, 10 less than 1% was diverted via the North Bay Aqueduct Water District and Contra Costa Water 11 District (CCWD), and 24% was exported via SWP/CVP facilities (Figure 2-8). Additional water was 12 taken upstream of the Delta in upstream diversions and reservoirs that accounted for an additional 13 7,525 thousand af (Governor’s Delta Vision Blue Ribbon Task Force 2008). These values vary by 14 water-year type and the inflows associated with the water year. For example, in the 2001 water 15 year, a dry year, approximately 51% of water entering the Delta passed through the system as 16 outflow, 12% was consumed within the Delta, and 37% was exported via SWP/CVP facilities 17 (Figure 2-9). Because exports and in-Delta use are relatively consistent across years, inflows affect 18 Delta outflow most significantly, with a lower proportion of water exiting the system as outflow 19 during drier years and a higher proportion during wetter years. 20
The hydrograph of the Delta is highly variable both within and across years (Figure 2-10). Within 21 years, water flow is generally greatest in winter and spring with inputs of wet season precipitation 22 and snowpack melt from the Sierra Nevada and lowest during fall and early winter before significant 23 rainfall. The construction of upstream dams and reservoirs for flood protection and water supply 24 has dampened the seasonal variation in flow rates. Water is released from reservoirs year-round, 25 and flooding is much less common than it was before dam and levee construction. As a result, the 26 frequency of small- to moderate-sized floods has been significantly reduced since major dam 27 construction, although the magnitude and frequency of large floods has not been significantly 28 altered; additionally, because of climatic changes there have been more large floods in the last 29 50 years than the previous 50 years. Across years, wet and dry periods (defined as periods during 30 which unimpaired runoff was above or below average, respectively, for three or more years) 31 occurred numerous times in the last 100 years; although the duration and magnitude of the wet and 32 dry periods have increased in the last 30 years, including the 6-year drought of 1987 to 1992 and 33 the prolonged periods of wetness in the early to mid-1980s and the middle to the late 1990s 34 (California Department of Water Resources 2007a). The wet and dry periods recorded over the last 35 150 years, however, are less severe and shorter than the prolonged wet and dry periods of the 36 previous 1,000 years. 37
The Yolo Bypass is an important physical feature affecting river hydrology during high-flow events 38 in the Sacramento River watershed. The bypass is a 59,280-acre engineered floodplain that conveys 39 flood flows from the Sacramento River, Feather River, American River, Sutter Bypass, and western 40 tributaries and drains (Figure 2-11) (Harrell and Sommer 2003). The leveed bypass protects 41 Sacramento and other nearby communities from flooding during high-water events. Most water 42 enters the Yolo Bypass by spilling over the Fremont and Sacramento weirs and returns to the 43 Sacramento River in the Delta approximately 5 miles upstream of Rio Vista. The Yolo Bypass floods 44 seasonally in approximately 70% of years (Sommer et al. 2001b), in which approximately 10% of 45
Bay Delta Conservation Plan Public Draft 2-26 November 2013
ICF 00343.12

Existing Ecological Conditions
Chapter 2
the floodwaters are from westside tributaries. The Yolo Bypass can convey up to 80% of flow from 1 the Sacramento basin during flood events (Sommer et al. 2001a). 2
2.3.3.3.2 Tides 3
The Delta, lower portion of the Yolo Bypass, and Suisun Marsh are tidally influenced by the Pacific 4 Ocean, although tidal range and influence decreases with increasing distance from the San Francisco 5 Bay (Kimmerer 2004; Siegel 2007). Tides are mixed semidiurnal with two highs and two lows each 6 day, one large magnitude high and low, and one lower magnitude high and low. A typical diurnal 7 range is 3.3 to 4.6 feet (1 to 1.4 meters) in the western Delta (Orr et al. 2003). The entire tidal cycle 8 is superimposed upon the larger 28-day lunar cycle with more extreme highs and lows during 9 spring tides and depressed highs and lows during the neap tides. In addition, annual tidal elevations 10 are highest in February and August. The multiple temporal scales at which these cycles occur causes 11 significant variation in draining and filling of the Delta, and therefore, in patterns of mixing of the 12 waters (Kimmerer 2004). Additionally, variation in sea level can also be caused by changes in 13 atmospheric pressure and winds. 14
2.3.3.3.3 Water Supply Facilities and Facility Operations 15
Over 3,000 diversions remove water from upstream and in-Delta waterways for agricultural, 16 municipal, and industrial uses; 722 of these are located in the mainstem San Joaquin and 17 Sacramento Rivers and 2,209 diversions are in the Delta (Herren and Kawasaki 2001). In the Delta, 18 the CVP managed by the Bureau of Reclamation (Reclamation) and SWP managed by DWR use the 19 Sacramento and San Joaquin Rivers and other Delta channels to transport water from river flows 20 and reservoir storage to two water export facilities in the south Delta (Figure 2-12). The C. W. “Bill” 21 Jones Pumping Plant (herein referred to as the Jones Pumping Plant) is operated by the CVP and the 22 Harvey O. Banks Delta Pumping Plant (herein referred to as the Banks Pumping Plant) is operated 23 by the SWP. Water from these facilities is exported for urban and agricultural water supply demands 24 throughout the San Joaquin Valley, southern California, the central coast, and the southern and 25 eastern San Francisco Bay area. 26
Water enters the Banks Pumping Plant via the Clifton Court Forebay (Figure 2-12). Large radial arm 27 gates control inflows to Clifton Court Forebay during the tidal cycle to reduce approach velocities, 28 prevent scouring of adjacent channels, and by allowing water to enter the Clifton Court Forebay at 29 times other than low tide, reducing water level fluctuation in the south Delta (U.S. Fish and Wildlife 30 Service 2005). The Banks Pumping Plant operates to move water from Clifton Court Forebay into 31 the 440-mile (708-kilometer) California Aqueduct. Water in the California Aqueduct travels to 32 O’Neill Forebay; where a portion of the water is diverted to the joint-use SWP/CVP San Luis 33 Reservoir for storage. The remaining water flows southward via the joint-use San Luis Canal, and to 34 the South Bay Pumping Plant and South Bay Aqueduct. 35
Water from Old River in the Delta is pumped by the Jones Pumping Plant into the Delta-Mendota Canal. 36 The Jones Pumping Plant facility does not have an associated forebay. The Delta-Mendota Canal sends 37 water southward, providing irrigation water along the way, towards the O’Neill Forebay where a 38 portion of the water is diverted into the San Luis Reservoir. The remaining water continues in the 39 Delta-Mendota Canal, providing irrigation water along the way, until it reaches the Mendota Pool, 40 where water is returned to the San Joaquin River to replenish downstream flows. 41
The Delta Cross Channel is operated by Reclamation to improve through-Delta flows from the 42 Sacramento River toward the pumping facilities in the south Delta, with benefits for water quality 43
Bay Delta Conservation Plan Public Draft 2-27 November 2013
ICF 00343.12

Existing Ecological Conditions
Chapter 2
and salmonid migration (Figure 2-12). Water is diverted into Snodgrass Slough, a tributary of the 1 Mokelumne River, through which it travels into the central Delta. Two large radial gates on the Delta 2 Cross Channel can open or close to control flows into the central Delta. Reasons for closure include 3 reduction in scour in the channels on the downstream side of the Delta Cross Channel, reduction in 4 flood flows into the Mokelumne River, and fish protection. 5
The Barker Slough Pumping Plant is operated by the SWP and draws water from Barker Slough into 6 the North Bay Aqueduct (Figure 2-12). The intake is located just upstream of where Barker Slough 7 empties into Lindsey Slough, which is approximately 10 miles (16 kilometers) from the mainstem 8 Sacramento River. Water from the Barker Slough Pumping Plant is delivered to Napa and Solano 9 Counties for municipal and industrial uses. The North Bay Aqueduct is operated by DWR as part of 10 the SWP and delivers wholesale water to the Solano County Water Agency and the Napa County 11 Flood Control and Water Conservation District. The 27.6-mile North Bay Aqueduct extends from 12 Barker Slough to the end of the Napa Turnout Reservoir. Water is pumped from the Delta at the 13 Barker Slough Pumping Plant, which is located 7 river miles upstream from the confluence of Barker 14 Slough with the Sacramento River in southeast Solano County. Water is then diverted to the Travis 15 Surge Tank where it flows by gravity through the North Bay Aqueduct to the Cordelia Pumping 16 Plant. 17
The South Delta Temporary Barriers project consists of the installation of four rock barriers each 18 spring in south Delta channels: the head of Old River, Old River at Tracy, Grant Line Canal, and 19 Middle River. The head of Old River barrier is also installed during the fall for dissolved oxygen 20 reasons. The head of Old River barrier is considered a fish barrier because it is installed to keep 21 migrating juvenile Chinook salmon in the San Joaquin River. The other three barriers are 22 agricultural barriers, meaning they are installed to maintain water quality and water levels for 23 agricultural uses in the south Delta. The head of Old River barrier was not installed in spring 2009 or 24 2010 as the U.S. Fish and Wildlife Service (USFWS) biological opinion (BiOp) (2008a) prohibited the 25 installation of the barrier for the protection of delta smelt. The rock barriers are not installed in 26 years when San Joaquin River flows are high, such as during 1998. 27
The CCWD diverts water from the Delta to the Contra Costa Canal and the Los Vaqueros Reservoir 28 using four intake locations: Rock Slough, Old River, Mallard Slough, and Middle River (on Victoria 29 Canal) (Figure 2-12). The Contra Costa Canal and its pumping plants have a capacity of 350 cfs and 30 were built by Reclamation from 1937 to 1948 as part of the CVP. The Contra Costa Canal is owned 31 by Reclamation but operated and maintained by CCWD. The screened Old River Pump Station 32 (250 cfs capacity) was built in 1997 as part of the Los Vaqueros Project to improve water quality for 33 CCWD. The Old River pump station connects via pipelines to a transfer pump station (200 cfs) used 34 to pump water into Los Vaqueros Reservoir (160,000 af capacity) and from the transfer station via 35 gravity pipeline to the Contra Costa Canal. The screened Mallard Slough intake (39 cfs capacity) was 36 constructed in the 1920s and rebuilt to make it seismically protected in 2001. It is used primarily in 37 winter and spring during wet periods when water quality is sufficiently high. The screened Middle 38 River intake and pump station (250 cfs capacity) were completed in 2010 to provide additional 39 operational flexibility and improved water quality. The Middle River intake connects to the Old 40 River Pump Station via pipe that crosses Victoria Island and tunnels underneath Old River. The 41 Middle River intake is used primarily in late summer and fall to provide better water quality than is 42 obtainable from the other three intakes. 43
East Contra Costa Irrigation District provides water supplies to the city of Brentwood, portions of 44 Antioch and Oakley, the unincorporated community of Knightsen, and surrounding unincorporated 45
Bay Delta Conservation Plan Public Draft 2-28 November 2013
ICF 00343.12

Existing Ecological Conditions
Chapter 2
rural areas (Dudek 2007). The East Contra Costa Irrigation District operates a diversion located at 1 Indian Slough on Old River in combination with canals and pumping stations for distribution within 2 the service area. The primary purpose of the diversion is to provide raw water for irrigation of 3 cultivated lands, landscape, and recreational uses (e.g., golf courses). The district has agreements 4 with CCWD and City of Brentwood to make surplus water available for municipal use. 5
The city of Antioch, located in eastern Contra Costa County, supplies water through diversions 6 directly from the San Joaquin River, raw water purchased from CCWD that is delivered through the 7 Contra Costa Canal, and treated water delivered through CCWD’s Multi-Purpose Pipeline (Dudek 8 2007). Antioch receives approximately 85% of its water supplies from CCWD. The majority of the 9 water is provided for municipal and residential use, with industrial (11%) and agricultural (13%) 10 uses in the service area. 11
Byron Bethany Irrigation District provides water for agricultural, industrial, and municipal uses to 12 portions of Alameda, Contra Costa, and San Joaquin Counties (San Joaquin County Planning Division 13 2008). The district maintains two water diversions from the Delta under a pre-1914 appropriative 14 water right and a riparian water right on Old River. Water diversions occur from the SWP intake 15 channel, located between the Skinner Fish Protection Facility and the Banks Pumping Plant. Two 16 diversions serve the Byron Division and the Bethany Division. The District also operates a series of 17 pumping stations and canals for water distribution. 18
East Bay Municipal Utility District’s Mokelumne Aqueduct traverses the Delta, carrying water from 19 Pardee Reservoir on the Mokelumne River to the East Bay (Figure 2-12). East Bay Municipal Utility 20 District, in partnership with Sacramento County, constructed a major new diversion from the 21 Sacramento River at Freeport. This new diversion, sized at 185 million gallons/day capacity, feeds 22 into the Mokelumne Aqueduct and the Vineyard Surface Water Treatment Plant for central 23 Sacramento County use. 24
There are over 2,200 water diversions in the Delta, most of which are unscreened and used for in-25 Delta agriculture irrigation (Figure 2-13) (Herren and Kawasaki 2001). Industrial diversions in the 26 Plan Area include the Mirant Power plants at Pittsburg and Antioch. Water from these diversions 27 cools generators producing electric power at the plants. 28
Suisun Bay and Suisun Marsh are important ecosystems connected to the Delta, and habitat 29 conditions and facility operations in Suisun Bay and Marsh can affect ecosystem conditions in the 30 Delta (Figure 2-12 and Figure 2-13). A system of levees, canals, gates, and culverts in Suisun Marsh 31 was constructed in 1979-80 and is currently operated by DWR to lower salinity in privately 32 managed wetlands in the marsh. The Suisun Marsh Salinity Control Gates are composed primarily of 33 a set of radial gates that extend across the entire width of Montezuma Slough. The control gates are 34 used to reduce salinity from Collinsville through Montezuma Slough and into the eastern and central 35 parts of Suisun Marsh, and to reduce intrusion of saltwater from downstream into the western part 36 of Suisun Marsh. In addition to radial gates, the Suisun Marsh Salinity Control Gates consist of 37 permanent barriers adjacent to the levee on either side of the channel, flashboards, and a boat lock. 38 The gates have been operated historically from September to May and open and close twice a day 39 during full operation to take advantage of tidal flows. The gates are opened during ebb tides to allow 40 fresh water from the Sacramento River to flow into Montezuma Slough and are closed during flood 41 tides to prevent higher salinity water from downstream from entering Montezuma Slough. Gate 42 operations have been curtailed in recent years, to allow for salmon passage while still meeting the 43 salinity requirements outlined within Decision-1641. 44
Bay Delta Conservation Plan Public Draft 2-29 November 2013
ICF 00343.12

Existing Ecological Conditions
Chapter 2
2.3.3.4 Non-Water Supply Plan Area Infrastructure and Uses 1
The Plan Area supports a substantial amount of infrastructure related to urban development, 2 transportation, agriculture, recreation, energy, and other uses. Portions of six counties are included 3 in the legal Delta: Yolo, Sacramento, Solano, Contra Costa, Alameda, and San Joaquin (California 4 Department of Water Resources 2006). 5
The major land use for the Plan Area is agriculture, which represents approximately two-thirds of all 6 surface area. There is increasing residential, commercial, and industrial land use in the Plan Area, 7 most of which occurs around the periphery of the Delta. Major urban development within the cities 8 of Sacramento, West Sacramento, Stockton, Tracy, Antioch, Brentwood, and Pittsburg are in the Plan 9 Area. Small towns located wholly within the Delta include Clarksburg, Hood, Walnut Grove, Isleton, 10 Collinsville, Courtland, Locke, Ryde, Bethel Island, and Discovery Bay. Much of this development 11 occurs in the secondary zone of the Delta (as defined in Section 12220 of the Water Code). 12
Several interstate highways (Interstates 5, 80, 205/580, and 680) and one state highway (State 13 Route [SR] 99) are on the periphery of the Delta, and three state highways (SR 4, SR 12, and SR 160) 14 and multiple county roads cut across the Delta (Figure 2-13). Three major railways cross through 15 the Delta. The Plan Area contains a network of electrical transmission lines (over 500 miles [805 16 kilometers]) and gas pipelines (over 100 lines). Natural gas extraction and storage is another 17 important Plan Area use. In addition to approximately 95 public and private marinas (Lund et al. 18 2007), two major ports (Stockton and Sacramento) and their associated maintained ship channels 19 are in the Delta. These ports can handle high tonnage (55,000-ton class) ships to move cargo to and 20 from the Pacific Ocean. Much of the Plan Area, including 635 miles (1,022 kilometers) of boating 21 waterways, is used for a variety of recreational purposes including water sports, fishing, hunting, 22 and wildlife viewing (Lund et al. 2007). 23
2.3.4 Natural Communities 24
Under an approved planning agreement (Section 2800 of the NCCPA), natural communities are 25 “those species and their habitat identified by the department that are necessary to maintain the 26 continued viability of those biological communities.” There are 13 natural communities in the Plan 27 Area. (Table 2-3; Figure 2-14). Cultivated lands, while not a natural community, are included in the 28 analysis for the habitat benefits they provide, as discussed in Section 2.3.4.14, Cultivated Lands. 29
As discussed in Section 2.3.1, Data Sources and Natural Community Classification, the descriptions of 30 the natural communities that follow are generally based on those originally developed for the 31 CALFED Bay-Delta Program (2000) Multi-Species Conservation Strategy. These community types 32 were refined and augmented by input from CDFW staff participating in the BDCP Terrestrial 33 Resources subgroup in 2009. 34
The extent of each natural community in the Plan Area is presented in Table 2-3, and the covered 35 species that are supported in those natural communities are identified in Table 2-4. The distribution 36 of natural communities in the Plan Area is presented in Figure 2-14. 37
Bay Delta Conservation Plan Public Draft 2-30 November 2013
ICF 00343.12

Existing Ecological Conditions
Chapter 2
Table 2-3. Extent of Natural Communities in the Plan Area 1
Natural Community Acreage Tidal perennial aquatic 86,266 Tidal mudflat NAa Tidal brackish emergent wetland 8,501 Tidal freshwater emergent wetland 8,953 Valley/foothill riparian 18,132 Nontidal perennial aquatic 5,509 Nontidal freshwater perennial emergent wetland 1,245 Alkali seasonal wetland complex 3,723 Vernal pool complex 8,547 Managed wetland 64,897 Other natural seasonal wetland 276 Grassland 78,624 Inland dune scrub 20 Cultivated lands 506,627 Total 791,320 Notes: a Tidal mudflats are not mapped separately, and occur at the edges between tidal perennial aquatic, tidal
freshwater emergent, and tidal brackish emergent. 2
These natural communities provide habitat for animals and plants that are covered under the Plan 3 Area, or in some cases, constitute a source of food organisms for covered fishes. Covered fish, 4 wildlife, and plant species that could be present within these natural communities or could consume 5 food resources produced in these natural communities are presented in Table 2-4. 6
A generalized schematic of the distribution of natural communities in the Plan Area relative to tidal 7 levels and representative species associated with each of the communities is depicted in Figure 8 2-15. All of the communities and covered species are discussed in more detail in the following 9 sections and in Appendix 2.A, Covered Species Accounts. The following sections describe the 13 10 natural communities (and cultivated lands) and discuss the physical and biological attributes 11 associated with each.12
Bay Delta Conservation Plan Public Draft 2-31 November 2013
ICF 00343.12
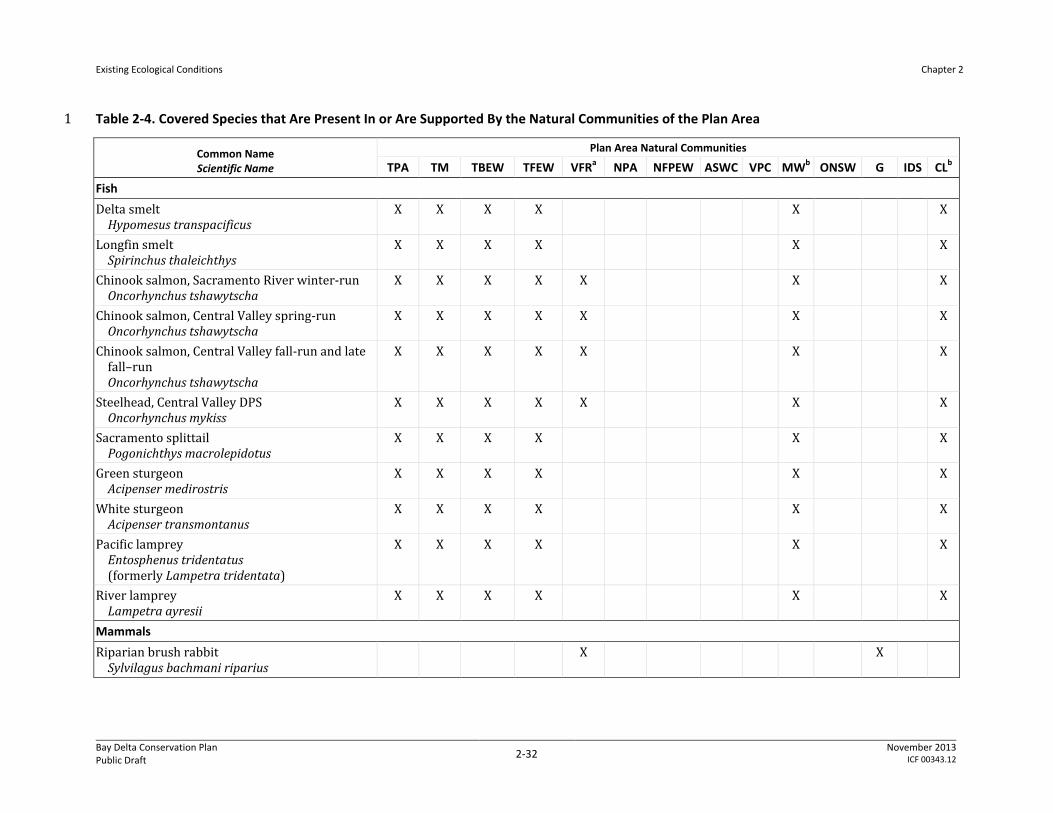
Existing Ecological Conditions
Chapter 2
Table 2-4. Covered Species that Are Present In or Are Supported By the Natural Communities of the Plan Area 1
Common Name Scientific Name
Plan Area Natural Communities
TPA TM TBEW TFEW VFRa NPA NFPEW ASWC VPC MWb ONSW G IDS CLb Fish Delta smelt
Hypomesus transpacificus X X X X X X
Longfin smelt Spirinchus thaleichthys
X X X X X X
Chinook salmon, Sacramento River winter-run Oncorhynchus tshawytscha
X X X X X X X
Chinook salmon, Central Valley spring-run Oncorhynchus tshawytscha
X X X X X X X
Chinook salmon, Central Valley fall-run and late fall–run Oncorhynchus tshawytscha
X X X X X X X
Steelhead, Central Valley DPS Oncorhynchus mykiss
X X X X X X X
Sacramento splittail Pogonichthys macrolepidotus
X X X X X X
Green sturgeon Acipenser medirostris
X X X X X X
White sturgeon Acipenser transmontanus
X X X X X X
Pacific lamprey Entosphenus tridentatus (formerly Lampetra tridentata)
X X X X X X
River lamprey Lampetra ayresii
X X X X X X
Mammals Riparian brush rabbit
Sylvilagus bachmani riparius X X
Bay Delta Conservation Plan Public Draft 2-32 November 2013
ICF 00343.12

Existing Ecological Conditions
Chapter 2
Common Name Scientific Name
Plan Area Natural Communities
TPA TM TBEW TFEW VFRa NPA NFPEW ASWC VPC MWb ONSW G IDS CLb Riparian woodrat (San Joaquin Valley)
Neotoma fuscipes riparia X
Salt marsh harvest mouse Reithrodontomys raviventris
X X X
San Joaquin kit fox Vulpes macrotis mutica
X X
Suisun shrew Sorex ornatus sinuosus
X X X
Birds California black rail
Laterallus jamaicensis coturniculus X X X X
California clapper rail Rallus longirostris obsoletus
X X X
Greater sandhill crane Grus canadensis tabida
X X X X X X
Least Bell’s vireo Vireo bellii pusillus
X
Suisun song sparrow Melospiza melodia maxillaris
X X X
Swainson’s hawk Buteo swainsoni
X X X X X X X
Tricolored blackbird Agelaius tricolor
X X X X X X X X X X
Western burrowing owl Athene cunicularia hypugaea
X X X X X X
Western yellow-billed cuckoo Coccyzus americanus occidentalis
X
White-tailed kite Elanus leucurus
X X X X X X X
Bay Delta Conservation Plan Public Draft 2-33 November 2013
ICF 00343.12

Existing Ecological Conditions
Chapter 2
Common Name Scientific Name
Plan Area Natural Communities
TPA TM TBEW TFEW VFRa NPA NFPEW ASWC VPC MWb ONSW G IDS CLb Yellow-breasted chat
Icteria viriens X
Reptiles Giant garter snake
Thamnophis gigas X X X X X X X X X
Western pond turtle Actinemys marmorata
X X X X X X X X X
Amphibians California red-legged frog
Rana draytonii X X X X X X X X X
California tiger salamander (Central Valley distinct population segment [DPS]) Ambystoma californiense
X X X
Invertebrates California linderiella
Linderiella occidentalis X X
Conservancy fairy shrimp Branchinecta conservatio
X X
Longhorn fairy shrimp Branchinecta longiantenna
X X
Midvalley fairy shrimp Branchinecta mesovallensis
X X
Valley elderberry longhorn beetle Desmocerus californicus dimorphus
X X
Vernal pool fairy shrimp Branchinecta lynchi
X X
Vernal pool tadpole shrimp Lepidurus packardi
X X
Plants Alkali milk-vetch
Astragalus tener var. tener X
Bay Delta Conservation Plan Public Draft 2-34 November 2013
ICF 00343.12

Existing Ecological Conditions
Chapter 2
Common Name Scientific Name
Plan Area Natural Communities
TPA TM TBEW TFEW VFRa NPA NFPEW ASWC VPC MWb ONSW G IDS CLb Boggs Lake hedge-hyssop
Gratiola heterosepala X
Brittlescale Atriplex depressa
X X X
Carquinez goldenbush Isocoma arguta
X X X
Delta button celery Eryngium racemosum
X X X X
Delta mudwort Limosella subulata
X X X X
Delta tule pea Lathyrus jepsonii var.jepsonii
X X X
Dwarf downingia Downingia pusilla
X
Heartscale Atriplex cordulata
X X X
Heckard’s peppergrass Lepidium latipes var. Heckardii
X
Legenere Legenere limosa
X
Mason’s lilaeopsis Lilaeopsis masonii
X X X X
San Joaquin spearscale Atriplex joaquiniana
X X X
Side-flowering skullcap Scutellaria lateriflora
X
Slough thistle Cirsium crassicaule
X
Soft bird’s-beak Cordylanthus mollis ssp. Mollis
X
Bay Delta Conservation Plan Public Draft 2-35 November 2013
ICF 00343.12

Existing Ecological Conditions
Chapter 2
Common Name Scientific Name
Plan Area Natural Communities
TPA TM TBEW TFEW VFRa NPA NFPEW ASWC VPC MWb ONSW G IDS CLb Suisun Marsh aster
Symphyotrichum lentum X X X
Suisun thistle Cirsium hydrophilum var. Hydrophilum
X
Notes: a Valley/foothill riparian natural community support salmonids by providing riparian shade, cooler water temperatures and undercut bank cover and
through detrital and terrestrial insect export that supports the aquatic foodweb. b Managed wetland and cultivated lands support aquatic species through both directly through habitat accessible during periods of flooding (e.g., to
splittail and Chinook), as well as through detrital export that supports phytoplankton and zooplankton communities and thus provides aquatic foodweb support.
Natural community codes: TPA = tidal perennial aquatic TM = tidal mudflat TBEW = tidal brackish emergent wetland TFEW = tidal freshwater emergent wetland VFR = valley/foothill riparian NPA = nontidal perennial aquatic NFPEW = nontidal freshwater perennial emergent wetland ASWC = alkali seasonal wetland complex VPC = vernal pool complex MW = managed wetland ONSW = other natural seasonal wetland G = grassland IDS = inland dune scrub CL = cultivated lands 1
Bay Delta Conservation Plan Public Draft 2-36 November 2013
ICF 00343.12

Existing Ecological Conditions
Chapter 2
2.3.4.1 Tidal Perennial Aquatic 1
The tidal perennial aquatic natural community includes deep water aquatic (greater than 10 feet [3 2 meters] deep from mean low low tide (lowest of the low tide in a day), shallow aquatic (less than or 3 equal to 10 feet [3 meters] deep from mean low low tide), and unvegetated intertidal (i.e., mudflat) 4 zones of estuarine bays, river channels, and sloughs (CALFED Bay-Delta Program 2000). Under 5 present water operation conditions in the Plan Area, tidal perennial aquatic is mainly fresh water, 6 with brackish and saline conditions occurring in Suisun Bay at times of high tides and low 7 freshwater inflows. The distribution of the tidal perennial aquatic natural community in the Plan 8 Area is shown in Figure 2-14. 9
2.3.4.1.1 Vegetation 10
The tidal perennial aquatic natural community is largely unvegetated. Where vegetation exists, it 11 can be separated into two categories: submerged aquatic vegetation and floating vegetation (both 12 rooted and unrooted) (Cowardin et al. 1979). The classification units used to map the tidal perennial 13 aquatic natural community are shown in Table 2-5. The geographic extent of this vegetation is 14 highly dynamic through time and space because it is largely dependent on physical factors that are 15 highly variable, such as depth, turbidity, water flow, salinity, substrate, and nutrient availability. 16
Submerged aquatic vegetation consists of aquatic plants that cannot tolerate drying, and as a result, 17 maintain leaves at or below the water surface. Submerged vascular plant species in the tidal 18 perennial aquatic natural community include native water primrose and the highly abundant and 19 invasive nonnative Egeria. The introduction of Egeria has been detrimental to native fishes in the 20 Plan Area (Section 2.3.4.1.3, Nonnative Species). Another common submerged nonnative invasive 21 plant is the Eurasian watermilfoil. In addition to plants, algae and cyanobacteria can be common 22 during summer and fall months in areas with clear water and little shade. Blooms of the nonnative 23 floating toxic cyanobacteria, Microcystis, were first documented in the Delta in 1999, and its 24 distribution has subsequently expanded eastward (Lehman et al. 2005). Periphyton, a thin layer of 25 organisms (mostly diatoms and bacteria) and their exudates, forms on substrates throughout this 26 community. The ecologically important eelgrass grows in soft sediment in the subtidal estuarine 27 habitat, primarily in the far western Suisun Bay where salinities are sufficiently high for this 28 brackish/saltwater species. Dense eelgrass beds can provide suitable habitat for young fish and 29 other aquatic organisms and are an important food source for waterfowl, although their occurrence 30 in the Plan Area is very limited. 31
Floating aquatic vegetation in this habitat generally consists of free-floating beds of plants at the 32 surface or in the water column. Wind and water movement can be important factors in determining 33 its distribution. Species in this group include native duckweed, native floating water fern, and 34 nonnative invasive water hyacinth. Reddish carpets of native floating water fern occur in calm 35 waters of sloughs supporting tidal perennial aquatic. This water fern has a symbiotic relationship 36 with a nitrogen-fixing bacterium that lives within its tissues (Armstrong 1979). Water hyacinth 37 grows in dense mats that can have harmful effects on native fish species (Section 2.3.4.1.3, Nonnative 38 Species). 39
Bay Delta Conservation Plan Public Draft 2-37 November 2013
ICF 00343.12

Existing Ecological Conditions
Chapter 2
Table 2-5. Map Classifications in the Tidal Perennial Aquatic Natural Community in the Plan Area 1
Map Classificationa Acreage in Plan Area Water 56,101 Undeterminedb 22,256 Ditches and sloughsc 3,489 Brazilian Waterweed (Egeria - Myriophyllum) Submerged 2,883 Algae 328 Tidal Mudflat 326 Generic Floating Aquatics 239 Floating Primrose (Ludwigia peploides) 133 Water Hyacinth (Eichhornia crassipes) 128 Milfoil - Waterweed (generic submerged aquatics) 65 Typha species (generic) 64 Ludwigia peploides 53 Scirpus (californicus or acutus)-Typha sp. 48 Scirpus californicus/S. acutus 36 Tidal mudflats 28 Scirpus (californicus or acutus)/Wetland 20 Scirpus (californicus or acutus)/Rosa 8 Hydrocotyle ranunculoides 7 Wetland herbs b 6 Pondweed (Potamogeton sp.) 5 Eucalyptus globulus 4 Phragmites australis 4 Typha angustifolia/Distichlis 3 Distichlis (generic) 3 Scirpus americanus/S. Californicus-S. acu 3 Rosa/Baccharis 3 Calystegia/Euthamia 2 Structure 2 Flooded Managed Wetland 2 Annual Grasses generic 2 Lepidium (generic) 2 Phragmites/Scirpus 2 Raphanus sativus (generic) 1 Typha angustifolia/Phragmites 1 Rosa californica 1 Rubus discolor 1 Typha angustifolia/S. americanus 1 Foeniculum vulgare 1 Tall Wetland Graminoids 1 Total 86,263 a Some of the map classifications provided here are directly representative of associations, alliances, or
phases identified through field surveys. Others represent amalgamations of field data due to issues of scale or remote sensing. For more detailed information concerning these map classifications and plant associations/alliances/phases, as well as methods of classification used, see Hickson and Keeler-Wolf (2007).
b This map classification is located in a portion of the Plan Area for which California Department of Fish and Wildlife did not delineate plant alliances. As described in Section 2.3.1, Data Sources and Natural Community Classification, these areas were delineated to natural community from aerial photography interpretation.
c California Department of Fish and Wildlife vegetation types were combined in order to condense the list.
Bay Delta Conservation Plan Public Draft 2-38 November 2013
ICF 00343.12

Existing Ecological Conditions
Chapter 2
2.3.4.1.2 Fish and Wildlife 1
Zooplankton in the foodweb of the tidal perennial aquatic natural community consume phytoplankton 2 and detritus, and are fed upon by other consumers, such as fish and macroinvertebrates. Water salinity 3 is a major factor that influences the distribution of zooplankton species in the tidal perennial aquatic 4 natural community. In the brackish portions of the Plan Area, calanoid copepods (Eurytemora, 5 Pseudodiaptomus) and cyclopoid copepods (Limnoithona) are the primary zooplankton species, and 6 mysid shrimp (Neomysis) is the dominant macrozooplankton. In freshwater regions, cladocerans 7 (Daphnia) and calanoid copepods (Diaptomus, Limnocalanus) are the dominant zooplankton present 8 (Kimmerer and Orsi 1996; Kimmerer 2004; Gewant and Bollens 2005; Winder and Jassby 2010). 9
The tidal perennial aquatic natural community supports over 50 species of fish, approximately one-10 half of which are native (Table 2-6). It is used as habitat by fish for foraging, spawning, egg incubation 11 and larval development, juvenile nursery areas, and migratory corridors. Most species spend their 12 entire lives in the community while others may spend certain seasons or part of their lives in habitats 13 outside of the tidal perennial aquatic natural community depending on the state of physical factors 14 such as salinity, turbidity, dissolved oxygen, flow rates, and water temperature. Tidal perennial aquatic 15 habitat is the primary habitat type for all covered fish species (Table 2-4). The covered giant garter 16 snake is a terrestrial species known to forage in tidal perennial aquatic habitat (Table 2-4). 17
Table 2-6. Native and Nonnative Fish Species Found in the Plan Area 18
Family Common Name Scientific Name Native Species Acipenseridae Green sturgeon Acipenser medirostris
White sturgeon Acipenser transmontanus Atherinopsidae Topsmelt Atherinops affinis Catostomidae Sacramento sucker Catostomus occidentalis Clupeidae Pacific herring Clupea pallasii Cottidae Prickly sculpin Cottus asper
Pacific staghorn sculpin Leptocottus armatus Cyprinidae California roach Hesperoleucus symmetricus
Hitch Lavinia exilicauda Hardhead Mylopharodon conocephalus Sacramento blackfish Orthodon microlepidotus Sacramento splittail Pogonichthys macrolepidotus Sacramento pikeminnow Ptychocheilus grandis
Embiotocidae Tule perch Hysterocarpus traskii Engraulidae Northern anchovy Engraulis mordax Gasterosteidae Threespine stickleback Gasterosteus aculeatus Gobiidae Chameleon goby Tridentiger trigonocephalus Osmeridae Delta smelt Hypomesus transpacificus
Longfin smelt Spirinchus thaleichthys Petromyzontidae River lamprey Lampetra ayresii
Pacific lamprey Entosphenus tridentatus (formerly Lampetra tridentata)
Bay Delta Conservation Plan Public Draft 2-39 November 2013
ICF 00343.12

Existing Ecological Conditions
Chapter 2
Family Common Name Scientific Name Pleuronectidae Starry flounder Platichthys stellatus Salmonidae Rainbow/steelhead trout Oncorhynchus mykiss
Chinook salmon Oncorhynchus tshawytscha Nonnative Species Atherinopsidae Inland silverside Menidia beryllina Centrarchidae Pumpkinseed Lepomis gibbosus
Warmouth Lepomis gulosus Green sunfish Lepomis cyanellus Redear sunfish Lepomis microlophus Bluegill Lepomis macrochirus Redeye bass Micropterus coosae Smallmouth bass Micropterus dolomieu Spotted bass Micropterus punctulatus Largemouth bass Micropterus salmoides Black crappie Pomoxis nigromaculatus White crappie Pomoxis annularis
Clupeidae American shad Alosa sapidissima Threadfin shad Dorosoma petenense
Cyprinidae Goldfish Carassius auratus auratus Red shiner Cyprinella lutrensis Common carp Cyprinus carpio Golden shiner Notemigonus crysoleucas Fathead minnow Pimephales promelas
Fundulidae Rainwater killifish Lucania parva Gobiidae Yellowfin goby Acanthogobius flavimanus
Shokihaze goby Tridentiger barbatus Shimofuri goby Tridentiger bifasciatus
Ictaluridae Brown bullhead Ameiurus nebulosus Black bullhead Ameiurus melas White catfish Ameiurus catus Channel catfish Ictalurus punctatus
Moronidae Striped bass Morone saxatilis Osmeridae Wakasagi Hypomesus nipponensis Percidae Bigscale logperch Percina macrolepida Poeciliidae Western mosquitofish Gambusia affinis Source: U.S. Fish and Wildlife Service, Stockton Office, unpublished data.
1
In addition to its value as habitat for fish, the tidal perennial aquatic natural community provides 2 reproduction, feeding, and resting habitat for many species of mammals and birds. Open water areas 3 supply habitat for rest and foraging by water birds, especially during heavy winter storms when 4 open coastal waters become rough. Bird species that use open water include loons, gulls, 5 cormorants, and diving ducks (CALFED Bay-Delta Program 2000). A number of state and federally 6
Bay Delta Conservation Plan Public Draft 2-40 November 2013
ICF 00343.12

Existing Ecological Conditions
Chapter 2
listed birds feed on fish in the tidal perennial aquatic natural community, including the bald eagle, 1 and California least tern. 2
2.3.4.1.3 Nonnative Species 3
The tidal perennial aquatic natural community has been heavily affected on nearly every trophic 4 level by the introductions of a number of nonnative species. These nonnative species have had 5 substantial adverse effects on the physical habitat and the foodweb, ultimately affecting the growth 6 and survival of the species covered under the BDCP. Successful nonnatives tend to be better suited 7 than natives to anthropogenic changes to the tidal perennial aquatic natural community. Successful 8 nonnatives generally do not experience the same population controls (i.e., competition, predation, 9 parasitism, and disease) that were present in their place of native origin, resulting in rapid 10 population expansion where they are introduced. 11
The introduction of two nonnative invasive aquatic plants, water hyacinth and Egeria, has reduced 12 habitat quantity and value for many native fishes in the Plan Area. Water hyacinth primarily occurs 13 in the south Delta upstream of Antioch (CalFlora 2011). Under ideal conditions, it is capable of 14 extremely rapid growth and can tolerate wide ranges in nutrient concentration, pH, and 15 temperature (Batcher 2000). The species grows as dense floating mats that can greatly reduce 16 primary productivity within the water column (National Marine Fisheries Service 2004). Egeria is 17 widely distributed in freshwater areas of the Delta, growing along the margins of channels and in 18 shallow bays in dense stands that restrict the access of juvenile fish to shallow water habitat. The 19 dense vegetative cover created by these two invasive species provides excellent habitat for 20 nonnative ambush predators such as bass and sunfish. Egeria is also thought to reduce turbidity by 21 reducing water velocity, resulting in higher local precipitation of suspended matter from the water 22 column. The increased visibility creates better hunting conditions for nonnative ambush predators 23 (Brown and Michniuk 2007). 24
Introduction of the highly efficient filter-feeding Potamocorbula led to a decline in abundance of the 25 native copepod, Eurytemora, This was followed by establishment of a nonnative copepod, 26 Pseudodiaptomus (Kimmerer and Orsi 1996). Eurytemora can still be abundant during spring, but its 27 populations are replaced by Pseudodiaptomus in late spring. Although native fishes, including delta 28 smelt and larval longfin smelt, can switch between these two copepod prey species, because 29 Pseudodiaptomus is more elusive than Eurytemora, a decrease in the abundance of Eurytemora can 30 lead to lower fish foraging efficiency leading to reduced growth rates and the starvation of native 31 fishes (Moyle 2002). More recently, the cyclopoid copepod, Limnoithona, has rapidly become the most 32 abundant copepod in the Delta after its introduction in 1993 (Hennessey and Hieb 2007). This species 33 is hypothesized to be a low-quality food source and intraguild predator of calanoid copepods such as 34 Eurytemora and Pseudodiaptomus (Resources Agency et al. 2007). 35
A variety of macroinvertebrates has been introduced into the tidal perennial aquatic natural 36 community with varying impacts. The Chinese mitten crab experienced a population bloom in 1997 37 that overwhelmed the fish screening facilities associated with the Jones and Banks Pumping Plants, 38 but has been uncommon since then. Other potential adverse effects of Chinese mitten crab include 39 physical impacts, because the crabs burrow into soft sediment and reduce levee stability; ecological 40 impacts, because the crabs are omnivorous, voracious, and experience population booms; and 41 economic impacts, because the crabs are known to eat rice shoots. The introductions of two clams 42 from Asia, Potamocorbula and the Asian clam, have led to major alterations in the foodweb in the 43 Delta. Potamocorbula is most abundant in brackish and saline water while the Asian clam is most 44
Bay Delta Conservation Plan Public Draft 2-41 November 2013
ICF 00343.12
Existing Ecological Conditions
Chapter 2
abundant in fresh water; therefore, Potamocorbula is most abundant in Suisun Bay and the western 1 Delta, and the Asian clam is most abundant in the central Delta. These species are highly efficient 2 filter feeders that significantly reduce phytoplankton and zooplankton concentrations in the water 3 column, which results in reduced food availability for native fishes, such as delta smelt and young 4 Chinook salmon (Kimmerer and Orsi 1996; National Marine Fisheries Service 2004; Center for 5 Biological Diversity 2007). In addition to its adverse effects on Eurytemora, Potamocorbula clam has 6 been implicated in the reduction of the native opossum shrimp, Neomysis, a preferred food of Delta 7 native fishes such as Sacramento splittail and longfin smelt (Feyrer 1999; Moyle 2002). 8
There is also a high level of concern that the Delta will, within the next decade, suffer invasion by the 9 dreissinid mussels, Dreissena polymorpha (the zebra mussel) and Dreissena bugensis (the quagga 10 mussel). These European species were introduced in eastern North America (the Great Lakes) in 11 1988 and have spread rapidly since then, with the first California detections along the lower 12 Colorado River in 2007 and then at San Justo Reservoir near Salinas in 2008. These filter feeders 13 threaten the stability of foodwebs and represent a potentially major maintenance problem at water 14 diversion facilities. However, these species require fresh water with a suitable concentration of 15 dissolved calcium in order to survive. The potential distribution of dreissinid mussel habitat in the 16 Delta has been described by Claudi and Prescott (2011), who examined water chemistry data for 17 sites in the SWP and found that, within the Plan Area, the Sacramento River at Hood does not 18 provide suitable water chemistry, but that marginally suitable water chemistry occurs at most SWP 19 facilities in the south Delta. The south Delta can therefore be regarded as at risk for dreissinid 20 mussel invasion. 21
A large number of nonnative fishes have been introduced into the tidal perennial aquatic natural 22 community of the Delta. Many of the species were introduced for sportfishing (striped bass, 23 largemouth bass, smallmouth bass, bluegill, and sunfish); as forage for sportfish (threadfin shad, 24 golden shiner, and fathead minnow); for human food use (common carp, brown bullhead, and white 25 catfish); and from either deliberate or undeliberate release from the aquarium trade or from ballast 26 water release (yellowfin goby, shimofuri goby, and shokihaze goby) (Moyle 2002). Although no 27 introduction of a nonnative fish has unambiguously caused the extinction of a native species in the 28 Delta (Cohen and Carlton 1995), it is suspected that nonnative introductions have significantly 29 contributed to the decline of some native species due to predation and competition for shared 30 resources. For example, smallmouth bass have been associated with the decline in hardhead, a 31 native minnow found in the Delta, and introductions of several centrarchid species (sunfish and 32 black basses) have been associated with the extirpation of the native Sacramento perch from the 33 Delta. 34
2.3.4.1.4 Ecosystem Functions 35
The physical habitat provided by the tidal perennial aquatic natural community supports much of 36 the aquatic Delta foodweb. This is an extremely complex system, and many details are provided in 37 the Delta Regional Ecosystem Restoration Implementation Plan (DRERIP) Foodweb Model (Durand 38 2008). Use of the habitat by individual species is often determined by multiple physical factors (e.g., 39 flow, water salinity, wind, tide, and temperature), many of which vary at multiple temporal scales 40 (Kimmerer 2004). Phytoplankton and zooplankton spend their entire lives in the water medium. As 41 described above, resident and migratory fish use tidal perennial aquatic habitat for spawning, 42 rearing, foraging, and escape cover (CALFED Bay-Delta Program 2000). Young Chinook salmon 43 forage in these productive waters as fry and juveniles to put on critical weight before entering the 44 ocean. Changes in physical attributes of the water column, such as flow and water temperature, 45
Bay Delta Conservation Plan Public Draft 2-42 November 2013
ICF 00343.12

Existing Ecological Conditions
Chapter 2
provide environmental cues for some species to trigger the timing of biological events, such as 1 migration and spawning. 2
The tidal perennial aquatic natural community is used for foraging, resting, and escape cover by 3 shorebirds, wading birds, and waterfowl. River otters and beavers use this habitat for much of their 4 semiaquatic lives. The tidal perennial aquatic natural community supports a soft sediment 5 community consisting primarily of invertebrates, including mollusks, crustaceans, and worms. 6
The tidal perennial aquatic natural community plays a primary role in the formation and 7 maintenance of tidal wetlands (Culberson et al. 2004). As sediments accumulate in the tidal aquatic 8 bed, areas of shallow water increase, and the opportunity for establishment of emergent vegetation 9 increases. Over time, this vegetation may give rise to wetland and riparian communities. 10
2.3.4.1.5 Environmental Gradients 11
The tidal perennial aquatic natural community includes an ecologically important water depth 12 gradient. Many species of phytoplankton, zooplankton, macroinvertebrates, and fish occupy 13 different depths along this gradient depending on their individual physical needs (e.g., light level, 14 temperature, and water velocity). The tidal perennial aquatic natural community also serves as an 15 important link between upstream and downstream ecosystems. Much of the productivity, organic 16 matter, and inorganic sediment from upstream waterways and marshes eventually move into this 17 community and moves downstream to the Pacific Ocean. In the Plan Area, saline water from coastal 18 oceanic water is diluted by fresh water flowing in from rivers (Ellison 1983). This mixture of fresh 19 and oceanic water forms a salinity gradient that varies by area and location with seasonal variations 20 in freshwater outflow and tidal action. This gradient drives the location of species that depend on a 21 specific salinity level. The location of this gradient varies on multiple time scales: daily tides, 22 monthly lunar cycle, intra-annual (seasonal) flow patterns, interannual flow variation from 23 interannual rainfall variation, and long-term global climate change (Section 2.3.4.1.6, Future 24 Conditions with Climate Change) (Kimmerer 2004). CCWD (2010), reviewing available data on salinity 25 changes during historical times, concluded that “the boundary between salt and fresh water is now 3 26 to 15 miles farther into the Delta than it would have been without the increased diversions of fresh 27 water that have taken place in the past 150 years.” 28
The tidal perennial aquatic natural community extends shoreward to shallower subtidal zone 29 habitat where light penetrates to the bottom under normal conditions. In this habitat, a distinct 30 benthic flora and fauna exist that rely on light for energy. 31
2.3.4.1.6 Future Conditions with Climate Change 32
As described in Section 2.3.3.2, Climate, atmospheric temperatures are projected to increase at an 33 accelerating pace from 3.6 to 9°F (2 to 5°C) by the end of the century (Cayan et al. 2009). Depending 34 upon the general-circulation model used, there are variable predictions for precipitation change, 35 with most models simulating a slight decrease in average precipitation (Dettinger 2005; California 36 Climate Change Center 2006). The Mediterranean-type climate seasonal precipitation experienced 37 in the Plan Area is expected to continue, with most precipitation falling during the winter season 38 and originating from North Pacific storms. Although the amount of precipitation is not expected to 39 change dramatically over the next century, seasonal and interannual variations in precipitation will 40 likely increase as it has over the past century (California Department of Water Resources 2006). 41 With more precipitation falling as rain instead of snow and the snowpack melting earlier, greater 42 peak flows will result during the rainy season and lower flows during the dry season. Knowles and 43
Bay Delta Conservation Plan Public Draft 2-43 November 2013
ICF 00343.12

Existing Ecological Conditions
Chapter 2
Cayan (2004) predict that inflows will increase by 20% from October through February and 1 decrease by 20% from March through September. This change in the annual hydrograph could affect 2 species in the tidal perennial aquatic natural community in a number of ways. Many species that 3 inhabit the tidal perennial aquatic natural community have evolved to use environmental cues, such 4 as changes in flows and temperature, to trigger the timing of biological events, such as migration 5 and spawning. Changes in these factors due to global climate change may lead to confusion by these 6 species as to the timing of these natural events and may affect their growth, production, and 7 survival. Reduced outflow from the Delta during the dry season and rising sea level would increase 8 the extent of saltwater intrusion into the Delta (Knowles and Cayan 2002, 2004). Such changes could 9 relocate the extent of tidal influence and the LSZ farther upstream. This relocation of the LSZ could 10 influence the amount of rearing habitat available to native estuarine species (U.S. Fish and Wildlife 11 Service 2004). Reduced flow into the Delta during summer and fall could also lead to increased 12 residence time during these seasons, likely exacerbating high water temperature and low dissolved 13 oxygen problems that already occur in localized areas of the Delta. Toxic substances may also 14 accumulate during the summer and fall as the flow-driven flushing action decreases. 15
Sea level rise could have negative effects on fish that rely on shallow water habitat by deepening 16 preferred shallow water areas of the Delta and changing them to the less-preferred deepwater 17 zones. At the same time, sea level rise will inundate lands that are not currently flooded, potentially 18 creating more shallow water and floodplain areas. This will benefit species that use floodplains as 19 rearing habitat. 20
Sea level rise is predicted to be an especially significant factor in the Plan Area, where much of the 21 land has subsided to below sea level and is currently protected from flooding by levees. The current 22 subsided island condition, combined with higher sea level, increased winter river flooding, and more 23 intense winter storms, will significantly increase the hydraulic forces on the levees. With sea level 24 rise exacerbating current conditions, a powerful earthquake in the region could collapse levees, 25 leading to major seawater intrusion and flooding throughout the reclaimed lands of the Delta, 26 altering the tidal prism, and causing substantial changes to the tidal perennial aquatic natural 27 community (Mount and Twiss 2005). 28
Warmer water temperatures from future climate change would be detrimental to temperature-29 dependent native fish species in the tidal perennial aquatic natural community by altering the 30 timing of optimal temperature regimes needed for fish spawning, rearing, and migration (Bennett 31 2005; Lindley et al. 2007). High temperatures can also cause sublethal (e.g., heat shock proteins) and 32 lethal effects to specific life stages of some fish and other organisms in the community. Warmer 33 temperatures could promote the success of nonnative species, such as centrarchids (e.g., black 34 basses, sunfish) and cyprinids (e.g., carp), that spawn during periods with warmer water 35 temperatures (Moyle 2002). 36
2.3.4.2 Tidal Mudflat 37
The tidal mudflat natural community typically occurs as mostly unvegetated sediment deposits in 38 the intertidal zone between the mean higher high tide and the MLLW. The community is typically 39 associated with the tidal freshwater and tidal brackish emergent wetland communities at its upper 40 edge and the tidal perennial aquatic community at its lower edge. The tidal mudflat natural 41 community is ephemeral and owes its physical existence to sediment erosion and deposition 42 processes that differ throughout the Delta and Suisun Marsh, and its biological characteristics to 43 plant succession (Golden and Fiedler 1991; Fiedler and Zebell 1993; Witham and Kareofelas 1994; 44
Bay Delta Conservation Plan Public Draft 2-44 November 2013
ICF 00343.12

Existing Ecological Conditions
Chapter 2
Zebell and Fiedler 1996; Cappiella et al. 1999; Meisler 2002; Ruhl and Schoellhamer 2004; McKee et 1 al. 2006; Witham 2006). Inflows to the Delta import suspended sediment, and the resuspension and 2 deposition of that sediment are critical accretion factors. Wave energy dissipation and levee 3 maintenance are typical erosion factors. The rate of plant succession on the sediments will vary 4 depending on the supply of plant propagules and the distance to plants that can colonize the 5 sediment by extending their root systems. 6
The tidal mudflat natural community was not mapped separately in the GIS datasets used for the 7 BDCP. Instead, it was subsumed within the mapped areas of tidal freshwater emergent wetland, 8 tidal brackish emergent wetland, and tidal perennial aquatic natural communities. GIS models were 9 used to estimate the extent of habitat for species that use mudflats (Appendix 2.A, Covered Species 10 Accounts). 11
2.3.4.2.1 Vegetation 12
The tidal mudflat natural community is generally not vegetated when considered at fine scales, but 13 patches of two small covered plant species, covered plant species Mason’s lilaeopsis and delta 14 mudwort (Table 2-4), are found in this community type. The former is more abundant in brackish 15 areas and the latter is more abundant in freshwater areas (Golden and Fiedler 1991; Fiedler and 16 Zebell 1993; Zebell and Fiedler 1996; Meisler 2002; Fiedler et al. 2007). Plant species in mudflats 17 are quite sensitive to inundation period and the plant community changes with very slight changes 18 in elevation and inundation period. 19
2.3.4.2.2 Fish and Wildlife 20
An important wildlife habitat function of the tidal mudflat natural community is as foraging habitat 21 for probing shorebirds, including godwits, willets, and sandpipers. This habitat function only exists 22 for shorebirds when the area of mudflat is exposed by the tides. This community supports an 23 extensive invertebrate community that consists of benthic and interstitial species (crustaceans, 24 bivalves, gastropods, aquatic insects, and polychaetes) that provide forage to shorebirds. Other 25 wildlife may access the tidal mudflat natural community occasionally, but there is little habitat value 26 for these species. 27
When the tidal mudflat natural community is inundated, it serves as shallow open water habitat for 28 pelagic fish species. These species can use tidal mudflat habitat as a shallow water refugia from 29 predators and forage on benthic invertebrates. Smaller benthic fish species, such as gobies, flatfish, 30 and sculpin inhabit the tidal mudflat natural community at low tide if depressions in the mud 31 support pooled water. All of the covered fish species benefit from the refugia habitat and foodweb 32 contribution of the tidal mudflat community (Table 2-4). California clapper rail is a covered wildlife 33 species that is supported by the tidal mudflat community (Table 2-4). 34
2.3.4.2.3 Nonnative Species 35
There are no available data regarding the impacts of nonnative invasive species on this community. 36 Where tidal mudflat exists within the valley/foothill riparian natural community, problematic plant 37 species are likely to include giant reed (Arundo donax) and perennial pepperweed (Lepidium 38 latifolium). 39
Bay Delta Conservation Plan Public Draft 2-45 November 2013
ICF 00343.12

Existing Ecological Conditions
Chapter 2
2.3.4.2.4 Ecosystem Functions 1
At lower intertidal elevations, the tidal mudflat natural community functions as foraging area for 2 waterfowl and shorebirds; and at higher intertidal elevations, it also functions as unoccupied 3 sediment that can be colonized by small stature plant species such as Mason’s lilaeopsis and delta 4 mudwort, which are covered species. 5
2.3.4.2.5 Environmental Gradients 6
The tidal mudflat natural community occupies a narrow transition zone between tidal perennial 7 aquatic and tidal brackish emergent wetland, tidal freshwater emergent wetland, or valley/foothill 8 riparian. In general, it provides habitat in the lower portion of the tidal range between the mean low 9 tide and extreme low tide where emergent plants typically cannot establish. However, in disturbed 10 sediment depositional areas along natural and artificial levees it provides ephemeral microhabitats 11 within other natural communities when vegetation is removed. 12
2.3.4.2.6 Future Conditions with Climate Change 13
Sea level rise is expected to shift the tidal mudflat natural community to higher elevations in areas 14 where the topography rises gradually; however, where steep levee sides are present, it would 15 diminish in areal extent. The tidal mudflat natural community is sensitive to sedimentation and 16 erosion processes (Ruhl and Schoellhamer 2004). If sediment delivery rates do not match sediment 17 export rates, the extent of the tidal mudflat natural community will change until a steady state 18 between supply and export is reached. It is unclear how climate change will affect these processes, 19 but a lack of sediment supply to the Delta and Suisun Marsh will likely decrease the extent of this 20 community (Cappiella et al. 1999; Ganju and Schoellhamer 2010). 21
2.3.4.3 Tidal Brackish Emergent Wetland 22
The tidal brackish emergent wetland natural community is a transitional community between the 23 tidal perennial aquatic and terrestrial upland communities. In the Plan Area, tidal brackish emergent 24 wetland exists from near Collinsville westward to the Carquinez Strait. While it is also present on 25 the south side of Suisun Bay and on islands in midchannel, most of its extent is within Suisun Marsh. 26 The distribution of the tidal brackish emergent wetland natural community in the Plan Area is 27 shown in Figure 2-14 and the classification units used to map the community are provided in Table 28 2-7. 29
Table 2-7. Map Classifications in Tidal Brackish Emergent Wetland Natural Community in the Plan 30 Area 31
Map Classification Acreage in Plan Area Scirpus californicus/S. acutus 1,131 Typha species (generic) 1,032 Scirpus (californicus or acutus)-Typha sp. 920 Typha angustifolia/S. americanus 849 Scirpus (californicus or acutus)/Wetland 544 Annual Grasses generic 331 Distichlis-Juncus-Triglochin-Glaux 326 Phragmites australis 293
Bay Delta Conservation Plan Public Draft 2-46 November 2013
ICF 00343.12

Existing Ecological Conditions
Chapter 2
Map Classification Acreage in Plan Area Distichlis/S. americanus 277 Scirpus (californicus or acutus)/Rosa 246 Scirpus americanus/Potentilla 218 Scirpus americanus (generic) 211 Typha angustifolia/Distichlis 190 Undeterminedb 173 Typha angustifolia/Phragmites 167 Lepidium (generic) 162 Phragmites/Scirpus 116 Ditches and Sloughsc 104 Distichlis/Annual Grasses 103 Calystegia/Euthamia 97 Flooded Managed Wetland 84 Distichlis spicata 78 Scirpus americanus/S. Californicus-S. acu 73 Rosa californica 65 Rubus discolor 46 Salicornia/Annual Grasses 44 Distichlis/Salicornia 41 Eucalyptus globulus 41 Wetland Herbsb 36 Distichlis/Juncus 36 Potentilla anserina (generic) 36 Typha angustifolia/Polygonum-Xanthium-Ech 36 Wetland Graminoidsc 31 Lolium (generic) 29 Rosa/Baccharis 28 Scirpus americanus/Lepidium 25 Raphanus sativus (generic) 22 Arundo donax 20 Lepidium/Distichlis 20 Polygonum-Xanthium-Echinochloa 16 Typha angustifolia (dead stalks) 16 Foeniculum vulgare 14 Baccharis/Annual Grasses 13 Salicornia virginica 12 Annual Grasses/Weeds 12 Lolium/Rumex 11 Conium maculatum 10 Bare Ground 10 Juncus balticus/Lepidium 9
Bay Delta Conservation Plan Public Draft 2-47 November 2013
ICF 00343.12

Existing Ecological Conditions
Chapter 2
Map Classification Acreage in Plan Area Juncus balticus 8 Atriplex triangularis 8 Distichlis/Lotus 6 Structure 5 Upland Herbsc 5 Scirpus maritimus 5 Tidal Mudflat 5 Rumex (generic) 5 Atriplex/Distichlis 5 Distichlis (generic) 4 Centaurea (generic) 4 Leymus (generic) 4 Juncus balticus/Potentilla 4 Brassica nigra (generic) 4 Lotus corniculatus 3 Salicornia (generic) 2 Medium Upland Shrubs 2 Cortaderia selloana 2 Grindelia stricta var stricta 2 Phalaris aquatica 2 Scirpus maritimus/Salicornia 1 Freshwater Drainage 1 Distichlis/S. maritimus 1 Landscape Trees 1 Perennial Grass 1 Distichlis/Cotula 1 Carpobrotus edulis 1 Cotula coronopifolia 1 Salicornia/Atriplex 1 Atriplex/Annual Grasses 1 Fraxinus latifolia 1 Total 8,501 a Due to the large number of very fine scale mapping units the units shown here are the totals based on
the dominant species. Additionally, for Suisun Marsh, San Francisco Estuary Institute (2005) tidal data were used and intersected with the Boul and Keeler-Wolf (2008) vegetation data. For detailed information on these mapping units and plant associations/alliances, as well as on methods of classification used, see Hickson and Keeler-Wolf (2007) and Boul and Keeler-Wolf (2008).
b Additional mapping efforts undertaken in 2011 and 2012 in Suisun Marsh classify mapping units to the natural community type as described in Section 2.3.1, Data Sources and Natural Community Classification.
c CDFW vegetation types were combined in order to condense the list. 1
Bay Delta Conservation Plan Public Draft 2-48 November 2013
ICF 00343.12

Existing Ecological Conditions
Chapter 2
The tidal brackish emergent wetland natural community in the Plan Area is found in undiked areas 1 of Suisun Marsh such as Rush Ranch and Hill Slough, along undiked shorelines on the south shore of 2 Suisun Bay, and on undiked in-channel islands such as Brown’s Island. Prior to anthropogenic 3 hydrologic modifications, the tidal brackish emergent wetland natural community comprised an 4 estimated 69,000 acres of Suisun Marsh (Boul and Keeler-Wolf 2008) but only 12%, or 8,351 acres, 5 remain. At any particular place within this community, the composition of the dominant plant 6 species is controlled by salinity in the channel water and in soil pore water (Culberson 2001; 7 Culberson et al. 2004). Salinity levels in the channels are controlled by local sources of fresh water, 8 seasonal outflow through the Delta and long term climatic variations, semidiurnal tides, and through 9 the operation of a number of water control structures (Byrne et al. 2001; Culberson 2001; Suisun 10 Ecological Workgroup 2001; Brown 2004; Culberson et al. 2004; Malamud-Roam and Ingram 2004; 11 Malamud-Roam et al. 2006; Malamud-Roam et al. 2007; Watson and Byrne 2009). 12
The effects of channel water salinity are attenuated with distance away from the channel. 13 Evapotranspiration through the dry season drives increases in soil pore water salinity that is not 14 flushed away by tidal influences (Culberson 2001; Culberson et al. 2004; Watson and Byrne 2009). 15 This results in higher salinity in the soil pore water of the channel/marsh transition zone and 16 highest salinity levels in the marsh plain (Culberson 2001; Culberson et al. 2004). Additionally, 17 within the marsh plain, depressions and small ponds may support vegetation adapted to less saline 18 conditions (Suisun Ecological Workgroup 2001). Because soil pore water salinity and distance from 19 channel, and not elevation, are the primary drivers of vegetation composition in these brackish 20 marshes, the distributions of saltgrass and pickleweed in the marsh plain proper are driven by 21 subtle differences in inundation duration (Culberson 2001; Culberson et al. 2004; Watson and Byrne 22 2009). Because the extent of the community is determined by dynamic salinity gradients, the 23 vegetation is also naturally spatially and temporally variable and this variability leads to high plant 24 diversity compared to tidal saline marshes (Watson and Byrne 2009). 25
Soils underlying the tidal brackish emergent wetland natural community are heavily influenced by 26 suspended sediment along the channels and by the formation of peat beds away from the channels 27 (Culberson 2001; Culberson et al. 2004). The rate of peat accumulation in the marsh plain is slow 28 due to the low productivity of the small stature dominant plants, but has been sufficiently rapid to 29 maintain its surface with increases in sea level (Culberson et al. 2004). 30
2.3.4.3.1 Vegetation 31
The tidal brackish emergent wetland natural community in the Plan Area is characterized by tall 32 herbaceous hydrophytes that line the channels down to approximately 18 inches below MLLW with 33 species that include hard-stem bulrush (Schoenoplectus acutus), California bulrush (Schoenoplectus 34 californicus), common reed (Phragmites australis), and cattail (Typha spp.) (Culberson 2001; Suisun 35 Ecological Workgroup 2001; Watson and Byrne 2009). The borders of first order channels and 36 mosquito ditches, which mimic small channels, are also habitat for Suisun thistle (Cirsium 37 hydrophilum var. hydrophilum), a covered species (U.S. Fish and Wildlife Service 2009a). These same 38 large species occur as clumps in the channel to marsh transition zone and share the zone with many 39 other species such as saltgrass (Distichlis spicata), Baltic rush (Juncus balticus), and seaside arrow 40 grass (Triglochin maritima). The boundary between the distant edge of the transition zone and 41 marsh plain is gradual, and this is where the soft bird’s-beak (Cordylanthus mollis ssp. mollis), a 42 covered species, occurs with pickleweed, saltgrass, salt marsh dodder (Cuscuta salina), and 43 spearscale (Atriplex triangularis) (Grewell 2005; U.S. Fish and Wildlife Service 2009b). The marsh 44 plain proper is dominated by a variable mixture of pickleweed and saltgrass. Covered plant species 45
Bay Delta Conservation Plan Public Draft 2-49 November 2013
ICF 00343.12

Existing Ecological Conditions
Chapter 2
that depend on the tidal brackish emergent wetland natural community include Delta tule pea5, 1 Mason’s lilaeopsis, and Suisun Marsh aster (Table 2-4). 2
2.3.4.3.2 Fish and Wildlife 3
The tidal brackish emergent wetland natural community in the Plan Area is productive wildlife 4 habitat. The vegetation and associated waterways provide food and cover for numerous species of 5 birds (e.g., waterfowl, wading birds), mammals, reptiles, and emergent aquatic insects. Many species 6 rely on these emergent wetlands for their entire life cycle. Covered wildlife species that depend on 7 the tidal brackish emergent wetland natural community include salt marsh harvest mouse, Suisun 8 shrew, California black rail, California clapper rail, and Suisun song sparrow. Western pond turtle 9 also uses this natural community, and it provides potential roosting habitat for tricolored blackbird 10 during the nonbreeding season (Table 2-4). 11
When inundated, the tidal brackish emergent wetland natural community provides high-value fry 12 and juvenile rearing habitat for a variety of fish species adapted to low salinities, such as Pacific 13 lamprey, river lamprey, splittail, salmonids, and sturgeon. In addition, organic material is exported 14 from the community to provide food to nearby pelagic species, such as delta and longfin smelt. 15
2.3.4.3.3 Nonnative Species 16
The tidal brackish emergent wetland natural community and native plant and wildlife species 17 present in the community have been, and continue to be, significantly affected by invasive nonnative 18 taxa. Invading plant species can potentially alter the species composition of the vegetation, its 19 structure, and its chemical characteristics. Invasions of perennial pepperweed, which are often 20 accompanied by fennel (Foeniculum vulgare), are one of the most serious threats to this community 21 (Brown 2004; Vaghti and Keeler-Wolf 2004; Grewell 2005; San Francisco Estuary Institute 2006; 22 Environmental Science Associates 2007; Fiedler et al. 2007; Hickson and Keeler-Wolf 2007; Boul 23 and Keeler-Wolf 2008; Andrew and Ustin 2009; U.S. Fish and Wildlife Service 2009a; U.S. Fish and 24 Wildlife Service 2009b). This tall species commonly forms dense patches that exclude native species 25 including covered species such as soft bird’s-beak and Suisun thistle (Grewell 2005; Fiedler et al. 26 2007; U.S. Fish and Wildlife Service 2009a; U.S. Fish and Wildlife Service 2009b). Other large-stature 27 invasive plant species that are problematic include pampas grass (Cortaderia selloana), giant reed 28 (Arundo donax), and the nonnative genotype of common reed (Phragmites australis). These species 29 commonly establish and spread along channels, in the marsh plain transition zone, and along the 30 upland/marsh transition zone. Additionally, small nonnative annual grasses, particularly barbgrass 31 (Hainardia cylindrical) and rabbitsfoot grass (Polypogon monspeliensis), have significantly affected 32 covered species soft bird’s-beak by functioning as ineffective host plants to this hemiparasite 33 (Grewell 2005). 34
A number of nonnative animals are serious predators of native wildlife and have been shown to 35 significantly reduce populations of salt marsh harvest mouse, California black rail, and California 36 clapper rail, which are covered species (Suisun Ecological Workgroup 2001; Brown 2004). These 37 invasive and high-impact nonnative wildlife species include red fox (Vulpes vulpes), feral cats (Felis 38 domesticus), and rats (Rattus spp.) (Brown 2004; Takekawa et al. 2006). Additionally, ground 39
5 Although delta is not capitalized in the delta smelt, delta button celery, and delta mudwort, it is capitalized in Delta tule pea (CalFlora: http://www.calflora.org/cgi-bin/species_query.cgi?where-calrecnum=4606).
Bay Delta Conservation Plan Public Draft 2-50 November 2013
ICF 00343.12
Existing Ecological Conditions
Chapter 2
disturbances caused by foraging by feral pigs (Sus scrofa) are significantly affecting the covered 1 Suisun thistle (Fiedler et al. 2007; U.S. Fish and Wildlife Service 2009a). 2
2.3.4.3.4 Ecosystem Functions 3
Because it is connected to the Plan Area through the semidiurnal tidal cycle, the tidal brackish 4 emergent wetland natural community has both local ecosystem characteristics and is part of other 5 ecosystems through its contribution to the shared foodweb. Local effects are dominated by 6 vegetation productivity and decomposition rates, which affect tidal channel morphology and tidal 7 plain elevation (Culberson 2001; Culberson et al. 2004; Pearce 2004). Because the soil away from 8 the immediate channel margins is primarily peat, a dynamic equilibrium exists between sea level 9 changes, underground biomass production, and decomposition rates that control the extent of 10 emergent vegetation (Culberson 2001; Culberson et al. 2004). Additionally, the structure of the 11 vegetation provides cover for aquatic species in the channels and over the transition zone and 12 marsh plain when high tides flood the marsh (Brown 2004). Organic carbon and invertebrates 13 produced within this community are transported to the channels and then to the Delta where they 14 contribute significantly to the greater foodweb (Brown 2004). 15
2.3.4.3.5 Environmental Gradients 16
The tidal brackish emergent wetland natural community exists at the intersection of many gradients 17 that are spatially and temporally variable. The gradients are primarily determined by tidal flows, 18 which range from 300,000 to 600,000 cfs between Chipps Island and Carquinez Strait and 6,500 to 19 50,000 cfs in Montezuma Slough (Brown 2004). These large flows create fast currents in the smaller 20 channels, but the transport of materials into and out of the community depends on complex flow 21 dynamics (Brown 2004). The tidal surges create a large-scale salinity gradient that is manifested by 22 brackish water conditions that exist because of the mixing of fresh water from the Delta and local 23 creeks with oceanic water from San Francisco Bay. The longitudinal boundary between fresh and 24 brackish water is not discrete but generally occurs over a distance of several miles from Sherman 25 Island to the Carquinez Strait with smaller local boundaries where tributaries enter the northern 26 portion of Suisun Marsh. There is no clear definition of brackish water, but a salinity range of 5 to 27 15 ppt generally describes the channel water salinity in the areas where the tidal brackish emergent 28 wetland natural community is found (Conomos et al. 1985; Goman and Wells 2000; Culberson 2001; 29 Kimmerer 2004). The amount of fresh water available to dilute oceanic water is generally 30 determined by water management operations, sewage effluent discharge, and by winter creek and 31 Sacramento River flows. Within this community, a secondary soil pore water salinity gradient 32 develops between the channels and the marsh plain during the dry season as salts accumulate away 33 from the channels through evapotranspiration (Culberson 2001). An elevational gradient also exists 34 between the channels and the marsh plain with the dividing elevation at mean higher high water 35 (MHHW) (Goman and Wells 2000). Below MHHW, large clonal species dominate, while above 36 MHHW are mixtures of various large and small species. The combination of the salinity and 37 elevational gradients creates a wide range of physical habitats that lead to a high diversity of species 38 compared to salt and freshwater marshes (Watson and Byrne 2009). 39
2.3.4.3.6 Future Conditions with Climate Change 40
As with all intertidal communities, the tidal brackish emergent wetland natural community is by 41 definition directly linked to sea level as well as the ratio of salt to fresh water. As a result, it is 42 particularly sensitive to long-term sea level rise associated with global climate change and changes 43
Bay Delta Conservation Plan Public Draft 2-51 November 2013
ICF 00343.12

Existing Ecological Conditions
Chapter 2
in Delta discharge. In order to persist, the tidal brackish emergent wetland natural community must 1 be able to accrete sediments at sufficient rates to keep their surfaces intertidal (Watson and Byrne 2 2009); that rate will depend upon how changing salinity and inundation duration affects the species 3 composition of the wetland (Culberson et al. 2004; Watson and Byrne 2009). 4
2.3.4.4 Tidal Freshwater Emergent Wetland 5
The tidal freshwater emergent wetland natural community is typically a transitional community 6 between the tidal perennial aquatic, and valley/foothill riparian and various terrestrial upland 7 communities across a range of hydrologic and edaphic conditions. In the Plan Area, the tidal 8 freshwater emergent wetland natural community often occurs at the shallow, slow-moving, or 9 stagnant edges of freshwater waterways in the intertidal zone and is subject to frequent long duration 10 flooding. The distribution of the tidal freshwater emergent wetland natural community in the Plan 11 Area is shown in Figure 2-14, and the mapping classification units are provided in Table 2-8. 12
Table 2-8. Map Classifications in the Tidal Freshwater Emergent Wetland Natural Community in the 13 Plan Area 14
Map Classificationa Acreage in Plan Area
Scirpus acutus -Typha latifolia 2,168 Scirpus acutus - (Typha latifolia) - Phragmites australis 1,546 Scirpus acutus Pure 1,386 Scirpus acutus - Typha angustifolia 768 Scirpus californicus - Scirpus acutus 676 California Bulrush (Scirpus californicus) 419 Mixed Scirpus / Submerged Aquatics (Egeria-Cabomba-Myriophyllum spp.) complex 378 Common Reed (Phragmites australis) 354 Mixed Scirpus Mapping Unit 336 Mixed Scirpus / Floating Aquatics (Hydrocotyle - Eichhornia) Complex 323 Hard-stem Bulrush (Scirpus acutus) 170 American Bulrush (Scirpus americanus) 133 Narrow-leaf Cattail (Typha angustifolia) 96 Undeterminedb 84 Scirpus californicus - Eichhornia crassipes 14 Typha angustifolia - Distichlis spicata 3 California Hair-grass (Deschampsia caespitosa) 1 Deschampsia caespitosa - Lilaeopsis masonii 1 Total 8,856 a Some of the map classifications provided here are directly representative of associations, alliances, or
phases identified through field surveys. Others represent amalgamations of field data due to issues of scale or remote sensing. For more detailed information concerning these map classifications and plant associations/alliances/phases, as well as methods of classification used, see Hickson and Keeler-Wolf (2007).
b Portions of the Plan Area for which CDFW did not delineate plant alliances were mapped only to the natural community level as described in Section 2.3.1, Data Sources and Natural Community Classification.
15
Bay Delta Conservation Plan Public Draft 2-52 November 2013
ICF 00343.12

Existing Ecological Conditions
Chapter 2
The tidal freshwater emergent wetland natural community is distributed in narrow, fragmented 1 bands along island levees, in-channel islands, shorelines, sloughs, and shoals. Prior to the 1860s, it 2 comprised an estimated 87% of the Delta, with extensive marshes forming dense stands of 3 vegetation bisected by meandering channels (The Bay Institute 1998; Grossinger et al. 2008). Today, 4 remnant patches of this community are found in the western portion of the Delta near the 5 confluence of the Sacramento and San Joaquin Rivers, along Lindsey Slough and the Yolo Bypass, 6 along the mainstem and several channels of the San Joaquin, Old, and Middle Rivers, Lost Slough, 7 and the area where the Cosumnes and Mokelumne Rivers join the Delta. The loss and degradation of 8 its historical extent is due to its conversion to agriculture as well industrial and urban development; 9 and those losses have led to dramatic reductions in habitat that is available for associated fish and 10 wildlife species (The Bay Institute 1998; CALFED Bay-Delta Program 2000). Channelization, levee-11 building, removal of vegetation to stabilize levees, and upstream flood management have also 12 reduced the extent of this community and altered its ecological function through changes to flooding 13 frequency, inundation duration, and quantity of alluvial material deposition. 14
The tidal freshwater emergent wetland natural community occurs along a hydrologic gradient in the 15 transition zone between open water and riparian vegetation or upland terrestrial vegetation such as 16 grasslands or woodlands. In the Plan Area, there are often abrupt transitions to agricultural habitats 17 and managed wetland natural communities and along the boundaries formed by levees and other 18 artificial landforms. The environmental conditions that support the tidal freshwater emergent 19 wetland natural community are dynamic with frequent flooding disturbances and geomorphologic 20 changes (i.e., alluvial deposition and scouring). Its constituent species composition and ecosystem 21 functions are consequently variable in space and time (The Bay Institute 1998). Because of the 22 different sources of variability and the anthropogenically restricted area in which it can occur, the 23 community vegetation may be distributed in small patches or in occasional large areas. 24
Soils underlying the tidal freshwater emergent wetland natural community are heavily influenced 25 by inundation period, water flow, and alluvial deposition. They are hydric soils and when mineral-26 based, their texture can vary from clay to sand; and when based on organic material, can form peat 27 beds (Goman and Wells 2000; Hitchcock et al. 2005; Drexler et al. 2009a). The soils are typically 28 anaerobic due to frequent or permanent saturation with slow decomposition rates resulting in the 29 accumulation of organic debris in various stages of decomposition. The composition of the 30 vegetation is limited to relatively few dominant species that are tolerant of inundation and 31 anaerobic soil conditions and typically are not tolerant of saline or brackish conditions (Holland and 32 Keil 1995). 33
The natural topography of the Plan Area that supports this community is virtually flat, draining 34 gradually toward the center of the Delta and then westward toward Suisun Bay. Under natural 35 hydrologic conditions, deposits of alluvial material sometimes shifted due to scouring and 36 redeposition, and elevational differences of the vegetation from place to place were a function of 37 alluvium elevation and tidal inundation levels (Grossinger et al. 2008). Today, artificial levees 38 provide topographic barriers adjacent to waterways, and the inboard areas of many of the leveed 39 islands that historically supported this community have subsided below sea level (CALFED Bay-40 Delta Program 2000). In some cases, where levees have been breached and not repaired, portions of 41 the islands that have not significantly subsided support tidal freshwater emergent wetland (e.g., 42 northern Liberty Island); however, other deeply subsided islands that have flooded and have not 43 been reclaimed support the tidal perennial aquatic natural community due to deeper inundation by 44 floodwaters (e.g., Franks Tract, southern Liberty Island). 45
Bay Delta Conservation Plan Public Draft 2-53 November 2013
ICF 00343.12

Existing Ecological Conditions
Chapter 2
2.3.4.4.1 Vegetation 1
The tidal freshwater emergent wetland natural community is characterized by erect herbaceous 2 hydrophytes (Holland and Keil 1995). There are 17 plant community alliances (i.e., unique species 3 assemblages) mapped in the Plan Area that fall within the tidal freshwater emergent wetland 4 natural community (Table 2-8) (Sawyer and Keeler-Wolf 1995; Hickson and Keeler-Wolf 2007). The 5 typical vegetation of this type, as mapped by CDFW and adopted for vegetation mapping purposes, is 6 dominated by tall, perennial monocots that reproduce by seed as well as vegetatively through 7 rhizomes. However, the CDFW vegetation classification was based on vegetation structure and 8 species composition and did not consider ecosystem functions such as location within or above the 9 intertidal region along drainages. In many areas of what is functionally tidal freshwater emergent 10 wetland, woody species, especially willows (Salix spp.), occur in the intertidal region and 11 codominate the vegetation (Atwater 1980; Watson 2006; EDAW 2007a; Watson and Byrne 2009). 12 These intertidal areas with woody vegetation were not distinguishable in the CDFW dataset. 13
Cattails (Typha spp.) dominate the vegetation of this community along the Sacramento River; while 14 throughout the San Joaquin River area, bulrushes (Schoenoplectus americanus and Bolboschoenus 15 maritimus), tules (Schoenoplectus californicus and S. acutus), and common reed (Phragmites 16 australis) are more often the dominant species (Atwater 1980; Watson 2006; EDAW 2007a; Hickson 17 and Keeler-Wolf 2007; Watson and Byrne 2009). In the far western portion of the Delta, where tidal 18 waters are generally fresh but may be brackish during periods of low outflow, saltgrass becomes 19 common (Boul and Keeler-Wolf 2008). Numerous native and nonnative dicots and rooted aquatics 20 also commonly occur in the tidal freshwater emergent wetland natural community. Covered plant 21 species associated with the tidal freshwater emergent wetland natural community are presented in 22 Table 2-4, and include delta mudwort, Delta tule pea, Mason’s lilaeopsis, and Suisun Marsh aster. 23
2.3.4.4.2 Fish and Wildlife 24
The tidal freshwater emergent wetland natural community provides productive habitat for wildlife. 25 Its vegetation and associated waterways provide food and cover for numerous species of birds (e.g., 26 waterfowl, wading birds), mammals, reptiles, emergent aquatic insects, and amphibians. All of the 27 covered fish species use tidal freshwater emergent wetland habitat for foraging, juvenile rearing, 28 and refugia. Covered terrestrial wildlife species that rely on tidal freshwater emergent wetland for 29 habitat include California black rail, Suisun song sparrow, tricolored blackbird, giant garter snake, 30 western pond turtle, and California red-legged frog. (Table 2-4). 31
Although the remaining areas of tidal freshwater emergent wetlands in the Plan Area are highly 32 altered, they remain critical wintering grounds for migratory birds. A small number of wetland-33 associated species, such as waterfowl and egrets, have successfully adapted to foraging on some 34 types of croplands that were converted from historical wetland areas (California Department of Fish 35 and Game 2005). 36
Many of the species of fish that use the tidal perennial aquatic natural community for habitat will 37 also use the tidal freshwater emergent wetland natural community as habitat when it is inundated. 38 Younger stages (e.g., larvae and fry) of some species rear in shallow waters that support emergent 39 vegetation. Further, many fish species use emergent vegetation as refuge from predation and high 40 flows (The Bay Institute 1998). 41
Bay Delta Conservation Plan Public Draft 2-54 November 2013
ICF 00343.12

Existing Ecological Conditions
Chapter 2
2.3.4.4.3 Nonnative Species 1
One important invasive nonnative species that has become established in the tidal freshwater 2 emergent wetland natural community is giant reed (Arundo donax). This species grows as dense 3 monocultures, which shade and crowd out native plant species in this community (Dudley 2000). 4 Giant reed also consumes large amounts of water and has been known to dry up otherwise low-5 flowing, perennial streams. It is found growing along natural and artificial watercourses throughout 6 the Plan Area, but the acreage of the invasion is unknown (Hickson and Keeler-Wolf 2007). By 7 eliminating native plants, giant reed reduces food and habitat for a number of birds, insects, and 8 other wildlife. 9
This natural community is also at risk from potential invasion by dreissinid mussels, as detailed in 10 Section 2.3.4.1.3, Nonnative Species. 11
2.3.4.4.4 Ecosystem Functions 12
The tidal freshwater emergent wetland communities provide critical biogeochemical, hydrologic, 13 and geomorphic functions, as well as habitat for a variety of fish and wildlife; however, island 14 reclamation throughout the Delta, channelization, and anthropogenic changes to flow patterns have 15 dramatically altered the ecosystem function and habitat value of these wetlands in the Plan Area 16 (California Department of Fish and Game 2005). The tidal freshwater emergent wetland natural 17 community in the Delta provides habitat for microorganisms, macroinvertebrates, and insects that 18 form the base of the aquatic food chain. The vegetation also releases organic debris (drift) into the 19 waterways that is a source of nutrients and cover. The warm, shallow water and dense vegetation 20 that is often present in this community provides cover for some species and can be a key source of 21 aquatic food or prey for birds and larger wildlife (The Bay Institute 1998). Additionally, it provides 22 allochthonous sources of food and prey for fish and other aquatic species. 23
The tidal freshwater emergent wetland natural community also naturally absorbs or processes 24 influxes of nutrients that find their way into the aquatic system (nutrient transformation), thereby 25 acting as a biogeochemical buffer and contributing to the aquatic foodweb. 26
2.3.4.4.5 Environmental Gradients 27
The tidal freshwater emergent wetland natural community provides habitat on virtually all 28 exposures and slopes provided the surface is saturated or at least periodically flooded by tidal 29 action. However, level topography dominates in the Plan Area, and on the water-side of levees from 30 a depth of approximately 18 inches below MLLW, the community occurs as a distinct transition to 31 the levee bank upland vegetation. The upland limit of the habitat is generally the boundary between 32 hydric soils supporting predominantly hydrophytic vegetation and nonhydric soils on the levees 33 with primarily nonaquatic vegetation (Cowardin et al. 1979). The boundary between habitat 34 associated with the tidal freshwater emergent wetland natural community and deepwater habitats 35 is approximately 18 inches below MLLW (Atwater et al. 1979; Simenstad et al. 2000). 36
Where brackish conditions occur at the western edge of the Delta, Suisun Bay, and Suisun Marsh, the 37 tidal freshwater emergent wetland natural community merges into the tidal brackish emergent 38 wetland natural community that supports plant and wildlife that are tolerant of brackish water or 39 saline soil conditions. Physical factors that drive the location of gradients between community types 40 include elevation, salinity, and flow patterns at multiple temporal scales (e.g., daily tidal, lunar, 41 seasonal, interannual) (Culberson 2001; Watson 2006; Watson and Byrne 2009). 42
Bay Delta Conservation Plan Public Draft 2-55 November 2013
ICF 00343.12

Existing Ecological Conditions
Chapter 2
2.3.4.4.6 Future Conditions with Climate Change 1
As with all intertidal communities, the tidal freshwater emergent wetland natural community is by 2 definition directly linked to sea level. As a result, it is particularly sensitive to long-term sea level 3 rise associated with global climate change (Nicholls et al. 1999). Higher sea level will relocate the 4 natural community to higher elevations in the Delta. Further, tidally influenced waterways would be 5 relocated upstream, thus shifting the tidal freshwater emergent wetland natural community farther 6 upstream. Because much of the Delta is armored with levees, the sea level driven relocation of the 7 intertidal zone would be primarily vertical and not horizontal, likely resulting in a reduction in the 8 extent of the tidal freshwater emergent wetland natural community as it is replaced by deepwater 9 habitat (i.e., tidal perennial aquatic natural community) adjacent to steep-sided levees. The greatest 10 increase in the extent of this natural community will primarily occur along the periphery of the 11 Delta where there are gently sloping areas of upland (Knowles 2006). 12
In order for its extent to remain constant the tidal freshwater emergent wetland natural community 13 must accrete sediments, both influxes of mineral soil as well as local accumulations of peat, at a rate 14 high enough to keep its lowest surface above an elevation of 18 inches below MLLW (Atwater et al. 15 1979; Simenstad et al. 2000; Kimmerer 2004). Given the reductions in sediment loads over the past 16 half century (Section 2.3.2, Ecosystem Processes) (Cappiella et al. 1999; Wright and Schoellhamer 17 2004; Ganju and Schoellhamer 2010), and the possibility that peat accumulation may not keep pace 18 with accelerating sea level rise in the late long-term, it is likely that the extent of this community will 19 be reduced where its vegetation cannot colonize newly inundated uplands. 20
2.3.4.5 Valley/Foothill Riparian 21
Broadly defined, the valley/foothill riparian natural community is often found as a transition zone 22 between aquatic and terrestrial habitats and often expresses a wide range of environmental 23 conditions (e.g., variable light and nutrient availability) (Holland and Keil 1995; The Bay Institute 24 1998; Vaghti and Greco 2007). In the Plan Area, the valley/foothill riparian natural community 25 occurs along the margins of low-gradient perennial and intermittent waterways, floodplains, tidal 26 areas, or where the water table is sufficiently high to provide water to plants year-round (e.g., 27 oxbows) (CALFED Bay-Delta Program 2000; Vaghti and Greco 2007). The distribution of the 28 valley/foothill riparian natural community is shown in Figure 2-14, and the mapping classification 29 units used to represent its constituent vegetation elements are presented in Table 2-9. 30
The valley/foothill riparian natural community usually occurs in the Plan Area as long, linear 31 patches separating other terrestrial biological communities and agricultural or urban land, or in 32 low-lying, flood-prone patches near river bends, canals, or breached levees (Figure 2-14). Such areas 33 are located along many of the major and minor waterways, oxbows, and levees in the Plan Area, 34 including the Sacramento River, Deep Water Ship Channel, Yolo Bypass, and channels of the San 35 Joaquin River and the Delta. Patches of riparian vegetation are also found on the interior of leveed 36 Delta islands, along drainage channels and pond margins, and in abandoned low-lying fields. 37
Bay Delta Conservation Plan Public Draft 2-56 November 2013
ICF 00343.12

Existing Ecological Conditions
Chapter 2
Table 2-9. Map Classifications in the Valley/Foothill Riparian Natural Community in the Plan Area 1
Map Classificationa Acreage in Plan Area Valley Oak (Quercus lobata) 2,021 Salix gooddingii - Populus fremontii - (Quercus lobata-Salix exigua-Rubus discolor) 1,741 Salix lasiolepis - Mixed brambles (Rosa californica - Vitis californica - Rubus discolor) 1,537 Blackberry (Rubus discolor) 1,196 Salix exigua - (Salix lasiolepis - Rubus discolor - Rosa californica) 1,100 Cornus sericea - Salix lasiolepis / (Phragmites australis) 823 Undeterminedb 809 Quercus lobata / Rosa californica (Rubus discolor - Salix lasiolepis / Carex spp.) 802 Salix gooddingii / Wetland Herbs 652 Fremont Cottonwood (Populus fremontii) 646 Black Willow (Salix gooddingii) 638 Intermittently or Temporarily Flooded Deciduous Shrublands 537 Salix lasiolepis - (Cornus sericea) / Scirpus spp.- (Phragmites australis - Typha spp.) complex unit 488 Arroyo Willow (Salix lasiolepis) 461 Salix gooddingii - Quercus lobata / Wetland Herbs 429 Fremont Cottonwood - Valley Oak - Willow (Ash - Sycamore) Riparian Forest NFD Alliance 428 Alnus rhombifolia / Salix exigua (Rosa californica) 419 Quercus lobata - Alnus rhombifolia (Salix lasiolepis - Populus fremontii - Quercus agrifolia) 371 Quercus lobata - Fraxinus latifolia 304 Narrow-leaf Willow (Salix exigua) 294 White Alder (Alnus rhombifolia) 150 Salix gooddingii / Rubus discolor 143 Temporarily or Seasonally Flooded - Deciduous Forests 142 Cornus sericea - Salix exigua 122 Mixed Willow Super Alliance 117 California Dogwood (Cornus sericea) 117 California Wild Rose (Rosa californica) 98 Valley Oak (Quercus lobata) restoration 96 Black Willow (Salix gooddingii) - Valley Oak (Quercus lobata) restoration 93 Acacia - Robinia 86 Coast Live Oak (Quercus agrifolia) 84 Horsetail (Equisetum spp.) 83 Shining Willow (Salix lucida) 78 Quercus lobata - Acer negundo 68 Intermittently Flooded to Saturated Deciduous Shrubland 63 Giant Cane (Arundo donax) 61 Baccharis pilularis / Annual Grasses & Herbs 53 Box Elder (Acer negundo) 45 Valley Oak Alliance - Riparian 42
Bay Delta Conservation Plan Public Draft 2-57 November 2013
ICF 00343.12
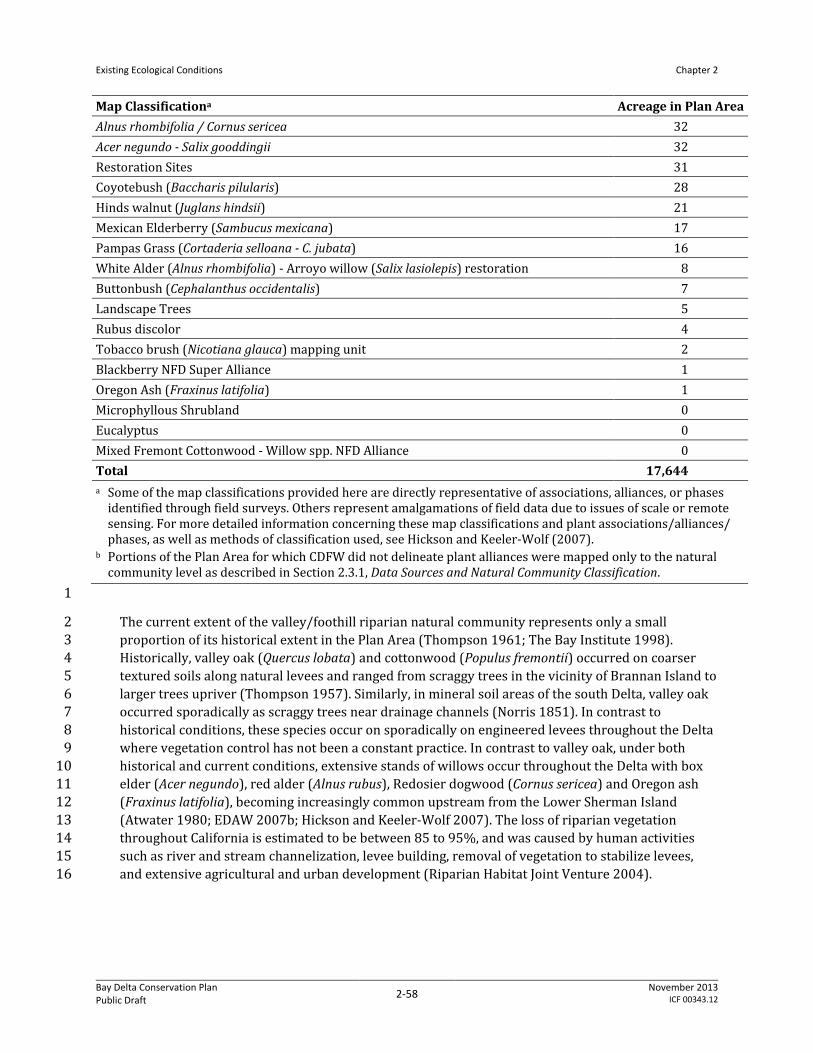
Existing Ecological Conditions
Chapter 2
Map Classificationa Acreage in Plan Area Alnus rhombifolia / Cornus sericea 32 Acer negundo - Salix gooddingii 32 Restoration Sites 31 Coyotebush (Baccharis pilularis) 28 Hinds walnut (Juglans hindsii) 21 Mexican Elderberry (Sambucus mexicana) 17 Pampas Grass (Cortaderia selloana - C. jubata) 16 White Alder (Alnus rhombifolia) - Arroyo willow (Salix lasiolepis) restoration 8 Buttonbush (Cephalanthus occidentalis) 7 Landscape Trees 5 Rubus discolor 4 Tobacco brush (Nicotiana glauca) mapping unit 2 Blackberry NFD Super Alliance 1 Oregon Ash (Fraxinus latifolia) 1 Microphyllous Shrubland 0 Eucalyptus 0 Mixed Fremont Cottonwood - Willow spp. NFD Alliance 0 Total 17,644 a Some of the map classifications provided here are directly representative of associations, alliances, or phases
identified through field surveys. Others represent amalgamations of field data due to issues of scale or remote sensing. For more detailed information concerning these map classifications and plant associations/alliances/ phases, as well as methods of classification used, see Hickson and Keeler-Wolf (2007).
b Portions of the Plan Area for which CDFW did not delineate plant alliances were mapped only to the natural community level as described in Section 2.3.1, Data Sources and Natural Community Classification.
1
The current extent of the valley/foothill riparian natural community represents only a small 2 proportion of its historical extent in the Plan Area (Thompson 1961; The Bay Institute 1998). 3 Historically, valley oak (Quercus lobata) and cottonwood (Populus fremontii) occurred on coarser 4 textured soils along natural levees and ranged from scraggy trees in the vicinity of Brannan Island to 5 larger trees upriver (Thompson 1957). Similarly, in mineral soil areas of the south Delta, valley oak 6 occurred sporadically as scraggy trees near drainage channels (Norris 1851). In contrast to 7 historical conditions, these species occur on sporadically on engineered levees throughout the Delta 8 where vegetation control has not been a constant practice. In contrast to valley oak, under both 9 historical and current conditions, extensive stands of willows occur throughout the Delta with box 10 elder (Acer negundo), red alder (Alnus rubus), Redosier dogwood (Cornus sericea) and Oregon ash 11 (Fraxinus latifolia), becoming increasingly common upstream from the Lower Sherman Island 12 (Atwater 1980; EDAW 2007b; Hickson and Keeler-Wolf 2007). The loss of riparian vegetation 13 throughout California is estimated to be between 85 to 95%, and was caused by human activities 14 such as river and stream channelization, levee building, removal of vegetation to stabilize levees, 15 and extensive agricultural and urban development (Riparian Habitat Joint Venture 2004). 16
Bay Delta Conservation Plan Public Draft 2-58 November 2013
ICF 00343.12

Existing Ecological Conditions
Chapter 2
2.3.4.5.1 Vegetation 1
CDFW identified 41 plant community alliances (i.e., unique species assemblages) in the Delta that 2 fall within the valley/foothill riparian natural community (Table 2-9) (Sawyer and Keeler-Wolf 3 1995; Hickson and Keeler-Wolf 2007). The most common riparian plant associations in the Plan 4 Area are dominated by valley oak, Fremont cottonwood, and Gooding’s black willow in the overstory 5 and Himalayan blackberry, narrow-leaf willow, arroyo willow, and California wild rose in the 6 understory or as riparian scrub. A recent Delta CDFW survey discovered areas of valley/foothill 7 riparian vegetation dominated by redosier dogwood (Cornus sericea). Other native trees and shrubs 8 that may be locally dominant or important include white alder, California sycamore, buttonbush, 9 California dogwood, Oregon ash, red willow, Pacific willow, box elder, Mexican elderberry, and 10 Hinds’ walnut. California wild grape is a vine commonly found climbing upon other riparian 11 vegetation. 12
Due to the wide range of abiotic environmental conditions in which the valley/foothill riparian 13 natural community is found (e.g., substrate, flood frequency and duration, groundwater level, 14 salinity), species composition and vegetation density and structure varies widely, from tall-canopied 15 riparian forests dominated by deciduous, broad-leaved trees, to riparian scrub dominated by 16 shorter stature trees, shrubs, and brambles. Species composition overlaps among the various 17 riparian vegetation associations, and the structure and density of vegetation may vary even at 18 relatively small spatial scales. The vegetation alliances, which make up the valley/foothill riparian 19 natural community as identified by CDFW in the Plan Area, can be placed into riparian forest, 20 woodland, and scrub categories, based largely on the canopy height and the structure of the 21 dominant plant taxa (Holland and Keil 1995). Riparian forest is dominated by broad-leaved, winter 22 deciduous trees, such as valley oak and Fremont cottonwood, that form closed canopies up to 115 23 feet (35 meters) tall (Griggs et al. 1993; Tu 2000; Griggs and Golet 2002; Trowbridge 2002; 24 Trowbridge et al. 2005). This type of riparian vegetation is typically found along perennial or 25 intermittent streams and tends to consist of relatively even-aged trees that reproduce episodically 26 after flood events (Trowbridge 2005; Vaghti and Greco 2007). Riparian woodland may have similar 27 species composition to the forests and are typically dominated by tall, broad-leaved, winter 28 deciduous trees. However, woodland canopies tend to be more open, likely due to hydrologic 29 conditions and the species adaptations to the flooding regime. These conditions are found in few 30 areas in the Delta today. Thickets dominated by one or more shorter stature willows (typically 31 narrow leaf willow or arroyo willow) are categorized as riparian scrub, and are common along 32 newly or frequently flooded waterways. Riparian scrub may contain saplings of riparian trees, other 33 fast-growing shrubs, and vines that recolonize quickly following flood disturbance. 34
The understory in riparian forest and woodland may contain immature canopy species and species 35 commonly found in the riparian scrub community. All three structural types of the valley/foothill 36 riparian natural community typically contain diverse mixtures of herbaceous plant species in the 37 understory, often including graminoids such as rushes, bulrushes, sedges, flat-sedges, and grasses, 38 as well as forbs such as monkeyflowers, stinging nettle, and watercress. Woody vines or lianas are 39 also common and may form a dense understory composed of species such as honeysuckles, poison 40 oak, and California wild grape (Holland and Keil 1995; Vaghti and Greco 2007). 41
Covered plant species found or likely to be found in the valley/foothill riparian natural community 42 in the Plan Area are listed in Table 2-4, and include delta button celery, delta mudwort, Delta tule 43 pea, Mason’s lilaeopsis, side-flowering skullcap, slough thistle, and Suisun Marsh aster. 44
Bay Delta Conservation Plan Public Draft 2-59 November 2013
ICF 00343.12

Existing Ecological Conditions
Chapter 2
2.3.4.5.2 Fish and Wildlife 1
Although significantly altered and reduced in extent since initial European settlement (Katibah 2 1984), riparian habitats continue to support the greatest diversity of wildlife species of any habitat 3 in California. The rich and complex vegetation composition and structure present in the 4 valley/foothill riparian natural community provides habitat for over 225 bird, mammal, and reptile 5 species (Riparian Habitat Joint Venture 2004). Over 80% of all wildlife species in the Sacramento 6 Valley use riparian areas during a part of their life cycle for nesting, movement, cover, or forage 7 (Riparian Habitat Joint Venture 2004). Salmonids rely on riparian shade and the resulting cooler 8 water temperatures that control basic metabolic processes. Salmonids also benefit from 9 contributions of the riparian community to the aquatic foodweb in the form of terrestrial insects and 10 leaf litter that enter the water. Riparian vegetation also supports the formation of steep, undercut 11 banks that provide cover for salmonids (Table 2-4). Covered terrestrial wildlife species that are 12 associated with the valley/foothill riparian natural community include the riparian brush rabbit, 13 riparian woodrat, least Bell’s vireo, Swainson’s hawk, tricolored blackbird, western yellow-billed 14 cuckoo, white-tailed kite, yellow-breasted chat, western pond turtle, California red-legged frog, and 15 valley elderberry longhorn beetle (Table 2-4). 16
Mammals that use the valley/foothill riparian natural community as habitat or movement corridors 17 include ringtails, muskrats, raccoons, deer, coyotes, mountain lions, bobcats, woodrats, and mice. 18 Two covered mammal species, riparian brush rabbit and riparian woodrat, are dependent upon the 19 valley/foothill riparian natural community in the Plan Area. Riparian brush rabbit, a federally listed 20 endangered species, relies on the community for its entire lifecycle. The riparian woodrat (San 21 Joaquin Valley woodrat), federally listed as endangered and a state species of concern, inhabits 22 riparian areas in the Plan Area. Bats are also found in greater densities near riparian areas feeding 23 on the abundant swarms of aquatic insects and use riparian areas for roosting habitat. 24
Abundant micro- and macro-invertebrate wildlife inhabit both the belowground and aboveground 25 portions of the valley/foothill riparian natural community, contribute to ecosystem function and 26 foodweb diversity. Soil invertebrates are a critical factor controlling decomposition and nutrient 27 cycling (Power and Rainey 2000). 28
Riparian habitat is considered the most important habitat to landbird species in California (Manly 29 and Davidson 1993; Davidson 1995). Migratory birds use riparian areas as stopover points. Major 30 direct and indirect anthropogenic and nonanthropogenic impacts on this community in the Plan 31 Area that affect avian species include degradation and fragmentation of habitat, nest parasitism, 32 disruption of hydrologic processes by levees, clearing for agricultural and urban development, and 33 biological invasions. Special-status bird species that are riparian habitat specialists include 34 Swainson’s hawk, bank swallow, yellow warbler, yellow-billed cuckoo, common yellowthroat, 35 Wilson’s warbler, and yellow-breasted chat. 36
Riparian vegetation directly influences the value of aquatic habitat for fish, affecting cover, food, 37 instream habitat complexity, streambank stability, and water temperature regulation. Large woody 38 debris recruited from streamside trees provides instream cover and habitat complexity, an essential 39 component of fish habitat. In smaller streams, riparian vegetation also provides shade and an 40 insulating canopy that moderates water temperatures in both summer and winter. Riparian 41 vegetation provides a filter that reduces the transport of fine sediment to the stream, and the roots 42 provide streambank stability and cover for rearing fish. Riparian vegetation influences the food 43
Bay Delta Conservation Plan Public Draft 2-60 November 2013
ICF 00343.12
Existing Ecological Conditions
Chapter 2
chain of a stream, providing organic detritus and terrestrial insects. Riparian vegetation also 1 controls aquatic productivity dependent on solar radiation (Meehan 1991). 2
2.3.4.5.3 Nonnative Species 3
Riparian environments, with their high edge-to-area ratios and frequent disturbance regime, are 4 prone to biological invasions (Planty-Tabacchi et al. 1996). In the valley/foothill riparian systems, 5 introduced nonnative woody and herbaceous plant species may replace native species, and once 6 established, can be extremely difficult to control or eradicate. Problematic nonnative invasive plant 7 species in riparian areas include tree-of-heaven, Sesbania, Chinese tallowtree, black locust, tamarisk, 8 Russian olive, bluegum eucalyptus, Himalayan blackberry, palm trees (multiple genera), giant reed, 9 and perennial pepperweed. For example, the introduction of giant reed has negatively affected the 10 valley/foothill riparian natural community because the species grows in very dense monocultures, 11 displacing natives and changing hydrologic regimes (Dudley 2000). By eliminating native plants, 12 giant reed removes food and habitat for a number of birds, insects, and other wildlife. 13
Many nonnative invasive wildlife species such as red-eared sliders and black rats have also affected 14 the valley/foothill riparian natural community. Feral domestic cats are another important nonnative 15 species that can affect many native bird species in this community. 16
2.3.4.5.4 Ecosystem Function 17
The valley/foothill riparian natural community provides disproportionately higher ecosystem 18 services and wildlife habitat compared to other terrestrial communities (National Research Council 19 2002). Riparian areas serve as the hydrologic connection between terrestrial uplands and aquatic 20 ecosystems, receiving water from precipitation, overland runoff, groundwater discharge, and flow 21 from an adjacent water body or alluvial aquifer (Vaghti and Greco 2007). They provide benefits to 22 water quality by processing and filtering runoff, retaining and recycling nutrients, and trapping 23 sediments (National Research Council 2002). Within the Plan Area, these ecosystem functions have 24 been substantially negatively affected due to the destruction and fragmentation of the community. 25
Although the covered fish species do not rely primarily on riparian habitat because they are aquatic 26 species, they are directly and indirectly supported by the habitat services and food sources provided 27 by the highly productive riparian ecosystem, particularly during flood flows when riparian habitats 28 are inundated. Riparian vegetation is a source for organic material (e.g., falling leaves), insect food, 29 and woody debris in waterways and can influence the course of water flows and structure of in-30 stream habitat. This debris is an important habitat and food source for fish, amphibians, and aquatic 31 insects (Opperman 2005). 32
2.3.4.5.5 Environmental Gradients 33
Due to its location in the transition zone between aquatic and terrestrial ecosystems, the 34 valley/foothill riparian natural community is characterized by biotic (e.g., species composition) and 35 abiotic (e.g., hydrologic) gradients (Vaghti and Greco 2007). These gradients interact to form highly 36 diverse and complex communities, both structurally and functionally. They also interact strongly 37 with and influence the aquatic, emergent, and upland habitats along their edges. 38
The valley/foothill riparian natural community is associated with active and remnant hydrologic 39 features in the Plan Area, as well as areas with a high water table that are periodically inundated. 40 Plant community composition and structure is tightly coupled with fluvial processes (Strahan 1984). 41
Bay Delta Conservation Plan Public Draft 2-61 November 2013
ICF 00343.12

Existing Ecological Conditions
Chapter 2
Vegetation density is inversely related to frequency of flooding; low-stature annual and perennial 1 species on frequently inundated sandbars and low-elevation ground give way to taller, longer-lived 2 species further upland. In the Plan Area, there are abrupt transitions to agricultural cover, managed 3 wetlands, or boundaries formed by levees and other engineered landforms. 4
Although the valley/foothill riparian vegetation is found on a range of soil types, the vast majority of 5 soil types are mineral or intermixed with peat in the Plan Area (Figure 2-4) (Hitchcock et al. 2005; 6 Unruh and Hitchcock 2009). Soil conditions associated with this vegetation type are also typically 7 influenced by current and past hydrologic conditions (Figure 2-6). 8
2.3.4.5.6 Future Conditions with Climate Change 9
Future climate change (Section 2.3.3.2, Climate) is expected to alter the valley/foothill riparian 10 natural community in a variety of ways. Rising sea level will affect the location, extent, and 11 composition of the valley/foothill riparian natural community because of increased water elevation 12 and increased saltwater intrusion. As water levels rise, riparian vegetation at the water’s edge will 13 become more frequently flooded, and many species intolerant of this longer inundation will migrate 14 upslope if suitable habitat and hydrologic regimes are present. The ability to colonize new ground 15 by shifting away from water’s edge will depend on the availability of space in adjacent higher 16 elevation areas and the ability of individual riparian species to colonize any new spaces (e.g., via 17 seed dispersal or clonal growth). 18
Future vegetation composition and extent of the valley/foothill riparian natural community will also 19 depend on the tolerance levels of individual plant species to the higher salinity associated with 20 saltwater intrusion. Changes in channel water salinity may cause species shifts in the lower Delta by 21 eliminating tree species that are not willows, but the effect will be difficult to determine even 22 qualitatively due to the inherent variability of the system. 23
Changes to the timing, duration, and magnitude of Delta inflows associated with future climate 24 change are anticipated to result in more intense winter flooding and greater erosion of riparian 25 habitats (Field et al. 1999; Hayhoe et al. 2004). The hydrodynamics of stream channels and the 26 width of riparian corridors will be altered, resulting in losses or shifts in species composition of 27 riparian vegetation. 28
Increased variability in precipitation is expected to produce prolonged droughts that make riparian 29 vegetation more prone to fires. Thus, the frequency of wildfires in the valley/foothill riparian 30 natural community is expected to increase in the future. 31
2.3.4.6 Nontidal Perennial Aquatic 32
The nontidal perennial aquatic natural community in the Delta can range in size from small ponds in 33 upland areas to small lakes, such as the North and South Stone Lakes. The nontidal perennial aquatic 34 natural community can be found in association with any terrestrial habitat and often transitions into 35 nontidal freshwater perennial emergent wetland and valley/foothill riparian. The distribution of 36 nontidal perennial aquatic is shown in Figure 2-14. The littoral zone of the nontidal perennial 37 aquatic community is defined as the portion of the water column penetrable by light and that occurs 38 at the edges of lakes and throughout most ponds (Moss 1998; Scheffer 2004). The limnetic zone 39 extends below the littoral zone to the deepest part of the water body. Light penetration is inversely 40 related to turbidity. Water temperature varies with depth; colder water generally occurs deeper due 41 to the inverse relationship between water temperature and density. The oxygen concentration in 42
Bay Delta Conservation Plan Public Draft 2-62 November 2013
ICF 00343.12

Existing Ecological Conditions
Chapter 2
nontidal perennial aquatic waters is low relative to that of flowing water. Only a small portion of 1 water is in direct contact with air at the surface, where gas exchange with the atmosphere occurs. 2 Dead organic material typically sinks to the bottom and decomposes, increasing biological oxygen 3 demand near the bottom of some water bodies. Because of the stratification of these physical 4 variables, there is a distinct zonation in plants and animals living in the nontidal perennial aquatic 5 natural community (California Department of Fish and Game 2005). 6
2.3.4.6.1 Vegetation 7
The plant mapping classification units within the nontidal perennial aquatic natural community are 8 described in Hickson and Keeler-Wolf (2007) and listed in Table 2-10. Nonplant primary producers 9 such as diatoms, desmids, and filamentous green algae often form the base of the foodweb where 10 they dominate open water habitat. Plant species found in this community vary with inundation 11 depth and distance from shore, from submerged aquatics (e.g., pondweed and Egeria) to floating 12 aquatic vegetation (e.g., duckweed and water hyacinth) that are found closer to shore and which 13 may increase the rates of sediment and organic matter accumulation (California Department of Fish 14 and Game 2005). 15
Table 2-10. Map Classifications in the Nontidal Perennial Aquatic Natural Community in the Plan 16 Area 17
Map Classificationa Acreage in Plan Area Water 4,793 Generic Floating Aquatics 216 Brazilian Waterweed (Egeria - Myriophyllum) Submerged 112 Undeterminedb 111 Water Hyacinth (Eichhornia crassipes) 96 Algae 69 Floating Primrose (Ludwigia peploides) 53 Ludwigia peploides 34 Milfoil - Waterweed (generic submerged aquatics) 6 Total 5,489 Notes: a Some of the map classifications provided here are directly representative of associations, alliances, or
phases identified through field surveys. Others represent amalgamations of field data due to issues of scale or remote sensing. For more detailed information concerning these map classification units and plant associations/alliances/phases, as well as methods of classification used, see Hickson and Keeler-Wolf (2007).
b Portions of the Plan Area for which CDFW did not delineate plant alliances were mapped only to the natural community level as described in Section 2.3.1, Data Sources and Natural Community Classification.
18
Shallow bodies of water, such as ponds and small lakes, generally are found in either a clear-water 19 state with rooted and floating aquatic plants or in a turbid-water state dominated by algae with very 20 few aquatic plants (Moss 1998; Scheffer 2004). These states can be stable or can oscillate between 21 each other depending on a large number of factors that primarily affect the density of Daphnia 22 zooplankton populations (Moss 1998; Scheffer 2004). The submerged portions of the plants provide 23
Bay Delta Conservation Plan Public Draft 2-63 November 2013
ICF 00343.12

Existing Ecological Conditions
Chapter 2
a substrate for smaller algae and cover for smaller aquatic animals, including fish. Floating aquatics 1 provide food and support for herbivorous crustaceans and mollusks (Smith 1974). Vegetation cover 2 in the nontidal perennial aquatic natural community ranges from continuous to open (CALFED Bay-3 Delta Program 2000). There are no covered plant species associated with the nontidal perennial 4 aquatic natural community (Table 2-4). 5
2.3.4.6.2 Fish and Wildlife 6
A thin layer of floating duckweed often covers the surface of shallow nontidal perennial aquatic 7 waters. Desmids, diatoms, protozoans, crustaceans, hydras, and snails live on the under-surface of 8 the layer, whereas mosquitoes and other aquatic insect larvae may live in between the plants. 9
Zooplankton, such as rotifers, copepods, and cladocerans, live suspended in the water column and 10 graze on phytoplankton (Smith 1974). Together with phytoplankton, these organisms compose the 11 base of the nontidal perennial aquatic foodweb. A variety of aquatic insects (e.g., dipterans, 12 coleopterans, chironomids, trichopterans, plecopterans, and ephemeropterans) and collembolans 13 use the nontidal perennial aquatic habitat for their larval stage. Native fish that can (or could in the 14 past) be found in some nontidal perennial aquatic communities include the Sacramento perch, hitch, 15 and tule perch (Moyle 2002). 16
A variety of wildlife species use the nontidal perennial aquatic natural community for resting and 17 foraging, including waterfowl, shorebirds, semiaquatic mammals (e.g., beaver, muskrat, and river 18 otter), piscivorous birds (e.g., bald eagles and osprey), and insectivorous birds and bats that prey on 19 insects that gather over open water. Ponds and other small bodies of open water also serve as 20 important brooding habitat for ducks nesting in nearby upland habitats. Many water-dependent 21 species (e.g., western pond turtle) require adjacent upland, riparian woodlands, or emergent 22 wetlands for cover or nesting habitat. Covered species associated with the nontidal perennial 23 aquatic natural community are giant garter snake, western pond turtle, and California red-legged 24 frog (Table 2-4). 25
2.3.4.6.3 Nonnative Species 26
Many nonnative species have invaded the nontidal perennial aquatic community. Common invasive 27 plants found in this habitat include Egeria, Eurasian watermilfoil, and water hyacinth (California 28 Department of Boating and Waterways 2006, 2008). These plants form thick mats that exclude 29 native vegetation and associated wildlife (San Francisco Estuary Institute 2003). 30
The nontidal perennial aquatic natural community in the Plan Area supports many nonnative 31 freshwater fish species, including centrarchids, common carp, inland silverside, fathead minnow, 32 and western mosquitofish. Additionally, the nonnative bullfrog is frequently present. These 33 nonnative species prey on or compete with native fish and amphibian species both directly and 34 indirectly for resources, including the covered California red-legged frog and California tiger 35 salamander. 36
This natural community is also at risk from potential invasion by dreissinid mussels, as detailed in 37 Section 2.3.4.1.3, Nonnative Species. 38
Bay Delta Conservation Plan Public Draft 2-64 November 2013
ICF 00343.12

Existing Ecological Conditions
Chapter 2
2.3.4.6.4 Ecosystem Functions 1
The nontidal perennial aquatic natural community is embedded in other communities, and generally 2 the most significant ecosystem functions include providing an alternative source of primary 3 productivity through its aquatic foodweb and an aquatic habitat for native fish, amphibians, and 4 reptiles such as giant garter snake, a covered species. As described above, the source of primary 5 productivity can be either algal phytoplankton or aquatic plants depending on whether the body of 6 water is in a turbid- or clear-water state. The identity of the primary consumers and their feedback 7 effects on the ecosystem depend in complex ways on many factors and cause impacts on the 8 secondary consumers such as planktivorous or benthivorous (cyprinids) fish (Scheffer 2004). 9
2.3.4.6.5 Environmental Gradients 10
Within the water column of the nontidal perennial aquatic natural community there are gradients of 11 light, oxygen and other chemicals, pH, and temperature, which combine in various ways and result 12 in a range of micro-habitat types (Moss 1998; Scheffer 2004). External gradients to terrestrial 13 ecosystems always exist at the boundary of this community and vary from direct transitions to 14 riparian forest, grassland, or cultivated lands in the Plan Area. 15
2.3.4.6.6 Future Conditions with Climate Change 16
Ongoing and future climate change (Section 2.3.3.2, Climate) is expected to alter the nontidal 17 perennial aquatic natural community. Where this community exists at elevations at or below current 18 sea level, rising sea level will alter its location, extent, and composition and potentially result in 19 increased saltwater intrusion through an altered tidal hydrologic regime. Also, where this 20 community exists in flooded depressions in upland areas, which presumably already support the 21 nontidal perennial aquatic community, it is not likely that natural processes could replace the area 22 that will be lost. 23
2.3.4.7 Nontidal Freshwater Perennial Emergent Wetland 24
The nontidal freshwater perennial emergent wetland natural community is composed of perennially 25 saturated wetlands, including meadows, dominated by emergent plant species that do not tolerate 26 perennial saline or brackish conditions (CALFED Bay-Delta Program 2000). Nontidal freshwater 27 perennial emergent wetland communities in the Plan Area occur in small fragments along the edges 28 of the nontidal perennial aquatic and valley/foothill riparian natural communities (Figure 2-14). 29 Soils are predominantly silt and clay, although coarser sediments and organic material may be 30 intermixed (Cowardin et al. 1979). In some areas, organic soils (peat) may constitute the primary 31 growth medium (U.S. Army Corps of Engineers 1978). 32
The extent of nontidal freshwater perennial emergent wetland in California, including the Delta, has 33 declined dramatically over the past century due to reclamation and conversion of the habitat to 34 other uses, primarily agriculture (Gilmer et al. 1982; The Bay Institute 1998). Only 1,135 acres of 35 this natural community remain within the Plan Area. The extent of this natural community in the 36 Delta has been dramatically reduced in the past century, with a corresponding reduction in habitat 37 function for associated fish and wildlife species (The Bay Institute 1998). 38
Bay Delta Conservation Plan Public Draft 2-65 November 2013
ICF 00343.12
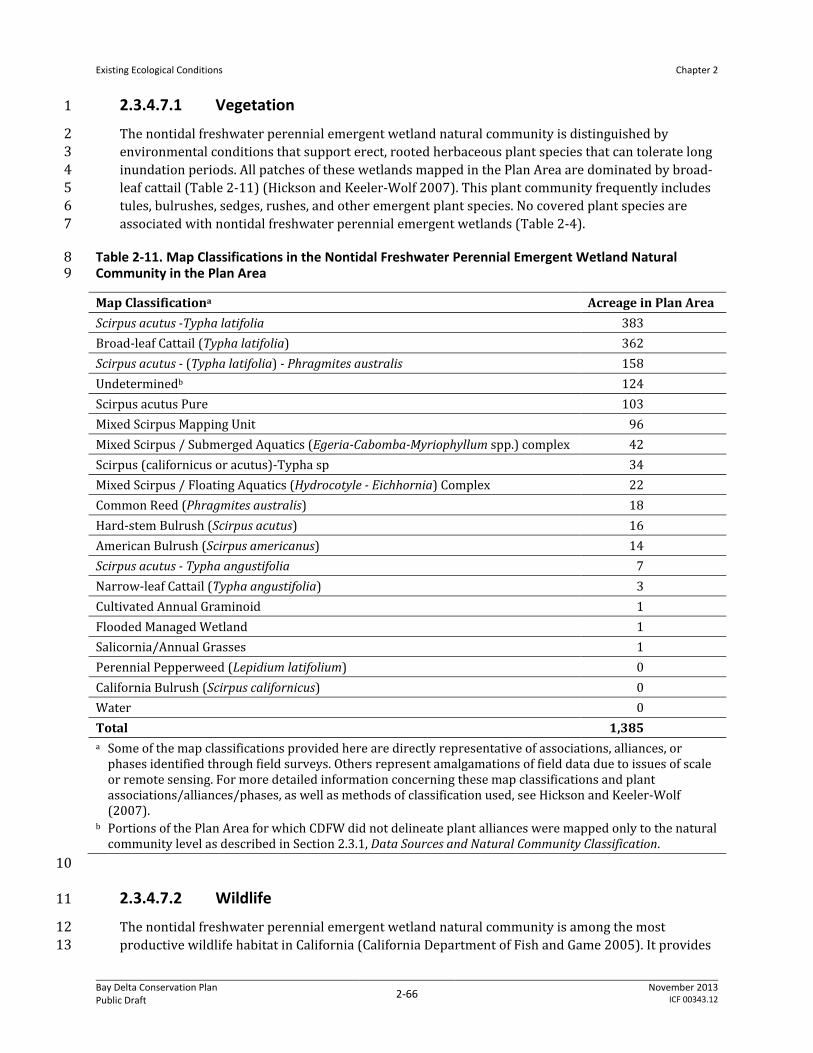
Existing Ecological Conditions
Chapter 2
2.3.4.7.1 Vegetation 1
The nontidal freshwater perennial emergent wetland natural community is distinguished by 2 environmental conditions that support erect, rooted herbaceous plant species that can tolerate long 3 inundation periods. All patches of these wetlands mapped in the Plan Area are dominated by broad-4 leaf cattail (Table 2-11) (Hickson and Keeler-Wolf 2007). This plant community frequently includes 5 tules, bulrushes, sedges, rushes, and other emergent plant species. No covered plant species are 6 associated with nontidal freshwater perennial emergent wetlands (Table 2-4). 7
Table 2-11. Map Classifications in the Nontidal Freshwater Perennial Emergent Wetland Natural 8 Community in the Plan Area 9
Map Classificationa Acreage in Plan Area Scirpus acutus -Typha latifolia 383 Broad-leaf Cattail (Typha latifolia) 362 Scirpus acutus - (Typha latifolia) - Phragmites australis 158 Undeterminedb 124 Scirpus acutus Pure 103 Mixed Scirpus Mapping Unit 96 Mixed Scirpus / Submerged Aquatics (Egeria-Cabomba-Myriophyllum spp.) complex 42 Scirpus (californicus or acutus)-Typha sp 34 Mixed Scirpus / Floating Aquatics (Hydrocotyle - Eichhornia) Complex 22 Common Reed (Phragmites australis) 18 Hard-stem Bulrush (Scirpus acutus) 16 American Bulrush (Scirpus americanus) 14 Scirpus acutus - Typha angustifolia 7 Narrow-leaf Cattail (Typha angustifolia) 3 Cultivated Annual Graminoid 1 Flooded Managed Wetland 1 Salicornia/Annual Grasses 1 Perennial Pepperweed (Lepidium latifolium) 0 California Bulrush (Scirpus californicus) 0 Water 0 Total 1,385 a Some of the map classifications provided here are directly representative of associations, alliances, or
phases identified through field surveys. Others represent amalgamations of field data due to issues of scale or remote sensing. For more detailed information concerning these map classifications and plant associations/alliances/phases, as well as methods of classification used, see Hickson and Keeler-Wolf (2007).
b Portions of the Plan Area for which CDFW did not delineate plant alliances were mapped only to the natural community level as described in Section 2.3.1, Data Sources and Natural Community Classification.
10
2.3.4.7.2 Wildlife 11
The nontidal freshwater perennial emergent wetland natural community is among the most 12 productive wildlife habitat in California (California Department of Fish and Game 2005). It provides 13
Bay Delta Conservation Plan Public Draft 2-66 November 2013
ICF 00343.12

Existing Ecological Conditions
Chapter 2
food, cover, and water for numerous mammals, reptiles, amphibians, and birds. Many species rely on 1 fresh emergent wetlands for their entire life cycle (e.g., giant garter snake). Others use the habitat 2 primarily for breeding (e.g., California red-legged frog), feeding and hunting (e.g., bald eagle), or 3 foraging and loafing habitat (e.g., migrating waterfowl). Within the Plan Area, the ecological 4 functions provided by nontidal freshwater perennial emergent wetlands in support of wildlife are 5 very limited because this community is highly fragmented and occurs in small patches (e.g., the 6 1,135 acres of this natural community are distributed among 159 mapped polygons). Covered 7 wildlife species that may use nontidal freshwater perennial emergent wetlands include California 8 black rail, tricolored blackbird, giant garter snake, western pond turtle, and California red-legged 9 frog (Table 2-4). 10
2.3.4.7.3 Nonnative Species 11
Many nonnative species have invaded the nontidal freshwater perennial emergent wetland natural 12 community. Common invasive plants found in this habitat include Egeria, Eurasian watermilfoil, and 13 water hyacinth (California Department of Boating and Waterways 2006, 2008). These plants form 14 thick mats that exclude native vegetation and associated wildlife (San Francisco Estuary Institute 15 2003). 16
Nontidal freshwater perennial emergent wetland natural community in the Plan Area supports 17 many nonnative freshwater fish species, including centrarchids, common carp, inland silverside, 18 fathead minnow, and western mosquitofish. Additionally, the nonnative bullfrog is frequently 19 present. These nonnative species prey on or compete with native fish and amphibian species both 20 directly and indirectly for resources. 21
This natural community is also at risk from potential invasion by dreissinid mussels, as detailed in 22 Section 2.3.4.1.3, Nonnative Species. 23
2.3.4.7.4 Ecosystem Functions 24
Nontidal freshwater perennial emergent wetland natural community generally forms the boundary 25 around the nontidal perennial aquatic natural community, and with that community is embedded in 26 other communities. Generally, its most significant ecosystem functions include providing an 27 alternative source of primary productivity through its aquatic foodweb and providing an aquatic 28 habitat for native fish, amphibians, and reptiles such as giant garter snake, a covered species. Its 29 importance as a source of primary productivity can increase or decrease if the body of water is 30 dominated by algal phytoplankton or aquatic plants depending on whether the body of water is in a 31 turbid- or clear-water state. The contribution of primary consumers and their feedback effects on 32 the ecosystem depend on many factors and cause impacts to the secondary consumers such as 33 planktivorous or benthivorous (cyprinids) fish (Scheffer 2004). Additionally, this community 34 provides the structural substrate for predator avoidance and nesting of wildlife. 35
2.3.4.7.5 Environmental Gradients 36
Within the water column of the nontidal freshwater perennial emergent wetland natural community 37 there are gradients of light, oxygen and other chemicals, pH, and temperature, which combine in 38 various ways and result in a range of micro-habitat types (Moss 1998; Scheffer 2004). External 39 gradients to terrestrial ecosystems always exist at the boundary of this community because the 40 boundary lies between open-water habitat and ecotonal transitions into riparian forest, grassland, 41 or cultivated lands in the Plan Area. 42
Bay Delta Conservation Plan Public Draft 2-67 November 2013
ICF 00343.12

Existing Ecological Conditions
Chapter 2
2.3.4.7.6 Future Conditions with Climate Change 1
Ongoing and future climate change (Section 2.3.3.2, Climate) is expected to alter the nontidal 2 freshwater perennial emergent wetland natural community. Sea level rise will affect the location, 3 extent, and composition of this community in places where it exists at or below current sea level 4 because of increased water elevation, increased saltwater intrusion, and the tidal hydrologic regime. 5 Nontidal freshwater perennial emergent wetland locations that exist at the water’s edge will become 6 more deeply immersed, or in the case of overtopped levees, deeply flooded. Where this community 7 exists in flooded depressions in upland areas, which presumably already support the nontidal 8 freshwater perennial emergent wetland natural community, it is not likely that natural processes 9 could replace the area that will be lost. 10
2.3.4.8 Alkali Seasonal Wetland Complex 11
The alkali seasonal wetland complex natural community occurs on fine-textured soils that contain a 12 relatively high concentration of dissolved salts. This natural community includes both saturated 13 wetlands, sometimes with areas of shallow ponding during the wet season, and a surrounding 14 matrix of various types of vegetation. It is typically found either at the historical locations of 15 seasonal ponds in the Yolo Basin in and around the CDFW’s Tule Ranch Preserve (Witham 2003; 16 EDAW 2007a) where salts accumulated through evaporation, or in upland situations such as basin 17 rims and seasonal drainages that receive salts in runoff from upslope salt-bearing bedrock such as 18 areas near Suisun Marsh and the Clifton Court Forebay. Associations dominated by saltgrass cover 19 the largest extent of the alkaline wetland alliances in the Plan Area (Hickson and Keeler-Wolf 2007), 20 and the area of undetermined vegetation adjacent to Suisun Marsh is likely dominated by saltgrass 21 (Table 2-12). Vegetation associations containing salt-adapted shrubs and subshrubs, generally 22 located in the Clifton Court Forebay area (San Francisco Estuary Institute 2010), constitute most of 23 the remaining acreage. Depending on its location, this community often transitions into other 24 natural communities such as tidal brackish emergent wetland, vernal pool complex, grassland, 25 valley/foothill riparian, and agricultural habitats. The distribution of the alkali seasonal wetland 26 complex natural community in the Plan Area is shown in Figure 2-14. 27
2.3.4.8.1 Vegetation 28
Dominant species in the alkali seasonal wetland complex natural community include saltgrass, Baltic 29 rush, pickleweed, iodine bush, and alkali heath (Table 2-12) (Hickson and Keeler-Wolf 2007). Other 30 abundant plant species include toad rush, bush seepweed, brass buttons, gum plant, and perennial 31 pepperweed. Annual grasses associated with this natural community include the native Pacific 32 foxtail as well as nonnative grasses such as rabbitsfoot grass, swamp timothy, and Italian ryegrass. 33 In associations that are dominated by woody plants in the Clifton Court Forebay area, shrubs 34 characteristic of desert regions such as iodine bush (Allenrolfea occidentalis) may form an open 35 shrub cover with an intermittent herbaceous strata that is dominated by saltgrass, wild barley, and 36 curved sicklegrass (Hickson and Keeler-Wolf 2007). 37
Bay Delta Conservation Plan Public Draft 2-68 November 2013
ICF 00343.12

Existing Ecological Conditions
Chapter 2
Table 2-12. Map Classifications in the Alkali Seasonal Wetland Complex Natural Community in the 1 Plan Area 2
Map Classificationa Acreage in Plan Area Distichlis spicata - Annual Grasses 3,044 Undeterminedb 233 Saltgrass (Distichlis spicata) 122 Salt scalds and associated sparse vegetation 47 Juncus balticus - meadow vegetation 45 Distichlis spicata - Juncus balticus 30 Allenrolfea occidentalis mapping unit 29 Alkaline vegetation mapping unit 28 Frankenia salina - Distichlis spicata 24 Annual Grasses generic 22 Suaeda moquinii - (Lasthenia californica) mapping unit 21 Distichlis spicata - Salicornia virginicac 20 Pickleweed (Salicornia virginica)c 15 Freshwater Drainage 12 Annual Grasses/Weeds 10 Bare Ground 5 Salicornia virginica - Distichlis spicatac 5 Creeping Wild Rye Grass (Leymus triticoides) 3 Salicornia virginica - Cotula coronopifoliac 3 Alkali Heath (Frankenia salina) 2 Salicornia virginicac 1 Typha species (generic) 1 Salicornia/Annual Grasses 0 Flooded Managed Wetland 0 Distichlis/S. maritimus 0 Total 3,723 a Some of the map classifications provided here are directly representative of associations, alliances, or
phases identified through field surveys. Others represent amalgamations of field data due to issues of scale or remote sensing. For more detailed information concerning these map classifications and plant associations/alliances/phases, as well as methods of classification used, see Hickson and Keeler-Wolf (2007).
b Portions of the Plan Area for which CDFW did not delineate plant alliances were mapped only to the natural community level as described in Section 2.3.1, Data Sources and Natural Community Classification.
c Salicornia virginica is now Salicornia pacifica 3
Covered plant species that occur in the alkali seasonal wetland natural community include 4 brittlescale and heartscale growing in alkaline drainages, Carquinez goldenbush, delta button celery 5 growing on alluvium in the Discovery Bay area, and San Joaquin spearscale on basin rims. 6
Bay Delta Conservation Plan Public Draft 2-69 November 2013
ICF 00343.12
Existing Ecological Conditions
Chapter 2
The vernal pool complex natural community is sometimes interspersed within the alkali seasonal 1 wetland natural community complex. Covered plant species that occur in these inclusions include 2 alkali milk-vetch, brittlescale, Boggs Lake hedge-hyssop, heartscale, Heckard’s peppergrass, and San 3 Joaquin spearscale (Table 2-4). 4
2.3.4.8.2 Fish and Wildlife 5
In the Plan Area, the alkali seasonal wetland complex natural community, and in particular 6 saltgrass-dominated grassland, supports breeding and/or foraging habitat for covered vertebrate 7 species, including San Joaquin kit fox, greater sandhill crane, Swainson’s hawk, tricolored blackbird, 8 western burrowing owl, white-tailed kite, giant garter snake, California red-legged frog, and 9 California tiger salamander (Table 2-4). 10
The vernal pool complex natural community, which is sometimes scattered within this community, 11 supports covered invertebrate species, which include vernal pool tadpole shrimp, Conservancy fairy 12 shrimp, longhorn fairy shrimp, vernal pool fairy shrimp, midvalley fairy shrimp, and California 13 linderiella (Table 2-4). 14
2.3.4.8.3 Nonnative Species 15
The primary problematic nonnative plant species in this community are perennial pepperweed 16 (Witham 2006; EDAW 2007a; Environmental Science Associates 2007) and annual ryegrass (Lolium 17 multiflorum) (Dawson et al. 2007), which form dense patches that exclude many native plant 18 species. There are no data describing their effects on wildlife. 19
2.3.4.8.4 Ecosystem Functions 20
The alkali seasonal wetland complex natural community is found on relatively impermeable clay 21 alluvial soils (Graymer et al. 2002; Water Resources & Information Management Engineering Inc. 22 2006; Natural Resources Conservation Service 2009) that remain saturated throughout the wet 23 season and during the early part of the dry season. The two contrasting types of typical vegetation, 24 either dominated by the perennial saltgrass as is the case in most areas, or the woody iodine bush 25 scrub near the Clifton Court Forebay, largely control the ecosystem functions of this community. 26 Saltgrass-dominated areas are generally vegetated more or less uniformly and provide a very simple 27 and herbaceous physical structure with relatively fast nutrient and carbon cycling. In contrast, 28 iodine bush-dominated areas tend to have a patchy distribution of shrubs that provide more 29 structural variation and sequester nutrients and carbon for longer periods. Saltgrass areas are 30 typically grazed by native wildlife and domestic livestock and function as grasslands. They are also 31 relatively open habitat that provides foraging habitat for raptors. Iodine bush habitat provides open 32 areas for foraging by wildlife as well as closed canopy areas for cover. 33
2.3.4.8.5 Environmental Gradients 34
The alkali seasonal wetland complex natural community transitions into wetter areas such as the 35 tidal brackish emergent wetland natural community in the Suisun Marsh area (Collins and 36 Grossinger 2004; Grossinger 2004) and the tidal freshwater emergent wetland in the Delta 37 (Grossinger et al. 2008) and often has vernal pool inclusions in areas with depressions. In other 38 areas, such as near the Montezuma Hills, it transitions into the drier grassland natural community 39 (Collins and Grossinger 2004; Grossinger 2004; Grossinger et al. 2008). 40
Bay Delta Conservation Plan Public Draft 2-70 November 2013
ICF 00343.12

Existing Ecological Conditions
Chapter 2
2.3.4.8.6 Future Conditions with Climate Change 1
Ongoing and future climate change (Section 2.3.3.2, Climate) is expected to alter the alkali seasonal 2 wetland complex natural community. Because this community is generally located well above sea 3 level it will not be directly affected by rising sea level except at locations where it abuts tidal 4 communities, which will move upslope, thus reducing its extent. The primary impact of climate 5 change on this community will be driven by changes in the hydrologic regime due to increased 6 variability in precipitation. The species present in this community are adapted to existing hydrologic 7 conditions such that increased variability of precipitation would likely lead to a shorter and more 8 variable wet season or similar changes in the inundation period. It is not known how the increased 9 variability in seasonal hydrology will affect the plants and animals inhabiting this community, but 10 because these species are adapted to current conditions, the impacts will likely result in changes to 11 species composition. In addition, rising average temperatures could result in increased 12 evapotranspiration rates and therefore more extended dry periods for this community; the impacts 13 of which are expected to be adverse to native plants and wildlife. 14
2.3.4.9 Vernal Pool Complex 15
The vernal pool complex natural community is characterized by interconnected and isolated groups 16 of vernal pools and seasonal swales that are generally within a matrix of either grassland or alkali 17 seasonal wetland vegetation. This natural community is rare in the Plan Area and is generally found 18 only in a few locations along the very margin of the Plan Area (Figure 2-14). The vernal pool 19 complex natural community was mapped specifically for the BDCP using a range of methods because 20 there were no available datasets with the appropriate level of detail or spatial extent. Details of the 21 methods used to map vernal pool complex are presented in Section 2.3.1.5, Vernal Pool Complex 22 Dataset Development, and an in-depth discussion is presented in Appendix 2.B, Vernal Pool Complex 23 Mapping and Modifications to Natural Community Mapping. Regions of the Central Valley to the east 24 and west of the Plan Area support large areas of vernal pool complex natural community, especially 25 in San Joaquin, Sacramento, and Solano Counties. 26
In the Plan Area, vernal pools are found west of the Sacramento River from Putah Creek south to the 27 gently sloped terraces immediately to the north and east of the Montezuma Hills, east of the 28 Sacramento River in the Stone Lakes area, and west of the San Joaquin River from Byron to 29 Discovery Bay (Witham 2003; Environmental Science Associates and Yolo County 2005; Leigh 30 Fisher Associates 2005; Williamson et al. 2005; Witham 2006; Baraona et al. 2007; Kleinschmidt 31 Associates 2008; Rains et al. 2008; San Francisco Estuary Institute 2010). The pools on the west side 32 of the Delta formed on clay soils with relatively high salt content, while those on the east side 33 formed on clays with little salt content. The plant communities and species in vernal pools (Table 2-34 13) are generally adapted to a hydrologic regime of standing water in winter and spring and 35 desiccated soils in summer (CALFED Bay-Delta Program 2000; Solomeshch et al. 2007). Vernal pools 36 in California are also known for providing habitat for a number of endemic and rare species (Jain 37 1979; Jones & Stokes Associates 1990; Skinner and Pavlik 1994; Solomeshch et al. 2007). A single 38 vernal pool may support over 100 species of native plants and animals (U.S. Fish and Wildlife 39 Service 2007). The conversion of large extents of the vernal pool complex natural community to 40 agriculture and developed areas has led directly to greatly reduced population sizes of covered 41 species such as alkali milk-vetch, Heckard’s peppergrass, and legenere (Table 2-4). 42
Bay Delta Conservation Plan Public Draft 2-71 November 2013
ICF 00343.12
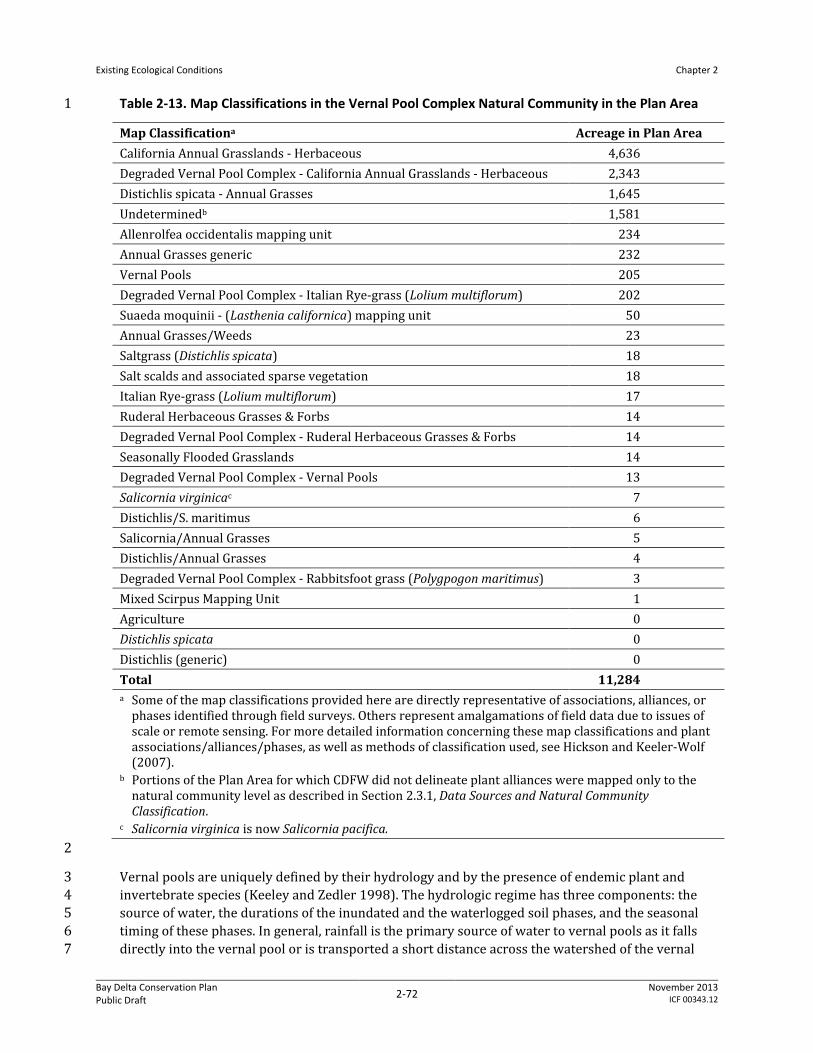
Existing Ecological Conditions
Chapter 2
Table 2-13. Map Classifications in the Vernal Pool Complex Natural Community in the Plan Area 1
Map Classificationa Acreage in Plan Area California Annual Grasslands - Herbaceous 4,636 Degraded Vernal Pool Complex - California Annual Grasslands - Herbaceous 2,343 Distichlis spicata - Annual Grasses 1,645 Undeterminedb 1,581 Allenrolfea occidentalis mapping unit 234 Annual Grasses generic 232 Vernal Pools 205 Degraded Vernal Pool Complex - Italian Rye-grass (Lolium multiflorum) 202 Suaeda moquinii - (Lasthenia californica) mapping unit 50 Annual Grasses/Weeds 23 Saltgrass (Distichlis spicata) 18 Salt scalds and associated sparse vegetation 18 Italian Rye-grass (Lolium multiflorum) 17 Ruderal Herbaceous Grasses & Forbs 14 Degraded Vernal Pool Complex - Ruderal Herbaceous Grasses & Forbs 14 Seasonally Flooded Grasslands 14 Degraded Vernal Pool Complex - Vernal Pools 13 Salicornia virginicac 7 Distichlis/S. maritimus 6 Salicornia/Annual Grasses 5 Distichlis/Annual Grasses 4 Degraded Vernal Pool Complex - Rabbitsfoot grass (Polygpogon maritimus) 3 Mixed Scirpus Mapping Unit 1 Agriculture 0 Distichlis spicata 0 Distichlis (generic) 0 Total 11,284 a Some of the map classifications provided here are directly representative of associations, alliances, or
phases identified through field surveys. Others represent amalgamations of field data due to issues of scale or remote sensing. For more detailed information concerning these map classifications and plant associations/alliances/phases, as well as methods of classification used, see Hickson and Keeler-Wolf (2007).
b Portions of the Plan Area for which CDFW did not delineate plant alliances were mapped only to the natural community level as described in Section 2.3.1, Data Sources and Natural Community Classification.
c Salicornia virginica is now Salicornia pacifica. 2
Vernal pools are uniquely defined by their hydrology and by the presence of endemic plant and 3 invertebrate species (Keeley and Zedler 1998). The hydrologic regime has three components: the 4 source of water, the durations of the inundated and the waterlogged soil phases, and the seasonal 5 timing of these phases. In general, rainfall is the primary source of water to vernal pools as it falls 6 directly into the vernal pool or is transported a short distance across the watershed of the vernal 7
Bay Delta Conservation Plan Public Draft 2-72 November 2013
ICF 00343.12

Existing Ecological Conditions
Chapter 2
pool. This direct rainfall and watershed model is the simplest case, but there may be groundwater 1 transport to the vernal pool through a shallow perched aquifer or a combination of rainfall and 2 creek flooding (Environmental Science Associates and Yolo County 2005; Williamson et al. 2005; 3 Rains et al. 2008). The duration and timing of the inundation and waterlogged soil phases are also 4 variable with hardpan vernal pools generally having shorter phases centered during the middle of 5 the wet season while claypan and clay vernal pools have longer phases extending earlier and later 6 into the wet season (Environmental Science Associates and Yolo County 2005; Williamson et al. 7 2005; Rains et al. 2008). Similar complications occur in determining the presence of the 8 characteristic endemic species. Using endemic plants as an example, the cover of many of them can 9 vary by orders of magnitude from season to season, and they may only be present in the soil seed 10 bank in some years (Barbour et al. 2007). These unique characteristics can also be blurred to 11 varying degrees by human-driven impacts such as land leveling and ripping, altering the supply of 12 water through flood irrigation, or through the intentional or inadvertent introduction of exotic plant 13 species. 14
Note that the vernal pool complex natural community was mapped separately from the other 15 vegetation data used for the BDCP and the mapped polygons of the community overlay of CDFW 16 vegetation types that are described in this chapter. The Plan Area contains 7,908 acres of the vernal 17 pool complex natural community (including both wetted surface and upland matrix), of which 4,730 18 acres are found in annual grassland vegetation, 1,673 acres are found in saltgrass vegetation, 233 19 acres are found in iodine bush scrub, and 196 acres were mapped as vernal pools by CDFW. 20
2.3.4.9.1 Vegetation 21
The flora of vernal pools has adapted in different ways to the unique physical and chemical 22 constraints imposed by the inundated lacustrian phase. The duration of inundation strongly 23 correlates with two clear functional groups (Zedler 1987, 1990; Barbour et al. 2003, 2005, 2007). An 24 edge-of-pool plant functional group is adapted to the fluctuating hydrology of shallow vernal pools 25 or to the edges of deep vernal pools, while the long inundation functional group is adapted to the 26 deeply inundated basins of vernal pools. The edge or saturated soil species are especially prone to 27 elimination by competition with upland exotic grass species or through thatch accumulation (Barry 28 1995; Griggs 2000; Marty 2005), while the basins are prone to invasion by low mannagrass (Gerlach 29 et al. 2009). 30
The vernal pool complex natural community in the Plan Area can be classified into four fairly 31 uniform types: annual grassland vernal pool complexes in the Stone Lakes area; clay alluvium vernal 32 pools and playa pools running from Putah Creek south to Cache Slough; Montezuma Block vernal 33 pools and playa pools in the Jepson Prairie/Montezuma Hills area; and alkaline sink/meadow vernal 34 pools near the Byron/Clifton Court Forebay area. Covered vernal pool plants include alkali milk-35 vetch, Boggs Lake hedge-hyssop, brittlescale, delta button celery, dwarf downingia, heartscale, 36 Heckard’s peppergrass, legenere, and San Joaquin spearscale (Table 2-4). 37
Annual grassland vernal pool complexes have uplands that are dominated by Eurasian annual 38 grasses with a varying mixture of native grasses and herbs depending on the farming history of the 39 site. These vernal pools are found in the lowest local topographic positions on soils that were 40 deposited in and alongside ancient stream channels and are underlain by a discontinuous claypan 41 (Williamson et al. 2005; Rains et al. 2008) or clay alluvial lens. The endemic plant species present in 42 the vernal pools are generally considered adapted to nonalkaline soils, but some characteristic 43 species of alkaline vernal pools, such as Heckard’s peppergrass (Table 2-4) or saline clover, may be 44
Bay Delta Conservation Plan Public Draft 2-73 November 2013
ICF 00343.12
Existing Ecological Conditions
Chapter 2
present. Typical plant species found in these vernal pools are: Pacific foxtail (Alopecurus saccatus), 1 bristled downingia (Downingia bicornuta var. bicornuta), low mannagrass (Glyceria declinata), 2 rayless goldfields (Lasthenia glaberrima), shining peppergrass (Lepidium nitidum var. nitidum), 3 small stipitate popcorn-flower (Plagiobothrys stipitatus var. micranthus), Sacramento mesamint 4 (Pogogyne zizyphoroides), and woolly marbles (Psilocarphus brevissimus). 5
Clay alluvium vernal pools and playa pools have uplands that are dominated in the spring by 6 either Eurasian annual grasses or a variable mixture of saltgrass and native herbs, and are 7 dominated in the summer by native tarweeds or the exotic yellow starthistle. These vernal pools and 8 playa pools can be found on extremely thick clay alluvium (Bryan 1923; Thomasson Jr. et al. 1960; 9 State of California 1987) in a range of topographic positions, from scoured areas above the main 10 flood distribution channels of Putah Creek to middle elevations where a swale may connect a series 11 of vernal pools (Environmental Science Associates and Yolo County 2005), to low-elevation playas in 12 the Yolo Bypass that are periodically flooded by the Sacramento River (Witham 2003), to much 13 older vernal pools and playa pools in the greater Jepson Prairie area (Bryan 1923; Thomasson Jr. et 14 al. 1960; Witham and Kareofelas 1994; Williamson et al. 2005; Witham 2006; Baraona et al. 2007; 15 Rains et al. 2008). The rare endemic species found in these vernal pools and playa pools include 16 Solano grass and Colusa grass, as well as alkali milk-vetch, San Joaquin spearscale, dwarf downingia, 17 legenere, and Heckard’s peppergrass which are covered plant species (Table 2-4). 18
Montezuma Block vernal pools and playa pools have uplands that are similar to those of the clay 19 alluvium vernal pools and playa pools, but extensive areas are also in agricultural production as dry-20 farmed wheat. These vernal pools and playa pools can also be found in a range of topographic 21 positions from intermittent stream channels in the Montezuma Hills, to the mid-elevation divide 22 that is characteristic of the Jepson Prairie area, to the near tidal elevation vernal pools found along 23 Cache Slough (Witham and Kareofelas 1994) and upland of Suisun Marsh (Wildlands Inc. 2005; San 24 Francisco Estuary Institute 2006). The rare endemic species found in these vernal pools and playa 25 pools include Colusa grass, as well as alkali milk-vetch, San Joaquin spearscale, dwarf downingia, 26 legenere, and Heckard’s peppergrass, which are covered plant species (Table 2-4). 27
Alkaline sink/meadow vernal pools, as the name implies, are found scattered within alkaline 28 meadows and alkaline sinks near the Byron/Clifton Court Forebay area (Carpenter and Cosby 1939; 29 San Francisco Estuary Institute 2010). Hydrologically, these vernal pools are similar to the clay 30 alluvium vernal pools and playa pools as their hydrology is a mixture of local rainfall, groundwater 31 flow, and long distance stream transport. The surrounding vegetation is unique as it is typically 32 dominated by native grasses such as saltgrass and alkali ryegrass, or by woody shrubs like iodine 33 bush (Allenrolfea occidentalis) and subshrubs such as bush seepweed (Suaeda moquinii) and alkali 34 heath (Frankenia salina). Recent BDCP field surveys (California Department of Water Resources 35 2009 and 2010 unpublished data) found that the herbaceous vernal pool species include: Pacific 36 foxtail (Alopecurus saccatus), brass-buttons (Cotula coronopifolia), rayless goldfields (Lasthenia 37 glaberrima), Heckard’s peppergrass (Lepidium dictyotum var. dictyotum), alkali milkvetch 38 (Astragalus tener var. tener), San Joaquin spearscale (Atriplex joaquiniana), heartscale (Atriplex 39 cordulata), brittlescale (Atriplex depressa), small stipitate popcorn-flower (Plagiobothrys stipitatus 40 var. micranthus), and Sacramento mesamint (Pogogyne zizyphoroides). 41
2.3.4.9.2 Wildlife 42
Much less is known about the adaptations of animals to vernal pool conditions than about the 43 adaptations of vernal pool plants. Most animals that are endemic to vernal pools have a combination 44
Bay Delta Conservation Plan Public Draft 2-74 November 2013
ICF 00343.12

Existing Ecological Conditions
Chapter 2
of behavioral, structural, and physiological adaptations to avoid, resist, or tolerate desiccation 1 during the dry season or during long droughts. Amphibians such as California tiger salamander use 2 vernal pools for breeding and then retreat to upland refugia, primarily rodent burrows, during the 3 rest of the year. It is likely that California red-legged frogs historically used vernal pools for 4 breeding, but in the Plan Area this is not considered primary habitat. Giant garter snakes may use 5 vernal pools for foraging and historically this habitat type may have played an important winter and 6 spring foraging role, but similar to the California red-legged frog, this habitat type is no longer 7 considered primary for the species. The six crustacean species covered under the BDCP (California 8 linderiella, midvalley fairy shrimp, Conservancy fairy shrimp, longhorn fairy shrimp, vernal pool 9 fairy shrimp, and vernal pool tadpole shrimp) tend to occur in separate vernal pools with different 10 inundation periods (Table 2-4). These species are typically not found in vernal pools that have been 11 heavily invaded by low mannagrass, as the fauna of these invaded vernal pools is typically 12 dominated by mosquito and midge larvae (Rogers 1998). Waterfowl may forage in vernal pools 13 during the wet season with ducks and shorebirds consuming invertebrates and geese consuming 14 vegetation (Medeiros 1976; Reiner and Swenson 2000). 15
The upland watersheds associated with the vernal pool complex natural community provide 16 foraging habitat for covered species such as San Joaquin kit fox, greater sandhill crane, Swainson’s 17 hawk, tricolored blackbird, western burrowing owl, and white-tailed kite (Table 2-4). 18
2.3.4.9.3 Nonnative Species 19
Vernal pools in the vernal pool complex natural community are invaded by different nonnative 20 species at different points along the moisture gradient. The margins of vernal pools throughout the 21 Central Valley are often dominated by the nonnative annual ryegrass. The deeper portions of many 22 pools are being rapidly invaded by low mannagrass (Gerlach et al. 2009). Other parts of vernal pool 23 complexes are being invaded by perennial pepperweed (Swiecki and Bernhardt 2002; Witham 24 2003; Environmental Science Associates and Yolo County 2005; Witham 2006; Environmental 25 Science Associates 2007). 26
2.3.4.9.4 Ecosystem Functions 27
This is essentially an amphibious ecosystem with greatly differing functions depending on whether 28 it is in its flooded or dry stages. When flooded, this community supports an aquatic foodweb that is 29 functionally similar to that found in shallow lakes (Alexander 1976; Barclay and Knight 1981; 30 Scheffer 2004, Williams 2006). As the water recedes, its ecosystem characteristics change from 31 those of an aquatic system to those of a wetland and then to those of a terrestrial ecosystem 32 (Williams 2006), and its foodweb linkages break down as the community becomes more integrated 33 with the terrestrial landscape in which it is embedded. When flooded, it teems with a variety of 34 ephemeral pond-adapted invertebrates, the immature stages of amphibians, and waterfowl. When 35 dry, it is integrated with the surrounding terrestrial ecosystems and provides foraging habitat for 36 native wildlife, and is typically managed as rangeland and grazed by sheep or cattle. 37
2.3.4.9.5 Environmental Gradients 38
The dominant environmental gradient in the vernal pool complex natural community is driven by 39 the different chemical and physical attributes of water versus air. Water is a polar solvent that is 40 important in many chemical exchanges, and those exchanges control pH and the oxidation state of 41 many chemicals and compounds. It also has a high heat capacity so temperature changes are 42
Bay Delta Conservation Plan Public Draft 2-75 November 2013
ICF 00343.12

Existing Ecological Conditions
Chapter 2
buffered, and it is extremely viscous compared to air so exchanges between the air and water as well 1 as movement within the water are very slow (Scheffer 2004; Williams 2006). Ecological gradients in 2 vernal pools are characterized by depth and ponding/saturation duration from the pool center to 3 the surrounding grassland community. 4
2.3.4.9.6 Future Conditions with Climate Change 5
Ongoing and future climate change (Section 2.3.3.2, Climate) is expected to alter the vernal pool 6 complex natural community. Because this community is generally located at elevations that will not 7 be directly affected by rising sea level, the primary impact of climate change is predicted to be 8 driven by changes in the hydrologic regime due to increased variability in precipitation. The species 9 present in this community are adapted to existing hydrologic conditions such that increased 10 variability of precipitation would likely lead to a shorter and more variable wet season or similar 11 changes in the inundation period. It is not known how increased variability in pool hydrology would 12 affect the plants and animals inhabiting them, but because these species are adapted to current 13 conditions, the impacts will likely result in changes to species composition. In addition, rising average 14 temperatures could result in increased evapotranspiration rates and therefore shorter wetted 15 periods for vernal pools; the impacts of which are expected to be adverse to native plants and 16 wildlife. 17
2.3.4.10 Managed Wetland 18
The managed wetland natural community consists of areas that are intentionally flooded and 19 managed during specific seasonal periods to enhance habitat values for specific wildlife species 20 (CALFED Bay-Delta Program 2000). Ditches and drains associated with this community are also 21 included. The managed wetland natural community includes some areas of the CALFED Ecosystem 22 Restoration Program managed seasonal wetlands habitat, and it fits into the fresh emergent wetland 23 classification from the California Wildlife Habitat Relationships (California Department of Fish and 24 Game 2005). 25
Soils are composed predominantly of silts and clays, although coarser sediments and organic 26 material may be intermixed. In some areas, such as Suisun Marsh, organic soils (peat) may 27 constitute the primary growth medium. 28
Managed wetland is distributed largely in the northern, central, and western portions of the Delta, as 29 well as in Suisun Marsh (Boul and Keeler-Wolf 2008; Hickson and Keeler-Wolf 2007). Substantial 30 acreage of this type occurs in the Yolo Bypass, Stone Lakes National Wildlife Refuge (NWR), 31 Cosumnes River Preserve, and Suisun Marsh (Suisun Ecological Workgroup 1997; Suisun Ecological 32 Workgroup 2001; Brown 2004; EDAW 2007a; U.S. Fish and Wildlife Service 2007; Kleinschmidt 33 Associates 2008). Several islands in the central Delta support large areas of this community type, 34 including Mandeville Island, Medford Island, Holland Tract, and Bradford Island. The far western 35 edge of the Delta, including Van Sickle and Chipps islands, and Suisun Marsh also includes managed 36 wetland (Figure 2-14). Water at the far western border of the Plan Area and in the Suisun Marsh can 37 be more brackish compared to other portions of the Delta where this community occurs (Suisun 38 Ecological Workgroup 1997; Suisun Ecological Workgroup 2001; Brown 2004). 39
The typical hydrologic management regime includes flooding during the winter in anticipation of the 40 arrival of migratory birds followed by a slow drawdown of water to manage plant seed production 41 (Fredrickson and Taylor 1982; Naylor 2002) and to control mosquito populations (Kwasny et al. 42 2004). Summer irrigation may also be conducted (U.S. Fish and Wildlife Service 2007). The 43
Bay Delta Conservation Plan Public Draft 2-76 November 2013
ICF 00343.12
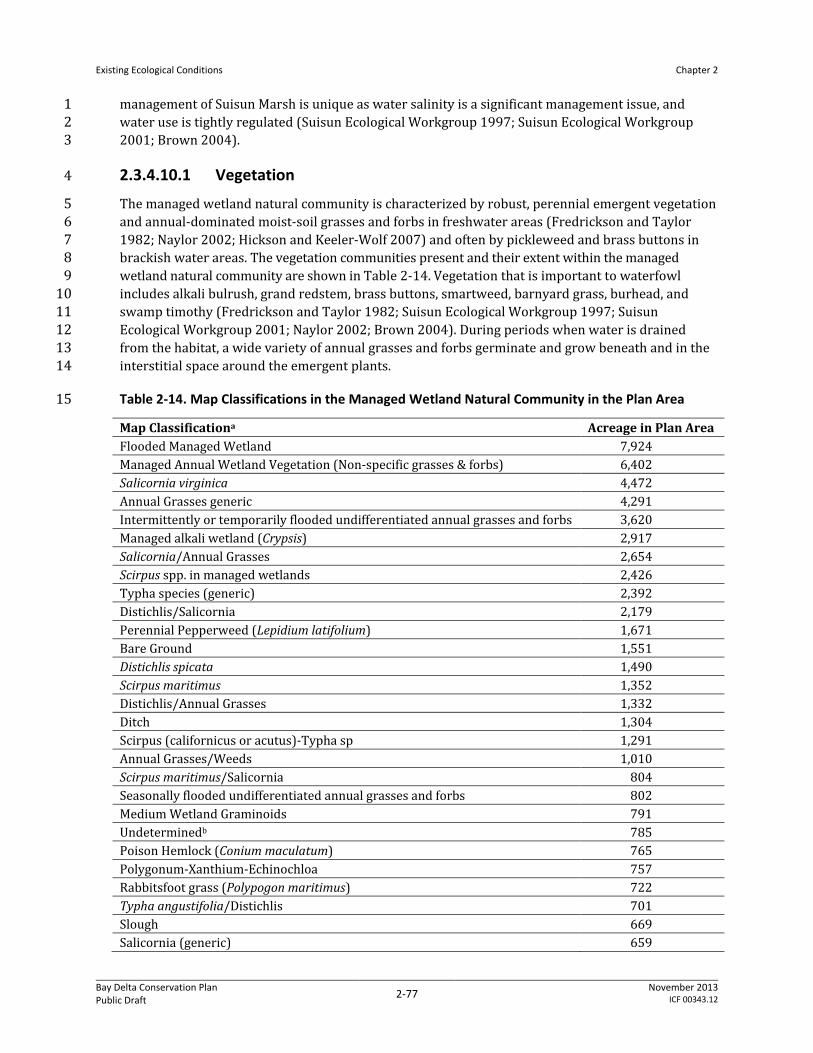
Existing Ecological Conditions
Chapter 2
management of Suisun Marsh is unique as water salinity is a significant management issue, and 1 water use is tightly regulated (Suisun Ecological Workgroup 1997; Suisun Ecological Workgroup 2 2001; Brown 2004). 3
2.3.4.10.1 Vegetation 4
The managed wetland natural community is characterized by robust, perennial emergent vegetation 5 and annual-dominated moist-soil grasses and forbs in freshwater areas (Fredrickson and Taylor 6 1982; Naylor 2002; Hickson and Keeler-Wolf 2007) and often by pickleweed and brass buttons in 7 brackish water areas. The vegetation communities present and their extent within the managed 8 wetland natural community are shown in Table 2-14. Vegetation that is important to waterfowl 9 includes alkali bulrush, grand redstem, brass buttons, smartweed, barnyard grass, burhead, and 10 swamp timothy (Fredrickson and Taylor 1982; Suisun Ecological Workgroup 1997; Suisun 11 Ecological Workgroup 2001; Naylor 2002; Brown 2004). During periods when water is drained 12 from the habitat, a wide variety of annual grasses and forbs germinate and grow beneath and in the 13 interstitial space around the emergent plants. 14
Table 2-14. Map Classifications in the Managed Wetland Natural Community in the Plan Area 15
Map Classificationa Acreage in Plan Area Flooded Managed Wetland 7,924 Managed Annual Wetland Vegetation (Non-specific grasses & forbs) 6,402 Salicornia virginica 4,472 Annual Grasses generic 4,291 Intermittently or temporarily flooded undifferentiated annual grasses and forbs 3,620 Managed alkali wetland (Crypsis) 2,917 Salicornia/Annual Grasses 2,654 Scirpus spp. in managed wetlands 2,426 Typha species (generic) 2,392 Distichlis/Salicornia 2,179 Perennial Pepperweed (Lepidium latifolium) 1,671 Bare Ground 1,551 Distichlis spicata 1,490 Scirpus maritimus 1,352 Distichlis/Annual Grasses 1,332 Ditch 1,304 Scirpus (californicus or acutus)-Typha sp 1,291 Annual Grasses/Weeds 1,010 Scirpus maritimus/Salicornia 804 Seasonally flooded undifferentiated annual grasses and forbs 802 Medium Wetland Graminoids 791 Undeterminedb 785 Poison Hemlock (Conium maculatum) 765 Polygonum-Xanthium-Echinochloa 757 Rabbitsfoot grass (Polypogon maritimus) 722 Typha angustifolia/Distichlis 701 Slough 669 Salicornia (generic) 659
Bay Delta Conservation Plan Public Draft 2-77 November 2013
ICF 00343.12

Existing Ecological Conditions
Chapter 2
Map Classificationa Acreage in Plan Area Medium Wetland Herbs 593 Distichlis (generic) 591 Scirpus californicus/S. acutus 583 Phragmites australis 569 Salicornia/Atriplex 526 Short Wetland Herbs 434 Distichlis/S. maritimus 428 Crypsis spp. - Wetland Grasses - Wetland Forbs NFD Super Alliance 402 Lepidium (generic) 378 Shallow flooding with minimal vegetation at time of photography 370 Typha angustifolia/Polygonum-Xanthium-Ech 364 Typha angustifolia/S. americanus 338 Typha angustifolia/Phragmites 338 Distichlis/Juncus 325 Atriplex/Distichlis 289 Atriplex triangularis 289 Polygonum amphibium 267 Scirpus americanus (generic) 263 Raphanus sativus (generic) 257 Juncus balticus 242 Conium maculatum 240 Atriplex/Annual Grasses 237 Cotula coronopifolia 236 Salicornia/Cotula 231 Sesuvium verrucosum 220 Elytrigia pontica 190 Lolium (generic) 189 Lotus corniculatus 189 Distichlis/S. americanus 185 Upland Herbs 166 Scirpus maritimus/Sesuvium 157 Eucalyptus globulus 141 Lepidium/Distichlis 137 Medium Upland Graminoids 135 Phragmites/Scirpus 124 Distichlis/Lotus 116 Distichlis/Cotula 114 Salicornia/Polygonum-Xanthium-Echinochloa 108 Short Wetland Graminoids 101 Baccharis/Annual Grasses 98 Salicornia/Sesuvium 96 Juncus balticus/Conium 95 Foeniculum vulgare 86 Scirpus (californicus or acutus)/Rosa 72 Tall Wetland Graminoids 72
Bay Delta Conservation Plan Public Draft 2-78 November 2013
ICF 00343.12

Existing Ecological Conditions
Chapter 2
Map Classificationa Acreage in Plan Area Crypsis schoenoides 70 Frankenia (generic) 67 Scirpus (californicus or acutus)/Wetland 67 Rubus discolor 66 Atriplex/S. maritimus 63 Smartweed Polygonum spp. - Mixed Forbs 59 Structure 58 Rosa californica 56 Lepidium latifolium - Salicornia virginica - Distichlis spicata 54 Bulrush - Cattail Fresh Water Marsh NFD Super Alliance 52 Typha angustifolia (dead stalks) 51 Fallow Disced Field 42 Atriplex triangularis (generic) 40 Medium Upland Herbs 38 Rosa/Baccharis 34 Frankenia/Distichlis 33 Lolium/Lepidium 31 Atriplex lentiformis (generic) 30 Perennial Grass 29 Agrostis avenacea 28 Sesuvium/Distichlis 28 Polypogon monspeliensis (generic) 26 Wetland Herbs 26 Centaurea (generic) 26 Freshwater Drainage 24 Scirpus americanus/S. Californicus-S. acu 23 Juncus balticus/Lepidium 20 Intermittently Flooded Perennial Forbs 19 Tidal Mudflat 19 Cultivated Annual Graminoid 18 Phalaris aquatica 18 Cynodon dactylon 17 Sesuvium/Lolium 14 Phragmites/Xanthium 10 Distichlis-Juncus-Triglochin-Glaux 9 Bromus spp/Hordeum 9 Vernal Pools 9 Medium Upland Shrubs 8 Tall Wetland Herbs 8 Temporarily Flooded Grasslands 8 Carpobrotus edulis 7 Spergularia/Cotula 6 Leymus (generic) 6 Atriplex/Sesuvium 6 Cortaderia selloana 6
Bay Delta Conservation Plan Public Draft 2-79 November 2013
ICF 00343.12

Existing Ecological Conditions
Chapter 2
Map Classificationa Acreage in Plan Area Scirpus americanus/Lepidium 5 Eucalyptus 5 Willow Trees 5 Salix laevigata/S. lasiolepis 5 Arundo donax 3 Brassica nigra (generic) 3 Lolium/Rumex 2 Fraxinus latifolia 2 Salicornia/Crypsis 2 Scirpus americanus/Potentilla 2 Frankenia/Agrostis 2 Oaks 2 Calystegia/Euthamia 2 Quercus agrifolia 2 Short Upland Graminoids 1 Vulpia/Euthamia 1 Rumex (generic) 1 Landscape Trees 1 Juncus balticus/Potentilla 1 Total 70,698 a Some of the map classifications provided here are directly representative of associations, alliances, or
phases identified through field surveys. Others represent amalgamations of field data due to issues of scale or remote sensing. Additionally, for Suisun Marsh, San Francisco Estuary Institute (2005) tidal data were used and intersected with the Boul and Keeler-Wolf (2008) vegetation data. For more detailed information concerning these map classifications and plant associations/alliances/phases, as well as methods of classification used, see Hickson and Keeler-Wolf (2007) and Boul and Keeler-Wolf (2008).
b Portions of the Plan Area for which CDFW did not delineate plant alliances were mapped only to the natural community level as described in Section 2.3.1, Data Sources and Natural Community Classification.
1
2.3.4.10.2 Fish and Wildlife 2
Managed wetland is managed specifically to promote use by wildlife, particularly birds, and as a 3 result, a wide variety of waterfowl and other birds migrating along the Pacific Flyway use the habitat 4 when inundated (Fleskes et al. 2005; EDAW 2007a; U.S. Fish and Wildlife Service 2007; 5 Kleinschmidt 2008). Sandhill cranes forage and roost, and many ducks, California black rail, geese, 6 wading birds, and shorebirds commonly forage and loaf in managed wetland in the Plan Area (U.S. 7 Fish and Wildlife Service 2007). This natural community includes abundant and diverse plant 8 assemblages and invertebrate populations that provide important food resources for migrating 9 waterfowl, bats, and many other wildlife species that forage in and over these wetlands. During 10 winter flood flow inundation, the managed wetland areas in the Yolo Bypass floodplain can provide 11 spawning and rearing habitat for Sacramento splittail and refuge habitat for other fish species 12 (Feyrer et al. 2006; Sommer et al. 2007) (Table 2-4). In Suisun Marsh, managed wetland provides 13 habitat for waterfowl, rails, Suisun song sparrow, and salt marsh harvest mouse (Suisun Ecological 14 Workgroup 1997; Suisun Ecological Workgroup 2001; Brown 2004). 15
Bay Delta Conservation Plan Public Draft 2-80 November 2013
ICF 00343.12
Existing Ecological Conditions
Chapter 2
Covered wildlife species that are associated with the managed wetland natural community within 1 the Plan Area include salt marsh harvest mouse, Suisun shrew, California black rail, greater sandhill 2 crane, Suisun song sparrow, Swainson’s hawk, tricolored blackbird, western burrowing owl, white-3 tailed kite, giant garter snake, western pond turtle, and California red-legged frog (Table 2-4). 4
2.3.4.10.3 Nonnative Species 5
Managed wetland is subjected to the same invasive nonnative plant taxa as tidal brackish emergent 6 wetland and tidal freshwater emergent wetland natural communities; however, because 7 management operations include discing and the manipulation of flooding duration, there are more 8 control opportunities. Perennial pepperweed (Lepidium latifolium) is one of the most serious threats 9 to this community. It is difficult to control and may be spread through discing (Brown 2004; Vaghti 10 and Keeler-Wolf 2004; EDAW 2007a; Environmental Science Associates 2007; Boul and Keeler-Wolf 11 2008). Other large stature invasive plant species that are problematic include pampas grass 12 (Cortaderia selloana), giant reed (Arundo donax), and the nonnative genotype of common reed 13 (Phragmites australis) (Vaghti and Keeler-Wolf 2004; Boul and Keeler-Wolf 2008). Managed wetland 14 supports nonnative animals, including red fox (Vulpes vulpes), feral cats (Felis domesticus), and rats 15 (Rattus spp.) (Brown 2004; Takekawa et al. 2006), that are predators of native wildlife and have 16 been shown to significantly reduce populations of covered species including salt marsh harvest 17 mouse, California black rail, and California clapper rail (Suisun Ecological Workgroup 2001; Brown 18 2004). 19
This natural community is also at risk from potential invasion by dreissinid mussels, as detailed in 20 Section 2.3.4.1.3, Nonnative Species. 21
2.3.4.10.4 Ecosystem Functions 22
As a surrogate for natural marshes, managed wetland is managed to support highly productive 23 seasonal wetlands interspersed with permanent wetlands to sustain large populations of waterfowl 24 and shorebirds through the production of seed and invertebrates (Brown 2004; EDAW 2007a). The 25 structure of the community is managed to provide nesting and resting or loafing areas. The 26 nutrients and primary productivity are often transferred to adjacent natural wetlands through 27 water management activities (Brown 2004) and by the daily and seasonal movements of waterfowl 28 and shorebirds. 29
2.3.4.10.5 Environmental Gradients 30
Because they are often confined behind levees, environmental gradients in managed wetland are 31 generally controlled through management actions. Discing and soil contouring provide a variety of 32 ponding depths and widths of shallow water habitat (Brown 2004; EDAW 2007a). Flooding timing, 33 duration, and water quality control species composition, primary productivity, water temperature, 34 salinity, and the timing of exports of primary productivity. 35
2.3.4.10.6 Future Conditions with Climate Change 36
The managed wetland community is particularly sensitive to increased variability in precipitation 37 associated with global climate change (Nicholls et al. 1999). Reduced and more variable water flows 38 through the Central Valley are likely to reduce the amount of water available for management 39 actions that require the flooding of the managed wetland community at precise times of the season 40 to provide habitat and food for waterfowl. Additionally, sea level rise is expected to be especially 41
Bay Delta Conservation Plan Public Draft 2-81 November 2013
ICF 00343.12

Existing Ecological Conditions
Chapter 2
significant in the Delta, where much of the land has subsided to below sea level and is currently 1 protected from flooding by levees. The current subsided island condition, combined with higher sea 2 level, increased winter river flooding, and more intense winter storms, will significantly increase the 3 hydraulic forces on the levees. With sea level rise exacerbating current conditions, a powerful 4 earthquake in the region could collapse levees, leading to major seawater intrusion and flooding 5 throughout the Delta if flows were sufficiently low, altering the tidal prism, and causing substantial 6 changes to the community (Mount and Twiss 2005). Areas within the levees that are currently 7 covered by the managed wetland community would be lost. 8
2.3.4.11 Other Natural Seasonal Wetland 9
The other natural seasonal wetland natural community encompasses all the remaining natural (not 10 managed) seasonal wetland communities that are not the vernal pool complex and alkali seasonal 11 wetland complex natural communities (Figure 2-14). The vegetation types included in the other 12 natural seasonal wetland natural community, as mapped by CDFW (Hickson and Keeler-Wolf 2007), 13 include seasonally ponded, flooded, or saturated soils dominated by grasses, sedges (Carex spp.), or 14 rushes (Juncus spp.). A review of the aerial photography (Google 2009) indicated that approximately 15 half of the other natural seasonal wetland natural community consists of seasonally ponding areas 16 in agricultural fields, and the other half consists of a temporarily flooded perennial forbs vegetation 17 type that is exclusively found in a field near the Cosumnes River that has been the subject of 18 restoration efforts through a levee breach and the creation of two ponds (Trowbridge 2005; 19 Trowbridge et al. 2005) (Figure 2-14). 20
Table 2-15. Map Classifications in the Other Natural Seasonal Wetland Natural Community in the Plan 21 Area 22
Map Classificationa Acreage in Plan Area Temporarily Flooded Perennial Forbs 185 Undeterminedb 76 Santa Barbara Sedge (Carex barbarae) 15 Total 276 a Some of the map classifications provided here are directly representative of associations, alliances, or phases
identified through field surveys. Others represent amalgamations of field data due to issues of scale or remote sensing. For more detailed information concerning these map classifications and plant associations/alliances/phases, as well as methods of classification used, see Hickson and Keeler-Wolf (2007).
b Additional mapping efforts undertaken in 2012 classify mapping units to the natural community type as described in Section 2.3.1, Data Sources and Natural Community Classification.
23
2.3.4.11.1 Vegetation 24
Vegetation found in the other natural seasonal wetland natural community consists of a mixture of 25 exotic and native perennial forbs, grasses, sedges, and rushes tolerant of temporary flooding, 26 ponding, or soil saturation during winter and spring months. 27
2.3.4.11.2 Fish and Wildlife 28
The other natural seasonal wetland natural community supports common invertebrates that are the 29 main source of food for waterfowl and shorebirds (Silveira 1998), which also use the wetlands in 30
Bay Delta Conservation Plan Public Draft 2-82 November 2013
ICF 00343.12

Existing Ecological Conditions
Chapter 2
their dry state as resting and seed foraging areas (U.S. Fish and Wildlife Service 2007; Kleinschmidt 1 Associates 2008). The covered species that use the other natural seasonal wetland natural 2 community include greater sandhill crane, Swaison’s hawk, tricolored blackbird, western burrowing 3 owl, and white-tailed kite (Table 2-4). 4
2.3.4.11.3 Nonnative Species 5
Problematic invasive nonnative plant species in the other natural seasonal wetland natural 6 community include low mannagrass, Italian ryegrass, and perennial pepperweed (Hogle et al. 2006; 7 Dawson et al. 2007; Gerlach et al. 2009). 8
2.3.4.11.4 Ecosystem Functions 9
When flooded, this natural community supports an aquatic foodweb that is functionally similar to 10 undisturbed vernal pools (Alexander 1976; Barclay and Knight 1981; Scheffer 2004; Williams 11 2006). As the water recedes, its ecosystem characteristics change from an aquatic system to a 12 terrestrial ecosystem (Williams 2006), and its foodweb linkages break down as the community 13 becomes more integrated with the terrestrial landscape in which it is embedded. 14
2.3.4.11.5 Environmental Gradients 15
The dominant environmental gradient in the other natural seasonal wetland community is driven by 16 the different chemical and physical attributes of water versus air. Water is a polar solvent that is 17 important in many chemical exchanges, and those exchanges control pH and the oxidation state of 18 many chemicals and compounds. It also has a high heat capacity so temperature changes are 19 buffered; and it is extremely viscous compared to air, so exchanges between the air and water as 20 well as movement within the water are very slow (Scheffer 2004; Williams 2006). The ecological 21 gradient between seasonal wetlands and surrounding terrestrial communities is marked by 22 transitions in plant and wildlife species and is most pronounced during the wetted phase. 23
2.3.4.11.6 Future Conditions with Climate Change 24
Ongoing and future climate change (Section 2.3.3.2, Climate) is expected to alter the other natural 25 seasonal wetland natural community. The primary impact of climate change will be driven by 26 changes in the hydrologic regime due to increased variability in precipitation. The species present in 27 this community are adapted to existing hydrologic conditions, therefore increased variability of 28 precipitation would likely lead to a shorter and more variable wet season or similar changes in the 29 inundation period. It is not known how the increased variability in seasonal hydrology would affect 30 the plants and animals inhabiting this community; however, because these species are adapted to 31 current conditions, the impacts will likely result in changes to species composition. Additionally, 32 rising average temperatures could result in increased evapotranspiration rates and therefore 33 shorter wetted periods for this community; the impacts of which are expected to be adverse to 34 native plants and wildlife. 35
2.3.4.12 Grassland 36
The grassland natural community encompasses a management spectrum ranging from natural to 37 intensively managed vegetation dominated by grasses. At the more natural end of the spectrum, it is 38 comprised of upland vegetation associations dominated by introduced or native annual and 39 perennial grasses and forbs (herbaceous species that are not grasses) (D’Antonio et al. 2007; Keeler-40
Bay Delta Conservation Plan Public Draft 2-83 November 2013
ICF 00343.12

Existing Ecological Conditions
Chapter 2
Wolf et al. 2007). At the intensively managed end of the spectrum, it includes nonirrigated 1 pasturelands (CALFED Bay-Delta Program 2000). The grassland natural community is often found 2 adjacent to wetland and riparian habitats and is the dominant community on managed levees in the 3 Plan Area (Hickson and Keeler-Wolf 2007). The distribution of the grassland natural community in 4 the Plan Area is shown in Figure 2-14. 5
The extent of this community in its natural landscape position around the periphery of the Plan Area 6 has declined over the past century due to land conversion to intensive agriculture and losses to 7 urban development (CALFED Bay-Delta Program 2000; San Francisco Estuary Institute 2010). 8 Anthropogenic changes to the natural disturbance regimes (e.g., dry-land grain farming, grazing, and 9 diseases) since European settlement have also eliminated many native plant communities 10 (D’Antonio et al. 2007; San Francisco Estuary Institute 2010). Depending upon how intensively and 11 how long a natural variant of the grassland natural community has been affected, its suite of native 12 species may have largely been replaced by nonnative species (D’Antonio et al. 2007) and is often 13 dominated by near monocultures of nonnative annual grasses and forbs (D’Antonio et al. 2007; U.S. 14 Fish and Wildlife Service 2007). In the historical tidal areas of the Delta, grassland has expanded on 15 the dry land created on and behind levees. 16
Vegetation types dominated by native grasses in the Plan Area were historically limited to a narrow 17 border of either alkaline or freshwater meadows on clay rich soils in the uplands, adjacent to either 18 marshes or alkaline sink scrub and dominated by saltgrass (Distichlis spicata). In higher topographic 19 positions on coarser textured soils, there was a unique community with a significant component of 20 native perennial and annual grasses (Distichlis, Elymus, Melica, Nassella, Poa, and Vulpia), geophytes 21 (Calochortus, Chlorogalum, Dichelostemma, and Triteleia), and a phenological succession of many 22 species of early spring-, spring-, and summer-flowering annual dicots (Bryan 1923; Thomasson Jr. et 23 al. 1960; Collins and Grossinger 2004; Grossinger 2004; Grossinger et al. 2008; San Francisco 24 Estuary Institute 2010). 25
In the southwestern portion of the Plan Area, from the Clifton Court Forebay to Oakley, there was a 26 narrow band of alkali meadow dominated by saltgrass, which was sandwiched between tidal 27 marshes and alkaline sink scrub on one side and oak savanna on the other (Carpenter and Cosby 28 1939; San Francisco Estuary Institute 2010). Similar conditions occurred around the Montezuma 29 Hills (Collins and Grossinger 2004). Using the historical conditions of the south San Francisco Bay, 30 old charts, and current floras to reconstruct the vegetation, along the borders of Suisun Marsh and 31 the Cache Slough area there were alkali meadows dominated by saltgrass located between the 32 marshes with the unique seasonal community in higher topographic positions (Collins and 33 Grossinger 2004; Grossinger 2004). 34
Along the west side of the Yolo Basin from the Cache Slough area to the current sinks of Putah Creek, 35 there was a unique landform called the Putah Plain that consisted of numerous small floodwater 36 distributaries of Putah Creek (Bryan 1923; Thomasson Jr. et al. 1960; Graymer et al. 2002; Witham 37 2003; Grossinger et al. 2008; Gerlach et al. 2009). The distributaries were aligned perpendicular to 38 the Yolo Basin as a continuous parallel repeating geomorphic series of shallow basin, low natural 39 levee, channel, low natural levee, shallow basin features. These hydrologic features disappear at 40 lower elevations in the Yolo Basin because they were periodically eroded away by large Sacramento 41 River flood events into the Yolo Basin. The channels were, and where they are still intact, are 42 dominated by vernal pool species characteristic of nonalkaline, short inundation period, clay-43 bottom, swale/pool complexes. Good examples are the relatively undisturbed channels at the CDFW 44 Tule Ranch. The basins in topographically higher positions than the channels were likely highly 45
Bay Delta Conservation Plan Public Draft 2-84 November 2013
ICF 00343.12

Existing Ecological Conditions
Chapter 2
alkaline areas that resulted from the accumulation of salts transported by floodwaters from west of 1 the Yolo Basin. These basins are dominated by saltgrass, tarweeds, tarplants, and seepweed at 2 higher elevation edges and by typical clay-bottom vernal pools species and saltpan species at their 3 bottoms. These bottoms are the local habitat of Solano grass and Colusa grass; a good example is 4 found at the Yolo County Grasslands Regional Park (Witham 2003; Environmental Science 5 Associates and Yolo County 2005; Gerlach et al. 2009). 6
Along the east side of the Plan Area in the vicinity of Stone Lakes NWR there are areas of the unique 7 seasonal community interspersed with partially filled former tidal drainages of the Cosumnes Basin 8 that grade upslope into claypan vernal pool/swale complex as reflected in the current flora and 9 aerial imagery (U.S. Fish and Wildlife Service 2007; Google 2009). These communities abut tidal and 10 reclaimed former tidal marshes and are periodically cut by small creeks and tidal channels running 11 down to the Cosumnes Basin. 12
Direct and indirect anthropogenic influences on the landscape of the Plan Area have resulted in the 13 reduction, conversion, and fragmentation of the meadows and unique seasonal communities. These 14 changes have led to diminished ecological conditions necessary for sustaining well-functioning 15 grassland natural community. In the Plan Area, the grassland natural community currently 16 comprises one of the most common natural communities, but a large portion of this grassland is in 17 areas that were historically tidal marsh and the vegetation is dominated by invasive nonnative 18 grasses. While many native plant species have been reduced in abundance or distribution through 19 these processes, they persist and coexist with nonnative plant species where the meadows and 20 unique seasonal community once existed. Some animal species have also adjusted well to the new 21 type of grassland community. Thus, the current grassland natural community still offers valuable 22 habitats to many grassland-dependent species. 23
2.3.4.12.1 Vegetation 24
The vegetation classification units present and their extent within the grassland natural community 25 are shown in Table 2-16. Common nonnative annual grass species in this natural community include 26 Italian ryegrass, soft chess, ripgut brome, red brome, wild barley, wild oats, and foxtail fescue. Native 27 perennial grasses are generally found only in areas that have not been plowed and include creeping 28 wildrye, blue wildrye, saltgrass, California melic, California brome, meadow barley, tuffed hairgrass, 29 one-sided bluegrass, and purple needlegrass (Witham 2003, 2006; Hickson and Keeler-Wolf 2007; 30 U.S. Fish and Wildlife Service 2007). If unplowed, the grassland natural community can be rich in 31 species in the lily family that may include Ithuriel’s spear, white hyacinth, harvest brodiaea, gold 32 nugget, paper onion, blue dicks, common muilla, and narrow-leaved soap plant. In some parts of the 33 Plan Area, the grassland natural community is interspersed with the vernal pool complex, alkali 34 seasonal wetland complex, and other natural seasonal wetland natural community types (Witham 35 2003, 2006; Baraona et al. 2007). The Manual of California Vegetation (Sawyer et al. 2009) 36 recognizes the broad spectrum of grassland types and includes vegetation types that are completely 37 dominated by nonnative annual grasses to grasslands that are dominated by perennial native 38 grasses. Plant species that can sometimes be found within grassland that contains patches of other 39 natural communities addressed by the BDCP include alkali milk-vetch, brittlescale, Carquinez 40 goldenbush, delta button celery, heartscale, Heckard’s peppergrass, and San Joaquin spearscale 41 (Table 2-4). 42
Bay Delta Conservation Plan Public Draft 2-85 November 2013
ICF 00343.12

Existing Ecological Conditions
Chapter 2
Table 2-16. Map Classifications in the Grassland Natural Community in the Plan Area 1
Map Classificationa Acreage in Plan Area Ruderal Herbaceous Grasses & Forbs 25,779 California Annual Grasslands - Herbaceous 24,255 Undeterminedb 16,643 Italian Rye-grass (Lolium multiflorum) 5,019 Upland Annual Grasslands & Forbs Formation 1,817 Annual Grasses generic 1,230 Bromus diandrus - Bromus hordeaceus 838 Pasture 244 Annual Grasses/Weeds 226 Lolium multiflorum - Convolvulus arvensis 36 Seasonally Flooded Grasslands 36 Distichlis/Annual Grasses 28 Centaurea (generic) 24 Cultivated Annual Graminoid 22 Perennial Grass 19 Rabbitsfoot grass (Polypogon maritimus) 14 Foeniculum vulgare 11 Bare Ground 11 Distichlis (generic) 9 Salicornia/Annual Grasses 8 Juncus bufonius (salt grasses) 6 Baccharis/Annual Grasses 5 Leymus (generic) 5 Landscape Trees 5 Foolded Managed Wetland 5 Distichlis spicata 4 Eucalyptus globulus 3 Structure 2 Salicornia/Polygonum-Xanthium-Echinochloa 2 Distichlis/Salicornia 2 Distichlis/Lotus 1 Medium Wetland Herbs 1 Lolium (generic) 1 Lepidium (generic) 1 Polygonum-Xanthium-Echinochloa 1 Distichlis/S. maritimus 1 Upland Herbs 1 Conium maculatum 1 Tall & Medium Upland Grasses 1 Medium Wetland Graminoids 1 Total 76,315 a In many areas of the Delta, Yolo Bypass, and Suisun Marsh, slightly different vegetation units were
mapped at a very fine scale. Plant alliances dominated by the same groups of species, such as nonnative annual grasses, were combined into a composite mapping unit. For more detailed information concerning the original mapping units and plant associations/alliances, as well as the methods of classification used, see Hickson and Keeler-Wolf (2007), Boul and Keeler-Wolf (2008), and Technology Associates International Corporation (2008).
b Additional mapping efforts undertaken in 2012 classify mapping units to the natural community type as described in Section 2.3.1, Data Sources and Natural Community Classification.
Bay Delta Conservation Plan Public Draft 2-86 November 2013
ICF 00343.12
Existing Ecological Conditions
Chapter 2
2.3.4.12.2 Wildlife 1
The grassland natural community provides important breeding and foraging habitat for many 2 species of wildlife. Common mammals found in grasslands include mule deer, California ground 3 squirrel, California vole, pocket gopher, desert cottontail, black-tailed jackrabbit, coyote, and badger. 4 Grasslands are important to raptors and nesting waterfowl (CALFED Bay-Delta Program 2000). 5 Raptors for which grasslands provide important foraging habitat include Swainson’s hawk, white-6 tailed kite, red-tailed hawk, northern harrier, golden eagle, American kestrel, burrowing owl, great 7 horned owl, and barn owl. Common songbirds that use the grasslands include loggerhead shrike, 8 horned lark, water pipit, western bluebird, savannah sparrow, and western kingbird. Common 9 reptiles and amphibians in the grasslands include gopher snake, common garter snake, California 10 king snake, western fence lizard, Pacific tree frog, and western toad. 11
Grasslands provide habitat for many covered wildlife species, including salt marsh harvest mouse, 12 San Joaquin kit fox, greater sandhill crane, Swainson’s hawk, tricolored blackbird, western 13 burrowing owl, white-tailed kite, giant garter snake, western pond turtle, California red-legged frog, 14 California tiger salamander, and valley elderberry longhorn beetle (Table 2-4). 15
2.3.4.12.3 Nonnative Species 16
California’s grasslands have been invaded by a large number of exotic plant species, which were 17 primarily introduced and spread through farming and ranching agricultural practices 18 (D’Antonio et al. 2007). A large number of exotic annual grass species dominate nonirrigated 19 grasslands (D’Antonio et al. 2007; Keeler-Wolf et al. 2007) with annual ryegrass, medusahead 20 (Taeniatherum caput-medusae) and barbed goatgrass (Aegilops triuncialis) being the most 21 problematic in the Plan Area (Swiecki and Bernhardt 2002; Witham 2003; Environmental Science 22 Associates and Yolo County 2005; U.S. Fish and Wildlife Service 2007; Hopkinson et al. 2008). Dicot 23 species that are especially problematic include Italian thistle (Carduus pycnocephalus), purple 24 starthistle (Centaurea calcitrapa), yellow starthistle (Centaurea solstitialis), and perennial 25 pepperweed (Lepidium latifolium) (Swiecki and Bernhardt 2002; Witham 2003; Environmental 26 Science Associates and Yolo County 2005; Witham 2006; U.S. Fish and Wildlife Service 2007; 27 Hopkinson et al. 2008). Much of the grassland natural community in the Plan Area is classified as 28 ruderal vegetation because it is dominated by nonnative opportunistic plants on disturbed soils 29 such as levees and old tilled fields. 30
Problematic vertebrate exotic species that adversely affect wildlife in the grassland natural 31 community include feral dogs (Canis lupus familiaris) and feral cats (Felis silvestris) (U.S. Fish and 32 Wildlife Service 2007). 33
2.3.4.12.4 Ecosystem Functions 34
The grassland natural community in the Plan Area is primarily managed for its function as a source 35 of primary productivity to feed domestic grazing animals (Jackson and Bartolome 2007). Burrows 36 excavated by small rodents provide terrestrial habitat for California tiger salamander and nesting 37 habitat for California burrowing owl (Witham 2006; EDAW 2007a; U.S. Fish and Wildlife Service 38 2007). Other ecosystem functions include effects on carbon sequestration and on the water and 39 nutrient cycles by the grassland natural community (Eviner and Firestone 2007; Jackson and 40 Bartolome 2007; Reever-Morghan et al. 2007). 41
Bay Delta Conservation Plan Public Draft 2-87 November 2013
ICF 00343.12

Existing Ecological Conditions
Chapter 2
2.3.4.12.5 Environmental Gradients 1
Because of its extensive distribution in California, the grassland natural community often serves as 2 the matrix in which other natural communities are embedded. In the Plan Area, it is generally 3 located in higher topographic positions with steep environmental gradients to lower and wetter 4 communities such as the alkali seasonal wetland complex and valley/foothill riparian natural 5 community. A less obvious gradient exists between subsurface environments such as rodent 6 burrows, which maintain high humidity for California tiger salamander during the hot dry season 7 (Storer 1925; Loredo and Van Vuren 1996; Petranka 1998; Trenham 1998). 8
2.3.4.12.6 Future Conditions with Climate Change 9
Ongoing and future climate change (Section 2.3.3.2, Climate) may negatively affect the grassland 10 natural community; although, there is no consensus on what the impacts will be (Dukes and Shaw 11 2007; Jackson et al. 2009). Because this community is generally located at elevations that will not be 12 directly affected by rising sea level, the primary impact of climate change will be driven by the 13 increased variability in precipitation. The species present in this community are adapted to the 14 existing precipitation regime, and an increase in the variability of precipitation is likely to lead to a 15 shorter and more variable wet season. It is uncertain how the community or its individual species 16 may respond to this increased variability (Dukes and Shaw 2007). 17
2.3.4.13 Inland Dune Scrub 18
Inland dune scrub is a dense to open shrub and sub-shrub dominated community of remnant dune 19 soils with a unique mix of rare, endemic species of plants and insects. Inland dune scrub occurs only 20 on the disturbed remnants of the former dune that existed along the southern shore of the San 21 Joaquin River, immediately east of the city of Antioch (Figure 2-14). The 190-acre dune paralleled 22 the shore for 2 miles, and was 0.15-mile wide and 120 feet tall (Howard and Arnold 1980; San 23 Francisco Estuary Institute 2010). Beginning in 1865, the sand of the dune was mined to 24 manufacture pottery, and in the late 1880s, the sand was mined to manufacture bricks. The rate of 25 sand mining greatly accelerated after the 1906 San Francisco earthquake for the manufacturing of 26 bricks to rebuild the city. In the 1920s, mining increased again for the manufacture of asphalt and 27 concrete. Sand mining then continued at a declining rate until World War II when it increased again. 28
After World War II, extensive commercial development spread across the area where the dune had 29 been mined away, and sand mining continued eastward. The mining continued on the last two 30 parcels of the dune even as USFWS was negotiating to establish the 55-acre Antioch Dunes NWR. By 31 the time the purchase was complete, the highest elevations of the remains of the dune were only 50 32 feet above MHHW of the San Joaquin River, with a slightly more dune-like area on an adjacent 12-33 acre Pacific Gas and Electric (PG&E) transmission line corridor 80 feet above MHHW (Howard and 34 Arnold 1980; U.S. Fish and Wildlife Service 1984; 2001; San Francisco Estuary Institute 2010). When 35 measured from the landward side, the highest point on the Antioch Dunes NWR is 30 feet; the PG&E 36 elevation is 60 feet. 37
A description of the combined area of the Antioch Dunes NWR and PG&E properties with dune-like 38 characteristics at the time of acquisition stated that “only an extremely small percentage of the area 39 is in the configuration of a dune” (U.S. Fish and Wildlife Service 1984). Management actions to 40 increase the dune-like characteristics of Antioch Dunes NWR have included creating small dunes 41 with 7,000 cubic yards of dredged sand material that had been stockpiled on the PG&E property 42
Bay Delta Conservation Plan Public Draft 2-88 November 2013
ICF 00343.12

Existing Ecological Conditions
Chapter 2
(which proved unsuitable due to its clay content), and bulldozing the residual sand on the Antioch 1 Dunes NWR into the shape of small dunes (U.S. Fish and Wildlife Service 1984, 2001). 2
The geological origin of the dune has not been determined; however, regardless of its original 3 source, the sand was sorted from a mixture of fine- and coarse-textured material and redeposited by 4 wind (not water), as indicated by its extremely low clay content (soil survey), and it appears to have 5 had a deep, older layer as well as a more recent layer (U.S. Fish and Wildlife Service 2001). It has 6 been speculated that the sand was brought to the location by the San Joaquin River approximately 7 140,000 years ago, and that the most recent dune probably established prior to the post-ice age sea 8 level rise approximately 15,000 years ago (U.S. Fish and Wildlife Service 1984, 2001). 9
Most accounts incorrectly describe the sand as the result of glaciation even though glaciated 10 material would consist of very fine clay and silt-like particles (glacial milk). Instead, the sand 11 probably originated during warm, humid periods as the granitic rock of the southern Sierra Nevada 12 was chemically transformed into grus and then transported to the San Joaquin Valley during 13 enormous slope failures (Wahrhaftig 1965; Twidale and Vidal Romaní 2005; Graham et al. 2010). 14 While the dune was a unique formation, the sand is distributed southwestward from the dune in a 15 5.5-miles-by-2-miles oblong patch (Carpenter and Cosby 1939; San Francisco Estuary Institute 16 2010). 17
In the 1933 soil survey of the area, the sand was classified as the Oakley sand soil series, and it was 18 determined to be infertile, slightly acidic, and consisting of 2% coarse sand, 65% fine sand and 1% 19 clay (Carpenter and Cosby 1939). In contrast, the much more heterogeneous riverine deposit of 20 Piper fine sandy loam on the low islands of the nearby Delta is slightly alkaline and consists of 12% 21 coarse sand, 45% fine sand, and 4% clay. 22
2.3.4.13.1 Vegetation 23
The vegetation communities present and their extent within the inland dune scrub natural 24 community are shown in Table 2-17. Inland dune scrub is more similar to the vegetation of sandy 25 soils in the San Joaquin Valley and Mohave Desert than to coastal scrub communities (Howard and 26 Arnold 1980). Unfortunately, the predisturbance species composition of the vegetation was never 27 well described before the sand mining and extensive oak cutting in the early 1900s and post-World 28 War II (U.S. Fish and Wildlife Service 2001). Based on early charts and a postcard dating from the 29 early 1900s, the vegetation contained widely scattered large valley oaks, live oaks, various shrub 30 species, and numerous herbaceous species (Howard and Arnold 1980; San Francisco Estuary 31 Institute 2010). Very similar vegetation occurred 1.5 miles southeast of the dune as a 3-mile by 1.5-32 mile, 3,000-acre oblong patch on the Oakley sand soil southwest of Oakley (San Francisco Estuary 33 Institute 2010). That area of chaparral/scrub was described as nearly impenetrable, but was cleared 34 for grain production, later planted as almond orchards, and now is almost entirely developed (San 35 Francisco Estuary Institute 2010). 36
Bay Delta Conservation Plan Public Draft 2-89 November 2013
ICF 00343.12

Existing Ecological Conditions
Chapter 2
Table 2-17. Map Classifications in the Inland Dune Scrub Natural Community in the Plan Area 1
Map Classificationa Acreage in Plan Area Lupinus albifrons - Antioch Dunes 15 Lotus scoparius - Antioch Dunes 5 Total 19 a Some of the map classifications provided here are directly representative of associations, alliances, or
phases identified through field surveys. Others represent amalgamations of field data due to issues of scale or remote sensing. For more detailed information concerning these map classifications and plant associations/alliances/phases, as well as methods of classification used, see Hickson and Keeler-Wolf (2007).
2
Antioch Dunes NWR vegetation surveys conducted by Susan Bainbridge of the UC Berkeley Jepson 3 Herbarium and the California Native Plant Society (CNPS) were used by CDFW (Hickson and Keeler-4 Wolf 2007) to map two Antioch Dunes unique vegetation types that have one or more shrubs in the 5 overstory, which may have very sparse cover. The data were not formally analyzed by the CDFW 6 Delta mapping project, and the inland dune scrub community is defined by the presence of either of 7 the two vegetation types. One vegetation type consists of a broadleaf shrubland that was classified 8 as the Lupinus albifrons Antioch Dunes alliance (5 acres), and the other is a dwarf shrub vegetation 9 type classified as the Lotus scoparius Antioch Dunes alliance (15 acres). Given that L. albifrons is 10 primarily a coastal species, while the vegetation of the dune is primarily the northern-most 11 expression of desert vegetation, it is more likely the species is the L. excubitus, an interior and desert 12 species that is indistinguishable from L. albifrons (Rosatti ed. 2010). Other plant species present 13 include ripgut brome (Bromus diandrus), yellow starthistle (Centaurea solstitialis), elegant clarkia 14 (Clarkia unguiculata), naked stem buckwheat (Eriogonum nudum var. auriculatum), California poppy 15 (Eschscholzia calfornica), California croton (Croton californicus), Grindelia (Grindelia spp.), California 16 matchweed (Gutierrezia californica), telegraph weed (Heterotheca grandiflora), vetch (Vicia spp.), 17 and Russian thistle (Salsola tragus) (U.S. Fish and Wildlife Service 2001)(Table 2-4). 18
2.3.4.13.2 Wildlife 19
Recent observations of wildlife on the Antioch Dunes NWR include coyote (Canis latrans), long-20 tailed weasel (Mustela frenata), muskrat (Ondatra zibethica), raccoon (Procyon lotor), Townsend’s 21 mole (Scapanus townsendi), Beechy ground squirrel (Otospermophilus beecheyi), black-tailed 22 jackrabbit (Sylvilagus bachmani), Botta’s pocket gopher (Thomomys bottae), gray fox (Urocyon 23 cinereoargenteus), red fox (Vulpes vulpes), racers (Coluber constrictor), gopher snake (Pituophis 24 melanoleucus), western fence lizard (Sceloporus occidentalis), and common side-blotched lizard (Uta 25 stansburiana). Numerous bird species have been observed on the Antioch Dunes NWR (migratory 26 and resident), and gadwalls (Anas strepera) and mallards (A. platyrhynchos) have nested there. 27 Historically, the dunes represented the northernmost occurrences for reptiles adapted to arid 28 conditions, including the California legless lizard (Anniella pulchra), glossy snake (Arizona elegans), 29 San Joaquin whipsnake (Masticophis flagellum ruddocki), and side-blotched lizard (Uta stansburiana) 30 (Howard and Arnold 1980; U.S. Fish and Wildlife Service 1984, 2001, 2008b). 31
2.3.4.13.3 Invertebrates 32
The Antioch Dunes have been known as an entomological hotspot since the 1930s, when research 33 entomologists began collecting in what is now the Sardis Unit of the Antioch Dunes NWR (Howard 34
Bay Delta Conservation Plan Public Draft 2-90 November 2013
ICF 00343.12

Existing Ecological Conditions
Chapter 2
and Arnold 1980; Arnold 1983). The area attracted extensive academic attention for its large and 1 colorful species with desert affinities. In the 1930s, many species of wasps and flies, particularly the 2 giant flower-loving fly (Thaphiomydas trochilus), were completely new to the region’s collectors. A 3 total of 27 taxa were described from the Antioch Dunes during that decade. Eight of those taxa are 4 endemic to the Antioch Dunes; four are now extinct, three are of uncertain status, and one is the 5 federally and state endangered Lange’s metalmark butterfly (Apodemia mormo langei). 6
2.3.4.13.4 Nonnative Species 7
The primary problematic nonnative plant species in this community are annual grasses such as 8 ripgut brome, vetches, and yellow starthistle (Centaurea solstitialis), which form dense patches that 9 crowd native plant species and reduce habitat value for wildlife and invertebrates (U.S. Fish and 10 Wildlife Service 2001). 11
2.3.4.13.5 Ecosystem Functions 12
The inland dune scrub natural community is found on infertile sandy soil that historically was a 13 large dune. There are only two patches totaling 19 acres of this natural community currently in 14 existence, all of which have been severely degraded by a century of sand mining. Currently, the 15 degraded remnants of the community are being managed exclusively for the three endangered 16 species for which the Antioch Dunes NWR was established to protect. 17
2.3.4.13.6 Environmental Gradients 18
Inland dune scrub transitions into the tidal brackish emergent wetland natural community along its 19 border with the San Joaquin River (U.S. Fish and Wildlife Service 1984, 2001). Its other three sides 20 are bordered by commercial developments. 21
2.3.4.13.7 Future Conditions with Climate Change 22
Because this community is generally located at elevations that will not be directly affected by rising 23 sea level, the primary impact of climate change is predicted to be driven by changes in the 24 hydrologic regime due to increased variability in precipitation. The species present in this 25 community are adapted to a highly variable precipitation, and it is uncertain how they will be 26 affected by increased variability. 27
2.3.4.14 Cultivated Lands 28
The majority of lands in the Delta are currently cultivated lands (Figure 2-14). Major Delta region 29 cultivated crops and cover types include small grains (such as wheat and barley), field crops (such 30 as corn, sorghum, and safflower), truck crops (such as tomatoes and sugar beets), forage crops (such 31 as hay and alfalfa), pastures, orchards, and vineyards (CALFED Bay-Delta Program 2000; California 32 Department of Water Resources 2007b). Of the total Plan Area, 66% is cultivated. Of the total 33 acreage of irrigated land in the Delta, which encompasses both seasonally flooded and upland 34 cropland, corn is currently the predominant cover type (28%), followed by alfalfa (21%), pasture 35 (12%), and tomatoes (8%). Orchards cover 4% of the total irrigated land acreage in the Delta, and 36 asparagus covers 3% (California Department of Water Resources 2007b). The distribution of 37 seasonal crops in the Plan Area varies annually, depending upon crop-rotation patterns and market 38 forces. Vegetable crops are the most abundant crops in the region (Fleskes et al. 2005). Changes in 39 agricultural crops in the Delta over the past 30 to 40 years have shown dramatic trends, including a 40
Bay Delta Conservation Plan Public Draft 2-91 November 2013
ICF 00343.12

Existing Ecological Conditions
Chapter 2
six-fold reduction in asparagus acreage (lowering it from the number one crop to the number eight 1 crop in acreage grown), a two-fold increase in corn acreage (making it the number one crop in 2 acreage grown), and an 18-fold increase in vineyards (California Department of Water Resources 3 2007b). These changes can have substantial effects on the habitat value of cultivated lands for 4 wildlife, particularly for birds. 5
2.3.4.14.1 Vegetation 6
Vegetation in the cultivated lands natural community is variable and dynamic in terms of structure, 7 growth, and harvesting patterns. Croplands do not conform to natural habitat successional stages. 8 Instead, cropland is regulated by the artificial crop cycle. Vegetation can be either annual or 9 perennial and can germinate at various times of the year. The largest proportion of the Plan Area 10 landscape includes annually cultivated irrigated croplands that are rotated seasonally or annually to 11 conserve soil nutrients and maintain soil productivity (Table 2-18). This portion of the landscape, 12 which includes most field, truck, and grain crops, changes seasonally as crops grow, are harvested, 13 and with the rotational sequence of different crop types. These changes influence the value and use 14 of cultivated habitats to covered wildlife species on a seasonal basis. Other cover types, such as 15 orchards, vineyards, rice, and irrigated pasture remain uncultivated for many years and are 16 considered perennial crop types because they do not seasonally or annually rotate to other crop or 17 cover types. Still other crops, particularly alfalfa and other hay crops, while regularly harvested, may 18 remain uncultivated for multiple years, but eventually are rotated to other uses and are thus 19 referred to as semi-perennial crop types. 20
While planting timeframes are variable, most annually cultivated croplands are planted in spring 21 and harvested in late summer or early fall. Much of the Plan Area remains unplanted and bedded 22 during the winter season, although a second crop may be planted during the same growing season in 23 some areas. Cropland vegetation is grown as a monoculture, using tillage or herbicides to eliminate 24 unwanted vegetation. 25
However, interspersed within the cultivated lands are small patches or linear corridors of natural 26 vegetation and other natural features, such as riparian woodland and scrub, wetlands, ponds, 27 hedgerows, tree rows, and small patches of isolated native or nonnative trees. Cultivated lands in 28 the Plan Area are not known to support any covered plant species (Table 2-4). Soil often dictates the 29 type of crops grown in the Plan Area. Corn, for instance, requires better soil than barley, which can 30 grow in poor-quality soil; and rice does well in clay soil not suitable for other crops. Leaching can 31 remove contaminants in areas of high salt or alkali levels, making the soil highly productive. Local 32 climate variation also influences the type of crops grown (California Department of Fish and Game 33 2005). 34
Orchard crops are categorized as deciduous or evergreen, with deciduous orchards far more 35 common in the Delta region than evergreen orchards. Deciduous orchards include commercially 36 productive tree crops in which the trees lose their leaves at some point in the year and include fruit 37 and nut trees (e.g., pear and walnut), and bush crops. Bush crops are similar to orchards, but they 38 may be configured in rows rather than a matrix, and are much shorter. Evergreen orchards include 39 commercially productive tree crops, including citrus, avocado, and olive groves, in which the trees 40 retain their leaves throughout the year (Hickson and Keeler-Wolf 2007). Cultivated lands also 41 include eucalyptus, tree-of-heaven, and other exotic vegetation stands. 42
Bay Delta Conservation Plan Public Draft 2-92 November 2013
ICF 00343.12

Existing Ecological Conditions
Chapter 2
Table 2-18. Map Classifications in the Cultivated Lands in the Plan Area 1
Map Classificationa Acreage in Plan Area Corn 100,933 Alfalfa & Alfalfa mixtures 80,948 Vineyards 33,857 Tomatoes (processing) 31,297 Mixed pasture 30,576 Misc grain and hay 27,667 Native Vegetation 26,869 Misc semi-ag 20,602 Deciduous fruits and nuts 19,897 Safflower 15,410 Asparagus 11,301 Rice 10,259 Native Pasture 8,376 Cropped within the past three years 8,143 Sudan 6,297 Beans (dry) 6,005 Wheat 4,731 Miscellaneous field 4,571 Melons, squash, and cucumbers (all types) 4,427 Turf farms 3,740 Non-irrigated native pasture 3,465 Potatoes 3,053 Non-irrigated mixed pasture 2,995 Farmsteads (includes a farm residence) 2,119 Other Ag Lands 2,028 Misc truck 1,585 non-irrigated Misc. Grain and Hay 1,303 Sunflowers 1,175 Dairies 830 Farmsteads (without residence) 820 Wild Rice 578 Other Pasture 577 Peppers 535 Sugar Beets 445 Misc grasses 422 Grain and Hay Crops 401 Marsh lands, tules and sedges 350 Grain sorghum 324 Hybrid sorghum/sudan 305 Onions/garlic 303
Bay Delta Conservation Plan Public Draft 2-93 November 2013
ICF 00343.12

Existing Ecological Conditions
Chapter 2
Map Classificationa Acreage in Plan Area Citrus and Sub-tropical 264 New lands being prepped for crop production 235 Cabbage 222 Bush berries 218 Water surface 206 Carrots 197 Livestock feedlots 180 Beans (green) 122 Flowers, nursery, Christmas trees 114 Celery 105 Cotton 78 Oats 74 Field Crops 71 Barren and wasteland 68 Mixed 39 Poultry farms 38 Clover 32 Mixed grain and hay 32 Rye grass 29 Lettuce 20 Strawberries 18 Broccoli 13 Semi-agricultural and incidental 5 non-irrigated Mixed grain and hay 2 Natural high water table meadow 2 Market Tomatoes 2 Total 481,908 a Source: California Department of Water Resources 2007b (Land Use)
1
2.3.4.14.2 Fish and Wildlife 2
Cultivated lands in the Plan Area formerly consisted of extensive wetlands, open grasslands, broad 3 riparian systems, and oak woodlands. The conversion of natural vegetation to agriculture has 4 eliminated large areas of these native habitats. However, although they generally support a less 5 diverse community of wildlife compared with most native habitats, agricultural systems continue to 6 support abundant wildlife and provide essential breeding, foraging, and roosting habitat for many 7 resident and migrant wildlife species (Fleskes et al. 2005; EDAW 2007a; U.S. Fish and Wildlife 8 Service 2007; Kleinschmidt 2008). Cultivated lands in the Plan Area provide habitat for several 9 federal and California listed species covered by the BDCP, including greater sandhill crane, 10 Swainson’s hawk, tricolored blackbird, western burrowing owl, white-tailed kite, giant garter snake, 11 western pond turtle, and California red-legged frog (Table 2-4). 12
Bay Delta Conservation Plan Public Draft 2-94 November 2013
ICF 00343.12

Existing Ecological Conditions
Chapter 2
Cultivated lands in the Delta provide essential upland habitat for many wildlife species. Crop 1 patterns that include a variety of hay, grain, and row crops support abundant rodent populations. 2 Field edges, woodlots, and watercourses that support riparian habitat also provide breeding sites 3 and refugia for prey species and other wildlife. Because of this abundance of food, the Central Valley 4 supports one of the largest concentrations of raptors during the winter and breeding seasons. 5 Raptors, such as red-tailed hawk, Swainson’s hawk and white-tailed kite, nest throughout the 6 Central Valley and forage in a variety of agricultural crop types including hay, grain, row crops and 7 irrigated pastures. Conversion of pastures, row crops, and similar agricultural habitats to orchards 8 and vineyards has been noted as a factor affecting raptors such as Swainson’s hawk (Estep in prep). 9 Grain, corn, and rice fields also provide important foraging habitats for sandhill cranes, waterfowl, 10 wading birds, and shorebirds. Upland and seasonally flooded agricultural habitats and wetlands of 11 the Delta support an estimated 10% of the waterfowl population that winter annually in California 12 (CALFED Bay-Delta Program 1998). 13
The Yolo Bypass Wildlife Area is an example of an area that utilizes agriculture to manage wildlife 14 habitats while providing income from agriculture (EDAW 2007a). Many agricultural practices 15 occurring in the Yolo Bypass Wildlife Area provide habitat for a diverse assemblage of wildlife 16 species. Rice is grown, harvested, and flooded to provide food for thousands of waterfowl. Cornfields 17 are harvested to provide forage for geese and cranes. Working with local farmers, the Yolo Bypass 18 Wildlife Area provides fields of grain sorghum, corn and sudan grass specifically for wildlife forage 19 purposes. Crops such as safflower are cultivated and mowed to provide seed for upland species such 20 as ring-necked pheasant and mourning dove (EDAW 2007a). 21
When inundated, the Yolo Bypass provides habitat for at least 42 fish species, 15 of which are native 22 (Sommer et al. 2001a). The bypass seasonally supports several covered species, including delta 23 smelt, splittail, green sturgeon, steelhead, and spring-run and winter-run Chinook salmon (Table 2-24 4). The majority of the floodplain habitat is seasonally dewatered and therefore cannot be 25 dominated by nonnative fish species except in perennial waters. Typical winter and spring spawning 26 and rearing periods for native Delta fishes coincide with the timing of the flood pulse (Sommer et al 27 2001a). Evidence suggests that splittail and Chinook salmon benefit from Yolo Bypass inundation 28 because of increased seasonal floodplain habitat that is used for rearing and spawning due to the 29 increased food supply, lower water velocity, and warmer water. 30
Native and nonnative vegetation growing along field margins and riparian vegetation growing along 31 permanent agricultural ditches also provides habitat for migrant and resident songbirds, raptors, 32 reptiles, amphibians, and small mammals. Filter strips of vegetation planted in agricultural areas to 33 improve water quality also provide wildlife habitat. Natural seasonal wetlands associated with 34 agricultural drainage and irrigation channels provide habitat for a number of wildlife and fish 35 species. 36
The wildlife habitat value of cultivated lands is a function of several variables, including accessibility 37 to prey, prey density, and proximity to other habitat types. However, due to the dynamic nature of 38 the cultivated land, to best evaluate the wildlife value of agricultural cover types in the Plan Area 39 over a long timeframe, cover types can be characterized at a broad scale according to seasonal or 40 perennial condition. Although perennial or semi-perennial cover types can be evaluated 41 independently, seasonal crop types are best evaluated more generally by combining all seasonally 42 and annually cultivated crop types into a single category. Specific crop type requirements or 43 preferences can be addressed at the species-specific or preserve management level. Cultivated lands 44 in the Plan Area are characterized and evaluated by the crop types presented in Figure 2-16. Those 45
Bay Delta Conservation Plan Public Draft 2-95 November 2013
ICF 00343.12

Existing Ecological Conditions
Chapter 2
crop types that provide the greatest habitat value for covered species are summarized in Table 2-19 1 and described in the text below. 2
Table 2-19. Acreages of Cultivated Land Categories in the Plan Area 3
Cultivated Lands Subtype Plan Area Acreage Alfalfa 80,948 Irrigated pasture 70,623 Rice 10,837 Orchards 20,161 Vineyards 33,857 Other cultivated cropsa 238,234 Other cultivated landsb 27,248 Total 481,908 Source: California Department of Water Resources 2007b (Land Use) a Other cultivated crops primarily include field crops, truck, nursery, and berry crops, and nonirrigated
pasture. b Other cultivated lands consist of livestock feedlots, dairies, poultry farms, and cropland-associated
infrastructure such as roads, ditches, houses, etc. 4
Alfalfa. Alfalfa is an ungrazed irrigated hay crop used for livestock feed. Alfalfa is regarded as a 5 semi-perennial crop type typically remaining uncultivated for 4 to 5 years, and occasionally longer. 6 During this time, it is not rotated to other crop types. Alfalfa is considered the agricultural cover type 7 with the highest foraging value to Swainson’s hawk and the white-tailed kite, and is an important 8 foraging cover type for the greater sandhill crane and tricolored blackbird. Its value is largely a 9 function of its relatively low vegetation structure, and the practice of regular mowing and flood 10 irrigating during the spring and summer, which enhances prey accessibility for foraging birds. This 11 crop type is distributed throughout the Plan Area, including portions of the Yolo Bypass. 12
Irrigated Pasture. Irrigated pastures are irrigated grasses or hays grazed by livestock and 13 periodically cut for hay. They include large pasturelands found in the Yolo Bypass, Sherman Island, 14 and other Delta islands, and smaller pastures associated with farm residences or smaller cattle 15 operations. While smaller irrigated pastures may be rotated to other cover types periodically, most 16 irrigated pasturelands remain intact for many years. Like alfalfa, irrigated pastures provide foraging 17 value to several covered species, including Swainson’s hawk, white-tailed kite, burrowing owl, 18 greater sandhill crane, and tricolored blackbird. 19
Rice. Because rice cultivation requires a narrow range of soil conditions and because of the 20 infrastructure required to effectively manage rice fields, this crop is not typically rotated and 21 remains for many consecutive years, sometimes decades. Thus, rice is also considered a perennial 22 crop type. Rice fields are active beginning as early as March when fields are initially flooded, to 23 September, October, and November when fields are drained and harvested. During the fall and 24 winter, some rice fields are flooded to provide habitat for wintering waterfowl. Rice fields provide 25 important aquatic habitat for giant garter snakes during the active season, as well as foraging 26 habitat for many bird species during the active and inactive seasons. 27
Orchards. Orchards are perennial crops that provide limited wildlife value, particularly to covered 28 species. Orchards develop a vegetation overstory that generally precludes access by foraging 29
Bay Delta Conservation Plan Public Draft 2-96 November 2013
ICF 00343.12

Existing Ecological Conditions
Chapter 2
Swainson’s hawks, white-tailed kites, burrowing owls, and other cultivated land-associated covered 1 species. Orchards are planted in rows and eventually develop a dense overstory canopy. Some bats 2 and birds find roosting and nesting opportunities in orchard trees, but overall, orchard trees receive 3 limited use and are of negligible value to covered species. 4
Vineyards. Like orchards, the structure of vineyards also limits use by covered species and most 5 other wildlife. This crop type also remains for many consecutive years and is considered a perennial 6 cover type. Planted in rows, a relatively dense overstory develops that prohibits use by most 7 agriculture-associated wildlife species. The increase in vineyard acreage in the Plan Area has 8 removed other agricultural habitats more suitable to wildlife. 9
Other Cultivated Crops. This type is defined as areas dominated by crop patterns that involve 10 annual or seasonal cultivation and rotation. This is the dominant cover type in the Plan Area and 11 consists of most of the field, truck, and grain crops. These types are generally characterized as 12 having seasonal or fluctuating habitat value depending on the planting and harvesting regime and 13 vegetation structure. Thus, there is substantial variation in habitat value among the many crop types 14 included within this category. Because they are rotated seasonally or annually, the value of 15 individual fields changes each year. In addition, lands that are farmed to rotated irrigated crops 16 generally have periods—usually during the fall post-harvest and winter months—when the fields 17 are disked or bedded and support no vegetation. Therefore, for purposes of general classification 18 and modeling habitat value, these crop types are not differentiated based on their individual 19 seasonal value but are instead combined into a category of seasonally rotated croplands. 20
2.3.4.14.3 Nonnative Species 21
The cultivated land within the Plan Area supports primarily nonnative cultivated crops interspersed 22 with small linear features (e.g., riparian corridors) or small patches (e.g., wetlands) that support 23 native vegetation. The modified and disturbed conditions inherent to agricultural habitats have also 24 encouraged a variety of undesirable nonnative species, commonly referred to as agricultural weeds, 25 that occur around the perimeter of agricultural fields and that rapidly germinate in idle fields. These 26 nonnative agricultural weeds usually require ground disturbance, such as tillage and irrigation, to 27 establish and persist. Many have been persistent in the cultivated land for generations. Active and 28 ongoing agricultural activity, including regular cultivation and herbicide application, is required to 29 suppress expansion in active fields. 30
Cultivated lands also attract a variety of nonnative wildlife species, particularly where patches of 31 natural habitat persist within the landscape that provides refuge from regularly cultivated lands. 32 Nonnative birds, such as the European starling and house sparrow, and nonnative mammals such as 33 the Norway rat and house mouse commonly occur in cultivated lands and adjacent riparian and 34 wetland habitats in the Delta and throughout the Central Valley. These and other nonnative wildlife 35 species are not unique to cultivated lands, but also occur in many natural habitats. In cultivated 36 lands, nonnative species are generally considered with respect to their impacts on cropland 37 productivity and agricultural economics; however, some species can also invade adjacent riparian 38 and wetland habitats. 39
2.3.4.14.4 Ecosystem Functions 40
While important for providing essential human services (e.g., food, fuel, fiber), cultivated lands are 41 generally considered detrimental to most ecosystem functions. The regular and intensive cultivation 42 of lands within the Delta can be contrary to the natural patterns of nutrient cycling, soil and 43
Bay Delta Conservation Plan Public Draft 2-97 November 2013
ICF 00343.12

Existing Ecological Conditions
Chapter 2
sediment retention, water flow and water quality regulation, climate and air quality regulation, flood 1 protection, and the protection of biodiversity. While some elements of ecosystem function can be 2 partially retained, such as providing flooded habitat for wintering waterfowl and other waterbirds, a 3 more comprehensive approach to cultivated land management that incorporates natural systems 4 and functions is generally required to retain or enhance most ecosystem functions, such as 5 incorporation of small patches or linear corridors of natural vegetation or wetlands. 6
The native Delta landscape was an extensive tidal marsh complex made up of freshwater and 7 brackish marshes. By the mid-1800s, reclamation of wetlands began to transform the Delta into an 8 agricultural region with a complex system of channelized waterways and Delta “islands.” This 9 transformation of the Delta into intensively managed cultivated lands has substantially reduced its 10 ecosystem functions and led to the development of several major resource issues that have affected 11 agricultural productivity and stability of the Delta environment including flooding, salinity intrusion, 12 and subsidence. 13
Cultivated lands can, however, provide important habitats for wildlife; and if appropriately 14 managed, can serve as surrogate habitats for native grasslands and wetlands that were converted to 15 cultivated lands. Several covered species rely on cultivated lands to meet life requisites. For 16 example, flooded rice fields provide surrogate wetland habitats for the giant garter snake and 17 western pond turtle during the spring and summer, hay crops and some annually cultivated crops 18 provide important foraging habitat for the Swainson’s hawk and the white-tailed kite, and winter-19 flooded croplands provide essential foraging and roosting habitat for the greater sandhill crane as 20 well as waterfowl and other waterbirds along the Pacific Flyway. 21
2.3.4.14.5 Environmental Gradients 22
In general, cultivated lands have a detrimental effect on natural gradients due to the removal of 23 native habitats, grading and leveling of land, and changes in both groundwater and surface water 24 movement. As a result, environmental gradients associated with cultivated lands tend to be abrupt. 25 The majority of the Plan Area consists of cultivated lands with little to no topographic relief. These 26 lands transition to grassland habitats in several areas, including portions of the southwestern, 27 northeastern, and western edges of the Plan Area, and portions of the Yolo Basin. Tidal perennial 28 aquatic habitats occur within cultivated lands, such as Franks Tract, Clifton Court Forebay, and the 29 Sacramento and San Joaquin Rivers; however, because these areas are confined by levees and water 30 flow is highly regulated, there is little natural transition between these features and cultivated lands. 31 Cultivated lands also transition to some wetland habitats, primarily in the Yolo Basin. 32
2.3.4.14.6 Future Conditions with Climate Change 33
Cultivated lands may be particularly sensitive to long-term sea level rise associated with global 34 climate change (Section 2.3.3.2, Climate) (Nicholls et al. 1999). More variable flows through the 35 Central Valley could reduce the reliability of water supply available for irrigating crops at critical 36 times of the year. With sea level rise exacerbating current conditions, a powerful earthquake in the 37 region could collapse levees; leading to major saltwater intrusion and flooding throughout the Delta 38 if flows were sufficiently low, altering the tidal prism and causing substantial changes to agricultural 39 areas (Mount and Twiss 2005). Areas within levees that are currently farmed would be affected by 40 the floodwaters. 41
Crop types are anticipated to change with elevated ambient temperatures. Jackson et al. (2009) 42 asserted that over the next 50 years, cultivation of some warm season crops, such as tomatoes, 43
Bay Delta Conservation Plan Public Draft 2-98 November 2013
ICF 00343.12

Existing Ecological Conditions
Chapter 2
cucumbers, sweet corn, and peppers, is expected to decline; whereas cultivation of hot season crops, 1 including melons and sweet potatoes, are expected to increase because of climatic changes. 2
2.4 Biological Diversity 3
California is considered a global hotspot for biological diversity, where species diversity, endemism, 4 and threats to this diversity are particularly high (Myers et al. 2000; Stein et al. 2000). California is 5 particularly rich in unique plant species and contains globally important sites of plant diversity 6 (Davis et al. 1997). 7
By most measures of biological diversity, California stands out as unique in North America. For 8 example, California contains more native biological diversity than any other state, including more 9 endemic species than any other state (1,295 species) (Stein 2002). Compared to other states, 10 California is ranked first in the United States in the number of endemic species of freshwater fish, 11 vascular plants, amphibians, reptiles, and mammals (Stein et al. 2000). In terms of total species, 12 California supports approximately one-third of all species of vascular plants and reptiles in the 13 United States, 47% of mammal species, and 56% of bird species (California Department of Fish and 14 Game 2003). 15
The Plan Area supports a great diversity of habitats. CDFW has identified over 100 different plant 16 associations, as defined by Sawyer and Keeler-Wolf (1995), in the Plan Area within the general 17 biological communities of aquatic, seasonal wetlands, tidal and nontidal perennial wetlands, 18 grasslands, riparian, and agricultural lands (Hickson and Keeler-Wolf 2007). The Delta is part of the 19 Pacific flyway, one of the major north-south migratory routes for avifauna in the Americas. Surveys 20 of the California Central Valley, including the Delta, document that it is one of the most important 21 regions in western North America to migratory and wintering shorebirds (Shuford et al. 1998). 22
One measure of the degree of biological diversity in the Plan Area is the number of species known to 23 inhabit the Delta and surrounding uplands. Based on information from various sources, an 24 estimated 345 species of vertebrates could occur in the biological communities of the Plan Area, 25 representing approximately 40% of all the vertebrate species known to occur in California (Table 2-26 20). Table 2-20 presents the number and percentage of species found in the Plan Area compared 27 with the entire State of California by taxonomic group. The Plan Area represents less than 1% of the 28 land area of California but is disproportionately rich in fish and bird species. Nearly 50% of all of 29 California’s bird species potentially use the Plan Area, a testament to its importance as part of the 30 Pacific flyway. The Plan Area has a high diversity of native fish species with 61% of California’s 31 native fish species found in the Delta (31 of 51 species) (see list of fish species in the tidal perennial 32 aquatic natural community in Table 2-6). Of all fish species found in California, both native and 33 nonnative, nearly half can be found in the Delta. 34
Over 300 taxa (species, subspecies, and varieties) of native and nonnative (naturalized) vascular 35 plants were recorded in sampled vegetation stands in the Plan Area by CDFW during its vegetation 36 mapping effort (Hickson and Keeler-Wolf 2007). Since this mapping effort only sampled at various 37 specific sites across the Plan Area, the total number of vascular plant taxa in the Plan Area is 38 certainly much higher. 39
Bay Delta Conservation Plan Public Draft 2-99 November 2013
ICF 00343.12

Existing Ecological Conditions
Chapter 2
Table 2-20. Number of Vertebrate and Vascular Plant Species Present in the Plan Area Compared 1 with Number in California 2
Taxonomic Group Number of Species in
Plan Area Number of Species in
Californiaa Percent of California Species in Plan Area
Vertebrates 345 876 39% Mammals 58b 197 29% Birds 200c 433 46% Reptiles 22d 84 26% Amphibians 9e 51 18% Fish 55f 111g 49%
Vascular plants Over 300h 6,272 Over 4% Total Over 643 7,231 Over 8% a California Department of Fish and Game 2003
b Eder 2005 c Sibley 2006
d California Department of Fish and Game 2008 e U.S. Fish and Wildlife Service no date f Moyle 2002 51 nonnative and 60 native fish species (approximately) g Hickson and Keeler-Wolf 2007
2.5 References Cited 3
2.5.1 Literature Cited 4
Adams, P. N., R. L. Slingerland, and N. D. Smith. 2004. Variations in Natural Levee Morphology in 5 Anastomosed Channel Flood plain Complexes. Geomorphology 61:127–142. 6
Alexander, D. G. 1976. Ecological Aspects of Temporary Pool Fauna. In: S. Jain, (ed.). Vernal Pools: 7 Their Ecology and Conservation. Institute of Ecology Publication Number 9. Davis, CA. 8
Alt, D. and D. W. Hyndman. 2000. Roadside Geology of Northern and Central California. Missoula, MT: 9 Mountain Press Publishing Company. 10
Anderson, D. M., P. M. Glibert, and J. M. Burkholder. 2002. Harmful Algal Blooms and Eutrophication: 11 Nutrient Sources, Composition, and Consequences. Estuaries. 25(4B):704–726. 12
Andrew, M. E., and S. L. Ustin. 2009. Habitat Suitability Modelling of an Invasive Plant with Advanced 13 Remote Sensing Data. Diversity and Distributions 15:627–640. 14
Andrews, W. F. 1970. Soil Survey of Yolo County, California. U.S. Department of Agriculture and 15 University of California Agricultural Experiment Station. 16
Anonymous. 1870. The Western Shore Gazetteer, Yolo County. Woodland, CA: Sprague and Atwell. 17
Anonymous. 2012. Delta Ecosystem White Paper. Prepared for review by the Delta Stewardship 18 Council. October 18. Available: 19 <http://deltacouncil.ca.gov/sites/default/files/documents/files/Delta_Ecosystem_White_Paper20 _2011_10_18.pdf>. 21
Bay Delta Conservation Plan Public Draft 2-100 November 2013
ICF 00343.12

Existing Ecological Conditions
Chapter 2
Argus, D. F. and R. G. Gordon. 2001. Present Tectonic Motion across the Coast Ranges and San 1 Andreas Fault System in Central California. Geological Society of America Bulletin 113:1580–2 1592. 3
Armstong, W. P. 1979. A Marriage between a Fern and an Alga. Environment Southwest. No. 500:20–4 24. 5
Arnold, R. A. 1983. Ecological Studies of Six Endangered Butterflies (Lepidoptera, Lycaenidae): Island 6 Biogeography, Patch Dynamics, and the Design of Habitat Preserves. Berkeley, CA: University of 7 California Press. 8
Atwater, B. F. 1980. Distribution of Vascular Plant Species in Six Remnants of Intertidal Wetlands of 9 the Sacramento-San Joaquin Delta, California. Open-File Report 80-883. U.S. Geological Survey. 10
Atwater, B. F. and D. F. Belknap. 1980. Tidal-Wetland Deposits of the Sacramento-San Joaquin Delta, 11 California. In W. E. Field, A. H. Bouma, I. P. Colburn, R. G. Douglas, and J. C. Ingle (eds.), 12 Quaternary Depositional Environments of the Pacific Coast: Pacific Coast Paleogeography 13 Symposium 4. Proceedings of the Society of Economic Paleontologists and Mineralogists. Los 14 Angeles (CA): Society of Economic Paleontologists and Mineralogists. 15
Atwater, B. F., S. C. Conard, I. N. Dowden, C. W. Hedel, R. L. MacDonald, and W. Savage. 1979. History, 16 Landforms, and Vegetation of the Estuary’s Tidal Marshes. In T. J. Conomos (ed.), San Francisco 17 Bay: The Urbanized Estuary. Proceedings of the 58th Annual Meeting of the Pacific Division of the 18 American Association for the Advancement of Science, Golden Gate Park, San Francisco, CA. 19 Pages 347–385. 20
Baraona, M., T. Ippolito, and W. Renz. 2007. Post-Project Appraisals of Constructed Vernal Pools in 21 Solano, County, California. Berkeley, CA: Water Resources Center Archives, University of 22 California. 23
Barbour, M. G., A. I. Solomeshch, C. W. Witham, R. F. Holland, R. L. MacDonald, S. Cilliers, J. A. Molina, 24 J. J. Buck, and J. M. Hillman. 2003. Vernal Pool Vegetation in California: Variation within Pools. 25 Madroño 50:129–146. 26
Barbour, M. G., A. I. Solomeshch, J. J. Buck, R. F. Holland, C. W. Witham, R. L. MacDonald, S. L. Starr, 27 and K. A. Lazar. 2007. Final Report: Classification, Ecological Characterization, and Presence of 28 Listed Plant Taxa of Vernal Pool Associations in California. Report prepared for U. S. Fish and 29 Wildlife Service. May 15. 30
Barbour, M. G., A. I. Solomeshch, R. F. Holland, C. W. Witham, R. L. MacDonald, S. Cilliers, J. A. Molina, 31 J. J. Buck, and J. M. Hillman. 2005. Vernal Pool Vegetation of California: Communities of Long-32 Inundation Habitats. Phytocoenologia 35:177–200. 33
Barclay, W. R. and A. W. Knight. 1981. Physiochemical Processes Affecting Production in a Turbid 34 Vernal Pool. In Vernal Pools and Intermittent Streams. Davis, CA: Institute of Ecology. Pages 126–35 142. 36
Barry, S. 1995. Rangeland Oasis. University of California Cooperative Extension. Leaflet No. 21531. 37
Batcher, M. S. 2000. Element Stewardship Abstract for Eichhornia crassipes (Martius) Solms, Water 38 Hyacinth. The Nature Conservancy, Wildland Invasive Species Team. Arlington, VA. Available: 39 <http://tncweeds.ucdavis.edu/esadocs/eichcras.html>. Accessed: July 5, 2007. 40
Bay Delta Conservation Plan Public Draft 2-101 November 2013
ICF 00343.12

Existing Ecological Conditions
Chapter 2
Belitz, K. 1988. Character and Evolution of the Ground-Water Flow System in the Central Part of the 1 Western San Joaquin Valley, California. Open-File Report 87-573. Sacramento CA: U.S. Geological 2 Survey. 3
Bennett, W. A. 2005. Critical Assessment of the Delta Smelt Population in the San Francisco Estuary, 4 California. San Francisco Estuary and Watershed Science 3(2):Article 1. Available: 5 <http://escholarship.org/uc/item/0725n5vk>. Accessed: December 14, 2011. 6
Blum, M. D. and T. E. Tornqvist. 2000. Fluvial Responses to Climate and Sea-Level Change: A Review 7 and Look Forward. Sedimentology 47(Supplement 1):2–48. 8
Boul, P. and T. Keeler-Wolf. 2008. 2006 Vegetation Map Update for Suisun Marsh, Solano County, 9 California. Sacramento, CA: California Department of Water Resources. 10
Brown, K. J. and G. B. Pasternack. 2005. A Paleoenvironmental Reconstruction to Aid in the 11 Restoration of Floodplain and Wetland Habitat on an Upper Deltaic Plain, California, USA. 12 Environmental Conservation 32:103–116. 13
Brown, L. R. 2004. Summary of 2004 Workshop Making Science Work for Suisun Marsh. Prepared for 14 the San Francisco Bay-Delta Science Consortium. 15
Brown, L. R. and D. Michniuk. 2007. Littoral Fish Assemblages of the Alien-Dominated Sacramento-16 San Joaquin Delta, California, 1980–1983 and 2001–2003. Estuaries and Coasts 30:186–200. 17
Bryan, K. 1923. Geology and Ground-Water Resources of Sacramento Valley, California. Water-Supply 18 Paper 495. U.S. Geological Survey. 19
Burau, J. 2004. Transport in Suisun Marsh—Why Do We Care and What Do We Know? Making 20 Science Work for Suisun Marsh. Workshop. San Francisco Bay–Delta Science Consortium. 21
Bureau of Soils. 1909. Alkali Map, Woodland Sheet. CA. 22
Byrne, R., B. L. Ingram, S. Starratt, and F. Malamud-Roam. 2001. Carbon-Isotope, Diatom, and Pollen 23 Evidence for Late Holocene Salinity Change in a Brackish Marsh in the San Francisco Estuary. 24 Quaternary Research 55:66–76. 25
CALFED Bay-Delta Program. 1998. Affected Environment—Vegetation and Wildlife. Draft technical 26 report. March 1998. Available: <http://www.calwater.ca.gov/Admin_Record/C-009083.pdf>. 27
CALFED Bay-Delta Program. 2000. Bay–Delta Program. Multi-Species Conservation Strategy, Final 28 Programmatic EIR/EIS Technical Appendix. July. Available: 29 <http://www.calwater.ca.gov/Programs/EcosystemRestoration/EcosystemMultiSpeciesConser30 vationStrategy.shtml>. 31
Calflora. 2011. Species Account for Eichhornia crassipes. Available: http://www.calflora.org. 32 Accessed October 24, 2011. 33
California Climate Change Center. 2006. Cal Energy and Climate. Available: 34 <http://calclimate.berkeley.edu>. Accessed: June 18, 2007. 35
California Department of Boating and Waterways. 2006. Egeria densa Control Program Second 36 Addendum to 2001 Environmental Impact Report with Five-Year Program Review and Future 37 Operations Plan. December 8. Sacramento, CA: U.S. Department of Agriculture. 38
Bay Delta Conservation Plan Public Draft 2-102 November 2013
ICF 00343.12

Existing Ecological Conditions
Chapter 2
California Department of Boating and Waterways. 2008. Egeria densa Control Program Annual 1 Report 2007 Application Season. Sacramento, CA: U.S. Department of Agriculture. 2
California Department of Fish and Game. 2003. Atlas of the Biodiversity of California. Sacramento, CA. 3
California Department of Fish and Game. 2005. California Interagency Wildlife Task Group. California 4 Wildlife Habitat Relationships Database Version 8.1. Software and Updated Database. Sacramento, 5 CA. Available: <http://www.dfg.ca.gov/whdab/html/wildlife_habitats.html>. Accessed: June 6 2007–January 2008. 7
California Department of Fish and Game. 2008. Yolo Bypass Wildlife Area Management Plan. 8 Available: <http://www.californiaherps.com/>; <Mhttp://www.cosumnes.org/flora_fauna/>; 9 <http://www.suisunwildlife.org/sumarsh.html>. 10
California Department of Water Resources. 1931. Variation and Control of Salinity in Sacramento-San 11 Joaquin Delta and Upper San Francisco Bay. DWR Bulletin No. 27. 12
California Department of Water Resources. 1993. Dams within the Jurisdiction of the State of 13 California. DWR Bulletin 17-93. 14
California Department of Water Resources. 2000. Land Use Survey Data for Sacramento County. 15 Available: <http://www.water.ca.gov/landwateruse/lusrvymain.cfm>. Accessed: 2011 and 16 2012. 17
California Department of Water Resources. 2003. Land Use Survey Data for Solano County. Available: 18 <http://www.water.ca.gov/landwateruse/lusrvymain.cfm>. Accessed: 2011 and 2012. 19
California Department of Water Resources. 2004. Land Use Survey Data for Sutter County. Available: 20 <http://www.water.ca.gov/landwateruse/lusrvymain.cfm>. Accessed: Spring 2013. 21
California Department of Water Resources. 2006. Sacramento-San Joaquin Delta Overview. Available: 22 <http://baydeltaoffice.water.ca.gov/sdb/tbp/deltaoverview>. 23
California Department of Water Resources. 2007a. Dayflow: An Estimate of Daily Average Delta 24 Outflow. 2007. Available: <http://iep.water.ca.gov/dayflow/index.html>. Accessed: October–25 December 2007. 26
California Department of Water Resources. 2007b. Past and Present Land Uses in the Sacramento-San 27 Joaquin Delta and Suisun Marsh. Report to the Delta Vision Blue Ribbon Task Force. November 21. 28 Sacramento, CA. 29
California Department of Water Resources. 2008. Land Use Survey Data for Yolo County. Available: 30 <http://www.water.ca.gov/landwateruse/lusrvymain.cfm>. Accessed: Spring 2013. 31
California Department of Water Resources. 2009. Unpublished Data. Surveys conducted to field-32 verify the habitat models. 33
California Department of Water Resources. 2010. Unpublished data. Surveys conducted to field-34 verify the habitat models. 35
California Native Plant Society. 2007. Vegetation Committee. Revised August. Vegetation Rapid 36 Assessment Protocol. Available: 37 <http://www.dfg.ca.gov/biogeodata/vegcamp/pdfs/CNPS_RapidAssessment_Protocol_8-23-38 07.pdf>. Accessed: October 23, 2011. 39
Bay Delta Conservation Plan Public Draft 2-103 November 2013
ICF 00343.12
Existing Ecological Conditions
Chapter 2
California State Mining Bureau. 1918. Quicksilver Resources of California. Sacramento, CA: California 1 State Printing Office. 2
Capiella, K., C. Malzone, R. Smith, and B. Jaffe. 1999. Sedimentation and Bathymetry Changes in Suisun 3 Bay: 1867–1990. USGS Open-File Report 99-563. Available: <http://geopubs.wr.usgs.gov/open-4 file/of99-563/>. 5
Carpenter, E. J. and S. W. Cosby. 1939. Soil Survey of Contra Costa County, California. Berkeley, CA: 6 U.S. Department of Agriculture. 7
Cayan, D., M. Tyree, M. Dettinger, H. Hidalgo, T. Das, E. Maurer, P. Bromirski, N. Graham, and R. Flick. 8 2009. Climate Change Scenarios and Sea Level Rise Estimates for the California 2009 Climate 9 Change Scenarios Assessment. California Energy Commission PIER Program Report, CEC-500-10 2009-014-F. Sacramento, CA. 11
Center for Biological Diversity. 2007. Delta Smelt. Available: 12 <http://www.biologicaldiversity.org/swcbd/species/deltasmelt/index.html>. Accessed: June 13 18, 2007. 14
Central Valley Regional Water Quality Control Board. 2005. Amendments to the Water Quality 15 Control Plan for the Sacramento River and San Joaquin River Basins for the Control Program for 16 Factors Contributing to the Dissolved Oxygen Impairment in the Stockton Deep Water Ship 17 Channel. Available: 18 <http://www.swrcb.ca.gov/centralvalley/water_issues/tmdl/central_valley_projects/san_joaqu19 in_oxygen/final_staff_report/do_tmdl_final_draft.pdf>. 20
Central Valley Regional Water Quality Control Board. 2008. Sacramento-San Joaquin Delta TMDL for 21 Methylmercury, Draft Report for Public Review. Sacramento, CA. 22
Central Valley Regional Water Quality Control Board. 2009. Clean Water Act Sections 305(b) and 23 303(d) Integrated Report for the Central Valley Region. Final Staff Report. September 2009. 24 Available: 25 <http://www.swrcb.ca.gov/rwqcb5/water_issues/tmdl/impaired_waters_list/303d_list.shtml>. 26
Claudi, R. and K. Prescott. 2011. Examination of calcium and pH as predictors of dreissinid mussel 27 survival in the California State Water Project. Prepared for California Department of Water 28 Resources Division of Operations and Maintenance Aquatic Nuisance Species Program. 29 2011.03.11. Picton, Ontario: RNT Consulting Inc. 74pp. 30
Cohen, A. N. and J. T. Carlton. 1995. Nonindigenous Aquatic Species in a United States Estuary: A Case 31 Study of the Biological Invasions of the San Francisco Bay and Delta. University of California, 32 Berkeley; Williams College, Mystic Seaport. Available: 33 <http://www.sgnis.org/publicat/cc1.htm>. 34
Cole, B. E. and J. E. Cloern. 1984. Significance of Biomass and Light Availability to Phytoplankton 35 Productivity in San Francisco Bay. Marine Ecology Progress Series. 17:15–24. 36
Collins. J. N. and R. M. Grossinger. 2004. Synthesis of Scientific Knowledge Concerning Estuarine 37 Landscapes and Related Habitats of the South Bay Ecosystem. Technical Report of the South Bay 38 Salt Pond Restoration Project. Oakland, CA: San Francisco Estuary Institute. 39
Bay Delta Conservation Plan Public Draft 2-104 November 2013
ICF 00343.12

Existing Ecological Conditions
Chapter 2
Conomos, T. J., R. E. Smith, and J. W. Gartner. 1985. Environmental Setting of San Francisco Bay. 1 Hydrobiologia 129:1–12. 2
Contra Costa Water District. 2010. Historical Fresh Water and Salinity Conditions in the Western 3 Sacramento-San Joaquin Delta and Suisun Bay. Technical Memorandum WR10-001. February. 4 Concord, CA. 5
Cowardin, L. M., V. Carter, F. C. Golet, and E. T. LaRoe. 1979. Classification of Wetlands and Deepwater 6 Habitats of the United States. Version 04DEC98. U.S. Fish and Wildlife Service, Washington, DC; 7 Jamestown, ND: Northern Prairie Wildlife Research Center Online. Available: 8 <http://www.npwrc.usgs.gov/resource/1 998/classwet/classwet.htm>. Accessed: July 2, 2007. 9
Culberson, S. D. 2001. The Interaction of Physical and Biological Determinants Producing Vegetation 10 Zonation in Tidal Marshes of the San Francisco Bay Estuary, California, USA. PhD dissertation, 11 University of California, Davis. 12
Culberson, S. D., T. C. Foin, and J. N. Collins. 2004. The Role of Sedimentation in Estuarine Marsh 13 Development within the San Francisco Estuary, California, USA. Journal of Coastal Research 14 20:970–979. 15
Curtis, J. A., L. E. Flint, C. N. Alpers, and S. M. Yarnell. 2005. Conceptual Model of Sediment Processes 16 in the Upper Yuba River Watershed, Sierra Nevada. Geomorphology 68:149–166. 17
D’Antonio, C. M., C. Malmstrom, S. A. Reynolds, and J. D. Gerlach. 2007. Ecology of Invasive Non-18 Native Species in California’s Grassland. In M. R. Stromberg, J. D. Corbin, C. M. D’Antonio (eds.), 19 California’s Grasslands: Ecology and Management. Berkeley, CA: University of California Press. 20 Pages 67–83. 21
Davidson, C. 1995. Determining Habitat Conservation Priorities for Neotropical Migrant Birds in 22 California. Draft report. San Francisco, CA: Pacific Southwest Research Station, U.S. Forest 23 Service. 24
Davis, S. D., V. H. Heywood, O. Herrera-MacBryde, J. Villa-Lobos, and A. C. Hamilton (eds.). 1997. 25 Centres of Plant Diversity: A Guide and Strategy for their Conservation. Volume 3: The Americas. 26 Cambridge, UK: The World Wildlife Fund for Nature and IUCN–the World Conservation Union. 27
Davisson, M. L., T. S. Presser, and R. E. Criss. 1994. Geochemistry of Tectonically Expelled Fluids from 28 the Northern Coast Ranges, Rumsey Hills, California, USA. Geochimica et Cosmochimica Acta 29 58:1687–1699. 30
Dawson, K., K. Veblen, and T. Young. 2007. Experimental Evidence for an Alkali Ecotype of Lolium 31 multiflorum, an Exotic Invasive Annual Grass in the Central Valley, CA, USA. Biological Invasions 32 9:327–334. 33
Dettinger, M. D. 2005. From Climate-Change Spaghetti to Climate-Change Distributions for 21st 34 Century California. San Francisco Estuary and Watershed Science [online serial]. 3(1) (March 35 2005), Article 4. Available: <http://repositories.cdlib.org/jmie/sfews/ vol3/iss1/art4>. 36
Dettinger, M., K. Redmond, and D. R. Cayan. 2004. Winter Orographic Precipitation Ratios in the 37 Sierra Nevada—Large-Scale Atmospheric Circulations and Hydrological Consequences. Journal 38 of Hydrometerology 5:1102–1116. 39
Bay Delta Conservation Plan Public Draft 2-105 November 2013
ICF 00343.12

Existing Ecological Conditions
Chapter 2
Deverel, S. J. and D. A. Leighton. 2010. Historic, Recent, and Future Subsidence, Sacramento-San 1 Joaquin Delta, California, USA. San Francisco Estuary and Watershed Science [online serial]. 8(2) 2 (August 2010). Available: <http://www.escholarship.org/uc/item/7xd4x0xw>. 3
Deverel, S. J. and S. K. Gallanthine. 1989. Relation of Salinity and Selenium in Shallow Groundwater 4 to Hydrologic and Geochemical Processes, Western San Joaquin Valley, California. Journal of 5 Hydrology 109:125–149. 6
Domagalski, J. L., C. N. Alpers, D. G. Slotton, T. H. Suchanek, and S. M. Ayers. 2004a. Mercury and 7 Methlymercury Concentrations and Loads in the Cache Creek Watershed, California. Science of 8 the Total Environment 327:215–237. 9
Domagalski, J. L., C. N. Alpers, D. G. Slotton, T. H. Suchanek, and S. M. Ayers. 2004b. Mercury and 10 Methylmercury Concentration and Loads in Cache Creek Basin, California, January 2000 through 11 May 2001. Denver, CO: U.S. Geological Survey. Page 56. 12
Donnelly-Nolan, J. M., M. G. Burns, F. E. Geoff, E. K. Peters, and J. M. Thompson. 1993. The Geysers-13 Clear Lake area, California; Thermal Waters, Mineralization, Volcanism, and Geothermal 14 Potential. Economic Geology 88:301–316. 15
Drexler, J. Z., C. S. de Fontaine, and T. A. Brown. 2009a. Peat Accretion Histories during the Past 16 6,000 Years in Marshes of the Sacramento-San Joaquin Delta, CA, USA. Estuaries and Coasts 17 32:871–892. 18
Drexler, J. Z., C. S. De Fontaine, and S. J. Deverel. 2009b. The Legacy of Wetland Drainage on the 19 Remaining Peat in the Sacramento-San Joaquin Delta, California, USA. Wetlands 29:372–386. 20
Dudek. 2007. Final Water and Wastewater Services Municipal Services Review for East Contra Costa 21 County. Martinez, CA: Contra Costa Local Agency Formation Commission. 22
Dudley, T. 2000. Arundo donax. In: C. Bossard, J. Randall, M. Hoshovsky (eds.). Invasive Plants of 23 California’s Wildlands. Berkeley, CA: University of California Press. 24
Dugdale, R. C. 2008. Effects of Ammonium on Phytoplankton Growth and Consequences for the POD. 25 5th Biennial CALFED Science Conference. October 22–24. Sacramento, CA. 26
Dugdale, R. C., F. P. Wilkerson, V. E. Hogue, and A. Marchi. 2007. The Role of Ammonium and Nitrate 27 in Spring Bloom Development in San Francisco Bay. Estuarine Coastal and Shelf Science 28 73:17–29. 29
Dukes, J. S. and M. R. Shaw. 2007. Responses to Changing Atmosphere and Climate. In M. R. 30 Stromberg, J. D. Corbin, C. M. D’Antonio (eds.), California Grasslands: Ecology and Management. 31 Berkeley, CA: University of California Press. Pages 218–229. 32
Durand, J. 2008. Delta Foodweb Conceptual Model. Delta Regional Ecosystem Restoration 33 Implementation Plan, Sacramento, CA. 34
EDAW. 2007a. Yolo Bypass Wildlife Area Management Plan. June. Sacramento, CA. Prepared for 35 California Department of Fish and Game, Davis, CA. Available: 36 <http://www.dfg.ca.gov/lands/mgmtplans/ybwa/docs/0-Cover&TitlePage.pdf>. 37
EDAW. 2007b. Lower Sherman Island Wildlife Area Land Management Plan. April. Prepared for 38 Sacramento, CA: California Department of Fish and Game. 39
Bay Delta Conservation Plan Public Draft 2-106 November 2013
ICF 00343.12

Existing Ecological Conditions
Chapter 2
Eder, T. 2005. Mammals of California. Lone Pine Publishing. 1
Edwards, R. 2006. Sea Levels: Change and Variability during Warm Intervals. Progress in Physical 2 Geography 30:785–796. 3
Ellison, J. 1983. Estuaries, California Aquatic Community Abstract. Sacramento, CA: California 4 Department of Fish and Game. 5
Environmental Science Associates. 2007. Distribution and Ecology of Lepidium latifolium in Bay-6 Delta Wetlands ERP 02-P09. Final report. Sacramento, CA: CALFED Ecosystem Restoration 7 Program. 8
Environmental Science Associates and Yolo County Planning & Public Works Department. 2005. 9 CALFED At-Risk Plant Species, Habitat Restoration and Recovery, and Non-Native Species 10 Management ERP-02-P46: Final Conservation and Management Plan. Sacramento, CA: CALFED 11 Ecosystem Restoration Program. 12
Estep, J. A. In preparation. Ecology of the Swainson’s Hawk in the Central Valley of California. 13
Eviner, V. T. and M. T. Firestone. 2007. Mechanisms Determining Patterns of Nutrient Dynamics. In 14 M. R. Stromberg, J. D. Corbin, and C. M. D’Antonio (eds.), California Grasslands: Ecology and 15 Management. Berkeley, CA: University of California Press. Pages 94–106. 16
Fay, N. P. and E. D. Humphreys. 2008. Forces Acting on the Sierra Nevada Block and Implications for 17 the Strength of the San Andreas Fault System and the Dynamics of Continental Deformation in 18 the Western United States. Journal of Geophysical Research 113:B12415. 19
Feyrer, F. V. 1999. Food Habits of Common Suisun Marsh Fishes in the Sacramento-San Joaquin 20 Estuary, California. MS thesis. California State University, Sacramento, CA. 21
Feyrer, F., T. Sommer and W. Harrell. 2006. Managing Floodplain Inundation for Native Fish: 22 Production Dynamics of Age-0 Splitail (Pogonichthys macrolepidotus) in California’s Yolo Bypass. 23 Hydrobiologia 573:213–226. 24
Fiedler, P. L., M. E. Keever, B. J. Grewell, and D. J. Partridge. 2007. Rare Plants in the Golden Gate 25 Estuary (California): The Relationship between Scale and Understanding. Australian Journal of 26 Botany 55:206–220. 27
Fiedler, P. and R. Zebell. 1993. Restoration and Recovery of Mason’s lilaeopsis: Phase I. Final report. 28 Submitted to the California Department of Fish and Game. 29
Field, C. B., G. C. Daily, F. W. Davis, S. Gaines, P. A. Matson, J. Melack, and N. L. Miller. 1999. 30 Confronting Climate Change in California: Ecological Impacts on the Golden State. November 31 1999. A report of the Union of Concerned Scientists and the Ecological Society of America. 32 Available:< www.ucsusa.org>. 33
Fleskes, J. P., J. L. Yee, M. L. Casazza, M. R. Miller, J. Y. Takekawa, and D. L. Orthmeyer. 2005. 34 Waterfowl Distribution, Movements, and Habitat Use Relative to Recent Habitat Changes in the 35 Central Valley of California. Dixon, CA: U.S. Geological Survey. 36
Florsheim, J. L. and J. F. Mount 2003. Changes in Lowland Floodplain Sedimentation Processes: Pre-37 Disturbance to Post-Rehabilitation, Cosumnes River, CA. Geomorphology 56:305–323. 38
Bay Delta Conservation Plan Public Draft 2-107 November 2013
ICF 00343.12

Existing Ecological Conditions
Chapter 2
Fredrickson, L. H. and T. S. Taylor. 1982. Management of Seasonally Flooded Impoundments for 1 Wildlife. Resource Publication 148. U.S. Fish and Wildlife Service. 2
Ganju, N. K. and D, H, Schoellhamer. 2010. Decadal-Timescale Estuarine Geomorphic Change under 3 Future Scenarios of Climate and Sediment Supply. Estuaries and Coasts 33:15–29. 4
Gerlach, J. D., B. S. Bushman, J. K. McKay, and H. Meimberg. 2009. Taxonomic Confusion Permits the 5 Unchecked Invasion of Vernal Pools in California by Low Mannagrass (Glyceria declinata). 6 Invasive Plant Science and Management. 2:92–97. 7
Gewant, D. S., S. M. Bollens. 2005. Macrozooplankton and Micronekton of the Lower San Francisco 8 Estuary: Seasonal, Interannual, and Regional Variation in Relation to Environmental Conditions. 9 Estuaries 28:473–485. 10
Gilbert, G. K. 1917. Hydraulic Mining in the Sierra Nevada. Professional Paper No. 105. U.S. Geological 11 Survey. 12
Gilmer, D. S., M. L. Miller, R. B. Bauer, and J. R. LeDonne. 1982. California’s Central Valley Wintering 13 Waterfowl: Concerns and Challenges. Transactions of the North American Wildlife and Natural 14 Research Conference 47:441–452. 15
Glibert, P. 2010. Long-Term Changes in Nutrient Loading and Stoichiometry and Their Relationships 16 With Changes in The Foodweb and Dominant Pelagic Fish Species in The San Francisco Estuary, 17 California. Reviews in Fisheries Science 18:211–232. 18
Golden, M. and P. Fiedler. 1991. Characterization of the Habitat for Lilaeopsis masonii (Umbelliferae): 19 A California State Listed Rare Plant Species. Final report to the California Department of Fish and 20 Game Endangered Plant Program. 21
Goman, M. and L. Wells. 2000. Trends in River Flow Affecting the Northeastern Reach of the San 22 Francisco Bay Estuary over the Past 7000 Years. Quaternary Research 54:206–217. 23
Google, Inc. 2009. Google Earth Professional Version 5.0. Mountain View, CA. Available: 24 <http://earth.google.com>. 25
Governor’s Delta Vision Blue Ribbon Task Force. 2008. Our Vision of the California Delta. Report to 26 Governor Schwarzenegger. January 17. Sacramento, CA. Available: 27 <http://deltavision.ca.gov/BlueRibbonTaskForce/FinalVision/ Vision_12_Page_Summary.pdf>. 28
Graham, R. C., A. M. Rossi, and K. R. Hubbert. 2010. Rock to Regolith Conversion: Producing 29 Hospitable Substrates for Terrestrial Ecosystems. GSA Today 20:4–9. 30
Graymer, R. W., D. L. Jones, and E. E. Brabb. 1994. Preliminary Geologic Map Emphasizing Bedrock 31 Formations in Contra Costa County, California. Open-File Report 94-622. U.S. Geological Survey. 32
Graymer, R. W., D. L. Jones, and E. E. Brabb. 2002. Geologic Map and Map Database of Northeastern 33 San Francisco Bay Region, California. Miscellaneous Field Studies Map MF-2403 Version 1.0. U.S. 34 Geological Survey. 35
Grewell, B. 2005. Population Census and Status of the Endangered Soft Bird’s Beak (Cordylanthus 36 mollis ssp. mollis) at Benicia State Recreation Area and Rush Ranch in Solano County, California. 37 Final report. Sacramento, CA: Solano County Water Agency. 38
Bay Delta Conservation Plan Public Draft 2-108 November 2013
ICF 00343.12

Existing Ecological Conditions
Chapter 2
Griggs, F. T. 2000. Vina Plains Preserve: Eighteen Years of Adaptive Management. Fremontia 1 27(4):48–51. 2
Griggs, F. T. and G. H. Golet. 2002. Riparian Valley Oak (Quercus lobata) Forest Restoration on the 3 Middle Sacramento River, California. General Technical Report PSW-GTR-184. USDA Forest 4 Service. 5
Griggs, F. T., V. Morris, and E. Denny. 1993. Five Years of Valley Oak Riparian Forest Restoration. 6 Fremontia 22(2):13–17. 7
Grimaldo, L. and Z. Hymanson. 1999. What Is the Impact of the Introduced Waterweed Egeria densa 8 to the Delta Ecosystem? Interagency Ecological Program Newsletter 12(1):43–45. Available: 9 <http://www.iep.water.ca.gov/report/newsletter>. 10
Grinnell, J., J. S. Dixon, and J. M. Linsdale. 1937. Fur Bearing Mammals of California, Their Natural 11 History, Systematic Status, and Relations to Man. Vol. I and II. Berkeley, CA: University of 12 California Press. 13
Grossinger, R. 2004. What Does the History of Suisun Marsh Tell Us About Its Future Management? 14 Making Science Work for Suisun Marsh. Workshop. San Francisco Bay–Delta Science Consortium. 15
Grossinger, R. and A. Whipple. 2011. Habitat Characteristics that Made Delta Landscapes Unique: 16 Perspectives for Ecosystem Restoration. San Francisco Estuary Institute, Delta Science Program 17 Brown Bag Series, April 20, 2011. 18
Grossinger, R., A. Whipple, and C. Wilcox. 2008. Pre-Modification Habitat Mosaics of the Delta: 19 Looking to the Past to Envision the Future. Sacramento, CA: CalFed Conference. 20
Grossman, D. H., K. Goodin, M. Anderson, P. Bourgeron, M. T. Bryer, R. Crawford, L. Engelking, D. 21 Faber-Langendoen, M. Gallyoun, S. Landaal, K. Metzler, K. D. Patterson, M. Pyne, M. Reid., L. 22 Sneddon, and A. S. Weakley. 1998. International Classification of Ecological Communities: 23 Terrestrial Vegetation of the United States. Arlington, VA: The Nature Conservancy. 24
Hansen, D., GISP, and Delta Vision Strategic Plan. 2010. The California Delta—Ecosystem Restoration 25 Targets and Levees at Risk. In: ESRI (ed.), ESRI Map Book Volume 25: GIS Then and Now. ESRI 26 Press. ISBN 978-1589482548. Page 38. 27
Harrell, W. C. and T. R. Sommer. 2003. Patterns of Adult Fish Use on California’s Yolo Bypass 28 Floodplain. In P. M. Faber (ed.), California Riparian Systems: Processes and Floodplain 29 Management, Ecology, and Restoration. 2001 Riparian Habitat and Floodplains Conference 30 Proceedings Sacramento, CA: Riparian Habitat Joint Venture. Pages 88–93. 31
Hayhoe, K., D. Cayan, C. B. Field, P. C. Frumhoff, E. P. Maurer, N. L. Miller, S. C. Moser, S. H. Schneider, 32 K. N. Cahill, E. E. Cleland, L. Dale, R. Drapek, R. M. Hanemann, L. S. Kalkstein, J. Lenihan, C. K. 33 Lunch, R. P. Neilson, S. C. Sheridan, and J. H. Verville. 2004. Emissions Pathways, Climate Change, 34 and Impacts on California. Proceedings of the National Academy of Sciences. 101(34):12422–35 12427. 36
Helley, E. J. and D. D. Harwood. 1985. Geographic Map of the Late Cenozoic Deposits of the Sacramento 37 Valley and Northern Sierran Foothills, California. Miscellaneous Field Studies Map MF-1790. U.S. 38 Geological Survey. 39
Bay Delta Conservation Plan Public Draft 2-109 November 2013
ICF 00343.12
Existing Ecological Conditions
Chapter 2
Hennessey, A. and K. Hieb. 2007. Zooplankton Monitoring 2006. Interagency Ecological Program 1 Newsletter 20(2): 10–14. 2
Herbold, B. and T. Vendlinski. 2012. Estuarine Habitat and the Low Salinity Zone (Draft). Prepared for 3 the Technical Workshop on Estuarine Habitat. March 27. 4
Herren, J. R. and S. S. Kawasaki. 2001. Inventory of Water Diversions in Four Geographic Areas in 5 California’s Central Valley. In: R. L. Brown (ed.), Contributions to the Biology of Central Valley 6 Salmonids. Volume 2. Fish Bulletin 179. California Department of Fish and Game. Pages 343–355. 7
Hickson, D. and T. Keeler-Wolf. 2007. Vegetation and Land-Use Classification and Map of the 8 Sacramento-San Joaquin River Delta. California Dept. of Fish and Game Bay Delta Region. 9 Sacramento, CA. Available: 10 <http://dfg.ca.gov/biogeodata/vegcamp/veg_classification_reports_maps.asp>. 11
Hitchcock, C. S., E. J. Helley, and R. W. Givler. 2005. Geomorphic and Geologic Mapping for Restoration 12 Planning, Sacramento-San Joaquin Delta Region. Final report. June 2005. Sacramento, CA: 13 CALFED. 14
Hogle, I., J. H. Viers, and J. F. Quinn. 2006. Perennial Pepperweed Infestation on the Cosumnes River 15 Experimental Floodplain. Davis, CA: Bay Delta Authority. 16
Holland, V. L. and D. J. Keil. 1995. California Vegetation. Dubuque, IA: Kendall/Hunt Publishing 17 Company. 18
Hopkinson, P., M. Stevenson, M. Hammond, S. Gennet, D. Rao, and J. W. Bartolome. 2008. Italian 19 Ryegrass: A New Central California Dominant? Fremontia 36(1):20–24. 20
Hothem, R. L., D. R. Bergen, M. L. Bauer, J. J. Crayon, and A. N. Meckstroth. 2007. Mercury and Trace 21 Elements in Crayfish from Northern California. Bulletin Environmental Contamination and 22 Toxicology 79:628–632. 23
Howard, A. Q. and R. A. Arnold. 1980. The Antioch Dunes— Safe at Last? Fremontia 8:3–12. 24
ICF International. 2012. Data for BDCP Plan Expansion Areas and “Gray Area” Mapping. August. 25 Sacramento, CA. 26
Intergovernmental Panel on Climate Change. 2007. Climate Change 2007: Synthesis Report. 27 Contribution of Working Groups I, II and III to the Fourth Assessment Report of the 28 Intergovernmental Panel on Climate Change. Geneva, Switzerland. Available: 29 http://www.ipcc.ch/pdf/assessment-report/ar4/syr/ar4_syr.pdf. 30
Jackson, L. E., F. Santos-Martin, A. D. Hollander, W. R. Horwath, R. E. Howitt, J. B. Kramer, A. T. 31 O’Geen, B. S. Orlove, J. W. Six, S. K. Sokolow, D. A. Sumner, T. P. Tomich, and S. M. Wheeler. 2009. 32 Potential for Adaptation to Climate Change in an Agricultural Landscape in the Central Valley of 33 California. California Energy Commission PIER Program Report, CEC-500-2009-044-F. 34 Sacramento, CA. 35
Jackson, R. D. and J. W. Bartolome. 2007. Grazing Ecology of California Grasslands. In M. R. 36 Stromberg, J. D. Corbin, and C. M. D’Antonio (eds.), California Grasslands: Ecology and 37 Management. Berkeley, CA: University of California Press. Pages 197–206. 38
Bay Delta Conservation Plan Public Draft 2-110 November 2013
ICF 00343.12

Existing Ecological Conditions
Chapter 2
Jackson, W. T. and A. M. Paterson. 1977. The Sacramento-San Joaquin Delta the Evolution and 1 Implementation of Water Policy: An Historical Perspective. Technical Completion Report, 2 Contribution No. 163. Davis, CA: California Water Resources Center. 3
Jackson, L. E., F. Santos-Martin, A. D. Hollander, W. R. Horwath, R. E. Howitt, J. B. Kramer, A. T. 4 O’Geen, B. S. Orlove, J. W. Six, S. K. Sokolow, D. A. Sumner, T. P. Tomich, and S. M. Wheeler. 2009. 5 Potential for Adaptation to Climate Change in an Agricultural Landscape in the Central Valley Of 6 California. California Energy Commission PIER Program Report, CEC-500-2009-044-F. 7 Sacramento, CA. 8
Jain, S. 1979. Some Biogeographic Aspects of Plant Communities in Vernal Pools. In S. Jain (ed.), 9 Vernal Pools: Their Ecology and Conservation. Institute of Ecology Publication No. 9. Davis, CA: 10 University of California. Pages 15–21. 11
James, A. 1999. Time and the Persistence of Alluvium: River Engineering, Fluvial Geomorphology, 12 and Mining Sediment in California. Geomorphology 31:265–290. 13
James, L. A. 2003. Glacial Erosion and Geomorphology in the Northwest Sierra Nevada, CA. 14 Geomorphology 55:283–303. 15
James, L. A. 2004a. Decreasing Sediment Yields in Northern California: Vestiges of Hydraulic Gold-16 Mining and Reservoir Trapping. In Sediment Transfer through the Fluvial System. Moscow: 17 International Association of Hydrological Sciences. Pages 225–244. 18
James, L. A. 2004b. Tailings Fans and Valley-Spur Cutoffs Created by Hydraulic Mining. Earth Surface 19 Processes and Landforms 29:869–882. 20
James, L. A. 2006. Bed Waves at the Basin Scale: Implications for River Management and Storage. 21 Earth Surface Processes and Landforms 31:1692–1706. 22
James, L. A. and M. B. Singer. 2008. Development of the Lower Sacramento Valley Flood-Control 23 System: Historical Perspective. Natural Hazards Review 9:125–135. 24
James, L. A., J. Harbor, D. Fabel, D. Dahms, and D. Elmore. 2002. Late Pleistocene Glaciations in the 25 Northwestern Sierra Nevada, California. Quaternary Research 57:409–419. 26
James, L. A., M. B. Singer, S. Ghoshat, and M. Megison. 2009. Historical Channel Changes in the Lower 27 Yuba and Feather Rivers, California: Long-Term Effects of Contrasting River-Management 28 Systems. In L. A. James, S. L. Rathburn, and G. R. Whittecar (eds.), Management and Restoration of 29 Fluvial Systems with Broad Historical Changes and Human Impacts. Pages 57–81. 30
Jassby, A. 2008. Phytoplankton in the Upper San Francisco Estuary: Recent Biomass Trends, Their 31 Causes and Their Trophic Significance. San Francisco Estuary & Watershed Science 6:1–24. 32
Jassby, A. D. and J. E. Cloern. 2000. Organic Matter Sources AND Rehabilitation of the Sacramento-33 San Joaquin Delta (California, USA). Aquatic Conservation: Marine and Freshwater Ecosystems. 34 10:323–352. 35
Jassby, A. D., and E. E. Van Nieuwenhuyse. 2005. Low Dissolved Oxygen in an Estuarine Channel (San 36 Joaquin River, California): Mechanisms and Models Based on Long-Term Time Series. San 37 Francisco Estuary and Watershed Science [online serial]. 3(2) (September 2005), Article 2. 38
Bay Delta Conservation Plan Public Draft 2-111 November 2013
ICF 00343.12

Existing Ecological Conditions
Chapter 2
Jassby, A. D., J. E. Cloern, and A. B. Mueller-Solger. 2003. Phytoplankton Fuels Delta Foodweb. 1 California Agriculture. 57(4):104–109. 2
Jassby, A. D., J. E. Cloern, and B. E. Cole. 2002. Annual Primary Production: Patterns and Mechanisms 3 of Change in a Nutrient-Rich Tidal Ecosystem. Limnology and Oceanography. 47:698–712. 4
Jassby, A. D., W. J. Kimmerer, S. G. Monismith, C. Armor, J. E. Cloern, T. M. Powell, J. R. Schubel, and 5 T. J. Vendlinski. 1995. Isohaline Position as a Habitat Indicator for Estuarine Populations. 6 Ecological Applications. 5:272–289. 7
Jennings, C. W., R. G. Strand, and T. H. Rogers. 1977. Geologic Map of California. Sacramento, CA: 8 California Division of Mines. 9
Jones & Stokes Associates, Inc. 1990. Sacramento County Vernal Pools: Their Distribution, 10 Classification, Ecology, and Management. (JSA 89-303) Sacramento, CA: Prepared for the 11 Sacramento County Planning and Community Development Department. 12
Kapnick, S. and A. Hall. 2009. Observed Changes in the Sierra Nevada Snowpack: Potential Causes and 13 Concerns. PIER Program Report CEC-500-2009-016-F. Sacramento, CA: California Energy 14 Commission. 15
Katibah, E. F. 1984. A Brief History of Riparian Forest in the Central Valley of California. In M. N. 16 Kochert, K. Steenhof, C. L. McIntyre, E. H. Craig (eds.), The Birds of North America. Philadelphia, 17 PA: The Academy of Natural Sciences. Pages 23–29. 18
Keeler-Wolf, T. and M. Vaghti. 2000. Vegetation Mapping of Suisun Marsh, Solano County California. 19 Sacramento, CA: California Department of Fish and Game. 20
Keeler-Wolf, T., J. M. Evens, A. I. Solomeshch, V. L. Holland, and M. G. Barbour. 2007. Community 21 Classification and Nomenclature. In M. R. Stromberg, J. D. Corbin, C. M. D’Antonio (eds.), 22 California Grasslands Ecology and Management. Berkeley, CA: University of California Press. 23 Pages 21–34. 24
Keeley, J. E. and P. H. Zedler. 1998. Characterization and Global Distribution of Vernal Pools. In C. W. 25 Witham, E. T. Bauder, D. Belk, W. R. Ferren Jr., and R. Ornduff (eds.), Ecology, Conservation, and 26 Management of Vernal Pool Ecosystems—Proceedings from a 1996 Conference. Sacramento, CA: 27 California Native Plant Society. Pages 1–14. 28
Keller, B. R. 2009. Literature Review of Unconsolidated Sediment in the San Francisco Bay and 29 Nearby Pacific Ocean Coast. San Francisco Estuary & Watershed Science 7, Article 2. 30
Kelley, R. 1989. Battling the Inland Sea. Berkeley and Los Angeles, CA: University of California Press. 31
Kim, W., A. Dai, T. Muto, and G. Parker. 2009. Delta Progradation Driven by an Advancing Sediment 32 Source: Coupled Theory and Experiment Describing the Evolution of Elongated Deltas. Water 33 Resources Research 45:W06428. 34
Kimmerer, W. J. 2002. Physical, Biological, and Management Responses to Variable Freshwater Flow 35 into the San Francisco Estuary. Estuaries 25(6B):1275–1290. 36
Kimmerer, W. J. 2004. Open Water Processes of the San Francisco Estuary: From Physical Forcing to 37 Biological Responses. San Francisco Estuary and Watershed Science [online serial]. 2(1) 38 (February 2004), Article 1. 39
Bay Delta Conservation Plan Public Draft 2-112 November 2013
ICF 00343.12

Existing Ecological Conditions
Chapter 2
Kimmerer, W. J. and J. J. Orsi. 1996. Changes in the Zooplankton of the San Francisco Bay Estuary 1 Since the Introduction of the Clam Potamacorbula amurensis. In J. T. Hollibaugh (ed.), San 2 Francisco Bay: The Ecosystem. San Francisco, CA: Pacific Division, American Association for the 3 Advancement of Science. Pages 403–424. 4
Kleinschmidt Associates. 2008. Cosumnes River Preserve Management Plan. Prepared for The Nature 5 Conservancy, Galt, CA. 6
Knowles, N. 2006. Projecting Inundation due to Sea Level Rise in the San Francisco Bay and Delta. 7 Third Annual Climate Change Research Conference. September 13–15, 2006. Available: 8 <http://www.climatechange.ca.gov/events/2006_conference/presentations/2006-09-9 14/2006-09-14_KNOWLES.PDF>. 10
Knowles, N. and D. Cayan. 2002. Potential Effects of Global Warming on the Sacramento/San Joaquin 11 Watershed and the San Francisco Estuary. Geophysical Research Letters 29:38-1–38-4. 12
Knowles, N. and D. R. Cayan. 2004. Elevational Dependence of Projected Hydrologic Changes in the 13 San Francisco Estuary and Watershed. Climatic Change 62:319–336. 14
Kwasny, D. C., M. Wolder, and C. R. Isola. 2004. Technical Guide to Best Management Practices for 15 Mosquito Control in Managed Wetlands. Central Valley Habitat Joint Venture. 16
Larsen, E., E. Anderson, E. Avery, and K. Dole. 2002. The Controls on and Evolution of channel 17 Morphology of the Sacramento River, as Case Study of River Miles 201–185. Davis, CA: The Nature 18 Conservancy. 19
Laymon, S. A. 1998. Yellow-billed cuckoo (Coccycus americanus). In The Riparian Bird Conservation 20 Plan: A Strategy for Reversing the Decline of Riparian-Associated Birds in California. California 21 Partners in Flight. Available: <http//www.prbo.org/calpif/htmldocs/riparian_v-2.html>. 22
Lee, G. F. and A. Jones-Lee. 2002. Synthesis of Findings on the Causes and Factors Influencing Low DO 23 in the San Joaquin River Deep Water Ship Channel near Stockton, CA. Report. El Macero, CA: SJR 24 DO TMDL Steering Committee. 25
Lehman, P. W. 2000. Phytoplankton Biomass, Cell Diameter, and Species Composition in the Low 26 Salinity Zone of Northern San Francisco Bay Estuary. Estuaries 23(2):216–230. 27
Lehman, P. W. and S. Waller. 2003. As cited in Lehman, P. W., G. Boyer, C. Hall, S. Waller, and K. 28 Gehrts. 2005. Distribution and Toxicity of a New Colonial Microcystis aeruginosa Bloom in the 29 San Francisco Bay Estuary, California. Hydrobiologia 541:87–99. 30
Lehman, P. W., G. Boyer, C. Hall, S. Waller, and K. Gehrts. 2005. Distribution and Toxicity of a New 31 Colonial Microcystis aeruginosa Bloom in the San Francisco Bay Estuary, California. 32 Hydrobiologia 541:87–99. 33
Lehman, P. W., G. Boyer, M. Satchwell, and S. Waller. 2008. The Influence of Environmental 34 Conditions on the Seasonal Variation of Microcystis Cell Density and Microcystins Concentration 35 in San Francisco Estuary. Hydrobiologia 600:187–204. 36
Leigh Fisher Associates. 2005. Byron Airport Master Plan. Final report. Concord, CA: Contra Costa 37 Public Works Department. 38
Bay Delta Conservation Plan Public Draft 2-113 November 2013
ICF 00343.12
Existing Ecological Conditions
Chapter 2
Lindley, S. T., R. S. Schick, E. Mora, P. B. Adams, J. J. Anderson, S. Greene, C. Hanson, B. P. May, D. R. 1 McEwan, R. B. MacFarlane, C. Swanson, and J. G. Williams. 2007. Framework for Assessing 2 Viability of Threatened and Endangered Chinook Salmon and Steelhead in the Sacramento-San 3 Joaquin Basin. San Francisco Estuary and Watershed Science (online serial). 5(1) (February 4 2007), Article 4. 5
Loredo, I. and D. Van Vuren. 1996. Reproductive Ecology of a Population of the California Tiger 6 Salamander. Copeia 1996:895–901. 7
Loudeback, G. D. 1951. Geologic History of the San Francisco Bay. In O. P. Jenkins (ed.). Bulletin 154: 8 Geologic Guidebook of the San Francisco Bay Counties. Sacramento, CA: California Division of 9 Mines. Pages 75–94. 10
Lucas, L. V., J. E. Cloern, J. K. Thompson, and N. E. Monsen. 2002. Functional Variability of Habitats 11 within the Sacramento-San Joaquin Delta: Restoration Implications. Ecological Applications. 12 12:1528–1547. 13
Lund, J., E. Hanak, W. Fleenor, R. Howitt, J. Mount, and P. Moyle. 2007. Envisioning Futures for the 14 Sacramento-San Joaquin Delta. Public Policy Institute of California. 15
Luoma, S. N. and T. S. Presser. 2000. Forecasting Selenium Discharges to the San Francisco Bay-Delta 16 Estuary: Ecological Effects of a Proposed San Luis Drain Extension. OFR 00-416. Menlo Park, CA: 17 U.S. Geological Survey. 18
Lydon, P. A. 1968. Geology and Lahars of the Tuscan Formation, Northern California. In R. L. Coats, R. 19 L. Hay, and C. A. Anderson (eds.), Volcanology: A Memoir in Honor of Howel Williams. Boulder, 20 CO: Geological Society of America. 21
Malamud-Roam, F. and B. L. Ingram. 2004. Late Holocene δ13C and Pollen Records of Paleosalinity 22 from Tidal Marshes in the San Francisco Bay Estuary, California. Quaternary Research 23 62:134–145. 24
Malamud-Roam, F., B. L. Ingram, M. K. Hughes, and J. L. Florsheim. 2006. Holocene Paleoclimate 25 Records from a large California Estuarine System and Its Watershed Region: Linking Watershed 26 Climate and Bay Conditions. Quaternary Science Reviews 25:1570–1598. 27
Malamud-Roam, F., M. Dettinger, B. L. Ingram, M. K. Hughes, and J. L. Florsheim. 2007. Holocene 28 Climates and Connections between the San Francisco Bay Estuary and Its Watershed: A Review. 29 San Francisco Estuary & Watershed Science 5, Article 3. 30
Manly P. and C. Davidson. 1993. A Risk Analysis of Neotropical Migrant Birds in California. Report. San 31 Francisco, CA: Region 5, U.S. Forest Service. 32
Mann, C. W., J. F. Warner, H. L. Westover, and J. E. Ferguson. 1911. Soil Survey of the Woodland Area, 33 California. Washington, DC: Government Printing Office. 34
Marchandt, D. E. and A. Allwardt. 1981. Late Cenozoic Stratigraphic Units, Northeastern San Joaquin 35 Valley, California. U.S. Geological Survey. p. 70. 36
Marty, J. T. 2005. Effects of Cattle Grazing on Diversity in Ephemeral Wetlands. Conservation Biology 37 19:1626–1632. 38
Bay Delta Conservation Plan Public Draft 2-114 November 2013
ICF 00343.12

Existing Ecological Conditions
Chapter 2
McKee, L. J., N. K. Ganju, and D. H. Schoellhamer. 2006. Estimates of Suspended Sediment Entering 1 San Francisco Bay from the Sacramento and San Joaquin Delta, San Francisco Bay, California. 2 Journal of Hydrology 323:335–352. 3
McKnight, T. L. and D. Hess. 2005. Physical Geography: A Landscape Appreciation. 8th Edition. Upper 4 Saddle River, NJ: Pearson Prentice Hall. 5
Medeiros, J. L. 1976. Vernal pools and Vernal Lakes in the Eastern Central Valley of California. In S. 6 Jain (ed.), Vernal pools: Their Ecology and Conservation. Publication Number 9. Davis, CA: 7 Institute of Ecology. 8
Meehan, W. R. 1991. Introduction and Overview. In W. R. Meehan (ed.), Influences of Forest and 9 Rangeland Management on Salmonid Fishes and Their Habitats. Special Publication 19. Bethesda, 10 MD: American Fisheries Society. Pages 1–16. 11
Meisler, J. A. 2002. Site Conservation Plan for the Jepson Prairie-Prospect Island Corridor. Prepared for 12 the Solano County Land Trust. 13
Mikhailov, V. O., T. Parsons, R. W. Simpson, E. P. Timoshkina, and C. Williams. 2006. Why the 14 Sacramento Delta Area Differs from Other Parts of the Great Valley: Numerical Modeling of 15 Thermal Structure and Thermal Subsidence of Forearc Basins. Physics of the Solid Earth 16 43:75–90. 17
Moss, B. 1998. Ecology of Fresh Waters. 3rd Edition. Victoria, Australia: Blackwell Science Ltd. 18
Mount, J. and R. Twiss. 2005. Subsidence, Sea Level Rise, Seismicity in the Sacramento-San Joaquin 19 Delta. San Francisco Estuary and Watershed Science [online serial]. 3(1) (March 2005), Article 5. 20
Mount, J. F. 1995. California Rivers and Streams: The Conflict between Fluvial Process and Land Use. 21 Berkeley, CA: University of California Press. 22
Moyle, P. B. 2002. Inland Fishes of California, Revised and Expanded. Berkeley, CA: University of 23 California Press. 24
Moyle, P. B., P. K. Crain, and K. Whitener. 2007. Patterns in the Use of a Restored California 25 Floodplain by Native and Alien Fishes. San Francisco Estuary and Watershed Science [online 26 serial]. 5(3) (July 2007), Article 1. 27
Myers, N. R., A. Mittermeier, C. G. Mittermeier, G. A. B. da Fonseca, and J. Kent. 2000. Biodiversity Hot 28 Spots for Conservation Priorities. Nature. 403:853–858. 29
National Atlas of the United States. 2009. Available: <http://nationalatlas.gov>. 30
National Marine Fisheries Service. 2004. Biological Opinion on the Long-Term Central Valley Project 31 and State Water Project Operations Criteria and Plan. October 2004. Long Beach, CA: Southwest 32 Region, National Marine Fisheries Service. 33
National Research Council. 2002. Riparian Areas: Functions and Strategies for Management. 34 Washington, DC: Committee on Riparian Zone Functioning and Strategies for Management, 35 Water Science, and Technology Board. 36
The Natural Heritage Institute. 2003. The Past and Present Condition of the Marsh Creek Watershed. 37 Berkeley, CA: The Natural Heritage Institute. 38
Bay Delta Conservation Plan Public Draft 2-115 November 2013
ICF 00343.12

Existing Ecological Conditions
Chapter 2
Natural Resources Conservation Service. 2009. Soil Survey Geographic (SSURGO) Database. 1
Naylor, L. W. 2002. Evaluating Moist-Soil Seed Production and Management in Central Valley 2 Wetlands to Determine Habitat Needs for Waterfowl. MS thesis, University of California, 3 Davis, CA. 4
Nicholls, R. J., F. M. J. Hoozemans, and M. Marchand. 1999. Increasing Flood Risk and Wetland Losses 5 due to Global Sea-Level Rise: Regional and Global Analyses. Global Climate Change 9:S69–S87. 6
Norris, R. 1851. General land office survey notes. October 1851. 7
Olmsted, F. H. and G. H. Davis. 1961. Geologic Features and Ground-Water Storage Capacity of the 8 Sacramento Valley, California. U.S. Geological Survey. p. 241. 9
Opperman, J. J. 2005. Large Woody Debris and Land Management in California’s Hardwood-10 Dominated Watersheds. Environmental Management 35(3):266–277. 11
Orr M., S. Crooks, and P. B. Williams. 2003. Will Restored Tidal Marshes Be Sustainable? San 12 Francisco Estuary and Watershed Science [online serial]. 1(1) (October 2003), Article 5. 13
Page, R. W. 1985. Geology of the Fresh Ground-Water Basin of the Central Valley, California, with 14 Texture Maps And Sections. Technical Paper 1401-C. U.S. Geological Survey. 15
Parker, A., A. Machi, J. Davidson-Drexel, R. Dugdale, and F. Wilkerson. 2010. Effect of Ammonium and 16 Wastewater Effluent on Riverine Phytoplankton on the Sacramento River, CA. Final Report to the 17 State Water Resources Control Board. 18
Parker, G., T. Muto, Y. Akamatsu, W. D. Dietrichs, and W. Lauer. 2008. Unravelling the Conundrum of 19 River Response to Rising Sea-Level from Laboratory to Field. Part II. The Fly-Strickland River 20 system, Papua New Guinea. Sedimentology 55:1657–1686. 21
Pearce, S. 2004. Analysis of Reference Tidal Channel Plan Form for the Montezuma Wetlands 22 Restoration Project. Oakland, CA: San Francisco Estuary Institute. 23
Peltier, W. R. and R. G. Fairbanks. 2006. Global Glacial Ice Volume and Last Glacial Maximum 24 Duration from an Extended Barbados Sea Level Record. Quaternary Science Reviews 25 25:3322–3337. 26
Peters, E. K. 1991. Gold-Bearing Hot Spring Systems of the Northern California Coast Ranges, 27 California. Economic Geology 86:1519–1528. 28
Petranka, J. W. 1998. Salamanders of the United States and Canada. Washington, DC: Smithsonian 29 Institution Press. 30
Pierce, D. W. and D. Gaushell. 2005. The California Delta Breeze: Characteristics and Sub-Daily 31 Forecasting. Abstract. Sixth Conference on Coastal Atmospheric and Oceanic Prediction and 32 Processes, San Diego, CA. 33
Planty-Tabacchi, A., E. Tabacchi, R. J. Naiman, C. Deferrari, and H. Décamps. 1996. Invasibility of 34 Species-Rich Communities in Riparian Zones. Conservation Biology 10:598–607. 35
Power, M. E. and W. E. Rainey. 2000. Foodwebs and Resource Sheds: Towards Spatially Delimiting 36 Trophic Interactions. In 40th Symposium of the British Ecological Society. Cambridge University 37 Press, University of Sussex. Pages 291–314. 38
Bay Delta Conservation Plan Public Draft 2-116 November 2013
ICF 00343.12

Existing Ecological Conditions
Chapter 2
Rahmstorf, S. 2007. A Semi-Empirical Approach to Projecting Future Sea Level. Science. 1 315(5810):368–370. 2
Rains, M. C., R. A. Dahlgren, R. J. Williamson, G. E. Fogg, and T. Harter. 2008. Geological Control of 3 Physical and Chemical Hydrology in Vernal Pools, Central Valley, California. Wetlands 4 28:347–362. 5
Reed, D., J. Anderson, E. Fleishman, D. Freyberg, W. Kimmerer, K. Rose, M. Stacey, S. Ustin, I. Werner, 6 B. DiGennaro, and W. Spencer. 2007. Bay Delta Conservation Plan Independent Science Advisors 7 Report. Available: <http://www.baydeltaconservationplan.com/Libraries/ 8 Background_Documents/BDCP_ISA_Report_11-16-07.sflb.ashx>. 9
Reever-Morghan, K., J. D. Corbin, and J. D. Gerlach. 2007. Water Relations. In M. R. Stromberg, J. D. 10 Corbin, and C. M. D’Antonio (eds.), California Grasslands: Ecology and Management. Berkeley, CA: 11 University of California Press. Pages 87–93. 12
Reiner, R. J. and R. Swenson. 2000. Saving Vernal Pools in the Cosumnes River Watershed. Fremontia 13 28:33–37. 14
Resources Agency, California Department of Water Resources, and California Department of Fish 15 and Game. 2007. Pelagic Fish Action Plan. March 2007. Available: 16 <http://www.water.ca.gov/deltainit/docs/030507pod.pdf>. 17
Riparian Habitat Joint Venture. 2004. The riparian bird Conservation Plan: A Strategy for Reversing 18 the Decline of Riparian Associated Birds in California. Version 2.0. California Partners in Flight. 19 Available: <http://www.prbo.org/calpif/pdfs/riparian_v-2.pdf>. 20
Robertson, K. G. 1987. Paleochannels and Recent Evolution of Sacramento River, California. MS thesis. 21 Davis, CA: University of California. 22
Rogers, D. C. 1998. Aquatic Macroinvertebrate Occurrences and Population Trends in Constructed 23 and Natural Vernal Pools in Folsom, California. In C. W. Witham, E. T. Bauder, D. Belk, W. R. J. 24 Ferren, and R. Ornduff, eds. Ecology, Conservation, and Management of Vernal Pool Ecosystems. 25 Sacramento, CA: California Native Plant Society. Pages 224–235. 26
Roos, M. 2006. Flood Management Practice in Northern California. Irrigation and Drainage 55:S93–27 S99. 28
Rosatti, T. (ed.). 2010. The Jepson Manual: Vascular Plants of California. Berkeley, CA: University of 29 California Press. 30
Rowland, J. C., W. E. Dietrich, G. Day, and G. Parker. 2009. Formation and Maintenance of Single-31 Thread Tie Channels Entering Floodplain Lakes: Observations from Three Diverse River 32 Systems. Journal of Geophysical Research 114:F02013. 33
Ruhl, C. A. and D. H. Schoellhamer. 2004. Spatial and Temporal Variability of Suspended-Sediment 34 Concentration in a Shallow Estuarine Environment. San Francisco Estuary & Watershed Science 35 2, Article 1. 36
Rutter, C. 1908. The Fishes of the Sacramento-San Joaquin Basin, with a Study of their Distribution and 37 Variation. Document No. 637. U.S. Bureau of Fisheries. 38
San Francisco Estuary Institute. 1998. EcoAtlas. Version 1.50b4. (Updated 2007.) Oakland, CA. 39
Bay Delta Conservation Plan Public Draft 2-117 November 2013
ICF 00343.12

Existing Ecological Conditions
Chapter 2
San Francisco Estuary Institute. 2003. Practical Guidebook for the Identification and Control of 1 Invasive Aquatic and Wetland Plants in the San Francisco Bay-Delta Region. Available: 2 <http://www.sfei.org/nis>. 3
San Francisco Estuary Institute. 2005. Tidal Data. Available: < http://www.sfei.org/data>. 4
San Francisco Estuary Institute. 2006. Second Annual Report: Montezuma Wetlands Restoration 5 Project Technical Review Team. Oakland. 6
San Francisco Estuary Institute. 2010. Draft East Contra Costa Historical Ecology Study. Oakland, CA: 7 Contra Costa County and the Contra Costa County Watershed Forum. 8
San Joaquin County Planning Division. 2008. San Joaquin County Mountain House New Community 9 Master Plan amended July 2008. Stockton, CA. Available: <http://www.sjgov.org/commdev/cgi-10 bin/cdyn.exe?grp=planning&htm=mhmasterplan>. 11
Sanderson, E. W., S. L. Ustin, and T. C. Foin. 2000. The Influence of Tidal Channels on the Distribution 12 of Salt Marsh Plant Species in Petaluma Marsh, CA, USA. Plant Ecology 146:29–41. 13
Sarna-Wojcicki, A. M., C. E. Meyer, H. R. Bowman, N. T. Hall, P. C. Russell, M. J. Woodward, and J. L. 14 Slate. 1985. Correlation of the Rockland Ash Bed, a 400,000-Year-Old Stratigraphic Marker in 15 Northern California and Western Nevada, and Implications of Middle Plistocene Paleogeography 16 of Central California. Quaternary Research 23:236–257. 17
Sawyer, J. O. and T. Keeler-Wolf. 1995. A Manual of California Vegetation. Sacramento, CA: California 18 Native Plant Society. 19
Sawyer, J. O., T. Keeler-Wolf, and J. M. Evens. 2009. A Manual of California Vegetation. 2nd Edition. 20 Sacramento, CA: California Native Plant Society. 21
Scheffer, M. 2004. Ecology of Shallow Lakes. Boston, MA: Kluwer Academic Publishers. 22
Schulz, P. D. and D. D. Simons. 1973. Fish Species Diversity in a Prehistoric Central California Indian 23 Midden. California Fish and Game 59(2):107–118. 24
Shelmon, R. J. 1971. The Quaternary Deltaic and Channel System in the Central Great Valley, 25 California. Annals of the Association of American Geographers 61:427–440. 26
Shuford, W. D., G. W. Page, and J. E. Kjelmyr. 1998. Patterns and Dynamics of Shorebird Use of 27 California’s Central Valley. Condor 100:227–244. 28
Shvidchenko, A. B., R. C. MacArthur, and B. R. Hall. 2004. Historic Sedimentation in Sacramento-San 29 Joaquin Delta. IEP Newsletter 17:21–29. 30
Sibley, D. A. 2006. The Sibley Field Guide to Birds of Western North America. Alfred A. Knopf, Inc. 31
Siegel, S. 2007. Determinism, Chaos, and Randomness: Restoring Delta Ecosystems. October 18, 32 2007. 8th Biennial State of the San Francisco Estuary Conference. 33
Silveira, J. G. 1998. Avian Uses of Vernal Pools and Implications for Conservation Practice. In C. W. 34 Witham et al. (eds.), Ecology, Conservation, and Management of Vernal Pool Ecosystems—35 Proceedings from a 1996 Conference. California Native Plant Society, Sacramento, CA. Pages 92–36 106. 37
Bay Delta Conservation Plan Public Draft 2-118 November 2013
ICF 00343.12

Existing Ecological Conditions
Chapter 2
Simenstad, C., J. Toft, H. Higgins, J. Cordell, M. Orr, P. Williams, L. Grimaldo, and Z. Hymanson. 2000. 1 Sacramento/San Joaquin Delta Breached Levee Wetland Study (BREACH). Preliminary report. 2 February 2000. Seattle, WA: Wetland Ecosysteam Team, University of Washington School of 3 Fisheries. 4
Singer, M. B. 2008. Downstream Patterns of Bed Material Grain Size in a Large, Lowland Alluvial 5 River Subject to Low Sediment Supply. Water Resources Research 44:W12202. 6
Singer, M. B. and R. Aalto. 2009. Floodplain Development in an Engineered Setting. Earth Science 7 Process and Landforms 34:291–304. 8
Singer, M. B. and T. Dunne. 2001. Identifying Eroding and Depositional Reaches of Valley by Analysis 9 of Suspended Sediment Transport in the Sacramento River, California. Water Resources Research 10 37:3371–3381. 11
Singer, M. B., R. Aalto, and L. A. James. 2008. Status of the Lower Sacramento Valley Flood-Control 12 System within the Context of Its Natural Geomorphic Setting. Natural Hazards Review 13 9:104–115. 14
Skinner, M. W. and B. M. Pavlik. 1994. Inventory of Rare and Endangered Vascular Plants in California. 15 5th edition. Special Publication No. 1. Sacramento, CA: California Native Plant Society. 16
Smith, R. L. 1974. Ecology and Field Biology. New York, NY: Harper and Row. 17
Solomeshch, A. I., M. J. Barbour, and R. F. Holland. 2007. Vernal pools. In M. J. Barbour, T. Keeler-18 Wolf, and A. A. Schoenherr (eds.), Terrestrial Vegetation of California. Berkeley, CA. Pages 394–19 424. 20
Sommer T. 2007. The Decline of Pelagic Fishes in the San Francisco Estuary: An Update. Presented to 21 the State Water Resources Control Board, Sacramento, CA. March 22, 2007. Available: 22 <http://www.waterrights.ca.gov/baydelta/docs/pelagicorganism/ dwr_032207sommer.pdf>. 23
Sommer, T., B. Harrell, M. Nobriga, R. Brown, W. Kimmerer, and L. Schemel. 2001a. California’s Yolo 24 Bypass: Evidence That Flood Control Can Be Compatible with Fisheries, Wetlands, Wildlife, and 25 Agriculture. Fisheries 26(8):6–16. 26
Sommer, T. R., M. L. Nobriga, W. C. Harrell, W. Batham, and W. J. Kimmerer. 2001b. Floodplain 27 Rearing of Juvenile Chinook Salmon: Evidence of Enhanced Growth and Survival. Canadian 28 Journal of Fisheries and Aquatic Sciences 58(2):325–333. 29
Sommer, T. R., W. C. Harrell, and T. J. Swift. 2008. Extreme Hydrologic Banding in a Large-River 30 Floodplain, California, U.S.A. Hydrobiologia 598:409–415. 31
Sommer, T., R. Baxter, and F. Feyrer. 2007. Splittail “Delisting”: A Review of Recent Population 32 Trends and Restoration Activities. American Fishing Symposium. 53:25–38. 33
Stainstreet, I. G. and T. S. McCarthy. 1993. The Okavango Fan and the Classification of Subaerial Fan 34 Systems. Sedimentary Geology 85:115–133. 35
State of California. 1987. A Proposal to the U.S. Department of Energy for Siting the Super Conducting 36 Super Collider in California, Davis Site: Vol. 3 Geology and Tunneling. 37
Bay Delta Conservation Plan Public Draft 2-119 November 2013
ICF 00343.12
Existing Ecological Conditions
Chapter 2
Stein, B. A. 2002. States of the Union: Ranking America’s Biodiversity. Arlington, VA: NatureServe; 1 Washington, DC: National Research Council. Available: 2 <http://www.natureserve.org/Reports/stateofunions.pdf>. Accessed: December 2006. 3
Stein, B. A., L. S. Kutner, and J. S. Adams. 2000. Precious Heritage: The Status of Biodiversity in the 4 United States. New York, NY: Oxford University Press. 5
Storer, T. I. 1925. A Synopsis of the Amphibia of California. University of California Publications in 6 Zoology 27:60–71. 7
Strahan, J. 1984. Regeneration of Riparian Forests of the Central Valley. In R. E. Warner and K. 8 Hendrix (eds.), California Riparian Systems: Ecology, Conservation and Productive Management. 9 Berkeley, CA: University of California Press. Pages 58–67. 10
Suisun Ecological Workgroup. 1997. Suisun Ecological Workgroup Brackish Marsh Vegetation 11 Subcommittee Report. Sacramento, CA: California Department of Water Resources Control Board. 12
Suisun Ecological Workgroup. 2001. Suisun Ecological Workgroup Final Report to the State Water 13 Resources Control Board. Sacramento, CA: State Water Resources Control Board. 14
Swiecki, T. J. and E. Bernhardt. 2002. Exotic and Native Plant Monitoring at Jepson Prairie Preserve, 15 2002. Fairfield, CA: Solano Land Trust. 16
Takekawa, J. Y., I. Woo, H. Spautz, N. Nur, J. L. Grenier, K. Malmud-Roam, J. C. Nordby, A. N. Cohen, F. 17 Malamud-Roam, and S. E. Wainwright-De La Cruz. 2006. Environmental Threats to Tidal-Marsh 18 Vertebrates of the San Francisco Bay Estuary. Studies in Avian Biology 32:176–197. 19
Technology Associates International Corporation. 2008. Unpublished material, YoloCounty_Regional 20 Vegetation_July08. Available: <http://www.yoloconservationplan.org/yolo_data/ 21 YoloCounty_RegionalVegetation_July08.shp>. 22
The Bay Institute. 1998. From the Sierra to the Sea: The Ecological History of the San Francisco Bay-23 Delta Watershed. The Bay Institute of San Francisco. Novato, CA. Available: 24 <http://www.bay.org/sierra_to_the_sea.htm>. 25
Thomasson, H. G., Jr., F. H. Olmsted, and E. F. LeRoux. 1960. Geology, Water Resources and Usable 26 Ground-Water Storage Capacity of Part of Solano County, California. Water-Supply Paper 1464. 27 U.S. Geological Survey. 28
Thompson, J. 1957. The Settlement Geography of the Sacramento-San Joaquin Delta, California. PhD 29 dissertation. Stanford University, Palo Alto, CA. 30
Thompson, J. 1965. Reclamation Sequence in the Sacramento-San Joaquin Delta. California 31 Geographer 1965:29–35. 32
Thompson, K. 1960. Historic Flooding in the Sacramento Valley. Pacific Historical Review 33 29:349–360. 34
Thompson, K. 1961. Riparian Forests of the Sacramento Valley, California. Annals of the Association 35 of American Geographers 51:294–315. 36
Trenham, P. C. 1998. Radio Tracking Information. Unpublished manuscript. 37
Bay Delta Conservation Plan Public Draft 2-120 November 2013
ICF 00343.12

Existing Ecological Conditions
Chapter 2
Trowbridge, W. B. 2002. The Influence of Restored Flooding on Floodplain Plant Distributions. PhD 1 dissertation. University of California, Davis. 2
Trowbridge, W. B. 2005. The Role of Stochasticity and Priority Effects in Floodplain Restoration. 3 Ecological Applications 17:1312–1324. 4
Trowbridge, W. B., S. Kalmanovitz, and M. W. Schwartz. 2005. Growth of Valley Oak (Quercus lobata 5 Nee) in Four Floodplain Environments in the Central Valley of California. Plant 6 Ecology 176:157–164. 7
Tu, I. M. 2000. Vegetation Patterns and Processes of Natural Regeneration in Periodically Flooded 8 Riparian Forests in the Central Valley of California. PhD dissertation. University of California, 9 Davis, CA. 10
Twidale, C. R. and J. R. Vidal Romaní. 2005. Landforms and Geology of Granitic Terrains. Leiden, 11 Netherlands: A. A. Balkema Publishers. 12
U.S. Army Corps of Engineers. 1978. Preliminary Guide to Wetlands of the West Coast States. U.S. 13 Army Engineer Waterways Experiment Station Technical Report Y-78-4. 14
U.S. Army Corps of Engineers. 2009. Water Resources Policies and Authorities Incorporating Sea Level 15 Change Considerations in Civil Works Programs. July. Circular No. 1165-2-211. 16
U.S. Department of Agriculture Farm Service Agency. 2005. Downloaded July 3, 2007, from CaSIL 17 mirror site hosted by California EPA: 18 <ftp://casil.calepa.ca.gov/casil/remote_sensing/naip_2005>. 19
U.S. Fish & Wildlife Service. 1984. Revised Recovery Plan for Three Endangered Species Endemic to 20 Antioch Dunes, California. Portland, OR. 21
U.S. Fish & Wildlife Service. 2001. Antioch Dunes National Wildlife Refuge Draft Comprehensive 22 Conservation Plan: Plan and Environmental Assessment. Sacramento, CA. 23
U.S. Fish and Wildlife Service. 2004. 5-Year Review Hypomesus transpacificus (Delta Smelt). 24 Sacramento, CA. 25
U.S. Fish and Wildlife Service. 2005. Reinitiation of Formal and Early Section 7 Endangered Species 26 Consultation on the Coordinated Operations of the Central Valley Project and State Water Project 27 and the Operational Criteria and Plan to Address Potential Critical Habitat Issues. February 24, 28 2005. Sacramento, CA. Available: 29 <http://www.fws.gov/sacramento/es/biological_opinions.htm>. 30
U.S. Fish and Wildlife Service. 2007. Stone Lakes National Wildlife Refuge Comprehensive 31 Conservation Plan. January. Sacramento, CA. 32
U.S. Fish and Wildlife Service. 2008a. Formal Endangered Species Act Consultation on the Proposed 33 Coordinated Operations of the Central Valley Project (CVP) and State Water Project (SWP). 34 Biological opinion. December. Sacramento, CA. Available: 35 <http://www.fws.gov/sacramento/delta_update.htm>. 36
U.S. Fish and Wildlife Service. 2008b. Lange’s Metalmark Butterfly (Apodemia mormo langei), 37 Antioch Dunes Evening-Primrose, (Oenothera deltoides subsp. howellii), Contra Costa Wallflower 38
Bay Delta Conservation Plan Public Draft 2-121 November 2013
ICF 00343.12

Existing Ecological Conditions
Chapter 2
(Erysimum capitatum var. angustatum). Five Year Review: Summary and Evaluation. Sacramento, 1 CA. 2
U.S. Fish and Wildlife Service. 2009a. Cirsium hydrophilum var. hydrophilum (Suisun Thistle) 5-Year 3 Review: Summary and Evaluation. Sacramento, CA. 4
U.S. Fish and Wildlife Service. 2009b. Cordylanthus mollis ssp. mollis (Soft Bird’s-Beak) 5-Year 5 Review: Summary and Evaluation. Sacramento, CA. 6
U.S. Fish and Wildlife Service. No date. Stockton Office, unpublished data. 7
U.S. Geological Survey. 2005. Preliminary Integrated Geological Map Databases for the United 8 States—Western States: California, Nevada, Arizona, Washington, Oregon, Idaho, and Utah. Open-9 File Report 2005-1305. 10
Unruh, J. R. and C. S. Hitchcock. 2009. Characterization of Potential Seismic Sources in the 11 Sacramento-San Joaquin Delta, California. Final technical report. Submitted November, 2009, to 12 the U.S. Geological Survey National Earthquake Hazards Reduction Program. 13
Unruh, J. R. and S. T. Hector. 1999. Subsurface Characterization of the Potrero-Ryer Island Thrust 14 System, Western Sacramento-San Joaquin Delta, Northern California. Final technical report. U.S. 15 Geological Survey National Earthquake Hazards Program. 16
Vaghti, M. and T. Keeler-Wolf. 2004. Suisun Marsh Vegetation Mapping Change Detection 2003. 17 Sacramento, CA: California Department of Water Resources. 18
Vaghti, M. G. and S. E. Greco. 2007. Riparian Vegetation of the Great Valley. In M. Barbour, T. Keeler-19 Wolf, and A. Schoenherr (eds.), Terrestrial Vegetation of California. Berkeley, CA: University of 20 California Press. Pages 425–455. 21
Van Dijk, M., G. Postma, and M. G. Kleinhans. 2009. Autocyclic Behavior of Fan Deltas: An Analogue 22 Experimental Study. Sedimentology 56:1569–1589. 23
Wahrhaftig, C. 1965. Stepped Topography of the Southern Sierra Nevada, California. Geological 24 Society of America Bulletin 76:1165–1190. 25
Wakabayashi, J. and T. L. Sawyer. 2001. Stream Incision, Tectonics, Uplift, and Evolution of 26 Topography of the Sierra Nevada, California. Journal of Geology 109:539–562. 27
Water Resources & Information Management Engineering Inc. 2006. Yolo County Integrated 28 Groundwater and Surface Water Model. Woodland, CA: Yolo County Flood Control and Water 29 Conservation District and Water Resources Association of Yolo County. 30
Watson, E. B. 2006. Environmental Change in San Francisco Estuary Tidal Marshes. PhD dissertation. 31 University of California, Berkeley, CA. 32
Watson, E. B. and R. Byrne. 2009. Abundance and Diversity of Tidal Marsh Plants along the Salinity 33 Gradient of the San Francisco Estuary: Implications for Global Change Ecology. Plant Ecology 34 205:113–228. 35
Weber-Band, J. 1998. Neotectonics of the Sacramento-San Joaquin Delta Area, East-Central Coast 36 Ranges, California. PhD thesis. Department of Geology/Geophysics, University of California, 37 Berkeley, CA. 38
Bay Delta Conservation Plan Public Draft 2-122 November 2013
ICF 00343.12
Existing Ecological Conditions
Chapter 2
Weissmann, G. S., G. L. Bennett, and A. L. Lansdale. 2005. Factors Controlling Sequence Development 1 on Quaternary Fluvial Fans, San Joaquin Basin, California. In A. M. Harvey, A. E. Mather, and M. 2 Stokes (eds), Alluvial Fans: Geomorphology, Sedimentology, Dynamics. London, UK: Geological 3 Society of London. 4
Weston, D. P. and M. J. Lydy. 2010. Urban and agricultural Sources of Pyrethroid Insecticides to the 5 Sacramento-San Joaquin Delta of California. Environmental Science and Technology. 6 44:1833–1840. 7
Whipple, A., R. Grossinger, D. Rankin, B. Stanford, and R. Askevold. 2012. Sacramento-San Joaquin 8 Delta Historical Ecology Investigation: Exploring Pattern and Process. Prepared for the California 9 Department of Fish and Game and Ecosystem Restoration Program. A Report of SFEI-ASC’s 10 Historical Ecology Program, Publication #672, San Francisco Estuary Institute-Aquatic Science 11 Center, Richmond, CA. 12
Wildlands Inc. 2005. Mitigation Banks: Performance Standards and Credit Release. 13
William Lettis & Associates. 2005. Geomorphic and Geologic Mapping for Restoration Planning, 14 Sacramento-San Joaquin Delta Region. Final report. June 2005. CALFED Ecosystem Restoration 15 Program. 16
Williams, D. D. 2006. The Biology of Temporary Waters. New York, NY: Oxford University Press. 17
Williamson, R., G. Fogg, M. Rains, and T. Harter. 2005. Hydrology of Vernal Pools at Three Sites, 18 Southern Sacramento Valley. Final technical report to the California Department of 19 Transportation, Sacramento, CA. 20
Winder, M. and A. D. Jassby. 2010. Shifts in Zooplankton Community Structure: Implications for 21 Food-Web Processes in the Upper San Francisco Estuary. Estuaries and Coasts 34(4):675–690. 22
Witham, C. W. 2003. Tule Ranch Vernal Pools Botanical Resources Survey Report. Davis, CA: Yolo 23 Basin Foundation. 24
Witham, C. W. 2006. Greater Jepson Prairie Ecosystem Regional Management Plan. Fairfield, CA: 25 Solano Land Trust. 26
Witham, C. W. and G. A. Kareofelas. 1994. Botanical Resources Inventory at Calhoun Cut Ecological 27 Reserve Following California’s Recent Drought. Sacramento, CA: California Department of Fish 28 and Game. 29
Wright, S. A. and D. H. Schoellhamer. 2004. Trends in the Sediment Yield of the Sacramento River, 30 California, 1957–2001. San Francisco Estuary and Watershed Science 2(2) (May 2004), Article 2. 31
Zebell, R. and P. Fiedler. 1996. Restoration and Recovery of Mason’s lilaeopsis: Phase II. Final report to 32 the California Department of Fish and Game Plant Conservation Program. 33
Zedler, P. H. 1987. The Ecology of Southern California Vernal Pools: A Community Profile. U.S. Fish & 34 Wildlife Service. 35
Zedler, P. H. 1990. Life Histories of Vernal Pool Vascular Plants. In D. H. Ikeda and R. A. Schlising 36 (eds.), Vernal Pools: Their Habitat and Biology. Chico, CA: Herbarium, California State University 37 Chico. 38
Bay Delta Conservation Plan Public Draft 2-123 November 2013
ICF 00343.12

Existing Ecological Conditions
Chapter 2
2.5.2 Personal Communications 1
Keeler-Wolf, T. Senior Vegetation Ecologist. California Department of Fish and Game. April 2, 2009—2 Email response to Chris McColl concerning Suisun Marsh GIS dataset registration issues. 3
Simenstad, C. Associate Professor, University of Washington. January 5, 2007—Phone conversation 4 with Rick Wilder about tidal marsh formation in the northern Delta. 5
Bay Delta Conservation Plan Public Draft 2-124 November 2013
ICF 00343.12