
CHAPTER 14 - Bahattin Buyuksahin
115
Bond Prices and Yields CHAPTER 14
-
Upload
khangminh22 -
Category
Documents
-
view
1 -
download
0
Transcript of CHAPTER 14 - Bahattin Buyuksahin

Bond Prices and Yields
CHAPTER 14

BOND CHARACTERISTICS
Face or par value
Coupon rate
Zero coupon bond
Compounding and payments
Accrued Interest
Indenture
BAHATTIN BUYUKSAHIN, DERIVATIVES
PRICING 2
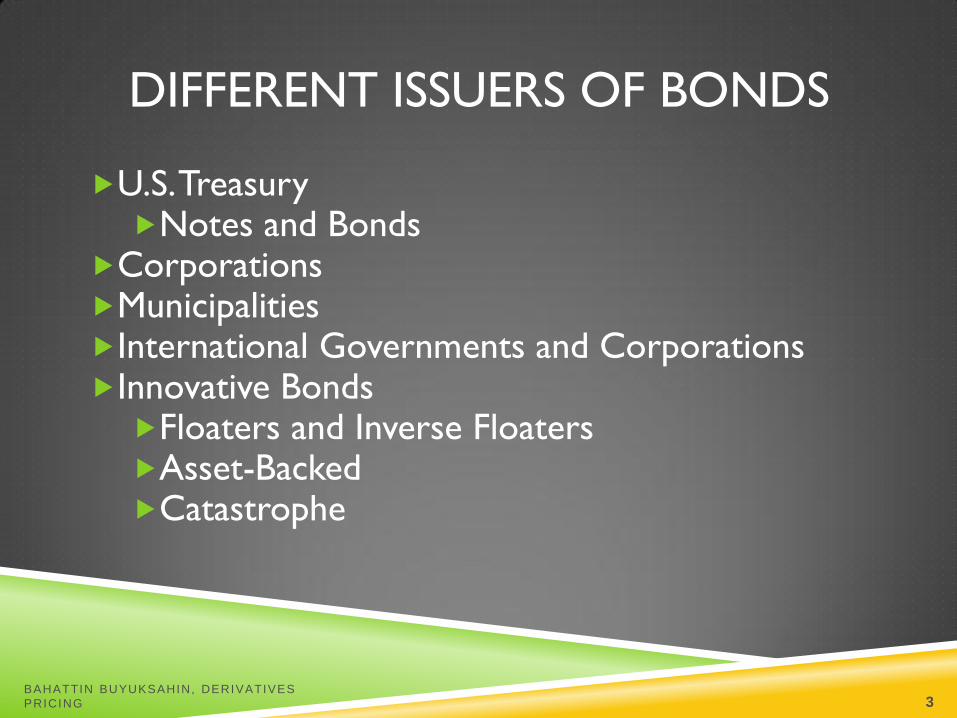
DIFFERENT ISSUERS OF BONDS
U.S. Treasury Notes and Bonds
Corporations Municipalities International Governments and Corporations Innovative Bonds Floaters and Inverse Floaters Asset-Backed Catastrophe
BAHATTIN BUYUKSAHIN, DERIVATIVES
PRICING 3

FIGURE 14.1 LISTING OF TREASURY
ISSUES
BAHATTIN BUYUKSAHIN, DERIVATIVES
PRICING 4

FIGURE 14.2 LISTING OF CORPORATE
BONDS
BAHATTIN BUYUKSAHIN, DERIVATIVES
PRICING 5

PROVISIONS OF BONDS
Secured or unsecured
Call provision
Convertible provision
Put provision (putable bonds)
Floating rate bonds
Preferred Stock
BAHATTIN BUYUKSAHIN, DERIVATIVES
PRICING 6

CONVERTIBLE BONDS
Give bondholders an option to exchange each bond for a specified nb of
shares of common stock
Conversion ratio
= number of shares per convertible bond
Market conversion value
= conversion ratio * current market value per share
Conversion premium
= bond value - conversion value
intuitively: extra amount to pay so as to become a shareholder
BAHATTIN BUYUKSAHIN, DERIVATIVES
PRICING 7

CONVERSION EXAMPLE
Burroughs Corporation
7 ¼% Due 8-1-2010
--------------------------------------------------------------------------
Agency rating (Moody’s/S&P) A3/A-
Conversion ratio 12.882
Market price of convertible 102
Market price of common stock $ 66.00
Dividend per share-common $ 2.60
Call price (first call: 8-1-1990) 106
Estimated floor price $ 66.50
-------------------------------------------------------------------------
(a) Market conversion value?
(b) Conversion premium per common share?
(c) Current yield-convertible?
(d) Dividend yield-common?
BAHATTIN BUYUKSAHIN, DERIVATIVES
PRICING 8

CONVERSION EXAMPLE
(a) Market conversion price = value if converted into stock
= market price of common stock x conversion ratio
= 12.882 x $66 = $850.21
(b) Conversion premium = Bond price – value if converted into stock
= $1020 – (12.882 x $66) = $1020 - $850.21 = $169.79
Thus, the conversion premium per share = ($169.79/12.882) = $13.18
(c) Current yield = (coupon/price) = ($72.50/$1020) = 0.0711 = 7.11%
(d) Dividend yield on common = (dividend per share/price) = ($2.60/$66) = 3.94%
BAHATTIN BUYUKSAHIN, DERIVATIVES
PRICING 9

INNOVATION IN THE BOND MARKET
Inverse Floaters
Asset-Backed Bonds
Catastrophe Bonds
Indexed Bonds
BAHATTIN BUYUKSAHIN, DERIVATIVES
PRICING 10
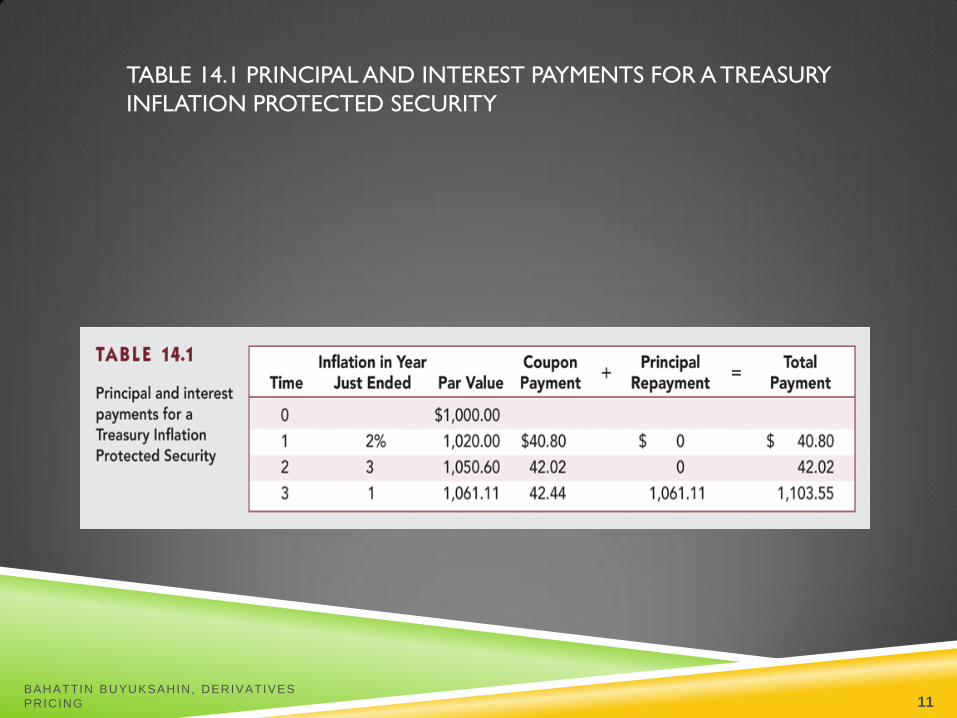
TABLE 14.1 PRINCIPAL AND INTEREST PAYMENTS FOR A TREASURY
INFLATION PROTECTED SECURITY
BAHATTIN BUYUKSAHIN, DERIVATIVES
PRICING 11

BOND PRICES AND YIELDS
Time value of money and bond pricing
Time to maturity and risk
Yield to maturity
vs. yield to call
vs. realized compound yield
Determinants of YTM
risk, maturity, holding period, etc.
BAHATTIN BUYUKSAHIN, DERIVATIVES
PRICING 12
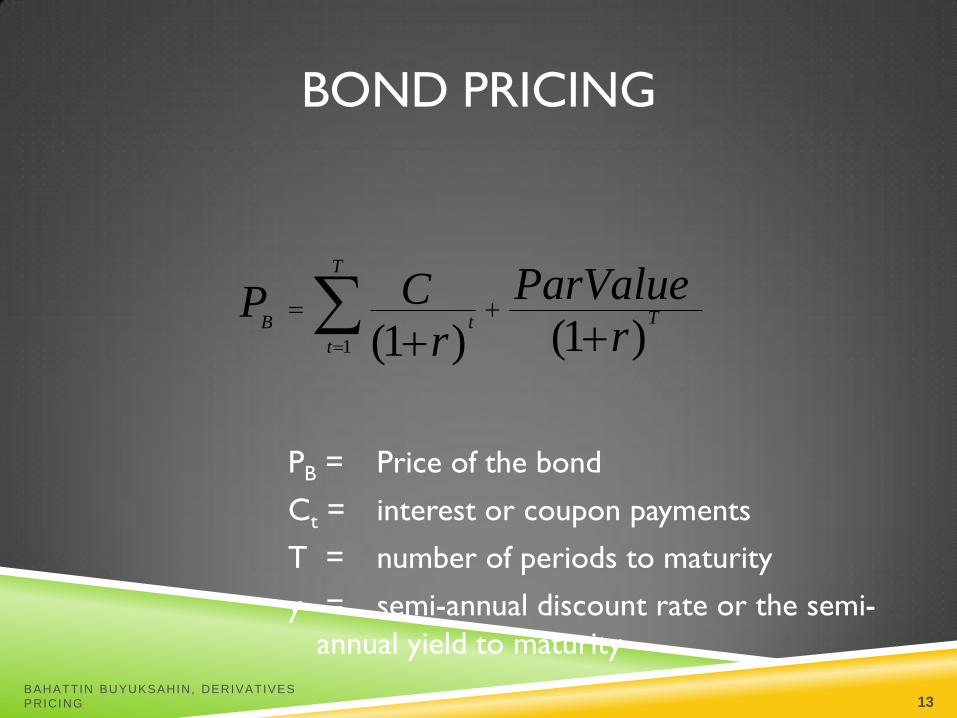
BOND PRICING
1 (1 )(1 )
T
TB t
t
ParValueCPrr
PB = Price of the bond
Ct = interest or coupon payments
T = number of periods to maturity
y = semi-annual discount rate or the semi-
annual yield to maturity
BAHATTIN BUYUKSAHIN, DERIVATIVES
PRICING 13

Ct = 40 (SA)
P = 1000
T = 20 periods
r = 3% (SA)
PRICE: 10-YR, 8% COUPON, FACE =
$1,000
77.148,1$
)03.1(
1000
03.1
140
20
20
1
P
Pt
t
BAHATTIN BUYUKSAHIN, DERIVATIVES
PRICING 14

BOND PRICING
Equation:
P = PV(annuity) + PV(final payment)
=
Example: Ct = $40; Par = $1,000; disc. rate = 4%; T=60 )1()1(1 r
Par
r
couponT
T
tt
000,1$06.95$94.904$)04.01(
000,1$
)04.01(
40$60
60
1
t
tP
BAHATTIN BUYUKSAHIN, DERIVATIVES
PRICING 15

BOND PRICES AND YIELDS
Prices and Yields (required rates of return)
have an inverse relationship
When yields get very high the value of the
bond will be very low
When yields approach zero, the value of the
bond approaches the sum of the cash flows
BAHATTIN BUYUKSAHIN, DERIVATIVES
PRICING 16

PRICES VS. YIELDS
P yield
intuition
convexity
Fig 14.3
intuition: yield P price impact
BAHATTIN BUYUKSAHIN, DERIVATIVES
PRICING 17

FIGURE 14.3 THE INVERSE RELATIONSHIP
BETWEEN BOND PRICES AND YIELDS
BAHATTIN BUYUKSAHIN, DERIVATIVES
PRICING 18

TABLE 14.2 BOND PRICES AT DIFFERENT
INTEREST RATES (8% COUPON BOND,
COUPONS PAID SEMIANNUALLY)
BAHATTIN BUYUKSAHIN, DERIVATIVES
PRICING 19
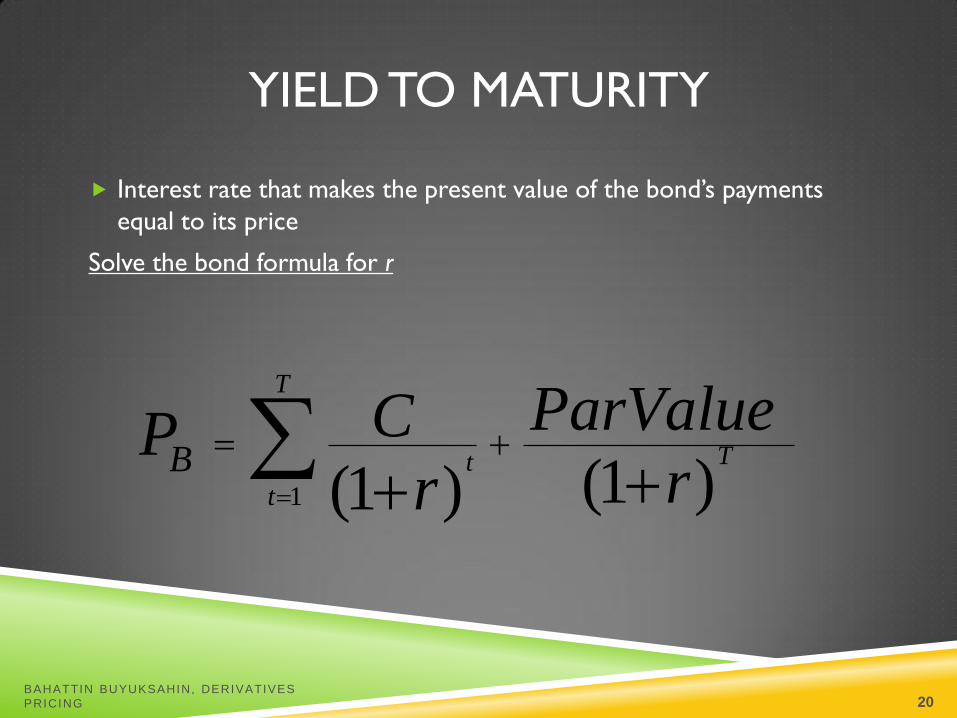
YIELD TO MATURITY
Interest rate that makes the present value of the bond’s payments
equal to its price
Solve the bond formula for r
1 (1 )(1 )
T
Tt
t
BParValueCP
rr
BAHATTIN BUYUKSAHIN, DERIVATIVES
PRICING 20
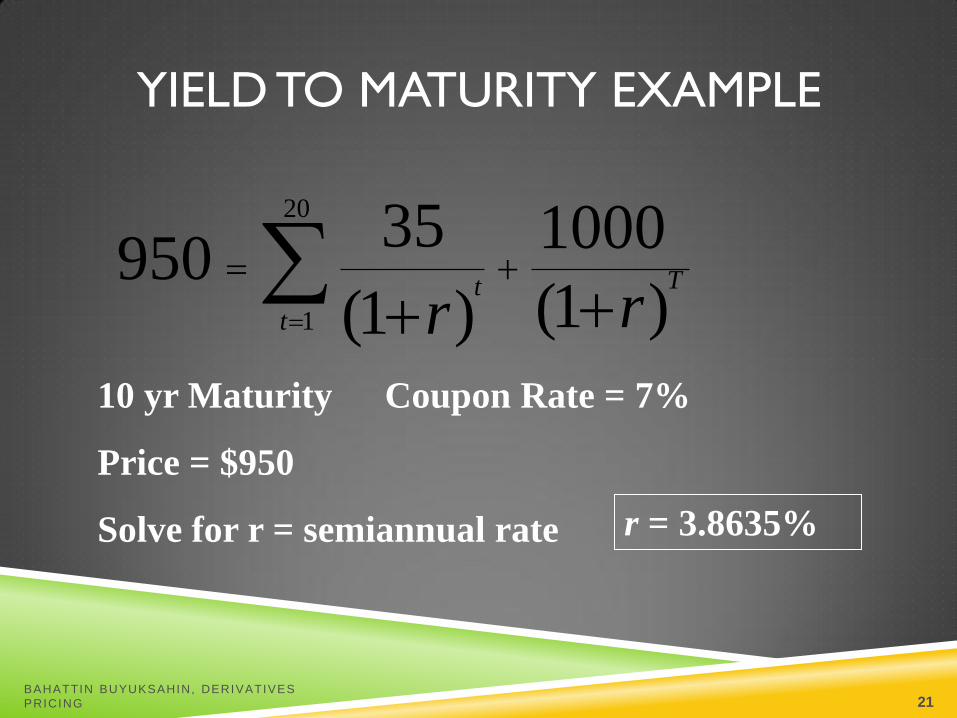
YIELD TO MATURITY EXAMPLE
)1(
1000
)1(
35950
20
1 rrT
t
t
10 yr Maturity Coupon Rate = 7%
Price = $950
Solve for r = semiannual rate r = 3.8635%
BAHATTIN BUYUKSAHIN, DERIVATIVES
PRICING 21
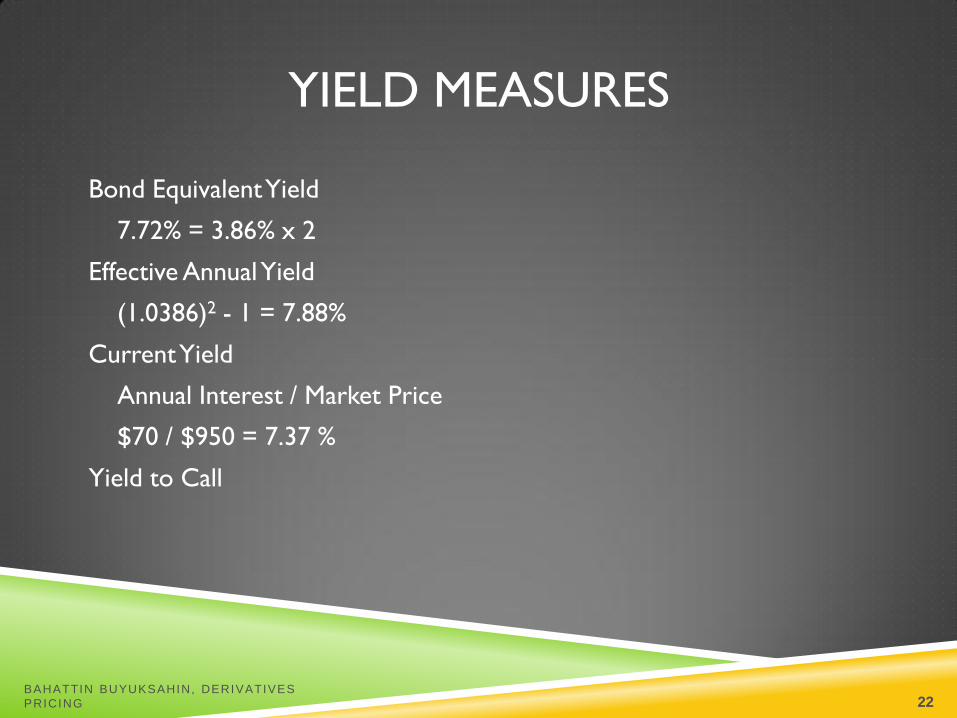
YIELD MEASURES
Bond Equivalent Yield
7.72% = 3.86% x 2
Effective Annual Yield
(1.0386)2 - 1 = 7.88%
Current Yield
Annual Interest / Market Price
$70 / $950 = 7.37 %
Yield to Call
BAHATTIN BUYUKSAHIN, DERIVATIVES
PRICING 22
PURE DISCOUNT BONDS (ZERO-
COUPON BONDS)
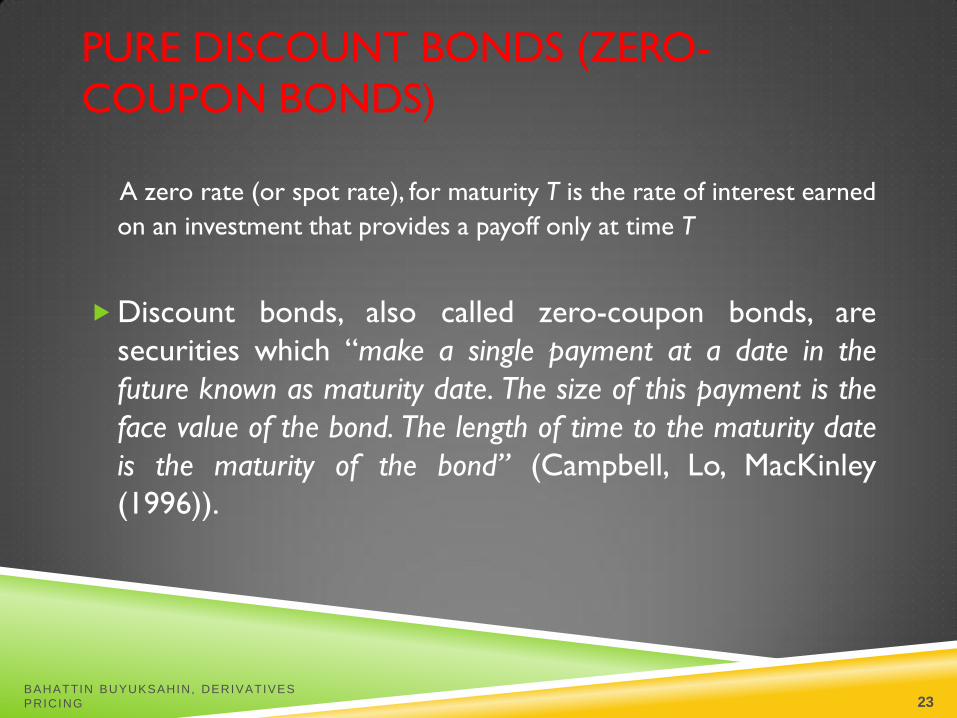
A zero rate (or spot rate), for maturity T is the rate of interest earned
on an investment that provides a payoff only at time T
Discount bonds, also called zero-coupon bonds, are
securities which “make a single payment at a date in the
future known as maturity date. The size of this payment is the
face value of the bond. The length of time to the maturity date
is the maturity of the bond” (Campbell, Lo, MacKinley
(1996)).
BAHATTIN BUYUKSAHIN, DERIVATIVES
PRICING 23

PURE DISCOUNT BOND
The promised cash payment on a pure discount bond is called its face
value or par value. Yield (interest rate) on a pure discount bond is the
annualized rate of return to investors who buy it and hold it until it
matures.
BAHATTIN BUYUKSAHIN, DERIVATIVES
PRICING 24
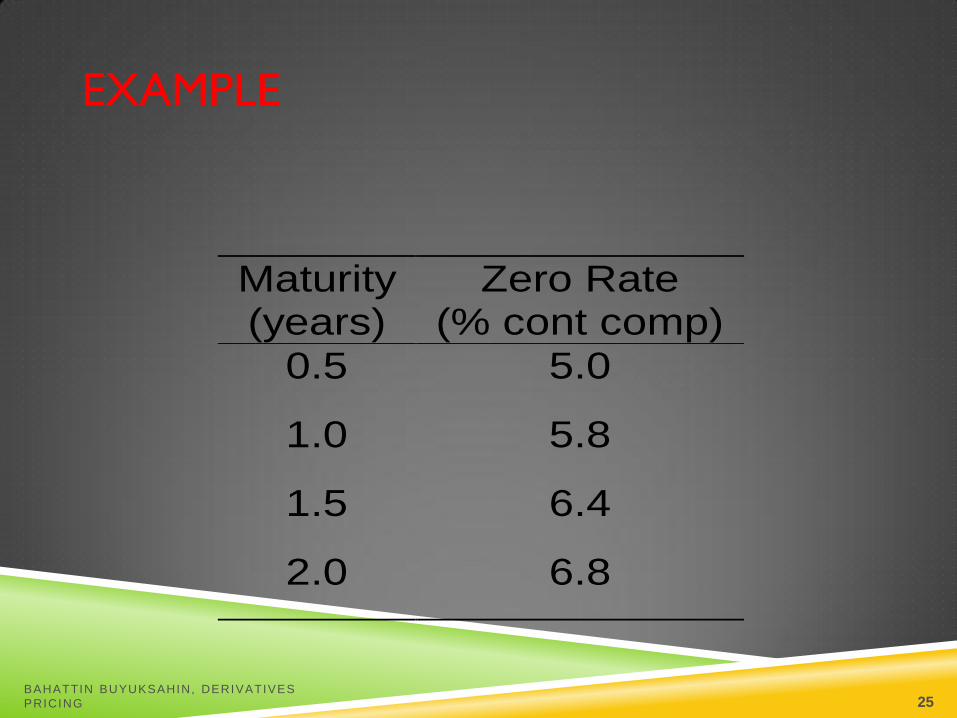
EXAMPLE
Maturity(years)
Zero Rate(% cont comp)
0.5 5.0
1.0 5.8
1.5 6.4
2.0 6.8
BAHATTIN BUYUKSAHIN, DERIVATIVES
PRICING 25

BOND PRICING
To calculate the cash price of a bond we discount
each cash flow at the appropriate zero rate
The theoretical price of a two-year bond
providing a 6% coupon semiannually is
3 3 3
103 98 39
0 05 0 5 0 058 1 0 0 064 1 5
0 068 2 0
e e e
e
. . . . . .
. . .
BAHATTIN BUYUKSAHIN, DERIVATIVES
PRICING 26

BOND YIELD
The bond yield is the discount rate that makes the present value of the cash flows on the bond equal to the market price of the bond
Suppose that the market price of the bond in our example equals its theoretical price of 98.39
The bond yield is given by solving
to get y = 0.0676 or 6.76%.
3 3 3 103 98 390 5 1 0 1 5 2 0e e e ey y y y . . . . .
BAHATTIN BUYUKSAHIN, DERIVATIVES
PRICING 27

PAR YIELD
The par yield for a certain maturity is the coupon
rate that causes the bond price to equal its face
value.
In our example we solve
g)compoundin s.a.(with 876get to
1002
100
222
0.2068.0
5.1064.00.1058.05.005.0
.c=
ec
ec
ec
ec
BAHATTIN BUYUKSAHIN, DERIVATIVES
PRICING 28
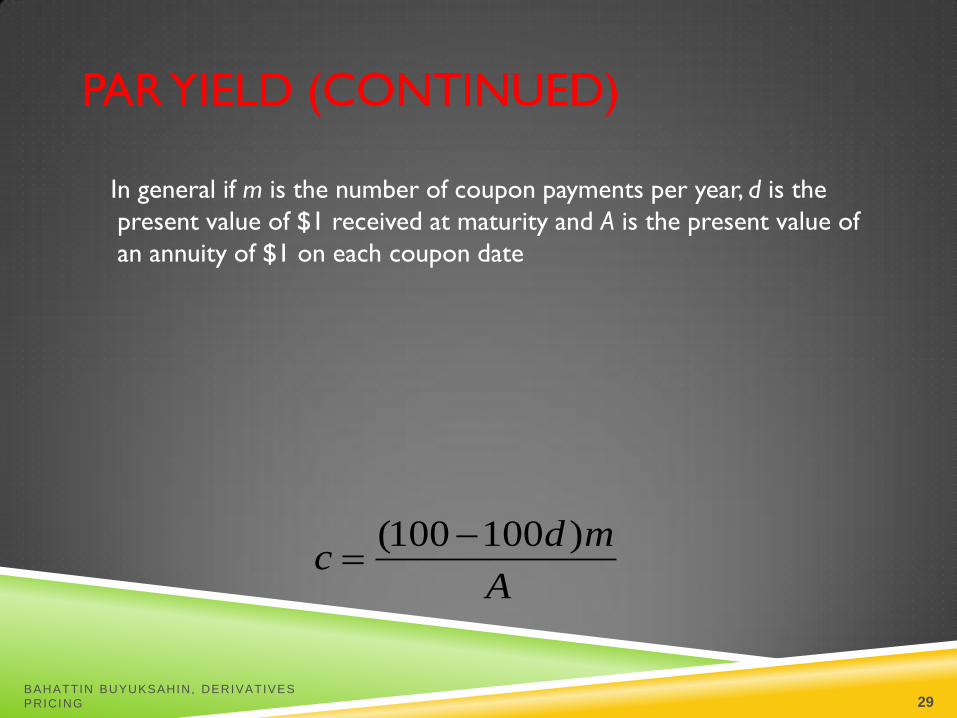
PAR YIELD (CONTINUED)
In general if m is the number of coupon payments per year, d is the
present value of $1 received at maturity and A is the present value of
an annuity of $1 on each coupon date
A
mdc
)100100(
BAHATTIN BUYUKSAHIN, DERIVATIVES
PRICING 29
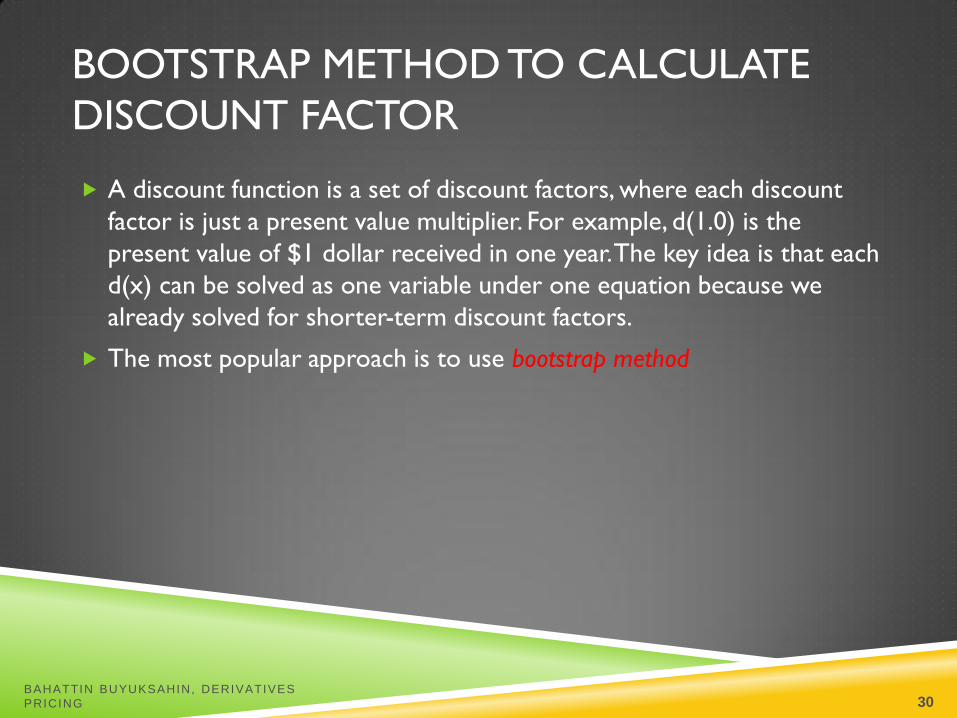
BOOTSTRAP METHOD TO CALCULATE
DISCOUNT FACTOR
A discount function is a set of discount factors, where each discount
factor is just a present value multiplier. For example, d(1.0) is the
present value of $1 dollar received in one year. The key idea is that each
d(x) can be solved as one variable under one equation because we
already solved for shorter-term discount factors.
The most popular approach is to use bootstrap method
BAHATTIN BUYUKSAHIN, DERIVATIVES
PRICING 30

BOOTSTRAP : EXAMPLE
Face (par) value $1,000
Years to Maturity 0.5 1 1.5 2 2.5 3
Bond Price $980 $990 $990 $980 $970 $960
Coupon Rate 0.00% 4.00% 5.00% 5.00% 5.00% 6.00%
Discount function 0.9800 0.9514 0.9187 0.8866 0.8552 0.7983
FV Cash Flows
Years 0.5 $1,000 $20 $25 $25 $25 $30
DF 0.9800 0.9800 0.9800 0.9800 0.9800 0.9800
1 $1,020 $25 $25 $25 $30
DF 0.9514 0.9514 0.9514 0.9514 0.9514
1.5 $1,025 $25 $25 $30
DF 0.9187 0.9187 0.9187 0.9187
2 $1,025 $25 $30
DF 0.8866 0.8866 0.8866
2.5 $1,025 $30
DF 0.8552 0.8552
3 $1,030
0.7983
d(.5) is present value of $1 in six month
d(1) is present value of $1 in one year
$980=d(.5)*($1000 in six month)
BAHATTIN BUYUKSAHIN, DERIVATIVES
PRICING 31

DISCOUNT FACTOR
0.6000
0.6500
0.7000
0.7500
0.8000
0.8500
0.9000
0.9500
1.0000
1 2 3 4 5 6 7
D
i
s
c
o
u
n
t
F
a
c
t
o
r
Years to Maturity
Discount function
as a set of discount factor
Discount function
BAHATTIN BUYUKSAHIN, DERIVATIVES
PRICING 32

DETERMINING TREASURY ZERO
RATES
Face (par) value $1,000
Years to Maturity 0.25 0.5 1 1.5 2
Bond Price $975 $949 $900 $960 $1,016
Coupon Rate 0.00% 0.00% 0.00% 8.00% 12.00%
Discount function 0.9750 0.9490 0.9000 0.8520 0.8056
Zero Rates 10.127% 10.469% 10.536% 10.681% 10.808%
FV Cash Flows
Years 0.25 $1,000 $0 $0 $0 $0
DF 0.9750 0.9800 0.9800 0.9800 0.9800
0.5 $1,000 $0 $40 $60
DF 0.9490 0.9490 0.9490 0.9490
1 $1,000 $40 $60
DF 0.9000 0.9000 0.9000
1.5 $1,040 $60
DF 0.8520 0.8520
2 $1,060
DF 0.8056
BAHATTIN BUYUKSAHIN, DERIVATIVES
PRICING 33

TREASURY ZERO RATE CURVE
9.6%
9.8%
10.0%
10.2%
10.4%
10.6%
10.8%
11.0%
1 2 3 4 5
I
n
t
e
r
e
s
t
R
a
t
e
Maturity (years)
Zero Rates given by the bootstrap method
Zero Rates
BAHATTIN BUYUKSAHIN, DERIVATIVES
PRICING 34

FIGURE 14.4 BOND PRICES: CALLABLE AND
STRAIGHT DEBT
BAHATTIN BUYUKSAHIN, DERIVATIVES
PRICING 35

EXAMPLE 14.4 YIELD TO CALL
BAHATTIN BUYUKSAHIN, DERIVATIVES
PRICING 36

REALIZED YIELD VERSUS YTM
Reinvestment Assumptions
Holding Period Return
Changes in rates affect returns
Reinvestment of coupon payments
Change in price of the bond
BAHATTIN BUYUKSAHIN, DERIVATIVES
PRICING 37
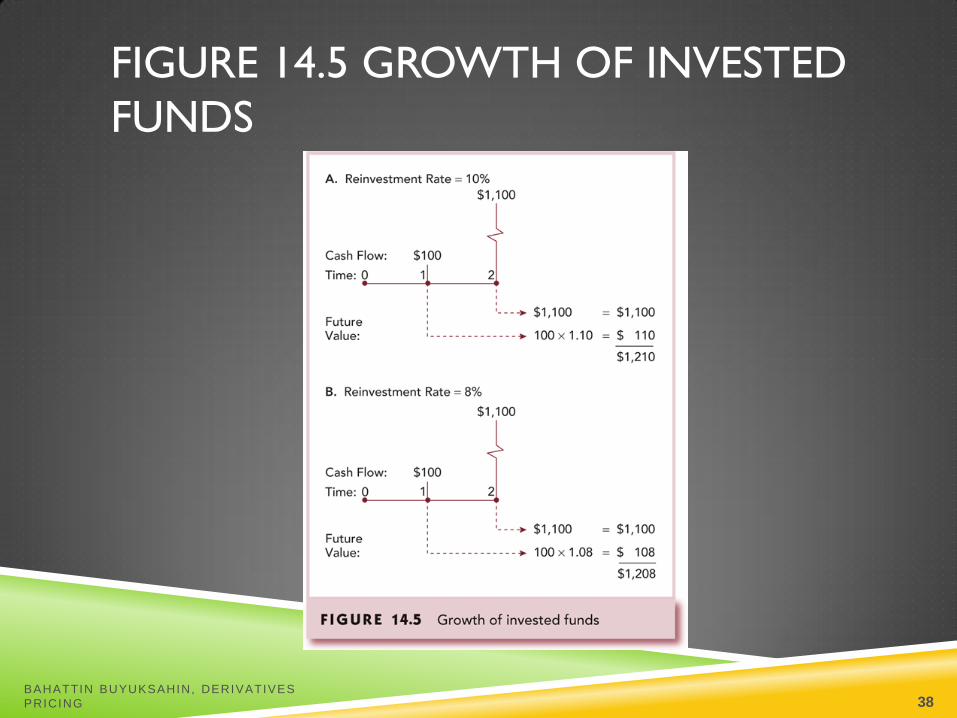
FIGURE 14.5 GROWTH OF INVESTED
FUNDS
BAHATTIN BUYUKSAHIN, DERIVATIVES
PRICING 38

FIGURE 14.6 PRICES OVER TIME OF 30-YEAR MATURITY, 6.5%
COUPON BONDS
BAHATTIN BUYUKSAHIN, DERIVATIVES
PRICING 39
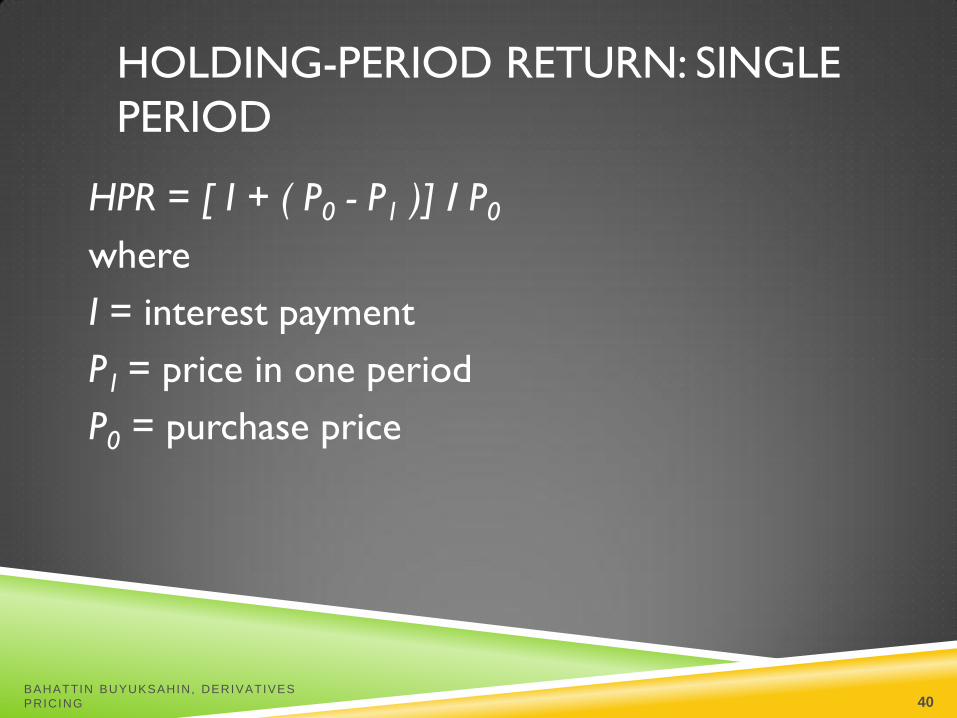
HOLDING-PERIOD RETURN: SINGLE
PERIOD
HPR = [ I + ( P0 - P1 )] / P0
where
I = interest payment
P1 = price in one period
P0 = purchase price
BAHATTIN BUYUKSAHIN, DERIVATIVES
PRICING 40
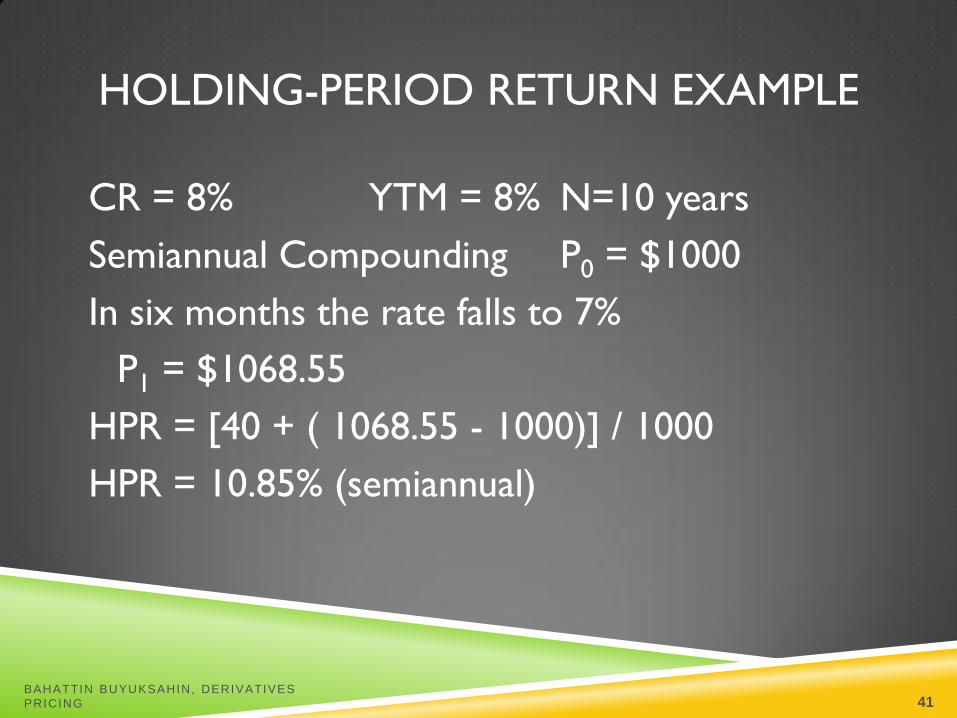
HOLDING-PERIOD RETURN EXAMPLE
CR = 8% YTM = 8% N=10 years
Semiannual Compounding P0 = $1000
In six months the rate falls to 7%
P1 = $1068.55
HPR = [40 + ( 1068.55 - 1000)] / 1000
HPR = 10.85% (semiannual)
BAHATTIN BUYUKSAHIN, DERIVATIVES
PRICING 41

FIGURE 14.7 THE PRICE OF A 30-YEAR ZERO-COUPON BOND OVER TIME
AT A YIELD TO MATURITY OF 10%
BAHATTIN BUYUKSAHIN, DERIVATIVES
PRICING 42

DEFAULT RISK AND RATINGS
Rating companies Moody’s Investor Service
Standard & Poor’s
Fitch
Rating Categories Investment grade
Speculative grade/Junk Bonds
BAHATTIN BUYUKSAHIN, DERIVATIVES
PRICING 43
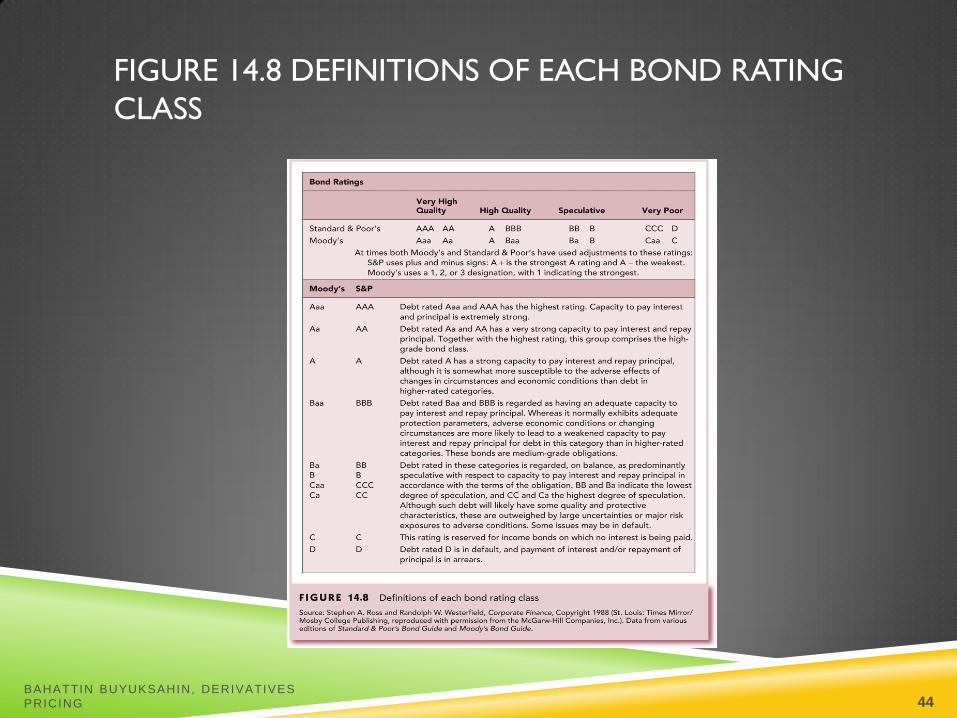
FIGURE 14.8 DEFINITIONS OF EACH BOND RATING
CLASS
BAHATTIN BUYUKSAHIN, DERIVATIVES
PRICING 44
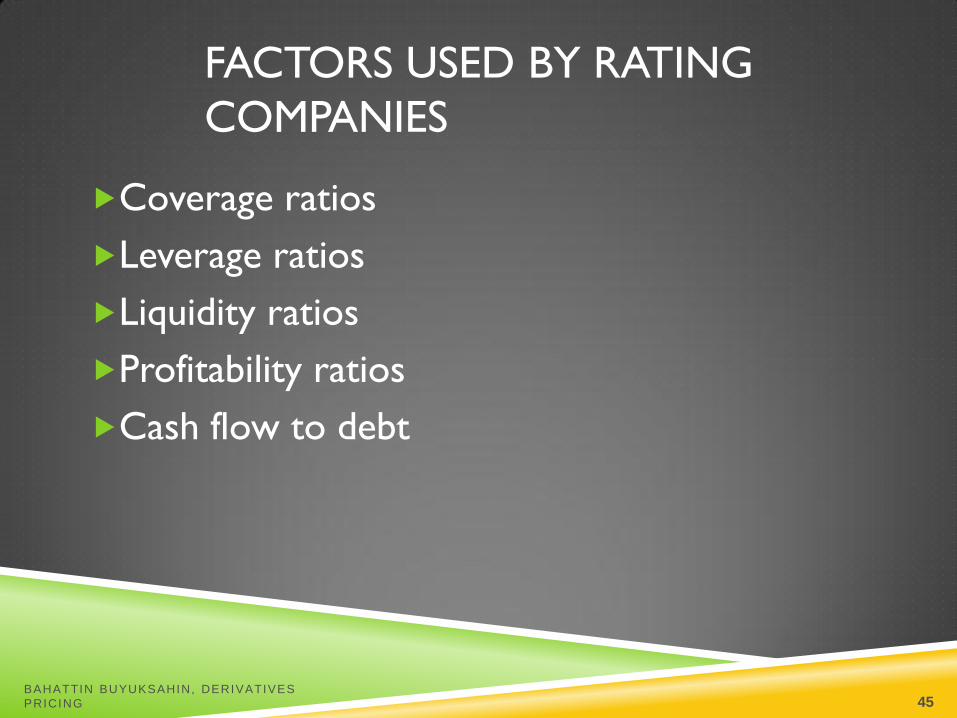
FACTORS USED BY RATING
COMPANIES
Coverage ratios
Leverage ratios
Liquidity ratios
Profitability ratios
Cash flow to debt
BAHATTIN BUYUKSAHIN, DERIVATIVES
PRICING 45
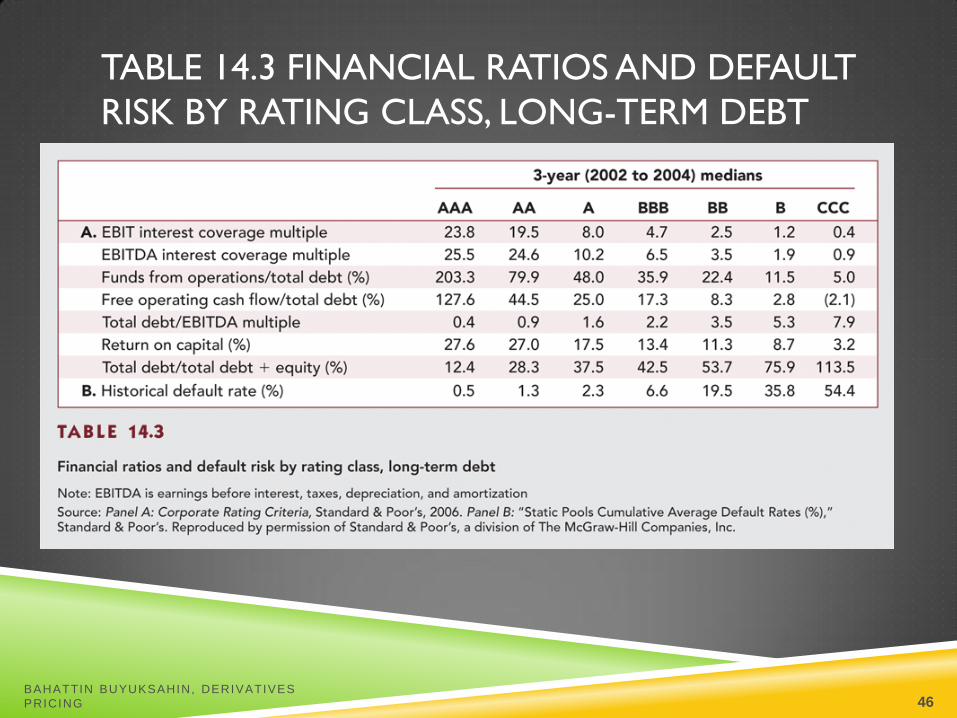
TABLE 14.3 FINANCIAL RATIOS AND DEFAULT
RISK BY RATING CLASS, LONG-TERM DEBT
BAHATTIN BUYUKSAHIN, DERIVATIVES
PRICING 46

FIGURE 14.9 DISCRIMINANT ANALYSIS
BAHATTIN BUYUKSAHIN, DERIVATIVES
PRICING 47

PROTECTION AGAINST DEFAULT
Sinking funds
Subordination of future debt
Dividend restrictions
Collateral
BAHATTIN BUYUKSAHIN, DERIVATIVES
PRICING 48

FIGURE 14.10 CALLABLE BOND ISSUED
BY MOBIL
BAHATTIN BUYUKSAHIN, DERIVATIVES
PRICING 49

DEFAULT RISK AND YIELD
Risk structure of interest rates
Default premiums
Yields compared to ratings
Yield spreads over business cycles
BAHATTIN BUYUKSAHIN, DERIVATIVES
PRICING 50

FIGURE 14.11 YIELDS ON LONG-TERM
BONDS, 1954 – 2006
BAHATTIN BUYUKSAHIN, DERIVATIVES
PRICING 51
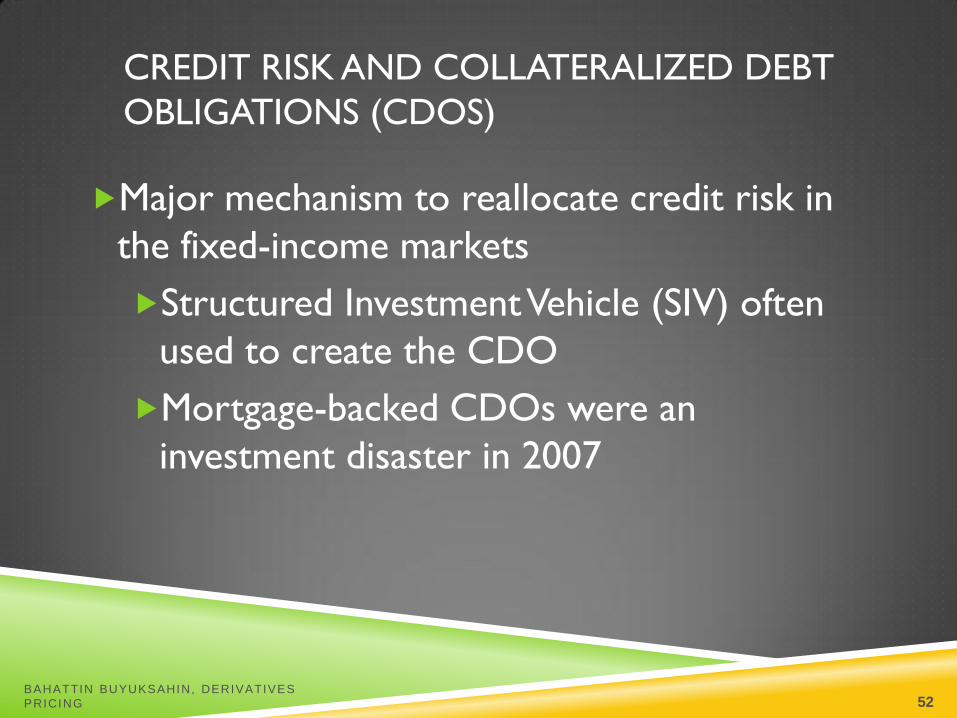
CREDIT RISK AND COLLATERALIZED DEBT
OBLIGATIONS (CDOS)
Major mechanism to reallocate credit risk in
the fixed-income markets
Structured Investment Vehicle (SIV) often
used to create the CDO
Mortgage-backed CDOs were an
investment disaster in 2007
BAHATTIN BUYUKSAHIN, DERIVATIVES
PRICING 52

FIGURE 14.12 COLLATERALIZED DEBT
OBLIGATIONS
BAHATTIN BUYUKSAHIN, DERIVATIVES
PRICING 53

CHAPTER 15
The Term Structure of Interest Rates
BAHATTIN BUYUKSAHIN, DERIVATIVES
PRICING 54

OVERVIEW OF TERM STRUCTURE
Information on expected future short term
rates can be implied from the yield curve
The yield curve is a graph that displays the
relationship between yield and maturity
Three major theories are proposed to explain
the observed yield curve
BAHATTIN BUYUKSAHIN, DERIVATIVES
PRICING 55

FIGURE 15.1 TREASURY YIELD CURVES
BAHATTIN BUYUKSAHIN, DERIVATIVES
PRICING 56

BOND PRICING
Yields on different maturity bonds are not all
equal
Need to consider each bond cash flow as a
stand-alone zero-coupon bond when valuing
coupon bonds
BAHATTIN BUYUKSAHIN, DERIVATIVES
PRICING 57
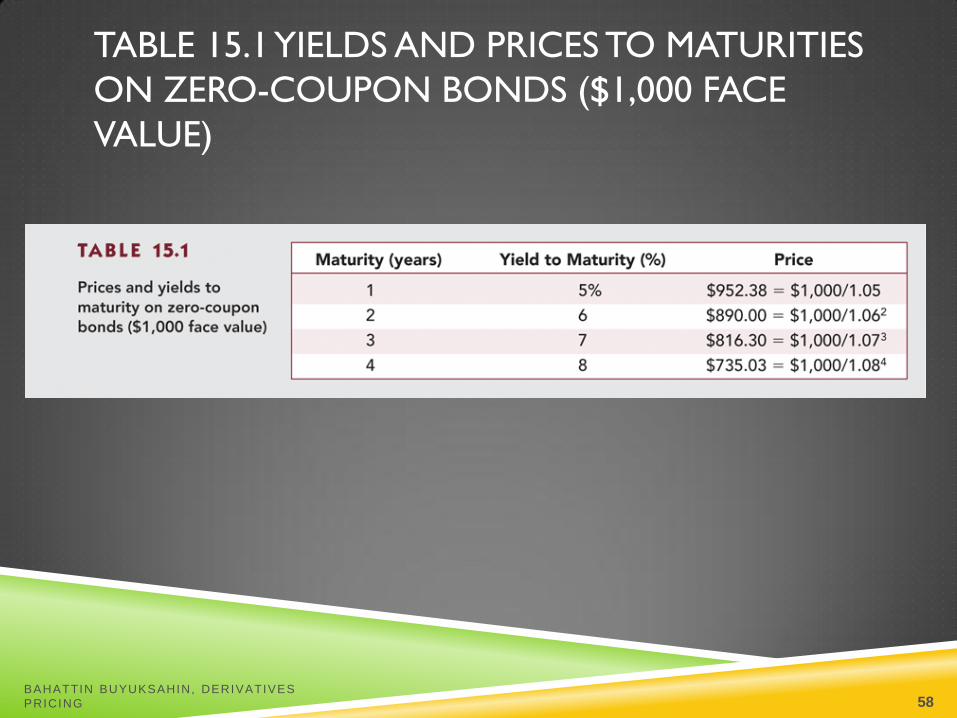
TABLE 15.1 YIELDS AND PRICES TO MATURITIES
ON ZERO-COUPON BONDS ($1,000 FACE
VALUE)
BAHATTIN BUYUKSAHIN, DERIVATIVES
PRICING 58

YIELD CURVE UNDER CERTAINTY
An upward sloping yield curve is evidence that short-term rates are going to be higher next year
When next year’s short rate is greater than this year’s short rate, the average of the two rates is higher than today’s rate
2
2 1 2
1
22 1 2
(1 ) (1 ) (1 )
1 (1 ) (1 )
y r x r
y r x r
BAHATTIN BUYUKSAHIN, DERIVATIVES
PRICING 59

FIGURE 15.2 TWO 2-YEAR INVESTMENT
PROGRAMS
BAHATTIN BUYUKSAHIN, DERIVATIVES
PRICING 60

FIGURE 15.3 SHORT RATES VERSUS
SPOT RATES
BAHATTIN BUYUKSAHIN, DERIVATIVES
PRICING 61
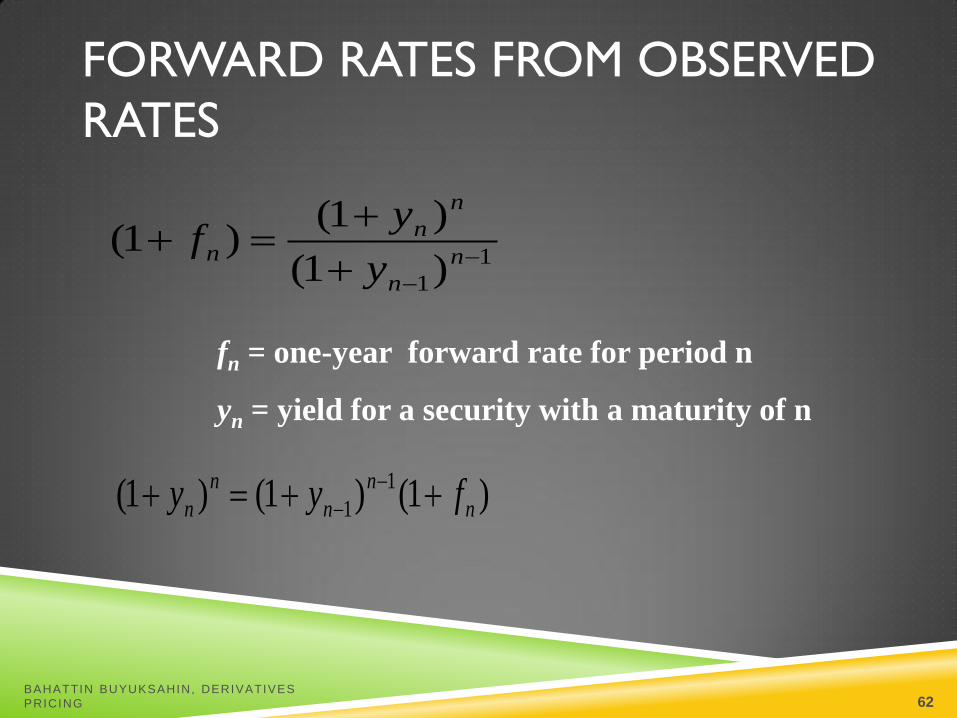
1
1)1(
)1()1(
n
n
n
nn
y
yf
fn = one-year forward rate for period n
yn = yield for a security with a maturity of n
)1()1()1( 1
1 n
n
n
n
n fyy
FORWARD RATES FROM OBSERVED
RATES
BAHATTIN BUYUKSAHIN, DERIVATIVES
PRICING 62

EXAMPLE 15.4 FORWARD RATES
4 yr = 8.00% 3yr = 7.00% fn = ?
(1.08)4 = (1.07)3 (1+fn)
(1.3605) / (1.2250) = (1+fn)
fn = .1106 or 11.06%
BAHATTIN BUYUKSAHIN, DERIVATIVES
PRICING 63
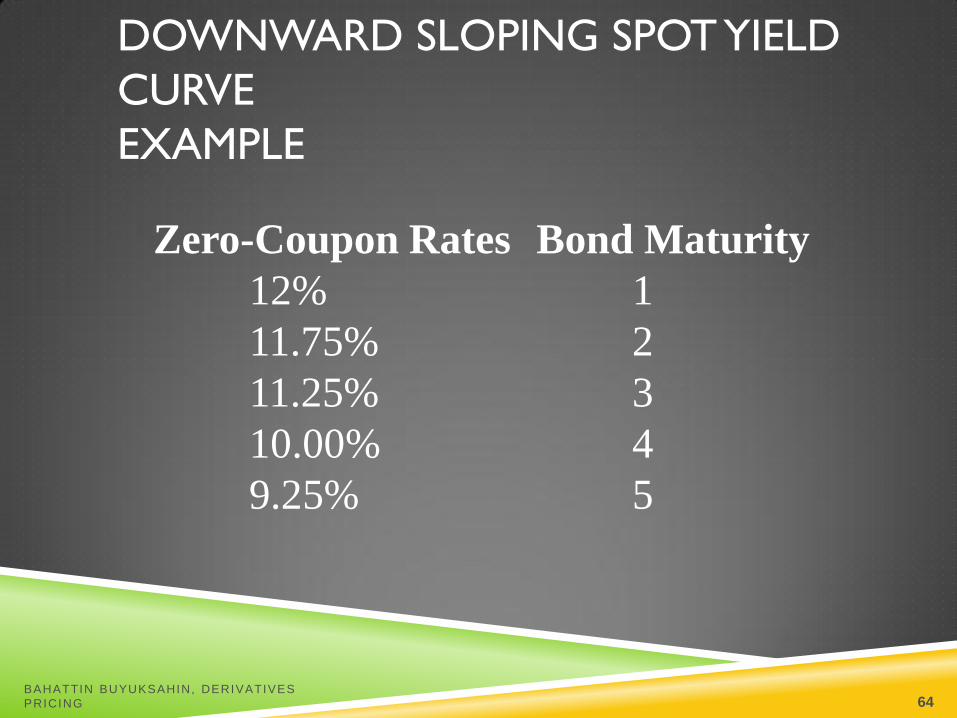
DOWNWARD SLOPING SPOT YIELD
CURVE
EXAMPLE
Zero-Coupon Rates Bond Maturity
12% 1
11.75% 2
11.25% 3
10.00% 4
9.25% 5
BAHATTIN BUYUKSAHIN, DERIVATIVES
PRICING 64

FORWARD RATES FOR DOWNWARD SLOPING
Y C EXAMPLE
1yr Forward Rates
1yr [(1.1175)2 / 1.12] - 1 = 0.115006
2yrs [(1.1125)3 / (1.1175)2] - 1 = 0.102567
3yrs [(1.1)4 / (1.1125)3] - 1 = 0.063336
4yrs [(1.0925)5 / (1.1)4] - 1 = 0.063008
BAHATTIN BUYUKSAHIN, DERIVATIVES
PRICING 65
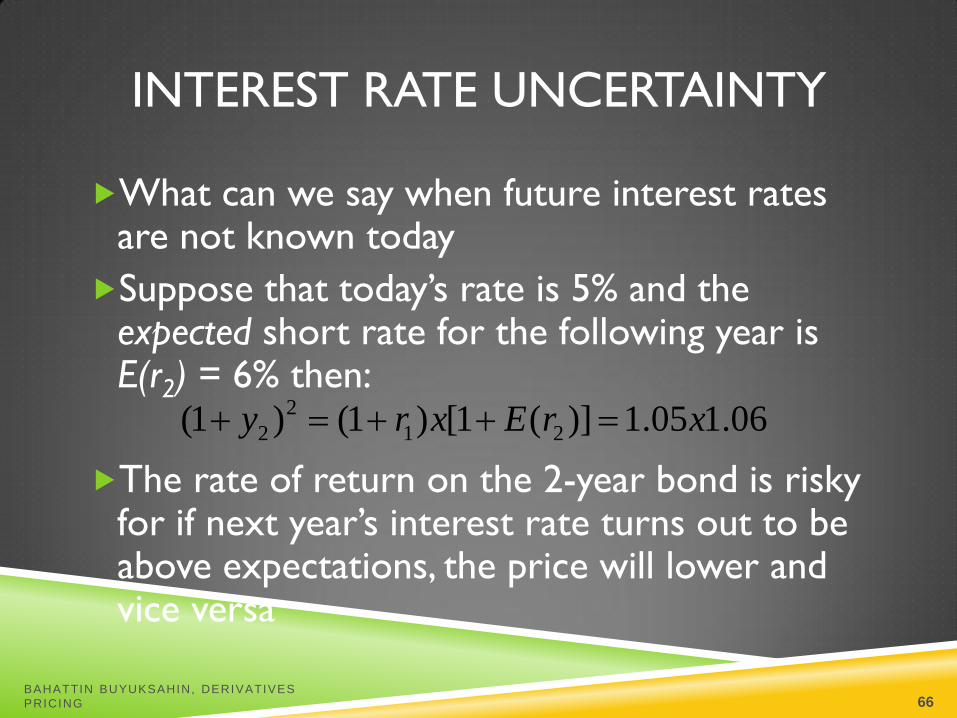
INTEREST RATE UNCERTAINTY
What can we say when future interest rates are not known today
Suppose that today’s rate is 5% and the expected short rate for the following year is E(r2) = 6% then:
The rate of return on the 2-year bond is risky for if next year’s interest rate turns out to be above expectations, the price will lower and vice versa
2
2 1 2(1 ) (1 ) [1 ( )] 1.05 1.06y r x E r x
BAHATTIN BUYUKSAHIN, DERIVATIVES
PRICING 66
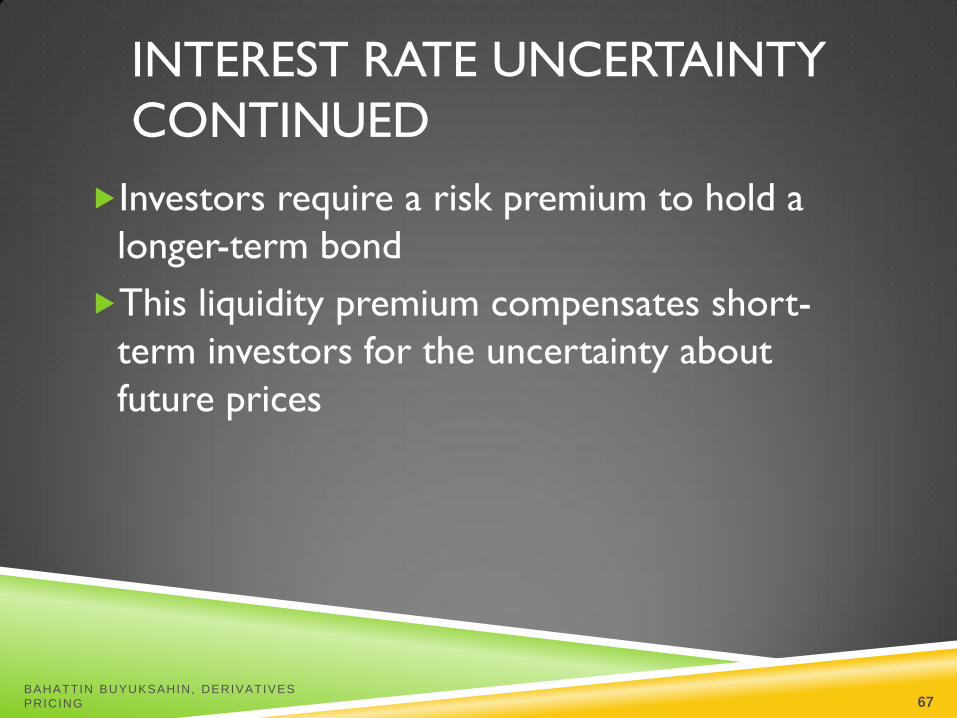
INTEREST RATE UNCERTAINTY
CONTINUED
Investors require a risk premium to hold a
longer-term bond
This liquidity premium compensates short-
term investors for the uncertainty about
future prices
BAHATTIN BUYUKSAHIN, DERIVATIVES
PRICING 67

TERM STRUCTURE OF INTEREST RATES
The term structure of interest rates (or yield curve) is the relationship of
the yield to maturity against bond term (maturity).
Typical shapes are: increasing (normal), decreasing, humped and flat.
Yield
Maturity
BAHATTIN BUYUKSAHIN, DERIVATIVES
PRICING 68

UPWARD VS DOWNWARD SLOPING
YIELD CURVE
For an upward sloping yield curve:
Fwd Rate > Zero Rate > Par Yield
For a downward sloping yield curve
Par Yield > Zero Rate > Fwd Rate
BAHATTIN BUYUKSAHIN, DERIVATIVES
PRICING 69

THEORIES OF THE TERM STRUCTURE
A number of theory have been proposed: Expectation
Hypothesis, Liquidity Preference Theory, Preferred Habitats
Theory, Segmentation Hypothesis.
Fabozzi (1998): Pure Expectation Hypothesis, Liquidity
Preference Theory, Preferred Habitats Theory are different
forms of the expectation theory ==> two major theories:
expectation theory and market segmentation theory.
BAHATTIN BUYUKSAHIN, DERIVATIVES
PRICING 70

THEORIES OF THE TERM STRUCTURE OF INTEREST
RATES (1)
The Pure Expectation Hypothesis: Implied forward rates are unbiased expectations of future spot rates ==> a rising term structure indicate that market expects short-term rates to rise in the future; a flat term structure reflects expectations that the future short term structure will be constant; and so on; Hicks (1937). Problems: It neglects the risks inherent in investing in bonds: if forward rates were perfect predictors of future interest rates then the future prices of bonds will be known with certainty.
The Liquidity Preference Theory (Keynes): Given that there is uncertainty, long bonds should have higher returns than short bonds ==> we should expect a risk premium arising out from investors liquidity preferences. It is consistent with the empirical results that yield curves are upward sloping ==> positive risk premium.
BAHATTIN BUYUKSAHIN, DERIVATIVES
PRICING 71

THEORIES OF THE TERM STRUCTURE OF INTEREST
RATES (2)
The Preferred Habitat Theory: It adopts the view that the term structure is
composed by two components: Expectations plus risk premium (=
liquidity preference theory). However, the risk premium might be
negative as well as positive to induce market participants to shift out of
their preferred habitat (Modigliani & Sutch (1966)).
The Segmentation Hypothesis (Culbertson (1957)): It also recognises that
investors have preferred habitat (= preferred habitat theory) ==>
individuals have strong maturity preferences ==> there need be no
relationship between bonds with different maturities ==> bonds with
different maturities are traded in different markets.
BAHATTIN BUYUKSAHIN, DERIVATIVES
PRICING 72

EXPECTATIONS THEORY
Observed long-term rate is a function of
today’s short-term rate and expected future
short-term rates
Long-term and short-term securities are
perfect substitutes
Forward rates that are calculated from the
yield on long-term securities are market
consensus expected future short-term rates
BAHATTIN BUYUKSAHIN, DERIVATIVES
PRICING 73
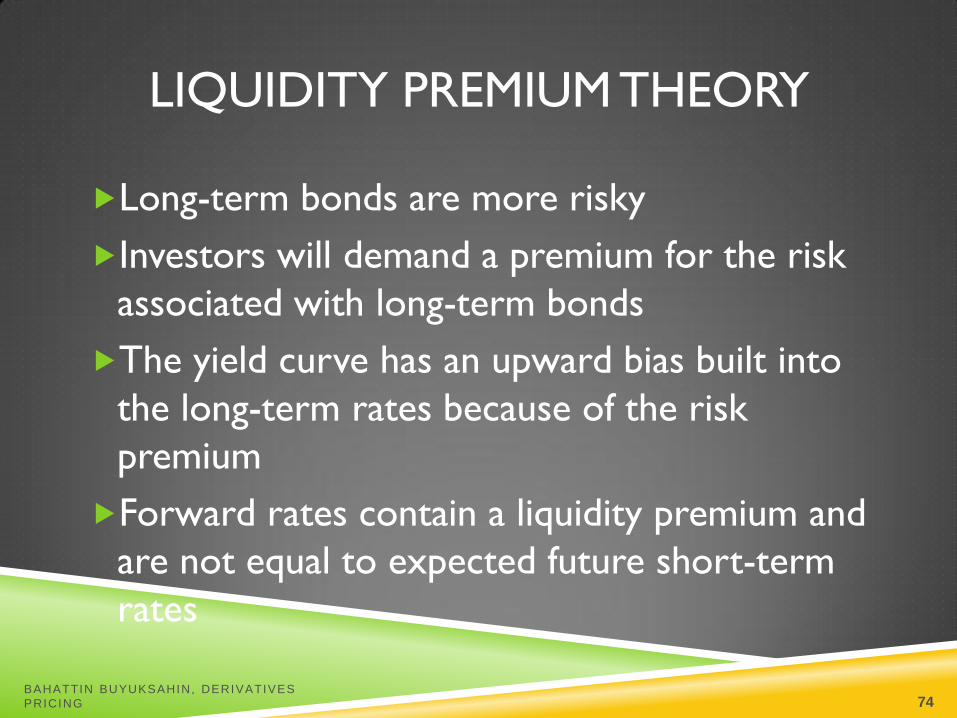
LIQUIDITY PREMIUM THEORY
Long-term bonds are more risky
Investors will demand a premium for the risk
associated with long-term bonds
The yield curve has an upward bias built into
the long-term rates because of the risk
premium
Forward rates contain a liquidity premium and
are not equal to expected future short-term
rates
BAHATTIN BUYUKSAHIN, DERIVATIVES
PRICING 74
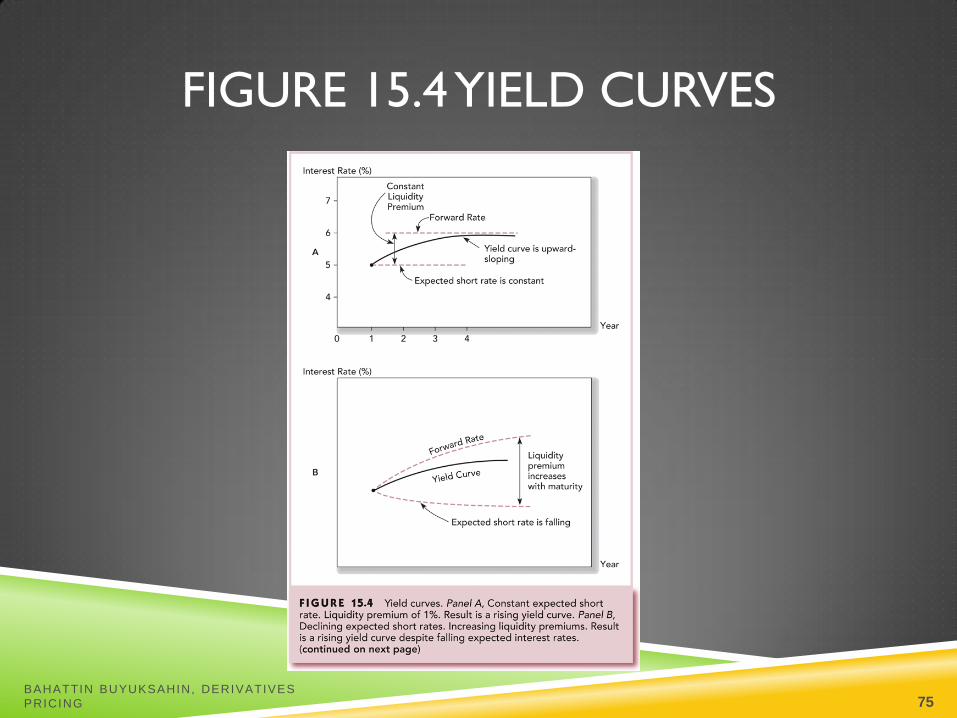
FIGURE 15.4 YIELD CURVES
BAHATTIN BUYUKSAHIN, DERIVATIVES
PRICING 75
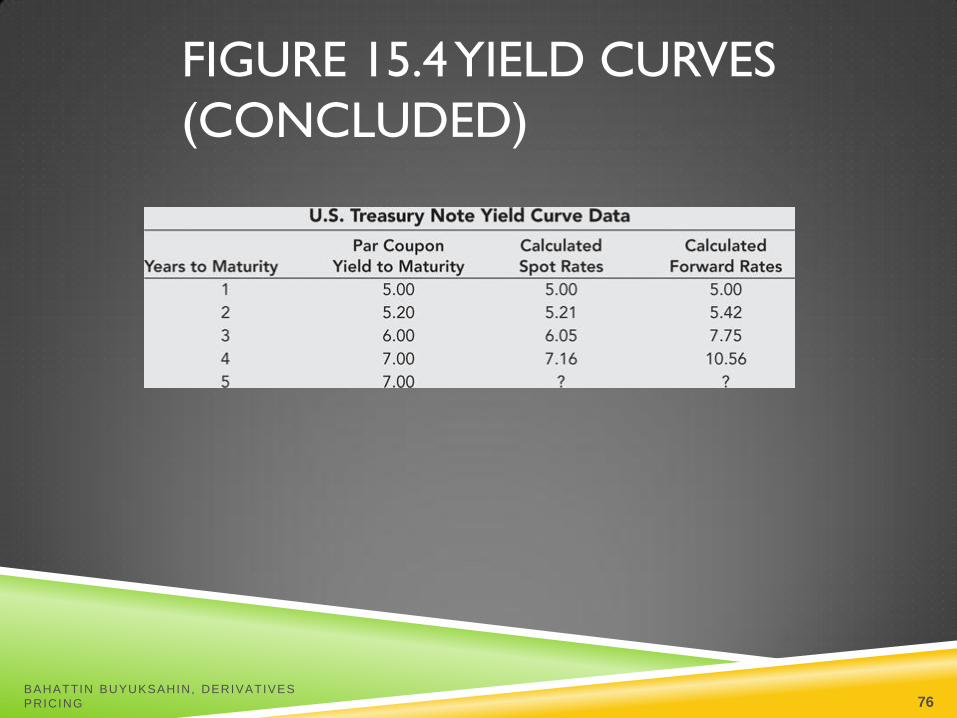
FIGURE 15.4 YIELD CURVES
(CONCLUDED)
BAHATTIN BUYUKSAHIN, DERIVATIVES
PRICING 76

INTERPRETING THE TERM
STRUCTURE
If the yield curve is to rise as one moves to
longer maturities
A longer maturity results in the inclusion of
a new forward rate that is higher than the
average of the previously observed rates
Reason:
Higher expectations for forward rates or
Liquidity premium
BAHATTIN BUYUKSAHIN, DERIVATIVES
PRICING 77

FIGURE 15.5 PRICE VOLATILITY OF LONG-TERM
TREASURY BONDS
BAHATTIN BUYUKSAHIN, DERIVATIVES
PRICING 78
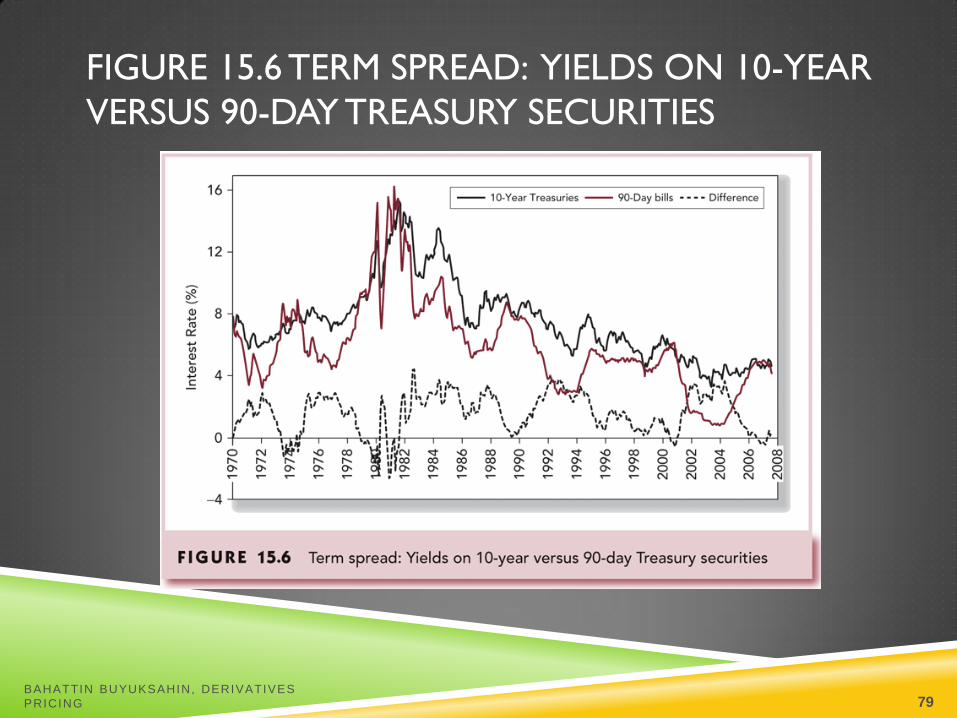
FIGURE 15.6 TERM SPREAD: YIELDS ON 10-YEAR
VERSUS 90-DAY TREASURY SECURITIES
BAHATTIN BUYUKSAHIN, DERIVATIVES
PRICING 79
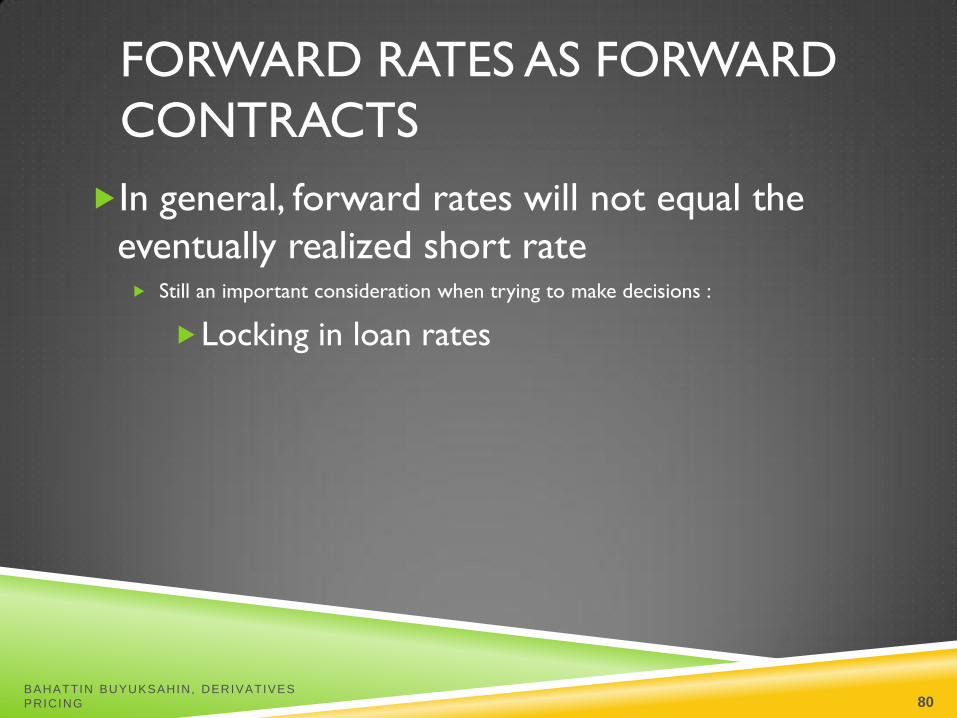
FORWARD RATES AS FORWARD
CONTRACTS
In general, forward rates will not equal the
eventually realized short rate Still an important consideration when trying to make decisions :
Locking in loan rates
BAHATTIN BUYUKSAHIN, DERIVATIVES
PRICING 80

FIGURE 15.7 ENGINEERING A SYNTHETIC
FORWARD LOAN
BAHATTIN BUYUKSAHIN, DERIVATIVES
PRICING 81

CHAPTER 16
Managing Bond Portfolios
BAHATTIN BUYUKSAHIN, DERIVATIVES
PRICING 82

BOND PRICING RELATIONSHIPS
Inverse relationship between price and yield
An increase in a bond’s yield to maturity
results in a smaller price decline than the gain
associated with a decrease in yield
Long-term bonds tend to be more price
sensitive than short-term bonds
BAHATTIN BUYUKSAHIN, DERIVATIVES
PRICING 83
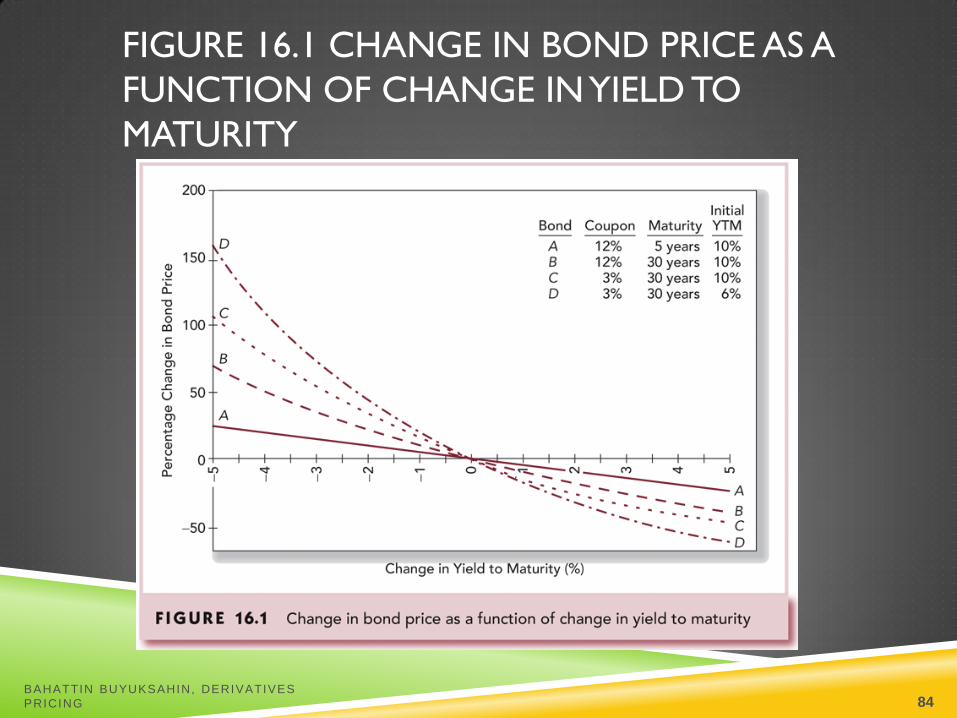
FIGURE 16.1 CHANGE IN BOND PRICE AS A
FUNCTION OF CHANGE IN YIELD TO
MATURITY
BAHATTIN BUYUKSAHIN, DERIVATIVES
PRICING 84

BOND PRICING RELATIONSHIPS
CONTINUED
As maturity increases, price sensitivity
increases at a decreasing rate
Price sensitivity is inversely related to a bond’s
coupon rate
Price sensitivity is inversely related to the yield
to maturity at which the bond is selling
BAHATTIN BUYUKSAHIN, DERIVATIVES
PRICING 85

TABLE 16.1 PRICES OF 8% COUPON BOND
(COUPONS PAID SEMIANNUALLY)
BAHATTIN BUYUKSAHIN, DERIVATIVES
PRICING 86
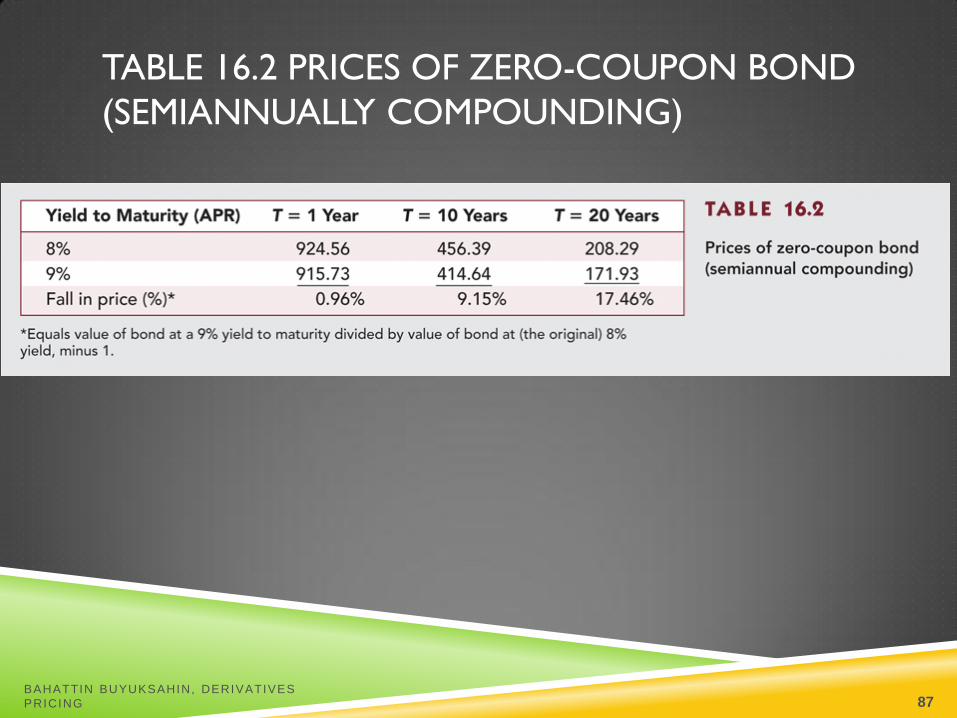
TABLE 16.2 PRICES OF ZERO-COUPON BOND
(SEMIANNUALLY COMPOUNDING)
BAHATTIN BUYUKSAHIN, DERIVATIVES
PRICING 87

DURATION
A measure of the effective maturity of a bond
The weighted average of the times until each
payment is received, with the weights
proportional to the present value of the
payment
Duration is shorter than maturity for all bonds
except zero coupon bonds
Duration is equal to maturity for zero coupon
bonds
BAHATTIN BUYUKSAHIN, DERIVATIVES
PRICING 88
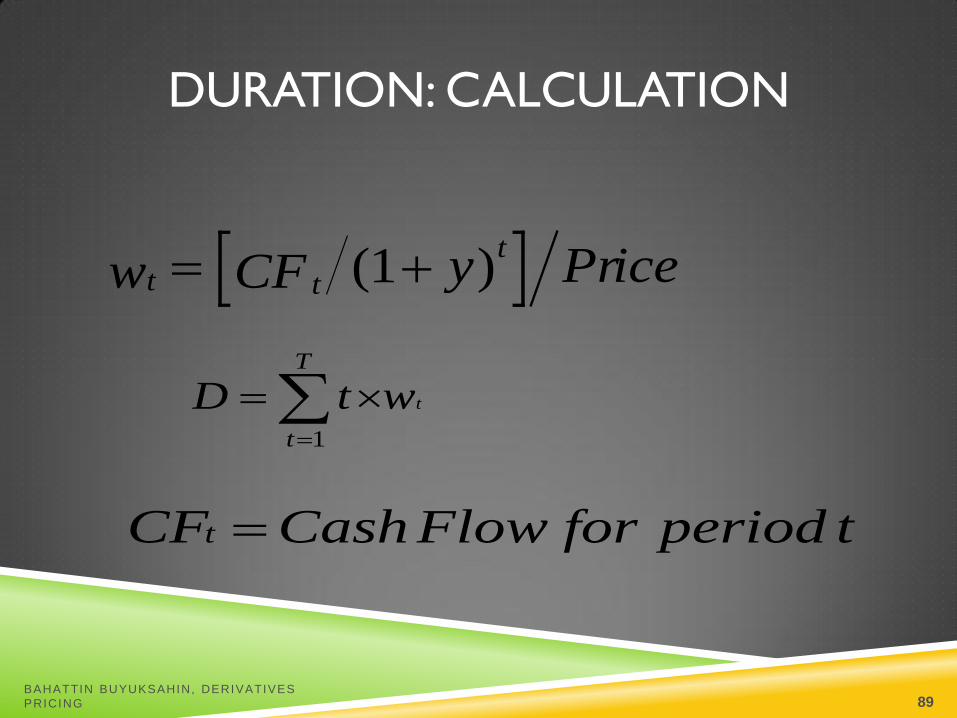
t t
tw CF y ice ( )1 Pr
twtDT
t
1
CF CashFlow for period tt
DURATION: CALCULATION
BAHATTIN BUYUKSAHIN, DERIVATIVES
PRICING 89
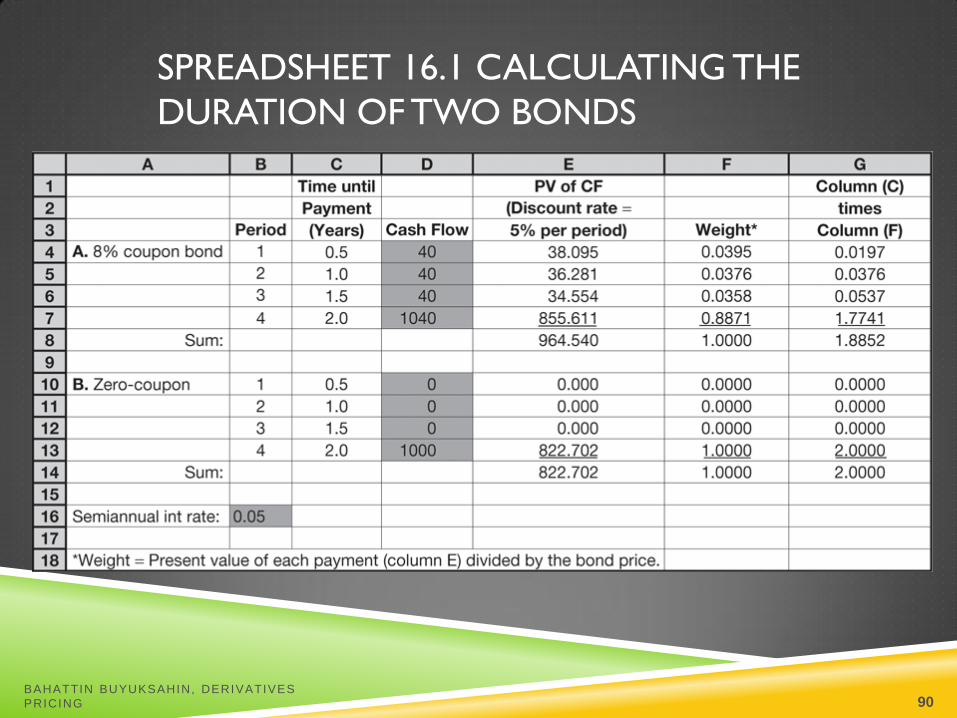
SPREADSHEET 16.1 CALCULATING THE
DURATION OF TWO BONDS
BAHATTIN BUYUKSAHIN, DERIVATIVES
PRICING 90

DURATION/PRICE RELATIONSHIP
Price change is proportional to duration and not
to maturity
D* = modified duration
(1 )
1
P yDx
P y
*P
D yP
BAHATTIN BUYUKSAHIN, DERIVATIVES
PRICING 91

RULES FOR DURATION
Rule 1 The duration of a zero-coupon bond equals its time to maturity
Rule 2 Holding maturity constant, a bond’s duration is higher when the coupon rate is lower
Rule 3 Holding the coupon rate constant, a bond’s duration generally increases with its time to maturity
Rule 4 Holding other factors constant, the duration of a coupon bond is higher when the bond’s yield to maturity is lower
Rules 5 The duration of a level perpetuity is equal to: (1+y) / y
BAHATTIN BUYUKSAHIN, DERIVATIVES
PRICING 92

FIGURE 16.2 BOND DURATION VERSUS
BOND MATURITY
BAHATTIN BUYUKSAHIN, DERIVATIVES
PRICING 93

TABLE 16.3 BOND DURATIONS (YIELD TO
MATURITY = 8% APR; SEMIANNUAL COUPONS)
BAHATTIN BUYUKSAHIN, DERIVATIVES
PRICING 94

CONVEXITY
The relationship between bond prices and
yields is not linear
Duration rule is a good approximation for
only small changes in bond yields
BAHATTIN BUYUKSAHIN, DERIVATIVES
PRICING 95

FIGURE 16.3 BOND PRICE CONVEXITY: 30-YEAR
MATURITY, 8% COUPON; INITIAL YIELD TO
MATURITY = 8%
BAHATTIN BUYUKSAHIN, DERIVATIVES
PRICING 96

CORRECTION FOR CONVEXITY
n
tt
t tty
CF
yPConvexity
1
2
2)(
)1()1(
1
Correction for Convexity:
21 [ ( ) ]2
PD y Convexity y
P
BAHATTIN BUYUKSAHIN, DERIVATIVES
PRICING 97

FIGURE 16.4 CONVEXITY OF TWO
BONDS
BAHATTIN BUYUKSAHIN, DERIVATIVES
PRICING 98
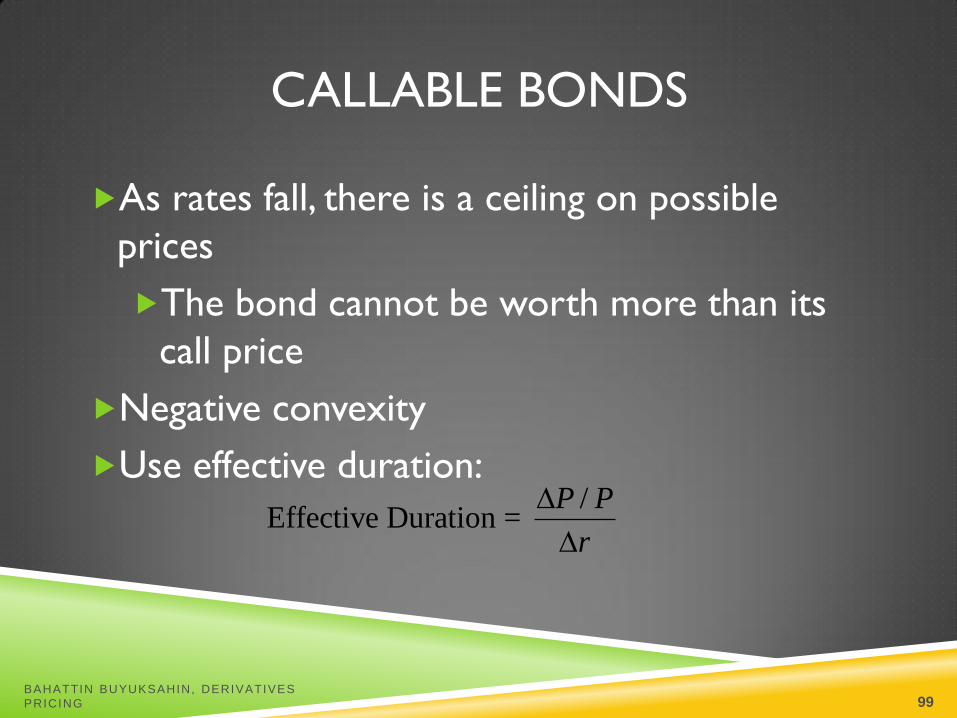
CALLABLE BONDS
As rates fall, there is a ceiling on possible
prices
The bond cannot be worth more than its
call price
Negative convexity
Use effective duration:
/
Effective Duration = P P
r
BAHATTIN BUYUKSAHIN, DERIVATIVES
PRICING 99

FIGURE 16.5 PRICE –YIELD CURVE FOR A
CALLABLE BOND
BAHATTIN BUYUKSAHIN, DERIVATIVES
PRICING 100

MORTGAGE-BACKED SECURITIES
Among the most successful examples of
financial engineering
Subject to negative convexity
Often sell for more than their principal
balance
Homeowners do not refinance their loans
as soon as interest rates drop
BAHATTIN BUYUKSAHIN, DERIVATIVES
PRICING 101
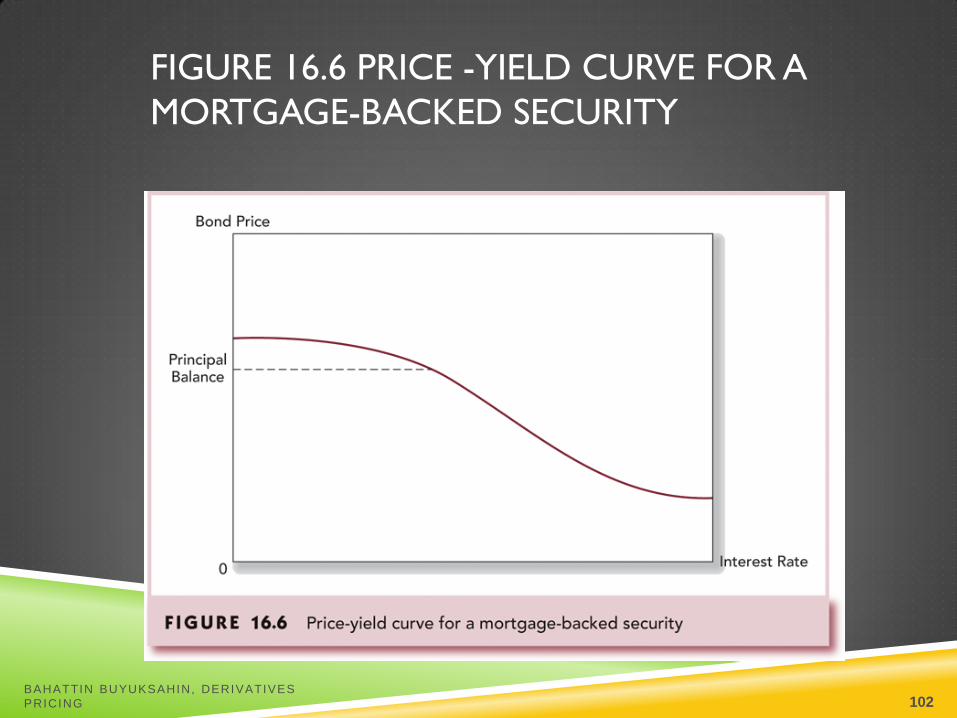
FIGURE 16.6 PRICE -YIELD CURVE FOR A
MORTGAGE-BACKED SECURITY
BAHATTIN BUYUKSAHIN, DERIVATIVES
PRICING 102

MORTGAGE-BACKED SECURITIES
CONTINUED
They have given rise to many derivatives
including the CMO (collateralized mortgage
obligation)
Use of tranches
BAHATTIN BUYUKSAHIN, DERIVATIVES
PRICING 103
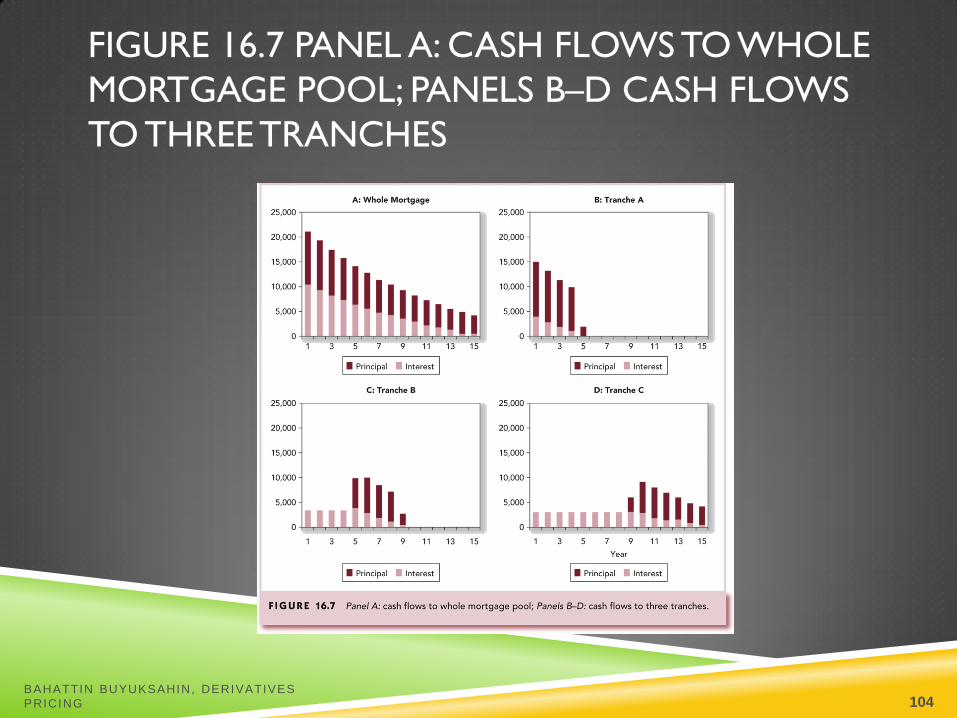
FIGURE 16.7 PANEL A: CASH FLOWS TO WHOLE
MORTGAGE POOL; PANELS B–D CASH FLOWS
TO THREE TRANCHES
BAHATTIN BUYUKSAHIN, DERIVATIVES
PRICING 104

PASSIVE MANAGEMENT
Bond-Index Funds
Immunization of interest rate risk:
Net worth immunization
Duration of assets = Duration of liabilities
Target date immunization
Holding Period matches Duration
BAHATTIN BUYUKSAHIN, DERIVATIVES
PRICING 105

FIGURE 16.8 STRATIFICATION OF BONDS INTO
CELLS
BAHATTIN BUYUKSAHIN, DERIVATIVES
PRICING 106
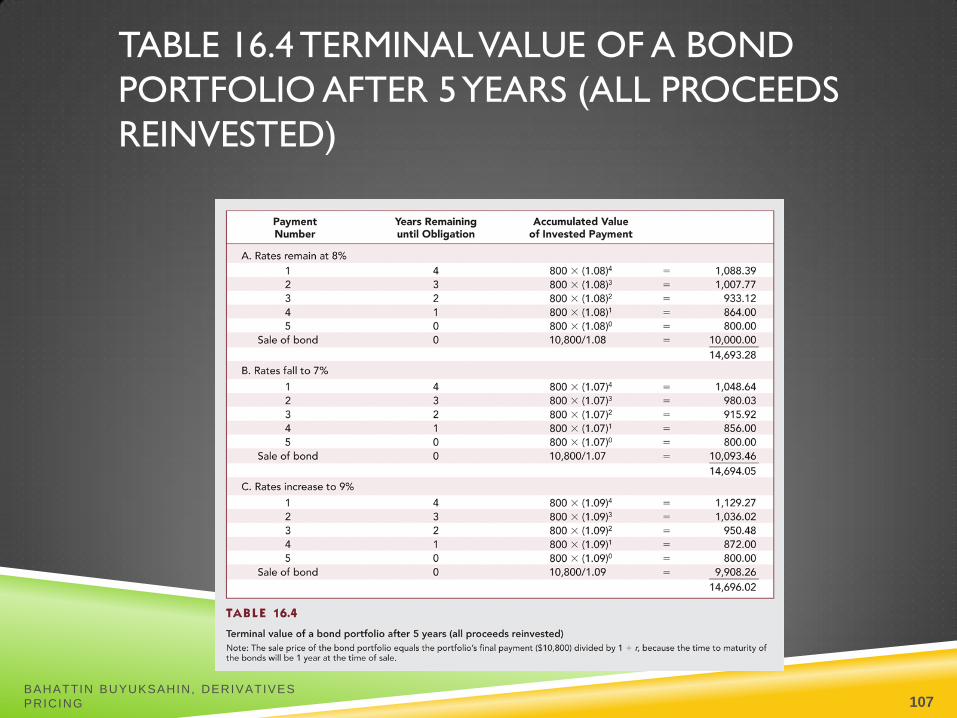
TABLE 16.4 TERMINAL VALUE OF A BOND
PORTFOLIO AFTER 5 YEARS (ALL PROCEEDS
REINVESTED)
BAHATTIN BUYUKSAHIN, DERIVATIVES
PRICING 107

FIGURE 16.9 GROWTH OF
INVESTED FUNDS
BAHATTIN BUYUKSAHIN, DERIVATIVES
PRICING 108

FIGURE 16.10 IMMUNIZATION
BAHATTIN BUYUKSAHIN, DERIVATIVES
PRICING 109
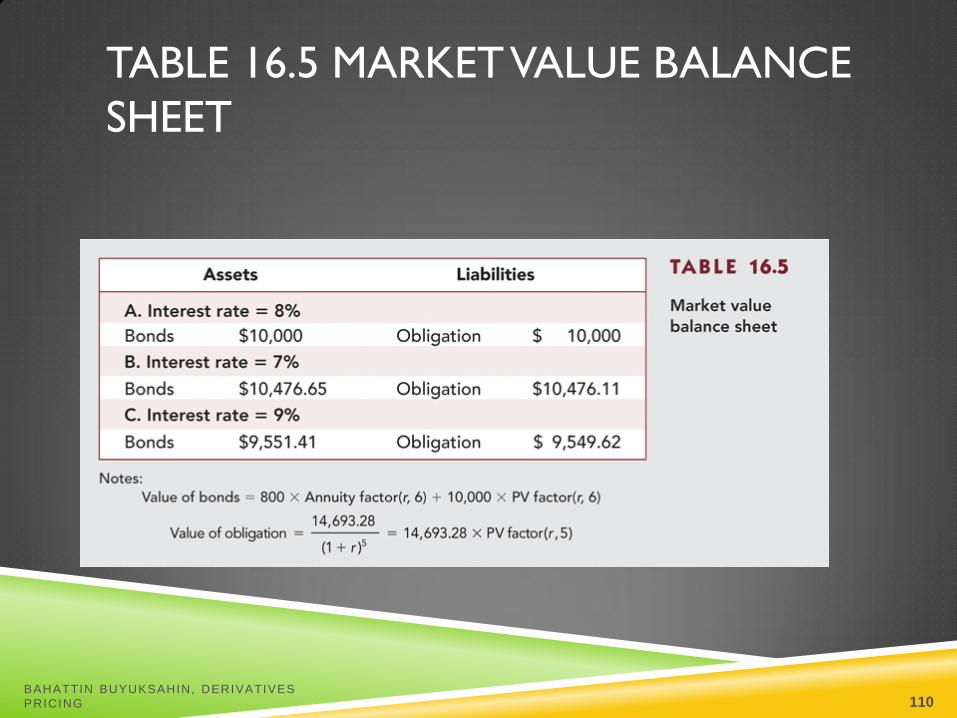
TABLE 16.5 MARKET VALUE BALANCE
SHEET
BAHATTIN BUYUKSAHIN, DERIVATIVES
PRICING 110
CASH FLOW MATCHING AND
DEDICATION
Automatically immunize the portfolio from
interest rate movement Cash flow and obligation exactly offset each other
i.e. Zero-coupon bond
Not widely used because of constraints
associated with bond choices
Sometimes it simply is not possible to do
BAHATTIN BUYUKSAHIN, DERIVATIVES
PRICING 111

ACTIVE MANAGEMENT: SWAPPING
STRATEGIES
Substitution swap
Intermarket swap
Rate anticipation swap
Pure yield pickup
Tax swap
BAHATTIN BUYUKSAHIN, DERIVATIVES
PRICING 112
HORIZON ANALYSIS
Select a particular holding period and predict
the yield curve at end of period
Given a bond’s time to maturity at the end of
the holding period
Its yield can be read from the predicted
yield curve and the end-of-period price can
be calculated
BAHATTIN BUYUKSAHIN, DERIVATIVES
PRICING 113
CONTINGENT IMMUNIZATION
A combination of active and passive management
The strategy involves active management with a floor rate of return
As long as the rate earned exceeds the floor, the portfolio is actively managed
Once the floor rate or trigger rate is reached, the portfolio is immunized
BAHATTIN BUYUKSAHIN, DERIVATIVES
PRICING 114

FIGURE 16.11 CONTINGENT
IMMUNIZATION
BAHATTIN BUYUKSAHIN, DERIVATIVES
PRICING 115