Changes in canopy structure and ant assemblages affect soil ecosystem variables as a foundation...
20
Changes in canopy structure and ant assemblages affect soil ecosystem variables as a foundation species declines JOSEPH A. KENDRICK, 1,2,6 RELENA R. RIBBONS, 3,4 AIME ´ E T. CLASSEN, 3,5 AND AARON M. ELLISON 2, 1 Bennington College, Bennington, Vermont 05201 USA 2 Harvard University, Harvard Forest, 324 North Main Street, Petersham, Massachusetts 01366 USA 3 University of Tennessee, Department of Ecology and Evolutionary Biology, Knoxville, Tennessee 37996 USA 4 Bangor University, School of the Environment, Natural Resources, and Geography, Bangor, Wales LL572UW United Kingdom 5 The Natural History Museum of Denmark, University of Copenhagen, Universitetsparken 15, 2100 Copenhagen Ø, Denmark Citation: Kendrick, J. A., R. R. Ribbons, A. T. Classen, and A. M. Ellison. 2015. Changes in canopy structure and ant assemblages affect soil ecosystem variables as a foundation species declines. Ecosphere 6(5):77. http://dx.doi.org/10.1890/ ES14-00447.1 Abstract. The decline of Tsuga canadensis (eastern hemlock)—a foundation tree species—due to infestation by Adelges tsugae (hemlock woolly adelgid) or its complete removal from a stand by salvage logging dramatically affects associated faunal assemblages. Among these assemblages, species composition (richness and abundance) of ants increases rapidly as T. canadensis is lost from the stands. Because ants live and forage at the litter-soil interface, we hypothesized that environmental changes caused by hemlock loss (e.g., increased light and warmth at the forest floor, increased soil pH) and shifts in ant species composition would interact to alter soil ecosystem variables. In the Harvard Forest Hemlock Removal Experiment (HF- HeRE), established in 2003, T. canadensis in large plots were killed in place or logged and removed to mimic adelgid infestation or salvage harvesting, respectively. In 2006, we built ant exclosure subplots within all of the canopy manipulation plots to examine direct and interactive effects of canopy change and ant assemblage composition on soil and litter variables. Throughout HF-HeRE, T. canadensis was colonized by the adelgid in 2009, and the infested trees are now declining. The experimental removal of T. canadensis from the canopy was associated with an increase in the rate of cellulose decomposition by .50%, and exclosure of ants from subplots directly reduced their soil nitrate availability by 56%. Partial least squares path models revealed sequential interactive effects prior to adelgid infestation: canopy change (as a proxy for associated environmental changes) altered both decomposition and ant assemblage structure; changes in ant assemblage structure and decomposition rates altered nitrogen availability. The results illustrate that biotic changes directly associated with decline of T. canadensis can have cascading effects on ecosystem nutrient availability and cycling. Key words: Adelges tsugae; ecosystem dynamics; foundation species; Formicidae; Harvard Forest; indirect effects; nitrogen; soil respiration; Tsuga canadensis. Received 18 November 2014; revised 6 February 2015; accepted 12 February 2015; published 12 May 2015. Corresponding Editor: D. P. C. Peters. Copyright: Ó 2015 Kendrick et al. This is an open-access article distributed under the terms of the Creative Commons Attribution License, which permits unrestricted use, distribution, and reproduction in any medium, provided the original author and source are credited. http://creativecommons.org/licenses/by/3.0/ 6 Present address: Brown University, Department of Ecologyand Evolutionary Biology, Providence, Rhode Island 02912 USA. E-mail: [email protected] INTRODUCTION Global redistribution of species and reorgani- zation of species assemblages associated with climatic changes and human activities (e.g., Garcia et al. 2014) are having widespread effects v www.esajournals.org 1 May 2015 v Volume 6(5) v Article 77
Transcript of Changes in canopy structure and ant assemblages affect soil ecosystem variables as a foundation...

Changes in canopy structure and ant assemblages affectsoil ecosystem variables as a foundation species declines
JOSEPH A. KENDRICK,1,2,6 RELENA R. RIBBONS,3,4 AIMEE T. CLASSEN,3,5 AND AARON M. ELLISON2,�
1Bennington College, Bennington, Vermont 05201 USA2Harvard University, Harvard Forest, 324 North Main Street, Petersham, Massachusetts 01366 USA
3University of Tennessee, Department of Ecology and Evolutionary Biology, Knoxville, Tennessee 37996 USA4Bangor University, School of the Environment, Natural Resources, and Geography, Bangor, Wales LL57 2UW United Kingdom5The Natural History Museum of Denmark, University of Copenhagen, Universitetsparken 15, 2100 Copenhagen Ø, Denmark
Citation: Kendrick, J. A., R. R. Ribbons, A. T. Classen, and A. M. Ellison. 2015. Changes in canopy structure and ant
assemblages affect soil ecosystem variables as a foundation species declines. Ecosphere 6(5):77. http://dx.doi.org/10.1890/
ES14-00447.1
Abstract. The decline of Tsuga canadensis (eastern hemlock)—a foundation tree species—due to
infestation by Adelges tsugae (hemlock woolly adelgid) or its complete removal from a stand by salvage
logging dramatically affects associated faunal assemblages. Among these assemblages, species composition
(richness and abundance) of ants increases rapidly as T. canadensis is lost from the stands. Because ants live
and forage at the litter-soil interface, we hypothesized that environmental changes caused by hemlock loss
(e.g., increased light and warmth at the forest floor, increased soil pH) and shifts in ant species composition
would interact to alter soil ecosystem variables. In the Harvard Forest Hemlock Removal Experiment (HF-
HeRE), established in 2003, T. canadensis in large plots were killed in place or logged and removed to mimic
adelgid infestation or salvage harvesting, respectively. In 2006, we built ant exclosure subplots within all of
the canopy manipulation plots to examine direct and interactive effects of canopy change and ant
assemblage composition on soil and litter variables. Throughout HF-HeRE, T. canadensis was colonized by
the adelgid in 2009, and the infested trees are now declining. The experimental removal of T. canadensis
from the canopy was associated with an increase in the rate of cellulose decomposition by .50%, and
exclosure of ants from subplots directly reduced their soil nitrate availability by 56%. Partial least squares
path models revealed sequential interactive effects prior to adelgid infestation: canopy change (as a proxy
for associated environmental changes) altered both decomposition and ant assemblage structure; changes
in ant assemblage structure and decomposition rates altered nitrogen availability. The results illustrate that
biotic changes directly associated with decline of T. canadensis can have cascading effects on ecosystem
nutrient availability and cycling.
Key words: Adelges tsugae; ecosystem dynamics; foundation species; Formicidae; Harvard Forest; indirect effects;
nitrogen; soil respiration; Tsuga canadensis.
Received 18 November 2014; revised 6 February 2015; accepted 12 February 2015; published 12 May 2015.
Corresponding Editor: D. P. C. Peters.
Copyright: � 2015 Kendrick et al. This is an open-access article distributed under the terms of the Creative Commons
Attribution License, which permits unrestricted use, distribution, and reproduction in any medium, provided the
original author and source are credited. http://creativecommons.org/licenses/by/3.0/6 Present address: Brown University, Department of Ecology and Evolutionary Biology, Providence, Rhode Island 02912
USA.
� E-mail: [email protected]
INTRODUCTION
Global redistribution of species and reorgani-
zation of species assemblages associated withclimatic changes and human activities (e.g.,Garcia et al. 2014) are having widespread effects
v www.esajournals.org 1 May 2015 v Volume 6(5) v Article 77

on the composition and function of ecosystems(reviewed in Bardgett and Wardle 2010). Theseeffects can be particularly large when a founda-tion species (sensu Dayton 1972) declines or isremoved, because these dominant, widespreadspecies play disproportionate roles in structuringecological systems (reviewed by Ellison et al.2005b). In particular, foundation species oftencontrol the distribution and abundance of manyassociated species via non-trophic interactions(Baiser et al. 2013).
Tsuga canadensis (L.) Carriere (eastern hemlock)is a foundation tree species in eastern NorthAmerican forests (reviewed in Ellison and Baiser2014). Populations of this species are decliningdue to infestation by a rapidly spreadingnonnative insect, Adelges tsugae Annand (hem-lock woolly adelgid) (Orwig et al. 2008). Inaddition, many eastern hemlock stands are beingpre-emptively cut in expectation of future adelg-id infestations, so as to salvage merchantabletimber (Foster and Orwig 2006). Compositionand abundance of many associated plant andanimal species, including understory herbs (Or-wig et al. 2013), insects (Ellison et al. 2005a,Dilling et al. 2007, Rohr et al. 2009, Sackett et al.2011), spiders (Sackett et al. 2011), salamanders(Mathewson 2009, 2014), and birds (Tingley et al.2002, Brown and Weinka 2014), change followingdecline and subsequent loss of T. canadensis dueto the adelgid or its rapid removal by logging.
Notably, ant species richness and abundanceincrease rapidly following either mechanism of T.canadensis loss (Ellison et al. 2005a, Rohr et al.2009, Sackett et al. 2011) as the forest floor iswarmed (Lustenhouwer et al. 2012) and soil pHchanges. Because ants are herbivores, seedharvesters, omnivorous predators, and soil andlitter movers, changes in their diversity andabundance also can alter ecosystem structureand function (reviewed by Del Toro et al. 2012).Foundation species also modulate ecosystemprocesses such as carbon and water flux, decom-position, and nutrient cycling (e.g., Ellison et al.2005b, Ford and Vose 2007). Changes to forestecosystem dynamics following pre-emptive sal-vage logging are similar in scale, but occur morerapidly than changes seen following adelgidinfestation (Orwig et al. 2013).
We hypothesized that direct effects of the lossof a hemlock canopy, subsequent effects of
changes in ant diversity and abundance associ-ated with hemlock decline, and the interactionsof changes in canopy structure and ant assem-blage composition, together would lead to acascade of changes in litter, soil, and vegetationdynamics in declining hemlock stands. To testthis hypothesis, we manipulated ant abundancewithin the Harvard Forest Hemlock RemovalExperiment (HF-HeRE), a long term, multi-hectare-scale, canopy manipulation experimentdesigned to study the effects of hemlock loss onnortheastern USA forests (Ellison et al. 2010,Orwig et al. 2013). We directly measured effectsof changes in ant abundance on the structure ofunderstory plant assemblages and on soil-levelecosystem variables that link the litter and soilsin which ants live—cellulose and lignin decom-position, soil nitrogen availability, and soilrespiration—and used path analysis to explorecausal linkages between forest canopy structure,hemlock decline, ant assemblages, and soilecosystem variables. We also took advantage ofthe design of HF-HeRE to contrast how theseeffects differed among stands where T. canadensiswas killed instantly by logging or girdling versusstands where T. canadensis is declining muchmore slowly as the adelgid colonizes them.
METHODS
Study site and canopy treatmentsHF-HeRE is sited in Petersham, Massachusetts,
within the 121-ha Simes tract at the HarvardForest (42.47–42.488 N, 72.22–72.218 W; 215–300m a.s.l). The tract comprises large areas domi-nated by T. canadensis throughout; other commontrees include red maple (Acer rubrum L.), red oak(Quercus rubra L.), black birch (Betula lenta L.),and white pine (Pinus strobus L.) (Ellison et al.2010, 2014). The current dominance of T. cana-densis at the Simes tract is relatively recent, andresulted from competitive release and rapidgrowth following loss of American chestnut(Castanea dentata (Marsh.) Borkh.) in the early1900s, logging of pines from the tract during the1880s, 1920s, and 1930s, and damage to pinesand hardwoods during the 1938 ‘‘Great Hurri-cane’’ (Ellison et al. 2014).
A full description of HF-HeRE is in Ellison etal. (2010); only pertinent details are mentionedhere. The experiment, established in 2003, con-
v www.esajournals.org 2 May 2015 v Volume 6(5) v Article 77
KENDRICK ET AL.

sists of eight ’90 3 90 m (0.81-ha) plots, dividedinto two blocks. The four plots in the ‘‘valley’’block are situated in the central valley of thetract, whereas those on the ‘‘ridge’’ block are’500 m northeast of the valley plots. The valleyblock is characterized by poorly drained,swampy soils. Besides T. canadensis, A. rubrum,P. strobus, and mixed hardwoods are common inthe valley block. Soils in the ridge block are betterdrained, and this area is dominated by Q. rubra,Q. alba L., and P. strobus, in addition to T.canadensis.
Within each block, three hemlock-dominated(.65% of the canopy and basal area) plots andone hardwood plot were sited at the beginning ofthe experiment. Of the three hemlock-dominatedplots, one was left untreated as a ‘‘hemlockcontrol’’ while the other two were manipulated.In the ‘‘girdled’’ plots, the bark and cambium ofevery individual hemlock stem were cut throughin May 2005 to simulate rapid decline and treedeath associated with adelgid infestation (Yorkset al. 2003). In the ‘‘logged’’ plots all hemlocks.20 cm DBH, 50% of merchantable oak and pine,and some poor-quality red maple and birch (forfirewood) were felled and removed betweenFebruary and April 2005 to mimic standardsilvicultural practices used to salvage the valueof the timber before the adelgid arrives (Fosterand Orwig 2006). Because of the large size of theplots and the aspect of the blocks, plots were notrandomly arrayed. Rather, to avoid shadingmanipulated plots in each block by the associatedhemlock control plot, logged plots were alwayssited south of hemlock control plots, and girdledplots were in between the logged and hemlockcontrol plots. Plots were separated from oneanother by 5–10 m. The fourth plot in each blockwas a ‘‘hardwood control’’ plot dominated byyoung hardwoods, and which represented theexpected near-term (20–50 year) structure offorests from which hemlock has been lost (i.e.,a space-for-time substitution) (Albani et al. 2010).In each block, the hardwood control was located.100 m from the three hemlock plots. Together,these four plot types are intended to serve as ashort-term chronosequence of forests invaded bythe adelgid; hemlock control plots representhemlock stands pre-invasion, girdled and loggedplots represent the immediate effects of infesta-tion and salvage logging respectively, and hard-
wood control plots represent the eventual futureof invaded stands.
Technically, HF-HeRE is a modified Before-After-Control-Impact experiment that was de-signed with three distinct temporal phases(Ellison et al. 2010). The ‘‘Before’’ phase ran from2003–2005. During those two years, baseline datawere collected on all plots. The ‘‘After-but-pre-adelgid’’ phase ran from 2005 to 2009. At thebeginning of this phase (spring 2005), the adelgidhad not yet colonized these plots (nor had it yetbeen found anywhere in Petersham outside of asingle cultivated hemlock tree near the town’snorthern border). Between the spring of 2005,when the two canopy manipulation treatments—logging or girdling—were applied to individualplots in each block, and mid-2009, when theadelgid was first detected in large numbers(occurrences on trees) at HF-HeRE, the focus ofthe experiment was on contrasting forest ecologyand soil ecosystem variables between intact T.canadensis stands (the hemlock controls) andstands in which T. canadensis had been removed(by logging) or was simply falling apart (follow-ing girdling). The ‘‘After-and-post-adelgid’’ phasebegan in 2010. Once the adelgid began to irruptin the hemlock control plots, the experimentalcontrast of interest shifted to that between standsin which T. canadensis had disintegrated due tophysical damage alone (girdling) versus standsin which T. canadensis was disintegrating due tothe adelgid (see Orwig et al. 2013). Thus, since2010, we have assessed additive and interactiveeffects on forest dynamics due to physical loss ofhemlock and presence of the adelgid (see alsoStadler et al. 2005, 2006).
Light environmentBecause the dense canopy of T. canadensis
creates deep shade on the forest floor (Lusten-houwer et al. 2012), changes in the amount oflight reaching the forest floor is one of the bestmeasures of decline or removal of hemlock froma forest stand. Hemispherical canopy photo-graphs have been taken twice yearly in each ofthe HF-HeRE plots since 2005: in April before leafbud-break by the deciduous trees (‘‘leaf-off’’condition), and in September, before the decidu-ous trees have dropped their leaves (‘‘leaf-on’’condition). Twenty-five photographs were takenin each plot on a 15-m grid (technical details in
v www.esajournals.org 3 May 2015 v Volume 6(5) v Article 77
KENDRICK ET AL.

Lustenhouwer et al. 2012). From each photo-graph, we calculated the global site factor (GSF),which ranges from 0 to 1 and is the estimatedproportion of (direct or diffuse) solar radiationreaching the camera (Rich 1989); here, GSFmeasures an ‘‘ants-eye’’ view of light available(in the forest understory, 1–2 m above ground).Initial analysis found no evidence of spatialautocorrelation at the scale of the 15-m grid,showed that each of the 25 photograph locationswithin each plot showed similar patterns overtime, and that differences among them (within-plot, at each sample date) were constant (A. M.Ellison and M. Levine, unpublished data). Thus, tocompare among the plots, we used the mean GSFvalue from all 25 photographs taken in each aplot at each measurement time.
Ant treatmentsWithin each canopy treatment plot, six 33 3 m
ant manipulation subplots were installed in April2006. Three subplot types were installed: ‘‘con-trol,’’ ‘‘disturbance control,’’ and ‘‘ant exclosure.’’Each subplot type was replicated twice withineach canopy treatment plot and was randomlysited within the 7200 m2 area of the canopymanipulation plot outside of the central 30 3 30m ‘‘core’’ area (which is otherwise intensivelysampled for many other variables: Ellison et al.2010) and at least 15 m from the edge of thecanopy manipulation plot. This split-plot design(small replicate ant manipulation subplots withineach large canopy manipulation plot) was usedto separate direct effects of changes in antassemblage structure on soil ecosystem variablesfrom those caused by canopy manipulations andadelgid infestation, which themselves may affectant species composition (Ellison et al. 2005a,Sackett et al. 2011).
Ant exclosures followed the design of Wardleet al. (2011); each consisted of an outer wall of 30-cm high fiberglass roofing buried 10 cm in theground around the perimeter of the plot, and aninner wall of 8-inch (’20-cm) diameter PVCsewer pipe cut lengthwise and buried 5 cm deeparound a 2 3 2 m square, inside of which allmeasurements were taken. Exclosure walls werecoated with Tanglefoot aerosol spray (BiocontrolNetwork LLC, Brentwood, Tennessee) in Mayand July each year. Control subplots wereflagged at the corners but were otherwise
unmanipulated, whereas disturbance controlsubplots were trenched and cleared of rocksaround the edges in the same manner as the antexclosures to control for possible confoundingeffects of the soil disturbance associated withexclosure installation. As with the exclosureplots, all measurements in the controls anddisturbance controls were made within a central2 3 2 m area.
In each of the ant manipulation and associatedcontrol subplots, two 7-cm diameter 3 10-cmdeep, 230-ml plastic cups (‘‘pitfall traps’’) wereburied flush with the soil surface. From 2006through 2014, three times each summer, trapswere opened, partially filled (20 ml) with amixture of water and a few drops of dishwashingdetergent, and then left uncovered for 48 hours,after which time all ants in the pitfalls wereremoved, counted, and identified to speciesfollowing Ellison et al. (2012). Voucher specimensare deposited in Harvard University’s Museumof Comparative Zoology. In addition to supply-ing necessary data on ant assemblages that couldbe associated with changes in soil ecosystemvariables, data from the control pitfalls were usedto test for differences in ant assemblage compo-sition among the canopy treatment plots, anddata from the exclosures were used to verify thatthe exclosures effectively reduced ant activity.
VegetationUnderstory vegetation, including herbs, tree
seedlings and suppressed saplings, respondsrapidly to the increasing light availability atten-dant to hemlock decline (Catovsky and Bazzaz2000, Orwig et al. 2013), and many understoryspecies are dispersed by ants (Stuble et al. 2014).Understory vegetation (plants ,1.3 m tall and,1.0 cm diameter) was sampled annually in thecanopy manipulation plots in five 1-m2 plotsspaced evenly along each of two 30-m transects(for herbs and seedlings) and within the central30 3 30 m ‘‘core’’ area (for saplings) of eachcanopy removal plot (Orwig et al. 2013). Identityand abundance of herbs, shrubs, and treeseedlings and saplings were recorded in theseannual samples. Vegetation within the antmanipulation subplots was assessed in July2014. For most species, we counted individualherbs, shrubs, and tree seedlings and saplings;percent cover was estimated for graminoids and
v www.esajournals.org 4 May 2015 v Volume 6(5) v Article 77
KENDRICK ET AL.

herbs, such as Mitchella repens L., that form large,spreading clones. Basal area was computed frommeasurements of diameter at breast height(DBH, measured at 1.3 m height) of tree saplings.1 cm DBH.
Soil ecosystem variablesSoil NO3
� (nitrate) and NH4þ (ammonium)
availability in the ant manipulation subplotswere measured quarterly from July 2006 throughOctober 2014. A single home-built WECSA-type(WECSA, LLC, Saint Ignatius, Montana, USA)soil-access tube constructed of a 1.5’’ (’4 cm)diameter PVC outer sleeve and a 1’’ (’2.5 cm)diameter removable PVC inner sleeve wasinstalled at an ’458 angle into the mineral soil(’15 cm depth) at a random location within eachsubplot. A Unibest PST-1 resin capsule (WECSA,LLC) was placed at the end of the inner sleeveand in contact with the soil. Resin capsules werecollected and replaced every three months,extracted with 60 ml of 1 M KCl solution, andanalyzed for NO3
� and NH4þ content using a
Lachat auto-analyzer (analytical details in Orwiget al. 2013).
A single 30-cm diameter, 10-cm high PVC soilrespiration collar was partially buried (5 cmdeep) at a random location in each subplot inMay 2006, and soil respiration was measured inthese collars biweekly during the summers of2006, 2007, and 2008 using a LI-COR 6200portable IRGA (LI-COR, Lincoln, Nebraska;detailed methods in Giasson et al. 2013). Four-teen of these biweekly ‘‘runs’’ were completedover the three years (three in 2006, four in 2007,and seven in 2008); in each run, every subplotwas measured within 5 days. Because soiltemperatures were measured continuously onlyat the scale of the canopy manipulation plot(Lustenhouwer et al. 2012), not within eachsubplot, we could not estimate annual CO2 fluxwithin ant manipulation subplots. Rather, weassessed the effects of ant manipulations oninstantaneous (within-run) CO2 fluxes amongsubplots.
Decomposition was assessed using standardsubstrates in mesh bags constructed of 3-mmnylon mesh (on the top) and 1.3-mm mesh plasticwindow screen (on the bottom). Cellulose filterpapers (5-g Whatman #1) were placed in 15.5 3
15.5 cm mesh bags, and lignin tongue depressors
(15 3 2 cm) were placed in 19 3 5 cm mesh bags.The larger mesh size on top allowed ants andother litter microarthropods to access the cellu-lose or lignin, while the smaller mesh on thebottom reduced substrate loss due to fragmenta-tion. Bags were stitched together on three sideswith polyester thread and closed with stainlesssteel staples. Decomposition rates were mea-sured in each subplot over 18 months. InSeptember 2008, two mesh bags containing ligninsubstrates and three mesh bags containingcellulose substrates were placed on the soilsurface at random locations in each subplot.One bag containing filter paper was collectedfrom each subplot in December 2008, and bagscontaining cellulose or lignin (one each) werecollected in June 2009 and March 2010. Aftercollection, the contents of each bag were re-moved, sorted to remove foreign material, driedto constant mass at 708C, and weighed (60.001g). Samples were ashed in a muffle furnace at5508C for 6 hours; data are presented as ash-freeoven-dried mass.
Statistical analysisThe overall experimental design is a split-plot
analysis of covariance (ANCOVA)—six ant sub-plots within each canopy manipulation plot—within two blocks sampled through time. Werecognize that two blocks is a less-than-idealsmall sample size, but siting even these twoblocks required nearly 10 ha of relativelyhomogeneous hemlock-dominated forest area.Nonetheless, because N . 1, variance can beestimated and used in the ANCOVA. Subplottype entered into the model as a fixed effectnested within canopy treatment (also treated as afixed effect). Block (ridge, valley) entered as arandom effect, and sample year (for ants), month(for soil nitrogen), or day of year (for soilrespiration) were included as covariates. Toavoid pseudoreplication (sensu Hurlbert 1984)among split-plots, data from the two subplots foreach treatment were pooled within each canopytreatment plot. Ant data were further pooled byyear (three pitfall samples/year), from which wecalculated total ant abundance, species richness,and the effective number of ant species (eH’: Chaoet al. 2014). Effects of canopy and ant manipu-lations on understory plant assemblages wereassessed using principal component analysis
v www.esajournals.org 5 May 2015 v Volume 6(5) v Article 77
KENDRICK ET AL.

(PCA). Annual changes in composition of un-derstory vegetation (ferns and fern allies, grami-noids, herbs, shrubs) in the different canopymanipulation plots were visualized as trajectoriesthrough principal component space. The loadingscores from that PCA were then applied to theunderstory vegetation data collected in 2014 inthe ant manipulation subplots to predict theirlocation in principal component space. Theeffects of canopy manipulation, ant manipula-tion, and their interaction were then tested on themeaningful principal components (as determinedfrom scree plots) for all replicate subplots.Densities of tree saplings in the canopy manip-ulation plots and ant manipulation subplots werecompared using ANOVA.
To examine effects of ant manipulations onthree of the soil ecosystem variables—NO3
� andNH4
þ availability, and soil respiration—we sub-tracted the value of the control at each sampletime from the corresponding values in thedisturbance control or the exclosure subplots;the expected value of each of these differencesunder H0 ¼ 0. Decomposition rates of celluloseand lignin were estimated by fitting a linearmodel to all of the data (proportion of materialremaining at each observation period) for eachpair of replicate subplots. For cellulose, weincluded a pre-deployment value of 100%, butbecause lignin decomposed very slowly over thefirst 9 months, we modeled only its decomposi-tion over the second 9 months of observations.The estimated slope for each pair of replicatesubplots was used as an estimate of the decom-position rate for each treatment. Differences indecomposition rates were analyzed using split-plot ANOVA; no covariate was included becausethe estimation of rate implicitly accounted forelapsed time.
We used partial least-squares path modeling(plspm) to explore how canopy treatments andant assemblage structure directly and indirectlyinfluenced the measured soil ecosystem vari-ables. In the path models, we used only theobservations made during the time that decom-position rate was assessed (2008–2010); thus, soilrespiration data (collected only in 2006–2008)and vegetation data (collected only in July 2014)were not used in the path analysis. The pathmodel assessed: direct effects of canopy treat-ment on ant assemblages, decomposition rates,
and soil nitrogen availability; downstream effectsof ant assemblage structure on decompositionand soil nitrogen availability; and finally, effectsof lignin and cellulose decomposition on soilnitrogen availability. For consistency, ant assem-blage and decomposition variables were trans-formed to differences from controls prior to pathmodeling.
Finally, for available data (ant species compo-sition and abundance, light, and soil nitrogen),we contrasted overall (2006–2014) responseswith analyses done pre- (2006–2009) and post-(2010–2014) colonization of the adelgid. Theorypredicts that during a transition from one state(here, dominated by T. canadensis) to another(here, young hardwoods), that variance inresponse variables should increase dramatically(so-called critical slowing down: Dakos et al.2012).
All analyses were done in R version 3.1.2 (RCore Team 2014). ANCOVA models were fitusing the aov() function in the stats package;linear models were fit using the lm() function inthe stats package and the segmented() function inthe segmented package (Muggeo 2014); principalcomponents analysis on scaled and centered datawere modeled and fit with prcomp() andpredict() in the stats package; and path modelingwas done using the pls() function in the plspmpackage (Sanchez 2013). In the path model, all‘‘inner model’’ variables other than ant diversitywere reflected by a single measured variable;overall ant diversity was considered to be a latentvariable reflected by species richness and theeffective number of species. Raw data and R codeare available from the Harvard Forest DataArchive (http://harvardforest.fas.harvard.edu/data-archive), datasets HF106 (understory vege-tation), HF107 (light), and HF-160 (ant collectiondata and ecosystem measurements within theant-exclosures and R code for this paper). Aknitted html document with model code, fullstatistical output, and additional diagnosticgraphs is provided in the Supplement.
RESULTS
Light and understory vegetationAfter treatments were applied, but prior to the
colonization of the plots by the adelgid in 2009,light levels were lowest in the hemlock control
v www.esajournals.org 6 May 2015 v Volume 6(5) v Article 77
KENDRICK ET AL.

plots and highest in the logged plots (Fig. 1). The
effect of adelgid colonization on light reaching
the forest floor was rapid in the hemlock control
stands. Before 2009, in both summer (when
Quercus species [oaks] and other deciduous trees
were in full leaf ) and winter (when they were
not), light levels in the hemlock control plots
were approximately constant at ,10% (Fig. 1).
From 2010 through early 2013, however, light
levels in the hemlock control plots increased at
3% per year in the winter (as the T. canadensis
canopy thinned). Since the summer of 2013,
however, light levels have stabilized as the
deciduous canopies have expanded. Similarly,
in the logged plots (in which only T. canadensis
individuals .20 cm diameter were removed) and
Fig. 1. Changes in light availability (expressed as global site factor [GSF]: the weighted average of direct þdiffuse radiation relative to full-sun, above-canopy, conditions) in the Harvard Forest Hemlock Removal plots
from 2005–2014. Each point represents the mean GSF of 25 photographs taken at 15-m intervals across each plot;
left and right columns of panels represent, respectively, photographs taken in the summer (deciduous trees in full
leaf ) or winter (deciduous trees leafless) in the four canopy manipulation treatments (top to bottom rows, HC:
Hemlock control; G: Girdled; L: Logged; HD: Hardwood control). Different symbols are used for plots in the
ridge (solid circle) and valley (solid triangle) blocks. The vertical dashed line indicates the year (2009) when we
first detected the adelgid in the plots. Regression lines (with shaded 95% confidence intervals; data pooled for
both blocks) were fit to those portions of data identified as being different using piecewise linear regression in the
segmented package of the R statistical software system.
v www.esajournals.org 7 May 2015 v Volume 6(5) v Article 77
KENDRICK ET AL.

the hardwood control plots (which have scat-
tered T. canadensis trees), winter light levels have
been increasing at 4% since 2007 and 6% since
2011, respectively. However, the preponderance
of deciduous trees in the hardwood controls, and
the rapid growth of deciduous saplings in the
logged plots, precluded detection of any light
response related to hemlock loss after 2009. There
has been no change in summer light levels in the
hardwood control plots since 2006, and the
dramatic change in light levels in the logged
plots occurred three years after the logging,
when the saplings exceed 2 m in height (over-
topping the camera). Similarly, changes in light
levels in the girdled plots were detected after the
trees had all died by the end of 2007 (Fig. 1).
The composition of understory vegetation
(ferns, herbs, and shrubs) sampled before the
canopy treatments in plots that were initially
dominated by hemlock had only scattered
individuals of a few species (Mitchella repens,
Coptis trifolia (L.) Salisb., Lysimachia borealis, and
scattered ferns). In contrast, the hardwood
controls had an abundant, diverse understory.
Fig. 2. Vegetation composition through time expressed as principal component scores in the canopy
manipulation plots (light gray to dark gray filled circles; larger circles are 2003 [lightest gray] and 2014 [darkest
gray]) and in the ant exclosure subplots in 2014 (filled squares: magenta: control; orange: disturbance control;
blue: exclosures). PC scores have been square-root transformed to provide more visual separation among the
points. See Table 1 for loadings on each of these principal axes. Abbreviations for canopy manipulation
treatments as in Fig. 1.
v www.esajournals.org 8 May 2015 v Volume 6(5) v Article 77
KENDRICK ET AL.

These differences are apparent in the separationof the hardwood controls from the other plots inprincipal component space (Fig. 2); all taxa thatloaded negatively on both axes (Table 1) werecharacteristic of hardwood-dominated stands.Over time, the understory vegetation in thegirdled and logged plots acquired more speciesand diverged (in principal component space)from the hemlock controls, but not in anyconsistent direction (Fig. 2). The composition ofunderstory vegetation sampled in 2014 in the antmanipulation subplots was similarly variable(Fig. 2) and did not differ among canopymanipulation (P ¼ 0.21, ANOVA) or ant manip-ulation (P ¼ 0.79) (sub)plots.
Some saplings (tree species for which individ-uals .1.3 m tall and ,5 cm DBH) occurred in theunderstories of the canopy manipulation plotsand within the ant manipulation subplots.Sapling densities differed among the canopymanipulation plots (F2,10 ¼ 8.8, P ¼ 0.006), beinghighest in the girdled (10,000–15,000/ha) andlogged (8,000–9,000 /ha) plots, much lower in thehardwood control plots (200–500/ha), and absentin the hemlock control plots. Betula lenta saplingsaccounted for .70% of the saplings in the centerof the canopy manipulation plots. Only saplingsof this species also were found in the antmanipulation subplots, where they grew atsimilar densities to those in the canopy manip-
ulation plots (F3,10 ¼ 0.65, P ¼ 0.6).
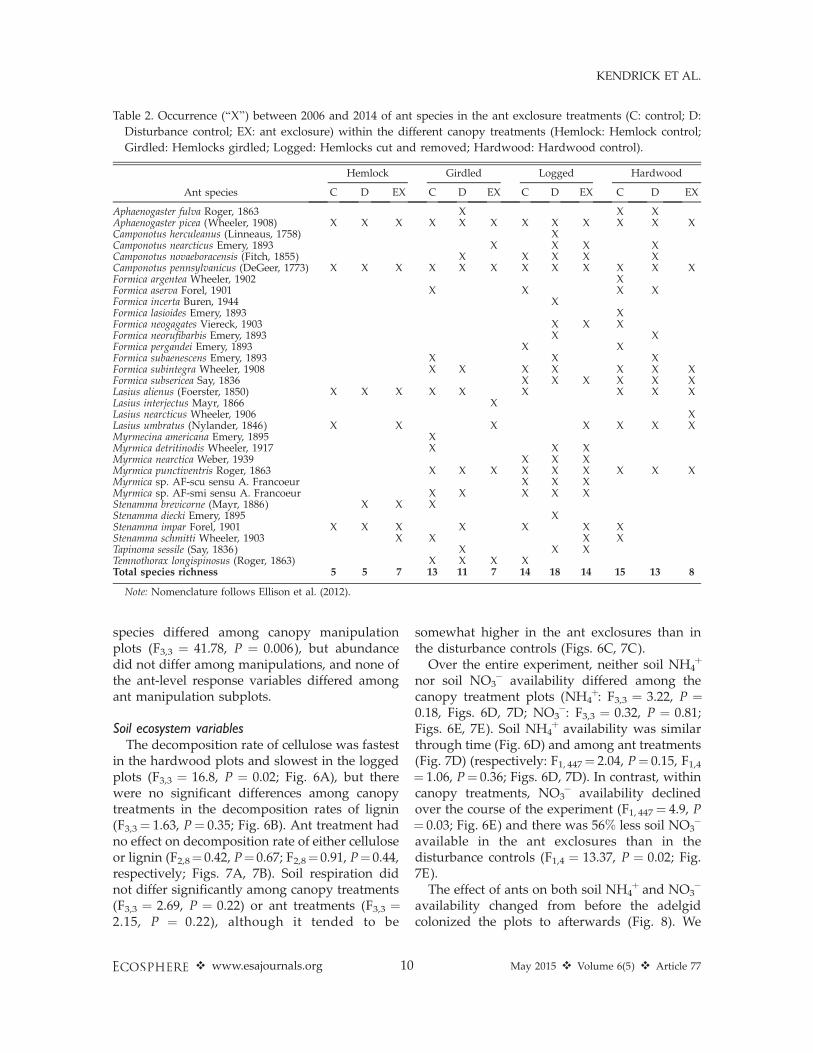
AntsNearly 2,500 individual ants representing 32
species and nine genera were collected frompitfall traps over the course of the experiment(Table 2). Aphaenogaster picea and Camponotuspennsylvanicus were the most common species,together accounting for more than 50% ofindividuals collected. Other common speciesincluded Formica subsericea, Lasius umbratus andMyrmica punctiventris, each representing morethan 100 individuals. No Formica species werecollected in the hemlock control plots.
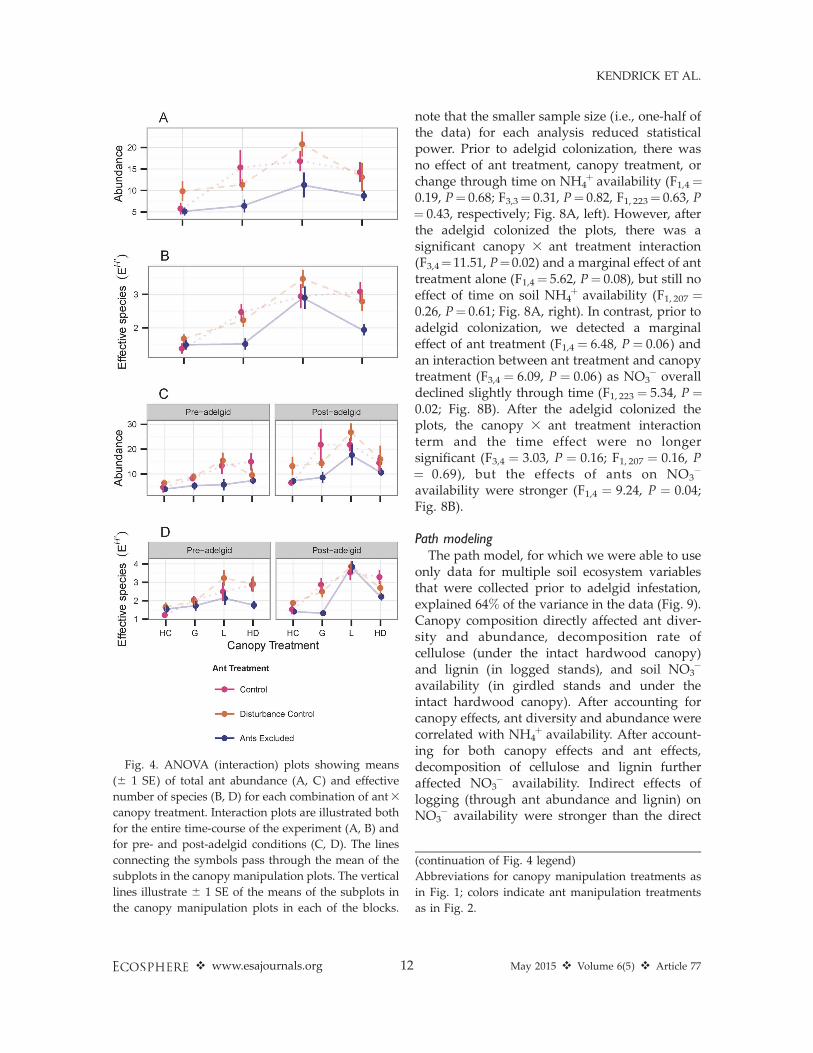
Overall, ant abundance and effective numberof species all increased significantly between2006 and 2014 (respectively: F1, 191 ¼ 44.5; F1, 191¼ 33.0; all P , 0.001; Fig. 3). Within canopymanipulation plots, ant abundance was signifi-cantly lower in the exclosures than in either thecontrols or disturbance controls (F2,8 ¼ 6.26, P ¼0.02; Fig. 4A): 35, 52, 40, and 36% in the hemlockcontrol, girdled, logged, and hardwood controlplots, respectively. Ant diversity (expressed asthe effective number of ant species [Fig. 4B]) washighest in the logged and girdled plots andlowest in the hemlock control plots (F3,3¼ 15.78,P ¼ 0.02), but did not differ among the antexclosure subplots (F2,8¼ 2.92, P¼ 0.11). Overall,ant assemblage composition remained relativelyconstant over the course of the experiment inboth the hemlock and hardwood control plots,but in the girdled and logged plots, speciesaccumulated through time (Figs. 3, 5; Table 3).These changes were much more pronounced inthe ant control and disturbance-control subplotsthan in the ant exclosures (Fig. 5).
Differences in responses of ants to canopymanipulations and subplot treatments also dif-fered before and after the adelgid colonized HF-HeRE. Through 2009, before the adelgid colo-nized these plots, abundance differed amongtreatments, and was much lower in the antexclosures than in either the controls or distur-bance controls (F2,8 ¼ 7.10, P ¼ 0.017; Fig. 4C).Prior to the arrival of the adelgid, effectivenumber of species also was lower in the antexclosures in all but the logged treatment, thoughthe effect was marginally significant (F2,8 ¼ 3.77,P ¼ 0.07; Fig. 4D). After 2010, when the adelgidwas present in the plots, effective number of
Table 1. Large (.j0.2j) loadings of the first two
principal component scores for the understory
vegetation sampled along transects in the Harvard
Forest Hemlock Removal Experiment.
Species PC-1 PC-2
Lysimachia borealis (Raf.) U. Manns & A.Anderb.
�0.30 . . .
Aralia nudicaulis L. �0.29 . . .Dendrolycopodium obscurum (L.) A. Haines �0.29 . . .Maianthemum canadense (Desf.) Greene �0.28 . . .Mitchella repens L. �0.26 . . .Dennstaedtia punctilobula (Michx.) T. Moore �0.25 . . .Huperzia lucidula (Michx.) Trevis. �0.22 . . .Oclemena acuminata (Michx.) Greene �0.20 . . .Rhododendron periclymenoides (Michx.)
Shinners. . . �0.35
Ilex verticillata (L.) Gray . . . �0.34Berberis thunbergii DC. . . . �0.32Epigaea repens L. . . . �0.32Lonicera canadensis Bartr. ex. Marsh. . . . �0.32Lysimachia qauadriflora Sims. . . . �0.32Osmundastrum cinnamomea (L.) C. Presl. . . . þ0.22
Notes: Species are sorted by absolute value of the loadings.Nomenclature follows Haines (2011).
v www.esajournals.org 9 May 2015 v Volume 6(5) v Article 77
KENDRICK ET AL.
species differed among canopy manipulationplots (F3,3 ¼ 41.78, P ¼ 0.006), but abundancedid not differ among manipulations, and none ofthe ant-level response variables differed amongant manipulation subplots.
Soil ecosystem variablesThe decomposition rate of cellulose was fastest
in the hardwood plots and slowest in the loggedplots (F3,3 ¼ 16.8, P ¼ 0.02; Fig. 6A), but therewere no significant differences among canopytreatments in the decomposition rates of lignin(F3,3¼ 1.63, P¼ 0.35; Fig. 6B). Ant treatment hadno effect on decomposition rate of either celluloseor lignin (F2,8¼ 0.42, P¼ 0.67; F2,8¼ 0.91, P¼ 0.44,respectively; Figs. 7A, 7B). Soil respiration didnot differ significantly among canopy treatments(F3,3 ¼ 2.69, P ¼ 0.22) or ant treatments (F3,3 ¼2.15, P ¼ 0.22), although it tended to be
somewhat higher in the ant exclosures than inthe disturbance controls (Figs. 6C, 7C).
Over the entire experiment, neither soil NH4þ
nor soil NO3� availability differed among the
canopy treatment plots (NH4þ: F3,3 ¼ 3.22, P ¼
0.18, Figs. 6D, 7D; NO3�: F3,3 ¼ 0.32, P ¼ 0.81;
Figs. 6E, 7E). Soil NH4þ availability was similar
through time (Fig. 6D) and among ant treatments(Fig. 7D) (respectively: F1, 447¼ 2.04, P¼ 0.15, F1,4¼ 1.06, P¼ 0.36; Figs. 6D, 7D). In contrast, withincanopy treatments, NO3
� availability declinedover the course of the experiment (F1, 447¼ 4.9, P¼ 0.03; Fig. 6E) and there was 56% less soil NO3
�
available in the ant exclosures than in thedisturbance controls (F1,4 ¼ 13.37, P ¼ 0.02; Fig.7E).
The effect of ants on both soil NH4þ and NO3
�
availability changed from before the adelgidcolonized the plots to afterwards (Fig. 8). We
Table 2. Occurrence (‘‘X’’) between 2006 and 2014 of ant species in the ant exclosure treatments (C: control; D:
Disturbance control; EX: ant exclosure) within the different canopy treatments (Hemlock: Hemlock control;
Girdled: Hemlocks girdled; Logged: Hemlocks cut and removed; Hardwood: Hardwood control).
Ant species
Hemlock Girdled Logged Hardwood
C D EX C D EX C D EX C D EX
Aphaenogaster fulva Roger, 1863 X X XAphaenogaster picea (Wheeler, 1908) X X X X X X X X X X X XCamponotus herculeanus (Linneaus, 1758) XCamponotus nearcticus Emery, 1893 X X X XCamponotus novaeboracensis (Fitch, 1855) X X X X XCamponotus pennsylvanicus (DeGeer, 1773) X X X X X X X X X X X XFormica argentea Wheeler, 1902 XFormica aserva Forel, 1901 X X X XFormica incerta Buren, 1944 XFormica lasioides Emery, 1893 XFormica neogagates Viereck, 1903 X X XFormica neorufibarbis Emery, 1893 X XFormica pergandei Emery, 1893 X XFormica subaenescens Emery, 1893 X X XFormica subintegra Wheeler, 1908 X X X X X X XFormica subsericea Say, 1836 X X X X X XLasius alienus (Foerster, 1850) X X X X X X X X XLasius interjectus Mayr, 1866 XLasius nearcticus Wheeler, 1906 XLasius umbratus (Nylander, 1846) X X X X X X XMyrmecina americana Emery, 1895 XMyrmica detritinodis Wheeler, 1917 X X XMyrmica nearctica Weber, 1939 X X XMyrmica punctiventris Roger, 1863 X X X X X X X X XMyrmica sp. AF-scu sensu A. Francoeur X X XMyrmica sp. AF-smi sensu A. Francoeur X X X X XStenamma brevicorne (Mayr, 1886) X X XStenamma diecki Emery, 1895 XStenamma impar Forel, 1901 X X X X X X XStenamma schmitti Wheeler, 1903 X X X XTapinoma sessile (Say, 1836) X X XTemnothorax longispinosus (Roger, 1863) X X X XTotal species richness 5 5 7 13 11 7 14 18 14 15 13 8
Note: Nomenclature follows Ellison et al. (2012).
v www.esajournals.org 10 May 2015 v Volume 6(5) v Article 77
KENDRICK ET AL.

Fig. 3. Effects of ant and canopy manipulations on ant species composition the Harvard Forest Hemlock
Removal Experiment. (A) Temporal changes in mean abundance of eight ant genera in each of the three ant
manipulation 3 four canopy manipulation treatments. The black line represents total abundance: the sum of
abundances of individual genera. (B) Temporal changes in effective number of species in each of the three ant
manipulations (different line types) 3 four canopy treatments (colors). Abbreviations for canopy manipulation
treatments as in Fig. 1.
v www.esajournals.org 11 May 2015 v Volume 6(5) v Article 77
KENDRICK ET AL.
note that the smaller sample size (i.e., one-half ofthe data) for each analysis reduced statisticalpower. Prior to adelgid colonization, there wasno effect of ant treatment, canopy treatment, orchange through time on NH4
þ availability (F1,4¼0.19, P¼ 0.68; F3,3¼ 0.31, P¼ 0.82, F1, 223¼ 0.63, P¼ 0.43, respectively; Fig. 8A, left). However, afterthe adelgid colonized the plots, there was asignificant canopy 3 ant treatment interaction(F3,4¼11.51, P¼0.02) and a marginal effect of anttreatment alone (F1,4¼ 5.62, P¼ 0.08), but still noeffect of time on soil NH4
þ availability (F1, 207 ¼0.26, P¼ 0.61; Fig. 8A, right). In contrast, prior toadelgid colonization, we detected a marginaleffect of ant treatment (F1,4 ¼ 6.48, P ¼ 0.06) andan interaction between ant treatment and canopytreatment (F3,4 ¼ 6.09, P ¼ 0.06) as NO3
� overalldeclined slightly through time (F1, 223¼ 5.34, P ¼0.02; Fig. 8B). After the adelgid colonized theplots, the canopy 3 ant treatment interactionterm and the time effect were no longersignificant (F3,4 ¼ 3.03, P ¼ 0.16; F1, 207 ¼ 0.16, P¼ 0.69), but the effects of ants on NO3
�
availability were stronger (F1,4 ¼ 9.24, P ¼ 0.04;Fig. 8B).
Path modelingThe path model, for which we were able to use
only data for multiple soil ecosystem variablesthat were collected prior to adelgid infestation,explained 64% of the variance in the data (Fig. 9).Canopy composition directly affected ant diver-sity and abundance, decomposition rate ofcellulose (under the intact hardwood canopy)and lignin (in logged stands), and soil NO3
�
availability (in girdled stands and under theintact hardwood canopy). After accounting forcanopy effects, ant diversity and abundance werecorrelated with NH4
þ availability. After account-ing for both canopy effects and ant effects,decomposition of cellulose and lignin furtheraffected NO3
� availability. Indirect effects oflogging (through ant abundance and lignin) onNO3
� availability were stronger than the direct
Fig. 4. ANOVA (interaction) plots showing means
(6 1 SE) of total ant abundance (A, C) and effective
number of species (B, D) for each combination of ant3
canopy treatment. Interaction plots are illustrated both
for the entire time-course of the experiment (A, B) and
for pre- and post-adelgid conditions (C, D). The lines
connecting the symbols pass through the mean of the
subplots in the canopy manipulation plots. The vertical
lines illustrate 6 1 SE of the means of the subplots in
the canopy manipulation plots in each of the blocks.
(continuation of Fig. 4 legend)
Abbreviations for canopy manipulation treatments as
in Fig. 1; colors indicate ant manipulation treatments
as in Fig. 2.
v www.esajournals.org 12 May 2015 v Volume 6(5) v Article 77
KENDRICK ET AL.

effects (dotted line in Fig. 9). Because ant
assemblage data were transformed to differences
from controls prior to path analysis, path model
effects are complimentary, but not directly
comparable to ANCOVA results.
DISCUSSION
The loss of dominant species in forests caused
by species invasions and human activities can
have direct impacts on ecosystem processes, but
the differences between impacts attributable to
Fig. 5. Ant assemblage composition through time in each of the three ant manipulation 3 four canopy
manipulation treatments in the valley (black) and ridge (red) blocks. Trajectories end in 2014 at the points of the
arrows. See Table 3 for loadings on each of these principal axes. Abbreviations for canopy manipulation
treatments as in Fig. 1.
v www.esajournals.org 13 May 2015 v Volume 6(5) v Article 77
KENDRICK ET AL.

direct changes in forest structure and those
attributable to subsequent shifts in associated
faunal assemblages have not been quantified
previously. Here, we manipulated forest canopy
cover at hectare scales and simultaneously
manipulated abundance of ground-dwelling ants
at meter scales to explore how loss of Tsuga
canadensis—a foundation species—altered soil
ecosystem variables both directly and indirectly
via canopy effects on ant assemblages. The large
spatial and temporal scale of the experiment
limited the number of replicate plots (but we
note that from the perspective of a 4-mm long
Table 3. Large (.j0.2j) loadings of the first two
principal component scores for the ant assemblages
from the ant manipulation subplots in the Harvard
Forest Hemlock Removal Experiment.
Species PC-1 PC-2
Camponotus pennsylvanicus 0.56 . . .Formica neogagates 0.46 . . .Formica subintegra 0.49 . . .Formica incerta 0.34 . . .Myrmica punctiventris . . . 0.65Stenamma diecki . . . 0.39Tapinoma sessile . . . 0.38Myrmica sp. AF-smi . . . 0.37Lasius nearcticus . . . 0.28
Note: Species are sorted by absolute value of the loadings.
Fig. 6. Time-series plots of differences among soil ecosystem variables as a function of canopy and ant
manipulation treatments on cellulose decomposition (A), lignin decomposition (B), soil respiration (C),
ammonium (NH4þ) availability (D) and nitrate (NO3
�) availability (E). Colors and line types as in Fig. 3B. Note
that data for soil respiration, NH4þ availability, and NO3
� availability are presented as differences from ant
manipulation controls. Abbreviations for canopy manipulation treatments as in Fig. 1.
v www.esajournals.org 14 May 2015 v Volume 6(5) v Article 77
KENDRICK ET AL.

[‘‘medium-sized’’] ant a ca. 1-ha plot is about the
same size as the five-borough New York City
area is to an individual person), but it was still
possible to analyze the design as a split-plot
ANCOVA (Ellison et al. 2005b), which we used to
identify differences among treatments that are
expected to occur as T. canadensis declines
throughout eastern North America.
The ant exclosures successfully reduced ant
abundance (Figs. 3, 4; see also Wardle et al. 2011)
while having no significant effects on vegetation
composition or structure (Fig. 2). Other inverte-
brates also were likely excluded by the treat-
ments, but given the large decline in ant
abundance and their known effects on forest
soils in northeast North America (Lyford 1963)
and elsewhere (Frouz et al. 2008, Jılkova et al.
2011, Wardle et al. 2011, Del Toro et al. 2012), it
seems reasonable to infer that the differences we
observed in soil ecosystem variables between the
exclosure and control subplots can be attributed
to changes in ant activity ultimately caused by
the canopy manipulations (Fig. 9). The changes
that we observed in ant assemblages (Figs. 3, 5;
Fig. 7. ANOVA (interaction) plots of the effects of canopy and ant manipulation treatments on cellulose
decomposition (A), lignin decomposition (B), soil respiration (C), ammonium (NH4þ) availability (D) and nitrate
(NO3�) availability (E). Symbols and lines as in Fig. 4. These analyses were done over the entire time-course of
the available data. As in Fig. 6, data shown are differences from ant manipulation controls for soil respiration,
NH4þ availability, and NO3
� availability. Abbreviations for canopy manipulation treatments as in Fig. 1; colors
indicate ant manipulation treatments as in Fig. 2.
v www.esajournals.org 15 May 2015 v Volume 6(5) v Article 77
KENDRICK ET AL.

see also Ellison et al. 2005a, Rohr et al. 2009,Sackett et al. 2011, Ribbons 2014), nitrogenavailability, energy flux, decomposition rates,and plant assemblages (Figs. 2, 6�8; see alsoOrwig et al. 2008, 2013) as a function of thecanopy manipulations were consistent withprevious observational studies. In addition, wewere able for the first time to determine thatcellulose decomposition was affected directly bychanges in forest canopy structure (a proxy forassociated environmental changes, such aschanges in light availability [Fig. 1] and temper-ature at the forest floor), whereas soil nitrateavailability was indirectly enhanced by reductionin abundance of ground-dwelling ants (Fig. 9).
Changes in soil ecosystem variables directlyattributable to canopy-level changes most likelyreflect changes in microclimate such as temper-
ature and moisture (Lustenhouwer et al. 2012).Cellulose decomposition was relatively high inhardwood control plots and relatively low in thelogged plots, where warmer and drier conditionsslow decomposition (see also Donnelly et al.1990). The results of our path model (Fig. 9)further indicate that decomposition of bothcellulose and lignin can strongly affect NO3
�
availability, with more rapid decompositionassociated with higher availability. Effects ofhemlock decline on microclimate and decompo-sition may also reduce NO3
� availability inde-pendent of any effects of associated changes inant activity. We note that we measured decom-position only over a relatively short period oftime using standard substrates and only threeyears after canopy manipulations were complete.Effects of T. canadensis loss on soil microclimateand the biotic community will continue tochange, and possibly increase, over time. Vege-tation data from this study also confirmed thatexperimental removal of T. canadensis affectsplant community composition (Fig. 2; see alsoFarnsworth et al. 2012 and Orwig et al. 2013),which might alter plant nitrogen uptake from thesoil pool. However, ant exclosures did not altersmall-scale plant assemblages independently ofthe effects of the canopy manipulations (Fig. 2).
Among the soil ecosystem variables that wemeasured, exclusion of ants reduced only soilNO3
� availability (see also Del Toro et al. 2015).Initially, we hypothesized that ant activity wouldincrease soil nitrogen availability directly byincreasing the rate of nitrogen recycling viadecomposition, especially given that the mostcommonly observed species are known to nest inrotting wood (Ellison et al. 2012). However,differences in ant abundance between ant ex-closures and their associated controls had nosignificant effect on decomposition rates. Analternative explanation for the effects of ants onNO3
� availability parallels observations made byJılkova and Frouz (2014). They suggested thatants may increase soil N locally through ‘‘micro-bial priming’’ (sensu Cheng 1999) when theybring honeydew and other insect exudates totheir nests. In fact, the more common Formicaspecies in our girdled and logged plots do tendaphids and scale insects on seedlings, saplings,and trees (Marquis et al. 2014); this honeydewcould be contributing to increased NO3
� avail-
Fig. 8. ANOVA (interaction) plots of the effects of
canopy and ant manipulation treatments on ammoni-
um (NH4þ) availability (A) and nitrate (NO3
�) avail-
ability (B) before and after the adelgid colonized the
canopy manipulation plots. These analyses were done
on differences from ant manipulation controls. Abbre-
viations for canopy manipulation treatments as in Fig.
1; colors indicate ant manipulation treatments as in
Fig. 2; lines as in Fig. 4.
v www.esajournals.org 16 May 2015 v Volume 6(5) v Article 77
KENDRICK ET AL.

ability outside of the ant exclosures. We note
further that Formica species were not collected in
any of the ant manipulation subplots within the
hemlock control plots (see also Ellison et al.
2005a). Soil and litter bioturbation by ants
foraging and building nests may also alter
nutrient cycling patterns, aerate the soil, and
increase the movement of soil water (Nkem et al.
2000)—all activities that may increase microbial
activity. We hypothesize that as large-scale loss of
T. canadensis continues, that increasing abun-
dance of Formica species will lead to increased
soil NO3� availability. This process could be
important in these transitioning ecosystems as
ants may facilitate nutrient retention when plant
biomass (and thus nutrient uptake) is reduced.
Clearly, the loss of foundation species will have
direct impacts on ecosystem function, but indi-
rect effects, such as shifts in species interactions,
while less studied, also may shape ecosystems
recovery following disturbance. Our data indi-
cate that changes in ant abundance can regulate
some soil ecosystem variables in forests, but it
remains an open question if these patterns will
scale over time to influence the trajectory of
ecosystems after the loss of T. canadensis.
ACKNOWLEDGMENTS
We thank: Jess Butler, Tony D’Amato, Lucas Griffith,Clarisse Hart, Jim Karagatzides, and Mike Pelini forhelping us install and maintain the ant exclosures;Matt Lau, Liza Nicoll, and Ahmed Siddiq for helptaking and analyzing canopy photographs; AmyBalint, Grace Barber, Kyle Chen, Ally DeGrassi, YvanDelgado, Israel Del Toro, Alyssa Hernandez, JamesLeitner, Sydne Record, and Ernesto Rodriguez forcollecting and sorting ants; Kyle Chen, ErnestoRodriguez, and Kathleen Savage for collecting the soilrespiration data; Jess Butler, Matt Lau, Heidi Lux,Manisha Patel, Mike Pelini, and Haley Smith forcollecting resin capsules and running nitrogen analy-ses; Courtney Patterson, Nick Reynolds, and HaleySmith for help with collecting the decomposition data;and Grace Barber, Audrey Barker Plotkin, BetsyColburn, David Foster, Brian Hall, Matt Lau, DaveOrwig, and Neil Pederson for helpful comments andcritiques of early versions of the manuscript. Thisexperiment was supported in part by NSF grants0400759, 0452254, 0620443, 0930516, 1003938, and1237491. HF-HeRE is a core experiment of the HarvardForest Long-Term Ecological Research Site.
LITERATURE CITED
Albani, M., P. R. Moorcroft, A. M. Ellison, D. A. Orwig,and D. R. Foster. 2010. Predicting the impact of
Fig. 9. Direct and indirect effects of canopy structure and ant assemblages on soil ecosystem variables prior to
adelgid colonization of the plots examined with partial least squares path modeling. Arrows represent all
hypothesized relationships. Relationships with a direct or indirect effect .0.3 are labeled and colored; blue
arrows indicate positive relationships whereas red arrows indicate negative relationships (all relative to hemlock
controls). The dashed line indicates that the indirect effect of logging on NO3� is greater than its direct effect.
Shading of Canopy Treatment and Decomposition sections is for clarity only.
v www.esajournals.org 17 May 2015 v Volume 6(5) v Article 77
KENDRICK ET AL.

hemlock woolly adelgid on carbon dynamics ofeastern U.S. forests. Canadian Journal of ForestResearch 40:119–133.
Baiser, B., N. Whitaker, and A. M. Ellison. 2013.Modeling foundation species in food webs. Eco-sphere 4:146.
Bardgett, R. D., and D. A. Wardle. 2010. Aboveground-belowground linkages: biotic interactions, ecosys-tem processes, and global change. Oxford Univer-sity Press, New York, New York, USA.
Brown, D. R., and T. Weinka. 2014. Predicting birdcommunity changes to invasion of hemlock woollyadelgid in Kentucky. Southeastern Naturalist13(Special Issue 6):104–116.
Catovsky, S., and F. Bazzaz. 2000. The role of resourceinteractions and seedling regeneration in maintain-ing a positive feedback in hemlock stands. Journalof Ecology 88:100–112.
Chao, A., N. J. Gotelli, T. C. Hsieh, E. L. Snader, K. H.Ma, R. K. Colwell, and A. M. Ellison. 2014.Rarefaction and extrapolation with Hill numbers:a framework for sampling and estimation inspecies diversity studies. Ecological Monographs84:45–67.
Cheng, W. X. 1999. Rhizosphere feedbacks in elevatedCO2. Tree Physiology 19:313–320.
Dakos, V., S. R. Carpenter, W. A. Brock, A. M. Ellison,V. Guttal, A. R. Ives, S. Kefi, V. Livina, D. A. Seekell,E. H. van Nes, and M. Scheffer. 2012. Methods fordetecting early warnings of critical transitions intime series illustrated using simulated ecologicaldata. PLoS ONE 7:e41010.
Dayton, P. K. 1972. Toward an understanding ofcommunity resilience and the potential effects ofenrichments to the benthos at McMurdo Sound,Antarctica. Pages 81–95 in B. Parker, editor.Proceedings of the colloquium on conservationproblems in Antarctica. Allen Press, Lawrence,Kansas, USA.
Del Toro, I., R. R. Ribbons, and A. M. Ellison. 2015.Ant-mediated ecosystem functions on a warmerplanet: effects on soil movement, decompositionand nutrient cycling. Journal of Animal Ecology, inpress. doi:10.1111/1365-2656.12367
Del Toro, I., R. R. Ribbons, and S. L. Pelini. 2012. Thelittle things that run the world revisited: a review ofant-mediated ecosystem services and disservices(Hymenoptera: Formicidae). MyrmecologicalNews 17:133–146.
Dilling, C., P. Lambdin, J. Grant, and L. Buck. 2007.Insect guild structure associated with easternhemlock in the southern Appalachians. Environ-mental Entomology 36:1408–1414.
Donnelly, P. K., J. A. Entry, D. L. Crawford, and K.Cromack, Jr. 1990. Cellulose and lignin degradationin forest soils: response to moisture, temperature,and acidity. Microbial Ecology 20:289–295.
Ellison, A. M., and B. Baiser. 2014. Hemlock as afoundation species. Pages 93–104 in D. R. Foster,editor. Hemlock: a forest giant on the edge. YaleUniversity Press, New Haven, Connecticut, USA.
Ellison, A. M., Barker Plotkin, A. A. D. R. Foster, andD. A. Orwig. 2010. Experimentally testing the roleof foundation species in forests: the Harvard ForestHemlock Removal Experiment. Methods in Ecolo-gy and Evolution 1:168–179.
Ellison, A. M., J. Chen, D. Dıaz, C. Kammerer-Burnham, and M. Lau. 2005a. Changes in antcommunity structure and composition associatedwith hemlock decline in New England. Pages 280–289 in B. Onken and R. Reardon, editors. Proceed-ings of the 3rd Symposium on hemlock woollyadelgid in the eastern United States. USDA ForestService, Forest Health Technology Enterprise Team,Morgantown, West Virginia, USA.
Ellison, A. M., et al. 2005b. Loss of foundation species:consequences for the structure and dynamics offorested ecosystems. Frontiers in Ecology and theEnvironment 3:479–486.
Ellison, A. M., N. J. Gotelli, E. J. Farnsworth, and G. D.Alpert. 2012. A field guide to the ants of NewEngland. Yale University Press, New Haven,Connecticut, USA.
Ellison, A. M., M. Lavine, P. B. Kerson, Barker Plotkin,A. A. and D. A. Orwig. 2014. Building a founda-tion: land-use history and dendrochronology revealtemporal dynamics of a Tsuga canadensis (Pinaceae)forest. Rhodora 116:377–427.
Farnsworth, E. J., Barker Plotkin, A. A. and A. M.Ellison. 2012. The relative contributions of seedbank, seed rain, and understory vegetation dy-namics to the reorganization of Tsuga canadensisforests after loss due to logging or simulated attackby Adelges tsugae. Canadian Journal of ForestResearch 42:2090–2105.
Ford, C., and J. Vose. 2007. Tsuga canadensis (L.) Carr.mortality will impact hydrological processes insouthern Appalachian forest ecosystems. Ecologi-cal Applications 17:1156–1167.
Foster, D. R., and D. A. Orwig. 2006. Pre-emptive andsalvage harvesting of New England forests: whendoing nothing is a viable alternative. ConservationBiology 20:959–970.
Frouz, J., M. Rybrucek, P. Cudlın, and E. Chmelikova.2008. Influence of the wood ant, Formica polyctena,on soil nutrient and the spruce tree growth. Journalof Applied Entomology 132:281–284.
Garcia, R. A., M. Cabeza, C. Rahbek, and M. B. Araujo.2014. Multiple dimensions of climate change andtheir implications for biodiversity. Science344:1247579.
Giasson, M.-A., et al. 2013. Soil respiration in anortheastern US temperate forest: a 22-year syn-thesis. Ecosphere 4:140.
v www.esajournals.org 18 May 2015 v Volume 6(5) v Article 77
KENDRICK ET AL.

Haines, A. 2011. Flora Novae Angliae: a manual for theidentification of native and naturalized highervascular plants of New England. Yale UniversityPress, New Haven, Connecticut, USA.
Hurlbert, S. H. 1984. Pseudoreplication and the designof ecological field experiments. Ecological Mono-graphs 54:187–211.
Jılkova, V., and J. Frouz. 2014. Contribution of ant andmicrobial respiration to CO2 emission from woodant (Formica polyctena) nests. European Journal ofSoil Biology 60:44–48.
Jılkova, V., L. Matejicek, and J. Frouz. 2011. Changes inthe pH and other soil chemical parameters in soilsurrounding wood ant (Formica polyctena) nests.European Journal of Soil Biology 47:72–76.
Lustenhouwer, M. N., L. Nicoll, and A. M. Ellison.2012. Microclimatic effects of the loss of a founda-tion species from New England forests. Ecosphere3:26.
Lyford, W. H. 1963. Importance of ants to brownpodzolic soil genesis in New England. HarvardForest Paper 7:1–18.
Marquis, M., I. Del Toro, and S. L. Pelini. 2014. Insectmutualisms buffer warming effects on multipletrophic levels. Ecology 95:9–13.
Mathewson, B. G. 2009. Eastern red-backed salaman-der relative abundance in eastern hemlock-domi-nated and mixed deciduous forests at the HarvardForest. Northeastern Naturalist 16:1–12.
Mathewson, B. G. 2014. The relative abundance of thejuvenile phase of the eastern red-spotted newt atHarvard Forest prior to the arrival of the hemlockwoolly adelgid. Southeastern Naturalist 13(SpecialIssue 6):117–129.
Muggeo, V. M. R. 2014. Segmented relationships inregression models with breakpoints/changepointsestimation. http://cran.r-roject.org/web/packages/segmented/segmented.pdf
Nkem, J. N., L. A. Lobry de Bruyn, C. D. Grant, andN. R. Hulugalle. 2000. The impact of ant bioturba-tion and foraging activities on surrounding soilproperties. Pedobiologia 44:609–621.
Orwig, D. A., Barker Plotkin, A. A. E. A. Davidson, H.Lux, K. E. Savage, and A. M. Ellison. 2013.Foundation species loss affects vegetation structuremore than ecosystem function in a northeasternUSA forest. PeerJ 1:e41.
Orwig, D. A., R. C. Cobb, A. W. D’Amato, M. L.Kizlinski, and D. R. Foster. 2008. Multi-yearecosystem response to hemlock woolly adelgid
infestation in southern New England forests.Canadian Journal of Forest Research 38:834–843.
R Core Team. 2014. R: A language and environmentfor statistical computing. R Foundation for Statis-tical Computing, Vienna, Austria.
Ribbons, R. R. 2014. Community responses to easternhemlock loss across a latitudinal gradient. South-eastern Naturalist 13(Special Issue 6):88–103.
Rich, P. M. 1989. A manual for analysis of hemispher-ical canopy photography. Los Alamos TechnicalManual LA-11733-M. Los Alamos National Labo-ratory, Los Alamos, New Mexico, USA.
Rohr, J., C. Mahan, and K. Kim. 2009. Response ofarthropod biodiversity to foundation species de-clines: the case of the eastern hemlock. ForestEcology and Management 258:1503–1510.
Sackett, T. E., S. Record, S. Bewick, B. Baiser, N. J.Sanders, and A. M. Ellison. 2011. Response ofmacroarthropod assemblages to the loss of hem-lock (Tsuga canadensis), a foundation species.Ecosphere 2:74.
Sanchez, G. 2013. PLS Path Modeling with R. http://www.gastonsanchez.com/PLS_Path_Modeling_with_R.pdf
Stadler, B., T. Muller, and D. Orwig. 2006. The ecologyof energy and nutrient fluxes in hemlock forestsinvaded by hemlock woolly adelgid. Ecology87:1792–1804.
Stadler, B., T. Muller, D. Orwig, and R. Cobb. 2005.Hemlock woolly adelgid in New England forests:canopy impacts transforming ecosystem processesand landscapes. Ecosystems 8:233–247.
Stuble, K. L., C. M. Patterson, M. A. Rodriguez-Cabal,R. R. Ribbons, R. R. Dunn, and N. J. Sanders. 2014.Ant-mediated seed dispersal in a warmed world.PeerJ 2:e286.
Tingley, M. W., D. A. Orwig, G. Motzkin, D. R. Foster,and R. Field. 2002. Avian response to removal of aforest dominant: consequences of hemlock woollyadelgid infestations. Journal of Biogeography29:1505–1516.
Wardle, D. A., F. Hyodo, R. D. Bardgett, G. W. Yeates,and M.-C. Nilsson. 2011. Long-term abovegroundand belowground consequences of red wood antexclusion in boreal forest. Ecology 93:645–656.
Yorks, T. E., D. J. Leopold, and D. J. Raynal. 2003.Effects of Tsuga canadensis mortality on soil waterchemistry and understory vegetation: possibleconsequences of an invasive insect herbivore.Canadian Journal of Forest Research 33:1525–1537.
v www.esajournals.org 19 May 2015 v Volume 6(5) v Article 77
KENDRICK ET AL.

SUPPLEMENTAL MATERIAL
SUPPLEMENT
R code, extended statistical output, and additional graphics are available online (Ecological Archives,http://dx.doi.org/10.1890/ES14-00447.1.sm).
v www.esajournals.org 20 May 2015 v Volume 6(5) v Article 77
KENDRICK ET AL.