Challenges and approaches to integrating intermittent power: A comparative analysis between roadmaps...
44
Marie Curie Actions – International Fellowships Project n°: 295130 Project Acronym: EC-HVEN Project Full Name: Europe-China High Value Engineering Network (EC-HVEN): Shaping Sustainable Engineering Sectors in Europe and China Marie Curie Actions WP 3: Deliverable 3.1 A comparative study of renewable energy industries in Europe and China Period covered: from 1 st May 2012 to 30 th April 2014 This deliverable is fulfilled by the attached report: ‘Challenges and approaches to integrating intermittent power into national electricity grids: a comparative analysis between roadmaps for Europe and China’ Authors: Elliott More, Michelle Chen Xiao Hong, Simon Ford, David Probert, Rob Phaal The report is a comparison between European and Chinese renewable energy generation, with a particular focus on the challenges of integrating intermittent power into the national electricity grids. A case study approach is taken, directly comparing two roadmaps created to explore this issue, one produced for Europe by the European Commission in 2011, the second in China in 2013 by the TsinghuaBP Clean Energy Research and Education Center in collaboration with the Centre for Technology Management, University of Cambridge. The roadmaps are compared in terms of their context what similar and different challenges the two regions face and the roadmapping process how were the roadmaps created and who was involved.
Transcript of Challenges and approaches to integrating intermittent power: A comparative analysis between roadmaps...
Marie Curie Actions – International Fellowships
Project n°: 295130
Project Acronym: EC-HVEN
Project Full Name: Europe-China High Value Engineering Network (EC-HVEN): Shaping Sustainable Engineering Sectors in Europe and China Marie Curie Actions
WP 3: Deliverable 3.1 A comparative study of renewable energy industries in Europe and China Period covered: from 1st May 2012 to 30th April 2014
This deliverable is fulfilled by the attached report: ‘Challenges and approaches to integrating intermittent power into national electricity grids: a comparative analysis between roadmaps for Europe and China’ Authors: Elliott More, Michelle Chen Xiao Hong, Simon Ford, David Probert, Rob Phaal The report is a comparison between European and Chinese renewable energy generation, with a particular focus on the challenges of integrating intermittent power into the national electricity grids. A case study approach is taken, directly comparing two roadmaps created to explore this issue, one produced for Europe by the European Commission in 2011, the second in China in 2013 by the Tsinghua-‐BP Clean Energy Research and Education Center in collaboration with the Centre for Technology Management, University of Cambridge. The roadmaps are compared in terms of their context -‐ what similar and different challenges the two regions face -‐ and the roadmapping process -‐ how were the roadmaps created and who was involved.
Challenges and approaches to integrating intermittent power A comparative analysis between roadmaps for Europe and China
Elliott More 1 *, Michelle Chen Xiao Hong 2, Simon Ford 1,David Probert 1, Robert Phaal 1
1 : Institute for Manufacturing (IfM), University of Cambridge
2 : Tsinghua School of Public Policy and Management (SPPM)
* : Corresponding author
As fossil fuel becomes ever more scarce, and action is taken to reduce greenhouse gas emissions related to climate change, intermittent power is forming an increasing proportion of national electricity generation in many countries. However this increasing proportion poses significant technical challenges to electricity grids. Thus many nations and regions have conducted foresight exercises to plan the integration of intermittent power into existing electricity networks, developing national level roadmaps.
A foresight exercise recently conducted in China, used a technology roadmapping workshop to determine the challenges and possible solutions to integrating intermittent power in China into the future. The workshop concluded that the outlook for intermittent power in China remains strong despite the challenges.
This report first presents the findings from this recent technology roadmapping workshop. Subsequently a similar roadmap developed in 2011 for the European region is contrasted with the Chinese roadmap. Differences and similarities between the two regions’ approaches are identified and discussed by examining the differing energy and policy contexts.
Acknowledgement: The authors would like to acknowledge the contributions made by the BP-Tsinghua Clean Energy Center for their help in organising and hosting the Chinese roadmap workshop.
Keywords : Intermittent power, renewable energy, energy security, technology roadmapping, foresight, EC HVEN
3 Challenges and approaches of integrating intermittent power A comparative analysis between roadmaps for Europe and China
Elliott More et al. April 2014
Contents Introduction .................................................................................................................. 4
Economic Context ......................................................................................................... 8
Energy and Electricity Context ...................................................................................... 9
Renewable Electricity Context .................................................................................... 14
Energy Policy Context ................................................................................................. 20
Case studies ................................................................................................................ 22
Analysis and Discussion .............................................................................................. 30
Conclusion .................................................................................................................. 35
References .................................................................................................................. 37
Appendix ..................................................................................................................... 40
4 Challenges and approaches of integrating intermittent power A comparative analysis between roadmaps for Europe and China
Elliott More et al. April 2014
Introduction The People’s Republic of China (PRC or China) has risen over the last 50 years to one the major global economies. PRC is now the second largest economy after the US, and latest figures put growth at around 7% annually (The Economist 2014). This growth has largely been the result of the booming manufacturing sector (China Greentech Initiative 2013), which led many to label China as the world’s factory (for example Zhang 2006).
The boom in industrial manufacturing has gone hand in hand with rising demand for energy. China has largely turned to its cheap and readily available sources of coal to meet this demand, and as a consequence of burning this high-‐carbon fuel, China became the world’s largest emitter of greenhouse gas emissions in 2007 (IPCC 2012), and is forecast to continue increasing emissions into the future (Friedman 2012).
The majority of goods manufactured in PRC are destined for the developed countries in Europe and the US (Wiessala et al. 2009; Eloot et al. 2013). This trade is not new, indeed trade between Europe and China has a long history. Trade existed between the Roman Empire and China more than 2,000 years ago for silk and gold, before stagnating as China became more developed and reduced its imports (Innes Miller 1969). However after a long decline in the Chinese economy relative to other countries, the last decades have seen strong economic growth, and EU-‐China relations are now of great importance; China is the second biggest trade partner of the EU after the US, is the largest market for imports and is the fourth largest for exports (as of 2007) (Wiessala et al. 2009).
Since the formation of the People’s Republic of China (PRC) sixty years ago, there have been two distinct periods. Rigid policies in the first period meant that exports and imports were not linked to relative prices or comparative advantage. These policies were reversed after 1978, when China began a slow but deliberate integration into the world economy. (Wiessala et al. 2009)
EU-‐China merchandise trade has risen sharply since the millennium, aided by China joining the World Trade Organisation in 2001. In the years 1999-‐2007 imports into the EU from China quadrupled in value to €230bn (Wiessala et al. 2009). Exports from the EU to China have also risen sharply, in mainly manufactured products, machinery, transport equipment, and chemicals (Wiessala et al. 2009).
Trade agreements have also proven important enablers to trade. On 2nd May 1978, the first EU-‐China Trade Agreement was signed, which was the precursor to the EC-‐China Trade and Cooperation Agreement in 1985 which is still the main legal framework for economic relations. It has since been extended twice, in 1994 and 2002. (Wiessala et al. 2009)
The trade has brought many economic benefits to both the EU and China, however recently many have voiced concerns over the imbalance. The EU has run a trade deficit with the rest of the world for many years; in 2007 this amounted to over €186bn, equivalent to 15% of total export. The lion’s share of this deficit is with PRC (just less than €160bn). (Wiessala et al. 2009)
5 Challenges and approaches of integrating intermittent power A comparative analysis between roadmaps for Europe and China
Elliott More et al. April 2014
The EU-‐China relationship has also been affected by the EU's focus on several political issues. From China's point of view, matters such as human rights, the arms embargo, and failure to recognise China's market economy status have stood in the way of building a meaningful strategic partnership (Yao 2011).
China's comparative advantage over the EU for manufacturing has largely been its abundant supply of lower wage labour, which has drawn low value manufacturing to its shores (Eloot et al. 2013). In contrast, high-‐value manufacturing has tended to remain in the EU as a result of the high-‐tech research and development (Technology Strategy Board 2012; Manyika et al. 2012).
Renewable and Intermittent Power As a result of the pressures on securing fuel supplies alongside international climate change pressure, China has invested heavily in renewable energy (China Greentech Initiative 2013; International Energy Agency 2013a). Renewables are generally defined as energy sources that come from resources which are naturally replenished on a human timescale, such as sunlight, wind, rain, tides, waves and geothermal heat (IPCC 2012).
Renewable energy has many benefits over fossil fuel energy sources. The International Energy Agency (2013c) summarises the benefits of renewables within a national energy portfolio as four fold. Energy security is strengthened through diversity of supply, and reducing energy imports that can form a geopolitical risk. Renewables are largely low-‐carbon sources of energy which reduce local air pollution and minimise greenhouse gas emissions contributing to global climate change. There are economic benefits as investment in the development and deployment of renewables can contribute significantly to sustainable economic growth. Finally, renewables play an important part in improving energy access and affordability to the 1.3 billion people currently without access to electricity, and the 2.6 billion that rely on burning biomass for energy.
Despite the significant benefits, there are many challenges to the development and deployment of renewable energy (see for example Mackay 2008; Ayres & Ayres 2009), which explains the dominance of fossil fuel use for energy in the developed countries where over 80% of energy comes from fossil fuels (Mackay 2008). One of the limitations of some renewable energy is their intermittency. Wind and solar energy in particular, whilst being to an extent predictable, cannot be relied upon to deliver energy when required (The Carbon Trust & DTI 2003). These forms of renewable energy are therefore a sub group of renewable energy and are defined as intermittent power sources (International Energy Agency 2011).
Intermittent power sources present a particular technical challenge to national electricity grids, since the variability in the power generation necessitates balancing and latency measures, such as back-‐up power or storage, which all add to the deployment cost of these renewable sources (The Carbon Trust & DTI 2003; International Energy Agency 2013b, p.208). In addition, while small amounts of intermittent power have little effect on grid operations, upgrades or even the complete redesign of the grid infrastructure can be required as the contribution
6 Challenges and approaches of integrating intermittent power A comparative analysis between roadmaps for Europe and China
Elliott More et al. April 2014
from intermittent sources grows (The Carbon Trust & DTI 2003; International Energy Agency 2011; European Commission 2011b). The speed at which renewables capacity is introduced is also important, as this influences the ability of the system to adapt through the normal investment cycle (International Energy Agency 2013b, p.209).
Despite the limitations, the pressures outlined above have contributed to a significant investment and contribution of intermittent power to national electricity grids around the world (International Energy Agency 2013c). As the share of intermittent power grows however, solutions to tackle the technical challenges of intermittency on balancing and latency require coordination between the major stakeholders in the energy industry. In devising technically feasible and economic solutions, it is necessary for energy suppliers, major energy users and regulators to come together to coordinate. One method of achieving coordinated solutions to complex problems such as this, is through the use of technology roadmapping (Phaal et al. 2010).
Technology Roadmapping Technology roadmapping is a technique that arose as a practical solution to the challenge of technology management in firms (Institute for Manufacturing 2010). There has been significant academic research into roadmapping over the last two decades since the process began to become common, first in corporate setting and later at industry and national level, see Phaal et al. (2010) for a definitive summary of the history of the technique. Two elements are important for roadmapping, the process and the structure.
The roadmapping process is a crucial element of the success of a roadmapping project. Whilst the final output of the process is a roadmap, the process is generally considered to be just as important as the roadmap (Phaal et al., 2010 p.108). Thus there has been a significant amount of research into the roadmapping process, and is widely acknowledged to be made up of three distinct elements: the preparation, the roadmap development, and the follow-‐up (e.g. see Garcia and Bray, 1997; Phaal et al., 2010).
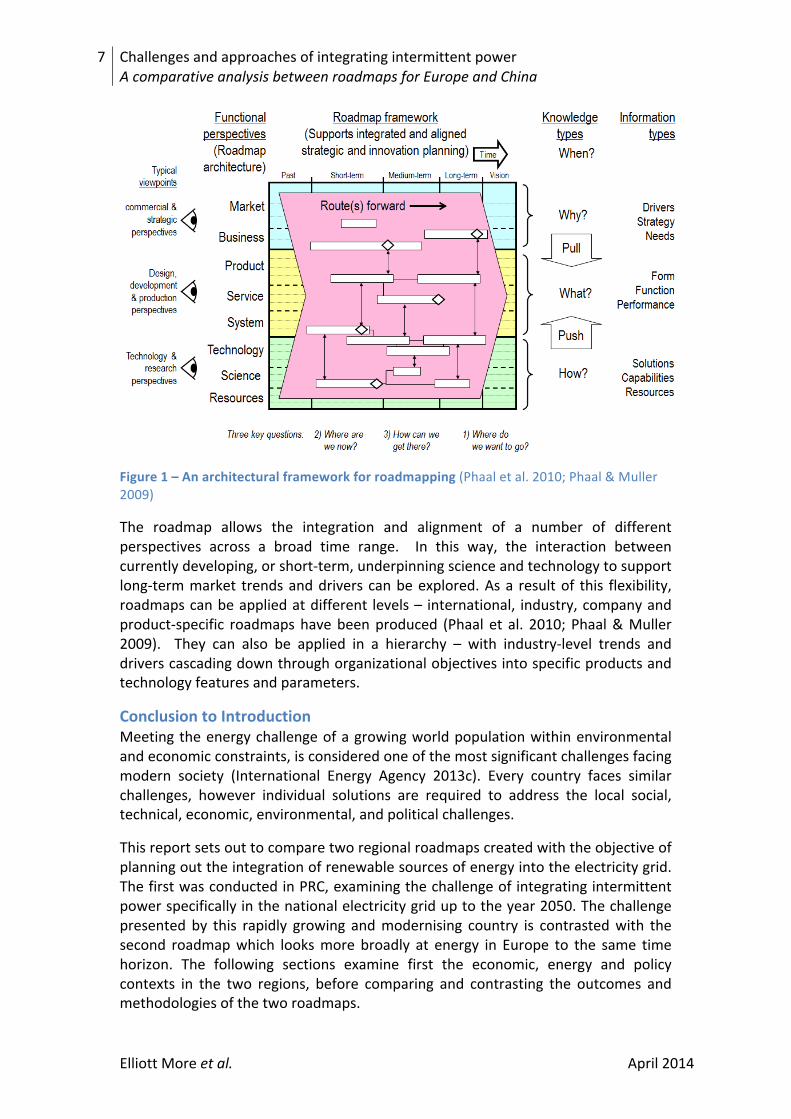
The roadmap structure is the second important element. Roadmaps provide a structured visualization of particular strategic topics. They are used to support strategic planning across a broad spectrum of applications. A common roadmap layout, or architecture, will contain two axes, as shown in Figure 1. There is a horizontal, time-‐based axis; often encompassing the past, short-‐, medium-‐ and long-‐term, as well as the vision. The vertical axis usually pertains to perspectives, or dimensions, relevant to the focal point of the roadmap; often represented as horizontal layers, forming a matrix across the time dimension. (Phaal et al. 2010)
7 Challenges and approaches of integrating intermittent power A comparative analysis between roadmaps for Europe and China
Elliott More et al. April 2014
Figure 1 – An architectural framework for roadmapping (Phaal et al. 2010; Phaal & Muller 2009)
The roadmap allows the integration and alignment of a number of different perspectives across a broad time range. In this way, the interaction between currently developing, or short-‐term, underpinning science and technology to support long-‐term market trends and drivers can be explored. As a result of this flexibility, roadmaps can be applied at different levels – international, industry, company and product-‐specific roadmaps have been produced (Phaal et al. 2010; Phaal & Muller 2009). They can also be applied in a hierarchy – with industry-‐level trends and drivers cascading down through organizational objectives into specific products and technology features and parameters.
Conclusion to Introduction Meeting the energy challenge of a growing world population within environmental and economic constraints, is considered one of the most significant challenges facing modern society (International Energy Agency 2013c). Every country faces similar challenges, however individual solutions are required to address the local social, technical, economic, environmental, and political challenges.
This report sets out to compare two regional roadmaps created with the objective of planning out the integration of renewable sources of energy into the electricity grid. The first was conducted in PRC, examining the challenge of integrating intermittent power specifically in the national electricity grid up to the year 2050. The challenge presented by this rapidly growing and modernising country is contrasted with the second roadmap which looks more broadly at energy in Europe to the same time horizon. The following sections examine first the economic, energy and policy contexts in the two regions, before comparing and contrasting the outcomes and methodologies of the two roadmaps.
8 Challenges and approaches of integrating intermittent power A comparative analysis between roadmaps for Europe and China
Elliott More et al. April 2014
Economic Context The economic context is the first dimension used to compare the PRC and the European Union (EU) region. For the sake of clarity, the EU region is the economic and political union of 28 member states that are located primarily in Europe, and the union is often referred to as EU281. The PRC statistics used in this analysis exclude Hong Kong and Taiwan.
The EU28 is the world’s largest economic entity, with a population of 505 million and a Gross Domestic Product2 (GDP) of €13 trillion in 2013 (European Commission 2014c). In comparison, PRC is the most populace country in the world with a population exceeding 1.3 billion, and a GDP of €6.8 trillion in 2013 (The World Bank 2014).
Despite the size of PRC’s economy, it is still considered a developing country since the GDP per capita stands at a relatively modest €5,000 compared to over €25,000 in EU28.
While the EU28 forms the world's largest economic entity, the size of each member state is relatively small. For instance the largest member state, Germany, has a GDP only half the size of PRC, and a fifth of the United States (US). As a result, many argue that to compete globally, and in particular to engage effectively with PRC, the EU must act as a single economic entity (see for example Yao 2011; McCormick 2008).
Economic Forecasts The latest EU economic growth forecast from the European Commission forecast slow growth in the aftermath of the financial crisis of 2008. GDP growth returned to positive in the second quarter of 2013, largely driven by domestic demand (European Commission 2014b). In comparison, the PRC economy continues to grow rapidly, and is expected to continue growing for many decades to come. According to a report by US National Intelligence Council (NIC) entitled Global Trends 2030, the Chinese economy will overtake the US as the world’s largest economy at some point between 2022 and 2030. The trio of dominant economies of US, Europe, and Japan will see their share of world trade fall to below half in 2030 (US National Intelligence Council 2012).
1 Some of the data used in this analysis refers to EU27, which refers to the 27 member states before Croatia’s accession in 2013. For the purposes of this analysis, the difference between the two is not considered significant and is therefore ignored where EU28 data cannot reasonably be found. 2 GDP (gross domestic product) is an indicator for a nation´s economic situation. It reflects the total value of all goods and services produced less the value of goods and services used for intermediate consumption in their production (European Commission 2014a).
9 Challenges and approaches of integrating intermittent power A comparative analysis between roadmaps for Europe and China
Elliott More et al. April 2014
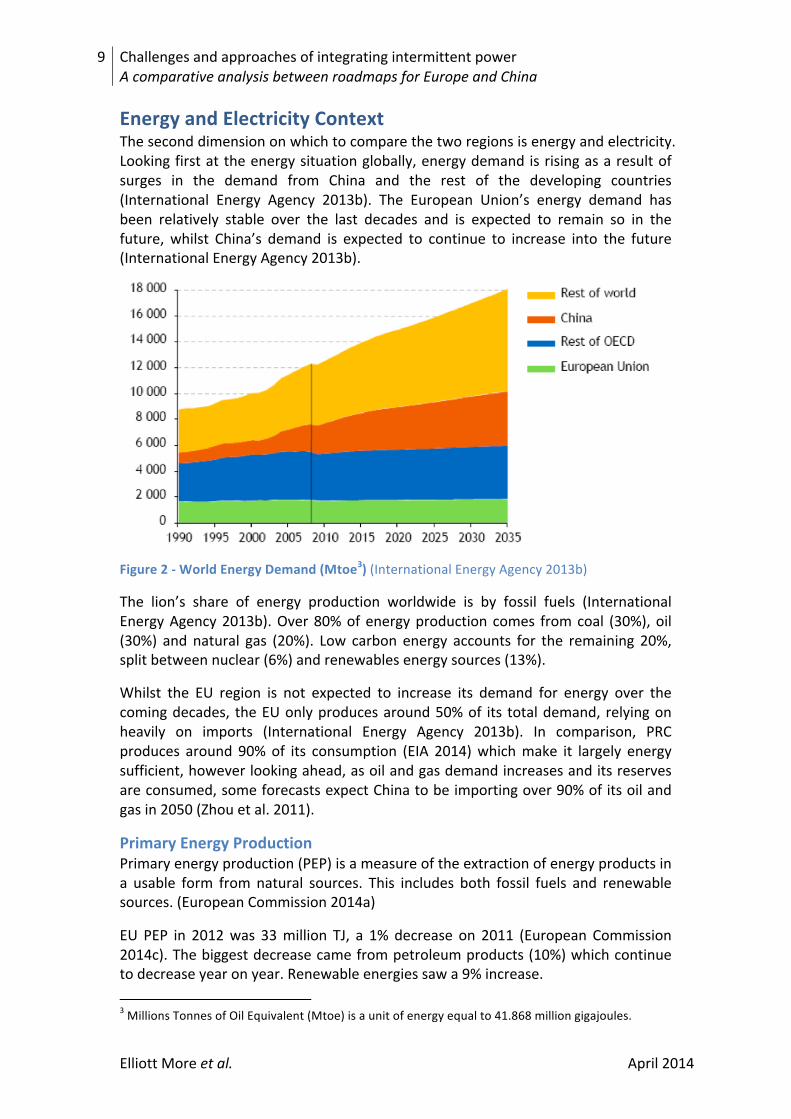
Energy and Electricity Context The second dimension on which to compare the two regions is energy and electricity. Looking first at the energy situation globally, energy demand is rising as a result of surges in the demand from China and the rest of the developing countries (International Energy Agency 2013b). The European Union’s energy demand has been relatively stable over the last decades and is expected to remain so in the future, whilst China’s demand is expected to continue to increase into the future (International Energy Agency 2013b).
Figure 2 -‐ World Energy Demand (Mtoe3) (International Energy Agency 2013b)
The lion’s share of energy production worldwide is by fossil fuels (International Energy Agency 2013b). Over 80% of energy production comes from coal (30%), oil (30%) and natural gas (20%). Low carbon energy accounts for the remaining 20%, split between nuclear (6%) and renewables energy sources (13%).
Whilst the EU region is not expected to increase its demand for energy over the coming decades, the EU only produces around 50% of its total demand, relying on heavily on imports (International Energy Agency 2013b). In comparison, PRC produces around 90% of its consumption (EIA 2014) which make it largely energy sufficient, however looking ahead, as oil and gas demand increases and its reserves are consumed, some forecasts expect China to be importing over 90% of its oil and gas in 2050 (Zhou et al. 2011).
Primary Energy Production Primary energy production (PEP) is a measure of the extraction of energy products in a usable form from natural sources. This includes both fossil fuels and renewable sources. (European Commission 2014a)
EU PEP in 2012 was 33 million TJ, a 1% decrease on 2011 (European Commission 2014c). The biggest decrease came from petroleum products (10%) which continue to decrease year on year. Renewable energies saw a 9% increase. 3 Millions Tonnes of Oil Equivalent (Mtoe) is a unit of energy equal to 41.868 million gigajoules.
10 Challenges and approaches of integrating intermittent power A comparative analysis between roadmaps for Europe and China
Elliott More et al. April 2014
In comparison, PRC’s PEP was 103 million TJ in 2012 (EIA 2014), meeting around 90% of its demand. The lion’s share of production came from fossil fuels, with coal accounting for 75% (Wenke & Yufeng 2013).
Primary Energy Consumption Primary energy consumption (PEC) measures the total energy demand of a country (European Commission 2014a). It covers consumption of the energy sector itself, losses during transformation (for example, from oil or gas into electricity) and distribution of energy, and the final consumption by end users. It excludes energy carriers used for non-‐energy purposes (such as petroleum not used not for combustion but for producing plastics).
Gross inland PEC in EU was 70 million TJ4 in 2012, a 1% decrease on 2011 (European Commission 2014c). Petroleum products continue to be the most important energy source, despite a long term downward trend, with natural gas the second most important energy source.
Energy consumption in PRC in comparison was 110.4 million TJ in 2012, a rise of 4% on 2011 (National Bureau of Statistics of China 2014; The World Bank 2014). Data for 2011 shows that the majority of this energy was generated from coal (nearly 70%), followed by oil (16%) and natural gas (4%) with the bulk of the rest coming from burning biofuels and waste (International Energy Agency 2013a).
Final Energy Consumption Final energy consumption (FEC) is the total energy consumed by end users, such as households, industry and agriculture (European Commission 2014a). It is the energy which reaches the final consumer's door and excludes that which is used by the energy sector itself.
China’s final energy consumption is dominated by the industry sector, in comparison to the EU which only uses a quarter in this sector, reflecting the focus of energy intensive industry in PRC.
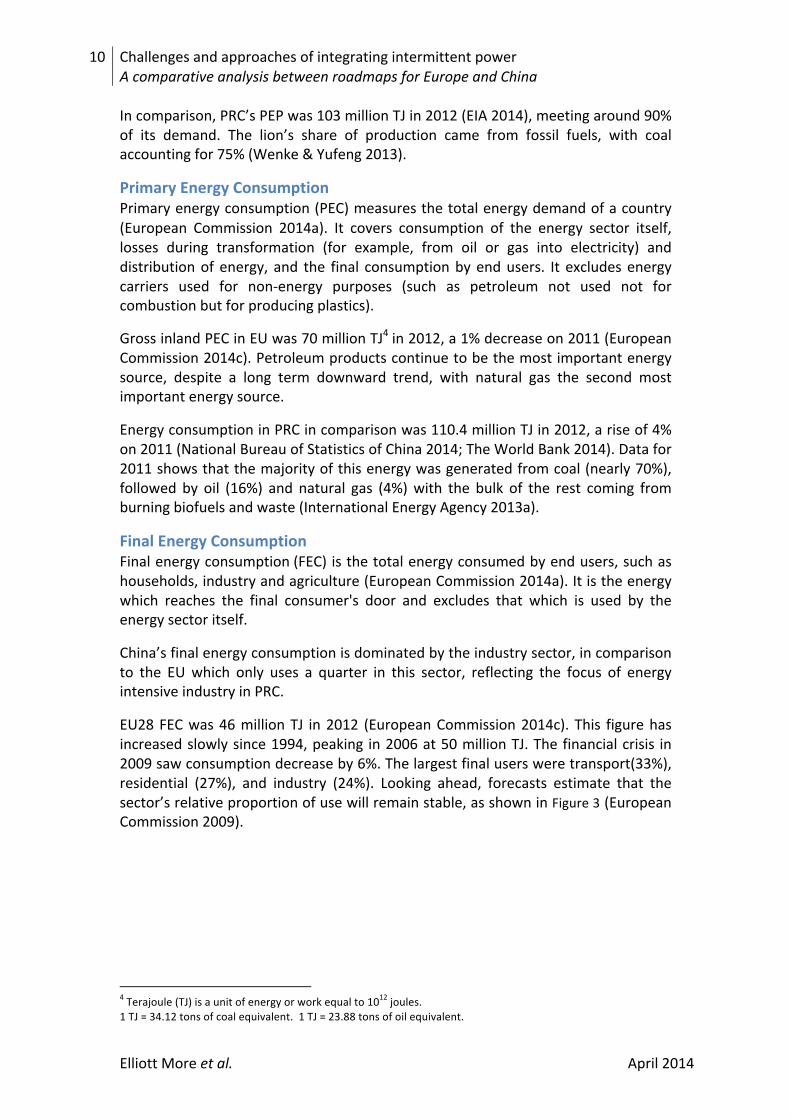
EU28 FEC was 46 million TJ in 2012 (European Commission 2014c). This figure has increased slowly since 1994, peaking in 2006 at 50 million TJ. The financial crisis in 2009 saw consumption decrease by 6%. The largest final users were transport(33%), residential (27%), and industry (24%). Looking ahead, forecasts estimate that the sector’s relative proportion of use will remain stable, as shown in Figure 3 (European Commission 2009).
4 Terajoule (TJ) is a unit of energy or work equal to 1012 joules. 1 TJ = 34.12 tons of coal equivalent. 1 TJ = 23.88 tons of oil equivalent.
11 Challenges and approaches of integrating intermittent power A comparative analysis between roadmaps for Europe and China
Elliott More et al. April 2014
Figure 3 – EU Final Energy Demand by sector (European Commission 2009)
PRC FEC was 68 million TJ in 2012 (International Energy Agency 2013a). The largest final users of this energy were industry, which consumed half of this energy, residential using a quarter, and transport at around 12%. Looking ahead at the changing nature of PRC’s energy use, some forecasts assume that the relative share of industry will decrease, as the service sector starts to contribute more significantly to economic growth (International Energy Agency 2013b; Zhou et al. 2011).
Electricity (Power) Generation Turning from energy broadly to the sub-‐set of electricity production 5 more specifically. Gross power generation (GPG) refers to the process of producing electrical energy. It is the total amount of electrical energy produced by transforming other forms of energy (European Commission 2014a).
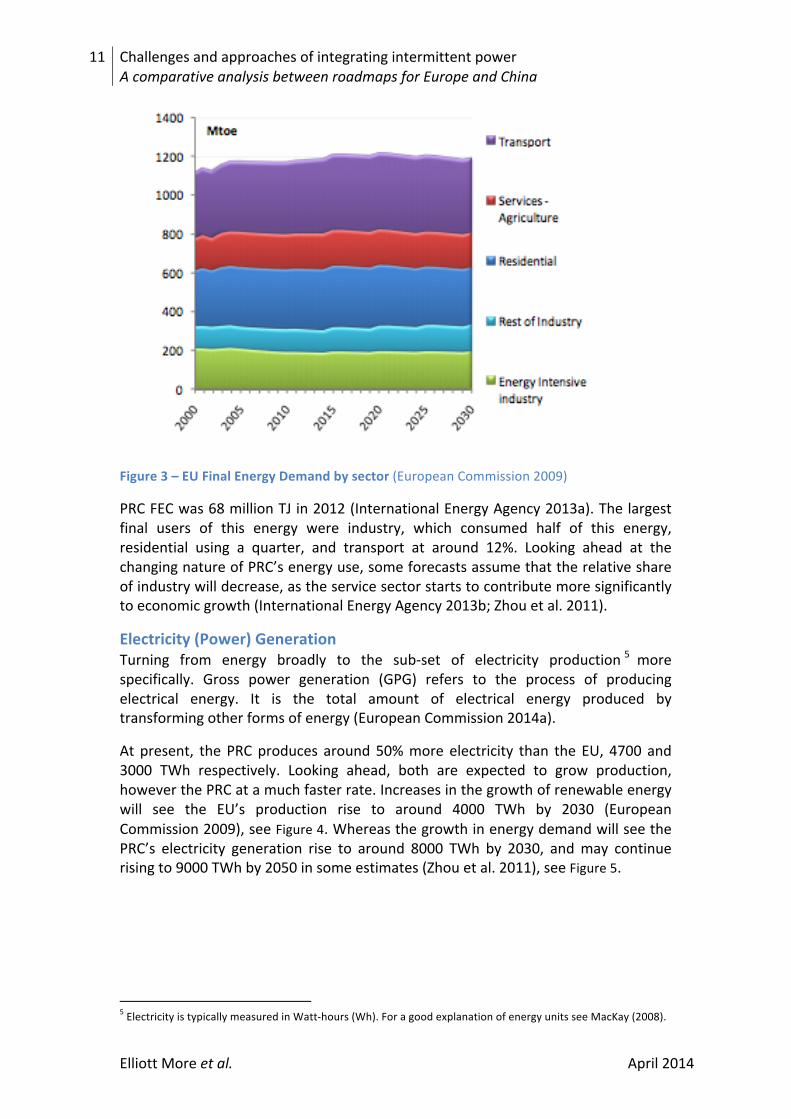
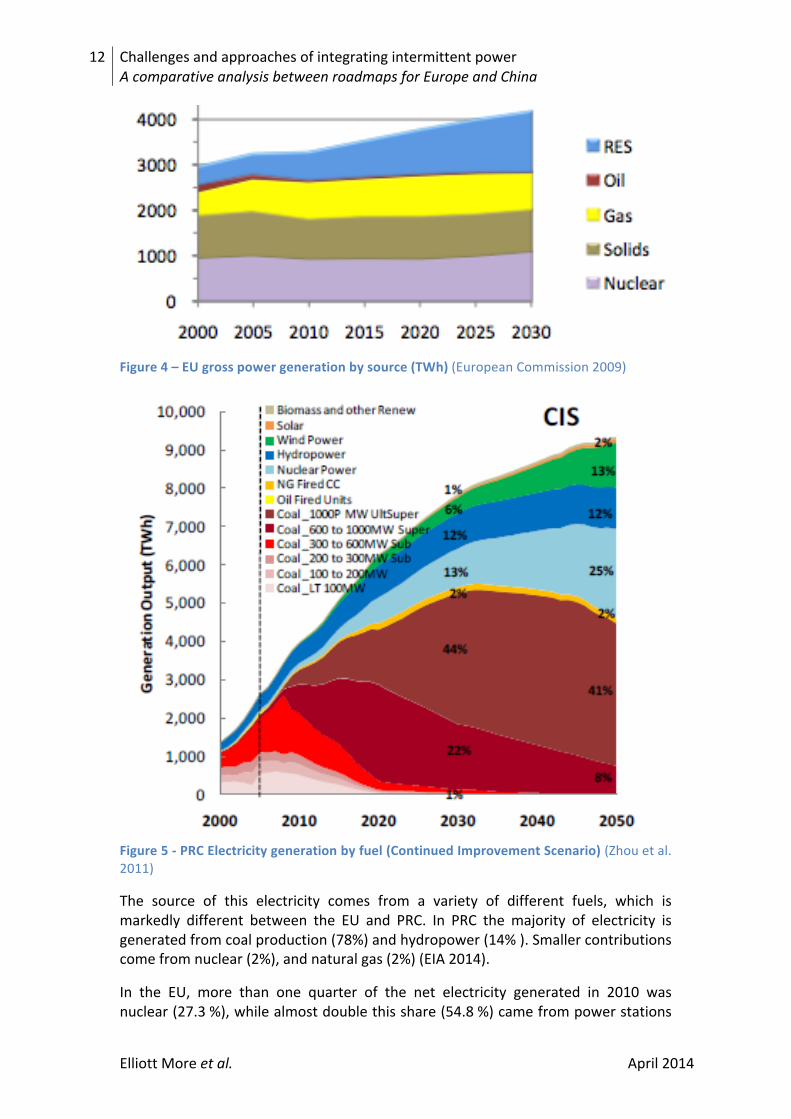
At present, the PRC produces around 50% more electricity than the EU, 4700 and 3000 TWh respectively. Looking ahead, both are expected to grow production, however the PRC at a much faster rate. Increases in the growth of renewable energy will see the EU’s production rise to around 4000 TWh by 2030 (European Commission 2009), see Figure 4. Whereas the growth in energy demand will see the PRC’s electricity generation rise to around 8000 TWh by 2030, and may continue rising to 9000 TWh by 2050 in some estimates (Zhou et al. 2011), see Figure 5.
5 Electricity is typically measured in Watt-‐hours (Wh). For a good explanation of energy units see MacKay (2008).
12 Challenges and approaches of integrating intermittent power A comparative analysis between roadmaps for Europe and China
Elliott More et al. April 2014
Figure 4 – EU gross power generation by source (TWh) (European Commission 2009)
Figure 5 -‐ PRC Electricity generation by fuel (Continued Improvement Scenario) (Zhou et al. 2011)
The source of this electricity comes from a variety of different fuels, which is markedly different between the EU and PRC. In PRC the majority of electricity is generated from coal production (78%) and hydropower (14% ). Smaller contributions come from nuclear (2%), and natural gas (2%) (EIA 2014).
In the EU, more than one quarter of the net electricity generated in 2010 was nuclear (27.3 %), while almost double this share (54.8 %) came from power stations
13 Challenges and approaches of integrating intermittent power A comparative analysis between roadmaps for Europe and China
Elliott More et al. April 2014
using combustible fuels (such as natural gas, coal and oil). Among renewable energy sources, the largest contributor was hydropower (12.2 %), followed by wind (4.6 %) and solar power (0.7 %). (European Commission 2014c)
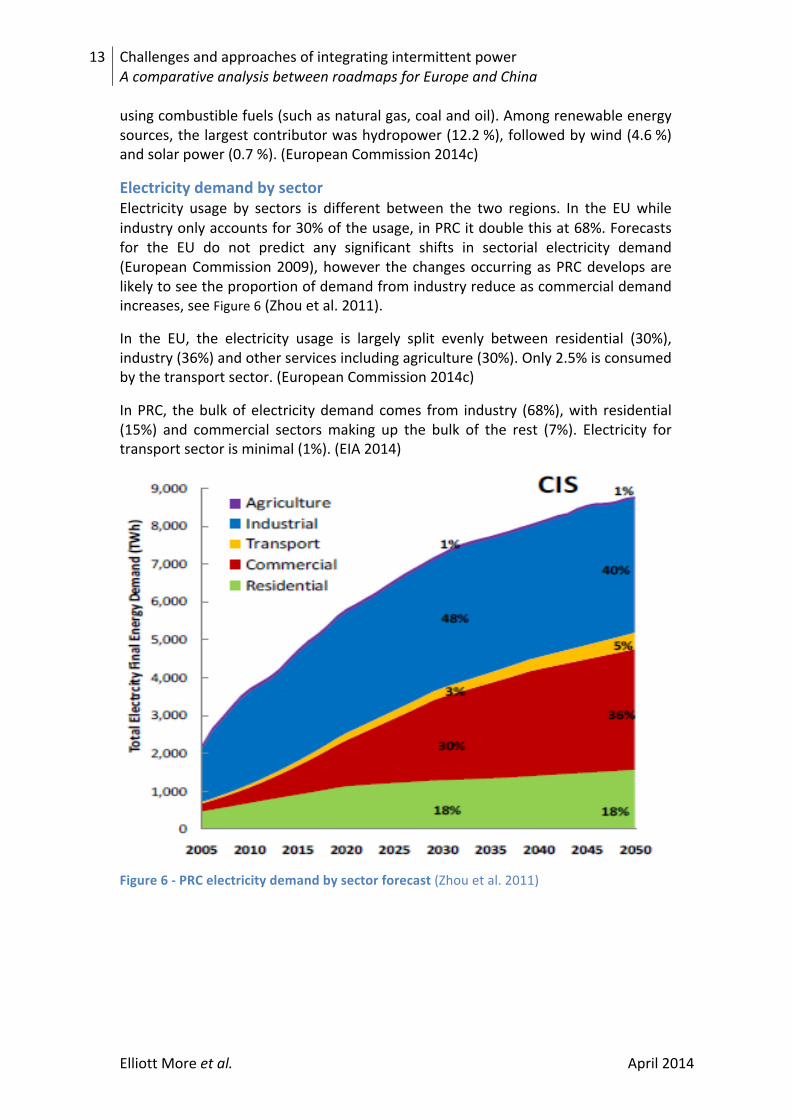
Electricity demand by sector Electricity usage by sectors is different between the two regions. In the EU while industry only accounts for 30% of the usage, in PRC it double this at 68%. Forecasts for the EU do not predict any significant shifts in sectorial electricity demand (European Commission 2009), however the changes occurring as PRC develops are likely to see the proportion of demand from industry reduce as commercial demand increases, see Figure 6 (Zhou et al. 2011).
In the EU, the electricity usage is largely split evenly between residential (30%), industry (36%) and other services including agriculture (30%). Only 2.5% is consumed by the transport sector. (European Commission 2014c)
In PRC, the bulk of electricity demand comes from industry (68%), with residential (15%) and commercial sectors making up the bulk of the rest (7%). Electricity for transport sector is minimal (1%). (EIA 2014)
Figure 6 -‐ PRC electricity demand by sector forecast (Zhou et al. 2011)
14 Challenges and approaches of integrating intermittent power A comparative analysis between roadmaps for Europe and China
Elliott More et al. April 2014
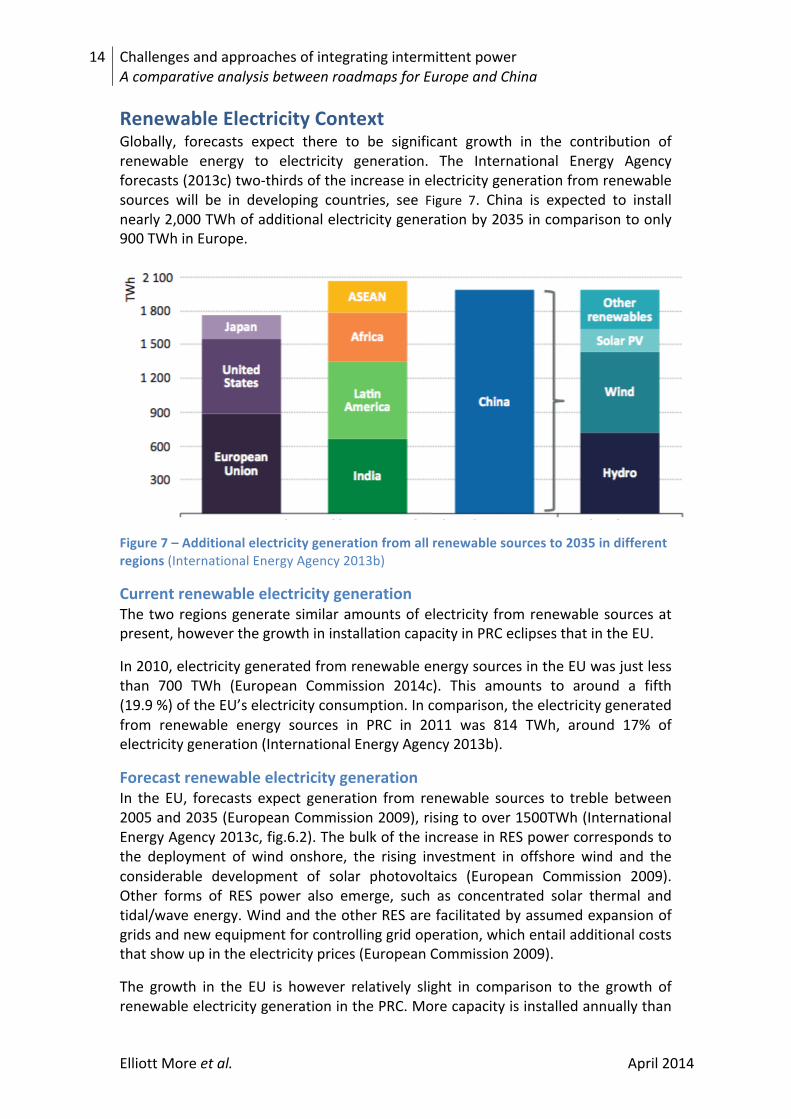
Renewable Electricity Context Globally, forecasts expect there to be significant growth in the contribution of renewable energy to electricity generation. The International Energy Agency forecasts (2013c) two-‐thirds of the increase in electricity generation from renewable sources will be in developing countries, see Figure 7. China is expected to install nearly 2,000 TWh of additional electricity generation by 2035 in comparison to only 900 TWh in Europe.
Figure 7 – Additional electricity generation from all renewable sources to 2035 in different regions (International Energy Agency 2013b)
Current renewable electricity generation The two regions generate similar amounts of electricity from renewable sources at present, however the growth in installation capacity in PRC eclipses that in the EU.
In 2010, electricity generated from renewable energy sources in the EU was just less than 700 TWh (European Commission 2014c). This amounts to around a fifth (19.9 %) of the EU’s electricity consumption. In comparison, the electricity generated from renewable energy sources in PRC in 2011 was 814 TWh, around 17% of electricity generation (International Energy Agency 2013b).
Forecast renewable electricity generation In the EU, forecasts expect generation from renewable sources to treble between 2005 and 2035 (European Commission 2009), rising to over 1500TWh (International Energy Agency 2013c, fig.6.2). The bulk of the increase in RES power corresponds to the deployment of wind onshore, the rising investment in offshore wind and the considerable development of solar photovoltaics (European Commission 2009). Other forms of RES power also emerge, such as concentrated solar thermal and tidal/wave energy. Wind and the other RES are facilitated by assumed expansion of grids and new equipment for controlling grid operation, which entail additional costs that show up in the electricity prices (European Commission 2009).
The growth in the EU is however relatively slight in comparison to the growth of renewable electricity generation in the PRC. More capacity is installed annually than
15 Challenges and approaches of integrating intermittent power A comparative analysis between roadmaps for Europe and China
Elliott More et al. April 2014
any other country, with annual double-‐digit growth over the last few years (e.g. 12% from 2010 to 2011). Forecasts expect the generation of renewable electricity to rise from around 800TWh in 2011 to over 2800TWh in 2035 (International Energy Agency 2013c, fig.6.2).
Renewable electricity generation by fuel The growing contribution of electricity from renewable sources is expected to come largely from the continuing surge in wind, biomass and solar installations in both EU and PRC.
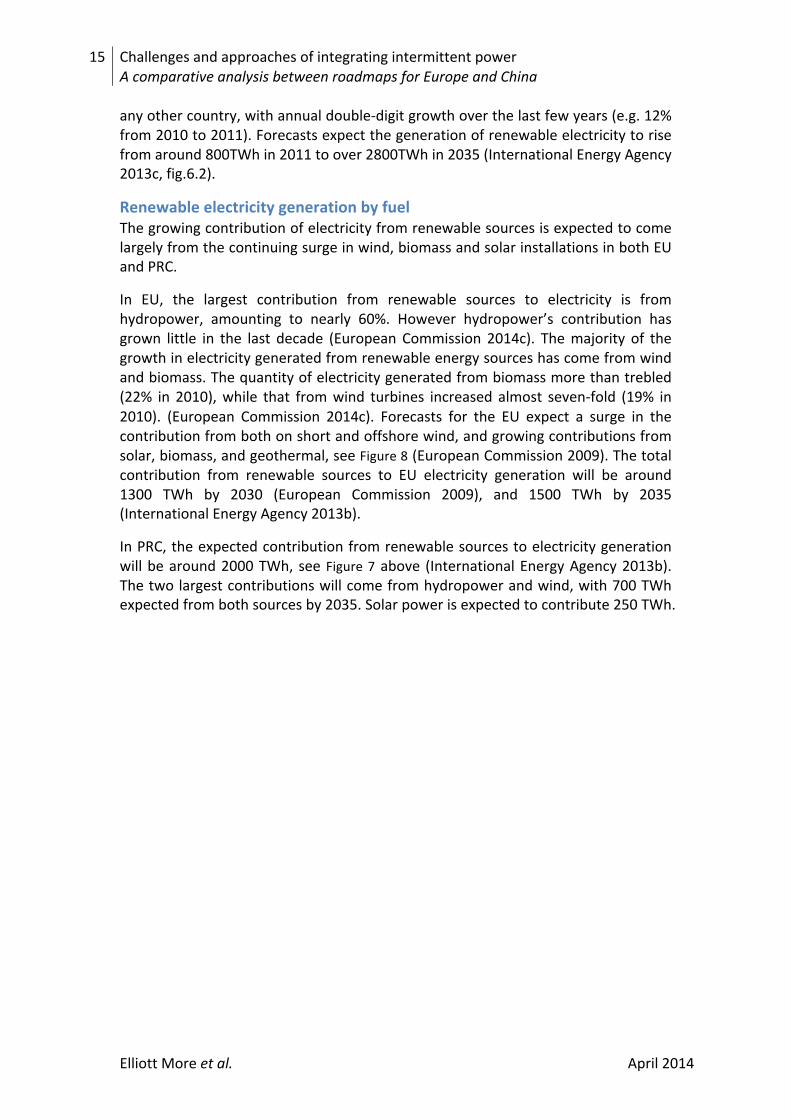
In EU, the largest contribution from renewable sources to electricity is from hydropower, amounting to nearly 60%. However hydropower’s contribution has grown little in the last decade (European Commission 2014c). The majority of the growth in electricity generated from renewable energy sources has come from wind and biomass. The quantity of electricity generated from biomass more than trebled (22% in 2010), while that from wind turbines increased almost seven-‐fold (19% in 2010). (European Commission 2014c). Forecasts for the EU expect a surge in the contribution from both on short and offshore wind, and growing contributions from solar, biomass, and geothermal, see Figure 8 (European Commission 2009). The total contribution from renewable sources to EU electricity generation will be around 1300 TWh by 2030 (European Commission 2009), and 1500 TWh by 2035 (International Energy Agency 2013b).
In PRC, the expected contribution from renewable sources to electricity generation will be around 2000 TWh, see Figure 7 above (International Energy Agency 2013b). The two largest contributions will come from hydropower and wind, with 700 TWh expected from both sources by 2035. Solar power is expected to contribute 250 TWh.
16 Challenges and approaches of integrating intermittent power A comparative analysis between roadmaps for Europe and China
Elliott More et al. April 2014
Figure 8 – EU electricity generation from renewable energy sources (TWh) (European Commission 2009)
Intermittent power Intermittent power is defined by the International Energy Agency (2013b) as electricity generation from (non-‐dispatchable) renewables sources, such as wind and solar. The energy is weather dependent and can only be adjusted to demand within the limits of the resource availability. The characteristics of such renewables have direct implications for their integration into power systems (International Energy Agency 2011). Intermittent power is characterized by the following properties (International Energy Agency 2013b):
• Variability • Resource Location • Modularity • Uncertainty • Low operating costs • Non-‐synchronous generation
Effective use of intermittent sources in an electric power grid usually relies on using the intermittent sources to displace fuel that would otherwise be consumed by non-‐renewable power stations, or by storing energy (The Carbon Trust & DTI 2003).
The International Energy Agency (2013c) calculated that in 2011, China’s share of intermittent power was 1.5%, in comparison to Europe larger share 7% (2013c, fig.6.2). The forecasts for 2035 expect PRC’s share of intermittent power to have grown to around 10%, in comparison to Europe at 23% (2013c, fig.6.2).
17 Challenges and approaches of integrating intermittent power A comparative analysis between roadmaps for Europe and China
Elliott More et al. April 2014
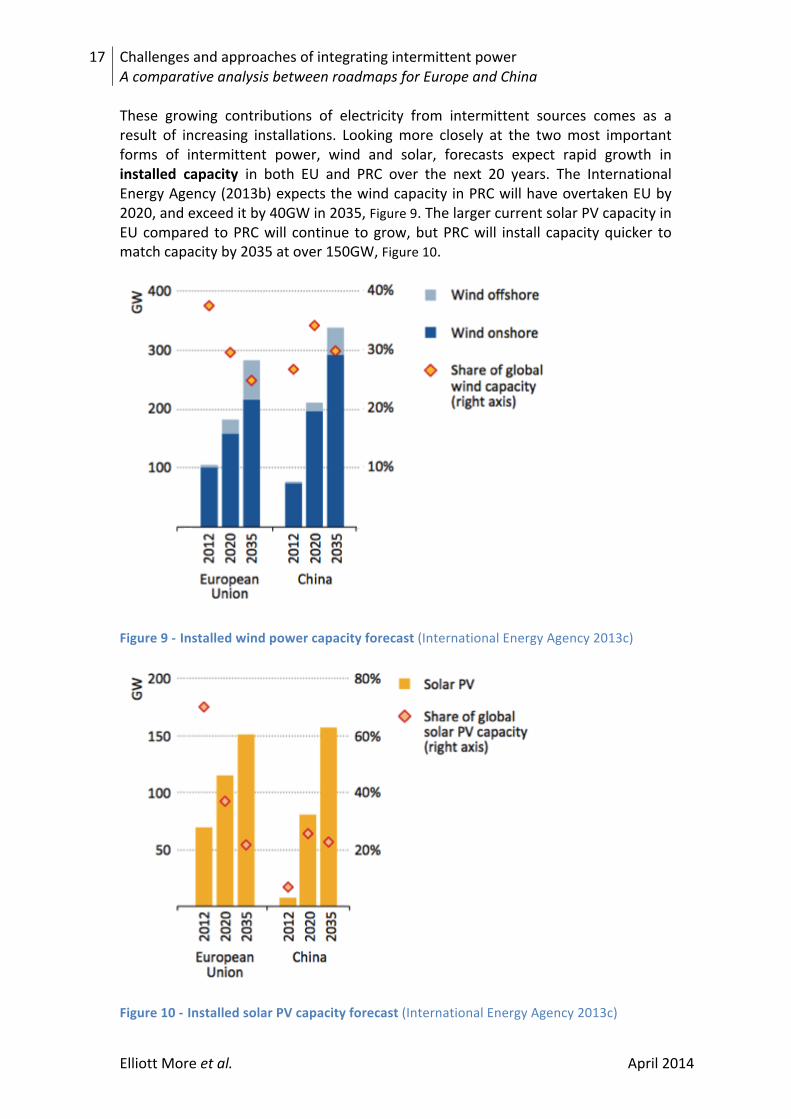
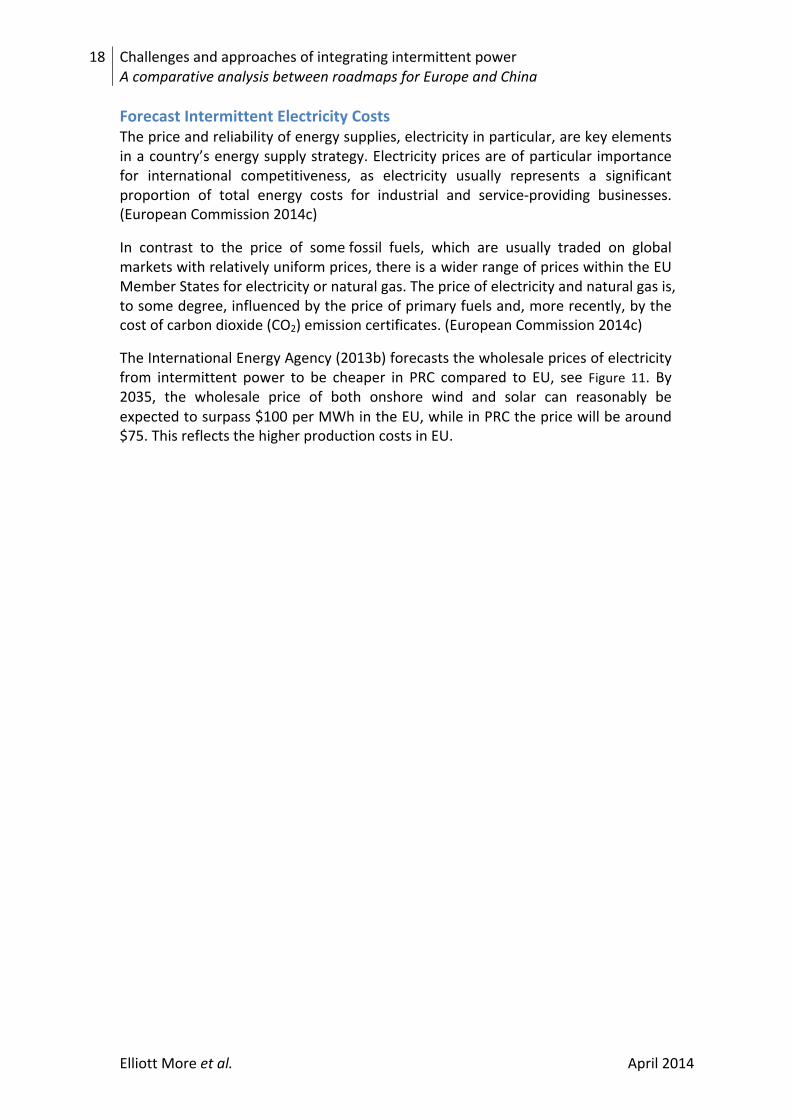
These growing contributions of electricity from intermittent sources comes as a result of increasing installations. Looking more closely at the two most important forms of intermittent power, wind and solar, forecasts expect rapid growth in installed capacity in both EU and PRC over the next 20 years. The International Energy Agency (2013b) expects the wind capacity in PRC will have overtaken EU by 2020, and exceed it by 40GW in 2035, Figure 9. The larger current solar PV capacity in EU compared to PRC will continue to grow, but PRC will install capacity quicker to match capacity by 2035 at over 150GW, Figure 10.
Figure 9 -‐ Installed wind power capacity forecast (International Energy Agency 2013c)
Figure 10 -‐ Installed solar PV capacity forecast (International Energy Agency 2013c)
18 Challenges and approaches of integrating intermittent power A comparative analysis between roadmaps for Europe and China
Elliott More et al. April 2014
Forecast Intermittent Electricity Costs The price and reliability of energy supplies, electricity in particular, are key elements in a country’s energy supply strategy. Electricity prices are of particular importance for international competitiveness, as electricity usually represents a significant proportion of total energy costs for industrial and service-‐providing businesses. (European Commission 2014c)
In contrast to the price of some fossil fuels, which are usually traded on global markets with relatively uniform prices, there is a wider range of prices within the EU Member States for electricity or natural gas. The price of electricity and natural gas is, to some degree, influenced by the price of primary fuels and, more recently, by the cost of carbon dioxide (CO2) emission certificates. (European Commission 2014c)
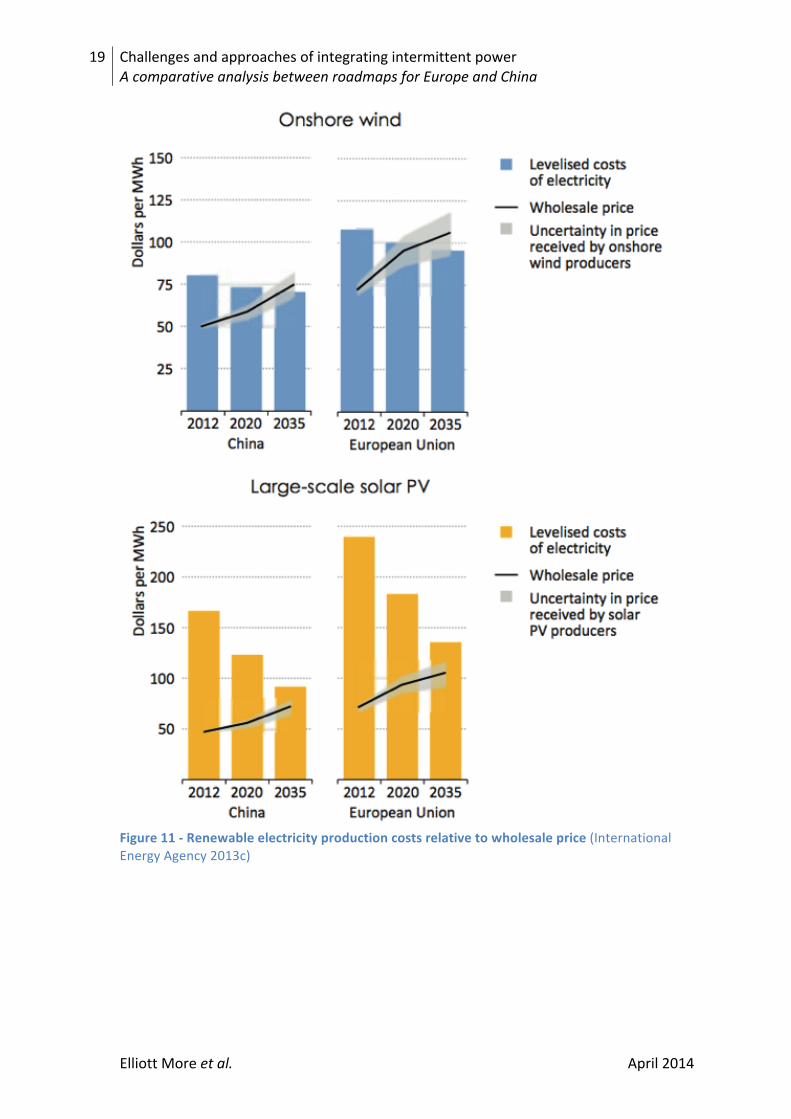
The International Energy Agency (2013b) forecasts the wholesale prices of electricity from intermittent power to be cheaper in PRC compared to EU, see Figure 11. By 2035, the wholesale price of both onshore wind and solar can reasonably be expected to surpass $100 per MWh in the EU, while in PRC the price will be around $75. This reflects the higher production costs in EU.
19 Challenges and approaches of integrating intermittent power A comparative analysis between roadmaps for Europe and China
Elliott More et al. April 2014
Figure 11 -‐ Renewable electricity production costs relative to wholesale price (International Energy Agency 2013c)
20 Challenges and approaches of integrating intermittent power A comparative analysis between roadmaps for Europe and China
Elliott More et al. April 2014
Energy Policy Context The final element of context compared in this report is current and expected energy policy in the two regions.
EU Policy Two important aspect of policy relating to energy in EU are worth considering. The series of legislative packages by the European Commission to liberalise energy markets and create the internal market. The second is the 20-‐20-‐20 target, an emissions policy that became binding for all Member States in 2009.
The European Commission launched a legislative package to liberalise energy markets in September 2007. These proposals were designed to: create a competitive energy market; expand consumer choice; promote fairer prices; result in cleaner energy; and promote the security of supply. In order to reach these goals, the proposals sought to: separate production and supply from transmission networks; facilitate cross-‐border collaboration, investment and trade in energy; introduce more effective regulation; encourage greater market transparency; and increase solidarity between EU Member States. (European Commission 2014c)
The 20-‐20-‐20 targets were set by EU leaders in March 2007, when they committed Europe to transition towards an energy-‐efficient, low carbon economy. These were enacted through the climate and energy package in 2009. Under the ‘climate and energy package’ the 2020 targets commit Member States to (European Commission 2014d):
§ A reduction in EU greenhouse gas emissions of at least 20 % below 1990 levels.
§ At least 20 % of EU gross final energy consumption to come from renewable energy sources.
§ At least 10 % of transport final energy consumption to come from renewable energy sources.
§ A 20 % reduction in primary energy use compared with projected levels, to be achieved by improving energy efficiency.
The climate and energy package comprises four pieces of complementary legislation which are intended to deliver on the 20-‐20-‐20 targets (European Commission 2014d):
• Reform of the EU Emissions Trading System (EU ETS) to include the introduction of a single EU-‐wide cap on emission allowances in place of the existing system of national caps. The cap will be cut each year so that by 2020 emissions will be 21% below the 2005 level.
• National targets for non-‐EU ETS emissions which account for 60% of EU’s total emissions.
• Binding national renewable energy targets for each Member State under the Renewable Energy Directive. Targets reflect Member States' different starting points and potential for increasing the share of renewables production in their energy consumption by 2020.
21 Challenges and approaches of integrating intermittent power A comparative analysis between roadmaps for Europe and China
Elliott More et al. April 2014
• Carbon capture and storage directive for the environmentally safe use of carbon capture and storage technologies. The directive covers all CO2 storage in geological formations in the EU and lays down requirements which apply to the entire lifetime of storage sites.
In the EU, the use of nuclear power for electricity generation has received renewed attention amid concerns of an increasing dependency on imported primary energy, rising oil and gas prices, and commitments to reduce greenhouse gas emissions. These have been balanced against long-‐standing concerns about safety and waste from nuclear power plants, which were highlighted during the immediate period following the Fukushima nuclear disaster in March 2011. While some Member States have continued with existing reactors or plans to construct new nuclear reactors others decided to review, and in some cases, change policies for existing plants, as well as cancelling planned nuclear constructions. (European Commission 2014c)
PRC Policy The PRC’s recent history is characterised by rapid industrialisation and urbanisation. During this time coal has served as the primary energy and electricity fuel source. However as a result of increasing local and international environmental concerns regarding this fuel source, the PRC has more recently been looking to diversify its fuel sources. Oil and natural gas are increasingly being imported, but increasing prices and concerns over future availability have forced a rethink in policy.
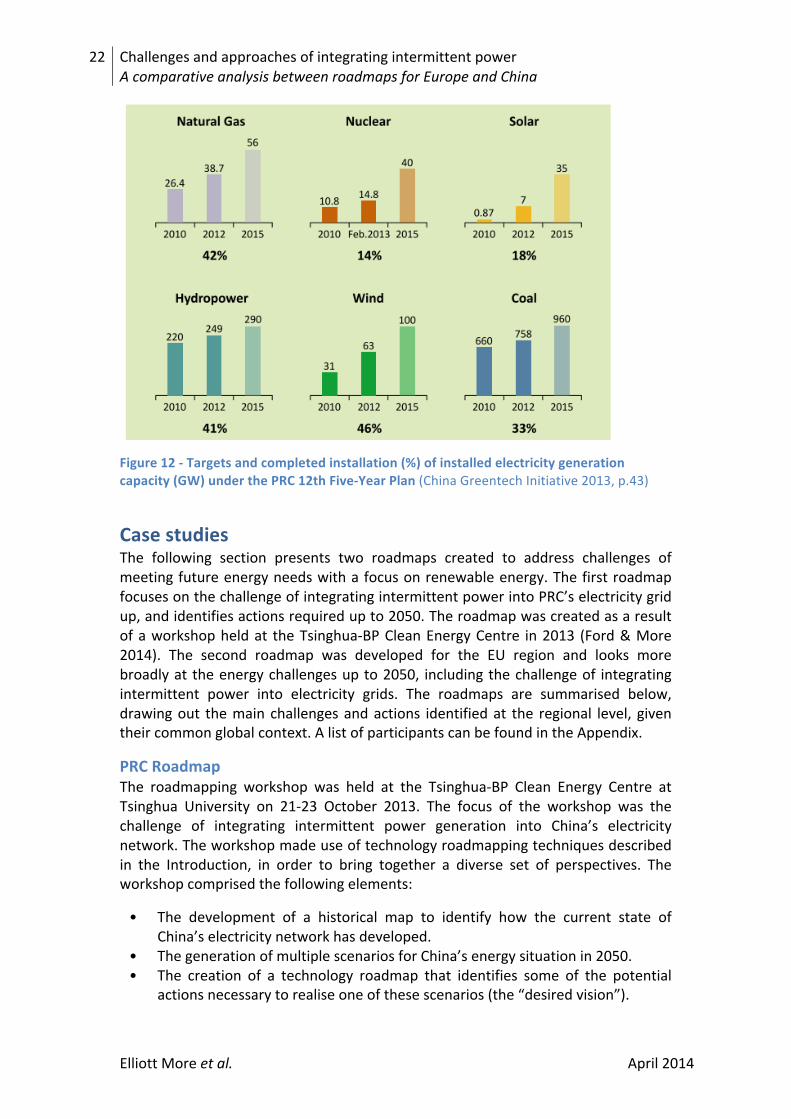
The latest energy development plan, published in January 2013 as part of the 12th Five-‐year Plan, sets ambitious renewable targets with mandatory 2015 targets for non-‐fossil energy use, energy intensity, carbon intensity and particulate emissions. PRC has committed in the last plan to significant new electricity generation capacity of in six main fuels, see Figure 12.
22 Challenges and approaches of integrating intermittent power A comparative analysis between roadmaps for Europe and China
Elliott More et al. April 2014
Figure 12 -‐ Targets and completed installation (%) of installed electricity generation capacity (GW) under the PRC 12th Five-‐Year Plan (China Greentech Initiative 2013, p.43)
Case studies The following section presents two roadmaps created to address challenges of meeting future energy needs with a focus on renewable energy. The first roadmap focuses on the challenge of integrating intermittent power into PRC’s electricity grid up, and identifies actions required up to 2050. The roadmap was created as a result of a workshop held at the Tsinghua-‐BP Clean Energy Centre in 2013 (Ford & More 2014). The second roadmap was developed for the EU region and looks more broadly at the energy challenges up to 2050, including the challenge of integrating intermittent power into electricity grids. The roadmaps are summarised below, drawing out the main challenges and actions identified at the regional level, given their common global context. A list of participants can be found in the Appendix.
PRC Roadmap The roadmapping workshop was held at the Tsinghua-‐BP Clean Energy Centre at Tsinghua University on 21-‐23 October 2013. The focus of the workshop was the challenge of integrating intermittent power generation into China’s electricity network. The workshop made use of technology roadmapping techniques described in the Introduction, in order to bring together a diverse set of perspectives. The workshop comprised the following elements:
• The development of a historical map to identify how the current state of China’s electricity network has developed.
• The generation of multiple scenarios for China’s energy situation in 2050. • The creation of a technology roadmap that identifies some of the potential
actions necessary to realise one of these scenarios (the “desired vision”).
23 Challenges and approaches of integrating intermittent power A comparative analysis between roadmaps for Europe and China
Elliott More et al. April 2014
PRC Roadmapping Process While technology roadmapping is a primarily a forward-‐focused approach, historical mapping is possible, and both were conducted based on the Organisation Scan technique developed at the Centre for Technology Management, University of Cambridge. The historical review was conducted first, with a small group of BP experts and Tsinghua academics, and sought to answer two questions:
1. What have been significant milestones in the development of China’s electricity network?
2. What activities and events have acted as enablers and barriers to the integration of intermittent power generation technologies to date?
As a result of mapping this historical development, a number of enablers and barriers were identified to integrating intermittent power into the national electricity grid. Strong enablers were seen to be Chinese renewables policy, with the increasing share of renewables in each of the Five Year Plans giving a strong push for the installation of greater generation capacity from renewables, along with the way in which international attention at the Beijing Olympics changed public perceptions on the acceptability of high levels of air pollution within the city.
Barriers to the integration of intermittent power generation into the grid included the difficulties that China has had in meeting energy demand, thus prompting a greater reliance of hydrocarbon-‐based power generation; the decision to install coal-‐based power generation, which is less easy to switch on and off than gas-‐powered stations and thus limits the ability of the grid to balance demand with intermittent power generation; and the geographic disparity between the location of intermittent energy sources and the location of demand that requires significant investment in grid infrastructure.
In addition to these enablers and barriers there were a number of items on which there were mixed views about their role in supporting the integration of intermittent power generation. These included Chinese participation in the WTO; Chinese power sector reforms; the breakup of SPCC and the creation of State Grid and regional subsidiaries; debates between power companies and the grid over wind power; the Fukushima disaster and its impact on nuclear power programmes; and the effectiveness of energy trading systems.
PRC Roadmap Scenarios In the second stage of the workshop, groups generated a number of scenarios for the integration of intermittent power generation in 2050. From these scenarios, one was selected for use as the desired vision for the roadmap. Termed ‘Utopia’, this scenario presented a vision of high global per capita wealth where nuclear fusion is available. The scenario was described thus:6
• Characterised by high economic growth and high energy demand
6 Thanks go to Ian Jones, Strategy Adviser at BP Alternative Energy, for summarising this scenario
24 Challenges and approaches of integrating intermittent power A comparative analysis between roadmaps for Europe and China
Elliott More et al. April 2014
• A wealthier nation demands secure energy supply and has concern for the environment. The energy mix is diversified to guarantee supply and support economic growth
• Carbon, NOx and SOx emissions are at their lowest levels • To diversify the power sector, ALL renewable resources are accessed. This
leads to high intermittency issues that are managed through: o Fast responding generation o Storage technologies o Demand response via smartgrids
• Gas and nuclear have a large share of the generation mix • High Voltage Direct Current (HVDC) allows the transfer of energy over long
distances and additional security through international links • Markets are de-‐regulated with generation, transmission, distribution and retail
companies created • The transport sector is diversified through biofuels, CNG trucks and buses and
EVs
PRC Roadmap – Actions required The roadmap led to the identification of thirteen priority actions for improving the integration of intermittent power generation into the grid.
1. Establish a consistent Chinese renewable energy policy in future 5 year plans. This should be an integrated approach to planning (of generation, transmission and consumption), with the ambition commensurate with what the grid can support and what technologies are available to aid integration.
2. Develop a single aligned strategy for the integration of generation and transmission planning, with this considering the type of demand to be met (e.g. peak vs off-‐peak). Key stakeholders need to be involved in policy and market design.
3. Use a carbon tax system to set an incentive to deliver material reductions in carbon emissions, and link it to international schemes. Review pilot schemes and expand consistently while understanding the carbon abatement options and price trigger points.
4. Deregulate Chinese energy markets using specific energy, capacity and flexibility pricing mechanisms. Study the experience of energy deregulation in Europe and develop models to understand the impact of large volumes of renewable generation on grid operations.
5. Create a balanced generation portfolio incorporating single cycle turbines to provide necessary system flexibility. China should develop its own gas turbine technology because current alternatives are too expensive in relation to coal.
6. Reform the Chinese shale gas market through market liberalisation, identifying the appropriate levels for setting incentives, providing access to land, and conducting seismic studies to identify resource availability
7. Deregulate energy prices by reducing subsidies. Control the transition from state-‐subsidised system to market-‐based systems with international linkages, learning from the mistakes made during the European transition.
25 Challenges and approaches of integrating intermittent power A comparative analysis between roadmaps for Europe and China
Elliott More et al. April 2014
8. Design new cities to be smart and low energy, using best in class building standards and urban planning. Develop detailed regulations for new city design.
9. Provide incentives for R&D and innovation in energy storage (i.e. electricity, heat etc.) devices.
10. Develop a realistic evaluation of the potential and timing of battery contribution to storage so that batteries can be deployed for smaller scale distributed energy storage by 2030.
11. Increase the maturity of smart grid technologies. Policies and market instruments should be used to incentivise smart grid deployment and end-‐user demand response.
12. Take steps towards a primary global grid by increasing cross-‐border trade in power. China should increase the integration of its own grid and set-‐up international trading systems.
13. Continue international collaboration on nuclear fusion so that an international demonstration can be realised by 2030.
26 Challenges and approaches of integrating intermittent power A comparative analysis between roadmaps for Europe and China
Elliott More et al. April 2014
EU Roadmap
Selection of comparison roadmap A number of roadmaps were identified that could be used for comparison. A search of energy roadmaps for Europe led to a dozen potential roadmaps. These included roadmap produced by a variety of different authors, including industry bodies, consultants, and academia. The Energy Roadmap 2050 was chosen based on the 2050 time horizon and the methodology used to create the roadmap, which are both discussed in further detail in the Discussion section.
Two key documents are associated with the roadmap. The first, the ‘Assessment of the Required Share for a Stable EU Electricity Supply until 2050’, was released before the Energy Roadmap in 2011. It describes the challenges of integrating intermittent power into electricity grids (European Commission 2011b). The second document is a roadmap released after the Energy Roadmap is the ‘Roadmap for moving to a competitive low-‐carbon economy in 2050’ (European Commission 2011a) which sets out actions required to reduce EU’s emissions by 80% by 2050.
The focus of the Energy Roadmap 2050 is the decarbonisation of the EU’s energy system, which reflect the underlying commitment of the EU to reduce greenhouse gas emissions to 80-‐95% below 1990 levels by 2050. The energy sector, as the largest contributor to man-‐made greenhouse gas emissions, must be decarbonised by transitioning to low-‐carbon energy. The vision that is created by the roadmap is that a secure, competitive and decarbonised energy system is possible by 2050.
The roadmap does not seek to “replace national, regional, and local efforts to modernise energy supply, but seeks to develop a long-‐term European technology-‐neutral framework in which these policies will be more effective. It argues that a European approach to the energy challenge will increase security and solidarity and lower costs compered to parallel national schemes by providing a wider and flexible market for new products and services.”
Energy Roadmap 2050 Scenarios Recognising the difficulty of forecasting the long term future, the roadmap proposes five scenarios towards decarbonisation of the energy system. These scenarios are of an illustrative nature, examining the impacts, challenges and opportunities of modernizing the energy system.
• High Energy Efficiency • Diversified Supply Technologies • High Renewable Energy Sources • Delayed CCS • Low Nuclear
All the scenarios assume that action is taken globally to tackle climate change.
The EU’s energy system requires high levels of investment even without the requirements to decarbonise.
27 Challenges and approaches of integrating intermittent power A comparative analysis between roadmaps for Europe and China
Elliott More et al. April 2014
In modernising the EU’s energy system, the European economy will gain from the high levels of investment.
Decarbonisation can be an advantage for Europe, securing its position as an early mover in the growing market for energy-‐related goods and services.
Energy Roadmap 2050 -‐ Structural Changes required Ten structural changes are identified for energy system transformation:
1. Decarbonisation is possible, and can be less costly than current policies in the long-‐run.
2. A transition is required from current high fuel and operational cots, to an energy system based on higher capital expenditure and lower fuel costs. The cumulative gird investment costs along could be up to €2.2trillion between 2011 and 2050.
3. Electricity must play a greater role, contributing to the decarbonisation of transport, heating and cooling.
4. Electricity prices rise until 2030 and then decline 5. Expenditure on energy and energy-‐related products (including for transport)
is likely to rise, and become a more important element of household expenditure.
6. Significant energy savings are required, which will require a decoupling of economic growth from energy consumption.
7. The share of renewable energy rises substantially in all scenarios, alongside significant electricity storage to accommodate intermittent power.
8. Carbon capture and storage (CCS) will contribute significantly. 9. Nuclear energy, as a key source of low carbon electricity generation, will
need to provide a significant contribution in the energy transformation. 10. As a result of increasing renewables, the power system and heat generation
will become ever more decentralised, however will need to maintain the flexibility to accommodate existing centralised large-‐scale nuclear and gas power plants.
Energy Roadmap 2050 – Actions required The conclusions of the roadmap are that a concerted and coordinated approach to transforming the EU energy system will lead to a growth, employment, greater energy security and lower fuel costs. It is inevitable that energy prices will continue to rise world-‐wide, however this can reversed in the 2030s if the energy system is designed to encourage investment in energy efficiency and low-‐carbon technologies. However, the roadmap warns that vulnerable customers and energy-‐intensive industries may need support during the transitional period. In order to achieve this, ten conditions are outlined:
1. Implement EU’s Energy 2020 strategy, and apply all existing legislation and the proposals in discussion.
2. The energy system and society must be dramatically more energy efficient.
28 Challenges and approaches of integrating intermittent power A comparative analysis between roadmaps for Europe and China
Elliott More et al. April 2014
3. Attention should be given to the development of renewable energy, with a modernisation of the policy framework required to accelerate development and market share.
4. Higher public and private investments in R&D and technological innovation are crucial.
5. A fully integrated energy market by 2014, which will require regulatory and structural shortcomings to be addresses.
6. Energy prices should reflect costs more effectively, notably the new investments needed throughout the energy system.
7. New energy infrastructure and storage capabilities must be developed urgently.
8. The safety and security from new energy sources must continue to be strengthened.
9. A broader and more coordinated EU approach to international energy relations must become the norm including redoubling work to strengthen international climate action.
10. Member states and investors need concrete milestones, and a 2030 policy framework, both of which will reduce uncertainty for investors.
EU Stable Energy Supply Report Following the Energy Roadmap 2050, the European Commission released a report with the objective to assess the stability of the energy system based on increasing intermittent power sources, because power system balancing will become important to maintain a stable energy supply. (European Commission 2011b)
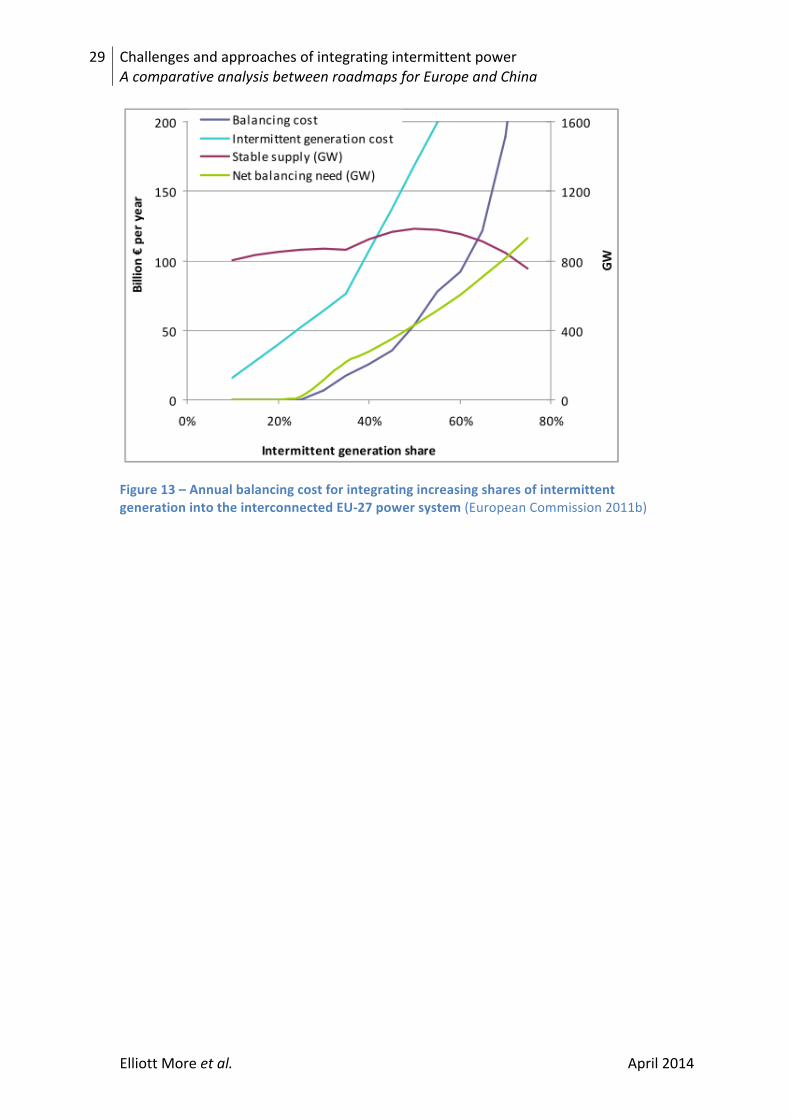
The major policy implication of the analysis was that there are increased costs associated with deployment of intermittent power in the EU. The relationship is almost an exponential increase in costs as the share of intermittent power increases, Figure 13, and that the larger the share of intermittent power required, the larger the investment required in upgrading the grid:
“If the cost of integrating intermittent generation was to be limited to about 25 billion EUR per year, no more than about 40% of intermittent generation can be integrated in the European power market.” (European Commission 2011b, p.5)
29 Challenges and approaches of integrating intermittent power A comparative analysis between roadmaps for Europe and China
Elliott More et al. April 2014
Figure 13 – Annual balancing cost for integrating increasing shares of intermittent generation into the interconnected EU-‐27 power system (European Commission 2011b)
30 Challenges and approaches of integrating intermittent power A comparative analysis between roadmaps for Europe and China
Elliott More et al. April 2014
Analysis and Discussion Having presented a synthesis of the outputs of the roadmaps in the previous section, it is now possible to compare their similarities and differences. Obviously both roadmaps discuss intermittent power, however the challenges and actions identified arise from issues related to the energy system as a whole. This reflects the challenge of integrating intermittent power, which is a systematic challenge to align future policy, economics, and technical issues simultaneously under conditions of uncertainty – a challenge which the roadmapping process has been found to tackle effectively (Phaal et al. 2010).
Whilst the objectives and methodologies of the two roadmaps were not identical, the similar time horizon and topic explored are considered sufficiently similar to warrant a comparative analysis. The validity of the comparison is explored further in the limitations section of the Conclusion.
This analysis and discussion is structured to start with content directly related to intermittent power, before progressing up the scale of complexity to renewables more broadly, and then finally to the whole energy system. Following this analysis of the roadmap content, the methodologies employed to create the two roadmaps are compared.
Roadmap Content Analysis As a result of the variable nature of intermittent power, it is of no surprise that both roadmaps describe the need for energy and electricity storage, new energy infrastructure, and back-‐up generation supplies.
• Both roadmaps agree on the need to accelerate research and development progress into battery technologies. The PRC roadmap describes the current slow technological progress, calling on the State Grid to ramp up early stage demonstrations, and to encourage research and development (R&D) into non-‐electricity storage technology such as heat. The EU roadmap is less explicit, calling more generally for urgent development into battery technology.
• Only the PRC roadmap mentions back-‐up power explicitly, making recommendations for back-‐up fast response gas turbines to match intermittent power generation, given the current lack of turbines installed, and going on to suggest PRC should develop its own gas turbine technology since current alternatives are relatively more expensive than coal.
Policy regarding renewable energy is considered by both roadmaps, however with clearly different foci.
• The EU roadmap is worded in an effort to sway opinion and make the case for an increase in renewable energy, for example by laying out the benefits of decarbonisation. The roadmap calls for the need to modernise policy to accelerate the development and market share of renewables.
• The PRC roadmap in comparison assumes a continuation of the large scale investment in building renewable capacity, built on the success of the current
31 Challenges and approaches of integrating intermittent power A comparative analysis between roadmaps for Europe and China
Elliott More et al. April 2014
renewable energy policy in the 12th Five-‐year Plan, but argues for a more integrated approach to planning of generation, transmission and consumption. A key barrier to integrated planning in the PRC lies in the lack of coordination between generation and transmission. The result is misaligned strategy as has happened in the EU and US history.
Energy efficiency improvements are discussed in both roadmaps. The EU roadmap calls for a dramatic improvement in the energy system, while the PRC roadmap calls for new low energy cities to replace the cheap urban investment currently being built with little thought for the future.
The importance of fuel diversity is prominent in both roadmaps as a way to improve security of supply. Renewables are mentioned in both roadmaps as a means to reduce dependence on energy imports. Two of the fossil fuels that are emphasised more strongly in the actions in both roadmaps are shale gas and nuclear.
• Domestic shale gas supplies present a relatively recent fuel source. The PRC roadmap mentions this explicitly, calling for market liberalisation in order to open up access for seismic testing to identify resource availability. The EU roadmap concedes that shale gas will have a part to play as domestic gas supplies diminish.
• While nuclear forms a core part of the energy mix in both roadmaps, nuclear fusion is mentioned explicitly in the PRC roadmap. PRC’s continuing participation in ITER project is expected to give way to international demonstrations of the technology by 2030.
• Safety fears arising from the Fukushima nuclear disaster influence both roadmaps. The EU roadmap makes explicit reference to the need to ensure the safety and security from new energy sources.
Both roadmaps call for electricity to play a larger part in the energy mix in order to enable more intermittent power generation and to reduce local pollution and national carbon emissions. Electricity is seen to have the potential to replace fossil fuels for transport (electric vehicles), heating and cooling. Of particular note is the emphasis in both roadmaps on international energy transfers.
• The EU roadmap calls not only for a fully integrated energy market across Europe, but also to align national policies to ensure mutually supportive cross-‐border transmission. The PRC roadmap describes a primary global grid facilitating cross-‐border trade in power, and the need for a High Voltage Direct Current (HVDC) grid to transfer power over large distances.
Climate change and the need to cut greenhouse gas (GHG) emissions features in both roadmaps, mentioning the need for coordinated global action and carbon taxation.
• Methods to reduce GHG emissions from the energy sector feature in both roadmaps, although while this lies at the crux of the EU roadmap, it could be argued that the PRC roadmap is less focused on this issue. The PRC utopia scenario describes how the concern for the environment will increase in a
32 Challenges and approaches of integrating intermittent power A comparative analysis between roadmaps for Europe and China
Elliott More et al. April 2014
wealthier nation, and that the PRC carbon tax system should link to other international schemes.
• The EU roadmap calls for a broader and more coordinated approach among EU member stakes alongside further action at the international level.
• The crucial role of carbon or emissions taxation is evident in both roadmaps. The PRC roadmap makes the recommendation to review carbon taxation pilot schemes and expand these consistently in order to set the right incentives to deliver material reductions in carbon emissions. The EU roadmap sees the European Trading Scheme (ETS) as a central pillar of European climate policy designed to provide an incentive for deployment of efficient, low carbon technologies across Europe.
A notable difference between the two roadmaps is the discussion on the energy market, reflecting the heavily regulated and subsidised nature of PRC energy. The PRC roadmap calls for energy price deregulation and a removal of subsidies, learning lessons from the same transition that occurred in Europe. A more subtle recommendation in the EU roadmap calls for energy prices to reflect costs more effectively, most notably the investments needed throughout the energy system.
Another crucial difference between the two countries is reflected in the roadmaps’ approach to economic growth. While the PRC roadmap takes high economic growth as a continuing assumption that drives energy demand, the EU roadmap aims to decouple economic growth from energy consumption. Further the EU views investment in decarbonising as a potential source of economic growth, aiming to capitalise on the growing market for decarbonisation technologies.
Roadmap Process Analysis Whilst both documents are identified as roadmaps, there are in fact a variety of different types of roadmap (Phaal et al. 2001, p.5). Up until this point the roadmaps have been considered as similar types of roadmaps, however the roadmaps were created using different methodologies, and thus a discussion is appropriate on how this difference impacts the analysis.
The PRC roadmap was conducted using the principles of technology roadmapping, the process described in the Introduction section and developed at the Centre for Technology Management, University of Cambridge.
In both cases, the roadmaps were created by a group of experts expressly selected based on their individual expertise and experience, and as a group to include representatives from a wide variety of stakeholders. In the case of the EU roadmap, the majority of the participants came from academia, but were complemented by experts from think tanks and non-‐governmental groups. The PRC roadmap on the other hand drew from a wider selection of stakeholders, including academic, industry, and policy makers. Following the EU roadmap, there was a public consultation (European Commission 2011d), which did not occur in the case of the PRC roadmap.
33 Challenges and approaches of integrating intermittent power A comparative analysis between roadmaps for Europe and China
Elliott More et al. April 2014
Roadmapping literature would suggest that including diversity in the participants is crucial to not only ensure all relevant issues are considered, but also as an effective method for participants to share ideas and develop buy-‐in to the roadmap’s actions and conclusions (Kerr et al. 2012; de Laat & McKibbin 2003; Garcia & Bray 1997; Industry Canada 2002). Indeed, many suggest that the roadmapping process is just as important as the eventual roadmap by creating social connections between important industry stakeholders (for example Phaal et al. 2010, p.108).
The roadmapping process must be customised to local conditions. Both organisational and cultural differences must be considered in the design of the process, and in the case of the PRC, additional considerations were required given the language barrier. The workshop was largely conducted in English, and as a result some participants were not able to communicate in their native language. However a trusted translator was able to act as a go-‐between to ensure all participants understood each other.
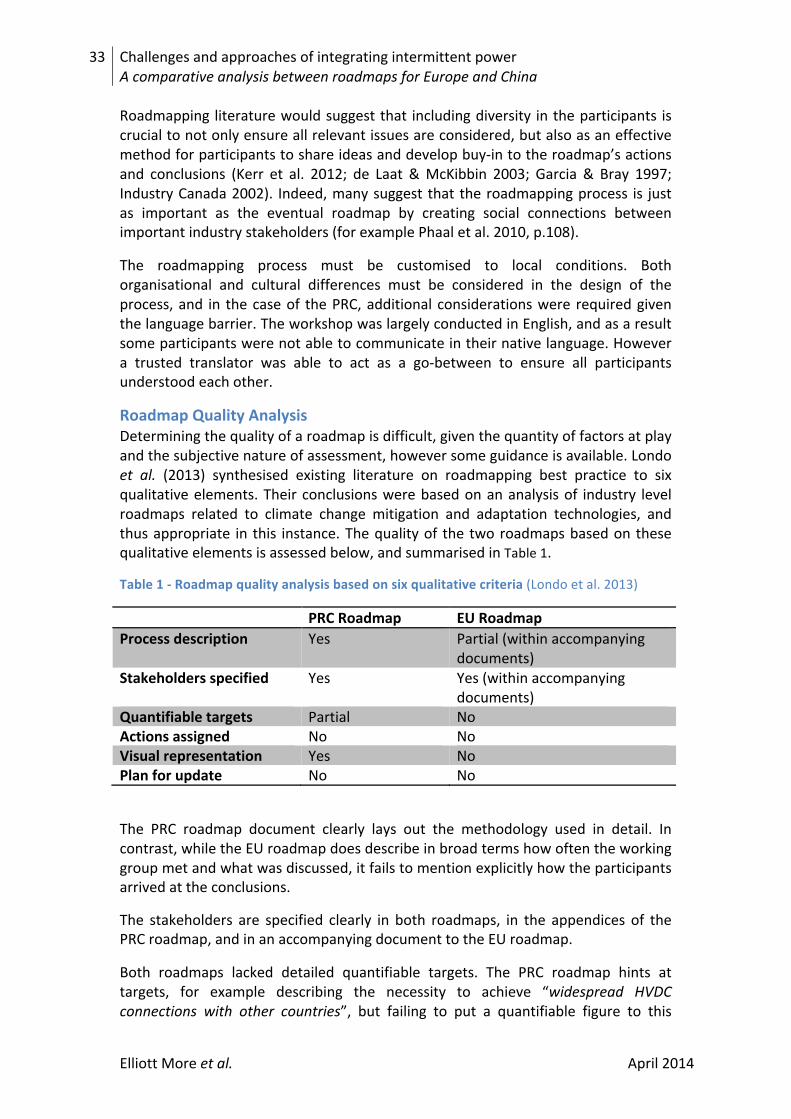
Roadmap Quality Analysis Determining the quality of a roadmap is difficult, given the quantity of factors at play and the subjective nature of assessment, however some guidance is available. Londo et al. (2013) synthesised existing literature on roadmapping best practice to six qualitative elements. Their conclusions were based on an analysis of industry level roadmaps related to climate change mitigation and adaptation technologies, and thus appropriate in this instance. The quality of the two roadmaps based on these qualitative elements is assessed below, and summarised in Table 1.
Table 1 -‐ Roadmap quality analysis based on six qualitative criteria (Londo et al. 2013)
PRC Roadmap EU Roadmap Process description Yes Partial (within accompanying
documents) Stakeholders specified Yes Yes (within accompanying
documents) Quantifiable targets Partial No Actions assigned No No Visual representation Yes No Plan for update No No
The PRC roadmap document clearly lays out the methodology used in detail. In contrast, while the EU roadmap does describe in broad terms how often the working group met and what was discussed, it fails to mention explicitly how the participants arrived at the conclusions.
The stakeholders are specified clearly in both roadmaps, in the appendices of the PRC roadmap, and in an accompanying document to the EU roadmap.
Both roadmaps lacked detailed quantifiable targets. The PRC roadmap hints at targets, for example describing the necessity to achieve “widespread HVDC connections with other countries”, but failing to put a quantifiable figure to this
34 Challenges and approaches of integrating intermittent power A comparative analysis between roadmaps for Europe and China
Elliott More et al. April 2014
proposal. The EU roadmap includes similar ambiguous wording, such as “the safety and security from new energy sources must continue to be strengthened”, without defining how or by when.
In order to maintain the momentum built during the roadmapping process, it is important to assign actions to specific people or groups, however neither roadmap documents appear to assign actions in such a way. The PRC roadmap actions include statements such as “review pilot schemes and expand consistency”, but do not include who should take on this responsibility. One of the actions in the EU roadmap is to create concrete milestones, which have been created in subsequent documents (such as European Commission 2011a).
A visual representation using the three layers along the vertical axis and time along the horizontal axis is a fundamental aspect of the roadmapping process developed by Phaal et al. (2010). The PRC roadmap was based on this method whereas the EU roadmap was not, therefore it is no great surprise that the EU roadmap does not include this specific type of visual, however the fact that there is no visualisation at all is notable.
Phaal et al. (2010) describe how the roadmap should be updated regularly. Given the speed of change within the world, the roadmap will become obsolete quickly unless it is updated regularly, and thus should be seen as a live document. Neither roadmaps discuss a plan for an update.
35 Challenges and approaches of integrating intermittent power A comparative analysis between roadmaps for Europe and China
Elliott More et al. April 2014
Conclusion Having presented a synthesis of first the energy and policy contexts within the two regions, and subsequently the outputs, similarities and differences between the two roadmaps, it is now possible to conclude this report with an attempt to explain the differences and similarities based on the different contexts in which they emerged. The conclusions discuss four elements: roadmap content within the different contexts, the roadmapping processes, the quality of the roadmaps, and the limitations of the study.
Three key conclusions emerge from an analysis of the context and roadmap outcomes:
• Despite the size of the PRC economy, it is a developing country based on its low per capita income, and thus exempt from the requirements for carbon emission reductions under international climate negotiations. This fact is reflected in the roadmap’s focus, and whereas the EU roadmap is built around the need to decarbonise the energy system, the PRC roadmap takes a more balanced view towards the continuing use of fossil fuel alongside a steadily growing renewable and intermittent power generation capacity.
• The different proportions of the economy using energy and generating economic growth between the two regions contributes to the different opinions on the link between energy use and economic growth. The PRC roadmap assumes that continued economic growth is linked with increasing energy use based on its reliance on industry as the driving force behind economic growth, while the EU has the potential to decouple economic growth from energy use with a larger service sector.
• Improving energy efficiency is a clear vision within both the roadmaps, reflecting the fact that both regions are importers of energy (PRC set to become a large importer of oil and gas) and are looking to reduce their reliance on fluctuating but generally increasing energy prices on the world markets.
• Forecasts put the expected share of intermittent power within the EU grid at nearly a quarter by 2035 compared to only 10% in PRC. This is significant as the technical reports on integrating intermittent power into grids warn that as contribution increases, there is an almost exponential growth in the capital investment required to upgrade the grid. This greater expense to the EU triggered the subsequent publishing of a report by the European Commission (2011b) into the expected costs.
Whilst the two roadmaps were created using different methodologies, and the description of the EU roadmap process is limited in the roadmap document, this fact does enable some interesting comparisons between the methodologies used to be drawn. The following recommendation arises in the context of recommendations given for best practice roadmapping described in the Introduction.
• Participants in the EU roadmap were drawn largely from academia and think tanks, with only limited industry or government involvement. The PRC
36 Challenges and approaches of integrating intermittent power A comparative analysis between roadmaps for Europe and China
Elliott More et al. April 2014
roadmap in comparison had participants from industry, academia and government, which can be expected to improve the quality of the discussion and the recommendations. The EU roadmap did however include post-‐roadmap public consultation which was not the case in the PRC roadmap.
Neither roadmap fully met the best practice qualitative recommendations, and therefore should the roadmaps be repeated, they would benefit from the following considerations:
• Both roadmaps need more quantifiable targets, and actions should be assigned to specific individuals or organisations.
• Effective roadmaps are part of an on-‐going process, and thus plans to repeat the roadmapping process should be included.
• The EU roadmap would benefit from structuring the actions in a multi-‐layered roadmap visual to aid communication and understanding.
Limitations of the study must also be considered to judge the validity of the conclusions and to suggest further work. This report and analysis has taken the approach of using roadmaps as a perspective on the renewable energy challenges between two different regions. However this is just one possible perspective, analysis by other means, such as literature review and expert interviews could have revealed different conclusions. Thus the conclusions from this analysis would be strengthened by checking for consistency with other roadmaps created on this subject, and also other related documents.
The difference in methodologies is the most obvious limitation of the comparison, although this contrast also provides the opportunity to improve both roadmaps in the future. Both roadmaps would potentially benefit from studying the other, and from the recommendations laid out in this report.
In conclusion, despite the differences in methodology and local context, both the EU and PRC have found have found roadmapping to be a useful and engaging activity in addressing the challenges of integrating renewable and intermittent power generation into electricity grids. The roadmaps for a basis from which the renewable energy industries in both Europe and China may further develop.
37 Challenges and approaches of integrating intermittent power A comparative analysis between roadmaps for Europe and China
Elliott More et al. April 2014
References
Ayres, R. & Ayres, E., 2009. Crossing the Energy Divide: Moving from Fossil Fuel Dependence to a Clean-‐Energy Future 1st ed., Prentice Hall.
China Greentech Initiative, 2013. The China Greentech Report 2013: China at a Crossroads, Beijing.
EIA, 2014. U.S. Energy Information Administration. Countries Statistics. Available at: http://www.eia.gov/countries/index.cfm [Accessed April 23, 2014].
Eloot, K., Huang, A. & Lehnich, M., 2013. A new era for manufacturing in China. McKinsey Quarterly, (June), pp.1–18.
European Commission, 2011a. A Roadmap for moving to a competitive low carbon economy in 2050, Brussels.
European Commission, 2011b. Assessment of the Required Share for a Stable EU Electricity Supply until 2050, Brussels.
European Commission, 2014a. Energy Statistics Glossary. Eurostat. Available at: http://epp.eurostat.ec.europa.eu/statistics_explained/index.php/Glossary.
European Commission, 2009. EU energy trends to 2030, Brussels.
European Commission, 2014b. European Economic Forecast: Winter 2014, Brussels.
European Commission, 2014c. Eurostat Statistical Data. Available at: http://epp.eurostat.ec.europa.eu [Accessed April 22, 2014].
European Commission, 2011c. Final Report of the Advisory Group on the Energy Roadmap 2050, Brussels.
European Commission, 2011d. Results of the public consultation on the Energy Roadmap 2050, Brussels.
European Commission, 2014d. The 2020 climate and energy package. Available at: http://ec.europa.eu/clima/policies/package/index_en.htm [Accessed April 24, 2014].
Ford, S. & More, E., 2014. China’s Energy Future: Report on the China Power Pathways Technology Roadmapping Event, Cambridge.
Friedman, L., 2012. China Greenhouse Gas Emissions Set to Rise Well Past U.S. Scientific American.
38 Challenges and approaches of integrating intermittent power A comparative analysis between roadmaps for Europe and China
Elliott More et al. April 2014
Garcia, M.L. & Bray, O.H., 1997. Fundamentals of Technology Roadmapping, Albuquerque, NM.
Industry Canada, 2002. Synthesis of Six Technology Roadmap Evaluations,
Innes Miller, J., 1969. Spice Trade of the Roman Empire 29 B. C. to A.D. 641, Oxford: Oxford University Press.
Institute for Manufacturing, 2010. Technology roadmapping: facilitating collaborative strategy development, Cambridge.
International Energy Agency, 2011. Harnessing Variable Renewables: A Guide to the Balancing Challenge, Paris.
International Energy Agency, 2013a. Key World Energy Statistics, Paris.
International Energy Agency, 2013b. World Energy Outlook 2013, Paris.
International Energy Agency, 2013c. World Energy Outlook: Renewable Energy Outlook, Paris.
IPCC, 2012. Renewable Energy Sources and Climate Change Mitigation O. Edenhofer, R. P. Madruga, & Y. Sokona, eds., Cambridge: Cambridge University Press.
Kerr, C., Phaal, R. & Probert, D., 2012. Addressing the Cognitive and Social Influence Inhibitors During the Ideation Stages of Technology Roadmapping Workshops. International Journal of Innovation and Technology Management, 09(06), p.1250046.
De Laat, B. & McKibbin, S., 2003. The effectiveness of technology road mapping -‐ building a strategic vision, Technopolis.
Londo, M. et al., 2013. Background paper on Technology Roadmaps, Technology Executive Committee of the United Nations Framework Convention on Climate Change.
Mackay, D.J.C., 2008. Sustainable Energy – without the hot air, Cambridge: UIT Cambridge.
Manyika, J. et al., 2012. Manufacturing the future: The next era of global growth and innovation, McKinsey Global Institute.
McCormick, J., 2008. European Union: politics and policies 4th ed., Boulder, Colorado: Westview.
39 Challenges and approaches of integrating intermittent power A comparative analysis between roadmaps for Europe and China
Elliott More et al. April 2014
National Bureau of Statistics of China, 2014. National Bureau of Statistics of the People’s Republic of China. Available at: http://data.stats.gov.cn/ [Accessed April 18, 2014].
Phaal, R., Farrukh, C. & Probert, D., 2010. Roadmapping for Strategy and Innovation: Aligning Technology and Markets in a Dynamic World, Cambridge: Institute for Manufacturing, University of Cambridge.
Phaal, R., Farrukh, C. & Probert, D., 2001. Technology Roadmapping: linking technology resources to business objectives, Cambridge.
Phaal, R. & Muller, G., 2009. An architectural framework for roadmapping: Towards visual strategy. Technological Forecasting and Social Change, 76(1), pp.39–49.
Technology Strategy Board, 2012. A landscape for the future of high value manufacturing in the UK, London.
The Carbon Trust & DTI, 2003. Renewables Network Impact Study: Intermittency Literature Survey & Roadmap,
The Economist, 2014. China’s economy: In three parts. The Economist.
The World Bank, 2014. The World Bank Data. Available at: http://data.worldbank.org/ [Accessed April 22, 2014].
US National Intelligence Council, 2012. Global Trends 2030: Alternative Worlds,
Wenke, H. & Yufeng, Y., 2013. China Energy outlook, Washington DC.
Wiessala, G., Wilson, J.F. & Taneja, P., 2009. The European Union and China: Interests and Dilemmas, Rodopi.
Yao, S., 2011. The EU-‐China Economic Relationship. ECRAN. Available at: http://www.euecran.eu/economics [Accessed April 17, 2014].
Zhang, K.H., 2006. China as the World Factory, Taylor & Francis.
Zhou, N. et al., 2011. China’s Energy and Carbon Emissions Outlook to 2050, Berkeley, California.
40 Challenges and approaches of integrating intermittent power A comparative analysis between roadmaps for Europe and China
Elliott More et al. April 2014
Appendix
Note on EU Forecasts considered Two documents were used in this study for the forecasts of EU statistics: the European Commission (2009) EU energy trends to 2030, and International Energy Agency (2013b). In both these forecasts, a number of different scenarios are projects. For the sake of simplicity in this analysis, the conservative or middle estimates have been used, which typically reflect a business as usual scenario in which policies are implemented as announced, including national pledges to reduce greenhouse-‐gas emissions. Therefore the Baseline Scenario and the New Policies Scenario are used, and are described in more detail below.
EU energy trends to 2030 (European Commission 2009)
The European Commission report titled EU energy trends to 2030 presents forecasts developed used the PRIMES model 7 . The PRIMES model simulates a market equilibrium solution for energy supply and demand in Europe based on current trends and policies as implemented by Member States by April 2009, the date of the report. The 2009 scenario takes account of the 2008 financial downturn and associated drops in energy intensive industries. It also considers legislation adopted including the Climate and Energy Package adopted in December 2007.
Two scenarios are used in the trends. The 2009 Baseline determines the development of the EU energy system under current trends and policies. Economic decisions are driven by market forces and technology progress in the framework of actual national and EU policies implemented by April 2009. The ETS and a number of energy efficiency measures are included. The Reference scenario is based on the same assumptions, but in addition is assumes that national targets under the Renewables directive 2009/28/EC and the GHG Effort sharing decision 2009/406/EC are achieved in 2020.
The energy trends under the 2009 Baseline assumptions lead to significant decreasing emissions and energy intensity gains, trends which deliver considerable ancillary benefits in terms of security of supply and non climate related environmental pressures. However, the results fall short of the agreed binding targets on greenhouse gases. The Reference scenario would be expected to be better in terms of meeting GHG emissions targets, however given the more realistic nature of the 2009 Baseline scenario, it has been used for forecasts in this analysis.
World Energy Outlook 2013 (International Energy Agency 2013b)
The second set of forecasts come from the International Energy Agency, with projections of energy trends through to 2035. The World Energy Outlook is widely
7 The scenarios derived from the PRIMES model developed by a consortium led by the National Technical University of Athens (E3MLab). For more information refer to the report which details the methodology and assumptions made in the model.
41 Challenges and approaches of integrating intermittent power A comparative analysis between roadmaps for Europe and China
Elliott More et al. April 2014
recognised as the most authoritative source of strategic analysis of global energy markets8.
Three scenarios are presented, New Policies, Current Policies, and 450 Scenario.
The Current Policies scenario assumes no changes in policies from the mid-‐point of 2013, and serves as a reference scenario.
The New Policies scenario takes account of broad policy commitments and plans that have been announced by countries, including national pledges to reduce greenhouse-‐gas emissions and plans to phase out fossil-‐energy subsidies, even if the measures to implement these commitments have yet to be identified or announced.
The 450 Scenario in comparison sets out an energy pathway consistent with the goal of limiting the global increase in temperature to 2°C by limiting concentration of greenhouse gases in the atmosphere to around 450 parts per million of CO2.
8 For example see recommendations listed at www.worldenergyoutlook.org/opinionleadersonweo
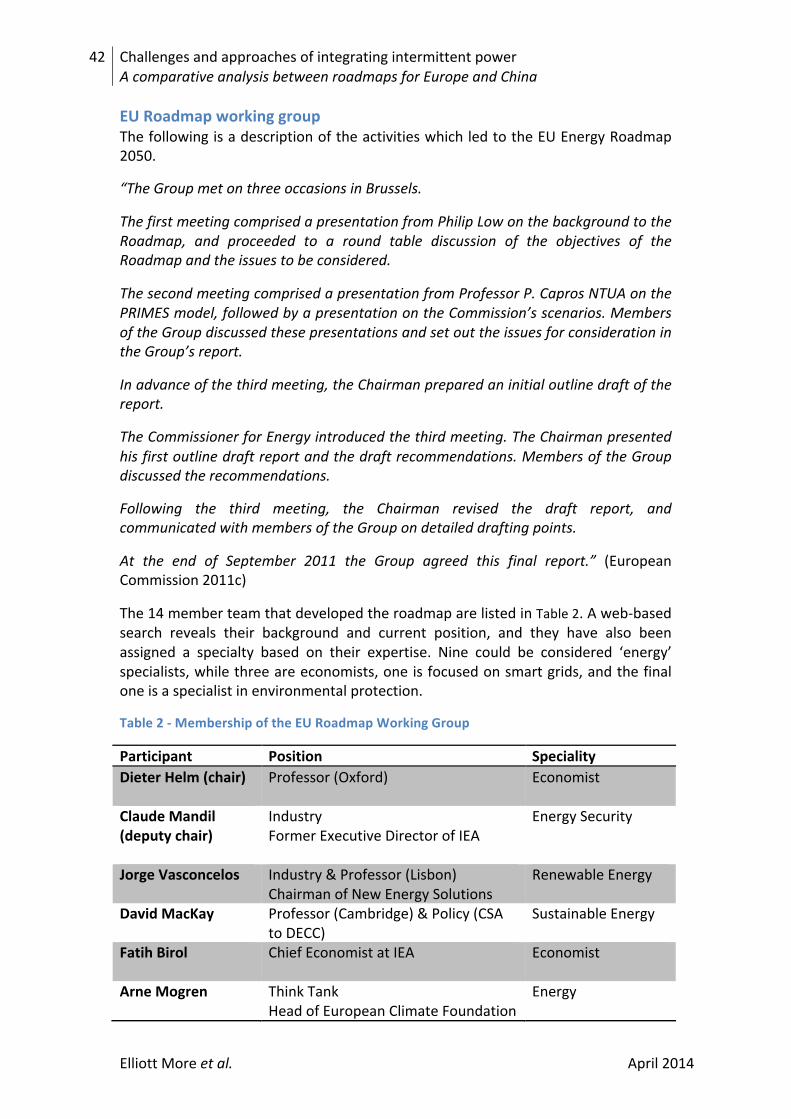
42 Challenges and approaches of integrating intermittent power A comparative analysis between roadmaps for Europe and China
Elliott More et al. April 2014
EU Roadmap working group The following is a description of the activities which led to the EU Energy Roadmap 2050.
“The Group met on three occasions in Brussels.
The first meeting comprised a presentation from Philip Low on the background to the Roadmap, and proceeded to a round table discussion of the objectives of the Roadmap and the issues to be considered.
The second meeting comprised a presentation from Professor P. Capros NTUA on the PRIMES model, followed by a presentation on the Commission’s scenarios. Members of the Group discussed these presentations and set out the issues for consideration in the Group’s report.
In advance of the third meeting, the Chairman prepared an initial outline draft of the report.
The Commissioner for Energy introduced the third meeting. The Chairman presented his first outline draft report and the draft recommendations. Members of the Group discussed the recommendations.
Following the third meeting, the Chairman revised the draft report, and communicated with members of the Group on detailed drafting points.
At the end of September 2011 the Group agreed this final report.” (European Commission 2011c)
The 14 member team that developed the roadmap are listed in Table 2. A web-‐based search reveals their background and current position, and they have also been assigned a specialty based on their expertise. Nine could be considered ‘energy’ specialists, while three are economists, one is focused on smart grids, and the final one is a specialist in environmental protection.
Table 2 -‐ Membership of the EU Roadmap Working Group
Participant Position Speciality Dieter Helm (chair)
Professor (Oxford) Economist
Claude Mandil (deputy chair)
Industry Former Executive Director of IEA
Energy Security
Jorge Vasconcelos
Industry & Professor (Lisbon) Chairman of New Energy Solutions
Renewable Energy
David MacKay
Professor (Cambridge) & Policy (CSA to DECC)
Sustainable Energy
Fatih Birol
Chief Economist at IEA Economist
Arne Mogren
Think Tank Head of European Climate Foundation
Energy
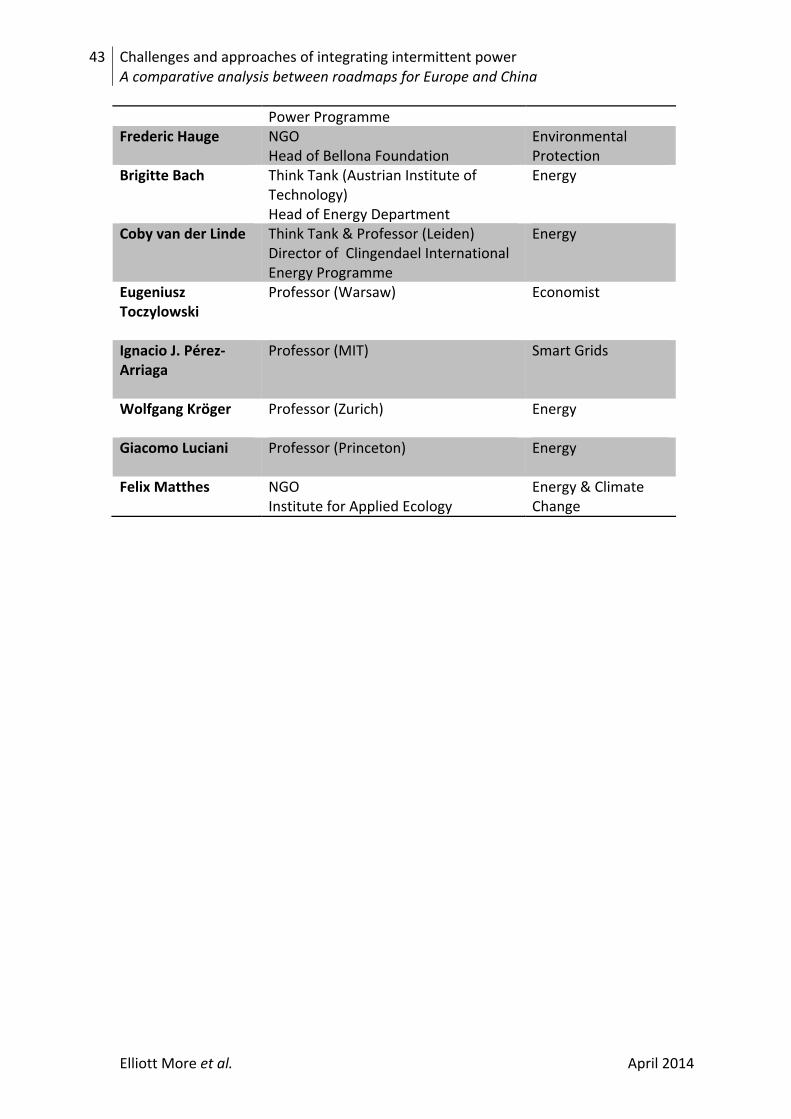
43 Challenges and approaches of integrating intermittent power A comparative analysis between roadmaps for Europe and China
Elliott More et al. April 2014
Power Programme Frederic Hauge
NGO Head of Bellona Foundation
Environmental Protection
Brigitte Bach
Think Tank (Austrian Institute of Technology) Head of Energy Department
Energy
Coby van der Linde
Think Tank & Professor (Leiden) Director of Clingendael International Energy Programme
Energy
Eugeniusz Toczylowski
Professor (Warsaw)
Economist
Ignacio J. Pérez-‐Arriaga
Professor (MIT) Smart Grids
Wolfgang Kröger
Professor (Zurich) Energy
Giacomo Luciani
Professor (Princeton) Energy
Felix Matthes NGO Institute for Applied Ecology
Energy & Climate Change
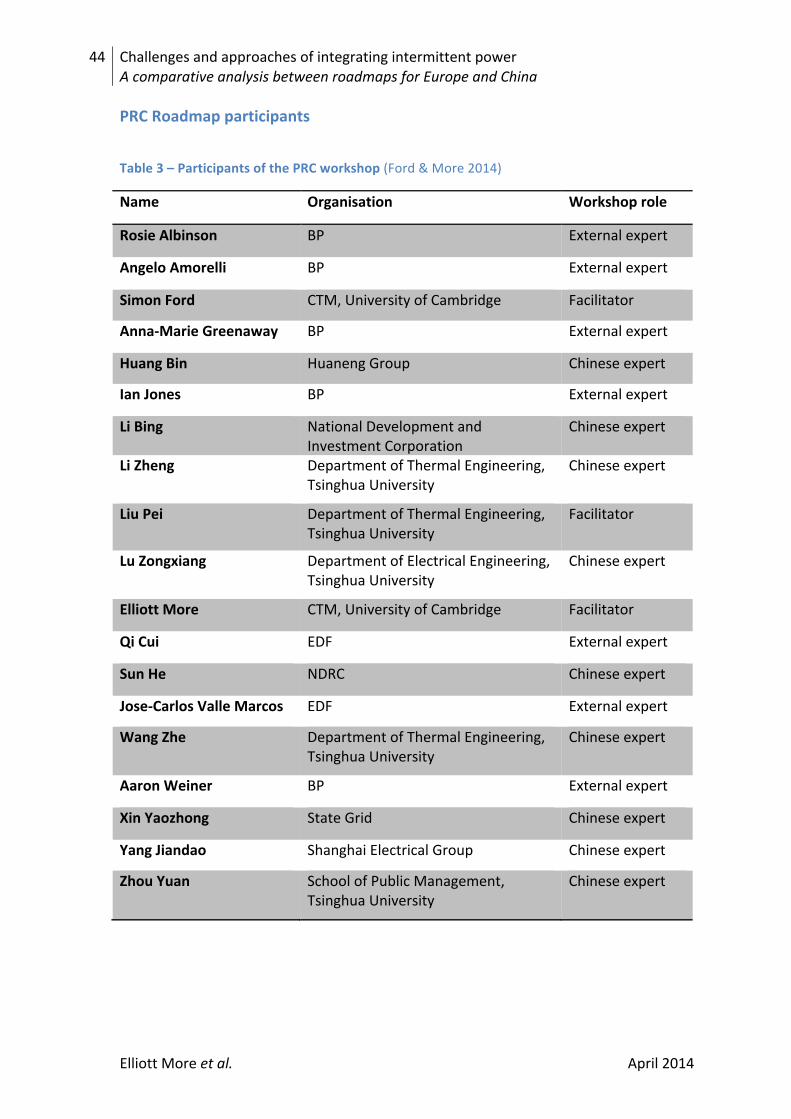
44 Challenges and approaches of integrating intermittent power A comparative analysis between roadmaps for Europe and China
Elliott More et al. April 2014
PRC Roadmap participants
Table 3 – Participants of the PRC workshop (Ford & More 2014)
Name Organisation Workshop role
Rosie Albinson BP External expert
Angelo Amorelli BP External expert
Simon Ford CTM, University of Cambridge Facilitator
Anna-‐Marie Greenaway BP External expert
Huang Bin Huaneng Group Chinese expert
Ian Jones BP External expert
Li Bing National Development and Investment Corporation
Chinese expert
Li Zheng Department of Thermal Engineering, Tsinghua University
Chinese expert
Liu Pei Department of Thermal Engineering, Tsinghua University
Facilitator
Lu Zongxiang Department of Electrical Engineering, Tsinghua University
Chinese expert
Elliott More CTM, University of Cambridge Facilitator
Qi Cui EDF External expert
Sun He NDRC Chinese expert
Jose-‐Carlos Valle Marcos EDF External expert
Wang Zhe Department of Thermal Engineering, Tsinghua University
Chinese expert
Aaron Weiner BP External expert
Xin Yaozhong State Grid Chinese expert
Yang Jiandao Shanghai Electrical Group Chinese expert
Zhou Yuan School of Public Management, Tsinghua University
Chinese expert