Cerebral cortical folding analysis with multivariate modeling and testing: Studies on gender...
10
Cerebral cortical folding analysis with multivariate modeling and testing: Studies on gender differences and neonatal development Suyash P. Awate a, ⁎, Paul A. Yushkevich a , Zhuang Song b , Daniel J. Licht c , James C. Gee a a Penn Image Computing and Science Laboratory, Department of Radiology, University of Pennsylvania, USA b Department of Psychiatry, University of California, San Diego, USA c Division of Neurology, The Children's Hospital of Philadelphia, USA abstract article info Article history: Received 5 April 2010 Revised 10 June 2010 Accepted 27 June 2010 Available online xxxx Keywords: Cerebral cortical folding Statistical shape analysis Gender differences Neonatal development This paper presents a novel statistical framework for human cortical folding pattern analysis that relies on a rich multivariate descriptor of folding patterns in a region of interest (ROI). The ROI-based approach avoids problems faced by spatial normalization-based approaches stemming from the deficiency of homologous features between typical human cerebral cortices. Unlike typical ROI-based methods that summarize folding by a single number, the proposed descriptor unifies multiple characteristics of surface geometry in a high- dimensional space (hundreds/thousands of dimensions). In this way, the proposed framework couples the reliability of ROI-based analysis with the richness of the novel cortical folding pattern descriptor. This paper presents new mathematical insights into the relationship of cortical complexity with intra-cranial volume (ICV). It shows that conventional complexity descriptors implicitly handle ICV differences in different ways, thereby lending different meanings to “complexity”. The paper proposes a new application of a nonparametric permutation-based approach for rigorous statistical hypothesis testing with multivariate cortical descriptors. The paper presents two cross-sectional studies applying the proposed framework to study folding differences between genders and in neonates with complex congenital heart disease. Both studies lead to novel interesting results. © 2010 Elsevier Inc. All rights reserved. Introduction Cerebral cortical folding (Armstrong et al., 1995; Ono et al., 1990; Van-Essen, 1997) forms an underpinning for the cognitive skills and behavioral traits in humans. It is one of the major maturational processes of the human brain that occurs rapidly throughout fetal and early postnatal life and is a major factor contributing to human intelligence. For the last few decades, magnetic resonance (MR) imaging has enabled in vivo studies of human cortical folding patterns. One class of approaches to folding analysis relies on spatial normalization (Nordahl et al., 2007; Yeo et al., 2008; Yu et al., 2007) and subsequently performs statistical hypothesis testing at every voxel or surface element in the normalized space. However, the difficulty in finding a large number of homologous features (Lyttelton et al., 2007; Mangin et al., 2004; Van-Essen and Dierker, 2007) may directly affect the normalization and, thereby, the reliability of findings in the clinical study. Furthermore, the phenomenon of cortical folding has an inherent large-scale or non-local character that may be difficult to capture with point-based descriptors. A second class of approaches proposes region-based folding descriptors (Batchelor et al., 2002; Pienaar et al., 2008; Rodriguez- Carranza et al., 2008; Van-Essen and Drury, 1997), which avoid the challenges associated with normalization by reducing spatial sensi- tivity from a voxel to a region of interest (ROI) that can be reliably defined in each individual based on observed homologous features. Examples of such ROIs can be brain lobes, regions around major sulci/ gyri, etc. Some descriptors quantify surface complexity alone: fractal dimension (FD) (Griffin, 1994; Majumdar and Prasad, 1988; Thomp- son et al., 1996) captures the rate of increase in surface area over multiscale representations of the surface; gyrification index (GI) (Zilles et al., 1988) is the ratio of the length of a planar/2D curve to the length of its convex hull/envelope; convexity ratio (CR) (Batchelor et al., 2002) is the ratio of the area of the surface to the area of the convex hull of the surface; isoperimetric ratio (IPR) (Batchelor et al., 2002; Im et al., 2008; Toro et al., 2008) is the ratio of the surface area to the two-third power of the volume enclosed by the surface; average curvedness (AC) (Awate et al., 2008) measures the deviation of the surface from a plane; another measure is the 2D centroid of the 1D histogram of curvature (HC) (Pienaar et al., 2008). Some folding descriptors capture partial folding characteristics by integrating specific measures for all surface patches: intrinsic curvature index (ICI) (Van-Essen and Drury, 1997) integrates degrees of hemispheri- city; mean curvature norm (MCN) (Batchelor et al., 2002) integrates NeuroImage xxx (2010) xxx–xxx ⁎ Corresponding author. E-mail address: [email protected] (S.P. Awate). YNIMG-07459; No. of pages: 10; 4C: 1053-8119/$ – see front matter © 2010 Elsevier Inc. All rights reserved. doi:10.1016/j.neuroimage.2010.06.072 Contents lists available at ScienceDirect NeuroImage journal homepage: www.elsevier.com/locate/ynimg Please cite this article as: Awate, S.P., et al., Cerebral cortical folding analysis with multivariate modeling and testing: Studies on gender differences and neonatal development, NeuroImage (2010), doi:10.1016/j.neuroimage.2010.06.072
Transcript of Cerebral cortical folding analysis with multivariate modeling and testing: Studies on gender...
NeuroImage xxx (2010) xxx–xxx
YNIMG-07459; No. of pages: 10; 4C:
Contents lists available at ScienceDirect
NeuroImage
j ourna l homepage: www.e lsev ie r.com/ locate /yn img
Cerebral cortical folding analysis with multivariate modeling and testing:Studies on gender differences and neonatal development
Suyash P. Awate a,⁎, Paul A. Yushkevich a, Zhuang Song b, Daniel J. Licht c, James C. Gee a
a Penn Image Computing and Science Laboratory, Department of Radiology, University of Pennsylvania, USAb Department of Psychiatry, University of California, San Diego, USAc Division of Neurology, The Children's Hospital of Philadelphia, USA
⁎ Corresponding author.E-mail address: [email protected] (S.P. Awat
1053-8119/$ – see front matter © 2010 Elsevier Inc. Aldoi:10.1016/j.neuroimage.2010.06.072
Please cite this article as: Awate, S.P., et adifferences and neonatal development, Neu
a b s t r a c t
a r t i c l e i n f oArticle history:Received 5 April 2010Revised 10 June 2010Accepted 27 June 2010Available online xxxx
Keywords:Cerebral cortical foldingStatistical shape analysisGender differencesNeonatal development
This paper presents a novel statistical framework for human cortical folding pattern analysis that relies on arich multivariate descriptor of folding patterns in a region of interest (ROI). The ROI-based approach avoidsproblems faced by spatial normalization-based approaches stemming from the deficiency of homologousfeatures between typical human cerebral cortices. Unlike typical ROI-based methods that summarize foldingby a single number, the proposed descriptor unifies multiple characteristics of surface geometry in a high-dimensional space (hundreds/thousands of dimensions). In this way, the proposed framework couples thereliability of ROI-based analysis with the richness of the novel cortical folding pattern descriptor. This paperpresents new mathematical insights into the relationship of cortical complexity with intra-cranial volume(ICV). It shows that conventional complexity descriptors implicitly handle ICV differences in different ways,thereby lending different meanings to “complexity”. The paper proposes a new application of anonparametric permutation-based approach for rigorous statistical hypothesis testing with multivariatecortical descriptors. The paper presents two cross-sectional studies applying the proposed framework tostudy folding differences between genders and in neonates with complex congenital heart disease. Bothstudies lead to novel interesting results.
e).
l rights reserved.
l., Cerebral cortical folding analysis with mulroImage (2010), doi:10.1016/j.neuroimage.2
© 2010 Elsevier Inc. All rights reserved.
Introduction
Cerebral cortical folding (Armstrong et al., 1995; Ono et al., 1990;Van-Essen, 1997) forms an underpinning for the cognitive skills andbehavioral traits in humans. It is one of the major maturationalprocesses of the human brain that occurs rapidly throughout fetaland early postnatal life and is a major factor contributing to humanintelligence. For the last few decades, magnetic resonance (MR)imaging has enabled in vivo studies of human cortical foldingpatterns.
One class of approaches to folding analysis relies on spatialnormalization (Nordahl et al., 2007; Yeo et al., 2008; Yu et al., 2007)and subsequently performs statistical hypothesis testing at everyvoxel or surface element in the normalized space. However, thedifficulty in finding a large number of homologous features (Lytteltonet al., 2007; Mangin et al., 2004; Van-Essen and Dierker, 2007) maydirectly affect the normalization and, thereby, the reliability offindings in the clinical study. Furthermore, the phenomenon ofcortical folding has an inherent large-scale or non-local character thatmay be difficult to capture with point-based descriptors.
A second class of approaches proposes region-based foldingdescriptors (Batchelor et al., 2002; Pienaar et al., 2008; Rodriguez-Carranza et al., 2008; Van-Essen and Drury, 1997), which avoid thechallenges associated with normalization by reducing spatial sensi-tivity from a voxel to a region of interest (ROI) that can be reliablydefined in each individual based on observed homologous features.Examples of such ROIs can be brain lobes, regions around major sulci/gyri, etc. Some descriptors quantify surface complexity alone: fractaldimension (FD) (Griffin, 1994; Majumdar and Prasad, 1988; Thomp-son et al., 1996) captures the rate of increase in surface area overmultiscale representations of the surface; gyrification index (GI)(Zilles et al., 1988) is the ratio of the length of a planar/2D curve to thelength of its convex hull/envelope; convexity ratio (CR) (Batcheloret al., 2002) is the ratio of the area of the surface to the area of theconvex hull of the surface; isoperimetric ratio (IPR) (Batchelor et al.,2002; Im et al., 2008; Toro et al., 2008) is the ratio of the surface areato the two-third power of the volume enclosed by the surface; averagecurvedness (AC) (Awate et al., 2008) measures the deviation of thesurface from a plane; another measure is the 2D centroid of the 1Dhistogram of curvature (HC) (Pienaar et al., 2008). Some foldingdescriptors capture partial folding characteristics by integratingspecific measures for all surface patches: intrinsic curvature index(ICI) (Van-Essen and Drury, 1997) integrates degrees of hemispheri-city; mean curvature norm (MCN) (Batchelor et al., 2002) integrates
tivariate modeling and testing: Studies on gender010.06.072
2 S.P. Awate et al. / NeuroImage xxx (2010) xxx–xxx
degrees of hemisphericity and cylindricity; Gaussian curvature norm(GCN) (Batchelor et al., 2002) integrates degrees of hemisphericityand saddle-likeness; average shape index (AS) (Awate et al., 2008)integrates shape indices. Thus, typical ROI-based approaches producescalar or low-dimensional summary statistics for the entire ROI,risking information loss.
This paper presents a new ROI-based statistical framework forfolding analysis relying on a rich multivariate non-local descriptorthat captures multiple aspects of surface geometry (Awate et al.,2009a,b). The proposed descriptor is a joint probability densityfunction (PDF) of two complementary/independent variables, onecapturing surface curvedness and the other capturing surface shapeindex. The resulting surface folding descriptor lies in a space havinghundreds or thousands of dimensions. The paper proposes a newapplication of a nonparametric permutation-based approach forstatistical hypothesis testing with multivariate cortical descriptors.In these ways, the proposed framework couples the reliability of ROI-based analysis with the richness of the proposed descriptor. Thispaper validates the proposed framework, on simulated as well asclinical data, and presents applications on two neuroimaging studies,in adults and neonates.
While several folding studies concern neurodevelopmentaldisorders, studies on gender differences, in the normal population,have received very little attention. Moreover, while one study(Luders et al., 2004) using the FD measure reported highercomplexity in adult females, two recent studies (Im et al., 2008;Toro et al., 2008) using the IPR measure report higher complexity inlarger adult brains (i.e. males). The study in this paper elucidatesthese seemingly-conflicting findings. This paper provides newtheoretical insights into relationships between folding measureswith intra-cranial volume (ICV), pinning them down to thefundamental issues of scale and replication. It shows that standardfolding measures in the literature imbibe different meanings of“complexity”. This paper proposes two systematic methods forhandling ICV changes in folding studies using the proposeddescriptor and shows that while the findings using one method areconsistent with (Luders et al., 2004), those using the other methodare consistent with (Im et al., 2008; Toro et al., 2008).
The second study in this paper deals with cortical folding in theoperculum in neonates with complex congenital heart disease(CHD). The operculum includes language areas and the sensorymotor cortex for the mouth, tongue, and throat. There is growingevidence of immature features or delayedmaturation of the brains offull-term infants with complex CHD (Licht et al., 2009; Miller et al.,2007). This immaturity probably gives rise to unexpected vulnera-bility to a white matter injury termed periventricular leukomalacia,previously seen only in premature infants. Abnormally low fetalblood oxygenation and bloodflow in the brain are likely causes of thismaturational delay. While direct evidence is lacking, there aredifferences in the circulatory patterns in fetuses with different formsof complex CHD. This paper quantitatively evaluates cortical foldingin the operculum in two key subtypes of CHD, namely hypoplastic leftheart syndrome (HLHS) and transposition of the great arteries (TGA).This paper reports differences in not only the complexity of foldingpatterns, but other geometrical aspects as well.
Methods and materials
A novel multivariate high-dimensional folding descriptor
This section describes a novel high-dimensional multivariatesurface descriptor that captures multiple aspects of surface geometry.
For surfaceM, at every pointm∈M, the principal curvatures κmin
(m) and κmax(m) describe the local geometry (DoCarmo, 1976) (up tosecond order and up to a translation and rotation). The spacebκmin,κmaxN can be reparameterized, by a polar transformation, into
Please cite this article as: Awate, S.P., et al., Cerebral cortical folding adifferences and neonatal development, NeuroImage (2010), doi:10.101
the orthogonal bases of curvedness C and shape index S thatmeaningfully separate notions of bending and “shape” (Koenderinkand van Doorn, 1992; Koenderink, 1990).
Novel cortical folding descriptorWe propose the joint PDF PM(C,S) as the multivariate high-
dimensional descriptor of cerebral cortical folding patterns for surfaceM. Fig. 1 provides a visual overview of these concepts.
In a way, PM(C,S) subsumes scalar descriptors such as ICI, MCN,GCN, AC, AS, and HC, because these descriptors can be computed usinga subset of the values/information in the proposed descriptor PM(C,S).The next paragraph provides a brief sketch of the underlyingtheoretical modeling framework. The paragraphs following thatprovide details on the practical aspects in estimating PM(C,S) fromdata.
Modeling cortical surfacesWe employ the following generative model for the proposed
studies of human cerebral cortical surfaces. We assume corticalsurfaces, in ROIs, to be smooth 2-D Riemannianmanifolds (Davatzikosand Prince, 1995; Joshi et al., 1995) that possesses a smooth 2-parameter planar parameterization f :Ω∈ℜ2↦M. The smooth pa-rameterization also implies a smooth spatial variation of curvednessand shape index values on the surface.
Let us consider C̃ : Ω→½0;∞Þ and S̃ : Ω→½−1;1� as continuousrandom fields describing the curvedness and shape index, respec-tively, at each point on the surface. Let us also consider the joint PDFthat captures the dependencies between C̃ðωÞ and S̃ðωÞ, ∀ω∈Ω, for aspecific class of surfaces. Thus, human cortical surfaces, in a studygroup, can be considered as independent instances of a single field ofrandom vectors ð C̃; S̃ Þ. Consider a finite collection of pointsf ω1� �
;…;f ωT� �� �
= m1;…;mT� �
uniformly distributed over thesurface M. Then, an MR image yields a discretization (in Ω)
C̃ ω1� �
; S̃ ω1� �� �
;…; C̃ ωT� �
; S̃ ωT� �� �n o
of an instantiation of the field
of random vectors ðC̃; S̃ Þ. For making analysis tractable, we assume
that each observation C̃ðωÞ; S̃ðωÞ� �
, ∀ω∈Ω, is randomly drawn from
a single PDF PMðC̃; S̃ Þ, i.e. the random field is stationary (Papoulis andPillai, 2001). The complexity and variability in cortical folding in thehuman population suggest that dependencies between randomvectors C̃ðω1Þ; S̃ðω1Þ
� �and ðC̃ðω2Þ; S̃ðω2ÞÞ decrease at a fast rate
with increasing geodesic distance between surface locations f(ω1) andf(ω2) or, equivalently, ω1 and ω2, i.e. the random field is mixing(Papoulis and Pillai, 2001).
Estimating the proposed cortical descriptorFor a given surface M, we propose to estimate the folding
pattern descriptor PM C̃f−1; S̃f−1� �
= PMðC;SÞ from the sample
ðCðmtÞ;f SðmtÞÞ:t = 1;…;Tg. A consistent nonparametric estimatefor the folding descriptor is the Parzen-window kernel densityestimate (Parzen, 1962; Lu and Chen, 2004): PMðC; SÞ≈1
T∑T
t = 1
GtððCðmtÞ; SðmtÞÞ;∑tÞ; where G((μ1,μ2),∑) is a 2D Gaussian kernel with
mean (μ1,μ2) and covariance ∑t, dependent on T, and we employ apenalized maximum-likelihood scheme (Chow et al., 1983) to estimate∑t; the literature provides many schemes (Wand and Jones, 1995).
The aforementioned estimation scheme for PM(C,S) relies on thesample {m1,…,mT} being uniformly distributed over the surfaceM. Weobtain a reasonably uniform distribution of points by obtaining animplicit surface parameterization as a level set of a distance transformon a Cartesian grid (Osher and Paragios, 2003; Sethian, 1999); moresophisticated approaches exist in the literature e.g. (Peyre and Cohen,2006). We employ the time-efficient sparse-field formulation (Whi-hitaker, 1998) for the level set fitting procedure. This paper representsthe level set in a grid of isotropic voxels of size υ3mm3with υ=0.4 mm.
nalysis with multivariate modeling and testing: Studies on gender6/j.neuroimage.2010.06.072
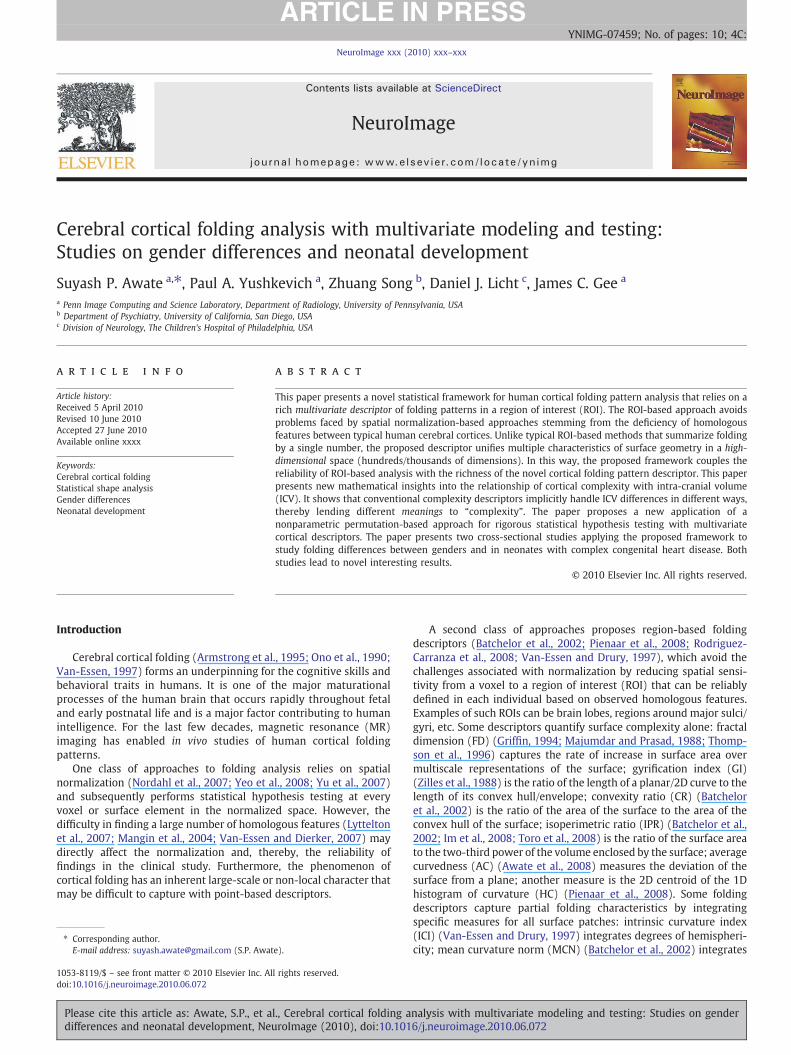
Fig. 1. (a) A sagittal slice of a head MR image overlapped with the cortical surface M. (b) Curvedness values C(m) painted on M (red→blue≡zero→high). In this figure, red areasare almost flat and blue areas are highly curved. (c) Shape index values S(m)∈ [−1,1] painted on M (red→blue ≡−1→1). In this figure, red/yellow areas are concave, blue/cyanareas are convex, and green areas are saddles. (d) Proposed descriptor PM(C,S) (blue→ red≡0→1 probability; colormap shown on right). For all plots of PM(C,S) in this paper:horizontal axis≡S, vertical axis≡C. The illustrations of local surface patches, at the top and bottom of this figure, depict patches for the entire range of possible S values;corresponding patches at the top and bottom have the same S value; all patches at the top have the same C value that is higher than the C value for all the patches at the bottom; theleft half of the domain comprises concave patches, while the right half comprises convex patches. (For interpretation of the references to colour in this figure legend, the reader isreferred to the web version of this article.)
3S.P. Awate et al. / NeuroImage xxx (2010) xxx–xxx
To reduce effects of noise, level set fitting incorporates smoothing. Thelevel set fitting, performed at sub-pixel accuracy, is driven by two forcesresulting from: (i) the data-consistency term that enforces the levelset to align with the (discrete) boundary between white matter (WM)and gray matter (GM) given by the tissue probabilities, at voxels,after segmentation (Awate et al., 2006) and (ii) the mean curvatureterm that enforces smoothness of the level set and counteracts some ofthe “noise”/errors in the segmentation as well as the limited resolution(discrete nature) of MRI data. Figs. 1(b) and (c) show the fitted levelset surface where every point is colored by the values of C and S,respectively.
Empirically, we find that values of C virtually never exceed cmax=(15v)−1 mm−1 equivalent to a minimum radius of curvature of15υ=6 mm. Figs. 1(b) and (c) indicate that this degree of smoothingcontinues to capture essential folding pattern information in typicalcortical surfaces. The lower limit of 6 mm is more conservative thanthe limit of 3 mm in (Pienaar et al., 2008). Imaging limitations, onvoxel sizes and signal-to-noise ratios, risk fidelity in capturingsharper surface features.
Discretizing PM(C,S) on an I× J grid leads to an IJ-dimensionaldescriptor. In this paper, we choose I= J=64, which yields a 4096-
Please cite this article as: Awate, S.P., et al., Cerebral cortical folding adifferences and neonatal development, NeuroImage (2010), doi:10.101
dimensional folding descriptor for each cortical surface. The trade-offs involved in choosing the grid size, i.e. I and J, are very similar tothose involved in standard voxel-based morphometry in theneuroimaging literature regarding smoothing of the data and thescale(s) at which statistically-significant effects are searched for inthe data (Jones et al., 2005; Worsley et al., 1996); this analysis relieson the matched-filter theorem in linear filtering in signal processing.For instance, coarser grids result in a higher degree of smoothing. Inaddition to such trade-offs, the trade-offs in our case are also relatedto the amount of available data, i.e. the sample size T underlying thedensity estimation. For example, a larger sample size (resulting froma larger anatomical region of interest in the study) can allow a higher-resolution probing of the data to reliably search for subtle effects inPM(C,S). On the other hand, larger IJ increases the computation time.Lastly, the choice of the grid size is also determined by therelationship between the clinical hypotheses of interest and theassociated size of the region(s) in the bC,SN domain.
Fig. 1(d) shows a typical PM(C,S), which is multimodal and farfrom standard parametric PDFs, thus justifying nonparametric PDFestimation for reliability of the clinical study. In practice, typical ROIsyield sample sizes T in the range of thousands or tens of thousands,
nalysis with multivariate modeling and testing: Studies on gender6/j.neuroimage.2010.06.072
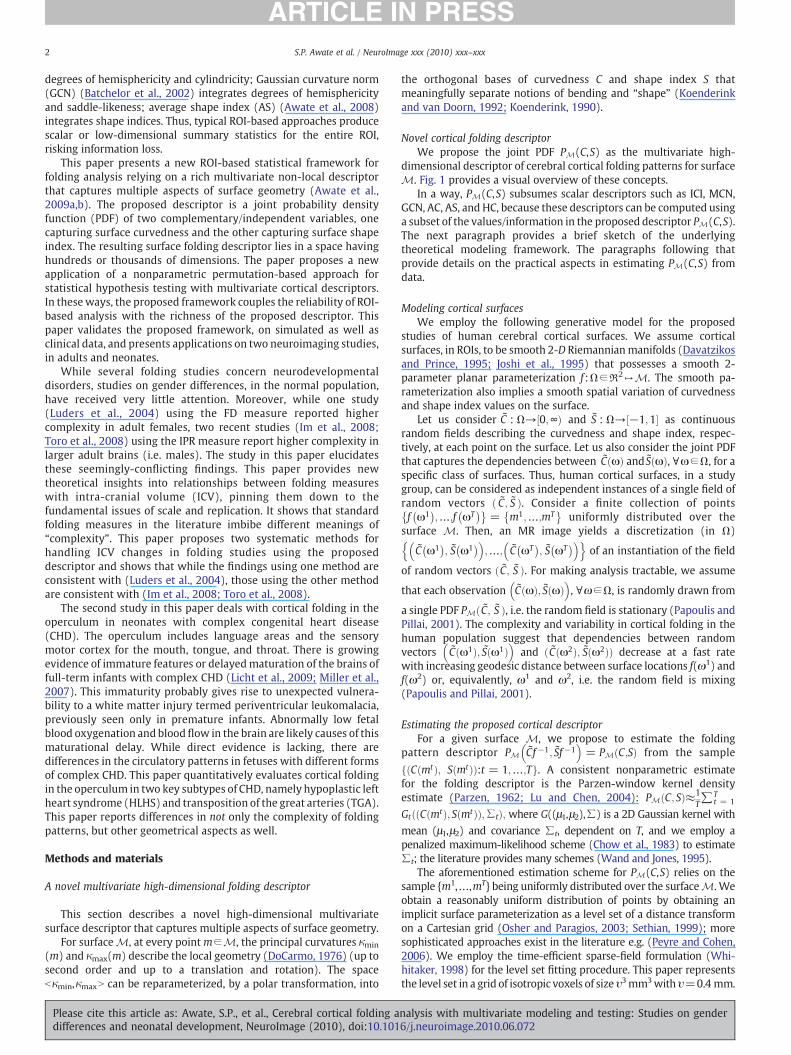
Fig. 2. What does “complexity” mean when volumes differ: issues of scale andreplication. S1 and S2 occupy the same volume (i.e. volume of their convex hulls); S2 ismore complex than S1. S3 and S4 occupy larger volumes than S2. S3 enlarges/scales thefolds in S2. S4 replicates the folds in S2. How do we compare the complexities of (i) S3and S2 and (ii) S4 and S2?
4 S.P. Awate et al. / NeuroImage xxx (2010) xxx–xxx
producing (i) very narrow kernel bandwidth estimates (∑t has smallEigen values) such that PM cb0;s∉½−1;1�ð Þ is desirably close to zeroand (ii) robust estimations. Moreover, the PDF mass very close tothe c=0 axis (shape index is undefined for a plane) is also negligible:PM cbcmin;s∈½−1;1�ð Þbδ for sufficiently small cmin and δ. This papersets cmin=0.001.
A novel testing scheme for multivariate density analysis
This section proposes a new application of a known nonparametricpermutation-based approach, i.e. the statistical nonparametric map-ping (SnPM) algorithm (Nichols and Holmes, 2002), for statisticalhypothesis testing with Nmultivariate cortical descriptors in a clinicalstudy, i.e. PM n ðC;SÞ:n = 1;…;Nf g:
Typical hypothesis tests, e.g. cross-sectional, longitudinal, re-gression, etc., are subsumed in the framework of general linearmodels (GLM). The GLM framework has been applied extensivelyfor voxel-based neuroimaging studies of brain function andstructure, via the statistical parametric mapping algorithm (SPM)(Ashburner and Friston, 2000; Friston et al., 1995). SPM entailsrunning parametric GLM tests at each voxel in the image followedby corrections for multiple comparisons via, for instance, Gaussianfield theory. However, such parametric approaches make strongassumptions on the data concerning the parametric distributions ofthe values at each point in the domain and the dependencies withinneighborhoods (Nichols and Holmes, 2002). Such strategies can beprone to spurious results when the underlying assumptions becomeinvalid.
Permutation tests (Fisher, 1935), on the other hand, arenonparametric and rely on the less inclusive assumption ofexchangeability: under the permutation-test null hypothesis, i.e.both groups of surfaces being generated by one distribution, theindependent and identically-distributed observations are exchange-able. Compared to parametric tests, permutation tests are morestringent (stronger control over Type-1 error) and more robust torandom noise in the imaging measurements and random inaccuraciesin the post-processing of image data. In this way, permutation testscan lead to more reliable inferences from clinical studies. A rigoroushypothesis testing scheme based on nonparametric permutationtesting for voxel-based studies is the SnPM algorithm (Nichols andHolmes, 2002).
The proposed strategy for testing differs from conventionalstrategies in twoways: (i) unlike typical usage of the SnPM algorithminvolving functions on the image domain (Nichols andHolmes, 2002)or surface domain (Styner and Gerig, 2003), both of whichnecessitate spatial normalization, we propose to apply the SnPMalgorithm to discretized cortical descriptors PMn(C,S); and (ii) unlikeconventional multivariate hypothesis testing (e.g. using Hotelling T2
statistic), the SnPM algorithm provides the locations (pixels andclusters), in the domain bC,SN, for significant differences/effects.
The proposed multivariate hypothesis testing algorithm is asfollows:
1. Empirically select thresholds cminN0 and cmaxNcmin for curvednessvalues and a very small � such that, ∀n = 1;:::;N:PMn c∉ cmin;½ðcmax�;s∉ −1;1½ �Þb�.
2. For the domain [cmin,cmax]×[−1,1], construct a regular rectangu-lar tessellation of the desired resolution. Denote the resulting I× Jrectangular bins by {bij:i=1,…,I; j=1,…, J}.
3. For all surfaces n=1,…,N and all bins {bij}, compute theprobabilities PMn((c,s)∈bij)∈ [0,1].
4. Use the N 2D images of probability values, P1,…,PN, as input forpermutation testing via the SnPM algorithm (Nichols and Holmes,2002). The SnPM algorithm indicates (i) a set of locations {(i, j)}and (ii) a set of clusters exhibiting statistical significance for theunderlying GLM experiment. Fig. 3 shows a validation study that is
Please cite this article as: Awate, S.P., et al., Cerebral cortical folding adifferences and neonatal development, NeuroImage (2010), doi:10.101
explained in detail later in Validation using simulated MRI (brainweb) of healthy adults section.
Complexity and volume relationships: new insights
This section presents new theoretical insights into (i) relationshipsbetween folding and ICV and (ii) different meanings of “complexity”underlying descriptors.
In Fig. 2, S1 and S2 occupy equal volumes (i.e. the volume of theirconvex hulls) but S2 has a larger number of finer-scale features thanS1. Desirably so, typical complexity measures, e.g. aforementionedmeasures in Introduction section, inform that S2 is more complexthan S1.
Now consider surfaces occupying different volumes. ICV increasecan be associated with two kinds of effects on cortical surfaces:(i) folds are scaled up/enlarged, e.g. comparing S2 and S3, or (ii) foldsare replicated, e.g. comparing S2 and S4. This section shows that themeaning of “complexity” imbibed in folding descriptors reflects howthe descriptors handle scaling and replication.
One class of measures is invariant to the aforementioned processesof scaling and replication; this includes GI and CR, which are bothnormalized by the convex hull surface area. Thus, GI and CR informthat S2, S3, and S4 have equal complexity.
A second class of measures is designed to be invariant to scale,but not replication; this includes IPR, ICI, MCN, GCN, and AC (Awateet al., 2008; Batchelor et al., 2002; Im et al., 2008; Toro et al., 2008),which are normalized by surface-patch area or ICV2/3. Thus, thesemeasures inform that S3 and S2 have equal complexity, but S4 ismore complex than S2.
A third class of measures is invariant to replication, but notscale; this includes FD (Luders et al., 2004), HC (Pienaar et al.,2008), and the proposed PM(C,S) in A novel multivariate high-dimensional folding descriptor section. Unlike the first two classes,these measures are not normalized via area or ICV2/3. Thus, theyinform that S4 and S2 are equally complex, but S3 is less complexthan S2.
We now propose a new scale-invariant descriptor. Isotropicallyenlarging or rescaling a volume by a factor β3, where βN1, reducescurvedness values of every point on the surface, lying within thatvolume, by a factor of β. Indeed, unit-area patches in enlargedsurfaces appear more planar, as dictated by Taylor's theorem. Thus,a scale-invariant version of PM(C,S) is PM(CβM,S), where β3
M is theratio of the mean group ICV to the ICV for cortical surface M.Similar to the second class of measures described in this section,PM(CβM,S) informs that S3 and S2 have equal complexity, but S4 ismore complex than S2.
Subsequent sections denote Preplication=PM(C,S) and Pscale=PM(CβM,S).
nalysis with multivariate modeling and testing: Studies on gender6/j.neuroimage.2010.06.072
5S.P. Awate et al. / NeuroImage xxx (2010) xxx–xxx
Clinical cohorts and imaging
This paper applies the proposed framework for two clinical studiesusing the following cohorts:
1. Healthy adults: the clinical cohort comprised T1-weighted MRimages (1 mm3 isotropic voxels) of 30 females (mean age34.8 years, standard deviation 9.6 years) and 27 males (meanage 36 years, standard deviation 11 years), obtained after enfor-cing quality-assurance checks on every image in the designedbrain database described in (Mortamet et al., 2005).
2. Neonates with complex congenital heart disease: the clinicalcohort (Licht et al., 2009) comprised 42 neonates with complexCHD (29 with HLHS, 13 with TGA) between 1 and 2 weeks of age,before undergoing corrective heart surgery. Neonates withindependent risk factors (e.g. shock, end-organ injury, and intra-uterine growth retardation) for abnormal brain development wereexcluded. MR images were acquired on a 3T scanner with voxelsizes around 0.88×0.88×1.5 mm3 using T1-weighted, T2-weight-ed, and FLAIR schemes. The HLHS and TGA groups were wellmatched by age and brain volume. The left and right operculums inevery image were parcellated semi-automatically with expertsupervision.
Validation of the proposed framework
Cortical folding analysis pipeline
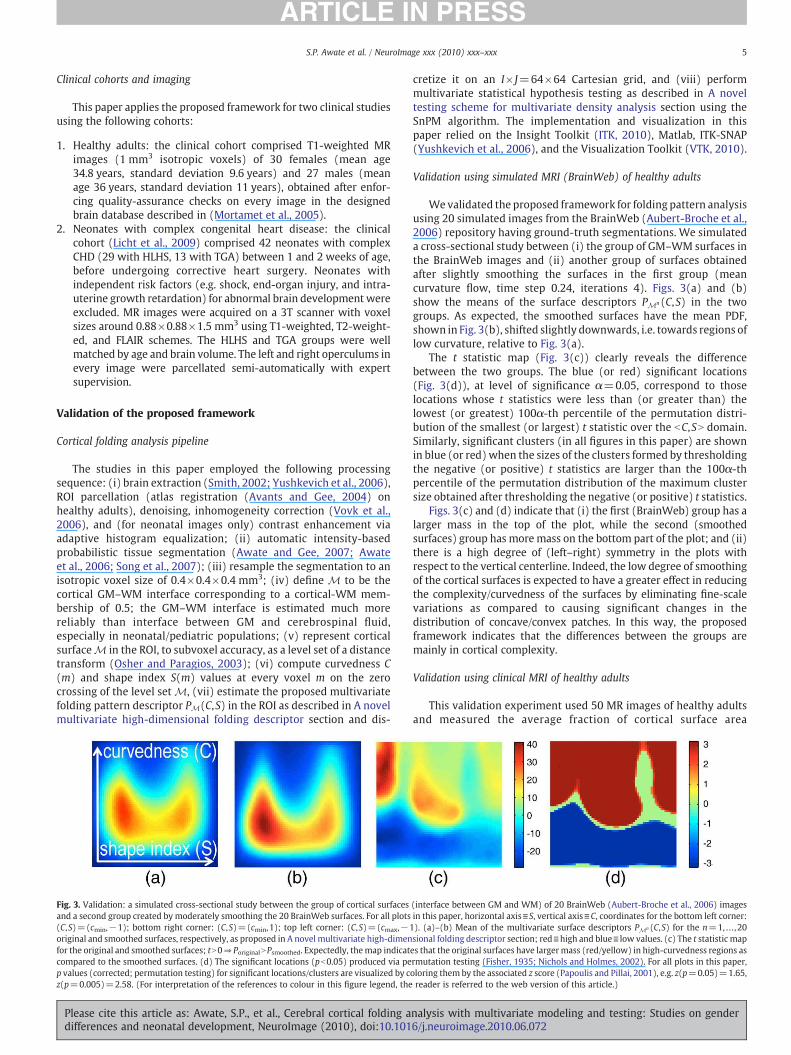
The studies in this paper employed the following processingsequence: (i) brain extraction (Smith, 2002; Yushkevich et al., 2006),ROI parcellation (atlas registration (Avants and Gee, 2004) onhealthy adults), denoising, inhomogeneity correction (Vovk et al.,2006), and (for neonatal images only) contrast enhancement viaadaptive histogram equalization; (ii) automatic intensity-basedprobabilistic tissue segmentation (Awate and Gee, 2007; Awateet al., 2006; Song et al., 2007); (iii) resample the segmentation to anisotropic voxel size of 0.4×0.4×0.4 mm3; (iv) define M to be thecortical GM–WM interface corresponding to a cortical-WM mem-bership of 0.5; the GM–WM interface is estimated much morereliably than interface between GM and cerebrospinal fluid,especially in neonatal/pediatric populations; (v) represent corticalsurfaceM in the ROI, to subvoxel accuracy, as a level set of a distancetransform (Osher and Paragios, 2003); (vi) compute curvedness C(m) and shape index S(m) values at every voxel m on the zerocrossing of the level set M, (vii) estimate the proposed multivariatefolding pattern descriptor PM(C,S) in the ROI as described in A novelmultivariate high-dimensional folding descriptor section and dis-
Fig. 3. Validation: a simulated cross-sectional study between the group of cortical surfacesand a second group created by moderately smoothing the 20 BrainWeb surfaces. For all plots(C,S)=(cmin,−1); bottom right corner: (C,S)=(cmin,1); top left corner: (C,S)=(cmax,−1original and smoothed surfaces, respectively, as proposed in A novel multivariate high-dimenfor the original and smoothed surfaces; tN0⇒PoriginalNPsmoothed. Expectedly, themap indicatcompared to the smoothed surfaces. (d) The significant locations (pb0.05) produced via pep values (corrected; permutation testing) for significant locations/clusters are visualized by cz(p=0.005)=2.58. (For interpretation of the references to colour in this figure legend, the
Please cite this article as: Awate, S.P., et al., Cerebral cortical folding adifferences and neonatal development, NeuroImage (2010), doi:10.101
cretize it on an I× J=64×64 Cartesian grid, and (viii) performmultivariate statistical hypothesis testing as described in A noveltesting scheme for multivariate density analysis section using theSnPM algorithm. The implementation and visualization in thispaper relied on the Insight Toolkit (ITK, 2010), Matlab, ITK-SNAP(Yushkevich et al., 2006), and the Visualization Toolkit (VTK, 2010).
Validation using simulated MRI (BrainWeb) of healthy adults
Wevalidated the proposed framework for folding pattern analysisusing 20 simulated images from the BrainWeb (Aubert-Broche et al.,2006) repository having ground-truth segmentations. We simulateda cross-sectional study between (i) the group of GM–WM surfaces inthe BrainWeb images and (ii) another group of surfaces obtainedafter slightly smoothing the surfaces in the first group (meancurvature flow, time step 0.24, iterations 4). Figs. 3(a) and (b)show the means of the surface descriptors PMn(C,S) in the twogroups. As expected, the smoothed surfaces have the mean PDF,shown in Fig. 3(b), shifted slightly downwards, i.e. towards regions oflow curvature, relative to Fig. 3(a).
The t statistic map (Fig. 3(c)) clearly reveals the differencebetween the two groups. The blue (or red) significant locations(Fig. 3(d)), at level of significance α=0.05, correspond to thoselocations whose t statistics were less than (or greater than) thelowest (or greatest) 100α-th percentile of the permutation distri-bution of the smallest (or largest) t statistic over the bC,SN domain.Similarly, significant clusters (in all figures in this paper) are shownin blue (or red) when the sizes of the clusters formed by thresholdingthe negative (or positive) t statistics are larger than the 100α-thpercentile of the permutation distribution of the maximum clustersize obtained after thresholding the negative (or positive) t statistics.
Figs. 3(c) and (d) indicate that (i) the first (BrainWeb) group has alarger mass in the top of the plot, while the second (smoothedsurfaces) group has moremass on the bottom part of the plot; and (ii)there is a high degree of (left–right) symmetry in the plots withrespect to the vertical centerline. Indeed, the low degree of smoothingof the cortical surfaces is expected to have a greater effect in reducingthe complexity/curvedness of the surfaces by eliminating fine-scalevariations as compared to causing significant changes in thedistribution of concave/convex patches. In this way, the proposedframework indicates that the differences between the groups aremainly in cortical complexity.
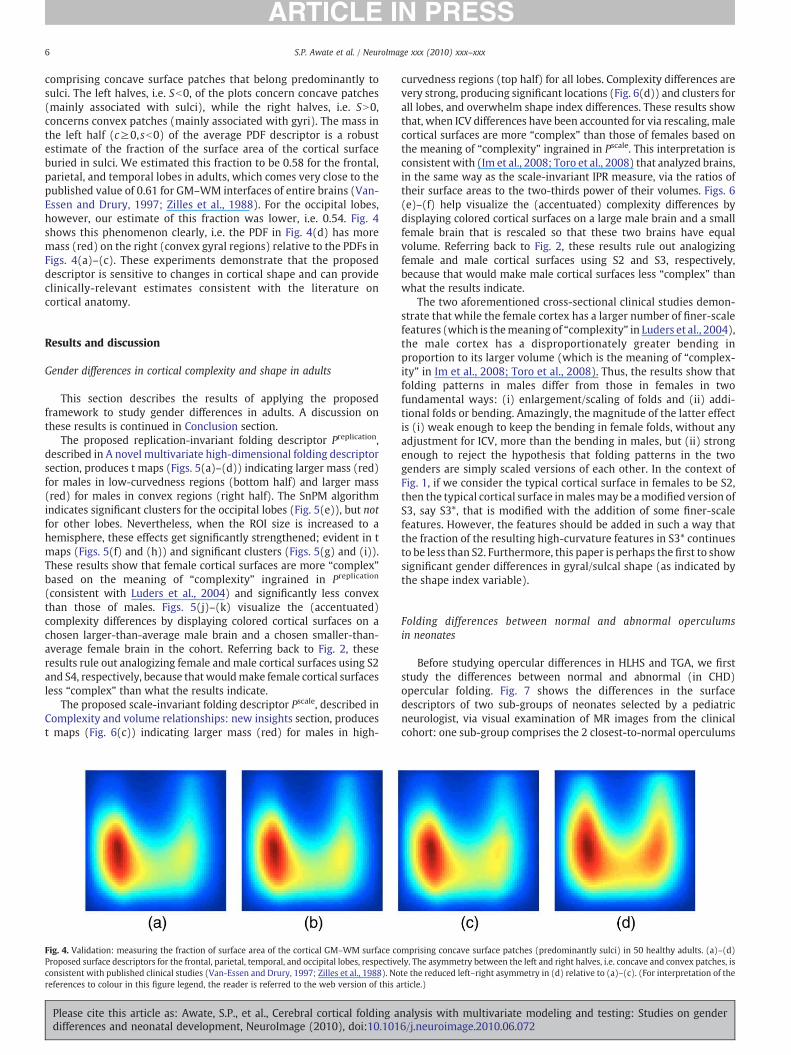
Validation using clinical MRI of healthy adults
This validation experiment used 50 MR images of healthy adultsand measured the average fraction of cortical surface area
(interface between GM and WM) of 20 BrainWeb (Aubert-Broche et al., 2006) imagesin this paper, horizontal axis≡S, vertical axis≡C, coordinates for the bottom left corner:). (a)–(b) Mean of the multivariate surface descriptors PMn (C,S) for the n=1,…, 20sional folding descriptor section; red≡high and blue≡ low values. (c) The t statistic mapes that the original surfaces have larger mass (red/yellow) in high-curvedness regions asrmutation testing (Fisher, 1935; Nichols and Holmes, 2002). For all plots in this paper,oloring them by the associated z score (Papoulis and Pillai, 2001), e.g. z(p=0.05)=1.65,reader is referred to the web version of this article.)
nalysis with multivariate modeling and testing: Studies on gender6/j.neuroimage.2010.06.072
6 S.P. Awate et al. / NeuroImage xxx (2010) xxx–xxx
comprising concave surface patches that belong predominantly tosulci. The left halves, i.e. Sb0, of the plots concern concave patches(mainly associated with sulci), while the right halves, i.e. SN0,concerns convex patches (mainly associated with gyri). The mass inthe left half (c≥0, sb0) of the average PDF descriptor is a robustestimate of the fraction of the surface area of the cortical surfaceburied in sulci. We estimated this fraction to be 0.58 for the frontal,parietal, and temporal lobes in adults, which comes very close to thepublished value of 0.61 for GM–WM interfaces of entire brains (Van-Essen and Drury, 1997; Zilles et al., 1988). For the occipital lobes,however, our estimate of this fraction was lower, i.e. 0.54. Fig. 4shows this phenomenon clearly, i.e. the PDF in Fig. 4(d) has moremass (red) on the right (convex gyral regions) relative to the PDFs inFigs. 4(a)–(c). These experiments demonstrate that the proposeddescriptor is sensitive to changes in cortical shape and can provideclinically-relevant estimates consistent with the literature oncortical anatomy.
Results and discussion
Gender differences in cortical complexity and shape in adults
This section describes the results of applying the proposedframework to study gender differences in adults. A discussion onthese results is continued in Conclusion section.
The proposed replication-invariant folding descriptor Preplication,described in A novel multivariate high-dimensional folding descriptorsection, produces t maps (Figs. 5(a)–(d)) indicating larger mass (red)for males in low-curvedness regions (bottom half) and larger mass(red) for males in convex regions (right half). The SnPM algorithmindicates significant clusters for the occipital lobes (Fig. 5(e)), but notfor other lobes. Nevertheless, when the ROI size is increased to ahemisphere, these effects get significantly strengthened; evident in tmaps (Figs. 5(f) and (h)) and significant clusters (Figs. 5(g) and (i)).These results show that female cortical surfaces are more “complex”based on the meaning of “complexity” ingrained in Preplication
(consistent with Luders et al., 2004) and significantly less convexthan those of males. Figs. 5(j)–(k) visualize the (accentuated)complexity differences by displaying colored cortical surfaces on achosen larger-than-average male brain and a chosen smaller-than-average female brain in the cohort. Referring back to Fig. 2, theseresults rule out analogizing female andmale cortical surfaces using S2and S4, respectively, because that wouldmake female cortical surfacesless “complex” than what the results indicate.
The proposed scale-invariant folding descriptor Pscale, described inComplexity and volume relationships: new insights section, producest maps (Fig. 6(c)) indicating larger mass (red) for males in high-
Fig. 4. Validation: measuring the fraction of surface area of the cortical GM–WM surface coProposed surface descriptors for the frontal, parietal, temporal, and occipital lobes, respectiveconsistent with published clinical studies (Van-Essen and Drury, 1997; Zilles et al., 1988). Noreferences to colour in this figure legend, the reader is referred to the web version of this a
Please cite this article as: Awate, S.P., et al., Cerebral cortical folding adifferences and neonatal development, NeuroImage (2010), doi:10.101
curvedness regions (top half) for all lobes. Complexity differences arevery strong, producing significant locations (Fig. 6(d)) and clusters forall lobes, and overwhelm shape index differences. These results showthat, when ICV differences have been accounted for via rescaling, malecortical surfaces are more “complex” than those of females based onthe meaning of “complexity” ingrained in Pscale. This interpretation isconsistent with (Im et al., 2008; Toro et al., 2008) that analyzed brains,in the same way as the scale-invariant IPR measure, via the ratios oftheir surface areas to the two-thirds power of their volumes. Figs. 6(e)–(f) help visualize the (accentuated) complexity differences bydisplaying colored cortical surfaces on a large male brain and a smallfemale brain that is rescaled so that these two brains have equalvolume. Referring back to Fig. 2, these results rule out analogizingfemale and male cortical surfaces using S2 and S3, respectively,because that would make male cortical surfaces less “complex” thanwhat the results indicate.
The two aforementioned cross-sectional clinical studies demon-strate that while the female cortex has a larger number of finer-scalefeatures (which is themeaning of “complexity” in Luders et al., 2004),the male cortex has a disproportionately greater bending inproportion to its larger volume (which is the meaning of “complex-ity” in Im et al., 2008; Toro et al., 2008). Thus, the results show thatfolding patterns in males differ from those in females in twofundamental ways: (i) enlargement/scaling of folds and (ii) addi-tional folds or bending. Amazingly, the magnitude of the latter effectis (i) weak enough to keep the bending in female folds, without anyadjustment for ICV, more than the bending in males, but (ii) strongenough to reject the hypothesis that folding patterns in the twogenders are simply scaled versions of each other. In the context ofFig. 1, if we consider the typical cortical surface in females to be S2,then the typical cortical surface inmalesmay be amodified version ofS3, say S3*, that is modified with the addition of some finer-scalefeatures. However, the features should be added in such a way thatthe fraction of the resulting high-curvature features in S3* continuesto be less than S2. Furthermore, this paper is perhaps the first to showsignificant gender differences in gyral/sulcal shape (as indicated bythe shape index variable).
Folding differences between normal and abnormal operculumsin neonates
Before studying opercular differences in HLHS and TGA, we firststudy the differences between normal and abnormal (in CHD)opercular folding. Fig. 7 shows the differences in the surfacedescriptors of two sub-groups of neonates selected by a pediatricneurologist, via visual examination of MR images from the clinicalcohort: one sub-group comprises the 2 closest-to-normal operculums
mprising concave surface patches (predominantly sulci) in 50 healthy adults. (a)–(d)ly. The asymmetry between the left and right halves, i.e. concave and convex patches, iste the reduced left–right asymmetry in (d) relative to (a)–(c). (For interpretation of therticle.)
nalysis with multivariate modeling and testing: Studies on gender6/j.neuroimage.2010.06.072
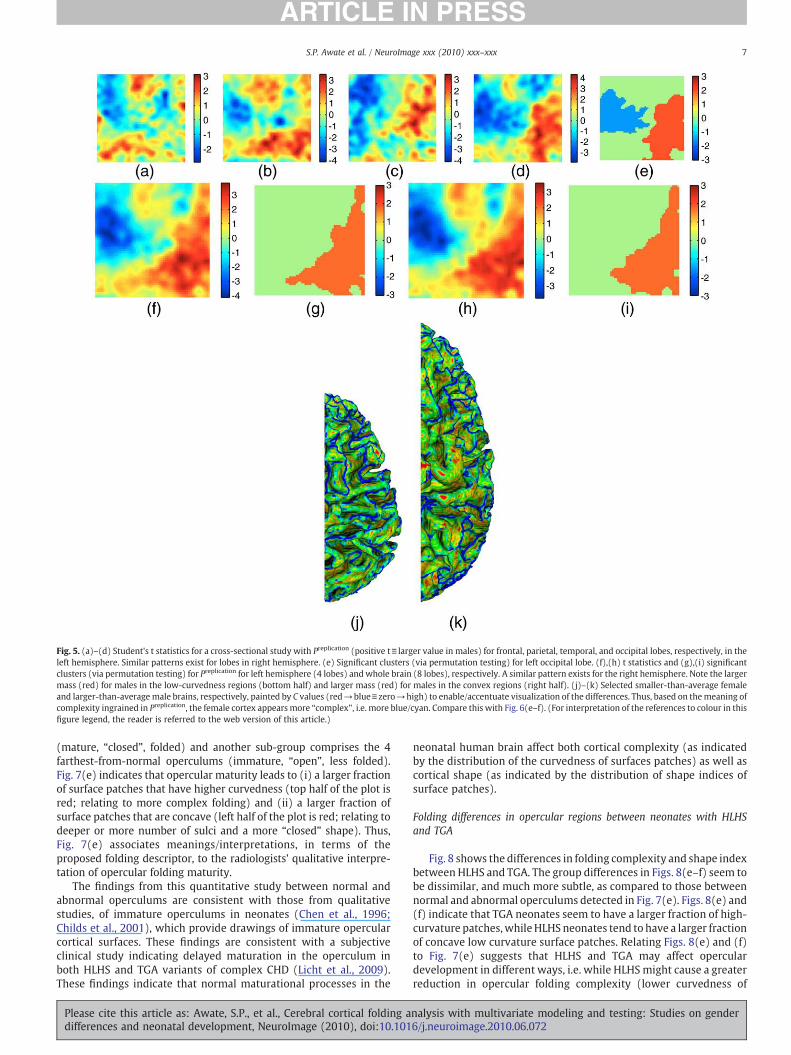
Fig. 5. (a)–(d) Student's t statistics for a cross-sectional study with Preplication (positive t≡ larger value in males) for frontal, parietal, temporal, and occipital lobes, respectively, in theleft hemisphere. Similar patterns exist for lobes in right hemisphere. (e) Significant clusters (via permutation testing) for left occipital lobe. (f),(h) t statistics and (g),(i) significantclusters (via permutation testing) for Preplication for left hemisphere (4 lobes) and whole brain (8 lobes), respectively. A similar pattern exists for the right hemisphere. Note the largermass (red) for males in the low-curvedness regions (bottom half) and larger mass (red) for males in the convex regions (right half). (j)–(k) Selected smaller-than-average femaleand larger-than-average male brains, respectively, painted by C values (red→blue≡zero→high) to enable/accentuate visualization of the differences. Thus, based on themeaning ofcomplexity ingrained in Preplication, the female cortex appears more “complex”, i.e. more blue/cyan. Compare this with Fig. 6(e–f). (For interpretation of the references to colour in thisfigure legend, the reader is referred to the web version of this article.)
7S.P. Awate et al. / NeuroImage xxx (2010) xxx–xxx
(mature, “closed”, folded) and another sub-group comprises the 4farthest-from-normal operculums (immature, “open”, less folded).Fig. 7(e) indicates that opercular maturity leads to (i) a larger fractionof surface patches that have higher curvedness (top half of the plot isred; relating to more complex folding) and (ii) a larger fraction ofsurface patches that are concave (left half of the plot is red; relating todeeper or more number of sulci and a more “closed” shape). Thus,Fig. 7(e) associates meanings/interpretations, in terms of theproposed folding descriptor, to the radiologists' qualitative interpre-tation of opercular folding maturity.
The findings from this quantitative study between normal andabnormal operculums are consistent with those from qualitativestudies, of immature operculums in neonates (Chen et al., 1996;Childs et al., 2001), which provide drawings of immature opercularcortical surfaces. These findings are consistent with a subjectiveclinical study indicating delayed maturation in the operculum inboth HLHS and TGA variants of complex CHD (Licht et al., 2009).These findings indicate that normal maturational processes in the
Please cite this article as: Awate, S.P., et al., Cerebral cortical folding adifferences and neonatal development, NeuroImage (2010), doi:10.101
neonatal human brain affect both cortical complexity (as indicatedby the distribution of the curvedness of surfaces patches) as well ascortical shape (as indicated by the distribution of shape indices ofsurface patches).
Folding differences in opercular regions between neonates with HLHSand TGA
Fig. 8 shows the differences in folding complexity and shape indexbetween HLHS and TGA. The group differences in Figs. 8(e–f) seem tobe dissimilar, and much more subtle, as compared to those betweennormal and abnormal operculums detected in Fig. 7(e). Figs. 8(e) and(f) indicate that TGA neonates seem to have a larger fraction of high-curvature patches,whileHLHS neonates tend to have a larger fractionof concave low curvature surface patches. Relating Figs. 8(e) and (f)to Fig. 7(e) suggests that HLHS and TGA may affect operculardevelopment in different ways, i.e. while HLHS might cause a greaterreduction in opercular folding complexity (lower curvedness of
nalysis with multivariate modeling and testing: Studies on gender6/j.neuroimage.2010.06.072
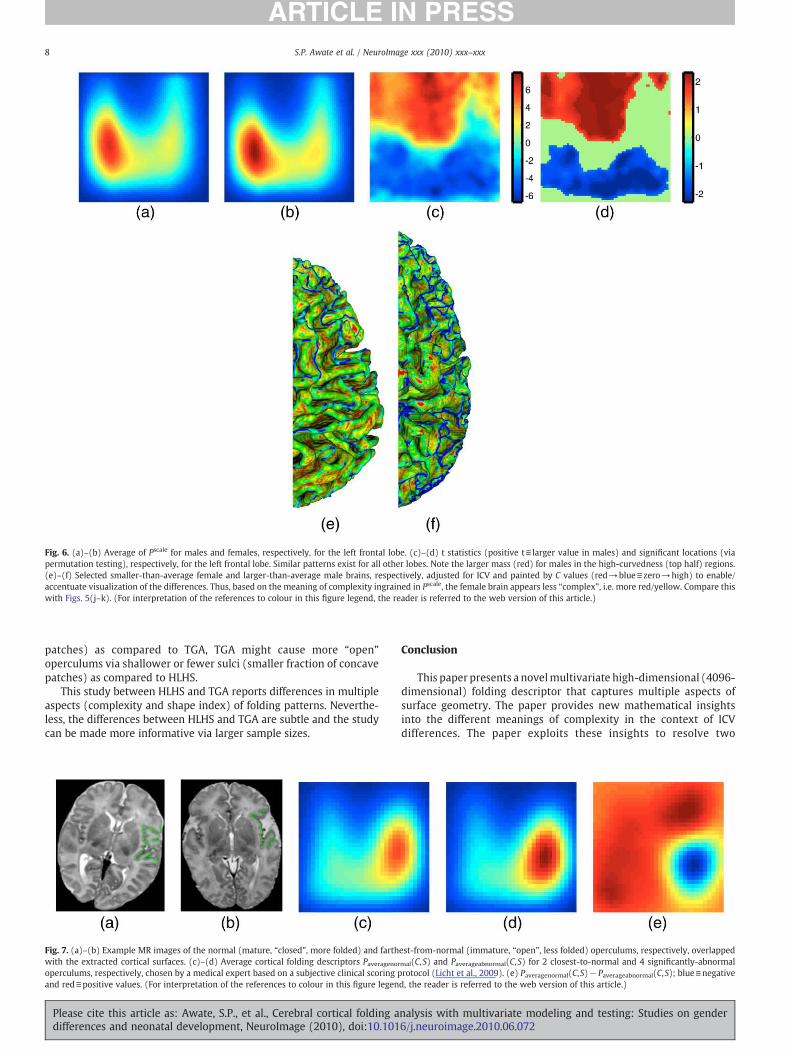
Fig. 6. (a)–(b) Average of Pscale for males and females, respectively, for the left frontal lobe. (c)–(d) t statistics (positive t≡ larger value in males) and significant locations (viapermutation testing), respectively, for the left frontal lobe. Similar patterns exist for all other lobes. Note the larger mass (red) for males in the high-curvedness (top half) regions.(e)–(f) Selected smaller-than-average female and larger-than-average male brains, respectively, adjusted for ICV and painted by C values (red→blue≡zero→high) to enable/accentuate visualization of the differences. Thus, based on the meaning of complexity ingrained in Pscale, the female brain appears less “complex”, i.e. more red/yellow. Compare thiswith Figs. 5(j–k). (For interpretation of the references to colour in this figure legend, the reader is referred to the web version of this article.)
8 S.P. Awate et al. / NeuroImage xxx (2010) xxx–xxx
patches) as compared to TGA, TGA might cause more “open”operculums via shallower or fewer sulci (smaller fraction of concavepatches) as compared to HLHS.
This study between HLHS and TGA reports differences in multipleaspects (complexity and shape index) of folding patterns. Neverthe-less, the differences between HLHS and TGA are subtle and the studycan be made more informative via larger sample sizes.
Fig. 7. (a)–(b) Example MR images of the normal (mature, “closed”, more folded) and farthwith the extracted cortical surfaces. (c)–(d) Average cortical folding descriptors Paveragenoroperculums, respectively, chosen by a medical expert based on a subjective clinical scoring pand red≡positive values. (For interpretation of the references to colour in this figure legen
Please cite this article as: Awate, S.P., et al., Cerebral cortical folding adifferences and neonatal development, NeuroImage (2010), doi:10.101
Conclusion
This paper presents a novelmultivariate high-dimensional (4096-dimensional) folding descriptor that captures multiple aspects ofsurface geometry. The paper provides new mathematical insightsinto the different meanings of complexity in the context of ICVdifferences. The paper exploits these insights to resolve two
est-from-normal (immature, “open”, less folded) operculums, respectively, overlappedmal(C,S) and Paverageabnormal(C,S) for 2 closest-to-normal and 4 significantly-abnormalrotocol (Licht et al., 2009). (e) Paveragenormal(C,S)−Paverageabnormal(C,S); blue≡negatived, the reader is referred to the web version of this article.)
nalysis with multivariate modeling and testing: Studies on gender6/j.neuroimage.2010.06.072
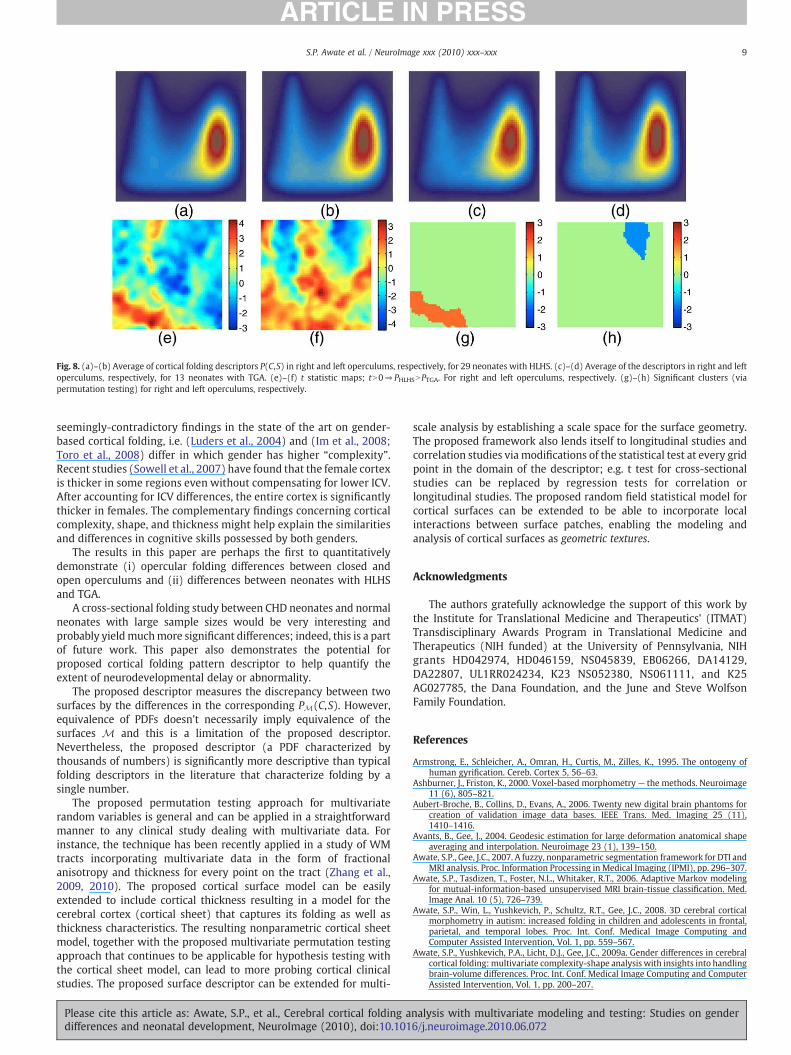
Fig. 8. (a)–(b) Average of cortical folding descriptors P(C,S) in right and left operculums, respectively, for 29 neonates with HLHS. (c)–(d) Average of the descriptors in right and leftoperculums, respectively, for 13 neonates with TGA. (e)–(f) t statistic maps; tN0⇒PHLHSNPTGA. For right and left operculums, respectively. (g)–(h) Significant clusters (viapermutation testing) for right and left operculums, respectively.
9S.P. Awate et al. / NeuroImage xxx (2010) xxx–xxx
seemingly-contradictory findings in the state of the art on gender-based cortical folding, i.e. (Luders et al., 2004) and (Im et al., 2008;Toro et al., 2008) differ in which gender has higher “complexity”.Recent studies (Sowell et al., 2007) have found that the female cortexis thicker in some regions even without compensating for lower ICV.After accounting for ICV differences, the entire cortex is significantlythicker in females. The complementary findings concerning corticalcomplexity, shape, and thickness might help explain the similaritiesand differences in cognitive skills possessed by both genders.
The results in this paper are perhaps the first to quantitativelydemonstrate (i) opercular folding differences between closed andopen operculums and (ii) differences between neonates with HLHSand TGA.
A cross-sectional folding study between CHD neonates and normalneonates with large sample sizes would be very interesting andprobably yieldmuchmore significant differences; indeed, this is a partof future work. This paper also demonstrates the potential forproposed cortical folding pattern descriptor to help quantify theextent of neurodevelopmental delay or abnormality.
The proposed descriptor measures the discrepancy between twosurfaces by the differences in the corresponding PM(C,S). However,equivalence of PDFs doesn't necessarily imply equivalence of thesurfaces M and this is a limitation of the proposed descriptor.Nevertheless, the proposed descriptor (a PDF characterized bythousands of numbers) is significantly more descriptive than typicalfolding descriptors in the literature that characterize folding by asingle number.
The proposed permutation testing approach for multivariaterandom variables is general and can be applied in a straightforwardmanner to any clinical study dealing with multivariate data. Forinstance, the technique has been recently applied in a study of WMtracts incorporating multivariate data in the form of fractionalanisotropy and thickness for every point on the tract (Zhang et al.,2009, 2010). The proposed cortical surface model can be easilyextended to include cortical thickness resulting in a model for thecerebral cortex (cortical sheet) that captures its folding as well asthickness characteristics. The resulting nonparametric cortical sheetmodel, together with the proposed multivariate permutation testingapproach that continues to be applicable for hypothesis testing withthe cortical sheet model, can lead to more probing cortical clinicalstudies. The proposed surface descriptor can be extended for multi-
Please cite this article as: Awate, S.P., et al., Cerebral cortical folding adifferences and neonatal development, NeuroImage (2010), doi:10.101
scale analysis by establishing a scale space for the surface geometry.The proposed framework also lends itself to longitudinal studies andcorrelation studies via modifications of the statistical test at every gridpoint in the domain of the descriptor; e.g. t test for cross-sectionalstudies can be replaced by regression tests for correlation orlongitudinal studies. The proposed random field statistical model forcortical surfaces can be extended to be able to incorporate localinteractions between surface patches, enabling the modeling andanalysis of cortical surfaces as geometric textures.
Acknowledgments
The authors gratefully acknowledge the support of this work bythe Institute for Translational Medicine and Therapeutics' (ITMAT)Transdisciplinary Awards Program in Translational Medicine andTherapeutics (NIH funded) at the University of Pennsylvania, NIHgrants HD042974, HD046159, NS045839, EB06266, DA14129,DA22807, UL1RR024234, K23 NS052380, NS061111, and K25AG027785, the Dana Foundation, and the June and Steve WolfsonFamily Foundation.
References
Armstrong, E., Schleicher, A., Omran, H., Curtis, M., Zilles, K., 1995. The ontogeny ofhuman gyrification. Cereb. Cortex 5, 56–63.
Ashburner, J., Friston, K., 2000. Voxel-based morphometry — the methods. Neuroimage11 (6), 805–821.
Aubert-Broche, B., Collins, D., Evans, A., 2006. Twenty new digital brain phantoms forcreation of validation image data bases. IEEE Trans. Med. Imaging 25 (11),1410–1416.
Avants, B., Gee, J., 2004. Geodesic estimation for large deformation anatomical shapeaveraging and interpolation. Neuroimage 23 (1), 139–150.
Awate, S.P., Gee, J.C., 2007. A fuzzy, nonparametric segmentation framework for DTI andMRI analysis. Proc. Information Processing in Medical Imaging (IPMI), pp. 296–307.
Awate, S.P., Tasdizen, T., Foster, N.L., Whitaker, R.T., 2006. Adaptive Markov modelingfor mutual-information-based unsupervised MRI brain-tissue classification. Med.Image Anal. 10 (5), 726–739.
Awate, S.P., Win, L., Yushkevich, P., Schultz, R.T., Gee, J.C., 2008. 3D cerebral corticalmorphometry in autism: increased folding in children and adolescents in frontal,parietal, and temporal lobes. Proc. Int. Conf. Medical Image Computing andComputer Assisted Intervention, Vol. 1, pp. 559–567.
Awate, S.P., Yushkevich, P.A., Licht, D.J., Gee, J.C., 2009a. Gender differences in cerebralcortical folding: multivariate complexity-shape analysis with insights into handlingbrain-volume differences. Proc. Int. Conf. Medical Image Computing and ComputerAssisted Intervention, Vol. 1, pp. 200–207.
nalysis with multivariate modeling and testing: Studies on gender6/j.neuroimage.2010.06.072

10 S.P. Awate et al. / NeuroImage xxx (2010) xxx–xxx
Awate, S.P., Yushkevich, P.A., Song, Z., Licht, D.J., Gee, J.C., 2009b. Multivariatehigh-dimensional cortical folding analysis, combining complexity and shape,in neonates with congenital heart disease. Proc. Int. Conf. InformationProcessing in Medical Imaging, pp. 552–563.
Batchelor, P., Castellano-Smith, A., Hill, D., Hawkes, D., Cox, T., Dean, A., 2002. Measuresof folding applied to the development of the human fetal brain. IEEE Trans. Med.Imaging 21 (8), 953–965.
Chen, C., Zimmerman, R., Faro, S., Parrish, B., Wang, Z., Bilaniuk, L., Chou, T., 1996. MR ofthe cerebral operculum: abnormal opercular formation in infants and children. Am.J. Neuroradiol. 17 (7), 1303–1311.
Childs, A., Ramenghi, L., Cornette, L., Tanner, S., Arthur, R., Martinez, D., Levene, M.,2001. Cerebral maturation in premature infants: quantitative assessment using MRimaging. Am. J. Neuroradiol. 22, 1577–1582.
Chow, Y., Geman, S., Wu, L., 1983. Consistant cross-validated density estimation. Ann.Stat. 11 (1), 25–38.
Davatzikos, C., Prince, J., 1995. An active contour model for mapping the cortex. IEEETrans. Med. Imaging 14 (1), 65–80.
DoCarmo, M., 1976. Differential Geometry of Curves and Surfaces. Prentice Hall.Fisher, R.A., 1935. The Design of Experiment. Hafner.Friston, K., Holmes, A., Worsley, K., Poline, J., Frith, C., Frackowiak, R., 1995. Statistical
parametric maps in functional imaging: a general linear approach. Hum. BrainMapp. 2, 189–210.
Griffin, L., 1994. The intrinsic geometry of the cerebral cortex. J. Theor. Biol. 166 (3),261–273.
Im, K., Lee, J., Lytteleton, O., Kim, S., Evans, A., Kim, S., 2008. Brain size and corticalstructure in the adult human brain. Cer. Cor. 18, 2181–2191.
ITK, 2010. National Library of Medicine Insight Segmentation and Registration Toolkit(ITK). URL http://www.itk.org.
Jones, D., Symms, M., Cercignani, M., Howard, R., 2005. The effect of filter size on VBManalyses of DT-MRI data. Neuroimage 26 (2), 546–554.
Joshi, S., Wang, J., Miller, M., Essen, D.V., Grenander, U., 1995. On the differentialgeometry of the cortical surface. Vision Geom. IV, 304–311.
Koenderink, J.J., 1990. Solid Shape. MIT Press.Koenderink, J., van Doorn, A., 1992. Surface shape and curvature scales. Image Vis.
Comput. 10 (8), 557–565.Licht, D., Shera, D., Clancy, R., Wernovsky, G., Montenegro, L., Nicolson, S., Zimmer-
man, R., Spray, T., Gaynor, W., Vossough, A., 2009. Brain maturation is delayed ininfants with complex congenital heart defects. J. Thorac. Cardiovasc. Surg. 137,529–537.
Lu, Z., Chen, X., 2004. Spatial kernel regression estimation: weak consistency. Stat. Prob.Lett. 68 (2), 125–136.
Luders, E., Narr, K., Thompson, P., Rex, D., Jancke, L., Steinmetz, H., Toga, A., 2004.Gender differences in cortical complexity. Nat. Neuro. 7 (8), 799–800.
Lyttelton, O., Boucher, M., Robbins, S., Evans, A., 2007. An unbiased iterative groupregistration template for cortical surface analysis. NeuroImage 34, 1535–1544.
Majumdar, S., Prasad, R., 1988. The fractal dimension of cerebral surfaces usingmagnetic resonance images. Comput. Phys. 2 (6), 69–73.
Mangin, J., Riviere, D., Cachia, A., Duchesnay, E., Cointepas, Y., Papadopoulos-Orfanos, D.,Scifo, P., Ochiai, T., Brunelle, F., Regis, J., 2004. A framework to study the corticalfolding patterns. Neuroimage 23 (1), S129–S138.
Miller, S., McQuillen, P., Hamrick, S., Xu, D., Glidden, D., Charlton, N., Karl, T., Azakie, A.,Ferriero, D., Barkovich, J., Vigneron, D., 2007. Abnormal brain development innewborns with congenital heart disease. N. Engl. J. Med. 257, 1928–1938.
Mortamet, B., Zeng, D., Gerig, G., Prastawa, M., Bullitt, E., 2005. Effects of healthy agingmeasured by intracranial compartment volumes using a designed MR braindatabase. Med. Imag. Comput. Comp. Assist. Interv. , pp. 383–391.
Nichols, T., Holmes, A., 2002. Nonparametric permutation tests for functionalneuroimaging: a primer with examples. Hum. Brain Mapp. 15 (1), 1–25.
Nordahl, C., Dierker, D., Mostafavi, I., Schumann, C., Rivera, S., Amaral, D., Van-Essen, D.,2007. Cortical folding abnormalities in autism revealed by surface-basedmorphometry. J. Neurosci. 27 (43), 11725–11735.
Ono, M., Kubick, S., Abernathey, C., 1990. Atlas of the Cerebral Sulci. Thieme Medical.
Please cite this article as: Awate, S.P., et al., Cerebral cortical folding adifferences and neonatal development, NeuroImage (2010), doi:10.101
Osher, S., Paragios, N., 2003. Geometric Level Set Methods in Imaging, Vision, andGraphics. Springer.
Papoulis, A., Pillai, S.U., 2001. Probability, Random Variables, and Stochastic Processes,4th Edition. McGraw-Hill.
Parzen, E., 1962. On the estimation of a probability density function and the mode. Ann.Math. Stats. 33, 1065–1076.
Peyre, G., Cohen, L., 2006. Geodesic remeshing using front propagation. Int. J. Comput.Vision 69 (1), 145–156.
Pienaar, R., Fischl, B., Caviness, V., Makris, N., Grant, P.E., 2008. A methodology foranalyzing curvature in the developing brain from preterm to adult. Int. J. ImagingSyst. Technol. 18 (1), 42–68.
Rodriguez-Carranza, C., Mukherjee, P., Vigneron, D., Barkovich, J., Studholme, C., 2008. Aframework for in vivo quantification of regional brain folding in prematureneonates. Neuroimage 41 (2), 462–478.
Sethian, J., 1999. Level Set Methods and Fast Marching Methods. Cambridge Univ. Press.Smith, S., 2002. Fast robust automated brain extraction. Hum. Brain Mapp. 17 (3),
143–155.Song, Z., Awate, S.P., Licht, D., Gee, J.C., 2007. Clinical neonatal brain MRI segmentation
using adaptive nonparametric data models and intensity-based Markov priors.Proc. Med. Image Computing Comp. Assisted Intervention, Vol. 1, pp. 883–890.
Sowell, E., Peterson, B., Kan, E., Woods, R., Yoshii, J., Bansal, R., Xu, D., Zhu, H., Thompson,P., Toga, A., 2007. Sex differences in cortical thickness mapped in 176 healthyindividuals between 7 and 87 years of age. Cer. Cor. 17, 1550–1560.
Styner, M., Gerig, G., 2003. Correction scheme for multiple correlated statistical tests inlocal shape analysis. SPIE Medical Imaging, pp. 233–240.
Thompson, P., Schwartz, C., Lin, R., Khan, A., Toga, A., 1996. Three-dimensionalstatistical analysis of sulcal variability in the human brain. J. Neurosci. 16 (13),4261–4274.
Toro, R., Perron, M., Pike, B., Richer, L., Veillette, S., Pausova, Z., Paus, T., 2008. Brain sizeand folding of the human cerebral cortex. Cer. Cor. 18, 2352–2357.
Van-Essen, D., 1997. A tension-based theory of morphogenesis and compact wiring inthe central nervous system. Nature 385, 313–318.
Van-Essen, D., Dierker, D., 2007. Surface-based and probabilistic atlases of primatecerebral cortex. Neuron 56, 209–225.
Van-Essen, D., Drury, H., 1997. Structural and functional analyses of human cerebralcortex using a surface-based atlas. J. Neurosci. 17 (18), 7079–7102.
Vovk, U., Pernus, F., Likar, B., 2006. Intensity inhomogeneity correction of multispectralMR images. Neuroimage 32 (1), 54–61.
VTK, 2010. The Visualization Toolkit (VTK). URL http://www.vtk.org.Wand, M., Jones, M., 1995. Kernel Smoothing. Chapman and Hall.Whitaker, R.T., 1998. A level-set approach to 3D reconstruction from range data. Int. J.
Comput. Vision 29 (3), 203–231.Worsley, K.J., Marrett, S., Neelin, P., Evans, A.C., 1996. Searching scale space for
activation in PET images. Hum. Brain Mapp. 4 (1), 74–90.Yeo, B., Yu, P., Grant, P., Fischl, B., Golland, P., 2008. Shape analysis with overcomplete
spherical wavelets. Med. Imag. Comput. Comp. Assist. Interv. , pp. 891–899.Yu, P., Grant, P.E., Qi, Y., Han, X., Segonne, F., Pienaar, R., Busa, E., Pacheco, J., Makris, N.,
Buckner, R.L., Golland, P., Fischl, B., 2007. Cortical surface shape analysis based onspherical wavelets. IEEE Trans. Med. Imaging 26 (4), 582–597.
Yushkevich, P., Piven, J., Hazlett, H., Smith, R., Ho, S., Gee, J., Gerig, G., 2006. User-guided3D active contour segmentation of anatomical structures: significantly improvedefficiency and reliability. Neuroimage 31 (3), 1116–1128.
Zhang, H., Awate, S.P., Das, S.R., Woo, J.H., Melhem, E.R., Gee, J.C., Yushkevich, P.A., 2009.A tract-specific framework for white matter morphometry combining macroscopicand microscopic tract features. Proc. Int. Conf. Medical Image Computing andComputer Assisted Intervention, Vol. 1, pp. 141–149.
Zhang, H., Awate, S.P., Das, S.R., Woo, J.H., Melhem, E.R., Gee, J.C., Yushkevich, P.A., 2010.A tract-specific framework for white matter morphometry combining macroscopicand microscopic tract features. Medical Image Analysis. Published Online; ToAppear in Print.
Zilles, K., Armstrong, E., Schleicher, A., Kretschmann, H., 1988. The human pattern ofgyrification in the cerebral cortex. Anat. Embryol. 179, 173–179.
nalysis with multivariate modeling and testing: Studies on gender6/j.neuroimage.2010.06.072