
Kineto-elasto-static synthesis of a 3-CRU spherical wrist for miniaturized assembly tasks
Upload
khangminh22Category
view
0download
0
1

2
Summary of Work Packages
WP1 Demonstrate Technology passively deployed and
resultant physical system impact
WP2 Optimise the charging infrastructure connections
metering and safety standards
WP3 Smart Charging and Network Operation
WP4 Network Planning
WP5 Establish the potential impact of EVs on the DUOS
average unit price
WP6 Facilitate a competitive market structure
WP7 EU Projects

3
Work Package 1.1
Identify Appropriate Connection Types

4
Table of Contents
1 Connector Types ..................................................................................................................... 5
2 AC Charge Points .................................................................................................................... 7
3 DC Charge Points .................................................................................................................... 8

5
1 Connector Types
Due to differences in electric vehicle design and the evolution of standards in the electric vehicle industry, Ireland’s charging network contains a number of different charging connectors/inlets for electric vehicles. Initially the car industry was providing vehicles with charging cables fitted with standard 3-pin plugs. This resulted in a limiting of current to 13 amps; in fact, it was advised by ESB that the current was limited to 8 amps due to its continuous nature over the full charging cycle and the possibility of overheating the plug or socket. A new type of AC connector was developed (IEC 62196 Type 2). In its native form this connector/inlet can cater for 32 amps 3-phase charging. Figure 1 shows the type 2 charge point inlet.
Figure 1 - Type 2 Charge Point Inlet
One of the first fast charging connectors/protocol to emerge was CHAdeMO. This standard is used in Nissan, Mitsubishi, Citroen, Peugeot and other electric vehicles. Figure 2 shows the CHAdeMO connector.
Figure 2 - CHAdeMO Connector
The next fast charge point standard to emerge was the Fast AC connector which is a fixed cable version of the IEC 62196 Type 2 connector and has the ability to carry 63 amps per phase. This predominantly is used for Renault vehicles. Figure 3 shows the Fast AC connector.

6
Figure 3 - Fast AC Connector
More recently the CCS fast charging standard has emerged which is used in BMW and many of the newer European manufactured electric vehicles. It is designed to be compatible with the J1772 inlet (Combo 1) and the IEC 62196 Type inlet (Combo2). Figure 4 shows a combo 2 CCS connector.
Figure 4 - CCS Connector

7
2 AC Charge Points
These charge points are typically single or dual-socket units, with dual-socket units becoming more common. All AC to DC power conversion takes places on-board the EV hence this is referred to as on-board charging. The charge points can be either single or three-phase and typically can supply maximum output current of 16 amps or 32 amps. High power versions allow 63 amp fast AC charging. Charging times with standard AC charge points vary depending on vehicle battery size and supply constraints but typically vary between 1 hour and 8 hours. Fast AC has the potential to charge a standard vehicle battery in approximately 30 minutes. A communications/safety protocol known as “mode 3” (as defined in IEC standard 61851) dictates the power switching and current levels. A typical 44kW double-headed AC charge point is shown in Figure 5.
Figure 5 - Typical AC Charge Point installed in Ireland

8
3 DC Charge Points
These charge points contain the AC-DC power conversion electronics inside the unit and as such this charging method is referred to as off-board charging. Controlled DC power is supplied directly to the EV battery and charging times can be as low as 30 minutes. Currently the most common form of DC charging uses a communication protocol called CHAdeMO which dictates the power switching and current levels. More recently the Combined Charging System (CCS) has been adopted (predominantly by the European automotive manufacturers) which uses a combination of the Type 2 plug with additional DC pins. Due to the relatively high cost of DC charge points compared to AC charge points, the planning criteria may be different (i.e. due to the increased safety and security measures). The physical footprint of the DC charge points is much larger than standard AC points. Many manufacturers now also offer combined AC and DC charge points. These typically offer 50kW DC power and either 22kW or 44kW AC power. The figure below shows a fast charge point in Ireland with three attached cables, one for CHAdeMO DC charging, one for CCS DC charging and one for Fast AC (44kW). Figure 6 shows a typical multi-standard fast charge point installed in Ireland.
Figure 6 - Multi-Standard Fast Charge Point Installed in Ireland
It is noted that the following technologies have not been used in Ireland’s charge point network due to a number of factors including lack of market development and unsuitability to the region.
Battery Swapping.
Inductive Charging (exclusive to pilot project for Green eMotion)
Solar-PV charging.

9
Work Package 1.2
Identify the Most Suitable CPs for Home, On-
Street, Commercial and Fast Charger Locations
for the Trial

10
Table of Contents
1 Introduction ...........................................................................................................................12
1.1 Home Charge Points ...............................................................................................................12
1.1.1 Applicable Codes and Standards ............................................................................................12 1.1.2 Network Parameters ...............................................................................................................13 1.1.3 Charging Stations ....................................................................................................................13
1.1.3.1 Components and Functionality ...........................................................................................13 1.1.3.2 Charging Mode....................................................................................................................13 1.1.3.3 Charging Station Composition and Internals ......................................................................14 1.1.3.4 PWM Pilot Signal ................................................................................................................14 1.1.3.5 Socket .................................................................................................................................14 1.1.3.6 Electrical Protection ............................................................................................................15 1.1.3.7 Power Contactors................................................................................................................15 1.1.3.8 User Interface ......................................................................................................................15 1.1.3.9 Charging Station Exterior ....................................................................................................15 1.1.3.10 IP Rating ..........................................................................................................................15 1.1.3.11 Electrical Connection .......................................................................................................15 1.1.3.12 Functionality After Disruption of Supply ..........................................................................16 1.1.3.13 IET Code of Practice .......................................................................................................16 1.1.3.14 EV Communications via Power Line Carrier ...................................................................16
1.2 On-Street AC Charge Points ...................................................................................................17
1.2.1 Introduction .............................................................................................................................17 1.2.2 Applicable Codes and Standards ............................................................................................17 1.2.3 Network Parameters ...............................................................................................................18 1.2.4 Charging Stations ....................................................................................................................18
1.2.4.1 Charging Station Variations ................................................................................................18 1.2.4.2 Charging Station Composition and Internals ......................................................................18 1.2.4.3 Charging Mode....................................................................................................................20 1.2.4.4 PWM Pilot Signal ................................................................................................................20 1.2.4.5 Charging Station De-rating .................................................................................................20 1.2.4.6 ZE Ready Certification ........................................................................................................20 1.2.4.7 Socket .................................................................................................................................20 1.2.4.8 Electrical Protection ............................................................................................................21 1.2.4.9 Power Contactors................................................................................................................21 1.2.4.10 User Interface ..................................................................................................................21 1.2.4.11 Charging Station Exterior ................................................................................................21 1.2.4.12 IP Rating ..........................................................................................................................21 1.2.4.13 Electrical Connection .......................................................................................................21 1.2.4.14 Equipment Nameplate .....................................................................................................22 1.2.4.15 IET Code of Practice .......................................................................................................22 1.2.4.16 EV Communications via Power Line Carrier ...................................................................22 1.2.4.17 Metrology .........................................................................................................................22 1.2.4.18 Additional Functionality ...................................................................................................23
1.3 Fast Charge Points .................................................................................................................25
1.3.1 Applicable Codes and Standards ............................................................................................25 1.3.2 Network Parameters ...............................................................................................................26 1.3.3 Fast Charging Station Specification ........................................................................................26
1.3.3.1 Charging Station De-rating .................................................................................................26 1.3.3.2 Electric Vehicle Certification ...............................................................................................27 1.3.3.3 Locking Mechanism ............................................................................................................27 1.3.3.4 Emergency Stop Button ......................................................................................................27 1.3.3.5 Electrical Protection ............................................................................................................27

11
1.3.3.6 Power Contactors................................................................................................................28 1.3.3.7 EMC Performance...............................................................................................................28 1.3.3.8 IP Rating .............................................................................................................................28 1.3.3.9 Electrical Connection ..........................................................................................................28 1.3.3.10 Equipment Nameplate .....................................................................................................29 1.3.3.11 IET Code of Practice .......................................................................................................29 1.3.3.12 EV Communications via Power Line Carrier ...................................................................29 1.3.3.13 Metrology .........................................................................................................................29 1.3.3.14 Additional Functionality ...................................................................................................29

12
1 Introduction
This work package describes the home, on-street and fast charge points specified and installed in Ireland’s electric vehicle charge point infrastructure.
1.1 Home Charge Points
The core electro-mechanical and IT requirements of basic home charge points used in the ESB ecars EV trials and SEAI grant installations is described in this document. It is noted that although the maximum rating of the equipment is specified below as 3-phase 32A (22kW), in reality most manufacturers of home charge points offer either 16A or 32A single phase only. The vast majority of home charge points installed in Ireland up to March 2015 have been 16A single phase and this is the current ESB standard. Samples of the installed home chargers are shown in Figure 7 below.
Figure 7 - Home Charge Points
1.1.1 Applicable Codes and Standards
The equipment shall comply with the latest editions of the following standards and codes:
Number Title
IEC 60364 Electrical installations of buildings
IEC Guide 113 Materials declaration questionnaires – Basic guidelines
ISO 9001 Quality Systems
89/336/EEC Electromagnetic Compatibility Directive
93/465/EEC The Affixing and Use of the CE Conformity Marking
IEC 61851 Electric Vehicle Conductive Charging System
IEC 62196 Plugs, Socket-Outlets, Vehicle Couplers and Vehicle Inlets
IEC 61439 Low-Voltage Switchgear and Control Gear Assemblies
ISO/IEC 18092 Telecommunications and Information Exchange Between Systems
IEEE 802.XX Wireless Standards
EV Ready 1.2 Renault-Nissan EV Charging Infrastructure Standards
IEC 14443 Identification Cards – Contactless Integrated Circuit Cards
ISO 14001 Environmental Management Systems
EU ROHS (2002/95EC) Hazardous Substances in Electrical and Electronic Equipment
Table 1 - Applicable Codes and Standards
a) The equipment shall comply with Electromagnetic Compatibility EMC Directive 89/336/EEC or later or any other legislation regarding electric supply installations open to public access and use and all Dubai laws.
b) The equipment shall carry the CE Mark in accordance with Direction 93/465/EEC.

13
c) Where a particular subject is not covered by one of the above standards then a recognised national standard shall apply.
d) This Specification shall take precedence in the case of any conflict between this Specification and
any of the standards.
1.1.2 Network Parameters
The equipment shall be suitable for installation on networks with the following design parameters.
Parameter Value
Rated Voltage 230/440V
No. of Phases 3
Frequency 50Hz
LV Earthing TNCS
3 Phase Short Circuit (rms)t 40kA
Duration of Short Circuit 1s
Power Frequency 1 min (rms) 3kV
Table 2 - Network Parameters
1.1.3 Charging Stations
1.1.3.1 Components and Functionality
The Home Charge Point shall have a socket (mode 3, case B) have the following functionality.
a) The Home Charge Points shall be capable of charging electric vehicles that conform to the Control Pilot Function as described in IEC 61851-1 Edition 2.0 in all respects unless explicitly detailed otherwise in this Specification.
b) The Home Charge Point shall be configured by default to be connected to a three phase, 400 V, AC supply. The Home Charge Points shall be capable of supplying a charge by default of 22 kW (32 A).
c) To ensure that an electrical installation that has a lower capacity than 22 kW is not overloaded by the charge point. The charge point should be easily configurable by the ESB approved personnel to deliver less than the 22 kW without impacting on the warranty (see Section 2.7).
d) Where an electrical installation does not have three phase a Home Charge Points will be required that is capable of supplying a single phase, 230V, 7kW (32A), charge to a suitable EV.
1.1.3.2 Charging Mode
The home charge point shall support Mode 3 charging as defined in IEC 61851-1 Edition 2.0.The following basic function shall be provided by the home charge point
a) Verification that the vehicle is properly connected b) Continuous protective earth conductor continuity checking c) Energization of the system d) De-energization of the system e) Selection of charging rate f) A means to ensure that the charging rate does not exceed the rated capacity of the mains,
connector cable, vehicle or battery capabilities g) Access Authorisation. h) Method to ensure that unauthorised users cannot access the home charge point
14
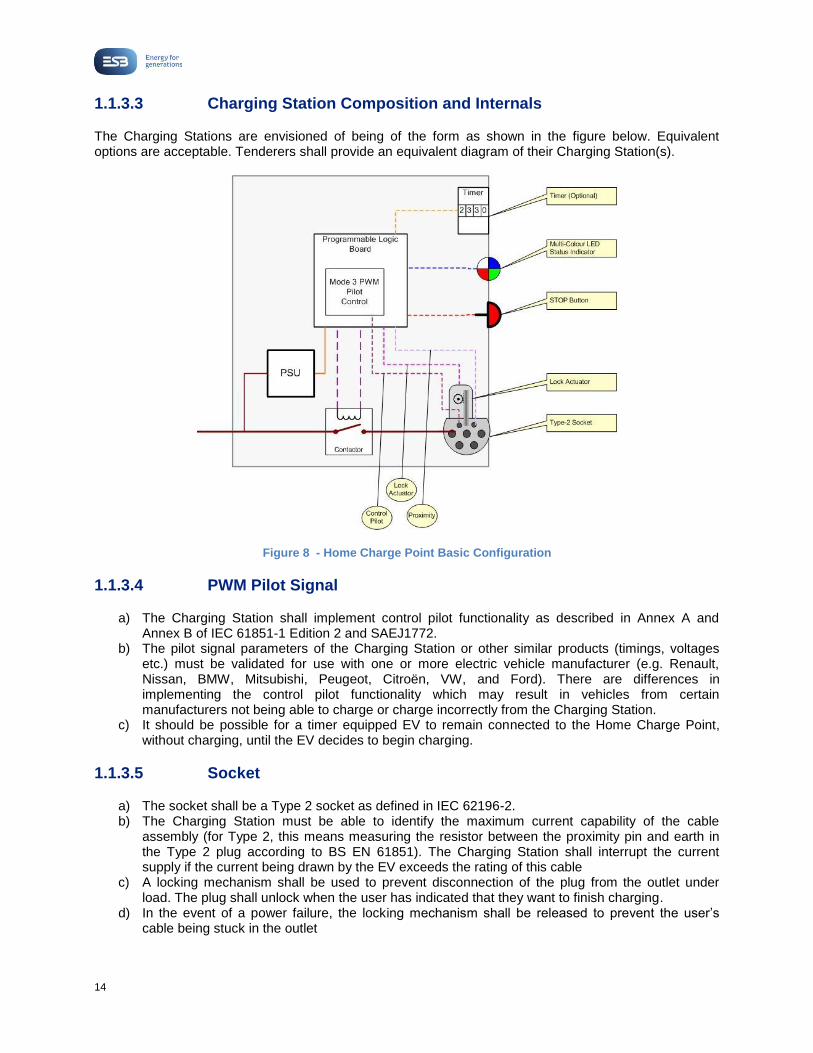
1.1.3.3 Charging Station Composition and Internals
The Charging Stations are envisioned of being of the form as shown in the figure below. Equivalent options are acceptable. Tenderers shall provide an equivalent diagram of their Charging Station(s).
Figure 8 - Home Charge Point Basic Configuration
1.1.3.4 PWM Pilot Signal
a) The Charging Station shall implement control pilot functionality as described in Annex A and Annex B of IEC 61851-1 Edition 2 and SAEJ1772.
b) The pilot signal parameters of the Charging Station or other similar products (timings, voltages etc.) must be validated for use with one or more electric vehicle manufacturer (e.g. Renault, Nissan, BMW, Mitsubishi, Peugeot, Citroën, VW, and Ford). There are differences in implementing the control pilot functionality which may result in vehicles from certain manufacturers not being able to charge or charge incorrectly from the Charging Station.
c) It should be possible for a timer equipped EV to remain connected to the Home Charge Point, without charging, until the EV decides to begin charging.
1.1.3.5 Socket
a) The socket shall be a Type 2 socket as defined in IEC 62196-2. b) The Charging Station must be able to identify the maximum current capability of the cable
assembly (for Type 2, this means measuring the resistor between the proximity pin and earth in the Type 2 plug according to BS EN 61851). The Charging Station shall interrupt the current supply if the current being drawn by the EV exceeds the rating of this cable
c) A locking mechanism shall be used to prevent disconnection of the plug from the outlet under load. The plug shall unlock when the user has indicated that they want to finish charging.
d) In the event of a power failure, the locking mechanism shall be released to prevent the user’s cable being stuck in the outlet

15
1.1.3.6 Electrical Protection
The electric vehicle charging circuit shall be protected by a dedicated RCBO or a dedicated RCD/MCB combination this will be installed in the properties distribution board and will have the following basic characteristics…
• Overcurrent Curve C • At least 10 kA breaking capacity. • Minimum requirement of type A earth leakage protection. • 30mA earth leakage
As the charge point will be configured differently depending on the conditions of the installations the following tables give a guide of the switchgear depending on the power requirements.
Configuration No. of Phases Current Rating (In)
22kW 3 40
11kW 3 20
7kW 1 40
3.6kW 1 20
Table 3 - Charge Point Switchgear Guide
1.1.3.7 Power Contactors
a) The outlet shall have a contactor that energises the power supply to the outlet on all phases and neutral.
b) There should be a means to detect if a contactor has stuck closed on any phase. On detection, the mains supply to all outlets shall be cut by means of tripping an RCD or otherwise.
1.1.3.8 User Interface
The user interface shall consist of, at a minimum, a single button or switch and a single tricolour LED.
1.1.3.9 Charging Station Exterior
Full details of the material composition of the Charging Station exterior, including estimated lifetime, resistance to corrosion and its long term performance under UV light, shall be provided. Photographs and renderings of the Charging Station shall be provided.
1.1.3.10 IP Rating
The entire Charging Station shall provide a minimum degree of protection of IP44 when in operation or not in operation. When installed in an outdoor location, the Charging Station shall meet the minimum IP ratings set out in BS EN 61851:1.
1.1.3.11 Electrical Connection
The Charging Station shall be connected to the network so as to not add any distortion to the network such as harmonics or flicker. The Supplier is required to provide evidence of this to the client.

16
1.1.3.12 Functionality after Disruption of Supply
It shall be possible for the user to switch the power supplying the Home Charge Point off for a period of no less than three weeks without affecting the full functionality of the Home Charge Point. When the power is returned the unit should be fully functional without any alteration made to the unit. The Home Charge Point shall also maintain full functionality without alteration after an electrical supply interruption.
1.1.3.13 IET Code of Practice
The installation of the Charging Station must be in accordance with the current edition of the IET Code of Practice (CoP) for Electric Vehicle Charging Equipment Installations, the IET Wiring Regulations (BS 7671) and all other applicable standards.
1.1.3.14 EV Communications via Power Line Carrier
Adequate space shall be provided in the Charging Stations for retrofit of Power Line Carrier modems compatible with the emerging ISO/IEC 15118 standard, and the Charging Station must be designed to provide the additional power supply and signal inputs and outputs of the PLC modem(s).

17
1.2 On-Street AC Charge Points
1.2.1 Introduction
This document contains the technical specification for “smart” connected charging stations which are required to interact with a Charge Point Management (CPMS) over a network layer (usually, but not limited to GPRS, 3G, 4G) using the Open Charge Point Protocol (OCPP) as specified and enhanced by the Open Charge Alliance (OCA). The document describes the core electro-mechanical, IT and tendering requirements of any such charging stations. These core requirements must be met fully by any prospective tenderers.
Figure 9 - On-Street AC Charge Points
1.2.2 Applicable Codes and Standards
The equipment shall comply with the latest editions of the following standards and codes:
Number Title
OCPP 2.0 Open Charge Point Protocol Specification version 2.0
IEC Guide 113 Materials Declaration Questionnaires – Basic Guidelines
ISO 9001 Quality Systems
89/336/EEC Electromagnetic Compatibility Directive
93/465/EEC The Affixing and Use of the CE Conformity Marking
IEC 61851 EV Conductive Charging System
IEC 62196 Plugs, Socket-Outlets, Vehicle Couplers and Vehicle Inlets
SAE J1772 SAE EV and PHEV Conductive Charge Coupler
IEC 14443 Identification Cards – Contactless Integrated Circuit Cards
ISO/IEC 15118 Vehicle to grid communication interface
Table 4 - Applicable Standards and Codes
Where a particular subject is not covered by one of the above standards then a recognised national standard shall apply.

18
1.2.3 Network Parameters
The equipment shall be suitable for installation on Networks with the following design parameters.
Parameter Value
Rated Voltage 230/440V
No. of Phases 3
Frequency 50Hz
LV Earthing TNCS
3 phase Short Circuit (rms)t 40kA
Duration of Short Circuit 1s
Power Frequency 1 min (rms) 3kV
Table 5 - Network Parameters
1.2.4 Charging Stations
1.2.4.1 Charging Station Variations
The following charging station variations are required:
a) Ground/surface mounted charging stations with two-outlet, 3-phase, 32A per phase (44kVA total
charging station output with both outlets at full supply).
b) Wall mounted charging stations with two-outlet, 3-phase, 32A per phase (44kVA total charging
station output with both outlets at full supply).
Charging Stations connected to an incoming 3-phase supply shall be capable of supplying 3-phase charge and/or single phase charge to one or two EVs simultaneously while maintaining all safety and metrological accuracy standards.
It shall be possible to connect the Charging Station to a single phase supply so that an EV will only draw current on that phase without compromising safety, metrological accuracy or functionality.
1.2.4.2 Charging Station Composition and Internals
The Charging Stations are envisioned of being of the form as shown in the figure below. Equivalent options are acceptable.

19
Figure 10 - Charge Point Internals

20
1.2.4.3 Charging Mode
The Charging Station shall support Mode 3 charging as defined in IEC 61851-1. The following functions shall be provided by the Charging Station:
a) Verification that the vehicle is properly connected b) Continuous protective earth conductor continuity checking c) Energisation of the system d) De-energisation of the system e) Selection of charging rate i.e. a means to ensure that the charging rate does not exceed the rated
capacity of the mains, vehicle or battery capabilities f) Determination of ventilation requirements for charging area (optional) g) Detection/adjustment of the real time available load current of the supply equipment. This can be
adjusting the PWM pilot signal to adjust the current drawn by the EV on receipt of an external command (e.g. remote command) and/or otherwise (e.g. max. current setting jumper). (optional).
1.2.4.4 PWM Pilot Signal
a) The Charging Station shall implement control pilot functionality as described in Annex A and Annex B of IEC 61851-1 Edition 2 and SAEJ1772.
b) The pilot signal parameters of the Charging Station or other similar products (timings, voltages etc.) have been validated for use with one or more electric vehicle manufacturer (e.g. Renault, Nissan, BMW, Mitsubishi, Peugeot, Citroën, VW, and Ford). There are differences in implementing the control pilot functionality which may result in vehicles from certain manufacturers not being able to charge or charge incorrectly from the Charging Station. The Supplier shall outline its efforts to mitigate this risk.
1.2.4.5 Charging Station De-rating
For some locations, local supply constraints will limit the total current that is available to a Charging Station. It shall be possible to adjust the pilot signal so that the total current drawn on all outlets does not exceed the supply rating. If the charging station contains 2 sockets, the first connected EV shall have the full rating of the supply made available to it. In the event that a second EV is connected, both outlets shall make equal amounts of current available to the EVs, without exceeding the total supply capacity.
1.2.4.6 ZE Ready Certification
a) The Charging Station shall be suitable for charging the End User’s electric vehicle(s). Some electric vehicles require Charging Stations that have passed ZE Ready certification.
b) The Supplier must provide proof and full test results of ZE Ready certification. Any non-compliance, even if the Charging Station has passed certification, must be clearly disclosed.
1.2.4.7 Socket
a) The socket shall be a Type 2 socket as defined in IEC 62196-2. b) The Charging Station must be able to identify the maximum current capability of the cable
assembly (for Type 2, this means measuring the resistor between the proximity pin and earth in the Type 2 plug according to BS EN 61851). The Charging Station shall interrupt the current supply if the current being drawn by the EV exceeds the rating of this cable
c) A locking mechanism shall be used to prevent disconnection of the plug from the outlet under load. The plug shall unlock when the user has indicated that they want to finish charging.
d) In the event of a power failure, the locking mechanism shall be released to prevent the user’s cable being stuck in the outlet

21
1.2.4.8 Electrical Protection
Each outlet shall have independent functionality for:
a) Residual current detection & trip (at least Type A RCD characteristic or equivalent via main contactor). If the charging station has remote or auto-recloseable RCDs, this shall be specified.
b) Gross over-current protection (fused at per-outlet max. current) or Type C MCB, 9kA rupturing capability.
c) Variable “over-current” trip (via primary contactor) set at level dynamically determined by CP (minimum of: charging cable capacity; nominal supply capacity, local distribution constraints).
d) Remote software initiated re-closing capability after RC or OC trip. e) Remote software initiated residual current test capability (e.g. >30mA leakage to earth circuit
closure via relay).
1.2.4.9 Power Contactors
a) Each outlet shall have a contactor that energises the power supply to the outlet on all phases and neutral.
b) There should be a means to detect if a contactor has stuck closed on any phase. On detection, the mains supply to all outlets shall be cut by means of tripping an RCD or otherwise.
1.2.4.10 User Interface
The user interface shall consist of, at a minimum, a single button or switch and a single tricolour LED.
1.2.4.11 Charging Station Exterior
Full details of the material composition of the Charging Station exterior, including estimated lifetime, resistance to corrosion and its long term performance under UV light, shall be provided. Photographs and renderings of the Charging Station shall be provided.
1.2.4.12 IP Rating
The entire Charging Station shall provide a minimum degree of protection of IP44 when in operation or not in operation. When installed in an outdoor location, the Charging Station shall meet the minimum IP ratings set out in BS EN 61851:1.
1.2.4.13 Electrical Connection
The Charging Station shall be connected to the network so as to not add any distortion to the network such as harmonics or flicker.

22
1.2.4.14 Equipment Nameplate
A nameplate shall be fixed to the Charging Station displaying clearly the following details:
1. Manufacturer's name 2. Equipment reference 3. Serial number 4. Date of manufacture 5. rated voltage in V 6. rated frequency in Hz 7. rated current in A 8. number of phases 9. IP degrees 10. Normal current rating of each socket 11. Gross weight 12. Reference to this specification
The nameplate shall be visible after installation.
1.2.4.15 IET Code of Practice
The installation of the Charging Station must be in accordance with the current edition of the IET Code of Practice (CoP) for Electric Vehicle Charging Equipment Installations, the IET Wiring Regulations (BS 7671) and all other applicable standards.
1.2.4.16 EV Communications via Power Line Carrier
Adequate space shall be provided in the Charging Stations for retrofit of Power Line Carrier modems compatible with the emerging ISO/IEC 15118 standard, and the Charging Station must be designed to provide the additional power supply and signal inputs and outputs of the PLC modem(s).
1.2.4.17 Metrology
a) Each Outlet shall have a separate certified electronic meter. This shall be on the AC input to the AC to DC converter for DC outlets.
b) Charging Station internal/auxiliary power supply circuits shall not be fed through the outlet meter(s)
c) This meter shall contain a non-volatile, non-resettable cumulative kWh energy display. d) To conform to current legal metrology requirements of the EU Measuring Instruments Directive, it
should be possible for the consumer (i.e. EV charging outlet user) to see the readings of the cumulative kWh energy register for each outlet from outside the charging station. For the avoidance of doubt, the meter kWh display must be visible to the user from outside the charging station. One way to achieve this is via a clear or transparent panel in the body of the charging station.
e) Meter register data values shall be capable of being read on demand by the charging station controller, with a maximum read cycle delay of 2 seconds, at a recurring frequency of up to 0.5Hz.
f) Actual register values for active energy, reactive power flows (vars), and any other measurands (amps, volts, frequency, THD, etc.) must be read and recorded by the controller (and uploaded to the CPMS) unmodified. For the avoidance of doubt, the use of secondary registers (e.g. energy accumulators via S0 interface pulse counter) are not acceptable
g) The meter(s) shall measure active energy to Class B, EN50470 and Class 1, EN62053-21. h) The meter(s) shall measure reactive energy to Class 2, EN62053-23. i) Meters and controller must be capable of reading voltage and current on a per-phase basis, to
facilitate the detection of large unbalanced EV loads, and the use of charging stations as smart-grid distribution network monitoring nodes.

23
1.2.4.18 Additional Functionality
The following additional desirable capabilities MAY be provided. Items that require OCPP 2.0 or above for standardized implementation and management by the Central System are labelled “OCPPP 2.0+”.
Autonomous Frequency Response Charging Suspension
Charging energy provision to all active charging sessions should be suspended (or constrained back to minimum levels by adjustment of pilot PWM signals) when the incoming mains frequency (as regularly read from one of the energy meters, or from separate circuitry), falls below a specified threshold (specified to 2 decimal places – e.g. 48.75Hz). (OCPP 2.0+).
Charging Bay Occupancy Detection & Reporting
Where suitable (internal/external) sensors are fitted/available, the Charging Station controller should detect transitions in the occupancy state of the parking space(s) reserved for vehicle charging (due to vehicles or other obstructions) and, if enabled, report it to the Central System using a Delta alert Notice (OCPP 2.0+).
Intrusion/Access Detection & Reporting
The controller should detect the opening and closing of all access doors/panels, etc. and report each such status change as an event to the Event Log, and as an immediate event report Notice (OCPP 2.0+).
Tilt, Shock & Damage Detection & Reporting
The Charging Station controller should detect the activation of any tilt or gross shock sensors, record each such status change as an event to the local event log, and also report it to the Central System using an alert Notice (OCPP 2.0+).
Where a 3-axis accelerometer is fitted, deviations in the post orientation angle from vertical should be measured, compared against configured limit parameters, and used to trigger appropriate event reports.
Where the angular deviation exceeds the specified “gross damage” threshold, the controller should enter an “out of service” state, and, if possible, trigger a complete failsafe shutdown (suicide trip).
Failsafe Electrical Shutdown
Charging Stations will usually be protected by an upstream RCD, typically located in a sealed underground chamber or a separate distribution pillar.
As a safety measure, charging stations should incorporate a failsafe electrical isolation system, to protect human life in the case high energy/high force impact on the post that causes sufficiently severe physical damage to create a potential situation where conductive parts of the post become “live” and pose an electric shock risk to vehicle occupants or members of the public.
Where a shock/damage/tilt sensor has detected gross damage (e.g. extreme tilt, or moderate tilt/shock occurring simultaneously with the opening of access door switches), the circuitry (or a fast interrupt driven routine in the main processor) should output a “suicide trip” signal. Where a battery backup system is fitted that can maintain power to the processor and communications equipment, a “last-gasp” event report should be immediately sent to the CPMS.
Remote triggering of the failsafe shutdown by the Central System is possible (OCPP 2.0+).

24
Operating Schedule
Display and enforce (parameterized) Operating Hours (OCPP 2.0+).
External Charging Station Availability Control
An external electrical input signal may be used to control the availability of a Charging Station, by Making it “Unavailable”, and entering a low power state on external command (e.g. on closure of the hosting site).
Auxiliary Output Control
Charging Station Controllers may provide the option to switch auxiliary electrical loads (typically extra lighting around the charging station), either on a specified time schedule, or based on ambient lighting levels.

25
1.3 Fast Charge Points
This document contains the technical specification for “smart” connected fast charging stations which are required to interact with a Charge Point Management (CPMS) over a network layer (usually, but not limited to GPRS, 3G, 4G) using the Open Charge Point Protocol (OCPP) as specified and enhanced by the Open Charge Alliance (OCA). The document describes the core electro-mechanical, IT and tendering requirements of any such fast charging stations. Figure 11 shows a sample of the fast charge points installed in Ireland.
Figure 11 - Fast Charge Points Installed in Ireland
1.3.1 Applicable Codes and Standards
The equipment shall comply with the latest editions of the following standards and Codes and all standards:
Number Title
OCPP 2.0 Open Charge Point Protocol Specification Version 2.0
CHAdeMO 0.9 and 1.0 CHAdeMO Association Protocol version 0.9 and 1.0
CCS Specification Combined Charging System (Combo) Specification
IEC 61851 Electric Vehicle Conductive Charging System
IEC 62196 Conductive Charging of Electric Vehicles
IEC 14443 Identification cards – Contactless Integrated Circuit Cards
ISO/IEC 15118 Vehicle to Grid Communication Interface
IEC Guide 113 Materials Declaration Questionnaires – Basic Guidelines
IEC 61439 Assemblies for Power Distribution in Public Networks
DIN 43 620 NH Fuses for 500 and 600 V AC and 440V DC
ISO 9001 Quality Systems
EU ROHS (2002/95EC) Hazardous Substances in Electrical and Electronic Equipment
89/336/EEC Electromagnetic Compatibility Directive
93/465/EEC The Affixing and Use of the CE conformity marking
Figure 12 - Applicable Codes and Standards

26
1.3.2 Network Parameters
The networks parameters as specified in Section 1.1.2 are applicable.
1.3.3 Fast Charging Station Specification
The fast charging station shall consist of a single unit with 3 outlets (attached cables) as specified below:
Outlet Number Outlet Type Power Rating
1 IEC 62196-2 Type 2 44kW AC
2 CHAdeMO 50kW DC
3 CCS 50kW DC
Table 6 - Fast Charging Station Specification
a) Outlet 1 charging functionality shall conform to IEC 61851- 1 Edition 2.0 in all respects unless explicitly detailed otherwise in this Specification.
b) Outlet 2 charging functionality shall conform to CHAdeMO Version 0.9 or greater in all respects unless explicitly detailed otherwise in this Specification.
c) Outlet 3 charging functionality shall conform to CCS Specification.
Notes
a) Fast Charging Stations connected to an incoming 3-phase supply shall be capable of supplying full power output (3-phase AC and/or DC) charging (subject to static or dynamic feed capacity and/or demand/load management constraints) to one or two EVs simultaneously while maintaining all safety and metrological accuracy standards.
b) It shall be possible to connect an AC Fast Charging Station outlet to an EV that will only draw current on one phase or two phases without compromising safety, metrological accuracy or functionality.
c) For the case of a combined AC & DC fast charging session, both outlets shall be able to operate simultaneously. The maximum output of the Fast Charging Station with both outlets operating simultaneously shall be at least 80kW.
d) The Fast Charging Station shall have configuration options both to (i) only allow one outlet only (DC or AC) to be used at a given time, and (ii) limit total power drawn to a configurable maximum value (e.g. 60kW)
e) To facilitate installations where the feeding network cannot support two full rate charging sessions (e.g. a limit of 60kW for example) the Fast Charging Station should implement a logical interlock (hardware and/or software) that can be enabled locally and/or remotely via command, to either prevent the initiation of a second charging session when one is already in progress (with suitable user notification), or, will clearly communicate to the user that the second session will not start, or will proceed at a “restricted/trickle” rate only, until the pre-existing session has terminated, or entered a final low power “top-off” stage.
1.3.3.1 Charging Station De-rating
a) It should be possible to remotely reconfigure the charge controller software to decrease the maximum power that can be drawn per outlet, or overall, per Fast Charging Station, to any value below the maximum rating, including “0 amps”, equivalent to a forced pause/stall of the charging session.
b) While standards for the dynamic modification of available power using the CHAdeMO/CCS protocol are not yet well defined, this functionality shall be implementable in the Fast Charging Station without any hardware upgrades or hardware configuration changes. Therefore, this shall

27
be implementable by using a software update which the vendors are required to provide at no cost.
1.3.3.2 Electric Vehicle Certification
a) The Fast Charging Station shall be suitable for charging the End User’s electric vehicle(s). Some
electric vehicles require Fast Charging Stations that have passed ZE Ready certification (or some
similar manufacturer’s compatibility test). The Supplier must provide proof and full test results of
such compatibility certifications. Any non-compliance, even if the Fast Charging Station has
passed certification, must be clearly disclosed.
1.3.3.3 Locking Mechanism
The Fast Charging Station connector shall be locked or latched on a vehicle inlet throughout the charge to avoid hot disconnect and electrical shock from vehicle batteries. The connector shall not be unlocked (if locking mechanism is applied) when hazardous voltage is detected through charging process including after the end of charging. In case of charging system malfunction, a means for safe disconnection shall be provided.
The Fast Charging Station shall have the following functions:
a) indicating means to notify users of locked status on the DC outlet, b) lock function to retain the locked status on the DC outlet
In the event of a power failure, the locking mechanism shall be released.
1.3.3.4 Emergency Stop Button
a) In the event of an emergency stop button (if fitted) being pushed, a message shall be displayed on the user display explaining how to recommence charging. It shall be possible for a user to recommence a charging session by resetting the emergency stop button and by selecting the correct options on the display screen
b) If the unit can be reset remotely this should be specified.
1.3.3.5 Electrical Protection
a) In the event of an EV drawing more power than has been advised as allowed via the communications protocol, the Fast Charging Station shall terminate the charging session and display an error message. This shall be implemented without impacting on the next user
b) The Fast Charging Station shall be protected from ground fault and earth leakage. A Type B RCD or equivalent shall be used. Each outlet shall have a separate RCD.
c) An optional requirement is to fit the RCDs with reclosers that can reset the RCD (after receiving a command only) in the event of a trip. A hardware and signal interface for this command shall be provided, if reclosers are present. RCD reclosers shall be included as an additional priced option if offered by the Tenderer.
d) Over current protection shall be placed on the input AC circuit to each outlet. This overcurrent protection shall consist of an 80A, Curve D MCB or equivalent
e) The Fast Charging Station shall measure internal temperature inside the unit. The Fast Charging Station shall de-rate and/or trip in the event of over heating
f) There should be a means to detect if a contactor has stuck closed on any phase or DC terminal. On detection, the mains supply to all outlets shall be cut.

28
1.3.3.6 Power Contactors
a) Each outlet shall have a contactor that energises the power supply to the outlet on all phases and neutral.
b) There should be a means to detect if a contactor has stuck closed on any phase. On detection, the mains supply to all outlets shall be cut by means of tripping an RCD or otherwise.
1.3.3.7 EMC Performance
Emissions
a) The harmonic currents shall be tested according to IEC 61000-4-7. The harmonic current limit values shall comply with those in CHAdeMO Protocol 1.0.0, Appendix 1 and CCS equivalent.
b) The voltage fluctuation and flicker performance shall comply with IEC 61000-3-11. c) The AC conducted emission tests shall be carried out according to CISPR16-1-2. The limit values
shall comply with those in CHAdeMO Protocol 1.0.0, Appendix 1 for a category C1 charger. d) The DC conducted emission tests shall be carried out according to the test circuit and load
conditions in the CHAdeMO Protocol 1.0.0, Appendix 1 and CCS equivalent. The limit values shall comply with those in CHAdeMO Protocol 1.0.0, Appendix 1 and CCS equivalent for a category C1 charger
e) The Radiated emission shall be tested according to CISPR16-2-3. The limit values shall comply with those in CHAdeMO Protocol 1.0.0, Appendix 1 and CCS equivalent for a category C1 charger.
f) Voltage surge shall be tested according to the test circuit in the CHAdeMO Protocol 1.0.0, Appendix 1 and CCS equivalent. The limit values shall comply with those in CHAdeMO Protocol 1.0.0, Appendix 1 and CCS equivalent.
g) Current ripple shall be measured according to the test circuit in CHAdeMO Protocol 1.0.0, Appendix 1 and CCS equivalent. The limit values shall comply with those in CHAdeMO Protocol 1.0.0, Appendix 1 and CCS equivalent.
h) Smart key influence shall be tested according to the test circuit in CHAdeMO Protocol, Appendix 1 and CCS equivalent. The limit values shall comply with those in CHAdeMO Protocol, Appendix 1 and CCS equivalent. Measures taken to limit stray DC currents onto the network shall be outlined in detail.
Immunity
a) Immunity testing shall be conducted according IEC 61000-6-1. The performance criteria of voltage dips and blackouts for a short period of time shall be "C."
b) During voltage dips and blackouts for a short period of time, the immunity shall conform to the input specification of the Fast charging station. That is that the equipment shall operate within +/- 10% of nominal supply voltage and 50Hz +/- 1%.
Filtering on Power Circuitry
Filtering contained inside the Fast Charging Stations shall prevent power quality and EMC issues at the EV and the AC grid.
1.3.3.8 IP Rating
As per Section 1.2.4.12.
1.3.3.9 Electrical Connection
As per Section 1.2.4.13.

29
1.3.3.10 Equipment Nameplate
As per Section 0.
1.3.3.11 IET Code of Practice
As per Section 1.2.4.15.
1.3.3.12 EV Communications via Power Line Carrier
As per Section 1.2.4.16.
1.3.3.13 Metrology
As per Section 1.2.4.17.
1.3.3.14 Additional Functionality
As per Section 1.2.4.18.

30
Work Package 1.3
Determine the likely distribution of existing EVs
during the trial period

31
The ESB Ecars Electric Vehicle Trial commenced in 2010 to investigate the feasibility and suitability of introducing EV’s to the Irish electricity distribution system. The initial phase of the trial was to install a small number of 3 pin chargepoints in urban areas. These were mainly used for small city car type EV’s like the Riva. The next development was Type 2 and ESB then purchased 15 Mitsubishi iMiev’s and used both 3 Pin and Type 2 for charging in public. In 2010/11 the Nissan Leaf arrived on the Irish market. The Leaf represented a huge step in EV development with a car that had better range and a more family car feel. The Renault Fluence and Kangoo van also arrived around this time. These Renaults did not support Chademo DC Fast Charging like the Leaf and were limited to AC only. Throughout this trial, the availability of EV models has been a major issue and Nissan, Renault & Mitsubishi were the only manufacturers offering vehicles for sale in Ireland. The technology of these cars varied greatly with Nissan offering the Leaf with AC and DC Chademo fast charging capability while Mitsubishi offered the iMiev but this was in a pre-production version with a high cost. Renault offered the Fluence and Kangoo van but this was limited to slow AC charging only.
Electric vehicle sales in Ireland have been low and the availability of new models has only started to increase in 2014 with Volkswagen, Renault, Mitsubishi, BMW and Audi bringing new EV’s and PHEV’s to the market. The table below shows EV Sales from 2010 to 2014. January 2015 sales are strong with over 120 units sold.
Year Units Sold
2008 38
2009 59
2010 66
2011 103
2012 215
2013 71
2014 269
The type of EV users in Ireland varies between two main types. The local driver who charges at home and uses the EV within its range each day and has very low reliance on the public infrastructure. The other type of EV user treats the car like a standard ICE car and drives long distances and relies heavily on the public infrastructure. These drivers use the DC Fast charger network for top-ups to carry out long journeys. There are also a lot of drivers who use the public infrastructure as their main form of charging instead of charging at home. During the initial phase of the project the EV driver was not charged for the electricity used on the public infrastructure. This was an interim measure while the ICT systems were being established. The availability of this free charging has led to higher demand for fast chargers and some busy urban areas have experienced queues.
As part of the promotion of EV’s in Ireland and to generate growth in the early phase of the trial, ESB agreed to provide a free home charger for the first 2000 EV’s sold in Ireland. The availability of home charging is essential to the success of an EV programme as people need to be able to charge their cars overnight while system demand is at its lowest. One of the fundamental reasons for introducing EV’s to Ireland was to increase off-peak demand for electricity and fill in the night valley curve on the system demand. This curve, shown below, was also mapped with a projection of what the load profile would look like if 250,000 EV’s were introduced to the distribution system.

32
The controlled charging of 250,000 EVs shown in the graph above may through the following means:
1. Incentivising off peak charging of EVs via implementation of dual tariff metering and low EV
specific tariffs (note that modern EVs have charging timers installed that can delay charging
session starting time until low tariff times (typically 11pm).
2. Developing systems that control and stagger EV charging session commencement (i.e. all EVs
starting their charging sessions simultaneously at 11pm is not desirable on either a local or
national level.).
The planning criteria used by the ESB Ecars Infrastructure team were developed through knowledge gained from EU Projects and statistics gathered outlining the location of new registrations, etc. The initial criteria used were to locate AC and DC chargers in the large urban centres like Dublin, Cork, Limerick, Galway and Waterford. AC chargers are mainly located in on-street locations and in public car parks. DC Fast chargers with Chademo connectors were then installed in service stations and at motorway service areas. An AC charger was also installed at many of these locations as a backup. The criteria for DC installations were ideally 24 hour access, toilet and rest facilities and the availability of hot food. These were mainly located in urban areas or on the main inter urban routes. A number of DC Chargers were also installed as part of the EU funded Ten-T International Green Electric Highways. This project identified the main arterial routes in Ireland and part funded fast charger installations on these routes. The target was to have a DC Fast charger every 60km on the routes. The project also covered a range of Intermodal sites at train stations where EV drivers could charge their car while using the rail network.
One key development in DC Fast Charging occurred during the role out of the Ten-T project. A group of European car manufacturers (Audi, BMW, Daimler, Ford, General Motors, Porsche and Volkswagen) came together to develop the CCS or Combo charging system. This incorporated the existing Type 2 plug with two additional DC pins. The introduction of CCS was delayed due to the lack of cars being introduced to the market but Volkswagen has recently introduced the eGolf and the eUp! and BMW have launched the i3 and i8. As a result of this new development , Ecars had to revisit its procurement process and purchase CCS chargers. A number of chargepoint manufacturers were not able to supply CCS chargers but one Portuguese company Efacec were able to supply us with chargers. We also investigated the

33
option of retrofitting CCS to the existing Chademo chargers on our system but this was not possible and none of our suppliers were able to offer a solution.
Figure 1 - Efacec Triple Standard Charger
The main locations for AC chargers were the urban centres but a general planning criteria was introduced to install at least one AC charger in every town with 1500 inhabitants. This criteria was observed but a number of towns were excluded due to their proximity to another town or to a DC fast charger. Also a number of towns were adjacent to larger urban areas that were already well served with infrastructure. The geographical spread of EV sales was also studied and the Dublin area had by far the greatest concentration of EV’s with 55% up to late 2013 and another 10% in the Dublin commuter counties of Louth, Meath, Kildare and Wicklow. Cork had 10% and the Midwest region had 6%.
Initially the usage of the AC network was fairly low but this has grown with the introduction of the Renault Zoe 22kW 3 phase AC charging and the Nissan Leaf with 6.6kW charging . A number of DC Fast chargers have also been supplied with Fast AC Charging at 43kW and this can provide a full charge to a Renault Zoe in 30 minutes via the Type 2 cable.
In order to complete the roll-out of the AC and DC charger infrastructure ecars have a number of important challenges ahead. Firstly, we must plan the remaining stocks of chargers and the planned deliveries for 2015 to ensure that we complete this phase of the deployment and cover all the key urban areas and the inter-urban routes. Care will be required to ensure no holes are left in the infrastructure and EV drivers are adequately connected to the rest of the country. A number of system upgrades are also required to improve the reliability and overall performance of certain chargepoint manufacturers. In certain cases, ecars have been forced to replace poorly performing chargers and chargers that do not meet specification or expectation. This process will continue throughout 2015. Another significant issue facing EV Drivers is the blocking of chargepoints by internal combustion engine vehicles. In 2014 the Dept. of Transport issued statutory Instruments to deal with this. Ecars will start the marking of the parking spaces with the words “Electric Vehicle Charging Only” in the near future and we plan to cover this in all urban areas in 2015.
34
Work Package 1.4
Determine the effect on voltage & load of the
connection of EVs to both tailed and
interconnected networks in urban & rural areas

35
Table of Contents
1 Introduction ...........................................................................................................................36
2 Urban Network .......................................................................................................................36
2.1 Introduction .............................................................................................................................36
2.2 Analysis and Results ...............................................................................................................37
3 Rural Network ........................................................................................................................54
3.1 Introduction .............................................................................................................................54
3.2 Analysis and Results ...............................................................................................................55
4 Analysis of Other Research Studies ...................................................................................55
5 Conclusion .............................................................................................................................56

36
1 Introduction
Some electric vehicles (EV) can charge at a rate of 3.3kW to 6.6kW and for as long as 6 to 8 hours for a full charge. This type of load is considerably different to traditional loads that could be expected to be found in residential networks. As a result, the introduction of significant levels of EVs in residential networks could significantly change typical demand patterns and lead to adverse effects, such as excessive voltage drop and overloading of network components.
A radial (tailed) network is a configuration with no normal connection to any other supply. This is the typical connection type for the distribution network. A parallel (interconnected/meshed) network has two or more connections to other points of supply. ESB Networks have developed the LV network in a radial manner. Changing the operation of LV networks from radial to parallel is as straightforward as closing or removing the normally open (NO) points that are built into the network.
It is therefore important to determine the effect on voltage and load of the connection of EVs to both radial and parallel networks. In order to comply with power quality standards set out in EN50160, ESB Networks undertakes to deliver single phase electricity within a voltage range of 207 Volts to 253 Volts (i.e. +/- 10% of nominal voltage). The report firstly describes the impact on urban networks and then goes on to describe the ongoing study in a rural network.
2 Urban Network
2.1 Introduction
In order to assess the potential impact of EVs on the Distribution network under a range of scenarios, ESB Networks established a field trial in 2012 where a section of low voltage (400V) network in a suburb of Dublin was selected as the location for the EV field trial. The trial took place over a twelve month period with up to 7 EVs deployed on the feeder to model the effects of mass penetrations of EVs on urban distribution networks. The network fed 54 customers in normal configuration. However, in order to assess the impact of vehicle charging on longer lines, the network was reconfigured to increase the network impedance and the number of customers served from this feeder. This was achieved by closing the normally open (NO) point and moving it halfway along the neighbouring feeder taking in 20 more houses. The reconfigured network then had 74 customers. Figure 13 shows a simplified single line diagram of the field trial feeder.

37
Figure 13: Simplified single line diagram of the field trial feeder
During the field trial, data collection meters were placed at the charging point of each EV in order to record information about EV charging characteristics independently of the EV user's residential load. Each meter recorded the active power demand at the EV charging point. Smart meters were installed in the participants’ homes to monitor and record the domestic power demand and voltage levels. A power quality meter was installed at the 10/0.4kV transformer. From the recorded data it was possible to determine the effect on voltage and load of the connection of EVs to radial networks in urban areas.
The section of LV network where the urban field trial took place as described above was used for test network modelling – as it is representative of modern underground LV network found throughout Dublin. The modelling was part of a desktop study which aimed to determine the benefit of using parallel network configuration over radial configuration.
2.2 Analysis and Results
The power quality meter installed at the 10/0.4 kV transformer to record 30 second resolution data provides a picture of the overall loading on the feeder. Figure 14 shows the 24-hour demand profile (kVA) which contains the maximum feeder demand from the recorded data. The demand of 65.85 kVA occurred at approximately 7.15 pm on a weekday evening in November. The corresponding voltage and current profiles from a smart meter located at the remote end of the feeder are provided in Figure 15. It is evident from this figure that the voltage experienced by this customer around the time of the maximum feeder loading is close to the lower acceptable limit of 0.9 pu (207 V). The actual recorded minimum voltage for this customer was 0.912 pu (209.8 V).

38
Figure 14: Profile of total apparent power on network feeder
Figure 15: Voltage and current profiles for a household at remote end of feeder for the 24-hour period shown in Figure 14
The smart meters used throughout the trials had the ability to record average, maximum and minimum values for current, voltage and power over 10 minute time steps. Data gathered over the course of the

39
trials has shown that in some cases it is important to consider the average, maximum and minimum as the difference in the values within a ten minute period can be significant. Analysis of the smart meter measurements showed that the lowest customer voltage did not necessarily occur at the same time as the maximum feeder demand. There were also a number of occurrences whereby the minimum voltage levels recorded in a ten minute period at certain customer households were below the lower acceptable limit, in one case as low as 0.884 pu (203.3 V) . For example, in Figure 16 the value for the average voltage at approximately 7 pm was recorded as 0.925 pu (212.8 V) which is above the lower acceptable limit of 0.9 pu. However, the corresponding value for the minimum voltage level recorded within the same 10 minute period was 0.895 pu (205.8 V) which is below the lower acceptable limit. The corresponding maximum current profile of the customer is also shown.
Figure 16: Voltage and current profiles for a household showing an example of the minimum voltage falling below the lower permitted limit of 0.9 pu
Another example is shown in Figure 17 which displays the recorded average and maximum current readings for a household over a 24-hour period. Figure 18 shows the difference between these two measurements over the same period. The greatest difference between the two recorded values in this example occurred at 8.10 am and was found to be 22.6 A. Given that the average values for the maximum and average current over the 24-hour period were 8.9 A and 5.1 A respectively, a difference of 22.6 A between the two measurements is relatively significant and due consideration for such differences should be given when analyzing such data.

40
Figure 17: Example household current profile showing maximum and average current measurements over a 24-hour period
Figure 18: Difference between the maximum and average current measurements of the profiles shown in Figure 17

41
Figure 16 and Figure 17 highlight that even within a ten minute period there can be a significant variation in demand. In particular, the average loading or voltage recorded within a period may indicate that it is comfortably within standard, but there may be short term loading spikes which push the voltages below the lower limit for a short time. The nature of LV networks is one of individual demand profiles that do not have the benefit of aggregation that analysis of higher voltage networks benefit from. The usage of a high power device for a short time will not always be captured fully in a ten minute window. This may pose unforeseen issues with the continued drive towards integration of new residential energy resources.
A modelling exercise was also undertaken to study the effect of voltages on the feeder with EV loading. Figure 19 shows the 3-phase voltage along the feeder. In the first case, electric vehicles are added incrementally from the start of the feeder (red line) and in the second case, they are added from the end of the feeder (blue line). This indicates the locational effect of vehicle connections on the network. If placed at each house from the end of the feeder, the lower 3-phase voltage limit of 0.92 pu is almost immediately reached given the initial high loading on the network, with the 0.9 pu voltage limit hit at approximately 8%. When vehicles are added from the start of the feeder the 0.9 pu limit is hit at 20%. Utilities will not be able to control where vehicles are connected but awareness of the sensitivity of the network parameters to vehicle charging is valuable.
Figure 19: Three-phase Voltage with Increasing Levels of Electric Vehicles
Figure 20 shows the single-phase voltage at a customer point of connection. This voltage is recorded at the end of the single-phase service cable which connects the house to the network. The same effect as shown in Figure 19 is evident again here. The reconfiguration to 74 customers results in low voltages at the maximum demand scenario. The voltage profile obtained is not as smooth as the 3-phase voltage due to the phase interdependency and slight load unbalance which occurs in the system.

42
Figure 20: Single-phase Voltage at Customer Connection Point with Increasing Levels of Electric Vehicles
The results shown in Figure 19 & Figure 20 indicate that it is at the remote end of the feeder where the most noticeable network impact will occur.
Figure 21 and Figure 22 show the thermal loading for increasing penetrations of EVs on the network transformer and mains cable connecting from the transformer to the field trial circuit respectively. The thermal loading of the transformer is affected by the electricity demand on all four feeders being supplied from the transformer. The results from Figure 21 show that an EV penetration of 20-30% across all the feeders could potentially exceed the thermal rating of the transformer. A similar analysis of the cable supplying the field trial feeder from the transformer indicates that an EV penetration of 60% is possible before the cable becomes overloaded (Figure 22). It should be noted that this analysis assumes that there is a charging coincidence factor of 1.0. For this feeder, the lower voltage limit is more likely to be the binding constraint as opposed to the thermal loading of the feeder cable. However, the introduction of EVs across all the feeders that are supplied by the transformer would increase the likelihood of the transformer loading limit becoming the binding constraint.

43
Figure 21: Thermal loading of transformer for increasing penetrations of EVs on all feeders
Figure 22: Thermal loading on each phase of mains cable connecting the transformer to the feeder for increasing EV penetration levels
The interdependence of the voltages between the phases is an important effect to be quantified. Since the household loads for this network are connected to individual phases, the addition of EV load to a particular customer point of connection (CPOC) affects the voltage at that particular CPOC as well as the voltages at CPOCs connected to the other phases of the network. EVs were added incrementally, as before, but only to those houses connected to phase A. Voltage levels were recorded at each of the points of interest

44
in the network. It should be noted that such a scenario is highly unlikely to occur in reality. If such a scenario were to arise, the network would be reconfigured in order to spread the load as evenly as possible across the phases. These results are therefore shown as an indicator of the extent to which excessive loading of one phase in a network can affect the other phases.
Figure 23 compares each of the phase voltages with increasing penetration of EVs at a CPOC on network. Voltage levels are only shown for penetrations up to, and including, 50% as the load flow calculations fail to converge for higher levels. While phase A experiences a much greater voltage drop than in the previous tests, phases B and C experience a voltage rise. This effect is most likely attributable to the sharing of a common neutral conductor by each of the phases.
Figure 23: Single-phase voltages at a CPOC for increasing levels of EV penetration applied to phase A only with households modelled as constant power loads
In order to investigate the importance of residential load modelling, the test was performed again with household loads modelled as constant impedances. Figure 24 shows a comparison of the voltages of the 3 phases at the selected CPOC for varying EV penetration levels. There is a similar impact on the voltage levels, as in the previous test, although the scale of the effect is not as great. For the case where the households are modeled as constant power loads, the lower allowable voltage limit is exceeded at a penetration level of approximately 13% (Figure 23), whereas for the case with constant impedance loads the equivalent penetration level is approximately 25%. It can also be seen that the voltage rise experienced on the remaining phases is not as severe in the constant impedance case as it is in the constant power case. This suggests that the load composition is a significant factor in determining acceptable EV penetration levels and that consideration of the general load composition should form part of any EV network study.

45
Figure 24: Single-phase voltages at a CPOC for increasing levels of EV penetration applied to phase A only with households modelled as constant impedance loads
A stochastic analysis technique was developed to incorporate certain unknowns inherent with EV charging on LV networks. The method used predefined probability distribution functions (PDFs) to determine both the behaviour of the residential load on the network and the EV load. The PDFs were based on real data obtained from the EV field trials.
The stochastic impact analysis investigated 3 different EV charging scenarios. Firstly, an EV penetration level of 10% was investigated. The second EV charging scenario examined the potential impact of a 50% EV penetration on the operating conditions of the test network. The third EV charging scenario also investigated the network impact for a 50% EV penetration with the addition of a time-of-use restriction in place.
Simulated voltage levels were recorded at each CPOC on the network throughout the network impact analyses. Each of the figures shown in this section show the resulting voltage levels recorded at one particular CPOC located at the remote end of the test feeder.
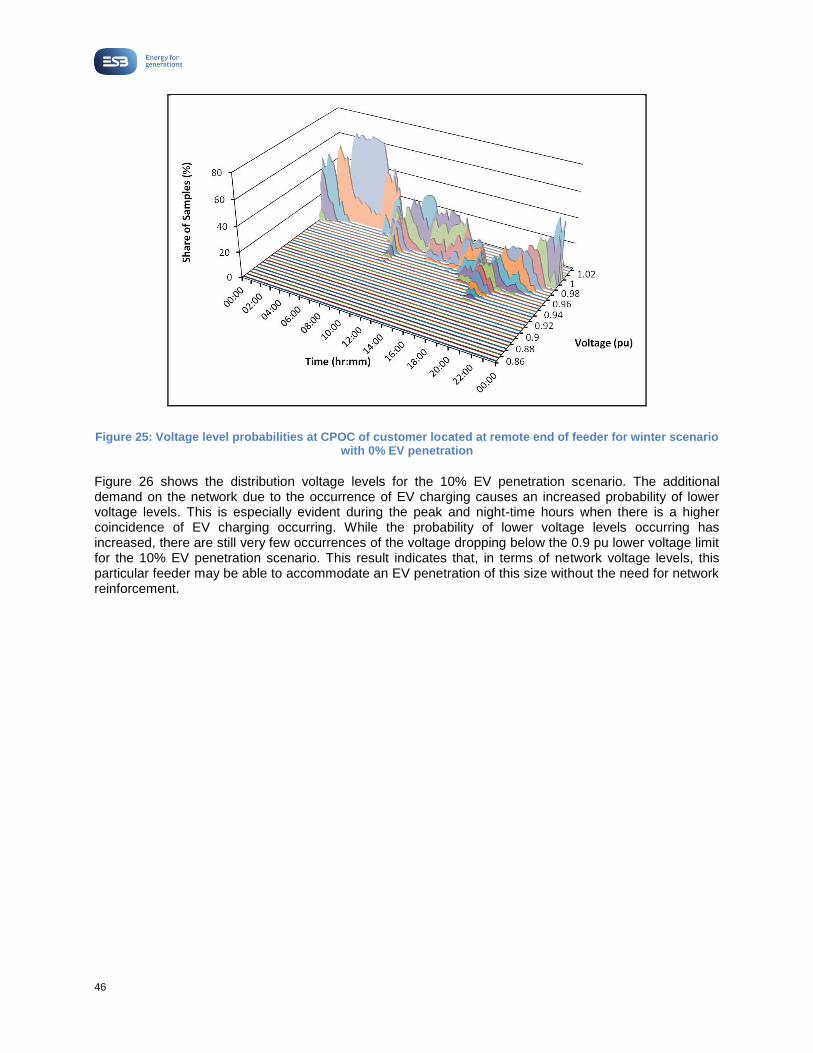
Figure 25 shows the voltage level distribution over a 24-hour winter weekday period at the connection point of the customer for the base case scenario with 0% EV penetration. It is evident from the graph that the voltage level at this connection point during the peak demand period reached as low as 0.92 pu. Outside of this period, voltage measurements remained well above the lower limit of 0.9 pu.
46
Figure 25: Voltage level probabilities at CPOC of customer located at remote end of feeder for winter scenario with 0% EV penetration
Figure 26 shows the distribution voltage levels for the 10% EV penetration scenario. The additional demand on the network due to the occurrence of EV charging causes an increased probability of lower voltage levels. This is especially evident during the peak and night-time hours when there is a higher coincidence of EV charging occurring. While the probability of lower voltage levels occurring has increased, there are still very few occurrences of the voltage dropping below the 0.9 pu lower voltage limit for the 10% EV penetration scenario. This result indicates that, in terms of network voltage levels, this particular feeder may be able to accommodate an EV penetration of this size without the need for network reinforcement.

47
Figure 26: Voltage level probabilities at CPOC of customer located at remote end of feeder for winter scenario with 10% EV penetration
Figure 27 shows the distribution of 24-hour voltage levels for the 50% EV penetration scenario. The graph shows that coincident charging of the EVs results in the probable voltage level at this particular customer's CPOC falling close to the lower acceptable limit during the peak demand period and remains so until midnight. There is also a significant increase in the number of occurrences where the voltage level is below the 0.9 pu limit, mainly occurring during the peak demand hours.
Figure 27: Voltage level probabilities at CPOC of customer located at remote end of feeder for winter scenario with 50% EV penetration

48
Figure 28 shows the resulting distribution of voltage levels for the 50% EV penetration scenario with time-of-connection restrictions in place. While the restriction on EV connections during peak hours has reduced the likelihood of this particular customer experiencing voltage levels below the acceptable limit during the peak demand period, it has increased the likelihood of the voltage being below 0.9 pu later in the 24-hour period.
Figure 28: Voltage level probabilities at CPOC of customer located at remote end of feeder for winter scenario with 50% EV penetration subject to time-of-connection restrictions
Both Figure 27 and Figure 28 have demonstrated that in the extreme scenario of 50% EV penetration, it may be necessary for the network operator to take some form action to ensure that each customer receives adequate power quality.
The total apparent power supplied to the feeder was also recorded during the simulations. Figure 29 shows the probability distribution for total power delivered to the feeder during a 24-hour period for the winter scenario with no EV charging present. From the graph, the highest demand on the feeder is most likely to occur during the peak demand hours, between 5 pm and 7 pm. The highest feeder demand recorded during the simulations was approximately 80 kVA.

49
Figure 29: Probability distribution for total apparent power supplied to feeder for winter scenario with 0% EV penetration
The distribution for total apparent power demand for the 10% EV penetration scenario in winter is shown in Figure 30. It is evident from the graph that the presence of EV charging has caused an increase in the total power delivered to the feeder, mainly between the hours of 5 pm and 3 am. The highest recorded demand during the 10% EV penetration simulation was found to be approximately 90 kVA which is a 12.5% increase when compared to the base case scenario with no EV charging present. Given that the transformer supplying the test feeder has a rating of 400 kVA, it should be able to supply the required demand on this feeder with an EV penetration of 10% together with the 3 other feeders, assuming each of the feeders has a similar load demand.

50
Figure 30: Probability distribution for total apparent power supplied to feeder for winter scenario with 10% EV penetration
Figure 31 shows the distribution of total power delivered to the feeder over a 24-hour period for the 50% EV penetration scenario during winter. It is clear that the addition of EV charging has caused a significant increase in the probability of high demand occurring on the feeder. The probability distribution of demand on the feeder during the night-time hours (8 pm-1 am) is now very similar to that of the traditional peak demand hours (5 pm-7 pm) due to the high levels of coincident EV charging during these hours. The highest demand recorded on the feeder throughout the simulation was found to be approximately 145 kVA. If similar loading profiles were present on the other feeders, it is clear that the existing 400 kVA would not be sufficient to supply the network. In order to prevent the network from exceeding its rated capacity it would be necessary for the existing network infrastructure to be upgraded or for some form of controlled charging to be utilised in order to shift load to later times during the night-time hours.

51
Figure 31: Probability distribution for total apparent power supplied to feeder for winter scenario with 50% EV penetration
In order to prevent EVs from connecting during the traditional peak demand period (5 pm-7 pm), the time-of-connection restriction is applied to the 50% EV penetration scenario simulations. Figure 32 shows the resulting loading level distribution on the feeder over a 24-hour period. While the connection restriction has the positive effect of reducing the load significantly during the peak demand hours, it also has the effect of potentially creating another peak a few hours after the restricted time period. As a result, potential loading levels of approximately 150 kVA may still occur which would lead to similar issues as those that were described for the 50% EV penetration scenario without the time-of-connection restriction. Simply restricting charging during the traditional peak demand period may not be a sufficient means for mitigating potential negative impacts from EV charging on network operation.

52
Figure 32: Probability distribution for total apparent power supplied to feeder for winter scenario with 50% EV penetration subject to time-of-connection restrictions
It should be noted that the original configuration of this feeder give different results in terms of voltage levels at the end of the feeder, and thermal loading of the transformer when compared to the reconfigured network as is shown above in Figure 20 and Figure 21 respectively. These differences can be seen in Figure 33 and Figure 34.
Figure 33: Voltage level with increasing EV penetration under two network configurations

53
Figure 34: Thermal loading of transformer with increasing EV penetration under two network configurations
The addition of 20 households to the feeder along with the accompanying EV load is shown to cause the transformer loading to be exceeded at an EV penetration of 30% compared to 60% for the original 54 house configuration.
The results of the radial and parallel load flow analysis were used to determine the variation in voltage along the feeders. This was done when both feeders were supporting the same level of EV penetration. Next the maximum diversified load was applied across both feeders in turn, where one feeder was allocated with 100% load and the adjacent feeder allocated with the After Diversity Maximum Demand per household. The change in variation in voltage along the test network was recorded.
Figure 35 shows the voltage recorded from each mini-pillar on feeders A and B during two loading scenarios. The upper dots in blue and pink represent the voltage of each mini-pillar with 0% penetration. The green dots represent the voltage of the mini-pillar when the NO point is closed.

54
Figure 35: Voltage of Mini-Pillars on Feeders A & B
In both cases it is seen that when the NO point is closed the voltage on one feeder rises and on the other drops, with the resulting voltage profile being at an intermediate level between those arising from radial feeding.
3 Rural Network
3.1 Introduction
Given the vast extent of rural networks in Ireland it was important to determine the effect of connecting EVs on the voltage and load on this form of network. In 2015, ESB Networks established a field trial where 3 EVs were deployed on a section of low voltage (230V) network in a rural area of Limerick. At the time of writing this report the trial was ongoing. Data collection meters were placed at the charging point of each EV in order to record information about EV charging characteristics independently of the EV user’s residential load. Smart meters will be deployed to record the voltage levels in each participant’s home. The demonstration consists of four stages:
No EVs connected
EVs deployed but charging restricted
EVs deployed with unrestricted charging
Intelligent charging
These stages will give a clear indication of the different charging patterns that may arise and the impacts that they have on the network. The first stage involves capturing the base case data so as to provide a means to quantify the impact of the EVs on the rural network. The unrestricted charging scenario will indicate the typical charging patterns and behavior of rural based EV users, while the restricted charging will be used to ensure the EVs are not charged at peak system demand times. Intelligent charging will be utilized to examine its capabilities in resolving potential network congestion.

55
3.2 Analysis and Results
At the time of writing this report the trial was still in its infancy therefore the results were not known.
4 Analysis of Other Research Studies
A number of organizations have completed similar studies into the effects on the network of EV charging.
In UK Power Networks’ study Impact of Electric Vehicle and Heat Pump loads on network demand profiles they identified that the most significant impact is on the LV network. The study noted that “as EV uptake rises, there is an increase in the number of voltage violations with the additional EV load. However, it is anticipated that the majority of these will be fixed through local LV reconfiguration works, with only a handful of events triggering any investment works. Of the investment-triggering events, these would have occurred due to the background load growth and will need to be brought forward by 1 to 2 years due to the additional EV load.” They also showed that “EV charging may cause a high harmonic current to flow on the network”.
Report available here:
http://innovation.ukpowernetworks.co.uk/innovation/en/Projects/tier-2-projects/Low-Carbon-London-(LCL)/
In the MIT Study on the Future of the Electric Grid it noted that “the degree to which EVs pose a stress to the power grid depends on their local penetration rate, as well as the power and time at which they charge. If regulators and utilities appropriately influence charging so that it mostly does not coincide with the system peak demand, EVs will improve system load factor and will not cause unmanageable disruption to the bulk generation and transmission system. Otherwise, integrating these loads will require more investment in equipment.”
Report available here:
https://mitei.mit.edu/system/files/Electric_Grid_5_Impact_Distributed_Generation_Electric_Vehicles.pdf
The Electric Power Research Institute (EPRI) completed a multiyear collaborative project to identify and gauge near-term impacts from EV charging. Key findings from this project include:
Feeder impacts from residential charging of EVs are likely to first appear as either low service
voltages or service transformer overloads.
The average energy delivered to a midsize sedan is expected to between 5-8 kWh.
Most dominant EV characteristic influencing asset overload from EV adoption is charge levels.
Report available here:
http://www.epri.com/abstracts/Pages/ProductAbstract.aspx?ProductId=000000000001024101

56
5 Conclusion
The analysis and modelling of the urban field trial has revealed a number of points of interest. The trial measurements provide high quality data at points on the network that generally have little or no data recording capability. The developing picture that this data forms is an important element in planning for the integration of EVs in the residential environment. The data highlights that even within a ten minute period there can be a significant variation in demand. In particular, the average loading or voltage recorded within a ten minute period may indicate that it is comfortably within standard, but there may be short term loading spikes which push the voltages below the lower limit for a short time, albeit still within the supply quality standards set out in EN50160. The stochastic scenario method for the assessment of network impacts provides a valuable tool for the usage of the field trial data and provides a clear picture of likely network impacts under a range of electric vehicle penetrations. The urban field trial showed that the existing feeder is capable of supporting penetrations up to 30% with end of line voltages likely to be the first limiting factor. The existing transformer was capable of supporting penetrations up to 60%.
A desktop study investigated the benefits of operating pairs of LV feeders in parallel. The benefits of operating in parallel include improved voltage regulation, additional capacity, and decreased losses. The results show that a higher penetration of EVs could be supported on the test network model with the NO point removed allowing the feeders to operate in parallel.

57
Work Package 1.5
Determine the effect that WP1.2 will have with the
incremental addition of EVs to the distribution
network

58
Table of Contents
1 Introduction ...........................................................................................................................59
2 WP 1.2 Findings ....................................................................................................................59
2.1 Home Charge Points ...............................................................................................................59
2.2 On-Street AC Charge Points ...................................................................................................59
2.3 Fast Charge Points .................................................................................................................59
3 Impact on the Network..........................................................................................................60
3.1 Home Charge Points ...............................................................................................................60
3.2 On-Street AC Charge Points ...................................................................................................61
3.3 Fast Charge Points - Bunching ...............................................................................................61
4 Conclusion .............................................................................................................................62
5 Acknowledgements ..............................................................................................................62

59
1 Introduction
The purpose of work package 1.5 is to determine the effect that the outcome of work package 1.2 will have with the incremental penetration of electric vehicles (EVs) to the distribution network. Work package 1.2 describes the home, on-street and fast charge points specified and installed in Ireland’s electric vehicle charge point infrastructure. This report firstly describes the relevant findings in work package 1.2, it then analyses the impact on the distribution network and the final section concludes.
2 WP 1.2 Findings
2.1 Home Charge Points
The maximum rating of the home charge points is specified as 3-phase 32A (22kW), in reality most manufacturers of home charge points offer either 16A or 32A single phase only. The vast majority of home charge points installed in Ireland up to March 2015 have been 16A single phase and this is the current ESB standard.
2.2 On-Street AC Charge Points
The technical specifications for On-Street AC Charge Points include the following variations:
c) Ground/surface mounted charging stations with two-outlet, 3-phase, 32A per phase (44kVA total
charging station output with both outlets at full supply).
d) Wall mounted charging stations with two-outlet, 3-phase, 32A per phase (44kVA total charging
station output with both outlets at full supply).
2.3 Fast Charge Points
The technical specifications for fast charging stations are specified below. The fast charging stations shall consist of a single unit with 3 outlets.
Outlet Number Outlet Type Power Rating
1 IEC 62196-2 Type 2 44kW AC
2 CHAdeMO 50kW DC
3 CCS 50kW DC
Table 7 - Fast Charging Station Specification
The fast charging stations connected to an incoming 3-phase supply shall be capable of supplying full power output (3-phase AC and/or DC) charging to one or two EVs simultaneously while maintaining all safety and metrological accuracy standards. For the case of a combined AC & DC fast charging session, both outlets shall be able to operate simultaneously. The maximum output of the fast charging station with both outlets operating simultaneously shall be at least 80kW. The fast charging station shall have configuration options to (i) only allow one outlet (DC or AC) to be used at a given time, and (ii) limit total power drawn to a configurable maximum value (e.g. 60kW).

60
3 Impact on the Network
All of the charge points specified in work package 1.2 are connected to the low voltage (LV) network. A recent study by UK Power Networks states that the most significant impact of EVs will be on the LV network. The nature of LV networks is one of individual demand profiles that do not always have the benefit of aggregation that analysis of higher voltage networks benefit from. The rated capacities of transformers on this network can range from 15kVA to 1000kVA. The main effects that increasing levels of EV charging may have on the network are reductions in power quality, breaches of the capacity of network components and harmonic issues.
3.1 Home Charge Points
The home charge points that have been installed to date are rated at 16A single phase. This means that each home charge point has the potential to add 3.7kW of load to the network. One of the trials undertaken by ESB to measure the impact of EVs on the network has shown that the ability of the network to accommodate EV’s depends on the degree of clustering and where on the networks such clusters occur. If there is a large group of EVs close to the substation, voltage drop is not normally an issue, however, if at a remote end from the substation it can be an issue. The urban field trial showed that the existing feeder is capable of supporting penetrations up to 30% with end of line voltages likely to be the first limiting factor. The existing transformer was capable of supporting penetrations up to 60%. Approximately half of rural transformers have only 1-2 customers – each of which could accommodate 2 home chargers. The heavier loaded rural transformers would likely need a group split to ensure voltage levels remain within the required standard and network components aren’t overloaded.
One possible impact that is not seen in the public chargers is phase imbalance caused by home chargers, as these are fed from a single phase. ESB developed a model of the network where the urban field trial took place. This was used to simulate the effects of phase imbalance on the distribution network. Currently home chargers are connected using the phase that is already feeding the home, therefore, where clustering occurs, there is a risk of connecting all home chargers to the one phase of the LV feeder. The simulations show that phase imbalance can exacerbate the effects of EV charging. Figure 36 shows the results of the modelling for two scenarios – 4 EVs connected (left) and 5 EVs connected (right) to the feeder.
Figure 36 - Voltage impact as a result of 4 EVs (left) and 5 EVs (right)

61
The image on the left has the following connection configuration – 1 EV connected to R phase, 2 EVs connected to S phase, and 1 EV connected to T phase. The image on the right has the following connection configuration - 1 EV connected to R phase, 2 EVs connected to S phase, and 2 EVs connected to T phase. The darkness of the blue gives an indication of the effect of the end of line voltage seen in each house. It is clear that the voltage in the homes improves slightly with an additional EV connected to the T phase. If large clusters of EVs begin to appear it will be important to determine the phases each home charger is connected to and ensure that they are balanced as evenly as possible across the three phases of the feeder.
A more comprehensive discussion of the effects of home charging is given in work package 1.4.
3.2 On-Street AC Charge Points
The rollout of the on-street AC charge points have seen approximately 700 points installed in cities, towns and villages around the country. The usage of these charge points varies throughout the country. Currently, there is no cost to use public chargers so the future consumption patterns observed may vary when a tariff is introduced. There is anecdotal evidence which indicates that some users only charge on public chargers, however a number of studies indicate that the majority of charging will be done in homes. The UK Power Network study involved a trial which saw 84% of charging occurring at home with the remaining 16% using the public chargers – some outliers existed which showed that a small number of users were heavily reliant on the public chargers.
The on-street AC chargers are typically connected to the existing LV cables running underneath the pathway. As seen in the home charger trials a large increase in load far from the unit sub can cause power quality issues – particularly the voltage levels dropping outside the required standards. This would be the case too for on-street AC chargers. Similarly, the additional loading may overload some of the network components. To date, the on-street AC chargers installed did not cause any network reinforcements – there was adequate capacity on each of the existing unit-substations to cater for this additional load. If in the future there is a need for clusters of on-street AC charge points, the necessary supply load will be accounted for in the design stage – ensuring adequate capacity.
A study carried out by ESB into the electrical characteristics of fast chargers which is described below did not consider on-street AC chargers. However, a similar study completed by UK Power Networks focused on AC charging rather than fast chargers. The study included an assessment of the impact of EV charging on power quality – with a focus on harmonics. The study showed that EV charging may cause a high harmonic current to flow on the network with the 3rd order harmonic making the greatest contribution, and that output harmonic current increases with phase current. The results suggest that the location of the EV charging effects the harmonic current produced from EV charging. The study found little evidence to suggest that the charging of EVs had an impact on the harmonic voltage.
3.3 Fast Charge Points - Bunching
The current fleet of 71 fast charge points are installed at service stations and other prime locations at approximately every 60km on Ireland’s main intercity routes. Typically service stations have designated unit-substations with capacity for additional load, which if necessary, can be upgraded if further EV charging capacity is required.
ESB completed testing on the fast chargers to determine the electrical characteristics. Power quality measurements were taken from four types of fast chargers which are installed around the country. While this study is described in more detail in work package 1.6 it was beneficial to include some of the relevant findings here. Firstly, unlike the on-street AC charger point’s charging cycle, the real power does not remain constant for the majority of the fast charger point’s charging cycle. The results show that full power demand for the fast charge points is only present for a small amount of time. The testing highlighted the reactive power consumption of fast chargers. The magnitudes of the reactive power measurements were large and have a significant impact on the power factor of the devices. Finally, the current harmonic

62
distortion for three of the four fast chargers tested are high. Such large current harmonics can have a significant impact on distribution systems assets such as premature aging of cables and transformers and may require over-sizing of neutral conductors. Theses results are similar to those seen above in the summary of the studies on AC public chargers undertaken in the UK.
Alternative solutions which negate the need for network reinforcement are available. To facilitate installations where the feeding network cannot support two full rate charging sessions (e.g. a limit of 60kW for example) the fast charging station should implement a logical interlock (hardware and/or software) that can be enabled locally and/or remotely via command, to either prevent the initiation of a second charging session when one is already in progress (with suitable user notification), or, will clearly communicate to the user that the second session will not start, or will proceed at a “restricted/trickle” rate only, until the pre-existing session has terminated, or entered a final low power “top-off” stage.
4 Conclusion
The field trials undertaken by ESB and investigation of research and field trials in the UK suggest that a high level of EV penetration will have significant impact on the distribution network. All studies suggest that the most significant impact of EVs will be on the LV network. Analysis completed by UK Power Networks suggest that EV load growth is seen to have a minor impact on the overall network peak load but will impact the network at LV feeder level. As the number of EVs on the road rises, there will be an increase in the number of voltage violations with the additional EV load, especially if these EVs are in clusters.
With several studies suggesting that home charging will be the main form of charging used – particular attention will have to be made to ensure the effects of home chargers are limited as EV uptake begins to rise. ESB simulated and verified that phase imbalance, which is a local issue, may be troublesome when large levels of EVs are charging on a single feeder.
The conclusions from the testing completed by ESB and the studies by UK Power Networks on public chargers suggest that EV charging could result in significant levels of harmonic current. In terms of voltage, the feeder voltage constraint is likely to be reached before the harmonic voltage distortion becomes an issue.
5 Acknowledgements
The author would like to acknowledge the use of reports published by UK Power Networks relating to the Low Carbon London project which have been referred to in this report. The following reports were referenced:
Impact of Electric Vehicle and Heat Pump loads on network demand profiles
Impact of low voltage connected low carbon technologies on power quality
Impact and opportunities for wide-scale Electric Vehicle deployment
These reports are available at:
http://innovation.ukpowernetworks.co.uk/innovation/en/Projects/tier-2-projects/Low-Carbon-London-(LCL)/

63
Work Package 1.6
Measure the Electrical Characteristics of EVs
and Charge Points

64
Table of Contents
1 Introduction ...........................................................................................................................65
2 Measured Parameters ...........................................................................................................65
2.1 Test Setup ...............................................................................................................................66
2.2 EVs and Charge Point Characteristics ....................................................................................67
2.2.1 EV Characteristics ...................................................................................................................67 2.2.2 Charge Point Characteristics ..................................................................................................68
3 Results ...................................................................................................................................69
3.1 EV Testing ...............................................................................................................................69
3.1.1 Voltage ....................................................................................................................................69 3.1.2 Current ....................................................................................................................................70 3.1.3 Real Power ..............................................................................................................................70 3.1.4 Reactive Power .......................................................................................................................71 3.1.5 Power Factor ...........................................................................................................................71 3.1.6 Frequency ...............................................................................................................................72 3.1.7 Voltage THD % .......................................................................................................................72 3.1.8 Voltage Harmonic Distortion ...................................................................................................73 3.1.9 Current THD % ........................................................................................................................73 3.1.10 Current Harmonic Distortion....................................................................................................74 3.1.11 High Frequency Harmonics ....................................................................................................74 3.1.12 Flicker ......................................................................................................................................76 3.1.13 Voltage Imbalance ..................................................................................................................76
3.2 Fast Charge Point Testing ......................................................................................................77
3.2.1 ABB Fast Charge Point ...........................................................................................................78 3.2.2 Aerovironment Fast Charge Point ...........................................................................................85 3.2.3 DBT Fast Charge Point ...........................................................................................................92 3.2.4 Efacec Fast Charge Point .......................................................................................................98
4 Conclusions for Fast Charge Point Testing .....................................................................105

65
1 Introduction
In this chapter the electrical characteristics of EVs and charge points are quantified. This work was realised by completing a suite of power quality measurements. The EVs investigated are those which are available in the Irish market as of April 2015 and are readily available to the authors in the timeframe involved. The charge points investigated are those which are deemed relevant for investigation and which are installed as part of the Irish EV charge point infrastructure.
The home and public AC charge points are not considered relevant and are not investigated in this chapter as there is no AC to DC conversion taking place within the charge point. From an electrical characteristic standpoint, these charge points represent a simple AC power source or socket. The effect that these charge points have on the system is quantified by the EV testing contained in this chapter. The AC charge points are in contrast to the DC fast charge points where the AC to DC conversion takes place inside the charge point and DC power is made available to the EV, via certain standard protocols (CHAdeMO / CCS).
This chapter represents a presentation of the results of the power quality measurement suite. It is not an analysis of the impact that the results may have on electric systems however where it is deemed appropriate unique aspects of the power quality of the EVs and charge points are discussed.
2 Measured Parameters
Table 8 shows the parameters measured as part of the power quality measurements.
Parameter Unit Sampling Frequency
Voltage volts 6 seconds
Current amps 6 seconds
Frequency hertz 1 minute
Real Power watts 6 seconds
Reactive Power vars 6 seconds
Power Factor N/A 6 seconds
Voltage Harmonics %THD 1 minute
Current Harmonics %THD 1 minute
Flicker, Pst N/A 1 minute
Very High Frequency Current Harmonics N/A single snapshots @ 5kHz / 25kHz
Voltage Imbalance (for 3 ϕ) % 6 seconds
Table 8 - Measured Parameters

66
2.1 Test Setup
Figure 37 shows the power quality measurement setup for a typical EV test. The labelled items are as follows; 1) home charge point, 2) laptop for real-time display, 3) power quality analyser for data capture, 4) cable break-out box, 5) multi-meter for control pilot measurement, 6) oscilloscope for high frequency harmonics, 7) connector and EV inlet.
The power quality analyser used was a UniPower 902. The oscilloscope used was a Tektronix TDS2000C digital oscilloscope. The break-out box was a bespoke unit manufactured by JTM.
Figure 37 - Power Quality Measurement Setup for EV Testing

67
2.2 EVs and Charge Point Characteristics
2.2.1 EV Characteristics
Table 9 shows the characteristics of the EVs that were subject to testing and Figure 38 shows each EV undergoing testing.
Vehicle Vehicle Type
Battery Size (kWh)
AC Charging Rate (amps)
Fast Charge Type
BMW i3 BEV 22 32 / 1ϕ CCS
Mitsubishi iMiev (pre-production) BEV 16 12 / 1ϕ CHAdeMO
Mitsubishi Outlander PHEV 12 16 / 1ϕ CHAdeMO
Nissan Leaf (16A) BEV 24 16 / 1ϕ CHAdeMO
Nissan Leaf (32A) BEV 24 32 / 1ϕ CHAdeMO
Table 9 - EV Characteristics
Figure 38 - EV Testing
The EVs tested had their battery packs drained as much as practically possible (typically below 10% state of charge (SOC)) before the testing began and the testing lasted until the EVs automatically terminated the charging process (typically at 100% SOC). The mode 3 vehicle inlet (whether J1772 or Type 2) was used for all EV testing. All EV testing occurred in ESB’s head office in Fitzwilliam Street, Dublin 2.
Specific EVs that were not tested due to their non-availability or EVs that have only recently become available on the Irish market include the Nissan eNV200, Renault Fluence ZE, Renault Zoe, Renault Kangoo ZE, Tesla Model S and Volkswagen eGolf. It is anticipated that as these vehicles become available further measurements shall be undertaken in order to have a full classification of the power quality of all EVs in Ireland.

68
2.2.2 Charge Point Characteristics
Table 10 shows connector types of the fast charge points installed in Ireland. The cells highlighted were subject to testing. Fast AC and CCS fast charge point testing did not occur due to the non-availability of a suitable EV in the timeframe. As per above it is anticipated that as these vehicles become available further testing will take place. The fast charge points were tested again by draining the EV battery packs to typically below 10% SOC and allowing the charging session to end as per fast charge point parameters (typically when battery SOCs are at approximately 90%). Testing occurred off-site at the nearest available fast charge point location in Ireland.
Manufacturer Connector Types
CHAdeMO CCS Fast AC
Aervironment
ABB Version 1
DBT Version 1
DBT Version 2
DBT Version 3
Efacec
SGTE Version 1
SGTE Version 2
Table 10 – Fast Charge Point Characteristics

69
3 Results
3.1 EV Testing
Each of the graphs presented in Section 3.1 – EV Testing show the measured parameter for all 5 EVs so that a parameter comparison between EVs can be readily made.
3.1.1 Voltage
Figure 39 shows the measured voltage in volts. As can be seen the voltage does not deviate to a large degree and stays within the ±10% limits.
Figure 39 – Voltage

70
3.1.2 Current
Figure 40 shows the measured current in amps. As can be seen the current remains constant for the majority of the charge cycle. Both Mitsubishi vehicles have periods during the charge cycle where the current drops to a low level for a period of time before resuming its constant level. Towards the end of the charging cycle, each EV drops the current steadily.
Figure 40 – Current
3.1.3 Real Power
Figure 41 shows the measured real power in watts.
Figure 41 - Real Power

71
3.1.4 Reactive Power
Figure 42 shows the measured reactive power in vars. It is noted that all EVs excluding the BMW i3 show negative reactive power. The charging cycle on the BMW i3 is to be further analysed to determine whether this behaviour is typical or as a result of measurement error.
Figure 42 - Reactive Power
3.1.5 Power Factor
Figure 43 shows the measured power factor. In general the power factor for all EVs remains above 0.95 during most of the charge cycle. The sections on the graphs where the power factor drops below 0.9 can be ignored as these represent times when the current was very low (i.e. the charging cycle had temporarily paused or was finished completely). It is noted that the Nissan Leaf (32A) power factor varies significantly and drops to low levels for a significant period of time at the towards the end of the charging cycle.
Figure 43 - Power Factor

72
3.1.6 Frequency
Figure 44 shows the measured frequency.
Figure 44 - Frequency
3.1.7 Voltage THD %
Figure 45 shows the measured voltage total harmonic distortion as a percentage of the fundamental. The values do not show a significant increase from measured background voltage THD.
Figure 45 - Voltage THD %

73
3.1.8 Voltage Harmonic Distortion
Figure 46 shows the measured voltage harmonic distortion by order as a percentage of the fundamental.
Figure 46 - Voltage Harmonic Distortion
3.1.9 Current THD %
Figure 47 shows the current total harmonic distortion as a percentage of the fundamental. Periods where the charge session has paused show high levels of current THD however these periods have very low levels of fundamental current and hence can be ignored. It is noted that in each EV the current THD increases significantly as the EV approaches the end of the charge cycle. It is observed that during steady state charging conditions the current THD may not be considered overly high (circa 5-10%). Towards the end of each charging process however the current THD increases significantly (although during this period the fundamental current is decreasing significantly).
Figure 47 - Current THD %

74
3.1.10 Current Harmonic Distortion
Figure 48 shows the measured current harmonic distortion by order as a percentage of the fundamental.
Figure 48 - Current Harmonic Distortion
3.1.11 High Frequency Harmonics
Figure 49 shows the measured high frequency harmonics. These measurements were taken in order to attempt to identify the switching frequency of the EV converter. The switching frequencies identified are shown in Table 11.
Vehicle Switching Frequency
BMW i3 50kHz
Mitsubishi iMiev 30kHz
Mitsubishi Outlander 50kHz
Nissan Leaf (16A) 27kHz
Nissan Leaf (32A) To be completed.
Table 11 - Switching Frequencies

75
Figure 49 - High Frequency Harmonics

76
3.1.12 Flicker
Figure 50 shows the measured short term flicker (Pst).
Figure 50 – Flicker
3.1.13 Voltage Imbalance
As all the EV testing was completed on single phase loads, no voltage imbalance was measured.

77
3.2 Fast Charge Point Testing
Four fast charge points were tested; 1) ABB, 2) Aerovironment, 3) DBT and 4) Efacec. In each case power quality equipment was connected to the local interface pillar. The test setup shown in Figure 51 is equivalent to that shown in Figure 37, with the only difference being the use of Rogowski coils for current measurement (due to the large current draw of fast charge points) as opposed to the current clamps used for the EV testing.
Figure 51 - Power Quality Measurement Setup for Fast Charge Point Testing
Unlike the EV Testing graphs, the results for each of the fast charge points are presented separately in this section. This is due to the fact that the fast charge points are measured using three phases and if presented together, too much data would be represented on the graph so as to make it illegible.
Comments are not made on the individual graphs but rather a conclusion is included after all fast charge point parameters are presented.

78
3.2.1 ABB Fast Charge Point
Table 12 shows the starting parameters for the ABB fast charge point test and Figure 52 shows a photograph of the test setup.
Test Location Texaco, Ballinalack, County Westmeath
Test Date 13/05/2015
Test Vehicle Nissan Leaf (11 D 34177)
Charge Point Type ABB Terra 51 (CHAdeMO)
Charge Start Time 10:53
Charge Stop Time 11:41
Background Harmonics 1.76% Voltage THD
Background Flicker Pst (phase 1) 0.152, Pst (phase 2) 0.155, Pst (phase 3) 0.170
Table 12 - Starting Parameters for ABB Fast Charge Point Test
Figure 52 - Photograph of ABB Fast Charge Point Test
The figures below shows the relevant parameters measured during the test.

79
Figure 53 - Voltage
Figure 54 - Current
Figure 55 - Real Power

80
Figure 56 - Reactive Power
Figure 57 - Power Factor
Figure 58 - Voltage THD

81
Figure 59 - Voltage Harmonic Distortion
Figure 60 - Current THD

82
Figure 61 - Current Harmonic Distortion
Figure 62 - Flicker

83
Figure 63 - Voltage Unbalance
Figure 64 - High Frequency Current Harmonics at 5 kHz Sampling

84
Figure 65 - High Frequency Current Harmonics at 25 kHz Sampling

85
3.2.2 Aerovironment Fast Charge Point
Table 13 shows the starting parameters for the Aerovironment fast charge point test and Figure 66 shows a photograph of the test setup.
Test Location Maxol Riverside Service Station, Navan, County Meath
Test Date 12/05/15
Test Vehicle Nissan Leaf (11 D 34177)
Charge Point Type Aerovironment (CHAdeMO)
Charge Start Time 09:39
Charge Stop Time 10:21
Background Harmonics 1.89% Voltage THD
Background Flicker Pst (phase 1) 0.204, Pst (phase 2) 0.193, Pst (phase 3) 0.251
Table 13 - Starting Parameters for Aerovironment Fast Charge Point Test
Figure 66 - Photograph of Aerovironment Fast Charge Point Test
The figures below shows the relevant parameters measured during the test.

86
Figure 67 - Voltage
Figure 68 - Current
Figure 69 - Real Power

87
Figure 70 - Reactive Power
Figure 71 - Power Factor
Figure 72 - Voltage THD

88
Figure 73 - Voltage Harmonic Distortion
Figure 74 - Current THD

89
Figure 75 - Current Harmonic Distortion
Figure 76 - Flicker

90
Figure 77 - Voltage Unbalance
Figure 78 - High Frequency Current Harmonics at 5 kHz Sampling

91
Figure 79 - High Frequency Current Harmonics at 25 kHz Sampling

92
3.2.3 DBT Fast Charge Point
Table 14 shows the starting parameters for the DBT fast charge point test and Figure 80 shows a photograph of the test setup.
Test Location Applegreen Service Station, M1 Lusk Southbound
Test Date 23/04/13
Test Vehicle Nissan Leaf (11 D 34177)
Charge Point Type DBT (CHAdeMO)
Charge Start Time 15:13
Charge Stop Time 16:00
Background Harmonics 1.99% Voltage THD
Background Flicker Pst (phase 1) 0.16
Table 14 - Starting Parameters for DBT Fast Charge Point Test
Figure 80 - Photograph of DBT Fast Charge Point Test
The figures below shows the relevant parameters measured during the test.

93
Figure 81 - Voltage
Figure 82 - Current
Figure 83 - Real Power

94
Figure 84 - Reactive Power
Figure 85 - Power Factor
Figure 86 - Voltage THD

95
Figure 87 - Voltage Harmonic Distortion
Figure 88 - Current THD

96
Figure 89 - Current Harmonic Distortion
Figure 90 - Flicker

97
Figure 91 - Voltage Unbalance
Figure 92 - High Frequency Current Harmonics at 5 kHz Sampling

98
3.2.4 Efacec Fast Charge Point
Table 15 shows the starting parameters for the Efacec fast charge point test and Figure 93 shows a photograph of the test setup.
Test Location Tesco Bray, Co. Wicklow
Test Date 21/04/15
Test Vehicle Nissan Leaf (141 D 7543)
Charge Point Type Efacec (CHAdeMO connector)
Charge Start Time 16:15
Charge Stop Time 16:59
Background Harmonics 2.13% Voltage THD
Background Flicker Pst (phase 1) 0.485, Pst (phase 2) 0.484, Pst (phase 3) 0.472
Table 15 - Starting Parameters for Efacec Fast Charge Point Test
Figure 93 - Photograph of Efacec Fast Charge Point Test
The figures below shows the relevant parameters measured during the test.

99
Figure 94 – Voltage
Figure 95 – Current
Figure 96 - Real Power

100
Figure 97 - Reactive Power
Figure 98 - Power Factor
Figure 99 - Voltage THD

101
Figure 100 - Voltage Harmonic Distortion
Figure 101 - Current THD

102
Figure 102 - Current Harmonic Distortion
Figure 103 - Flicker

103
Figure 104 - Voltage Unbalance
Figure 105 - High Frequency Current Harmonics at 5 kHz Sampling

104
Figure 106 - High Frequency Current Harmonics at 25 kHz Sampling

105
4 Conclusions for Fast Charge Point Testing
Only the parameters that from observation of the results will have a significant effect on electricity systems are discussed in this conclusion. If the parameter is not discussed below then it can be assumed that the authors do not consider its behaviour of any significance.
The fast charge point testing results show that unlike the AC charging cycle, the real power does not remain constant for the majority of the charging cycle. It is well documented that charging batteries very quickly (with large input power) damages the battery and reduces its lifespan. The reduction in input power over the fast charging cycle demonstrates the EV battery management system communicating with the fast charge point (via the CHAdeMO protocol) to control the rate of charge. The measurements show that the full power demand for the fast charge points is only present for a small amount of time. Electricity system planners may decide to implement a factor of diversity when designing for fast charge point connections.
The reactive power consumption measured for the fast charge points raises a number of issues. Two of the fast charge points show a positive reactive power and two show a negative reactive power. Further investigation is required to determine why this is the case however it is noted that the architectural design of fast charge points can differ (i.e. pre-rectification transformer isolation as opposed to post-rectification high frequency isolation). The magnitudes of the reactive powers in both cases are large and have a significant effect on the power factor of the devices. In a domestic scenario, utilities may not bill customers for reactive power however for high power devices such as fast charge points the financial loss in only billing for real power (watts) may be significant.
The current harmonic distortion for the three of the four fast charge points tested is considered significantly high. These values of high current harmonic distortion may be deemed acceptable for low current devices (such as mobile phone chargers) however the fast charge points are high current devices. Such large current harmonics can have a significant impact on distribution system assets such as aging of cables and transformers and may require over-sizing of neutral conductors. Solutions to this problem may include further interaction with fast charge point suppliers regarding equipment design changes (architecturally or simply through the use of harmonic filters).

106
Work Package 1.7
Measure the degree of co-incident charging of
multiple vehicles on urban LV network

107
Table of Contents
1 Introduction ........................................................................................................................108
2 Results ................................................................................................................................108
3 Findings ..............................................................................................................................112

108
1 Introduction
In order to assess the potential impact of electric vehicles (EVs) on the Distribution network under a range of scenarios, ESB Networks organised a field trial in 2012 where a section of low voltage (400V) network in a suburb of Dublin was selected as the location for the EV field trial. The trial took place over a twelve month period with up to 7 EVs deployed on the feeder to model the effects of mass penetrations of EVs on urban distribution networks.
During the field trials, data collection meters were placed at the charging point of each EV in order to record information about electric vehicle charging characteristics independently of the EV user's residential load. Each meter recorded the active power demand at the EV charging point. From the recorded data it was possible to determine likely EV charging characteristics such as connection times and battery state of charge upon connection.
2 Results
Figure 107 shows a sample residential load curve over a day with and without EV charging. The effect of the vehicle charging is pronounced – the levels of demand seen when the EV is charging at night are similar to the evening peak experienced by this customer. This suggests the existing network is capable of accommodating the initial penetrations of EVs. However, if the EV is charged during the normal evening peak this could lead to network issues (excessive thermal loading or under voltage). Time-of-day pricing may lead to a high coincidence of EV charging, which could also lead to network issues at certain times of the day. From a network planning point of view it is important and prudent to have an approximate measure of the degree of coincident charging on the LV network.
Figure 107: Sample residential demand profile with and without electric vehicle charging
Figure 108 shows the distribution of recorded connection times for EV charging during the field trials. From this graph, it is evident that the majority of EV charging connections occurs after 16:00 each day with the highest probability of connection approximately occurring at 18:30 and again at 22:30.

109
Figure 108: Probability distribution function of EV connection times recorded during the field trials
Figure 108 provides information regarding the connection times for EV charging throughout the field trials. However, it does not provide information relating to the typical duration of the individual charging periods or the likelihood for the occurrence of coincident charging. Figure 109 shows the probability distribution function for the occurrence of EV charging on the network throughout a 24-hour period. While Figure 108 indicates a relatively high probability of connection for charging at approximately 18:30, Figure 109 shows that there is a relatively low occurrence of coincident charging at this time. Instead, there is a steady increase in the level of coincident charging from around this time up until between approximately 22:00 and 23:00 before decreasing steadily until approximately 4 am.
These results may indicate that while there are some occurrences of EVs being connected for charging upon arrival home from the workplace (assuming typical business hours), the duration of charging combined with some evening journeys result in the maximum coincident charging occurring between 22:00 and 23:00. From Figure 109 it is evident that the majority of EV charging occurs from 20:00 onwards reaching a peak at 23:00, which may indicate that EV users will typically do most of their charging following their last trip of each day.

110
Figure 109: Probability distribution function for the occurrence of EV charging over a 24-hour period
Figure 110 shows the distribution function of the recorded daily energy requirements of the EVs during the field trials. Each EV used in the trials had a battery capacity of 20 kWh. From Figure 110 it is evident that there are some cases when the total daily energy requirement exceeds the rated battery capacity. This indicates that there were a number of occurrences when an individual EV was connected for charging at least twice within one 24-hour period. The graph also shows that the most common daily EV energy requirement was between 8 kWh and 9 kWh, which is approximately half of the rated battery capacity of the EVs used in the trail. There were fewer occasions when the energy requirement was low (0 – 2 kWh) and very few of the samples occurred when the energy requirement was very large (> 16 kWh). A possible explanation for this may be that EV owners are reluctant to allow their EV battery to approach full depletion while also deciding not to charge if the battery charge status is above approximately 75%.

111
Figure 110: Probability distribution function for the daily EV energy requirement
In the case of time-of-use restrictions there is a potential for a sharp increase in EV related network load. The probability distribution function of connection times from the field trials (Figure 108) was modified to restrict EVs from connecting between 16:30 and 19.00 so as to avoid the peak demand period, which is typically between the hours of 17.00 and 19.00. Figure 111 highlights the extent of which the EV load could be impacted by time-of-use restrictions.
Figure 111: Probability distribution function of modified EV connection times due to time-of-use restrictions

112
3 Findings
The trial has given ESB Networks a valuable indication of the probability of the occurrence of coincident EV charging on our urban LV network. The section of network selected for the trail is a typical mature residential development in South Dublin fed exclusively through underground cables. The trial has demonstrated that the majority of EV charging in domestic premises is likely to occur in the evening from 16:00 onwards.
Conversely, the trial has also verified that very low amounts of EV charging take place between 04:00 and 10:00. The most common energy requirement of the EVs during the trial was 8 – 9 kWh. Based on the standard charging rate of 2.8 kW it would take approximately 3 – 4 hours to deliver this energy requirement. Given that this is a significant length of time there was a pre trial expectation of a high probability of coincidental charging in the evening / night time. The trial data confirmed that the maximum incidence of coincidental charging is likely to occur between 22:00 and 00:00.
In addition, the trail also showed that restrictions imposed by time-of-use pricing may lead to significantly higher levels of coincidental charging. This is not surprising given that a typical full battery charge takes between six and eight hours and that the majority of charging takes place after 16:00, therefore by removing a three hour charging opportunity, there is a significant increase in connections and EV related demand immediately after this period ends.

113
Work Package 1.8
Relative Use of Public Charging versus Home
Charging

114
Table of Contents
1 Introduction .........................................................................................................................115
2 Data Gathering ....................................................................................................................115
2.1 Public Charge Point Usage – Queuing Site ..........................................................................115
2.2 Public Charge Point Usage – Fast Charging Sample Sites ..................................................117
3 Analysis ...............................................................................................................................118
4 Discussion ...........................................................................................................................119

115
1 Introduction
When EV owners charge their EVs using their home charge point, the energy consumed by the EV is metered by the standard utility home meter and is billed accordingly. In the vast majority of cases, the amount of energy consumed and the home charging session start and stop times are not recorded.
As of May 2015 no fee is charged to the customer for availing of the use of the EV public charging network. The free cost to the EV owner is used as an incentive to encourage additional EV sales. Anecdotal evidence asserts that some of the EV owners do not use their home charge points at all and rely solely on public charging for their needs. Section 2 below uses some of the gathered data to investigate the validity of the assertion and hence deduce the relative use of public charging versus home charging.
2 Data Gathering
2.1 Public Charge Point Usage – Queuing Site
Even though sales of EVs in Ireland have not reached the levels of some of the other European countries, such as Norway and The Netherlands, ESB ecars have observed queues at certain fast charge point locations as seen in the figure below.
Figure 112 - EVs Queuing at a Fast Charge Point in Ireland
In particular, the group of EV owners in Ireland has communicated to ESB ecars that queues for fast charging at a particular site were common. In order to quantify the usage patterns and queuing at this site, data from the ESB ecars CPMS was exported and analysed. A partial extract from the CPMS is shown below.

116
Figure 113 - Partial Extract from CPMS
The data study period was defined as from June 1st 2014 to December 1st 2014. During that period, the following was shown:
1118 charging sessions were completed. Note that a charging session was only considered a valid fast charging session if it lasted greater than 5 minutes. This helped to eliminate a quantity of short charging sessions that were found in the data that may not have represented true charging patterns and may be the result of user or system error.
111 unique tag IDs were used (i.e. 111 unique users of the charge point).
17.63 kWh was the maximum energy consumed during a charging session.
6.02 kWh was the average energy consumed.
1 hour was the longest continuous charging session.
40 queue sessions occurred (a charging session was considered a queue session if the time interval between the previous charging session ending and the current charging session starting was less than 2 minutes and the two tag IDs were unique (i.e. different customers).
11% charge point usage (i.e. 20.16 days in use out of 184 days in the period). The number of charging sessions per user is plotted in the figure below. It is noted that one user is dominating the usage with 10 other users using the fast charge point 2 to 3 times a week.

117
Figure 114 - Number of Charging Sessions per User
The results show that the fast charge point is heavily used and show that queuing is happening.
2.2 Public Charge Point Usage – Fast Charging Sample Sites
Below is EV charge point usage data from the charge points installed at the M1 and M4 motorway stations for the year 2014. Each EV owner is given a charge point access card (RFID), which they need to swipe in order to start and stop a charging session. The CPMS logs this data which is shown in Table 16.
Site Name No. of Sessions (#) Average Time Charging (minutes)
Lusk M1 Northbound 506 23
Lusk M1 Southbound 370 25
Castlebellingham M1 Northbound 322 23
Castlebellingham M1 Southbound 241 27
Enfield M4 Eastbound 191 26
Enfield M4 Westbound 205 27
Table 16 - Charge Point Usage in 2014 for Selected Sites

118
3 Analysis
The following assumptions have been made in this analysis:
The average number of sessions from Table 16, which is 306, represents the number of yearly sessions at each charge point in Ireland.
The average energy consumed during each session is the same as that shown for the queuing example (6.02kWh).
A Nissan Leaf is typical of a standard EV in Ireland which has a chargeable battery size of 21kWh and a range of 135km1.
Standard yearly mileage is 16894km2
The number of public charge points in the Republic of Ireland is 9003.
The number of EVs in Ireland as of the end 2014 is 5654.
Total energy required for the Irish EV fleet for 1 year (2013-2014)
565 × 16894𝑘𝑚 × 21𝑘𝑊ℎ
135𝑘𝑚= 1484795 𝑘𝑊ℎ
Total energy consumed in public charge points (2013-2014)
900 × 306 × 6.02𝑘𝑊ℎ = 1657908 𝑘𝑊ℎ
As can be seen from comparisons of energies above, more energy is being consumed from the public charge points than is required for charging the EV fleet. This suggests a number of possibilities:
1. The standard yearly mileage is higher for EVs than stated above. 2. The average energy consumed at the sample charge point does not reflect the true average for all
charge points. 3. The average number of sessions from the sample charge points does not reflect the true average
for all charge points. 4. EV owners are using the public charge point network as their main source for charging their EVs.
1 http://insideevs.com/real-world-test-2013-nissan-leaf-range-vs-2012-nissan-leaf-range/ 2 http://www.seai.ie/News_Events/Press_Releases/2006/Transport9thAug06.pdf 3 No. of charge points in the Republic of Ireland as of the end of 2014. 4 Central Statistics Office.

119
4 Discussion
As there is no fee for charging your EV on the public charging network, there is a significant saving for the EV owner in avoiding home charging. A sample yearly expenditure on EV charging is shown below:
16894𝑘𝑚
135𝑘𝑚× 21𝑘𝑤ℎ × 0.099𝑐/𝑘𝑊ℎ ≅ €260
The above assumes mileage, range and battery size as stated in Section 3 with a night-rate electricity price of 0.099c/kWh5
The down-side to relying on public charging is the waiting in your vehicle during the charging process and/or possible walk from home to the charge point to collect your vehicle.
It is anticipated that a fee will be introduced for public charging in the near future. The structure of this fee will determine whether the favouring of public charging over home charging is maintained. If the fee consists of a cost per unit of electricity consumed, and this cost is above the night rate price, then it would be anticipated that the EV owners would favour home charging. If however a flat fee is used to access public charging, then it is likely that EV owners will try to maximise the use of public charging in order to justify the cost of the flat fee.
5 https://www.electricireland.ie/switchchange/allPricePlans.htm#dual-only

120
Work Package 1.9
Establish demand for other technology types
(e.g. electric scooters/bikes) for public
charging, inductive charging etc.

121
Table of Contents
1 Introduction .........................................................................................................................123
2 Future Technologies ...........................................................................................................123
2.1 Electric Bicycles, Scooters & Mopeds .............................................................................123
2.2 Electric Motorcycles ..............................................................................................................123
2.3 Electric & Hybrid Buses .....................................................................................................124
3 Projected Uptake ..............................................................................................................124
3.1 Electric Bicycles, Scooters & Mopeds..............................................................................124
3.2 Electric Motorcycles ...........................................................................................................124
3.3 Electric & Hybrid Buses .....................................................................................................125
3.4 Conclusion ...........................................................................................................................125
4 Appendix A – Investigations on Available Technologies and Grid Impact of Full Electric Buses for Public Transport in European Cities.........................................................125
5 Scope of work and structure of study ..............................................................................130
5.1 Scope of work ........................................................................................................................130
5.2 Structure of study ..................................................................................................................130
6 Technology analysis ...........................................................................................................131
6.1 Overview ...............................................................................................................................131
6.2 Conductive Charging .............................................................................................................132
6.2.1 Function ................................................................................................................................132 6.2.2 Field Experiences ..................................................................................................................133 6.2.3 Advantages and disadvantages ............................................................................................134
6.3 Inductive Charging ................................................................................................................135
6.3.1 Function ................................................................................................................................135 6.3.2 Field experiences ..................................................................................................................137 6.3.3 Advantages and disadvantages ............................................................................................137
6.4 Battery swapping ...................................................................................................................138
6.4.1 Function ................................................................................................................................138 6.4.2 Field experiences ..................................................................................................................139 6.4.3 Advantages and disadvantages ............................................................................................140
6.5 Technical components for recharging stations .....................................................................141
6.5.1 Aspects of safety issues ........................................................................................................143
7 Scenarios .............................................................................................................................146
7.1 Scenario Assumptions ..........................................................................................................146
7.2 Fast-charging (conductive) ....................................................................................................148
7.3 Battery swapping ...................................................................................................................151
7.4 Grids and impact calculations ...............................................................................................153
7.4.1 Artificially generated grids .....................................................................................................153 7.4.2 Evaluation methods and exemplary load flow calculations ...................................................155

122
8 Exemplary results ...............................................................................................................162
8.1 Grid impact ............................................................................................................................162
8.1.1 Results of the developed scenarios with 100 bus lines .........................................................162 4.1.2 Comparing different numbers of bus lines ............................................................................170
8.2 Costs .....................................................................................................................................171
8.2.1 Conductive charging .............................................................................................................171 8.2.2 Battery swapping ...................................................................................................................172 8.2.3 Comparison ...........................................................................................................................173
8.3 CO2 emissions .....................................................................................................................177
9 Recommendations derived out of study ..........................................................................181
10 Suggestions for further research activities ......................................................................183
10.1.1 List of references ...................................................................................................................184
11 Appendix ..............................................................................................................................188
12 List of abbreviations ...........................................................................................................197

123
1 Introduction
Public EV charging infrastructure in Ireland consists of two typical installations types: a fast-charging installation which provides up to 50 kW per circuit, or a standard on-street AC installation which can provide up to 22 kW per socket. The quantity of power drawn from these units by an EV varies from vehicle to vehicle, depending on the charging type and mode implemented. Public EVSE on the Island of Ireland is only equipped with Type 2, Chademo or CCS connectors, as shown in figure 1 below. Tethered type 2 cables which facilitate AC charging at 43 kW are available at a number of the fast-charge sites, alongside the fast-DC CHAdeMO and CCS connectors.
Figure 1: Charging Connector Types
The rollout of EVSE has, thus far, been conducted with electric cars in mind. It is envisaged,
however, that the proliferation of electromobility will extend beyond this into motorcycles, electric
scooters and buses.
2 Future Technologies
2.1 Electric Bicycles, Scooters & Mopeds
At present electric bicycles, scooters and mopeds are not compatible with the public EVSE infrastructure. The majority of models on the market charge from standard wall sockets, and lack battery and control systems of sufficient complexity and sophistication to justify the inclusion of type 2 charging at production. While there is a theoretical possibility of mopeds adopting the type 2 charging mode in the medium-term, the current cost of battery systems combined with the driving patterns generally associated with mopeds would appear to render high-power charging unnecessary for these vehicles.
2.2 Electric Motorcycles
A number of motorcycle manufacturers have begun to implement type 2 and even fast DC charging on their models in recent years. Due to the lighter weight of the motorcycles and the less onerous range requirement owing to the driving patterns, the increase in energy capacity of the battery systems is unlikely to follow the same trajectory as that of electric cars, which are expected to routinely push upwards of 40 kWh in the near future. The table below lists some of the electric

124
motorcycle manufactures along with the associated battery capacities and charging types. The AC charging method is either by residential socket, type 1 J1772 connector or type 2 connector with a maximum power of 7 kW. The average battery pack size available is approximately 12 kWh.
2.3 Electric & Hybrid Buses
The main modes of charging electric buses which are currently in test or pilot stages internationally are either bus stop based via either pantograph conductive charging or inductive (wireless) charging, or terminus based via a more conventional conductive charging cable. The short duration of stops combined with the continually operational nature of a bus service presents a unique challenge to charging processes. This leads to a requirement for charger powers far in excess of a standard DC fast charger, in the order of 200-500 kW.
Appendix A features a report conducted by Aachen University on the current investigations into the various technologies available in the electric bus arena. The report concludes that the most suitable method of on-route recharging is that of the automatically deployed pantograph connector for conductive charging. This method is seen to have the lowest impact on schedules and reduces human involvement in the charging process. Furthermore, a comprehensive fleet- management system is strongly endorsed to avoid any scenarios of grid-overload caused by multiple simultaneous charging events. It is also noted that the installation of a recharging station at every stop is not economically feasible.
3 Projected Uptake
3.1 Electric Bicycles, Scooters & Mopeds
As discussed in section 3.1, electric bicycles, scooters and mopeds are not considered as relevant to the discussion of public infrastructural development due to their low power requirement and the unlikely growth of that power requirement. Charging from a domestic socket is deemed as sufficient for the requirements of these vehicles.
3.2 Electric Motorcycles
The total number of new motorcycles sold in Ireland was 878 in 2013 and 960 in 2014. This constitutes less that 1.2% of all new car sales. Of this figures, not one electric motorcycle was sold. If

125
one makes the assumption that the motorcycle sales approximately track car sales at this scale, the proliferation of electric motorcycles does not present any challenge for public EV charging infrastructure. Production models follow the same IEC standards as other electric vehicles and are compatible with the connectors currently on the Irish system.
3.3 Electric & Hybrid Buses
There are currently no test or pilot projects for battery-electric buses either planned or in operation in Ireland. Any movement in that direction will be undertaken at the behest of the National Transport Authority, who currently has no planned works in this area. In the absence of any plan or programme, uptake of the electrification of bus transport cannot be accurately estimated. It is, however, reasonable to assert that there will be no short to medium term impact on public charging infrastructure.
3.4 Conclusion
Current public EV charging infrastructure is more than sufficient to meet any short or medium term uptake in alternative technologies. Electric cars will continue to be the dominant player in this arena, and the electrical requirements they demand will comparatively dwarf those of any alternative forms of motive transport. The adoption of electrified buses will require bespoke solutions which will operate outside of the realm of public EV charging infrastructure and will be investigated at the discretion of the National Transport Authority.
4 Appendix A – Investigations on Available Technologies and
Grid Impact of Full Electric Buses for Public Transport in
European Cities

126
Investigations on available technologies and grid impact of full electric buses for
public transport in European cities
for
Final Report

127
Institute for High Voltage
Technology Univ.-Prof. Dr.-
Ing. Armin Schnettler 52056
Aachen
Aachen, 03. May 2012

128

129

130
5 Scope of work and structure of study
5.1 Scope of work
Buses for public transport in urban areas are predominantly operated with diesel engines. In order to
reduce local emissions caused by public transport, full electric buses are being investigated as a low
emission alternative.
In order to prepare possible field trials with full electric buses, technologies for the energy supply
have to be investigated and compared. Besides sufficient energy storage and recharging devices,
the feasibility in terms of grid impact has to be shown. Only technologies that can be expected to be
available for field trials until 2013 will be within the scope of this study.
5.2 Structure of study
The present study is basically organized in three parts:
The first part deals with available technologies for electric buses. Here, the focus is only on full
electric buses and does not regard hybrid or complete overhead line buses. To get a deeper insight
into the investigated technologies, particular advantages and disadvantages and also field
experiences are specified more precisely after a description of the function in general. To complete
the technology investigation, existing relevant components like plugs or cables are listed as well.
A further step is the establishment of reasonable bus fleets of a certain city, as well as setting up
scenarios to calculate the impact on the power grid related to the city. Since it is completely unknown
where the grid is located in relation to the bus lines, it is not possible to build up an exact model, so
that some assumptions have to be made in order to make reasonable calculations. An appropriate
bus fleet with respect to the size of the grid is being generated and combined with the relevant
investigated technologies to develop reasonable grid impact scenarios. A short introduction to load
flow calculations and the artificially generated grids are presented.
The third part is about the results of the load flow calculations and their appropriate interpretation. In
addition to that, emission calculations are discussed and very gross cost estimations are being
presented. With this information altogether, recommendations for potential field trails can be derived.
The report finishes with suggestions for further research activities.
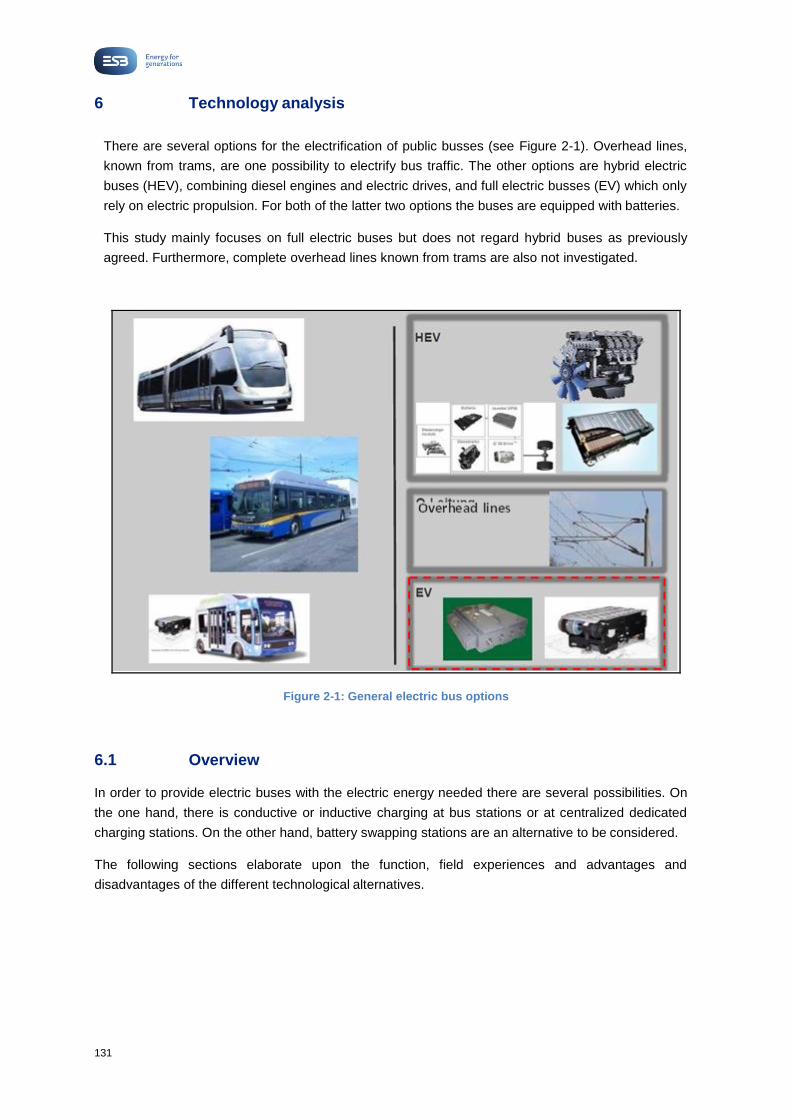
131
6 Technology analysis
There are several options for the electrification of public busses (see Figure 2-1). Overhead lines,
known from trams, are one possibility to electrify bus traffic. The other options are hybrid electric
buses (HEV), combining diesel engines and electric drives, and full electric busses (EV) which only
rely on electric propulsion. For both of the latter two options the buses are equipped with batteries.
This study mainly focuses on full electric buses but does not regard hybrid buses as previously
agreed. Furthermore, complete overhead lines known from trams are also not investigated.
Figure 2-1: General electric bus options
6.1 Overview
In order to provide electric buses with the electric energy needed there are several possibilities. On
the one hand, there is conductive or inductive charging at bus stations or at centralized dedicated
charging stations. On the other hand, battery swapping stations are an alternative to be considered.
The following sections elaborate upon the function, field experiences and advantages and
disadvantages of the different technological alternatives.

132
6.2 Conductive Charging
6.2.1 Function
Two major options exist for conductive charging of electric or hybrid buses. These options include:
Connection of bus via power cables to a charging spot/station
Usage of station-based pantographs to create a conductive connection
Cable connection
Firstly, there is the option of connecting the buses via power cables at charging stations. For electric
cars a cable connection is seen as an adequate solution for charging
E.g. at home or at the office. However, for electric buses this option seems not very practical.
Charging via cable implies that the bus has to stand still at one location for a significant duration.
Additionally the bus driver has to get out of the bus in order to connect the bus to the charging spot.
This is very impractical since the number of recharging process will be higher than today’s refueling.
Due to tight bus schedules and the goal of many operational hours, a cable connection is not
reasonable. Only while the buses are parked in a terminal during non-operating hours charging via
cable appears to be a viable option. However, the corresponding capacity of the battery would be
very high in order to keep the bus in operation for nearly the whole day. This would be very cost
intensive and is therefore not recommended.
Pantograph
The second possibility is a pantograph on the roof of buses which connects to over- head conductors
at some or all bus stations. The technology and materials for pantographs are already known from
tram, train and bus operations. In case of electric buses the electric energy is supplied during regular
stops at bus stations which are equipped with overhead conductors. The time during regular bus
stops is utilized to charge the bus’s batteries. The bus driver only needs to stop in a designated area
and the pantograph can connect automatically to the overhead conductor. In order to provide a
sufficient amount of energy in a short time, high power ratings are necessary. The chargers are
usually rated with 200 to 500 kW [OPB12a], [PRO12].
The capacity of the battery of the bus depends on the number of stations along the bus line that are
equipped with overhead conductors and the distances between stations. Bigger distances and less
equipped bus stations imply a bigger battery size. For the full electric buses with pantographs
produced by Proterra (see also section 2.2.2) the batteries have only a capacity of 54-72 kWh.
Compared to other systems for electric buses which necessitate battery sizes of 150-200 kWh (e.g.
with regular charging stations or battery swapping), this is a relatively small size1. However, the
savings in battery costs are confronted with additional investments into the necessary infrastructure
at the bus stations in order to allow conductive charging via rooftop pantographs.
1 The weight of a battery with 200 kWh would correspond to 1.8 tons and a volume of 0.9 m³. This would be 15 % of the weight of a 12m-standard bus with overall weight of 12 tons [GRE12]

133
6.2.2 Field Experiences
For electric or hybrid buses with pantographs two companies with commercially available and
already field-tested solutions were identified. These are Proterra and Opbrid. Both of them use
pantographs, but have slightly different approaches.
Opbrid
Opbrid’s solution is closely based on existing products used in trams (see Figure 2-2). The
technology’s durability and safety are key aspects of the concept. Docking the pantograph on top of
the bus to the overhead conductor is fully automated. The DC chargers utilized have power ratings
between 100 and 240 kW [OPR12a]. In order to increase safety, the overhead docking station is de-
energized and grounded when there is no charging process active. The pantographs on top of the
bus are usually placed in the front and back of the bus to also maximize the distance between the
two electrodes. Opbrid’s Bůsbaar pantograph system can be mounted on any hybrid or electric bus.
So far hybrid buses were in focus of the company.
The first field trial of Opbrid’s technology is currently being executed in the Swedish university city
Umea [BCS11]. The Bůsbaar charging station provided by Opbrid is located at one end of the bus
route and can fast charge the bus in only a few minutes at the end of each trip. The buses used in
this trial are hybrid buses with a 100 kWh Lithium-Ion battery. The diesel engine only acts as a
range-extender. Together with the pantograph system the possible operation hour the buses is
significantly increased from two to eighteen hours. The conversion of the regular hybrid buses to
fast-charged hybrid buses was done in about six weeks.
Figure 2-2: Pantograph solution “Opbrid Bůsbaar” with customized bus [OPB12b]

134
Proterra
The company Proterra offers a combined solution comprising a full electric bus with pantographs
(“EcoRide BE35”) and the overhead docking stations for the pantographs. The charging system is
named “The FastFill” (see Figure 2-3). The pantograph on the roof top is part of the bus design. As of
today Proterra does not offer to equip other hybrid or electric buses with the system.
The DC charger of Proterra’s solution has a power rating of up to 500 kW and provides the possibility
to rapidly charge the batteries from 0% to 95% with more than 92% energy charge efficiency in six
minutes [PRO12].
Proterra’s system is already being used or currently being implemented in several North American
cities. In Pomona, California three full electric EcoRide BE buses with pantographs are in service
with 54 to 72 kWh batteries [EVW11]. Additionally some bus lines in San Antonio, Texas and
Tallahassee, Florida are supposed to be operated with Proterra’s fast charging electric buses soon
[ADK11].
Figure 2-3: Pantograph solution “The FastFill” with Proterra’s electric bus [PRO12]
6.2.3 Advantages and disadvantages
The advantages and disadvantages of conductive charging are summarized in Table 2-1. Cable
connections which were shown to be impractical for buses are not considered in the further course of
this study. The findings in Table 2-1 are focused on panto-graph systems.
Key advantage of fast conductive charging via pantographs is that charging can be performed during
regular bus stops or during shift breaks of the bus drivers. Especially Proterra’s system which is said
to be able to provide a 95% state of charge for 54 kWh batteries in about six minutes. Also the

135
possibility to reduce battery capacities by deploying charging infrastructure at several bus stations
along the bus lines can enable cost savings.
The high power ratings of the charging infrastructure pose a serious challenge to the grid on the
other hand. A grid connection to the medium voltage networks is likely to be necessary. Also safety
and vandalism risks of the system should not be neglected.
Advantages Disadvantages
Fast charging during regular stops
of the bus line or during breaks in
between shifts
High power ratings imply significant
peaks in the load curve which pose a
challenge for the distribution grid
Technology long tested in trams and
trains
Additional infrastructure at bus
stations costly
Fully automated system avoids the
need for driver to get off the bus
Modifications of bus or proprietary
bus model necessary
Possibility to reduce battery sizes in
buses if charging infrastructure is
provided at several stops
Safety risks (e.g. children who
climb on buses), overvoltage
protection necessary
Risk of vandalism
Table 2-1: Overview of advantages and disadvantages of conductive charging
6.3 Inductive Charging
6.3.1 Function
Inductive charging systems pose an alternative to the conductive charging method. The energy is
transferred by magnetic induction. No conductive connection with cables and plugs is needed. A
primary coil is integrated into the pavement of the street or into an overhead power source resonator
above the bus in the bus stations. The secondary coil is installed underneath the bus or integrated
into the bottom panel of the bus. The sizes of the two types of coils differ by a factor of 1:3-4
(primary to secondary). The primary coil generates an electromagnetic field which induces a current
in the secondary coil. This induced current is used to charge the battery. Figure 2-4 exemplarily
illustrates the principle of inductive charging for an electric car.

136
Figure 2-4: Inductive Charging for electric vehicles [ING11]
For electric buses inductive charging possibilities are aimed to be installed at bus stations allowing
for short energy transfers during bus stops (see Figure 2-5 for an example with overhead primary
coil). [CON11] highlights the battery compatibility of many charging processes with lower power
ratings at several bus stations opposed to the stress on batteries induced by fast charging
systems. However, lower power ratings also imply the need for more stations equipped with coils
for inductive charging in order to ensure efficient operations.
Existing inductive charging systems in prototype or field test stage show a very high efficiency of
around 90% including all power electronic devices and the inductive transfer itself. Power ratings
are mostly in the range of 3.3 to 3.7 kW [PAU12], [ING11]. First solutions with higher ratings of up
to 22 kW are coming into existence tough. Also systems with high ratings of up to 500 kW are in
development [JLI12].
It should be noted that the degree of efficiency strongly depends on the distance be- tween the two
coils and an exact positioning of the bus. This can imply problems for fully loaded or empty bus. In
order to ensure an acceptable coil distance it might be necessary to lift or lower the secondary coil
in the bus or alternatively the primary coil in the ground or above. Acceptable distances are in the
range of 75 to 150 mm according to different sources [CON11], [ING11].

137
Figure 2-5: Inductive Charging at “Solar Curve” bus station [FLE12]
In context of wireless energy transfer, electromagnetic compatibility (EMC) is always named as a
potential source of problems. Due to the locally very limited electromagnetic field, tests have
revealed that EMC does not pose a problem in case of inductive charging of electric vehicles
[TÜV11].
6.3.2 Field experiences
Inductive charging systems are not a very mature technology yet. Most products are still in either
prototype of field test stage. Compared to other options, the wireless power transfer technology used
by the German company Conductix-Wampfler has a relatively high degree of maturity already
[CON11].
It was and is being tested in an extensive field trial with electric buses in Genoa and Turin in Italy
since 2002. Eight electric buses in Genoa and 23 electric buses in Turin are charged inductively via
coils in the pavement at some of the bus stops. So far the technology has proven to be reliable in
everyday operations of a bus fleet [BBC11]. The system works fully automatically. The bus driver
only needs to position the bus in a designated area and then the charging process can begin.
6.3.3 Advantages and disadvantages
Table 2-2 summarizes the advantages and disadvantages of inductive charging. The avoidance of
any cables and the automated charging during bus stops has to be high- lighted on the plus side.
The high efficiency is additionally advantageous. From a grid perspective the integration of low rated
inductive charging spots appears to be relatively easy.

138
However, there is no commercially available product yet which is a major disadvantage. Some
solutions are being field-tested, but the trials are very limited compared to those undertaken for
conductive charging concepts or battery swapping. Another significant disadvantage is the lower
power rating of the available products. With ratings of only up to 22 kW, charging processes take
longer or have to happen more frequently. This implies either longer stops, which is impractical, or
primary coils at many bus stations. The latter implicates extensive road works at stations and is
costly.
Advantages Disadvantages
Charging during regular stops of the
bus line or during breaks in between
shifts
Limited field tests, no
commercially available and
sufficiently tested product yet
No cables or plugs necessary;
avoids also complications in
standardization process
Only low power ratings (max. 22
kW) which implies the need for
many charging possibilities or longer
stops Fully automated system prevents
threats to personal safety
Exact positioning necessary to ensure
high efficiency; driver assistance sys-
tem needed
High efficiency of more than 90%
Most solutions include secondary coils
underneath the bus which implicates
that road works are needed to install
primary coils in the ground
Relatively easy integration into
electricity grid due to low power
ratings
Electromagnetic compatibility issues
might hinder public acceptance
Table 2-2: Overview of advantages and disadvantages of inductive charging
6.4 Battery swapping
6.4.1 Function
In order to provide the buses with the energy needed for driving, the batteries are swapped at
designated battery swapping stations. At these stations (e.g. situated at the bus terminal) a flexible
number of batteries are kept und charged. Fully automated robots remove the old batteries and
replace them with fully charged ones. The batteries are locked safely in the electric bus afterwards.
Figure 2-6 illustrates the possible setup of a swapping station for buses. The exemplary system is
already used in field trials and daily operations (see section 2.3.2). The backup batteries are kept

139
and charged in a charging rack. In addition to the charging rack an additional buffer rack is
introduced to increase flexibility. Two robots are utilized in the system to ensure efficient operations.
Figure 2-6: Possible setup of a battery swapping station for buses [FEN11]
The duration of the changing cycle varies between one minute and up to 15 minutes according to
different sources [BET12], [REN12], and [FEN11]. Compared to refueling a conventional bus with a
diesel engine this duration is very competitive.
Due to the high number of batteries needed to ensure operations of a regular city bus fleet, the
swapping stations pose a significant load in the electricity grid. Already existing swapping stations for
120 to 180 battery racks in Shanghai result in maximum loads of 2 to 3 MW [PTI11], [FEN11].
However, the battery management system in these facilities usually also provides the possibility to
control the charging process and timing, thus limiting the grid impact.
6.4.2 Field experiences
There are several companies and public institutions which are already operating or planning on
operating swapping stations for electric vehicles. For electric cars the company Better Place,
which offers a holistic mobility solution including battery swap- ping and charging spots to private
customers, dominates in the media coverage. Also Renault offers a “Quickdrop” system for charging
batteries of its electric cars of the ZE series in just three minutes [REN12].

140
Figure 2-7: Battery swapping in the field (Beijing Olympic Games 2008)
So far, battery swapping stations especially dedicated for electric buses can mostly be found in
bigger Chinese cities. The first significant field trial was during the Olympic Games 2008 in Beijing.
60 electric buses with exchangeable battery packs were used to transport athletes. After the Olympic
Games those buses are used in regular metropolitan bus lines. Other examples include electric
buses deployed with battery swap- ping stations in Shanghai and Guangzhou since 2010. In
Shanghai 120 electric buses were used during the Shanghai Expo in 24 hour operation. 112
batteries with a capacity of 150 kWh each came into use. Per day roughly 320 charging processes
were recorded [PTI11].
6.4.3 Advantages and disadvantages
The advantages and disadvantages of the battery swapping concept are summarized in Table 2-3.
Key advantages are the speed of the processes and the technology’s already relatively high degree
of maturity. On the other hand the costs for a swapping station and the associated backup battery
sets are enormous.
From a grid perspective, swapping stations are a projectable load which can be taking into
consideration as any other regular load. It is even possible that the facilities pro- vide some flexibility
in load management. However, the power rating of the swapping stations is significant and an
erection in urban areas can be problematic or necessitate significant grid reinforcement or
expansions. If applicable, the swapping station can be used in in a so called “Vehicle to Grid” (V2G)
concept. V2G means that there is a bidirectional connection between battery and grid and the
energy of the battery can be used to smooth load peaks in times of high loads.

141
Advantages Disadvantages
“Fast charging” of buses allows to
maximize operational time
Considerable initial investment costs
for swapping station
Swapping station is a projectable
capacity for the grid (nearly the
same amount of connected
batteries over the time)
No experiences regarding impact of
numerous swapping processes on
battery lifetime
Fast “refuelling” process also in
comparison to buses with diesel
engines
To ensure accessibility battery needs to
be placed at relatively exposed spot in
the bus
Fully automated system prevents
threats to personal safety
Missing standards
Already field tested an commercially
operated technology
In urban areas grid connection of
swapping station can be challenging
Table 2-3: Overview of advantages and disadvantages of battery swapping
6.5 Technical components for recharging stations
In order to have the analyzed technologies available for field trials, nowadays existing technical
components, especially cables and contact wires, must be identified, as well. Since a recharging
power up to 500 kW is considered in this study, corresponding technical components have to be
identified which are able to conduct that high power. Therefore, two different possibilities are
introduced in the following
The first considered solution is invented by the company Furrier+Frey which is used in the Opbrid
Bůsbaar, already introduced in 2.2. Here, overhead, conductive, automatic bus charging stations
are used with Furrer+Frey Conductor Rails [FUR12]. This solution unifies all components in one
station which is needed for recharging. Even relevant safety issues are considered. Figure 2-8
shows a drawing for a fixed arm solution.

142
Figure 2-8: Fixed arm drawing for Opbrid Bůsbaar [OPB12b]
These rails enable a semi or fully automatic docking. The rails are designed for high current capacity
for any future requirements up to 1000 A. This value strongly depends on the pantograph design. On
top of that, a high voltage capacity of 1000 is manageable of the conductor rails. Other features of
this technology are DC Earth fault detection for safety reason and conductive power transfer for low
transfer losses. More technical details can be found in [OPB12b]. The complete above presented
solution together with its dedicated bus is pictured in Figure 2-9.
Figure 2-9: Swinging Arm Version for Opbrid Bůsbaar in the field [OPB12b]

143
The second possibility that shall be shortly presented in this study is about pantograph and contact
wires for high-speed trains for the German train (DB) especially for the type Re330 pictured in Figure
2-10.
Figure 2-10: ICE3 of the Deutsche Bahn AG [DBS12]
The power consumption of the trains can be up to 9.6 MW with occurring voltages of 15 kV und
currents of 1400 A. Figure 2-11 shows the pantograph of the single-system ICE3 that is able to
conduct up to 5 MW [DBS12].
Figure 2-11: Pantograph of the single-system ICE3 [DBS12]
6.5.1 Aspects of safety issues
Due to the currents that occur during the conductive charging process, it is strictly necessary to
guarantee an operation without any risks for electric devices and human health. With a nominal
battery voltage of 500 V and a charging power of 500 kW, there are currents up to ~ 1000 A. During
the charging process, different grid topologies are connected to one overall system. Therefore, one
of the most important aspects is the overvoltage protection of the devices. According to [HOF11], the

144
observation of the insulation resistance is the most important aspect to avoid personal injury. The
requirements of the conductive charging station are similar to those of substations. Be- cause of that,
it is possible to adopt the protection systems that are already in use. For the overvoltage protection it
is possible to use semiconductors, which are one of the cheapest possibilities in this section. The
protection of human respectively animal health is more complicated. It has to be guaranteed, that the
charging process interrupts immediately, if there are any unforeseen occurrences. A protection that
people cannot climb on the roof of the bus during the charging process can also be seen as a part of
these concepts.
To give a short overview about the amount of components that are necessary for a safe operation,
in Figure 2-12 the DC charging process of an electric vehicle is dis- played with all technical devices.
On the left side there is the public power distribution which is the contact between charging station
and grid. Due to the fact that an electric vehicle has to be charged with direct current, a DC charger
is the next component. Be- tween DC charger and electric vehicle there are connection components
like cables ( it can be seen that besides a communication connection only two cables are necessary,
a DC+ and a DC- cable). This structure is for a standardized charging process of a passenger
electric vehicle, charged with a cable. It allows a first impression of the complexity of charging
processes, independently from the connection that is used (cable or pantograph).
Figure 2-12: DC-Charging [HOF11]
Important standards
In order to give an overview about relevant standards for the components used for re- charging
stations, some of them are listed in the following:
Standard DIN EN 60950-1:2003
This standard is applicable to mains-powered or battery-powered information technology equipment,
including electrical business equipment and associated equipment, with a rated voltage not
exceeding 600 V. Addressed safety issues are related to:
Safety Construction
Isolation voltage
Earth leakage

145
Standard DIN EN 55022
EMD: It deals with the limitation of the radio-frequency emission (radio disturbance
suppression) of information technology equipment (ITE) and specifies the relevant limits
and measuring methods.
Standard DIN EN 61000-4
ESD: It describes the immunity test of electrical and electronic equipment against
electrostatic discharges
Fast transients: This standard describes the immunity test of electrical and electronic
equipment against electrical fast transient/burst.
Surges: This standard describes the immunity test of electrical and electronic equipment
against surges (surge voltages and currents).

146
7 Scenarios
In this chapter the appropriate scenarios for the study based on the analyzed technologies are
introduced. Inductive charging is no longer in focus due to missing opportunities for field tests until
2013. Hence, there are five different scenarios which are investigated as Figure 3-1 is depicting.
Figure 3-1: Scenario overview
7.1 Scenario Assumptions
In order to analyze the impact of electrification of city buses on the distribution grid, it is important to
make valid assumptions about the structure of bus transportation net- works, the corresponding bus-
components and a comparison between electric buses and diesel buses. To build up suitable
scenarios to calculate the grid impact, it is necessary to have reliable information about bus lines and
their corresponding consumption. As a first quantity, the study ‘UITP Project Sort’ by UITP [UIT09] is
very helpful. Although it is about diesel buses and their consumption, some information can be de-
rived for electric buses. Firstly, the average speed of buses in urban is 12 km/h. Secondly, the
distance between 2 bus stops can be assumed to be 520 m. To get an idea about the consumption
of a bus, Figure 3-2 depicts the consumption in liter/100km over average speed. As it is displayed, by
increasing the speed until 27 km/h, diesel consumption will decrease. However, in urban areas the
average speed is almost 12 km/h in which the rate of energy consumption is very high.
Figure 3-2: Consumption of a Diesel-Bus over average speed [UIT09]
Fast-charging (conductive)
1. Recharging after 3 hours
2. Recharging after a full cycle
3. Recharging at each station
Battery Swapping
4. One huge swapping station
5. Several swapping stations
located in the grid

147
In order to use this information meaningful for electric buses, the conversion of the consumption
from liter/100km into kWh/100km can be found in Equation A-1 in the appendix. Furthermore, it can
be accepted that the consumption of an electric bus driving with the speed of 18 km/h is about 280
kWh/100km2. The consumption of electric buses together with the data in Figure 3-2 can be
transferred into Table 3-1. Hence, the amendment of the consumption by changing speed for diesel
buses is transferable to electric buses. Prof. Pütz from University of applied science Landshut has
confirmed this behavior. It can be seen that energy consumption of electric buses is 53.3% of diesel
buses. However, only the consumption at 12 km/h is of importance for this study.
Speed [km/h]
12
18
26
Diesel Bus
Consumption
[kWh/100km
]
654
525
475
Electric Bus
349
280
253
Table 3-1: Consumption-Comparison of Diesel and Electric Bus
Based on this useful information out of the UITP study some assumptions are considered as followed:
Bus related
Working hours of each bus per day is 16 h which begins at 7:40 in the morning and
finishes at 23:40 at night
Consumption of one bus is 720 kWh/day
Battery discharging per hour is (720 KWh / day)/(16h/day) = 45 kwh/h Battery related
Full energy capacity of each battery is 200 KWh (see 2.2.1) but it should be operated
between 25% and 80% of this capacity to extend the battery life. Therefore, the real usable
capacity is 110 kWh 3
Bus Lines and Route related
There are 20 bus stations in each line
Each station has 4 buses that work simultaneously
Distance of a full cycle is almost 9880 m which lasts 39 min
2 Lecture: “Battery Storage Systems”, held by Univ.-Prof. Dirk Uwe Sauer at RWTH Aachen
3 Note, in scenario 2 and scenario 3 the batteries are not used to full capacity. Hence, the capacity of the batteries could be even lower

148
To get an idea about the impact due to these assumptions, the energy consumption of an electric
bus fleet in an exemplary city like Aachen should be compared with the overall energy consumption
of the city nowadays. There are 67 bus lines in Aachen [ASE12], therefore the entire consumption of
the bus fleet would be about 69 GWh/a. The overall energy consumption of the city (including
households, industry and traffic) is about 1300 GWh/a [STA12]. Hence, the rate of the bus fleet
consumption would be about 5 % of the overall city energy consumption per year (see Figure 3-3).
Energy Consumption
City
Bus Fleet
Figure 3-3: Energy Consumption of Aachen’s City and their possible Electric Bus Fleet
7.2 Fast-charging (conductive)
To have a comprehensive study about the impact of conductive recharging on power grid, three
different scenarios are considered in this part. These scenarios include:
Recharging after 3 hours
Recharging after a full driving-cycle
Recharging at each station
Customer satisfaction, efficiency of battery operation and distributing the charging nodes are the main factors which are considered for selection of these scenarios
Recharging after 3 hours
In this scenario, each bus is recharged after three hours of working which is almost the maximum
time of operation for the battery (see 2.2.1). This way is the most efficient way of battery operation
since the entire capacity is used. In addition, only a few nodes are allocated with recharging stations.
The entire energy amount of the bus fleet is arbitrarily distributed to these stations which can be in
the city centers (most frequented nodes) or from the electrical point of view the strongest ones. This
approach allows simultaneous charging, so that the corresponding station is more loaded (this is
also true for the other scenarios). The cost of building few charging stations is dramatically lower
than building a charging station for each station as in the third scenario. However, it can be predicted
that recharging only at a few stations can bring critical challenges to the grid. Finally, the recharging
process in this scenario takes about 36 minutes even with fast charging method which is a
noticeable time for public transportation.

149
Recharging after a full driving-cycle
In this scenario, each bus will recharge after traversing a full driving-cycle. Recharging process takes
8.4 minutes. Like the previous scenario, basic investment for setting up recharging stations is not as
high since only a few nodes are assigned with recharging stations. It should be mentioned here
again, that it is completely unknown where the grid is located in relation to the bus lines. Therefore, it
is not possible to derive the ac- curate location for the stations. Figure 3-4 clarifies this statement by
picturing an arbitrary generated grid equipped with some recharging stations (buses). Although this
way is not the most efficient way of operating batteries (compared to previous scenario), short time
of recharging process at the end of one full driving-cycle is a positive point for this scenario.
Figure 3-4: Ratio of recharging stations to nodes of an arbitrary generated grid
Recharging at each station
The last fast-charging scenario which is considered in this investigation is recharging of buses in
each stop. The time needed for this purpose is 18 seconds in each bus stop. Establishing a
recharging station for each bus stop is very expensive (see 4.2). This is the most disadvantage of
this scenario, as well. Furthermore, life time of batteries which are discharged and recharged very
often in a short time is shorter compared to scenario S1. On the other hand, the impact of
electrification of city buses will be distributed on the network, which is the most advantage of this
scenario in comparison with the previous two scenarios.

150
Figure 3-5: Developed Fast-Charging Scenarios
Figure 3-5 outlines the developed scenarios for conductive fast-charging. It can be clearly seen the
difference in length and number of recharging processes. Table 3-2 is showing the important
specifications of the developed scenarios. The power used to recharge the batteries together with
the assumptions introduced in 3.1, it can be de- rived that the overall time of the recharging process
of one bus would be 216 min for 200 kW and respectively 86.4 min for 500 kW each day.
Scenario
Power of Recharging
Process [kW]
Time for Recharging
Process [min]
Number of Recharging
Process for each Bus
1
200
36
~10
2
200
8.4
~42
3
500
0.3
~480
Table 3-2: Specifications of developed Scenarios

151
7.3 Battery swapping
This part of investigation consists of two main scenarios which include:
Using one huge swapping station
Using several swapping stations.
One huge swapping station
In order to save the money of building several swapping stations, it is possible to establish a huge
swapping station at the primary bus line or the most frequented MV node. Batteries can be charged
at this station all day long and during night, so this load can be considered as a permanent load of
the grid. It should be mentioned, that charging all the batteries in one node can bring critical
problems to the grid.
Several swapping stations
Like the first and the second scenario, the most frequented nodes are selected for set- ting up
swapping stations (see Figure 3-6). In this scenario, there are two different situations which include:
Each bus has one set of battery (one in use, one in swapping station)
Swapping stations have more batteries than needed

152
Figure 3-6: Ratio of swapping stations to nodes of an arbitrary generated grid
Each bus has one set of battery
In this scenario, only two batteries are allocated to each bus. At working time, one of the batteries is
used by the bus and another is charging at the station. Since there is no time limitation at nights, the
pressure of charging at stations is lower at nights than during days. Therefore, it is not possible to
have a constant permanent load in charging stations and the load will be different in days and nights.
Providing charged batteries on time can cause some problems and inconsistencies may cause
dissatisfaction.
Swapping stations have more batteries than needed
If more than two batteries are assigned to each bus, the recharging processes during the day are not
time critical. However, there is no need to have information about the exact number of batteries
since the specific energy amount of the buses is known that has to be refilled. This energy amount is
arbitrarily distributed to the swapping stations which can be seen as a constant load during days and
nights.

153
7.4 Grids and impact calculations
7.4.1 Artificially generated grids
To validate and assess the developed scenarios it is necessary to conduct exemplary load flow
calculations. For these calculations, special grids have to be regarded which should imply European
urban character. Since it is not possible to identify the standard unified European urban grid,
assumptions have to be made which fit the average European urban grid. Therefore, grids are
artificially generated based on experience from further research projects.
Figure 3-7: Artificially generated large-size grid
To get an idea about the impact on grids with different sizes, two different grids are generated. A
medium-sized (Figure 3-8) and a large-sized (Figure 3-7) grid are considered. This approach
ensures a more general assessment of the out coming results. The grids are basically composed of
radial networks. There are yellow colored nodes on medium-voltage side. These nodes represent
the course of the grid. The turquoise colored nodes represent the course of the low-voltage side,
respectively. Furthermore, the turquoise nodes are weighted with household loads. These loads
present probabilistic load profiles generated with a tool developed at the institute for high voltage
technology. Since the power for recharging the buses in the study are assumed above 200 kW, the

154
recharging stations as well as the swapping stations are connected to the medium voltage nodes.
However, the establishment of the connection is not part of this study.
Figure 3-8: Artificially generated medium-size grid
The connections between the nodes denote branches which correspond to cables or overhead lines.
Note, a yellow colored connected to a turquoise colored node stand for a secondary substation as
depicted in Figure 3-9.
Figure 3-9: Secondary substation consisting of yellow and turquoise nodes
Here, the voltage is transformed from medium to low voltage. The magenta colored node represents
the transfer from high voltage to medium voltage. The branches between all of the nodes differ in
length. The number and length of branches, as well as the number of nodes, are higher in the large-
sized grid, understandably. The following Table 3-3 gives an idea about the size of the corresponding

155
city and hence about the bus fleet size since it is assumed that the grid fits on a particular city-size.
The average number of bus lines in the respective city is derived out of the “Handbuch der Verkehr-
sunternehmen im VDV” accordingly [VDV11].
Subject
Medium-sized gird
Large-sized grid
Number of low-voltage nodes
52
273
Number of medium-voltage nodes
139
287
Number of branches
195
564
Spanned area of grid
110 km²
240 km²
Number of bus lines
45
100
Table 3-3: Specifications of artificially generated grids
7.4.2 Evaluation methods and exemplary load flow calculations
To understand the consequences and characteristics of a grid stressed with a high load, a short
exemplary load flow calculation is presented.
Evaluation methods
In general, there are two values of interest when analyzing load flow calculations. Firstly, the asset
utilization is of importance. Here, the assets are equated with the branches of the grid. The unit of
the asset utilization is “per unit (p.u.)”; hence normally it should never exceed 1. A value above 1 is
only allowed for a short time. The exact number and time of this exceeding depends on the particular
asset. The second interesting value is the voltage-band. This value reflects the voltage over the
nodes in the grid. Again, the unit is measured in “per unit” and should be ideally 1, thus the voltage
would be stable. There is a standard which allows a deviation of 10 % superior or less of this
particular value [DIN50]. Since a recharging process of a bus is a load for the grid, only a downward
deviation is of importance in this study.
Exemplary load flow calculations
Figure 3-10 shows the artificially generated grid with its typical nodes and branches. As described in
3.4.1, the different colors represent the corresponding voltage levels. The nodes 5 and 30 show a
secondary substation which should be analyzed more in detail. Note, node 5 stands for the upper
side and node 30 for the lower side of the secondary substation. The nominal power of the
secondary substation is supposed to be 1 MVA.

156
Figure 3-10: Artificially generated grid for exemplary load flow calculations
Two different cases are getting analyzed. In the first case there is a variable load on the lower side
of the particular secondary substation. The second case deals with a load on the upper side,
respectively. The variable load represents a different number of buses recharging synchronistical at
one station. The load is varying between 0.5 MW and 4 MW. Assuming that the buses are recharged
with 0.5 MW, 4 MW would correspond to 8 buses recharging synchronistical at one station.
In this chapter of the exemplary calculations, only the branches and nodes nearby the particular
secondary substation are observed.
Load on lower side of secondary substation
Figure 3-11 shows the asset utilization in the case of a load on the lower side of the secondary
substation. It is obvious that the loading on the secondary substation (Branch 5-30) is equivalent to
the load on the lower side of the secondary substation. With a load of 4 MW the secondary
substation is busy to four times since the nominal power is 1 MVA. Branch 5-9 and branch 2-9 show
that a load on the low voltage side has a significant effect on the medium voltage side since the
loading of the branches go up.

157
Figure 3-11: Asset utilization of the exemplary grid (impact on bus 30)
From Figure 3-12 can be derived that the voltage over bus 30 is descending linearly with increasing
load. Between load 3 MW and 4 MW the voltage is even passing the limit of 10 %, thus a forbidden
state occurs. The voltage over bus 5 is following the voltage of bus 30 with a smaller decline.
Figure 3-12: Voltage-band of the exemplary grid (load at bus 30)

158

159
It can be stated that an impact on the low voltage side of a secondary substation has significant influence on the medium voltage side. Figure 3-13 illustrates the mentioned effect. The red flashes show the affected areas due to the impact. Furthermore, an impact on the secondary substation higher than the nominal power is causing a de- scent of voltage below the allowed limit.
Figure 3-13: Impact on bus 30 and the corresponding negative effect on medium voltage side

160
Load on upper side of secondary substation (load at bus 5)
In contrary to Figure 3-11, Figure 3-14 shows that the secondary substation is not utilized since the
load is on the upper side. The utilization of the other branches is equally and therefore below their
nominal. This can be seen as the confirmation that the re- charging processes are only possible
with medium voltage since the secondary substations are not dimensioned for such high power. If
applicable the secondary substations can be exchanged with one with higher power or additional
stations can be added.
Figure 3-14: Asset utilization of the exemplary grid (impact on bus 5)
The same characteristics are true for the voltage-band. Bus 9 and bus 26 have minimal deviations
and are nearly at their optimal value 1 over the different loads at bus 30. Bus 5 and bus 30 are
descending linearly with increasing load. However, the decline is smaller compared to the former
scenario and the limit is not reached by far. Nevertheless, it can be seen that the lower side of the
secondary substation follows the upper side.

161
Figure 3-15: Voltage-band of the exemplary grid (impact on bus 5)
Figure 3-16 is almost identical to Figure 3-13. It shows that branches 5-9, 2-9 and 8-9 are affected similar but the secondary substation has no impact.
Figure 3-16: Impact on bus 5 and the corresponding negative effect on medium volt- age side

162
8 Exemplary results
8.1 Grid impact
In this chapter the results with respect to the grid impact of the developed scenarios are presented
as discussed in 3.4.24. However, the conclusion for the two different grid size scenarios is the same.
Similar to 3.4.2 the asset utilization (Line Utilization) and the Voltage-Band are displayed. Since a
whole day is analyzed the figures are realized in 3D-plots. Hence, the x-axis reflects the time of day
in hours. The y-axis depicts the asset number. Here, asset number can be a node or a line,
respectively. Note, the lines and nodes differ in their number as shown in Table 3-3. It follows, that
the z-axis is showing the loading in per unit.
A comparison of the original scenario 3 with the scenario 3 with more buses than assumed in the
original one is discussed exemplary, as well. The same comparison for the other scenarios can be
found in the appendix. To complete the assessment of the scenarios, there are plots about the
transformer utilization in the appendix, as well. The transformer serves as a reference node in the
load flow calculations and represents a primary substation.
It should be mentioned at this point that the results that will be showed in the following are only
representing the impact of the bus fleets. For the calculations, the household loads at the
corresponding low-voltage nodes have been considered but are neglected in the results in order to
focus on the bus fleet impact.
8.1.1 Results of the developed scenarios with 100 bus lines
Scenario 1
Line utilization and voltage level of nodes are presented in Figure 4-1 and Figure 4-2. Compared to
scenario 2, this scenario redounds to several overloads during the charging intervals. Also, voltage
drop is more frequent and tougher in this scenario. This occurs because of the scenario internal
management of the bus fleet. The charging power in the two scenarios is the same. To prevent this
undesirable situation, more re- charging stations are needed. As it is seen in the figures, line
overloads and voltage drops occur periodically at the time of charging. Therefore, one effective
solution is to distribute the charging stations over the whole grid and to manage the charging period
of buses in a way that the minimum simultaneous charging processes occur.
4 Note, only the results of the large-sized grid calculations are presented. The results of the calculations with the medium-sized grid can be found in the appendix

163
Figure 4-1: Line Utilization of Scenario 2 with 100 bus lines
Figure 4-2: Voltage-Band of Scenario 2 with 100 bus lines

164
Scenario 2
In Figure 4-3 the line utilization of scenario 2 with 100 bus lines is shown. Unlike the previous
scenario, it can be seen that there are load peaks on some lines which are slightly high during
the operation hours of buses. It has to be mentioned that the maxi- mum nominal load of these
lines is not reached (for medium voltage). Figure 4-4 shows the voltage band of electric busses
for this scenario. The voltage level of the different nodes is almost the same before the charging
stations are used. The voltage dips which are shown in this picture after this time belong to the
nodes where the charging stations are located. To avoid critical situations in this scenario, a
proper bus fleet management is necessary to reduce the concurrency factor (recharging of
several buses at the same time can lead to more serious problems).
Figure 4-3: Line Utilization of Scenario 1 with 100 bus lines

165
Figure 4-4: Voltage-Band of Scenario 1 with 100 bus lines
Scenario 3
Figure 4-5 displays the line utilization for the third scenario. The maximum utilization of the single
lines in this scenario is less than 1.8 per unit which is a smaller compared with the previous
scenario. Due to the high amount of charging stations all over the grid, the utilization is more
distributed over whole grid and operation hours of the bus fleet. As it can be seen in Figure 4-6,
this also occurs regarding the voltage band if the different nodes. Voltage fluctuation of the nodes
during working hours of the city buses is unacceptable. Therefore, one conclusion could be that
500 kW is too high for charging of city buses.

166
Figure 4-5: Line Utilization of Scenario 3 with 100 bus lines
Figure 4-6: Voltage-Band of Scenario 3 with 100 bus lines

167
Scenario 4
Using one huge charging station for recharging all the batteries will drastically affect the distribution
network. The power needed for recharging in this node corresponds to
10.500 kW (which is a value that cannot be reached in medium voltage). Therefore, load flow
calculation did not converge for this scenario. There is no matter where this load is located in the
grid, voltage level will pass the voltage-band limitation in any case. The only possible solution would
be a direct connection of this load to the high voltage grid.
Scenario 5a
As it is predicted, the impact of charging the batteries in this scenario is different during day and
night. Figure 4-7 underlines that there are lines with about six times of nominal loading during the
recharging process of the battery packs. That means that twenty swapping stations are even too few
for a city with 100 bus lines. However, overloading at night is smaller (about two times of nominal
loading). The voltage dips also follow this trend as it is exhibited in figure 4-8. There are about 25
percent voltage dips in some nodes in contrast to other nodes without any voltage dips. This means
that the swapping stations have to be further spread across the grid.
Figure 4-7: Line Utilization of Scenario 5a with 100 bus lines and 20 swapping stations

168
Figure 4-8: Voltage-Band of Scenario 5a with 100 bus lines and 20 swapping stations
Scenario 5b
By distributing the charging load of scenario 5a over a whole day the negative effects on the grid
can be reduced in this scenario. However as it is illustrated in Figure 4-9 and Figure 4-10, using
more than two batteries for each bus is not enough and there are still overloaded lines and
voltage dip in several nodes. Twenty swapping stations and allocating more than two batteries for
each bus is not the proper solution. To re- duce voltage dips and overloading to zero, further
distribution of charging stations over the grid is necessary.

169
Figure 4-9: Line Utilization of Scenario 5b with 100 bus lines and 20 swapping stations
Figure 4-10: Voltage-Band of Scenario 5b with 100 bus lines and 20 swapping stations

170
4.1.2 Comparing different numbers of bus lines
In order to investigate the outcome of adding bus lines, the third scenario is applied to the same
grid with 150 bus lines and the results illustrated in Figure 4-11 and Figure 4-12. With a higher
amount of buses the effect of electrification on the power grid rises. It can be seen that voltage
dips of some nodes pass the limitation (0.9 per unit). In conclusion, cities with a large number of
bus lines need a grid with sufficiently dimensioned operating material. The same comparison for
the other results can be found in the appendix, as well.
Figure 4-11: Line Utilization of Scenario 3 with 150 bus lines

171
Figure 4-12: Voltage-Band of Scenario 3 with 150 bus lines
In general it can be said that the grid impact of the scenarios differs according to the
assumptions. In the case of conductive charging, a proper bus fleet management is strictly
necessary to avoid an overloading of the components. Every single charging process can be
seen as a load peak. Due to the possibility of recharging the battery packs in the swapping
stations constant over the whole day, there is a uniform utilization.
8.2 Costs
In a first step every single component for conductive charging and battery swapping has to be
analyzed to calculate and compare the costs between the different scenarios. It has to be
mentioned, that there is no real market for those components until today, due to the early phase
of research activities in this field. Because of that, all the cost estimations have to be interpreted
with caution.
8.2.1 Conductive charging
As already mentioned before, the charging stations for conductive charging have to be connected
to medium voltage. Due to the resulting load peaks there have to be several safety components
to guarantee that there are no health or safety hazards. In Figure 4-13 the most important
components are demonstrated. The grey box indicates the existing grid, which covers the grid
connection to high voltage and the secondary sub- stations. For these substations (dark grey

172
rectangles), there are different possible field of application. On the one hand, typical low voltage
applications can be connected, for example a street with household customers (the yellow lines
on the right side of Figure 4-13). On the other hand, the conductive charging stations can directly
be connected to those secondary substations. The necessary components for this connection are
explained in detail in the following section.
Figure 4-13: Components for conductive charging
In a first step, a medium voltage cable is needed for the connection between secondary substation
and the charging station (a). To protect the cable against weather and vandalism, it has to be placed
in a depth of about 1 meter, which makes civil engineering works indispensable [NEX06].
Furthermore, a fundament is strictly required to guarantee a solid anchoring of the charging station.
To protect the electric components of the charging station against weather influences, a kind of
mechanical case has to be in- stalled onto the fundament (b). Because batteries have to be charged
with direct cur- rent, a rectifier has to be placed into the case to transform the alternate current which
is provided by the grid (c). On top of the mechanical case an overhead line has to be in- stalled, to
supply the bus with energy (d). As already mentioned in the technology analysis, the buses are
equipped with a pantograph to connect the battery packs with the charging station (e). Furthermore,
there are some other devices which cannot be dis- played in this figure, e.g. functional tests and
licenses (f).
8.2.2 Battery swapping
The main difference between conductive charging and battery swapping is the amount of stations
that have to be placed in the grid. Even with several swapping stations, the overall amount of
stations is small compared to conductive charging. The smaller the amount of stations, the higher is
the amount of buses that have to be equipped with new battery packs in a single station. Therefore,
the first device that is necessary is a large hall, where the swapping process is performed. The
construction of these halls can be complicated due to space problems in the cities. In general, those
halls have to be placed to locations where a lot of bus lines cross. But exactly these places are al-

173
ready well developed and do not offer free space for new buildings. A trade-off between average
distance and possible space has to be found. In general the different staging areas are a solution.
Because the battery packs have to be changed completely, every single bus of the bus fleet has to
be reconstructed. Special container must be built under the roof of the bus, where the battery packs
can be stored. Due to the heavy weight of the battery packs, some mechanical reinforcements have
to be done. By this procedure it is possible to change the battery packs within some minutes, as
already figured out in the technology analysis. The most important devices for battery swapping are
the robots, which carry out the swapping process. This is the only way to reduce ongoing costs and
to guarantee a fast change of the battery. Furthermore, there are some devices that are already
known from conductive charging. Again, a rectifier and a grid connection through medium voltage
cable are necessary.
8.2.3 Comparison
To compare the different charging methods the prices of the different components have to be
investigated. Beside the fixed prices for rectifier and robots, there are prices for the medium voltage
cable and the overhead line, which can be seen as a function of the distance [€/km]. Due to the fact,
that the exact location of the charging stations in comparison to the grid is unknown, it is not possible
to figure out the exact costs for a single station. As a rough estimation for medium voltage cable
costs, 80.000€ per kilo- meter can be used. The battery costs are another problem, because they do
have a huge impact on the battery swapping scenarios. An optimistic value for lithium batteries is
400€/kWh. With the assumptions made before, this correspondents to 80.000€ per battery (every
battery has a capacity of 200 kWh). Even for a swapping station with only 10 batteries in storage, the
battery costs are four times higher than the costs for the swapping station.
Because of the problems with variable costs mentioned before, only the fixed costs are compared to
each other. In Figure 4-14, the costs for a single conductive charging station are summarized. It can
be seen that pantograph and rectifier are the most expensive components. Overall, the costs for a
single station can be seen between 100.000€ and 350.000€ per station.

174
Figure 4-14: Costs for a single conductive charging station
In Fehler! Verweisquelle konnte nicht gefunden werden., the costs for a single battery swapping
station are displayed.
Figure 4-15: Costs for a single battery swapping station
Analogue to the conductive charging, only the fixed costs are summarized. In this case, the robots
for the swapping process have the highest amount of costs. All in all, there are costs between
200.000€ and 500.000€ per swapping station, but of course without any battery in storage. The hall
for the battery swapping station has a size of about 150 m². The costs for the batteries that have to
be stored are not included in Fehler! Verweisquelle konnte nicht gefunden werden.

175
With these data it is now possible to give a rough estimation of the costs of the different scenarios
which have been presented before (the cheapest price for a single charging station respectively
battery swapping station is used). The results can be seen in Figure 4-16. A distinction is made
between medium grid and large grid. For a medium grid, 40 buses and 100 batteries in storage are
adopted. In a large grid, a bus fleet of 100 buses and 200 batteries is needed. The costs for a huge
battery swapping station are about 5 times higher than the costs for smaller ones due to hall size,
amount of robots and ongoing costs (energy and safety).
Scenario Medium Grid Large Grid
S1 5.715.000 € 12.700.000 €
S2 5.715.000 € 12.700.000 €
S3 11.811.000 € 36.449.000 €
S4 9.037.500 €* 17.037.500 €*
S5 9.150.000 €* 20.150.000 €*

176
Assumptions:
• Medium Grid: 40 buses / 100 batteries
• Large Grid: 100 buses / 200 batteries
• Huge battery station ~ 5 times more expensive than the
smaller ones
*Assuming 2 batteries per bus

177
Figure 4-16: Scenario costs
It can be seen, that the costs for scenario S3 are comparatively very high, because a charging
station has to be placed at every single bus stop. Apart from this, the costs for battery swapping
stations are higher that the costs for conductive charging due to the battery costs.
8.3 CO2 emissions
In addition to the calculation of costs an analysis of the CO2 emissions is strictly necessary to
compare the different scenarios. In general, the overall efficiency of electric vehicles is about 85%
compared to 25% for a conventional car, although the so called “well-to-wheel” (WTW) emissions
have to be regarded for suitable information. This kind of analysis evaluates “the primary energy
consumption yielded by the vehicle for each kWh of energy given at the vehicle wheels, comprising
all the steps covered by the well-to-tank conversion path and subsequently by the tank-to-wheel
onboard energy conversion” [CAM08]. To evaluate the WTW emissions, the energy mix has to be
regarded in a first step. In Figure 4-17 the European energy mix for 2010 is shown. It can be seen,
that nearly 50% of the energy transmutation is done with coal and gas. The CO2 emissions of these
power plants are high compared to nuclear power plants and renewable energy sources, see Table
4. Therefore, the energy mix which is used to fulfill the charging of the electric vehicles has a huge
impact on the overall CO2 emissions.
Figure 4-17: European energy mix 2010 [ENT10]

178
Power plant
CO2 emissions
Coal
800-1000 g/kWh
Gas
350-450 g/kWh
Nuclear / Renewable
5-20 g/kWh
Table 4: CO2 emissions of power plants [RET10]
A difficulty can be seen in the missing data for electric buses, because all investigations and
evaluations so far focused on passenger cars. Due to this fact, some assumptions have to be made.
The tank-to-wheel emissions for electric cars are zero for the investigations, due to the overall
efficiency. For a bus with an internal combustion engine (ICE), a consumption of 70 l/100km5 is
assumed. With the calculations made before, a full electric bus has a consumption of about 350
kWh/100km. With this data it is possible to compare the WTW emissions of buses that are
charged with different energy sources, see Figure 4-18. The blue bar shows the CO2 emissions for a
bus with an internal combustion engine. The next three bars underline the importance of an energy
5 Own Calculation by IFHT
mix with a high amount of renewable sources. If the electric vehicle is completely charged with
energy that is converted by coal plants, the CO2 emissions are even higher than the emissions of the
ICE bus (an increase of around 60%). In contrast to this, an electric bus that is charged with energy
from 100% renewable sources can reduce the CO2 emissions nearly to zero (reduction of around
97%). Of course, the assumption that an electric vehicle is charged by 100% of a specific energy
form is not realistic, because there is always a kind of mixture in the grid. Because of that, the fifth
bar indicates the CO2 emissions for the European energy mix mentioned before. It can be seen, that
the CO2 emissions can be reduced with a realistic energy mix.

179
Figure 4-18: Well-to-wheel emissions of electric buses
Furthermore it makes sense to compare the external costs for the different power sources (diesel
fuel, hybrid and battery). In addition to the CO2 emissions, NOx and PM emissions are investigated;
see Figure 4-19 [PÜT10].

180
Figure 4-19: External costs of different energy sources
In general, NOx is a generic term for the oxides NO and NO2, PM is the acronym for particulate matter, also known as fine particles [WIK11]. It is assumed that the live cycle for a single bus is about 17 years. It can be seen, that the overall reduction even from modern diesel technique compared to renewable battery systems can be up to 400%. The largest reduction can be achieved in the sector of CO2 emissions for the driving operation (light blue bars). As mentioned before, a full electric bus can be operated without any CO2 emissions.

181
9 Recommendations derived out of study
The recommendations that will be given in the following part are derived out of the results of the
developed scenarios. The study attempts to derive general statements since it is not possible to
elaborate a perfect solution that fits for every European city. This allows general recommendations
that can be précised for different urban cities afterwards.
Bus fleet management: It has been shown that a proper bus fleet management is very important to
avoid synchronistical recharging processes. The bus fleet operator has not just pay attention to the
bus schedule as at present, but also has to consider the impact on grid if there are too many buses
at one station recharging their battery. Figure 5-1 depicts the overlapping of the recharging
processes of 3 different buses. There is a time when 3 buses are recharging synchronistical. Hence,
the impact on the grid is also the treble. In order to minimize the probability of synchronistical
recharging of several buses, the operator should shorten the recharging processes to a minimum of
time. This on the other hand would mean to use a higher power to accelerate the process.
Figure 5-1: Overlapping Recharging Process of different Buses
Distributed recharging processes: If some areas of the distribution grids are more burdened due
to recharging processes than others, there will not be any compensation of load flow in the grid.
Rather, the one half will have a higher impact on assets and branches. That is the reason why it is
recommended to distribute the compete load over the whole grid. Therefore, no matter how many
recharging stations will be used, it is better to distributed them over the grid. However, the more
recharging stations are built up at sensible locations, the better the load gets distributed.
Overnight recharging: It can be derived out of Scenario 5a and Scenario 5b that overnight
recharging is suitable. Hence, the amount of energy needed for keeping the bus fleet on the road
can be distributed over the time. If the whole day can be used to recharge the batteries, the load can
be better distributed similar to the previous statement.
Limited amount of power: In the developed scenarios for this study, the recharging power is
assumed to be 200 kW and 500 kW. Out of the scenarios, it cannot explicitly be derived whether this
assumption is suitable or not. However, using a power of 500 kW to recharge the battery for several
minutes would destroy the battery thermally. Hence, it is only possible to use this high power only up

182
to 30-40 seconds by recommendation of Prof. Pütz from Landshut. His suggestion is also to use a
power of 400 kW since it is possible to recharge the battery for several minutes with this amount of
power.
Number of recharging/swapping stations: It has been shown (Scenario 3) that a high number of
recharging stations is more grid-friendly than having only a few. This is similar to the statement:
Distributed recharging processes. However, the more stations that are built the more expensive
will be the whole infrastructure for electric bus fleets. Therefore, it has to be made a trade-off
between grid-friendly and cost-friendly recharging infrastructure. Nevertheless, it depends on the
particular city and grid which alignment should be more weighted and can’t be recommended
explicitly. The same is of course true for the number of swapping stations.
In this study, the technologies are only regarded as individual solutions. There is also the possibility
to combine the analyzed technologies. This would be suitable for cities where are circle bus lines as
well as strand bus lines. It is conceivable to use recharging station around the city center. Usually,
there are many circle bus lines, so that the corresponding buses would pass here often und could
quickly recharge. On top of that, the spouts of the strand bus lines also intersect at those recharging
stations near the city center and could recharge their batteries here. Out of the city, the buses of the
strand bus lines could change their batteries at swapping stations, since the strands of the lines
could be very long. Note, for this scenario the recharging process as well as the swapping process
has to be feasible for the corresponding buses. Hence, the de- sign of the buses and the location of
the battery have to be compatible to both processes.

183
10 Suggestions for further research activities
It is possible to solve the presented research activities on a different way by using optimization tools.
Therefore the positioning of the charging infrastructure has to be regarded with respect to battery
capacity and charging cycles as a whole optimization problem. The infrastructure and operating
costs can be considered as objective function. The present optimization problem can be summarized
under the term ‘Siting and Sizing’.
One of the most important aspects for evaluating the different scenarios concerns the occurring
overall costs. The cost calculations for this report were realized in a very general way. Therefore, it is
strictly necessary to calculate the different positions in detail in further studies. In a first step, the
devices for conductive charging have to be dimensioned. After that, it would be possible to get more
detailed information about the prices for components like rectifier and safety components. Without
these calculations, the overall costs are just a rough estimation to have a first impression of the order
of magnitude.
Another important aspect for further activities is the city grid dilemma, which has been mentioned
before. Due to the fact that there is not any reliable information about the connections between grid
and bus lines, it is difficult to calculate realistic locations of the bus stations. To solve this problem,
bus and grid lines of the city have to be centralized in a standardized data format that is geo-
referenced. With this kind of maps, the exact location of every charging station can be analyzed and
the distance to the medium voltage grid can be calculated. This of course affects the costs again and
makes them more realistic.
As already mentioned in the recommendations, the different types of bus lines have a huge impact
on the results. Because of that, a detailed analysis of the bus lines in the considered region is
necessary. With this information it would be possible to separate the scenario analysis between
circle lines and bus strand bus lines. Furthermore, a determination of grid-friendly strategies could be
interesting. An example can be seen in the location a buffer battery next to the recharging station to
smooth resulting load peaks.

184
10.1.1 List of references
[ADK11] M. Adkins: “Proterra future-proofs public transportation”, in North Amercian
Composites – Delivering Performance, Winter 2011, viewed on 05.04.2012:
http://www.nacomposites.com/delivering-
performance/page.asp?issueid=21&page=feature
[ASE12] Aachener Straßenbahn und Energieversorgungs-AG (ASEAG), company
description, viewed on 07.04.2012:
http://www.aseag.de/unternehmen/die_ASEAG/index.html
[BBC11] BBC, K. Moskvitch: ” Wireless charging - the future for electric cars?”, July 2011,
viewed on 16.04.2012: http://www.bbc.co.uk/news/technology- 14183409
[BCS11] BC Sustainable Energy Association: “The Arctic Whisper: The World's First Fast-Charged
Hybrid Bus Debuts in Umeå, Sweden”, viewed on 04.04.2012:
http://www.bcsea.org/learn/news/2011/04/05/arctic-whisper- worlds-first-fast-charged-
hybrid-bus-debuts-ume%C3%A5-sweden
[BET12] Better Place: “Better Place – the solution – switch stations”, viewed on
04.04.2012: http://www.betterplace.com/the-solution-switch-stations
[BRA04] Brandt, F.: “Brennstoffe und Verbrennungsrechnung”, Vulkan Verlag Essen, 3.
Auflage 2004, ISBN 3-8027-5801-3
[CAM08] http://www.sciencedirect.com/science/article/pii/S0378775308018934
[CON11] Conductix-Wampfler: “Frost and Sullivan Award for "E-Mobility", press re- lease,
February 2011, viewed on 16.04.2012: http://www.conductix.us
/news/frost-and-sullivan-award-for-e-mobility/
[DBS12] Deutsche Bahn AG: „Systemtechnik“ product description, viewed on
10.04.2012:
http://www.dbsystemtechnik.de/site/dbsystemtechnik/de/start.html
[DIN50] DIN EN 50160: „Voltage characteristics of public electricity supply net- works”, draft
11/2008
[DIN55] DIN EN 55022: “Information technology equipment - Radio disturbance characteristics -
Limits and methods of measurement (CISPR 22:2008, modified)”, draft 12/2011

185
[DIN60] DIN EN 60950: “Information technology equipment - Safety - Part 1: General requirements
(IEC 60950-1:2001, modified)”, draft 1/2003
[DIN61] DIN EN 61004: “Electromagnetic compatibility (EMC) - Overview of IEC 61000-4 series
(IEC 61000-4-1:2006)”, draft 10/2007
[ENT10] ENTSO-E - European network of transmission system operators for electricity, “Monthly
production for a specific year”, viewed on 10.03.2012:
https://www.entsoe.eu/resources/data-portal/production/
[EVW11] EV World: “GM Ventures Invests in E-Bus Maker Proterra”, article evworld,
June 2011
[FEN11] Ni Feng: “Study and Practice of EV Charging Facilities”, study of State Grid Electric
Power Research Institute China, September 2011
[FLE12] C. Fleischfesser: “Wireless solar charging for electric buses?”, in: Smart Planet,
February 2012, viewed on 16.04.2012:
http://www.smartplanet.com/blog/transportation/wireless-solar-charging-for- electric-
buses/1422
[FUR12] Furrier+Frey: “Overead contact lines”, product description, viewed on
05.04.2012:
http://www.furrerfrey.ch/web/furrerfrey/en/produkte/fl200_fl260.html
[GRE12] Green Car Congress, “The Battery Pack for Mitsubishi’s i MiEV”, product
description, viewed on 05.04.2012:
http://www.greencarcongress.com/2008/05/the-battery-pac.html
[HOF11] Hofheinz, W., Sellner, H.: „Elektrische Sicherheit bei der Ladung von Elekt-
rofahrzeugen“, 2011
[HOP10] Hoppecke: “Moderne Batterietechnologien für den Einsatz in Elektrobussen des
ÖPNV“, Vortrag, Luzern, November 2010
[ING11] A. Ingram: “Siemens Inductive Charging Testing with BMW begins in Ber- lin”, in:
Green Car Reports, April 2011, viewed on 16.04.2012:
http://www.greencarreports.com/news/1058200_siemens-inductive- charging-testing-
begins-in-berlin-with-bmw
[JLI11] J. Lassop: “Lasslop Inductive Charging - hocheffiziente induktive Übertra- gung trägt den
Namen J-LIC©”, viewed on 16.04.2012: http://www.j-
lasslop.de/news/news/mehr/archiv/2011/01/12/licc-hocheffiziente-induktive-
uebertragung-hat-einen-namen.html

186
[NEX06] NEXANS: „Niederspannungsnetzkabel und Mittelspannungsnetzkabel“, 2006
[OPB12a] Opbrid: “Opbrid busbaar”, Shaefer charger technical product details, viewed on
04.04.2012:
http://www.opbrid.com/index.php?option=com_content&view=article&id=70
&Itemid=70&lang=en
[OPB12b] Opbrid: “Opbrid busbaar”, technical product details, viewed on 05.04.2012:
http://www.opbrid.com/index.php?option=com_content&view=article&id=69
&Itemid=69&lang=en
[PAU12] M. Paulus: “Wireless Charging System for Electric Vehicles”, presentation for US
Department of Energy, 2012, viewed on 16.04.2012:
http://www.ornl.gov/adm/partnerships/events/bridging_gap2012/Presentatio
nPDF/13_Wireless%20Power%20Transmission_Paulus.pdf
[PRO12] Proterra: “FastFill Charging Station”, product description, viewed on
04.04.2012: http://www.proterra.com/index.php/products/productDetail/C23/
[PTI11] Power Transfer International Limited: “New Energy Whole Integrated Sys- tem
Solutions Supplier”, Presentation, September 2011
[PÜT11] Pütz, R.: Interne Studien zur Ökobilanzierung, Landshut 2011
[REN12] Renault: “Renault ZE – Quick Drop System”, viewed on 04.04.2012:
http://www.renault-ze.com/de-de/old-de/renault-z.e.-die-einzelheiten/wie- kann-ich-
mein-elektrofahrzeug-aufladeny-670.html
[RET10] RETRANS: “Opportunities for the Use of Renewable Energy in Road
Transport”, March 2010
[STA12] Stadtwerke Aachen AG (STAWAG), business description, viewed on
07.04.2012: http://www.stawag.de/
[TÜV11] TÜV: “TÜV SÜD: Ladesysteme technisch reif für den Aufbau der Elektro-
mobilitäts-Infrastruktur“, viewed on 16.04.2012: http://www.tuev-
sued.de/pkw-nutzfahrzeuge/aktuelles/tuev-sued-ladesysteme-technisch- reif-fuer-den-
aufbau-der-elektromobilitaets-infrastruktur
[UIT09] Union Interantionale desTransportes Publics: „UITP Project ‚Sort‘“, new edition
UITP 2009

187
[VDV10] Verband Deutscher Verkehrsunternehmen: „Handbuch der Verkehrsunter- nehmen
im VDV“, Köln, 2009/2010,ISBN 978-503-11614-0
[WIK11] Wikipedia.org: “NOX“, viewed on 14.04.2012:
http://en.wikipedia.org/wiki/NOx

188
11 Appendix
The results for the developed scenarios with medium-voltage are listed in the following:
Figure A-3: Line Utilization of Scenario 1 with 45 bus lines
Figure A-4: Voltage-Band of Scenario 1 with 45 bus lines
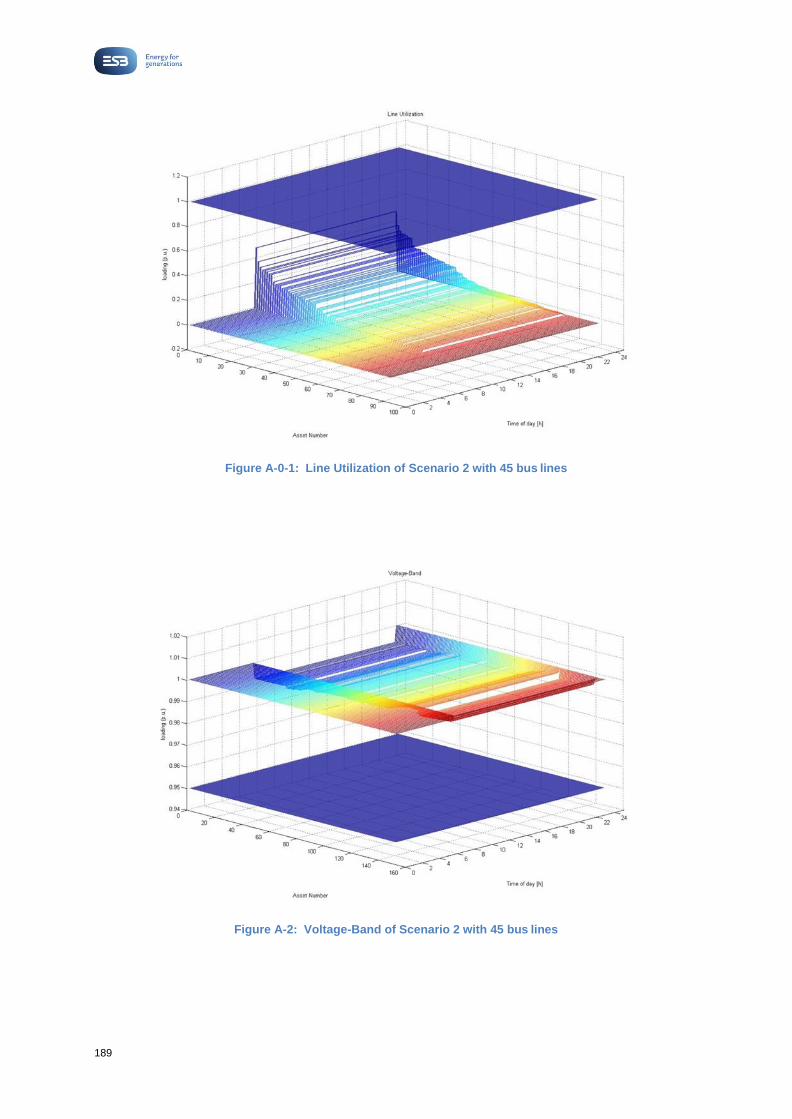
189
Figure A-0-1: Line Utilization of Scenario 2 with 45 bus lines
Figure A-2: Voltage-Band of Scenario 2 with 45 bus lines

190
Figure A-5: Line Utilization of Scenario 3 with 45 bus lines
Figure A-6: Voltage-Band of Scenario 3 with 45 bus lines
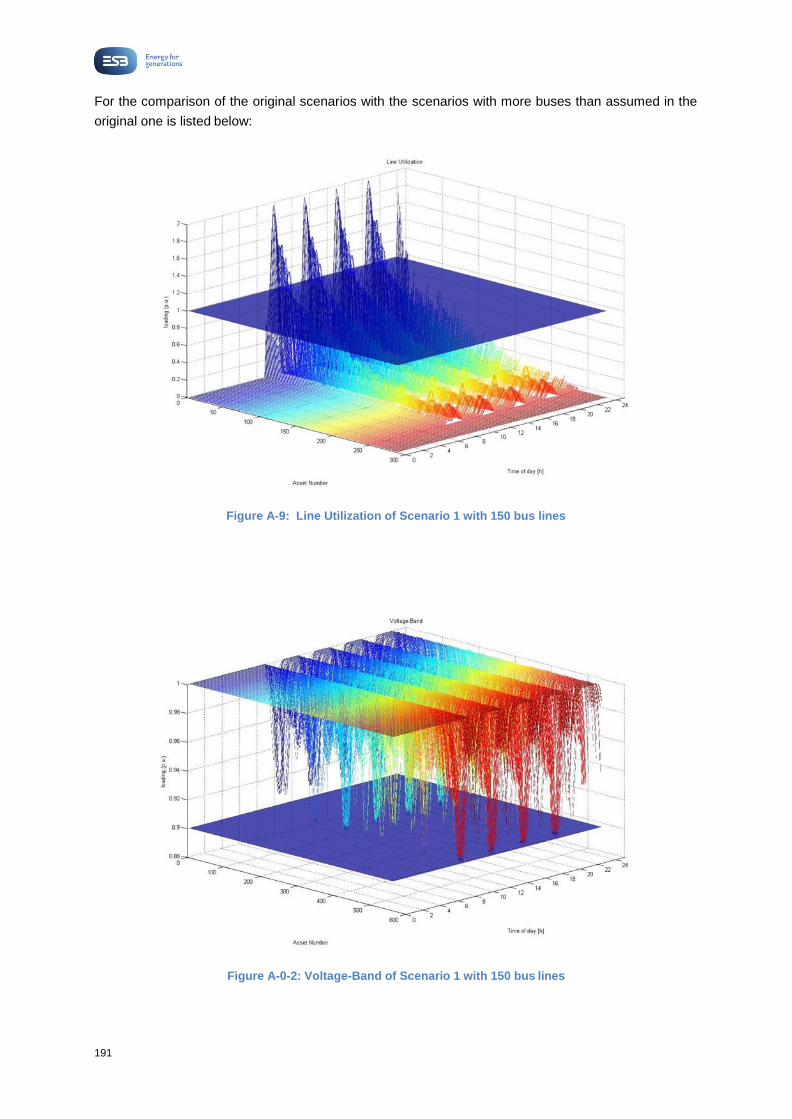
191
For the comparison of the original scenarios with the scenarios with more buses than assumed in the
original one is listed below:
Figure A-9: Line Utilization of Scenario 1 with 150 bus lines
Figure A-0-2: Voltage-Band of Scenario 1 with 150 bus lines

192
Figure A-7: Line Utilization of Scenario 2 with 150 bus lines
Figure A-8: Voltage-band of Scenario 2 with 150 bus lines

193
The next figures illustrate the transformer utilization for the different scenarios (as histograms). On
the x-axis, there is the transformer utilization in per unit. On the y-axis the amount of transformers
that are in the corresponding interval are listed. For example, in Figure A-11 there are about 10.000
transformers that are utilized less than 0.05 per unit.
Figure A-12: Transformer Utilization of Scenario 1 with 100 bus lines

194
Figure A-11: Transformer Utilization of Scenario 2 with 100 bus lines
Figure A-13: Transformer Utilization of Scenario 3 with 100 bus lines
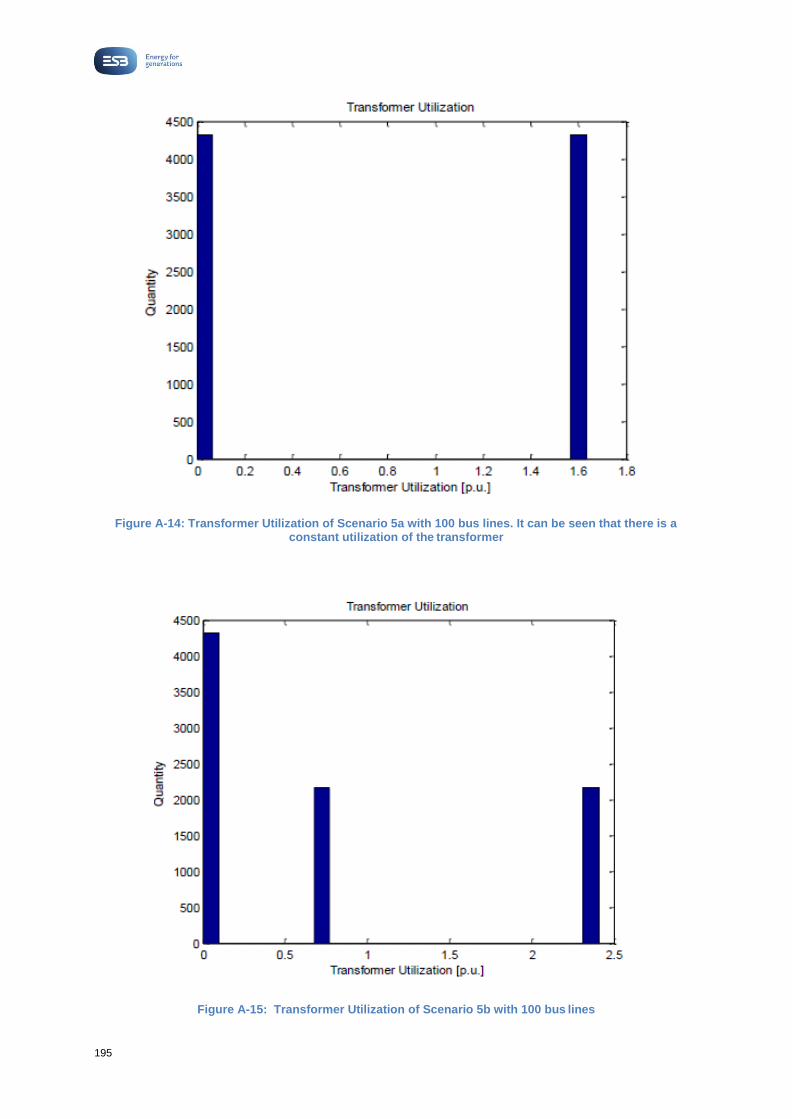
195
Figure A-14: Transformer Utilization of Scenario 5a with 100 bus lines. It can be seen that there is a constant utilization of the transformer
Figure A-15: Transformer Utilization of Scenario 5b with 100 bus lines

196
According to [BRA04] the density of diesel is about 0.84 kg/liter. The corresponding heating value is considered as 11.8 kWh/kg. Hence, the conversion equation is:
Equation A-1: Equation to convert diesel bus consumption in l/km into kWh/km

197
12 List of abbreviations
a Anno
CO2 Carbon dioxide
e.g. For example
EV Electric vehicle
HEV Hybrid electric vehicle
ICE Internal combustion engine
K Kilo
kW Kilowatt
kWh Kilowatt-hour
NOX Nitrogen oxide
PM Particulate matter
p.u. Per unit
W Watt

Page 198 of 625
Work Package 2.1
Measured impact of environmental factors &
public behaviour on integrity of safety
standards for charging infrastructure in
controlled trial

Page 199 of 625
Table of Contents
1 Describe Project Deliverable ............................................................................................200
2 Report on Project Deliverable ...........................................................................................200
3 Selection of a suitable site ................................................................................................200
4 Specification of Equipment ...............................................................................................200
5 Vandalism ...........................................................................................................................202
6 Instances of unintended damage .....................................................................................205
7 Conclusion and Recommendation ...................................................................................207
8 Appendices .........................................................................................................................208
Appendix 8.1 .........................................................................................................................................208
Appendix 8.2 .........................................................................................................................................209

Page 200 of 625
1 Describe Project Deliverable
This project deliverable looks at the performance of the charge point infrastructure in terms of environmental effects while maintaining a safe state and taking account of public interaction with the infrastructure, whether by a user or a passer-by.
2 Report on Project Deliverable
To meet the set deliverable, measures were taken to eliminate the risks of damage to property or injury to the public, and where this could not be achieved every reasonable effort was made to reduce these risks to a minimum. This was achieved through risk assessments at each stage of the design, procurement and installation of the infrastructure.
3 Selection of a suitable site
A job aid was developed to set out the criteria for a suitable site. This covered all aspects of the site selection, including safety, and has evolved over the period to include lessons learned. See Appendix 1 for details.
4 Specification of Equipment
There are two types of installations typically done, one which provides fast charging (~20-30 mins, dependent on the vehicle) normally located in service stations, hotels and shopping centres which are close to national routes. The second type is a standard AC charge point (1-7 hours, dependent on the vehicle) used for on street parking and car parks. These are typically used in town car parks, park-and-ride car parks and at transport hubs such as train stations, bus depots and airports.
A typical AC charge post consists of two charge points with each point protected by a dedicated MCB and RCD. These are of an appropriate rating and type to facilitate a car with an on board charger rated up to 22 kW, 3 phase. The RCD are a type B as recommended by the various OEMs which provide or intend to provide electric vehicles in the European market. Upstream from a charge post an interface pillar is installed, normally 5-20 metres from the post against a wall or similar structure, which provides additional protection should there be a failure by the post’s internal protection or should the post’s tilt switch be activated. The tilt switch is designed into the post to isolate the supply from the interface pillar in scenarios where there is a significate impact on the post leading to possible physical damage. Additional physical protection is provided to the charge post by either a barrier or bollards. These are intended to protect the equipment from damage caused by vehicles parking adjacent to the charge post, or to reduce the impact to the post in more severe scenarios.
AC Charge Posts used by ESB are as per the IEC standard 61851, Electric vehicle conductive charging system and as such are required to meet IEC 61439-5 Low-voltage switchgear and control gear assemblies - Part 5: Assemblies for power distribution in public networks.

Page 201 of 625
Charge Posts have an Ingress Protection rating of IP55 and have been specified to cope the with the following Environmental conditions:
Air temperatures:
Max ambient temperature 40°C
Max daily average ambient temperature 30°C
Annual average ambient temperature 10°C
Min ambient temperature -25°C
Exposure to the following:
Salt laden atmosphere wind blown salt deposits
Rainfall average 1000mm per annum
Average Rainfall Frequency Every 1-2 days
Pollution Heavily polluted atmosphere
Solar Radiation 420 – 870 W/m2
Humidity up to 95%
wind (gust) velocity Maximum 50m/s
Typical Street Side Layout of an AC Post
Attaching the charge post to the Distribution Grid requires an interface pillar located near the charge post. Locating the charge post and pillar will rely on placing the post within 450mm of the car parking spot. A protective barrier or bollards are to be placed between the parking spot and the charge post. The amount of space left between the post, barrier and car parking is designed to impede or discourage pedestrians from walking between these items. The interface pillar should be located away from the car parking spot and shall not interfere with pedestrian passage. The diagram fig. 1 shows a typical arrangement.

Page 202 of 625
Fig. 1 - Typical Layout
Fig. 2 - Single Charge Post Interface Pillar Fig. 3 - Single Charge Post Interface Pillar
5 Vandalism
While Vandalism has not been a large problem across the country, there have been some cases of minor vandalism such as graffiti on charge post and in more serious cases, physical damage has occurred. Graffiti has been easily been removed due to Graffiti Resistant Paint used on the Charge Posts. Where there has been physical damage, there has been no instance where the damage has

Page 203 of 625
been so serious as to permit access to the internals of the post. Posts have their supply isolated in the case of a serious impact.
Most manufactures of charge posts used by ESB use steel in the construction of the body and door/panel, however one of our manufactures uses a composite plastic for this and these have proven to be more susceptible to physical damage, in particular at the base. While the manufacture has demonstrated that their posts do meet IEC 61439-5, see Appendix 2, it has shown that this requirement is not sufficient. Working with the manufacture, we have added reinforcement of the lower section and this has significantly strengthened the posts, see Fig. 6.
Fig. 4 - Graffiti and damage to steel casing

Page 204 of 625
Fig. 5 - Damage to composite casing at base of a Charge Post, no reinforcement
Fig. 6 - Added Steel Reinforcement to same type of unit

Page 205 of 625
6 Instances of unintended damage
There have been very few instances of unintended damage and this has normally resulted from vehicle impact. Where this has occurred, the damage sustained was by the protective barrier or bollards which are in place between the charge post and the parking area. Barriers were used in earlier sites but it was found that these could impede access to the charge post door/panel when carrying out maintenance, and bollards were found to be a better solution. It was also found that it is essential to reinforce bollards to prevent them being kinked as a result of an impact. Reflective tape is used to increase their visibility. All bollards and barriers are earth bonded in the event of an earth fault.
Fig. 7 - Example of a protective barrier being used

Page 206 of 625
Fig. 8 - Damage to protective bollards (Hollow) from vehicle impact
Fast Chargers which are typically placed in service stations along main routes and as such have not had any instances of vandalism. This is put to the fact that these areas are generally quite busy with customers coming and going and also are normally well equipped with security camera systems.
To date the only damage of fast charger equipment was from a delivery truck which was reversing with its tail gate down and at the truck’s floor level. At this level, the tailgate was at a height higher than that of the protective barrier and thus impacted directly with the body of the equipment. See Fig 7.
On the basis of a risk assessment, it is deemed impractical to protect charge posts against all such eventualities and the designer must take a practical approach to the selection of protection bollards, while being aware that some charge posts may get damaged in any case.

Page 207 of 625
Fig. 9 - Damage to Fast Charger from truck
7 Conclusion and Recommendation
In relation to environmental conditions, the charge point equipment used in this project has performed well in the Irish climate and no notable reduction in the integrity of the units due to their environment was observed.
Unfortunately vandalism did have an impact with one of our manufacture’s units and as such resulted in having to remove these to have them repaired. These were reinforced at that point and later deliveries incorporated the same reinforcement in the base. It was noted that while these charge points did meet the IEC 61439-5 and the withstand forces defined here, it has proven not to be sufficient. From this experience, it would be recommended that the specifications be revised to state that the charge point equipment be built to withstand several impacts and at higher force, expected to be in the range of 3-4 kN. The applied force should be applied dynamically rather than as a static force, as this is seen as more likely to be experienced by a charge post either in cases of vandalism or accidental damage.

Page 208 of 625
8 Appendices
Appendix 8.1

Page 209 of 625
Appendix 8.2

Page 210 of 625
Work Package 2.2
Monitoring of physical integrity of cabinets

Page 211 of 625
1 Describe Project Deliverable
The deliverable describes how monitoring was carried out in relation to physical integrity of the enclosures of charge posts and interface pillar.
2 Report on Project Deliverable
Monitoring of the physical integrity is done through a number of ways.
As part of Maintenance and Inspection visits twice yearly
Remote monitoring of Charge Points via the Charge Point Management System
Visual Checks by host site
Fault reports from the general public or EV users
3 Maintenance and Inspection
Most manufacturers (particular those of DC charge points due to their complexity) do have a service schedule associated with their charge points. Routine inspections of the charge points and pillars are also carried out to check for operational status and vandalism. ESB has in place the following, carried
out as part of its Maintenance and Inspection plan:
Bi-annual inspection of enclosures.
Bi-annual replacement of ventilation filters.
Bi-annual testing of electrical protection components.
Bi-annual inspection of high current paths for sign of discolouration.
Replacement of batteries on PCBs.
Planned software upgrades.
In addition there may be other requirements such as:
Cleaning the enclosure of the charge point.
Cleaning the display panel.
Cleaning contaminated data carriers (i.e. SD cards).
Rebranding the charge point after vandalism.
This work is carried out by a contractor appointed by ESB. Audits on quality and safety are routinely carried by ESB to ensure that standards are maintained. At a monthly meeting a review is carried out of the past month’s works, as well as those planned for the following month.
4 AC Public Charge Points
In general all charging equipment has a protective barrier or bollards positioned in front of the unit to protect against accidental impact of a parking vehicle. However, should such an incident occur, all AC charge posts are equipped with tilt switch, as part of the ESB specification, so that in the event of a serious impact the tilt switch would operate and the supply from the interface pillar would be disconnected, leaving the post electrically isolated. The post will also send a signal back to the charge point management system (CPMS), flagging the event. In order to do this the post is equipped with a battery which maintains power to the processor and communications equipment. This is described as a “last-gasp” event report.

Page 212 of 625
Remote monitoring of the operating status of each publically accessible charge point is a requirement of all charge point manufactures supplying to ESB.
5 Fast Charge Points
Unlike AC Public Charge points, fast charge points are much larger and heavier pieces of equipment. These are typically used in service stations and not in locations on-street, where AC public charge points are typically situated. Thus these are exposed to a far lower risk of impact and, as such, do not contain a tilt switch.
As part of our commercial agreement which the host site in these locations, the host is required to provide daily visual checks on the equipment and report any suspect or obvious damage to ESB.
6 Interface Pillars
There are two sizes of interface pillar used. The smaller size is used with on street AC public charge post and the larger for fast chargers. The interface pillars are made of galvanized steel and normally located against a wall 5 to 20 meters from the charging equipment. Due to their steel construction and low profile which are a similar standard to that of a mini pillar, no physical damage has been found to an interface pillar during the course of this project.
7 Conclusion
The monitoring arrangements currently in place have been shown to work well over the course of the project. However, vigilant monitoring will continue to be applied to ensure public safety through the
integrity of the charge post and interface pillar enclosures.

Page 213 of 625
Work Package 2.3
Assessment of safety of physical location,
protection systems and vehicle interface

Page 214 of 625
Table of Contents
1 Report on Project Deliverable ............................................................................................215
1.1 Safety of Physical Location ...................................................................................................215
1.2 Protection systems and Vehicle Interface .............................................................................215
1.3 Chademo ...............................................................................................................................215
1.4 Combined Charging System, CCS .......................................................................................218
1.5 AC Chargers, Type 2 Mode 3 ...............................................................................................219
2 Functional requirements of Mode 3 ..................................................................................220
3 Conclusion and Recommendation ....................................................................................221
4 Appendices ..........................................................................................................................222
4.1 Appendix 1 ............................................................................................................................222
4.2 Appendix 2 ............................................................................................................................224

Page 215 of 625
1 Report on Project Deliverable
1.1 Safety of Physical Location
Over the course of the project, the process of assessing how to enhance safety was fundamental to the goal of providing charging services, while eliminating or minimising safety risks at charging locations. In doing this, Job Aids were developed as a guide to engineers in locating suitable sites and avoiding areas which may pose risks to users of the infrastructure, road users or the general public. Conditions were set out regarding appropriate positioning of the chargepoint and interface pillar which would reduce the likelihood and severity of safety incidents due to pedestrian obstruction, while also providing a safe and secure secondary point of isolation. See Appendix 1.
As sites were installed and experience was gained, lessons learned from these were reviewed and the aids updated. Sites such as service stations have additional risks so a separate job aid was developed specifically for these. See Appendix 2.
1.2 Protection systems and Vehicle Interface
Under the scope of the project to provide a network of electric vehicle charge points in Ireland, the primary considerations were the present and future requirements of electric vehicle users.
ESB assessed the developing standards and direction in which the automotive industry was moving; in terms of AC connections, the Type 2 Mode 3 was supported generally across most of Europe developed based on IEC 60309 with addition of signal pins. This has, since January 2013, been backed by the European Commission as the common solution to end uncertainty about the charging station connector in Europe. The Type 2 Mode 3 is now covered in IEC 62196, Plugs, socket-outlets, vehicle connectors and vehicle inlets - Conductive charging of electric vehicles - Part 1: General requirements.
In terms of fast Charging, (power levels greater than 22kW), CHAdeMO was selected based on the cars capable of supporting such at that point. The Nissan Leaf was one of the first cars to do so and has, in recent years, been the biggest selling electric car globally and the number one in Ireland. The CHAdeMO standard was developed by Tepco and the Japanese OEMs and delivers up to 62.5 kW of high-voltage direct current power via a special electrical connector. ESB has supported this type of connection for fast charging since 2010; however as Combined Charging System (CCS) has been backed mainly by the German OEMs such as the Volkswagen group, Daimler and BMW, ESB has now moved to support both connection types with a shared power electronics to provide the 50kW DC supply, ensuring the infrastructure supports both standards backed by the Automotive Industry.
Safety in relation to Vehicle Interface
1.3 Chademo
Uses Analog communications and is designed to Fail Safe.
Both the EV and the Charger redundantly monitor charging condition
Isolation test prevents inadvertent short circuit
The connector is robustly designed
Isolation transformer prevents electrical shock
AC filters eliminates high harmonic distortions

Page 216 of 625
The connector also makes a data connection using the CAN bus protocol. This performs functions such as a safety interlock to avoid energizing the connector before its safe, transmitting battery parameters to the charging station including when to stop charging, target voltage, and total battery capacity, and how the station should vary its output current while charging. Interface details can be seen in Fig 1
Fig. 1 - Chademo Interface
Fig. 2 - Chademo Charging Sequence
As well as the protection provided via the interface between Charger and electric vechicle, the charger also contains protection internally to monitor earth faults on the primary side of the transformer as well as between the seconary side and the vechicle. See Fig 3.
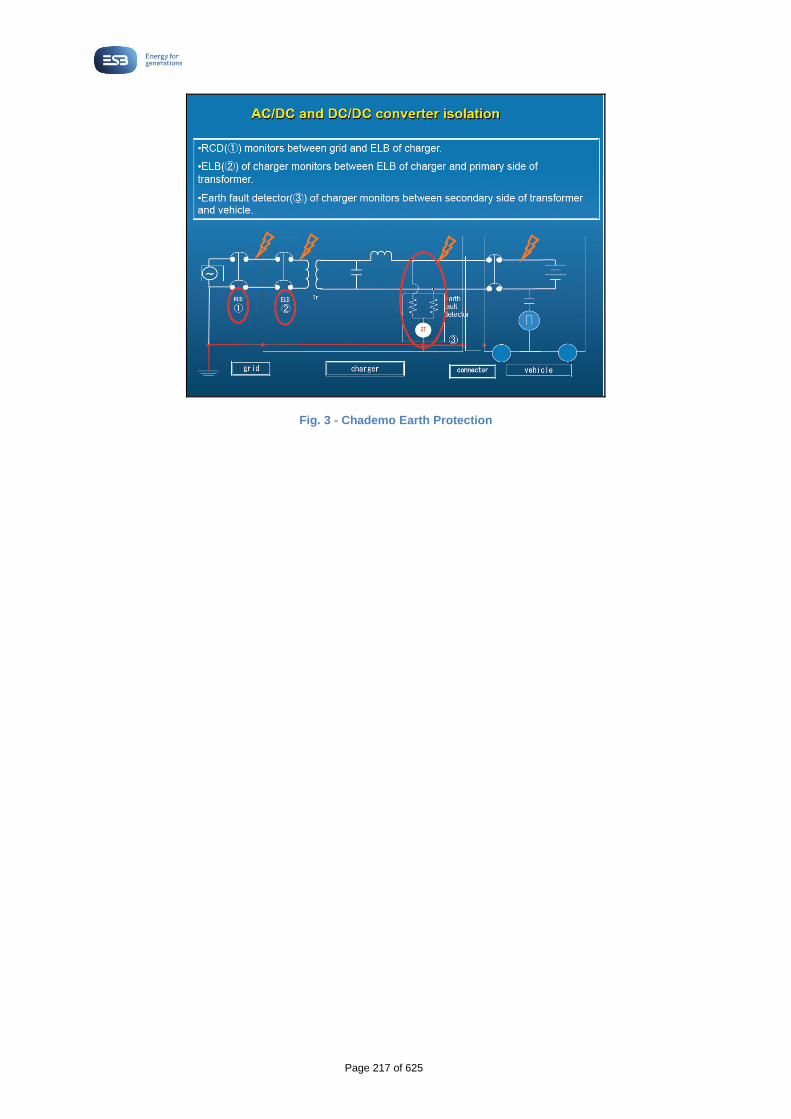
Page 217 of 625
Fig. 3 - Chademo Earth Protection

Page 218 of 625
1.4 Combined Charging System, CCS
The Combined Charging System, CCS, has grown out of the current AC standard used in the US and Europe with an additional two pins to cater for the higher level of energy transfer required by fast-charging, while still being suitable for use for AC charging in the same connection. See Fig 4
In September 2009, a request to use a PLC protocol for the Vehicle2Grid communication was given at a joint presentation of BMW, Daimler and VW on California Air Resource Board ZEV Technology Symposium. In 2011, global auto manufacturers Audi, BMW, Daimler, Ford Motor Company, General Motors, Porsche and Volkswagen all put their considerable weight behind the HomePlug Green PHY specification for connectivity with concurrent electric vehicle charging.
This is competing with the CAN Bus proposal from Japan, CHAdeMO, discussed above.
Fig. 4 - CCS Type 2 as used in the EU and Type 1 as used in the US
Fig. 5 - CCS Plug and Socket Details of the Type 2 used in Europe

Page 219 of 625
1.5 AC Chargers, Type 2 Mode 3
For AC chargers in Ireland, the standard connector type is type 2 using mode 3 as outlined in IEC 62196-1.
Mode 3 connectors have IEC 61851-1 control and signal pins connecting end to end on the cable. The charging station socket is not live if no EV is connected. For compatibility, the 32 A plugs of IEC 61851-1 Mode 2 connectors may be used, while fast charging with higher currents up to 250 A.
The charging station puts 12 volts on the contact pilot CP and the proximity pilot PP (also "Plug Present") measuring the voltage differences. This protocol allows it to skip integrated circuit electronics as they are required for other charging protocols like the CAN bus used with Chademo.
A 1000 Hertz square wave on the contact pilot CP that is connected back to the protected earth PE on the side of the vehicle by means of a resistor and a diode. The socket when opened will remain dead if the CP-PE circuit is open.
Fig. 6 - State of Electric Vechicle over Mode 3
Fig. 7 - Type 2 Connector

Page 220 of 625
2 Functional requirements of Mode 3
1. The Charge Point shall be able to determine that the connector is properly inserted in the vehicle inlet and properly connected to the Charge Point. A connected vehicle will not be permitted to be driven as per ISO 6469-2.
2. Equipment earth continuity between the Charge Point and the vehicle shall be continuously verified.
3. Energisation of the system shall not be performed until the pilot function between Charge Point and EV has been established correctly.
4. If the pilot function is interrupted, the power supply to the cable assembly shall be interrupted but the control circuit may remain energized.
With DC Charging, Mode 4, the following additional function is also required; this is applicable to both CCS and Chademo:
1. The DC charging station shall supply DC voltage and current to the vehicle battery in accordance with vehicle charging control function (VCCF) controlling.
2. The DC charging station shall measure the output current and output voltage in accordance of the tolerances defined in IEC 61851-23.
3. A means shall be provided to retain and release the vehicle coupler. Such means may be mechanical interlock, electrical interlock, or combination of interlock and latch.
4. A vehicle connector used for DC charging shall be locked on a vehicle inlet if the voltage is higher than 60 V DC. In the case of charging system malfunction, a means for safe disconnection may be provided.
5. Compatibility of EV and DC charging station shall be checked with the information exchanged at the initialization phase.
6. The DC charging station shall perform an insulation resistance test between its DC output circuit and protective conductor to the vehicle chassis, including the charging station enclosure, before the EV contactors are allowed to close. If the required value is not met, the DC charging station shall send the signal to the vehicle that the charging is not allowed.
7. The DC charging station shall perform an emergency shutdown and disconnect its supply to prevent overvoltage at the battery, if output voltage exceeds maximum voltage limit sent by the vehicle. In case of vehicle failure, disconnection from AC mains may not be necessary.
8. Where the charging stations is responsible for the locking of vehicle connector, as with Chademo, the DC charging station shall not energize the charging cable when the vehicle connector is unlocked. The voltage at which the vehicle connector unlocks shall be lower than 60 V.
9. If an earth fault, short circuit or overcurrent is detected in the output circuit of DC charging station, the power circuit shall be disconnected from its supply, but the power supply for control circuit shall not be interrupted unless the power circuit interruption is due to a loss of AC supply network (mains).
10. With the EV connected to the DC charging station and before the EV contactor is closed, the DC charging station shall have a means to check for a short circuit between DC output circuit positive and negative for the cable and vehicle coupler.
11. The DC charging station shall have a means to allow the user to shut down the charging process.
12. If more than one conductor or wire and/or vehicle connector contact is used in parallel for DC current supply to the vehicle, the DC charging station shall have a mean to ensure, that none of the conductors or wires will be overloaded.
13. For stations serving a maximum output voltage up to 500 V, no voltage higher than 550 V shall occur for more than 5 seconds at the output between DC+ and PE or between DC- and PE. For stations serving a maximum output voltage above 500 V and up to 1 000 V, no voltage higher than 110 % of DC output voltage shall occur for more than 5 seconds at the output between DC+ and PE or between DC- and PE.

Page 221 of 625
3 Conclusion and Recommendation
The job aids used by ESB help ensure assessors of potential sites to identify the typical safety issues to look for. This is complemented by a continuous review process on an ongoing basis.
With regard to vehicle interfaces the, IEC standards applicable are relatively new and technical complications do still arise due to differing interpretations of the standards by the growing number of automotive and charging equipment manufacturers. This continues to improve, however, and as increased cooperation between the parties has continued, issues arising have reduced. This experience, however, does indicate that the IEC standards will continue to evolve and become better defined.
It is recommended that changes in these standards be closely monitored and taken into account as future installations are pursued.

Page 222 of 625
4 Appendices
4.1 Appendix 1

Page 223 of 625

Page 224 of 625
4.2 Appendix 2
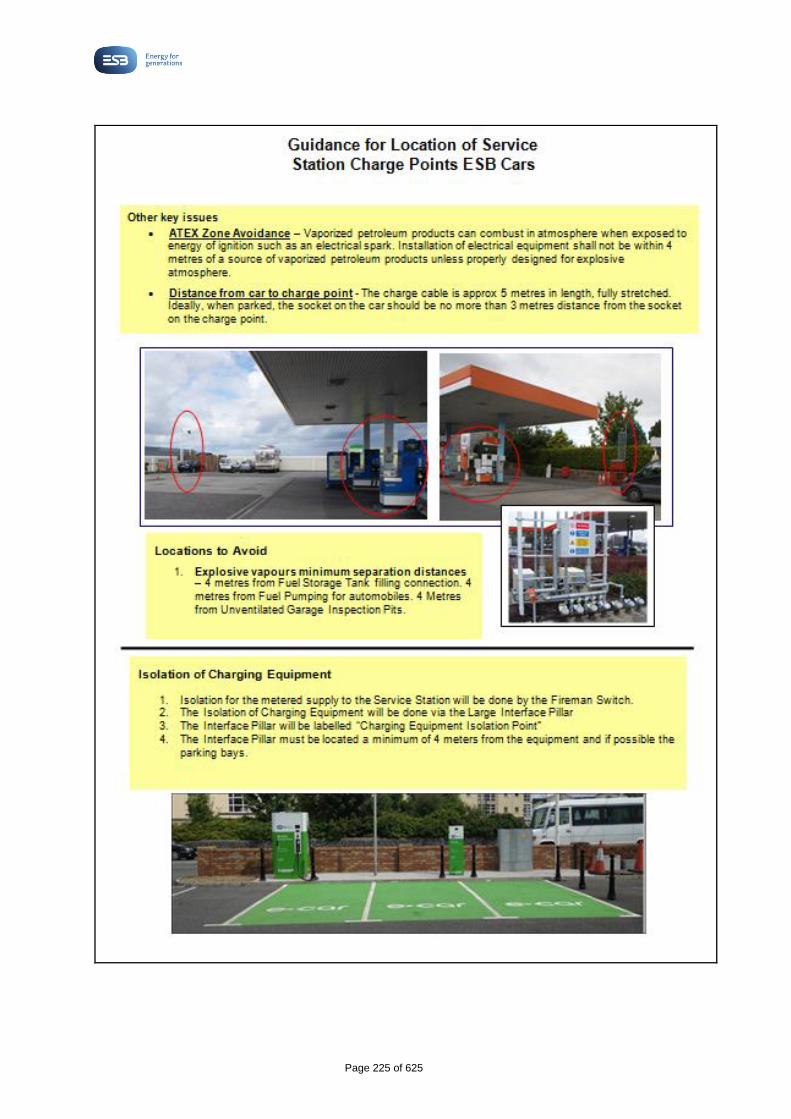
Page 225 of 625

Page 226 of 625
Work Package 2.4
The Design of a Cost-Effective Supplier-
Independent Management System for EV
Charging, Metering and Billing

Page 227 of 625
Executive Summary
The over-all solution to support the roll-out of electric vehicles in Ireland has been designed by ESB ecars as a complete end-to-end system with the flexibility to grow and adapt based on the emerging needs and demands of an industry at the very early stages of evolution. Embracing the principles of openness, transparency and customer choice, the system has been designed to be truly independent in terms of energy supplier and tariff selection.
The over-all design is inherently modular in nature – made up of multiple building blocks – including physical charge point hardware, a telecommunications-based connectivity mechanism, a network management system, a billing engine, and a customer relationship management component.
Through the charge points installed in publically accessible locations throughout the country, energy to provide a re-charging service to EV users is delivered via common EV industry charging standards at varying power levels - using both AC and DC. The ability to manage and operate these charge points is realised using a Charge Point Management System (CPMS).
Customer-related activities such as the processing of new registrations, on-going support functions, and account management services as provided by way of a Customer Relationship Management (CRM) module.
All complex billing and tariff related functions are carried-out directly in the billing engine, or core transaction processor. Various methods of billing are supported in the design; these can be based on parameters such as access fees, energy usage, subscriptions, time-of-use, and location. Payment may be handled on a pre or post-pay basis, with entities such as the network operator, energy supplier, or eMobility provider responsible for the actual customer billing process.
Energy usage data is collected using certified revenue-grade meters installed within each charge point unit, one per outlet. These record multiple measurands which are subsequently communicated to the back-office system for further processing.
The capability to integrate with the Irish energy market in order to provide settlement for the energy used is facilitated. In the long term, full retail market integration is achievable through data aggregation, together with the use of multiple per-supplier (and per tariff) “virtual MPRNs”.
However, until such time as the number of electric vehicles on the roads is significant enough to warrant the implementation of a fully integrated market, the Global Aggregation Algorithm will be employed as an interim measure.
By adopting open standards at a technical level, providing the best value to consumers, and by minimising the barriers to entry for energy suppliers, the over-all system design guarantees cost-effectiveness. In addition, it represents a blueprint for a viable and sustainable solution with the capability to support the expected increase in the number of electric vehicles on Ireland’s roads in the coming years.

Page 228 of 625
Work Package 3.1
Report on potential of advanced Smart Home
Charging

Page 229 of 625
Table of Contents
1 Introduction ........................................................................................................................230
2 Project 1 ..............................................................................................................................230
2.1 Minimum Voltage ...............................................................................................................231
2.2 Daily Mean Across Five Homes ...........................................................................................231
2.3 Selected House ....................................................................................................................233
2.4 Power Factor ......................................................................................................................235
2.5 Power Usage .......................................................................................................................235
3 Project 2 ..............................................................................................................................236
3.1 Primary Objective: Minimise the cost of charging ................................................................237
3.2 Minimisation of Total Load ...................................................................................................239
3.3 Maximising the utilisation of Renewable Energy .................................................................239
3.4 Maximising Battery Lifetime .................................................................................................240
3.5 Departure and Arrival Time Predictions ...............................................................................240
4 Project 3 ..............................................................................................................................241
4.1 Vehicle – to – Home .............................................................................................................243
5 Conclusion ..........................................................................................................................244

Page 230 of 625
1 Introduction
The range of home chargers installed in Ireland to date does not have smart functionalities. However it was important to determine the potential benefits of smart home charging, therefore ESB Networks investigated this matter through a number of projects. These projects expanded on the existing systems and trials by completing further data analysis and developing new ICT systems to allow smarter charging and ease of interaction for Electric Vehicle (EV) users with the charging infrastructures. The concept of vehicle-to-home will rely on the effective use of advanced smart home charging; as such it is discussed below.
2 Project 1
ESB Networks organised an extensive urban based trial on a section of low voltage networks in a suburb of Dublin. Homeowners were given Mitsubishi iMiEVs for a defined period and smart meters and smart home chargers were installed in these homes.
Figure 115: Smart Home Charge Point and Smart Meters
The smart home chargers allowed control of the charging patterns in order to investigate a number of parameters including; voltage optimisation, power factor, power usage and potential electricity cost savings. The analysis, charging algorithms and reporting was completed by Intel, a Mobi Europe project partner.
The source data consists of smart meter measurements from ten houses during the period from 19th November 2012 to 11th March 2013. The measurements supplied were minimum, maximum and average voltage, maximum current and average power factor. All measurements were sampled at ten minute intervals. When considering the data in a daily window, it was analysed from 12:00 to 12:00 the following day, as the effects of overnight EV charging are of particular interest. The analysis focused primarily on five of the ten houses which provided the most reliable and relevant data.
Two forms of optimization were investigated:
EnLIVE EV charging Community Optimisation – the aim of EnLIVE community optimisation was to control charging patterns of EVs in a neighbourhood to reduce the effects extra load will have on maintaining a minimum supply voltage, while delivering charge to the user’s predicted or scheduled need.

Page 231 of 625
EnLIVE EV charging Local Optimisation – the aim of EnLIVE local optimisation was to control the time and level of user’s EV charging with the aim of reducing the cost of charging while ensuring the vehicle has enough charge at predicted times of use.
2.1 Minimum Voltage
In order to comply with power quality standards set out in EN50160, ESB Networks undertakes to deliver single phase electricity within a voltage range of 207 Volts to 253 Volts (i.e. +/- 10% of nominal voltage). This section examines how effective the EnLIVE optimised EV charging system was at maintaining a minimum supply voltage compared to uncontrolled charging.
2.2 Daily Mean Across Five Homes
This sub-section examines the daily mean minimum supply voltage across the five homes. A number of dates were selected, where the type of charging falls into one of the following categories:
• No vehicle charging in any home.
• Uncontrolled charging in at least one home and no charging in any others.
• Optimised charging in at least one home, and no charging in any others.
The figures below display the mean daily voltages (Vmax, Vmin, and Vavg) from days which fall into these three categories.
Figure 116- Mean daily voltages (max, min & average) for the five meters before EVs deployed
Time
V
1213 14 15 16 17 18 19 20 21 22 23 00 01 02 03 04 05 06 07 08 09 10 11 12
218
220
222
224
226
228
230
232

Page 232 of 625
Figure 117- Mean daily voltages (max, min & average) for the five meters during uncontrolled charging
Figure 118- Mean daily voltages (max, min & average) for the five meters during optimised charging
To compare the effectiveness of the optimised charging algorithm at maintaining voltage, the Mean Squared Error (MSE) was calculated between the minimum and average voltages and the ideal voltage of a constant 230V. This was the cost value used in the EnLIVE community optimisation. These values, presented in the table and figure below, show that the optimised approach results in a lower MSE. This indicates that optimised charging was more effective at maintaining a voltage closer to the ideal voltage than uncontrolled charging, over an average day.
No Charging
Uncontrolled Optimised
Vmin 30.48 37.32 33.46
Vavg 10.24 13.49 10.18
Table 17: Mean Squared Error (MSE) between Vmin, Vavg and 230V
Time
V
1213 14 15 16 17 18 19 20 21 22 23 00 01 02 03 04 05 06 07 08 09 10 11 12
218
220
222
224
226
228
230
232
Time
V
1213 14 15 16 17 18 19 20 21 22 23 00 01 02 03 04 05 06 07 08 09 10 11 12
218
220
222
224
226
228
230
232

Page 233 of 625
Figure 119- Chart of MSE between mean Vmin and Vavg and 230V for the different EV charging scenarios
The global minimum or worst-case voltages for uncontrolled and optimised scenarios are shown in the figure below.
Figure 120- Worst case minimum voltages for no charge, uncontrolled and optimised charging scenarios
2.3 Selected House
The data from a selected house provides distinct periods of no-charging, uncontrolled charging and optimised charging. This makes it an interesting candidate for closer analysis. The daily mean minimum supply voltages were calculated for each of the three scenarios. These distributions are overlapped in the figure below, with markers for winter night electricity rates (23:00 – 08:00).
1213 14 15 16 17 18 19 20 21 22 23 00 01 02 03 04 05 06 07 08 09 10 11 12200
205
210
215
220
225
230
V
Time
No charging
Uncontrolled
Optimised

Page 234 of 625
Figure 121 - Daily Mean Minimum Voltages for Selected House
The MSEs between Vmin and 230V were calculated for the day and night periods. These values, displayed in the table and figure below, again indicate that optimised charging is more effective than uncontrolled charging at maintaining minimum voltage over twenty-four hours as well as during peak hours. This is not the case during the off-peak period, where optimised charging typically takes place.
Period Time No
charging Uncontrolled
charging Optimised charging
Day 08:00 – 23:00 47.13 60.85 45.79
Night 23:00 – 08:00 7.73 11.64 14.45
24h 12:00 – 12:00 19.76 28.08 22.95
Table 18: MSE between Minimum Voltage and 230V for Selected House
12 13 14 15 16 17 18 19 20 21 22 23 00 01 02 03 04 05 06 07 08 09 10 11 12218
220
222
224
226
228
230
232mean minV
Time
V
no EV
Uncontrolled
Optimised

Page 235 of 625
Figure 122 - MSE between Mean Vmin and 230V for Selected House
2.4 Power Factor
Power factor is the ratio of real power to apparent power, with an ideal value of 1.0 (unitless). Reductions in this are typically caused by inductive loads such as industrial motors. The source data for average power factor was frequently greater than 1.0 which is theoretically impossible. This may be attributed to measurement error at low current levels. To correct for this, all power factor data was saturated at 1.0. The average power factor is displayed in the figure below. The data would indicate no significant variation of power factor due to the presence of EV charging patterns.
Figure 123 - Average Power Factor
2.5 Power Usage
1213 14 15 16 17 18 19 20 21 22 23 00 01 02 03 04 05 06 07 08 09 10 11 120
0.1
0.2
0.3
0.4
0.5
0.6
0.7
0.8
0.9
1
Pow
er
Fa
cto
r
Time
No charging
Uncontrolled
Optimised

Page 236 of 625
Mean daily power usage is displayed in Figure 124 and mean energy values are displayed in Table 19. As expected, total energy usage is similar in uncontrolled and optimised charging scenarios as the same amount of energy is required to charge the vehicle. However by using the optimised charging method, more energy is consumed during off-peak hours than during peak hours.
Figure 124 - Mean Daily Power Usage
Period Time No charging Uncontrolled
charging Optimised charging
kWh kWh kWh
Night 23:00 – 08:00 5.86 9.87 13.33
Day 08:00 – 23:00 19.19 29.64 25.62
24h Total 25.05 39.51 38.95
Table 19: Mean Daily Energy Usage
3 Project 2
As part of the Mobi Europe project, ESB and Intel participated in the Enernet Smart Charging trial. The following section summarises the performance of the Enernet Optimisation Server for the duration of the smart charging trial. All data is indicative of a single user participating in Enernet smart charging over a three month trial period with relatively light EV usage. The equivalent annual usage for an average user under average usage behaviour is also shown.
It is important to note that the optimisation objective during the trial is the minimisation of the wholesale energy cost of satisfying the user requirements. The system could be readily extended to
12 13 14 15 16 17 18 19 20 21 22 23 00 01 02 03 04 05 06 07 08 09 10 11 120
0.5
1
1.5
2
2.5
3
3.5
Pow
er
(kW
)
Time
No charging
Uncontrolled
Optimised

Page 237 of 625
satisfy any other stakeholder objectives, for example: voltage excursion minimisation or maximisation of renewable utility.
3.1 Primary Objective: Minimise the cost of charging
Throughout this particular trial, the primary objective of the Enernet Optimisation Server was to minimise the total cost of charging for all devices in the community. Figure 1 shows the Enernet console. The Energy Cost graph shows the wholesale energy cost data which was used in the optimisation. It was calculated by combining the ‘Within Day’, ‘Ex Ante’ and ‘Ex Ante 2’ energy trading prices, available on www.sem-o.com.
Figure 125 - The Price and Load Graphs from the Enernet Optimisation Server Console
The daily wholesale costs of charging throughout the trial period for this device, as seen in the figures below, show the frequency distribution for the percentage savings in the cost of charging.

Page 238 of 625
Figure 126- The Frequency Distribution of the Savings Smart Charging Provides Compared to Regular Charging
Since the participant in this case study had relatively light energy usage, it is also useful to consider how these findings will extend to a more general use case over a sustained period of time. To extrapolate this usage to represent more typical usage, we use data from the US Federal Highway Administration to normalise the regular and optimised cost of charging for an average user over an average year of usage. Putting all of this together, the results of the trial can be summarised in the table below.
Trial
Participant Average
User-Year
Average Saving 36.4%
Max Saving 70%
Wholesale Cost of Regular Charging
€19.58 €716.69
Wholesale Cost of Optimised Charging
€14.59 €534.04
Table 20: Charging Costs and Savings
0 10 20 30 40 50 60 70 800
0.2
0.4
0.6
0.8
1
1.2
1.4
1.6
1.8x 10
-3
% Charge cost saving
Rela
tive
Fre
que
ncy
of
Occurr
ence

Page 239 of 625
3.2 Minimisation of Total Load
A secondary objective of the Enernet Optimisation Server was to minimise the total load in sections of the grid. The figure below illustrates the effect of Enernet smart charging had on the peak load over a given day. Throughout the trial period, the additional peak load resulting from EV charging was reduced by an average of 58%.
Figure 127 - A Comparison of the Peak Loads for Regular Charging and Enernet Smart Charging
3.3 Maximising the utilisation of Renewable Energy
Another result of the price-optimised primary objective was that the amount of renewable energy consumed by the EVs is increased. Figure 128 illustrates how the wind-energy content of the supplied energy over a typical day was calculated. For the entire trial period we calculated average wind-energy content for both regular and Enernet smart charging. The findings were:
Regular charging had a 19% renewable energy content.
Enernet smart charging had a 27% renewable energy content.
Enernet smart charging uses 42% more renewable energy than regular charging.
12:00 18:00 00:00 06:00 12:000
1
2
3
4
5
6
7
8
9
Time [24-hour clock]
Pow
er
[kW
]
Total home consumption with unoptimised EV charging
Total home consumption with smart EV charging

Page 240 of 625
Figure 128: Illustration of How the Proportion of Consumed Energy Derived from Wind is calculated
3.4 Maximising Battery Lifetime
Previous Intel work* with the National Renewable Energy Laboratory (NREL) has shown that managing the charging of the battery such that charging happens primarily at low cost periods can significantly increase the effective lifetime of the battery. Smart charging the battery to full capacity can increase the effective lifetime of the battery by approximately 25%. This is primarily because delaying the time at which the battery begins to charge has the effect of reducing the total proportion of time which the battery spends at a high state-of-charge, which increases the battery’s useful lifetime.
Estimating the effective useful battery lifetime is a time-consuming process which requires third-party facilitation. Hence, the exact numeric appraisal of the lifetime improvement for this particular vehicle could be conducted if deemed necessary. However, it can be reasonably assumed that the 25% improvement also applies to this vehicle.
* A. Hoke, A. Brissette, D. Maksimovic, D. Kelly, A. Pratt, and D. Boundy “Maximizing lithium ion vehicle battery life through optimized partial charging,” in IEEE PES Innovative Smart Grid Technologies, 2013, pp. 1–5.
3.5 Departure and Arrival Time Predictions
The departure and arrival time prediction algorithms are designed such that a prediction which results in an under-prediction of the amount of time available to charge should never occur. This means that the home departure times are always under-predicted (predicted earlier than the actual time) and the home arrival times are always over-predicted (predicted later than the actual time). Figure 6 illustrates the variables produces in each prediction over several weeks for a chosen weekday (Sunday in this case).
0
1000
2000
3000
4000
Pow
er
[MW
]
12:00 18:00 00:00 06:00 12:000
5
10
15
Perc
enta
ge o
f w
ind e
nerg
y
Total Power Consumption
Wind Energy Availability
Wind Energy Content [%]

Page 241 of 625
Figure 129 - Raw Predictions, Filtered Predictions and the Chosen Predictions Compared to the Actual Departure Times
In the figure above, the “predicted” values are generated by modelling the “actual” data from previous weeks as a statistical process. From the predicted variables, the “filtered predicted” are generated to ensure that predictions based on incomplete data are not fully utilised in the early weeks of training. The “chosen predicted” values are the minimum (maximum for the arrival time predictions) of the “predicted” and “filtered predicted” values. This ensures that the departure times are never over-predicted and the arrival times are never under-predicted, as evidenced in the figure above.
4 Project 3
As part of the FINESCE project, ESB Networks organised two trials. One of the trials involves the development of a Charge Optimisation System (COS) which looks to ensure that large-scale coordinated interruption and continuation of electric vehicle charging will not disrupt the local distribution network. The EV charging system that has been designed and built as part of the trial includes EVs, charge points, communications networks, a control system and control algorithms using generic enablers and domain specific enablers. The testbed is a combination of public and private test-bed facilities and is primarily operated by ESB and Waterford Institute of Technology. It allows the project partners to build capabilities in data analytics, that is the manipulation of data with the goal of discovering useful information, and in smart energy usage associated with EVs and future internet technologies (i.e. generic and specific enablers).
7.3586 7.3587 7.3588 7.3589 7.359 7.3591 7.3592 7.3593 7.3594
x 105
4
6
8
10
12
14
16
18
20
22
Day Number
Tim
e [
24
-ho
ur
clo
ck]
Predicted
Filter Predicted
Chosen Predicted
Actual

Page 242 of 625
Figure 130: Overview of trial infrastructure
Figure 130 gives an overview of the trial infrastructure. The trial aims at setting up a charging optimisation system for domestic home charging taking into account several criteria such as customer experience, grid friendliness, and renewable energy usage.
EVSEWiMAX
NT
WiMAX
Base
Station
Galway Trial
LTE
Node-B
South East Trial
Router Switch
DATA
CENTRE
FIREWALL
HEAnet
10Gbps
Layer Two
API
Home
EVSEWiMAX
NTHome
Charging
Optimisation
System
WIT
Demand
Response
Management
DN
Monitor
WiMAX
NT
Distribution Network
EVSELTE
NT
Home
EVSELTE
NT
Home
DN
Monitor
LTE
NT
Distribution Network
Validation Requests
OpenADR 2.0b
Distribution
Network
Data
(Real Time)
Power System Management
EIRGRID
SONI
Web-Servers
TSO Data
External System
External Parties

Page 243 of 625
Figure 131: Charging Optimisation System
Figure 131 shows a high level overview of the COS. The functional model presented aims to encompass the whole COS, as well as related sub-functions such as for example TSO/DSO power system management, renewable generation management, and energy market management functions.
At the time of writing this report the FINESCE project was ongoing therefore the findings were not available.
4.1 Vehicle – to – Home
As part of smarter homes, new high specification and high power appliances, such as washing machines, air conditioners, dish washers, water heaters and heating systems are being equipped with short range communication and control modules to allow control signals from home energy management systems (HEMS) to determine when these appliances operate. When there are sources of home-based generation such as solar or micro-wind, the reliance on the electricity system is reduced. The benefits are further increased with the addition of the storage and release capabilities of an electric vehicle.
Up until recently the electric vehicle has been viewed as another load on the electricity system. Typically the home charge point provides AC power to the EV, and a battery charger converts this AC to DC and charges the EV’s battery. Reversing the power flow allows home appliances to be powered by the EV if required.
EVSE Controller
Distributed Computation
Conflict Resolver
Grid Emergency Processing
Charging Interruption
Management
Content Based Security
Analytics Engine
Data Validation
Data Parsing
Data Processing
Data Handling
SERVODistribution
NetworkImpact
Charging ChangeAuthorisation
Content Based security
DB Anonymiser
Complex Event Processer
COS DSE
GE
GE
GE
GE
GE
Optimisation Service
Regional Power Optimiser
Interruption Prioritisation
Charging Schedule Calculator
Renewable Management
Administration Dashboard
Identity Management GCP
GE
Cloud Edge
GE
SME
Grid Emergency
Initiator
OpenADR2.0b

Page 244 of 625
The use of the EV in a vehicle-to-home system has a number of benefits for the home owner and the electricity system operator such as; 1) a reduction of demand during peak times, 2) a reduction in home owner energy costs though maximising lower tariff periods, 3) an increase in renewable energy demand and corresponding reduction in CO2 emissions and 4) use as a backup power supply for emergencies.
Vehicle-to-home systems have already been developed by OEMs such as Nissan, Mitsubishi and Toyota and, as of April 2015, are available as upgrade kits for EVs on sale in Japan.
5 Conclusion
The smart charging trials have demonstrated a number of benefits that can be accrued by EV users and by electricity system operators through the use of EVs, namely; cost savings, use of renewables, minimisation of total load, voltage control and peak load shifting.
The EnLIVE EV optimisation trial showed benefits of the smart charging. The optimised charging algorithm maintained the voltage close to the ideal value (230 V) compared to the uncontrolled charging scenario. The results of the optimisation detailed above show that a significant portion of the EV charging load was shifted from day time to night time.
The main findings of the Enernet Smart Charging trial were:
The daily price of charging was reduced by an average of 36.4% (and a maximum of 70%).
The additional peak load due to EV charging was reduced by an average of 58%.
42% more renewable energy was used by smart charging.
The effective lifetime of the battery can be extended by 25% by smart charging
While these benefits are positive, a larger scale study should be completed to verify that these benefits will be realised if there is a mass rollout of EVs and smart chargers.
The FINESCE project was ongoing at the time of writing this report therefore the final project findings are not currently available. Before vehicle-to-home systems can be deployed, the ability to control and optimise the charging of EVs in homes needs to be in place. These systems offer further potential benefits to stakeholders, including homeowners and System Operators.

Page 245 of 625
Work Package 3.2
Report on potential benefit of Smart Network
Operations to increase hosting capacity of EVs

Page 246 of 625
Table of Contents
1 Introduction .........................................................................................................................247
2 Parallel Low Voltage Networks - Desktop Study .............................................................247
2.1 Introduction ...........................................................................................................................247
2.2 Review of Literature ..............................................................................................................247
2.3 LV Network Test Model .........................................................................................................248
2.4 Testing of Model ....................................................................................................................249
2.4.1 Benefits in Voltage from using Parallel Networks .................................................................249 2.4.2 Improvement in Losses .........................................................................................................255
2.5 Fault Behavious on a Parallel Network .................................................................................259
2.6 Findings .................................................................................................................................260
3 SOP Trial ..............................................................................................................................261
3.1 Introduction ...........................................................................................................................262
3.2 Testing the SOP Device ........................................................................................................262
3.2.1 Test Setup .............................................................................................................................262 3.2.2 Test Procedure ......................................................................................................................264
3.3 Results ..................................................................................................................................265
3.3.1 Power Transfer ......................................................................................................................265 3.3.2 Power Quality Measurements ...............................................................................................265 3.3.3 Thermal Imaging ...................................................................................................................266 3.3.4 Noise Measurements ............................................................................................................267
3.4 Applications ...........................................................................................................................268
3.5 Conclusion ............................................................................................................................268
4 Conclusion ...........................................................................................................................269

Page 247 of 625
1 Introduction
ESB Networks have completed a number of studies to investigate the benefit of Smart Network Operations to increase the hosting capacity of electric vehicles (EV) on its network. One of the activities ESB Networks completed was a desktop study of Parallel Low Voltage Networks. The purpose of the study was to investigate meshing of LV networks as a solution for increased voltage and network capacity to allow for higher penetrations of EVs. Another activity which investigated a solution to increase hosting capacity of EVs was the trialling of a Soft Open Point device (SOP) on the LV network. The SOP was designed to provide automatic power transfer between LV feeders and to mitigate potential problems due to increased penetration of EVs. These two studies are discussed in detail below.
2 Parallel Low Voltage Networks - Desktop Study
2.1 Introduction
Typically cables feed radially from the substation, and if the urban area is sufficiently dense, will tend to interconnect with other circuits, either from the same or different substations, at Normally Open points. This means that the impact of a concentration of load may be more significant in one feeder than another, resulting in a requirement for reinforcement of the heavily loaded feeder.
One possible way of deferring such reinforcement would be if it were possible to solidly inter-connect the two feeders so that the total feeder capacity of both was now available and the overall load now spread across two feeders rather than concentrated on one. Interconnected LV networks are used in some large cities in, for example, Germany.
With this in mind ESB Networks completed a desktop study of interconnecting LV networks. The research investigated the benefits and disadvantages of operating pairs of Low Voltage (LV) feeders in parallel in comparison to radial operation. The LV network represents the portion of the distribution systems operating at 400 V nominal. With the use of coherent and thorough modelling of an existing section of LV test network, loads representing that of EVs were added to a test network with the aim of comparing the volt drop and losses of radial and parallel networks.
A radial network is a configuration with no normal connection to any other supply. This is the typical connection type for the distribution network. A parallel network has two or more connections to other points of supply. To date, ESB Networks, in common with most other utilities, have developed their LV Network in a radial manner. Changing the operation of LV Networks from radial to parallel can be as straightforward as closing or removing the normally open (NO) points that are built into the network.
2.2 Review of Literature
Many studies have recognised the benefits of paralleling at MV. Parallel networks have well known advantages versus radial schemes: a reduction of power losses, a better voltage profile, a greater flexibility and ability to cope with the load growth, and an improvement of power quality due to the fault level increase at each bus.
The literature also highlights some disadvantages to parallel networks including short circuit level, voltage regulation, and protection coordination. Short circuit level can increase to intolerable values and this fact can lead to change in many switchgears in the network.

Page 248 of 625
2.3 LV Network Test Model
A section of LV network in a suburb of south Dublin was selected as the location for the test network modelling. The section was selected as it is representative of modern underground LV network found throughout Dublin and was the test location for an EV trial. The test network is connected in parallel and consists of two 10kV/400V transformers supplying a total of 104 domestic loads on two sections of LV network.
Figure 132 below shows the layout of the feeders being considered. An operable switch was included between the blue and yellow lines. This made it possible to test the model in radial and parallel. The blue line forms Feeder A and the connection of the red and yellow lines form Feeder B. The number of customers was altered to balance across both feeders (54 on each feeder); however, the cable spans remained unchanged. The total cable distance between both substations is 660 m. There is 229 m from unit sub A to the NO point and 361 m from the NO point to unit sub B.
Figure 132: Test LV Network connected in parallel to two MV/LV substations
The sending voltage of each substation was set at 244 V - 4% or 234.24 V. This is a figure that experts in the field deemed realistic for the load being considered. This figure acts as the voltage base for per unit analysis.
Typically the LV Network in a housing estate is designed for a volt drop of no more than 5% under normal feeding arrangements using an After Diversity Maximum Demand (ADMD) of 2.3 kW. Therefore the demand for each household was assigned as 2.3kW which was modelled as a 50% constant power, 50% constant impedance load at 0.95 power factor. Based on previous studies and reports an EV load was modelled as a 4 kW constant power load at unity power factor. Existing cable properties were used in the modelling.
The test carried out in this study consisted of snapshot analysis of these feeders. Therefore the loads from EVs were added to the test feeders in increments of 25% (ex. 100% penetration meant that every customer had the 4 kW EV load, in addition to their 2.3 kW base load.

Page 249 of 625
2.4 Testing of Model
This section examines the results of the load flow analysis to assess the benefits of operating the feeders in parallel. First, the results of the radial and parallel load flow were used to determine the variation in voltage along the feeders. This was done when both feeders were supporting the same level of EV penetration. Next the maximum diversified load was applied across both feeders in turn, where one feeder was allocated with 100% load and the adjacent feeder allocated with the ADMD per household. The change in variation in voltage along the test network was recorded.
Furthermore the decrease in volt drop was assessed for every combination of loading. This involved running the load flow, while holding one feeder constant and increasing the other in increments of 25%. This was done to further investigate the increase and decrease in delivered voltage when operating the network in parallel compared to the normal radial configuration.
2.4.1 Benefits in Voltage from using Parallel Networks
This section investigates the benefits of using parallel configurations as opposed to radial configurations by comparing the variation in voltage across the feeders with identical EV loading.
Figure 133 shows the voltage recorded from each mini-pillar on feeders A and B during two loading scenarios. The upper dots in blue and pink represent the voltage of each mini-pillar with 0% penetration. The green dots represent the voltage of the mini-pillar when the NO point is closed.
Figure 133: Voltage of Mini-Pillars on Feeders A & B
With each customer given this load at 0.95 power factor, the voltage drop along both feeders was short of the 5% limit (shown in red), which indicates that the feeder was allocated more capacity than is needed. They are designed to have a 5% volt drop across the mains cable when each customer has the ADMD. Here, 2.3kW was modelled for each customer and the volt drop across the mains cable came to just 2%. Therefore, while the network was designed not to exceed 5% volt drop, there is only a volt drop of 2%. This is due to the use of standard 4x185 AL Xlpe cables for general usage to minimise losses, and where distances in more dense urban areas are shorter due to land prices, so that ampacity becomes a constraint before voltage.
Since the two feeders have the same number of customers, there should be no change when the NO point is closed. This however is not the case, since the mains cables in each feeder span different distances. Feeder B undergoes a bigger volt drop than Feeder A due to the fact that there are longer cable spans in Feeder B. Thus when the NO point is closed the feeder balances out, the voltage of Feeder B increases slightly and the voltage of Feeder A experiences a minor decrease.
Variation Along Feeder
0.89
0.91
0.93
0.95
0.97
0.99
Roebuck A1 A2 A3 A4 A5 A6 X2 X3 2D1 1D1 D2 D1WhiteOak
Mini-Pillar I.D.
Vo
lta
ge
[p
u]
Feeder A 0%
Feeder B 0%
NO Closed 0%
Feeder A 100%
Feeder B 100%
NO Closed 100%
Limit

Page 250 of 625
This phenomenon is highlighted more clearly in the case when both feeders are supporting the load of 52 EVs in addition to the 2.3kW base load. In Figure 133 the lower dots in orange and black correspond to the voltage of each mini-pillar along the feeder when loaded at 100%. The light blue line is the voltage of the mini-pillars when the NO point is closed. From this, a bigger change in voltage of Feeders A and B can be seen.
In both cases it is seen that when the NO point is closed the voltage on one feeder rises and on the other drops, with the resulting voltage profile being at an intermediate level between those arising from radial feeding.
Figure 134 below shows the variation in voltage along the feeder when allocated with loads corresponding to an EV penetration of 25% and 75%. The dots of orange and black represent the voltage measured from the mini-pillars at the 25% penetration. The light blue line represents the voltage at the same locations measured when the NO point was removed from operation. The voltage support provided from Feeder A was able to decrease the overall volt drop on Feeder B to be well within in the 5% standard.
Figure 134: Voltage of Mini-Pillars on Feeders A & B
The lower dots of blue and pink correspond to the recorded voltage from the mini-pillars when both feeders were penetrated to 75%. As the cable spans on Feeder B are greater than those of Feeder A, a bigger volt drop is present on Feeder B. Here the volt drop on Feeder B is in excess of the 5% limit and the volt drop on Feeder A is just within standard. Closing the NO point greatly improves the volt drop on Feeder B. However it is insufficient in providing enough voltage support to the feeder. It also increases the volt drop on Feeder A to be outside standard.
This highlights the potential danger in relying on there being enough voltage support for both feeders. Connecting the feeders in parallel to increase the delivered voltage above standard is only possible if the other feeder is above standard.
Figure 133 and Figure 134 show that by closing the NO point there is a voltage increase along the feeder that is suffering the greater voltage drop. This larger volt drop can be due to greater cable spans of the feeder (as seen above) and/or can be due to the fact that one of the feeders is supporting a bigger load. The bigger the voltage drop experienced on the feeder, relative to the other feeder, the bigger the improvement in voltage. To highlight this, each feeder was in turn fully loaded with loads representing that of an EV, while holding the load on the adjacent feeder constant with each household consuming the ADMD of 2.3kW.
Variation Along Feeder
0.9
0.91
0.92
0.93
0.94
0.95
0.96
0.97
0.98
0.99
1
Roebuck A1 A2 A3 A4 A5 A6 X2 X3 2D1 1D1 D2 D1 WhiteOak
Mini-Pillar I.D.
Vo
lta
ge
[p
u]
Feeder A 25%
Feeder B 25%
NO Closed 25%
Feeder A 75%
Feeder B 75%
NO Closed 75%
Limit

Page 251 of 625
A 4kW constant power load, representing that of an EV, was given to each of the 52 customers on Feeder A in addition to the 2.3kW (50% constant power, 50% constant impedance at 0.95 power factor) load. Each customer on Feeder B was allocated with just the base 2.3kW load.
At 100% penetration of EV loading on Feeder A the voltage on the 3-phase mains cables feeding 3 mini-pillars exceeded the allowable 5% loss in voltage, as seen in Figure 135. The voltage at each of the mini-pillars on Feeder B was within standard, as there was only a 3% loss in voltage from the start to the end of the feeder. The results indicate that on closing the NO point, the voltage at each of the mini-pillars on the lighter loaded Feeder B was still within standard. On closing the NO point the voltage on Feeder A improved to be just above the 5% standard.
Figure 135: Voltage of Mini-Pillars on Feeder A at 100% and Feeder B at 0%
When Feeder A is fully loaded, closing the NO point at a time when the adjacent feeder is only loaded with ADMD, the last mini-pillar sees an increase of 2.57V or 0.011pu. The decrease in the voltage of the last mini-pillar on Feeder B came to 3.27V or 0.0139 pu. This decrease is justified since the LV feeder is now operating above standard. If the switch was closed and the adjacent Feeder B was also 100% loaded with EVs, this would result in a decrease of 2.55V to the same mini-pillar, as seen in Figure 133.
The opposite case was then considered, when both feeders were again allocated the base 2.3kW per customer and each of the 52 customers on Feeder B were given a 4kW EV load. Figure 136 shows that in this scenario the voltage seen by all mini-pillars on Feeder A were within the 5% limit. However, the voltage seen by four of the mini-pillars on Feeder B was in breach of the 5% limit.
Variation Along Feeder
0.9
0.91
0.92
0.93
0.94
0.95
0.96
0.97
0.98
0.99
1
Sub A A1 A2 A3 A4 A5 A6 X2 X3 2D1 1D1 D2 D1 Sub B
Mini-Pillar I.D.
Vo
lta
ge
[p
u]
Feeder A
100%
Feeder B
0%
NO Closed
Limit

Page 252 of 625
Figure 136: Voltage of Mini-Pillars on Feeder A at 0% & Feeder B at 100%
On closing the NO switch the results indicated that the voltage of each of the mini-pillars on the lightly loaded feeder was still above standard. The voltage of each of the mini-pillars on Feeder B improved. However, the improvement in losses along the feeder was insufficient in bringing two of the mini-pillars within standard, as they remained marginally outside the allowable 5% drop.
When Feeder B is fully loaded, closing the NO switch at a time when the adjacent feeder is only loaded with ADMD, the last mini-pillar sees an increase of 0.03283pu or 7.98V. If the switch was to close and the adjacent feeder was also 100% loaded with EVs this would still result in an increase of 1.9V in the voltage of the same mini-pillar, as seen in Figure 133.
It is clear from the above results that on removal of the NO point from two feeders experiencing different volt drops, which the total volt drop measured from one of the feeders will see a decrease while the other will see an increase. The voltage on the end of the heavier loaded feeder will increase while that of the lighter loaded feeder decreases.
In all cases closing the NO point results in a decrease in the volt drop seen by the heavier loaded feeder; in other words an improvement in voltage to the mini-pillar furthest away from the sub-station. This section investigates how the increase in voltage seen by the heavier loaded feeder compares to the decrease in voltage seen by the lighter loaded feeder.
Under normal radial operation, with the NO point open, the voltage drop for different loading scenarios along the feeder is plotted below in blue for Feeder A and red for Feeder B. The network was then connected in parallel and the volt drop along the feeder was found and plotted here in beige for each of the loading scenarios considered. Seen below in Figure 137 is the volt drop measured as a percentage of the radial and parallel cases. This graph shows Feeder B held constant at 0% penetration and Feeder A increasing in EV penetration in increments of 25%.
Variation Along Feeder
0.9
0.91
0.92
0.93
0.94
0.95
0.96
0.97
0.98
0.99
1
Roebuck A1 A2 A3 A4 A5 A6 X2 X3 2D1 1D1 D2 D1 WhiteOa
Mini-Pillar I.D.
Vo
lta
ge
[p
u]
Feeder A
0%
Feeder B
100%
NO Closed
Limit

Page 253 of 625
Figure 137: Change in volt drop for a Feeder B at 0%
Subsequently the NO point was returned and Feeder B was allocated with 25% EV penetration. The greatest volt drop experienced on both feeders was measured as the penetration of EVs on Feeder A was increased in increments of 25%. Each increment was then tested for the worst volt drop measured with the removal of the NO point. The results in percentage volt drop are seen in below in Figure 138.
Figure 138: Change in Volt Drop for Feeder B at 25%
This procedure was repeated for the penetration of EVs on Feeder B held constant at 50%. The resulting recorded volt drop of the radial and parallel networks are seen here in Figure 139.
Volt Drop with Feeder B: 0%
0
1
2
3
4
5
6
7
8
0% 25% 50% 75% 100%
Feeder A: %EV
Vo
lt D
rop
alo
ng
Fe
ed
er
[%]
Volt Drop A
Volt Drop B
Volt Drop NO
Closed
Volt Drop with Feeder B: 25%
0
1
2
3
4
5
6
7
8
0% 25% 50% 75% 100%
Feeder A: %EV
Vo
lt D
rop
alo
ng
Fe
ed
er
[%]
Volt Drop A
Volt Drop B
Volt Drop NO
Closed

Page 254 of 625
Figure 139: Change in Volt Drop for Feeder B at 50%
Once again the test was repeated for Feeder B held constant at 75% penetration of EVs. The results are found in Figure 140 below.
Figure 140: Change in Volt Drop for Feeder B at 75%
The final test had the load on Feeder B represent that of 100% penetration and Feeder A increasing in increments of 25%, as seen in Figure 141.
Volt Drop with Feeder B: 50%
0
1
2
3
4
5
6
7
8
0% 25% 50% 75% 100%
Feeder A: %EV
Vo
lt D
rop
alo
ng
Fe
ed
er
[%]
Volt Drop A
Volt Drop B
Volt Drop NO
Closed
Volt Drop with Feeder B: 75%
0
1
2
3
4
5
6
7
8
0% 25% 50% 75% 100%
Feeder A: %EV
Vo
lt D
rop
alo
ng
Fe
ed
er
[%]
Volt Drop A
Volt Drop B
Volt Drop NO
Closed

Page 255 of 625
Figure 141: Change in Volt Drop for Feeder B at 100%
In most cases, the decrease in the voltage of the lighter loaded feeder is less than the increase in voltage seen by the heavier loaded feeder. However, there were six cases where there was a greater decrease in voltage than there was an increase. The worst scenario yielded a nominal voltage change of -1.25V. This was in the case of Feeder A loaded at 100% and Feeder B loaded at 0%. Closing the NO point saw the volt drop on Feeder A decrease by 2.57V and the volt drop on Feeder B increase by 3.82V.
There are major advantages to be gained from paralleling at LV. The results of the testing have shown that in a parallel configuration, as many as 65 households (of a possible 104) can draw a 4kW EV load in addition to the 2.3kW base load before the voltage drop on the network goes beyond the 5% standard. If connected in parallel, Feeder A could potentially be penetrated to 100% providing Feeder B was kept below 25%. Feeder B could be penetrated to just under 75% providing Feeder A was kept below 25%. Both feeders could support 50% penetration. There is an improvement from the radial configuration, where Feeder B could only be penetrated to 25% and Feeder A could only be penetrated to 50% before any volt drop issues arose.
2.4.2 Improvement in Losses
The losses on the Feeder are thought to decrease when the NO point is removed. To test whether this is indeed the case the losses on the feeder under normal radial operation are determined and compared to the losses found when the feeders were fed in parallel.
With Feeder A and B loaded with the base 2.3kW per customer and no EVs, the power needed to supply the load was 126kVA. The sending power of each of the substations came to 136kVA, which meant that there was an overall loss of 10kVA on each of the feeders. Closing the NO point at this time resulted in the output of both substations changing, where load from Feeder B was now being supported from sub A. Their combined output marginally changed.
There is less power being sent due to the fact that there are fewer losses on the feeder. This network can be considered to be more efficient in supplying a load, as the best possible voltage is supplied to that load.
Considering that the loads present on this feeder are 50% constant power, 50% constant impedance (customer loads), and 100% constant power (EV loads), one would expect the losses on the feeder to decrease. A constant power load will draw a constant amount of real and reactive power as the supplying voltage varies. An increase in voltage supplied will mean the constant power load draws less current. As losses are proportionate to the square of the current, the losses are reduced. Here,
Volt Drop with Feeder B: 100%
0
1
2
3
4
5
6
7
8
9
0% 25% 50% 75% 100%
Feeder A: %EV
Vo
lt D
rop
alo
ng
Fe
ed
er
[%]
Volt Drop A
Volt Drop B
Volt Drop NO
Closed

Page 256 of 625
removing the radial nature of the network increases the voltage of the heavily loaded feeder and in turn decreases the current drawn for the same load on a radial connection.
The following graphs show the decrease in losses that occur when connected in parallel compared to normal radial operation. In every case the cumulative power from both unit subs is found for radial operation and subtracted from the cumulative power of both unit subs for the parallel case.
Seen below in Figure 142 is the decrease in overall losses with the load on Feeder A held constant at 0% penetration of EVs, and the load in Feeder B increasing in increments of 25% EV loading.
Figure 142: Decrease in Losses with Feeder A at 0%
This shows that the bigger the load and voltage diversity between the feeders, the greater the savings in losses on the feeder when connected in parallel. This is clearly the case because losses are proportional to I2, and hence equalising currents between two feeders reduces I2 and minimises losses. Removing the NO point balances the volt drop on the feeder to a newly determined low point and sees both substations change their sending power. There is now less power needed to support the same load since the network is more efficient i.e. voltage received by loads is greater.
Figure 143 below shows the decrease in losses on the feeder (due to the decrease in the power sent by the substations to support the reconfigured network) with the load on Feeder A held constant at 25% and the load on Feeder B increasing in increments of 25%.
Decrease in Losses with Feeder A: 0%
0
1
2
3
4
5
6
7
8
9
10
0% 25% 50% 75% 100%
Feeder B: %EV
Dec
reas
e in
Los
ses
[kV
A]

Page 257 of 625
Figure 143: Decrease in Losses with Feeder A at 25%
The trend of the plot again indicates that the bigger the diversity between the loads on the feeders, the greater the improvement in losses provided from the parallel configuration. Both feeders penetrated to 25% show the lowest improvement in the losses. However, there is nonetheless still an improvement. There are more losses on Feeder B than Feeder A at this time. Closing the NO point results in the balancing of the voltage and overall decrease in the losses on the feeder. The greatest improvement again occurs with Feeder B penetrated to 100%
Figure 144 below shows the improvement in losses on the feeder (due to the decrease in the power sent by the substations to support the reconfigured network) with the EV load on Feeder A held constant at 50% and the EV load on Feeder B increasing in increments of 25%.
Figure 144: Decrease in Losses with Feeder A at 50%
Losses with Feeder A: 25%
0
1
2
3
4
5
6
7
8
9
10
0% 25% 50% 75% 100%
Feeder B: %EV
Dec
reas
e in
Los
ses
[kV
A]
Losses with Feeder A: 50%
0
1
2
3
4
5
6
7
8
9
10
0% 25% 50% 75% 100%
Feeder B: %EV
Dec
reas
e in
Los
ses
[kV
A]

Page 258 of 625
Here the same conclusion can be drawn as losses again are seen to improve with the losses on the feeder improving in correlation between the load diversity between feeders.
Figure 145 below shows the improvement in losses on the feeder (due to the decrease in the power sent by the substations to support the reconfigured network) with the load on Feeder A held constant at 75% and the load on Feeder B increasing in increments of 25%.
Figure 145: Decrease in Losses with Feeder A at 75%
Here the same conclusion can be drawn as losses again are seen to improve with the losses on the feeder improving in correlation between the load diversity between feeders.
Figure 146 below shows the improvement in losses on the feeder (due to the decrease in the power sent by the substations to support the reconfigured network) with the load on Feeder A held constant at 100% and the load on Feeder B increasing in increments of 25%.
Losses with Feeder A: 75%
0
1
2
3
4
5
6
7
8
9
10
0% 25% 50% 75% 100%
Feeder B: %EV
Dec
reas
e in
Los
ses
[kV
A]

Page 259 of 625
Figure 146: Decrease in Losses with Feeder A at 100%
Here the same conclusion can be drawn as losses again are seen to improve with the losses on the feeder improving in correlation between the load diversity between feeders.
All loading scenarios investigated above yielded the same result when assessing the change in losses on the system. The overall losses on a parallel fed feeder, will either be less than or equal to the total losses on the two feeders, fed in traditional radial manner. When there are constant power EV loads present on the network the benefits for losses of paralleling are increased. If the loads were of constant current, the losses are proportionate to the square of the current, so there would be no change in the losses on the feeder as result of paralleling. For constant impedance loads implementing the paralleling of LV networks will introduce an increase in the voltage supplied, thus an increase in the power used and hence an increase in losses.
To conclude, paralleling at LV should improve the losses on the feeder or at the very least have no negative effect. In the case of the network test model examined, the greatest percentage change in losses occurred at a time when diversity in load between the feeders was greatest, when Feeder A and B were penetrated to 0% and 100% respectively. Here a 32% change in losses was recorded (e.g. 29.96kVA with NO point in operation versus 20.36kVA when connected in parallel).
2.5 Fault Behavious on a Parallel Network
One of two scenarios may occur in the event of a fault on a parallel network. The fault current may be reduced through each fuse at the substations and the fault may not blow substation fuses. Alternatively, the fault current is increased at the point of fault and may exceed equipment ratings. The impedance of the fault and the feeders determines which of the above scenarios occurs.
If the fault is of high impedance (relative to the cable impedances) then the fault current from both subs will be less than the fault on a radial fed sub. The current feeding into the fault will remain more or less the same. If the fault is of low impedance the fault current from the subs will be more or less the same as when radial connected, however this will mean the current feeding into the fault has increased in value, possibly to an amount in excess of the equipment rating.
Both scenarios were analysed using the Ohmic value method. In the case of the high impedance fault the results show that a similar fault current is flowing into the location of the fault. The contribution however from each unit sub is more or less halved. The danger here is that there may be a scenario
Losses with Feeder A: 100%
0
1
2
3
4
5
6
7
8
9
10
0% 25% 50% 75% 100%
Feeder B: %EV
Dec
reas
e in
Los
ses
[kV
A]

Page 260 of 625
where the fuses at the substation are unaware of a fault on the network due to the high impedance fault. In the case of the low impedance fault the results show that a similar current is flowing from each of the unit subs. At the location of the fault however there is approximately double the current present. The danger on a parallel network in the case of a low impedance fault is that the fault current may greatly exceed the rating of the equipment. In practice however, the fault current will be limited by the impedance of the feeders themselves, so that this scenario is only likely where the feeders operating in parallel are very short, in which case there is little advantage in paralleling them.
A 3 phase fault was simulated at every section on the LV network test model connected in parallel to assess the varying levels of 3 phased fault current. The model suggested that when feeding into a fault, the current from Sub A is independent of the current from Sub B. The impedance of the path from the Sub to the location of the fault determines the fault current. The fault current is the ratio of the system voltage to the impedance, as seen from the fault point. This behaviour, as seen in the above example, is typical of a low impedance fault. Figure 147 below shows the variation in fault current as the location of the fault is varied over the feeder. Also seen, is the contribution of unit subs A (Green) and B (Red) to the fault.
Figure 147: Variation in 3 Phase Fault on Test Network
The graph above shows the trend in the 3-phased fault current along the feeder. The model was tested for a fault at every section joining two mini-pillars. At every section along the feeder the 3-phased fault current was measured, seen here in blue. The green line is the current from Sub A and the red line is the current from Sub B at the time of the fault. The summation of the currents from sub A and B approximately equals the 3-phase fault current.
If the NO point of LV networks are to be removed, a protective device must be fitted in its place to isolate a fault. Continuity of the network should remain unaffected by the change in network topology.
2.6 Findings
The desktop study set out to prove that there are inherent benefits to operating the LV Network in parallel with a high penetration of EV loads. A comparison was made with two radial networks to test for load flows. The results show that a higher penetration of EVs could be supported on the test network model with the NO point removed allowing the feeders to operate in parallel. Issues relating to faults on a closed loop network were addressed and the report distinguished high and low impedance faults as possible events.

Page 261 of 625
The benefits of paralleling include a decrease in overall volt drop and a decrease in losses on the system. This research found that:
65 households (out of a possible 104) can draw a 4kW EV load in addition to the ADMD
before the volt drop on the mains cable increases above 5%. This is an improvement from 26
on Feeder A and 13 on Feeder B when operating in a radial configuration.
The biggest improvement in losses was a 32% decrease. This occurred when Feeder A and B
were penetrated to 0% and 100% respectively.
It was found that the losses were reduced, or remained the same, but never increased when
the network was modelled in parallel.
A major issue relating to the paralleling of LV Networks is in the event of a fault. The research found that:
• The contribution from a unit sub to the fault current may be greatly reduced in the case of a
high impedance fault.
• The contribution from a unit sub to the fault current may be slightly increased in the case of a
low impedance fault.
• In the case of a 3 phase fault on the simple models examined, the distance from the feeders
where the fault would go undetected came to 2.6km. This suggests that paralleling urban LV
networks with cable lengths considerably less than this would be no problem.
• Further investigation into cable spans from a high impedance faults is required as calculations
were done for a low impedance fault. It is expected that this would cause considerable lower
short circuit currents to flow and therefore the distance the fault would go undetected would
greatly decrease and therefore pose a problem to urban networks.
• These results indicate the need for a device that will recognise the characteristics of a fault on
a parallel network.
It is necessary to install a device that is not only responsive to the magnitude of fault currents but is also unresponsive to typical currents flowing at a time of high diversity in demand between the feeders. In addition, the device must be able to react quicker to a fault than the fuses in place at the unit subs. This will ensure that the fault is isolated from a functioning feeder. In summary, a potential device needs to:
• Have discrimination between the fuses in series at the unit subs.
• Recognise a fault current.
• Be able to operate with a current of up to 120A, based on the LV test network.
In addition paralleling at LV between two substations which may not be on the same network segments can result in inadvertent back-feeding which can be problematic during a fault. This in turn requires that some extra switchgear is required in the Unit Substation at either end of the feeder, and possibly also at the NO point.
If this were achieved, then the benefits of providing voltage support to facilitate high penetration of EVs could be realised with the added bonus of reducing losses on the LV network while keeping the continuity of the system unaffected.
3 SOP Trial

Page 262 of 625
3.1 Introduction
The Soft Open Point (SOP) is a prototype device provided to ESB by Alstom Grid as part of the Green eMotion project. The device was installed at ESB Networks (ESBN) Portlaoise Training School, Portlaoise Town, County Laois, Republic of Ireland with commissioning and testing taking place in January 2015. The ESBN training school contains a live network of utility assets with voltage levels ranging from 38kV to low voltage (LV) and hence the SOP was installed in a network which represented a typical scenario while still maintaining a controlled environment. The tests involved load transfer across the SOP with associated power quality measurement, thermal imaging and noise measurement.
The SOP device is designed to connect two adjacent feeders, typically with an existing normally open (N/O) point, and controls the power flow between those feeders as shown in the figure below.
Figure 148: Overview of SOP
3.2 Testing the SOP Device
3.2.1 Test Setup
The SOP is a LV device and was installed at a normally open (N/O) point in the existing network at Portlaoise Training School. Feeder 1 from the N/O point was supplied from Odlums MV/LV 200kVA Substation. Feeder 2 was supplied from St. John’s MV/LV 400kVA Substation. The network diagram is shown in the figure below.

Page 263 of 625
Figure 149: Test System Network Diagram
The physical SOP setup is shown below. The mini-pillar in the foreground is the normally open point. The mini-pillars to the left and right are simply supply points to the SOP.
Figure 150: SOP Device installed in Networks Training School
The SOP is housed in a standard utility cabinet. The SOP with its doors open and closed is shown in the images below.

Page 264 of 625
Figure 151: Soft Open Point on Site
Two resistive load banks were installed adjacent to Odlums Substation and St. John’s Substation. The two load banks used had characteristics as follows: 250kW, 400V, 3-phase 50Hz. The SOP is rated for 50kW load transfer and hence the load banks were not used to their full capacity. Images of the load banks are shown below.
Figure 152: Load Banks
3.2.2 Test Procedure
The tests involved variation of the load on the individual load banks and subsequent power transfer through the SOP. Automatic and manual current transfers were used. The tests specifically undertaken are shown in the table below.
Test Scenario Number Description
1 No load
2 10kW at Odlums, 0kW at St. John’s
3 20kW at Odlums, 0kW at St. John’s
4 40kW at Odlums, 0kW at St. John’s
5 40kW at Odlums, 10kW at St. John’s
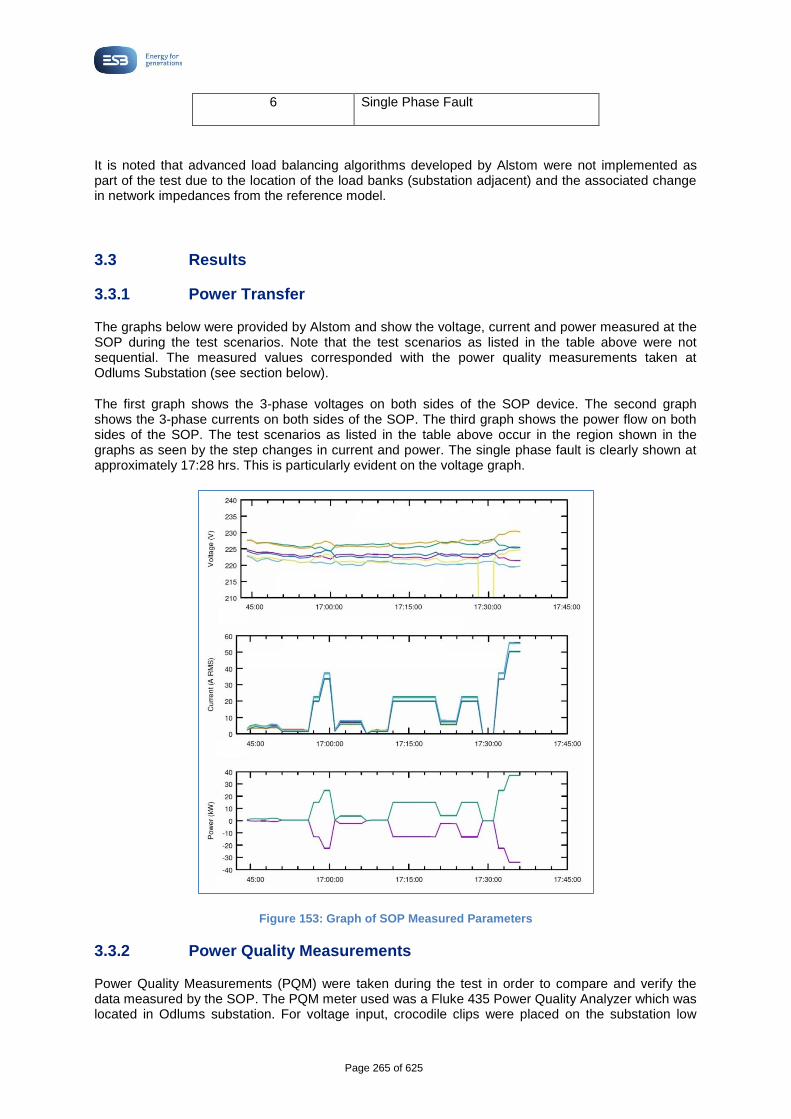
Page 265 of 625
6 Single Phase Fault
It is noted that advanced load balancing algorithms developed by Alstom were not implemented as part of the test due to the location of the load banks (substation adjacent) and the associated change in network impedances from the reference model.
3.3 Results
3.3.1 Power Transfer
The graphs below were provided by Alstom and show the voltage, current and power measured at the SOP during the test scenarios. Note that the test scenarios as listed in the table above were not sequential. The measured values corresponded with the power quality measurements taken at Odlums Substation (see section below).
The first graph shows the 3-phase voltages on both sides of the SOP device. The second graph shows the 3-phase currents on both sides of the SOP. The third graph shows the power flow on both sides of the SOP. The test scenarios as listed in the table above occur in the region shown in the graphs as seen by the step changes in current and power. The single phase fault is clearly shown at approximately 17:28 hrs. This is particularly evident on the voltage graph.
Figure 153: Graph of SOP Measured Parameters
3.3.2 Power Quality Measurements
Power Quality Measurements (PQM) were taken during the test in order to compare and verify the data measured by the SOP. The PQM meter used was a Fluke 435 Power Quality Analyzer which was located in Odlums substation. For voltage input, crocodile clips were placed on the substation low

Page 266 of 625
voltage bus-bars. For current input, Rogowski coils were looped around the outgoing low voltage feeder cables. A picture of the setup is shown below.
Figure 154: Power Quality Measurement Setup
As per the sample screenshots below, the PQM meter has the ability to display “Power & Energy”, “Volts/Amps/Hertz” and “Harmonics”. The “Power & Energy” and “Volts/Amps/Hertz” samples taken concurred with the values measured by the SOP. The SOP does not measure harmonic content and therefore the PQM meter values for harmonics were noted. The percentage of current total harmonic distortion (ITHD) varied from a minimum of 2% to a maximum of 13.8% depending on the status of the SOP. The maximum value of ITHD occurred when 40kW of power was being transferred through the SOP. It is noted that the maximum value of ITHD of 13.8 % compares with previous harmonic measurements taken by ESB of similar devices (electric vehicle fast charge points). Large values of ITHD may have a detrimental impact on expensive utility assets including ageing of transformers and cables and may require over-sizing of neutral conductors. Additionally certain harmonic frequencies can stimulate resonant conditions on venerable networks.
The effect of the harmonics produced by the SOP in a real life scenario would depend on the network topology and pre-existing harmonics. It is recommended that PQM are taken in a number of installation scenarios in order to define the SOP impact on existing systems. Additionally more extensive or network specific filtering could be incorporated into the SOP.
Figure 155: Power Quality Measurement Screenshots
3.3.3 Thermal Imaging
In order to measure the temperature of the SOP during the test a thermal imaging camera was used. The test scenarios were not designed to maximise the temperature of the cabinet as this process was already completed in Alstom’s test lab. The thermal imaging camera however captured the

Page 267 of 625
temperature in an outdoor real system implementation. The camera was located at a distance of 6.3 metres from the SOP. The thermal imaging camera setup is shown in the figure below.
Figure 156: Thermal Imaging Camera
During the test 9 separate thermal images were taken when the SOP was in use. Two thermal images are shown below which showed the maximum and minimum temperatures recorded.
Figure 157: Thermal Images
The temperature of the outer surface of the SOP cabinet reached a maximum of 6.9°C. This is determined as within acceptable limits for a public installation however it is noted that the test was not undertaken during maximum ambient air temperature conditions. Further thermal testing is recommended during warm weather conditions and with more continuous load transfer.
3.3.4 Noise Measurements
The noise produced by the SOP during previous factory testing was highlighted as a potential negative aspect of the device. Noise measurement, using a standard sound meter, was completed during the on-site test. The reading from the sound meter varied from 54.6dB to 88dB during the test. It is noted however that the load banks used during the test dominated the noise level in the area and hence the measurements do not represent a real live scenario whereby the load noise would not be significant.
It is noted that the SOP is a prototype device and was not designed to limit noise. Any noise issue would be easily addressed in next version units though the use of noise suppressing materials and insulation.

Page 268 of 625
3.4 Applications
The SOP has a number of potential applications. As an example, two such applications are described below.
Figure 158: Feeding Scenario 1
In the feeding scenario shown in the diagram above, the industrial load is at its peak during the day. The SOP allows power transfer from the residential substation to the industrial load thus minimising the overload of the industrial substation and keeping industrial customer voltages within limits. During the evening the residential load is at its peak. The SOP allows power transfer from the industrial substation to the residential load.
Figure 159: Feeding Scenario 2
In the feeding scenario shown in the diagram above, if a particular feeder (Residential Substation 2) has a high penetration of EVs and the utility is observing transformer overloading or excessive voltage drops, the SOP can be installed which will allow transfer from the lightly loaded feeder (Residential Substation 1).
As shown in the scenarios above, the SOP has the potential to balance load and control voltages on venerable feeders. This has cost saving implications for utilities as expensive assets such as transformers, cables and overhead lines will not be overloaded. Adjacent networks may not require upgrades and hence planning costs can be minimised. Penalties incurred due to customers experiencing excessive voltage changes will be avoided. The SOP has the potential to enable more efficient use of the existing network.
3.5 Conclusion
The soft open point was commissioned and tested in ESBN Training School in January 2015.
Load was successfully transferred across the N/O point by the SOP both automatically and manually for various test scenarios and the SOP tripped successfully for a fault scenario. It is noted that advanced load balancing algorithms developed by Alstom were not implemented as part of the test

Page 269 of 625
due to the location of the load banks (substation adjacent) and the associated change in network impedances from reference values.
Power quality measurements were completed during the test and the values of current, voltage and power measured by the SOP were verified by the power quality meter. The percentage current total harmonic distortion during a high load transfer scenario was identified as a possible negative aspect of the SOP.
Thermal imaging was conducted during the test with measured temperatures remaining very low. Further thermal testing has been recommended during warm weather conditions and with more continuous load transfer. Noise measurements identified possible nuisance noise from the SOP however as the device is a prototype it was determined that this could be addressed in future versions.
A number of applications for the SOP were discussed. The SOP has the potential to balance load across adjacent feeders and control local system voltages.
4 Conclusion
The desktop study set out to prove that there are inherent benefits to operating the LV Network in parallel with a high penetration of EV loads. A comparison was made with two radial networks to test for load flows. The results show that a higher penetration of EVs could be supported on the test network model with the NO point removed allowing the feeders to operate in parallel.
To achieve this of course there has to be an ability to interconnect feeders, and whilst this will be more generally available in dense urban areas it may not exist outside such areas e.g. a housing estate in a regional town or on the outskirts of a city may have little opportunity for interconnection. In general there is limited opportunity in Ireland for the application of interlinked networks, although in the UK this is seen as a significant opportunity and is being investigated by UK utilities in trials. This means that a solution in this area is likely to be commercially available in the near future and can be adopted by ESB as required.
The trial of the Soft Open Point device demonstrated an alternative means of increasing hosting capacity on LV networks. The SOP successfully transferred load across the NO point automatically and manually for various test scenarios and it tripped successfully for a fault scenario. One of the main benefits of the SOP is the hybrid radial/meshed solution it provides – benefiting from the protection of radial networks and the reliability of meshed networks.
While the above solutions are proven technical solutions to increasing the hosting capacity of EVs, it is important to investigate the financial impact of these solutions as opposed to other network reinforcement activities before any deployment.

Page 270 of 625
Work Package 4
WP 4 Network Planning – Overview

Page 271 of 625
Table of Contents
1 Background to LV Network capabilities ...........................................................................272
2 Approach .............................................................................................................................273
3 Conclusions .........................................................................................................................275
4 Assumptions and caveats ..................................................................................................275
5 Overview of Conclusions from each WP4 Deliverable ....................................................277
5.1 WP 4.1 Residential Demand Profiles and EV Charging .......................................................277
5.2 WP 4.2 Report on network reinforcement requirements for various levels of EV penetration and the impact of Dumb Charging on urban low voltage circuits based on existing EV trials. ............279
5.3 WP 4.3: Estimate approximate reinforcement costs for widespread roll-out and how they might be minimised ...............................................................................................................................281
5.4 WP 4.4 Establish design rules for max no of on-street EV charge points on LV Group in order to minimise reinforcement costs for DUOS customers ...............................................................283
5.5 WP 4.5 Examine the conductor and cable sizes for future networks taking account of EV demands. ..............................................................................................................................................284
5.6 WP 4.6 Examine the conductor and cable sizes for future networks taking account of EV demands. ..............................................................................................................................................286
5.7 WP 4.7 Review of rural non-scheme connection standards .................................................289
6 Appendix 1: Summary of Work Proposal .........................................................................290

Page 272 of 625
1 Background to LV Network capabilities
Domestic customers are supplied at LV in urban areas via an Underground cable network, typically fed from a 400kVA transformer, and in rural areas via overhead wires fed from a 15kVA transformer.
The initial limitations on which EV charging will impinge are, in order of priority:
(a) Voltage drop (b) Transformer Capacity (c) Cable/Overhead Line capacity
LV networks have generally been designed to allow any individual customer up to 12kW, but on the basis that the remaining customers, on average, are only using between 1kW (older inner city housing)) to 2 - 2.3kW (more modern housing schemes). These limits are also in line with those used in the UK.
The reason why the demand of the remaining customers is circa 2kW is due to the fact that the individual customers load is made up of the aggregate of many smaller loads, and not all of these are on at the one time, simply due to the variation in household lifestyles, the large number of low power making up the load and the limited amount of time when higher power loads could clash together.
The introduction of EV charging is potentially a major challenge for existing networks to accommodate as EV charging is relatively high (3kW+), and occurs over sustained periods (c. 8 hrs), so that it is inevitable that such loads will be on simultaneously.
In a tightly designed network the aggregate of customer loads of c.2kW will have been designed to produce no more than 5% voltage drop at peak, so any increase in loading above this amount will cause voltage to fall below standard.
This is potentially serious because appliances will have been designed on the basis that voltages will remain within EN 50160 limits, and excursions outside these limits may cause problems e.g. dimming of lights, computers to freeze up, controls to work incorrectly etc., and such drops in voltage, occurring perhaps only a few times per day for very short periods, could cause problems with household equipment which would cause major inconvenience.
Consequently there is no scope to allow EV charging to infringe on the EN50160 standard.
The issue then is to establish how likely the standard is likely to be breached on typical networks, given that the use of standard cable and transformer sizes and the actual numbers of houses connected on a street will mean that not all networks are at their design limits, and hence may have headroom to accommodate a certain percentage of EV Charging.

Page 273 of 625
In turn, this will depend on the time of day when the EV charging is likely to occur and hence whether it will add cumulatively to the existing loads e.g. as a rough estimate, load at night may typically be no more than 0.5kW power house, leaving about 2kW free per house for electric charging or in other words, nearly two thirds of the houses could have 3kW EV charging at night and keep within existing design parameters.
Reinforcement of existing network could also be a solution to some EV Charging limitations.
Limits on Transformer size are also important as the addition of EV load will increase the thermal load on the transformer and also the volt drop across it. Increased harmonics from EV’s may also cause disproportionate heating in the transformers due to eddy currents which are sensitive to frequency. Larger Transformers such as those on Housing estates tend to have significant thermal inertia so that they can average out limited increases in load without having excessive temperature rise. Cables have thermal inertia, but more limited.
This means that the main issue (within limits) for EV Charging and Transformers/cables is the economic loss of equipment life, which can be balanced against the increased benefits to customer from EV Charging.
Upstream of the Transformers are the MV and HV networks and Substations, but it would not be expected that any reasonably foreseeable increase in EV Charging would have an impact at this level, simply because the loads on these networks are made up of significant portions of industrial and commercial loads, so that any increases in the portion of Domestic load caused by EV charging would not be significant, or would have been subsumed into general load growth and catered for when Network reinforcement was taking place. Even in areas where the load is predominantly Domestic, with little Commercial /Industrial load, it is likely that normal load growth will drive HV upratings, as the component of growth from EV loads is diluted by the larger amount of existing load.
Accordingly the immediate critical area for EV Charging lies is the LV network including associated MV/LV Transformers, and this area accounts for the majority of ESB Networks, with nearly half the conductor and most of the asset locations – 234,000 MV/LV Transformers of which 20,000 are on housing estates and 214,000 in rural areas of rural, non-scheme, and houses.
2 Approach
In any investment decision under uncertainty there is a balance between making the cheapest immediate decision with no flexibility to change, or instead paying extra to make a more flexible resilient decision, albeit at a higher price.
Accordingly any investment must be considered from a ‘Real Options’ perspective, where the NPV of the investment is the sum of the NPV of the cash flows plus the NPV of the associated options provided for future network developments..

Page 274 of 625
NPVInvestment = NPV Cash Flows + NPV Options
This approach is particularly beneficial when uncertainty is high and when the time scale over which the investment must deliver value is long, as is the case with any fundamental change in Network design.
Typical sources of uncertainty would include:
Changes in expected EV Penetration forecasts e.g. in 2011 10% EV Penetration in 2020 was expected, but in 2014 this had been revised to 2%
Reviews leading to less onerous voltage standards, changes in power requirements for EV’s,
the introduction of significant extra loads due to the electrification of heat ,
the proliferation of on site PV generation
and associated storage
Implementing a ‘Real Options’ approach in practice means that ESB Investments should be incremental, flexible and have low switching costs without stranding if a better approach emerges or if circumstances change.
So the approach recommended here is to reinforce existing networks only when and where problems arise using either ‘SmartGrid’ MV/LV Transformers or new ‘Sidewalk ‘ Transformers’.
‘SmartGrid’ MV/LV Tap-change transformers operate by replacing traditional transformers and, by ensuring the LV is constant, eliminate the impact of MV variations upstream, thus allowing a wider LV voltage range. As they can often be retrofitted at short notice in existing Unit and Indoor Subs they are a low cost solution.
‘Sidewalk Transformers’ are essentially small stripped down Unit Subs which can be placed directly on the pavement in built up areas and do not require a dedicated site. They can provide both voltage and current reinforcement, but new MV cables need to be connected to them and this cost is their principal disadvantage (-generally optimise trafo location to minimise either MV or LV cabling costs, so minimising LV costs in one location may require longer run of MV).
However either option is cheaper than any other alternative.
‘Demand Side Control’ was also examined and may be of use in the future for EV control, but is inappropriate at this stage, as any network problems are likely to be sporadic and only arise in particular networks. This means that undertaking the huge upfront costs of such a system ab initio would provide poor value and high risk.

Page 275 of 625
3 Conclusions
Forecasts for EV penetration form SEAI 2014 report are that by 2020 there will be 2% EV penetration (50,000 EVs) with EV’s then having a 15% market share of new car sales. This indirectly implies an ultimate penetration rate of 15%, and certainly no more than 15% to 2030.
The studies here, which are all subject to the caveats and assumptions listed later in this report, suggest that ESB Networks can accommodate a penetration rate of 20% at low cost, involving only sporadic investment as problems arise.
Voltage issues are the main problem and generally solved in existing areas by using ‘SmartGrid’ MV/LV Tap Changing Transformers and ‘Sidewalk transformers’.
In new housing estates/commercial/industrial areas provision for extra substations and ducts for extra MV cabling can be incorporated in the initial design at low cost, and the equipment installed at a later stage if found to be required.
Many of the investments proposed may arise anyway with general load increases but have been attributed to EV’s alone, giving a cost of €35m by 2020 for 2% EV penetration, with 20% Penetration (>15% post 2020++) costing a total of €350m.
It was also found that the DUoS income from the extra EV’s would generally pay for any deep reinforcement associated with EV’s.
4 Assumptions and caveats
Predicting the impact of Electric Vehicles on Networks over a long period when there is no previous experience globally of high penetration rates inevitably means that the report must be based on certain assumptions and caveats.
In particular the following assumptions have been made:
(a) Report only looks at EV penetration, it does not look at the combination of EV and Heat Pump load on the one network. Extra Heat Pumps would be the equivalent of extra EV’s as loads are similar. Households with EV’s and Heat Pumps would have a double impact, but EV and Heat Pump could be interlocked locally by the household, as is currently the practice where two electric showers are used. In practice this would mean the Heat Pump running from say 7am to 6pm, and the EV running thereafter.
(b) Assumes that no Demand response scheme operates to TURN ON Electric Vehicles or other loads i.e. that the historical rate of consumption is a basis for the report
(c) Assumes that the load of an EV is 3kW on average, and that of a residential customer is 2.3kW

Page 276 of 625
(d) Assumes that load and voltage variations within 10 minute averaging periods do not produce unacceptable effects
(e) Impact of PV or other local generation is not taken into account (f) Assumes no radical changes in DUoS tariffs (g) Assumes that the distribution of customers between Unit Sub feeders is evenly spread (h) Assumes that the distance between houses on an Urban feeder is similar to that in the
Roebuck Downs Field Trials. (i) Assumes that for Unit Subs with loadings that could potentially give rise to problems at 20%
EV Penetration, that at least 10% EV penetration occurs at the end of one of the Transformer feeders, thus triggering a requirement for reinforcement. Obviously the ‘worst case’ may not happen in every case but is a conservative assumption.
(j) Assumes that in Rural areas the distribution of EV’s is random and as likely to occur on a 15kVA trafo with little load as one with a heavy load which will requires uprating. No pricing policies are assumed which would encourage customers to install EV’s where no reinforcement costs are incurred
(k) Assumes that all EV’s require a separate ESB Meter (l) Assumes that in EV Charging posts in Public areas and Apartments that the EV Meter is
acceptable for ESB Billing, as a standard ESB Smart Meter will not fit into an EV Charging Post housing
(m) Normally the loading on Transformers is unlikely to be a limiting factor in terms of EV’s penetration as Volt Drop issues will arise initially, and their solution will either not require extra transformer capacity, or , if required, will be at low marginal cost. Hence the heating effect of harmonic loading from EV Inverters on the transformers has been ignored up to the 20% penetration level assessed. In apartment blocks however where voltage drop is not an issue and EV penetration could be high, then extra transformer capacity could be required.
(n) SmartMeter data used in the analysis was based on 30 min Integration periods, so that variations in current were averaged out over this period. In practice there could exist large spiked in current which caused short term voltage impacts which were not anticipated in the analysis. However as EV loading is constant at c. 3kW, and as any existing variations seem to be tolerable in practice, the impact would be mitigated to the marginal change produced by the c3kW loading.
(o) Assumes that Demand Control will not be able to turn on loads at LV in such a manner as to cause problems. Demand Control at Household level can involve all loads, not just EV and as ESB Networks have been designed stochastically it would be possible to overload networks by turning on groups of loads on a particular network simultaneously. In practice such Demand Control would primarily be for use for its impact on the Generation/Transmission level, so that the same impact could be obtained without network implications by avoiding excessive loading on particular networks where problems would be expected to arise. This would be implemented by ‘Servo’. Should restrictions imposed by Servo cause excessive restrictions to Demand Control in particular instances, these could be identified and an economic assessment carried out to see whether the costs of network reinforcement to remove the restriction were justified.
(p) Costs assume a 15% clustering effect in each area, although this may tend to exaggerate the costs. If EV’s were confined to areas where there was sufficient existing headroom then costs would be substantially less. Similarly whilst clustering might occur at the 15% level, it has also been assumed that each occasion of clustering requires reinforcement, which is conservative.
(q) In the case of rural networks where an extra EV requires a Group Split, it is possible that such a split would have been required for normal network development in any case, but, as the EV drove the change, all the costs are ascribed to the EV
(r) The expected EV penetration will be limited by volt drop issues well before Transformer loading becomes a problem. The analysis here indicates that thermal inertia on the transformer can allow extra loading to significant extents, so that it is clear that transformer loading is not an issue. However no utility worldwide has ever loaded transformers to this extent in practice, so that the calculations herein are all theoretical and heretofore unknown issues may arise if transformers were pushed to these limits.
(s) All calculations assume that general changes in ADMD for new housing estates and apartment blocks are treated separately for DUOS and Connection costing, as such changes in ADMD would take into account the impact of Direct Electric Heating, Heat Pumps, Electric Vehicles and self –generation and could not be ascribed to Electric Vehicles only.

Page 277 of 625
5 Overview of Conclusions from each WP4 Deliverable
5.1 WP 4.1 Residential Demand Profiles and EV Charging
In WP 4.1 the data gathered from large numbers of SmartMeters which had been installed for the SmartMeter trials was used to assess the worst case usage for groups of customers on Urban Housing scheme feeders/Transformers and also on typical Rural Transformers and Overhead LV Networks.
The approach taken was reasonably conservative in that the profiles were assembled from those customers with more than 5,500kWh per annum consumption, which is reasonable as EV’s are more likely to be installed in more affluent areas where existing consumption will be higher.
The results from these studies indicated that the existing ESB design rules used to model demand were closely aligned to the peak measured, with ADMD = [12 + (n-1)(2.3)]kW.
The EV loading profile for 40% penetration was then added to the existing design load for the Housing Scheme transformers at night and the impact assessed. This indicated that for 200kVA and 400kVA transformers there was a reduction in lifetime for the transformers of, respectively, 1 – 1.6 days per day of operation, but this was only especially severe for 630kVA transformers, where the loss was nearly 5 days per day of operation.
In practice the majority of Housing Scheme Transformers in Housing Schemes are of 200 and 400kVA sizes, with 630kVA units only being used in Night Storage Heating Schemes and in City areas with mixed industrial loads.
Reductions in transformer lifetime of 1 – 1.6 days per day of operation mean that the remaining lifetime is reduced by 50-60%. However this assumes that all 40% of EV penetration occurred immediately, whereas in practice this would ramp up over a period of time. Furthermore, it is unrealistic to expect a 40% penetration in the foreseeable future, as the last SEAI study in ‘Energy in Transport -2014 Report’ UK suggested 2% EV penetration in 2020 and a share of 15% EV in new car sales, which would suggest an overall penetration level of 15% until well after 2030. This is set out in more detail in WP 4.3
In addition transformers are typically rated for 100% loading for 30 years, and ‘die’ at 1 day per day of usage. However as transformers are more lightly loaded initially, as load has not developed, their initial decay is slower than 1/day/day, so that their life is not depreciated as rapidly, and it is this store of extra life that the EV charging would initially eat into. Finally, these figures were based on the transformer being at full design load ab initio, which is a worst case scenario, as transformers generally have some spare capacity. This is because they only come in fixed sizes (200 & 400kVA), so that connecting smaller loads such as 150kVA or 300kVA will still require a 200kVA or 400kVA transformer. Consequently this means that there will likely be some spare capacity on existing transformers.

Page 278 of 625
Note: It is important to note that Apartments with Night Storage Heating are unlikely to be able to accommodate EV Charging on their existing Transformers as these are fully loaded on Winter nights (typically 5kW per Apartment) and, as usually located in urban areas, also have a significant commercial day load, so that the transformer is consistently loaded.
So on a general basis it would be reasonable that 200kVA and 400KVA Housing Scheme Transformers (feeding non-Night Storage Heating Loads) could accommodate up to 40% penetration of EV charging at night time (11pm – 8am).
In contrast, any increase in EV charging during the day would depend on the individual transformer’s existing loading and how far above the existing peak the additional EV charging pushed the peak load. In the cases studied the cyclic rating of the transformer had already been used to accommodate existing load so that a 200kVA transformer have a peak of 250kVA, which is 25% above nameplate rating but within the cyclic rating. Increases in peak loading which occur for short periods but are severe can cause thermal runaway within certain components within the transformer which may have short time constants e.g. bushings. Such occurrences can cause the near immediate (minutes) failure of the transformer. In theory the transformer should be able to cope with 90% overload for some minutes, but the exact period will vary from transformer to transformer and has never been tested by utilities. Lower levels of overload will also cause failure but only after slightly longer periods – the Specification IEC 60076 sets out overload percentages but not duration. Practice in European Utilities is only to overload during standby emergency feeding, as unexpected random failures of transformers due to general overloading would be very disruptive to customers.
Consequently, the accommodation of EV charging during the day would require that the EV Charging only took up the excess capacity above the normal load. For a Trafo at Design load – say 100 customers on a 200kVA or 220 on a 400kVA, this would allow 30% from 8am until noon, 16% penetration from noon to 4pm, but none from 16:30 – 22.30 based on 3kW per EV.
However as will be shown in WP4.7, Transformer loading is not a critical issue as existing transformer are easily uprated at relatively low cost and in short timescales (1-2 days).
In addition the EV Penetration rate to which this analysis applies is 20% penetration of car population at 3kW per EV Charger.
Other figures from WP 4.1 relating to feeder loads are used in relation to volt drop calculations in WP 4.2 – 4.7
CAVEAT: The expected EV penetration will be limited by volt drop issues well before Transformer loading becomes a problem. The analysis here indicates that thermal inertia on the transformer can allow extra loading to significant extents, so that it is clear that transformer loading is not an issue. However no utility worldwide has ever loaded transformers to this extent in practice, so that the calculations herein are all theoretical and heretofore unknown issues may arise if transformers were pushed to these limits.

Page 279 of 625
5.2 WP 4.2 Report on network reinforcement requirements for various levels of EV penetration and the impact of Dumb Charging on urban low voltage circuits based on existing EV trials.
Using the results from Field Trials of Electric Vehicles at Roebuck Downs in Dublin it was found that the first power quality criteria to be breached was voltage, and that this occurred with 8% penetration of Electric Vehicles at the end of an LV cable feeder.
These results were then cross checked using a Distribution model and found to give similar results - at 20% EV penetration at the sending end of the feeder or uniformly along its length, little or no reinforcement was required, but for 10% penetration located at the end of the feeder voltage breakdown occurred.
Once voltage breakdown occurs Distribution reinforcement is required and can be expected to take the form of the replacement of the existing ‘passive’ transformer with a new ‘SmartGrid’ MV/LV tap changing transformer, which actively manages the voltage. The number of Distribution locations where such reinforcements will be required, based on an overall 20% EV penetration rate, is on about 15% of Unit Subs, based on an assessment of the customer numbers and Unit Sub size of all ESB Unit Subs.
However such Distribution reinforcement will only be required when and where actual breakdown takes place, which on the original 2011 SEAI figures was 2025 (based on 10% in 2020) and on the 2014 SEAI figures with 2% penetration by 2020 and 15% share of new car sales for EV’s, caps the penetration levels at 15% indefinitely, but certainly post 2030.
The alternative of initially using Demand Response to control when EV’s charged was not found to be viable initially, as the cost of implementing such a solution would require to be incurred upfront, yet their benefits would only arise in those small segments of the Distribution where problems would arise over the next 10 years.
The expected EV penetration of 15% allows for a modular Distribution investment approach, where costs are only incurred when and where required. In addition, as the Distribution solution generally involves marginal changes to equipment that is already installed on the system, any stranding costs are minimal, and switching to an alternative approach at any stage is possible at minimal cost.
In practice this means that if Demand Response develops in Ireland for more profitable applications such as optimising energy usage/costs & minimising System Peak, these applications pay for the development of a Demand Response Infrastructure nationally. This then provides the opportunity of using these Demand Response customers to control EV and other loads as required, at a cost which might prove competitive with ‘Smart Grid’ reinforcement.
In this context it is important to note that Demand Response will only be a solution if there are sufficient Demand Response customers on the particular individual LV circuit where problems arise i.e. 100% Demand Response penetration on adjoining circuits is irrelevant. This is a generic issue that can make DR inappropriate as a solution for certain types of Distribution reinforcement deferral. The Roebuck Downs trial also suggested that had load been shifted to another part of the day to avoid

Page 280 of 625
coincidence with System Peak, there would then be a local peak from the displaced load, which of itself would require Distribution Reinforcement.
Finally, deferral of the use of Demand Response until it proves economic also allows the final technology choice to be optimal. It can be expected that with the increasing standardisation of control and communication systems as normal features on ‘white good ‘ appliances such as washing machines, and the convergence of home control systems toward NEST et al., that the Demand Aggregator will deal with the overall Household as a single unit, not directly with individual appliances.
The benefits of this for the homeowner are that any communications between devices within the home can be managed by any proprietary system, as long as the interface to the Demand Aggregator is standard. So effectively all household appliances, EV’s, Heat Pumps, and Water Heating etc. are considered as just part of the load profile to be managed. This means that the customer’s Home Area Manager can decide the make up of the overall load profile to be offered to the Demand Aggregator, and that this profile can be tailored to the customer’s preferences. From the Demand Aggregator’s viewpoint it is also much simpler to have the individual appliances managed by the home itself, so that the Demand Aggregator then just requires one point of contact with the Customers’ Home Area Managers.
The only requirement at this stage would be that EV’s would have a facility ab initio that they could adjust their demand according to a signal received remotely from the Home Area Manager.
In conclusion, currently the best option to accommodate EV penetration up to 20% is to reinforce the Distribution locally as and when problems arise, using ‘SmartGrid’ transformers. This strategy is flexible, low risk and minimises the risk of investments being stranded due to technological obsolescence or a failure of the market to develop as expected. In addition, as it has minimal switching costs, it leaves the opportunity to switch to Demand response open where this is cost effective.
The cost effectiveness of using DR to deal with local Distribution issues is low if such deferrals are relied on to fund the DR directly, but where the DR has already been installed for other more profitable reasons such as matching wind to load, then it only needs to cover its marginal costs and is likely to be much more cost effective.

Page 281 of 625
5.3 WP 4.3: Estimate approximate reinforcement costs for widespread roll-out and how they might be minimised
The Distribution costs of catering for a penetration rate of 20% EV amongst customers who have cars will depend on the degree of clustering which arises, and which is estimated at 15%. It is also assumed that an EV charges at 3kW and that the impact of additional loads such as new Heat Pumps is not taken into account.
Whilst the calculation below is for 20% EV penetration, this is only expected to be achieved well after 2030, as the SEAI forecast for EV penetration has been reduced to 2% in 2020, with EV’s then comprising only 15% of new car sales, thus resulting in a trajectory toward 15% EV penetration at best.
Accordingly a summary of the Distribution costs for 20% penetration is as follows:
Distribution network reinforcement:
Rural Areas €127m
Urban Areas outside the M50 €115m
Inside M50 €33m
Distribution network reinforcement Total €275m
Separate Meter for each EV: @€250 € 68m (0.272m x €250)
Total €343m
These Distribution costs assume a 15% clustering effect in each area, which tends to exaggerate the Distribution costs. If EV’s were confined to areas where there was sufficient existing headroom then Distribution costs would be substantially less. Similarly whilst clustering might occur at the 15% level, it has also been assumed that each occasion of clustering requires Distribution reinforcement, which is conservative.
Finally, in the case of rural Distribution networks where an extra EV requires a Group Split, it is possible that such a split would have been required for normal Distribution network development in any case, but, as the EV drove the change, all the Distribution costs are ascribed to the EV

Page 282 of 625
Note: EV is assumed to be 3kW and no other load changes such as Heat Pumps taken into account.
Cost variation over time Of course a full 20% EV penetration is not going to happen overnight, so that the above Distribution costs will only arise as EV’s are installed over the period.
In the case of the current SEAI 2014 forecasts of 2% EV penetration by 2020, it could be expected that €35m of Distribution costs would be incurred between 2015 and 2020, and that for the 15% EV penetration post 2030 a further €225m ( - pro-rata from 20% penetration).

Page 283 of 625
5.4 WP 4.4 Establish design rules for max no of on-street EV charge points on LV Group in order to minimise reinforcement costs for DUOS customers
The description of WP4.4 ‘Establish design rules for max no of on-street charge points on LV Group in order to minimise reinforcement costs for DUOS customers’ is clarified as follows:
•‘minimise reinforcement costs for DUOS Customers’ is taken to mean that the cost to be minimised is the excess costs associated with EV charging which are not covered by the extra DUOS units charged for EV Charge Point usage
•‘maximum number of on-street charge points on LV Group’ is dictated by the point at which the extra revenue received from use of the EV Charge Points is less than or equal to the cost of providing the EV Charge points – at either stage there is no extra payment required from other DUOS customers.
Typically ESB connection charges are structured in so far as is reasonably practical to send the correct price signals to customers so that dysfunctional behaviour is not encouraged i.e. so that customers make rational economic decisions based on prices which reflect the true economic costs.
If correctly operated therefore, any connection class pays for itself over time, and is not cross subsidised by other groups of DUOS customers. Typically those costs which are directly attributable to a particular connection are charged to the customer making the connection, and any generic overhead costs for this class of connection are apportioned over the associated DUOS group in proportion to the amount of electricity (kWh) used.
This means that those installing Electric Chargers will seek locations which provide best value for money, taking into account the higher revenues obtained from locations which can be expected to be particularly busy. So from a commercial perspective the first business driver for an EV Charge Point Operator will be what level of revenue can be obtained from a particular site (as this needs to cover the costs of EV Chargers, their installation and connection costs, and profits), with the connection cost being just a necessary costs of doing business at that location. EV Charge point locations will be chosen according to the revenue available, not from cost of connection e.g. EV Charge Points close to an ESB Substation will be inexpensive, but if the Substation is down a lane with limited parking there is unlikely to be enough Revenue to provide a return on the chargers and their installation to use it.
Consequently the issue of ‘Design Rules for On Street Charge Points’ is not critical – it is immediately clear to EV Charge Point Operators that locations close to Substations will be less expensive if large numbers of cars need to be charged or ‘fast chargers’ employed, that locations close to large cables with available capacity will minimise excavation required, and that locations which require expensive excavation and reinstatement (Granite kerbing) or where a main road has to be crossed to provide a connection will be expensive.
The exact answer in each individual case will depend on the existing capacity available at a location which must be established in each case, although for small numbers of chargers some generic ‘rules of thumb’ are included below.
In similar circumstances such as the mass connection of Bus Shelter Advertising and Telecom Kiosks, the customer has typically provided a list of locations with some flexibility about the exact location and then asked ESB to provide a price for the lowest connection cost which meets their requirements.
From the analysis below, if EV’s make the same DUOS contribution as a similar sized Domestic load, then the DUOS Revenue would be sufficient to cover upstream Network costs as well as make a contribution to the direct connection costs. Normally the DUOS rate is adjusted to ensure that the DUOS charge per category is set to cover the costs expected but not give rise to a cross subsidy to other customers.
So this means that EV Charging is expected to provide sufficient revenue to cover the costs imposed on the network, with connection costs charged directly to EV Charge Connections so as to encourage correct behaviours in site selection.
The actual DUOS charge regime for EVs would then be set to just recover the charges imposed.

Page 284 of 625
Consequently there should be no impact on general DUOS customer arising from the connection of EV’s.
5.5 WP 4.5 Examine the conductor and cable sizes for future networks taking account of EV demands.
The issue to be addressed is ‘to what extent should existing networks designs now be modified to cope with possible increased future loading from EV/Heat Pumps such that the NPV of the proposed investment is minimised for the expected increase in loading.’
The scope to meet EV demands is not limited to simply using larger cables or conductors, but also extends to how these are configured and how their capacity might best be optimised through the injection of extra capacity from additional transformers.
In addition, the mechanism chosen should ideally be such that it avoids risky up front investment where resources are committed on the assumption of expected development, and then stranded if this does not occur as planned. Instead the ideal is to invest incrementally as required to meet actual load, but in such a fashion that an optimal network is still built, but in an incremental fashion. In practice this can be difficult to achieve as the sum of a series of small optima investments can turn out be sub-optimal overall, as such ‘stepwise investment’ can miss out on economies of scale.
For existing Housing Schemes the cables and conductors are already installed and the cost of any attempt to uprate these in size would be completely uneconomic. A better value solution is to make use of existing capacity by rebalancing load between differently loaded circuits (where this is possible with minimal investment), and subsequently injecting extra transformer capacity where the circuits still require reinforcement.
On new Housing Schemes the provision of capacity for future EV’s can be provided by designing the networks so as to facilitate their subsequent reinforcement through the addition of extra Unit Substations. This allows investment to be deferred until it is actually required, and does not require any changes to most cables and other network equipment. In such designs provision would be made for additional Unit Subs through the provision of extra substations sites in the layout, with MV cables running past and LV cables in the vicinity to facilitate their later connection. This avoids upfront investment in the expectation of future load increases, as would be the case had cable and conductor sizes been increased.
There are two areas where changes to existing materials could be considered ab initio. One is in the case of the cable ‘junction box’ (Mini-pillar) from which the House services are connected. The Mini-pillar is designed to provide single phase connections to houses, although it could in general potentially supply 1-2 three phase house connections, as this would simply involve replacing the single phase house service cable with a three phase one, along with the installation of a 3 phase Meter and Cut-out to replace the existing single phase units. Changing the Mini-pillar design to facilitate connection of a greater number of three phase services is unlikely to be very costly if incorporated in a new Tender.

Page 285 of 625
The second area would be in the provision of greater space in the Meter Box/provision for an adjoining Meter Box, should the EV require a separate meter. Again, if costs are to be minimised the use of an interconnected but adjoining Meter box which could be installed by the householder retrospectively is the cheapest option, as it only need be installed when and if required.
Consequently, generally no changes to existing conductors and cables are recommended.

Page 286 of 625
5.6 WP 4.6 Examine the conductor and cable sizes for future networks taking account of EV demands.
Voltage drop will be the most limiting criteria in the connection of extra EV Loads to networks. Such problems will first appear in clustered locations on the network where the network is strained or where there is a concentration of EV Load.
Load Control is a possible way of deferring network reinforcement but requires that both EVs and other loads are all capable of load control and that there is a control mechanism in existence that can operate down to individual LV circuits to ensure that voltage drop is maintained within standard. However this is unlikely to be available in the near term, and when available must not only be applicable to EV’s loads, but also all other heavy new loads such as Heat Pumps and Electric Heating. Unfortunately, as load density increases on such circuits, the loads will tend to be rescheduled more frequently so that customers may not be able to charge when desired.
In the near term such a level of control required everywhere when problems are only likely to occur in particular clusters would be overkill.
Consequently the likely solution in Housing Schemes will be either interconnection at LV to maximise the usage of spare Transformers and circuit capacity, whilst minimising volt drop, plus the subsequent installation of Sidewalk Substations which can reinforce the existing feeder networks selectively with out any significant amounts of civil works being required.
In summary the strategy for coping with increased Electric Vehicle penetration on new and existing Housing Estates/Apartments/Offices is as follows:
New Build:
New Housing Estates:
Electric Vehicles should be able to be easily accommodated in new Housing estates because the extra load required can be incorporated whilst the estate is being designed. However to avoid up front costs and potential stranding of assets, the extra reinforcement required should be obtained by incorporating provision for extra Unit Substation sites in the Housing scheme design, with MV cables routed past these points, with cables jointed from existing LV cables to an LV Section pillar adjacent to the proposed Unit Substation position.
This would mean that should the density of EV’s require reinforcement, then a new Unit Sub can be placed on the designated site, the MV cabling looped into the Unit Substation and the LV side connected to the LV panel. This will address any voltage regulation issues and, as also provide extra Transformer capacity and improved Short Circuit levels.
New Apartment blocks/Offices:
New Apartment Blocks/Offices are characterised by their use of Indoor Substations, with basement parking due to the high cost of land. Coping with extra Electric Vehicle load would require either an uprating of the existing Transformers or the addition of a new transformer. Such Indoor Substations can typically be uprated to supply up to 1000kVA, and provision of an additional transformer should more than 1000kVA be required would require some extra space – probably slightly less than an additional 4 x 3.5m – about one car parking space. The circuitry supplying the EV’s would be installed by the landlord on a ‘Rising Main’ and would either be metered at each EV Charging Point or at one point centrally – the exact method

Page 287 of 625
depending on CER Regulatory requirements. Use of one Meter on this circuit for all EV’s would however mean no choice of Supplier for EV users.
At design stage the Indoor Substation should be sized for any expansion required, but minimal extra costs need be incurred unless the load increase required is certain.
Existing Build:
Existing Housing Estates:
The driver for reinforcement of existing housing estates due to the advent of Electric Vehicles will arise where EV’s cluster in certain areas, particularly at the ends of circuits. Conversely this also means that the majority of estates will not require any immediate reinforcement. Reallocation of loads between LV feeders might also be a very low cost solution where minimal reinforcement is required.
Significant reinforcement in existing areas is made difficult by the inability to find suitable sites for new Substations and the extra cost of excavation and reinstatement for new cabling.
However two recent changes in technology can help minimise such costs:
(a) Tap Changing MV/LV Transformer Here the existing Transformer is swopped for a more modern type which can provide a steady voltage at the upper end of the voltage range. This means that the same cable can supply a greater load whilst still keeping the voltage within standard. This is the cheapest form of reinforcement and only need be installed as load arises. In some cases the existing Unit Substation will be unsuitable to incorporate a new transformer, in which case it will have to be replaced, but again this is a relatively low cost option, and would have probably been required in the near future due to the age of such substation types.
(b) Sidewalk Substation: These are small substations with no switchgear and a very limited LV panel – essentially just a fused transformer with bolt on MV connections. They would be installed between two MV Switching points and could supply up to 250kVA of power to inject into congested areas of the network. The main costs arising in such situations would be where no MV cabling was in the immediate vicinity, in which case the substation might either have to be located in a less optimal position, or a new cable trench installed. The economics of either option would be site dependent. Again the ‘Sidewalk Substation’ would only need to be installed shortly before load arrived, so that the investment is back ended and with little risk of stranded assets. Similarly sized MV Kiosks are already in use by ESB, usually built into garden walls when installed as part of the original development, but can be installed externally as in the case to Telecom Eireann Kiosks which are similar in size.

Page 288 of 625
Fig. 0 - Telecom Kiosk of similar size and positioning to ‘Sidewalk Sub’
Existing Apartment Blocks:
Same approach as described for new Apartment blocks described above.
The upshot of the above approach is that little initial investment is required upfront, and that reinforcement need only be provided when it is clear that it is actually required. This minimizes the risk of stranded assets and provides a more efficient investment profile.

Page 289 of 625
5.7 WP 4.7 Review of rural non-scheme connection standards
About 40% of the 4m populations live in the countryside, with the remainder in towns and cities, principally Dublin (pop 1m). The dispersed nature of rural settlement results in the number of customer per km is very low, and especially the number of customers per transformer, with ESB having the lowest number of customers per transformer in Europe. This has also meant that most rural MV networks are single phase and use Single Phase transformers, a common Network topology in the US, but, within Europe, confined to the UK and Ireland.
As an illustration, of the 250,000 transformers in Ireland, 20,000 are three phase units in Towns and cities, 20,000 are Pole Mounted three phase units near towns, and the remaining 210,000 are nearly 15kVA pole mounted single phase transformers feeding isolate groups of customers – 50% have less than 4 customers.
In rural areas only those customers within EV commuting distances of work will find it worthwhile to buy an EV so that EV usage from overhead networks will be concentrated around urban conurbations. This reduces the likelihood of a large proportion of the overhead LV network requiring reinforcement to cope with increased EV penetration. However if the battery capacity increased substantially beyond 24kWh this could change.
There are two limits to feeding EV’s from 15kVA Pole Mounted Transformers, volt drop and transformers capacity, as the 3.7kW loading of an EV is a significant proportion of the transformer capacity. However many rural 15kVA Transformers are lightly loaded with 50% of all transformers having three customer or less connected. This means that as long as the EV’s are reasonably close (50 - 140m) to the transformer they can accommodate EV Loading of 2 EV’s within volt drop limits, and, due to the significant diversity with rural transformer loadings, can also be accommodated within the transformer rating, regardless of when the charging takes place. Where older conductors less than 95’s bundle have been used to offload the 15kVA the distances within which voltage standards will be maintained will be less.
If EV Charging is confined to night time so that it does not clash with day load then the 15kVA Transformer can accommodate up to 4 EV’s as long as they are within a reasonable distance from the transformer. This means that 8% of rural 15kVA Transformers could accommodate 4 EV’s of 3.7kW each.
Where reinforcement is required it will first come about in groups of more than 4 customers where load reinforcement is likely to be required in the future anyway, so that traditional splitting of the group will the most cost effective choice, as the reinforcement will improve voltage generally as well as providing capacity for additional EVs.
Finally, the benefits of load control, other than charging at knight, are very limited as most groups will already accommodate EV’s and those that don’t are likely to require reinforcement in the future anyway, thus stranding and load control investments.
Note: Electric Showers may have to be interlocked with customer’s EV in order to avoid clashing, but as interlocking of two electric showers is already commonplace this should not be an issue.

Page 290 of 625
6 Appendix 1: Summary of Work Proposal
WP 4 – Network Planning – Overview
• To determine rules for the number of charge points allowable on any network sector
• To ensure that in future new LV networks built for new housing schemes and single houses can
accommodate the extra electricity demand that will arise from electric vehicles
• To understand the capital cost implications of building networks than can accommodate a
foreseeable level of EV penetration
To design connection standards in term so allowed charging level, flexibility and control for home charging.
Description
Electric Vehicle charging will constitute a significant new type of load on the system. In order to
ensue that LV networks will not be overloaded and that adequate voltage will be maintained, it will be
necessary to understand the impact of a given % penetration of electric vehicles on the overall peak
demand on the networks.
The traditional peak loading for demand customers is well understood at this stage, and the network
is sized accordingly. These traditional network planning standards can be considered as a baseline
benchmark measure. However, if peak demand for EV charging turns out to be co-incident with the
traditional load peak, then significant additional network reinforcement costs could accrue. [WP 4.1]
This incremental cost will be measured and evaluated in the trial through the data and analysis
gained in the trial. This will then establish whether the behaviour of the EV load or operation of the
network can be adjusted to defer investment and to quantify the cost savings.
It will be necessary to anticipate the costs of network reinforcement requirements that will arise for
various levels of electric vehicle penetration. This will be needed for DUoS revenue controls and is
also a prerequisite for WP 5.
In addition to understanding the reinforcement requirements for existing networks for various levels
of charging, it may be necessary to amend the design standard for new housing scheme
developments. [WP 4.6]
The design guidance of non-scheme housing (which is generally in rural settings) will need to be
reviewed taking account of the knowledge obtained in previous stages. [WP 4.5, 4.7]

Page 291 of 625
Objectives
The objectives of this work package are to:
• Quantify the likely challenges of uncontrolled charging for local distribution networks,
based on the results of WP1.
• understand the capital cost implications of building networks to accommodate a likely
level of Electric vehicle penetration
• Investigate the potential cost and benefit of “Dumb” Charging, Vs Simplistic “Smart Charging”
Vs “Advanced Smart Charging” and consider what obligations should be applied in terms of
charge management to ensure fairness and appropriate allocation of costs.
Design the electrical connection standards– including smart charging requirements
for domestic EV charging
design the electrical connection requirements for home and on-street charge points
ensure that LV networks built for new housing schemes and single houses can accommodate the extra electricity demand that will arise from electric vehicles [WP 4.6]
Scope
In conjunction with WP3 develop demand profiles for groups of domestic
customers with various penetrations of EV:
Study the home charging profiles of WP1representing a range of home charging behaviours and assess the consequent load profile as seen on the electricity network
[WP 4.1]
Simulate the consequence of “dumb” home charging on typical LV circuits, urban and rural, combining the potential home charging behaviour, with the characteristics of the connection with the network circuit. Identify the range of possibilities based on EV take up within the LV circuit group, (% of households with EVs among the customers connected to the same LV circuit or group), charging behaviour, specific locations or distribution of EVs on a given LV circuit (Start/Middle/End) [WP 4.2]
Create a set of profiles for electric charging which will be related to the number of vehicles. The profiles will be such that they can be added to the profiles that are
already established for conventional load to predict the profile and specifically the peak load of a group of domestic customers with a given penetration of EVs. The predicted peak load can then be modelled against a given network design to check if any elements of the network are overloaded and that voltage is within standard at all points. [WP 4.1 ,4.2]

Page 292 of 625
The profiles of home charging and charging via public charging points will naturally be very different and separate profiles will need to be created for home and public charging points. [WP 4.4]
Initially the home EV charging profiles will be based on uncontrolled charging where customers do not have incentives for off peak charging. These will need to be kept up to date in line with observed customer behaviours as time differentiated tariffs evolve. The outcome of WP3 will be reviewed in terms of how smart charging can reduce the need for network investment. [WP 4.3]
Evaluate Network Reinforcement Requirements for various levels of penetration of electric vehicles. In order to understand network reinforcement requirements for various levels of EV penetration it will be necessary to set up models for a statistically significant sample of LV and MV networks serving both urban and rural customers. Load flow studies will be run on the sample networks assuming various level of penetration of EVs and based on the demand profiles determined. The extent of networks found to be overloaded for a given % EV penetration will be determined. In addition to the voltage level, the voltage quality in terms of harmonics and other effects will be modelled. The nature and cost of the required reinforcements to correct any overloading and voltage standard breeches can then be determined. [WP 4.1,4.2,4.3,,4.6,4.7]
The extent of reinforcements required and the nature of those reinforcements may vary significantly by network type and location, likely seeing more numerous but lower cost reinforcements required in rural locations. [WP 4.6, 4.7]
Review and revise as necessary the design standards for new housing To do this it will be necessary to assume a likely maximum % penetration for EVs. The demand profile and peak loading for that particular level of EV penetration can then be used as the basis for a revised design standard for housing developments. [WP 4.6]
Review the non-scheme house (mainly rural) connection design standards Rural domestic dwellings are generally connected to single phase networks supplied by single phase transformers. Typically up to 10 houses within a radius of 300m are supplied form a transformer. [WP4.7]
The present network is designed with the assumption that an individual dwelling with a maximum electricity load requirement of 12kVA will contribute just 2KW to the peak of their local network. This assumption is based on the fact that all households do not use their electricity at the same time and therefore there is a large diversification factor applied. This method of sizing the design of the system is best international practise and the approximately 2KW level adopted in Ireland has been proved to be correct for Irish network to date. This 2 kW level is known as the After Diversity Maximum Demand (ADMD). [WP 4.1]
To future proof domestic connections for EV charging it will be necessary to assume that residents could own an EV in the future. This will mean that a higher standard supply level will be adopted. It may simply be required to revise the standard connection maximum import capacity. It will also be necessary to consider the ADMD per house. The profiles developed

Page 293 of 625
for electric vehicle charging and possibilities for smart charging will inform at. [ WP 4.5,4.6,4.7]
Rural networks are inherently more vulnerable to harmonic pollution of the supply quality. As part of this work package, a voltage quality measurement programme will be carried out on a sample of 5 houses to ensure that the harmonic distortion is within acceptable limits. [WP 4.7]
WP 4 Deliverables and timeline
No Description
4.1 Report on residential demand profiles and peak demands for various levels of EV
penetration. Taking in the output of 3.1 and the smart charging options as
developed in WP3
4.2 Report on network reinforcement requirements for various levels of EV penetration
and the impact of Dumb Charging on urban low voltage circuits based on existing EV
trials.
4.3 Estimate approximate reinforcement costs for widespread roll-out and how they might
be minimised
4.4 Establish design rules for maximum number of on-street charge points on LV
Group in order to minimise reinforcement costs for DUOS customers.
4.5 Examine the conductor and cable sizes for future networks taking account of EV
demands.
4.6 Revise housing scheme design guidelines
4.7 Review of rural non-scheme connection standards

Page 294 of 625
Work Package 4.1
Analysis of Residential Demand Profiles and
EV Penetration

Page 295 of 625
Table of Contents
1 Introduction .........................................................................................................................296
2 Network Planning: Worst-Case Scenarios .......................................................................297
2.1 The Smart Meter Data ...........................................................................................................298
2.2 Load Profiles .........................................................................................................................299
2.3 Transformer and Feeder Demand ........................................................................................300
3 LV Feeder Demand ..............................................................................................................303
3.1 Rural Feeders: Groups of 5 Customers ................................................................................303
3.1.1 Results for a rural feeder with 5 customers ..........................................................................304
3.2 Rural Feeders: Groups of 10 Customers ..............................................................................305
3.2.1 Results for a rural feeder with 10 customers ........................................................................306
3.3 Urban Feeders: Groups of 50 Customers .............................................................................307
3.3.1 Results for an urban feeder with 50 customers ....................................................................308 3.3.2 Summary of Feeder Demand ................................................................................................309
4 Transformer Demand ..........................................................................................................311
4.1 200 kVA Transformer ............................................................................................................313
4.2 400 kVA Transformer ............................................................................................................315
4.3 630 kVA Transformer ............................................................................................................317
4.4 Transformers and ADMD ......................................................................................................319
4.5 Results of Transformer Loading ............................................................................................319
ADMD in the future .............................................................................................................................320
4.6 Electric Vehicles ....................................................................................................................320
4.7 Results ..................................................................................................................................324
4.8 Electric Vehicles And Transformers ......................................................................................324
4.9 200 kVA Transformer ............................................................................................................325
4.10 400 kVA Transformer ............................................................................................................326
4.11 630 kVA Transformer ............................................................................................................327
5 Overall Results from Electric Vehicles .............................................................................329
6 Load Duration Curves.........................................................................................................330
7 Impact on System Demand ................................................................................................334
8 Conclusions .........................................................................................................................335

Page 296 of 625
1 Introduction
ESB Networks installed smart meters to record the consumption of a statistically representative group of 6,000 domestic customers every half hour. This smart meter data was primarily intended to be used to investigate the effects of time of day pricing. However it also provided the opportunity to investigate other aspects of the distribution network such as the After Diversity Maximum Demand (ADMD), the actual demand on feeders and transformers, the effect of electric vehicles, and to create profiles to be used in year long network analysis of voltage drops and losses.
As part of the Smart Meter Customer Behaviour Trial, smart meters were installed in about 6,000 premises around Ireland to provide information about the consumption of these customers at 30 minute intervals. This 30-minute data was collected and validated on a daily basis and was of a quality suitable for billing purposes. This smart meter load information provided a unique opportunity to examine the loads of customers in more detail, provide more accurate load information for planning, to confirm the planning parameters that are used for domestic designs and guidelines and how these could be affected by EV’s. In addition, the impact of future new loads on typical feeder and transformer demands could be reviewed at a high level.
This section examines each of these areas, firstly looking at the current typical load of LV feeders and transformers as well as looking at ESBN current method for calculating the After Diversity Maximum Demand (ADMD) of domestic customers. The effects of electric vehicle charging on LV feeders are also considered. The EN 50160 voltage standard is briefly looked at.
Currently when calculating the peak demand of a number of customers, ESBN uses a method involving the After Diversity Maximum Demand (ADMD) which is the average demand of each customer at the time of maximum demand. The ADMD was revised a number of years ago to be 2.3 kW, having historically been in the region of 1.5 – 2kW including an allowance for future load growth. Using the smart meter data, the actual ADMD, without provision for future growth, is calculated for three different types of feeders.
Rural Feeder with 5 Customers, ADMD = 2.7 kW
Rural Feeder with 10 Customers, ADMD = 2.1 kW
Urban Feeder with 50 Customers, ADMD = 2.2 kW
The transformers used by ESBN are given a cyclic rating, which allows the peak load on the transformer to be greater than the name plate rating. This allows for an increased number of customers to be attached to a transformer. With the smart meter data the actual peak demand of transformers, using typical customers was calculated and compared to the estimated peak demand.
It was the aim of the Irish Government to have 10% electric vehicles on the road by 2020, although this currently looks quite high. The charging of electric vehicles will have an effect on the LV feeder demand. Using the smart meter data, a high level estimate of obtainable EV penetration rate on a transformer before it reaches full capacity is calculated to be 40% if the 3kW electric vehicles start charging at 23:00. However by changing the time that EVs start charging to 00:00 this can reach 60% penetration on the transformer. Note this is high level and does not take into account possible uneven distribution load on LV feeders, nor does it include the impact of voltage drop along feeders which is a more significant limitation.
However it does indicate that for urban Substations the transformer capacity is not a limiting factor until relatively high penetration levels are reached.

Page 297 of 625
The current voltage standard, EN50160, calls for the voltage to be within standard 95% of the time in a one week period. EN50160 standard measures voltage over a 10 minute period, while the Smart Meter data is half hour data. Having half hour data will have the impact of softening the peaks, but would also give higher coincident levels of peaks than 10 minute data. However, notwithstanding this issue, the study gives a good indication whether typical feeders are within standard. Using the smart meter data, the actual voltage drop of a typical LV feeder with 50 higher than average size customers connected to it and the largest customers at the extremity of the feeder is calculated. This found that the voltage is within standard 99.4% of the time. This is well within the limits set down by the current EN50160 and gives adequate room for increased accuracy that would be got with 10 minute data were to be assessed. It also indicates that it would be acceptable if the voltage standard was changed to 99% of the time, but 10 minute data would be required to accurately assess this for that level of accuracy.
Overall this indicates that the primary limitation on EV Penetration will arise from circuit Voltage drop, not from Transformer thermal capacity of Transformer voltage drop.
2 Network Planning: Worst-Case Scenarios
Distribution networks are planned for the worst-case scenarios, i.e. the customers with the highest peak demand on the day with the highest demand. In this report, the sections about the ADMD, feeder and transformer demand, electric vehicles and load duration curves are all based on worst-case scenarios. In each section the smart meter data used is from customers with an annual consumption in 2009 of over 5,000 kWh. The average consumption of all customers in the smart meter trial is 4,900 kWh, so the data used is from above average customers.
The time of year with the highest domestic demand is also used. It was decided that this day would be a day when the majority of customers were at home, which would be during winter when there is more cooking, lighting and water heating and direct heating used due to the colder and darker conditions. The most likely days for this to occur were Christmas Day 2009, New Years Eve 2009 or New Years day 2009 and 2010, which were holidays when the majority of workplaces were closed, which would mean that the system demand is primarily due to domestic customers. However, on New Years Day 2010, the customer behaviour trial began and the tariffs placed on customers may have influenced their demand, and on New Years Day 2009 only a fraction of the smart meters had been installed, so these two days were excluded.
This left Christmas Day 2009 and New Years Eve 2009 as being the days with the highest domestic demand. To decide which of these days better represented a worst-case scenario the system demand on each of these days, which is available on the Eirgrid website, was examined.
Figure 1 shows the system demand on Christmas Day 2009 and New Years Eve 2009. On Christmas Day the system peak was 3,639 MW and on New Years Eve the system peak was 4,317 MW. Therefore the highest domestic peak possibly occurred on New Years Eve, and so was the day used in this report for the worst-case scenarios.

Page 298 of 625
Figure 160: System Demand on Christmas Day 2009 and New Years Eve 20096
2.1 The Smart Meter Data
The smart meter data used in this report is from the year 2009, before any incentives were used in the customer behaviour trial, so the data represents normal customer behaviour.
The demand of a customer is constantly changing due to the stochastic nature by which customers use their electrical appliances. In order to calculate the demand at any one point the demand curve is broken into equal time intervals. In each interval the average value of the demand is determined and this average is the demand at that point in time. The shorter the time interval the more accurate the value of the demand will be. The smart meter data uses a time interval of 30 minutes. This provides reasonably accurate values for the demand because the appliances in a house that use the most amount of power generally are on for periods of longer than 30 minutes (lights, heating, refrigeration, wet appliances). However there are appliances such as electric showers that are on for shorter amounts of time and the demand of these appliances can appear to be less than it actually is due to the time interval. This can be seen in figure 2 below, the average demand over ½ hr period is 2.5kW, however if we were to look at the same data over a 15 min period, the demand is actually moves from 2kW to 3kW to 3.67kW to 1.3kWs. Figure 2 shows that the variations in demand are significantly more profound if a time interval of 15 minutes is used instead of 30 minutes. This is an important factor to be considered throughout this report. Although the time interval of 30 minutes does show the variations in demand quite well, it may conceal higher demands that would be seen if the time interval is 15 minutes or less. However there is also a contrary point to this that there would be less co-incidence with shorter interval demands, so the overall impact of using ½ hour data gives adequate profile to carry out the assessments.
Adding a constant load such as EV Charging means that the worst case peak will be the sum of the EV Charging level which is constant. With whatever highest load peak occurs during charging, and this in turn will produce the worst case voltage drops. This means that voltage dips during the day when other loads are also on would be significantly worse at times than if EV Charging were at night.
6 Information ex Eirgrid website: http://www.eirgrid.com/operations/systemperformancedata/systemdemand/

Page 299 of 625
Figure 161: Effects of Different Time Intervals
2.2 Load Profiles
A load profile of a customer shows the power demanded by that customer over a given period of time such as an hour, day, week, or a year. For a residential customer, the demand is made up of appliances turning on and off. When an appliance is turned on a spike appears in the load profile, and when it is turned off, the spike disappears. This can be seen in Figure 162 below which shows the load profile for a winter’s day of single customer.
Figure 162: Load profile of a single customer on a winter’s day
This load profile portrays the random and varied switching on and off of appliances throughout a day. It also shows the average power that is required for each half hour interval during the day.

Page 300 of 625
The load factor is a term used to describe the ‘peakyness’ of the demand of a customer, or group of customers. It measures the ratio of the average demand to the maximum demand7. The demand can also be referred to as the load, hence load factor. If a load has a load factor of 1 then the load profile will be flat as the average load will be equal to the maximum load. Load factor of 0.5 would mean that the average power used by a load is half of the maximum power it uses. When a utility designs a system so that it can operate at the maximum load then the load factor gives an indication of how well a utility’s facilities are being used. The average Demand is the total energy used in a time period divided by the time period. The maximum Demand is the highest demand in a time period.
2.3 Transformer and Feeder Demand
Transformers and feeders serve numerous customers. The loads seen by these elements of a distribution system are due to the contribution of several individual loads, which are all different. For example their maximum and minimum demands will all occur at different times. Figure 163 below shows 10 individual load profiles for a winter’s day in December.
Figure 163: Load Profile of 10 Customers
The maximum demand on a feeder is not the sum of the individual maximum demands because they do not occur at the same time. The sum of the individual maximum demands is known as the maximum non-coincident demand. The sum of the demands at any time in the day is known as the diversified demand.
The sum of the maximum demands in this case is 31.7 kW but if we graph the diversified demand, which is the demand on the feeder, the actual maximum demand on the feeder is 21.6 kW. Figure 164 shows the diversified demand on the feeder.
7 William H. Kersting (2002). Distribution Modelling and Analysis: CRC Press

Page 301 of 625
Figure 164: Diversified Demand of 10 Customers
The relationship between the sum of the maximum demands and the diversified demands is known as the diversity of the load. In the case of the 10 customers in the graphs above, the maximum diversified demand is 21.6 kW and the maximum non-coincident demand is 31.7 kW. This gives a diversity of 0.68, a dimensionless figure.
This concept is important for designing networks because it means that a network will not be designed for the maximum non-coincident demand which is never actually reached, instead networks are designed based on the maximum diversified demand which is far more economical.
It is easy to calculate the diversified demand when the individual load profiles of each customer are available, however distribution networks have to plan and design networks without the knowledge of the individual profiles.
In these cases the After Diversity Maximum Demand (ADMD) is used. The ADMD measures the load per customer at the time of the maximum diversified demand. This can be used to calculate the maximum demand (peak load) of an unknown number of customers, using the formula:
Peak Load = N x ADMD,
Where N is the number of customers
The ADMD gives a good estimation of the average power of group of customers at the time of maximum diversified demand. Although a customer may be using less than the ADMD, another customer on the same feeder may be using more than the ADMD and so on average it balances out. (This is the effect of diversity among loads). However at low numbers of customers it does not give a value for the peak demand that takes into account some appliances that use a large amount of power but for short periods of time, such as an electric shower. To compensate for these appliances the ESB assumes that one customer is using its maximum import capacity of 12 kVA, (or 12kW depending on the power factor) and that the other customers are using the ADMD, due to the effects of diversity. Now the formula for peak load becomes:
Peak Load = 12 + ((N-1) x ADMD)

Page 302 of 625
This is the formula that the ESB currently uses to calculate the peak load of N customers.
The value for the ADMD has varied over time and was originally adopted from UK figures in the 1950’s ACE Report, which included the actual loads measured plus an allowance of load growth over the following decades. This resulted in actual housing scheme designs being based on varying levels of ADMD, from 1.6kW in the 1960’s to 2.3KW in mid-2000. Aggregate MV Feeder measurements on Housing Estates in 2008 indicated it to be 2.3 kW, although this does not include any allowances for future load growth. The smart meter data therefore offers an opportunity to calculate what the ADMD of various groups of houses actually is, how close the ESB’s ADMD of 2.3 kW is to the actual ADMD on an LV feeder basis (i.e. without the diversity impact of measuring at MV) and how EV Charging would add to such loads.

Page 303 of 625
3 LV Feeder Demand
A feeder connects customers to a transformer. The worst case scenario of either excessive voltage drop or full thermal capacity on a feeder determines the number of customers on a feeder. Under normal circumstances the voltage drop cannot exceed 5% and the load cannot exceed the thermal rating assigned to the feeder.
As a rule of thumb, the thermal capacity of a feeder is usually exceeded in urban areas before the volt drop criteria, especially if houses are densely packed together. In contrast, on rural feeders, where houses are much further apart, voltage drop becomes the critical factor.
In this section three different types of feeders are examined:
A rural feeder with 5 customers
A rural feeder with 10 customers
An urban feeder with 50 customers
Rural feeders have fewer customers because the customers are much more spread out and so the voltage drop between houses is greater.
To simulate a feeder, random groups of 5, 10 and 50 customers are used. The smart meters are spread out across the country and are on multiple feeders. There is not enough information from the smart meter data to make any assumptions about whether or not customers with similar consumption levels occur on the same feeder or not. Because of this, and ESB Network protocol to plan for a worst-case scenario, the random groups are taken from customers with an annual consumption greater than 5,000 kWh. The average consumption of all the smart meters for 2009 is 4,900 kWh. By taking only customers with above-average consumption, a worst-case scenario is created. The maximum diversified demand of each of the groups is calculated and using the formula seen in the previous section the ADMD of each group can be calculated. This formula can also be used to compare actual load under these conditions with what is predicted by ESBs existing methodology. The actual peak demand is compared to the ESBs calculated peak load via the 2.3kW ADMD formula. The day chosen for this section was New Years Eve because it is the day with the greatest domestic demand, as seen in Figure 160.
3.1 Rural Feeders: Groups of 5 Customers
To simulate the rural feeder with 5 customers, MPRNs were selected randomly from a selection of DG2 MPRNs on New Years Eve that had an annual consumption greater than 5,000 kWh. There were enough MPRNs for a 100 random groups of 5 customers to be created. The load profile of the 5 MPRNs was calculated and the maximum diversified demand was used with the formula for peak load to calculate the ADMD. The following graph (Figure 165) shows in ascending order the peak load with the corresponding ADMD as well as what the ESB have planned for using and ADMD of 2.3 kW.
The blue and green lines represent the actual and ESB calculated peak load respectively with the scale being on the left side of the graph. The red line shows the ADMD calculated using the actual peak load and the scale is on the right side.

Page 304 of 625
Figure 165: Rural Feeder: Maximum Demand of 100 Groups of 5
3.1.1 Results for a rural feeder with 5 customers
There is a sharp rise in peak demand for the last group that results in an ADMD of 2.7kW; however the previous groups ADMDs are 2.5 and 1.9 kW. This indicates that 2 groups (2%) of the 100 exceed the peak load as calculated by the ESB. However it should be noted that the information on which this is based is half hour data and therefore there is a possibility that the ADMD calculated from data with a shorter time interval of 15 or 10 minutes could be significantly higher.
A closer examination of these two groups reveals that just one customer drives the demand throughout the day. This is to be expected as small groups of customers will not tend to correlate with each other so that the peak demand will be made by whatever customer has the highest peak added to the much lower loads of other customers at the same time.
Figure 8 shows the profile for the 100th group, which has an ADMD of 2.7 kW. Each individual’s contribution to the overall profile is shown. The red profile stands out and has a far greater demand than all of the others. It is an MPRN with an annual consumption of greater than 20,000 kWh which is 4 times greater than average.
Figure 166: Breakdown of Individual Loads, Group 100 from Rural Feeder with 5 Customers

Page 305 of 625
Figure 8 shows the profile for the 99th group, which has an ADMD of 2.5 kW. Again the red profile has the largest contribution throughout the day and is the reason for such a large peak demand. This is a MPRN with an annual consumption greater the 17,000 kWh.
Figure 167: Breakdown of Individual Loads, Group 99 from Rural Feeder with 5 Customers
Apart from these two groups, all other groups had an acceptable peak demand and ADMD.
3.2 Rural Feeders: Groups of 10 Customers
Again these MPRNs were selected randomly from a selection of DG2 MPRNs on New Years Eve that had an annual consumption greater than 5,000 kWh. There were enough MPRNs this time for 71 random groups to be selected. The load profile of the 5 MPRNs was calculated and the maximum diversified demand was used with the formula for peak load to calculate the ADMD. The following graph (Figure 10) shows in ascending order the peak load with the corresponding ADMD as well as what the ESB have planned for using an ADMD of 2.3 kW.
The blue and green lines represent the actual and ESB calculated peak load respectively with the scale being on the left side of the graph. The red line shows the ADMD calculated using the actual peak load and the scale is on the right side.

Page 306 of 625
Figure 168: Rural Feeder Maximum Demand of 71 Groups of 10
3.2.1 Results for a rural feeder with 10 customers
This time the highest peak load is less than the peak load calculated by the ESB. This is most likely due to the fact that there are more customers. As the number of customers increases, so does the diversity factor. This decreases the ADMD. The highest ADMD from the 71 groups of 10 is 2.1 kW, which is less than the 2.3 kW that is used in the planning of networks. However this is expected as the ADMD used to plan networks is obtained from urban city areas which generally have a higher coincidence of demand than the average, and hence a slightly higher ADMD. In this instance the issue is whether the ESB figure of 2.3 kW allows sufficiently for future growth.
The contribution of the individual loads to the peak demand of the groups with the highest peaks is again considered, to assess how the individual customers contribute to the peak load. Figure 169 shows the breakdown of the individual loads for group 71, the one with the highest peak. The MPRN represented by the light purple area has an annual consumption greater than 14,000 kWh. It has the most significant impact on the profile at the time of system peak when it makes up a third of the overall demand, whereas in the groups of 5, the MPRN with the biggest impact on the profile made up half of the overall demand.
30.847
32.7
2.094111111
0
0.5
1
1.5
2
2.5
0
5
10
15
20
25
30
35
1 3 5 7 9 11 13 15 17 19 21 23 25 27 29 31 33 35 37 39 41 43 45 47 49 51 53 55 57 59 61 63 65 67 69 71
kW
Peak Load, Current Peak Load and Actual ADMD for 71 groups of 10 DG2 MPRNs
Sum of kW
Peak Load Calculated By ESB
Actual ADMD

Page 307 of 625
Figure 169: Breakdown of Individual Loads, Group 71 from Rural Feeder with 10 Customers
Figure 170 shows the breakdown of individual loads for the group 70, the one with the second highest peak. In this case there is no one particular MPRN that greatly affects the maximum demand.
Figure 170: Breakdown of Individual Loads, Group 70 from Rural Feeder with 10 Customers
3.3 Urban Feeders: Groups of 50 Customers
To simulate an urban feeder, groups of 50 DG1 MPRNs with an annual consumption over 5000 kWh were randomly selected on New Years Eve. There were enough of these MPRNs to create 23 groups. The load profile for each group of 50 MPRNs was calculated, and the maximum diversified demand was used with the formula for peak load to calculate the ADMD. The following graph (Figure 171) shows in ascending order the peak load with the corresponding ADMD as well as what the ESB have planned for using and ADMD of 2.3 kW.
The blue and green lines represent the actual and ESB calculated peak load respectively, with the scale being on the left side of the graph. The red line shows the ADMD calculated using the actual peak load and the scale is on the right side.
0
5
10
15
20
25
30
35
kW
Breakdown of Individual Loads for Group With Second Highest Peak

Page 308 of 625
Figure 171: Urban Feeder Maximum Demand of 23 Groups of 50
3.3.1 Results for an urban feeder with 50 customers
The highest peak out of all the groups was 120.7 kW, which is less than the ESBs calculated demand of 124.7 kW. This corresponds to the highest ADMD being 2.2 kW, which is just below the current ADMD of 2.3 kW.
The group with the highest peak is examined and shows that there is not one MPRN that has a significant effect throughout the day, which was the case with rural feeders. Figure 172 shows the profile for group with the highest peak.

Page 309 of 625
Figure 172: Breakdown of Individual Loads, Group 23 from urban feeder with 50 Customers
3.3.2 Summary of Feeder Demand
Table 21: Highest ADMD from each Type of Feeder
Table 21 shows that the highest ADMD that was calculated by taking the highest peak demand from each feeder. From these figures it would appear as though the current ADMD of 2.3 kW is not sufficient in the case of rural feeders with 5 customers. However when the groups with an ADMD of over 2.3 kW were examined individually they were each found to have a customer with an exceptionally high annual consumption, compared to the average annual consumption. With the exception of two groups on the rural feeder, the current ADMD of 2.3 kW is just above the next highest ADMD of 2.2 kW.
The customers who had an exceptionally high annual consumption had a peak demand of 10 kW which is less than their maximum import capacity of 12 kW.
ADMD
Rural Feeder: 5 MPRNs 2.7
Rural Feeder: 10 MPRNs 2.1
Urban Feeder: 50 MPRNs 2.2

Page 310 of 625
For the time being, the current ADMD of 2.3 kW is still valid, but the contribution of future load growth should also be taken into account. Historically, the demand of a house increases with time. In the future the demand of a customer will be most influenced by the introduction of new appliances, electric vehicles and heat pumps (in certain areas).
New appliances tend to be more efficient and should bring down the ADMD. Table 2 shows an estimation of how the energy usage of appliances in different categories will decrease in the future.
Usage in 2010 (kWh)
Usage in Future (kWh)
Wet Appliances 540 409.31
Refrigeration 696 355.07
Lighting 967 302.22
Circulation Pump 218 192
Space Heating 778 739
Hot Water 1278 1278
Cooking 667 634
Other 413 413
Total 5557 4322.6
Table 22: Appliance Energy Usage in 2010 and the Future8
However electric vehicles and heat pumps are larger loads that will most likely increase the ADMD, the effect of electric vehicles will be looked at in a later section. The net effect will most likely be an increase in ADMD.
This may best be catered for in Network Designs by using the ADMD (After Diversity Maximum Demand) to represent the stochastic demand from non-EV, or Electric Heating loads, and adding such loads on to the average ADMD demand.
The rollout of smart meters on a nationwide basis would allow for a closer monitoring of the demand on feeders, which would allow planners to predict the voltage drops more accurately and make any reinforcements necessary.
NB. The smart meter data used to calculate the feeder demand is measure over a 30-minute interval that may conceal the actual peak demand (See figure 2).
However the groups are composed of the most onerous set of customers with higher than the average annual consumptions. Therefore the demand of more average customers will be less than demand of
8 Figures for 2010 from SEAI website, Figures for the future are based on A rated appliances.
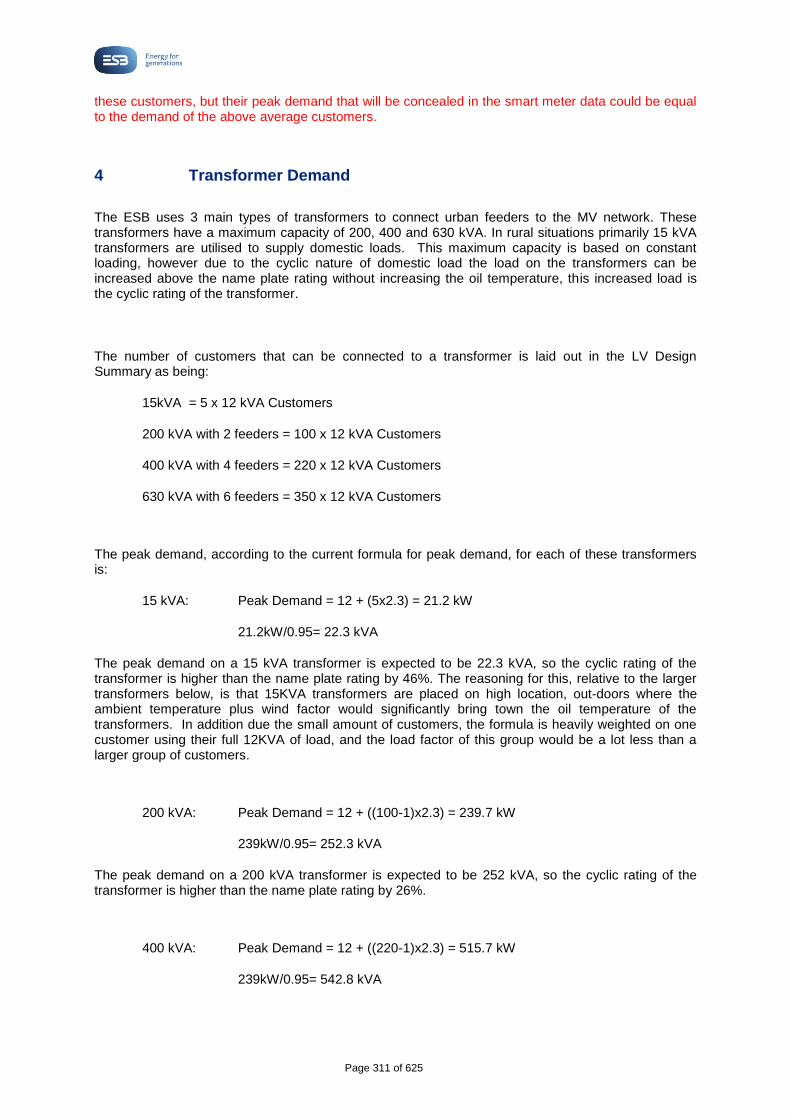
Page 311 of 625
these customers, but their peak demand that will be concealed in the smart meter data could be equal to the demand of the above average customers.
4 Transformer Demand
The ESB uses 3 main types of transformers to connect urban feeders to the MV network. These transformers have a maximum capacity of 200, 400 and 630 kVA. In rural situations primarily 15 kVA transformers are utilised to supply domestic loads. This maximum capacity is based on constant loading, however due to the cyclic nature of domestic load the load on the transformers can be increased above the name plate rating without increasing the oil temperature, this increased load is the cyclic rating of the transformer.
The number of customers that can be connected to a transformer is laid out in the LV Design Summary as being:
15kVA = 5 x 12 kVA Customers
200 kVA with 2 feeders = 100 x 12 kVA Customers
400 kVA with 4 feeders = 220 x 12 kVA Customers
630 kVA with 6 feeders = 350 x 12 kVA Customers
The peak demand, according to the current formula for peak demand, for each of these transformers is:
15 kVA: Peak Demand = 12 + (5x2.3) = 21.2 kW
21.2kW/0.95= 22.3 kVA
The peak demand on a 15 kVA transformer is expected to be 22.3 kVA, so the cyclic rating of the transformer is higher than the name plate rating by 46%. The reasoning for this, relative to the larger transformers below, is that 15KVA transformers are placed on high location, out-doors where the ambient temperature plus wind factor would significantly bring town the oil temperature of the transformers. In addition due the small amount of customers, the formula is heavily weighted on one customer using their full 12KVA of load, and the load factor of this group would be a lot less than a larger group of customers.
200 kVA: Peak Demand = 12 + ((100-1)x2.3) = 239.7 kW
239kW/0.95= 252.3 kVA
The peak demand on a 200 kVA transformer is expected to be 252 kVA, so the cyclic rating of the transformer is higher than the name plate rating by 26%.
400 kVA: Peak Demand = 12 + ((220-1)x2.3) = 515.7 kW
239kW/0.95= 542.8 kVA

Page 312 of 625
The peak demand on a 400 kVA transformer is expected to be 543 kVA, so the cyclic rating of the transformer is higher than the name plate rating by 35%.
630 kVA: Peak Demand = 12 + ((350-1)x2.3) = 814.7 kW
239kW/0.95= 857.6 kVA
So the peak demand on a 630 kVA transformer is expected to be 858 kVA, so the cyclic rating of the transformer is higher than the name plate rating by 36%.
Note: As will be seen later in the analysis, the limiting factors on EV connection are volt drop rather than Transformer loading. The actual impact of EV loading on Transformers will be far more severe than an equivalent resistive load as EV’s use inverters for charging, and so create harmonics. Harmonics increase the heating within the transformer considerably so that the kVA loading is reduced. However as the above has shown substantial headroom it is likely that transformers will accommodate such loading up to the 20% EV Penetration level assessed. In Apartment blocks where voltage drop is not a limit the transformer may require to be uprated as EVs could be a considerable proportion of the load.
Using the smart meter data, the load on a transformer can be simulated and peak load examined. Using this expected peak load, the loss of life of the transformer can then be calculated. The smart meters record the kW consumed by a customer whereas the transformers capacity is measure in kVA so a power factor of 0.95 is assumed in order to make the conversion in this section.
Like the urban feeder simulations, random groups of MPRNs that have an annual consumption over 5000 kWh are selected to simulate the demand on New Years Eve. For 15KVA transformers as the work for the feeder looked at the consumption of 5 customers, this is not repeated here.
The load profile for the day is shown and compared to the transformers rated capacity.
In the discussions below the impact of ESB’s use of the cyclic rating of the transformer rather than its name plate rating is considered and shown to have no material impact on the expected lifetime of the transformer, assuming that the transformer is fully loaded to its maximum cyclic capacity for Domestic load.
Next a level of EV loading is added which increases the cyclic loading and increases the rate at which the transformer ages, thus decreasing its remaining lifetime. This establishes boundaries on the ability of existing transformers to cope with increased loading due to EV’s.
As will be shown in later modules and is supported by this earlier analysis, it is normally not the transformer or feeder capacity which limits EV penetration in urban areas, but volt drop. In turn solving the voltage drop issues by either inter-connection of LV feeders or the installation of sidewalk infeed transformers, also reduces transformer loading.
In rural areas fed from pole mounted 15kVA transformers, volt drop will also be found to be the initial limiting factor, followed by transformer capacity, as EV loads of 3-4 kW are significant in relation to a 15kVA transformer size. Again, the solution of splitting LV groups introduces extra transformer capacity as well as addressing the volt drop issue, so transformer capacity is not a problem per se.

Page 313 of 625
Finally, all of the above are based on the transformer operating at full cyclic loading, but given that transformers only come in fixed sizes of 200,400 or 630KVA, it is inevitable that there will be a mismatch between actual load and capacity e.g. a 300kVA load will require a 400kVA transformer. Over time such mismatches are reduced by load growth, but in the interim could provide extra headroom for EV’s.
4.1 200 kVA Transformer
Consider a 200 kVA transformer with a 100 customers on it. There were enough DG1 MPRNs with an annual consumption over 5,000 kWh to create 11 different groups. For the second graph that includes MPRNs with all consumptions, there were enough MPRNs to create 38 groups. Figure 14 shows the load profile for the 11 groups of MPRNs over 5,000 kWh for the full day. The red line shows the transformers maximum capacity.
Figure 173: 200 kVA Transformer with Random Groups of 100 MPRNs with Annual Consumption over 5000 kWh
The highest peak of all the groups is 235.3 kVA, which is less than the expected peak of 252 kVA. At 235.3 kVA the transformer is loaded to 117% of the name plate rating.
This group can be taken and used to analyse the effect of overloading a 200 kVA transformer and consider if the loading would cause the expected life of the transformer to reduce at a quicker rate than would be required. It would be hoped that the loss of life would be less than 1.

Page 314 of 625
Figure 174: Preload and Peakload of a 200 kVA Transformer
Figure 175: Loss of Life calculation for 200 kVA Transformer

Page 315 of 625
The loading of a 200 kVA transformer above its name plate rating results in a loss of life of 0.06 days per day (See Figure 175). While the transformer is above name plate rating at time of peak load, the customers profile of use give adequate time for the transformer to cool at other times during the day. This confirms that this level of loading is not excessive and there is some room for an increase in the loading – therefore the LV design guidelines outlined above are within the capability of the transformer, without excessive impact on the expected life of the transformer.
4.2 400 kVA Transformer
Next a 400 kVA Transformer is considered, with 220 customers on it. There were enough urban (DG1) MPRNs with an annual consumption over 5000 kWh to create 5 different groups. Figure 18 shows the load profile for the 5 groups of MPRNs over 5,000 kWh for the full day. The red line shows the transformers maximum capacity.
Figure 176 :400 kVA Transformer with Random Groups of 220 MPRNs with Annual Consumption over 5000 kWh
For 400 kVA transformer, the highest peak of the 5 groups was 481.7 kVA, which is less than the expected peak demand of 543 kVA. At 481.7 kVA the transformer is 21% overloaded.
Taking this group with the highest peak the effects of this overloading on the life time of the transformer can be considered.

Page 316 of 625
Figure 177: Preload and Peakload of a 400 kVA Transformer
Figure 178: Loss of Life calculation for 400 kVA Transformer

Page 317 of 625
The overloading on this transformer results in a loss of life of 0.07 days per day. Again this shows that there is ample time for the transformer to cool down after the peak occurs, and that there is enough capacity for the number of customers on the transformer to be increased.
4.3 630 kVA Transformer
Lastly a 630 kVA Transformer is considered with 350 customers on it. There were enough urban (DG1) MPRNs with an annual consumption over 5000 kWh to create 3 different groups. Figure 21 shows the load profile for the 3 groups of MPRNs over 5000 kWh for the full day. The red line shows the transformers maximum capacity.
Figure 179: 630 kVA Transformer with Random Groups of 350 MPRNs with Annual Consumption over 5000 kWh
The maximum load on the 630 kVA transformer is 737.6 kVA which is less than the expected peak demand of 858 kVA. At 737.6 kVA the transformer is 17% overloaded.
This group with the highest demand is taken and used to calculate the loss of life on a 630 kVA transformer.

Page 318 of 625
Figure 180: Preload and Peakload of a 630 kVA Transformer
Figure 181: Loss of Life calculation for 630 kVA Transformer

Page 319 of 625
In this case the transformers loss of life is 0.06 days per day. The overloading is not excessive and there is enough time for the transformer to cool down after the peak.
4.4 Transformers and ADMD
The actual ADMD, using the actual peak demand on each transformer is compare it to the 2.3 kW estimate currently used as follows:
200 kVA: The ADMD is calculated to be 2.13 kW.
400 kVA: The ADMD is calculated to be 2.02 kW.
630 kVA: The ADMD is calculated to be 1.96 kW
From these figures we can see that the ADMD falls as the number of customers increases. This was also seen when calculating the ADMD from the actual feeder demand. The ADMD falls because there is more and more diversity between the customers.
4.5 Results of Transformer Loading
In all cases the highest peak of each group was never more than 21% percent of the transformers rating. As these simulations represent worst case scenarios (all the annual consumptions were over 5,000 kWh), they strongly suggest the increased loading allowed on transformers is correct. Also considering that the loss of life is never more than 1 day per day there is scope for a further review of the appropriate loading levels. However it should be noted that transformers do occasionally have to take increased loads in the case of standby feeding.
The ADMD calculated from the transformers actual peak demands is in table 3 shown below. None of the values are greater than 2.3 kW which is currently used by the ESB.
The smart meter data is measured with a time interval of 30 minutes and may conceal high, short peaks. These are averaged out in terms of thermal loading on the transformer but are of relevance to
ADMD
200 kVA: 100 MPRNs 2.13
400 kVA: 220 MPRNs 2.02
630 kVA: 350 MPRNs 1.96
Table 23: ADMD calculated from Transformers Actual Peak Demand

Page 320 of 625
voltage drop calculations. Therefore the results in this section are a good indication of the actual load on transformers based on a 30 min integration period.
ADMD in the future
When the current ADMD was calculated initially ibn the 1950’s it included growth into the future. Now that the end of this pre-calculated growth has been reached, the future ADMD must also be calculated. The demand of customers will be made up of three main areas: Appliances, Heat Pumps and Electric Vehicles.
The tendency with appliances is for them to become more efficient. This should lead to a decrease in the demand as older appliances are gradually replaced with newer A rated appliances (See Table 2).
Heat pumps are most likely to replace oil and solid fuel boilers. However customers that are connected to the gas network are unlikely to get a heat pump. A heat pump will increase the demand of customers but will only have an affect on the average ADMD in an area if they are installed in clusters. However as Heat Pumps run at constant load for long periods they will significantly increase the demand of any customers using them e.g. a typical 3kW heat pump will run most of the day and will clash with the house peak load, so that the demand of a house with a Heat Pump will be 5.3kW.
Electric vehicles are also significant in future customer load increases as they also run for long periods to charge the car (e.g. 3,000kWh charging of EV per annum vs other kWh consumption of c. 5,000kWh). In addition, whilst existing single phase chargers tend to operate at 3 – 3.7KW, other single phase models operators at 7kW, and there phase models at 11kW or 22kW.
4.6 Electric Vehicles
The initial aim was to have 10% Electric Vehicle penetration by 2020, which would have amounted to approximately 250,000 vehicles. This target may no longer be achieved, and a more realistic, but still challenging target, would be 60,000 units. However these EV’s may not be randomly distributed over the network but instead occur in clusters. Accordingly it was decided that where such clusters occurred they would correspond to a 10% penetration rate of the Feeder involved. The smart meter data allows for a realistic view of how these electric vehicles will change the load profile of a feeder.
There will most likely not be an even distribution of electric vehicles among feeders; therefore the effects of varying penetration rates on feeders will be looked at.
The feeders examined in this section are the ones that were created when examining the demand on urban feeders in the previous section on LV feeder demand. An urban feeder was picked because Electric Vehicles are likely to be more popular for use by commuters in urban areas, than rural commuters who may have to travel further distances. The impact on peak demand of each feeder on New Years Eve in 2020 is examined as the penetration level of EVs is increased.
As this is a simulation is a worst-case scenario a number of assumptions is required:
0.5% load growth every year between 2009 and 2020.

Page 321 of 625
Customers charge every night from an empty battery to a full battery. (Realistically cars will not always need to be fully charged and so charging may only take 4-5 hours.)
A favourable but realistic scenario would involve Customers with EVs being on a Night rate tariff that begins at 11pm during winter. It is also assumed that there is a staggered start to the charging of the vehicles with half the cars start charging at 11 while the other half does not start until 12.
The charging requirements for this diction were based on the Nissan Leaf. The Nissan Leaf has a 24 kWh battery that requires 3 kW for 8 hours. Another electric vehicle that will be released is the Mitsubishi I-MIEV, which requires 2.3 kW for 7 hours. The Leaf requires more power for longer and so it was used in this simulation. In fact the Leaf charger could charge at 3.7kW peak, but as there is adequate time to fully charge over 8 hours, the charge rate assumed was 3kW.
Each of the feeders had 50 customers, so 10% penetration corresponded to 5 customers charging an electric vehicle. At 10% penetration there would be 15 kW (5 customers x 3 kW per vehicle) added to the load profile for 8 hours during the nights. However with the staggered start, there is 9 kW from 23:00 to 00:00, 15 kW from 00:00 to 07:00 and 6 kW from 07:00 to 08:00.
The kW for each penetration level were calculated and added to each of the 23 feeders. Figure 182 below shows the peak demand of each customer in ascending order and how it compares to the ESB’s current peak load, (the red line). As the EV load is effectively filling the night valley of the profile, there is no difference in the peak demand until 15% penetration is achieve at which point the electric vehicles begin to affect the feeders with lowest peak demand on the left of the graph. As 35% penetration the electric vehicles have changed the peak of 19 of the 23 groups, but they are still below the ESBs calculated demand. At 40% penetration the electric vehicles have changed the peak demand of 22 of the 23 groups. At 45% the peak of half of the groups exceeds the ESBs calculated peak load.
Figure 182: The effect of Electric Vehicles on the peak demand of urban feeders
This graph indicates that electric vehicle penetration could reach 40% before feeders will become overloaded, if charging was to be restricted to or predominately at night. These feeders were created using MPRNs with an annual consumption greater than 5,000 kWh so they do represent a realistic

Page 322 of 625
worst case scenario from that viewpoint. However this result would need further investigation as with the EV load, the load factor or utilisation factor of assets would be significantly higher and therefore the equipment ratings may have to be reviewed in light of the less cyclic load of domestic customers with EVs than was previously the standard. In reality voltage drop issues will be experienced before Feeder Load issues, so that the above figures tend to indicate that Feeder loading is not on the critical path limiting EV penetration.
As well as examining the peak a single feeder with varying EV penetration levels is also examined. For this we take group 23, the group with the highest peak without any electric vehicles. In 2009 this group has a peak of 120 kW on New Years Eve, which with 0.5% load growth gives a peak in 2010 of 126.7 kW which is just below the calculated peak demand for a feeder of 50 which is 127 kW. This feeder represents the worst realistic case.
To this feeder we add increasing numbers of Electric vehicles. Up to the point where the actual peak demand of the feeder is greater than the calculated peak demand. Figure 183 shows how the profile changes with increasing penetration levels. The order of the day has been rearranged so that the focus is night-time.
Figure 183: Simulation on New Years Eve - 23:00 Night Tariff
The electric vehicle penetration rate reaches 40% before the peak begins to exceed what has been planned for. In this situation only half the vehicles begin charging at 11 and the rest at 12. If they were all to begin charging at 11 then the peak would occur at 11, and there would be a slight reduction in the penetration rate that is achievable without feeder reinforcement.
In Figure 183 the demand is still falling when the night rate tariff begins. So the peak demand occurs when the night rate tariff begins. In the next two graphs we examine what would happen if EVs started charging later in the night.
Figure 25 below shows what would happen to the feeder demand if electric vehicles started to charge at 00:00 instead of 23:00. The demand at 00:00 without electric vehicles is already less than the

Page 323 of 625
demand at 23:00, this means that the EV penetration level can reach 60% before the peak becomes greater that the peak calculated by the ESB.
Figure 184: Simulation on New Years Eve - 00:00 Night Tariff
Figure 26 shows what would happen to the feeder demand if Electric Vehicles started to charge at 00:00 instead of 23:00. The demand at 00:00 without EVs is already less than the demand at 23:00, this means that the EV penetration level can reach 60% before the peak becomes greater that the peak calculated by the ESB.
Fig 27 shows what would happen to the feeder demand if Electric Vehicles started to charge at 01:00 instead of 23:00. The demand at 01:00 without EVs is getting closer to the night-time valley, and so more EVs can be facilitated by the feeder if they were to start charging at this time. However if EVs start charging at this time then they will not be finished by the time that the demand began to pick up in the morning and so the peak will occur in the morning. In the case that EVs start charging at 01:00 the EV penetration level can still only reach 60% because of the peak that occurs in the morning. However if a vehicle started charging at 01:00 it would not be fully charged until 09:00 which is too late for most commuters.
Penetration levels such as 40% and 60% are mentioned in a crude manner and without the long list of caveats that would normally be expected. The reason for this is because what the analysis indicates is that it is not the feeder or transformer thermal capacity which will be the limiting actor, but the voltage drop which will be shown to appear as a limitation at much earlier stages.

Page 324 of 625
Figure 185: Simulation on New Years Eve - 01:00 Night Tariff
4.7 Results
Under current conditions, Electric Vehicle penetration can reach 40% before there is a problem with regards to the peak demand exceeding the peak demand for thermal capacity that the ESB has planned for, provided such charging occurs at night.
Based on the results from Figure 184 and Figure 185, this suggests that there is scope for the establishment of strong Time of Day rates which would start at a time that would allow vehicles to be charged by the morning and that would ensure the peak demand due to Electric Vehicles was as low as possible.
The smart meter data is measured with a time interval of 30 minutes and may conceal high, short peaks which will have a significant effect on voltage quality. Therefore the results in this section are not conclusive, but are a good indication of the effect of Electric Vehicles.
4.8 Electric Vehicles and Transformers
In the previous section on transformer, it is seen that under current conditions there is time for transformers to cool down following loading in excess of the nameplate rating. However the addition of electric vehicles charging during the night will reduce the time during which a transformer can cool down. The effects of electric vehicles charging during the night on the transformer can also be examined. Taking the 40% penetration rate seen in Figure 24 and applying them to each of the urban transformers, the loss of life can be calculated. There will be a significant change in the loss of life because there is a decreased time which the transformer has to cool down.

Page 325 of 625
4.9 200 kVA Transformer
In Figure 27 the red line shows the original demand, and the blue line shows the addition of electric vehicles. 40% penetration on a 200 kVA transformer corresponds to 40 customers owning electric vehicles. And at 3 kW for each electric vehicle, there is an extra 120 kW added onto the night load. In this case the peak load becomes 246 kVA, which is a lot closer to the cyclic rating of the transformer, which is 252 kVA.
Figure 27: 200 kVA Transformer with 40% EV penetration
Figure 28: Loss of Life calculation for 200 kVA Transformer With 40% EV penetration

Page 326 of 625
In this scenario the loss of life of the transformer is 0.9 days of life per day’s usage, which is a huge increase on the loss of life without Electric Vehicles, which is only 0.06 days per day. In effect the rate of loss of remaining life is doubled, although it could still take a long number of years before this impacted on the transformer, because such levels of loss of life only occur on days when such peaks are reached e.g. in summer with lower loads the aging of the transformer will be less than it’s expected 1 day/day so that lifetime extensions are being banked for future consumption.
However this method for calculating the loss of life does not take into account the gap between the two peaks in which the transformer would have been able to cool down slightly.
4.10 400 kVA Transformer
In Figure 29 the red line shows the original demand, and the blue line shows the addition of electric vehicles. 40% penetration on the 400 kVA transformer corresponds to 88 customers owning electric vehicles. And at 3 kW for each electric vehicle, there is an extra 264 kW added onto the night load. In this case the peak load becomes 507 kVA, which is closer to the cyclic rating of the transformer which is 543 kVA.
Figure 29: 400 kVA Transformer with 40% EV penetration

Page 327 of 625
Figure 30: Loss of Life calculation for 400 kVA Transformer With 40% EV penetration
The loss of life on the 400 kVA Transformer becomes 1.6 days per day. Without electric vehicles the loss of life is 0.07 days per day. This increase is due to the decreased time for the transformer to cool down. A 200 kVA transformer will take 100 customers, but a 400 kVA transformer will take 220 customers, this is not a linear relationship because it is assumed that there is more diversity as the number of customer’s increases. However there is no diversity between the electric vehicles charging and so with a larger transformer the loss of life is much greater. This will be seen again with the 630 kVA transformer.
4.11 630 kVA Transformer
In Figure 31 the red line shows the original demand, and the blue line shows the addition of electric vehicles. 40% penetration on the 630 kVA transformer corresponds to 140 customers owning electric vehicles. And at 3 kW for each electric vehicle, there is an extra 420 kW added onto the night load. In this case the peak load becomes 842 kVA, which is closer to the cyclic rating of the transformer, which is 858 kVA.

Page 328 of 625
Figure 31: 630 kVA Transformer with 40% EV penetration
Figure 32: Loss of Life calculation for 630 kVA Transformer With 40% EV penetration

Page 329 of 625
For a 630 kVA transformer the loss of life is 4.8 days per day. This is quite a severe increase, as the loss of life without any electric vehicles is only 0.06 days of life per day’s usage.
5 Overall Results from Electric Vehicles
Under current conditions, Electric Vehicle penetration can reach 40% for thermal capacity before there is a problem with regards to the peak demand exceeding the peak demand provided such charging occurs at night.
Based on the results from Figure 24 and Figure 25, this suggests that Time of Day tariffs should be established, starting at a time that would allow vehicles to be charged by the morning and that would ensure the peak demand due to Electric Vehicles is as low as possible.
On urban feeders the electric vehicle penetration can reach 40% however this has a great effect on the transformer because transformers need time to cool down after the load exceeds the name plate rating. The loss of life for each transformer with a 40% EV penetration rate is shown below
200 kVA: 0.9 Days per Day
400 kVA: 1.6 Days per Day
630 kVA: 4.8 Days per Day
The loss of life on a 630 kVA transformer is most severe and a cause for concern. So although feeders have the capacity to deal with 40% penetration rate of electric vehicles before reaching their thermal limit, transformers are more capable of taking extra capacity at peak times, than during the night when they normally cool down. However these calculations did not take into account the gap between the evening peak and the electric vehicle peak that the transformer would be able to cool down for. These graphs are also based on a peak day with a lot of domestic load, during the rest of the year the transformers demand will not be as high and the peak in the evening is likely to be a lot smaller than on this particular day.
The smart meter data is measured with a time interval of 30 minutes and may conceal high, short peaks. Therefore the results in this section are not conclusive, but are a good indication of the effect of Electric Vehicles.

Page 330 of 625
6 Load Duration Curves
A load duration curve graphs the power consumed against the percentage of time that it is consumed for. This is important with regards to voltage standard because networks are planned according to the ADMD of customers. And although on average a group of customers may not exceed what their peak load is, several customers may be using more than their ADMD, which would lead to an unacceptable voltage drop on the network.
According to EN50160 the voltage should be within standard more than 95% of the time in a 1 week period. This is to be measured at 10 minute intervals. This therefore allows the voltage to be outside standard for up to 8 hours in a week. There have also been proposals in the past to tighten the EN50610 standard to require the voltage to be within standard for 99% of the time rather than 95% of the time, this would reduce the time allowed to be outside standard to less than 2 hours per week. Similarly reducing the aggregation interval to less than 10minutes would also impact on the time outside standard.
However the smart meter data records the kW at 30 minute intervals so it is not accurate enough to be used as proof of the EN50160. It can however be used as a good indicator.
For this section we take a random group of 50 customers that all have an annual consumption greater than 5,000 kWh, and examine their consumption for 1 week in December (16th – 22nd).
First the load duration curve is created for each customer within this group of 50 customers.
Figure 33: Load Duration Curve for 50 Customers for 1 week in December
The green line shows the loads for the highest 5 % of the time and the red line shows the average ADMD used in Network design. The blue line shows the actual load which is more than 3.2kW for 5% of the time and less than 2.3kW for 10.8% of the time. In theory if the network is designed to the limit any increase over 2.3KW could result in low voltage, but statistically not only is the load required to be above 2.3kW, but also its position along the feeder is also significant. The load duration curve shows

Page 331 of 625
that domestic loads, when looked at on an individual basis are very peaky. For the top 5 % of time, each customer will be using on average 3.2kW each or more, For the top 1% of time, each customer will be using 5.7kW or more.
This would give some indication that the impact of any tightening the EN50610 standard could be significant, however, in addition to the fact that there would be a lot of diversity among the individual peaks, because there are significantly less peaks at 99% level, there would be increased diversity among the highest peaks – therefore this is only an indicator.
The load duration curve does not take into account non-coincident nature of the load, and although for 10.8% of the time, there are customers over 2.3 kW, these do not all occur at the same time.
In fact the curve shows that the relationship for Feeder Load (= 12kW + (n-1) ADMD) is correct, as it is established that any individual customer is likely to be 12kW or less, and that the other customers are likely to have an ADMD less than 2.3kW for 90% of the time. For customers <5,000kWh pa this figure will be less again.
Figure 34: Number of MPRNs that exceed 2.3 kW at each point in a 1 week period
Fig. 34 shows how many of the customers exceed 2.3 kW at each half hour in the full week. The graph resembles the average load profile of a house, with more customers exceeding 2.3 kW in the evening around 19:00.
At most there are 18 of the 50 customers exceeding 2.3 kW on Tuesday at 19:00 and Saturday at 18:30.

Page 332 of 625
The consumption of the 50 customers at these two times is examined as follows.
Figure 35: Distribution of Consumption for 50 customers on Thursday at 19:00
On Thursday at 19:00 the load is 93.2 which give an average load per house of 1.9 kW, which is less than the 2.3 kW that is assumed.
Figure 35: Distribution of Consumption for 50 customers on Saturday at 19:00

Page 333 of 625
On Saturday at 18:30 the load is 102.3 which give an average load per house of 2.05 kW which is again less than the 2.3 kW that is assumed.
The percentage voltage drop can be calculated at each half hour in the week using the smart meter data. The graph below shows the worst possible voltage drop that occurs when the loads are organised so that the customer with the highest demand is at the end of the feeder, and assumes that the actual feeder voltage drop is 5% at peak.
The Volt drop calculated is from the MV/LV substation transformer to the customer premises so includes the LV mains plus the service cable. The allowable volt drop as per ESB planning criteria that can be allocated to this network is 5%. Based on this graph the typical voltage (without EV’s) is not out of standard at any stage and therefore is well below the 5% which is allowed by the current EN50160. In addition it should be noted that while the maximum volt drop occurs for just one hour in the week (0.6%).
Figure 37: Worst Possible Voltage Drops in a 1 week period
The load duration curve shows that under current conditions customers use more than 2.3
kW for more than 5% of the time that is used for planning networks, however the load duration curve does not take into account the diversity between the loads and when the voltage drop is calculated throughout a full week it is only greater than 5% for 0.6% of the week. This is well within current
voltage standards.
The voltage standard requires the load to be measured in 10-minute intervals, the smart meter data measures the load in 30-minute intervals and so is not accurate enough to be used as proof of EN50160, but it does give a good indication.

Page 334 of 625
Note: Harmonics
Harmonics cause excess heating in transformers and EV Charging is a rich source of Harmonics. However given that EV’s are generally expected to spread across the networks, this means that their harmonic impact will also be diffused, except in those areas where they cluster. In such areas voltage drop is likely to force reinforcement wither through additional Substations or uprating of existing ones, at which point any excess harmonic load can also be addressed, either through the very fact that an additional transformer will split the load, or a replacement transformer can be a larger capacity.
7 Impact on System Demand
The impact of EV’s loading on System Demand depends on the coincidence between System Peak and EV demand as well as the volume/size of EV’s installed and whether these are Demand Controlled.
The experience from the Roebuck Downs Field Trials was that customer would charge their cars once they were at or below 75% charge rate, and that this charging would generally begin once the customer arrived home after their last journey of the day. From the field data it would suggest that c.30% of EV’s would be in the process of charging between 6pm and 8pm and thus potentially contribute to the System Peak.
So as a crude assessment of the impact of 20% penetration EV charging on System Peak the following calculation can be used:
Number of EV’s at 20% Penetration: = 20% x 2.3m (no of Cars in Ireland in 2020)
= 0.46m
EV kW Demand: = 3kW
% of EV’s charging 6pm – 8pm: = 30%
Impact on System Peak: = 30% x 3kW x 0.46m
= 420MW
Given that the 2014 SEAI report suggested that EV penetration would be only c. 2% in 2020 (50,000 EV’s) this would then correspond to about 45MW.

Page 335 of 625
In such a scenario even a car which only required charging for a few hours would likely coincide with the system peak. As shown in WP 4.2, using Time of Day Charging/Demand Control to move EV’s from this point en masse to (say) 8pm could in some instances, also cause problems at high levels of penetration simply from the volume of coincident EV load then charging simultaneously.
As not all EV’s need to charge simultaneously there is scope to use Demand Control, to spread the load more evenly but this is beyond the scope of this report. However any Demand Control measures used should be in conjunction with ‘Servo’ so that Demand Control does not cerate network problems at LV whilst solving problems at Transmission/Generation levels.
The decision on the interaction of requirements at LV vs Generation/Transmission is essentially an economic one and any restrictions at LV in particular instances can be removed if economically justified – in PJM, which uses nodal pricing, network bottlenecks on the system are identified by restrictions on operation, and then a comparison of the costs incurred vs those avoidable through reinforcement made.
However as Transmission/Generation requirements are met through Demand Control anywhere on the Network, it is less likely that limitations on a particular section of networks caused by the inability to control (say) 10EV’s on a particular section of LV Network when required would be justified – likely to be more economic to simply choose another set of EV’s to which no limitations applied.
8 Conclusions
From the above it is reasonable to conclude that Transformer capacity will not normally be a limiting factor in the introduction of EV’s up to a 20% penetration rate.
Usually voltage drop will be the limiting factor, and as will be shown in WP 4.6 and WP 4.7, this is best alleviated through either change of existing transformer or injection of a new Transformer. In cases where a new Transformer is added then the load on the existing one is automatically reduced, and in case of replacement with a ‘SmartGrid’ MV/LV Tap Changing transformer, if additional capacity is required a large sized unit, up to 630kVA, can be retrofitted for a small additional cost.
In apartment blocks where volt drop is not an issue then the transformer capacity will be come the limiting factor, and can be solved by uprating the existing transformer or adding in a second one, depending on existing and ne loading. In addition harmonic heating effects on the transformer may be more evident is such cases and add to the thermal loading beyond what the extra kVA demand adds.
CAVEAT: The expected EV penetration will be limited by volt drop issues well before Transformer loading becomes a problem. The analysis here indicates that thermal inertia on the transformer can allow extra loading to significant extents, so that it is clear that transformer loading is not an issue. However no utility worldwide has ever loaded transformers to this extent in practice, so that the calculations herein are all theoretical and heretofore unknown issues may arise if transformers were pushed to these limits.

Page 336 of 625
Work Package 4.2
Report on network reinforcement
requirements for various levels of EV
penetration and the impact of Dumb Charging
on Urban Low Voltage circuits based on
existing EV trials

Page 337 of 625
Table of Contents
1 Introduction .........................................................................................................................338
2 Dumb Charging on Urban LV circuits based on existing EV Trials ...............................338
3 Roebuck Downs Trials........................................................................................................339
4 Application of Data obtained in Field Trials .....................................................................342
5 Conclusions on Dumb Charging .......................................................................................344
6 Distribution reinforcement requirements for various levels of EV penetration ...........344
7 Use of Demand Response Solutions ................................................................................346
8 Conclusions on Choice of Demand Response versus Distribution Reinforcement for Electric Vehicles .................................................................................................................................347

Page 338 of 625
1 Introduction
The requirement in WP 4.2 is as follows: ‘Report on Distribution reinforcement requirements for various levels of EV penetration and the impact of Dumb Charging on urban low voltage circuits based on existing EV trials’.
Many of these aspects have been covered in WP 4.0, WP 4.6 and WP 4.7 and associated parts will be referenced here.
In addition the possible use of SmartGrid technology/Demand Response to address LV issues arising from increased load will be examined.
2 Dumb Charging on Urban LV circuits based on existing EV Trials
The impact of Dumb Charging was trialled in the Roebuck Downs tests where Electric Vehicles were given to residents and the charging regimes used were uncontrolled, save that charging was restricted to 3.7kW.
These results were then fed into a Load Modelling program in order to assess what the impact of EV ‘Dumb Charging’ would be for different points on the Distributions.
As a background to the issues associated, the amount of Load (of any kind) which Urban Distributions can accept is dictated by when either Thermal Loading or Power Quality criteria are breached.
Load criteria dictate that Plant should not be overloaded in normal operation. This is because overloading of plant results in a reduction of life and this reduction increases exponentially with the additional load. The effects of such loading on lifetime are cumulative and can raise the risk of unexpected failure.
In terms of Power Quality, such issues arise when the extra electrical load causes unacceptable variations in Voltage, beyond those allowed in EN50160. Such voltage criteria include changes in the average voltage below 207V, dips in voltage caused by sudden increases in load, flicker caused by rapid increases/decreases in voltage of about 1-3% caused by rapidly varying loads, and increases in Harmonics associated with operation of inverters such as would be used in Battery Charging.
In practice the Distribution and the load are such that one criteria is breached ahead of another, but this also means that the condition initially breached may simply be the first before the next criteria then breached. As an example average voltage will decrease with circuit length for a given load, so that as load is increased the voltage will decrease until it is outside standard. Rectifying such a breach e.g. through the use (say) of an electronic voltage regulation device will increase the load on the Distribution and cause another voltage drop upstream of the first, possibly solving the initial problem but creating another elsewhere.

Page 339 of 625
3 Roebuck Downs Trials
As part of the ESB eCar Trials a section of the LV Distribution in South Dublin (Roebuck Downs) was selected for study, as typical of underground urban Distribution, and is covered in EPRI Paper ‘ESB Electric Vehicle Assessment’ EP-P35490/C16097.
The Distribution chosen fed up to 74 customers and was supplied at LV from a 400kVA Unit Sub Transformer and was capable of being modelled in detail. Demands of 3kW were used for EVs for various penetration rates.
Fig. 1 Roebuck Downs Estate
The results then indicated that if the EV’s were clustered at the remote end of the feeder voltage breakdown occurred at 8% penetration assuming balanced feeder loads. Conversely if the EV’s were clustered closer to the Transformer (Sending end) then voltage would not be breached until 20% penetration.
Fig. 2 Voltage Drop versus %EV Penetration rate

Page 340 of 625
In both scenarios, however, if voltage unbalance were present between phases then some phases would start with lower voltages and breach limits earlier.
From the above it was seen that voltage breakdown was the most critical criteria.
Thermal loading limits on the Transformer were reached between 20-30% penetration and on the cables at around 60% (-because the load had been divided over three cable circuits. Normally any individual cable circuit capacity is less than the transformer capacity).
The results from the modelling were then assessed against results from Field Trial Measurements on the same Distribution with penetration rates of up to 10%, based on the installation of 7 Mitsubishi iMiEV Electric Vehicles.
Fig. 3 Impact of EV Charging on Residential Profile
From Fig. 3 where the EV is charging at night, a comparison of the effect of EV Charging on a customer’s typical average usage pattern can be seen – the EV load is greater than the average residential load and if coincident with normal residential usage would effectively double the demand.
In examining the above consideration also needs to be given to effects which are hidden by the averaging processes – the EV is essentially a constant load of about 3kW when averaged over 10 min intervals. The Average Residential Profile is however made up of many separate appliances, used by many customers, and then averaged over a 10 min period. This reduces the variability by a considerable amount. In practice customer scan show individual demands of up to 12kW but for short periods of time, these then average out in the consolidation. However as the impact of short voltage changes can be significant, as even occasional short dips in voltage can cause equipment problems in sensitive equipment.

Page 341 of 625
Fig. 4 Probability distribution of ECV Charging over 24 hr period
The actual charging profile which was seen in the Field Trials at Roebuck Downs is shown above in Fig. 4, and indicates that, in general, people plug their EV’s in as soon as they return form work and then leave them charging until unplugged the next morning. Of course the actual amount of active charging which takes place will depend on the state of remaining charge already in the battery when charging commences, and in practice it was found that the EV’s still had a half charge left when initially plugged in. This indicated that users have concerns over running out of charge and will plug in the EV for Charging regardless of the state of existing charge remaining i.e. in the Trails, EV users charged once their EV was below 75% of charge. Overall c.30% of EV’s were charging in the period 6pm – 8pm and might coincide with System Peak.
This means that most EV’s when installed will tend to charge simultaneously with overlaps of load over at least some part of their charge cycle e.g. one EV may charge continuously for 8 hrs, another for only 2 hrs, but both will simultaneously draw load during the first two hours. This is more severe on the Distribution than if the EV which required only 2 hr charge was plugged in on a different day, as would be possible technically, but which is not done due to ‘range anxiety’ on behalf of the customer.
Voltage quality was also measured during the trials and indicated that low voltage was associated with either high demand or low incoming system voltage – obviously a combination of these two effects would be particularly onerous. Interestingly, the proposal in WP 4.6 to use MV/LV tap changing transformers can be expected to overcome both of these issues.
Significant differences were also noted between the average and instantaneous voltage and currents due to the averaging effect of the ‘ten minute’ average, and in practice such differences would need to be accommodated in any design, as excessively low voltage for even short periods of time can cause problems to sensitive customer equipment.

Page 342 of 625
4 Application of Data obtained in Field Trials
Using data from the field trials the impact of an 8-10% penetration on a ‘Roebuck Downs’ Distributions was modelled probabilistically, so that typical EV demand was averaged at 2.8kW and suggested that at such levels breaches of the voltage standard occurred, but infrequently, as shown in Fig. 5.
Fig. 5 Voltage level probabilities at 10% penetration (remote end)
Conversely, once 50% penetration was reached there were widespread breaches of voltage criteria (Fig. 6) and even when charging was prohibited from coinciding with evening peak, this caused the charging to be concentrated from 8pm onwards, causing a significant amount of voltage issues post 8pm (see Fig 7.)
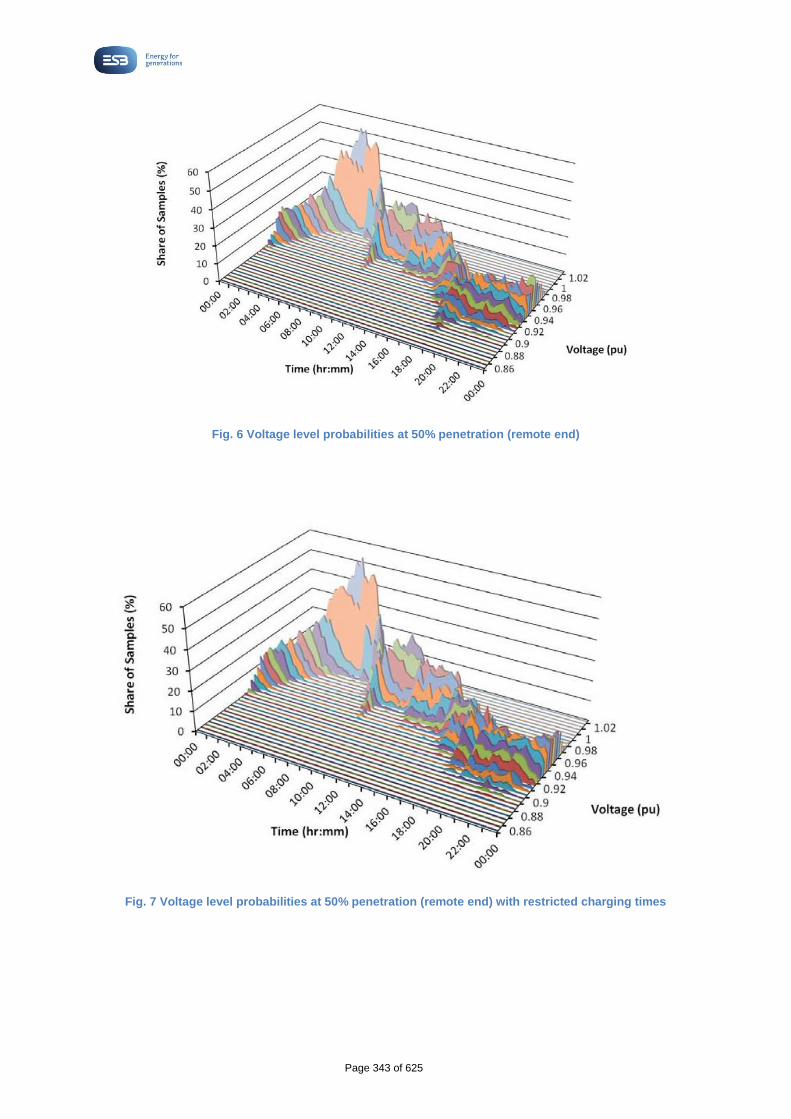
Page 343 of 625
Fig. 6 Voltage level probabilities at 50% penetration (remote end)
Fig. 7 Voltage level probabilities at 50% penetration (remote end) with restricted charging times

Page 344 of 625
5 Conclusions on Dumb Charging
In the particular case studied it was demonstrated that up to about 10% EV penetration in a worst case configuration (on that particular Distribution) could be accommodated without any significant breach of power quality standards and consequently without any requirement for reinforcement.
However the 10% penetration was on the margin of impacting power quality and exceeding the 10% would cause increases in the breaches occurring as penetration levels were increased.
At penetration levels of 50% it was shown that voltage standards were widely breached and that restricting the time of charging di not alleviate the problem, as it simply shifted charging to a different time period, non-coincident with the local demand peak, but where it was still sufficient on its own t cause problems.
6 Distribution reinforcement requirements for various levels of EV
penetration
Distribution reinforcement is required once power quality or thermal loading limits are breached.
At the LV level the potential solutions are as follows:
(a) Redistribute load between feeders by changing Sectionalizing
- This is often possible in dense urban Distributions with many interconnected feeders, such as in Dublin City centre. Moving to the suburbs the extent of such LV interconnection is less and consequently it is of less significance. However as a very low cost, fast solution it must always be considered first.
(b) Install an MV/LV Tap Changing Transformer:
- This solution increases the sending voltage from the Unit Substation and would generally solve any voltage related problems. As these are the first that will appear it will normally be one of the first solutions proposed. In addition, as the cost of installing a larger sized transformer is perhaps an extra 20%+ of the overall cost of installing a tap-changing transformer, such a solution would also easily address any upcoming Transformer loading limitations foreseen.
- Cable loading is likely to be less of a problem as transformers normally have multiple cables offloading the transformer to reduce electrical losses, minimize voltage drop and improve reliability.
(c) Install a Sidewalk Transformer:
- In cases of older Distributions where circuits have been reduced in capacity to match loads which were expected to be lower with distance from the Unit Sub, or where smaller overhead LV lines gad been used, problems with both voltage and circuit capacity may occur simultaneously. Whilst (b) would solve any voltage issues it would not have an

Page 345 of 625
impact on circuit capacity. The only way to address this would be to add in /replace existing circuits which would be very expensive and time consuming due to the large amounts of civil works involved, or instead install a small transformer on the pavement and use it to feed circuits locally. This removes the loading restriction on the cables, increases overall capacity and provides a strong source of voltage.
So for any loading levels above 10% penetration it is likely that breaches of the voltage criteria will occur and reinforcement is required, most likely with solution (b) or (c).
Accordingly the issue then revolves around what percentage of the Distribution would require such reinforcement at different penetration levels, and whether the same solutions that were relevant at 10% + are also relevant at higher levels such as 50%+, or whether a new approach e.g. demand control, would be relevant.
It is also important in this context to allow for the timescale over which such EV penetration would take place, as with a long timescale the Distributions will require refurbishment anyway, which then provides scope for low cost reinforcement as part of normal Distribution development, and also, with time, technological advances take place which make the cost of demand control very much less.
Reinforcement of MV Distribution and higher voltage Distributions are unlikely to be significantly affected by EV growth in the short term as the MV Load is the aggregate of both Domestic and Commercial /Industrial loads, so that the proportion of EV load at MV of total load is small and not a significant driver for MV & HV investment.
Accordingly the real area in which investment needs will arise is from problems arising at LV where the penetration of EV’s on a circuit is distributed at feeder end and used in such a way as to cause voltage issues.
Typically a Unit Sub on a housing estate will have 200 customers and these will be spread over 3 – 4 circuits. To cause a voltage problem the EV’s will need to be concentrated on one feeder and at the end of the feeder e.g. in Roebuck Downs there were 54 customers on one feeder with 7 EV’s at the end of that feeder in order to cause problems. So whilst problems can occur, once such distributions happen, they are relatively unlikely.
Taking it that for EV’s at the start of a feeder 20% penetration can be accepted, and at the end of feeder 10%, then if EV’s are distributed uniformly a penetration of 20% is also acceptable as this will only have the same impact as 10% penetration at the end of the feeder (- a uniformly distributed load on a feeder will create half of the voltage drop of a similar load lumped at the end of the feeder).
So this suggests that at an overall national penetration rate of 20%, voltage issues will not generally arise unless there is clustering at the end of the feeder (-assumes non-tapered feeder and normal sending voltage). For 20% penetration of EV’s in an area served by one Unit Sub and assuming a similar house density to Roebuck Downs, a feeder would require 6 EV’s at the end along with 54 customers. As Unit Subs will have at least two cables for 200kVA and four for 400kVA, often evenly

Page 346 of 625
loaded, this suggests that issues will most likely arise only in 200kVA Units Subs with more than 108 customers and on 400kVA Unit Subs with more than 216 customers.
Examining ESB Unit Subs it is found that about 12% meet the above criteria and could require reinforcement if more than 10% of EV’s locate at the end of one of their feeders. In addition, if the distribution of customers between feeders is uneven then some feeders could be more heavily loaded than others and break down more easily if the 10% EV occurs on them.
Overall a level of 15% clustering which leads to a reinforcement requirement has been chosen along with a 20% penetration level for EV’s. Essentially this implies that with 20% penetration spread along the feeder or grouped near the sending end, then no reinforcement is expected, but for 10% or over grouped at the end of the feeder reinforcement is required in 15% of locations.
7 Use of Demand Response Solutions
Distributions need to be reinforced because demand is excessive in relation to capacity, causing a breakdown in voltage quality or exceeding thermal ratings. If however demand could be controlled so that it was always within the circuit capacity, then any reinforcement could be deferred.
This is an attractive proposition when the cost of reinforcement is high (high material & civil works) and where the cost of Demand Response is low (e.g. only a cheap extra comms unit required).
The actual point where Demand Response is better value than physical reinforcement also depends on the scale at which Demand Response is being applied. Whilst the individual demand control units are low cost, the infrastructure costs can be high, and need a large volume of customers over which this overhead can be spread.
In addition Demand Response is most applicable where the problem to be solved is at the Transmission or Generation level, where the aggregate response from any customers in a large geographic area can address the problem e.g. if high demand requires less efficient but expensive generation plant to operate then Demand Response, which reduced overall Demand nationally, would work. Similarly if demand in a particular area of the country caused power flows to overload part of the Transmission Distribution, then reducing the demand in that part of the country could solve the problem.
It can also be the case that if Demand Response is available generally for use at Generation or Transmission level, then such usage would also cover the initial set-up costs, making it available for use at lower voltages with little marginal cost.
Whilst Demand Response has proven successful in many countries in terms of lowering System Peak, it has seldom proved applicable to address problems on individual parts of the Distribution itself. The reason for this is that addressing a Distributions problem requires control of just those loads on those particular circuits – the availability of control on loads on adjacent circuits is immaterial.

Page 347 of 625
In addition, the requirement for use of Demand Response at Distribution level arises only when a circuit limit is about to be breached and has little value otherwise:
E.g. in New Zealand a 20MVA line had 18MVA and was growing at 5% per annum. At loadings of up to 16MVA there was no issue, however as 18MVA was approached this meant the line had to be uprated in next 2 years. Using DSM of 1MVA deferred uprating for a year, an additional 1MVA of DSM provided deferral for an additional year, at which stage no more DSM was available and line had to be uprated. Following the uprate the DSM could provide no further benefits for the Distribution system, and did not receive further payments from the DSO.
The lesson from the above is that if DSM had been installed for System Peak Control it could also be applied, if available in sufficient quantities on a particular circuit, for circuit load control at little cost as the associated overhead and installation costs had already been covered. In addition, once the circuit was uprated and no further Distribution DSM was required, the DSM investment would still available to earn revenue from System Peak Control
So using DSM which is already available for System Peak Control to provide control in other areas can be economic as there is little marginal cost – the system has already been paid for and installed.
8 Conclusions on Choice of Demand Response versus Distribution
Reinforcement for Electric Vehicles
The Distribution Reinforcement proposed for Electric Vehicles actually uses Active Management of the voltage through the introduction of new ‘SmartGrid’ MV/LV Tap changing transformers, an item that has only been commercially available in the last 1 – 2 years, and which provides a much lower cost solution than traditional reinforcement.
Given that the instances where reinforcement is required are likely to be geographically scattered and confined to individual circuits of about 60 customers on about 15% of transformers this is a good approach, as it only needs to be implemented when and where a problem arises. No front loading of the investment is required, and investment is only made where it has actually been found to be required.
As a solution it allows EV penetration levels of up to 20% at relatively low costs, covering EV installations up to about 2025 (using original 2011 SEAI figures of 10% EV penetration by 2020 and 60% by 2050)9, and, using the 2014 SEAI 10 figures of 2% penetration (50,000 EVs) by 2020 with 15% EV sales of new vehicles, which in the absence of further information suggests an indefinite cap of 15% on EV penetration) through incremental investment.
9 SEAI 2011 ‘Electric Vehicles Roadmap’ 10 SEAI ‘Energy in Transport – 2014 Report’

Page 348 of 625
In addition, should any better system of dealing with the impact of EV on Distributions arise, there are no impediments to switching to an alternative system. So in terms of an investment strategy it has very high flexibility and low cost as it only requires investment incrementally where and when required, has no stranded assets and no switching costs to future alternatives such as Demand Response.
In contrast the case for initially using Demand Response as a solution is poor:
(a) Problems will only arise is sporadic locations over time if EV penetrations takes place as expected. However this means that a Demand Response system would still be required ab initio to cope with such isolated problems i.e. the full Demand Response infrastructure and communications system would have to be set up immediately, and all Electric vehicles equipped with a standard control system, regardless of their manufacturer. Market arrangements to use such a system would also be required. Additionally, this system would be ineffective if there were other large loads which could also be installed without Demand Responses (e.g. Heat Pumps) and would also require that these be covered.
(b) The Demand Response system above would have been designed for Electric Vehicles and
might not be suitable for alternative uses on System Peak Control.
(c) In order to avoid problems every EV would have to allow for control by ESB as every cluster capable of causing problems requires control. Unless it was mandatory to allow ESB to control load usage the system would not work. For voluntary control, payments for control would be an extra cost.
(d) Any system installed now will be technically immature and probably obsolete by the time the
market for Demand response matures, or even by the time any significant use of it is required for EV control. In addition, new appliances are increasingly being manufactured in such a way that they can be controlled remotely, and this is now becoming a standard feature of ‘white good’ appliances such as washing machines. Furthermore it is likely that as Demand Response is developed in the market, the household itself will be treated as a single unit to be controlled, rather than the Demand Aggregator attempting to control individual appliances within the households. This approach minimises the complexity for the Demand Aggregator as they need only communicate with one controller within the household, and is more attractive to the customer as the demand they offer can be selected from all appliances according to the customer’s individual preferences.
So from the above it is readily apparent that attempting to use Demand Responds in this way is not optimal.
The alternative scenario to the ‘Demand Response’ approach is ‘SmartGrid’ Reinforcement i.e. reinforce the Distribution as when and where problems arise
In the meantime Demand Response infrastructure will be developed naturally by the market in areas where savings will be larger – System Peak Control and matching of Load to excess wind. Technically, products will be produced internationally which come equipped with Communications and control so that the cost to an aggregator of using such units in Demand Response will be very low. Standardisation of the control protocols will develop, as is already happening with NEST, where the NEST algorithms are being copied for use in other products.

Page 349 of 625
Accordingly it could then be expected that a Demand Response infrastructure would have developed in an economic manner, and would naturally have control over as many household loads as customers wished. The overhead cost of such a system having already been covered, those of such a system to control EV and other circuit loads would be minor.
At that stage the issue would then be whether customers would accept restriction on their load use and at what price, and whether there was sufficient penetration of Demand Response to solve local circuit problems. It would also be important to realise that as the penetration of extra load increases, deferring it’s use causes it to shift to another time period, when it will occur simultaneously and perhaps still caused problems e.g. as shown in Fig. 7, where shifting the load to after the evening peak still caused voltage breakdown.
Obviously, to facilitate future control of EV Charging the ecar should be capable of receiving a signal from an associated device to ramp down load if instructed. This is a more flexible approach that from requiring the EV to respond in a specific way to direct signals from a System Operator(DSO/TSO) directly or through an Aggregator, as it allows much more flexibility to the car manufacturers and makes it simpler for Demand Aggregators to operate i.e. the Demand Aggregator interfaces with a Home Controller, and the Home Controller controls the individual loads such as Heat Pumps, EV’s, Appliances in oared to make up the load Profile requested by the Demand Aggregator. This means that the customer chooses the controller which matches their requirements and so is much more flexible as a Demand Control system.

Page 350 of 625
Work Package 4.3
Estimate approximate reinforcement costs for
widespread roll-out and how they might be
minimised

Page 351 of 625
Table of Contents
1 Introduction .........................................................................................................................352
2 Costing of Investment required for 20% EV Penetration ................................................353
3 Rural Areas ..........................................................................................................................355
4 Urban Outside M50 .............................................................................................................358
5 Inside M50 ............................................................................................................................362
6 Cost Summary .....................................................................................................................363
7 Cost variation over time .....................................................................................................364
8 Appendix 1. CSO Car Ownership Statistics 2011 ............................................................365

Page 352 of 625
1 Introduction
The description of WP 4.3 ‘4.3 Estimate approximate Distribution reinforcement costs for widespread roll-out and how they might be minimised’ is clarified as follows:
‘approximate Distribution costs for widespread rollout’ – widespread rollout is defined as up to
20% of customers.
‘how they might be minimized’ is defined in terms of minimizing the upfront Distribution costs to
obtain 20% penetration whilst making any significant upfront investments to cater for growth beyond
20%.
The figure of 20% is somewhat arbitrary, but any Distribution network response to EV penetration cannot be made in the anticipation of much higher possible take-up rates without taking a high risk of stranding investment, either because the anticipated penetration does not occur, or that the investments made upfront become technologically obsolete.
In fact such forecasting risks, which are inherent in the introduction of new technologies, are well illustrated by the change in targets from the 2011 SEAI11 report which suggested 10% EV Penetration in 2020 and 60% by 2050, and which was subsequently revised downward in the 2014 SEAI12 review to 2% EV Penetration in 2020 with an expectation that 15% of new car sales would then be EV’s, which in the absence of other information would lead ultimately to an EV penetration rate of 15%.
EV penetration occurs over time so that by making incremental investments in line with penetration best value for money is provided and risk is minimised. If however there was some abrupt and massive take-up in EV’s the policy can then be altered.
Finally, any low cost options which provide a significant return in the future should obviously be taken upfront e.g. provision of space for future substations.
In summary, the investment philosophy is NPV Investment = NPV Cash Flows + NPV Options
and with an expectation of no more than 15% by 2030 the assessment of the Distribution networks at 20% is a sound strategy.
11 SEAI ‘Electric Vehicles Roadmap’ 12 SEAI ‘Energy in Transport -2014 Report’

Page 353 of 625
2 Costing of Investment required for 20% EV Penetration
Intuitively the Distribution costs of catering for 20% EV penetration will depend on where such penetration occurs – Distribution networks with more ‘headroom’ will require less investment than those with less. In addition it can be anticipated that clustering will occur where some geographic areas, perhaps more affluent, have a concentrated proportion of the EV penetration and require more investment – in the UK studies suggested that EV penetration might follow a similar pattern to PV installations, in which case ‘clustering’ impact occurred on 5% of the Distribution networks where PV was installed. Investigations in WP 4.2 suggest that in weaker Irish Distribution networks suggest that up to 15% of Unit Substations could potentially require Distribution reinforcement for penetration rates of 20% EV assuming that in such locations EV’s grouped at the end of feeders (-less if grouped otherwise).
Load increases other than EVs could also require upgrades, but for clarity it is assumed that any upgrade is ascribed to EV installation (rather than just being an acceleration of work that would be required in the future anyway), and that interaction of EVs with other loads is not considered e.g. addition of Heat Pumps, will reduce available Headroom for EV’s. In fact the slower the penetration rate of EV’s the greater the opportunity to allow for future EV penetration during the course of normal Distribution network development.
The approach taken in this section is to divide the ESB Distribution networks into three parts according to their broad characteristics, and then cost each. This caters to some extent for where EV concentrations may occur e.g. Dublin, and associate them with the Distribution reinforcement costs likely to arise on those particular Distribution networks.
Hence in summary the ESB Distribution networks can be divided as follows:
(a) Rural Areas (b) Urban areas outside the Dublin M50 zone (c) Urban Areas within Dublin M50
Table 1 Numbers of Dwelling Types and usage Inside and Outside M50 areas.
Numbers and type of Dwellings are important, as whilst ESB may have more than one meter per Building Unit, there is unlikely to be more than one Charging Point, simply because of limited car parking space and the cost of an EV charger. In addition, as may be seen from Table 1,the numbers of ESB Accounts corresponds closely to the numbers of postal points as would be expected, but the numbers of Building is less, as there are multiple Postal Points/meters in buildings which have shared occupancy. However each building will only have one main ESB connection. From the CSO statistics in Appendix 1 it will be taken that 75% of Households within the M50 80% - 85% of Urban Households outside M50 and 90% of Rural households have one or more cars.
Total Number of
Postal Points
Usage:
Both Residential
& Commercial
Usage:
Commercial
Usage:
Residential
Type:
Bungalow
Type:
Detached
Type:
Duplex
Type:
Semi-
Detached
Type:
Terraced
Apartment/Flats Total Number
Building Units
ROI 2,162,210 203,137 154,424 1,804,649 24,304 1,068,176 12,291 455,588 601,851 262,905 1,863,039
Inside M50 387,625 20,338 31,422 335,865 89 98,613 2,476 84,643 201,804 113,661 266,196
Outside M50 1,774,585 182,799 123,002 1,468,784 24,215 969,563 9,815 370,945 400,047 149,244 1,596,843

354
Table 2 Summary of Estimated EV Associated Distribution reinforcement costs
Clustering 15%
70,000 15,000 45,000 12,000 7,000 250
UG GM
MV/LV
Subs
UG Cust
from GM
Subs
No
Dwellings
Total
Households
(Dwellings excl
Ind/Comn users)
Households
with 1 or
more vehicles
Households
with No
vehicles
% Households
with at least 1
vehicle
No EV at 20%
Penetration of
Households
with Cars
No
Sidewalk
NoTrafo
Replace in
U/S or GMT
No
Replacement
Unit Subs
Urban Group
Split using
3Ph PMT
Rural Group
Split
Cost for
Sidewalk Sub
(€'m)
Cost for
MV/LV Tap
Change
Retrofit
(€'m)
Cost for
Replacement if
Unit Sub with
Tap Change
Unit Sub (€'m)
Urban Group
Split
Rural Group
Split
Network
Total (€'m)
Meters
Total
Overall
Total
(€'m)
Inside M50 4,346 411,978 266,196 411,460 303,508 107,952 74% 60,702 2,280 1,033 1,033 24 2 7 33 15 48
Large Town 7,202 450,760 217,392 2,015 3,423 1,763 21 8 12 41 17 57
Outskirts Large
Town 3ph PMT7,172 89,000 89,000 7,172
13
13
Small Town 7,885 440,109 212,255 1,518 4,202 2,165 16 9 15 40 12 52
Outskirts Small
Town 3ph PMT11,828 141,000 141,000 11,828
21 21 21
34,087 1,120,869 659,647 763,097 580,799 138,820 76% 116,160 34 34 29 63
Total Urban Incl
M5038,433 1,532,847 925,843 1,174,557 884,307 246,772 75% 176,861 61 19 33 34 148 44 192
Rural 1Ph PMT 209,000 671,000 671,000 518,329 475,379 42,950 92% 95,076 16,000 112 112 24 136
Total 247,433 2,433,847 1,863,039 1,692,886 1,359,686 289,722 80% 271,937 61 19 33 34 112 260 68 328
Unit Costs
37 17 27
81
420,974
342,123
333,947 87,027 79%
246,852 51,793 72%
66,789
49,370
All Towns

Page 355 of 625
3 Rural Areas
The ESB Distribution networks in Rural areas can be defined in the diagram below:
Fig. 2 Connection Method for Rural Dwellings
It is seen that there are a large amount of customers living in ‘one off’ rural houses supplied by an Overhead Pole Mounted Transformers.
Fig. 3: Cumulative Customer Numbers13 vs Numbers of Customers per Individual transformer
13 Note: There are actually 671,000 customers fed from 209,000 transformers, but the detailed statistic above is only available for 609,000 customers fed from 184,000 pole mounted transformers.

Page 356 of 625
So from Fig. 3 it can be seen that nearly half of all customers fed from Single Phase Pole Mounted Transformers are fed from units which have 4 or less customers on the Transformer, and 130,000 customers are fed form SP PMT’s with 1-2 customers connected.
Fig. 4: Percentage of Single Phase Pole Mounted Transformers with one or more Customers
As shown in Fig. 4 the number of customers per transformer varies widely, so that there are many transformers with one to two customers, and these would likely accommodate a 3kW EV for each customer without Distribution reinforcement being required e.g. 50% of Transformers have two or less customers connected. As the numbers of customers on a transformer increases the scope for hosting any additional load (such as an EV) decreases, and may require Distribution reinforcement by splitting the group, typically at a cost of about €---.
Taking it that as per CSO statistics, over 90% of such rural houses have one or more Cars, and that the EV Penetration rate required is 20%, this means that 18% of such rural dwellings could each ultimately be expected to host at least one EV i.e. 95,000 EVs (= 475,000 dwellings with one or more cars x 20% Penetration).
Next it is assumed that the 18% is spread evenly across every cohort14, so that taking a transformer with 3 customers it is assumed that it needs a Group Split. From Fig. 4 about 52% of transformers have two or less customers, and so 48% have 3 or more and could require a ‘Group Split’, depending on clustering.
14 Note: To precisely allocate the number of Domestic Dwellings per transformer cohort from the available overall figures of Total Customers per cohort available, it is assumed that the proportion of Domestic Customers in each cohort is in proportion to the relevant overall Domestic and Total Customer numbers, so using Numbers of Domestic Households as a proportion of Total Number of Customers (=518,000/609,000 = 85%), and 18% of this proportion in each cohort assumed to connect an EV. This gives a total of just over 93,000 EV connections, which is line with the earlier crude estimate of 95,000.

Page 357 of 625
A ‘Group Split’ takes place in cases where voltage drops or transformer capacity limitations require Distribution reinforcement, where a new 15kVA Pole Mounted Transformers is erected in such a position that it allows the Group to be split between the existing and new transformers, optimising the voltage drops and transformer capacity. Overall the total Distribution costs of each ‘Group Split’ would be expected to be around €--- each, covering the cost of the Transformer, the extension of MV to the new location and the interconnection to the LV Distribution network.
Table 3 Numbers of SP PM Transformers which may require uprating
So in Table 3 for any of the initial customers installing EVs who are in the group on a 1 – 2 customer transformer, there are likely no Distribution reinforcement costs, but for those from 3 – 16 customers each EV is expected to drive a Group split for either voltage or Transformer capacity reasons, effectively involving the installation of one new Trafo for each EV connected, with associated Distribution costs of up to €---m (excluding metering).
So overall Distribution costs for Group Splitting are €---m (excl. metering)
Note: This figure is conservative in that it assumes that for every transformer with more than two customers an upgrade is required because it is assumed that there are two 3kW EV’s on an LV feeder, with this Feeder being more than about €---m.
It also assumes that the connections are evenly spread across all transformers in order to make up the 20% EV penetration level, and that where a ‘Group Split’ occurs only 1 EV is connected.
Customers
per Trafo
Cumulative
Customer
Numbers
(Dom/Ind/Comm)
Incremental
Customers per
Single Phase
trafo
No. of Domestic
Customers (85%)
of which 18%
expected to have
EV
Cumulative
EVs
Connected
No. of Trafo
Uprates
expected to be
Required.
1 60,807 60,807 9,310 9,310 -
2 131,985 71,178 10,898 20,207 -
3 204,228 72,243 11,061 31,268 4,335
4 275,616 71,388 10,930 42,198 3,212
5 340,591 64,975 9,948 52,146 2,339
6 398,491 57,900 8,865 61,010 1,737
7 446,658 48,167 7,375 68,385 1,239
8 486,818 40,160 6,149 74,534 904
9 519,191 32,373 4,956 79,490 647
10 545,481 26,290 4,025 83,515 473
11 565,820 20,339 3,114 86,629 333
12 581,792 15,972 2,445 89,074 240
13 591,412 9,620 1,473 90,547 133
14 599,392 7,980 1,222 91,769 103
15 604,987 5,595 857 92,626 67
16 609,643 4,656 713 93,338 52
609,643 93,338 15,814

Page 358 of 625
4 Urban Outside M50
Urban Distribution networks outside Dublin i.e. outside the M50, generally consist of Underground MV within the Urban area with Overhead MV on the outskirts
(- in contrast Distribution networks within the M50 i.e. Dublin, are considerably denser and have a greater proportion of Underground )
Associated LV Distribution networks are usually Undergrounded, of medium density, and fed from Ground Mounted Unit Substations. Older Urban areas are still likely to be fed from Overhead LV Aerial Distribution networks despite the MV supplying a Ground Mounted rather than a Pole Mounded Substation. Distribution networks on the outskirts of the Urban area may still be fed from Overhead MV, Pole Mounted Substations of between 50 and 200kVA Three phase, and Overhead LV.
As the LV feeding arrangements and loading determine voltage drop, this in turn decides what head-room for EV’s is available on the Distribution network and what likely Distribution reinforcement will be required.
Fig. 7: Connection method for Dwellings outside the M50
Examining the connection method layouts in Fig 7 it is seen that a similar methodology to the Rural analysis can also be applied, with an assessment of 76% of dwellings having a Car, which is

Page 359 of 625
reasonable as larger Urban centres have lower CSO ownership rates down to 75% , although their suburbs are close to 90%; rural towns coming in at about 85% - see Table 2 which is based on CSO Car ownership figures in Appendix 1.
Splitting the Distribution network into two tranches:
(a) Customers fed from UG Cable and Minipillars or Overhead LV Mains and Aerials (b) Customers fed from OH Aerials from 3 Phase Pole Mounted Trafos. on outskirts of Towns
Distribution costs associated with (a) Customers fed from UG Cable and Minipillars or Overhead LV Mains and Aerials
Overall there are estimated to be 0.6m ESB customers in this category, but confining this to Households only who own cars, reduces the pool to just over 0.5m.who already own a car and may purchase an EV.
As was shown in the Roebuck Downs survey, the ability of the Distribution network to accommodate EV’s depends on the degree of clustering and where on the Distribution networks such cluster occur. If occurring close to the substation Voltage drop is not an issue, if at an end remote from the substation it is an issue and Distribution reinforcement will be required.
The nature of the Distribution reinforcement in areas with Unit Substations will be to replace the existing Transformer with a Tap changing MV/LV Transformer within the existing Unit Sub, and in cases of older Unit Subs which will not have space to accommodate the new transformer, to replace the Unit Sub itself. The advantage of this approach is that variable amounts of civil works for cabling are avoided, with Civil works per km for cabling typically amounting to over €--- per km.
Distribution costs for Tap Changing MV/LV Transformer’s are not generally available as yet as they are a new product and a ‘market skim’ price is currently being applied by manufacturers, being about 2 to 2.5 times the cost of a normal transformer. So replacement of an existing Unit Sub would be about €--- (will also require cabling termination changes) and replacement of the transformer alone in an existing Unit Sub about €---.
There are also MV/LV substations which are ‘free standing’ or incorporated in Buildings, although these are more pre-dominant in Dublin than elsewhere. However they will accommodate new MV/LV Tap Changing Transformers quite easily, so can be treated as similar to modern Unit subs, with a cost of €--- to upgrade.
Overall there are about 19,500 Ground Mounted Substations in ESB, of which 37% are in Dublin and 63% in the remainder of the country. Within Dublin roughly 50% are Indoor Building Structures and 50% Unit Subs, with half these Unit Subs being able to accommodate a retrofit Tap changing transformers. Outside Dublin two thirds of Subs are Units Subs and a third ‘Building Subs’ – same proportion of Unit Subs can accommodate retrofit trafos.

Page 360 of 625
However the decision as to whether use of a replacement transformer is the most suitable solution depends on whether there are any circuit bottlenecks as well as voltage issues. The assumption made is that where customers are fed from urban overhead Distribution networks then there will be circuit bottlenecks and the more expensive ‘Sidewalk transformer’ will be required to solve the problem. However in the remaining instances the installation of a ‘SmartGrid’ MV/LV transformer will be adequate, and this can be installed without difficulty in either the new Unit Sub type or in Indoor Subs, but will require the replacement of the full Unit sub where it cannot be accommodated in the existing one.
The cost of the ‘Sidewalk Transformer’ itself is likely to be about €--- but is the cost of connecting it to the MV UG Distribution network where the main Distribution costs will arise. Probably about 300m of cabling at an overall cost of €--- would be required where a sidewalk transformer is to be installed – if it were closer to MV it would be closer to an Existing Substation and adding a Tap changer trafo would be a solution. So where a ‘Sidewalk Transformer’ is required as a solution the Distribution costs will be about €--- each.
The next issue is to determine how many substations would require Distribution reinforcement?
Table 4
The figures in Table 4 are essentially extracted from Table 2 in simplified form. Substations are split between ‘Inside the M50’ and ‘Outside the M50’, and by Substation type, with Indoor Substations and newer Unit Subs being able to accommodate a new MV/LV transformer at low cost.
Hence the Substations are then recategorised according to the type of Distribution network they feed based on the connection figures for different types of customers in Table 2.
Not all substations will have issues feeding EV loads so some estimate of how likely a transformer is to have problems that require uprating is required.
Total Total
Cluster
Fix rate Cost (€'m)
Ireland (Ground Mounted) 19,433 Ireland 19,487
Substation Types: Substation by Type of Network fed: €
Dublin 4,346 Dublin (Inside M50) 4,346
Indoor Type 2,173 Sub feeding OH Network 2,173 15% Sidewalk 70,000 22.8
Unit Sub (New Type) 1,087 Sub feeding UG Network (Indoor/New Unit Sub Type) 1,087 15% MV/LV TC 15,000 2.4
Unit Sub (Old Type) 1,087 UG Network Unit Sub (Old Type) 1,087 15% Replace 45,000 7.3
32.6
Outside Dublin 15,087 Outside Dublin 15,087
Indoor Type 5,130 Sub feeding OH Network 3,533 15% Sidewalk 70,000 37.1
Unit Sub (New Type) 4,979 Sub feeding UG Network (Indoor/New Unit Sub Type) 7,626 15% MV/LV TC 15,000 17.2
Unit Sub (Old Type) 4,979 UG Network Unit Sub (Old Type) 3,928 15% Replace 45,000 26.5
80.8
3Ph Pole Mounted Trafos 19,000 3Ph Pole Mounted Trafos 19,000 15% 12,000 34.2
147.6
Unit Cost €
for each type
Calculation of Substation Reinforcement requirements to Support Voltage for 20% EV Penetration.

Page 361 of 625
Obviously Substations with low numbers of customers would have low number of EVs if 18% of such customers adopted EV’s.
From records, of the 15,000 Ground Mounted Subs outside the M50, about a third are 200kVA Units Subs, and with 270,000 customers this implies 48,000 EV’s or 9 per Substation, the remaining 10,000 Substations, feed 420,000 customers and 75,000 EV’s, or 7 – 8 EV’s per Substation. If such an even distribution of EV’s occurred little Distribution reinforcement would be required as it would be unlikely that more than 7 EV’s would accumulate at the end of just one particular feeder, but the likelihood is that clustering will occur in some cases and drive a need for Distribution reinforcement.
As per WP 4.2:
Typically a Unit Sub on a housing estate will have 200 customers and these will be spread over 3 – 4 circuits. To cause a voltage problem the EV’s will need to be concentrated on one feeder and at the end of the feeder e.g. in Roebuck Downs there were 54 customers on one feeder with 7 EV’s at the end of that feeder in order to cause problems. So whilst problems can occur once such distributions happen, they are relatively unlikely.
Taking it that for EV’s at the start of a feeder 20% penetration can be accepted, and at the end of feeder 10%, then if EV’s are distributed uniformly a penetration of 20% is also acceptable as this will only have the same impact as 10% penetration at the end of the feeder (- a uniformly distributed load on a feeder will create half of the voltage drop of a similar load lumped at the end of the feeder).
So this suggests that at an overall national penetration rate of 20%, voltage issues will not generally arise unless there is clustering at the end of the feeder (-assumes non-tapered feeder and normal sending voltage). For 20% penetration of EV’s in an area served by one Unit Sub and assuming a similar house density to Roebuck Downs, a feeder would require 6 EV’s at the end along with 54 customers. As Unit Subs will have at least two cables for 200kVA and four for 400kVA, often evenly loaded, this suggests that issues will most likely arise only in 200kVA Units Subs with more than 108 customers and on 400kVA Unit Subs with more than 216 customers.
Examining ESB Unit Subs it is found that about 12% meet the above criteria and could require Distribution reinforcement if more than 10% of EV’s locate at the end of one of their feeders. In addition, if the distribution of customers between feeders is uneven then some feeders could be more heavily loaded than others and break down more easily if the 10% EV occurs on them.
Overall a level of 15% clustering which leads to a Distribution reinforcement requirement has been chosen along with a 20% penetration level for EV’s. Essentially this implies that with 20% penetration spread along the feeder or grouped near the sending end, then no Distribution reinforcement is expected, but for 10% or over grouped at the end of the feeder Distribution reinforcement is required in 15% of locations. This 15% estimate will therefore be applied to all Substations.
This would give an upper bound of 2,250 substations outside M50 to be reinforced i.e. 15% of substations (- this figure is below that in UK estimates from the 2009 Element Energy Report

Page 362 of 625
‘Strategies for the uptake of electric vehicles and associated infrastructure implications’ which indicated 30% of UK substations would need to be reinforced, but UK substations are more heavily loaded than those in Ireland as they generally cluster in urban areas where load can be spread more evenly over them. In Ireland with more dispersed housing, it is not possible to share load evenly between substations, so their average loading will be less, and hence less likely to require Distribution reinforcement for additional EV load.)
However this ‘30%’ figure is probably overly conservative as it assumes that the excessive EV loading all occurs on one feeder rather than being spread over the other three Substation feeders.
In the UK the EA Technology report on Low Carbon Distribution networks applied the figures for clustering of PV installations as a proxy for clustering of electrical load such as PVs and expected that Distribution reinforcement would be required in 5% of cases.
So a reasonable compromise would be to assume 15% of Substations need Distribution reinforcement with such Distribution reinforcement requiring a ‘Sidewalk Transformer’ in cases where OH LV needs Distribution reinforcement, a retrofitted Tap Change trafo in those modern Unit Subs and Indoor Building Subs where it can be retrofitted, and a replacement of the Unit Sub itself in the remaining cases of older Unit Subs. This is detailed in Table 2 and amounts to €---.
(b) Customers fed from OH Aerials from 3 Phase Pole Mounted Trafos. on outskirts of Towns
For the 200,000 customers on 19,000 3 phase transformers a simple assumption is that 15% will require a Group Split using a 3ph trafo. at a cost of €---, so cost will be €--- (=0.15*19,000 Trafo groups x €--- per Group Split)
See Table 2, 3.
5 Inside M50
Inside the M50 are about 412,000 customers fed from 4,400 Ground Mounted Substations. As a large number of these (c 50%) will be ‘Building’ rather than Unit Subs, the Distribution costs of reinforcement if required will be at the lower rate of €--- per Substation.
Of the 412,000 customers inside the M50 area, a substantial portion, 288,000 are fed from LV OH Distribution networks. Such Distribution networks have less thermal capacity than an UG cable and also have higher volt drops. This means that simply providing a Tap Change Transformer may not solve the problem, and instead the OH Distribution network would need to be reinforced by the addition of an additional ‘side walk transformer’ and sectionalising the LV OH Mains.
Adopting similar Distribution reinforcement percentages as previously (15%) and taking it that as approximately half of customers are fed from UG Services then there are an associated 2,066 Substations of which 15% will require Distribution reinforcement. In cases of either modern Unit Sub construction or free standing Building Substation (Overall 50% of Substation types) it should be

Page 363 of 625
possible to replace the existing trafo. with a Tap Changing type at a cost of c. €---. In the remaining cases the Unit Sub will be of an older type and require replacement at a cost of €--- per unit.
The remaining customers are fed from OH LV from 2,280 substations. In 15% of cases the LV Distribution network associated with these substations will require to be reinforced by the installation of a new ‘Sidewalk Transformer at a cost of €--- per installation.
Hence the cost inside M50 will be €---
(Sidewalk Transformers €---, Retrofits €---, Replacements €---)
6 Cost Summary
The Distribution costs of catering for a penetration rate of 20% EV amongst customers who have cars will depend on the degree of clustering which arises, and which is estimated at 15%. It is also assumed that an EV charges at 3kW and that the impact of additional loads such as new Heat Pumps is not taken into account.
Accordingly a summary of the Distribution costs is as follows:
Distribution network reinforcement:
Rural Areas: €---
Urban Areas Outside the M50: €---
Inside M50: €---
Distribution network reinforcement Total: €---
Separate Meter for each EV: @€---15 € --- (0.272m x €---)
Total for 20% penetration: €---
15 New EU rules effectively require energy for EV’s to be separately metered (cf. Appendix 1 Extracts from DIRECTIVE 2014/94/EU OF THE EUROPEAN PARLIAMENT AND OF THE COUNCIL of 22 October 2014 on the deployment of alternative fuels infrastructure)

Page 364 of 625
These Distribution costs assume a 15% clustering effect in each area, which tends to exaggerate the Distribution costs. If EV’s were confined to areas where there was sufficient existing headroom then Distribution costs would be substantially less. Similarly whilst clustering might occur at the 15% level, it has also been assumed that each occasion of clustering requires Distribution reinforcement, which is conservative.
Finally, in the case of rural Distribution networks where an extra EV requires a Group Split, it is possible that such a split would have been required for normal Distribution network development in any case, but, as the EV drove the change, all the Distribution costs are ascribed to the EV
Note: EV is assumed to be 3kW and no other load changes such as Heat Pumps taken into account.
7 Cost variation over time
Of course a full 20% EV penetration is not going to happen overnight, so that the above Distribution costs will only arise as EV’s are installed over the period.
In the case of the current SEAI 2014 forecasts of 2% EV penetration by 2020, it could be expected that €--- of Distribution costs would be incurred between 2015 and 2020, and that for the 15% EV penetration post 2030 a further €---.( - pro-rata from 20% penetration).

Page 365 of 625
8 Appendix 1. CSO Car Ownership Statistics 2011

Page 366 of 625
Work Package 4.4
Establish design rules for max no of on-street
charge points on LV Group in order to
minimise reinforcement costs for DUOS
customers

Page 367 of 625
Table of Contents
1 Introduction .........................................................................................................................368
2 Economics of EV Charge Points .......................................................................................369
3 Revenue and Cost Analysis ...............................................................................................371
4 Modifications to DUOS Charging Methodology ...............................................................374
4.1 DUoS Charging Methodology ...............................................................................................375
4.2 Opportunity Costs .................................................................................................................376
5 Locations where connection costs are minimised ..........................................................376
6 Conclusion ...........................................................................................................................377
7 Appendix 1 - Extracts from DIRECTIVE 2014/94/EU OF THE EUROPEAN PARLIAMENT AND OF THE COUNCIL of 22 October 2014 on the deployment of alternative fuels infrastructure378
7.1 Article 2 .................................................................................................................................379
7.2 Article 4 .................................................................................................................................379
8 Appendix 2 ...........................................................................................................................381
8.1 Technical specifications for recharging points .......................................................................381

Page 368 of 625
1 Introduction
The description of WP4.4 ‘Establish design rules for max no of on-street charge points on LV Group in order to minimise reinforcement costs for DUOS customers’ is clarified as follows:
‘LV Group’ also includes customers fed from an Urban Networks ( Cables and Transformer), as well as the traditional ‘Rural LV Group’ consisting of a 15kVA Pole mounted Transformer and associated LV Circuits
‘minimise reinforcement costs for DUOS Customers’ is taken to mean that the cost to be minimised is the excess costs associated with EV charging which are not covered by the extra DUOS units charged for EV Charge Point usage
‘maximum number of on-street charge points on LV Group’ is dictated by the point at which the extra revenue received from use of the EV Charge Points is less than or equal to the cost of providing the EV Charge points – at either stage there is no extra payment required from other DUOS customers.
The typical consumption of an EV is assumed to be 3,000kWh per year based on results of the Roebuck Downs pilot – the actual consumption will depend on the range covered, the driving style (higher speed uses disproportionately more kWh/km), proportion of winter driving (extra heat/lights) and the weight of the vehicle used.
It is assumed that Domestic Customers will pay DUOS on a Day/Night basis at 4.56 & 0.58c/kWh respectively. For Public On Street Charging it is expected that the DUOS Rate (DG5) is 4.13c/kWh .for Day & Night units based on expectation that usage will be dissimilar to normal Domestic usage, with a heavier load factor and a higher proportion of Day Units i.e. more akin to Industrial/Commercial DUOS (- there could also be a case for a special DUOS class tailored to the DUOS class costs associated).
The recent EU Directive 2014/94/EU (Oct 2014) which has yet to be transcribed into Irish law, suggests that Electric vehicles in private Households will need to be metered separately. This may require an additional meter, or possibly a replacement of the existing meter with one which has a second measuring element (not widely available). In addition changes to the SAP Billing system and Market Operation system would be required. In WP 4.3 it has been assumed (conservatively) that a second meter will be required for each private EV Charge Point and that this will cost €--- per EV installation.
The provision of separate DUOS Metering for each EV means that all the costs associated with EV Charging can be attributed to EV users, provided the extra Network investments can be identified and provided there is an allocation of shared costs from non-EV users to EV users i.e. essentially a redistribution of existing costs between DUOS householders.. The actual costs of the energy used by a domestic EV user and by a non-EV domestic user will be quite similar if the electricity used is at similar times e.g. Day or Night. So between domestic EV and Non-EV domestic users all the costs of domestic EV charging will arise, and can be allocated between these two groups.

Page 369 of 625
Within the EU Directive there is also a proposal that for every 10 EV there should be one Publicly Accessible EV Charging point. It has been assumed that such Publicly Accessible Charging Points will be paid for in full by the entity installing them, so that any direct DUOS costs which arise will be for ‘deep reinforcement’ i.e. Network reinforcement that cannot be directly attributed to the EV Charging points.
This is likely to be small as small groups of EV Charge Points are unlikely to cause overload to Transformers, and large groups at Train Stations etc. will require their own supply i.e. costs will be directly attributable. Hence no significant extra costs to DUoS customers have been attributed due to this requirement.
2 Economics of EV Charge Points
As outlined in the Introduction the regulatory framework around EV Charging has not yet been fully decided by CER due to amongst other factors the EU Directive 2014/94/EU, so the following cases could arise:
(a) EV Charging at Private Residential Homes The assumption made for reasons of practicality is that such connections would be within the existing kVA Contract levels and paid for under Domestic DUoS Tariffs.
(b) EV Charging in Apartment Blocks
In Apartment Blocks, charging is likely to require an additional ESB Transformer and the installation of extra Charging circuits in the Car Park by the Management Company/landlord. The costs of such work would normally be paid by the Management Company, so that there is no cross subsidy from other DUOS customers.
(c) On-Street Charging in Public area: Private Company: If a private company were permitted to provide EV Charging in a Public Area then ESB Networks would assess the costs involved and charge for the Connection accordingly. In theory there should be no impact on other DUOS customers, as all the extra costs of the EV connection had been paid up-front. In such cases the EV operator would look at a choice of possible locations where many EV’s would charge and assess the connection costs in each case. As the limiting factor is likely to be the availability of suitable on-street spaces (which would also have Car Parking costs associated), the costs of most ESB Connections would be minor. In filtering possible locations the EV company would likely use simple ‘rules of thumb’ to assess the likely ESBN connection costs and then obtain a detailed quotation from ESBN. The level at which ‘step changes’ in connections costs arise would be important and these are covered later in the analysis.
(d) On Street Charging (Public Area) as ESBN Infrastructure
As above, but in this case all the connection costs are covered by DUOS.

Page 370 of 625
If the On Street Charging has a separate DUOS rate then there is no cross subsidy from other DUOS customers.
If no special ‘EV DUOS’ Rate then the extra costs would be spread over all existing DUOS customers, but EV users would still pay DUOS on all 3,000kWh units used per annum at normal DUOS Rates.
(e) EV Charging in Publicly Accessible Private Commercial Areas (Shopping Centres, Hotels etc.)
The above situation would be as in case (a) above with the Connection costs being paid by the Private entity and no charge to existing DUOS customers.
It would also be possible that there could be a ‘special DUOS rate’ which would spread the costs of all such connections over all EV customers on the ‘special’ DUOS rate based on the expected EV DUoS revenues. However this would mean that the risks of inappropriate locations were being taken by EV Customers rather than by the EV Operator who is best placed to evaluate such risks and who gains from any upside.
(f) Private Home Charger on Overhead Pole Mounted Network (15kVA Transformer) In this case the customer in a rural area is installing a home charger, as outlined in WP 4.7. The issue here is that the Charger is now a significant portion of the Transformer capacity, and the requirement for reinforcement will depend on how many other customers on the 15kVA Trafo also have EV’s.

Page 371 of 625
3 Revenue and Cost Analysis
It is assumed here that the EV Chargers themselves are provided either by commercial companies in competition with each other, or by a franchise awarded after a public Tender, which would also give advantages in standardisation and economies of scale, as there are ‘natural monopoly’ aspects to the provision of EV Chargers.
It is also assumed that ESB Networks will provide the connections from the network to the EV Fusing pillar, adjacent to the EV Chargers themselves, and then from these pillars to the Individual EV Charge points. In this manner there is consistency in ESB installing the UG cabling required and maintaining it thereafter, including responsibility for recording its position and carrying out any repairs required, as is the current practice with all other street furniture. Given the expected predominance of EV chargers there is a significant Safety hazard should cable faults make the EV post or any associated street furniture live.
The easiest case on which to start, and the one which will be most pre-dominant is:
(a) EV Charging at Private Residential Homes
Each home will use 3,000 kWh per EV and should charge at night to minimize costs. Accordingly the annual revenue from such charging at Night would be €17 per annum per EV (3,000kWh x €0.0058/kWh). Capitalising this at 5% over 20 years gives a capitalised contribution of €217 per EV. An important point to note here is that DUOS income is set to cover the costs associated with running the Network, not to make any excess profit, so that if over-recovery of costs is predicted then DUOS charge per kWh would be reduced until it just covers the required expenditure. Accordingly if there were any over-recovery in DUOS due to extra revenue from EV usage it would result in a readjustment of the DUOS Tariff., As shown in later modules, the costs for accommodating large amounts of EV when charging is at night are very low, so the extra revenues should be adequate for any reinforcements required from largely night usage. If EV Charging occurred during the day, as is the tendency from customers, then the DUOS Revenues per EV per annum would be €136.8 pa per EV (3,000kWh x €0.0456/kWh). Capitalising at 5% over 20 years gives €1,704 as the capitalised contribution per EV. As a ‘Sidewalk substation‘ will solve any LV reinforcement problem and it’s basic cost will be around €---, then -- EV’s in a Group (-- x €---) would pay for such a solution (- the costs of extra transformer losses must be included as well as costs for cabling and trenching). On a 400kVA Unit Substations have 4 outlets and about 200 customers, this means that a typical LV circuit would have 4.5EV’s without a problem, and voltage issues would be expected to arise when EV’s were concentrated on one feeder (e.g. Roebuck Downs study of 4 - 10 EV’s on a single feeder, or a penetration on the overall LV group of 8% - 20%).. The Roebuck Downs study used 2.7kW per EV (although chargers can be 3.7kW or even 6.6kW) so that the Charging Rate per EV is also an important variable. Higher

Page 372 of 625
Charging rates simply use the same kWh and produce the same DUOS revenue, but are twice as severe on the network voltage. The upshot of the above is that assuming constant DUoS , EV’s should pay for the reinforcement costs they inflict on the network, without requiring cross subsidy from other users. However the costs of reinforcement may arise some years after the EV’s have been connected, so the DUOS revenue from such EV’s could be accumulated in a reserve to pay for such reinforcement when it arises.
(b) EV Charging in Apartment Blocks
The extra network costs associated for DUoS involve an additional transformer/substation and similar to those in (a), as the MV cables will be on site, any LV is installed by the Management company who also provide the civils associated with the new substation. As apartments typically have more than 40 customers, usually ranging from 40 to 200, there is a higher density of customers on the network and consequently even a 10% EV penetration would cover the ESBN costs.
(c) On-Street Charging in Public area: Private Company
Any direct connection costs would be 100% paid by the company involved. The direct costs should also include a contribution toward the Transformer and cable capacity used.in order to provide a cost signal to the EV operator as to the real costs of the Site location chosen, and this ensure best value for society.
This can be complex so simple guidance rules could be prepared such as no Transformer or cable costs allocated as long as EV ‘On Street’ charging load on a substation was less than 50kW, and on a cable less than 20% of capacity. No voltage drop reinforcement would be expected if the EV Charging points were within 50m of an ESB substation cable. Outside these zones individual quotations would identify the costs involved.
On Street Charging in Public Streets is different from other charging situations as the scarce resource is the availability of car parking spaces and the opportunity cost of using these spaces for parking rather than charging. This means that EV operators are more likely to look for fast charging in such locations to maximise revenue but also to increase vehicle turnover i.e. more cars charged faster. In turn this means that ‘fast Charger’s of 50kW each are likely to be used, which could add significantly to substation loads, as an EV operator is more likely to wish to install multiple fast Chargers at such locations.
If the existing network cable/transformer cannot provide adequate power then it may be best to provide a sidewalk substation adjacent to the load which could provide 200kW of capacity. The costs of this Substation would then be recovered in the EV Operators charging schedule. Accordingly, if the EV operator chose a location that was remote from existing MV network to connect the new substation their costs would increase, and hence provide guidance on the attractiveness of alternative locations.
(In the eventuality that the EV Charging Post was a monopoly activity to be carried out by ESBN, then standard connection procedures would apply and it would be possible to have a separate DUOS tariff

Page 373 of 625
with appropriate standing charges, to bill EV Customers for their impact on the network. See (d) below)
(d) On Street Charging (Public Area) as ESBN Infrastructure:
This is similar to (c) above but the installation costs are recovered from DUOS charges. Similar DUOS revenue would have been recovered from vehicles in (c) as well as the connection costs, which would mean an over recovery in DUOS income, which would then be corrected by a realignment of the DUOS tariff by CER. If required an EV DUOS Tariff could be created with separate Standing Charge and kWh costs.
In terms of breakeven, the addition of a sidewalk substation would require 20 full EV Charges per day per charging points fed from the Sidewalk Sub, or 10 Charges per day on each of two fast chargers, which would be 5 hrs charging each day for each charger.
This is unlikely to be achievable in most locations, which would then mean that any ‘fast’ charging would be targeted at Substations where this capacity was available already and did not require reinforcement as the ‘fast’ charger was installed close to the Substation.
In the case of (c) above the EV operator is recovering the costs involved from a charging structure related to the individual customers willingness to pay, so return can be much greater.
(e) EV Charging in Publicly Accessible, Privately owned, Commercial Areas (Shopping Centres, Hotels etc.)
If EV Charging points are provided on private ground then all civils are the responsibility of the owner and all connection costs should be 100% chargeable.
There are two possible scenarios:
(1) The owner allows electricity from his connection to be supplied to the EV and makes no charge to the EV user directly for the electricity used, but may charge a fee for use for the Charging station (as restriction on choice of Supplier is not permitted by legislation).

Page 374 of 625
In this case all the connection costs are borne by the owner and not attributable to DUPS Customers.
(2) Customer is connected at LV and it is possible for ESB to provide an LV connection from the existing connection point.
In this case the civils are still the responsibility of the owner, and the connection form the owners connection point to the EV Charge Point Locations would normally be via an SWA cable, installed by the owner, sealed at both ends and inspect-able along it’s route. Accordingly ESBN incur no DUOS costs in such connections and customers have choice of supplier when buying their electricity. Note: In the case of the Owner having an MV Supply, no separate ESB supply will be available and the scenario in (1) applies. So in summary, the extra kWh usage from EV’s should pay the extra ‘deep reinforcement’ costs (which are not part of the direct connection) involved in aggregate, although not perhaps in particular individual cases. A key change that may be required is the creation of a DUOS Reserve fund for EV Network reinforcement, as the requirements for reinforcement may be several years after the EV has been connected.
(f) Private Home Charger on Overhead Pole Mounted Network (15kVA Transformer)
As per WP 4.7, 15kVA Transformers with two customers can support 2 EV’s if charging during the day and a significant portion of ESB’s population of such Transformers has two customers or less.
For the remaining Transformer population the addition of an EV which charges during the day is likely to cause voltage drop outside of standard, and hence require reinforcement. Such reinforcement will require splitting of the group, with the addition of a new transformer close to the EV load, with possible costs in the region of €---.
The capitalised DUOS Contribution from 3 EV’s (assuming that the third drove the uprate) would amount to about €--- (based on 3 x €--- per EV = €---), leaving a shortfall of €--- to be picked up by other DUOS users in theory.
However all EV’s installed on rural networks which do not require reinforcement will also make similar contributions, and as it is more common to have 1 – 2 customers per Transformer, the majority of installation’s will not require reinforcement, yet will make a DUOS contribution of €--- each if left for 20 years.
This implies that it could be possible to have no connection costs for EV’s in rural areas as DOUS income from EV’s would offset EV Connection costs. This would also be consistent with situation in urban areas where EV connection costs will be ‘deep’ and not normally chargeable to individual customers.
4 Modifications to DUOS Charging Methodology

Page 375 of 625
Application fees:
In cases (c) and (d) above where private companies are seeking optimal locations for EV Charging points there can be considerable costs in evaluating possible locations, and there is no incentive on such companies to minimise the numbers of locations to be assessed, as ESB do not charge for any Application fees for such load studies. The reason for this is that normally there is only one site to be evaluated per customer and the costs involved are small.
However where multiple locations need to be examined there are more significant costs and drains on scarce Design resources. Accordingly it would be more appropriate to send a Price signal which would match the benefits of carrying out such studies to the cost involved. This could relatively easily sit in existing methodology if applied where applications to more than one location were received from the same company.
4.1 DUoS Charging Methodology
DUoS Charging Methodology is based on spreading any outstanding costs of Connection (deep/shallow) and Maintenance over the numbers of units used at the Connection point. However the level of costs arising is generally more associated with the connection method itself and then with the kW peak rather than the kWh usage.
With large numbers of small loads which operated stochastically the traditional DUoS approach was appropriate, but with the coming advent of large individual loads each of which are greater than the full ADMD (EV, Heat Pump, Direct Electric Heating, Night Storage Heating) and which will clash with system peak, it would be more appropriate to have a kW Capacity element to the DUOS Charge, as is the case in many other utilities.
In order to best establish how such changes should be structured it would be important ab initio to classify premises with larger individual loads on their own separate DUOS class e.g. DG1(a) could be used for premises with an EV, DG1(b) for premises with a Heat Pump etc. This would also provide transparency to the Network Operator as to where and when such loads are being installed.
Given the information arising from the above DUOS tariffs appropriate to the loading pattern could be generated and charged. This also gives the advantage that Demand charges which are controllable make such loads more attractive for Demand Aggregators to target, as the tariff allows for response to be rewarded. Ultimately it might be possible to apply a DUOS Tariff based on Load Factor as well as Capacity, so that the overall DUOS costs charged related to the impact on the network from the KW peak as well as the contribution received from the kWh usage i.e. Peaky loads which imposed high kW peaks on the network but had little kWh usage would pay more DUOS per kWh used, and those which used a high proportion of kWh in relation to their peak demand would pay less.
From the customers perspective this also means that DUoS tariffs could be more easily adjusted to avoid cross subsidies between those customers with EV’s/Heat Pumps etc. and those without.
Note: Load Factor = kWh usage / Total kWh consumption possible (=kWpeak x hrs)

Page 376 of 625
4.2 Opportunity Costs
Considering EV’s first and allowing them take advantage of available network capacity neglects any associated opportunity costs. It is the case that if there were no future usage for this capacity the opportunity costs would indeed be zero, but in practice if other loads such as Heat Pumps/Electrification of Heat are expected, then there is an Opportunity cost, and it may not be being charged to EV’s under the current methodology. So an EV might have a cheap connection to an Overhead Pole Transformer, but the next customer with a Heat pump load might find all spare cap city has been used up i.e. there would be a first mover advantage. Appropriate structuring of DUoS tariff can overcome such difficulties by pricing in such Opportunity costs e.g. based on a capacity charge.
5 Locations where connection costs are minimised
As the most onerous situation is where voltage drop is excessive, locations close to Substations will incur least cost connections.
As can be seen from the above extract of a typical Urban Housing Schemes network, there are multiple Substation (red square) locations at which EV Charging can be adjacent.

Page 377 of 625
In the case of ‘Fast’ chargers (50kW) the guideline would be within 100m of a Unit Sub/Ground Mounted Trafo on a 4x 185Al or 4x120Al cable, assuming adequate thermal capacity on the feeder and transformer.
6 Conclusion
The conclusion from the above is that given the appreciable amounts of kWh used by EV’s in charging and assuming that such usage occurs at the one Charging Point, then the DUOS income received (at current rates) would appear to cover the extra reinforcement costs involved.
If the EV owner charges at several EV Points, they still make the same DUOS Contribution but it is now spread over several EV Charging points. However once the aggregate DUOS is greater than that of the Charge point connection costs there is no DUOS impact on other customers.
A special DUOS Tariff could be applied to dedicated EV Chargers, but this would be impractical for home charging unless a separate EV meter was installed. As it would be impossible to separate out non-EV units from EV units. In any case any over-recovery on DUOS is automatically addressed by CER’s DUOS Tariff review which ensures that DUOS only covers expenditure levels agreed with CER.
However if EV’s are provided with separate metering then they could also have a special tariff matched to the costs imposed by EV’s on the system, including an appropriate rate for when electricity is used.
Recent EU Legislation suggests that EVs will require separate metering.
Note: The availability of EV Demand Control to operate in such a way as to minimise reinforcement would have little impact on new connection costs where the direct physical connection requires the bulk of the expenditure. However where reinforcement upstream is required some saving s might be possible, but would not justify the installation of EV Charge control regimes for such purposes alone. It is more likely that EV Charge control will arise as a result of DSM for loads in general, of which the EV is one i.e. at 2% expected EV penetration by 2020, EV Charge control for EV’s alone is unlikely to be viable.

Page 378 of 625
7 Appendix 1 - Extracts from DIRECTIVE 2014/94/EU OF THE EUROPEAN PARLIAMENT AND OF THE COUNCIL of 22 October 2014 on the deployment of alternative fuels infrastructure
(23)
Electricity has the potential to increase the energy efficiency of road vehicles and to contribute to a CO2 reduction in transport. It is a power source that is indispensable for the deployment of electric vehicles, including L-category vehicles as referred to in Directive 2007/46/EC of the
European Parliament and of the Council (1) and Regulation (EU) No 168/2013 of the European
Parliament and of the Council (2), which can contribute to improving air quality and reducing noise in urban/suburban agglomerations and other densely populated areas. Member States should ensure that recharging points accessible to the public are built up with adequate coverage, in order to enable electric vehicles to circulate at least in urban/suburban agglomerations and other densely populated areas, and, where appropriate, within networks determined by the Member States. The number of such recharging points should be established taking into account the number of electric vehicles estimated to be registered by the end of 2020 in each Member State. As an indication, the appropriate average number of recharging points should be equivalent to at least one recharging point per 10 cars, also taking into consideration the type of cars, charging technology and available private recharging points. An appropriate number of recharging points accessible to the public should be installed, in particular at public transport stations, such as port passenger terminals, airports or railway stations. Private owners of electric vehicles depend to a large extent on access to recharging points in collective parking lots, such as in apartment blocks and office and business locations. Public authorities should take measures to assist users of such vehicles by ensuring that the appropriate infrastructure with sufficient electric vehicle recharging points is provided by site developers and managers.
(28)
The recharging of electric vehicles at recharging points should, if technically and financially reasonable, make use of intelligent metering systems in order to contribute to the stability of the electricity system by recharging batteries from the grid at times of low general electricity demand and to allow secure and flexible data handling. In the long term, this may also enable electric vehicles to feed power from the batteries back into the grid at times of high general electricity demand. Intelligent metering systems as defined in Directive 2012/27/EU of the European Parliament and of the Council (1) enable real-time data to be produced which is needed to ensure the stability of the grid and to encourage rational use of recharging services. Intelligent metering systems provide accurate and transparent information on the cost and availability of recharging services, thereby encouraging recharging at ‘off-peak’ periods, which means times of low general electricity demand and low energy prices. The use of intelligent metering systems optimises recharging, with benefits for the electricity system and for consumers.
(29)
With respect to recharging points for electric vehicles which are not publicly accessible, Member States should aim to explore the technical and financial feasibility of synergies with intelligent meter roll-out plans following the obligation under Annex I.2 to Directive 2009/72/EC of the European Parliament and of the Council (2). Distribution system operators play an important role in relation to recharging points. In the development of their tasks, the distribution system operators, some of whom may be part of a vertically integrated undertaking owning or operating recharging points, should cooperate on a non-discriminatory basis with any other owners or operators of recharging points, in particular providing them with the information needed for the efficient access to and use of the system.

Page 379 of 625
(30)
In the development of infrastructure for electric vehicles, the interaction of that infrastructure with the electricity system, as well as the electricity policy of the Union, should be consistent with the principles established under Directive 2009/72/EC. The establishment and operation of recharging points for electric vehicles should be developed as a competitive market with open access to all parties interested in rolling-out or operating recharging infrastructures.
(31)
The access of Union electricity suppliers to recharging points should be without prejudice to the derogations under Article 44 of Directive 2009/72/EC.
7.1 Article 2
• ‘recharging point’ means an interface that is capable of charging one electric vehicle at a time or exchanging a battery of one electric vehicle at a time;
• ‘normal power recharging point’ means a recharging point that allows for a transfer of electricity to an electric vehicle with a power less than or equal to 22 kW, excluding devices with a power less than or equal to 3,7 kW, which are installed in private households or the primary purpose of which is not recharging electric vehicles, and which are not accessible to the public;
5. ‘high power recharging point’ means a recharging point that allows for a transfer of electricity to an electric vehicle with a power of more than 22 kW;
7.2 Article 4
Each Member State shall adopt a national policy framework for the development of the market as regards alternative fuels in the transport sector and the deployment of the relevant infrastructure. It shall contain at least the following elements:
— national targets and objectives — measures necessary to ensure that the national targets and the objectives contained
in the national policy framework are reached, — designation of the urban/suburban agglomerations, of other densely populated
areas and of networks which, subject to market needs, are to be equipped with recharging points accessible to the public in accordance with Article 4(1),
1) Member States shall ensure, by means of their national policy frameworks, that an appropriate number of recharging points accessible to the public are put in place by 31 December 2020, in order to ensure that electric vehicles can circulate at least in urban/suburban agglomerations and other densely populated areas, and, where appropriate, within networks determined by the Member States. The number of such

Page 380 of 625
recharging points shall be established taking into consideration, inter alia, the number of electric vehicles estimated to be registered by the end of 2020, as indicated in their national policy frameworks, as well as best practices and recommendations issued by the Commission. Particular needs related to the installation of recharging points accessible to the public at public transport stations shall be taken into account, where appropriate.
2) The Commission shall assess the application of the requirements in paragraph 1 and, as appropriate, submit a proposal to amend this Directive, taking into account the development of the market for electric vehicles, in order to ensure that an additional number of recharging points accessible to the public are put in place in each Member State by 31 December 2025, at least on the TEN-T Core Network, in urban/suburban agglomerations and other densely populated areas.
3) Member States shall also take measures within their national policy frameworks to encourage and facilitate the deployment of recharging points not accessible to the public.
4) Member States shall ensure that normal power recharging points for electric vehicles, excluding wireless or inductive units, deployed or renewed as from 18 November 2017, comply at least with the technical specifications set out in point 1.1 of Annex II and with specific safety requirements in force at national level.
5) Member States shall ensure that high power recharging points for electric vehicles, excluding wireless or inductive units, deployed or renewed as from 18 November 2017, comply at least with the technical specifications set out in point 1.2 of Annex II.
6) The recharging of electric vehicles at recharging points accessible to the public shall, if technically feasible and economically reasonable, make use of intelligent metering systems as defined in point (28) of Article 2 of Directive 2012/27/EU and shall comply with the requirements laid down in Article 9(2) of that Directive.
7) Member States shall ensure that operators of recharging points accessible to the public are free to purchase electric city from any Union electricity supplier, subject to the supplier's agreement. The operators of recharging points shall be allowed to provide electric vehicle recharging services to customers on a contractual basis, including in the name and on behalf of other service providers.
8) All recharging points accessible to the public shall also provide for the possibility for electric vehicle users to recharge on an ad hoc basis without entering into a contract with the electricity supplier or operator concerned.
9) Member States shall ensure that prices charged by the operators of recharging points accessible to the public are reasonable, easily and clearly comparable, transparent and non-discriminatory.
10) Member States shall ensure that distribution system operators cooperate on a non-discriminatory basis with any person establishing or operating recharging points accessible to the public.
11) Member States shall ensure that the legal framework permits the electricity supply for a recharging point to be the subject of a contract with a supplier other than the entity supplying electricity to the household or premises where such a recharging point is located.

Page 381 of 625
8 Appendix 2
8.1 Technical specifications for recharging points
• Normal power recharging points for motor vehicles
Alternating current (AC) normal power recharging points for electric vehicles shall be equipped, for interoperability purposes, at least with socket outlets or vehicle connectors of Type 2 as described in standard EN 62196-2. While maintaining the Type 2 compatibility, those socket outlets may be equipped with features such as mechanical shutters.
• High power recharging points for motor vehicles
Alternating current (AC) high power recharging points for electric vehicles shall be equipped, for interoperability purposes, at least with connectors of Type 2 as described in standard EN 62196-2.
Direct current (DC) high power recharging points for electric vehicles shall be equipped, for interoperability purposes.

Page 382 of 625
Work Package 4.5
Examine the conductor & cable sizes for
future networks taking account of EV
demands

Page 383 of 625
Table of Contents
1 Introduction .........................................................................................................................384
2 Design Considerations in Housing Schemes ..................................................................385
3 Optimum Design for New Networks ..................................................................................385
4 Recommendation ................................................................................................................389
5 Other Considerations affecting Network Design for the future .....................................390
6 Conclusion ...........................................................................................................................391

Page 384 of 625
1 Introduction
Currently Networks for both urban and rural customers are designed in relation to traditional levels of expected load i.e. 2.3kW per house. In the event of the future proliferation of electric vehicles, and other loads such as Heat Pumps, consideration should be given as to whether such traditional cable and conductor sizes remain appropriate.
The use of the phrase ‘cable and conductor sizes’ is actually too limiting as it ignores Substation capacity, use of LV Voltage regulation, use of three phase LV Services and the use of extra conductors of the same size.
More correctly the issue is ‘to what extent should existing networks designs now be modified to cope with possible increased future loading from EV/Heat Pumps such that the NPV of the proposed investment is minimised for the expected increase in loading.’
Any investment must be considered from a ‘Real Options’ perspective, where the NPV of the investment is the sum of the NPV of the cash flows plus the NPV of the associated options provided for future network developments..
NPVInvestment = NPV Cash Flows + NPV Options
This approach is particularly beneficial when uncertainty is high and when the time scale over which the investment must deliver value is long, as is the case with any fundamental change in Network design.
Typical sources of uncertainty such as :
reductions in voltage standards required, changes in power requirements for EV’s,
the introduction of significant extra loads due to the electrification of heat ,
the proliferation of on site PV generation
and associated storage
As time passes knowledge increases and the uncertainty diminishes. The reals issue then is whether this extra knowledge can still be applied to existing networks or has a ‘once in a lifetime’ opportun ity to improve the design been missed?
In short the options are:
(a) Increase the Network Design in new developments to cope ab initio with increased loading e.g. up to 1 heat Pump and 1 EV per house, where the EV could charge at rates from 3.7 to 11kW.

Page 385 of 625
(b) Make minor amendments now to the Network Design in order to preserve the option to upgrade the load capabilities of the network when the extra loading is required
Option (b) is only an option if the networks loading capability can be increased in future at a reasonable cost.
2 Design Considerations in Housing Schemes
In WP 4.6 the existing network Designs for Apartment and Urban Housing Schemes are detailed, as well as ‘one off’ rural connections and how such designs could be modified to cope with increased loading.
The conclusion in the analysis was that in the event of extra loading capability being required it would be possible to install extra substations to split the existing LV cables, increase their capacity and maintain voltage within standard.
So this means that Option (b) is feasible, and the issue is then whether Option (a) ‘Redesign for High Loading’ or Option (b) ‘Maintain Existing Design and reinforce as required’ is best.
3 Optimum Design for New Networks
The answer of course is that for new networks the optimum must always be a combination of elements from Options (a) and (b) according to the level of uncertainty in expected loading involved and the cost of either making certain changes now as against provision of an option for upgrade to existing network now.
Urban Housing Scheme
Considering the elements of an Urban Housing Scheme in turn
(a) Unit Substation
All existing ESB Unit Substations can be upgraded on site from 200kVA to 630kVA within 1 day. The substation is designed with a removable roof which provides access to the transformer which in turn has one MV cable connection and 3 LV and 1 Neutral connection (Fig. 1) to the LV panel.

Page 386 of 625
Fig. 1 Transformer Connections in Unit Sub
All Unit Substations come equipped with a facility to off load up to four 4x185 circuits.
Unless EV Penetration was very high with high levels of charging it is unlikely that the transformer size would need to be increased.
ESB Transformers are designed to provide outputs of 244V, yet the allowed Voltage Limit is 253V per EN50160, the difference being available for voltage rise as might be caused by retrofitting of local generation such as PV. It might be worthwhile in areas where PV was not present but where voltage drops were an issue to increase the output voltage of any retrofitted transformer to 253V through the installation of a tap changing transformer. If PV were present this would automatically reduce the voltage also, as the tap changer operates to ensure that the voltage on the LV busbar is within set limits so that no customer receives excessively high voltage. However the cost of such transformers is currently double that of a conventional one, but prices cab be expected to fall, so that it is an option for the future. The allowable voltage from an LV Cable is 5% and an increase in voltage from 244V to 253V would offset 3.5% of the 5% drop.
In addition the option of using/replacement of normal fixed tap transformers with voltage regulating transformers is also available and allows greater voltage bandwidth on the LV side.
Note: Whilst changes to the physical structure of the Substation are not seem to be required, the layout and configuration of cables and circuits should facilitate the future connection of additional Substations for subsequent reinforcement. In practice this means that suitable Unit Sub sites should be identified and acquired when the initial Housing Scheme design is being done, and should have ready access to MV and LV cables, either from their location or for routing such cables past them ab initio. To minimise excavation costs the required LV cable connections could be made to an LV Main Sectionalising Pillar so that any Unit Sub subsequently installed could be easily connected to LV circuits. In addition the availability of an LV Man Sectionalising pillar may defer need for the Unit Substation slightly, as it allows easy reconfiguration of the network to rebalance loads and defer investment.

Page 387 of 625
(b) Mains Cable
All Housing Schemes use a minimum size of 4 x 185 AL in duct which has a constant rating of around 320kVA (depending on presence of limitations on heat dissipation due to surrounding ducts).
On both 400 and 630kVA Unit Subs the designer will usually bring out four circuits as the optimum loading level for losses savings is about 80kVA. This also minimises voltage drop and increases continuity, as a singe cable fault affects less load. The cost of installing extra cabling is minimal at construction stage as the ground is already open, and the cost of LV cabling is low.
This means that for 400 & 630kVA Unit Subs there is already scope for increased loading incorporated. This also means that there would be no benefit in increasing the size of the cables from say 4x185 to say 4 x 240Al, as there is already adequate capacity in the existing capability.
For 200kVA Units Subs only two circuits would normally be extended for losses reasons, but as 200kVA Unit Subs are used mainly on small rural developments and are the minimum size available, their actual loading is low i.e. a 200kVA is required as it is the smallest Unit Substation available and Council Planning Regulations requires it’s use as circuits on new Housing Schemes must be underground. So there is little benefit in laying extra cables in the case of a 200kVA Unit Sub unless it’s uprating to higher capacity is anticipated. In WP 4.6 the planning of new housing estates with allowance for additional electrical load is covered, and in such planning consideration would be given to the installation of extra cabling.
Current practice in urban areas is to interconnect LV Circuits to the existing LV network, but such dense LV networks only exists in very urbanised areas such as Dublin. However where they exist consideration can be given to LV Interconnection to share load and minimise voltage.
(c) Service cable
Service Cable sizes are determined by the volt drop limitation of 2% for 12kW on their run. If the run is normal then a 25Al/16Cu service cable is used, or if longer a 35Al/25Cu. In rural areas with very long runs a 70Al/50Cu cable may also be used.
As these service cables are sized for 12kW there is no advantage in increasing their size, as the voltage drop limitation arises on the upstream network.

Page 388 of 625
However there is one scenario where changes to the service cable is worth considering, and this is to allow a single phase service cable to be changed to a three phase one.
In cases where a customer wants to use steady loading at the higher levels, their diversity will be less and the impact on mains voltage much more onerous, particularly as several such customers may be on the one phase and hence cause voltage unbalance, and more severe voltage drop.
Providing such customers with a three phase supply would allow such heavier loads to be spread evenly over the three phases, on the 4 x 185 Al mains cable, thus diminishing the volt drop impact by two thirds. As service cables are fully ducted from the Meter box to the Minipillar, and as this duct is large enough to accommodate a 3 x 25/16 Service cable, upgrading to three phase involves opening the vault at the Minipillar, and pulling a new three phase cable into the service cable duct (Fig. 1, 2). A three phase meter and cut-out then replaces the existing single phase unit in the Meter Box, and the customer will then need to upgrades their own wiring system to three phase.
(d) Meter Box
It is possible that should an EV require separate metering, extra room would be required in the meter box – but provision can be made by the builder during construction to install an adjoining meter box in the future should this be required.
Fig. 1 Minipillar and Vault, showing service pipe running to Meter Box.

Page 389 of 625
Fig. 2 Minipillar Vault with 3 x 4x185AL Mains cables and 7 House Service Cables
However the Minipillar currently used is designed to provide 12 Single Phase services or 4 three phase ones, so the possibility of upgrading to three phase will be limited by the available service cable connections in the Minipillar.
Accordingly the one area which would be expensive to deal with in retrospect is the availability of Service ways in Minipillars. This means that consideration should be given to increasing the availability of three phase services from new Minipillars. This will require some internal design changes but should not be expensive i.e. it is cheaper to make this change now than attempt to do it later, especially as the Minipillar life time is up to 40 years.
4 Recommendation
For new Housing Schemes use Minipillars which can accommodate three phase Services.
Where Voltage Drop is an issue either replace the existing transformer with a voltage regulating transformer or add in an extra substation – this facility is available in the future and does not require changes to existing designs.
LV paralleling is another facility which if available will have already been provided in existing designs. Allowing it to be used continuously will require additional control equipment – again this can be done in future and does not require any changes now.

Page 390 of 625
Rural ‘One Off‘ Schemes
These are fully described in WP 4.6.
Recommendation
No changes should be made to existing Network Designs as each design is customized to the individual customer connecting. Where extra capacity is required it is best provided through the addition of a new Pole Mounted Transformer and the splitting of the LV group in an optimal position so that the new load is fed and provision made for any known expansion and minimisation of voltage drops.
5 Other Considerations affecting Network Design for the future
The future is uncertain. Incurring costs in advance in all areas when extra loads may only materialise in certain locations would be costly, and possibly futile – the loads may be much higher than expected so that reinforcement is required anyway, or other solutions may have emerged which obviate the need.
The main issues other than load which could impact on the need for Network reinforcement are as follows:
(a) Changes in EN50160
EN50160 is a very stable standard but based on requirements of equipment set in the late 1970’s. The recent (2012) EU banning of Incandescent lights has suggested that the’ flicker’ standards which limit the frequency and severity of voltage dips affecting light output is questionable. The increased ability of much electronic equipment to operate over very wide voltage ranges could also mean that the lower voltage limits would change over time.
If such changes in EN50160 occurred it would mean that the networks could accommodate wider voltage tolerances and hence more EV with less investment.
(b) Availability of ‘DSM’ type controls
Control of customer load switching in order that voltage limits were not breached is another possibility, particularly if such control could be exercised by local measurements of the voltage by the equipment connected at that point of common coupling. Such controls would ameliorate but not eliminate changes in voltage and delay the need for reinforcement. However it would seem that unless there was a huge and widespread proliferation of EV’s on

Page 391 of 625
the network that it would be cheaper and more practical to simply reinforce the network in particular areas where problems head were likely to arise.
(c) Lower impact than expected of EV and Heat Pumps
Initial UK Studies ‘Impact of Electric Vehicle and Heat Pump Loads on Network Demand Profiles’ (UKPN Report B2 Sept. 2014) suggest that as EV’s and Heat Pumps are averaged over different consumers on each section of the network, their aggregate impact on local demand is relatively small and not expected to drive major reinforcement in the near term.
(d) Impact of PV and Storage
The Heat Pump works continuously during the day, as does PV, so it could be that if both were installed one would largely offset the other.
EV charging mainly occurs in the evening so PV would have less impact, but if storage at residential level were economic it could be used to manage the load profile of EV charging.
(e) EV Charging at Work place
If EV Batteries increase in size the requirement to charge at home became less, particularly if EV Charging at the Workplace is facilitated. This in turn would severely reduce the need for Residential EV Charging.
(f) Requirement for Fast Charging
Customers may want 22kW charging at home in which case any reinforcement to provide 3.7KW charging would be stranded, and 3 phase connections would be required instead.
6 Conclusion
The above illustrates that the best policy in regard to design of Networks is to maintain flexibility in the design and then respond as required when reinforcement is needed. In nearly all cases such work is as easy to do later as earlier, with consequent decrease in risk and reduction in cost.
The only are which would appear to be worth providing in advance is the ability for new Minipillars to provide Three Phase Services to residential customers.

Page 392 of 625
Work Package 4.6
Revised Housing/Apartment Scheme Design
Details

Page 393 of 625
Table of Contents
1 Introduction .........................................................................................................................394
1.1 Housing scheme designs can be divided as shown below ...................................................394
2 Network Design Considerations in existing Housing Schemes ....................................395
2.1 Apartment Developments......................................................................................................395
2.2 Housing Schemes .................................................................................................................396
3 Future Considerations in Housing Scheme design: .......................................................397
4 Load Control ........................................................................................................................398
4.1 Adoption of revised Power Quality Standards: .....................................................................399
5 Network Reinforcement ......................................................................................................400
5.1 Apartment Blocks – New and Existing ..................................................................................400
5.2 Housing Schemes .................................................................................................................400
5.3 New Housing Schemes .........................................................................................................400
6 Summary ..............................................................................................................................407
7 APPENDIX 1 - Interlinking LV Feeders ..............................................................................408

Page 394 of 625
1 Introduction
1.1 Housing scheme designs can be divided as shown below
(a) Existing Apartments (b) New Apartments (c) Existing semi-detached/detached (d) New Semi-detached/detached.
In existing developments costs have already been sunk and the networks created, so that any modification to these networks must be developed from the existing configuration.
In contrast, for new developments there is scope to design the networks on a radically different basis.
In all cases what must be borne in mind is that no sub-optimisation should occur – there is little point in optimising the networks for additional EV loads only to find that they are then still unsuitable for (say) electrification of heat from Heat Pumps or Storage Heaters.
Accordingly any investment must be considered from a ‘Real Options’ perspective, where the NPV of the investment is the sum of the NPV of the cash flows plus the NPV of the associated options provided for future network developments..
NPVInvestment = NPV Cash Flows + NPV Options
This approach is particularly beneficial when uncertainty is high and when the time scale over which the investment must deliver value is long, as is the case with any fundamental change in Network design.
Typical sources of uncertainty such as :
Reviews leading to less onerous voltage standards, changes in power requirements for EV’s,
the introduction of significant extra loads due to the electrification of heat ,
the proliferation of on site PV generation
and associated storage
are some of the issues which will be addressed in order to ensure a resilient solution.

Page 395 of 625
2 Network Design Considerations in existing Housing Schemes
2.1 Apartment Developments
Most apartment developments were designed for use with Night Storage Heating with an ADMD of 5 – 6kW per apartment. By their nature, Apartments tend to be located in urban areas where land prices are high, which in turn means that adjoining loads are typically other apartments and commercial developments such as retail, pubs/clubs and restaurants.
Over about 150kVA (about 30 apartments) each apartment complex will have its own sub-station, typically with a transformer sized for the apartment load – up to 1MVA for a 200 Apartment complex. Essentially, apartment housing is regarded as a point load which will have limited future growth, which if it occurs would be catered for by transformer uprating.
Apartment Sub-stations will generally (in the more dense urban areas) also be connected at LV to the adjoining network, thus reinforcing the local cable networks and providing capacity for day loads outside the apartments.
Usually the wiring within the apartment complex is provided by the developer, with the ESB Transformer being offloaded to an adjoining Main Switch room, and SWA rising mains then provided by the developer between the Switch room and the group metering panels, located at each block. Individual supplies are then wired from the meter to each apartment.
Voltage drop is not an issue on the ESB side of these designs as the output voltage from the transformer will be about 244V, with the only voltage drops occurring on the Rising Mains cables (usually substantial copper cables) and on the circuits between the meters and the apartments. On these circuits ETCI rules will have been applied to control the voltage drop.
Underground car parks are a feature of such apartment blocks, with car park lighting being provided by the apartment management company.
Substations are typically Indoor rooms 4 x 3 x 2.5m located on the periphery of the apartment block, typically with apartments adjoining and above. In cases where the access to the Underground car park is more than c.3m in height they may also be located close to the end of the entry ramp.

Page 396 of 625
2.2 Housing Schemes
Housing Schemes are developments of semi-detached/detached houses which are built on either side of a new road network laid out by the Developer. The loads in each house are stable, with load growth in the area expected to come from additional land being developed, not from increases in load on the existing site.
Accordingly, these developments are fed by pre-fabricated substations consisting of transformer, switchgear and LV Distribution panels, which are placed as self contained units on concrete plinths in the centre of the development. As additional land is developed, more Unit Subs are installed, with each feeding the adjoining territory.
Where possible the LV cables from the Units Subs are interconnected as this provides a ready standby feed for maintenances as well as facilitating the even distribution of loads between substations.
These LV cables are now a uniform 4 x 185Al in size, but in the past ‘tapered networks’ were used, whereby the size of the cable decreased as the load dropped off with distance from the substation, running from 4 x 185 to 4 x 120 to 4x 70 Al. Where tapered networks have been used there are limitations on subsequent network reinforcements, as these sections act as bottlenecks to power flows with excessive voltage drops and loading limitations.
The Mains cables are looped into junction boxes called Minipillars, from which smaller Service cables are taken to feed individual houses. The peak load carried by the se Service cables is limited by the allowed voltage drop of 2%, and is no more than 12kW in newer housing schemes, but can be lower in older areas.
Design loads for average houses were 2.3kW (modern) or between 1kW and 2kW for Local Authority/Gas Heated Houses.
Typically such Unit Subs are either 200kVA or 400kVA in size, although larger ones of 630kVA have been used in the past where load density was high e.g. Estate equipped with electric heating.
The sites for Unit Subs are provided by the developer and are areas segregated from adjoining gardens, facing onto roadway and without anything being built above them. They are designed to be unobtrusive and blend into the development.
Fig. 1 Location of Unit Subs in Housing Schemes

Page 397 of 625
All Unit Subs have been designed to have the transformer uprated to 630KVA, although the rating of the Unit Sub may be constrained below the transformer nameplate rating due to cooling restrictions
imposed by the transformer housing.
Fig 2 Photo of Unit Sub in Housing Scheme
3 Future Considerations in Housing Scheme design:
Load increases by residential users, either for EV charging or for the electrification of heat (e.g. Heat Pumps, Storage Heaters) will result in the design loading of 2.3kW ADMD being exceeded, and may cause a need for network reinforcement if there is insufficient voltage or thermal capacity on the particular network.
Whether such reinforcement is actually necessary in practice will depend on the level of increased loading involved and the ‘headroom‘ on that part of the network.
Two Scenarios can be considered:
(a) General dispersed penetration of EV’s and Electrification of Heat
If loads increase in a random way as individual customers buy and install equipment, then the impact will be spread out both geographically and over time so that it is less likely that there will be any general requirement for network reinforcement. However it is likely that clusters of areas requiring reinforcement will occur, either because the network in that area was particularly weak already and the additional EV load caused standards to be breached, or because there was an unusual concentration of EV’s in the area.
(b) Widespread concentrated developments of EV’s and electrification of Heat
In contrast, more widespread reinforcement would be required if there was a concentration of load due to the application of new policy requirements e.g. that only EV’s would be allowed parking

Page 398 of 625
spaces in new Apartment developments, grants for installing Heat pumps etc., or due to the widespread adoption of EV’s for economic/social reasons.
In scenario (a) additional investment is initially only required in those clusters where voltage/thermal standards have been breached, and in all other areas the existing ‘headroom’ on the network has been found sufficient to cater for the additional loading. Over time, as this ‘headroom’ is absorbed by new loads, additional reinforcement may be necessary, but in the meantime investment generally only takes place as and when required in those areas where problems emerge. Additionally, where low cost opportunistic investment is possible during required refurbishment of networks for maintenance/obsolescence/redevelopment, advantage may be taken to provide extra capacity at a low marginal cost e.g. instead of uprating from 400kVA to 630kVA, the substation might be uprated to 1000kVA instead, as the additional cost is probably only --% of the overall substation cost and carrying out a second uprating of 630kVA to 1000kVA in the future could be more expensive.
In contrast scenario (b) rapidly exhausts any headroom on the existing network and then requires either major network reinforcement or significant load curtailment.
In reality the adoption of new technologies tends to follow an ‘S’ curve with low initial adoption rates (Scenario (a)) followed by rapid expansion until saturation is reached (Scenario (b)) and growth levels off.
This means that the best approach to network development is to try and proceed along Scenario (a) making low cost provision for the likelihood of Scenario (b), and then recognising when Scenario( (b) is in effect and being able then to adopt the existing networks in a sensible and economic manner.
In addressing the above the only solutions are to:
(a) Restrict the load in time and duration (‘SmartGrid’ load control)
(b) Adoption of revised Power Quality standards
(c) Reinforce the network
(d) Combination of both network reinforcement and load control
4 Load Control
Load control of EVs to ensure that peak demand is not increased is often recommended although the details of how and when it would be applied in practice are seldom fully elaborated. In practice it is likely that Load Control will be developed commercially for use in the market, but will be operated with DSO & TSO ‘override’ to ensure that it is not operated in such a way so as to breach standards or endanger the safe and secure operation of the system, through the use of DSO controlled systems such as ‘Servo16’. It is also looked at only in respect of EV charging, yet the installation of 3kW Heat Pumps would cause as much or more impact on the network than EV’s, and is far more likely given their lower initial cost and rapid payback.
This means that any load control solution that looked at EV charging in isolation would be made void once Heat Pumps began to be installed, as these were not under EV charge control.
So for load control to be effective it must apply to all large, long duration, domestic loads – Heat Pumps, EV’s, Storage and Water Heaters. In addition it must take into account the impact of Demand aggregators who may turn on loads at peak times in order to absorb excess wind energy r to take advantage of other market conditions.
16 The impact of ‘Servo’ is to block load switching initiated by TSO/Aggregator where such load switching would be deleterious to the operation of the Distribution Network. The decisions on the criteria to be adopted would depend on an economic and technical comparison of the costs, benefits and risks involved.

Page 399 of 625
Market (i.e. price) mechanisms are ineffective at the LV level in ensuring that Power Quality standards are maintained because the breaching of a voltage standard may only take a very short time, yet the impact on equipment performance could be substantial. It is not possible for market signals set at an aggregate level to control customer behaviour at LV to an extent that would ensure that voltage standards are always maintained.
It is therefore clear that the Load Control system required will not only apply to all such loads (not only EV’s) but must also communicate with the DSO so that switching signals from different aggregators are coordinated, so that standards on a particular network are not breached by excessive loads being turned on in concert.
In addition, even in the absence of any central signals from aggregators, the loads on a particular LV circuit, consisting of small random household loads plus larger EV, Storage and Heat Pump loads, must all operate in such a manner that voltage /thermal limits are not breached. The less ‘headroom’ on the network the more tightly controlled the co-ordination required between such loads.
However not alone must the loads be co-ordinated in such a manner that the voltage standard’s are not breached (which implies a knowledge of the relative position of individual loads along the feeder), it also requires that the load co-ordination must also be in agreement with the customers wishes of when they wish to use electricity. This becomes difficult when the amount of load which must be scheduled accumulates, so that deferral of one group of loads causes this group to switch on simultaneously at a later time to make up the charging they lost earlier.
In light of the above it can be seen that fully developed Load Control at LV will be complicated to achieve, involving extensive communications and load modelling of individual LV feeders, as well as a market mechanism to allocate when EV charging of each customer is allowed. (See WP 4.2 for further details)
Probably an ESBN Demand Control system called ‘Servo’ will coordinate any centralised load switching by Aggregators, and local control to manage local loads on individual LV feeders will be accomplished by calibrating the allowed voltage drop at each individual household by switching on a particular load combination and measuring the volt drop at each house using a Smart Meter. Loads would then be allowed switch until a particular voltage threshold was being reached at which time individual loads would cycle off in a pre-arranged random order. In this way any load could be used without restriction at any time provided the voltage was adequate, but in the event of low voltage some loads would turn off.
Accordingly it is unlikely that such a sophisticated system will appear initially, as the numbers of loads would not be large enough to require it at an early stage. So the most likely outcome would be that a cruder mechanism would be used to gain the most benefits from load control at the least cost i.e. restricting EV charging to night hours.
This also has the corresponding implication that the solutions to initial problems with EV charging, which is not adequately addressed by time restriction, will instead be addressed by Network reinforcement, with Demand control extended into the future when problems exist beyond specific clusters.
See also WP 4.2
4.1 Adoption of revised Power Quality Standards:
Much of the issue with the accommodation of new loads lies with breaches of voltage standards rather than breaches of thermal limits. Voltage Standards are set in EN 50160 and were determined in the 1970’s based on what sensitive data processing equipment could accommodate. However much of today’s equipment operates over much wider ranges than those in the 1970’s and changes in lighting (the banning of the incandescent build) will mean that sharp voltage changes no longer case flicker in household lights.

Page 400 of 625
It may be that over time the voltage standards in EN 50160 are reviewed to better reflect modern requirements, in which case certain levels of investment would no longer be required.
5 Network Reinforcement
5.1 Apartment Blocks – New and Existing
In cases such as apartment blocks, new and existing, EV charging will occur in the car parking areas from a set of chargers installed by a third party on an internal distribution network. This network would be analogous to the Rising Main’s already installed by the Developer between the main Switch-room and the Metering points. Additional transformer capacity if required could be provided by the DSO either replacing the existing transformer with a larger unit or installing a second substation.
The relative simplicity of dealing with Apartment EV charging lies in the fact that voltage drop is not an issue as the cables to the EV chargers will be new and adequately sized to avoid excessive voltage drop. Provision of extra transformer capacity is also a relatively straightforward exercise.
5.2 Housing Schemes
The approach taken in new and existing Housing Schemes will differ somewhat due to the greater design flexibility afforded in new build.
5.3 New Housing Schemes
In designing a new Housing Scheme it will not be known what future load requirements are to be expected. It would be possible to design a network capable of feeding 30kVA per household, but with a large increase in initial costs and resulting in stranded assets if the expected load developments did not take place.
The five areas in which design modifications could be made are listed below and considered in turn:
(a) Mains Cable
ESB currently use 4 x 185 Al mains cable which is rated for about 200kVA. Installing a larger sized cable would add in proportion to cable costs but not provide extra capacity in proportion, as the cable rating is proportional to its ability to dissipate heat. Heat dissipation in turn is proportional to the surface area, which increases only linearly with cross sectional area, so that the benefit of larger cable size is not in proportion to the associated cost increase.
Accordingly use of a larger cable size would incur large increased costs immediately in all areas, but even in those areas where the extra capacity was used it would have been provided at an unnecessarily high cost.
Installation of larger numbers of cables during scheme development can be more cost effective once loading can be at 80kW per cable average, as this level of loading provides savings in losses which defray the extra costs of the cables. The reason why this method is economic is based on the assumption that the cost of additional ducting once the developer as the ground open is small, basically the cost of the ducts. Consequently if extra cabling may be required in the future a yet better option is to simply install spare ducts rather than the cable itself.
As covered in WP 4.1, thermal capacity of cabling is unlikely to be an initial constraint, rather voltage drop.

Page 401 of 625
(b) Transformer Capacity and Sidewalk Unit Substations:
The Transformer itself only accounts for less than --% of the substation cost, so that if Transformer capacity is a limit, increasing it is generally good value for money. An increase in transformer capacity is economic because the power output is proportional to the volume of material in the transformer – a small increase in dimensions is reflected in a proportionately larger increase in available power.
However the transformer may still be limited by either the thermal of voltage constraints associated with the offloading network cables. Adding in new cable circuits is worth considering but, as discussed in (a) above, costs can be further deferred if the developer simply installs spare ducts to facilitate future reinforcement.
However the addition of an additional substation not only provides extra transformer capacity but because the substation splits into existing LV cables it increases the available cable capacity (in proportion to the size of the transformer capacity installed) and, most importantly, solves any voltage drop problems in the vicinity.
Providing extra sites for additional transformer capacity in new estates would be one approach, as suitable sites are impossible to find after the estate is developed and the land allocated. An inappropriate substation location requires extra cabling and extra trenching to blink cables to the Substation, and costs associated would then be quite high – as a guide over €---/km.
Another (but yet untried in Ireland) approach would be to use Sidewalk Transformers to add additional capacity. These are used in Centre City Tokyo, where the LV Network is reinforced through the use of Substations which are 0.4m wide, 1.45m high and 1.1m long. The advantage here would be that they could be installed in suitable public spaces as problems develop, without requiring any private land to be expropriated.
Fig. 3 Sidewalk Substations used in Tokyo © Tepco
In Fig. 3 an illustration is provided of how Tepco in Tokyo are already using such ‘Sidewalk Transformers’, pictured in Fig 4. below. Tepco’s network configuration is somewhat different to that of ESB but similar enough to demonstrate the principles of operation.

Page 402 of 625
So in Fig 3 MV Network shown by the Pink and Blue circuits is shown entering an MV Switching Kiosk (‘6kV Multi-Switch’), where one MV circuit is routed to and MV Customer (two Pink cables entering ‘6kV Cabinet’). In Addition a Pink MV cable is shown entering a ‘Pad Mounted Transformer’ which reduces the voltage from MV to LV, where it exits the transformer using the Green LV Cables. The Green LV cables then go to a distribution pillar (‘LV Branch Box’) to which individual customer LV circuits can be more readily connected.
In Fig. 4 a schematic of a more advanced version of the ‘Siwealk Trafo’ is shown where the ‘Multi-Switch’, ‘Pad Mounted Transformer’ and ‘Lv Branch box’ are shown all combined in one unit. This is very similar in configuration to ESB’s existing Unit Sub but much smaller. However it has a high overhead in terms of switchgear costs compared to the power delivered – about 200 – 300kVA.
For ESB a more appropriate lower cost design would involve the use of elbow connectors to connect the cables to the transformers with switching being carried out using the MV switchgear in the Unit Subs on either side. The Transformer would itself be protected by an internal MV fuse and an LV fuse on the outgoing LV cable which would terminate in a separate LV Sectionalising pillar. This approach minimises the costs of the ‘Sidewalk Transformer’ per kVA connected, and facilitates incremental use as required.
Fig. 4 Photo of Sidewalk Substation and internal Schematic © Tepco
It may also be possible to adjust the dimensions of the Unit Substation so that it’s height is reduced but with a corresponding increase in length so that it was less obtrusive when placed against a garden wall. Currently this unit is similar in size to the Telecom cabinets used by Eircom or the Street Sectionalising Pillars used in Dublin City by ESB, so public acceptability seems reasonable.
In essence the Sidewalk Transformers are used to split existing cable networks thus providing a new source for voltage and reducing loads on existing cables, as is illustrated below in Fig. 5

Page 403 of 625
Fig. 5 Housing Scheme with 4 outlets feeding 8 Minipillars
Fig. 6 Second Substation splitting existing Circuits
The installation of an additional Unit Substation allows existing circuits to be split, thus doubling the capacity of the existing circuits and providing a strong new source of voltage to existing loads.

Page 404 of 625
(c) House Service Cable
The service cable feeding the house is typically sized to allow a 2% voltage drop over its length for a load of 12kW. This is based on the design criteria that at least one house may be using 12kW whilst the remainder are running at 2.3kW.
The addition of extra constant loading from EV’s and Heat Pumps voids the initial assumption but may also stress the Service Cable volt drop criteria, particularly if an electric shower also happens to run in conjunction with the other loads.
Increases in load beyond 12kW even for short periods are not catered for in this design.
Using a larger Service Cable size would add costs to each house ab initio, regardless of whether additional load was actually installed. Furthermore, losses and volt drops are based on the assumption of load being balanced across all phases – this is statistically correct when dealing with large numbers of small loads which are switched at random, but not when dealing with smaller numbers of single phase loads.
In new housing schemes the service cables are laid in ducts from the Minipillar to the meter box, so that if an upgrade to the Service Cable is required it can be made by the installation of a different cable, and the most appropriate upgrade would be to a three phase supply, as is provided in Germany.
Fig. 7 Minipillar used to connect Service cables to houses.
Three phase is available at the Minipillar and results in a better distribution of loads, as well as allowing for the use of three phase chargers and heat pumps, as well as the balancing of loads such as storage heaters over all three phases.
Such cables can be retrofitted from the Minipillar to the Meter box, with the ESB cut-out and Meter replaced with three phase units. This approach allows investment to be deferred until required with little expenditure in advance.
The main change required from such an approach in new designs would be to change the Minipillar internal connections so that instead of accommodating 12 single phase services or 4 x 3 phase services it could accommodate(say) 6 x 3 phase services and 6 Single phase services. Such a change would have a small impact on the overall cost of new Minipillars.
For existing Minipillars a method of extending the numbers of phase and neutral connections would be required to be able to be retrofitted.
(d) Interlinking LV Feeders
Typically cables feed radially from the Substation, and if the urban area is sufficiently dense, will tend to interconnect with other circuits, either from the same or different substations, ant Normally Open

Page 405 of 625
points. This means that the impact of a concentration of load may be more significant in one feeder than another, resulting in a requirement for reinforcement of the heavily loaded feeder.
One possible way of deferring such reinforcement would be if it were possible to solidly inter-connect the two feeders so that the total feeder capacity of both was now available and the overall load now spread across two feeders rather than concentrated on one. Interconnected LV networks are used in some large cities in, for example, Germany.
Fig. 8 - LV Interconnected Networks in Germany
To achieve this of course there has to be an ability to interconnect feeders, and whilst this will be more generally available in dense urban areas i.e. generally city centres, and may not exist outside such areas e.g. a housing estate in a regional town or on the outskirts of a city may have little opportunity for interconnection.
In designing new housing estates however opportunities for such interconnection can be taken advantage of if available at low cost, either by installing cables or making provision for their later installation. There are also other benefits of such interconnection such as reduced losses and improved standby for maintenance, so that they can often be economically attractive.

Page 406 of 625
Fig. 9 Interconnected LV Networks trial at Roebuck Downs in Dublin
In Fig. 9 two Unit Substations are shown in Blue and Red, with an LV Interconnection shown in Yellow. In theory, interconnecting such networks means that the voltage profile will be optimised, with all voltage drops along the interconnected feeders less than when operated radially. This means that with less voltage drop more EV’s or other load can be accommodated.
Technically paralleling at LV between two Substations which may not be on the same network segments can results in inadvertent back feeding which can be problematic during a fault. This in turn requires that some extra switchgear is required in the Unit Substation at either end of the feeder, and possibly also at the Normally Open point.
In general there is only limited opportunity in Ireland for the application of inter-linked networks, although in the UK this is seen as a significant opportunity and his being investigated by UK utilities in trials using equipment from ---. This means that a solution in this area is likely to be commercially available in the near future and can be adopted by ESB as required.
For future Housing Estate Designs this means that opportunity should be taken to actively design for future interconnection as this is a low cost investment with good returns, even in cases where the expected load increases did not occur.
An example of such a network is illustrated in Appendix 1
Existing Housing Schemes
The situation on Existing housing schemes is that a network already exists and so there is less scope to make any radical change. The Network may be old using lower ADMD’s and smaller service cables,

Page 407 of 625
with tapered LV mains networks, where the cable size decreases with distance from the Substation. In addition, in a fully developed housing estate there will be little room for additional substations of traditional design.
Installation of three phase service cables may also be feasible, but only in cases where the service cable is ducted.
Accordingly the most feasible approaches in existing Housing estates will be to:
(a) Interconnect LV Networks where feasible
(b) Install additional Sidewalk Substations which have a wider choice of site due to their small footprint.
(c) Replace existing trafo with ‘SmartGrid’ MV/LV Tap Change Trafo where both Volt Drop and extra capacity is required
6 Summary
Voltage drop will be the most limiting criteria in the connection of extra EV Loads to networks. Such problems will first appear in clustered locations on the network where the network is strained or where there is a concentration of EV Load.
Load Control is a possible way of deferring network reinforcement. However, as explained in WP 4.2, it requires that both EVs and other loads are all capable of being demand controlled. In addition, it also requires that there is a control mechanism in existence that can operate down to individual LV circuits in order to ensure that voltage drop is maintained within standard.
However all of the above are unlikely to be available in the near term, and when available must not only be applicable to EV’s loads, but also all other heavy new loads such as Heat Pumps and Electric Heating. Unfortunately, as load density increases on such circuits, the loads will tend to be rescheduled more frequently so that customers may not be able to charge when desired. In addition there is also the danger that when such loads are deferred and then begin charging later, they may group together in time and cause similar volt drop problems. (See WP 4.2)
In the near term such a level of control would be required everywhere ab initio, yet problems are only likely to occur in particular clusters at some stage into the future. Accordingly the requirement to provide such a system now would be overkill, especially when cheaper alternatives are available.
Consequently the likely solution in Housing Schemes will be either interconnection at LV to maximise the usage of spare Transformers and circuit capacity, whilst minimising volt drop, plus the installation of Sidewalk Substations which can reinforce the existing feeder networks selectively with out any significant amounts of civil works being required.
Any interconnection of LV is complicated as it can inadvertently mesh two HV networks at MV, and also needs protection to prevent backfeeds from LV to MV during faults. This is technically and economically challenging at present.
In Apartment blocks the main restriction may be Transformer capacity, but additional Transformer capacity can be installed by either upgrading the existing transformer or adding in a new Substation, both relatively low cost options. Circuits for EV Charging would be privately installed.

Page 408 of 625
7 APPENDIX 1 - Interlinking LV Feeders
Fig. A - Network Diagram showing LBV and MV Circuits on a Housing Scheme
In Fig A the LV Cables required to feed the housing load are shown in purple, with new LV cables for interconnection shown in Grey. MV cables and the MV/LV Substation are shown in light blue.
This is a geographic map of the Housing estate showing the physical position of the cables. A better understanding is obtained by looking at the Schematic representation in Fig. B below:

Page 409 of 625
In Fig B the MV/LV Substation is shown in Blue, with the LV cables in black and the Minipillars from which the House Service cables feed shown in Yellow. As is evident, many circuits run to tails which are not interconnected with existing network or with other tails from the same substation.
Making such connections adds in extra cable costs but also allows loads to be balanced more evenly and hence reduces losses. In addition such interconnection reduces outage times in the event of a fault as backup from an adjacent circuit is available.
Fig. C - Additional LV Cabling required to form inter-linked network
As can be seen from Fig C above, relatively little extra cabling may be required to form an interconnected network. This extra cabling could be installed as part of the original design, or ducts laid to facilitate it’s installation at a later date. Where possible the cabling should be installed ab initio, as the costs of cabling compared with the associated civil works of installing it later, even when ducts are available, is generally quite high.

Page 410 of 625
Work Package 4.7
Revised non-scheme connection Standards

Page 411 of 625
Table of Contents
1 Introduction .........................................................................................................................412
2 Network Design Considerations in existing ‘non-schemes’ ..........................................415
3 Future Considerations in accommodating Electric Vehicles on new and existing non-scheme connections ..........................................................................................................................420
4 Network Reinforcement ......................................................................................................422
5 Reconductoring to 95’s bundle .........................................................................................422
6 Load Control ........................................................................................................................422
7 Summary ..............................................................................................................................422

Page 412 of 625
1 Introduction
About 40% of the 4m populations live in the countryside, with the remainder in towns and cities, principally Dublin (pop 1m) – see map below.
Fig. 1 - Population density map of Ireland
From the viewpoint of the electrical system this has resulted in a comparatively large MV & LV overhead network (83,000km MV OH and 58,000km LV OH) to connect dispersed groups of customers in rural areas (234,000 Pole Mounted Transformers), and a much smaller underground network in cities and towns (10,000km UG MV cable, 12,000 LV UG cable) where population density is much higher.
Some statistics on the ESB Network are given in the table below, and the salient points are that the
number of customer per km is very low, and especially the number of customers per transformer, with
ESB having the lowest number of customers per transformer in Europe due to the very dispersed
settlement pattern.

Page 413 of 625
Table 1 - Statistics on Network density within EU
The use of single Phase Transformers is unique within Europe to Ireland and the UK.
Fig. 2 - Single Phase Network construction in isolated rural area
In developing electricity networks to feed rural areas back in the 1920’s, it was clear that if the rural area was characterised by isolated dwellings with low electricity consumption, then Single Phase MV Networks were the most economic method of supply.
Ireland and the UK are unique in Europe by having extensive rural communities consisting of ‘one off houses’ or clusters of 2-7 dwellings each separated by a few hundred metres.

Page 414 of 625
In contrast, France (and most other EU countries), which also have extensive rural areas, instead use MV three phase entirely, but in France the rural population tends to live in villages which are large enough to make three phrase MV networks optimal; in Scandinavian countries electricity is used for heating and electrical consumption is high enough to also require three phase LV connections.
Consequently as only UK and Ireland use Single Phase MV networks, they are also the only countries in the EU which use Single Phase Transformers.
In Ireland 40% of the population live in rural areas, mainly in isolated rural dwellings, so that small single phase transformers are predominant – 90% of Single phase transformers are 15kVA Single Phase and 10% 33kVA Single Phase.
Again, in the Irish case, of the 2.2m Customers LV Customers, 0.6m are rural with a consumption of 3,000 GWh, and the remainder are Urban with a consumption of 13,000 GWh, so that it is, clear that Urban 3 Phase transformers have a significantly greater loading than Rural Single Phase Transformers
Ireland:
Urban Areas: 20,000 Ground Mounted Three Phase
Rural Areas: 20,000 Pole Mounted Three Phase
210,000 Pole Mounted Single Phase (90% x 15kVA & 10% x
33kVA)
Total: 250,000 Transformers
Table 2 - Statistics on usage of Pole Mounted Transformers in Ireland
In the UK, which is much more urbanised, Single Phase Transformers are much less common, as the settlement pattern tends to result in rural dwellers congregating in villages , with three phase transformer supply.
At present the UK uses about 5,000 Single Phase units per annum and Ireland 5,500 per annum – greater than in the whole of the UK.
The upshot of the above is that the issues associated with supplying Electric Vehicles from Pole Mounted Transformers in rural Ireland are likely to be nearly unique within the EU. In addition, very rural areas are likely to be too far away from typical destinations to facilitate the use of the EV, as its range is more limited. However once outside the main urban areas overhead network is typical, so that a customer 8 km from Naas town centre is likely to be supplied via an overhead pole mounted transformers, and will find an EV suitable for commuting into Dublin on a daily basis.

Page 415 of 625
2 Network Design Considerations in existing ‘non-schemes’
Overview
The attached diagram shows a typical ESB MV Network from the 38kV Station at Clara, with the circuit of interest coloured in Yellow.
The Yellow circuit is a 3 phase MV backbone Line operating at either 10kV or 20kV.
Each square on the map is 1km, so that the total length of the three phase circuit in yellow is 6km, and of the Single phase – shown dashed, 12km. (actual full length of this circuit was 20km 3 phase and 40km Single phase)
From the Three Phase MV extend other 3 phase branches (also coloured Yellow), and from these 3 phase Branches extend single phase branches (2 wires) to the customer transformers (shown as small open circles), which step the voltage down from MV to 230V.
There are 44 points along the three phase Branch from which Spurs extend, and these Spurs also branch along their length, and feed varying numbers of transformers from 6 – 26. A total of 160 transformers are connected to the network, feeding 530 customers. Span lengths between poles are between 70 and 90 metres.
After the Transformers a low voltage conductor extends to poles adjacent to the customers house, and from these poles a 15m aerial extends to the customer, or in come cases a cable is brought down the pole and into a duct on the customers’ property.

Page 416 of 625
Fig. 2 - Sample MV Three Phase and Single Phase Networks/Transformers
Design Considerations:
In Ireland there tends to be a lot of ribbon development as farmers sell off sites with road access. Such sites are typically 60m long and 30m wide ( - ‘ 200ft x 100ft’)
ESBN designs traditionally involve the use of a pole mounted transformer on a pole at the rear of the house feeding the house either directly from the transformer itself or via an Underground service, either 35/25 or 50/70, from an OH Main of 95Bundled conductor (new build).
Typically the single phase 95 Al bundle would feed up to 250m for 12kVA MIC Customers or 180m for 16kVA MIC Customers, with the exact distances and customer numbers depending on the LV Design Criteria.

Page 417 of 625
The span lengths of the 95Bundled conductor are fairly short – typically around 30m, as the poles are positioned to be in line with the boundaries of the site and avoid wayleave disputes.
Fig. 3 - Sample LV Network (Blue) feed from MV network (Green)
The 95Al Bundle typically feeds in two directions from the transformer, parallel to the rear of the houses. It is generally blocked from feeding perpendicularly to the houses as the houses are in the way, and in the opposite direction the MV Line itself forms a minor blockage as the LV line can’t be run underneath the LV, although it could be run at an angle.
When an additional house(s) is to be added to the group the revised load and networks are reviewed and a decision taken as to whether reinforcement is required. Such reinforcement, if required, typically involves splitting the group , and this is commonly achieved by converting some of the existing LV poles to MV and installing a second 15kVA transformer along this new MV circuit, with downstream LV network brought into the new transformer.
Looking at a typical network in Fig. 4 below the above scenario can clearly be envisaged:
The 33kVA transformer is fed at 20kV via a Single phase 25Cu OH line, with a single fused outlet at the transformer split into two directions. In the event of extra load developing at the end of the LV main and the group falling outside standard, then the group would be split.

Page 418 of 625
Fig. 4 - Detail of LV Connection (LV Blue, MV Green, New MV Pink)
This would likely involve extending a new MV line to Pole 3 (say) and converting Pole 3 to MV the installation of a 15kVA transformer at pole 3 and the connection of the existing downstream bundled conductor into the new transformer.
Typically existing 15kVA transformers have 5 or less customers connected (Fig. 5), and as seen from Fig. 4 (above) will be fed over 1-2 sections of 95 Bundled conductor. Older transformers will use smaller sized conductors with greater volt drops.
Fig. 5 - Numbers of customers per 15kVA/33kVA Transformer – not all customers of equal power usage
34m x
70m
250m
33kVA
TrafoExtending
MV Line

Page 419 of 625
These figures are broadly in line with the LV Design Manual:
Table 2 Design Guide for Equivalent Customers per Single Phase Pole Mounted Transformer
Newer 15kVA Transformers (all 20kV and newer 20/10kV Dual Ratio) have 2.2% impedance, and older 10kV 15kVA units 4%, so that there is less volt drop available on the network for older 15kVA Units.
Typically when a new transformer is required this will be located reasonably close to the individual customer or close to the centre of a group of customers. In the case of a group of customers the transformer is located so that customers can be supplied on at least two short LV feeders from the transformer rather than one long feeder i.e. there are likely to be two sections of LV Bundled Conductor per transformer.
The separation of the transformer from individual customers is determined by the need to keep adequate separation between the MV and customer earths – typically 50m.
Note: 95’s Bundled conductor has 1% VD for 722kwm at 0.9PF, and a 25C rating of 313A (72kW single phase); Target span is 85m.
Table 3 Design Guide for Maximum Rural LV Feeder Length (excl. Aerials and Service Cable)
ESBN ADMD figures for domestic customers on single 15kVA transformers assume a level of embedded load growth – however the diversity of the load is more significant than any growth rate.
Typically new Rural connections are designed from either 12 or 16kVA supply levels, depending on what the customer requests.
Contracts for 12kVA are based on 10 minute average values with an expectation of 2.5KVA as the average ADMD on the transformer from each 12kVA customer and allows for usage of a 9kW
Transformer Type Allowed Customers
15kVA Normal Impedance 5 x Equivalent Customers
15kVA Low Impedance 7 x Equivalent Customers
33kVA 12 Equivalent Customers
Maximum Custmer Numbers for Single Phase Trasnformers
Customer Class Maximum LV Feeder
8kVA Supply 400m (6 spans)
12kVA Contract 250m (4 spans)
16kVA Contract 180m (2-3 Spans)
Maximum Rural LV Feeder Length

Page 420 of 625
instantaneous shower unit.. Similarly, for 16kVA customers the expected ADMD on the transformer is 3kVA, again based on 10 minute averages.
3 Future Considerations in accommodating Electric Vehicles on new and existing non-scheme connections
The overwhelming majority of any EV’s connected in rural areas are that they will be to Groups fed from an existing 15kVA transformer. The ability of the group to support one or more EVs will depend primarily on how far from the transformer the EV is and on whether there are any additional EV’s already on this circuit, as such loads will certainly clash. Thermal capacity of the 15kVA Transformer is less of an issue as Transformers are often lightly loaded – the smallest size used is 15kVA, so that even if only one customer wants a connection this sized unit is installed.
There are two types of Group developments. The first type arises where a single customer looks for supply and the transformer is located adjacent to their premises. Subsequent customers are fed from this transformer over one or more circuits, depending on where they are positioned. The second type, less frequent, is where the initial development have grown significantly in customer numbers creating excessive volt drops. In such cases ESB will reinforce the network by splitting the group i.e. install a second transformer in such a position that it is central to the load it feeds, so that there are two shorter feeders rather than one long one.
Obviously situations where groups have already been split will have less volt drop and more easily accommodate EVs.
A typical 95’s bundled conductor will have a 1% volt drop when the product of the load by the length reaches 722 kW.m, so that given 3.7kW as the charging peak of an EV and 2.3kW as the ADMD of a customer, the 5% Volt drop limit of 3,610kW.m will be reached as described in the scenarios below:
Note: The above calculations ignored voltage drop on services/aerials which connect the customer to the LV Backbone line. Such services are rated to have no more than 2% voltage drop at 12kVA, so that with an EV and an instantaneous load of 15.7kVA, the voltage drop will be about 2.6%. This could be considered if compensated for by allowing less voltage drop on the main i.e. instead of allowing 5% voltage drop restrict it to 4.4% for the assessment of acceptable distance from the Transformer of the EV charger.
Unrestricted Charging:
In this scenario, the 12kW peak of one customer can coincide with all other EV charging and also with the ADMD of the second customer.
Case 1:
One customer on 15kVA Transformer with one EV of 3.7kW and 50m from Transformer.
In this case if the EV is allowed charge unconstrained it will clash with the peak day load of 12kW, resulting in a combined load of 15.7kW and creating a volt drop once feeder length over 229m is reached.
So for those 15kVA transformers supplying a single customer there is little difficulty in connecting an EV.

Page 421 of 625
Case 2:
Two customers on 15kVA transformer, one of whom has an EV. Second Customer is 80m from customer in Case 1 above and on the same feeder.
Worst case will be when customer furthest from the transformer has the EV.
In such a case the kW.m will be [(12kW+3.7kW)*(80m)]+[(12kW +3.7kW+2.3kW) x 50m] which at 2,156kW.m is within standard.
Case 3:
As Case 2 but both customers have a 3.7kW EV
kW.m are then [(12kW+3.7kW)] x 80m +[(12kW+3.7kW)+(2.3kW+3.7kW))] x 50m which is also within volt drop standard similar to case 2, as the additional EV connected near the transformer has little impact on Volt drop. Supply goes outside standard when the distance from the fittest to the second customer exceeds 130m
Going further on the same feeder would result in excessive voltage drop for the last customer. In addition the voltage drop across the transformer would now exceed the design rating of 2.2% Volt Drop at full load as the transformer loading is 21kW. Thermally the transformer will also under stress.
(-all based on use of 95Al bundle for LV, older areas will use smaller conductors and breach voltage limits at lower distances)
Note: Electric Showers may have to be interlocked with customer’s EV in order to avoid clashing, but as interlocking of two electric showers is already commonplace this should not be an issue.
Charging after 23.00:
In this case the situation is somewhat similar to that which exists with existing customers, except that volt drops will be greater as the load will be 3.7kW instead of 2.3kW. So if the network is currently just within standard with the existing ADMD distribution, then at night when customers would use 3.7kW for each EV, the volt drop would be 50% greater. The thermal limit on the transformer would be met with 4 EV’s.
The volt drop limit would be met if there were only 3 EV’s on the one Feeder with the fourth on a separate feeder.
So if charging is limited to night time charging those transformers already feeding 4 customers or less could also accommodate 4 Electric Vehicles. If more customers were fed from the transformer then the transformer cyclic load would be exceeded.
However the limiting criterion is not then the transformer capacity per se, but the volt drop on the customer network fed from the transformer. Typically a transformer would tend to be located equidistant from customers in order to minimise voltage drops, so that a two customer transformer might have up to 200m of LV running in two directions to feed two customers, with the volt drop on each being due to a single customer. Once past 2 customers however it is likely that there will be 2 customers on one feeder, and that the furthest customer will be more than 200m distant.

Page 422 of 625
So as detailed in WP 4.3, it would be reasonable to expect that about 20% of the Trafo. Population could accommodate 1 – 2 ESVs but the remaining 80% would require some reinforcement.
4 Network Reinforcement
To accommodate greater numbers of Electric Vehicles on Rural Groups some reinforcement would be required, but this would likely occur in networks which have 4 or more customers. Such networks are likely to require reinforcement in the future in any case as the recommended loading for a 15kVA transformer is 5 Equivalent customers (- some existing customers may be holiday homes, cow sheds etc. with low kWh usage so that their impact on volt drop may be low.)
The normal method of network reinforcement is to ‘split the group’ whereby an additional transformers is located central to the load group, taking into account the fixed location of the existing 15kVA transformer, thus dividing the existing group into two parts, each of which has an optimal volt drop for the configuration available. As such a group split would halve the typical distance from the Transformer to the EV it would allow the installation of additional EV’s, as well as providing a solution to imminent existing voltage problems.
Alternative solutions such as the use of Pole Mounted LV Voltage Regulators could also be consider but have limited lifetimes due to the use of electronics (10 years) and do not provide any additional thermal capacity to the transformer. Hence they are not an economic solution compared to splitting the LV Group.
The MV Network is unlikely to require reinforcement particularly if at 20kV unless there was very widespread penetration of EV. This is unlikely as the range of EV’s will tend to limit their usage to those networks near towns which are within the range of Rural EV users.
5 Reconductoring to 95’s bundle
Uprating the existing conductor size is only worthwhile if it is required to be replaced anyway, as restringing with 95’s bundle may also require additional poles due to different span lengths. Such judgements will be required to be made on a case by case basis.
6 Load Control
Load control of EV Charging is worthwhile when it is simple and confines EV Charging to periods where it does not coincide with normal day customer loads. However any more sophisticated version is clearly not worthwhile initially, as it’s use would only pay in groups requiring more than 4 EV’s and these are seen to be groups which are likely to require reinforcement in the future, at which stage the load control investment becomes stranded. In addition, as time passes Load control will become available as standard on appliances and will be available at marginal cost for use in relation to DSO (see WP 4.2).
7 Summary
In rural areas only those customers within EV commuting distances of work will find it worthwhile to buy an EV so that EV usage from overhead networks will be concentrated around urban conurbations. This reduces the likelihood of a large proportion of the overhead LV network requiring reinforcement to cope with increased EV penetration. However if the battery capacity increased substantially beyond 24kWh this could change.

Page 423 of 625
There are two limits to feeding EV’s from 15kVA Pole Mounted Transformers, volt drop and transformers capacity, as the 3.7kW loading of an EV is a significant proportion of the transformer capacity. However many rural 15kVA Transformers are lightly loaded with 50% of all transformers having three customer or less connected. This means that as long as the EV’s are reasonably close (50 - 140m) to the transformer they can accommodate EV Loading of 2 EV’s within volt drop limits, and, due to the significant diversity with rural transformer loadings, can also be accommodated within the transformer rating, regardless of when the charging takes place. Where older conductors less than 95’s bundle have been used to offload the 15kVA the distances within which voltage standards will be maintained will be less.
If EV Charging is confined to night time so that it does not clash with day load then the 15kVA Transformer can accommodate up to 4 EV’s as long as they are within a reasonable distance from the transformer. This means that 8% of rural 15kVA Transformers could accommodate 4 EV’s of 3.7kW each.
Where reinforcement is required it will first come about in groups of more than 4 customers where load reinforcement is likely to be required in the future anyway, so that traditional splitting of the group will the most cost effective choice, as the reinforcement will improve voltage generally as well as providing capacity for additional EVs.
Finally, the benefits of load control, other than charging at night, are very limited as most groups will already accommodate EV’s and those that don’t are likely to require reinforcement in the future anyway, thus stranding and load control investments.

Page 424 of 625
Work Package 5.1
Parameterised Models to Support DUOS
Impact Analysis Confidential

Page 425 of 625
Table of Contents
1 Background to DUOS .........................................................................................................426
2 Parameterised Model ..........................................................................................................426
3 Conclusion ...........................................................................................................................431
4 Appendix 1 Paramaterised Model .....................................................................................433

Page 426 of 625
1 Background to DUOS
Distribution Use of System (DUOS) is the method approved by CER by which the costs of providing Distribution Network infrastructure are recovered from customers in a fair and equitable way, under the regulation of CER.
Essentially all costs related to customers can be broken down into those costs which customers pay directly (e.g. the cost of connection of a new house) plus the costs of network reinforcement, development, maintenance and operation, which are generally recovered from DUOS charges on each unit of electricity (kWh) sold i.e. at a high level DUOS = Total Network Costs/Total kWh.
The addition of Electric Vehicles would have a twofold effect – an increase in the Network costs associated with any reinforcement required for EV connection, plus an increase in the number of kWh sold.
If the increase in extra kWh sold outweighs the extra cost from EV connection then average DUOS will decrease.
As Electric Vehicles have a high usage of electricity in proportion to their extra load on the network it would be expected that the overall impact from expected EV connections will be neutral or involve a slight reduction in Average DUOS, as Network Costs are largely fixed and using such an asset more intensively simply reduces average costs.
From a societal viewpoint it is unimportant how the overall costs associated with EV’s are split between those costs charged directly to the customer and those which are borne generally by DUOS, as these are issues associated with the distribution of costs between customer classes rather than about whether for customer as a whole usage of Electric Vehicles increases or decreases DUOS. For simplicity and conservatism, it will be assumed that all connection costs, metering and Network reinforcement are fully borne by DUOS.
2 Parameterised Model
The model for DUOS costing is set out in Fig 1, below and is based on the following assumptions regarding Electric Vehicles:
(a) That Electric Vehicles use 3,000kWh pa (b) That Investment required is pro-rate with numbers of EV’s installed (c) That 2% penetration is achieved in 2020 and 15% in 2030
To indicate the impact of EV’s on DUOS the current kWh usage and revenues are assumed constant, with any variations in kWh usage and costs coming from EV usage. All metering costs are assumed to be included in DUOS rather than paid by Customer directly.

Page 427 of 625
Fig. 1 - Variation in DUoS over time
Fig. 2 - Variation in DUOS when EV consumption is 3,530kWh instead of 3,000kWh
There are four variations modelled, as shown in Figs 1 – 4.
-1.00%
-0.75%
-0.50%
-0.25%
0.00%
0.25%
0.50%
0.75%
1.00%
1 3 5 7 9 11 13 15 17 19 21 23 25 27 29 31 33 35 37 39 41 43 45 47
% D
UO
S C
han
ge
%Change in DUOS over time

Page 428 of 625
In Fig. 1 costs decrease for the first 10 years as Revenue from EV’s reduces the average more quickly than extra units from EV’s can decrease it. After year 10 the impact of extra investment is seen and is introduced between years 10 and 15, resulting in an increase in DUOS by 0.6% in year 17, followed thereafter by a year on year decrease as no further investment is projected, as EV penetration has peaked at 15%.
In Fig 2 a small increase in expected consumption from 3,000kWH to 3,530kWh reduces the peak
increase in DUOS from 0.6% to 0% or less, indicating the sensitivity of the model to small changes, as costs are hovering around 0%.
Fig. 3 - DUoS Variation if customers pay for meter/no meter mandated
In Fig 3, it is shown that if customers pay directly for the meter required by the EU Directive then DUOS is continually decreased – this is because the overall cost of the investment has now decreased by about 20%, as every EV was expected to have a meter, whereas only 15% of cases required any reinforcement.
It is noteworthy that the model is so sensitive to the average consumption per Electric Vehicle, as the consumption used in the above analysis at c. 3,000kWh is based on the consumption of ESB supplied Electric Vehicles at the ESB Research site at Roebuck Downs, which is an urban location about 7km from the city centre, and where residents were provided with an EV for test purposes.
Users who purchase their own EV tend to do so for economic reasons, as it is much cheaper to run, and hence they have greater mileage. Similarly as batteries get larger it can be expected that EV

Page 429 of 625
users will drive slightly faster, use heaters and in car entertainment to a greater extent, and hence increase their kWh usage, which is currently closely monitored due to ‘range anxiety’.
Surveys undertaken by Amarach consulting on the driving behaviour of EV Drivers in Ireland for the EU Project Ten-T EA (Action 2011-EU-92145-S Dublin, October 2014)
indicated that driving mileage was increasing year on year as ‘range anxiety ‘decreased and as more drivers with higher mileage requirements found EV purchase an attractive proposition.
Table 1 - EV Distance per week – weighted average of 16,800km pa
Using 0.21kWh/km for conversion purposes, an annual mileage of 16,800km corresponds to 3,530kWh pa.

Page 430 of 625
Fig. 4 - DUoS Variation (incl Meter) if Clustering were 12% instead of 15%
In Fig 4 DUOS breakeven occurs when the overall costs (including metering) of reaching 15% penetration show breakeven if Investment costs are reduced from €257m to €215m, corresponding to a change in the estimated clustering level from 15% to 12%.
All of the modelling is based on SEAI figures of 2% penetration by 2020 followed by 15% penetration by 2030, however if 15% were not achieved until 2035 instead, then the variation of DUOs would be as shown in Fig 5 below:

Page 431 of 625
Fig. 5 - Variation in DUOS when 15% penetration occurs in 2035 instead of 2030
As the EV usage is less but the expected investment is similar, there is an increase in DUOS of about 0.9% which then decreases as further EV’s come on line.
The actual model used is described in Appendix 1
3 Conclusion
The modelling of the impact of EV’s on DUOS charges is generally to reduce average DUOS, and in the worst case peaked at less than 1% after 20 years. The modelling has been done conservatively and it is seen that a change from the conservative 3,000kWh pa (used in the urban testbed at Roebuck Downs) underestimates significantly the usage of those users who actually buy cars (3,500kWh), and has a significant impact on reducing average DUOS.
Similarly if 12% instead of 15% clustering occurs there are significant decreases in DUOS.
Opex costs have not been included as these are not expected to be significant as the reinforcement costs have low Opex intensity – generally transformers and cables, added mainly to existing networks which already bear Opex.

Page 432 of 625
Finally, the above models generally include all metering costs which are generally borne by customers directly – without such costs (which are significant at 20% of overall Capex) the impact is to generally reduce DUOS below current levels.
From this analysis it can be expected that adaptation of Electric Vehicles as described in more detail in WP 4 can generally expect to be DUOS neutral or possibly result in a reduction in DUOS.

Page 433 of 625
4 Appendix 1 Paramaterised Model
DUOS Modelling work by establishing the kWh growth pattern and matching the Capex investment to the growth in load.
However in terms of the impact of the Capex investments on DUOS, these are amortised over the life of the investment, which, for reinforcement, is 45 years.
Accordingly the Investment is added to the Rateable Asset Base (RAB) and depreciated each year. In addition a Weighted Cost of Capital is applied to the RAB each year to preserve the value of the Asset Base.
This means that the cash flows to be funded each year from the Capital Investments comprise of the Depreciation Charges and the Interest on Investment outstanding.
This results in the impact of network investments being spread over long periods of time, as such network components have long asset lives and produce a certain return.
In turn this means that there are no significant ‘shocks’ to the Unit Price, even from relatively large network investments.
The payment of the Depreciation and Interest charges is applied by allocating such charges in proportion to the number of kWhs passing through the networks.
This results in the average DUOS decreasing with increasing kWh usage – essentially a fixed asset (the Network) is being used more intensively, resulting in a similar DUOS income at a slightly lower average DUOS Unit cost.
Note: For clarity, inflation has been assumed to be zero and existing kWh usage maintained constant, so that only the impact of increased sales and investment from Electric Vehicles appears.

434
Appendix 1: Model of DUOS impact of Electric Vehicles
EV Penetration Rate (2%) (15%)
2015 2016 2017 2018 2019 2020 2021 2022 2023 2024 2025 2026 2027 2028 2029 2030
0 1 2 3 4 5 6 7 8 9 10 11 12 13 14 15
Cum. No of Electric Vehicles (EVs) 750 1,416 2,082 2,748 3,414 4,080 24,100 44,100 64,100 84,100 104,100 124,100 144,100 164,100 184,100 204,000
MWh Consumption due to EVs 4,248 6,246 8,244 10,242 12,240 72,300 132,300 192,300 252,300 312,300 372,300 432,300 492,300 552,300 612,000
Annual Investment 1.78 0.84 0.84 0.84 0.84 25.22 25.20 25.20 25.20 25.20 25.20 25.20 25.20 25.20 25.07
PV of Annual
Cumulative Investment discounted 0 1.8 2.6 3.5 4.3 5.1 30.4 55.6 80.8 105.9 131.1 156.3 181.5 206.7 231.9 257.00
Annual Investment 0 1.8 0.8 0.8 0.8 0.8 25.2 25.2 25.2 25.2 25.2 25.2 25.2 25.2 25.2 25.1
Incremental Inv by (1+ Wacc) 1.9 0.9 1.0 1.0 1.1 33.7 35.3 37.1 38.9 40.8 42.9 45.0 47.2 49.6 51.7
Opening incremental RAB 0 1.87 2.76 3.67 4.61 5.58 39.17 73.83 109.68 146.81 185.30 225.25 266.77 309.95 354.91
Addional Investment 1.87 0.92 0.97 1.02 1.07 33.70 35.34 37.08 38.92 40.85 42.87 44.99 47.22 49.55 51.75
Additional Depreciation - 0.04 0.06 0.08 0.10 0.11 0.67 1.23 1.79 2.35 2.91 3.47 4.03 4.59 5.15
Incremental Closing RAB 1.87 2.76 3.67 4.61 5.58 39.17 73.83 109.68 146.81 185.30 225.25 266.77 309.95 354.91 401.51
Revenue Requirement
Reurn on investment 0.05 0.11 0.16 0.20 0.25 1.11 2.80 4.54 6.35 8.22 10.16 12.18 14.27 16.46 18.72
Return of investment - 0.04 0.06 0.08 0.10 0.11 0.67 1.23 1.79 2.35 2.91 3.47 4.03 4.59 5.15
Incremental Revenue requirement 0.05 0.15 0.22 0.28 0.35 1.22 3.47 5.78 8.14 10.57 13.08 15.65 18.31 21.05 23.88
PV Value of Revenue Requirment 252 0.04 0.14 0.19 0.23 0.27 0.91 2.48 3.92 5.27 6.52 7.69 8.77 9.77 10.70 11.57
Present day Value of the CAPEX 257 1.78 0.84 0.84 0.84 0.84 25.22 25.20 25.20 25.20 25.20 25.20 25.20 25.20 25.20 25.07
GWH Distributed
With EVs 22,805 22,807 22,809 22,811 22,813 22,873 22,933 22,993 23,053 23,113 23,173 23,233 23,293 23,353 23,413
Without EVs 22,801 22,801 22,801 22,801 22,801 22,801 22,801 22,801 22,801 22,801 22,801 22,801 22,801 22,801 22,801
Revenue
With EVs 762 762 763 763 763 764 766 768 770 773 775 778 781 783 786
Without EVs 762.3 762.3 762.3 762.3 762.3 762.3 762.3 762.3 762.3 762.3 762.3 762.3 762.3 762.3 762.3
AUP
with EVs 0.033429 0.0334 0.0334 0.0334 0.0334 0.0334 0.0334 0.0334 0.0334 0.0334 0.0335 0.0335 0.0335 0.0335 0.0336
Without EVs 0.033433 0.0334 0.0334 0.0334 0.0334 0.0334 0.0334 0.0334 0.0334 0.0334 0.0334 0.0334 0.0334 0.0334 0.0334
% Difference -0.01% -0.01% -0.01% -0.01% -0.01% -0.16% -0.12% -0.08% -0.04% 0.02% 0.08% 0.15% 0.24% 0.33% 0.44%
Assumptions
1. 15% penetration of Electrical Vehicles in 15 years
=> 204,000 EVs by 2030
2 Annual kWh consumption of EV 3,000 ( WP 4.4)
3 CAPEX Investment for 204,000 EV Networks Costs €257 m
4 Assumed WACC for the period 4.95%
Data
D.1 No of Electric vehicles at 20% Penetration (2011) 272,000 (Table 2 WP 4.3)
D.2 2016 DUoS Revenue (€m) 762.3
2016 GWh Distributed 22,801
=> 2015 AUP{ €/kWh €0.0334
Year

435
Work Package 5.2
Real time data capture of typical charging
behaviour through commercial & domestic
scenarios

Page 436 of 625
Table of Contents
1 Introduction .........................................................................................................................437
2 Overview of Real Time Charging Data available to EV drivers ......................................438
2.1 On screen display on EV chargers .......................................................................................438
2.2 Smartphone Applications ......................................................................................................438
2.3 Charge Point Management Systems ....................................................................................439
2.4 Case Studies of Real Time Data Capture .............................................................................441
2.5 Dublin Airport ........................................................................................................................441
2.6 Roebuck Downs EV trial, South Dublin Suburban Housing Estate. .....................................443
3 Network Measurements ......................................................................................................446
3.1 Finesce Trial ..........................................................................................................................449
3.2 Plan Grid EV Trial .................................................................................................................450
4 Conclusion ...........................................................................................................................451

Page 437 of 625
1 Introduction
The ability to obtain information and data on the charging and habits of Electric Vehicle (EV) drivers is an essential by-product of the research and development of Ireland’s EV charging infrastructure. While the provision of a reliable and functioning chargepoint network for EV drivers to utilise is essential, the information captured from studying the user patterns and charging habits is key in providing ESB an insight into any future development of not only the EV charging network but also the distribution system as a whole.
Ireland’s targets for EV penetration are ambitious with an expected 50,000 vehicles of the road fleet being electrified by 2020.When one considers that the bulk of these vehicles will be charging at properties, be they domestic or commercial, the importance of research and data capture of charging habits is all the more pertinent. A local distribution grid will have significant load demands placed on it during peak evening time and the additional EV charging load coming on stream in the early evening /post commute could present issues for the system operators, if uncontrolled.
Additionally the demand for public infrastructure charging network is a specific consideration when considering the necessary expansion of public EV charging networks and or any associated incentives/tariffs to encourage the most efficient usage of the network.
The role of EVs in load shedding, demand response and as battery/storage for any utility will become more and more useful as vehicle numbers increase. As of June 2015 approximately 1000 EVs have been sold in Ireland with numbers and available brands of vehicle including PHEV (Plug –in Hybrid Electric Vehicles) increasing.
ESB are incentivising the adoption of EVs in Ireland by providing free home chargers to the first 2000 EV purchasers in Ireland, the bulk of these chargers are basic chargers with no data capture facilities. In the UK, the Office of Low Emission Vehicles (OLEV) also incentivises the purchase of vehicles by providing a grant for the installation of such chargers. It should be noted that the OLEV installations are required to record data on charging activities to OLEV. The responsibility for the collection of this data lies with the chargepoint supplier/installation company.
Overview of current charging technologies available to EV drivers in Ireland
AC/DC Fast/Rapid 40-50kW chargers o Have the capability to charge vehicles from 0% to 80% in c.30mins o Typically located off street in service area or car parks o Typically communicates to chargepoint management system and accessed via user
RFID/App access over GPRS M2M system o Connected to local distribution system
AC 22kW chargers
o Typically charge vehicles in from 0-100% in 1-8 hours o Located on-street or in service areas/car parks o Typically communicates to chargepoint management system and is accessed via
user RFID/App access o Connected to local distribution system
3.6 /7.2 kWh Home Charging Units
o Typically charge vehicles from 0-100% in 4-8 hours o Most Irish chargers are not fitted with communications protocols to monitor data. o Connected to domestic or host supply*
*In most domestic situations ESB Networks supply is capped at 12kVA per household. The ability to draw down greater
amounts is dependent on the charger and also the load within the house or property.

Page 438 of 625
As part of the fulfilment of work package 1.6 “Measure the Electrical Characteristics of EVs and Charge Points”, a series of power quality measurements were completed. The electric vehicles tested were the BMW i3, Mitsubishi iMiEV, Mitsubishi Outlander and Nissan Leaf (16 amp and 32 amp versions).
Five manufacturers of fast charge points were also tested. The tests consisted of starting a charging session and measuring and recording electrical characteristics such as voltage, current, frequency, power (real and reactive), power factor and harmonics. The results of the tests may be used for assessing the impact of current and future EV loads on the electricity distribution and transmission systems.
2 Overview of Real Time Charging Data available to EV drivers
There are a number of basic sources for real time data display /capture of charging activities for an EV driver.
2.1 On screen display on EV chargers
A number of chargers have LCD display screens which may show the cumulative energy, instantaneous current or duration of charging session. Figure 1 below shows an
Electromotive 165 22kW AC charger’s display when in use.
Figure 1: LCD display on an AC charger showing cumulative energy and instantaneous current during a charging session in real time.
2.2 Smartphone Applications
Most of the EV OEM companies now provide an associated EV user application for drivers to connect with their vehicle. This enables the driver to manage remotely their charging events such as remote starting and stopping of charging events, total energy consumption and remote use of heating/temperature control. These same applications can show the user the current status of a charging event in real time. The communications are possible via sim technology installed in the vehicle.
Examples of these tools are Nissan’s “Car Wings” and BMW’s “Connect” Applications. Pictured below are displays from charging events carried out on a Nissan Leaf and remotely reviewed in real time using the “Car Wings” smartphone App. The EV driver can review the status of the charge and

Page 439 of 625
available range in the vehicle. Additionally the systems can provide outputs to the drivers of total energy consumption of the vehicle to date and estimated range of the vehicle based on the driver’s habits to date.
Figure 2: Real time charging data from Nissan showing charging events
Note the increase in range from 112 miles to 136 over 12 minutes of charging and reduction in estimated time to complete charge from 1hr 30 to 1hr.
Figure 3: Screenshot of BMW’s connect App showing battery status
2.3 Charge Point Management Systems
While an EV user can view and access their charging information on mobile devices and displays on infrastructure, large amounts of multi user and multi asset data are typically connected to back office Charge Point Management Systems (CPMS). These asset databases can register customer details, payments, tariffs and chargepoint user sessions. Both the asset owner and users can view their charging events, energy consumption, associated costs via viewing portals for customers or operators.

Page 440 of 625
Figure 4: Example of CPMS User Portal Showing Usage Data
Figure 5: Sample of CPMS Operator Portal showing customers and chargers on the system.

Page 441 of 625
Figure 6: Sample CPMS analysis of Chargepoint activities on specific chargers.
2.4 Case Studies of Real Time Data Capture
As mentioned in the introduction, the management of the EV load demand for the DSO is of particular benefit. To be able to realistically predict usage patterns and assess the impact of the EV load, a number of trials were carried out in commercial and domestic scenarios to monitor energy usage of EVs, collect real time data of the charging habits and assess the impacts of such on the local grid. Three of these studies were carried out at:
o Dublin Airport Metered chargers of DAA Commercial Vehicle Fleet (Commercial) o Roebuck Downs Housing Estate, South County Dublin. (Domestic) o Finesce Trial in ESB head Office of 4 EVs used for ESB car sharing Pool (Commercial) o PlanGrid EV –Rural EV trial, Co. Limerick
2.5 Dublin Airport
Six standard domestic 3.6 kW chargepoints were monitored at Dublin Airport Authority (DAA) sites on the land and airside of Dublin Airport campus. DAA has 14 EVs as part of their management and maintenance fleet.
Real time charging data was captured and exported digitally to ESB Networks metering department using GSM in the individual meter boxes for the chargers. The data captured shows the voltage being drawn from the chargers at 15 minute intervals and was exported in csv files. Examples of the 15 minute epochs of usage is detailed below.

Page 442 of 625
Table of recorded EV chargers at DAA charger, Dublin Airport
The data has been collected continuously since December 2012.
ESB has been working with DAA to implement significant energy saving processes and measures across the airport complex.
Figure 7: DAA Renault Kangoo Van and charging bays at Dublin Airport Facilities Buildings, Swords, Co. Dublin.

Page 443 of 625
2.6 Roebuck Downs EV trial, South Dublin Suburban Housing Estate.
The electric vehicle field trial commenced in January 2011 and ran until March 2012. Based upon deterministic load flow analyses of the network, locations where EV charging was most likely to have the greatest impact were selected.
Initially, a Mitsubishi iMiEV was allocated to two customers in turn, each for a period of three months. From December 2011 to March 2012 a trial period with 7 EVs (approximately 10% penetration) took place. From this data it was possible to determine likely EV usage characteristics such as typical daily connection times and typical values for the Battery State Of Charge (BSOC) of the EV upon connection.
Analysis of a vehicle’s charge cycle has been carried out with the data provided from the field trials. A sample charge profile for a vehicle is shown in Figure 8. The dips in the charging profile, which occur at approximately 21:45 and 00:30, were found to be present for almost all vehicle profiles examined. The most likely explanation for these dips is that they occur due to an equalising of the stored energy in the battery cells at the beginning and at the end of the charging cycle.
Figure 8: Sample charge profile of a Mitsubishi iMiEV
Figure 9 shows a sample residential load curve over a day with and without electric vehicle charging. The effect of the vehicle charging is pronounced. The vehicle is charged during the night-time period as can be expected under a scenario where time-of-day pricing is in place. This is also the time period when the vehicle is most likely to be available for charging. The levels of demand seen during this time are not much greater than the evening peak experienced by this customer (~3 kW), indicating that the existing network would be able to accommodate initial penetrations of electric vehicles. However, if the charging took place during the normal evening peak this could lead to network issues such as excessive thermal loading or undervoltage. In addition, time-of-day pricing may lead to a high coincidence of electric vehicles charging, which could potentially lead to network limits being approached or breached, at certain times of the day.

Page 444 of 625
Figure 9: Residential demand profile over a sample day with and without electric vehicle charging
During the field trials, data collection meters were placed at the charging point of each EV in order to record information about electric vehicle charging characteristics independently of the EV user's residential load. Each meter recorded the active power demand at the EV charging point. From the recorded data it was possible to determine likely EV charging characteristics such as connection times and BSOC upon connection. Figure 10 shows the distribution of recorded connection times for EV charging during the field trials. From this graph, it is evident that the majority of EV charging connections occurs after 4 pm each day with the highest probability of connection approximately occurring at 6.30 pm and again at 10.30 pm.
Figure 10: Probability distribution function of EV connection times recorded during the field trials.
Figure 10 provides information regarding the connection times for EV charging throughout the field trials. However, it does not provide information relating to the typical duration of the individual charging

Page 445 of 625
periods or the likelihood for the occurrence of coincident charging. Figure 11 shows the probability distribution function for the occurrence of EV charging on the network throughout a 24-hour period. While Figure 10 indicates a relatively high probability of connection for charging at approximately 6.30 pm, Figure 11 shows that there is a relatively low occurrence of coincident charging at this time. Instead, there is a steady increase in the level of coincident charging from around this time up until between approximately 10 and 11pm before decreasing steadily until approximately 4 am. These results may indicate that while there are some occurrences of EVs being connected for charging upon arrival home from the workplace (assuming typical business hours), the duration of charging combined with some evening journeys result in the maximum coincident charging occurring between 10 pm and 11 pm. From Figure 11 it is evident that the majority of EV charging occurs from 8 pm onwards reaching a peak at 11 pm, which may indicate that EV users will typically do most of their charging following their last trip of each day.
Figure 11: Probability distribution function for the occurrence of EV charging over a 24-hour period
Figure 12 shows the distribution function of the recorded daily energy requirements of the EVs during the field trials. Each EV used in the trials had a battery capacity of 16 kWh. From Figure 12 it is evident that there are some cases when the total daily energy requirement exceeds the rated battery capacity. This indicates that there were a number of occurrences when an individual EV was connected for charging at least twice within one 24-hour period. The figure also shows that the most common daily EV energy requirement was between 8 kWh and 9 kWh, which is approximately half of the rated battery capacity of the EVs. Occasions when the energy requirement of EV owners is close to zero or the rated battery capacity of 16 kWh are less frequent. A possible explanation for this may be that EV owners are reluctant to allow their EV battery to approach full depletion while also deciding not to charge if the BSOC is above approximately 75%.

Page 446 of 625
Figure 12: Probability distribution function for the daily EV energy requirement
3 Network Measurements
The power quality meter installed at the 10/0.4 kV transformer to record 30 second resolution data provides a picture of the overall loading on the feeder. Figure 13 shows the 24-hour demand profile (kVA) which contains the maximum feeder demand from the recorded data. The demand of 65.85 kVA occurred at approximately 7.15 pm on a weekday evening in November. The corresponding voltage and current profiles from a smart meter located at the remote end of the feeder are provided in Figure 14. It is evident from this figure that the voltage experienced by this customer around the time of the maximum feeder loading is close to the lower acceptable limit of 0.9 pu (207 V). The actual recorded minimum voltage for this customer was 0.912 pu (209.8 V).
Figure 13: Profile of total apparent power on network feeder showing peak demand of 65.85 kVA occurring at approximately 7.15 pm

Page 447 of 625
Figure 14: Voltage and current profiles for a household at remote end of feeder for the 24-hour period shown in Figure 13.
The smart meters used throughout the trials had the ability to record average, maximum and minimum values for current, voltage and power over 10 minute time steps. Data gathered over the course of the trials has shown that in some cases it is important to consider the average, maximum and minimum as the difference in the values within a ten minute period can be significant. Analysis of the smart meter measurements showed that the lowest customer voltage did not necessarily occur at the same time as the maximum feeder demand. There were also a number of occurrences whereby the minimum voltage levels recorded in a ten minute period at certain customer households were below the lower acceptable limit, in one case as low as 0.884 pu (203.3 V)17. For example, in Figure 15 the value for the average voltage at approximately 7 pm was recorded as 0.925 pu (212.8 V) which is above the lower acceptable limit of 0.9 pu. However, the corresponding value for the minimum voltage level recorded within the same 10 minute period was 0.895 pu (205.8 V) which is below the lower acceptable limit. The corresponding maximum current profile of the customer is also shown.
17 It should be noted that the EN50160 standard governing power quality specifies maintaining supply voltage within the limits on the basis of ten minute average values.

Page 448 of 625
Figure 15: Voltage and current profiles for a household showing an example of the minimum voltage falling below the lower permitted limit of 0.9 pu
Another example is shown in Figure 16 which displays the recorded average and maximum current readings for a household over a 24-hour period. Figure 17 shows the difference between these two measurements over the same period. The greatest difference between the two recorded values in this example occurred at 8.10 am and was found to be 22.6 A. Given that the average values for the maximum and average current over the 24-hour period were 8.9 A and 5.1 A respectively, a difference of 22.6 A between the two measurements is relatively significant and due consideration for such differences should be given when analyzing such data.
Figure 16: Example household current profile showing maximum and average current measurements over a 24-hour period

Page 449 of 625
Figure 15 and Figure 16 highlight that even within a ten minute period there can be a significant variation in demand. In particular, the average loading or voltage recorded within a period may indicate that it is comfortably within standard, but there may be short term loading spikes which push the voltages below the lower limit for a short time. The nature of LV networks is one of individual demand profiles that do not have the benefit of aggregation that analysis of higher voltage networks benefit from. The usage of a high power device for a short time will not always be captured fully in a ten minute window. This may pose unforeseen issues with the continued drive towards integration of new residential energy resources.
Figure 17: Difference between the maximum and average current measurements of the profiles shown in Figure 16.
3.1 Finesce Trial
This project utilised ESB’s 5 x EV car pool chargers in their Head Offices in Dublin.
Shown in Figure/Table X is data from the chargers in ESB Head Office
o the data consists of the energy consumed by the charger every 15 minutes o the expected 15 minute power values are ~650W(iMiev)/850W(non-iMiev) o the energy readings that exceed the expected values are a result of a loss of comms. These
readings are the sum of energy consumed for the period of the loss of comms
The FINESCE project is an EU funded smart energy project, supporting the EC’s FI-WARE programme, with several trial sites across Europe. Two trials are currently being developed in Ireland. The project is due to be completed in September 2015. One of the Irish trials, WP5 Stream 1, involves the development of a Charge Optimisation System (COS) which looks to ensure that large-scale coordinated interruption and continuation of electric vehicle charging will not disrupt the local distribution network. Stream I has several major applications of this concept, in the control of future electricity grids, including the ability to develop flexible and rapid responses to grid emergencies while

Page 450 of 625
minimising customer impact; the ability to balance volatile renewable supply and EV demand, to minimise CO2 emissions; the ability to manipulate inter-regional power flows to avoid the high costs of future power link upgrades; ability to provide energy markets with an additional control capability; and to offer individual customers and service providers more information and control of their electric vehicle charging applications.
The FINESCE WP5 Stream I trial site is an integration of public and private test-bed facilities in Ireland. It is primarily operated and supported by ESB as an industry partner and Waterford Institute of Technology /TSSG as an academic partner and, as such, it makes use of existing infrastructure from HEAnet (Ireland’s National Research and Education Network) to provide interconnection services. WP5 partner organisations, such as ALUD, RWTH and Ericsson can connect to the test-bed platform via WIT using the FINESCE API. Two kinds of wireless access technologies are being evaluated during this trial: WiMAX and LTE.
The heart of the charging optimization system is located at WIT premises in Waterford, Ireland, hosting a central database containing all data collected during the trial as well as configuration data to be taken into account by the charging optimisation algorithm. The management and control software of the Electric Vehicle Supply Equipment (EVSE) are being developed and hosted by WIT Additionally an API is provided allowing access to trial data for internal partners to access the data.
Results of the recorded charging are tabulated in Table 2 below.
Table 2: Records of charging of EVs in Finesce Trial.
3.2 Plan Grid EV Trial
The demonstration undertaken by ESB on its networks as part of the PlanGridEV project aimed to examine the potential impact of electric vehicles on rural LV networks. Mitsubishi iMiev Electric vehicles were deployed to three of the four customers connected to the MV/LV transformer in Croom, Co. Limerick. A number of charging scenarios were completed during the trial, which ran over a number of months in 2015.
Charging restricted to 11pm to 7am.
Charging staggered so max of 2 EVs charging at any one time.
Unrestricted charging. Each provides insights into the behaviour and impact of different charging limits. The main sources of data were from smart meters installed in the homes of the four customers and energy meters installed at the charge points. At time of writing this report the results of PlanGrid EV project are not available but they will be made available to the commission on completion. The project results are due to be published in Q1 2016.

Page 451 of 625
4 Conclusion
There are various methods of capturing real time data on charging events for electric vehicles. These range from IT supported chargepoint management systems which can be accessed by EV users to real time apps showing charging rates. Additionally some on street infrastructure can graphically display charging levels when in use.
Additionally data capture of charging habits and cycles from meters in test environments such as Dublin Airport, Roebuck Downes Trial and the Finesce project has provided ESB with real time information from domestic and commercial customers which provide essential reference data for analysis of the impacts of EVs on the distribution system. As EV penetration develops further in Ireland, reliable charging data and driver habits will be of critical importance in designing appropriate networks and tariffs to maximise the benefits of EVs onto the network as a whole for both operator and customers.

Page 452 of 625
Work Package 5.3
Final Report on Project Impact of EV Rollout
on DUOS Charges

Page 453 of 625
Table of Contents
1 Background .........................................................................................................................454
2 Discussion ...........................................................................................................................454
3 Conclusion ...........................................................................................................................456

Page 454 of 625
1 Background
In WP 5.1 a number of scenarios were modelled, indicating the impact of various changes in assumptions on DUOS Charges.
The overall conclusion was that within the assumptions under which the project was undertaken, there was no significant impact of a rollout of up to 15% penetration by 2030 on DUOS charges – in fact under a number of assumptions DUOS Charges on average decreased as the extra revenue from EV Charging outmatched the Depreciation and Interest charges associated with the investments required.
2 Discussion
In WP4 a full description of how the network would be reinforced was outlined along with a set of assumptions and caveats associated with such reinforcement.
Following on from this the EV Project proposal ‘Preparation for EV’s on the Distribution System Pilot Project Implementation Document’ raises the issue in WP 5 outline of what factors could detrimentally impact network costs, including the impact of ‘dumb charging’ or 3rd party controlled charging, particularly where clustering occurs.
Such issues are not limited to EV’s but are also associated with 3rd party control of any similar loads such as Heat Pumps, Storage Heating and even Electric Water Heating as well as EVs,
The answer is simple and the same for all scenarios – if 3rd party control of Customer loads results in such loads switching on simultaneously then network overloading can occur and quality of supply standards could be breached. Reinforcing networks to avoid such occurrences would be wasteful, as such breaches are only likely to occur occasionally, so that the investment required to uprate the network would be excessive and provide a poor return to customers.
An alternative approach would instead be to only allow such switching when and where such problems are not expected to arise, thus allowing any available network capacity to be used as required, but not giving rise to any requirement for network reinforcement for worst case scenarios.
The simplest approach initially to such a situation involves the ESB ‘Servo’ concept, which arose from the EU Address project which covered such issues. Essentially the DSM Aggregator would have ‘Machine to Machine’ contact with ESB systems whereby, in real-time, signals for load switching would be checked and cleared through the ESB Servo DSM Control system before being progressed by the DSM Aggregator.

Page 455 of 625
Fig. 1 - Schematic of SERVO DSM Control System
If there were no Network constraints then permission is given, if there were then permission is withheld. In the event of a particular set of loads on an individual network section being generally unavailable for switching, it would be possible to examine such network and make a business case as to whether it was worth reinforcing.
Normally Domestic DSM Aggregators are operating stochastically to turn on/off large numbers of small loads and hence switch an aggregated target amount of load. Unavailability of loads for switching on a particular LV feeder would not be expected to be a major issue as other alternative loads on other feeders could be substituted.
Accordingly implementation of a system such as Servo would address concerns over load switching, not only for Electric Vehicles but also all other Electric Heating Loads.
Other issues which could affect Networks are the interaction of Heat Pumps, Electric Vehicles and Storage Heaters on the one set of LV Circuits, although this is a wider issue. However the approach to reinforcement outlined in WP 4 would still be applicable, and in fact reinforcement provided for Electric Vehicles would also facilitate the connection of other technologies such as Electric Heating.
Accordingly all calculations assume that general changes in ADMD for new housing estates and apartment blocks are treated separately for DUOS and Connection costing, as such changes in ADMD would take into account the impact of Direct Electric Heating, Heat Pumps, Electric Vehicles and self –generation and could not be ascribed to Electric Vehicles only.

Page 456 of 625
3 Conclusion
Electric Vehicles have been shown in WP4 to be capable of being accommodated on ESB Networks at penetrations of up to 20% without major reinforcement, and in WP 5.1 it has been demonstrated that for a range of scenarios (up to 15% penetration in 2030) the DUOS revenue from the Electric Vehicles in many case more than matches the extra DUOS charges associated with any reinforcement required.
Accordingly the use of Electric Vehicles on ESB Networks, within the terms outlined in WP4, is feasible and economic.

Page 457 of 625
Work Package 6.1
Chargepoint Integration and OCPP
Compliance

Page 458 of 625
Table of Contents
2 Background ........................................................................................................................459
3 Charge point Integration ...................................................................................................461
4 Charging Station Integration / Connectivity Issues .......................................................462
4.1 RFID UID Byte Ordering ......................................................................................................462
4.2 Missing Stop Transaction Notifications ................................................................................462
4.3 Charging Station Local List Support ....................................................................................463
4.4 Charging Stations and Off-line Support ...............................................................................463
4.5 Missing Usage Data when in Open-charge Mode ...............................................................463
5 Protocol Adaptors / Translation Mechanisms ................................................................463
6 Charging Stations Sending Multiple start / stop transaction messages .......................465
7 SOAP Namespace issues and OCPP version detection ................................................465
8 SMS Wake-up .....................................................................................................................465
9 Reliability of Charging Station Connectivity ...................................................................466
10 Reporting Charge point Status and Availability .............................................................466
11 Miscellaneous Issues ........................................................................................................467
12 OCPP Compliance ..............................................................................................................467
12.1 The Open Charge point Protocol .........................................................................................467
12.2 OCPP Compliance ...............................................................................................................468
12.3 ESB OCPP Compliance Procedures ...................................................................................468
13 Conclusion ..........................................................................................................................468

Page 459 of 625
1 Introduction
The ESB ecars pilot project requires large numbers of charge points spread over a wide geographic area to be connected to a centralised computerised management system known as the Charge point Management System (CPMS for short). The CPMS has the capability to remotely operate, manage and control the entire charging network in real-time, on a 24 / 7 basis.
In order for the entire system to function in a stable and integrated manner, each individual component must exhibit a high level of availability, should be reliable, and should be designed to the highest standards in terms of uptime and dependability. Always-on connectivity across all elements of the solution as far as is realistically possible is essential.
the lack of standards at all levels of the ecosystem is leading to much fragmentation, both on the electrical side – where multiple methods of charging have emerged, as well as in the information and operations technology areas – where integration protocols and specifications for data sharing and exchange have not yet been agreed upon, or are still extremely immature. This chapter will focus on the information and operations technology aspects, describing the complete set of end-to-end issues encountered by ESB ecars when integrating close to 1000 charge points with the Charge point Management System. It will also detail the procedure put in place to verify the level of OCPP compliance achieved / attained by each charge point model.
2 Background
A simplified view of the over-all physical system architecture of the ESB ecars IT systems solution design is shown below. The key concept is that it exists as a single inter-connected system; the user interacts with a charging station using an RFID card, the charging station communicates with the CPMS via OCPP over a private link established via a cellular network, and the CPMS carries-out all functions and activities involved in managing and operating the network.

Page 460 of 625
OCPP (Open Charge point Protocol) is a free, open standard application level protocol specification for communications between charging stations and central network management systems. It promotes openness, interoperability and is charging station and management system agnostic. It defines and specifies the various operations / functions to be provided by both entities, as well as the corresponding message content and formats to be exchanged. Built on top of standard Internet technologies – namely the traditional TCP/IP transport mechanism, it makes use of HTTP for message delivery, and SOAP or JSON to add structure. To date, 2 versions of the protocol have been released; version 1.2 in 2010, and version 1.5 in 2012. The next major update is version 2.0, due for release in early 2015.

Page 461 of 625
As part of procurement processes completed in 2011 and 2013, ESB ecars purchased charging hardware from various manufacturers – both AC and DC – which were subsequently installed throughout the country.
All charging equipment procured was explicitly required to implement and conform to the specific version of OCPP available at the time as specified in ESB’s tender document – primarily version 1.2 in 2011, and version 1.5 in 2013.
In tandem with the charge point roll-out, ESB ecars in conjunction with its implementation partner developed from the ground up, a back-office system - termed the Charge point Management System (CPMS). Built on OCPP, the system would manage and control the complete ESB ecars charge point fleet, irrespective of make / model of charge point, via a single web-based interface.
Year Manufacturer Type OCPP Version
2011 EBG AC 1.2
2011 Elektromotive AC 1.5
2011 EVEO AC 1.5
2011 Podpoint AC 1.2
2011 Siemens AC 1.2
2013 DBT DC 1.5
2013 EFACEC DC 1.5
2013 SGTE DC 1.5
3 Charge point Integration

Page 462 of 625
The process of configuring the physical charging stations to communicate and integrate with the centralised CPMS is known as on-boarding. Since the primary communications mechanism being used to provide connectivity is a GPRS-based cellular network, each charging station is required to be fitted with a suitably provisioned and configured SIM card. Once a secure communications link has been successfully established with a mobile carrier over a private channel, and the IP address and port of the CPMS configured via the software embedded in the charging station, OCPP message exchange between both entities can then take place. All aspects of charge point control, monitoring, and management are then under the direct control of the CPMS, and the charging station is said to be “on-boarded”.
4 Charging Station Integration / Connectivity Issues
4.1 RFID UID Byte Ordering
RFID cards are currently used by EV users to access the charging network. The card is presented to a charging station, which in collaboration with the CPMS determines whether authorization may be granted. In general, the mechanism of identifying RFID cards is via a 4 or 6 byte hexadecimal number known as an UID (unique identification number) stored in the internal persistent memory storage area of the card. This value is read directly by the card reading device on the charger, and subsequently processed against a list of approved cards on the system (which are in turn associated with user accounts). In certain situations, it was found that the value was being read and hence processed in different ways by the different charging station types. In one case in particular, the number was being read in reverse – essentially right-to-left as opposed to left-to-right. As a consequence, cards were unable to be recognised and thus access to the system was denied.
The problem was identified to be endianness related, a well-known concept in computing relating to the storage and transmission of data.
The most efficient solution was to implement the capability to “re-work” the UIDs received from all charging stations exhibiting this behaviour into the expected format within the CPMS. This made for a rapid resolution of the problem.
4.2 Missing Stop Transaction Notifications
The CPMS maintains a relationship with each charging station on the network. It continuously sends and receives messages from each individual device in order to construct and maintain an overarching view of the status of the entire system in real-time. Once a charging event is initiated, the CPMS considers it to be active until such time as it receives notification from the charging station that charging has been completed and that it is once again in “stand-by” mode and available for use.
In certain situations however, it has been found that the CPMS is not being informed when charging sessions have finished. This has serious implications for the central system – from the operational side it means that its internal view of the network is inconsistent with the actual real-time status of the devices under its control, and from a business / commercial perspective – it makes the process of customer billing impossible.
It would appear that the reason these notification messages aren’t being received is related to the behaviour of the embedded software on the charging stations when the communications link to the CPMS is lost. Charging stations are expected to retain the capability to operate independently (stand-alone or off-line) in such situations, and provide a record of all activities that took place during the outage period to the central system when communications is restored. This doesn’t appear to be happening consistently across all models.

Page 463 of 625
4.3 Charging Station Local List Support
Significant variation in the level of support for the use of local lists of authorized RFID cards by charging station vendors has been observed across the entire charge point fleet. Some units facilitate the storage of these lists in memory (either internal or via external storage devices), some maintain lists of previously used cards only, some allow updating via OCPP, some require updating to be done manually, some support differential updates, and some do not support the concept at all. In addition, each charge point vendor uses its own proprietary mechanism for specifying the lists, knowledge of which is often retained in-house. This fragmented, non-standard approach across implementations makes it extremely difficult for ESB ecars and its maintenance personnel to manage local lists across the entire network.
4.4 Charging Stations and Off-line Support
Charging stations are expected to have the capability to operate independently in the event of an issue with the communications link to the central system. They should function as normal, providing operations except those requiring explicit support / authorization by the CPMS. In particular, they should switch seamlessly between “on-line” mode and “off-line” mode, with little or no apparent change in behaviour being perceived by the user. Support for such seamless transitioning varies from charger to charger; some perform as expected, and others require manual intervention at the physical charging station in order to switch between the available modes.
4.5 Missing Usage Data when in Open-charge Mode
For operational reasons, it has been necessary to switch some charging stations to what is termed “open charge” or “tradeshow” mode for periods of time. This essentially allows the charger to be used by anyone, eliminating the need for any form of authorization or authentication. When in these modes, it has been observed that not all devices behave in the same way. Some continue to log each transaction locally, making it possible to replay these to a central system at a future time. Others record only a subset of the data – for example all usage information with the exception of the actual amount of energy used, making any subsequent data analysis more difficult and less accurate.
5 Protocol Adaptors / Translation Mechanisms
ESB ecars in its original charge point specification required all vendors to provide support for the OCPP protocol. It was envisaged that vendors would deliver this support via software implemented natively on each charge point. Whilst in the main this did turn out to be the case, in a minority of situations vendors chose to make use of an intermediate component to act as an adaptor / translation mechanism.
In one particular implementation, this protocol adapter exists as a software application owned by ESB ecars and operated as part of the CPMS. It provides a bi-directional conversion function, transforming messages between a proprietary protocol and OCPP. Charging stations continue to communicate with

Page 464 of 625
the central system in the traditional way via the existing M2M solution.
In another implementation, charging stations are configured to communicate directly with the central systems operated by the charging station vendor. The translation component located there adapts all messages to OCPP, before sending them over a secure server-to-server communications tunnel to the CPMS. Limited support for the reverse channel is also provided.

Page 465 of 625
6 Charging Stations Sending Multiple start / stop transaction
messages
When a charging session is successfully initiated or terminated by a charging unit, a notification should be sent to the central system informing it of same. This enables it to maintain and provide an accurate representation of network status and availability at all times. Over time however, it has been observed that various charger types are sending multiple notification messages to the central system. This is a particularly serious issue since matching start / stop messages is an essential part of accurately recording usage, which will ultimately provide the basis for end-user billing. Clearly, being able to verify the accuracy and validity of all time and meter related data is a fundamental requirement for any revenue-grade system.
In certain situations, phantom charging sessions have been witnessed at the central system, as a direct result of multiple start notifications being received and processed. These phantom events persist, since a matching stop message never arrives. This in turn leads to the central system maintaining an incorrect real-time view of the network. As a consequence, availability information provided to 3rd party systems or directly to end-users via live maps is of poor quality, and does not reflect the true state of the network.
It has proven extremely difficult to establish the root cause of the issue - in particular with regard to those notifications associated with starting a charge cycle. This is due primarily to the manner in which individual chargers handle customer behaviour – namely the presentation of RFID cards by users, or the physical act of connecting the connector to the charging unit or the electric vehicle.
7 SOAP Namespace issues and OCPP version detection
Since the charging network is comprised of hardware from multiple vendors, complete with their own individual characteristics and running their own particular flavour of embedded software, it is logical to expect that not all units will support the same version of the OCPP protocol. For this reason, together with the need to roll-out new features and continuously support the trialling of experimental functionality, it was necessary for the CPMS to have the capability to handle and support multiple versions of OCPP simultaneously. In theory, making this possible was relatively straightforward. The CPMS would listen for incoming OCPP messages at a single endpoint address, the inbound messages would specify the version in their header section, and the CPMS would process the message traffic accordingly.
As a result of differences in the way vendor implementations build their OCPP messages, the method of specifying the OCPP version number in the header was found to vary. In certain situations this meant that the CPMS was unable to parse the message correctly, and therefore processing would fail.
After carrying-out an exercise to detect and identify the particular make / models of chargers exhibiting the unorthodox approach to OCPP message formulation, it was decided to modify the CPMS to enable it to handle the alternative formats. This was deemed to be the most effective course of action at the time, given the time constraints and complexities involved in obtaining and rolling-out firmware updates to the actual charging units themselves.
8 SMS Wake-up
Charging stations are expected to support SMS-based functionality to facilitate a remote reset capability where the on-board software becomes unresponsive, as well as a mechanism for restoring connectivity to the central system in the event of a loss of the communications link with the cellular network (as prescribed by OCPP). To date, implementation of such functionality has been delivered by just one single charging station vendor. Furthermore, the solution provided although somewhat

Page 466 of 625
functional, is very much proprietary in nature, and does not conform to that specified by OCPP. For example - the protocol specification requires that either an empty SMS message, or one containing the internal identifier of the charger is sent directly to the charging unit in order to prompt it to re-initiate a connection with the cellular network and hence the central system. In the case of the implementation provided to us– SMS messages conforming to a vendor-specific syntax are required to initiate the desired action.
Clearly, to enable a single central system such as the CPMS to manage a mixed charge point fleet – as is the fundamental requirement – the need for a formal, standardised approach to SMS wake-up functionality is critical. Providing support for differing implementations on an ad-hock basis is unsustainable, and is in no way in keeping with the ecars philosophy of creating a charging network which is open, interoperable and facilitates plug-and-play of both charge points as well as central system components.
9 Reliability of Charging Station Connectivity
Since charging stations are connected over a cellular network, they are subject to the reliability, coverage and traffic / latency / speed / dependability constraints of such communications links. Even though chargers would be capable of operating periodically in off-line mode, the expectation is that this would be a relatively irregular occurrence.
Never-the-less, when the inevitable communications outages do occur, charging stations should be capable of gracefully and efficiently handling and recovering from them, whilst still providing the end-user with the ability to charge their vehicle as far as is practical.
Lengthy communications outages have been primarily identified in areas of intermittent or low signal quality. In some situations communications are never restored after an interruption occurs. As a direct result of the lack of support for SMS wake-up functionality, it is therefore often necessary to dispatch a maintenance engineer to perform a complete reset of the charger in order to restore normal behaviour.
Our current M2M telecommunications carrier provides a solution which allows charging stations to communicate exclusively over the carrier’s network, use of or “roaming” on networks of other operators in the Irish market is prohibited. Given the variation in network coverage and location of individual cell sites, it is perfectly reasonable to expect that some charge point locations may be better served by networks other than that of our current carrier. For this reason, efforts to add an internal roaming or what is termed “un-steered” capability to the existing M2M solution are on-going. Should these efforts prove fruitful, individual testing of each charging station model will be required to be undertaken in order to determine whether the units themselves are capable of seamlessly and intelligently switching between mobile networks. There hasn’t been a requirement to verify this type of functionality thus far, either by ESB ecars or by the charge station vendors themselves. It is therefore inevitable that further issues will be encountered during the testing phase.
10 Reporting Charge point Status and Availability
Charging stations are expected to report their status to the CPMS via OCPP Status Notification messages. This enables the central system to maintain an accurate picture of the live state of each charger and / or each individual connector at all times. The level of support for such activities has been found to vary significantly from charger to charger.
Some chargers never send status notification messages at all, instead relying on the CPMS to intelligently determine their state based on previous request / response message sets and / or function calls. Certain types of units report their status at the over-all charger level, whilst others provide the information for each individual connector. Depending on the context, the selected approach can prove advantageous, however the lack of consistency among implementations means that the CPMS is

Page 467 of 625
often required to do some additional processing in an attempt to compensate for this lack of standardisation.
11 Miscellaneous Issues
A further list of integration-related issues identified is given below, together with the component/s and / or protocol which have been identified as being responsible for the problem.
Charging Station: The embedded software / firmware – both in the main controller as well as the modem - in charging stations is quite immature, and is therefore susceptible to sporadic freezes / crashes. Direct physical intervention at the charger is required by support personnel in order to restore the unit to its normal working state.
Charging Station: certain models continue to send authorization requests to the CPMS after an RFID card has been found to exist in the local cache, and thus successfully validated. In this situation the sending of Authorize messages is incorrect behaviour, results in unnecessary data transfer, and has the potential to lead to additional charges by the mobile operator.
OCPP Protocol Specification: The specification (for all versions) makes extensive use of the words “may” and “should”. The non-binding nature of these words contributes greatly to many of the inconsistencies / differing functional implementations discovered across the installed charge point fleet.
Charging Station / M2M Solution / CPMS: Connections between certain models of charging station and the cellular network frequently drop due to large periods of inactivity. Sending OCPP heartbeat messages at regular intervals has been found to remedy this. However, decreasing the interval between heartbeats results in a greater number of messages being sent, which on occasion has flooded the CPMS causing significant performance degradation. All charging stations should be capable of maintaining open connections, in conjunction with support from the CPMS.
OCPP Protocol Specification / Charging Station: Certain vendors use the OCPP status notification messages to report potential issues (hardware or otherwise) with charging units. The specific format in which these error messages are defined is for the most part proprietary and charging station model specific. Furthermore, it has been our experience that the status reports can be somewhat inaccurate i.e. providing notification of an issue with a charge point which in reality does not exist.
12 OCPP Compliance
12.1 The Open Charge point Protocol
Having originated in the Netherlands in 2010, OCPP has emerged as the de-facto standard for charging station to management system communications, particularly in Europe. Version 1.2 was the first official release of the protocol, in February 2011. It defines a set of 9 operations to be implemented by a charging station, and a further set of 9 to be implemented by a management system. These operations cover user-centric activities such as authorization, initiation / termination of recharging, as well as energy / usage measurement. On the device-management side, activities such as configuration, diagnostics / troubleshooting, and firmware management are specified.
Building on the success of version 1.2, OCPP 1.5 was released in mid-2012, adding a further 7 operations. These facilitated the introduction of new features such as the ability to support charge point reservations, the management of RFID card authorization lists stored directly on the charging

Page 468 of 625
stations, support for the provision of clock-aligned meter readings, as well as the provision of a mechanism to allow for the implementation of experimental functionality agreed upon between charge station manufacturers and central system operators in a structured fashion. Version 1.5 is backward compatible with the older version 1.2.
Scheduled for public release in Q1 2015, version 2.0 is the next official major version of the protocol. It specifies a host of new operations, facilitating the implementation of functionality such as smart charging, pricing, and advanced device monitoring and control features.
12.2 OCPP Compliance
Due to the immaturity and somewhat open and ambiguous nature of the OCPP protocol specification, differences in both charge point and central system vendor implementations have emerged. The protocol began life by defining message interactions between charge point and central system, together with a set of operations / functions to be implemented by the entities involved based on the messages exchanged. However, many important implementation details were not formally specified, instead they were left up to charge station vendors to interpret and implement. This has resulted in the emergence of multiple non-standardised approaches to delivering key functionality, making interoperability a real challenge.
Specific dialects of OCPP are commonplace, particularly on the charge station side. Given that the end-to-end connectivity mechanism is built on a cellular network solution, it is inherently therefore subject to performance and reliability constraints and limitations as described earlier. As a consequence, identifying the source of what may be regarded as a miss-conformity, non-compliance, or simply a software bug was non-trivial.
12.3 ESB OCPP Compliance Procedures
Since OCPP is quite immature, formal, recognised compliance and certification processes haven’t as yet been defined. Furthermore, the testing tools needed to determine and evaluate interoperability do not yet exist.
For these reasons, ESB ecars devised a formalised procedure for charge point commissioning certification in collaboration with all its hardware manufacturers. The aim was to provide a structured methodology for testing and verifying the functional capabilities of the charge station units prior to delivery. In addition, the process mandated a thorough assessment and evaluation of the level of OCPP support provided by each unit to be undertaken, against both the manufacturers reference implementations, as well as against the ESB ecars CPMS. To ensure adherence to the process, and to guarantee the authenticity of the results, representatives from ESB ecars were involved at all stages of the procedure.
This process proved to be extremely valuable, demonstrating significant advantages for ESB – in terms of identifying potential system stability issues at an early stage, helping to distinguish between implementation issues on the charging stations as opposed to those internal to the management system, as well as providing clear evidence of areas for potential improvement / enhancement within the OCPP protocol specification itself.
Through its involvement in the OCPP Forum and more recently the Open Charge Alliance, ESB ecars has participated in various interoperability events such as plug-fests. These activities provided an excellent opportunity to test the level of compliance and effectiveness of OCPP support within its CPMS against implementations provided by 3rd-party charge station vendors.
13 Conclusion
The process of detecting and categorising issues with the over-all system has presented a significant challenge. Given the advanced nature of the solution, the relative immaturity of the technologies involved, and the evolving nature of the OCPP protocol, issues may exist for a variety of reasons, and

Page 469 of 625
have multiple route causes. Identifying problems is often challenging, can be time-consuming, and requires a considerable amount of technical knowledge. With the pending release of OCPP 2.0, and the ever-increasing levels of experience gained by charge point vendors in implementing OCPP-based solutions, the number of issues occurring is expected to fall considerably. In addition, tighter integration between CPMS systems and those of M2M providers will greatly enhance the dependability and reliability of the communications channels, eliminating an interface which has proven to be a source of much of the over-all system instability discovered thus far.

Page 470 of 625
Work Package 6.2
Implementation and Go-Live of All Island
CPMS

Page 471 of 625
Executive Summary
The CPMS (Charge Point Management System) is a software system used to manage, control and operate the fleet of charge points installed throughout the country by ESB ecars. Delivered from the cloud on a software-as-a-service basis, the solution is implemented as a set of Internet-powered applications, available to the user through a web-based interface. One of the first of its kind in the world, it leverages flexible, open standards (such as the Open Charge Point Protocol) to facilitate the integration of a wide-range of charge point hardware from multiple vendors. Based on a novel system design produced in house by ESB ecars following extensive research of the EV industry globally, the first release of the CPMS went live in late 2012.
Some of the features provided include the ability to remotely operate and troubleshoot charge points in the field, to authorise users to use the network (based on RFID card validation), to handle charge point hardware with differing designs (multiple plugs / outlets), and to roll-out software updates directly to charge points
Tailored interfaces are provided for different user groups so as to customise the range of features available, ensuring that each group sees only the information and functions most relevant to them. These interfaces or “layers” include one for each of the following user groups - call-centre personnel, charge point engineers, network owners / administrators, and EV users. In addition, tools are provided to allow for the monitoring of infrastructure usage, acting as input to future network planning activities.
The CPMS is today actively managing over 800 charge points on the ecars network, located at geographically diverse locations throughout the island. Additional functions are being added on an on-going basis to expand the systems’ capabilities and to meet the ever-growing needs of the industry and consumers.

Page 472 of 625
Work Package 6.3
The Intelligent EV Enablement Platform

Page 473 of 625
Executive Summary
ESB ecars together with IBM have designed and implemented the Intelligent Electric Vehicle Enablement Platform (IEVEP), an IT-based system capable of supporting the functions and services necessary to operate a scalable commercial business in the emerging electric vehicle industry. Built on proven enterprise-grade technologies from IBM and powered from the cloud, the platform has been developed to be flexible enough to meet the future needs and demands of the industry as it grows and matures.
It has been designed specifically to support a broad range of high-level back-office services including charging infrastructure asset management, customer provisioning and support, account management, rating and billing, payment processing, energy market settlement and international roaming. In addition, smart charging related activities together with those associated with balancing of the extra load placed on the electricity distribution system by electric vehicles are supported.
The IEVEP has the ability to integrate with the Charge Point Management System via a suitably engineered system-system interface. This facilitates the flow of data between both systems, allowing the higher-level functions to be realised by the IEVEP.
The over-all architectural design is modular in nature, leveraging multiple inter-connected components to deliver the complete set of services. These components include Sugar – a CRM system, a driver portal application (optimised for use by customers on mobile devices), and a billing engine (also known as the Core Transaction Processor).
Through participation in the EU-funded Mobi Europe and Green eMotion projects, the platforms strong data sharing and systems integration capabilities have been realised. International roaming was successfully demonstrated and real-time information on charge station availability was shared with 3rd parties in a standardised and automated way.
To date, ESB ecars are actively using the IEVEP on a daily basis for the purposes of customer fulfilment, network maintenance and customer service. This includes usage by the ESB ecars internal team, as well as by its call-centre and infrastructure maintenance partners.
The over-all solution represents a comprehensive all-encompassing system for the management and provision of eMobility services. It’s rich feature set, integration / interfacing capabilities and its extensive support for a wide range of data exchange protocols and formats have shown it to be extremely flexible. As a consequence of the slower than expected development of the EV industry in Ireland, only a subset of the functionality originally defined to be delivered has been implemented. Settlement processes, both domestically in relation to the energy market and internationally – with respect to the provision of roaming services, require further standardisation and agreement by the relevant stakeholders. In addition, customer billing and related payment processing activities are still being finalised by ESB ecars. Although not all the functionality specified was implemented, the extensive system design work undertaken remains relevant and will prove invaluable in future as the market develops.

Page 474 of 625
Work Package 6.4
Demonstrate Smart Grid Capabilities
Including Frequency Response

Page 475 of 625
Table of Contents
1 Introduction .........................................................................................................................476
2 FINESCE ...............................................................................................................................476
2.1 Project Description ................................................................................................................476
2.2 Trial Site ................................................................................................................................476
2.3 Applications ...........................................................................................................................478

Page 476 of 625
1 Introduction
ESB is and has been involved in many projects which demonstrated electric vehicle smart charging capabilities including:
Development of the smarted functions of the Charge Point Management System,
Roebuck Downes EV Trial (EPRI),
Enernet Intel Trial (MOBI.Europe)
Smart Charging in Amsterdam Arena (MOBI.Europe),
Soft Open Point (Green eMotion),
Inductive Charging (Green eMotion),
The projects above have been detailed in CER deliverables WP7.5 (Technology Report Green eMotion) and WP 7.6 (Smart Charging Report). Most of these projects focus on local smart charging. The smart grid capabilities of EVs have not developed at the pace of smart charging. A reason for this may be the low EV sales in Ireland (approx. 1000 as of April 2015) which has given little incentive to develop the necessary systems and business models required to implement smart grid capabilities.
2 FINESCE
2.1 Project Description
One of the few projects running in Ireland that deals with smart grid capabilities is FINESCE. A brief description of the FINENSE project is included below. Note that a more detailed description of the work is in WP3.1 (Report on Potential of Advanced Smart Home Charging).
The FINESCE (Future INtErnet Smart Utility Services) project is a two year EU funded smart energy project, supporting the EU’s FI-WARE programme, with several trial sites across Europe. Two trials are currently being developed in Ireland. The project is due to be completed in September 2015. One of the Irish trials, WP5 Stream 1, involves the development of a Charge Optimisation System (COS) which looks to ensure that large-scale coordinated interruption and continuation of electric vehicle charging will not disrupt the local distribution network. Stream 1 has several major applications of this concept, in the control of future electricity grids, including:
the ability to develop flexible and rapid responses to grid emergencies while minimising customer impact,
the ability to balance volatile renewable supply and EV demand to minimise CO2 emissions;
the ability to manipulate inter-regional power flows to avoid the high costs of future power link upgrades;
the ability to provide energy markets with an additional control capability;
the ability to offer individual customers and service providers more information and control of their electric vehicle charging applications.
Key Irish partners working on the projects are ESB Telecoms and Waterford Institute of Technology’s research institute TSSG (Telecommunication Software and Systems Group).
2.2 Trial Site
One of the trial sites is ESB’s Head Office in Lower Fitzwilliam Street. ESB has been running an electric vehicle car sharing scheme for staff using a fleet of Mitsubishi iMiEVs. Figure 186 shows the charging area and EVs.

Page 477 of 625
Figure 186 - EV Sharing Scheme in ESB Head Office
Initially the EVs were charged using standard “dumb” charge points. As part of the FINESCE project the charge points have been retrofitted with communications equipment and specific control modules. The retrofitted charge points are shown in Figure 187.
Figure 187 - Retro-fitted Charge Points

Page 478 of 625
In AC mode 3 charge points a control pilot circuit between the charge point and the EV exists. A PWM signal on this circuit can be controlled by varying certain resistances (control pilot to proximity pilot resistance). A change in PWM magnitude can change the charging state of the vehicle and can be used to increase or decrease the charging current.
2.3 Applications
The remote increase and decrease of charging load has been demonstrated and very fast system response times have been observed. This system is designed to be capable of taking TSO/DSO signals and subsequently varying quantities of EV load (if available). This would allow:
Tracking of EV load to wind generation thus maximising low CO2 emissions for transport,
Shedding of non-essential load (and minimising customer interruption) for system frequency events,
Local voltage control in weak networks.
It is noted electric vehicles form a part of Eirgrid DS3 system services program, particularly in the area of demand side management. The system developed as part of the FINESCE project will likely form a part of future smart grid capabilities in Ireland.

Page 479 of 625
Work Package 6.6
Development, Adoption, and Promotion of the
Open Charge Point Protocol

Page 480 of 625
1 Discussion
OCPP is an open standard application level protocol for communications between charging stations and central network management systems. It promotes openness, interoperability and is charging station and management system agnostic. First deployed in 2011, and originating in the Netherlands, OCPP has grown to become the de-facto standard in over 50 countries, and is today being used in over 10,000 charging stations globally. The specification is publically available, remains free to use, and has no associated licensing or usage costs.
ESB ecars became involved in the development of OCPP in early 2011, and was recognised as the first international partner to join the movement. Subsequent efforts to encourage its adoption resulted in the formation of the OCPP Forum, a group made up of industry players from across Europe with the common objective of further developing the protocol and encouraging its wide-spread implementation. The OCPP Forum was managed through a steering committee, with the technical work carried out in various working groups.
In mid-2012, building on the initial protocol specification, and based on the specific needs of ESB ecars amongst others, the forum released OCPP version 1.5. This included a number of new features which in particular would facilitate the roll-out of charging networks capable of supporting advanced utility-grade energy metering. Since then, the number of OCPP-based network deployments has grown considerably, with the benefits of openness generating broad industry consensus behind the protocol.
In late 2013, ESB ecars together with its partners the e-Laad Foundation in the Netherlands and Greenlots in the US founded the Open Charge Alliance. A formal organisation with strong governance structures, the Alliance is continuing the work of the OCPP Forum towards furthering the development, promotion, and uptake of OCPP, with the ultimate goal of positioning it as the de-facto standard for open, flexible and interoperable charging networks globally. In addition, the consortium aims to develop formal certification processes, together with a suite of compliancy tests and accompanying toolkit.
The next major milestone for the Alliance is the upcoming release of OCPP version 2.0 scheduled for 2015. This will introduce significant new functionality, such as the capability to calculate and display pricing information on a charging station, the ability to vary the power delivered during a charging transaction (“smart” charging), and a much richer and comprehensive set of device health monitoring and control features. In addition, this version also brings technical advances which promise to improve over-all network efficiency; lower operating costs, and contributes in a positive way towards guaranteeing interoperability and protocol compliance.
ESB ecars through its involvement in various initiatives both in Europe and further afield, has been actively promoting the work of OCA, and the benefits open and accessible charging networks bring to the EV industry as a whole. The entire network of 1200 charge points on the island of Ireland is built on OCPP, with charging stations from more than 10 different vendors being operated from a single central system serving as a real-world example of the significant advantages OCPP offers.
As a key member of OCA, ESB ecars participates at all levels of the organisation, and continues to be a strong supporter of its principles, philosophy, and over-all approach.

Page 481 of 625
Work Package 7.1
Interim Report on EV Charging in Green
eMotion

Page 482 of 625
Table of Contents
1 Introduction .........................................................................................................................483
2 Definitions ............................................................................................................................483
2.1 Drive Types ...........................................................................................................................483
2.2 Categories .............................................................................................................................484
3 Vehicle Evolution ................................................................................................................485
4 Charging methods ..............................................................................................................486
5 Use cases .............................................................................................................................490
5.1 Electric Assisted Bicycles......................................................................................................490
5.2 Buses ....................................................................................................................................491
5.2.1 Denmark Buses .....................................................................................................................491 5.2.2 Madrid Buses ........................................................................................................................493
5.3 Taxis ......................................................................................................................................498
5.3.1 Ireland Taxis ..........................................................................................................................498 5.3.2 Spain Taxis ...........................................................................................................................500
6 Conclusions .........................................................................................................................505

Page 483 of 625
1 Introduction
This report is titled “WP7.1 Interim Report on EV Charging in Green eMotion” and details the status of the EV market in the Green eMotion regions (predominantly Western Europe) as of the end of 2012. The report acts as a complementary report for WP7.2 “Final Report on EV Charging in Green eMotion.”
The report sets out the different type of EVs available on the market in 2012, their respective charging methods and particular use cases, specifically with regard to use in EV fleets, as opposed to personal vehicles.
2 Definitions
It is necessary to present a definition of the various terms and to describe examples of vehicle types. A Fleet Vehicle as described in this report refers to any vehicle, two wheeler or above used in connection with commercial or public business by a private company, public body or institute. It excludes any vehicle used solely for private purposes. The quantity of vehicles included within a fleet is not discriminated against. Every vehicle type from pedelec to cars, buses and trucks are represented in the fleets being evaluated. This report shows the progress of eMobility in fleets in Europe.
2.1 Drive Types
The following section describes the main drive types commonly found in fleet vehicles. The intention is to give a clearer understanding of the inclusions within technology types and the boundaries between them as used in fleet scenarios.
Zero Emission Vehicle (ZEV)
A vehicle that has no regulated emissions from the exhaust pipe or tailpipe. ZEV is one of the most important definitions from the point of view of developing enabling measures and legislation to support the uptake of EV’s. Both climate change strategies and the need to provide healthy cities for the future require reductions in CO2 and noise. Measures to address noise in cities are now being regulated by European Directive which has been transposed into national legislation throughout the EU.
European cities have a variety of ‘Toolkits’ available when it comes to regulation and the implementation of control measures to support the economic development of city centres. However, the potential enhancement offered by more widespread deployment of EVs has yet to be exploited in support of declared objectives. The availability of a variety of ZEVs across the range of vehicle types correlates the deployment of EV’s in fleets and climate change strategies especially for cities.
Battery Electric Vehicle (BEV)
The Battery Electric Vehicle is a vehicle which is powered by battery energy store only. The vehicle has no internal combustion engine, it is propelled by an electric motor, powered by a battery pack. The vehicle is recharged by connection to an external power supply and has no on board generation capacity.
Hybrid Electric Vehicle (HEV)
The 1990s definition of IA-HEA Annex 1 states that “a hybrid electric vehicle (HEV) is a hybrid road vehicle in which at least one of the energy stores, sources or converters delivers electric energy”. The International Society of Automotive Engineers (SAE) defines a hybrid as “a vehicle with two or more energy storage systems, both of which provide propulsion power, either together or independently”. Normally, the energy converters in a HEV are a battery pack, an electric machine or machines, and

Page 484 of 625
internal combustion engine (ICE). However, fuel cells may be used instead of an ICE. In a hybrid, only one fuel ultimately provides motive power. One final definition is from the UN, which defines a HEV as “a vehicle that, for the purpose of mechanical propulsion, draws energy from both of the following on-vehicle sources of stored energy/power: a consumable fuel, and an electrical energy/power storage device (e.g.: battery, capacitor, flywheel/generator, etc.).” A parallel hybrid is a HEV in which both an electric machine and engine can provide final propulsion power. A series hybrid is a HEV in which only the electric machine can provide final propulsion power. A series hybrid can also be termed a range extended electric vehicle (REEV).
Plug in Hybrid Electric Vehicle (PHEV)
A HEV with a battery pack with a relatively large amount of kWh of storage capability, with the ability to charge the battery by plugging into the electricity grid. This allows two fuels to provide the propulsion energy giving the possibility of extended ranges where necessary and at the same time benefiting from cleaner more efficient electrical energy from the electricity network.
Internal Combustion Engine (ICE)
Historically the most common means of converting fuel energy to mechanical power in conventional road vehicles. Air and fuel are compressed in cylinders and ignited intermittently. The resulting expansion of hot gasses in the cylinders creates a reciprocal motion that is transferred to the wheels via a driveshaft or shafts.
2.2 Categories
Electric Bike
With an electric bike, riding a bicycle is possible without pedalling. The motor output of an electric bike is activated and controlled by using a throttle or button. Human power and the electric motor are independent systems. This means that the throttle and the pedals can be used at the same time or separately. This contrasts with the pedelec (see below) which requires that the throttle and pedals must always be used at the same time. As a result, an electric bike is more or less used in the same way as a scooter or motorcycle rather than a bicycle. UK, Swiss and Italian regulations define the maximum motor power that can be used for an electric bike. More power categorises an electric scooter.
Pedelec
Pedelec stands for “pedal electric cycle”. While pedalling the cyclist gets additional power from the electric drive system. The control of the motor output of a pedelec is linked to the cyclist’s pedalling contribution by means of a movement or power sensor.
Electric Scooter or E-scooter
Small electric sit-down or stand-up vehicles ranging from motorised kick boards to electric mini motorcycles. Differences between the two types of small electric scooters are as follows: Stand-up scooters, instead of pushing the scooter forward with one leg, the rider simply turns the throttle on the handlebar and rides electrically. In contrast, sit-down scooters are small electric vehicles with a seat and are used much the same way as gasoline or petrol powered scooters. A throttle on the handlebar regulates the acceleration.
Car
Cars as described in this report are passenger vehicles up to 8 seats in addition to the driver, in accordance with European vehicle category M1. These can include ICE, or any of the electric drive configurations.
Van

Page 485 of 625
Vans as described in this report are goods vehicles with a maximum weight not exceeding 3.5 Tonnes in accordance with European vehicle category N1. These can include ICE, or any of the electric drive configurations.
Truck
Trucks as described in this report will be larger goods vehicles greater in size than the category Van. This includes European vehicle category N2 and N3. These can include ICE, or any of the electric drive configurations.
Bus
Buses as described in this report refer to passenger vehicles described in European categories, M2 and M3. These can include ICE, or any of the electric drive configurations.
3 Vehicle Evolution
In the year 2010 the Mitsubishi iMiEV came on the European market which became the starting point for the new generation of affordable electric cars in the EU. It was the first serious attempt to build an all-electric car based on the newest battery technology, Li-Ion. In the year 2011, the Nissan Leaf and the Renault Fluence ZE came on sale. All three cars offered good range at a reasonable price. For the new generation of electric cars the consumer can now look forward to longer range and lower prices on all-electric cars.
This new generation of electric cars offers a significantly higher standard for the building quality, compared to the previous models of electric cars on the market. The change from small scale production series up to large scale OEM production is one of the key changes in the electric car industry in recent years. More OEM built cars are on the way to the market and only a small amount of small scale producers of electric cars has survived and continue to provide reliable cost effective solutions.
The differences between the so called small scale production series or retrofit company cars and the OEM build cars are amongst others, that the small scale cars18 are often of poor quality– often with different types of malfunctions due to low quality management. Additionally, users experienced high maintenance costs due to limited service network and high prices on simple failures. Many of the vehicles exhibited limited range due to old battery technology and poor utilisation of the battery capacity as well as long charging capabilities (mode 1 charging).
For the retrofit versions the gearbox was often reused and replaced by a standard industrial motor, but similar to the small scale producers making fully designed electric cars, simple motor control units and battery management systems were widely used in the business. This often causes imprecise indications of the state of charge and with-it difficulties in knowing how far you could go. The battery itself was, up until 2011-12, often Lead-Acid or Nickel-Metal-Hydride batteries that did not have the range and reliability as the Li-Ion now has.19
The new generation of electric cars is seen to have overtaken the small production series, as the OEMs can offer significantly lower price, better quality, higher safety and longer range.
Strengths and weaknesses - OEM build electric cars
There are three distinct groupings available across OEM based electric cars; the all-battery electric vehicle (BEV), the plug-in hybrid (PHEV) and the range extended electric vehicle (REEV) which alternates between a conventional engine and a motor. The majority of EVs are BEVs with a small number of battery swap vehicles in circulation (such as in demonstration projects in Israel and Denmark).
18 http://www.ens.dk/DA-DK/KLIMAOGCO2/TRANSPORT/ELBILER/Sider/Forside.aspx 19 http://www.tva.com/environment/technology/car_batteries.htm

Page 486 of 625
The technical set-up of the PHEV and REEV is very different from the BEV. In terms of range the biggest advantage for the PHEV/REEV is that they can be measured with the best diesel cars on the market, where the BEV has a total range of avg. 100 to 160 km on one charge. Due to the fact that both drive technologies are installed in the PHEV/REEV, the price itself is significantly higher than for other competing technologies which also reflect the service costs being higher than for both BEVs and conventional cars.20
See (Table 24) below regarding the difference in charging methods.
Hybrid PHEV REEV SBEV FBEV
ICE
Electric Drive Mode
Generator
Recuperation
E-Boost Function
Energy Source 1 1,2 1,2 2 2,3
1 – Fossil Fuel 2 – Plug-in Electric 3 – Battery Swap (see section 4)
Table 24 - Vehicle Technologies
4 Charging methods
There are a number of charging scenarios relevant across the existing range of electric cars on the market such as; AC slow, AC fast, battery swap, CHAdeMO, Combo Charging System (CCS) which includes AC slow as well as DC fast charge on one connector and inductive charging (not commercially yet ready).
On the AC connector side the Type 2 connector has been widely accepted as the norm, supported at EU level in the Clean Power for Transport (CPT) directive. The directive also supports the CCS connector for DC fast charging, although the existence of a significant number of CHAdeMO vehicles on the road up until now leaves the need to maintain a charging infrastructure for this technology.
AC Charging
The most commonly used form for charging is the AC charging which can be facilitated in three modes.
Mode 1: In this charging mode a 16A EC plug is used and mostly by the “first generation” (late 1980-2009) of electric cars, having a small battery density and short range. Mode 1 charging is still seen for retrofit cars and small scale production models but is not seen on the second generation OEM build cars - except from OEM build micro cars with a very limited battery density. This is partly due to the fact that a small battery can be charged relatively fast and that the power of a micro car battery is not exposing any overload to the current level when being charged. However, for an average sized ‘Mode 1 car’ the charging can put stress on the current level pulling all the current the car can get. Where the current scenario is max 10-13A, often seen in for instance summer houses, charging up to 12 hours of max peak can potentially lead to dangerous hazards, especially since the typical Mode 1 charging set-up has no system to control the charging at the household plug end.
20 http://www.greencarreports.com/news/1018460_prius-repairs-cost-a-little-more-than-non-hybrids

Page 487 of 625
Mode 2: This mode is facilitated by a cable with an installed control box unit that limits the level of amps to be used for charging for the ‘Mode 3 car’. Certain boxes can be adjusted to a specific amp level while others do not facilitate this change. The typical max amp load is normally set at 8-12 A which at some point ought to prevent dangerous hazards as the box does not see what the limitations at the site are.
All Mode 3 supporting cars OEM build BEVs (FBEVs and SBEVs) and PHEV/REEVs can use this type of control box in charging sites where an EC industrial inlet is accessible. Mode 2 charging limits the max current and can be even slower than Mode 1 charging.
Mode 3: All OEM built cars being delivered now are supporting Mode 3 which is compatible with charging stations supporting IEC standards IEC 61851-1, 61851-21+22 and the 62196-2.
Single Phase Charging: This type of AC charging is and will be the most commonly used form for charging at home and at work. The most commonly known plug on the car side for both types of BEVs and PHEV/REEVs is the Yazaki plug (SAE J1772/IEC 62196-2 type 1) facilitating single phase charging at 16 or 32 amps depending on the vehicle. On the charging station side the Mennekes (IEC 62196-2 type 2) is the most used plug on the market in Europe (see also 3 phased charging). The Mode 3 single phase charging is ideal for BEV car fleet owners with very little need for recharging during the whole workday, which can either be set to charge approx. 5-6 hours (0-100 % at 16A) without being interrupted or with fixed charging during longer visits or breaks, depending on the frequency, but not less than 20 minutes. The charging time of the PHEV/REEVs is due to the significant smaller battery equivalent faster than the BEVs using approx. 3-4 hours (0-100 % at 16A).
3 Phase Charging: To meet the requirements from the consumers to lower the charging time, when charging in the day time, a 3 phased solution is now available with some vehicles such as the Renault Zoe. With the introduction of 3 phase charging the plug on both the car and the charging station side predominantly seems to be the Mennekes plug (IEC 62196-2 type 2) which facilitates charging at max 63A 500V21 and an easy to use interface in line with the CPT Directive.
Some charge point operators have set-up their charging infrastructure to support 3 phases as this set-up appears to be required in parallel with the DC fast charging system supported by the fact that the AC equipment can be installed at a low marginal cost. It will also give the car driver a remarkably higher service degree as a 3 phased mode 3 charging of an average sized electric car (22kWh) can lower the charge time to only 1 hour (and to 30 minutes with 80% state of charge (SOC)) making it attractive for fleet usage.
DC Charging
DC charging is used by a significant portion of BEV’s, these vehicles are predominately CHAdeMO with CCS starting to take a share of the market. DC charging makes it possible for the driver to charge the car in approx. 25-30 minutes from 0-80 % state of charge. Initially the OEM’s had included a limit of 1 DC fast charge a day in their warranties, however some of the OEM’s have now removed this limitation, indicating better confidence in the battery performance. DC charging as with AC fast charging provides a means of increasing the practical range of the vehicle through the fast replenishment of the battery. In Europe, CCS (IEC 62196) has received the backing of the CPT Directive.
Battery Swap
The introduction of the battery swap (or switch) technology is available in Denmark and in Israel covering both countries nationwide with the use of Renault Fluence ZE vehicles. An unofficial record set by Better Place Denmark (July 2012) demonstrated that thanks to the battery switch technology 2,399km could be driven in 24 hours (first attempt). This proves that the swap battery electric vehicle (SBEV) can act as a normal car when the battery switch infrastructure is in place in the area you operate. The cost of the SBEV is without the battery and thereby the risk and battery up-date is taken by the battery swap station operator. The battery swap station is able to handle multi battery pack sizes and can switch the battery in less than 5 minutes. The battery cost for the fleet manager could be lowered by offering a battery pack which fits to the needs and which can be swapped to a higher
21 The Smart ED has an on-board 22kW 400V charger

Page 488 of 625
density (same shape) at a higher price when needed. At present, battery swap is not progressing (with the main technology proponent Better Place no longer trading) with limited availability in any of the world markets.
Summary
The charging technology parameters are shown in the table below.
AC Charging Inductive Charging
DC Charging Fast Charge
Charging Power kW) 3.7 11 22 44 3,7 11 <20 < 50 60
Voltage (V) 230 400 400 400 230 400 450 dc <450 dc 400 dc
Current (A) 16 16 32 63 16 16 32 < 100 150
From SOC min (%) 30 30 30 30 30 30 30 30 30
To SOC max (%) 100 10 100 80 100 100 100 80 80
Charging time for 20 kWh (minutes)
230 80 40 20 230 80 40 20 12
Table 25 - Charging Technology Parameters

Page 489 of 625
A summary table for the EVs available on the market in 2012 is shown below.
Vehicle
Car Pedigree Charging Method
FB
EV
SB
EV
PH
EV
Serv
ice N
etw
ork
AC
Mo
de 1
AC
Mo
de 2
& 3
AC
/DC
Co
mb
o
DC
Batt
ery
Sw
ap
Bellier 1
BlueCar 1
FIAT / MicroVett e500 1 3
FIAT / MicroVett Fiorino 1 3
FIAT / MicroVett Doblo 1
FIAT / MicroVett Ducato 1 3
Fisker Karma 2
Garia 1
Mitsubishi iMiEV / Citroën C-Zero / Peugeot Ion
2
Mega City 1
Mercedes Vito e-Cell 2
MyCar 1
Nissan Leaf 2
Opel/Vauxhall Ampera 2
Renault Kangoo/Maxi ZE 2
Renault Fluence ZE 2
Renault Twizy 2
Reva 1
Smart ForTwo ED 2
Tesla Roadster 2
Think City 1
Toyota Prius Plug-In 2
1 – Small Service Network 2 – OEM 3 – Additional Choice
Table 26 - Characteristics of EVs on Sale in 2012

Page 490 of 625
5 Use cases
5.1 Electric Assisted Bicycles
Pedelec ‘Electric Assisted’ Bicycles, Cork (Ireland)
Cork City Council has introduced a small fleet of bicycles for use by staff during the day. Members of staff apply to be users and they can get access to keys and removable lights. In addition, the transportation division of the council has been making use of a Pedelec ‘power assisted’ electric bike which was purchased at the end of 2011. Cork City Council is also considering the purchase another Pedelec for the fleet this year to support the promotion of the benefits of GeM.
The electric bike is now being used on a regular basis by a Cork City Council technician to undertake site visits that previously required the use of a car. In fact, the site visits previously necessitated the use of a vehicle from the car sharing club. Trips of in excess of 12 km are being undertaken by electric bike to visit and inspect the installation of the Real Time Passenger Information (RTPI) system being implemented by the National Transport Authority (NTA). It has been noted by the user that in addition to extending the range of cycling, the enhanced ability to overcome the uphill gradients in Cork means this bike can be used were a standard bike would not be of interest. Details of the range and the battery capacity are provided with reference to the HERO eco Ultra Motor Hybrid A2B manufacturer’s brochure and Giant Cycles brochure:
http://a2b.ultramotor.com/en/a2b_hybrid_26
http://www.giant-bicycles.com/en-gb/bikes/model/twist.w/9359/55728/
Electric Assisted Bicycles Malmö (Sweden)
Electric bicycles are now in use in Malmö and it is planned to start to track the bicycles in August 2012.
About the use: City of Malmö has 30 electric assisted bicycles in its bicycle fleets. Those 30 bicycles are distributed at several departments of the city and used for various work related trips. The city is encouraging employees to use the electric bicycles instead of cars for trips within the city. In most of the cases the employee can make their own choice about what vehicle will be used for the trip. Malmö is a relatively small city with good bicycle roads and there is a good potential for increased use of electric bicycles for short / medium trips. Details of the range and the battery capacity are provided with reference to the ‘Goodwheelmanufacturers’ brochure:
http://shop.goodwheel.se/se/grp/elcyklar.php

Page 491 of 625
5.2 Buses
5.2.1 Denmark Buses
Movia - the largest public transport company in Denmark - has a fleet of 11 electric busses which run a fixed route, route 11A, in the inner city zone 1 in Copenhagen. The 11A route is 10.1 km long. A ride takes approximately half an hour if you go from Copenhagen Central Station to the bus terminus. The buses run between 11-13 times per day. On average each bus thus runs 130 kilometres per 24 hours. The buses run 7 days a week during the following hours; on weekdays from 7am till midnight, on Saturdays and Sundays from 9am till midnight. The buses run every 10 minutes during the day and every 20 minutes in the evenings. There are no breaks in the day. The total energy consumption per month of all the buses is between 18,000 and 20,000 kWh depending on the weather conditions.
The buses have nine seats and standing room for twelve. They have been converted by an Italian manufacturer and are only charged by charging points at the bus depot. The buses do not require preheating in the winter. Only e-buses run on route 11A, and unfortunately it is rather difficult to give examples with fossil fuel buses on the same route. The traditional buses in the City of Copenhagen run on diesel, and below there is a chart with an overview of the differences between e-buses and traditional buses in terms of room, weight and durability.
Seats Standing Room (#)
All-up weight
Dead Weight
Load Capacity
km/litre (average)
E-buses 9 12 5,950 kg 4,150 kg 1,800 kg
12 m diesel bus 34 37 18,000 kg 11,175 kg 6,825 kg 2.5
13.7 m diesel bus 43 61 2,0925 kg 13,400 kg 7,525 kg 2.5
14.7 m diesel bus 47 63 22,700 kg 14,700 kg 80,000 kg 2.5
Table 27 - Electric Buses vs. Diesel Buses
Maintenance costs
In this project, the operating costs of the e-busses have been more expensive than those of the diesel busses in all respects: The driving line cost per kilometre is higher, especially since the batteries are very expensive. There are 24 batteries in each bus, and the price of one battery currently amounts to EUR 3,500. Up to now, five batteries packs (i.e. 120 batteries) have been replaced. Furthermore, the cost price of e-busses is higher than that of diesel busses, as the supply is smaller. Repair costs are also higher due to the special technology, which is rather time consuming. Additionally, there is a much larger risk of breakdowns and slow fault clearance with e-busses, since the problems arising are not known. There is also a much larger residual risk when selling e-busses due to the fact that the e-technology is evolving rapidly, and therefore it is more difficult to sell an old e-bus compared to an old diesel bus. Lastly, the electric buses cannot tolerate water submersion of the lower carriage unlike ICE vehicles with high tailpipes.
Having mentioned the challenges above, it should be kept in mind that e-technology is constantly and rapidly evolving, which is why the price and product quality may also vary. E-buses should still be regarded and organised as a pilot project until sufficient experiences have been attained. However, this does not mean that there will not be an overall socio-economic benefit in the short term taking account of the impact on environmental pollution and noise etc.

Page 492 of 625
Below there are two tables respectively indicating the e-buses’ energy consumption per month and the distance travelled per month.
Date Total Energy (kWh)
Energy (since last reading) (kWh)
01-11-2009 23,940
18-11-2009 32,360 8,420
01-12-2009 37,700 5,340
01-01-2010 51,680 13,980
01-02-2010 65,690 14,010
01-03-2010 77,740 12,050
01-04-2010 94,990 17,250
01-05-2010 109,480 14,490
01-06-2010 124,550 15,070
01-07-2010 140,710 16,160
01-08-2010 157,680 16,970
01-09-2010 174,600 16,920
01-10-2010 191,130 16,530
01-11-2010 209,060 17,930
01-12-2010 229,720 20,660
01-01-2011 250,300 20,580
01-02-2011 266,790 16,490
01-03-2011 283,100 16,310
01-04-2011 301,230 18,130
01-05-2011 325,210 23,980
01-06-2011 344,770 19,560
01-07-2011 363,510 18,740
01-08-2011 374,037 10,527
01-09-2011 384,280 10,243
01-10-2011 394,450 10,170
01-11-2011 406,300 11,850
01-12-2011 418,240 11,940
01-01-2012 431,060 12,820
01-02-2012 447,520 16,460
01-03-2012 461,070 13,550
01-04-2012 472,520 11,450
01-05-2012 482,560 10,040
01-06-2012 495,290 12,730
Table 28 - Electric Bus Energy Consumption

Page 493 of 625
Month (2012)
Bus 1 Bus 29 Bus 3 Bus 4 Bus 5 Bus 6 Bus 7 Bus 8 Bus 9 Bus 10 Bus 11
January 0 0 0 0 0 0 0 0 2,254 0 0
February 0 2,866 0 3,754 0 4,013 3,433 799 188 3,328 3,087
March 0 2,782 0 3,553 0 1,971 2,939 3,240 867 3,027 1,912
April 0 2,852 0 2,931 0 3,086 2,147 2,335 0 2,399 2,037
May 0 2,505 0 2,715 0 2,618 1,558 2,186 0 2,232 2,079
June 0 1,367 0 2,929 0 3,675 2,227 2,727 1,907 2,412 3,516
June Odometer Reading
64,709 94,782 98,891 104,324 61,969 77,955 93,461 69,415 71,891 57,132 71,273
Table 29 - Electric Bus Kilometres Driven Per Month
From Table 29 above we can see that the buses were heavily utilised with average monthly usage of over 2500km. While energy consumption figures are included in Table 28 above, these figures represent only a short overlap period and therefore while they give an indication of kWh/km, they are as yet immature.
5.2.2 Madrid Buses
Madrid Municipal Transport Company, called EMT (Empresa Municipal de Transportes de Madrid) provides regular transport services in Madrid City. EMT has a fleet of 1,903 buses that operate within 203 lines. The adoption of electric buses was a decision taken to solve the need for sustainable transport in the city. 20 Gulliver Electric Buses are currently in operation along two urban bus lines in Madrid City. These minibuses provide service within the neighbourhoods of the historic downtown along two lines: M1 which was inaugurated in March 2008 and M2 that started to operate in October 2008. These buses circulate through narrow streets, in areas under special environmental protection and in low speed zones. The characteristics of these lines are shown in Table 30.
Line Name Length Average speed
Line M1 Sevilla-Embajadores 4.90 km 5.7 km/h
Line M2 Sevilla-Arguelles 5.98 km 6.7 km/h
Table 30 - Characterisation of the Electric Bus Lines in Madrid
The EMT has become member of GeM External Stakeholders Forum and has allowed the monitoring of their electric buses fleet with the purpose of providing valuable information for an analysis of the performance of the electric buses. The purpose of the study was to analyse the battery performance in terms of range and power consumption, and with this goal, current and voltage sensors were installed on the buses. Data was collected on a daily basis during a five-month period starting from September 2014 in order to assess the performance of the vehicles. Additionally, a GPS system provided detailed information on the actual routes, and therefore mileage can be easily calculated. In the following chart we can see this information for lines M1 and M2.

Page 494 of 625
Figure 188 - Routes of Buses in Lines M1 and M2 in Madrid
The buses run six days a week (Monday to Saturday) from 8:00 AM to 21:00 PM. The average frequency of each line at each stop is as follows: Line M1 (9-16 min) and Line M2 (13-18 min). The route is usually completed in approximately one hour including stops about 10 minutes at the beginning and end of each line. These types of microbuses can carry up to 25 passengers, 7 of which are seated. More detailed characteristics of the bus22 in relation to the motor and batteries can be found in Table 31.
Dimension
Length 5200 mm
Width 2035 mm
Height 2850 mm
Weight (Net) 3635 kg
Weight Gross (1 driver + 25 passengers) 5675 kg
Motor
Maxim power 27.2 kW
Maxim revolutions 1890 rpm
Nominal Voltage 85 V
Weight 127 kg
Battery (Na-NiCl2 2 modules)
Capacity 418 Ah
Nominal Voltage 85 V
Total Energy 71 kWh (85 V 836 Ah)
Weight 294 kg
Performance
22 Data provided by the company EMT

Page 495 of 625
Maximum Velocity 33 km/h
Autonomy 100km (12 hours)
Table 31 - Main Characteristics of Gulliver Electric Minibus
Figure 189 - TECNOBUS Gulliver U520 ESP LR
The buses are equipped with two ZEBRA batteries with a voltage of 85V and a capacity of 418 Ah by battery. Batteries must operate within a range of temperatures between 240 and 330 ° C. At 270 ° C, nominal temperature, there’s an energy loss by heat of 128 W. The batteries are recharged at 380 V using a fully automatic recharging system. 17 buses have been monitored for this study in terms of voltage and current of the motor to compute the average consumption of batteries. In the following figure, measurement of current and voltage during a 20 minutes ride is shown (this is the time that it takes the bus to go from start to end of the line for this case). The buses range is approximately 8 hours, during which they travel circa 60 km and then return to the docks to recharge the batteries for at least another eight hours. The instantaneous current and voltage measurements during charging are shown in Figure 190.
Figure 190 - Instantaneous Current and Voltage Measurement

Page 496 of 625
Figure 191 - Charging Area and View of the Batteries Installed in the Gulliver Minibus
In the next table consumption data, kilometres travelled and hours of operation of the bus lines covering the lines each month are depicted. The average consumption for the first line M1 was 0.88 kWh per kilometre and 0.85 kWh per kilometre for the second line M2. The average speed for each line was 5.9 km/h for line M1 and 6.8 km/h for line M2. The number of passengers who use monthly each line M1 and M2 is circa 32,000 and 12,000 respectively.
Line M1 Line M2
km Hours kWh cons. km Hours kWh cons.
September 7,815 1,279 6,643 8,721 1,268 7,238
October 8,122 1,385 7,066 9,115 1,362 7,748
November 7,634 1,236 6,565 8,435 1,210 7,085
December 7,432 1,296 6,689 8,244 1,254 7,255
January 7,562 1,278 6,730 8,432 1,235 7,336
Table 32 - Average Data Measured on Both Lines M1 and M2
The average energy consumption per 100 kilometres of the electric mini-buses fleet in these five months is represented in Figure 192. Considering the current average electricity price23 in Europe of € 0.2 per kWh for recharging the batteries of the electric minibuses and the average consumption of 86 kWh per 100 kilometres, the price equates to circa €16.8 per 100 kilometres. The fuel cost for a diesel mini-bus is estimated at €26.40, taking into account diesel price of 1.2 €/l24 and an average consumption of 22 litres per 100 kilometres.
23 Data from Eurostat. Energy Price statistic March 2014 24 http://ec.europa.eu/energy/observatory/oil/bulletin_en.htm

Page 497 of 625
Figure 192 - Electric Minibuses Average Consumption in the Demo Project
If we compare this data consumption with data obtained in a previous project25 that took place in Portugal in 2005, results are similar. In this project two electric GULLIVER U500 ESP mini buses were put into service in twenty-four Portuguese cities, during periods of four to six weeks. The next chart shows the mean consumption in each city. The daily mean consumption taking into account all cities was of 76 kWh/100 km.
Figure 193 - Consumptions in Different Portuguese Cities of a Gulliver Minibus
Besides the smaller fuel cost, the electric minibuses have additional advantages such as reduction in C02 emissions when compared with diesel equivalent buses. Although electric vehicles (EV) have locally zero emissions, the electricity production required to power them, presents environmental impacts. The emissions of CO2 depend on the electricity production process. For example, in Spain according to studies from REE26 the specific emissions in 2013 were on average about 0.174 kg CO2/kWh based on the energetic production mix. This means that according to the previous calculated consumptions, an electric minibus emits 14.96 Kg CO2 per 100 kilometres. Considering the losses in the recharging process that for this type of microbuses was monitored and assessed4 to be about 35% of the total energy supplied, the total emissions will be of 22.46 kg CO2 per 100 kilometres.
25 “Alternatives for Urban Public Transport Energy and Environment”. Robert Stüssi, Inês Santos. October 2004 26 Observatorio de la Electricidad Febrero 2014.WWF Spain. Source http://www.ree.es

Page 498 of 625
CO2 emissions of an equivalent diesel microbus are estimated around 48 kg C02/kWh. In the following table we can find a comparison between the two types of buses.
Electric mini-bus
Average Consumption (kWh/100km)
86
CO2 emissions (kg/100 km)
22.46
Diesel equivalent minibus
Average Consumption (litres/00km)
22
CO2 emissions (kg/100 km)
48
Table 33 - Comparative in Emissions and Consumption of Diesel and Electric Minibuses
Finally, another advantage of these electric buses against conventional buses is low maintenance. Although in this project maintenance costs have not been analysed, the transportation agency of the city of Rome ATAC has estimated that maintenance costs only represent the 4.8% of total costs per kilometre of a bus.
Therefore if we compare electric mini-buses with diesel equivalent buses in the same conditions, the use of electric fleets is more favourable in aspects such as emission reduction, low maintenance, little noise beside consumption what makes this type of buses ideal for this type of routes in historical urban areas that usually cover routes of 5km.
5.3 Taxis
5.3.1 Ireland Taxis
The Ireland demonstration region has monitored two electric taxis. The vehicle type and the charging technologies were different in order to assist in assessing challenges and opportunity in operating an electric taxi. Neither vehicle is shared by a second driver. The vehicles have been monitored over a 12 month period which has been supported by an interview of both drivers in order to ensure a greater understanding of the full experience.
Taxi Regulation
There are 11,028 taxis licensed in the County of Dublin as off June 2012 of which 487 are wheelchair accessible. Taxi regulation in Ireland specifies the load space required in the taxis. In the case of one of the trial taxis, special permission has been granted for use as a taxi, due to the undersized load space. A portion of taxi licences are granted for specific use as wheelchair accessible vehicles.
Dublin Geographical Overview
The Dublin area consists of approx. 920km2. For both vehicles monitored the home area is south of the city, however clients can wish to travel outside this area. The airport is located to the north of the city and is likely to be the most regular long journey a taxi driver based in the south of the city will encounter. (See Figure 194)

Page 499 of 625
Figure 194 - Dublin Area View
Taxi 1 is operated between 5 and 6 days a week. It has both AC charge (3.5kW) and DC ‘fast charge’ (50kW) capability. The primary place of residence has been fitted with an AC charge point. Taxi 1 is charged each night at the home charge point with occasional use of a DC charge at a city centre location. Fridays and Saturdays are the days where fast charging is most important due to the quantity (and distance) of trips undertaken. Approximately 20% of requests are declined due to range limitations, where the driver is uncomfortable about the return journey. At no time has the driver declined a fare due to luggage space. The driver experience has been very positive with particular notes made on responsiveness and comfort. The car is much preferred to the previous fossil fuel vehicle and attracts positive feedback from passengers. The driver is aware of the difference in fuel costs between both vehicles and this is a significant factor in considering the vehicle type. The driver believes a range of 250km to be suitable for taxi use in the Dublin area.
Taxi 2 is also operated between 5 and 6 days a week. It has 3 Phase AC charge capability only, with a charge time of approximately 8.5 hours. Charge outlets are installed at both home and taxi office locations. Due to the duration required to charge, the only practical charging is overnight at the drivers home. Fridays and Saturdays are the days charging is the greatest problem due to the quantity (and distance) of trips undertaken. Approximately 40% of requests are declined due to range limitations, where the driver is uncomfortable about the expected distance. The driver experience has been generally positive with particular notes made on comfort and quietness; however charge times are a particular issue with this vehicle. The vehicle is more comfortable than the previous fossil fuel vehicle and attracts positive feedback from passengers. The driver is aware of the difference in fuel costs between both vehicles and this is a significant factor in considering the vehicle type. The driver believes a range of 300km to be suitable for taxi use in the Dublin area.

Page 500 of 625
Vehicle ID Taxi 1 Taxi 2 Comments
Type Car, 5 Door Van, Wheelchair Access
Seating 5 6
AC Charging Yes Yes
DC Charging Yes No
Charge Rate (AC) 3.5kW 5kW
Charge Time (AC) 6.8 hrs 8.5 hrs
Nominal Range 160km 160km
Previous Vehicle Engine Volume
Petrol, 2 Litre Diesel, 2 Litre
Average weekly km 900km 750km
Weekly electricity Cost €30 €35 Assuming €0.21 /kWh
Weekly fossil fuel cost €140 €120 Assuming €1.60/l fuel
% Home Charge 85% 100%
% Public AC Charging 0% 0%
% Public DC Charging 15% 0%
Savings per Annum €5,280 €4,080 Assuming €0.21 /kWh and €1.60/l fuel, 48 weeks per year
Table 34 - Trial Taxi Comparison Chart
Findings
The ranges of the tested vehicle technologies are on the boundaries of practical use as taxis in the Dublin area. Particular difficulties are experienced at peak times, while the vehicle operation is satisfactory at other days in the working week. The availability of DC fast charging significantly alleviates this obstacle and highlights the importance of fast energy replenish times by whatever method. The overall experiences of comfort and energy costs are very positive. Range extension and/or the accessibility of fast methods of charging or battery swapping are of particular interest to operators. After 3 years of operation in the Nissan leaf, the vehicle has covered over 100,000km. There has been no evidence of battery degradation through the lifetime of the trial and the battery can still be charged to full capacity.
Future plans
The testing of induction charging on a Nissan Leaf as part of work package 8 of GeM, will consider the possible opportunities for range extension while parked between journeys. Furthermore the added value of 6kW AC charging available in the latest production Nissan Leafs as against the 3kW AC available in the current taxi will be considered with respect to the potential to increase the range of the vehicle.
5.3.2 Spain Taxis
The number of electric taxis in different cities of Europe is increasing quickly. According to IDTechEX27, 119,000 electric taxis will be sold in the world market in 2014. Taxi companies see advantages in electric vehicles. Although the key disadvantages of electric taxis are the price of the vehicle and the limited range of autonomy (approximately 180km) on the other hand, they are an attractive alternative to the conventional car in many other respects. The price of petrol or diesel is about 5 times more expensive than electricity. Many city governments give incentives to the user
27 www.IDTechEx.com

Page 501 of 625
when acquiring an electric car. But for drivers and managers of taxi companies there is an extra reason for replacing the conventional taxi with an electric model - to reduce the level of noise and improve the quality of urban air. In Spain, statistics show that a taxi runs nineteen times more mileage than a private car. Therefore an EV can be seen as a perfect test vehicle.
In this case we are analysing the use of an electric taxi. This taxi was the first electric taxi circulating in Spain (November 2011). Specifically this taxi is operating in the city of Valladolid. The city of Valladolid is a city of medium size.
The distance between the outer extremities of the City is 9 km.
A very large number of villages in the periphery are within 20 km. The nearest city of Palencia
is 50 km from Valladolid.
The airport is located 13 km from the city centre.
There are 34 charging points installed in public streets and parking, plus 2 fast charging
points.
The taxi usually travels a distance of 15 km on its routes with a travelled distance between
120-150 km daily, where it can cover the vast majority of journeys.
The electric taxi has the following characteristics: It has a capacity battery of 24 KWh, consumption approximately 173 Wh/km and a nominal range of 180 km, and it has an energy recovery system (regenerative braking).
Figure 195 - Daily Route in Urban Area 150 km

Page 502 of 625
Figure 196 - Daily Routes in Urban Area with Trip to a Closer Village 165 km
The taxi operates mainly in an urban environment, but sometimes it runs in extra urban routes to reach some villages near to the city including trips to the airport. The geographic area within which the taxi is used has been divided into three zones relating to the average speed reached by the taxi. In Figure 197, the green area represents speed values less than 50km/h. Speed between 50km/h and 80 km/h correspond to the orange area. Finally, in the remaining areas the taxi circulates with speeds over 80km/h. The classification is made taking into account that this model of electric vehicle has an energy recovery system. This system comes into operation at the time when the driver lifts his / her foot off the accelerator pedal and also when applying the foot break. These systems work better in urban areas where the stops and starts are frequent, thus achieving increases in the autonomy of the vehicle. Another advantage is lower maintenance due to the car braking systems have less wear.
Figure 197 - Map of Valladolid (Usual Routes by Area)
From the data collected from the electric taxi, the efficiency estimation by speed has been calculated. Two different types of efficiency have been defined. The first corresponds to a use during seasons where the heating and air conditioning has not been necessary to activate. The second corresponds to a lower efficiency where the use of HVAC systems corresponding with winter and summer periods.

Page 503 of 625
Speed d< 50 km/h 50km/h<d<80km/h d>80km
Efficiency 120% 100% 80%
Table 35 - Efficiency Type 1 (no HVAC)
Speed d< 50 km/h 50km/h<d<80km/h d>80km
Efficiency 110% 90% 70%
Table 36 - Efficiency Type 2 (HVAC)
In the next table, a total of eight daily routes have been selected in order to analyse the type of displacements most representative. These routes correspond to travelled distances in one day. The average distance travelled is approximately 100 km as depicted in the table. Some of the daily routes necessitate intermediate recharges made during a lunch break.
Distance Speed < 50 km/h 50km<Speed<80km/h Speed> 80km/h
km % km % km % km
Route 1 115,13 54,4 62,63 4,17 4,8 41,43 47,7
Route 2 125,14 86,57 108,34 9,43 5 4 11,8
Route 3 147,7 89,44 132,1 3,25 4,8 7,31 10,8
Route 4 190,93 89 169,93 3,04 5,8 7,96 15,2
Route 5 132,61 81,1 106,21 3,3 4,4 15,6 22
Route 6 69,08 100 69,08 0 0 0 0
Route 7 46,13 81,6 37,63 10,4 4,8 8 3,7
Route 8 73,96 84,31 62,36 4,33 3,2 11,36 8,4
Total 900,68 83,30 748,28 4,74 32,8 11,95 119,6
Table 37 - Route Classifications by Speed
A total of 83% of the total distance travelled was made in an urban environment with speeds below 50 km/h. The fuel consumption over a distance travelled of 900 km of an electric taxi versus an internal combustion engine vehicle was compared. For the consumption of the electric taxi in contrast to an ICE vehicle, the efficiency depending on the area was taken into account. Furthermore data was taken from urban, extra-urban and combined consumption. The results clearly show that the consumption of an electric taxi is 5 times lower than that of an ICE vehicle on urban routes. As the average speed of travel increases, this difference becomes smaller due in part to lower consumption of an ICE taxi as well as the lower efficiency of the electric taxi.
Speed < 50 km/h 50km<Speed<80km/h Speed> 80km/h Total
Kilometres 748,28 (83%) 32,8 (4.74%) 119,6(11.95%) 900,68
EV consumption 11.43 (110 %) 0.61 (90%) 2.87 €(70%) 14.91€
Diesel Consumption
61.81 €(5.9 l) 2.07 € (4.5 l ) 6.53 € (3.9) 70.4 €
Saving (%) 5.41 3.38 2.28 4.72
Assuming prices :diesel (1.4 €/l), electricity (0.12 €/kWh) Assuming energy consumption (0.14kWh/km). Efficiency type 2
Table 38 - Fuel Economy of the Electric Taxi Compared to the ICE
In addition to the previous data, in the next graphic the driving distance and the energy consumption during the last two years is represented. Total other data is represented in Table 39. If we take into

Page 504 of 625
account an average energy consumption of 0.14 kWh/h and taking the cost of electricity based on night tariff of 0.12 €/kWh the total cost of fuel of the electric taxi during two years is calculated.
Year 2012 0.14kWh/km* 0.12 €/kWh* 35564 km = €597.47
Year 2013 0.14kWh/km* 0.12 €/kWh* 44664 km = €750.35
Comparing the cost of a diesel fuelled taxi during this time taking the fuel cost of 1.4 €/l and an average consumption of 8.5 l/100km in urban environment, fuel cost would be circa €8,200. This means that with use of nearly 300,000 km can pay back the initial investment of the electric taxi, which for this model electric car was about €30,600.
Total electric cost = €1,347.82
Total diesel cost (8.5 l/100km)*(1.40 €/l)*(80228 km) = €9547.13
Figure 198 - km and Consumption Made by the Electric Taxi in 2012 and 2013
2012 2013
Total driving distance 35564,8 km 44644 km
Average energy consumption 0,14 kW/km 0,14 kW/km
Power consumption 5086,2 kW 6377,3 kW
Driving time 2345.5 h 4292,4 h
CO2 emission reductions 6110 Kg 7670 Kg
Table 39 - Total Data Taxi During 2012 and 2013
If we consider the maintenance costs of both vehicles the repayment period would be achieved in less time for the EV. Maintenance costs of the electric taxi have were €600 during the trial period while the costs in an ICE taxi would be in the region of €1,100 during this period. The cost differences would be greater in the case of corrective maintenance where the only fault in the electric taxi has consisted in the replacement of a light bulb. If in addition to the savings in fuel and maintenance we consider that the acquisition costs of the vehicle have dropped in the last year, we can estimate that amortization of the EV can be achieved in 200,000km.
Despite the advantages of electric taxi in relation to fuel consumption, the taxi drivers are still wary of electric car use. Perhaps one of the biggest problems they argue is the lack of range of the vehicle. Range anxiety could be avoided if there are enough recharging points and if the driver knows in advance their location. Another factor to consider is the efficiency of the batteries. This decreases with use, especially in high temperatures.

Page 505 of 625
It should be noted that some cities are more favourable than others to the use of electric taxi. For example, Valladolid is an appropriate city due to its topography and climate. It is a flat city with few slopes and the climate in summer is not too hot. Almost 80% of the routes can be performed in urban environment with average speeds less than 50 km/h. it is possible that cities with greater average distances and higher volumes of passengers are not as appropriate.
From the data analysed during the two and a half years that the electric taxi has been in use in the city of Valladolid the following conclusions can be obtained:
The electric taxi is a good alternative to conventional car in cities with the size and
geographical characteristics of Valladolid. The electric taxi is perfectly applicable for use in the
majority of cities and towns in Spain and therefore in Europe.
One of the biggest advantages to consider is the fuel economy, besides the low maintenance.
There are also other personal environmental advantages such as the absence of noise inside
the car and drivability in everyday use (similar to automatic gearbox driving)..
6 Conclusions
This report has detailed the status of the EV market in the Green eMotion regions (predominantly Western Europe) as of the end of 2012. The report acts as a complementary report for WP7.2 “Final Report on EV Charging in Green eMotion.” The report has set out the different type of EVs available on the market in 2012, their respective charging methods and particular use cases, specifically with regard to use in EV fleets, as opposed to personal vehicles.
The particular use cases shown of electric assisted bicycles, electric buses and electric taxis are applicable to Ireland. Electric assisted bicycles may be incorporated as part of the Irish city free bicycle schemes. With the support of ESB, some electric taxis are already operating in Ireland. There are currently no electric buses operating in Ireland however the use cases shown in Spain and Denmark have demonstrated that such projects can be viable. As the costs of electric buses reduce, it is likely that some public or private operators in Ireland may adopt the technology.

Page 506 of 625
Work Package 7.2
Final Report on EV Charging in Green eMotion

Page 507 of 625
Table of Contents
1 Introduction .........................................................................................................................508
2 Charging Methods ...............................................................................................................509
3 Use cases .............................................................................................................................510
3.1 Courier & Urban Delivery ......................................................................................................510
3.1.1 Postal Fleets .........................................................................................................................510
3.2 Car Pool ................................................................................................................................519
3.2.1 Ireland Car Pool ....................................................................................................................519 3.2.2 Spain Car Pool ......................................................................................................................524
3.3 Electric Hoists .......................................................................................................................530
3.4 EVs for E-Mobility Operators ................................................................................................532
4 European City Logistics Comparison ...............................................................................534
5 Fleet EV Usage Patterns .....................................................................................................536
6 Vehicle Costs .......................................................................................................................537
6.1 Lease/Purchase models........................................................................................................537
7 Fuel Economy ......................................................................................................................537
8 Maintenance Costs .............................................................................................................543
9 Emissions ............................................................................................................................553
10 Noise.....................................................................................................................................553
11 Other factors ........................................................................................................................554
12 Potential in Electric Vehicle Fleets (2014) ........................................................................556
13 Conclusion ...........................................................................................................................564

Page 508 of 625
1 Introduction
This report is titled “WP7.2 Final Report on EV Charging in Green eMotion” and details the status of the EV market in the Green eMotion regions (predominantly Western Europe) as of the end of 2014. The report acts as a complementary report for WP7.1 “Interim Report on EV Charging in Green eMotion.”
The report sets out the different type of EVs available on the market in 2014, their respective charging methods and particular use cases, specifically with regard to use in EV fleets, as opposed to personal vehicles.

Page 509 of 625
2 Charging Methods
A summary table for the EVs available on the market early 2014 is shown below.
Vehicle
Car Pedigree Charging Method
FB
EV
SB
EV
PH
EV
Serv
ice N
etw
ork
AC
Mo
de 1
AC
Mo
de 2
& 3
AC
/DC
Co
mb
o
DC
Batt
ery
Sw
itch
BMW i3 (both as BEV and PHEV) 1 3
BMW i8 / i8 Spider 1 3
Ford C Max 1
Ford Transit Connect 1 2
Ford Focus Electric 1 2
Honda Jazz EV 1
Hyundai i30 Plug-in 1
Mercedes A Class E Cell 1 3
Peugeot 508 Hybrid4 1
Renault Fluence ZE (2nd gen.)
Renault Zoe ZE 1
Smart ForTwo ED (3 phased as optional)
1
Tesla Model S 1 4 5
Toyota Prius C 1
Volvo C30 electric 1
Volvo V60 plug-in 1
VW e-UP 1 3
VW Golf Blue e-Motion (both as BEV and PHEV)
1 3
QBEAK 1
1 – OEM 2 – Three-phase charging not confirmed 3 – Combo charging not confirmed 4 – Near future possibility for super-charging 5 – No infrastructure solution in literature
Table 40 - Characteristics of EVs on Sale in early 2014
When this table is compared to the corresponding table for 2012 in WP7.1 “Interim Report on EV Charging in Green eMotion” it can be seen that modern charging technology has been embraced by the automotive Original Equipment Manufacturers (OEMs). None of the vehicles in the table above support Mode 1 charging. Interestingly, there has been a reduction in Full Battery Electric Vehicles (FBEVs) and a large increase in Plug-in Hybrid Electric Vehicles (PHEVs) most likely to alleviate perceived range anxiety and therefore increase vehicle sales.

Page 510 of 625
3 Use cases
3.1 Courier & Urban Delivery
3.1.1 Postal Fleets
The postal sector plays an important role within the urban freight logistics as shown in Figure 199. This sector utilises a large number of means of road transport such as vans of different sizes and small and medium trucks. Bicycles and motorcycles are mainly used for delivery to the final user through various daily tours totaling around 50 km per day. The sector is on the rise and daily deliveries to customers are becoming more numerous, which is partly due to the increase in e-commerce (internet sales).
At the same time, the sector is defined by “just-in-time” deliveries required frequently and in small quantities (courier deliveries / urgent letters). This produces a lot of trips daily around town causing an increase in the levels of urban traffic and congestion which leads to increased levels of pollution in cities. Therefore, electric vehicles, whether purely electric, hybrid or plug-in are a real alternative to combustion vehicles which make up the majority of urban fleets characterized by low everyday driving and low load capacity. The postal fleets have already begun the process of gradually replacing the traditional vehicles by electric vans, cars and two-wheelers.
In this report we will see the composition evolution of the main European postal fleets and some examples of cities that have implemented the electric vehicle in urban freight.
Figure 199 - Market Sectors for Urban Freight Transport
For an overview of the number of vehicles that the postal fleets have in the world we can analyse the data provided by IPC. International Post Corporation is a cooperative association of 24 member postal operators in Asia Pacific, Europe and North America. With members delivering some 80% of global postal mail, IPC represents the majority of the world’s mail volume. The number of vehicles that members of IPC28 possessed in 2012 is approximately 500,000 units. According to Figure 200 and Figure 201 we can see that the number of alternative-fuel vehicles have increased from 79,370 in 2011 to 96,727 in 2012 representing a 17% of total reported vehicles. The number of electric vehicles made up 3% of the global vehicles with an increase of 143% in 2012 with respect to the previous year.
28 2013 IPC Postal Sector Sustainability Report

Page 511 of 625
Against this data it is possible to estimate that the fleet of electric postal vehicles can reach up 30% of the postal fleet by 2020.
Figure 200 - Comparison of % of Alternative-Fuel Vehicles in 2009-2012
Figure 201 - Comparison of Alternative-Fuel Vehicles by Type in 2011-2012
Below we will analyse some of the European postal fleets and their contribution to the adoption of the electric car in fleets. We can anticipate that most of the electric fleets are formed by electric bikes and motorcycles.
Belgium Postal Fleet
Bpost’s fleet of vehicles29 is one of the largest in Belgium. At the end of 2013 it comprised 6,466 vans, 2,180 mopeds, 412 trucks, 3,140 bicycles, 2,524 electric bicycles and 10 electric delivery three-wheelers. The introduction of e-bikes to replace mopeds was a first stage in upgrading its vehicle fleet.
Figure 202 - Evolution of e-bikes in Bpost Fleet in 2010-2014
Portugal Postal Fleet (CTT)
Correios de Portugal is the national postal service of Portugal with a fleet of 3465 vehicles in 2013. It has a fleet of electric alternative vehicles consisting of 2 delivery 4-wheeled EV (cap. 2-3 m3), 5 electric scooters, 28 pedal bicycles, 180 electric bicycles and 9 hybrid vehicles.
Table 41 - Evolution of Ctt Alternative Fleet in 2008-2012
29 http://www.bpost.be/en/greenpost/planet/index.html

Page 512 of 625
CTT participates in the EU funded project- FR-EVUE (Freight Electric Vehicles in Urban Europe). Ten four-wheel electric vehicles are used by CTT.

Page 513 of 625
Spain Postal Fleet
In this section we will focus on the postal service in Europe, particularly in the Spanish public company "Correos". The fleet of these companies brings a set of characteristics that make it suitable for replacing internal combustion vehicles to electric vehicles. One such feature is the variety of its fleet with motorcycles, cars, vans and trucks of different tonnages. To this must be added the total distances that these fleets cover daily, by delivering letters and parcels to the users.
The Spanish postal fleet30 has about 13,426 vehicles including cars, vans, trucks and motorcycles. This fleet daily travels more than 342,000 km, equivalent to travelling nine times around the world every day. The fleet is composed of approximately 10,000 motorcycles, 285 cars, 3,061 vans of different load and about 80 trucks.
Figure 203 - Vehicle Numbers of Postal Fleet by Categories
The company has replaced 2% of its fleet, approximately two hundred, with electric vehicles comprising cars and motorbikes, with the goal of reducing pollution in cities, due both to noise and carbon dioxide emissions.
The current electric postal fleet is composed of a total of 209 vehicles (5 vans, 100 motorcycles, 89 bicycles and 15 four-wheel vehicles). Through the use of these vehicles 16,200 kilos of CO2 emissions per year will be avoided.
There are also provisions to replace between the 10% and 20% of its fleet of motorcycles, by electric bikes and between 30 and 40% of commercial vehicles of up to 400 kg load by electric vehicles.
The postal service EVs are distributed in about 80 locations, conducting routes not exceeding 50 kilometres per day. As there is no need to recharge en route, it may use the conventional charging points in postal facilities during night-time hours when the vehicles are not in use.
In addition to fuel savings and reduced environmental impact, the postal service also notes a decrease in the electric motorcycle accidents compared to their combustion counterparts. Furthermore adaptation to EVs by the drivers has been smooth, with a very positive reception to the new technology.
In the Figure 204 and Table 42, we can see the estimated average cost (€/km) of each type of conventional vehicle belonging to the postal fleet. This data have been calculated according to the average consumption of each type of car that uses the fleet, based on information obtained from IDAE31. Furthermore, the average consumptions for electric cars with similar characteristics to those
30 www.postal.es 31 http://www.idae.es/Coches/portal/BaseDatos

Page 514 of 625
already in operation have been calculated32. Thus, the fuel economy by km related to replacing an ICE by an EV for the category of passenger car and van has been estimated.
Figure 204 - Fuel Economy for Introduction of EVs in Postal Fleets
If we analyse the average fuel savings due to the replacement of a conventional vehicle belonging to the current fleet, by an electric vehicle, it would be approximately €2 per day. For this calculation the following assumptions have been made: an average distance of 50 km per vehicle, an average cost of diesel price of €1.4 per litre and an average cost of electricity about €0.2 per kWh. In Table 42, the savings in fuel costs for the lifetime of the vehicles taking into account that small vehicles are replaced at 150,000 km at most and vans greater capacity to 300,000 km are also analysed.
ICE €/km
EV €/km Save by km
Save by car daily
Save by fleet daily
Save lifetime by car
PRIVATE CAR 0.052 0.023 0.029 € 1.44 € 412 € 4338 €
SMALL VANS 0.070 0.027 0.043 € 2.15 € 3747 € 6450 €
MEDIUM VANS 0.101 0.055 0.046 € 2.29 € 1862 € 6882 €
LARGE VANS 0.124 0.084 0.041 € 2.03 € 791 € 12180 €
Table 42 - Comparative of EV versus ICE vans in Postal Fleets
Ireland Postal Fleet
An Post operates one of Ireland’s largest fleets with over 2,700 vehicles33 ranging from smaller vans to large articulated vehicles. In 2011, as part of the Irish demonstration region a total of 6 vehicles were monitored over a period of 12 weeks in urban delivery and courier scenarios. These vehicles were all ICE vehicles, with the intension of assessing usage patterns and analysing suitability for EV alternatives. In addition 3 fixed route courier post-delivery electric vehicles are monitored.
Drive patterns of the monitored vehicles show varying distances in a working day. The monitored vehicles show only one work shift per day, after which the vehicle is idle. The duration of breaks witnessed during the day is short with few lasting for more than 1 hour. The vehicles are all mainly used in day time applications. Due to the nature of the routes, (i.e. the majority is city centre) the vehicles are in the best environment to achieve the maximum ranges specified for EVs.
It was determined that for vehicles on fixed routes, AC (3.5kW) charging may be sufficient, once the distances travelled are within the practically achievable range of the vehicle. Due to the short breaks and relatively long distances covered by many vehicles, particularly those on variable distance routes, it would be necessary to consider the charging methods for EV urban delivery. Vehicles will often require fast charge or battery swap technologies to facilitate extensions in range during the short intervals between usages. This would be particularly important where vehicles are to be used in ‘back
32 http://www.movele.es/index.php/mod.coches/mem.listado/relmenu 33 An Post Annual Report 2013

Page 515 of 625
to back’ shift scenarios, that is, where a driver finishes a work shift and another driver takes the same vehicle for the next shift. Increased range capabilities would address the needs of single shift vehicles where they can be charged over longer periods of time, however the multi-shift vehicles will still require a fast replenish facility.
The nature of usage experienced across the vehicles monitored, would suggest that, if uncontrolled, the charging would take place mainly at the time of peak electricity demand. To best optimise this and to control energy prices for the user, there is opportunity to exploit scheduled charging, thus making use of night-time or other variable electricity rates. While this timing could be undertaken in the vehicle, it would be advantageous to consider centralised scheduling for larger fleets as this would alleviate, stresses to the electricity supply at a depot from large scale simultaneous charging.
Figure 205 - Urban Delivery Vehicle Usage
In March 2012, An Post launched a pilot project with 3 electric vans placed in 3 strategic locations: Galway with a delivery route about 45km and a vehicle range between 60-65 km daily, Dublin with a delivery route about 100km and a vehicle range between 70-80 Km and Cork with a delivery route between 60-80 km and a vehicle range up 120 Km. The results in saving energy consumed were as follows:
At all 3 locations there was a fuel cost saving of up to 65%.
Potential to reduce carbon footprint by approx. 40% if all small vehicles are converted to
electric.
Germany Postal Fleet
Deutsche Post DHL is the world’s leading postal and logistics services group. Deutsche Post is Germany's only universal provider of postal services and delivers mail and goods in Germany and the world. Today DHL’s road fleet consists of more than 89,000 vehicles34, including small commercial vehicles for letter mail and parcel delivery, light trucks for regional transport, and heavy trucks for long-haul transport. (17, 4% cars, 17% trucks and 65.6% vans). Deutsche Post DHL is switching to electric vehicles for its delivery services in Bonn and the surrounding region, making the city the first location in Germany with a carbon-free vehicle concept. In an initial phase, 79 vehicles will be put into service by the end of the year in Bonn and the surrounding area for the parcel delivery and the combined mail and parcel delivery. The pilot project foresees about 141 electric vehicles on the road by 2016.
34 dpdhl-corporate-responsibility-report-2013
Monitored ICE's
0
20
40
60
80
100
120
140
160
180
200
Samples
km
Km per day
Longest trip per day.

Page 516 of 625
Figure 206 - Evolution of DHL Alternative Fleet in 2011-2013
France Postal Service
La Poste is the mail service of France Transport. The fleet consists of 84000 vehicles35: 334 trucks, 3679 electric light vehicles, 1041 electric quadricycles, 29971 bicycles including 16236 electric power-assisted bicycles and 11941 motorcycles. Electric vehicles have been widely integrated into the postal and parcel delivery services. By 2015, 10,000 electric post-vans will be added to the group fleet.
Italy Postal Fleet
Poste has the largest, most complex fleet of vehicles36 of any Italian utility, operating two and three-wheeled motor vehicles, quadricycles, cars and vans and light and heavy vehicles. From the entire fleet of 39,000 vehicles, approximately 3,000 are eco-sustainable (electric and dual-fuel petrol/LPG vehicles). The green vehicle fleet was boosted with the introduction of 301 additional electric quadricycles (making a total of 1,108). The types of vehicles used for postal services (year 2012) and by commercial staff can be divided into four main categories:
motorcycles and quadricycles: 21357
delivery vehicles: 11774
vans and lightweight trucks: 3120
saloon cars for service use: 1132
Sweden-Denmark Postal Fleet
PostNord has a fleet of more than 20,000 vehicles. PostNord’s37 distribution network plays a major role in key social functions in the Nordic region of Sweden and Denmark. PostNord has one of Europe's largest fleets of electric vehicles with approximately 5,000 electric bicycles, mopeds and club cars including 50 electric vehicles purchased for the Danish operations. During 2014 the logistics business will test two large electric vehicles for parcel distribution.
Switzerland Postal Fleet
Swiss Post fleet has approx. 12900 motorized vehicles38, 7400 scooters, 700 small lorries, 1800 medium lorries, 500 large lorries, 1700 transporters, 200 trucks and 500 warehouse vehicles. With over 5,000 electric vehicles (scooter) delivering letters, Swiss Post has the largest electric fleet in Europe. The company has also been testing twelve electric delivery vans since 2012, and more will be purchased if they prove themselves on the road.
35 LeGroupeLaPoste. Corporate Social Responsibility Report 2013 36 Posteitaliane sustainability report 2012 37 PostNord Annual Report 2013 38 2013 Annual Report Swiss Post Innovation Management

Page 517 of 625
Austrian Postal Fleet
Austrian Post is the leading logistics and postal services provider in Austria. Its fleet is compound of about 9000 vehicles39 between bicycles, mopeds, vehicles up to 3.5t and vehicles over 3.5t. By the end of 2016 Austrian Post wants to have more than 1,300 e-vehicles at its disposal.
Figure 207 - Austrian Post Fleet in 2013
Hungary Postal Fleet
Magyar Posta is one of the biggest company groups and employers in Hungary. It has more than 30,000 employees, 2,700 post offices, 350 mobile posts, and a vehicle fleet of 3,000. It operates a unique logistics network and an extensive services portfolio. The extent of its EV program is not known.
Finland Postal Fleet
Itella fleet is the Finland postal service with a fleet of about 4,000 commercial vehicles travelling a total of more than 125 million kilometres each year. Itella also uses environmentally friendly electric carts, electric cars and 1,000 electric bicycles. Up until now, increasing the number of electric cars in delivery has been challenging, as electric cars suitable for winter conditions in Finland are not available. Approximately half of the mopeds they use are electric.
Norway Postal Fleet
Postal Norge is a Nordic mail and logistics group that develops and delivers complete solutions within postal services, communications and logistics. Postal Norge has a fleet about 6182 vehicles of which 643 are electric (261 mopeds, 213 jeeps, 145 trolleys and 24 cars)
Norway Post is on track to increase the level of green vehicles in its fleet, with an ambitious goal to remove approximately 30% of fossil-fuelled delivery vehicles by 2015, in favour of more effective and environmentally friendly vehicles.
Luxembourg Postal Fleet
POST Luxembourg has a fleet with more than 1,000 vehicles, 69 electric vehicles (the largest electric fleet in the country).
The Netherlands Postal Fleet
PostNL is the designated postal operator in the Netherlands with a fleet of 4.533 owned vehicles. The extent of its EV program is not known.
Great Britain Postal Fleet
Royal Mail is a public postal operator in Great Britain. It has a fleet of over 33,000 commercial delivery vehicles operating across the UK and has one of the largest fleets in Europe. The Fleet is composed of 1515 HGV (14 tons and above) and 2187 LGV (6.5-7.5 tons). The number of cars and vans is approximately of 28800. It also owns 5000 company cars and between 5000-10000 private vehicles
39 Annual Report 2013 | Austrian Post

Page 518 of 625
used for business purposes. Royal Mail vehicles travel approximately c.600 million miles (965 million kilometres) a year and use 153 million litres (40.4m US gallons) of diesel. In order to lessen the impact that its transport and distribution operations have on the environment, Royal Mail has included in its fleet 10 diesel-electric hybrids and two electric vehicles.
Postal Fleet Conclusions
Looking at Figure 208 and Table 43 it is possible to see the percentage of electric vehicles out of the total number of vehicles (EVs and ICEs) within the European postal fleets analysed. Approximately 312,000 vehicles make up the fleets, and 40,000 of them correspond to electric vehicles. This represents around the 13% of the total fleet. If the e-bikes are ignored these values drop to about 15,000 units, what would come to be a 5% of the total fleet. This number would be reduced to about 4200 units (1.5% of the total fleet) if only cars with four wheels (not quadricycles) are considered as electric vehicles. From this analysis we can conclude that electric cars and vans composing the European fleets are limited and in most cases are available thanks to pilot experiences encompassed in European projects. Perhaps the most prominent case is the Group Laposte where the French government along with Renault has promoted the introduction of the electric vehicle in some major companies, such as the French postal fleet. It is clear that there is great potential for the implementation of the electric car not only in Public Postal Operators of the 28 EU Countries but also in the whole European postal fleet with about 49 organizations and more than one million postal vehicles travelling across Europe.
Figure 208 - Number of Total Vehicles by fleet in Europe in 201340
Postal
Fleet
Four
Wheels
Quadri-
Cycles
Tri-
Cycles
Bi-
Cycles
Motor-
Bikes Others %Total
BP (Belgium) 10 2524 20%
AP (Ireland) 3 0%
CTT (Portugal) 2 180 5 5%
DHL (Germany) 304 0.35%
GLP (France) 3679 1041 16236 45%
CO (Spain) 5 15 85 89 2%
PI (Italy) 1108 3%
PN (Sweden-Denmark) 5660* 27%
SP (Switzerland) 12 5000 38%
AP (Austria) 72 439 142 7%
MP (Hungary)
IT (Finland) 1000 100 25%
PN (The Netherlands) 24 213 261 145 10%
PL (Luxembourg) 69 7%
Total Number of EVs 38423
Table 43 - Electric Vehicles Sorted by Type in European Fleets 40 CTT Sustainable mobility. IPC Best Practice Seminar on Alternative Vehicles and Fuels. Sep 2013

Page 519 of 625
3.2 Car Pool
3.2.1 Ireland Car Pool
Transport is a particularly significant overhead for many businesses, however it is not goods delivery alone that creates this drain on resources, in many cases it is transit of employees. Company vehicles can be utilised where particular members of staff such as sales or service engineers are regularly travelling on behalf of the business, however in cases where travel patterns are more sporadic, then taxi or car mileage allowances are typically favoured. The use of personal vehicles is still a financial drain on the business however it has the added disadvantage of requiring the employee to commute to work in their personal car, where they might otherwise be able to utilise public transport. This situation clearly doesn’t support the sustainable targets of modern business. A solution to the challenge may be found in a ‘car pool’ system, however migration to an ICE car pool holds none of the fuel saving benefits, nor does it benefit the sustainable targets of companies.
A fleet of 4 EVs were used in a car pool located at the head office of a Dublin based company. The office is the main workplace of approximately 800 employees from a variety of business units. As the company has multiple offices within the region and conducts business with other industry partners, employees would regularly be required to travel to other locations as part of their work. This travel may require employees to walk, cycle, use their own vehicle or take a taxi. The car pool has not yet been advertised throughout the company but relies solely on word of mouth, with the number currently using the car pool standing at 40 users and is provided free of charge. Following this pilot, it is hoped to supplement the number of vehicles available and advertise the service to a wider audience under a ‘business shared service’ scheme.
Users of the car pool can make bookings by contacting a member of staff responsible for vehicle management who can then view availability and enter bookings on behalf of the user. It is anticipated that the software would be made available to all staff once a wider deployment of the system commences. It is also anticipated that key management is upgraded to allow more automated access control. Data was gathered from records of the company taxi account and the receipted taxi expenses of employees. The total combined value of receipted expenses from taxi usage and the invoices to the taxi account can be seen in Table 44 below.
Taxi Invoices 2011
01 Jan 2011 - 31 Dec 2011 Totals
€ Total €61,672
No of Trips 4,224
€ Average €17.17
Average Trip Distance (km) 2.98
Taxi Receipts (Personal Expenses) Total spend €43,473
Total no of trips 2,058
Regulated Taxi Fare Structure Rates €
Standing Charge €4.10
Charge / km €1.03
Combined Taxi Costs
Total Spend €105,145
Total Number of Trips 6,282
Average Trip Distance (km) 12.27
Table 44 - Taxi Invoices & Expenses

Page 520 of 625
A cost comparison of owning 4 electric vehicles for 5 years against the cost of taxis over 5 years reveals that the taxis would cost €525,724, while the cost of owning and maintaining the electric vehicles would cost approximately €132,213. See Table 45 below.
The TCO for the fleet of 4 EVs has been calculated using the parameters set out below. The distance travelled over the taxi journeys is calculated using the number of journeys and the regulated taxi fares listed in Table 44 above. Currently in Ireland, the cost of a Nissan ‘Leaf’ is €25,500 with an electricity consumption of €1094 for 77,077km. Energy costs are calculated based on night time charging at a rate of 10.18 cent/kWh. Data acquired from the Nissan ‘Carwings’ monitoring system calculated energy consumption of 0.14kWh/km, (based on 900km of typical travel) therefore the calculation of fuel for the vehicles is:
0.14kWh x 10.18 cent x 77077km = €1098.50 per year.
The insurance for the four vehicles is estimated at €4000 per year, however for many fleet insurance policies this would be considered high. Vehicle road tax is €120 per vehicle per year and the maintenance costs have been consistent for 3 existing vehicles over 2 years at €105 per vehicle each year. A National Car Test applies to vehicles which are 4 years old; this test is only repeated after a further 3 years and therefore will only apply once during the evaluation period at a cost of €55 per vehicle.
1 Year (€) 5 Years (€)
Cost of Taxi's 105,145 525,725
EV Ownership x 4
Capex 20400 102,000
Fuel 1098.50 5492.50
Insurance 4000 20,000
Tax 480 2400
Maintenance 420 2100
National Car Test NCT (Required in Yr. 4)
220
TCO 26,398.50 132,212.50
Table 45 - Comparison Overview
A comparison of emissions showed that for the taxi’s journey total distance of 77,077 km the taxis emitted 11.56 million grams of carbon, while the same journeys in an electric car would reduce it to 5.32 million grams (based on Ireland’s electricity mix). This promotes sustainable travel and a reduction in their carbon footprint. These figures show that there is an opportunity to improve sustainable travel in the office. The replacement of taxi journeys with low emission electric vehicles not only reduces the company’s carbon footprint, but also it’s spending on staff transport. See Table 46 below.
Taxi carbon g / Km 150
EV carbon g / Km 69
Taxi carbon g / total Km 11561621
Millions grams of carbon 11.56
EV carbon g / total Km 5318345.83
Millions grams of carbon 5.32
Table 46 - Emissions Comparison Taxi versus EV

Page 521 of 625
Table 47 and Table 48 give summary details and assumptions used in the pilot.
Total number of bookings 1,074
Total distance driven (kms) 29,250
Average distance 27.2
No of bookings per car 358
Avg distance per car 9,750
Number of cars available 4
Working days in month 21
Table 47 - Summary Data
Equivalent cost in a taxi €4,793.16
Cost to pay for fuel: Euro
- petrol 514
- diesel 310
- electricity 56
Assumptions
Cost of fuel per km (cent)
- petrol 12.5
- diesel 7.5
- electricity - Night Rate 1.42
EV Purchase Cost €25,500
Taxi costs
Standing charge €4.10
Charge / km €1.03
Total distance km Taxi 4,177
No of Standing charges -160
Total km remaining 4,017
Total cost of standing charges
€656
Total cost of remaining charges
€4,137
€4,793
Emissions
Total distance for trips Km 4,118
EV carbon g / Km 69
Taxi carbon g / Km 150
Taxi carbon g / total Km 617,687
EV carbon g / total Km 284,136
Table 48 - Monthly Equivalents
From the data gathered in this use case and validation with equivalent taxi usage, there is a clear benefit both financially and environmentally for the use of an EV car pool. The average return journey

Page 522 of 625
the cars were used for was 26km and the cars were used on average, twice a day. This high number of uses of the vehicles and the high average distances augurs well for the cost benefit of using this type of car pool system in place of a taxi service or indeed a mileage system for personal vehicle usage.
In addition to this data a survey was carried out of registered users of the car pool in which questions were presented relevant to user acceptance. From the responses received it can be clearly seen that the EV carpool was mainly replacing ICE vehicles.
The high level of respondents who use either cycling or public transport to commute to work combined with the high number of users who would have used own transport as an alternative means of travelling to meetings indicates that there is a greater benefit to having EV car pools other than that simply calculated on the business journeys.
While the percentage of work related journeys which were possible with an electric vehicle was high, the main limitation was the range limitation of 70km available with the preproduction vehicles used in the pilot. It should be noted that the ranges available on many of the vehicles currently available is significantly higher, thus allowing almost all trips to be within the capabilities of the EV.
If the electric car was unavailable, what method of transport would you choose?
How do you usually commute to work?
0
20
40
60
80
100
% Responses
Taxi
Walk
Cycle
Drive own car/Vehicle
Public transport
0
10
20
30
40
50
60
70
80
90
100
% Respondants
Walk
Cycle
Drive
Public Transport

Page 523 of 625
Have there been many work related journeys that the electric car could not facilitate?
If yes, what distances were they, on average?
Are there any instances where you have recharged the car while using it away from head office during working hours?
0
20
40
60
80
100
% Respondants
Yes
No
0
20
40
60
80
100
% Respondants
70-80Km
80-90Km
90-100Km
0
20
40
60
80
100
% Respondants
Yes
No

Page 524 of 625
Are there any journeys where you would choose a taxi over an electric car, given that the electric car was available?
The above data shows that a car pool system using Electric Vehicles is an acceptable and workable solution to the majority of the respondents. The main limitation of range which was experienced with the preproduction vehicles would not be a factor for many of the vehicles commercially available at this point in time.
3.2.2 Spain Car Pool
The ES2 Demo Region in Spain has monitored a total of 13 electric vehicles: 8 of them belonging to Iberdrola car sharing. This is a private fleet used by Iberdrola employees in their daily work displacements. The other 5 vehicles constitute a public car sharing fleet located in Ataun and is supported by local authorities. The type of vehicle is a city car and its features are shown in Table 49. Data from a 24-month period has been used in order to analyse the energy consumption and the charging process.
Electric Vehicle Performance
Maximum speed 120 km/h
Power 40 HP
Acceleration 0-50km/h: 6.5 seg
Range Up to 203 km (160 normal conditions)
Charging time 8(16A) 80% in 7h
Battery 28,2 kwh (23kWh)
Table 49 - Electric City Car Features
Reviewing the data monitored during the year 2012 (see Figure 209) in the two fleets, it can be seen that the consumed energy differs from the energy used for recharging. This is mainly due to the fact that if the electric car is used irregularly, the battery discharges over time. The manual specifies that under these conditions the battery lasts "over a week" and it is advised that you have always plugged the car in if it is not used.
As can be seen in the graphs, the energy loss in the vehicles from Iberdrola car sharing is greater than that from Ataun fleet. Reduced use of vehicles from Iberdrola car sharing causes the battery to become discharged more often. It can be concluded that an electric vehicle will be more efficient the more often it is used. This is also true when compared to a conventional vehicle.
0
20
40
60
80
100
% Respondants
Yes
No

Page 525 of 625
Figure 209 - Comparative of Consumption in Iberdrola Car Pooling and Ataun Fleet 2012
Routes
Madrid is the largest city of Spain and the third largest city in the European Union. The city spans a total of 604.3 km2. There are a great number of extended suburbs and villages around the city. Madrid Airport is located 13 km from the city centre. There are several orbital motorways: M30 is the innermost ring road of the city and the length is 32.5 km (maximum speed 90 km/h). It is almost inside the city being the busiest road. Outer rings are named M-40 (maximum speed 100 km/h), and M-50 (maximum speed 120 km/h).
Figure 210 - Madrid Map
A fleet of EVs from Iberdrola car sharing has been used to perform this study. Data from the vehicles location during each journey was collected by a GPS navigation system. Analysing the data shown in Figure 211, it can be seen that most of the trips were made to the metropolitan area of the city inside the area surrounded by the M30, mainly around the east of this area.
These journeys are made from the company’s head office at Tomas Redondo Street (Figure 210) to other locations travelled by employees as part of their daily work (Figure 211). These routes

Page 526 of 625
correspond to the main avenues and streets of the city, such as the Paseo de la Castellana, Príncipe de Vergara, Avenida de Alberto Alcocer, Avenida de América, and Calle de Alcalá. To access these locations drivers usually use the fast roads of the city, like the M30 and M40.
There are also routes corresponding to remote parts of the city with the objective to reach nearby villages. Examples are the villages located around 50 km, like Colmenar Viejo 50 km, Torredolones 42 km, Alcorcón 35 km, Griñon 50 km and Pinto 33 km.
Figure 211 - Usual Routes of Iberdrola Car Pooling
As per Figure 211 the average distance travelled each month by Iberdrola car sharing in 2012 was around 10 km. However, in the case of Ataun fleet, this value is approximately 16 km. Travel distances of less than 2 km have not been taken into account. This is due to the routine use of these cars that usually access business areas which are very close to the starting point of the vehicles. Moreover, the average total number of trips (Figure 213) made monthly by Iberdrola car sharing fleet in 2012 is around 140 trips (0.88 uses/day) while in Ataun fleet it is around 314 trips (3.14 uses/day).
From the data analysed in this study it is possible to conclude there is an actual benefit related to the use of electric vehicles versus Internal combustion vehicles, mainly in big cities. Until the electric car has more uptake among private users, only the use of electric vehicles in fleets has greater advantages over other means of transport using fossil fuel.
Figure 212 - Comparative of km per trip in Iberdrola Car-Pooling and Ataun fleet 2012

Page 527 of 625
Figure 213 - Comparative of Travels in Iberdrola Car-Pooling and Ataun fleet 2012
In the graph below the estimated speed that vehicles have reached in their routes around the city is shown. As can be seen, the areas of use are clearly defined. In the downtown area of the city the speed is below 50 km/h. The sections comprising the M30 inner ring and the access to the outer ring M40 show that the speed is below 70 km/h due to the speed limit on those fast roads, and finally the speed is around 100 km/h in the outer ring road M40 and the exits from M40 to reach the closer villages.
Figure 214 - Vehicle Speed in Iberdrola Car Pooling
Fuel Consumption
A theoretical energy cost comparison of electric vehicles against conventional ones of similar features to those from the ES2 Demo Region reveals that the ICE vehicle energy would cost about 0.0805 €/km, while that from the electric vehicle would be of approximately 0.02955 €/km. This equates to 3 times less energy cost in the EV. However, if we consider the actual monitored data throughout the year 2012 in Iberdrola car sharing and Ataun pilot, the actual cost of the power consumption of the electric car is significantly higher than expected when compared to the theoretical data. These data are not as advantageous as one would initially expect. The fuel savings of the electric car are reduced to 53% in the case of vehicles from Ataun and only about 30% in the case of those from Iberdrola car sharing.
The difference between real and theoretical consumption of the vehicle is determined among others, by the use of heating and air conditioning and the speed. The climate is not equal in the selected locations. The lower usage of cars in Iberdrola car sharing linked to the increased use of heating

Page 528 of 625
systems and conditioned areas contribute to lower the efficiency of the electric vehicle. Additionally, the high speed of Madrid’s motorways demand more energy than Ataun’s roads.
EV Manufacturer ATAUN 2012 IBERDROLA 2012 ICE (similar features)
0.02955 €/km 0.03722 €/km 0.05579 €/km 0.0805 €/km
Battery 28kw Autonomy 180 kw
Diesel Price 1.4€/ l Electricity Prices 0.19 € kw/h
Table 50 - Consumption Comparative of the Different Scenarios
Fleet-Month-Year Energy consumption per month
Kilometres per month
Charging times per month
average€/kw
Iberdrola 1-2012 552.552 1812 77 0.0594
Iberdrola 2-2012 254.324 707 40 0.0602
Iberdrola 3-2012 496.748 1638 84 0.0543
Iberdrola 4-2012 366.1 1337 61 0.0511
Iberdrola 5-2012 652.12 2114 89 0.0549
Iberdrola 6-2012 416.164 1484 79 0.0579
Iberdrola 7-2012 457.66 1434 77 0.0587
Iberdrola 8-2012 185.584 674 40 0.0562
Iberdrola 9-2012 478.184 1502 68 0.0541
Iberdrola 10-2012 535.808 1839 87 0.0516
Iberdrola 11-2012 508.004 1601 84 0.0535
Iberdrola 12-2012 444.752 1397 60 0.0571
Ataun 1-2012 1330 6959 178 0.0402
Ataun 2-2012 842.8 4185 131 0.0438
Ataun 3-2012 1168.16 5952 174 0.0380
Ataun 4-2012 927.08 5077 134 0.0364
Ataun 5-2012 995.12 5857 152 0.0338
Ataun 6-2012 1207.64 7455 216 0.0328
Ataun 7-2012 730.8 4494 133 0.0336
Ataun 8-2012 326.76 1707 54 0.03002
Ataun 9-2012 642.6 3755 97 0.0342
Ataun 10-2012 997.92 5774 153 0.0361
Ataun 11-2012 613.48 2867 100 0.04313
Ataun 12-2012 788.2 3915 115 0.04427
Assuming Electricity Price 0.19€/kwh
Table 51 - Data by Month of Pilot Fleets during Year 2012
The total cost savings by month of city cars that have been used in both fleets throughout the year 2012 can be seen in the graph below. An average consumption of 5.75 l, for a conventional diesel city car and a fuel price of 1.4 €/l. (0.0805 €/km) has been considered. An average fuel price has been estimated, considering the price in Spain is different depending on the region (mainly due to rates of tax).

Page 529 of 625
Figure 215 - Estimated Saving of EV versus ICE in Iberdrola Car-Pooling and Ataun Fleet
This data can be used to calculate the average total savings of an electric car versus conventional car considering the lifetime of the battery which can be estimated around 1,200 recharges, equivalent to 234,000 km.
(0,0805 €/km – 0,05579 €/km) * 234.000 km = €5,780 Iberdrola car sharing
(0,0805 €/km – 0,03722 €/km) * 234.000 km = €10,126 Ataun fleet

Page 530 of 625
3.3 Electric Hoists
ESB Networks in 2009 set upon a program of reducing the carbon emissions of their work fleet. Targets of 30% by 2012, 50% by 2020 and 100% by 2035 have been set.
Since then ESB have introduced two fully electric Mobile Elevated Working Platforms (MEWPs), into their fleet with a further eight vehicles converted to-date. The diesel powered vehicles were fitted with lithium battery packs to operate the MEWP part of the vehicle.
These are ‘every day’ working vehicles fitted with hydraulic platforms that allow our network technicians to service and maintain the ESB overhead networks infrastructure.
Figure 216 - Smith Newton Electric MEWP
For our assessment we are monitoring the power consumption of the electric and hybrid vehicles compared to similar vehicles fuelled by diesel. Both sets of vehicles are in everyday usage and will be compared as part of routine activity rather than a laboratory style test.
The vehicles we are going to look at are a Smiths Newton 10t 120kW electric truck, which went into service in May 2012. The second vehicle is a 2009 Mercedes Atego 918, 11 tonne diesel powered engine with an output of 130kW (177hp) at 2,200 rpm which in turn operates a power take off (PTO) which when engaged by the driver operates the hydraulic system to power the MEWP.
The vehicle is based in Enniscorthy, Ireland and is operated by a network technician in the same location. The operator returns monthly reports via an hour meter fitted to the machine to capture its usage of the battery pack. To date the MEWP has a total of seven hundred and forty hours of working time on its battery pack.
In parallel we examined the conventional diesel vehicle (Mercedes Atego) doing the same type of work and focused on its PTO/idle time, to see what advantages/disadvantages the electric/Hybrid had over the diesel vehicle, and any savings that could be achieved.
The Smiths Newton has now been in service for 15 months and has travelled 2,500kms. The MEWP side of the vehicle has operated on average three hour per day and in that time it has a total reading to date of nine hundred hours.
The Mercedes Atego hybrid MEWP has a plug-in 220 volt system to charge the lithium battery pack. Charging took place at the end of the operator’s working day, and left charging over-night ready for use the next day. It takes eight hours to charge the battery pack to its full capacity this is indicated by means of a meter fitted to the battery pack unit. As mentioned above we will consider the fuel usage of a conventional MEWP working at the pole with its engine idling and PTO engaged.

Page 531 of 625
Hybrid Power Pack System
Figure 217 - Mercedes Atego Hybrid MEWP
ESB Fleet & Equipment have carried out a pilot study using a battery power pack system to operate their mobile elevated work platforms (MEWPs) and truck mounted cranes. Fleet & Equipment is committed to fitting a battery power pack system to a MEWP and Crane before the end of 2009.
The Pilot study will focus on safety, reliability, electric as the primary power and fuel use.
The estimated cost of the battery power pack unit will be in the region of €15,000 to €20,000.
From motor industry average figures, if all MEWPs and cranes on ESB’s fleet were fitted with power pack units, the reduction of carbon emissions would be estimated at 1,518 tons of CO2 per annum (see calculations below).
ESB average 3 hours per day idling and operating Crane/MEWP
Industry average 2 litres of fuel per hour = 5kg CO2
3h x 5kg = 15kg CO2 per day per vehicle (75kg CO2 per week)
260 hoists, 200 cranes = Total of 460 units
(44 weeks) × (75kg CO2) × (460 units) = 1,518,000 kg CO2 per annum = 1,518 tons CO2 per
annum
Figure 218 - Example of Power Pack System Currently Under Research and Development by Versalift UK.

Page 532 of 625
3.4 EVs for E-Mobility Operators
ESB ecars
Commissioning, maintenance, fault finding and repairing charge points is a large part of the work of e-mobility operators, such as ESB in Ireland. During these processes, the use of an actual electric vehicle (as opposed to a test kit) is important for a number of reasons:
An actual EV will draw full power from the charge point thus verifying that the components can
operate under electrical stress,
For AC charging, many charge point test-kits do not mirror exactly the PWM signals on all
ranges of EVs,
For DC charging, many manufacturers have bespoke CHAdeMO test-kits however a large
number of these kits are either not for sale by the charge point manufacturers or have not yet
completed standardised processes such as “CE marking” or “UL marking”.
When a charge point infrastructure is located within city limits, a battery electric vehicle (BEV) is suitable as the testing vehicle. ESB has however installed a nationwide charge point infrastructure in Ireland with maximum distances between charge points in excess of 500km. A map of Ireland’s charge point network and a sample of the charge point types are shown in Figure 219.
Figure 219 - Ireland's EV Charge Point Network and Charge Point Types
The large distances between charge points limit the practicality of using a Battery Electric Vehicle (BEV). A trip for example from Dublin to Letterkenny can take as long as 5 hours in a BEV (such as a Nissan Leaf), due to the requirement for intermediate charging. In the past, ESB ecars has been either using BEVs, which are based on our head office in Dublin, to travel to remote charge points or relying on the goodwill of local EV owners to verify that charge points are operational after commissioning, servicing or repair.
In association with the Green eMotion project, ESB has purchased a PHEV for use by engineers in our e-mobility role. It is anticipated that the use of the PHEV will save time for ESB engineers and reduce the commissioning, servicing and fault repair times, thus increasing customer confidence in the charge point infrastructure and further promoting e-mobility in Ireland.
The vehicle is a Mitsubishi Outlander PHEV which is equipped with a 12kWhr battery pack and associated motors and a 2.0 litre petrol engine. The cargo space is suitable for carrying large amounts of site equipment and tools.
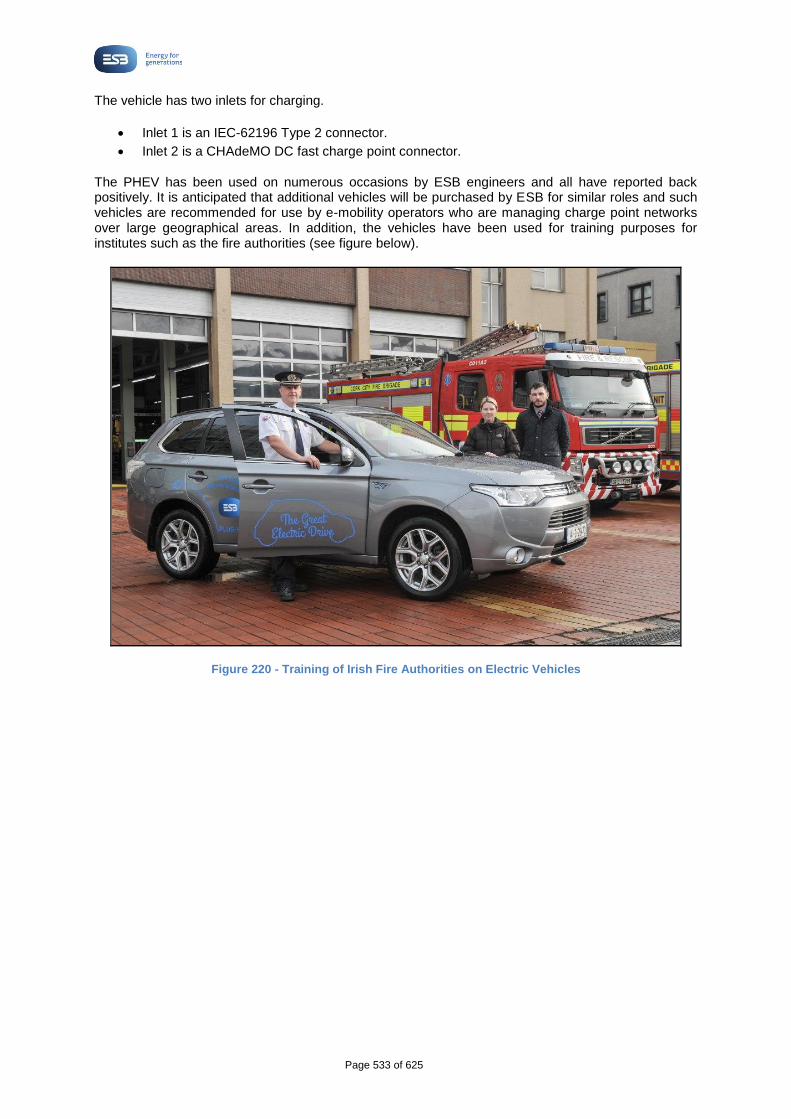
Page 533 of 625
The vehicle has two inlets for charging.
Inlet 1 is an IEC-62196 Type 2 connector.
Inlet 2 is a CHAdeMO DC fast charge point connector.
The PHEV has been used on numerous occasions by ESB engineers and all have reported back positively. It is anticipated that additional vehicles will be purchased by ESB for similar roles and such vehicles are recommended for use by e-mobility operators who are managing charge point networks over large geographical areas. In addition, the vehicles have been used for training purposes for institutes such as the fire authorities (see figure below).
Figure 220 - Training of Irish Fire Authorities on Electric Vehicles

Page 534 of 625
4 European City Logistics Comparison
The nature of urban logistics is similar to many others where margins are extremely tight. To be competitive and win contracts the operator must trim all possible aspects of operating costs. Of high impact on the operating cost of urban delivery or logistics companies is fuel, therefore regular fuel savings are crucial for the competitiveness of operators. One of the perceived concerns of logistics companies is the limited driving range of vehicles. If the vehicle cannot cover the required range then the fuel cost is irrelevant. The table below shows a selection of European cities, comparing the geographical layout of the region. Each of the cities has been considered in terms of its outer ring road which reasonably creates a boundary for the ‘urban’ zones.
While considering the use case of urban delivery, there are two distinct modes of operation. The first is fixed route and the second is the ‘job by job’ basis. Fixed route delivery holds massive potential for EV use. Fleet operators will have accurate data relating to each vehicle, where this data is not available historically it can easily be gathered by taking a daily reading from the vehicle’s odometer. It is important to consider, that with the increasing availability of fast charge infrastructure, the vehicle is not limited to the range achievable with one battery charge, but rather has the opportunity to achieve greater autonomy by making use of a charge on route or during natural break times or rest periods for a driver.
Country City North-South (km) East-West (km) Average Diameter(km) Size Rank
Germany Berlin 72 79 75.5 1
UK London 76 66 71 2
Germany Hamburg 42 42 42 3
Austria Vienna 40 34 37 4
France Paris 30 42 36 5
Italy Rome 37 25 31 6
Lithuania Vilnius 34 28 31 7
Germany Munich 31 29 30 8
Spain Madrid 35 24 29.5 9
Latvia Riga 29 28 28.5 10
Germany Frankfurt 26 30 28 11
Ireland Dublin 30 22 26 12
Malta - 26 23 24.5 13
France Lyon 21 22 21.5 14
The Netherlands Amsterdam 19 23 21 15
Belgium Brussels 19 21 20 16
Estonia Tallinn 18 22 20 17
France Marseille 23 14 18.5 18
Spain Barcelona 25 11 18 19
Switzerland Zurich 19 17 18 20
Ireland Cork 16 13 14.5 21
Demark Copenhagen 15 13 14 22
Ireland Belfast 16 10 13 23
Greece Athens 11 14 12.5 24
Spain Seville 14 10 12 25
Portugal Lisbon 9 13 11 26
Sweden Stockholm 10 9 9.5 27
Portugal Porto 8 10 9 28
Switzerland Geneva 9 8 8.5 29
Switzerland Bern 8 8 8 30
Malta Valletta 4 1.5 2.75 31
Table 52 - European City Dimensional Overview
A selection of Europe’s larger cities have are presented in the table above. While each potential Fleet EV adopter will need to assess their own fleet individually, the table assists in comparing these cities to the cities presented in the use cases. Each operator should also consider the rate of travel in their

Page 535 of 625
location as slower travel rates will mean greater diesel consumption and lower electricity consumption resulting in higher EV autonomy on a single charge.

Page 536 of 625
5 Fleet EV Usage Patterns
The data from all vehicles registered under the category ‘fleet’ in each of the demonstration regions of Green eMotion has been correlated to provide some useful information on usage times and charge start times. Figure 221 below shows the distribution of ‘Plug in’ times for the monitored vehicles. The chart shows the times of plug in predominantly across the standard day to evening time after a work shift. The data indicates that while there are significant plug in events arising during the typical evening energy electricity consumption peak, the number of events during the daytime is still very high. This differs significantly from the private vehicle household charge events monitored in GeM WP 1, which showed a much higher level of charge events started at or during the evening peak. This indicates that the effect on the electricity system could be significantly lower on fleet vehicles than an equivalent number of private use vehicles.
Figure 221 - Plug-in Time Distributions
The distribution of start and finish times of fleets are shown in Figure 222 and Figure 223 respectively. These charts show that the distribution overlap is very close indicating that the journey times are generally short. The monitored vehicles started their daily activity at approx. 6.30 am. Last journey activity tapering off from 6pm with almost no activity after 11pm.
Figure 222 - Journey Start Time Distributions
PLUG-IN TIME DISTRIBUTION
0.00
0.50
1.00
1.50
2.00
2.50
3.00
3.50
4.00
4.50
5.00
00
:00
01
:00
02
:00
03
:00
04
:00
05
:00
06
:00
07
:00
08
:00
09
:00
10
:00
11
:00
12
:00
13
:00
14
:00
15
:00
16
:00
17
:00
18
:00
19
:00
20
:00
21
:00
22
:00
23
:00
TIME (24 HRS)
NU
MB
ER O
F EV
ENTS
0
20
40
60
80
100
PLUG-IN
%
JOUNREY START TIME DISTRIBUTION
0
50
100
150
200
250
300
350
400
450
00
:00
01
:00
02
:00
03
:00
04
:00
05
:00
06
:00
07
:00
08
:00
09
:00
10
:00
11
:00
12
:00
13
:00
14
:00
15
:00
16
:00
17
:00
18
:00
19
:00
20
:00
21
:00
22
:00
23
:00
TIME (24 HRS)
NU
MB
ER O
F TR
IP E
VEN
TS
0
20
40
60
80
100
PER
CEN
TAG
E C
ON
TRIB
UTI
ON
(%
)
JOURNEY START %
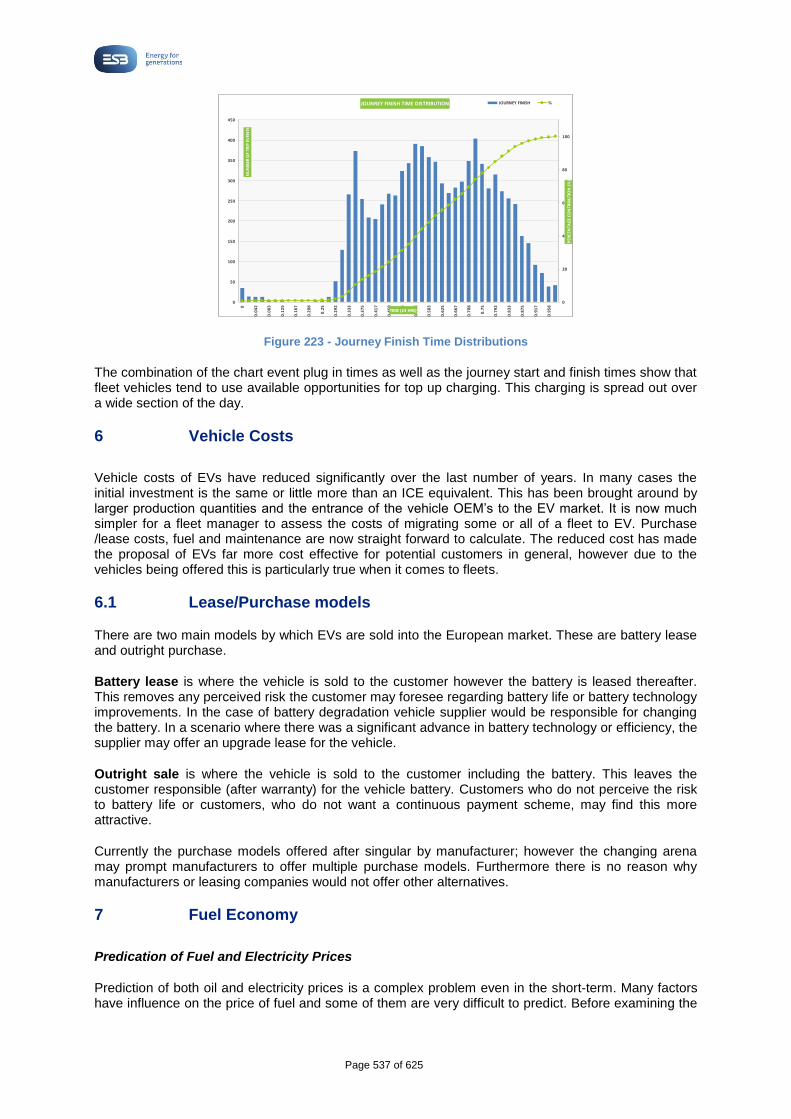
Page 537 of 625
Figure 223 - Journey Finish Time Distributions
The combination of the chart event plug in times as well as the journey start and finish times show that fleet vehicles tend to use available opportunities for top up charging. This charging is spread out over a wide section of the day.
6 Vehicle Costs
Vehicle costs of EVs have reduced significantly over the last number of years. In many cases the initial investment is the same or little more than an ICE equivalent. This has been brought around by larger production quantities and the entrance of the vehicle OEM’s to the EV market. It is now much simpler for a fleet manager to assess the costs of migrating some or all of a fleet to EV. Purchase /lease costs, fuel and maintenance are now straight forward to calculate. The reduced cost has made the proposal of EVs far more cost effective for potential customers in general, however due to the vehicles being offered this is particularly true when it comes to fleets.
6.1 Lease/Purchase models
There are two main models by which EVs are sold into the European market. These are battery lease and outright purchase.
Battery lease is where the vehicle is sold to the customer however the battery is leased thereafter. This removes any perceived risk the customer may foresee regarding battery life or battery technology improvements. In the case of battery degradation vehicle supplier would be responsible for changing the battery. In a scenario where there was a significant advance in battery technology or efficiency, the supplier may offer an upgrade lease for the vehicle.
Outright sale is where the vehicle is sold to the customer including the battery. This leaves the customer responsible (after warranty) for the vehicle battery. Customers who do not perceive the risk to battery life or customers, who do not want a continuous payment scheme, may find this more attractive.
Currently the purchase models offered after singular by manufacturer; however the changing arena may prompt manufacturers to offer multiple purchase models. Furthermore there is no reason why manufacturers or leasing companies would not offer other alternatives.
7 Fuel Economy
Predication of Fuel and Electricity Prices
Prediction of both oil and electricity prices is a complex problem even in the short-term. Many factors have influence on the price of fuel and some of them are very difficult to predict. Before examining the
JOUNREY FINISH TIME DISTRIBUTION
0
50
100
150
200
250
300
350
400
450
0
0.0
42
0.0
83
0.1
25
0.1
67
0.2
08
0.2
5
0.2
92
0.3
33
0.3
75
0.4
17
0.4
58
0.5
0.5
42
0.5
83
0.6
25
0.6
67
0.7
08
0.7
5
0.7
92
0.8
33
0.8
75
0.9
17
0.9
58
TIME (24 HRS)
NU
MB
ER O
F TR
IP E
VEN
TS
0
20
40
60
80
100
PER
CEN
TAG
E C
ON
TRIB
UTI
ON
(%
)
JOURNEY FINISH %

Page 538 of 625
factors influencing the predictions and making estimations for the short and medium term, the evolution of prices (all taxes included) in the last years will be analysed. Looking at the Figure 224, we can see that the trend in prices of gasoline and diesel41 during 2012-2013 has been irregular, with large increases followed by marked declines, with prices at the end of 2013 which are very similar to those ones at the beginning of the year 2012. The trend in 2014 has been different with a slight downward price evolution in the case of diesel and a slight upward trend in the case of gasoline prices.
Figure 224 - Oil Prices (per litre) Evolution in the Years 2012-2013-2014* in EU 28
If we extend the study42 to the period between the years 2005-2014 we can draw the first conclusions. Analyzing the Figure 225 we can distinguish two periods: 2005-2009 and 2009-2014. In the first period the trend is rising with ups and downs in the price of oil up to a maximum value from which a large drop in prices occurs. From this moment a second period of constant increasing prices takes place up to 2012-2014, period during which prices remain at a certain level with slight fluctuations. In the short term predictions can be made that this trend will be maintained at constant prices over the next few months but it is likely that the prices will increase again.
Figure 225 - Oil Prices Evolution along the Years 2005-2014* in EU 28
41 http://ec.europa.eu/energy/observatory/oil/bulletin_en.htm 42 EU Energy in figures.Statistical Pocketbook 2014

Page 539 of 625
Figure 226 - Diesel Prices Evolution along the Years 2016-2014 in countries belonging to EU 28
Figure 227 - Gasoline Prices Evolution along the Years 2016-2014 in countries belonging to EU 28

Page 540 of 625
One of the main factors influencing the price of oil is the demand that is intimately related to the production. According to an analysis of the IEA during the period 2008-2030, the world oil supply is expected to grow by 1% per year. Crude oil has many other influential factors, like decisions conducted by organizations such as the Organisation of Oil Producing Countries (OPEC) or Nation Oil Companies (NOCs), even some hardly predictable factors over time like economic crises or wars involving countries’ products as occurred in the last decades. Although the future crude oil prices and price fluctuations are difficult to predict, several forecasts with a significant variability in the oil prices can be found in Table 53 - Long Term Projections of World Oil Prices.
Table 53 - Long Term Projections of World Oil Prices
As shown in Table 53, oil price forecasts vary significantly. The most optimistic predictions are based on a drop in prices based on the decrease in demand and technological advances in the coming years. By contrast, other predictions see more likely an increase in the oil price due to a rise in demand in emerging countries and the appearance of external factors.
Unlike the global oil market where prices paid by consumers in each country are very similar, in the electricity market the situation is very different. The electricity markets are more complex than they should be and the consumer pays different price depending on the country or region where they live.
The differences between average prices and the maxima of electricity paid by consumers in Europe are very high (close to twice the average price). The dispersion of electricity for households and industry in 2013 (0.28 and 0.29) with the EU is about 3 times larger than in the case of gasoline and diesels (0.10 and 0.08 in 2014). Whilst the electricity prices by domestic consumers increased by more than 18% (3% by year) in the period 2008-2013, diesel and gasoil prices have increased 22% and 16% (4% and 3% by year) between 2010 and 2014. From this analysis we can conclude that fuel prices both for the electric car and the conventional one have experienced some increases in the same order.

Page 541 of 625
Table 54 - Electricity Prices Domestic Consumers
Table 55 - Electricity Prices Industrial Consumers

Page 542 of 625
Table 56 - Dispersion Metrics in Electricity and Fuel Price in the EU28
Regarding the prediction of electricity prices in Europe in the coming years we find a more difficult problem to solve than the one faced when dealing with oil price prediction. The price the consumer pays for each kw/h contains a lot of components and subcomponents. The three main components in the final price are the generation, transmission and distribution of the energy, and finally taxes and levies. Generation covers the cost related to delivering to the grid the energy produced, as well as the sale costs to the final consumers. The transmission and distribution costs are related to infrastructure cost, services, network losses and other charges, and finally the taxes are constituted by a combination of taxes on different administrative levels (national, regional, local etc.). Looking at Figure 22843 we realize that in some cases more than one third of what the final consumer pays for electricity is due to the taxes.
Figure 228 - Evolution of EU28 Electricity Price by Components
Looking at the figure below, we can see that the cause of the increase in electricity prices for domestic consumers is based primarily on increasing distribution costs by around 18.5% and higher taxes around 36.5%. Taxes have become a key element when it comes to controlling the price of electricity, which in most cases is used as a means to finance public spending budgets of countries. Also in times of crisis like the one that struck Europe in the period 2008-2012 this fact is more noteworthy. According to these values, it is possible to conclude that governments have many arguments to lower the price of electricity to consumers, especially to the energy that consumers use to recharge their electric cars.
43 Energy prices and costs in Europe. Document from European Commission. March 2014

Page 543 of 625
Figure 229 - Evolution of EU28 Electricity Price by Percentage Change and by Components
8 Maintenance Costs
In a similar manner to the cost of fuel for a conventional ICE car versus an EV, the cost of maintenance is also a factor to consider in relation to the total cost of a vehicle. There are various types of vehicle maintenance. Maintenance operations can be mainly classified into two types.
Routine or preventive maintenance: represents the maintenance associated with periodic operations according to the car manufacturer. Some of these operations, such as changing the oil or replacing the timing belt, are necessary to help prevent a major breakdown.
Corrective maintenance or repair is a system of maintenance that is performed after a fault or breakdown has occurred, with the goal of restoring operability to the system. In some cases, it can be impossible to predict or prevent a failure, making this type of maintenance the only option. In other instances, a system can require repairs as a result of insufficient preventive maintenance.
We can include a third type of maintenance based on replacement due to wear and aging of the vehicle parts. Such operations can be defined as safety preventive maintenance and usually are recommendations done by the car workshops based on visual inspections done in preventive or corrective maintenance operations. The tasks associated with this type of maintenance are focused on preventing the occurrence of unexpected breakdowns. (e.g. changing brake pads, tyres or windshield wiper blades). In the next sections the different maintenance costs for ICE and electric vehicles will be analysed.
Many studies tend to confirm that the maintenance costs of an electric car are lower than those from an ICE vehicle. The current chapter is intended to analyse the maintenance costs for various types of vehicles to make an estimation of the corresponding maintenance costs for the same EV counterparts.
According to a study conducted by (IFA)44 and published on 20 November 2012, maintenance and
repair costs for electric vehicles will be around 35 percent below costs of a comparable internal combustion vehicle. The Institute calculated these numbers on the basis of a small car with a lifetime of 8 years and an annual mileage of 8,000km. For ICEs, running on gasoline or diesel, maintenance and repair costs will represent on average 3,650€, when owners of a battery-electric car will only have to pay 2,350€. The main reasons are:
Elimination of oil changes
No need for replacement of exhaust systems and couplings
Regenerative breaking reduces brake wear
44 Institute for Management in the Automotive Sector (Institut für Automobilwirtschaft [IFA])

Page 544 of 625
Fewer moving parts
Electrical systems do not require frequent maintenance
Routine Maintenance Costs
Firstly, the costs of preventive maintenance of ICE vehicles will be analysed. Four categories of vehicles have been chosen based on size and usage-based vehicle classification systems worldwide.
Below the European classification is defined45.
Euro NCAP Class (1997 2009) Euro Market Segment
Supermini B-segment small cars
Small family car C-segment medium cars
Large family car D-segment large cars
Small-Large MPV M-segment multi-purpose cars
Table 57 - European Car Classification (in the case of MPV, only small category has been considered)
'Supermini''' (also called '''B-segment''' across Europe) have three, four or five doors and are
designed to seat four passengers comfortably. Current supermini hatchbacks are
approximately 3900 mm long, while saloons and estate cars are around 4200 mm long.
Today, superminis are some of the best-selling vehicles in Europe. In 2013, 22.4% of
European sales were B-segment cars. Half of the sales are covered by five models such us
Ford Fiesta, the recently renewed Renault Clio and Peugeot 208+, the VW Polo and the Opel
Corsa.
Small family refer (equating roughly to the C-segment+ in Europe) to the hatchbacks and
shortest saloons and estate cars with similar size. They are approximately 4250 mm long in
case of hatchbacks and 4500 mm in the case of saloons and estate cars. Compact cars have
room for five adults and usually have engines between 1.4 and 2.2 litres, but some have
engines of up to 2.5 litres. Popular small European family cars include the Ford Focus, Opel
Astra, Renault Megane, Citroën C4+, Seat Leon, Toyota Corolla, and VW Golf.
Large Family class (described as D-segment in Europe), these cars have room for five adults
and a large trunk (boot). Engines are more powerful than small family/compact cars and six-
cylinder engines are more common than in smaller cars. Car sizes vary from region to region;
in Europe, large family cars are rarely over 4700 mm long. Examples of large family cars
include the Ford Mondeo, Opel Insignia, Peugeot 508, Volkswagen Passat and Citroen C5.
Multi-purpose vehicles/Minivans (MPV). Also known as "people carriers", this class of cars
resembles tall estate cars are versions of small family cars fitting between the mini MPV and
large MPV sub-segments. Most compact MPVs have better "flexibility" than other body styles:
for example, seats may be individually folded or even removed. Due to the multi-purpose
architecture, the bonnet may be shorter and the passengers sit more upright than in regular
cars, providing for a roomier interior.
Larger MPVs may have seating for up to eight passengers. Being taller than a family car improves visibility for the driver (while reducing visibility for other road users) and may help access for the elderly or disabled. They also offer more seats and increased load capacity than hatchbacks or estate cars. The first vehicle to be described by that term was the Renault Scenic Some later models include the Citroën C4 Picasso, Ford C-MAX, Opel Zafira, Renault Kangoo, Peugeot Partner.
For each category the best-selling cars in Europe in 2012 have been selected. The different OEM manufacturers specify their maintenance routines according to a predefined interval of kilometres.
45 http://acdac.files.wordpress.com/2010/06/car_classification.pdf

Page 545 of 625
Typically this range varies depending on the type of vehicle and the brand. Currently the most recommended intervals are 15,000, 20,000 and 30,000 km.
The different ranges of costs for each vehicle kilometres have been obtained from Cochesnet201346, which is a Spanish service dedicated to establishing the details of every preventive maintenance stop. It includes the list of spare parts to be substituted and the corresponding labour cost. In order to calculate the different costs per kilometre, all the maintenance costs carried out in the first 120,000 km realized by each vehicle have been taken into account.
Figure 230 - Routine Costs for Conventional Cars (€/km)
Figure 231 - Routine Costs for Conventional Cars (€)
The set of spare parts that usually must be taken into account in such routine revisions are shown in the following list:
Pollen filter
Brake fluid
Refrigerant fluid
Oil
Diesel Filter
Oil Cartridge
Spark Plugs.
The elements with the largest associated costs are oil changes and the manual labour due to the fact that they are more frequent. The cost differences of the various categories are due to the frequency of predictive maintenance performed and the cost of the different spare parts. According to Figure 230 and Figure 231, the small family category has the lowest maintenance costs and the super mini category the highest costs.
46 Spanish prices without VAT (21%) as of December-2013, source:
http://www.coches.net/servicios/costes-mantenimiento

Page 546 of 625
The preventive maintenance costs of electric cars most commonly used in Europe have been collected using the same source of information used for the analysis of internal combustion engine cars. The preventive maintenance costs of 7 electric vehicles have been analysed (1 MPV, 4 supermini and 2 small family cars) with batteries capacities ranging from 16 to 24 kWh and autonomy of 130-200 km. The results are the average of all available data regardless of classification because it is difficult to have cost data relating to the maintenance.
As shown in the Figure 232 and Figure 233, where the average maintenance costs of a conventional vehicle are compared against those of an electric car, the maintenance cost per kilometre of an EV car is 42% cheaper than the one from an ICE car. That's an average saving of 540 euros per 120,000 km travelled. The savings are mainly due to two reasons. Firstly, preventive maintenance of an electric car is quite simple and only requires changes in pollen filters and brake fluids. Secondly, the revisions (new models) are less frequent (Figure 234) than in conventional cars so that manual labour is also cheaper.
We can conclude that the costs are lower in electric cars and that these costs remain virtually constant throughout the lifetime of the vehicle and this can be known in advance when we facing the decision of buying either vehicle.
Figure 232 - Routine Maintenance Costs (EV versus ICE)
Figure 233 - Total Maintenance Costs (EV versus ICE)
0.62
1.07
0
0
0
1
1
1
1
EV Average
c€/k
m
Routine costs - EV vs ICE
740
1,279
0
200
400
600
800
1,000
1,200
1,400
EV Average
€
Total costs - EV vs ICE

Page 547 of 625
Figure 234 - Distance between Revisions (EV versus ICE)
Replacement Tyre Cost
Another of the costs that we must consider when buying a car is the cost of changing tyres. The useful life of a tyre depends on many factors, driving style, tyre brand and maintenance. According to the
study47 the replacement of tyres is usually done about 35000-45000 km. In our case we have
assumed a change of tyres every 40,000km which is about 2 additional sets of tyres for 120,000 km.
Taking an average cost of tyres and the tyre size recommended by the manufacturer, in Figure 235 and Figure 236 different replacement tyre costs are showed depending on the category of vehicle. The category named Family has the highest cost due to use larger tyre size.
Figure 235 - Replacement Tyre Costs for Conventional Cars (€/km)
47http://www.ocu.org/coches/neumaticos/noticias/los-mejores-y-los-peores-neumaticos
37,143
20,875
0 5,000 10,000 15,000 20,000 25,000 30,000 35,000 40,000
EV
Average
km
km between revisions - EV vs ICE

Page 548 of 625
Figure 236 - Replacement Tyre Costs for Conventional Cars (€)
In Figure 237 and Figure 238 the comparison of replacement tyre cost for average EVs and average conventional cars is presented. If we assume that the selected electric cars mostly belong to the supermini and small family cars category, the replacement tyre cost would be slightly higher in internal combustion cars 0.41€ / km than in electric cars 0.32€ / km. This difference may be higher due to the fact that tyre wear is lower in electric cars because the load is better distributed throughout the car and therefore the frequency of tyre change can be greater than 40,000 km of conventional cars.
Figure 237 - Replacement Tyre Costs EV versus ICE (€/km)
Figure 238 - Replacement Tyre Costs EV versus ICE (€)
Repair Maintenance Cost
Repair maintenance represents those tasks associated to the fixing of unexpected breakdowns. This type of maintenance is related to how reliable each car is. The repair maintenance cost is determined by how often a car needs repairing, and how much it will cost you to fix. According to [Reliability Index 2013]48 costs data has been extracted about repair of breakdowns of over 70 models of cars of 48English prices source: http://www.reliabilityindex.com/

Page 549 of 625
different manufacturers belonging to different categories of cars and it also take account the more frequent fails. Reliability decreases as the size of the car is increased. So for example the supermini cars category is the most reliable and the MPV category cars are most likely to have faults.
The estimated cost of the replacement of wear parts that do not involve a breakdown has been also considered. Data provided by periodic technical inspections reports49 can give us an estimation of these costs. From the data analysed, these costs represent in most cases a value greater than the cost of corrective maintenance. In the following figure the average repair and wear costs are presented for the four categories of cars.
Figure 239 - Average Repair Costs for ICE Cars (€/km)
Figure 240 - Average Repair Costs for ICE Cars (€)
In the following table the percentage of faults for each type of ICE is presented (calculations made from the data of 15 cars in every category). Major breakdowns in conventional cars are associated with electrical problems (21.64%) and with faults in suspension systems (20.26%).
Supermini Small Family Family MPV Total
Air Conditioning 2.77% 6.17% 4.14% 5.50% 4.64%
Axle & Suspension 25.60% 18.96% 15.68% 20.78% 20.26%
Braking System 6.35% 10.14% 10.16% 8.63% 8.82%
Cooling & heating system 10.96% 8.90% 7.01% 5.98% 8.21%
Electrical 26.39% 21.57% 18.24% 20.37% 21.64%
Engine 9.68% 13.97% 16.72% 14.79% 13.79%
49TÜV reports, source http://www.anusedcar.com and MOT index source, http://www.motangel.co.uk
1.28
1.69
2.10
2.43
1.88
0
0.5
1
1.5
2
2.5
3
Supermini Small Family Family MPV Average
c€/k
m
Total repair costs - combustion

Page 550 of 625
Fuel System 6.51% 4.51% 11.88% 6.43% 7.34%
Gearbox 5.52% 6.34% 3.53% 6.02% 5.36%
Steering System 3.51% 5.47% 7.71% 7.08% 5.94%
Transmission 2.70% 3.98% 4.92% 4.40% 4.00%
Table 58 - Typical Faults of ICE Car by Categories
Figure 241 - Percentage of Faults in Conventional Car
In the case of the electric vehicle maintenance is cheaper compared to a traditional engine because it does not have elements whose maintenance involves its replacement with use. For example clutch, alternator, starter motor and timing belt. Furthermore, the recovery of energy in regenerative braking system of this type of cars, results in a lower wear in brake pad and brake discs than in a conventional car. Although it is difficult to have real data since most of the electric vehicles are under warranty and the repairs are carried out by authorised workshops, an initial estimation can be done. If we consider that in most electric cars certain type of breakdowns cannot occur, according to Table 58, we could estimate that the cost of maintenance of repair can be reduced by up to 60% in relation to conventional cars.
Consequently, comparing of the costs corrective maintenance per kilometre between the electric vehicle and the conventional one would be reflected in the chart below.
Figure 242 - Repair Maintenance Costs EV versus ICE (€/km)
0.75
1.88
0
1
1
2
2
EV Average
c€/k
m
Repair costs - EV vs ICE

Page 551 of 625
Figure 243 - Repair Maintenance Costs EV versus ICE (€)
One of the current limitations of using an electric vehicle is the durability of the battery and therefore the high cost. The useful life of the battery depends mainly on the number of cycles of loading and unloading, in addition to other factors such as ambient temperature and management of the charging process. In Table 59 we can see a comparative assessment of different battery technologies that includes the number of cycles, the expected service life and the cost per kWh
Battery type Energy Density Wh/kg Service Life
Cost €/kWh Cycles Years
Lead 30-50 500-1000 3-5 100-150
Nickel/Cadmium 40-60 >2000 3-10 225-350
Nickel/Metal hydride 60-80 500-1000 5-10 225-300
Zebra (Na-NiCl2) 80-100 800-1000 5-10 225-300
Lithium ion 90-120 1000 5-10 275
Lithium polymer 150 <1000 - <225
Zinc/Air 100-220 - - 60
Table 59 - Battery Technology Assessment50
If we assume that a battery can last a maximum of 1000 cycles and the autonomy of a car is around 120 km, a battery useful life of about 120,000 km can be estimated. The total cost of the battery may be around 5000 euros for a 20kWh battery standard, with an average price of 250 € / kWh. If for example the useful life of an electric car was about 240,000 km, the cost of replacing the battery would result in the total maintenance cost of the electric car being higher than that of the conventional car. This extra cost would affect less to fleet cars as they are renewed very often. It should also be considered that the cost at the end of life of the battery may be for a reconditioned battery rather than a complete new battery, which should be considerably cheaper, however as the technology has not reached this level of maturity, it is impossible to predict what this cost might be.
Total Maintenance Cost
Finally in the following graphs the total maintenance costs in euros and the average cost per kilometre of both electric and conventional cars are reflected. It should be noted that the maintenance costs has been taken from sources in different countries where prices can vary from one another. In view of the mirrored data we can draw the following conclusions:
An electric car is about 50% more economical to maintain than a conventional car. In part due
to the lower amount mechanical components which means it does not require routine
50 Internal Basshuysen R., Schäfer F., Combustion Engine Handbook: Basics, Components, Systems, and Perspectives, SAE International, 2004.
900
2256
0
500
1,000
1,500
2,000
2,500
EV Average
€
Total costs - EV vs ICE

Page 552 of 625
operations such as changing the oil, air filter, fuel, timing belt. Moreover, the breakdowns are
much lower and the replacement of wearing parts is less frequent.
The saving of the electric car can fade if replacement of the batteries when reaching a
numbers performed recharge cycles is considered.
The total maintenance costs area an average of different models and categories of vehicles
for a mileage of 120,000 km. In the case of ICE cars these costs depend on many factors. It is
obvious that the costs per kilometre will increase according to car mileage. The estimation of
costs in the EV is more difficult to determine but overall are lower than ICE cars.
Figure 244 - Total maintenance costs EV versus ICE (€/km)
Figure 245 - Total maintenance costs EV versus ICE

Page 553 of 625
9 Emissions
Electric vehicles are often dismissed as not being zero emissions due to the requirement to fuel electricity generation by fossil fuel resources. Sweeping statements are never an accurate reflection of the true state of the sector. Equivalent CO2 emissions on EVs will vary from country to country and from minute to minute. We can see from the table below that the energy mix across these sample countries varies substantially. Many of the fuel sources contained in the generation mix offer lower CO2 when it reaches the wheel than an equivalent ICE vehicle. With renewable sources offering close to zero CO2, there is advantage in most member states in the utilization of EVs. Green eMotion Deliverable D9.5 (GeM) will further evaluable the environmental impact of widespread shifting towards electricity based mobility.
Country Coal Natural Gas Oil Nuclear Hydro Renewables Diverse
Denmark 9 % 21 % 2 % 0 % 0 % 25 % 43 %
Spain 7.9 % 23.8 % 0 % 22.1 % 13.8 % 27.1 % 5.3 %
Germany 42.7 % 13.7 % 1.2 % 22.8 % 3.2 % 12.5 % 3.8 %
Sweden 4.8 % 0 % 0 % 38.3 % 45.6 % 11.3 % 0 %
Italy 12.8 % 43.1 % 1.7 % 1.2 % 0 % 35.2 % 6 %
Ireland 14.3 % 61.4 % 2.1 % 0 % 2.1 % 9.7 % 10.4 %
Figure 246 – Generation Mix Examples from Across Europe
EC member state targets for generation by renewable sources are high agenda items and are steadily increasing the renewable generation share. This increase in sustainable energy goes further to driving down the equivalent CO2 emissions of EVs. Furthermore development of smart charging systems which will allow increased preference of renewable sources while charging your vehicle can further facilitate renewable sources by allowing load balancing at times of renewable instability.
Fleet usage of EVs can assist substantially in the renewable goal. Particularly where there are a number of vehicles used at a single depot, charge management systems can be utilized to gain greater reductions in energy prices. This utilisation of charge management can be very beneficial to electricity system control.
10 Noise
Noise has always been an environmental challenge to mankind. In many cities throughout medieval Europe, it was not allowed to go by horse or in horse carriages during night hours because of the disturbance of sleep. Even in ancient Rome restrictions was made to prevent iron wheeled wagons to disturb nightly sleep.
In modern society, ambient noise, and traffic noise in particular, is louder and wider spread than ever before. It has huge effects on humans and wildlife alike and today it is a well-known fact that noise affects health and has a large impact on people’s life and the wellbeing of the society in whole. Quiet areas are scarce and continuously grow smaller. Noise disrupts communication, sleep, concentration and rest and generally affects our quality of life. There are also indications that prolonged exposure to traffic noise can cause effects on the cardiovascular system and create stress. These effects on health not only affect the individual citizen, but also infer large social and economic costs.
Today, about 40% of the population in the European Union, about 200 million people, suffer from noise levels exceeding 55 dB, a level potentially dangerous to health. Additionally, 30% of the population, about 150 million people, are exposed to levels above 55 dB at night. One should then

Page 554 of 625
bear in mind that the recommendations from World Health Organization (WHO) is 33 dB during night-time51.
Some groups are more vulnerable to noise than others. Children are highly affected since they spend more time in bed than adults. To mention some examples, noise has an effect on learning, motivation and potentially blood pressure. Other groups that are more sensitive to noise are chronically ill, elderly, shift workers and less affluent citizens52.
Except from the severe costs of health and convenience of people, traffic noise also has a tremendous economic cost for society. In Europe, the social cost of traffic noise is estimated to be about 40 billion Euro each year, or about 0.4% of the Gross Domestic Product (GDP). In those estimates, 90 % of the noise comes from passenger cars and trucks53.
Studies calculate vehicle noise as the sum of noise produced by a number of factors, such as tyre contact to surface, aerodynamics, engine sound, horns and braking. At low speed, engine sound and drive train are the dominating factors, while aerodynamics and tyre noise are dominant in higher speeds54. This makes the relatively silent electrical motor interesting to have a real potential to reduce noise levels in our cities. In urban traffic, electric vehicles (EV) are less noisy than vehicles with combustion engines at slow speeds. However, when the speed exceeds about 20 kilometres per hour, an electric car is as noisy as a car with an internal combustion engine2 since the tyre and aerodynamic noise factors take over.
In an urban environment, electrical vehicles may be one piece of the puzzle solving the traffic noise challenge. EVs together with technical advancements and efforts in areas such as more silent tyres, silent pavement and speed reductions, could challenge traffic noise in Europe in near future. In urban areas a commercial EV fleet could have large impact. This has been investigated and demonstrated before and the impacts of noise reduction are large55 56. Exchanging heavy duty vehicles such as trucks and busses into low-noise electric alternatives could potentially reduce the noise pollution in urban environments, especially in noise sensitive situation such as in residential areas or deliveries in noise restricted areas.
11 Other factors
Fleet Managers and the Benefit of EVs
From a vehicle fleet point of view the GeM Project is focused on the deployment and use of Plug-in Hybrid and Battery Electric Vehicles, collectively referred to as EVs, across the full range of types or vehicle classes. The use of Hybrid Electric Vehicles that do not cater for plug-in charging from the grid do not form part of the GeM fleet as these vehicles do not require electrification of the transport infrastructure and more crucially would not contribute the quanta of energy savings being sought by 2020. Typically, ICE powered vehicles consume between three and five times more energy based on the full life cycle when manufacture, fuel consumption and disposal of the vehicle are calculated as compared to Plug-in hybrid and Battery EVs.
51 Hurtley, C., Bengs, D. ed., 2009, Night noise guidelines for Europe, World Health Organization, Regional Office for Europe, Denmark 52 Genuit, K., Fiebig, A., 2010, Psychoacoustics for the creation of acoustically green city areas, 23-27 August. Sydney, Australia, ICA 2010 53 den Boer, L.C, Schroten, A., 2007, Traffic noise reduction in Europe. CE Delft, March 2007 54 Victoria Transport Policy Institute, 2009, Transportation cost and benefit analysis – Techniques, estimates and implications, sec. ed. [pdf] Victoria, Canada. Available at: http://www.vtpi.org/tca/tca0511.pdf [Accessed 25 June 2012] 55 McMorrin, F., Anderson, R., Featherstone, I., Watsoi, C. ed., Plugged-in fleets – A guide to deploying electric vehicles in fleets, EV20. Available at: http://www.theclimategroup.org/_assets/files/EV_report_final_hi-res.pdf [Accessed 1 august 2012] 56 Douglas, C., Quit deliveries demonstration scheme (QDDS), Final Project Report, Department for transport, London. Available at: http://assets.dft.gov.uk/publications/quiet-deliveries-demonstration-scheme/quiet-deliveries-demo-scheme-final-project-report.pdf [Accessed 1 August 2012]

Page 555 of 625
The energy savings associated with the full life cycle of EVs are not as yet fully reflected in projected cost of ownership as is always the case with an emerging technology and the associated market conditions. However, the incentives and benefits on offer to the purchasers of EVs seek to offset the initial capital cost for the early adopter.
EVs for Goods Deliveries in Cities & Urban Areas
The use of EVs for goods delivery in city centres and urban areas is one of the most attractive options from a fleet manager’s point of view. Firstly, given the duty cycle and range associated with goods deliveries EVs are inherently more efficient in dealing with traffic congestion, stopping and starting and with the parking associated with loading and unloading. As with private users of EVs a capital grant or a refund is available to the purchaser of a new vehicle. However, in many jurisdictions an Accelerated Capital Allowance or write off is available to the business investing in the purchase of an EV or EVs for the vehicle fleet.
Accelerated Capital Allowances for Electric Vehicles
Capital Allowances allow a business to gain relief from Corporation Tax on money spent on capital equipment purchases such as vehicles. The relief is received by allowing the company to reduce its taxable income by an amount equal to the pre-tax value of the asset. The company therefore “writes down” the asset against profits. They normally must do this over an 8 year period so 1/8th or 12.5% of the capital value of the asset is written down each year until 100% write down has been achieved at the end of year 8.
The total value of the relief to the business is therefore equal to 12.5% of the pre-tax value of the asset. Under normal Capital Allowances, this total benefit accrues over an 8 year period so. 1/8th of the relief is received each year.
Under Accelerated Capital Allowance (ACA) schemes, 100% asset write down is permitted in year 1 allowing the full value of the tax relief benefit to be received in year 1 thus helping to stimulate a greater cash flow for the business. ACA is intended to stimulate businesses to buy more energy efficient products which include Electric Vehicles and their associated charging infrastructure.
GeM Project & Fleet Managers
Fleet Manager’s need to be appraised of the savings and benefits of a transition to EVs in the vehicle fleet and vehicle dealers and energy agencies within the regions should consider special marketing and promotional initiatives to highlight the potential savings and benefits with reference to actual Case Studies on Goods Deliveries with EVs such as:
Virtuous Sustainable EV Cycle for Cities: Climate Change Strategies – Reduction in CO2 emissions & Noise - EVs in fleets –Liveable Urban Centres– Healthy Cities initiative – The benefit of a transition to widespread deployment of EVs in fleets needs to be highlighted as a Virtuous Cycle for Cities
GeM is demonstrating the viability and economic costs associated with the deployment of EVs in fleets which can be seen to support the viability of City centre strategies based on Pedestrian Priority Zones, Restricted Access, Zero Emissions Zones, Low Emissions Zone, Clean Zones, Quiet Night-time Deliveries and Clean Air strategies as implemented throughout European cities. The need to extend these measures both in terms of range and impact requires a comprehensive deployment of EVs in both public and private fleets. A strategy of undertaking commitments by cities on CO2 emissions and Noise reduction would contribute to the uptake and deployment of EVs to a very significant extent.
The more sustainable modes of transport comprising walking, cycling, public transport and EVs are essential to secure liveable and healthy cities for the future. If cities begin to commit to Climate Change reductions in CO2 combined with reductions in Noise, the deployment and uptake of EVs will increase in the manner envisaged by policy makers to deliver reduced unit costs for vehicle fleets.
The widespread deployment of EVs in vehicle fleets is an essential prerequisite to the establishment and maintenance of healthy cities for the future in Europe and globally. The electrification of transport infrastructure as reflected in the term ’electro-mobility’ is a key to a sustainable future in Europe as demonstrated by partners on GeM.

Page 556 of 625
There is a clear advantage in terms of fuel economy for the EVs versus the conventional vehicles. In terms of savings it is expected an average of 80% if we compare, for example, an EV van and a conventional van. In order to the assess the total impact in Europe economy it will be needed to undertake a deeper study that will take in to account the available EV technology capacities and ranges to be compared against their counterparts conventional vehicle. To estimate the total potential savings in fuel economy it will be required to estimate the figures of vehicles devoted to fleet operation, and their spending in fuel.
12 Potential in Electric Vehicle Fleets (2014)
Electric Cars
Sales of electric cars in Europe still represent a relatively small percentage compared to the total car sales. This percentage in most European countries is below one percent of total sales. However, sales data57 in 2013 seem to indicate that there is a reason to start believing that the electric car starts off in Europe as it is depicted in Figure 247. The trend is growing in some European countries and the rates of selling electric cars in 2013 have reached a rate of 6.2 with respect to total sales in Norway (The share of EVs in new sales reached 12% of new vehicle registrations in November 2013) and of 4.2 in the Netherlands.
In other countries such as France, Germany and UK, sales of EVs have experienced a growth rate of 50% in 2013 from the year before despite that its market share is still below 1%. In late 2013 there were over 60,000 new electric cars running on European roads.
Figure 247 - EV Sales by Country in Europe 2011-2013
57 Electric vehicles in Europe: gearing up for a new phase? Amsterdam Roundtable Foundation and McKinsey & Company The Netherlands April 2014

Page 557 of 625
In 2014 the sales data of 100% electric vehicles are encouraging with an increase of 79% in the first half of the year compared to the six months of 2013. If we analyse the data58 in Figure 248 we see that Norway is the country with the highest number of sales (9550 cars sold in the first half of 2014) with an increase of 300%, which is the highest value of all countries. Germany, with 4230 sales and an increase in the percentage of 78%, and UK with an increase of 120% to reach 2570 units are two countries where the EV is gaining momentum. Although sales in France have fallen by 12% in the same period, the 6405 vehicles sold show that in this country the electric car is going to continue improving its sales.
Figure 248 - Electric Car Sales in Europe in the First Half of 2013 and the First Half of 2014
If we analyse the data published by Eagle AID59 that only takes into account pure electric vehicles by the end of July, the overall number of records exceeded 31,000 units. This is probably almost two times higher than last year at the same time. From the sales in March 2014, which are shown in Figure 249, we realize there was a maximum of 6705 car sales registered.
58 http://evobsession.com/europe-electric-car-sales-77-2014/ 59 AID Europe´s leading automotive industry newsletter

Page 558 of 625
Figure 249 - BEV Registrations in Europe in 2014
If we analyze the sales evolution of electric cars by model obtained from [EV-sales blog]60 we can see that in a large number of the models the sales have increased, reaching in some case over 11,000 units sold during these nine last months in 2014, as it is depicted in Figure 250. Most models have surpassed over this same period the total sales of 2013. The increase in the number of sales is primarily due to the acceptance by the consumer of the new models that appeared at the end of 2013 or the new models which have been launched during this year 2014.
Figure 250 - Sales 100% EV in Europe by Model in 2013-2014
These numbers indicate that in Europe around 50,000 vehicles could have been sold at the end of the year 2014 without included plug-in and hybrid cars. Although it is still a small portion of the European car market, the electric car is becoming a reality.
According to 2014 updated data, sales of pure electric cars have exceeded expectations with around 63,500 purely electric cars sold and about 28,000 units of PHEV. This means that more than 100,000 electric vehicles (BEV+PHEV) have been sold during 2014 which represents approximately a 50% increase over 2013. Note that 5 models of purely electric cars covering 50% of total sales of electric cars in 2014.
It is very difficult to predict what will be the evolution of sales of electric vehicles on the market in the next five years. Across Europe, a greater variety of hybrid electric, plug-in hybrid and battery electric vehicle models are being offered by manufacturers each month. In some cases are new models; in others are improvements over existing ones. This coupled with improved battery technology will make
60 http://ev-sales.blogspot.com.es/

Page 559 of 625
to grow up the electric car market day to day. By 2020, Pike Research61 forecasts that more than 1.8 million electric vehicles will be on Europe’s roadways, along with 1.2 million plug-in hybrids and 1.7 million hybrid electric vehicles. Six European countries will represent the 67% of the total market of pure electric cars in 2010, Germany, France, Norway, United Kingdom, the Netherlands and Sweden.
Figure 251 - Vehicle Sales by Electrified Drivetrain, European Markets: 2012-2020
61 http://electriccarsreport.com/2013/01/pike-forecasts-1-8m-evs-on-european-roads-by-2020/

Page 560 of 625
Urban Delivery Electric Cars
The market for electric commercial vehicles has not reached the expected forecast as shown in the figure below. Although various OEMs pushed for the launch of various models of electric vans, only one model has made an impact on the market. For some types of business and in certain locations, such as urban environments, electric vans are a suitable alternative to ICE vans. There are a number of factors however that may limited sales or mean that fleet managers may not replace ICE vehicles with EVs; 1) the price of the electric vans must reduce, 2) the range of the vehicles must increase and 3) the fossil fuel price must remain the same or increase.
Figure 252 - Main Electric Commercial Vehicles Sales in Europe (2013-2014)
E-bikes
Electric bicycles are becoming increasingly popular in Europe. There are many advantages for cycling either for personal or business use. One advantage is that the electric motor helps you in your pedaling and makes it easier to get up your speed. Another benefit of using e-bikes in the urban environment is that they help you avoid traffic and thus reach your destination in less time. The e-bike boom in Europe has emerged in the last years according to data from Association of the European Two-Wheeler Parts62 as we can see in the following chart. In 2013 e-bike sales reached nearly a million units in Europe. This market is not only linked to the particular use but even some shipping companies are now using electric bikes to deliver packages in different European countries.
Year 2006 2007 2008 2009 2010 2011 2012 2013
EPAC Sales (x1000) 98 173 279 422 588 716 854 907
Evolution % 76,53 61,27 51,25 39,34 21,77 19,27 6,21
Table 60 - European Electric Power-Assisted Cycles (EPAC) Sales in Europe (2006-2013)
Within Europe, Germany covers 45% of the sales of e-bikes, followed by Holland with 21%. Growth in bikes sales have fallen in the last year in Europe. In countries such as Germany sales dropped 5.5%, even countries like Holland, with the highest per capita bicycle usage of Europe, the sales only increased by 9%. Despite this data, the next chart from Pike Research shows strong growth for e-bikes for Europe by 2018. According to this data about 2 million electric bikes will have been sold in Europe in 2018. Of this number a part could be focused on sales of e-bike for delivery companies.
62 EUROPEAN BICYCLE MARKET 2014 edition. Association of the European Two-Wheeler Parts& Accessories ‘Industry

Page 561 of 625
Table 61 - Electric Bicycle Sales by Region, World Markets: 2012-2018
Electric Taxi in Europe
There are more than one million taxis in Europe. They constitute an important share of the means of passenger movement in European cities and account for 5% of the European local public transport. More than one million people are employed in the European taxi industry. This is about 8% of all employment in the European transport sector.
If we compare the data63 to the amount of taxis that existed in 2007 in some major European countries, we can see that taxis constitute a significant fleet where EVs can make an impact. At present, this data can’t have changed much due to regulations in many countries. For example, in Spain there were 70,623 taxis in 2012 and in Norway approximately 8414 taxis, values that are very close to the ones shown in next Figure.
Table 62 - Total Number of Taxis in European Countries
63 Improving access to taxis. European Conference of ministers of transport and International Road Transport Union. 2007

Page 562 of 625
Although taxi fleets are pioneers in the use of new technologies due to the fact that they were one of the first fleets that used hybrid cars (in Paris alone there are over 800 hybrid taxis), the introduction of the EV has not caught on among taxi drivers. The taxi is thought to be used daily in small trips, with short runs punctuated by stops which cover high numbers of kilometres per year in urban environment. For all these reasons the taxi is the suitable vehicle to be replaced by an EV. Some fleets in Europe and owner-drivers have adopted the electric taxi as vehicle. Here we detail some experiences in the use of 100 % electric taxi.
Rotterdam Taxi Centre (RTC) (The Netherlands)
One of the biggest taxi operators in the Netherland has put into service two electric taxis BYD e6 at the beginning of 2014. This company is considering purchasing more electric cars after around one year's trial time with much positive feedback.
Amsterdam TAXI-E (The Netherlands)
The Dutch company was the first private taxi service to switch to a fleet full electric taxis in November 2011 with 10 electric taxi. In 2014 Taxi-E operates a fleet of 25 Nissan Leaf with 1.5 million km taxi operations. The Taxi Electric will be the first taxi company to add the new model Nissan of electric van, the e-NV200 to its fleet.
Cornish C&C taxis (UK)
A C&C taxi was the first taxi cab operator in the UK to add an electric taxi to its fleet in May 2013. A year after, C&C has five electric taxis and have clocked up 150,000 km in one year with an estimated saving of around €50,000. Today plans to add all electric minivan to its expanding electric vehicle fleet.
London Thriev (UK)
In February 2014 the taxi operator launched a fleet of 20 zero-emission fully-electric cars BYD e6 electric mini cabs in London. The car has a range of up 186 miles and the 20 private hire will be recharged both at the depot and on the road. A rapid charger was installed at Thriev’s Edgware Road facility with a capability of charging the EV battery to 80% in just 30 minutes.
Dublin National Radio Cabs (NRC) (Ireland)
A 100% electric Nissan Leaf has been part of a trail between ESB ecars and NRC. It has clocked up over 55000 km on Dublin roads over 18 months. The results are a fuel savings of over €6500 and a net reduction in over four tones of CO2 emissions.
Rome Taxi 3570 (Italy)
Taxi 3750 will be the first company to introduce electric taxis in Italy. Two taxis Nissan Leaf will operate in Rome as part of the Taxi 3570 fleet running on the streets of the Italian capital at the end of 2014. This trial has a goal to improve the quality of life and savings of Taxi 3570 drivers and to transform the taxi service in Rome.
London, eConnect cars (UK)
eConnect cars is a London company with the goal to manage a fleet comprising entirely of electric vehicles. Since January 2014 they own seven Nissan Leafs and intend to supplement the fleet with another 14 EVs by the end of 2014.
Nottingham DG Cars (UK)
DG Cars has become the first taxi firm in Nottingham to add electric cars to their vehicles line-up. The company has purchased six Nissan Leafs, with the view of adding more if the electric taxis prove popular with passengers.
Phoenix Taxi (UK)
Phoenix Taxis is one of the North East's largest taxi operators with over 170 vehicles on the road. Phoenix was the first taxi firm in the North East of the UK to put Nissan’s LEAF on as a taxi at the end

Page 563 of 625
of 2012. With real-time savings of €6,400 a year in fuel, the company has expanded its fleet and will have 15 Leafs on the road by summer 2014.
Electric Taxis In Lisbon (Portugal)
The municipality of Lisbon will provide financial incentives to promote fleet renewal, towards electric mobility, during 2014 in order to support the acquisition of 20 new electric taxis, which will replace old internal combustion engine vehicles. In August 2012 a Lisbon owner-driver José Ferreira replaced his diesel-powered taxi with a Nissan LEAF. He has driven more than 15,000 kms so far, covering 80-100 kms a day.
Spanish Experiences (Spain)
In 2011 Roberto San Jose was the only electric taxi owner-driver in Spain. With his Nissan Leaf he has travelled more than 77,000 km on the roads of the city of Valladolid. He estimates a fuel saving about €8,200 in relation to his previous diesel powered taxi. Other owners have opted for the electric taxi as a tool of their trade in other Spanish cities such as Barcelona, Madrid, Zaragoza, Seville, Bilbao, Valladolid, Pamplona, Asturias and Teruel.
Electric Taxi Conclusions
As we have seen there are a lot of successful experiences of use of electric taxis in Europe however it still has not taken off in many countries in Europe. Maybe some of the reasons may be the following:
Today there are still not many models of electric cars that meet the characteristics for use as
taxi.
The autonomy of electric vehicles does not allow the use of the electric car as a taxi in cities
where medium and large distances are covered in the routes.
Infrastructure is unsuitable with insufficient recharging points in the cities.
Perhaps when these problems can be solved, most taxis traveling on cities across Europe will be
100% electric vehicles. According to IDTechEx report64 the total market for electric buses and taxis will
multiply over 8 times in the next decade. It is only a matter of time that these predictions become in reality. The numbers of experiences that are emerging in European cities are growing day by day and this implies that the taxi drivers are increasingly convinced that the taxi to be driven in the future will be an EV.
Table 63 - Number of Electric Taxis sold 2012-2017 in Thousands
64 IDTechEx report Hybrid and Electric Buses and Taxis 2013-2023: Forecasts, Opportunities, Players

Page 564 of 625
13 Conclusion
The EV has made large strides in technology, availability of infrastructure and price points over the last number of years. Many EU member states have made significant steps to facilitate and encourage the use of EVs. Vehicle manufacturers are expanding their ranges and are offering improved driving autonomy in newer models. All of these factors, combined with rising fuel prices, have made EVs more attractive to fleets than ever before. The use cases assessed also identified clear advantages of EVs in fleets while many of the obstacles encountered are being addressed already. The use cases provide a good basis to assist fleet managers in making an informed choice as to suitability of the technology.
The additional areas where taxis, car pools and urban deliveries have been explored demonstrate how the technology works effectively in both the moderate climates as well as the more temperate climates across Europe. Fuel efficiencies are less favourable where heating or air conditioning is used, however even here the benefits are still clear above the internal combustion alternative.
An expansion of the analysis of both fuel consumption and maintenance costs establishes that on both counts the EV shows significantly advantages over petrol or diesel vehicles. Maintenance costs are significantly less over the lifetime of the vehicle, with fewer moving parts and no engine oils to change. Furthermore the cost of maintenance is far more linear for EVs over the lifecycle of the vehicle, making fleet budgeting a more straightforward prospect.
Further vehicle offerings with the capability of fast battery recharging mean that the effective range requirements of more fleets fall into the operating parameters of an EV. Having identified the clear reduction in cost, and understanding the tight margins that most logistics companies encounter, the choice of EV has become a real opportunity for competitive edge.
An overview of a selection of large and recognisable cities across Europe sets a measure by which potential adopters can gauge the demonstration cities with that of their own location.
At this point, the application of fixed route buses shows high potential; however the cost of operation and maintenance is still an obstacle, posing a challenge to bus operators when considering migration to electric technologies. Cars and small vans have reached a point where the fleet manager can easily assess the suitability of the application and identify the clear benefits of adopting the EV technology.
It is clear from the use cases demonstrated that many of the myths and perceptions commonly associated with EVs are no longer true to the current offerings. The time has come where EVs are practical, reliable and cost effective in fleets.

Page 565 of 625
Work Package 7.3
Green eMotion Marketplace Report

Page 566 of 625
Table of Contents
1 Introduction .........................................................................................................................567
2 System Architecture ...........................................................................................................567
3 The Marketplace ..................................................................................................................567
4 ESB Demonstrations ..........................................................................................................568
4.1 Objectives .............................................................................................................................568
4.2 Roaming ................................................................................................................................568
4.3 Search ...................................................................................................................................569
4.4 Outcomes ..............................................................................................................................571
5 Conclusion ...........................................................................................................................572

Page 567 of 625
1 Introduction
The Green e-Motion project of which ESB ecars has been a key contributor was established with the goal of creating an electromobility-based framework to enable the widespread roll-out of electric vehicles throughout Europe. A significant element of this was concerned with the design of a mechanism to facilitate the development of a fully integrated and interoperable charging infrastructure, capable of supporting international roaming and related value-added services.
Technical solutions were to be specified and implemented, and trials undertaken on a pan-European basis in order to demonstrate in a real-world scenario how the features and services would operate.
Built on an advanced ICT-based foundation, the over-all solution would be scalable, and would be flexible enough to support the needs and demands of the emerging electric vehicle industry into the future.
2 System Architecture
The system architecture proposed by Green e-Motion is based on a highly distributed, interconnected B2B platform enabling the contracting and delivery of a range of electromobility related services – both ICT and otherwise -- between service providers and service requesters on a pan-European basis. The services offered cover a variety of functional areas, including those required to enable charging of electric vehicles, those needed to facilitate international roaming for EV users, and those involved in providing advanced energy management capabilities. The environment is termed the EV-services market, and is facilitated by a single centralised service broker component or “Marketplace”. The marketplace is realised through a software-based system, providing the necessary functionality to enable authorised entities to offer their own services, or contract and make use of those made available by others. In addition, it provides the necessary technical connectivity mechanisms to enable integration with a multitude of distributed systems and components in a standardised way, acting as a hub / gateway for message forwarding and exchange. The over-all model is extremely scalable, offers strong transactional / commercial integrity, and minimises barriers to entry, thus providing a fast and efficient method of rolling out different types of services as they become available. Figure 253 shows the Green eMotion marketplace architecture.
Figure 253 - Green eMotion Marketplace
3 The Marketplace
The marketplace platform is built on IBM’s Websphere Commerce product suite. It provides a range of web interfaces through which business partners can publish and manage their service offerings, as

Page 568 of 625
well as enabling the contracting and subsequent monitoring of service contracts entered into with other entities. In the background, it facilitates the implementation of various web service interfaces, and relevant business logic for B2B contract management and verification. Individualised accounts for each business partner are used to provide access, and appropriate security mechanisms are employed to guarantee system and communication-level security. A formalised business partner validation / registration process is provided to ensure only appropriate entities are granted access to the system. A screen-shot of active marketplace contracts as of end 2014 is shown in Figure 254.
Figure 254 - Marketplace Contracts
4 ESB Demonstrations
4.1 Objectives
As part of ESB’s involvement in the project, the objectives were to implement and demonstrate functionality associated with the provision of international roaming services, together with a mechanism for publishing real-time charging network status and availability information.
In order to make this possible, it was necessary to advertise or publish the relevant services on the marketplace, and to “consume” or contract those provided by other business partners.
4.2 Roaming
The fundamental objective of the roaming demonstration was to provide a mechanism which would allow EV users from Ireland travel abroad, and seamlessly use the charging infrastructure located there, irrespective of charging station operator. Existing RFID cards would be used to activate charging sessions just as they would within Ireland. Ultimately, usage data would be transferred from the “visited” network operator to ESB ecars upon termination of a charge session, enabling subsequent billing and settlement related activities to be performed.
An important component in the delivery of a system capable of providing a roaming service is a clearinghouse., This entity is in general tasked with validating and verifying B2B and B2C contracts, as well as optionally providing financial clearing type functions to enable end-user as well as inter-

Page 569 of 625
operator billing. Within Green e-Motion, the clearinghouse application was built and operated by SAP, and was made available as a standard marketplace service. Partners wishing to enable international roaming for their users first needed to establish a contract with SAP for use of the clearinghouse. This contract was specified and closed by ESB ecars using the Marketplace administration tool described earlier.
As well as the functionality provided by the clearinghouse, each individual partner was required to implement specific business logic and / or web service interfaces in their back-office systems. Since the objective for ESB ecars was to allow its users charge internationally, it was necessary to implement 2 web service interfaces – the “Authorize” interface and the “SDRForwarding” interface. The purpose of “Authorize” is to provide user validation / authorisation functions, and the “SDRForwarding” service is used to receive and process details of charging events undertaken by its users on partner networks. Since all business partners are connected via the marketplace and / or clearinghouse, all required web-service interfaces must also be built and supported by such intermediaries. Thus – the clearinghouse was also required to implement the “Authorize” and “SDRForwarding” services.
Figure 255 - Clearing House and Authorization
In addition to the technical work outlined above, it was also necessary to establish a direct contractual agreement between ESB ecars and other network operators. In this situation – ESB – as the EV Service Provider – effectively “signed” a commercial agreement with 3rd party charging network operators describing the commercial terms on which its customers could use the services offered by the partner entities. For the purposes of the demonstration, a template was used to simulate a commercial contract. Permission was granted for ESB ecars users to charge their vehicles on the charging infrastructure operated by Green e-Motion partners RWE, Enel, Iberdrola, Endesa, Bosch, and the City of Malmo. Standard ESB ecars branded 4-byte Mifare RFID cards were subsequently shared with the aforementioned organisations, and relevant real-world demonstrations and field trials conducted. Records of the various charging transactions were received and processed by the ESB ecars back-office systems.
4.3 Search
The primary aim of this particular demonstration was to make the location and status information for all charging stations on the ESB ecars charging network available via a single central web portal. This would enable EV drivers to efficiently plan their journey, based on real time charge station operational and status availability information. Relevant data for each charging station such as connector type, method of charging, opening hours, and access requirements would empower the driver, serving to greatly reduce range anxiety and to create a positive user experience, leading to increased levels of driver satisfaction.
To make this possible, ESB ecars chose to implement a mechanism for sharing its chargepoint location and availability information with external entities. This was based on a set of web service

Page 570 of 625
operations as specified within the Green e-Motion project. The operations implemented were defined as “ProvideEVSEMasterData”, and “ProvideEVSEStatusData”. The former was primarily concerned with sharing static chargepoint information such as geolocation, opening hours, access requirements etc..., whilst the latter was focused on the actual real time operational availability and status of each charging station and its associated connectors.
Technically, the data was made available via a pull-based mechanism. This approach is extremely lightweight, promotes re-use, and is inherently designed to provide a continuous feed to external systems, whilst requiring minimal systems integration work on the part of the data provider.
Simply put - it involves making the data available at a unique endpoint or Internet address. Entities wishing to access it are required to make a request to the service, just as they would if accessing any other piece of data on the Internet such as a standard webpage. Since the access pattern follows the standard request / response method commonly used on the Internet, the over-all scheme is described as a pull-based mechanism.
As part of the demonstration, project partner Siemens built and delivered the front-end component i.e. a map-based web portal, which provided a single unified and integrated view of all charging stations available throughout Europe. In addition, they also implemented the back-end capability to integrate with data providers such as ESB ecars. To facilitate the demonstration, Siemens configured there system to “pull” the charging station location data once every 7 days, and the availability information every 15 minutes.
The underlying data was described in the common Green e-Motion data model, allowing concepts such as charging pools, charging stations, plug types, connector status etc... to be realized. Both web service operations were defined as per the interface definitions, and standard communication / data transfer mechanisms were employed to simplify systems integration. Support for the initial release of the over-all functionality was supported in late 2013, with the capability to fully support the final release added in 2014.

Page 571 of 625
Figure 256 - EVSE Search Web Portal
4.4 Outcomes
Both the search as well as the roaming demonstrations were successfully implemented and executed by ESB ecars. Functionally, the over-all system design and technologies chosen were proven to be capable of delivering the required services. However, a number of weaknesses in current deployments and infrastructure roll-outs were identified.
A distinct lack of standardization in the area of RFID card technology was clearly evident. Multiple card types are in use amongst operators of charging networks, readers are not always compatible with certain card types, the unique identifiers on each card are sometimes read in reverse (endianness), and the ability to encode information such as a user’s account / contract id directly on to the cards is not always available. This is an extremely serious problem, given the number of charging stations already installed throughout Europe. Standardization / harmonisation between all parties involved is urgently required to address this issue if RFID cards are to be used to enable roaming. Furthermore, with the introduction of NFC-based technology, care must be taken to ensure that compatibility is a fundamental requirement from the outset.
The widely geographically distributed nature of charging network infrastructure has resulted in the use of cellular networks to provide connectivity between charging stations and back-office systems. Given the relative immaturity of M2M solutions, the reliability / dependability issues inherent in cellular-based connections, and idiosyncrasies apparent in application-level protocol implementations such as OCPP, it’s not always possible to guarantee an adequate level of connection quality. This “unreliability” was found to have significant implications for both the search and roaming services

Page 572 of 625
demonstrated. More work is required in this area to put in place a more robust solution, capable of achieving a higher level of availability and reliability than is currently offered.
Fundamental to the provision of electromobility services delivered via IT systems and platforms is the standardization of the underlying data model, interface definitions, and information exchange formats. The initial work done in the Green e-Motion project in this area has provided a solid base to allow technology demonstrations to take place. However, the solutions proposed represent just a subset of that which will be required to enable a fully functioning EV industry. ESB ecars is active in developing a common language for data transfer, sharing and processing across all ICT platforms, together with the eMi3 group – made up of major stakeholders from the EV industry. Publishing a set of interoperable standards as early as possible is essential in order to allow the industry to move forward as a single cohesive unit, capable of delivering the types of services that will be required and demanded by users of electric vehicles into the future.
5 Conclusion
ESB ecars benefited significantly from its involvement in the Green e-Motion project. Working collaboratively with stakeholders on a pan-European basis made it possible to share knowledge and experiences on the various EV initiatives underway, their achievements to date, and areas for improvement. Making use of a centralised marketplace for offering, contracting and consuming services provided a convenient, efficient mechanism for bringing together the relevant players from around Europe. Valuable lessons were learned from implementing both the search and roaming services described above, chiefly in the area of interoperability. A considerable amount of the work done on implementing the back-office IT systems can be re-used, in particular the search functionality, which will become a key part of the ESB ecars Digital offering over the next number of months. Whilst the goal of demonstrating a Europe-wide ecosystem based on a centralised marketplace for the delivery of electromobility services was successfully achieved, it is clear that significant work remains. It is vital that efforts to standardise the data models, business objects, and interface definitions continue as a matter of urgency. In the absence of standardisation, there is a huge risk of fragmentation occurring, which has in turn the potential to directly impact in a negative way on the uptake of electric vehicles both in Ireland as well as internationally.

Page 573 of 625
Work Package 7.4
IT and Standardisation

Page 574 of 625
Table of Contents
1 Introduction .........................................................................................................................575
2 Organisational Identifier (EVSP / EVSEOP ID) .................................................................576
3 Customer Account Identifier (EVCOID / EMA ID) .............................................................576
4 Charging Station Identifier (EVSEID) ................................................................................577
5 Data Model / Attribute Lists ...............................................................................................578
6 Chargepoint -> Back-Office Communications .................................................................578
7 Interface Specifications ......................................................................................................579
8 Charge / Service Detail Records ........................................................................................579
9 Conclusion ...........................................................................................................................580

Page 575 of 625
1 Introduction
Fundamental to the roll-out of the types of advanced IT services needed to support the development of a fully integrated electric vehicle ecosystem is the specification, harmonisation and standardisation of the underlying data objects, communications protocols, and system-to-system interfaces. The creation of an interoperable environment, based on a single common language, capable of delivering a rich and compelling set of EV services to the EV driver is required in order to support the widespread uptake of electric vehicles globally.
Given the immaturity of the industry, the vast majority of the necessary technical standards have not yet been developed. This inherent lack of standardisation exists across all areas of the ecosystem, from the charging stations themselves, to the protocols used to communicate with the corresponding back-office systems, right the way through to the communication pathways, system interfaces and message exchange flows which facilitate inter-network connectivity.
Through pilot projects undertaken in various countries in recent years, proprietary approaches to system design have emerged, driven by the need to develop prototype implementations for the purpose of conducting trials and technology demonstrations. This has led to much fragmentation and poor infrastructure utilisation, in particular in the US, where numerous charging networks exist as “islands”. In Europe however, thanks to initiatives such as the EU-funded Green e-Motion and Mobi Europe projects -– both of which ESB ecars has participated in, as well as initiatives such as Hubject and e-clearing.net, excellent progress towards putting in place a framework for a fully integrated pan-European charging network has been made.
In addition, under the auspices of ERTICO, the eMI3 group (eMobility, ICT, Interoperability, Innovation) was founded in 2013 with the objective of developing, publishing, sharing and promoting ICT standards for the EV industry. The group is comprised of significant players from around the world, who possess a shared interest in the EV space, and who have a common focus on the long-term development of a sustainable industry. Never-the-less, the current lack of standardisation – both de-facto as well as formal continues to present an immediate and significant issue for all concerned.
This chapter will identify the specific areas where standardisation is required. It will outline the reasons why it is required, describe all relevant efforts to achieve same, and give details of how ESB ecars is working with all relevant industry stakeholders to create an ecosystem which is fit for purpose and which will be capable of supporting the development of the EV industry into the future.
Page 576 of 625
2 Organisational Identifier (EVSP / EVSEOP ID)
A mechanism for uniquely identifying operators of charging infrastructure and entities offering eMobility services to drivers of electric vehicles is needed. The purpose of these identifiers is to facilitate user authentication / authorization, route inter-system messages to the appropriate location and to enable billing related activities. Without such a scheme, the provision of interoperable services on a global, commercially scalable basis would be impossible to achieve.
A centralised authority with specific responsibility for assigning these unique identifiers to organisations based on their role, as well as for the subsequent maintenance and associated lookup of these values needs to be put in place. Such an entity must be commercially independent, operate in a transparent manner, and be capable of managing the necessary systems and processes efficiently and effectively.
During the lifetime of the Green e-Motion project, FIR – The Institute for Industrial Engineering at the RWTH University Aachen, Germany was responsible for assigning these codes to partner entities, and the relevant IT platform operated by the consortium members was used for subsequent management and lookup. A similar approach was adopted within Mobi Europe, and both the Hubject and e-clearing.net initiatives use their own internal mechanisms to manage the process. Going forward, the eMI3 group are assuming responsibility for this centralised role. How it will function technically remains an open question.
An initial attempt at standardising the identifiers was undertaken by DIN – the German institute for standardisation – in 2011 through specification 92186. The provider identifier was defined to be a 3-character alphanumeric string, whilst the operator id was specified to be a 3-digit number (as per the number schemes defined in ITU-T E..164:11/2010).
Further work towards standardisation was done within the eMI3 group, where the provider identifier remained as a 3-character alphanumeric string, and the operator id was modified to also become a 3-character alphanumeric string. These definitions were designed to be backward compatible with those defined by DIN. They were subsequently accepted and incorporated into ISO/IEC15118-2 Annex H.
ESB ecars is fully supportive of the standardisation efforts underway within eMI3 in relation to these identifiers. Current proposals would seem to adequately meet the requirements, however an open question remains as to how the role of the central assigning authority and process co-ordinator will operate.
3 Customer Account Identifier (EVCOID / EMA ID)
In order to facilitate true mobility of users across territories and charging networks, as well as subsequent billing and settlement related activities, a universally recognisable format for a customer contract account is necessary. The significance of this will grow as interconnectivity amongst charging networks increases, and as the need for end-user and inter-operator billing and related financial clearing activities emerges.
The first attempt at defining such a concept was undertaken by DIN – the German Institute for Standardisation in 2011. In specification 91286, the concept of an EVCOID (electric vehicle contract identifier) was introduced. This identifier needed to be guaranteed to be unique beyond organisational and country boundaries. It was defined to be a string made up of 3 primary components – a country code (in the form of a 2-character alphanumeric value), a provider identifier (a 3-character alphanumeric value), an instance element (a 9-character alphanumeric value representing the actual customer account with the provider), and a check digit, included for verification purposes. Providers were free to assign the “instance” value as per their own internal scheme for customer contract identification.
This definition was further refined by the eMI3 group, leading to it being specified as the EMAID (eMobility Account ID) in specification ISO/IEC15118-2 Annex H.

Page 577 of 625
The EMAID is closely aligned with the DIN specification, incorporating the existing concepts of country code, provider id, instance identifier and check digit, together with an “ID type” element which is always given as “C” to denote “Contract”. This definition was designed to be backward compatible with that specified by DIN. In addition, the EMAID has been submitted to NEMA (the National Electrical Manufacturers Association) in late 2014 for standardisation in the US.
ESB ecars currently operates its own internal mechanism for assigning customer accounts, based on an alphanumeric string designed to be uniquely identifiable within its own systems. However, the authorisation / initiation of charging events at charging stations continue to be done via RFID card UIDs. Through its involvement in the Green eMotion project, ESB ecars was assigned both a provider as well as an operator identifier. These served as a basis for the generation of EVCOIDS which were subsequently used by the marketplace and clearinghouse as part of the regional demonstrations.
ESB ecars fully supports the concept of an EMAID. It provides a simple and straightforward mechanism for capturing and identifying customer accounts on a global scale. As previously stated, uncertainty still remains around the formalisation of the central authority tasked with assigning the provider and operator identifiers, as well as the technical approach chosen to implement this in practise. Additional work is required in this area before the use of EMAIDS can become ubiquitous.
4 Charging Station Identifier (EVSEID)
Similarly to uniquely identifying a mobile device such as a smartphone, it must be possible to individually identify an electric vehicle charging station irrespective of its geographic location – and more specifically – a distinct plug / connector on that particular station. Termed the EVSEID, this identifier must be guaranteed to be unique beyond organisational and country boundaries.
DIN, the German Institute for Standardisation initially defined this in specification 91286 in 2011 to be a string comprised of the following 3 individual elements - a country code (ITU-T E.164:11/2010), a spot operator id (3-digit numeric value), and a power outlet id (37 alphanumeric characters).
A directory of spot operator identifiers was to be issued and maintained by a nominated centralised assigning authority tasked with performing this role.
eMI3 have now assumed responsibility for specifying the EVSEID. The DIN specification has been further refined, leading to it being specified in ISO/IEC15118-2 Annex H.
It does however remain closely aligned with the original DIN specification, incorporating the existing concepts of country code, spot operator id, instance identifier, together with an “ID type” element which is always given as “E” to denote “EVSE”.
Similar to the specification of the EVCOID, the country code is now a 2-character alphanumeric value taken from ISO-3166-1, and the spot operator identifier has been modified to become a 3-character alphanumeric string. This definition was intended to map to German EVSEIDS for a period of 2 years from the time of standardisation, to ensure compatibility with existing infrastructure deployments.
The specification has been submitted to NEMA (the National Electrical Manufacturers Association) in late 2014 for standardisation in the US.
ESB ecars operates its own internal mechanism for assigning identifiers to charging stations, based on an alphanumeric string designed to be uniquely identifiable within its own systems. This can be combined with a country code, and a spot operator identifier to produce an internationally recognisable EVSEID. This was proven during technology trials conducted as part of the Mobi Europe project, where an EVSEID was encoded as part of a QR-code which was then subsequently interpreted by a smartphone application in order to demonstrate an innovative method of initiating a charging event.
The benefits of a universally recognisable charging station identifier are clear. eMI3 and the other relevant parties involved in defining the standard have produced a specification which fulfils the requirement for a highly scalable solution to the problem. The next step requires the relevant entities

Page 578 of 625
to put in place the appropriate processes and technical solutions to allow the identifiers to be used in the provision of charging services.
5 Data Model / Attribute Lists
In order to facilitate the sharing of relevant information between charging network operators, service providers, and all other entities involved, a common understanding of the underlying business objects is necessary. The role of business objects is to model and encapsulate the various components or items which make up a specific business domain. They provide a modular, concrete representation of each part of same, facilitating seamless and flexible integration between diverse systems and platforms.
Some of the key business entities in the electric vehicle ecosystem which have been identified for standardisation include the EVSE operator, EV service provider, EVCOID, EVSEID, charging station (ePOI), and the charge detail record (CDR). Business objects are described using a combination of properties, attribute lists, and other associated business objects.
Historically, EV pilot projects have tended to make use of proprietary business objects, leading to the emergence of closed systems. This impacts significantly on the ability to integrate with other systems, making it necessary to employ complex translation techniques in order to achieve consistency.
The primary standardisation efforts in this area are being led by the business objects subgroup of eMI3. They are initially focused on defining identifiers (such as those described above), and the charging pool / station entity. Modelling the charging station is a non-trivial exercise, due to the variation in charging equipment design / composition. Descriptors such as the geographic location, access permissions, opening hours, and the range of services offered at the location all need to be considered. This work will broaden to cover records of charging transactions, as well as pricing related data. It is of paramount importance that a standardised, consistent definition of these objects is specified in a timely manner.
ESB ecars is fully supportive of the on-going standardisation efforts, and is looking forward to implementing a range of user-centric applications and services based on the prescribed standards as soon as possible.
6 Chargepoint -> Back-Office Communications
The general operating model is for a charging station to be monitored, managed and controlled through a centralised management or back-office system. The communications channel linking both entities is delivered over a cellular network, which is generally GPRS or UMTS-based.
A number of protocols exist to control charging station hardware. These are both proprietary and non-proprietary. In order to promote interoperability, to prevent vendor lock-in, and to ensure robust and sustainable charging networks, the adoption of a non-proprietary protocol is recommended. The most widely deployed protocol today is the Open Charge Point Protocol, OCPP, currently being used to control over 10,000 charging stations in over 50 countries.
As the name suggests, this protocol is completely open, is charging station as well as management system agnostic, and is free to use. Maintained by an organisation known as the Open Charge Alliance, which promotes openness and interoperability.
OCPP defines and specifies the various operations / functions to be provided by the charging station and the central system respectively, as well as the corresponding message content and formats to be exchanged. Built on top of standard Internet technologies – namely the traditional TCP/IP transport mechanism, it makes use of HTTP for message delivery, and SOAP or JSON to add structure. To date, 2 versions of the protocol have been released; version 1.2 in 2010, and version 1.5 in 2012. The next major update is version 2.0, due for release in 2015.

Page 579 of 625
OCPP is progressing along a path towards standardisation. It is currently recognised as the de-facto standard for charging station to central system communications in Europe. Formalised activities relating to the protocol’s on-going development, certification and promotion are being led by the Open Charge Alliance, of which ESB ecars is a founding member. eMI3 are also active in this area through the charge station protocols working group.
ESB ecars believes that building charging networks – and the EV ecosystem as a whole -- on open protocols and standards is the only way of guaranteeing a sustainable future for the industry. This view is reflected in the significant role ESB ecars has played in the development of OCPP since its inception. As a founding member of the Open Charge Alliance, we look forward to further developing the protocol into the future, and contributing to its standardisation and wide-spread adoption.
7 Interface Specifications
The basis for information exchange between interconnected systems is the business object. In order to facilitate transfer of such entities, clear and concise interface definitions must be specified, together with a description of the required data formats and message exchange mechanisms.
Harmonising such interfaces represents a significant challenge, particularly in the roaming domain, where various architectural approaches to the provision of a roaming platform exist. These include the single hub / marketplace approach, the multi-marketplace approach, the peer-to-peer approach, the clearinghouse approach, as well as variants and combinations of same. To encourage interconnectivity, and in order to foster competition amongst marketplace operators, the necessary interfaces must be specified in an architecturally independent manner.
The various European initiatives – Green eMotion, Mobi Europe, Hubject and e-clearing.net have each specified their own proprietary interface definitions. These cover not only roaming related services, but also those concerning areas such as parking, searching of ePOI information, and activities relating to the management of the additional load placed on electricity networks by electric vehicles. The eMI3 group have now assumed responsibility for specifying a reference IT architecture for the entire ecosystem, which in turn will feed the eventual definition of a set of standard interface specifications.
Experience has shown that the use of proprietary interfaces has contributed greatly to the lack of available implementations, used for purposes other than trials or functional demonstrations. Organisations are reluctant to invest the necessary time and effort in order to integrate their systems using a proprietary interface specification, which may or may not continue to exist and / or to be maintained into the future. Until such time as standard interface specifications are agreed and published, it is envisaged that the range of services – including roaming -- will continue to be limited, and where available - will be mostly ad-hock in nature, and will be primarily based on bilateral arrangements between organisations. ePOI data is particularly relevant for the automotive OEMs, who are keen to achieve standardisation in order to be able to offer appropriate information and services to the EV driver via their in-vehicle infotainment systems.
ESB ecars is fully supportive of the work being done by eMI3 in this area, and looks forward to the timely publication of the interface specifications in order to begin the role-out of commercially available applications and services.
8 Charge / Service Detail Records
To facilitate inter-partner settlement and subsequent user-billing operations for all types of transactions, the exchange of charge or service detail records is necessary. These records are intended to model and encapsulate the specific details of different types of transactions, such as charging events, reservations, parking space usage etc. Some of the information to be captured includes the transaction start / end time, services used, user contract details, energy consumption (based on individual and periodic meter read values), and potentially cost / pricing details.
Much standardisation is required in this area, not only with regard to the design of the records themselves, but also to the business processes and rules around how inter-partner or wholesale

Page 580 of 625
settlement and associated financial clearing should take place, and the contractual and regulatory frameworks needed to facilitate the potential sale and subsequent billing of energy across organisational as well as jurisdictional boundaries.
In the absence of commercially viable business models for the EV industry in general – both on a local level as well as internationally, pilot projects to date have focused on defining and developing the functional system components needed to put in place solutions and platforms for the purposes of technology demonstrations.
Various specifications for the definition of a CDR have been proposed. The Green e-Motion version advocates an over-all Service Detail Record which can be further broken down into other more specific records depending on the business context - such as the Charge Data Record. This itself can be comprised of multiple entries containing individual meter read values taken at periodic time intervals during the course of the recharge event.
Mobi Europe defines a more abstract concept - the transaction. This is intended to provide a generic specification for any type of service – charging, parking, etc... It takes a very simple approach - describing the transaction in its totality, and doesn’t allow for the encapsulation of per-interval meter readings. Neither approach has gained much traction within the industry, other than being implemented as part of over-all trials, including those undertaken by ESB ecars.
The eMI3 Group are active in this space also, and are working towards the specification of a suitably comprehensive CDR. However, as the number of EVs remains low, inter-network energy usage is generally being viewed as insignificant, the cost of which is currently being absorbed by the charging network operators. This is resulting in more emphasis and a higher priority being placed on standardisation efforts in other areas – namely the specification of data objects and system-to-system interfaces.
Although interoperability and inter-connectivity between charging networks are significant issues particularly in central Europe, they are less important in Ireland. This is due primarily to the integrated nature of the over-all charging network, where a single management system is used to operate and control the infrastructure deployed right across the island. Furthermore, being a relatively isolated island nation located on the extreme west-coast of Europe, the number of EV tourists expected to visit would be extremely low. As a consequence, ESB ecars – at least in the short term – doesn’t see the standardisation of a charge detail record as being a significant priority.
9 Conclusion
The need for standardisation of many of the elements which make-up the electric vehicle IT ecosystem is clearly evident. To enable the industry to grow in a scalable, sustainable and cost-effective manner, integrated and interoperable charging infrastructure, advanced driver-centric applications, and appropriate back-office operational and billing systems are required.
The various initiatives and pilot projects underway around the world have identified the specific areas in which standardisation efforts should be concentrated.
Through the formation of the eMI3 group, significant progress is being made. However, as a consequence of the large number and cross-industry nature of the stakeholders involved, each with their own particular needs and requirements, achieving consensus and agreement is challenging. This in turn is leading to delays, which is having a significant impact on the pace at which the rollout of the necessary systems and services can proceed.
We have seen OCPP emerge as the de-facto standard for charging station to back-office communications. The open nature of this protocol, combined with the inclusive approach to its specification, represents an excellent model of what can be accomplished when the industry works collaboratively for the common good.
There is no doubt that the burgeoning industry will ultimately suffer should standardisation efforts fail, or in the event that multiple conflicting standards emerge, such as occurred in the great VHS vs

Page 581 of 625
Betamax war of the 1980s. The necessary safeguards / steps to ensure that a similar scenario is avoided is absolutely essential.
ESB ecars is very much a supporter of the standardisation efforts, and continues to work with all relevant industry stakeholders to specify, develop and promote same.

Page 582 of 625
Work Package 7.5
Technology Report Green eMotion

Page 583 of 625
Table of Contents
1 Introduction .........................................................................................................................584
2 Inductive Charger ................................................................................................................584
2.1 Introduction ...........................................................................................................................584
2.2 The Democase ......................................................................................................................585
2.3 Technical Description ............................................................................................................586
2.4 Results ..................................................................................................................................587
2.4.1 User Experience ....................................................................................................................587 2.4.2 Possible Issues with the Inductive Charging System ...........................................................588 2.4.3 Suggested Improvements .....................................................................................................588
2.5 Conclusions ...........................................................................................................................589
3 Soft Open Point ...................................................................................................................590
3.1 Introduction ...........................................................................................................................590
3.2 Test Setup .............................................................................................................................591
3.3 Test Procedure ......................................................................................................................593
3.4 Results ..................................................................................................................................594
3.4.1 Power Transfer ......................................................................................................................594 3.4.2 Power Quality Measurements ...............................................................................................595 3.4.3 Thermal Imaging ...................................................................................................................596 3.4.4 Noise Measurements ............................................................................................................596
3.5 Conclusions ...........................................................................................................................598
4 Fast Charging ......................................................................................................................599
4.1 Introduction ...........................................................................................................................599
4.2 EV Sales in Ireland ................................................................................................................600
4.3 Results ..................................................................................................................................601
4.3.1 Installation .............................................................................................................................601 4.3.2 Electrical Supply ....................................................................................................................602 4.3.3 Queuing .................................................................................................................................603
5 Conclusion ...........................................................................................................................604

Page 584 of 625
1 Introduction
This report describes the technology demonstration in Ireland of Green e-Motion developed solutions namely; Inductive Charger, Soft Open Point and DC Fast Charging.
2 Inductive Charger
2.1 Introduction
Inductive charging has been used in the electric vehicle industry since the mid-1990s mainly through the Magne Charge (J1773) inductive charging system which used an inductive charging paddle to charge vehicles such as the EV1 and Chevy S10. The EV1 and the Magne Charge paddle are shown in the figure below.
Figure 257 - EV1 and Inductive Charging Paddle
An example is shown in the figure below of an inductive charging bus in the City of‘s-Hertogenbosch in The Netherlands in 2012. Primary coils are installed at a number the bus stops allowing boosts during the route with standard and fast conductive charge points at the bus terminus.
Figure 258 - Inductive Charging Bus with Primary and Secondary Coils
It is obvious that the wireless power transfer (WPT) has several advantages compared to the conductive system. Inductive charging provides a clean, cable free method of charging a vehicle while it is parked. The convenience of not having to plug a vehicle into conductive charging infrastructure will optimize the use of short time slots for charging. The accumulated short time slots are expected to offer significant opportunity to increase autonomy of the vehicle.
The objective of the demonstration case was to learn more about the potential benefits of induction charging as well as driver attitudes and impacts of the technology on the local electrical networks. The physical installation will be assessed considering the safety of the system for wide scale installations as well as the requirements and connection processes which will be encountered. A further objective is to assess the suitability of this technology in other interest areas, such as taxi areas and private home installations.

Page 585 of 625
2.2 The Demonstration case
The Induction Charging demonstration case for Green eMotion sees the retrofit of induction charging coils in a Nissan Leaf as well as the installation of corresponding primary coil, power electronics and switchgear for the controlled charge of the vehicle. The prototype was designed by fake, Siemens, and Alstom.
Inductive charging was demonstrated at ESB’s Head Office in Ireland. The location of the area was chosen to allow a controlled test space while providing an opportunity to allow visiting stakeholders to view the process and developments. As the vehicle was a modified version of the Nissan Leaf, a small group of 5 users were chosen to be suitably trained in the operation of the induction charging equipment. Some pictures of the inductive charging installation in ESB Head Office are shown below.
Figure 259 - Induction Charging Setup
Figure 260 - Modified Nissan Leaf
Figure 261 - Induction Charging Cabinet

Page 586 of 625
Figure 262 - Primary Coil
Figure 263 - Emergency Stop Button
2.3 Technical Description
This section describes the basic operating mode of inductive power transfer. For a full description refer to Green eMotion Deliverable 5.4. The following figure shows the general technical concept of the inductive charging system:
Figure 264 - Concept of the Inductive Charging System

Page 587 of 625
Compared to charging based upon conduction, the inductive charging has the following advantages:
Easy and comfortable operation
Driver will not have to get out of the car and get his hands dirty
No standardisation efforts of wired plugging systems
No risk of forgetting to plug in the vehicle at the end of the parking
Safe against vandalism, misuse/abuse and environmental influences (e.g. humidity)
No negative impact on the cityscape (all devices are hidden in the ground)
At the end of the parking, most of the time the vehicle is available for vehicle-to-grid applications.
All these advantages bring nonetheless some challenges that also need to be discussed. The wireless energy transmission is not that efficient as the conventional conductive charging. To minimize this effect, the coils should be positioned exactly concentrically about each other. A radial displacement can reduce the charging current at the EVs power train significantly. Furthermore, the integration of inductive charging spots in the existing infrastructure is more complex to realize than building of charging stations for plug in charged vehicles.
For inductive charging, three major groups can be identified for the energy transmission system:
1. Transmitting unit (rectifier and converter, embedded in the primary power electronics) 2. Inductive transmission path (coil pair and wireless communication system between the electric
vehicle and the power grid) 3. Receiving unit (rectifier and traction battery)
The energy that is supplied by the power grid provides a three phase alternating current. This current has to be rectified, glazed, and converted in a high frequency square wave voltage to power the primary coil of the transmitting unit and to minimize transmission losses. The generated magnetic field induces a current into the receiving coil in the car. Since the battery must be supplied by a direct current, the current flow is again rectified and stabilised by the power electronics.
The inductive charging unit installed in ESB Head Office provides a demand of 3.7 kW. That means that a 20 kWh traction battery will be recharged in about five and a half hours. This prototype is expected to show how this charging system behaves during normal use by the consumer. Whether this option has realistically potential in future applications must be evaluated by analysing the experiences made during the test trial phase.
2.4 Results
2.4.1 User Experience
In order to commence a typical conductive charging session the user must pull the release tab for the charging cap, remove the charging cable from the EV and plug the connector into both the vehicle and the charge point. With the inductive charging system the user is only required to park the EV in the correct place and press a single button. This creates a more user friendly experience as:
Tripping hazards are eliminated as the is no charging cable,
Extra time outside the vehicle in possible inclement weather conditions is avoided,
Wear and tear on the charging cable and connectors is reduced,
There is no possibility of a charging cable being locked in a charge point or stolen

Page 588 of 625
2.4.2 Possible Issues with the Inductive Charging System
Timer
The trial vehicle, and most modern EVs, have built in timers which allow the user to define a specific charging session start time. This can be important to the user, as they can avail of off-peak electricity tariffs, but can also be important to the electricity system operators as it can prevent overloading during peak times. Even with conductive charging systems this can cause issues as the charge points can fail to “wake-up” when the start time occurs. The existing timer functionality of the conductive charging vehicles must be mirrored with inductive charging whilst avoiding the potential “wake-up” problems.
Weather
The inductive charging system has not been extensively trialled in extreme weather conditions. While it is unlikely that these weather conditions will affect the charging process, certain unforeseen hazards may occur. An example of this is when the primary coil is covered with snow when a charging session starts. The heat generated may melt the snow, which may subsequently refreeze and create a slipping hazard around the vehicle. Conversely a primary coil which is subjected to intense sunlight followed by a charging session may reach excessive temperatures which may be harmful to humans or animals.
Pacemakers
The impact of the inductive charging system on people with pacemakers is to be further defined.
Metal Debris
Any metallic object on the primary coil is likely to heat up when a charging session is in progress. This may lead to combustion of other material such as litter or leaves. The inductive charging system designer have however recommended that the primary coil be inspected before use. This will almost entirely eliminate the risk of fire.
2.4.3 Suggested Improvements
Reversing Camera
Nissan offer a reversing camera as an optional extra on the Leaf. The vehicle used for the inductive charging trial is the base model which does not have a reversing camera. A reversing camera would assist the user in lining up the EV with the primary coil.
Guidance System
The EV must be manually driven so that the secondary coil is directly above the primary coil. Control of the stopping distance is achieved by the use of wheel-stops however the lateral position of the vehicle is not controlled and the user must estimate the correct position. A guidance system on the vehicle, possibly integrated into the centre console would greatly assist the user in achieving correct alignment and hence maximum power transfer. On a rudimentary basis, a guidance system could consist of cross-hairs integrated into the reversing camera display. A more sophisticated system would involve the use of visual and audio guides as provided in modern parking assist systems. The ideal solution would consist of a self-drive system whereby the user instructs the EV to automatically align the coils correctly. This would also eliminate the requirement for physical barriers such as wheel stops or bollards.
CHAdeMO Fast Charging
The inductive charging system has been integrated into the trial vehicle by using the CHAdeMO interface. This required the removal of the CHAdeMO socket and hence the elimination of the option of fast charging the trial vehicle. If this system is to be implemented on a commercial basis it is recommended that a system is developed that will allow a maintaining of the ability to fast charge.

Page 589 of 625
Primary Coil and Cabling Flush Surface Mounting
The existing primary coil and supply cabling is designed to be surface mounted. An effort has been made to reduce the tripping hazard associated with the surface mounting by designing filleted edges on the primary coil and cable covers on the supply cables. The tripping hazard would be completely eliminated by designing a surface flush primary coil which is supplied via a ducted cable. It is noted however that this will increase the distance to the secondary coil unless a coil mating system is developed.
Charging During Ignition Mode
With the standard Nissan Leaf it is possible to turn on the internal auxiliary systems during a charging session. This is achieved by pressing the push button ignition switch. This allows the user to monitor the state of charge, use the radio along with many other features. This functionality is not available in the trial vehicle as the charging session terminates when the ignition button is pressed.
Size of Charging Cabinet
The physical size of the inductive charging cabinet is such that it would occupy quite a large area in a domestic setting. For commercialisation of the product it is recommended that the size of the cabinet be reduced.
2.5 Conclusions
From the results gathered in the demonstration case, and after interviews with the trial participants we can establish a number of clear conclusions:
Induction charging is seen as a cleaner tidier alternative to conductive charging.
The positioning of the vehicle over the induction pad is unilaterally seen as a difficult task although this is believed to have been impacted by the parallel parking position of the vehicle. Alternative guidance systems have been proposed.
The charge instigation and subsequent termination process is seen as a very straightforward task.
When asked about the substitution of induction charging over DC fast charging, the drivers agreed that while the vehicle functioned satisfactorily for them in the car poll scenario, it would have been a negative consideration if they were to have been choosing a vehicle under broader operating parameters such as home and family profiles.
The inclusion of induction charging as an option in vehicles likely to be used by service providers where vehicles are used back to back would offer a strong likelihood of adoption. The opportunity for range extension of the vehicle in day to day use is significant enough to add value for a fleet manager.
Induction charging should be offered in parallel to other charging technologies rather than a substitution. This is particularly true for Fast charging technologies however may be of less importance for AC slower charging, where the vehicles are used in confined circuits and stopped at a fixed terminus at regular intervals.
The drivers using the technology consider that if the technology were available as part of the higher specification comfort levels within the vehicle, they would be encouraged to purchase the option.

Page 590 of 625
3 Soft Open Point
3.1 Introduction
The Soft Open Point (SOP) is a prototype device provided to ESB by Alstom Grid as part of the Green eMotion project. The device was installed at ESB Networks (ESBN) Portlaoise Training School, Portlaoise Town, County Laois, Republic of Ireland with commissioning and testing taking place on Monday 19th of January 2015 from 10:00hrs to 18:00hrs by staff from ESB and Alstom. The ESBN training school contains a live network of utility assets with voltage levels ranging from 38kV to low voltage (LV) and hence the SOP was installed in a network which represented a typical scenario while still maintaining a controlled environment. The tests involved load transfer across the SOP with associated power quality measurement, thermal imaging and noise measurement.
The SOP device is designed to connect two adjacent feeders, typically with an existing normally open (N/O) point, and controls the power flow between those feeders as shown in the figure below.
Figure 265 - Overview of SOP*
The power transfer can be set to a constant value (for commissioning), but normally the references are set automatically to reduce any measured AC voltage difference between the two feeders. In internal components inside the SOP cabinet are shown below.
Figure 266 - Internal Components in SOP Cabinet*
* Images taken from Alstom SOP Operating and Instructions Manual

Page 591 of 625
3.2 Test Setup
The SOP is a LV device and was installed at a normally open (N/O) point in the existing network at Portlaoise Training School. Feeder 1 from the N/O point was supplied from Odlums MV/LV 200kVA Substation. Feeder 2 was supplied from St. John’s MV/LV 400kVA Substation. The network diagram is shown in the figure below.
Figure 267 - Test System Network Diagram
The physical SOP setup is shown below. The mini-pillar in the foreground is the normally open point. The mini-pillars to the left and right are simply supply points to the SOP.
Figure 268 – ESB Networks Portlaoise Training School Setup

Page 592 of 625
The SOP is housed in a standard utility cabinet. The SOP with its doors open and closed is shown in the images below.
Figure 269 - Soft Open Point on Site
Two resistive load banks were installed adjacent to Odlums Substation and St. John’s Substation. The two load banks used had characteristics as follows: 250kW, 400V, 3-phase 50Hz. The SOP is rated for 50kW load transfer and hence the load banks were not used to their full capacity. Images of the load banks are shown below.
Figure 270 - Load Banks

Page 593 of 625
3.3 Test Procedure
The tests involved variation of the load on the individual load banks and subsequent power transfer through the SOP. Automatic and manual current transfers were used. The tests specifically undertaken are shown in the table below.
Test Scenario Number Description
1 No load
2 10kW at Odlums, 0kW at St. John’s
3 20kW at Odlums, 0kW at St. John’s
4 40kW at Odlums, 0kW at St. John’s
5 40kW at Odlums, 10kW at St. John’s
6 Single Phase Fault
Table 64 - Test Scenarios
It is noted that advanced load balancing algorithms developed by Alstom were not implemented as part of the test due to the location of the load banks (substation adjacent) and the associated change in network impedances from the reference model.

Page 594 of 625
3.4 Results
3.4.1 Power Transfer
The graphs below were provided by Alstom and show the voltage, current and power measured at the SOP during the test scenarios. Note that the test scenarios as listed in the table above were not sequential. The measured values corresponded with the power quality measurements taken at Odlums Substation (see section below).
The first graph shows the 3-phase voltages on both sides of the SOP device. The second graph shows the 3-phase currents on both sides of the SOP. The third graph shows the power flow on both sides of the SOP. The test scenarios as listed in the table above occur in the region shown in the graphs as seen by the step changes in current and power. The single phase fault is clearly shown at approximately 17:28 hrs. This is particularly evident on the voltage graph.
Figure 271 - Graph of SOP Measured Parameters

Page 595 of 625
3.4.2 Power Quality Measurements
Power Quality Measurements (PQM) were taken during the test in order to compare and verify the data measured by the SOP. The PQM meter used was a Fluke 435 Power Quality Analyzer which was located in Odlums substation. For voltage input, crocodile clips were placed on the substation low voltage bus-bars. For current input, Rogowski coils were looped around the outgoing low voltage feeder cables. A picture of the setup is shown below.
Figure 272 - Power Quality Measurement Setup
As per the sample screenshots below, the PQM meter has the ability to display “Power & Energy”, “Volts/Amps/Hertz” and “Harmonics”. The “Power & Energy” and “Volts/Amps/Hertz” samples taken concurred with the values measured by the SOP. The SOP does not measure harmonic content and therefore the PQM meter values for harmonics were noted. The percentage of current total harmonic distortion (ITHD) varied from a minimum of 2% to a maximum of 13.8% depending on the status of the SOP. The maximum value of ITHD occurred when 40kW of power was being transferred through the SOP. It is noted that the maximum value of ITHD of 13.8 % compares with previous harmonic measurements taken by ESB of similar devices (electric vehicle fast charge points). Large values of ITHD may have a detrimental impact on expensive utility assets including ageing of transformers and cables and may require over-sizing of neutral conductors. Additionally certain harmonic frequencies can stimulate resonant conditions on venerable networks.
The effect of the harmonics produced by the SOP in a real life scenario would depend on the network topology and pre-existing harmonics. It is recommended that PQM are taken in a number of installation scenarios in order to define the SOP impact on existing systems. Additionally more extensive or network specific filtering could be incorporated into the SOP.
Figure 273 - Power Quality Measurement Screenshots

Page 596 of 625
3.4.3 Thermal Imaging
In order to measure the temperature of the SOP during the test a thermal imaging camera was used. The test scenarios were not designed to maximise the temperature of the cabinet as this process was already completed in Alstom’s test lab. The thermal imaging camera however captured the temperature in an outdoor real system implementation. The camera was located at a distance of 6.3 metres from the SOP. The thermal imaging camera setup is shown in the figure below.
Figure 274 - Thermal Imaging Camera
During the test 9 separate thermal images were taken when the SOP was in use. Two thermal images are shown below which showed the maximum and minimum temperatures recorded.
Figure 275 - Thermal Images
The temperature of the outer surface of the SOP cabinet reached a maximum of 6.9°C. This is determined as within acceptable limits for a public installation however it is noted that the test was not undertaken during maximum ambient air temperature conditions. Further thermal testing is recommended during warm weather conditions and with more continuous load transfer.
3.4.4 Noise Measurements
The noise produced by the SOP during previous factory testing was highlighted as a potential negative aspect of the device. Noise measurement, using a standard sound meter, was completed during the on-site test. The reading from the sound meter varied from 54.6dB to 88dB during the test. It is noted however that the load banks used during the test dominated the noise level in the area and hence the measurements do not represent a real live scenario whereby the load noise would not be significant.
It is noted that the SOP is a prototype device and was not designed to limit noise. Any noise issue would be easily addressed in next version units though the use of noise suppressing materials and insulation.

Page 597 of 625
Applications
The SOP has a number of potential applications. As an example, two such applications are described below.
Figure 276 - Feeding Scenario 1
In the feeding scenario shown in the diagram above, the industrial load is at its peak during the day. The SOP allows power transfer from the residential substation to the industrial load thus minimising the overload of the industrial substation and keeping industrial customer voltages within limits. During the evening the residential load is at its peak. The SOP allows power transfer from the industrial substation to the residential load.
Figure 277 - Feeding Scenario 2
In the feeding scenario shown in the diagram above, if a particular feeder (Residential Substation 2) has a high penetration of EVs and the utility is observing transformer overloading or excessive voltage drops, the SOP can be installed which will allow transfer from the lightly loaded feeder (Residential Substation 1). Alternatively, if and when V2G is available, the residential feeder with EV can be used as a load control for the non-EV feeder.
As shown in the scenarios above, the SOP has the potential to balance load and control voltages on venerable feeders. This has cost saving implications for utilities as expensive assets such as transformers, cables and overhead lines will not be overloaded. Adjacent networks may not require upgrades and hence planning costs can be minimised. Penalties incurred due to customers experiencing excessive voltage changes will be avoided. The SOP represents a much more efficient use of the existing network

Page 598 of 625
3.5 Conclusions
The soft open point was commissioned and tested in ESBN Portlaoise Training School in Ireland in January 2015 as part of the Green eMotion project.
Load was successfully transferred across the N/O point by the SOP both automatically and manually for various test scenarios and the SOP tripped successfully for a fault scenario. It is noted that advanced load balancing algorithms developed by Alstom were not implemented as part of the test due to the location of the load banks (substation adjacent) and the associated change in network impedances from reference values.
Power quality measurements were completed during the test and the values of current, voltage and power measured by the SOP were verified by the power quality meter. The percentage current total harmonic distortion during a high load transfer scenario was identified as a possible negative aspect of the SOP.
Thermal imaging was conducted during the test with measured temperatures remaining very low. Further thermal testing has been recommended during warm weather conditions and with more continuous load transfer.
Noise measurements identified possible nuisance noise from the SOP however as the device is a prototype it was determined that this could be easily addressed in future versions.
A number of applications for the SOP were discussed. The SOP has the potential to balance load across adjacent feeders and control local system voltages. The SOP has cost saving implications for utilities and represents a much more efficient use of the existing network

Page 599 of 625
4 Fast Charging
4.1 Introduction
An EV fast charging network has been installed in Ireland which consists of numerous multi-standard charge points at approximately 70 fast charge locations. There is currently no fee for use of the fast charge point network. A map of the fast charge point locations on the Island of Ireland is shown below.
Figure 278 - Fast Charge Point Locations on the Island of Ireland
The charge points are designed to 3 different charging standards, namely, CHAdeMO, Combined Charging System (CCS) and Type 2 AC 43kW. CHAdeMO is a DC fast charger standard and was developed by the Japanese utility Tepco and a number of Japanese automobile manufacturers. It is the standard used in EVs manufacturer by Nissan, Mitsubishi, Peugeot and Citroen among others. CCS (or combo charging as it is sometimes referred to) is another DC charging standard that has been developed by the European and US automobile manufacturers. It uses a combination of the Type 2 plug with additional DC pins and is used by BMW, Volkswagen among others. Type 2 AC 43kW is an on-board charging system predominantly used by Renault.

Page 600 of 625
A figure showing the 3 different connector types is shown below.
Figure 279 - Charge Point Connectors
Many charge point manufacturers offer combined AC and DC fast charge points. These typically offer 50kW DC power (via CHAdeMO and CSS) and either 22kW or 44kW AC power. A typical multi-standard fast charge point is shown below.
Figure 280 - Typical Multi-Standard Fast Charge Point Installed in Ireland
The democase DC fast charging is being run in Ireland and involves the installation of a second DC fast charge point at a site that already has an existing multi-standard fast charge point.
4.2 EV Sales in Ireland
EV sales in Ireland have been dominated by the Nissan Leaf which was first released in early 2011. To date over 400 have been sold. Other modern EVs sold in Ireland include the Mitsubishi iMiEV/Outlander, Renault Kangoo/Zoe/Fluence, BMW i3/i8 and Tesla Roadster/Model S and a small number of plug-in hybrids however number of these vehicles are very small. There are also a number of older EVs which predominantly use very basic charging methods (Smiths Edison, REVA etc). Due to the low numbers of CCS and Fast AC compatible vehicles in Ireland it has been assumed that charging at the Demonstration site has been predominantly CHAdeMO.

Page 601 of 625
4.3 Results
4.3.1 Installation
The location chosen for the installation of an additional CHAdeMO fast charger was Park Pointe Retail Centre in Dun Laoghaire County Dublin. The site originally had a multi-standard charge point and a public AC charge point as shown in the figure below.
Figure 281 - Original Charge Point Installation at Demonstration Site
The multi-standard charge point is capable of fast charging two vehicles at any one time (CHAdeMO and Fast AC or CCS and Fast AC). Simultaneous CHAdeMO and CCS charging is not possible as there is only one convertor in the charge point and load sharing between the two DC fast charging standard has not been implemented in the charge point design.
The public AC charge pointe has been replaced with a CHAdeMO fast charge point. The CHAdeMO charge point shown below was commissioned on the 16th of December 2014.
Figure 282 - New CHAdeMO Fast Charge Point Installed at Demonstration Site
It is now possible for three EVs to fast charge at this site.
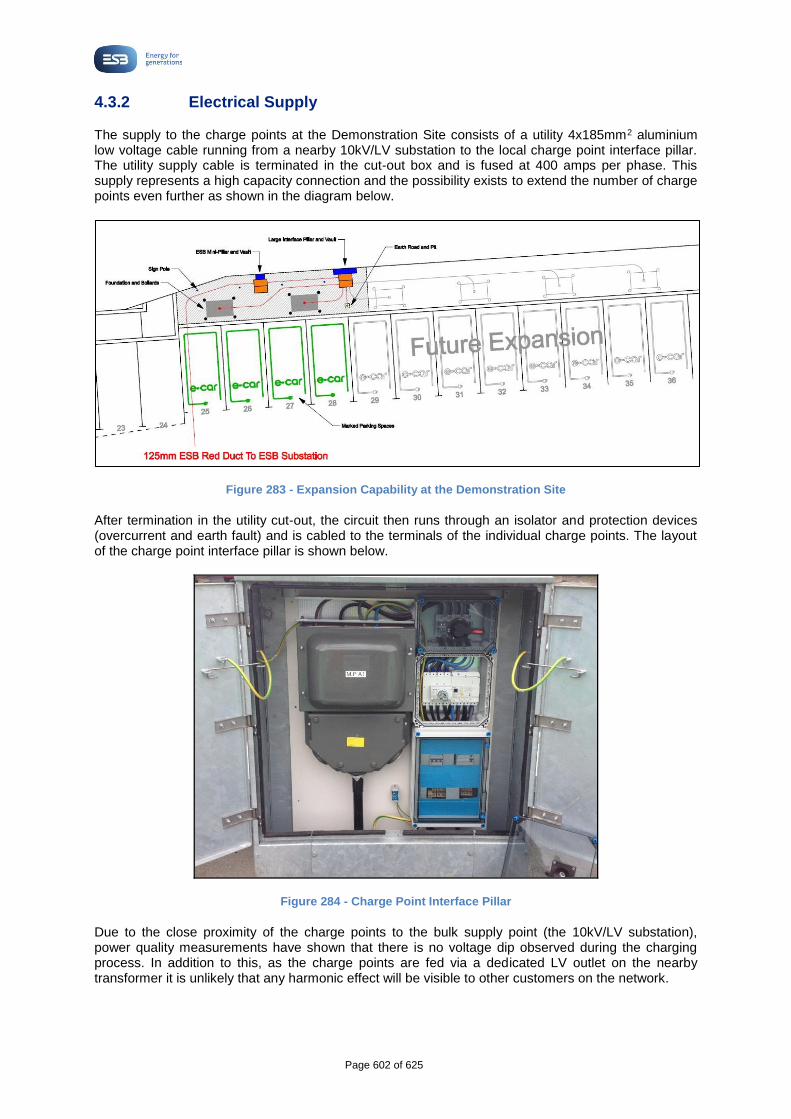
Page 602 of 625
4.3.2 Electrical Supply
The supply to the charge points at the Demonstration Site consists of a utility 4x185mm2 aluminium low voltage cable running from a nearby 10kV/LV substation to the local charge point interface pillar. The utility supply cable is terminated in the cut-out box and is fused at 400 amps per phase. This supply represents a high capacity connection and the possibility exists to extend the number of charge points even further as shown in the diagram below.
Figure 283 - Expansion Capability at the Demonstration Site
After termination in the utility cut-out, the circuit then runs through an isolator and protection devices (overcurrent and earth fault) and is cabled to the terminals of the individual charge points. The layout of the charge point interface pillar is shown below.
Figure 284 - Charge Point Interface Pillar
Due to the close proximity of the charge points to the bulk supply point (the 10kV/LV substation), power quality measurements have shown that there is no voltage dip observed during the charging process. In addition to this, as the charge points are fed via a dedicated LV outlet on the nearby transformer it is unlikely that any harmonic effect will be visible to other customers on the network.

Page 603 of 625
4.3.3 Queuing
Even though sales of EVs in Ireland have not reached the levels of some of the other European countries, such as Norway and The Netherlands, ESB ecars have observed queues at certain fast charge point locations as seen in the figure below.
Figure 285 - EVs Queuing at a Fast Charge Point in Ireland
In particular, the group of EV owners in Ireland has communicated to ESB ecars that queues for fast charging at the Demonstration Site were common.
In order to quantify the usage patterns and queuing at the Demonstration Site, data from the ESB ecars Charge Point Management System (CPMS) was exported and analysed. A partial extract from the CPMS is shown below.
Figure 286 - Partial Extract from CPMS

Page 604 of 625
The data study period was defined as from June 1st 2014 to December 1st 2014. During that period, the following was shown:
1118 charging sessions were completed. Note that a charging session was only considered a valid fast charging session if it lasted greater than 5 minutes. This helped to eliminate a quantity of short charging sessions that were found in the data that may not have represented true charging patterns and may be the result of user or system error.
111 unique tag IDs were used (i.e. 111 unique users of the charge point).
17.63 kWh was the maximum energy consumed during a charging session.
6.02 kWh was the average energy consumed.
1 hour was the longest continuous charging session.
40 queue sessions occurred (a charging session was considered a queue session if the time interval between the previous charging session ending and the current charging session starting was less than 2 minutes and the two tag IDs were unique (i.e. different customers).
11% charge point usage (i.e. 20.16 days in use out of 184 days in the period).
The number of charging sessions per user is plotted in the figure below. It is noted that one user is dominating the usage with 10 other users using the fast charge point 2 to 3 times a week.
Figure 287 - Number of Charging Sessions per User
The results show that the existing fast charge point at the Demonstration Site is heavily used and show that queuing is indeed happening. The installation of the second DC fast charge point should alleviate some of the queuing. Charge point usage at this site will be monitored and if the data analysis verifies that the queuing has been reduced or eliminated, and then the demonstration case will be considered a success. If similar patterns are observed at other fast charge point sites in Ireland then the expansion of the DC fast charging network at these sites is likely.
5 Conclusion
Analysis of the data from Ireland’s CPMS for the Demonstration Site has shown that queues are forming for fast charging. A new DC fast charge point has been installed at the site which has adequate electrical and physical capacity for expansion. Ongoing monitoring of the usage patterns at the site will verify whether the installation of the new DC fast charge point will partially or completely eliminate queuing.

Page 605 of 625
Work Package 7.6
Smart Charging Report

Page 606 of 625
Table of Contents
1 Introduction .........................................................................................................................607
2 Ireland’s CPMS Smart Functionality .................................................................................607
3 Roebuck Downes EV Trial ..................................................................................................610
3.1 Minimum Supply Voltage ......................................................................................................611
3.2 Power Factor .........................................................................................................................615
3.3 Power Usage .........................................................................................................................615
4 Enernet Intel Trial ................................................................................................................617
4.1 Primary Objective: Minimisation of cost of charging .............................................................617
4.2 Minimisation of Total Load ....................................................................................................619
4.3 Maximising Utility of Renewable Energy ...............................................................................619
4.4 Maximising Battery Lifetime ..................................................................................................620
4.5 Departure and Arrival Time Predictions ................................................................................620
5 Smart Charging in Amsterdam Arena ...............................................................................622
5.1 Physical Setup ......................................................................................................................622
5.2 Charge System Control .........................................................................................................622
5.3 Conclusion ............................................................................................................................625

Page 607 of 625
1 Introduction
This report describes a number of smart charging trials that ESB has been involved in since the conception of the ecars project. Specifically, the following trials are reported on:
1. Ireland’s CPMS Smart Functionality 2. Roebuck Downs EV Trial 3. Enernet Intel Trial 4. Smart Charging in Amsterdam Arena
2 Ireland’s CPMS Smart Functionality
ESB ecars has installed a nationwide network of EV charge points in Ireland. As of January 2015 the number of charge points has reached 1,754 (833 AC public charge points, 70 fast charge points and 851 domestic charge points). The network contains many different charge point manufacturers and includes all the relevant charge point connectors to suit the current range of EVs on the market. Ireland’s EV charge point network map is shown in the figure below along with a sample of the public AC and fast charge point types.
Figure 288 - Ireland's EV Charge Point Network and Charge Point Types
To support this network a back office Charge Point Management System (CPMS) has been developed based on the use of open standards. This CPMS is designed to support the sale of electricity by all licensed energy suppliers in Ireland.

Page 608 of 625
Figure 289 - CPMS Core Requirements
Open Charge Point Protocol (OCPP)
Charging stations in Ireland are specified to use the common open industry standard known as the Open Charge Point Protocol (OCPP) as their primary mechanism for all operational and management information transfers to and from the central Charge Point Management System (CPMS). This includes, but is not limited to:
Online and offline authorization mechanisms
Vehicle charging events
Charging station operational event, state and status reporting
Charging station hardware and software configuration management
In addition, the following functionalities that are not mandatory in the OCPP specifications are also supported:
Local Authorisation List/Cache
Sampled and Clock-Aligned Meter Readings
Remote Start & Stop of charging transactions
Immediate Reservations
Remote Wakeup via SMS
The following additional functionalities that are enabled by the use of OCPP version 2.0 and above may also be incorporated depending on the supplier:
Smart Charging
Pricing & Cost Display
Autonomous Frequency Response Charging Suspension
Intrusion/Access Detection & Reporting
Tilt, Shock & Damage Detection & Reporting
Failsafe Electrical Shutdown
Operating Schedule

Page 609 of 625
External Charging Station Availability Control
As part of CPMS phase 2 development it is anticipated that there will be a requirement for the following requirements:
Frequency Response via Transmission System Operator (TSO) command,
Virtual Spinning Reserve
SCADA integration
A flow chart of the spinning reserve integration is shown in the figure below.
Figure 290 – Integration of Spinning Reserve.

Page 610 of 625
3 Roebuck Downs EV Trial
Roebuck Downs is a housing estate in South Dublin in Ireland in which an extensive EV trial was completed by ESB. Home owners were given Mitsubishi iMiEVs for a defined period and smart meters and smart home chargers were installed in their homes. The smart home chargers allowed control of the charging patterns in order to investigate a number of parameters including; voltage optimisation, power factor, power usage and potential electricity cost savings. The analysis, charging algorithms and reporting was completed by Intel.
Figure 291 - ESB ecars iMiEVs Used in Roebuck Downes Trial
Source Data
The source data consists of smart meter measurements from ten houses during the period from 19th November 2012 to 11th March 2013. The measurements supplied are outlined in the table below
Table 65 - Smart Meter Measurement Parameters
Measurement Symbol Unit
Minimum Voltage Vmin V
Maximum Voltage Vmax V
Average Voltage Vavg V
Maximum Current Imax A
Average Power Factor PFavg unitless
Measurements were sampled at ten minute intervals. When considering the data in a daily window, it is analysed from 12:00 to 12:00 the following day, as the effects of overnight EV charging are of particular interest. This report focuses primarily on five of the ten houses which provided the most reliable and relevant data.
EnLive EV charging Community Optimisation
The aim of EnLIVE community optimisation is to control charging patterns of EVs in a neighbourhood to reduce the effects extra load will have on maintaining a minimum supply voltage, while delivering charge to the user’s predicted or scheduled need.

Page 611 of 625
EnLIVE EV charging Local Optimisation
The aim is to control time and level of user’s EV charging to result in lower cost of charging while ensuring vehicle has enough charge at predicted time of use.
3.1 Minimum Supply Voltage
Electricity providers in the EU are required to supply electricity within the predefined tolerances outlined in the table below. This section will examine how effective the EnLIVE optimised EV charging system is at maintaining a minimum supply voltage, compared to uncontrolled charging.
Table 66 - EU Voltage Supply Thresholds
Minimum Voltage (-10%) Ideal Voltage Maximum Voltage (+10%)
207.0V 230.0V 253.0V
Daily Mean Across Five Homes
This sub-section examines the daily mean minimum supply voltage across the five homes. A number of dates were selected, where the type of charging falls into one of the following categories:
No vehicle charging in any home,
Uncontrolled charging in at least one home, and no charging in any others,
Optimised charging in at least one home, and no charging in any others.
The figures below display the mean daily voltages (Vmax, Vmin, Vavg) from days which fall into these three categories.
Figure 292- Mean daily voltages (max. min, average) for the five meters before the arrival of EVs
Time
V
1213 14 15 16 17 18 19 20 21 22 23 00 01 02 03 04 05 06 07 08 09 10 11 12
218
220
222
224
226
228
230
232

Page 612 of 625
Figure 293- Mean daily voltages (max. min, average) for the five meters during uncontrolled charging
Figure 294- Mean daily voltages (max. min, average) for the five meters during optimised charging
To compare the effectiveness of the optimised charging algorithm at maintaining voltage, the Mean Squared Error (MSE) was calculated between the minimum and average voltages and the ideal voltage of a constant 230V. This is the cost value used in EnLive community optimisation. These values, presented in the table and figure below, show that the optimised approach results in a lower MSE. This indicates that optimised charging is more effective at maintaining a voltage closer to the ideal voltage than uncontrolled charging, over an average day.
Table 67- Mean Squared Error (MSE) between Vmin, Vavg and 230V
No Charging Uncontrolled Optimised
Vmin 30.48 37.32 33.46
Vavg 10.24 13.49 10.18
Time
V
1213 14 15 16 17 18 19 20 21 22 23 00 01 02 03 04 05 06 07 08 09 10 11 12
218
220
222
224
226
228
230
232
Time
V
1213 14 15 16 17 18 19 20 21 22 23 00 01 02 03 04 05 06 07 08 09 10 11 12
218
220
222
224
226
228
230
232
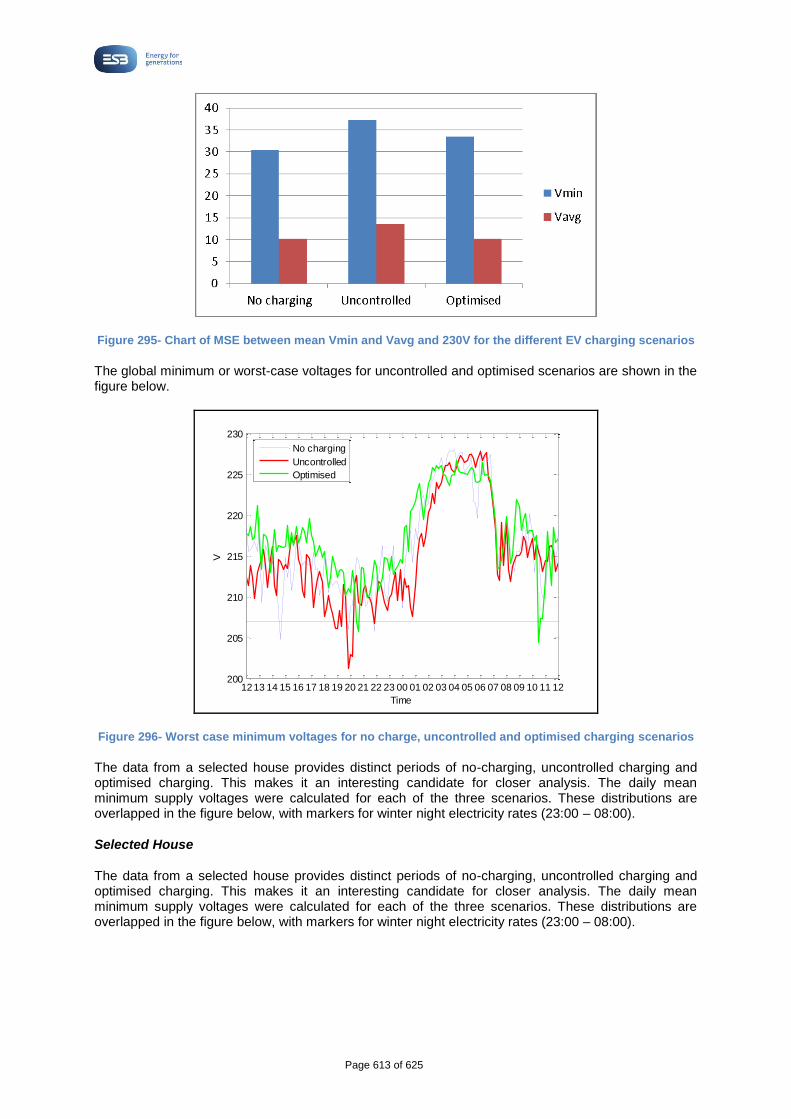
Page 613 of 625
Figure 295- Chart of MSE between mean Vmin and Vavg and 230V for the different EV charging scenarios
The global minimum or worst-case voltages for uncontrolled and optimised scenarios are shown in the figure below.
Figure 296- Worst case minimum voltages for no charge, uncontrolled and optimised charging scenarios
The data from a selected house provides distinct periods of no-charging, uncontrolled charging and optimised charging. This makes it an interesting candidate for closer analysis. The daily mean minimum supply voltages were calculated for each of the three scenarios. These distributions are overlapped in the figure below, with markers for winter night electricity rates (23:00 – 08:00).
Selected House
The data from a selected house provides distinct periods of no-charging, uncontrolled charging and optimised charging. This makes it an interesting candidate for closer analysis. The daily mean minimum supply voltages were calculated for each of the three scenarios. These distributions are overlapped in the figure below, with markers for winter night electricity rates (23:00 – 08:00).
1213 14 15 16 17 18 19 20 21 22 23 00 01 02 03 04 05 06 07 08 09 10 11 12200
205
210
215
220
225
230
V
Time
No charging
Uncontrolled
Optimised

Page 614 of 625
Figure 297 - Daily Mean Minimum Voltages for Selected House
The MSEs between Vmin and 230V were calculated for the day and night periods. These values, displayed in in the table and figure below, again indicate that optimised charging is more effective than uncontrolled charging at maintaining minimum voltage over twenty-four hours as well as during peak hours. This is not the case during the off-peak period, where optimised charging typically takes place.
Table 68 - MSE between Minimum Voltage and 230V for Selected House
Period Time No charging
Uncontrolled charging
Optimised charging
Day 08:00 – 23:00 47.13 60.85 45.79
Night 23:00 – 08:00 7.73 11.64 14.45
24h 12:00 – 12:00 19.76 28.08 22.95
Figure 298 - MSE between Mean Vmin and 230V for Selected House
12 13 14 15 16 17 18 19 20 21 22 23 00 01 02 03 04 05 06 07 08 09 10 11 12218
220
222
224
226
228
230
232mean minV
Time
V
no EV
Uncontrolled
Optimised
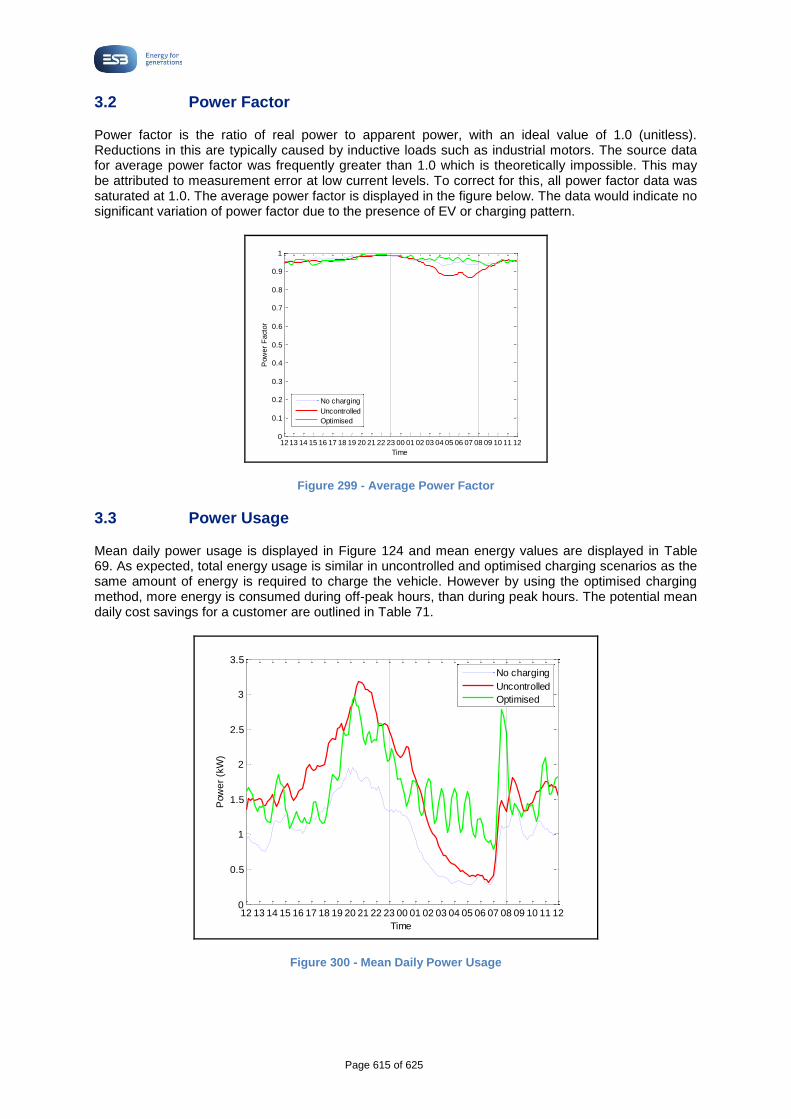
Page 615 of 625
3.2 Power Factor
Power factor is the ratio of real power to apparent power, with an ideal value of 1.0 (unitless). Reductions in this are typically caused by inductive loads such as industrial motors. The source data for average power factor was frequently greater than 1.0 which is theoretically impossible. This may be attributed to measurement error at low current levels. To correct for this, all power factor data was saturated at 1.0. The average power factor is displayed in the figure below. The data would indicate no significant variation of power factor due to the presence of EV or charging pattern.
Figure 299 - Average Power Factor
3.3 Power Usage
Mean daily power usage is displayed in Figure 124 and mean energy values are displayed in Table 69. As expected, total energy usage is similar in uncontrolled and optimised charging scenarios as the same amount of energy is required to charge the vehicle. However by using the optimised charging method, more energy is consumed during off-peak hours, than during peak hours. The potential mean daily cost savings for a customer are outlined in Table 71.
Figure 300 - Mean Daily Power Usage
1213 14 15 16 17 18 19 20 21 22 23 00 01 02 03 04 05 06 07 08 09 10 11 120
0.1
0.2
0.3
0.4
0.5
0.6
0.7
0.8
0.9
1
Pow
er
Fa
cto
r
Time
No charging
Uncontrolled
Optimised
12 13 14 15 16 17 18 19 20 21 22 23 00 01 02 03 04 05 06 07 08 09 10 11 120
0.5
1
1.5
2
2.5
3
3.5
Pow
er
(kW
)
Time
No charging
Uncontrolled
Optimised

Page 616 of 625
Table 69- Mean Daily Energy Usage
Period Time No charging Uncontrolled charging Optimised charging
kWh kWh kWh
Night 23:00 – 08:00 5.86 9.87 13.33
Day 08:00 – 23:00 19.19 29.64 25.62
24h Total 25.05 39.51 38.95
Table 70- Electricity Rates*
Day Night
Time 08:00 – 23:00 23:00 – 08:00
Rate (€/kWh) 0.2060 0.1018
* Electric Ireland Standard Electricity NightSaver plan, winter time, inclusive of VAT, accessed 4th April 2013. https://www.electricireland.ie/switchchange/elecStdNightsaver.htm
Table 71 - Mean Costs and Potential Savings
Day Night Total
Cost (€) Cost (€) Cost (€)
No EV charging 3.95 0.60 4.55
Uncontrolled charging 6.11 1.01 7.11
Optimised charging 5.28 1.36 6.64
Mean daily saving (€) 0.47

Page 617 of 625
4 Enernet Intel Trial
The results in this chapter summarise the performance of the Enernet Optimisation Server for the duration of the smart charging trial. The main findings in this report are:
The daily price of charging was reduced by an average of 36.4% (and a maximum of 70%).
The additional peak load due to EV charging was reduced by an average of 58%.
42% more renewable energy was used by smart charging.
The effective lifetime of the battery can be extended by 25% by smart charging.
All data is indicative of a single user participating in Enernet smart charging over a 3-month trial period with relatively light EV usage. Where relevant, the report also shows the equivalent annual usage for an average user under average usage behaviour.
Also bear in mind that the optimisation objective during this trial is the minimisation of the wholesale energy cost of satisfying the user requirements. The system can be readily extended to satisfy any other stakeholder objectives, for example; fast frequency response, capacity payment maximisation, voltage excursion minimisation, maximisation of renewable utility, etc.
Figure 301 - M2C Smart Home Charge Point and Smart Meters
4.1 Primary Objective: Minimisation of cost of charging
Throughout this particular trial, the primary objective of the Enernet Optimisation Server is to minimise the total cost of charging for all devices in the community. Figure 1 shows the Enernet console. The Energy Cost graph shows the wholesale energy cost data which is used in the optimisation. It is calculated by combining the ‘Within Day’, ‘Ex Ante’ and ‘Ex Ante 2’ energy trading prices, available on www.sem-o.com.

Page 618 of 625
Figure 302 - The Price and Load Graphs from the Enernet Optimisation Server Console
The daily wholesale costs of charging throughout the trial period for this device, seen in the figures below, show the frequency distribution for the percentage savings in the cost of charging.
Figure 303- The Frequency Distribution of the Savings Smart Charging Provides Compared to Regular Charging
Since the participant in this case study had relatively light energy usage, it is also useful to consider how these findings will extend to a more general use case over a sustained period of time. To extrapolate this usage to represent more typical usage, we use data from the US Federal Highway Administration to normalise the regular and optimised cost of charging for an average user over an average year of usage. Putting all of this together, the results of the trial can be summarised in the table below.
0 10 20 30 40 50 60 70 800
0.2
0.4
0.6
0.8
1
1.2
1.4
1.6
1.8x 10
-3
% Charge cost saving
Rela
tive
Fre
que
ncy
of
Occurr
ence

Page 619 of 625
Table 72 - Charging Costs and Savings
Trial Participant Average User-Year
Average Saving 36.4%
Max Saving 70%
Wholesale Cost of Regular Charging €19.58 €716.69
Wholesale Cost of Optimised Charging €14.59 €534.04
4.2 Minimisation of Total Load
A secondary objective of the Enernet Optimisation Server is to minimise the total load in sections of the grid. The figure below illustrates the effect of Enernet smart charging on the peak load over a given day. Throughout the trial period, the additional peak load resulting from EV charging was reduced by an average of 58%.
Figure 304 - A Comparison of the Peak Loads for Regular Charging and Enernet Smart Charging
4.3 Maximising Utility of Renewable Energy
Another result of the price-optimised primary objective is that the amount of renewable energy consumed by the EVs is increased. Figure 5 illustrates how we calculate the wind-energy content of the supplied energy over a typical day. For the entire trial period we calculated average wind-energy content for both regular and Enernet smart charging. The findings were:
1. Regular charging: 19% renewable energy content. 2. Enernet smart charging: 27% renewable energy content. 3. Enernet smart charging uses 42% more renewable energy than regular charging.
12:00 18:00 00:00 06:00 12:000
1
2
3
4
5
6
7
8
9
Time [24-hour clock]
Pow
er
[kW
]
Total home consumption with unoptimised EV charging
Total home consumption with smart EV charging

Page 620 of 625
Figure 305 - Illustration of How the Proportion of Consumed Energy Derived from Wind is calculated
4.4 Maximising Battery Lifetime
Previous Intel work* with the National Renewable Energy Laboratory (NREL) has shown that managing the charging of the battery such that charging happens primarily at low cost periods can significantly increase the effective lifetime of the battery. Smart charging the battery to full capacity can increase the effective lifetime of the battery by approximately 25%. This is primarily because delaying the time at which the battery begins to charge has the effect of reducing the total proportion of time which the battery spends at a high state-of-charge, which increases the battery’s useful lifetime.
Estimating the effective useful battery lifetime is a time-consuming process which requires third-party facilitation. Hence, the exact numeric appraisal of the lifetime improvement for this particular vehicle could be conducted if deemed necessary. However, it can be reasonably assumed that the 25% improvement also applies to this vehicle.
* A. Hoke, A. Brissette, D. Maksimovic, D. Kelly, A. Pratt, and D. Boundy “Maximizing lithium ion vehicle battery life through optimized partial charging,” in IEEE PES Innovative Smart Grid Technologies, 2013, pp. 1–5.
4.5 Departure and Arrival Time Predictions
The departure and arrival time prediction algorithms are designed such that a prediction which results in an under-prediction of the amount of time available to charge should never occur. This means that the home departure times are always under-predicted (predicted earlier than the actual time) and the home arrival times are always over-predicted (predicted later than the actual time). Figure 6 illustrates the variables produces in each prediction over several weeks for a chosen weekday (Sunday in this case).
0
1000
2000
3000
4000
Pow
er
[MW
]
12:00 18:00 00:00 06:00 12:000
5
10
15
Perc
enta
ge o
f w
ind e
nerg
y
Total Power Consumption
Wind Energy Availability
Wind Energy Content [%]

Page 621 of 625
Figure 306 - Raw Predictions, Filtered Predictions and the Chosen Predictions Compared to the Actual Departure Times
In the figure above, the “predicted” values are generated by modelling the “actual” data from previous weeks as a statistical process. From the predicted variables, the “filtered predicted” are generated to ensure that predictions based on incomplete data are not fully utilised in the early weeks of training. The “chosen predicted” values are the minimum (maximum for the arrival time predictions) of the “predicted” and “filtered predicted” values. This ensures that the departure times are never over-predicted and the arrival times are never under-predicted, as evidenced in the figure above.
7.3586 7.3587 7.3588 7.3589 7.359 7.3591 7.3592 7.3593 7.3594
x 105
4
6
8
10
12
14
16
18
20
22
Day Number
Tim
e [
24
-ho
ur
clo
ck]
Predicted
Filter Predicted
Chosen Predicted
Actual

Page 622 of 625
5 Smart Charging in Amsterdam Arena
5.1 Physical Setup
Alliander, the City of Amsterdam and Renault have launched a “Smart Charging” pilot in the Amsterdam ArenA public parking facilities as part of the MOBI.Europe project. A total of twenty charge points (sockets) have been installed, distributed over ten charging stations. Each socket is technically capable of charging at speeds up to 22 kW. However, the charging stations share a single grid connection with a total capacity of 250A.
Figure 307 - Large Capacity Charge Hub at Amsterdam Arena
In theory, if all sockets would charge simultaneously at maximum speed, the total output capacity would be 640A (20 sockets @ 32A). The power outlet on the sockets needs to be carefully managed to ensure that the maximum available capacity is never exceeded. In order to provide a range of charge speeds, catered to the EV-drivers’ needs and within the physical constraints, a smart charging solution has been developed.
5.2 Charge System Control
Basic Charging vs. Smart Charging
Alliander has defined a basic speed at which all sockets should be able to charge at any time (simultaneously). This “Basic Charging” (BC) speed is set at 3.7 kW. All charging stations have been configured to restrict any charging session that is initiated by a RFID token to this BC speed. To enable faster charging speeds up to 22 kW, drivers will have to use the MOBI.Europe mobile app. Based on the registered vehicle, available capacity and desired time of departure the relevant charging speeds are offered to the user to choose from.
The process to determine the available capacity and the relevant charging speed options is referred to as “Smart Charging” (SC). On top of the Alliander Charge Point Management System (CPMS) a new Load Balancing module has been developed. This module manages and controls charging sessions for sockets that have been configured as “Charging Plaza” with a restricted available capacity. The following sections will describe in more detail the process of determining the available capacity for new sessions.
Determining the Available Capacity for “Smart Charging” Sessions
Although capacity and consumption are generally indicated in (kilo)Watts, the actual available capacity for the group of charge points is determined by the maximum current on the shared connection. In the case of the ArenaPoort P1, the maximum current is 250A per phase.

Page 623 of 625
Determining the available capacity for “Smart Charging” is actually determining how many “non-standard” sessions can be supported while guaranteeing that at the same time “Basic Charging” will be available on all other connectors.
The first step in this approach is to determine the power consumption (in current) when all sockets are in use for basic charging. Basic Charging will require a current of 16 Amperes on one single phase. Since only one phase is used in this scenario (the first connector pin in each socket), all load would be on one of the three phases. For 20 sockets, this would require a capacity of 320A. Obviously, this will not work on a connection of 250A.
A typical power supply cable contains five wires: Phase 1 (L1), Phase 2 (L3), Phase 3 (L3), Neutral (N) and Ground / Earth (E). This is illustrated in the picture below.
Figure 308 - Typical Power Supply Cable
Every charge point is equipped with two sockets. In order to evenly distribute the load when two sockets are charging on one phase, the wiring of the sockets has been modified IN the charge point. The first socket is connected to the wires in the normal sequence. The second socket has been wired with the Phase wires shifted one position. The picture below shows a schematic illustration of the way that the sockets are wired.
Figure 309 - Shifting of Phase Wires

Page 624 of 625
The result of this (hardware) setup is that when 20 sockets are charging on one single phase, only ten sockets will draw power from the L1 wire, while the other ten sockets will draw their power from the L2 wire.
We can now determine that in the Amsterdam ArenA configuration “Basic Charging” on all sockets will effectively draw 10x16A from L1 and 10x16A from L2. At the same time, we can determine that L3 is not used at all in this scenario.
Back to the question of how many “non-standard” sessions we can support. We will now have to decide what a “non-standard” session is. In the case of the ArenaPoort P1 pilot, we will be offering the following four charging speeds:
Table 73 - Power Consumption
Power consumption Amperes Number of phases
3,7 kW (standard) 16 1
7,4 kW 32 1
11 kW 16 3
22 kW 32 3
From these figures it is clear that any “non-standard” session will either draw an additional 16A from a single phase, or additional 16A from phases that are not used when “Basic Charging” is selected.
Guaranteeing that basic charging is available on all sockets means that 160A must be reserved on phases L1 and L2. So, only 90A is available on phases L1 and L2 for drawing current above the standard 16A.
Because we only provide charge speed options in blocks of 16A (see table above), this means that we can only allow five charge sessions at non-standard speeds. The additional 80A will keep the load on all phases below 250A. A sixth additional non-standard session would theoretically raise power consumption on either L1 or L2 to 256A, in which case the fuse will break and the entire Charging Plaza will be out of service.
The Load Balancer module on our back-office has not been equipped (yet) to monitor output power on individual phases. Therefore, in the current solution, we can’t discriminate between a 32A session on one single phase (i.e. BMW i3) or a 32A session on three phases (i.e. Renault Zoë or Tesla Model S). We only register a “faster than normal” session, which will either draw 16A extra from the phase that would be used for basic charging or would draw up to 32A extra from the phases that would not be used for basic charging.
Functional Solution
Based on the available number of non-standard sessions, the implementation of our Smart Charging Plaza in the Amsterdam ArenA is built as a ticketing system. When a driver uses the app to request a charge session, the app will query the LB module to check if there is still availability for “non-standard” charge sessions. When available, the user will be offered a choice of available charge speeds; presented as departure time options. When the user selects a faster than normal charge speed, the LB module will register this choice and limits the availability for non-standard sessions accordingly. The user has effectively made a reservation for a specific charging speed. The next user to make a request will only see options based on the updated availability.
In order to avoid exceeding grid capacity, a charge solution was developed that controls the charge demand. The system utilises information on the type of EV, departure times and the currently available power to determine the smart & efficient way to charge all electric vehicles. The actual charge commands are then sent to the charge point back office to take effect.

Page 625 of 625
When controlling the charge sessions, it is crucial that the system is able to use input from the EV-drivers. The choice for a mobile app makes this process convenient for EV-drivers.
Figure 310 - Smart Charging How it Works
As a RFID-card does not allow a customer to make any choices, we needed to develop a special mobile app that provides this possibility. App-users are granted priority for charging over RFID-card users. In this way we intended to create awareness and an incentive for users to actively and intentionally decide for an appropriate charge speed. On the charge station we inform drivers about the app and its functionalities and additionally we informed and invited people to join this test and demonstration during a road-show.
In case a charge transaction is started with the app during the test and demonstration phase all customer choices are free of cost. For a charge session initiated with a RFID card, the regular charge transaction price is collected.
5.3 Conclusion
The load balancer system that was developed specifically for the Amsterdam Pilot is able to accommodate network congestion signals from grid operators. This means that the load balancer can manage loads to remain within pre-configured charge point connection limits, but (in the future) may also use dynamic grid congestion input to balance loads within the local electricity grid.
This pilot demonstrates a smart charging solution that is able to control charge demand. Unlike more tech-oriented smart charging solutions, this solution puts customers first. Customers are in charge of their charge sessions, because the charge session is tailored to their scheduled departure time and their current vehicle state of charge. Based on this input, the charge system effectively succeeded to prioritize demand and balance the grid on a local level. At the same time, customers get their EV charged at the right time and to the right amount.
Copyright © 2022 FDOKUMEN