CEO birthplace identity and corporate social responsibility
67
Local boy does good: CEO birthplace identity and corporate social responsibility Zicheng Lei, Dimitris Petmezas, P. Raghavendra Rau, and Chen Yang * May 2021 Abstract We examine how CEO birthplace identity affects firm corporate social responsibility (CSR) activities. CEOs heading firms located in their home birth counties are associated with higher levels of CSR. The relation is more pronounced for CEOs with deeper home connections. Importantly, CSR activities by home CEOs are associated with significant increases in firm value relative to non-home CEOs. Additionally, home CEOs do not appear to extract private benefits, either directly or indirectly, from these activities. Overall, our results suggest that engaging in CSR will not necessarily increase levels of social trust. The place identity of the CEO also matters. Keywords: Corporate Social Responsibility (CSR); CEOs; Home Bias, Psychology; Trust; Place Identity * Lei: King’s Business School, King’s College London, London, WC2B 4BG, UK, [email protected]. Petmezas and Yang: Durham University Business School, Durham University, Durham, DH1 3LB, UK, dimitris.pet- [email protected]; and [email protected]. Rau: Cambridge Judge Business School, University of Cam- bridge, Cambridge CB2 1AG, UK, [email protected]. We thank Gerry Attrick, Vineet Bhagwat, Ettore Croci, Elroy Dimson, Andrey Golubov, Jarrad Harford, Ivan Lim, Peter Limbach, Nick Travlos, and seminar participants at the University of Cambridge for helpful comments and suggestions, Rüdi Fahlenbrach for sharing data on founder CEOs, Reza Houston for sharing data on CEOs with political positions, Kai Li for sharing data on corporate culture, Christos Pantzalis for sharing data on political contributions and corporate lobbying, and Scott Yonker for sharing data on home CEOs and CEO residences. All remaining errors are our own.
-
Upload
khangminh22 -
Category
Documents
-
view
0 -
download
0
Transcript of CEO birthplace identity and corporate social responsibility

Local boy does good: CEO birthplace identity and corporate social
responsibility
Zicheng Lei, Dimitris Petmezas, P. Raghavendra Rau, and Chen Yang*
May 2021
Abstract
We examine how CEO birthplace identity affects firm corporate social responsibility (CSR)
activities. CEOs heading firms located in their home birth counties are associated with higher
levels of CSR. The relation is more pronounced for CEOs with deeper home connections.
Importantly, CSR activities by home CEOs are associated with significant increases in firm value
relative to non-home CEOs. Additionally, home CEOs do not appear to extract private benefits,
either directly or indirectly, from these activities. Overall, our results suggest that engaging in CSR
will not necessarily increase levels of social trust. The place identity of the CEO also matters.
Keywords: Corporate Social Responsibility (CSR); CEOs; Home Bias, Psychology; Trust; Place Identity * Lei: King’s Business School, King’s College London, London, WC2B 4BG, UK, [email protected]. Petmezas and Yang: Durham University Business School, Durham University, Durham, DH1 3LB, UK, [email protected]; and [email protected]. Rau: Cambridge Judge Business School, University of Cam-bridge, Cambridge CB2 1AG, UK, [email protected]. We thank Gerry Attrick, Vineet Bhagwat, Ettore Croci, Elroy Dimson, Andrey Golubov, Jarrad Harford, Ivan Lim, Peter Limbach, Nick Travlos, and seminar participants at the University of Cambridge for helpful comments and suggestions, Rüdi Fahlenbrach for sharing data on founder CEOs, Reza Houston for sharing data on CEOs with political positions, Kai Li for sharing data on corporate culture, Christos Pantzalis for sharing data on political contributions and corporate lobbying, and Scott Yonker for sharing data on home CEOs and CEO residences. All remaining errors are our own.

- 1 -
1. Introduction
Corporate social responsibility (CSR) is becoming an increasingly important concern for
managers and investors. In 2019, nearly 200 CEOs at the Business Roundtable argued that
companies should no longer advance only the interests of shareholders, but also invest in their
employees, protect the environment, and deal fairly and ethically with their suppliers.1 There is
some evidence consistent with this in the academic literature. For example, Lins, Servaes, and
Tamayo (2017) provide evidence that firm’s corporate social responsibility (CSR) activities
generate social capital and trust. However, this literature also offers mixed recommendations as to
whether engaging in CSR creates value for firms.
One strand of literature argues that CSR activities have positive effects on shareholder value
because focusing on the interests of all stakeholders increases their willingness to support firm
operations, which in turn increases shareholder wealth. For example, Lins, Servaes, and Tamayo
(2017) show that during the 2008-2009 financial crisis, firms with high CSR intensity earned
higher stock returns, and experienced higher profitability, growth, and sales per employee relative
to low CSR firms. However, another strand of literature argues that CSR activities are driven by
agency considerations and are essentially negative NPV investments for shareholders. For
instance, CEOs could undertake CSR to extract private rents from shareholders (Krüger, 2015;
Masulis and Reza, 2015), or gain an elevated status within their local communities, allowing the
CEOs to win local awards, directorships, paid speaking engagements, or increased access to
government officials (Jiang, Qian, and Yonker, 2019).
Importantly, neither strand focuses on how the idiosyncratic identity characteristics of the
managers affect how the CSR activities are likely to be perceived by the local community and
hence, how CSR affects firm value. There is evidence that idiosyncratic identity characteristics
matter in the level of firm CSR activity. For example, Cronqvist and Yu (2017) document that
when a firm’s chief executive officer (CEO) has a daughter, the corporate social responsibility
rating (CSR) is about 9.1% higher than the median firm. Di Giuli and Kostovetsky (2014) find that
firms also score higher on CSR when they have Democratic rather than Republican founders.
1 See Gelles, David and Yaffe-Bellany, David (2019): “Feeling Heat, C.E.O.s Pledge New Priorities”, New York Times, August 20, 2019, page A1 or Benoit, David (2019): “Move Over, Shareholders: Top CEOs Say Companies Have Obligations to Society”, Wall Street Journal, August 19, 2019.

- 2 -
There is no evidence, however, on how these CEO characteristics impact the effect of CSR on firm
value.2
In this paper, we depart from prior studies by examining: i) whether CEOs whose identities
are bound to their home communities are more likely to engage in CSR than CEOs without such
bindings; and ii) whether their CSR activities are more likely to create value for the firm. The
predictions regarding CSR activity are unclear ex ante. On the one hand, home CEOs might wish
to maintain their social capital and trust by investing time and money in the welfare of residents in
their home counties. They would have incentives to give back to the societies where they were
born by actively engaging in more CSR and avoid jeopardizing pre–existing social capital by not
doing CSR; in that case, we predict that home CEOs should invest more in CSR. On the other
hand, if home CEOs rely on existing social capital and trust developed with the local community
by virtue of pre–existing relationships with customers, suppliers, employees, or society, we would
expect home CEOs to not need to engage in CSR and hence predict a negative relation between
the presence of a home CEO and CSR. Alternatively, if investments in CSR activities help
establish trust with key stakeholders, regardless of who carries out the activity, non–home CEOs
would have the incentive to invest more in CSR.
We find that home CEOs, defined as CEOs who manage firms located within 100 miles of
their birthplaces, undertake significantly higher CSR activities in their local communities relative
to non-home CEOs. Moreover, CSR activities by home CEOs are associated with significant in-
creases in firm value. We provide evidence that local customers, suppliers, and employees react
more positively to CSR activities than non-local stakeholders by firms managed by home CEOs
than non-home CEOs across the sample period. In particular, CSR activity by home CEOs is cor-
related with higher productivity by local employees, the firms earn higher sales growth, and charge
higher markups than firms run by non-home CEOs. Additionally, while we find that firms engag-
ing in CSR earn higher stock returns during tough times (consistent with Lins et al., 2017), we
show that these results are driven specifically by firms managed by home CEOs.
Simply put, engaging in CSR is not a sufficient condition to create social trust and value. Who
undertakes the CSR also matters. For home CEOs, CSR activity appears to act as a virtuous circle.
2 Di Giuli and Kostovesky (2014) show that the relation between CSR and firm performance is driven by the firm’s political environment which includes external state-level political variables and internal political affiliation variables. Board and CEO affiliations are measured using campaign contributions. They do not use any CEO intrinsic identity characteristics.

- 3 -
The CEO is trusted by the community, and reciprocates that trust in the form of CSR, which creates
value for the firm.
Why do local stakeholders trust home CEOs more? To answer this question, we draw on the
psychology literature on familiarity, place identity, and place attachment (Proshansky, 1978).3
Place identity is “a component of personal identity, a process by which, through interaction with
places, people describe themselves as belonging to a specific place” (Hernández et al., 2007, p.
311) while place attachment “is an affective bond that people establish with specific areas where
they prefer to remain and where they feel comfortable and safe” (Fischer et al., 1977). It is plausible
that an individual with place identity will receive greater trust from a local community - as being
one of them - than one who is only attached to a place but is not identified with it.4
The distinction between place identity and place attachment is important. Place identity forms
a key element of an individual’s personal identity (Proshansky, 1978) and is less likely to be an
endogenous choice of the CEO (the birthplace is usually chosen by the CEO’s parents) while place
attachment is more likely to be endogenously driven by the CEO’s choice to work for a firm
headquartered in a particular area. Hence, while both place identity and place attachment predict
that local CEOs will engage in relatively higher levels of CSR activity, place identity restricts the
effect to home CEOs (natives whose birthplaces and work environments coincide), while place
attachment predicts that non-home CEOs with long periods of residence in their work
environments will also react the same way as home CEOs. In terms of the value effect, we
hypothesize that local stakeholders will trust home CEOs more because place identity is unlikely
to be a conscious choice by the CEO. It is more likely an intrinsic trait that a CEO would find
difficult to change. Hence, local stakeholders are likely to react to CSR decisions by these CEOs
in a way that increases firm value.
We focus on the universe of non-financial, non-utility firms covered by the Standard & Poor’s
Executive Compensation (ExecuComp) database and obtain data on the birthplace origins of their
3 For a review of this literature, see Gieryn (2000) or Manzo (2003). 4 Place attachment and place identity frequently overlap because the samples used in most studies (native persons who have resided in that place for a long time) show a high level of both place attachment and place identity. However, an individual could be attached to a place but not identify with it (i.e., someone who likes to live in a place and wants to remain there but does not feel that this place is part of their main place identity). Similarly, someone could have a high personal identity with a place but not a high place attachment (for example, they feel that they belong to a place though they do not live there). Hernández et al. (2007) use samples of natives and non-native residents to distinguish place identity from place attachment. They show that place identity and place attachment coincide and reinforce each other in natives. However, they act in different directions in non-natives. Non-natives are more likely to be attached to a place they are living in but identify with the places they grew up in.

- 4 -
CEOs for the years 1992–2016. More than one quarter of our sample firms are managed by home
CEOs. We use the MSCI ESG database (commonly referred to as KLD) as our measure of firm-
level CSR. The KLD database has been used as a standard measure of CSR in an increasing number
of research studies in economics and finance.5,6
We find evidence of an economically sizable and statistically significant positive effect of the
presence of home CEOs, defined as CEOs who manage firms located within 100 miles of their
birthplaces, on CSR activities. The CSR score of a firm managed by a home CEO is about 4.3%
higher than the median firm. The magnitude of the home CEO effect on CSR is economically
large, corresponding to approximately 7% of the median firm’s net income, comparable to the
CEO-daughter effect (on the order of 10.4%) in Cronqvist and Yu (2017) and the CEO political
preference effect (on the order of 9.3%) in Di Giuli and Kostovetsky (2014). A decomposition of
the CSR measure reveals that there is no unique driver of the impact of CSR, with diversity,
environment, employee relations, and community scores all being positively impacted by the
birthplace identity effect.
We next show that the birthplace identity effect is more likely to be driven by place identity
than place attachment. The effect on CSR is significantly stronger for home CEOs than for non-
home CEOs who have spent equivalent amounts of time residing in counties near the firm
headquarters. The strength of the effect is strongly related to proxies for place identity. CEOs who:
i) spend more time in their home state; ii) had their first degree in their home state; or iii) serve as
board members of other firms in their home state, conduct higher levels of CSR.
Our conclusions hold when we examine within-firm changes in CEOs, headquarters
relocations, and changes in corporate culture. Specifically, the impact of CEO changes on CSR
occurs only when there is a change from non-home to home CEOs (positive impact) or from home
to non-home CEOs (negative impact), not when a home CEO is replaced by another home CEO,
or a non-home CEO is replaced by a non-home CEO. Further, our results are robust to using an
alternative empirical design that isolates the effects of changes in birthplace identity on changes
in CSR. In particular, we find similar results when we use a difference-in-differences method to
compare changes in CSR surrounding corporate headquarters relocation events that change the
strength of the birthplace identity effect. Finally, our results remain unaltered when we control for
5 See, for instance, Hong and Kostovetsky (2012), Deng, Kang, and Low (2013), Di Giuli and Kostovetsky (2014), Lins, Servaes, and Tamayo (2017), and Cronqvist and Yu (2017). 6 Using alternative CSR proxies such as those derived from the ASSET4 database does not alter our conclusions.

- 5 -
changes in corporate culture, suggesting that the home CEO effect is not simply a proxy for a
corporate culture effect.
Our results are also robust to endogeneity issues. We find similar results for a firm fixed
effects model that reduces concerns of selection bias as argued by Fee, Hadlock, and Pierce (2013).
We also find a significantly positive relation between the presence of home CEOs and CSR
activities when we use a propensity score matching (PSM) analysis, where we match firms that
hire home CEOs with those exhibiting analogous characteristics but are not managed by a home
CEO. We find qualitatively similar results when we run a two-stage instrumental variable analysis
using an indicator for a hometown board position prior to becoming CEO as an instrument for the
firm’s decision to select a home CEO. It is plausible that firms are more likely to select a home
CEO who had also acted as a board member of another firm in her home state to exploit CEO
connections. Hence, this instrument is likely to satisfy the relevance condition for instrumental
variables. Simultaneously, a CEO serving as a board member in another firm in her home state is
relatively unlikely to be correlated with the firm’s choice of CSR, satisfying the exclusion
condition. When we regress the instrumented home CEO on CSR, we still obtain a strong positive
relation between home CEOs and CSR activities, reducing concerns of an omitted variable bias.
Our conclusions remain unaltered following a battery of robustness tests. Specifically, they
hold after using different measures of home CEO, an alternative measure of CSR and a different
CSR data provider, a different industry classification to define industries, after removing the top 3
CEO home counties (which account for around 20% of the sample), after removing highly
educated CEOs with advanced degrees and founder CEOs, and after controlling for CEO political
preferences (Republican/Democratic), firm financial constraints, state-level religiosity, and local
business concentration.7
In the second part of the analysis, we show that CSR activities by firms with home CEOs are
significantly positively associated with firm value relative to CSR activities by non-home CEOs.
Specifically, there is a significant positive association between Tobin’s Q and CSR for firms with
a home CEO relative to firms with a non–home CEO. Consistent with Lins et al. (2017), firms
managed by local CEOs report higher levels of customer satisfaction, supplier trade credit and
employee satisfaction. We then show that this trust is reciprocated by local customers, suppliers
7 For brevity, we discuss these robustness tests in the Internet Appendix.

- 6 -
and employees who reward the firms with home CEOs with higher gross margins, sales growth,
and sales per employee.
Lins et al. (2017) argue that if a firm’s social capital helps build stakeholder trust and
cooperation (Putnam, 1993), it should pay off when being trustworthy is more valuable, such as in
an unexpected crisis period. We follow their analyses using two unexpected crisis periods: the
2008-09 financial crisis period and the 2020 COVID-19 pandemic period. We find that only firms
with home CEOs and high CSR scores in a prior period earn higher stock returns during the 2008-
2009 financial crisis and the COVID-19 pandemic periods, respectively. In other words, during
tough times, investors appear to value only CSR activities by firms with home CEOs, not CSR by
firms with non-home CEOs. This finding also suggests that there is a causal link between CSR and
increase in firm value only for home CEOs.
It is worth noting that our results are unlikely to be driven by agency effects. They are robust
to controlling for standard corporate governance proxies. Additionally, there is no evidence of
private rents extracted by CEOs in terms of home CEOs obtaining political positions. CSR levels
are unrelated to executive compensation and firms do not appear to use CSR to substitute for
political contributions or lobbying expenses.
Our study makes several contributions to the literature. First, we are the first to show a CEO-
specific effect of CSR on firm value. Prior studies either document that specific types of CEOs
invest more in CSR but do not show that these CEO characteristics have any effect on firm value
(Borghesi et al., 2014; Cronqvist and Yu, 2017; Hegde and Mishra, 2019) or show that firm-level
CSR activity impacts firm value without examining whether these findings are driven by the
intrinsic characteristics of the CEO at the firm (Deng et al., 2013; Krüger, 2015; Ferrell, Liang,
and Renneboog, 2016; Lins et al., 2017; Gibson, Krueger, and Schmidt, 2021). Hence, our study
contributes to the long-standing debate on the impact of CSR engagement on firm performance.
Friedman (1970) suggests that CSR investments that ultimately benefit other stakeholders at the
expense of shareholders will lead to reduced corporate profits and stock prices. In contrast, Servaes
and Tamayo (2013) and Flammer (2015) propose that companies engage in CSR activities to
mitigate conflicts between managers and non-investing stakeholders, resulting in superior firm
performance. Consistent with the latter studies, we find that CSR activities by home CEOs are
positively associated with firm value. However, our results on stock returns during two negative
shocks (financial crisis and COVID-19 periods, respectively) suggest that the trust being built

- 7 -
through CSR is not firm-specific, as implied by the papers above, but individual-specific, as the
market rewards the individual (home CEO) rather than the firm conducting CSR activities.
Second, our paper contributes to a fast–growing literature in finance and economics tying
corporate decisions to the locations where CEOs grew up. Prior studies provide evidence that
birthplace bias affects firms’ employment policies (Yonker, 2017a), CEO compensation packages
(Yonker, 2017b), merger and acquisition outcomes (Jiang et al., 2019), bank credit allocation (Lim
and Nguyen, 2020), R&D expenditure (Lai, Li, and Yang, 2020), and innovation (Ren, et al.,
2021). We add to this literature and show that CEO birthplace identity has a real effect on social
giving through CSR engagement, both in terms of levels of activity and value creation for the firm.
One important contribution of our paper is that we are the first to show that social trust is more
likely to be driven by place identity than by place attachment.
Third, this study adds to the recent stream of literature which examines determinants of CSR.8
We extend the scope of this literature by documenting an important additional determinant that
systematically affects firms’ CSR activities: CEO geographic origin. This has policy implications
for CSR. Focusing solely on the value implications of CSR naturally leads to discussions of
managerial incentive design to increase or reduce CSR expenditure. However, it is important to
consider idiosyncratic CEO identity characteristics that have the potential to moderate the impact
of incentive design on CSR investment.
Finally, our paper contributes to the literature which shows that corporate executives have
idiosyncratic styles that affect their behavior (e.g., Bertrand and Schoar, 2003; Kaplan, Klebanov,
and Sørensen, 2012; Fee et al., 2013).9 Our findings thus provide evidence of an additional
manager-specific effect, i.e., idiosyncratic style of a CEO on within-firm business policies. Our
distinction between place identity and place attachment has potential implications for what types
8 These studies find that CSR activity is related, for instance, to mergers and acquisitions (Deng et al., 2013), political affiliation of the firm (Di Giuli and Kostovetsky, 2014), cash holdings (Cheung, 2016), analyst coverage (Adhikari, 2016), CEOs parenting daughters (Cronqvist and Yu, 2017), seasoned equity offerings (Dutordoir, Strong, and Sun, 2018), the cost of debt (Goss and Roberts, 2011), the cost of equity (Dhaliwal et al., 2011), marital status of CEO (Hegde and Mishra, 2019), systematic risk (Albuquerque, Koskinen, and Zhang, 2019), the interactions with other product-market peers (Cao, Liang, and Zhan, 2019), and institutional investors (Chen, Dong, and Lin, 2020). 9 Prior studies provide evidence that a CEO’s life experience (Bernile, Bhagwat, and Rau, 2017; Cronqvist and Yu, 2017; Hegde and Mishra, 2019), career experience (Custodio and Metzger, 2014), personal style (Islam and Zein, 2020), overconfidence (Malmendier and Tate, 2005), gender (Ahern and Dittmar, 2012), age (Yim, 2013), cognitive and noncognitive ability (Adams, Keloharju, and Knüpfer, 2018), political ideology (Hutton, Jiang, and Kumar, 2014), and lifestyle (Sunder, Sunder, and Zhang, 2017), among others, affect corporate decisions.

- 8 -
of idiosyncratic CEO styles might be intrinsic to the CEO and what types might be driven by CEO
experiences over time.
The remainder of the paper is organized as follows. Section 2 describes our data and the
measures of CSR and birthplace identity. Section 3 documents that home CEOs are significantly
more likely to be associated with increased CSR activity. Section 4 shows that these CSR activities
by home CEOs are associated with increased firm value. Section 5 addresses agency explanations
for our results. Section 6 concludes. In the Internet Appendix, we discuss several robustness tests.
2. Data
2.1. Sample construction and measures of home CEOs
Our initial sample consists of the universe of firms covered by the ExecuComp database over
the period 1992–2016. We exclude financial firms (SIC 6000–6999) and regulated utilities (SIC
4900–4999) because our analysis uses firm characteristics (e.g., debt ratios) that are constrained
by regulatory requirements in these industries. To create our measure of home CEOs, we manually
collect birthplace data of CEOs from Marquis Who’s Who, Standard and Poor’s Register of
Directors and Executives, Lexis-Nexis, NNDB.com, or Google searches. We obtain birthplace
information for 1,845 out of the 6,251 US-born CEOs in 1,347 non-financial, non-utility firms and
11,894 firm-year observations covered by ExecuComp from 1992 to 2016.10 We classify a CEO
as a home CEO if the distance between her place of birth and the firm’s headquarters is less than
100 miles.11
Next, we match this sample to the MSCI ESG KLD database using CUSIP or TICKER
identifiers and firm names,12 leading to a sample of 1,066 unique CEOs in 752 firms and 6,339
firm-year observations. To calculate the distance between the CEO’s hometown and the firm’s
10 In unreported analysis, though we do not have exact birthplace information on them, we also include foreign CEOs in the sample but find no relation between the presence of a foreign CEO and the firm’s CSR activities. 11 In robustness tests, we use several alternative methods to identify home CEOs, including a continuous measure of distance (Ln (distance+1)) and restricting distance between CEO hometown and firm headquarters to lie within 50 or 200 miles. We also use home CEO information from Yonker (2017b), who gathers the Social Security Number (SSN) from LexisNexis online public records database. Bernile et al. (2017) argue that for 75% cases, the birth state of CEO and SSN state coincide. Our results are qualitatively similar in these alternative models. We thank Scott Yonker for sharing his SSN-related CEO data. 12 We use firm names to match firms if the observations cannot be matched by CUSIP or tickers. Because some firms share the same ticker in KLD, we also check firm names by hand when matching the two datasets using ticker symbols.

- 9 -
headquarters, we follow the procedure in Vincenty (1975). 13 We remove 484 firm-year
observations, leading to a sample of 984 unique CEOs in 714 unique firms and 5,855 firm-year
observations because we cannot find the latitudes and longitudes of the firm’s headquarters. After
merging with financial data from Compustat and removing missing values of firm and CEO
characteristics, our final sample consists of 963 unique CEOs in 703 firms and 5,771 firm-year
observations.
2.2. Measure of corporate social responsibility (CSR)
We construct our measure of corporate social responsibility activities using data collected
from the MSCI ESG KLD database. KLD rates large publicly traded US companies on
environmental, social, and governance (ESG) activities and has been used in numerous studies that
investigate the determinants and consequences of firms’ CSR (see, e.g., Hong and Kostovetsky,
2012; Deng et al., 2013; Di Giuli and Kostovetsky, 2014; Krüger, 2015; Lins et al., 2017; Cronqvist
and Yu, 2017; Chen et al., 2020). Based on a wide variety of sources, including company filings,
government data, non–governmental organization data, and media, KLD evaluates firms’ social
performance in seven major categories: community, diversity, employee relations, environment,
human rights, product, and corporate governance. Following Servaes and Tamayo (2013), Lins et
al. (2017), and Cao et al. (2019), we remove the product category because it contains several
elements that lie outside the scope of CSR, such as product quality, safety, and innovation. We
also remove the corporate governance category, as it is generally not a part of the CSR activities
undertaken by the firm (Lins et al., 2017).
For each of the categories, KLD classifies firms’ activities into “strengths (good deeds)” and
“concerns (harmful deeds)”. A firm gets one point if it engages in a related activity and zero
otherwise. For instance, a firm gets one point for a “Workforce Reduction Concern” if it “has made
significant reductions in its workforce in recent years” (MSCI, 2015) and zero otherwise. A rough
proxy for the firm’s engagement in CSR activities is the raw measure of CSR activities, which is
the sum of strength scores minus the sum of concern scores (used, for example, in Hong and
Kostovetsky, 2012; Di Giuli and Kostovetsky, 2014; Chen et al., 2020). However, because: i) KLD
gives equal weight to individual indicators when comparing CSR activities across years and
13 Headquarters’ location data are obtained from Compustat. To calculate the distance between the coordinates of the CEO’s hometown and the firm’s headquarters, we also require that the geographic coordinates (longitude and latitude) can be obtained from the US Census (2014) Gazetteer.

- 10 -
categories; and ii) the number of strength and concern indicators varies for each category every
year (Deng et al., 2013; Lins et al., 2017), comparing the raw CSR scores across categories and
years might lead to biased results. Hence, we follow Servaes and Tamayo (2013) and Lins et al.
(2017) in constructing an adjusted measure by dividing the strength and concern scores for each
of the five categories by the respective number of strengths and concerns.14 Our adjusted CSR
score is the difference between the total adjusted CSR strength score and the total adjusted CSR
concern score.15 We use this adjusted CSR score as our main measure of a firm’s engagement in
CSR activities. We note, however, that our baseline results also hold if we use the raw CSR score.
To facilitate the interpretation of the economic size of the estimated home CEO effect, we follow
Cronqvist and Yu (2017) and normalize the CSR score so that the minimum value is zero.
2.3. Descriptive statistics
Panels A and B of Table 1 report summary statistics for our firm and CEO variables for the
overall sample, as well as for home and non-home CEOs, respectively. We winsorize all our non-
binary variables at the 1st and 99th percentiles. Our sample firms are roughly similar to the samples
in prior studies along firm and CEO characteristics (e.g., Deng et al., 2013; Di Giuli and
Kostovetsky, 2014; Cronqvist and Yu, 2017). Firms with home CEOs represent 27.1% of
observations in our sample, consistent with the figure (30%) documented by Yonker (2017b).
Panel A also presents univariate statistics for the CSR score for the sample firms. A higher CSR
score implies that the firm has a higher engagement in CSR activities. To facilitate the
interpretation of the economic size of the estimated home CEO effect, we follow Cronqvist and
Yu (2017) and normalize the CSR score so that the minimum value is zero. Home CEOs are
associated with higher CSR scores than non-home CEOs. Finally, firms with home CEOs have
lower market-to-book values than firms with non-home CEOs. Home CEOs also appear to have
longer tenure and higher equity ownership than non-home CEOs, consistent with the notion of
birthplace identity for home CEOs.
14 To illustrate, there are seven subcategories in the human rights category in 2004, with four strength and three con-cern indicators. For a firm that gets one point in every subcategory, the raw score is: 1+1+1+1–1–1–1 = 1. In contrast, the adjusted human rights score is: 1/4+1/4+1/4+1/4–1/3–1/3–1/3 = 0. 15 To illustrate, in 2004, the respective numbers of strength subcategories across the five KLD categories are 4, 3, 3, 5, and 4. A sample firm with the sum of the KLD strength indicators across the five categories equal to 0, 1, 1, 2, and 1, respectively, will have an adjusted total strength score of 0/4+1/3+1/3+2/5+1/4 =1.32. The adjusted CSR score for the firm is the difference between 1.32 and the similarly adjusted total concern score.

- 11 -
3. Do home CEOs engage in higher levels of CSR?
3.1. Do firms run by home CEOs earn higher CSR scores?
To answer this question, we employ the following pooled OLS regression model:
CSR Scorei,t+1 = α + β Home CEOj,t + μFi,t + λCj,t + γk + δt +φm + εi,j,k,m,t (1)
where i indexes firms, j indexes CEOs, k indexes industries, m indexes counties, and t indexes time.
All independent variables are lagged by one year. γ, δ, and φ denote industry, year, and county
fixed effects. ε is the error term.
The dependent variable, CSR score, is the sum of adjusted CSR scores calculated from five
CSR categories (community, environment, diversity, employee relations, and human rights) in
year t+1. The main explanatory variable, home CEO, is a dummy variable that equals one if the
distance between the CEO’s birth county and the firm headquarters county is less than 100 miles,
and zero otherwise. F and C are vectors of firm and CEO control variables that have been found
to affect firm CSR engagement in the prior literature (Cronqvist and Yu, 2017). Specifically, firm-
level controls consist of size (proxied by ln (total assets)), profitability (proxied by return on assets
(ROA)), leverage, and a proxy for growth opportunities, the market–to–book ratio. CEO control
variables include a female CEO indicator, CEO age, CEO age2, CEO tenure, CEO tenure2, and
CEO ownership.
To control for time invariant industry–related variables that might affect CSR, we use the two–
digit Standard Industrial Classification (SIC) codes to define industry.16 We also include year fixed
effects to control for a possible time trend of firms becoming more concerned about CSR over
time.17 Finally, we add county fixed effects to control for county-level time invariant variables that
might affect CSR. County fixed effects capture religious, political, or other “cultural” variation
across regions in CSR policies. For example, Di Giuli and Kostovetsky (2014) show that firms
have higher CSR scores when they are headquartered in Democratic-oriented rather than
Republican-oriented states, while Bae, Sun, and Zheng (2019) report that regional religiosity has
a significant impact on socially responsible investment behavior by U.S. fund managers. We do
not use CEO fixed effects in our regression models for the same reason as in Cronqvist and Yu
(2017). Most CEOs retire after their tenures. Only 37 out of the 963 CEOs in our sample manage
16 Our results continue to hold when we use an alternative industry definition in the Internet Appendix. 17 There is no corresponding trend in the proportion of home CEOs.

- 12 -
two different firms during the period we study, making the use of CEO fixed effects empirically
challenging. Across all models, we use heteroscedasticity–robust standard errors double–clustered
at the county-year level (Lim and Nguyen, 2020). Overall, our model compares firms with home
CEOs versus those with non-home CEOs within the same industry, year, and county, and with
similar firm and CEO characteristics.
Table 2 presents the results for our baseline models. Model (1) includes only firm control
variables, model (2) includes only CEO control variables, and model (3) includes both firm- and
CEO-level controls. In model (3), only firm size (ln (total assets)), profitability (ROA), market-to-
book ratio, and CEO age2 are significantly related to the CSR score with signs consistent with the
prior literature (see, e.g., Adams and Funk, 2012; Di Giuli and Kostovetsky, 2014).
Regardless of the controls, however, across all three models, there is an economically sizeable
and consistently strong positive association between home CEOs and CSR, which is significant at
the 1% level. In economic terms, firms with a home CEO on board are associated with higher CSR
ratings which range between 4.06% (=0.121/2.983 in model (1)) and 4.59% (=0.137/2.983 in
model (2)), relative to the median firm in our sample. This corresponds to approximately 21.1%
(= 0.121/0.574) of one standard deviation of the CSR score distribution.
3.2. How large is the CEO birthplace identity effect?
3.2.1. Effect on cash flows
Following Di Giuli and Kostovetsky (2014) and Cronqvist and Yu (2017), we next examine
how expenditure on CSR affects the firm’s cash flows. Since most CSR activities involve extra
expenses (e.g., work–life benefits such as childcare, pollution prevention, or employee health and
safety programs), they would, at least partially, be expected to affect the firm’s selling, general,
and administrative (SG&A) expenses, and, in turn, the firm’s cash flows.18
Table 3 presents the results. In model (1), we regress the log (SG&A expenses) on CSR score,
controlling for year, industry, and county fixed effects, as well as the same set of firm and CEO
characteristics used in Table 2. We find a strong positive relation between CSR and SG&A
expenses, in line with prior evidence (e.g., Di Giuli and Kostovetsky, 2014; Cronqvist and Yu,
2017). The CSR score coefficient is 0.149 and statistically significant at the 1% level, suggesting
18 We note that part of any expenses related to CSR may also end up as part of the Cost of Goods Sold (COGS) or capital expenditure. For example, some investments in environmentally friendly equipment affect the firm’s capital expenditure. Consequently, our estimates might actually understate the full costs of CSR.

- 13 -
that a greater level of engagement in CSR leads to higher SG&A expenses. In economic terms, a
one standard deviation increase in CSR score translates into to an extra 8.55% (=0.574 × 0.149)
SG&A expenses for a firm. In other words, the median firm spends an extra $59.68 million (=8.55%
× $698 million) per year on corporate social responsibility, corresponding to approximately 32.29%
of the median firm’s net income.19
Following Cronqvist and Yu (2017), we multiply the coefficient of Home CEO in column (3)
of Table 2 by the coefficient of CSR Score in column (1) of Table 3 to determine the effect of
having a home CEO on SG&A expenditure. Having a home CEO corresponds to an extra 1.91%
(=0.128 × 0.149) SG&A expenses for a firm. The median firm with a home CEO spends an extra
$13.33 million (=1.91% × $698 million) per year on corporate social responsibility relative to a
firm with a non-home CEO, corresponding to approximately 7.21% of the median firm’s net
income. This figure is comparable to the CEO-daughter effect (on the order of 10.4%) in Cronqvist
and Yu (2017) and the CEO political preference effect (on the order of 9.3%) in Di Giuli and
Kostovetsky (2014). Overall, our findings suggest that the home CEO effect we document is
economically sizeable.
One concern with the first model in Table 3 is that CSR is a form of marketing and might be
correlated with advertising spending (which also falls under SG&A) (Di Giuli and Kostovetsky,
2014). Hence, in model (2), we remove advertising spending from SG&A expenditure. The results
are similar to model (1) in both economic and statistical magnitude. Another concern is that CSR
might boost sales, which is likely to lead to an increase in expenses to meet those sales. In model
(3), the dependent variable is constructed by dividing SG&A spending by total revenues. Again,
we find a strong positive relation with CSR.
3.2.2 Which aspect of CSR is important?
As discussed in section 2.2, our CSR score consists of five different categories: community,
environment, diversity, employee relations, and human rights. We next decompose our CSR
measure to analyze which categories have the strongest home CEO effects.
Table 4 presents the results for each of the five CSR categories. First, it is worth noting that,
on average, a home CEO is consistently related to more socially responsible corporate decision-
19 The median values of SG&A expenses and net income in our sample are $698 million and $184.82 million, respec-tively.

- 14 -
making, as all the point estimates are positive. The coefficients on four out of the five CSR
activities are statistically significant. Hence, the aggregate home CEO effect does not appear to be
driven by any specific category. In order of the economic magnitude of the point estimates, the
strongest contributors to the overall effect on CSR of home CEOs are diversity, environment,
community, and employee relations (all significant at the 1% level). In economic terms, a firm
with a home CEO is associated with enhanced diversity, environment, employee relations and
community by about 4.7% (=0.047/1), 4% (=0.032/0.800), 2.36% (=0.021/0.889) and 2.2%
(=0.022/1), respectively, relative to the median firm.
The evidence that employee relations are significantly improved with a home CEO in place is
consistent with the effect documented by Yonker (2017a). This finding is important as it implies
that the previous findings on labor relations (Yonker, 2017a), for instance, are just parts of
collective CSR policies of home CEOs rather than ad hoc isolated corporate decisions. Hence, it
appears plausible that we should not simply interpret such findings individually but as an overall
package of CSR activities.
In unreported analysis we examine the effects on the specific strength and concern
subcategories of the four CSR categories that, as shown above, are significantly associated with
home CEOs. Specifically, we run 66 regressions for each of the strength and concern subcategories
of the community, environment, diversity and employee relations categories employing the same
set of control variables and fixed effects used in prior tables. Our results in the specific
subcategories are broadly consistent with the overall results.
In the community category, home CEOs are significantly more likely to provide for charity
and have less negative economic effects on their communities. In the environment category, home
CEOs appear to focus more on recycling and their firms have fewer concerns on hazardous waste,
regulatory problems, substantial emissions, agriculture chemicals, climate change, land use and
biodiversity, supply chain management and water management. In the diversity category, home
CEOs promote more female and minority employees, hire more disabled individuals from their
hometowns and experience less controversies concerns. Finally, in the employee relations
category, home CEOs treat their employees in a fairer manner - for instance, they exhibit fewer
concerns on workforce reductions and higher strengths on employee involvement. Additionally,
home CEOs are associated with fewer concerns on union relations, supply chain controversies,
and child labor.

- 15 -
3.3. Place identity or place attachment?
In this section, we examine whether the birthplace identity effect is more likely to be driven
by place identity or place attachment. Place attachment is more likely to be endogenously driven
by the CEO’s choice of residence and work environments than place identity. We conjecture that
non-home CEOs are more likely to be attached to the locations where they have lived for long
periods but do not necessarily identify more with them. In contrast, home CEOs whose birthplaces
are close to or coincide with their residential places, are more likely to exhibit high levels of both
place attachment and place identity. Simply put, (home or non-home) CEOs who reside close to
work environments for long periods are more likely to have strong feelings of place attachment,
while home CEOs whose birthplaces and work environments coincide feel a stronger sense of
place identity than non-home CEOs. If place identity drives the birthplace effect, then we should
expect that home CEOs who reside close to work environments for longer periods invest more in
CSR activities than non-home CEOs who reside close to their work environments for equally long
periods. The relation between CSR and length of residence should be much weaker or non-existent
for non-home CEOs whose residential places are far away from their birthplaces. If place
attachment drives the birthplace effect, then we should expect both home and non-home CEOs
who reside close to their work environments for long periods to invest more in CSR activities.
In Table 5, we explore the relation between CSR and the length of the CEO residence for both
home and non-home CEOs.20 Out of 5,771 firm-year observations, we identify the CEO residence
for 2,342 firm-year observations.21 Panel A in Table 5 reports coefficients from OLS regressions
on home CEOs and non-home CEOs where the dependent variable is the adjusted CSR score. The
main independent variable of interest is Length of Residence near Headquarters, which is the
number of years that a CEO resides in a county that is no more than 100 miles away from the
location of headquarters during her tenure. In model (1), we focus on home CEOs and find a
significantly positive relation between the length of residence and CSR score at the 1% level. In
model (2), the main independent variable of interest is statistically insignificant at conventional
20 We thank Scott Yonker for sharing his CEO residence data. 21 In the sample of 2,342 firm-year observations, 696 observations are for home CEOs (i.e., the distance between birthplace and headquarters are less than 100 miles). 98.71% (687/696) of them are also residents near the firm head-quarters (i.e., the distance between residence and headquarters is also less than 100 miles). This means that their birthplace, residence, and headquarters are very close.

- 16 -
levels for non-home CEOs, suggesting that CEOs do not engage in more CSR activities if they
live in places they are attached to but are not their birthplaces.
In Panel B, we divide the sample based on the length of residence (above/below sample
median) for both home and non-home CEOs and compare the mean values of CSR between home
CEOs and non-home CEOs with similar length of residence. Controlling for the length of
residence, the CSR score of a home CEO is higher than that of a non-home CEO and the mean
difference is statistically significant at the 1% level. Overall, place identity of home CEOs appears
to be a stronger driver for the birthplace effect.
3.4. The strength of the CEO place identity effect
Previous literature shows that the impact of home CEOs strengthens with higher connections
between CEOs and their hometowns (see, e.g., Yonker, 2017a; Jiang et al., 2019). If the birthplace
identity effect on CSR is not spurious, we should expect the effect to be more pronounced for
home CEOs with stronger home ties. We use three variables to capture home connections as in
Pool et al. (2012) and Jiang et al. (2019). The first one is the variable “attended home college or
university”, which is a dummy set to one if the CEO was educated in a home state college or
university, and zero otherwise. The second variable to capture home ties is the “long home tenure”,
which is a dummy set to one if the number of years that the CEO lived in her home state is greater
than the sample median, and zero otherwise. The third, “hometown board position”, is a binary
variable that is equal to one if the CEO is the board member of another firm in her hometown state
in a given year, and zero otherwise.
Table 6 reports the results for the analysis on CEO home connections. We augment the
baseline model (3) in Table 2, by interacting home CEOs with the three CEO home connection
variables. The positive association between home CEOs and CSR remains statistically significant
at the 1% level in all three models. Importantly, in all three models, the interaction terms between
the home CEO indicator and the home connections variables are significant and positively related
to the CSR score, albeit only at the 10% level for the interaction terms between home CEOs with
long home tenure and hometown board position.

- 17 -
3.5. Within-firm effects of CEO birthplace identity
3.5.1. Does CSR activity change when the CEO changes?
We first examine the within–firm effects of CEO birthplace identity on CSR activities by
examining CEO turnover. We identify 207 CEO changes in our sample and classify them into 4
types: from a non–home CEO to a home CEO, from a home CEO to a non–home CEO, from a
home CEO to a home CEO, and from a non–home CEO to a non–home CEO.
If birthplace identity drives our result, then we would expect a significant effect to show up in
the group of firms which replace a non–home CEO with a home CEO, and in firms which replace
a home CEO with a non-home CEO (with the effect on the latter having the opposite sign than the
former). We report results from a difference–in–differences approach. The double differencing
approach allows us to examine whether the change in CEO between the control period and post-
treatment period is different between treated firms (i.e., firms with specific change of a CEO) and
control firms. Specifically, for each observation in the treatment group, we conduct a one-to-one
matching process based on calendar year, 2-digit SIC industry classification, market-to-book ratio,
and ROA. The control group contains matched observations of firms with no CEO change in year
t. The change of the CSR score is calculated from one year before the CEO change until two years
after the CEO change (t-1, t+2), with year t being the year of the CEO change.22 We test for
differences in means in changes of the CSR score between the treatment group and control group.
In Table 7 Panel A, the first treatment group contains observations where a non-home CEO is
replaced by a home CEO. There are 32 CEO changes in this category. The average change of the
CSR score in the treatment group is 0.113 in comparison to -0.101 in the control group. The mean
difference is positive and statistically significant at the 10% level, indicating that the CSR score
significantly increases when a non-home CEO is replaced by a home CEO. The second treatment
group in Panel A contains 28 observations where a home CEO is replaced by a non-home CEO.
Using a similar matching approach with the control group containing matched firms with home
CEOs in year t-1 and no CEO change in year t, we find that the average change of CSR score in
the treatment group is -0.137 relative to 0.345 in the control group. The mean difference is negative
and statistically significant at the 1% level, which suggests that the CSR score plunges when a
home CEO is replaced by a non-home CEO.
22 Using an alternative window (t-1, t+3) leads to qualitatively similar results.

- 18 -
The third and fourth treatment groups contain treated samples of firms where a non-home
CEO is replaced by another non-home CEO, and a home CEO is replaced by another home CEO.
In neither case is the difference in changes of the CSR score between the treatment and control
group statistically significant at conventional levels. Firm CSR engagement does not change when
a non-home CEO is replaced by another non–home CEO or when a home CEO is replaced by
another home CEO.
3.5.2. Does CSR activity change when the firm’s headquarters changes?
We next analyze the effects of variations in birthplace identity by focusing on firms that
relocate corporate headquarters to another county, thus changing the level of birthplace identity.
Not surprisingly, the sample of firms that relocate farther away from home is relatively small.
However, we do identify a sample of firms that did relocate during the home CEO’s
tenure. Specifically, based on the sample of 703 unique firms in our main analysis, we identify 71
firms which either relocated closer to or farther away from the CEO’s birthplace at least once in
the period 1994–2016. Out of the 71 firms, there are 19 firms which relocated closer to the CEO’s
birthplace and 52 which relocated farther away while 14 firms are managed by home CEOs and
57 firms are managed by non-home CEOs.
Table 7 Panel B reports the results. We re-estimate the baseline models with three main
variables of interest, namely, Home CEO, and the interaction variables of Home CEO ×
Headquarters Relocation (in model (1)), and Home CEO × closer-to-home headquarters
relocation (in model (2)). Headquarters relocation is a dummy variable that equals one if the firm
has relocated its headquarters, and zero otherwise. Closer-to-home headquarters relocation is a
dummy variable that equals one if the firm has relocated its headquarters, and the new headquarters
is geographically closer to the CEO’s birthplace at the county-level relative to the previous
headquarters, and zero otherwise.
In both models, the effect of home CEO on CSR remains positive and significant at the 1%
level with the coefficients being similar, in terms of economic magnitude, to the baseline models.
In model (1), the interaction variable of Home CEO × headquarters relocation is statistically
insignificant at conventional levels, suggesting that, in general, headquarters relocation does not
affect the relation between CEO birthplace identity and CSR activities. Interestingly, however, a
closer-to-home relocation amplifies the positive impact of home CEO on firm CSR. In model (2),
the interaction variable Home CEO × closer-to-home headquarters relocation carries a positive

- 19 -
coefficient, significant at the 5% level. This finding indicates that changes in birthplace identity
over time can explain temporal changes in CSR activities. While the headquarters relocation itself
does not play any significant role on the level of CSR activities, the type of CEO who initiates the
relocation (i.e., home CEOs) and the direction of that relocation (closer to her home) do matter.23
3.5.3. Is the home CEO effect simply driven by the type of corporate culture at the firm?
In the robustness check section, we show that our results are robust to including firm fixed
effects in the model. However, a remaining concern is that corporate culture at the firm may also
change over time, causing the firm to replace its CEO, rather than the other way around. Hence, in
this explanation, our results would be attributable to a change in corporate culture, not to the CEO.
To rule out this explanation, we use corporate culture proxies that vary over time. In particular, we
use the score of five time-varying corporate cultural values of integrity, teamwork, innovation,
respect, and quality as in Li et al. (2020).24 We then set a dummy variable that equals one if the
firm-year integrity score, or teamwork score, or innovation score, or respect score, or quality score
is lower or higher than 100% relative to the corresponding score of the previous year, and zero
otherwise.25, 26 Each firm-year’s score is the weighted-frequency count of each of the five cultural
values-related words and phrases in the QA section of firm’s earnings calls transcripts averaged
based on three-year moving averages of annual scores.
Table 7 Panel C presents the results. Our main variable of interest is Home CEO and its
interaction with the five corporate culture dummies. Across all specifications, home CEOs carry a
positive and strongly significant coefficient at the 1% level, with economic magnitude similar to
our baseline results. In contrast, all five interaction variables, as well as the corporate culture
variables themselves, are insignificant at conventional levels, suggesting that corporate culture
does not drive the relation between home CEOs and CSR activities.
23 To verify that the documented results are attributable to changes in birthplace identity resulting from the relocation decisions, we test whether firm attributes in the subsamples that relocated either closer or farther away from home are comparable. A Student’s t-test (not tabulated for brevity) shows no significant differences between the two groups of firms across either firm attributes or CSR activities in the year immediately before relocation. 24 We would like to thank Kai Li for sharing data on corporate culture. 25 We obtain similar results when we use a 75% or 50% change in the score of each corporate culture value. 26 Creating the dummies based on the changes in the five corporate culture scores relative to the median value of the score instead of the score of the previous year does not alter our results.

- 20 -
3.6. Dealing with endogeneity
A major concern with our causal interpretation of the relation between home CEOs and CSR
activities is endogeneity. There are two possible sources of endogeneity. The first is reverse
causality. It is possible that boards choose the firm’s desired CSR strategies and hire CEOs to
implement these strategies. If home CEOs are better able to articulate or implement these CSR
strategies, then the positive relation between home CEOs and CSR may be driven by reverse
causality. The second is an omitted variables bias, arising from unobservable characteristics that
are related both to CEO selection by firms and to CSR activities. We deal with both issues below.
3.6.1. Propensity score matching (PSM)
To solve the matching issue and ensure that our results are not driven by observable
characteristics which induce home CEOs to invest in CSR, we implement a propensity score
matching (PSM) analysis as in Drucker and Puri (2005). We match firms that hire home CEOs
(treated) with firms exhibiting analogous characteristics but do not have a home CEO (control).
The treatment effect from the PSM estimation is the difference between the treated sample and the
matched control sample, as measured by the home CEO coefficient. In order to match firms, we
calculate a one-dimensional propensity score, which is a function of observable characteristics
used in our baseline model (3) of Table 2 plus two more location–level variables. These are: i) the
state GDP per capita, which is defined as state–level GDP divided by the state population; and ii)
the state unemployment rate. The two location-level variables are included because firms located
in richer states or states with lower unemployment rate are likely to be faced with better economic
conditions, potentially offering them greater flexibility to spend more on CSR activities. We
implement a one–to–one (i.e., nearest neighbor) matching estimator with replacement.27 To ensure
the adequacy of the matching estimation method, we require that the absolute difference in
propensity scores between pairs does not exceed 0.01.
Table 8 reports the PSM results. Panel A reports the difference–in–means of the independent
variables for firms with home CEOs versus firms with non–home CEOs for both the unmatched
and matched samples, respectively. This diagnostic test aims to ensure that our PSM
implementation removes sample selection biases (related to observable firm characteristics). The
27 For robustness, we also use 30-nearest-neighbors, 50-nearest-neighbors, and Gaussian and Epanechnikov kernel-based matching estimators. We find similar results with these different estimators.

- 21 -
t–statistics of the corresponding difference–in–means indicate that many variables differ
significantly for the unmatched sample. As expected, however, all the considered independent
variables are comparable for the matched sample which indicates that the PSM process removes
obvious sample selection biases. Using the matched sample in Panel B, we re–run the regression
with the same control variables and fixed effects as the baseline model (3) of Table 2. The results
remain robust, confirming that selection on observable characteristics does not bias the positive
impact of home CEO on CSR score.
3.6.2. Two-stage instrumental variable (IV) analysis
To address the possibility that an omitted variable bias drives our results, we perform a two–
stage instrumental variable (IV) analysis (2SLS) and present the results in Table 9. This approach
requires an instrumental variable that is correlated with the choice of home CEOs to manage the
firm but is uncorrelated with CSR activities. We use the Hometown board position prior to
becoming CEO variable as an instrument for the firm’s decision to select a home CEO. Relative
to the Hometown board position variable of Table 6, the Hometown board position prior to
becoming CEO is an indicator variable that equals one if the CEO was a board member of another
firm in her hometown state before she became CEO, and zero otherwise. We ensure that home
CEOs held a board position prior to becoming CEOs to avoid the criticism that the CEO position
causes the board position, specifically that local firms recruit local CEOs at other firms to join
their boards (Fahlenbrach, Low, and Stulz, 2010). Additionally, home CEOs with board experience
gained in a home state firm are more likely to have better connections and a better knowledge and
understanding of the customers, suppliers, employees, laws, tax regulations, and generally, the
environment where the firm operates. It can be therefore plausibly argued that firms are more likely
to select a home CEO who had also acted as a board member of another firm in her home state to
exploit CEO connections. Hence, this instrument is likely to satisfy the relevance requirement of
instrumental variables. Simultaneously, a CEO serving as a board member in another firm in her
home state is relatively unlikely to be correlated with her own firm’s choice of CSR, satisfying the
exclusion condition of instrumental variables. Supporting this conjecture, we find an insignificant
relation between Hometown board position and CSR score in model (3) of Table 6, as well as
between Hometown board position prior to becoming CEO and CSR score in untabulated results.
To perform the IV analysis, in the first stage (model 1), we regress the variable Home CEO
on Hometown board position prior to becoming CEO as well as on all other firm– and CEO–level

- 22 -
control variables used in previous analysis. We find a strong positive relation between Hometown
board position prior to becoming CEO and Home CEO. Specifically, the coefficient on the
hometown board position indicator is significant at the 1% level, indicating that our instrument is
appropriate. Importantly, we find that the Kleibergen–Paap Rk Wald F statistic for the weak
identification test is comfortably higher (85.339) than the critical value and satisfies the relevance
condition, allowing us to reject the null of weak identification. In the second stage (model 2), we
run the same regression as in the baseline model (3) of Table 2 where the instrumented home CEO
variable is our main variable of interest. The significantly positive relation between the
instrumented home CEO and CSR score remains. This result, combined with our extensive set of
controls, helps alleviate endogeneity concerns and confirms the robustness of our finding that
home CEOs engage in higher levels of CSR activities.
4. Do CSR activities by home CEOs benefit their firms?
The prior literature finds mixed evidence on the relation between CSR and firm performance.
Friedman (1970) suggests that CSR investments that ultimately benefit other stakeholders at the
expense of shareholders will lead to reduced corporate profits and stock prices. Servaes and
Tamayo (2013), Flammer (2015), and Albuquerque et al. (2019) show, however, that CSR affects
Tobin’s Q positively. In our analysis, we investigate whether having a home CEO affects the
impact of CSR on firm value. Specifically, we examine whether CSR activities by home CEOs
add to or destroy firm value relative to activities undertaken by non–home CEOs.
Table 10 presents the results where the dependent variable is Tobin’s Q as a measure of firm
value in year t (model (1)), t+1 (model (2)), and t+2 (model (3)).28 All control variables are similar
to the ones used in prior analysis. In all three regressions, in line with Yonker (2017b), the
individual effect of a home CEO on performance is insignificantly different from zero. CSR itself
positively affects performance (in the first two models), consistent with the prior literature. Most
importantly, we find that, across all three models, there is a significant positive association between
Tobin’s Q and CSR for firms with a home CEO relative to firms with a non–home CEO.
28 KLD scores persist strongly over time, which makes measuring the effect of yearly changes in KLD ratings on changes in Tobin’s Q a meaningless exercise.

- 23 -
4.1. Are home CEOs better regarded? Evidence from customer satisfaction, suppliers’ trade credit
and employee satisfaction
Our evidence shows that home CEOs add value to the firm when they engage in CSR activi-
ties. A potential explanation is that home CEOs have more local information, including infor-
mation advantages related to the local business environment and local business or political con-
nections (Yonker, 2017b). These local skills are likely to help home CEOs to target CSR decisions
effectively and hence build social trust for the firm. If local stakeholders consider a home CEO as
“one of them” and are consequently more trusting towards these CEOs, we should expect higher
stakeholder satisfaction for firms with home CEOs. In this section, we first examine the impact of
home CEOs on customer satisfaction, suppliers’ trade credit, and employee satisfaction.
The results are reported in Panel A of Table 11. Using a linear probability model, in model
(1), we investigate whether firms with home CEOs are associated with higher customer satisfac-
tion. The dependent variable is a dummy variable that equals one if the firm’s customer satisfaction
score is higher than its industrial benchmark in the American Customer Satisfaction Index (ACSI)
in a given year, and zero otherwise. As expected, we find that the customer satisfaction of firms
with home CEOs is higher relative to that of firms with non-home CEOs.
Next, we examine whether suppliers to firms with home CEOs extend more trade credit rela-
tive to firms with non-home CEOs. We conjecture that the level of asymmetric information faced
by the firms’ suppliers (Ferris, 1981), especially local suppliers, declines when firms are managed
by home CEOs. The enhanced trust of suppliers towards home CEOs strengthens the supplier-
customer relations and leads to higher level of trade credit granted to the firm. In models (2) and
(3), we use payables scaled by sales and cost of goods sold respectively, as proxies for the trade
credit the firm gets from suppliers (Dai, Rau, and Tan, 2020). Indeed, we find that firms with home
CEOs are associated with increased levels of account payables. Because the strength of supplier-
customer relations manifests, firms with home CEOs receive more trade credit demand. In eco-
nomic terms, firms with a home CEO on board are associated with higher levels of account paya-
bles which range between 7.46% (=0.005/0.067 in model (2)) and 11.93% (=0.013/0.109 in model
(3)), relative to the median firm in our sample.
Lastly, we use a novel dataset from Glassdoor to measure employee satisfaction. Glassdoor
has collected employee satisfaction ratings and reviews of their employers since 2008. Specifi-
cally, Glassdoor employer reviews contain employees’ ratings on a scale of one to five, as well as

- 24 -
satisfaction in different categories such as work/life balance, culture and values, career opportuni-
ties, and compensation and benefits. In model (4), we first use the average score for the firm from
Glassdoor Rating as a dependent variable to measure employee satisfaction. We find that the home
CEO variable has a positive and strongly significant (at the 1% level) coefficient. This finding
indicates that firms with home CEOs are associated with higher employee satisfaction. In eco-
nomic terms, firms with a home CEO on board are associated with 7.97% (= 0.271/3.400) higher
employee satisfaction, relative to the median firm in our sample. All these results are consistent
with Lins et al. (2017).
In addition to the overall employer rating, we examine the effect of employee satisfaction
across different dimensions: work/life balance, culture and values, career opportunity, and com-
pensation and benefits in models (5) to (8). Across all four models, there is a consistently strong
positive association between home CEOs and employer rating, which is statistically significant at
conventional levels. In economic terms, a firm with a home CEO is associated with enhanced
work/life balance, culture and values, career opportunity and compensation/benefits by 8.63%
(=0.302/3.500), 7.18% (=0.253/3.524), 9.44% (=0.299/3.167) and 3.30% (=0.112/3.398), respec-
tively, relative to the median firm.
In models (9) and (10), we construct two more variables to measure employee satisfaction.
The first is the firm recommendation ratio, calculated as the proportion of employees who recom-
mend the firms they are employed at. The second is the CEO Approval Ratio, computed as the
proportion of employees who approve of their CEO.29 We find that firms with home CEOs are
associated with higher firm recommendation and CEO approval ratios.
4.2. The effect of CSR on local margins, sales growth, and employee productivity
In the previous section, we show that: i) home CEOs who engage in CSR are associated with
higher firm value; and ii) home CEOs are associated with higher customer satisfaction, suppliers’
trade credit and employee satisfaction. In this section, we attempt to shed light on the channels
through which customers, suppliers and employees increase firm value. Specifically, we differen-
tiate between local and non-local stakeholders. The results are reported in Panel B of Table 11. In
each model, the variable of interest is the interaction term between Home CEO and CSR.
29 The average overall Glassdoor Rating in our sample is 3.34 stars, which is very similar to Green et al. (2019). Additionally, 51% of employees, on average, recommend the firms they are employed at, while about 44.39% of employees approve of their CEO.

- 25 -
In models (1) and (2), our main variable of interest is gross margin, defined as total sales
minus costs of goods sold, scaled by total assets. We examine whether home CEOs who engage
in CSR activities sell their products at higher mark-ups. Model (1) analyzes the effects on local
customers or suppliers, while model (2) analyzes the effect on non-local customers or suppliers.
To identify local customers and suppliers, we collect data from the Compustat Segments Cus-
tomer File. Using manual search procedures, we identify and match US listed customers to their
Compustat identifiers (i.e., GVKEY). The variables Local (Non-local) customers or suppliers are
dummy variables that take the value one if customers or suppliers are located within (outside) 100
miles from the firm’s headquarters, and zero otherwise. Model (1) shows that the gross margin of
home CEO firms with CSR activities is higher relative to the margin for non-home CEO firms. In
economic terms, a one-standard-deviation increase in CSR score is associated with 1.84%
(=0.574×0.032×100) higher gross margin for home CEOs relative to non-home CEOs. In contrast,
there is no significant effect for non-local CEOs, which indicates that the local stakeholders are
the ones who support home CEOs.
One concern is that the higher mark-up documented in model (1) is associated with lower
sales growth for the firm, leaving the shareholders no better off. Therefore, in model (3) and (4),
our dependent variable is sales growth, computed as the percentage growth in sales relative to the
previous year. Interestingly, firms with home CEOs that perform CSR activities experience higher
sales growth than firms with non-home CEOs: a one-standard-deviation increase in CSR is asso-
ciated with 9.24% (=0.574×0.161) higher sales growth over the sample period. Again, the positive
effect holds only for local customers (model 3) but not for non-local customers (model 4). Taken
together, models (1) and (3) indicate that firms with home CEOs engaging in CSR experience
higher sales than other firms, despite charging higher mark-ups. This suggests that the customers
of these firms are more willing to “stick” with the company that is managed by a CEO with em-
bedded trust (i.e., home CEO) who also wishes to maintain that trust through CSR.
Turning to employees, in models (5) and (6), we examine whether firms with home CEOs,
engaging in CSR, achieve higher sales per employee than firms with non-home CEOs. Model (5)
shows the effect for local employees and model (6) for non-local employees, respectively. The
variable, Local (non-local) employee, is an indicator variable that equals one if a firm has higher-
than-median number of local (non-local) employees. The number of local employees of a firm is
proxied by its annual market share multiplied by the number of employees in the same industry in

- 26 -
its headquarters’ county. The county-specific industrial employment data is from the County Busi-
ness Patterns (CBP) database. The market share is based on market capitalization and 2-digit SIC
codes.
We find a positive association between home CEOs × CSR and employee productivity in
model (5) for local employees. Economically a one-standard-deviation increase in CSR score is
associated with $33,782 (=58.853×0574) higher sales per employee for firms with home CEOs
relative to firms with non-home CEOs. The mean (median) firm over the estimation period has
sales per employee of $332,297 ($223,229), with a standard deviation of $333,233, indicating that
the impact of CSR on employee productivity is considerable. This result suggests an additional
channel through which CSR affects firm value. Finally, to verify that higher sales per employee
are not due to employee layoffs, we use the growth in the number of employees as dependent
variable in models (7) and (8). As we show in model (7) for local employees, there is no evidence
of higher employee layoffs for firms with CEOs that engage in CSR; instead, there is an increase
in employee growth for such firms.
In sum, these findings suggest that three channels through which value is created by CSR by
firms with home CEOs are: i) greater effort by local employees, as reflected in their higher produc-
tivity, ii) the willingness of local customers to continue supporting these firms, as reflected in the
higher sales growth and acceptance of higher mark-ups. The latter result also partly reflects the
support of suppliers in offering more relaxed funding terms.
4.3. Do high CSR firms do better during exogenous shock periods?
Lins et al. (2017) argue that if a firm’s social capital helps build stakeholder trust and cooper-
ation (Putnam, 1993), it should pay off when being trustworthy is more valuable, such as in an
unexpected crisis period. Lins et al. (2017) use the 2008–2009 financial crisis as an example of a
crisis period. We follow their analyses using two unexpected crisis periods: the 2008-09 financial
crisis period and the 2020 COVID-19 pandemic period. In addition to exploring whether trust is
the mechanism for the effect of CSR on firm value, these tests allow us to draw inferences on the
causal effects of CSR by firms with home CEOs relative to firms with non-home CEOs.
Table 12 Panel A presents the results for the 2008-09 financial crisis period. We follow the
approach by Lins et al. (2017) and estimate difference-in-differences models with continuous treat-
ment and include industry, county, and time fixed effects over the period 2007–2013. Specifically,
we construct a panel of monthly returns for all the firms prior to the financial crisis period and

- 27 -
after the financial crisis period. The financial crisis period is a dummy variable that is set to one
in the period August 2008 to March 2009, and zero otherwise. The post-crisis period is a dummy
variable that is set to one in the period April 2009 to December 2013, and zero otherwise. The
dependent variables are raw return (in models 1 and 3) and abnormal return (in models 2 and 4),
defined as the raw return minus the expected return, based on the market model using the CRSP
value-weighted index as the market proxy. Market model parameters are estimated using monthly
data over the 60-month period ending in July 2008. To avoid problems with outliers, we winsorize
these returns at the 1st and 99th percentiles. As in Lins et al. (2017), we relate these returns to our
CSR measure for the prior year 2006 to guard against the possibility that by year end 2007, firms
may have already changed their CSR policies in anticipation of the crisis ahead.
Our main variable of interest is the interaction CSR × financial crisis period. The coefficient
on the interaction captures the differential impact of CSR on monthly stock returns, during the
financial crisis period, after controlling for the firm’s four-factor loadings and financial character-
istics similar to the controls used by Lins et al. (2017). Additionally, we include the variable CSR
× post-crisis period to investigate whether any potential significant relation between CSR and firm
stock returns, is unique to periods of low trust (i.e., during financial crisis period), or is common
to most periods, perhaps due to some unobservable (omitted) risk factor that is correlated with
CSR.
In models (1) and (2), which present the results for home CEOs, we find that firms with higher
CSR ratings perform significantly better during the financial crisis period. The effect of CSR on
returns is economically large: a one-standard-deviation increase in 2006 CSR (0.498) is associated
with 1.25% (=0.025×0.498) higher raw return or 1.05% (=0.021 × 0.498) higher abnormal return
during the financial crisis period. This translates into $114.43 ($33.48) million value enhancement
for a mean (median) size firm using raw returns, and $96.12 ($28.13) million value enhancement
for a mean (median) size firm using abnormal returns. Consistent with Lins et al. (2017), we do
not find any reversal in abnormal returns in the post-crisis period, which indicates that it is less
likely that an unobservable (omitted) risk factor is correlated with CSR and drives the positive
relation we document. A similar analysis for non-home CEOs shows no significant effect, sug-
gesting that the market rewards only home CEOs who engage in CSR activities but not non-home
CEOs.

- 28 -
Table 12 Panel B reports similar results using the COVID-19 pandemic period as an alterna-
tive exogenous negative shock. We estimate difference-in-differences models with continuous
treatment and include industry, county, and time fixed effects for a sample of US firms over the
period January 2019–December 2020. Similar to Ding, et al. (2021) and Augustin, et al. (2021),
the COVID-19 period is an indicator variable that is set to one in the period January 2020 to May
2020, and zero otherwise. Accordingly, the post-COVID-19 period is an indicator variable that is
set to one in the period June 2020 to December 2020, and zero otherwise. We relate the raw and
abnormal returns to our CSR measure for the year 2018, which is the last year with CSR data
availability in the KLD dataset.
We find that firms with higher CSR ratings performed significantly better during the COVID-
19 period only when they are managed by home CEOs (models 1 and 2). In contrast, firms man-
aged by non-home CEOs perform significantly worse (models 3 and 4). Different to the financial
crisis period results, we find that the interaction variable CSR × post-COVID-19 period is also
significantly positive for home CEOs and significantly negative for non-home CEOs, which is
plausible as the effect of COVID-19 persisted and did not fade away immediately after May 2020.
In sum, these results indicate that the excess returns earned by high CSR firms during tough
moments such as the 2008-09 financial crisis period and COVID-19 pandemic period are confined
only to home CEOs. This is consistent with our intuition that social capital created through CSR
pays off when trust in firms declines unexpectedly only for firms that have home CEOs who benefit
from place identity – being identified as local. This result is striking as it offers new insights on
the findings by Lins et al. (2017). In particular, it indicates that the trust being built through CSR
is not firm-specific, as implied by the findings of Lins et al. (2017), but individual-specific.
Specifically, the valuation effects appear to be driven by the individual (home CEO) rather than
the firm conducting the CSR activities.
5. Are the results driven by agency issues?
Another explanation for our results so far is that they are driven by agency issues. Specifically,
home CEOs are better able to divert firm resources to their own pet causes in their hometowns.
The prior literature shows that home CEOs are more likely to divert wealth away from shareholders
when corporate governance is weak.30
30 For example, Yonker (2017a) shows that home CEOs favor hometown labor when corporate governance is weak.

- 29 -
5.1. Weak corporate governance
Hence, we next control for corporate governance. In particular, beyond the controls used in
the tables so far, we add three proxies to control for weak corporate governance. These proxies
are: (1) the entrenchment index (E–index) as in Bebchuk, Cohen, and Ferrell (2009); (2) low
institutional ownership as in Chung and Zhang (2011); and (3) the proportion of independent
directors in the firm’s board (Dahya, McConnell, and Travlos, 2002). The E-index is the sum of
binary variables on six provisions: (i) classified boards; (ii) limitations to shareholders’ ability to
amend the bylaws; (iii) supermajority voting for business combinations; (iv) supermajority
requirements for charter amendments; (v) poison pills; and (vi) golden parachutes. A high E–index
value represents strong managerial power and indicates weak corporate governance. We define a
high E–index indicator as a dummy variable that is equal to one if a firm has an E–index higher
than the sample median, and zero otherwise. Low institutional ownership is a dummy variable that
takes the value of one if the proportion of outstanding shares held by institutions is lower than the
sample median, and zero otherwise. The variable Independent directors represents the proportion
of independent directors in the firm’s board, with a smaller fraction of independent directors
typically being associated with weak corporate governance.
Table 13 reports the results. Models (1)-(3) include each corporate governance indicator
variable and its interaction term with home CEO in separate regression models. Even after adding
these controls for the level of corporate governance in the firm, firms with home CEOs are
associated with significantly higher CSR score in all three models. Additionally, none of the
interaction variables are significant, suggesting that regardless of the strength of governance in the
firm, CSR activities of home CEOs are similar. In other words, it is not poor corporate governance
that induces home CEOs to engage in CSR activities. Finally, these findings indicate that agency
effects are unlikely to be the underlying mechanism behind CSR activities of home CEOs.
5.2. Do (indirect or direct) private benefits drive the relation between home CEOs and CSR?
A significant strand of the CSR literature argues that managers engaging in CSR pursue
private benefits unrelated to shareholder value maximization. Specifically, home CEOs engage in
CSR not because of place identity, but because they want to pursue political office (obtaining
indirect private rents from a political position), or because they wish to reduce firm expenses by
substituting CSR for political contributions or lobbying. Alternatively, CEOs who might wish to

- 30 -
engage in CSR for personal benefits might be willing to substitute higher executive compensation
for the ability to spend more on CSR.
Panel A of Table 14 reports the results on whether CEOs obtain indirect benefits from CSR
activities for themselves or their firms by seeking to hold political office or reduce political
contributions and corporate lobbying. In model (1), political position is a dummy variable that
equals one if a CEO has been a politician before her employment as a CEO or became a politician
after stepping down from the CEO position.31 The coefficient term on the interaction between
home CEOs and political position is statistically insignificant at conventional levels, suggesting
that having held or seeking to hold a political position is unlikely to affect the positive relation
between home CEOs and CSR. Our results are unaltered in models (2) and (3) when we break
down CEOs’ political positions into two categories: i) if a CEO had been a politician before she
joined the firm; and ii) if a CEO became a politician after stepping down from the CEO position.
Again, the coefficients associated with the interaction terms are statistically insignificant at
conventional levels, suggesting that CEOs’ desire for political office is unrelated to CSR.
To examine if firms substitute CSR for direct political contributions or lobbying, we use
additional variables measuring the level of political contributions in model (4) and corporate
lobbying in model (5), and investigate the effects of CEO political connections on the relation
between home CEOs and CSR. 32 Political contributions are calculated as the natural log of
corporate contributions to US political campaigns at federal level, while corporate lobbying is
computed as the natural log of corporate lobbying expenditures. In model (4), we find that the
interaction variable carries a positive and statistically significant (at the 1% level) coefficient,
which suggests that home CEOs who contribute more to political campaigns also invest more in
CSR activities. This result is in line with home CEOs being good citizens without substituting CSR
expenses for contributions to politicians. In contrast, the coefficient for political contributions itself
is significantly negative at the 1% level, indicating that non-home CEOs consider political
contributions and CSR investment as substitutes. In model (5), the interaction variable shows that
lobbying expenditures do not affect the relation between home CEOs and CSR. Overall, we find
that home CEOs do not replace political connections with CSR activities.
31 We would like to thank Reza Houston for sharing data on CEOs with political positions. 32 We would like to thank Christos Pantzalis for sharing data on political contributions and corporate lobbying.

- 31 -
Panel B of Table 14 presents the results for direct private (CEO) benefits. In particular, it
presents the effects of CEO total and equity compensation on the relation between home CEOs
and CSR.33 If firms allow home CEOs to treat the ability to engage in CSR as a form of substitute
compensation, we would expect compensation levels received by home CEOs to be negatively
related to the level of CSR activities. Model (1) presents the results for total compensation and
model (2) for equity compensation. The interaction term between total compensation and home
CEOs is insignificant as is the interaction term between equity compensation and home CEOs,
suggesting that home CEOs who engage in more CSR do not receive lower compensation.
6. Conclusions
In this paper, we examine how CEO birthplace identity affects firm corporate social
responsibility activities. We provide robust evidence that CEOs who manage firms headquartered
close to where they were born engage in CSR activities to a significantly greater extent than non-
home CEOs. The home CEO effect is not driven by a simple place association story. Controlling
for the length of residence near firm headquarters, firms managed by home CEOs have
significantly higher levels of CSR activities than non-home CEOs. The stronger the ties between
the CEOs to their birthplaces, the higher the level of CSR activities by the firms.
In addition, CSR activities undertaken by home CEOs are significantly more likely to be
positively associated with firm value than CSR activities undertaken by non-home CEOs. They
appear to create value because following CSR activity at these firms, local employees at these
firms are more productive, the firms earn higher sales growth, and charge higher markups than
firms run by non-home CEOs. Home-CEO firms also earn higher stock returns during exogenous
negative shock periods than non-home CEO firms. Our results do not appear to be driven by
agency concerns. CSR activity is unrelated to proxies for weak corporate governance. Home CEOs
do not appear to be driven by a desire to obtain private benefits either – they are not more likely
to seek political positions nor is there a relationship between executive compensation and CSR.
Home CEOs also do not substitute corporate lobbying or contributions to PACs for CSR.
Di Giuli and Kostovetsky (2014) document that CSR has adverse financial effects for firms
and argue that this adverse effect helps explain why only firms whose stakeholders obtain direct
33 Hoi, Wu, and Zhang (2019) also focus on total and equity compensation arguing that they do so because they reflect broad consequences of managerial rent extraction in CEO compensation (e.g., Bertrand and Mullainathan, 2001; Morse, Nanda, and Seru, 2011).

- 32 -
value from CSR are more willing to implement it. They note that if CSR paid for itself or was
financially profitable, one would expect all firms, regardless of stakeholder preferences toward
social responsibility, to vigorously implement it. Our paper provides strong evidence to suggest
that CSR does not have adverse financial effects if it is undertaken by CEOs who are more likely
to be trusted by the local community. Hence, engaging in CSR is not a sufficient condition for
firms to create social trust and firm value. The place identity of the CEO who undertakes the CSR
also matters.

- 33 -
References
Adams, R., Funk, P., 2012. Beyond the glass ceiling: Does gender matter? Management Science 58, 219–235.
Adams, R., Keloharju, M., Knüpfer, S., 2018. Are CEOs born leaders? Lessons from traits of a million individuals. Journal of Financial Economics 130, 392-408.
Adhikari, B.K., 2016. Causal effect of analyst following on corporate social responsibility. Journal of Corporate Finance 41, 201-216.
Ahern, K.R., Dittmar, A.K., 2012. The changing of the boards: The impact on firm valuation of mandated female board representation. Quarterly Journal of Economics 127, 137-197.
Albuquerque, R., Koskinen, Y., Zhang, C., 2019. Corporate social responsibility and firm risk: Theory and empirical evidence. Management Science 65, 4451-4469.
Augustin, P., Sokolovski, V., Subrahmanyam, M.G., Tomio, D., 2021. In sickness and in debt: The COVID-19 impact on sovereign credit risk. Working Paper, McGill University, HEC Montreal, New York University (NYU), and Darden School of Business
Bae, J., Sun, Z., Zheng, L., 2015 Religious belief and socially responsible investing. Working Paper, Elon University and University of California, Irvine.
Bebchuk, L., Cohen, A., Ferrell, A., 2009. What matters in corporate governance? Review of Fi-nancial Studies 22, 783-827.
Bernile, G., Bhagwat, V., Rau, P.R., 2017. What doesn't kill you will only make you more risk-loving: Early‐life disasters and CEO behavior. Journal of Finance 72, 167-206.
Bertrand, M., Mullainathan, S., 2001. Are CEOs rewarded for luck? The ones without principals are. Quarterly Journal of Economics 116, 901-932.
Bertrand, M., Schoar, A., 2003. Managing with style: The effect of managers on firm poli-cies. Quarterly Journal of Economics 118, 1169-1208.
Borghesi, R., Houston, J. F., Naranjo, A., 2014. Corporate socially responsible investments: CEO altruism, reputation, and shareholder interests. Journal of Corporate Finance 26, 164-181.
Boubakri, N., Ghoul, S.E., Wang, H., Guedhami, O., Kwok, C.C.Y., 2016. Cross-listing and corporate social responsibility. Journal of Corporate Finance 41, 123-138.
Cao, J., Liang, H., Zhan, X., 2019. Peer effects of corporate social responsibility. Management Science 65, 5487-5503.
Chen, T., Dong, H., Lin, C., 2020. Institutional shareholders and corporate social responsibil-ity. Journal of Financial Economics 135, 483-504.
Cheung, A., 2016. Corporate social responsibility and corporate cash holdings. Journal of Corpo-rate Finance 37, 412-430.
Chung, K.H., Zhang, H., 2011. Corporate governance and institutional ownership. Journal of Financial and Quantitative Analysis 46, 247-273.
Cronqvist, H., Yu, F., 2017. Shaped by their daughters: Executives, female socialization, and cor-porate social responsibility. Journal of Financial Economics 126, 543-562.
Custodio, C., Metzger, D., 2014. Financial expert CEOs: CEO’s work experience and firm’s fi-nancial policies. Journal of Financial Economics 114, 125-154.

- 34 -
Dahya, J., McConnell, J.J., Travlos, N.G., 2002. The Cadbury committee, corporate performance, and top management turnover. Journal of Finance 57, 461-483.
Dai, Y., Rau, P.R., Tan, W., 2020. Do firms react to uncertainty by doing good deeds? Uncertainty and CSR investment. Working Paper, Huazhong University of Science and Technology, University of Cambridge, and Hong Kong Baptist University.
Deng, X., Kang, J.K., Low, B.S., 2013. Corporate social responsibility and stakeholder value max-imization: Evidence from mergers. Journal of Financial Economics 110, 87-109.
Dhaliwal, D.S., Li, O.Z., Tsang, A., Yang, Y.G., 2011. Voluntary nonfinancial disclosure and the cost of equity capital: The initiation of corporate social responsibility reporting. Accounting Re-view 86, 59-100.
Di Giuli, A., Kostovetsky, L., 2014. Are red or blue companies more likely to go green? Politics and corporate social responsibility. Journal of Financial Economics 111, 158-180.
Ding, W., Levine, R., Lin, C., Xie, W., 2021. Corporate immunity to the COVID-19 pandemic. Journal of Financial Economics, forthcoming.
Drucker, S., Puri, M., 2005. On the benefits of concurrent lending and underwriting. Journal of Finance 60, 2763-2799.
Dutordoir, M., Strong, N.C., Sun, P., 2018. Corporate social responsibility and seasoned equity offerings. Journal of Corporate Finance 50, 158-179.
Fahlenbrach, R., Low, A., Stulz, R., 2010. Why do firms appoint CEOs as outside directors? Journal of Financial Economics 97, 12-32.
Fama, E.F., French, K.R., 1997. Industry costs of equity. Journal of Financial Economics 43, 153-193.
Fee, C.E., Hadlock, C.J., Pierce, J.R., 2013. Managers with and without style: Evidence using exogenous variation. Review of Financial Studies 26, 567-601.
Ferrell, A., Liang, H., Renneboog, L., 2016. Socially responsible firms. Journal of Financial Eco-nomics 122, 585-606.
Ferris, J.S., 1981. A transactions theory of trade credit use. Quarterly Journal of Economics 96, 243–270.
Fischer, C.S., Jackson, R., Stueve, C.A., Gerson, K., Jones, L.M., 1977. Networks and places. Free Press, Glencoe, Illinois.
Flammer, C., 2015. Does corporate social responsibility lead to superior financial performance? A regression discontinuity approach. Management Science 61, 2549-2568.
Friedman, M., 1970. The social responsibility of business is to increase its profits. New York times magazine, September, 13.
García, D., Norli, Ø., 2012. Geographic dispersion and stock returns. Journal of Financial Economics 106, 547-565.
Gibson, R., Krueger, P., Schmidt, P. S., 2021. ESG rating disagreement and stock returns. Working Paper, University of Geneva and University of Zurich.
Gieryn, T.F., 2000. A space for place in sociology. Annual Review of Sociology 26, 463-496.
Goss, A., Roberts, G.S., 2011. The impact of corporate social responsibility on the cost of bank loans. Journal of Banking and Finance 35, 1794-1810.
- 35 -
Green, T.C., Huang, R., Wen, Q., Zhou, D., 2019. Crowdsourced employer reviews and stock returns. Journal of Financial Economics 134, 236-251.
Hadlock, C.J., Pierce, J.R., 2010. New evidence on measuring financial constraints: Moving beyond the KZ index. Review of Financial Studies 23, 1909-1940.
Hegde, S.P., Mishra, D.R., 2019. Married CEOs and corporate social responsibility. Journal of Corporate Finance 58, 226-246.
Hernández, B., Hidalgo, M.C., Salazar-Laplace, M.E., Hess, S., 2007. Place attachment and place identity in natives and non-natives. Journal of Environmental Psychology 27, 310-319.
Hilary, G., Hui, K.W., 2009. Does religion matter in corporate decision making in America? Jour-nal of Financial Economics 93, 455-473.
Hoi, C.K.S., Wu, Q., Zhang, H., 2019. Does social capital mitigate agency problems? Evidence from Chief Executive Officer (CEO) compensation. Journal of Financial Economics 133, 498-519.
Hong, H.G., Kostovetsky, L., 2012. Red and blue investing: Values and finance. Journal of Fi-nancial Economics 103, 1-19.
Hong, H.G., Kubik, J.D., Scheinkman, J., 2011. Financial Constraints on Corporate Goodness. Working Paper, NBER working paper no. 18476.
Hutton, I., Jiang, D., Kumar, A., 2014. Corporate policies of Republican managers. Journal of Financial and Quantitative Analysis 49, 1279-1310.
Ioannou, I., Serafeim, G., 2012. What drives corporate social performance? The role of nation-level institutions. Journal of International Business Studies 43, 834-864.
Islam, E., Zein, J., 2020. Inventor CEOs. Journal of Financial Economics 135, 505-527.
Jiang, F., Qian, Y., Yonker, S.E., 2019. Hometown biased acquisitions. Journal of Financial and Quantitative Analysis 54, 2017-2051.
Kaplan, S.N., Zingales, L., 1997. Do investment-cash flow sensitivities provide useful measures of financing constraints? Quarterly Journal of Economics 112, 169-215.
Kaplan, S.N., Klebanov, M.M., Sørensen, M., 2012. Which CEO characteristics and abilities mat-ter? Journal of Finance 67, 973-1007.
Krüger, P., 2015. Corporate goodness and shareholder wealth. Journal of Financial Econom-ics 115, 304-329.
Lai, S., Li, Z., Yang, Y.G., 2020. East, west, home’s best: Do local CEOs behave less myopically? The Accounting Review 95, 227-255.
Leuven, E., Sianesi, B., 2003. PSMATCH2: Stata module to perform full Mahalanobis and propensity score matching, common support graphing, and covariate imbalance testing. Working Paper, University of Oslo.
Li, K., Mai, F., Shen, R., Yan, X., 2020. Measuring corporate culture using machine learning. Review of Financial Studies, forthcoming.
Lim, I., Nguyen, D.D., 2020. Hometown lending. Journal of Financial and Quantitative Analysis, forthcoming.
Lins, K.V., Servaes, H., Tamayo, A., 2017. Social capital, trust, and firm performance: The value of corporate social responsibility during the financial crisis. Journal of Finance 72, 1785-1824.
- 36 -
Malmendier, U., Tate, G., 2005. CEO overconfidence and corporate investment. Journal of Fi-nance 60, 2661-2700.
Manzo, L.C., 2003. Beyond house and haven: Toward a revisioning of emotional relationships with places. Journal of Environmental Psychology 23, 47-61.
Masulis, R.W., Reza, S.W., 2015. Agency problems of corporate philanthropy. Review of Finan-cial Studies 28, 592-636.
Morse, A., Nanda, V., Seru, A., 2011. Are incentive contracts rigged by powerful CEOs? Journal of Finance 66, 1779-1821.
MSCI, 2015. MSCI ESG KLD Stats 1991-2015 Data Set Methodology, 44-75,
Pool, V.K., Stoffman, N., Yonker, S.E., 2012. No place like home: Familiarity in mutual fund manager portfolio choice. Review of Financial Studies 25, 2563-2599.
Proshansky, H.M., 1978. The city and self-identity. Environment and Behavior 10, 147-169.
Putnam, R.D., 1993. Making democracy work: Civic traditions in modern Italy. Princeton University Press, Princeton, New Jersey.
Ren, S., Cheng, Y., Hu, Y., Yin, C., 2021. Feeling right at home: Hometown CEOs and firm innovation. Journal of Corporate Finance 66, 101815.
Servaes, H., Tamayo, A., 2013. The impact of corporate social responsibility on firm value: The role of customer awareness. Management Science 59, 1045-1061.
Sunder, J., Sunder, S.V., Zhang, J., 2017. Pilot CEOs and corporate innovation. Journal of Finan-cial Economics 123, 209-224.
Vincenty, T., 1975. Direct and inverse solutions of geodesics on the ellipsoid with application of nested equations. Survey Review 23, 88-93.
Wu, L.Z., Kwan, H.K., Yim, F.H.K., Chiu, R.K., He, X., 2015. CEO ethical leadership and corpo-rate social responsibility: A moderated mediation model. Journal of Business Ethics 130, 819-831.
Yim, S., 2013. The acquisitiveness of youth: CEO age and acquisition behavior. Journal of Finan-cial Economics 108, 250-273.
Yonker, S.E., 2017a. Do managers give hometown labor an edge? Review of Financial Studies 30, 3581-3604.
Yonker, S.E., 2017b. Geography and the market for CEOs. Management Science 63, 609-630.

Appendix. Variable definitions Variable Definition Source
Firm Variables
Ln (Total Assets) The natural log of total assets. Compustat
ROA Return on assets, computed as Net income before extraordinary items and discontinued operations divided by total assets.
Compustat
Leverage Total long-term debt divided by total assets. Compustat
Market-to-Book Market value of equity divided by book value of equity. Compustat
SG&A Expenses Selling, general, and administrative expenses, in million dollars. Compustat
Advertising spending Annual spending on advertising, in million dollars. Compustat
SG&A Expenses/Total Revenue Selling, general, and administrative expenses (in million dollars) divided by total revenue.
Compustat
Tobin’s Q The ratio of the total assets minus book value of equity plus mar-ket value of equity minus deferred taxes, divided by total assets.
Compustat
Payables/Sales Accounts payable divided by sales, using annual data. Compustat
Payables/COGS Accounts payable divided by cost of goods sold, using annual data.
Compustat
Gross Margin Sales minus cost of goods sold, divided by total assets. Compustat
Sales Growth The percentage change in sales from the previous year. Compustat
Sales per Employee The annual sales divided by the number of employees. Compustat
Employee Growth The percentage change in the number of employees from the pre-vious year.
Compustat
Ln (Market Cap) The natural logarithm of the number of ordinary shares outstand-ing multiplied by price closed, using quarterly data.
Compustat
Short-Term Debt Short-term debt divided by total assets, using quarterly data. Compustat
Long-Term Debt Long-term debt divided by total assets, using quarterly data. Compustat
Cash Holding Cash and marketable securities divided by assets. Compustat
Book-to-Market Book value of equity divided by market value of equity. Compustat
Negative B/M A dummy variable that is equal to one if the book-to-market ratio is negative, and zero otherwise.
Compustat
SA Index The size-age index of Hadlock and Pierce (2010) computed us-ing the following equation: –0.737 Size + 0.043 Size2 – 0.040 Age, where Size is the log of inflation adjusted total assets de-flated using the 1983 consumer price index, and Age is the num-ber of years the firm has been on Compustat with a non-missing stock price. A firm is classified as financially constrained in year t when the SA index is above the sample median in that year, and financially unconstrained otherwise.
Compustat
Raw Return The monthly holding period return of a stock. CRSP
Abnormal Return Abnormal returns are computed based on the market model us-ing the CRSP value-weighted index as the market proxy. Market model parameters are estimated using monthly data over the 60-month period ending in July 2008 for the financial crisis test, and in December 2019 for the COVID-19 pandemic test, respec-tively.
CRSP
Momentum The raw return of a stock over the previous 12 months. CRSP

Idiosyncratic Risk The residual variance of a stock from the market model esti-mated over the previous five-year period, using monthly data.
CRSP
Glassdoor Rating The average rating of a firm by its employees on a five-point Likert scale in a given year.
www.glassdoor.com
Work-Life Balance The average rating for “work-life balance” dimension by a firm’s employees on a five-point Likert scale in a given year.
www.glassdoor.com
Culture and Values The average rating for “culture and values” dimension by a firm’s employees on a five-point Likert scale in a given year.
www.glassdoor.com
Career Opportunity The average rating for “career opportunity” dimension by a firm’s employees on a five-point Likert scale in a given year.
www.glassdoor.com
Compensation and Benefits The average rating for “compensation and benefits” dimension by a firm’s employees on a five-point Likert scale in a given year.
www.glassdoor.com
Recommendation Ratio The percentage of a firms’ employees that would like to recom-mend their employer to others.
www.glassdoor.com
CEO Approval Ratio The CEO approval rating of a firm, in percentages. www.glassdoor.com
Headquarters Relocation A dummy variable that is equal to one if the firm has relocated its headquarters, and zero otherwise.
EDGAR
Closer-to-Home Headquarters Re-location
A dummy variable that equals one if the firm has relocated its headquarters, and the new headquarters are geographically closer to the CEO’s birthplace at the county-level relative to the previous headquarters, and zero otherwise.
EDGAR
Cultural Change (Integrity, Team-work, Innovation, Respect, Quality)
A dummy variable that equals one if the firm-year score (integ-rity, teamwork, innovation, respect, or quality) is lower or higher than 100% relative to the corresponding score of the previous year, and zero otherwise. Each firm-year’s score is the weighted-frequency count of the culture-related words and phrases in the QA section of firm’s earnings calls transcripts averaged based on three-year moving averages of annual scores.
Thomson Reuters’ Street Events
Li et al. (2020)
High Customer Satisfaction A dummy variable that is equal to one if the firm’s customer satisfaction score is higher than its industrial benchmark in the American Customer Satisfaction Index (ACSI) in a given year, and zero otherwise.
ACSI
Local Customers A dummy variable that is equal to one if customers are within 100 miles from the firm’s headquarters, and zero otherwise. Us-ing manual search procedures, US listed customers are identified and matched to their Compustat identifiers (i.e., GVKEY).
Compustat Seg-ments Customer
Database
Local Suppliers A dummy variable that is equal to one if suppliers are within 100 miles from the firm’s headquarters, and zero otherwise. Using manual search procedures, US listed customers are identified and matched to their Compustat identifiers (i.e., GVKEY).
Compustat Seg-ments Customer
Database
Local Employees A dummy variable that is equal to one if a firm has a higher-than-median number of local employees. The number of local employees of a firm is proxied by its annual market share multi-plied by the number of employees in the same industry in its headquarter county. The county-specific industrial employment data is from the County Business Patterns (CBP) database. The market share is based on market capitalization and 2-digit SIC codes.
United States Cen-sus Bureau CBP
Database

CEO Variables
Home CEO A dummy variable that is equal to one if the distance between the CEO's birth county and the headquarters county is less than 100 miles, and zero otherwise.
Bernile et al. (2017) extended with man-ual collection from
Marquis Who’s Who, Standard and Poor’s Register of
Directors and Exec-utives, Lexis-Nexis,
NNDB.com, or Google
Female CEO A dummy variable that is equal to one if a CEO is female, and zero otherwise.
ExecuComp
CEO Age The age of the CEO, in years. ExecuComp
CEO Age2 The squared term of the “CEO Age” variable. ExecuComp
CEO Tenure The tenure of the CEO, in years. ExecuComp
CEO Tenure2 The squared term of the “CEO Tenure” variable. ExecuComp
CEO Ownership The percentage of shares owned by the CEO (set to zero if data is not available).
ExecuComp
Attended Home College or Univer-sity
A dummy variable that is equal to one if a CEO was educated in a home state college or university, and zero otherwise.
BoardEx, Marquis Who’s Who Data-base, the Notable Names Database,
and Google
Long Home Tenure A dummy variable that is equal to one if the number of years that the CEO lived in her home state is greater than the sample me-dian, and zero otherwise. A particular CEO’s home tenure is equal to her age if the CEO’s home state matches the state in which the firm is headquartered. If the two states do not match, then, if the CEO attended college in the same state as her home state, the age at which the CEO graduated from her degree pro-gram is considered the CEO’s home tenure. If the CEO did not attend college in her home state and does not work for a firm headquartered in her state, then the CEO is assumed to have left the state 4 years prior to obtaining a degree at an institution out-side her home state (Pool et al., 2012).
BoardEx and manu-ally collected data from the Marquis
Who’s Who Data-base, the Notable Names Database,
and Google
Hometown Board Position A dummy that is equal to one if the CEO is the board member of another firm in her hometown state in a given year, and zero oth-erwise (Jiang et al. 2019).
BoardEx
Hometown Board Position Prior to Becoming CEO
A dummy that is equal to one if the CEO was a board member of another firm in her hometown state before she became CEO, and zero otherwise.
BoardEx
Length of Residence near Head-quarters
The number of years that a CEO was resident in a county that is no more than 100 miles away from the headquarters location during her CEO tenure
LexisNexis
CEO with MBA or Masters’ De-gree
A dummy variable that is equal to one if a CEO has an MBA or Masters’ Degree, and zero otherwise.
BoardEx and manu-ally collected data from the Marquis
Who’s Who Data-base, the Notable Names Database,
and Google

Republican CEO A dummy variable that takes the value of one if a CEO's political contributions in a given election cycle all go to Republican-af-filiated candidates or party committees, and zero otherwise.
Hutton et al. (2014)
Total Compensation The total compensation of the CEO in a year which includes sal-ary, bonus, restricted stock grants, long-term incentive plan, and other annual payments.
ExecuComp
Equity Compensation The equity compensation of the CEO in a year, calculated as to-tal compensation minus cash compensation (salary and bonus).
ExecuComp
State-Level and County-Level Variables
State GDP per Capita State-level GDP divided by the state population. US BEA
State Unemployment Rate State-level unemployment rate, in percentage. US BLS
County-Level Religiosity Calculated as the number of religious adherents in the county to the total population in the county. Data on religiosity is available for six years (1952, 1971, 1980, 1990, 2000, and 2010). We fol-low previous studies (e.g., Hilary and Hui, 2009) and linearly interpolate the data to obtain the values in the missing years.
US Association of Religion Data Ar-
chives
Local Business Concentration A dummy variable that takes the value of one if, in the firm’s 10-K report of the year, the number of times that its headquarters state is cited is more than 50 percent of its citations of all US states.
Diego Garcia’s website
(http://leeds-fac-ulty.colo-
rado.edu/gar-cia/page3.html)
Corporate Governance Variables
E-Index
The index is the sum of binary variables concerning the follow-ing provisions: 1) classified boards; 2) limitations to sharehold-ers' ability to amend the bylaws; 3) supermajority voting for business combinations; 4) supermajority requirements for char-ter amendments; 5) poison pills; and 6) golden parachutes. In the regressions, we use the “high E-index”, which is a dummy vari-able that is equal to one if a firm has an E-Index higher than the sample median, and zero otherwise.
ISS Database
Institutional Ownership The proportion of outstanding shares held by institutions. In the regressions we use the “low institutional ownership” which is a dummy variable that takes the value of one if the proportion of outstanding shares held by institutions is lower than the sample median.
ISS Database
Independent Directors The proportion of independent directors on the firm’s board. ISS Database
Political Variables
Political Position
A dummy variable that is equal to one if a CEO had been a pol-itician (i.e., held the position of secretary, senator, congressman, officer in the government) before her CEO employment or be-came a politician after her CEO employment.
EDGAR, Marquis Who’s Who Data-base, the Notable Names Database,
and Google
Political Position (Pre-CEO) A dummy variable that is equal to one if a CEO had been a pol-itician before her CEO employment.
EDGAR, Marquis Who’s Who Data-base, the Notable Names Database,
and Google
Political Experience (Post-CEO) A dummy variable that is equal to one if a CEO became a poli-tician after her CEO employment.
EDGAR, Marquis Who’s Who Data-base, the Notable Names Database,
and Google

Political Contributions The natural log of corporate contributions to US political cam-paigns at federal level.
Federal Election Commission
Corporate Lobbying The natural log of corporate lobbying expenditures. The Center for Re-sponsive Politics
CSR Measures
CSR Score The sum of adjusted CSR scores calculated from the five CSR categories below. All adjusted scores are calculated following Lins et al. (2017) by dividing the strength (concern) subcategory scores for the respective categories below by the respective num-ber of strength (concern) subcategories to get adjusted strength (concern) score for this category and then taking the difference between adjusted strength scores and adjusted concern scores.
KLD
Community Score The adjusted CSR score calculated for the community category. KLD
Environment Score The adjusted CSR score calculated for the environment category. KLD
Diversity Score The adjusted CSR score calculated for the diversity category. KLD
Employee Relations Score The adjusted CSR score calculated for the employee relations category.
KLD
Human Rights Score The adjusted CSR score calculated for the human rights cate-gory.
KLD
Raw CSR Score The sum of CSR scores calculated from the five CSR categories above, calculated as the number of CSR strengths across the five categories minus the number of CSR concerns across the five categories.
KLD
Definitions of Time Period
Financial Crisis Period A dummy variable that is equal to one in the period August 2008 to March 2009, and zero otherwise.
Lins et al. (2017)
Post-Crisis Period A dummy variable that is equal to one in the period April 2009 to December 2013, and zero otherwise.
Lins et al. (2017)
COVID-19 Period A dummy variable that is equal to one in the period January 2020 to May 2020, and zero otherwise.
Ding et al. (2021) and Augustin et al.
(2021)
Post-COVID-19 Period A dummy variable that is equal to one in the period June 2020 to December 2020, and zero otherwise.
Ding et al. (2021) and Augustin et al.
(2021)

Table 1
Sample descriptive statistics.
This table reports summary statistics for a sample of US firms with data in the ExecuComp, Compustat, and MSCI KLD databases, and with birthplace data for the period between 1992 and 2016. Panels A and B report the mean, median, and number of observations for firm and CEO characteristics, respectively, for the overall sample as well as for home CEOs and non-home CEOs. Home CEO is a dummy variable that is equal to one if the distance between the CEO’s birth county and the firm headquarters county is less than 100 miles, and zero otherwise. All other variables are defined in the Appendix. The final columns report p-values from difference in means and Mann-Whitney rank-sum tests for each characteristic for home CEOs versus non-home CEOs.
Panel A: Firm Characteristics
All Sample (1) N= 5,771
Home CEOs (2) N= 1,564
Non-Home CEOs (3) N= 4,207
Difference (2)-(3)
Variables Mean Median Mean Median Mean Median p-value Dif-ference in
means
p-value Mann-Whitney rank-
sum test Ln (Total Assets) 8.379 8.334 8.398 8.288 8.371 8.348 0.564 0.264 ROA 0.050 0.055 0.052 0.054 0.050 0.056 0.485 0.290 Leverage 0.244 0.235 0.245 0.240 0.243 0.233 0.714 0.283 Market-to-Book 3.634 2.632 3.277 2.354 3.767 2.742 0.000*** 0.000*** CSR Score 3.033 2.983 3.054 2.983 3.025 2.983 0.083* 0.041**
Panel B: CEO Characteristics
Home CEO 0.271 0 - - - - - - Female CEO 0.028 0 0.024 0 0.030 0 0.185 0.184 CEO Age 56.174 56 56.066 56 56.215 56 0.496 0.028** CEO Tenure 9.329 7 11.385 9 8.564 7 0.000*** 0.000*** CEO Ownership 2.021% 0.053% 2.960% 0.225% 1.672% 0.020% 0.000*** 0.000***

Table 2
The effect of home CEOs on CSR.
This table reports coefficients from OLS regressions for the effect of home CEOs on CSR activities for a sample of US firms with available data in MSCI KLD database for the period between 1992 and 2016. The dependent variable is the CSR score, which is the sum of adjusted CSR scores calculated from five CSR categories (community, environment, diversity, employee relations, and human rights). Home CEO is a dummy variable that is equal to one if the distance between the CEO’s birth county and the firm headquarters county is less than 100 miles, and zero otherwise. All other variables are defined in the Appendix. Column (1) includes only firm-level controls. Column (2) includes only CEO-level controls. Column (3) includes both firm-level and CEO-level controls. All models include year, industry, and county fixed effects, whose coefficients are suppressed, and are based on calendar year, 2-digit SIC industry classification, and county dummies, respectively. T-statistics, which are based on heteroscedasticity–robust standard errors clustered at the county-year level, are reported in parentheses. ***, **, and * indicate significance at the 1%, 5%, and 10% levels, respectively.
CSR Score (1) (2) (3)
Home CEO 0.121*** 0.137*** 0.128***
(5.442) (5.863) (5.661)
Ln (Total Assets) 0.100*** 0.094***
(10.992) (10.380)
ROA 0.219*** 0.235***
(2.395) (2.580)
Leverage -0.040 -0.050
(-0.779) (-0.983)
Market-to-Book 0.004** 0.003**
(2.142) (2.014)
Female CEO 0.076 0.078
(1.294) (1.413)
CEO Age 0.001 0.002
(0.195) (0.591)
CEO Age2 -0.000* -0.000*
(-1.917) (-1.910)
CEO Tenure -0.002 -0.005
(-0.287) (-0.650)
CEO Tenure2 0.000 0.000
(0.071) (0.398)
CEO Ownership -0.004*** -0.002
(-3.659) (-1.300)
Constant 1.380*** 2.653*** 1.776***
(5.883) (8.490) (5.817) Year Fixed Effects Yes Yes Yes Industry Fixed Effects Yes Yes Yes County Fixed Effects Yes Yes Yes Observations 5,771 5,771 5,771 Adjusted R2 0.393 0.369 0.395

Table 3
Economic magnitude of CSR.
This table reports coefficients for OLS regressions of CSR Score on selling, general, and administrative expenses (SG&A). The dependent variable in specification (1) is the log (SG&A Expenses) (expressed in millions of dollars). The dependent variable in specification (2) is the log of SG&A minus advertising expenses (expressed in millions of dollars). The dependent variable in specification (3) is SG&A expenses (expressed in millions of dollars) divided by total revenue. All variables are defined in the Appendix. All models include year, industry, and county fixed effects, whose coefficients are suppressed, and are based on calendar year, 2-digit SIC industry classification, and county dummies, respectively. T-statistics, which are based on heteroscedasticity–robust standard errors clustered at the county-year level, are reported in parentheses. ***, **, and * indicate significance at the 1%, 5%, and 10% levels, respectively.
Log (SG&A Ex-penses)
Log (SG&A Ex-penses- Advertising)
SG&A Expenses / To-tal Revenue
(1) (2) (3)
CSR Score 0.149*** 0.140*** 0.027***
(8.759) (8.307) (8.115)
Ln (Total Assets) 0.836*** 0.826*** -0.021*** (88.935) (84.976) (-11.077)
ROA -0.156* -0.155* -0.239*** (-1.721) (-1.668) (-7.651)
Leverage -0.403*** -0.371*** -0.041*** (-5.548) (-4.971) (-3.085)
Market-to-Book 0.014*** 0.013*** 0.001***
(7.508) (6.950) (3.201)
Female CEO -0.119** -0.107* -0.008 (-1.990) (-1.754) (-0.687)
CEO Age 0.021** 0.017* -0.002
(2.160) (1.726) (-0.829)
CEO Age2 -0.000* 0.000 0.000
(-1.692) (-1.359) (0.517)
CEO Tenure -0.008*** -0.005* 0.001
(-2.860) (-1.669) (1.068)
CEO Tenure2 0.000 0.000 -0.000*
(-0.754) (-1.437) (-1.726)
CEO Ownership 0.010*** 0.008*** 0.000
(5.318) (4.252) (-0.198)
Constant 0.530 0.787*** 0.788***
(1.572) (2.338) (12.296) Year Fixed Effects Yes Yes Yes Industry Fixed Effects Yes Yes Yes County Fixed Effects Yes Yes Yes Observations 5,292 5,292 5,292 Adjusted R2 0.901 0.897 0.714

Table 4
Evidence from decomposition of CSR scores.
This table reports coefficients for OLS regressions for the effect of home CEOs on CSR activities by decomposing CSR scores into its five categories. The dependent variables are CSR scores from five different categories (community, environment, diversity, employee relations, and human rights). Home CEO is a dummy variable that is equal to one if the distance between the CEO’s birth county and the firm headquarters county is less than 100 miles, and zero otherwise. All other variables are defined in the Appendix. All models include the firm and CEO control variables used in Table 2; they also include year, industry, and county fixed effects, whose coefficients are suppressed, and are based on calendar year, 2-digit SIC industry classification, and county dummies, respectively. T-statistics, which are based on heteroscedasticity– robust standard errors clustered at the county-year level, are reported in parentheses. ***, **, and * indicate significance at the 1%, 5%, and 10% levels, respectively.
CSR Score by Category
Community Environment Diversity Employee Rela-tions
Human Rights
(1) (2) (3) (4) (5)
Home CEO 0.022*** 0.032*** 0.047*** 0.021*** 0.006
(2.357) (5.014) (4.356) (2.351) (0.994)
Constant 0.244 0.544*** 0.641*** 0.963*** 1.090***
(1.417) (7.944) (4.854) (9.827) (12.437)
Firm and CEO Control Variables Yes Yes Yes Yes Yes
Year Fixed Effects Yes Yes Yes Yes Yes
Industry Fixed Effects Yes Yes Yes Yes Yes
County Fixed Effects Yes Yes Yes Yes Yes
Observations 5,771 5,771 5,771 5,771 5,771
Adjusted R2 0.218 0.398 0.408 0.314 0.131

Table 5
Place identity or place attachment?
This table reports coefficients from OLS regressions on the relation between CSR and the length of CEO residence near firm’s headquarters. In Panel A, the dependent variable is the CSR score, which is the sum of adjusted CSR scores calculated from five CSR categories (community, environment, diversity, employee relations, and human rights). Specification (1) reports the estimates only for home CEOs with residence data available. Specification (2) reports the estimates only for non-home CEOs with residence data available. All variables are defined in the Appendix. All models include the firm and CEO control variables in Table 2 and year, industry, and county fixed effects, whose coefficients are suppressed, and are based on calendar year, 2-digit SIC industry classification, and county dummies, respectively. T-statistics, which are based on heteroscedasticity– robust standard errors clustered at the county-year level, are reported in parentheses. Panel B compares the mean values of CSR between home CEOs and non-home CEOs, based on their length of residence near headquarters (i.e., higher than median and lower than median residence near headquarters, respectively). ***, **, and * indicate significance at the 1%, 5%, and 10% levels, respectively.
Panel A: CSR Score
Home CEOs
Non-Home
CEOs (1) (2)
Length of Residence near Headquarters 0.029*** 0.001 (3.530) (0.148)
Constant 6.307*** 2.532*** (8.412) (6.733)
Firm & CEO Control Variables Yes Yes
Year Fixed Effects Yes Yes
Industry Fixed Effects Yes Yes
County Fixed Effects Yes Yes
Observations 696 1,646
Adjusted R2 0.636 0.538
Panel B: Comparison of CSR levels between Home CEOs and Non-Home CEOs
N
Mean Value of
CSR (Home CEOs)
N
Mean Value of CSR
(Non-Home CEOs)
Difference T-Stats
Length of Residence near HQ (> median) 321 3.133 784 3.017 0.116*** 3.279
Length of Residence near HQ (< median) 375 3.061 862 2.933 0.128*** 4.249

Table 6
The role of CEO home connections.
This table presents the results of OLS regressions for the effect of home CEOs on CSR activities for CEOs who have higher home connections. The dependent variable is the CSR score, which is the sum of adjusted CSR scores calculated from five CSR categories (community, environment, diversity, employee relations and human rights). Home CEO is a dummy variable that is equal to one if the distance between the CEO's birth county and the headquarters county is less than 100 miles, and zero otherwise. The three variables used to proxy for home connection are: i) attended home college or university; ii) long home tenure; and iii) hometown board position. All variables are defined in the Appendix. All models include the firm and CEO control variables used in Table 2; they also include year, industry, and county fixed effects, whose coefficients are suppressed, and are based on calendar year, 2-digit SIC industry classification, and county dummies, respectively. T-statistics, which are based on heteroscedasticity– robust standard errors clustered at the county-year level, are reported in parentheses. ***, **, and * indicate significance at the 1%, 5%, and 10% levels, respectively.
CSR Score
(1) (2) (3)
Home CEO 0.088*** 0.108*** 0.116***
(2.807) (4.043) (3.660)
Attended Home State College or University -0.019
(-0.960)
Long Home Tenure -0.027
(-1.284)
Hometown Board Position 0.025
(0.638)
Home CEO × Attended Home State College or University
0.080**
(1.957)
Home CEO × Long Home Tenure 0.079*
(1.943)
Home CEO × Hometown Board Position 0.112*
(1.739)
Constant 1.262*** 1.355*** 2.003***
(4.101) (4.444) (4.741)
Firm and CEO Control Variables Yes Yes Yes
Year Fixed Effects Yes Yes Yes
Industry Fixed Effects Yes Yes Yes
County Fixed Effects Yes Yes Yes
Observations 5,298 5,298 3,895
Adjusted R2 0.408 0.407 0.445
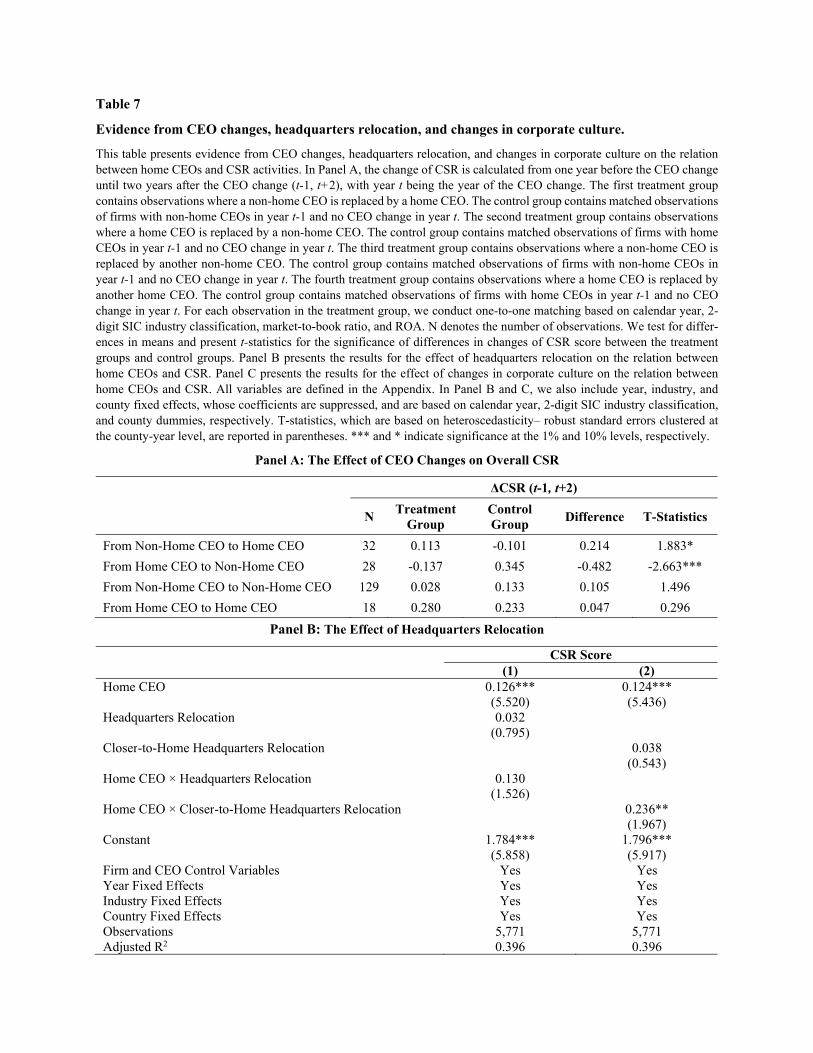
Table 7
Evidence from CEO changes, headquarters relocation, and changes in corporate culture.
This table presents evidence from CEO changes, headquarters relocation, and changes in corporate culture on the relation between home CEOs and CSR activities. In Panel A, the change of CSR is calculated from one year before the CEO change until two years after the CEO change (t-1, t+2), with year t being the year of the CEO change. The first treatment group contains observations where a non-home CEO is replaced by a home CEO. The control group contains matched observations of firms with non-home CEOs in year t-1 and no CEO change in year t. The second treatment group contains observations where a home CEO is replaced by a non-home CEO. The control group contains matched observations of firms with home CEOs in year t-1 and no CEO change in year t. The third treatment group contains observations where a non-home CEO is replaced by another non-home CEO. The control group contains matched observations of firms with non-home CEOs in year t-1 and no CEO change in year t. The fourth treatment group contains observations where a home CEO is replaced by another home CEO. The control group contains matched observations of firms with home CEOs in year t-1 and no CEO change in year t. For each observation in the treatment group, we conduct one-to-one matching based on calendar year, 2-digit SIC industry classification, market-to-book ratio, and ROA. N denotes the number of observations. We test for differ-ences in means and present t-statistics for the significance of differences in changes of CSR score between the treatment groups and control groups. Panel B presents the results for the effect of headquarters relocation on the relation between home CEOs and CSR. Panel C presents the results for the effect of changes in corporate culture on the relation between home CEOs and CSR. All variables are defined in the Appendix. In Panel B and C, we also include year, industry, and county fixed effects, whose coefficients are suppressed, and are based on calendar year, 2-digit SIC industry classification, and county dummies, respectively. T-statistics, which are based on heteroscedasticity– robust standard errors clustered at the county-year level, are reported in parentheses. *** and * indicate significance at the 1% and 10% levels, respectively.
Panel A: The Effect of CEO Changes on Overall CSR
ΔCSR (t-1, t+2)
N
Treatment Group
Control Group
Difference T-Statistics
From Non-Home CEO to Home CEO 32 0.113 -0.101 0.214 1.883*
From Home CEO to Non-Home CEO 28 -0.137 0.345 -0.482 -2.663***
From Non-Home CEO to Non-Home CEO 129 0.028 0.133 0.105 1.496
From Home CEO to Home CEO 18 0.280 0.233 0.047 0.296
Panel B: The Effect of Headquarters Relocation
CSR Score (1) (2)
Home CEO 0.126*** 0.124*** (5.520) (5.436) Headquarters Relocation 0.032 (0.795) Closer-to-Home Headquarters Relocation 0.038 (0.543) Home CEO × Headquarters Relocation 0.130 (1.526) Home CEO × Closer-to-Home Headquarters Relocation 0.236** (1.967) Constant 1.784*** 1.796*** (5.858) (5.917) Firm and CEO Control Variables Yes Yes Year Fixed Effects Yes Yes Industry Fixed Effects Yes Yes Country Fixed Effects Yes Yes Observations 5,771 5,771 Adjusted R2 0.396 0.396

Panel C: The Effect of Changes in Corporate Culture
CSR Score
(1) (2) (3) (4) (5)
Home CEO 0.102*** 0.102*** 0.106*** 0.099*** 0.106***
(2.405) (2.441) (2.588) (2.439) (2.590) Cultural Change (Integrity) 0.018
(0.581)
Home CEO × Cultural Change (Integrity) 0.079
(1.354)
Cultural Change (Teamwork) 0.054
(1.445)
Home CEO × Cultural Change (Teamwork) 0.013
(0.201)
Cultural Change (Innovation) -0.047
(-0.752)
Home CEO × Cultural Change (Innovation) 0.036
(0.359)
Cultural Change (Respect) -0.023
(-0.636)
Home CEO × Cultural Change (Respect) 0.090
(1.376)
Cultural Change (Quality) 0.060
(0.979) Home CEO × Cultural Change (Quality) -0.004 (-0.035) Constant 3.279*** 2.627*** 2.446*** 3.742*** 2.369*** (5.054) (3.770) (3.731) (6.421) (3.625) Firm and CEO Control Variables Yes Yes Yes Yes Yes Year Fixed Effects Yes Yes Yes Yes Yes Industry Fixed Effects Yes Yes Yes Yes Yes County Fixed Effects Yes Yes Yes Yes Yes Observations 2,804 2,830 2,847 2,842 2,844 Adjusted R2 0.444 0.440 0.440 0.440 0.440

Table 8
Propensity score matching.
This table presents the results on propensity score matching (PSM) analysis for treatment (home CEO) and control (non-home CEO) firm-year observations. Panel A presents the results for the difference-in-means of control variables between the home CEOs and non-home CEOs subsamples together with the corresponding t-statistics before and after the matching. Panel B re-estimates the baseline model (Table 2, column (3)) using the PSM matched sample. The propensity score is estimated as a probit function of ln (total assets), ROA, leverage, market-to-book, female CEO, CEO age, CEO age2, CEO tenure, CEO tenure2, CEO ownership, GDP per capita at state-level, and unemployment rate at state-level. The definitions of all variables are provided in the Appendix. We match each home CEO observation with a non-home CEO observation using the nearest neighbor (i.e., one-to-one matching) with replacement subject to caliper (i.e., maximum difference in propensity score) of 0.01 using psmatch2, a STATA function written by Leuven and Sianesi (2003). In Panel B, we include the firm and CEO control variables used in Table 2; we also include year, industry, and county fixed effects, whose coefficients are suppressed, and are based on calendar year, 2-digit SIC industry classification, and county dummies, respectively. T-statistics, which are based on heteroscedasticity–robust standard errors clustered at the county-year level, are reported in parentheses. ***, **, and * indicate significance at the 1%, 5%, and 10% levels, respectively.
Panel A: Difference-in-Means of Control Variables Between Home CEO and Non-Home CEO Subsamples
Before PSM After PSM
Home CEO
Non-Home CEO
Difference T-Stats Home CEO
Non-Home CEO
Differ-ence
T-Stats
Ln (Total Assets) 8.398 8.371 0.026 0.577 8.371 8.353 0.018 0.271 ROA 0.052 0.050 0.002 0.698 0.052 0.050 0.002 0.550 Leverage 0.245 0.243 0.002 0.366 0.243 0.240 0.003 0.444 Market-to-Book 3.277 3.767 -0.490*** -3.759 3.405 3.498 -0.092 -0.539 Female CEO 0.024 0.030 -0.007 -1.327 0.027 0.022 0.004 0.686 CEO Age 56.066 56.215 -0.149 -0.680 55.942 55.910 0.032 0.100 CEO Age2 3205 3212 -7.756 -0.311 3190 3185 5.338 0.149 CEO Tenure 11.385 8.564 2.821*** 12.356 10.269 10.540 -0.271 -0.801 CEO Tenure2 207.812 125.755 82.057*** 10.178 174.625 177.129 -2.504 -0.216 CEO Ownership 2.960% 1.672 1.288*** 7.418 2.519 2.439 0.080 0.309 State GDP per Capita 4.736 4.648 0.088*** 3.098 4.736 4.733 0.003 0.062 State Unemployment Rate 6.003 6.127 -0.124** -2.222 6.029 6.073 -0.044 -0.583
Panel B: Regression with PSM Matched Sample
CSR Score Home CEO 0.115*** (3.483) Constant 3.237*** (7.858) Yes Year Fixed Effects Yes Industry Fixed Effects Yes County Fixed Effects Yes Observations 2,356 Adjusted R2 0.414

Table 9
Two-stage instrumental variable (IV) analysis.
This table presents the results of a two-stage instrumental variable (IV) regression analysis. In the first stage, the dependent variable takes the value of one for a home CEO, and zero otherwise. The instrument used in the first stage regression is Hometown Board Position Prior to Becoming CEO. The instrumented home CEO is then used in the second-stage regression, where the dependent variable is the CSR score, which is the sum of adjusted CSR scores calculated from five CSR categories (community, environment, diversity, employee relations, and human rights). All variables are defined in the Appendix. All models include year, industry, and county fixed effects, whose coefficients are suppressed, and are based on calendar year, 2-digit SIC industry classification, and county dummies, respectively. T-statistics, which are based on heteroscedasticity–robust standard errors clustered at the county-year level, are reported in parentheses. ***, **, and * indicate significance at the 1%, 5%, and 10% levels, respectively.
First Stage Second Stage Home CEO CSR Score (1) (2)
Hometown Board Position Prior to Becoming CEO 0.313***
(9.238)
Instrumented Home CEO 0.339***
(2.366)
Ln (Total Assets) 0.007 0.092***
(1.263) (10.582)
ROA 0.028 0.231**
(0.689) (2.653)
Leverage -0.034 -0.037
(-0.766) (-0.710)
Market-to Book -0.001 0.004**
(-1.217) (2.237)
Female CEO 0.010 0.075
(0.220) (1.459)
CEO Age 0.020*** -0.010
(2.568) (-1.190)
CEO Age2 -0.000*** 0.000
(-3.595) (1.076) CEO Tenure 0.011*** -0.001 (5.313) (-0.180) CEO Tenure2 -0.000 -0.000** (-0.009) (-1.985) CEO Ownership 0.003*** -0.002** (2.616) (-1.905) Constant 0.234 1.536*** (0.930) (5.550) Year Fixed Effects Yes Yes Industry Fixed Effects Yes Yes County Fixed Effects Yes Yes Kleibergen-Paap Rk Wald F 85.339 LIML size of nominal 10% Wald 16.38 Observations 5,771 5,771 Adjusted R2 0.382 0.424

Table 10
Do home CEOs affect the relation between CSR and firm performance?
This table presents the results of OLS regressions for the effect of home CEOs on the relation between CSR investments and firm performance. The dependent variable is Tobin’s Q in year t (specification (1)), in year t+1 (specification (2), and in year t+2 (specification (3)). Home CEO is a dummy variable that is equal to one if the distance between the CEO’s birth county and the firm headquarters county is less than 100 miles, and zero otherwise. All other variables are defined in the Appendix. All models include year, industry, and county fixed effects, whose coefficients are suppressed, and are based on calendar year, 2-digit SIC industry classification, and county dummies, respectively. T-statistics, which are based on heteroscedasticity– robust standard errors clustered at the county-year level, are reported in parentheses. ***, **, and * indicate significance at the 1%, 5%, and 10% levels, respectively.
Tobin’s Qt Tobin's Qt + 1 Tobin's Qt + 2 (1) (2) (3)
Home CEO 0.007 0.029 0.081 (0.181) (0.633) (1.557)
CSR 0.060* 0.066* 0.049 (1.810) (1.861) (1.301)
Home CEO × CSR 0.112* 0.132** 0.131* (1.836) (1.969) (1.898)
Ln (Total Assets) -0.138*** -0.124*** -0.120*** (-7.080) (-6.220) (-5.805)
ROA 2.500*** 1.898*** 1.578*** (7.809) (5.616) (4.357)
Leverage -1.387*** -1.210*** -1.106*** (-7.248) (-6.205) (-5.298)
Market-to-Book 0.121*** 0.096*** 0.076*** (12.551) (11.482) (10.420)
Female CEO -0.015 -0.072 -0.107 (-0.094) (-0.464) (-0.587)
CEO Age -0.010 -0.003 0.004 (-0.560) (-0.133) (0.181)
CEO Age2 0.000 -0.000 -0.000 (0.169) (-0.186) (-0.499) CEO Tenure 0.018** 0.013* 0.008 (2.511) (1.649) (1.081) CEO Tenure2 -0.001** -0.000* -0.000 (-2.335) (-1.793) (-1.205) CEO Ownership 0.008** 0.010*** 0.013*** (2.196) (2.711) (3.113) Constant 3.334*** 1.537** 3.329*** (5.682) (2.502) (3.870) Year Fixed Effects Yes Yes Yes Industry Fixed Effects Yes Yes Yes County Fixed Effects Yes Yes Yes Observations 5,185 4,867 4,551 Adjusted R2 0.578 0.527 0.501

Table 11
Home CEOs and customers, suppliers, and employees.
In Panel A presents the results of OLS regressions (apart from specification (1), which employs a linear probability model) for the effect of home CEOs on customer satisfaction, suppliers’ trade credit, and employee satisfaction. In specification (1), the dependent variable is high customer satisfaction. In specification (2) and (3), the dependent variable is trade credit, proxied by Payables/Sales, and Payable/COGS, respectively. In specifications (4) to (10), the dependent variable captures employee satisfaction measured using Glassdoor data. Panel B reports the results of OLS regressions for the effect of home CEOs engaging in CSR investments on: i) Gross Margin (in specifications (1) and (2)); ii) Sales Growth (in specifications (3) and (4)); iii) Sales per Employee (in specifications (5) and (6)); and iv) Employee Growth (in specifications (7) and (8)). In Panel B, specifications (1) and (2) report the results for local customers or suppliers and non-local customers or suppliers, respectively; specifications (3) and (4) report the results for local customers and non-local customers, respectively; specifications (5) and (6) report the results for local employees and non-local employees, respectively; and specifications (7) and (8) report the results for local employees and non-local employees, respectively. For regressions (1) to (4) we use data from the Compustat Segments Customer File. Using manual search procedures, we identify and match US listed customers to their Compustat identifiers (i.e., GVKEY). The number of local employees of a firm is proxied by its annual market share multiplied by the number of employees in the same industry in its headquarter county. The county-specific industrial employment data is from County Business Patterns (CBP) database. The market share is based on market capitalization and 2-digit SIC codes. All models include the firm and CEO control variables used in Table 2; they also include year, industry, and county fixed effects, whose coefficients are suppressed, and are based on calendar year, 2-digit SIC industry classification, and county dummies, respectively. T-statistics, which are based on heteroscedasticity–robust standard errors clustered at the county-year level, are reported in parentheses. ***, **, and * indicate significance at the 1%, 5%, and 10% levels, respectively.
Panel A: The relation between home CEOs and customer satisfaction, suppliers’ trade credit, and employee satisfaction
High
Customer Satisfaction
Payables /Sales
Payables/ COGS
Glassdoor Rating
Work-Life Bal-
ance
Culture and Val-
ues
Career Opportuni-
ties
Compensation and Benefits
Recom-menda-tion Ra-
tio
CEO Approval
Ratio
(1) (2) (3) (4) (5) (6) (7) (8) (9) (10) Home CEO 0.138*** 0.005*** 0.013*** 0.271*** 0.302*** 0.253*** 0.299*** 0.112* 0.095*** 0.090*** (2.448) (2.958) (2.755) (3.011) (3.160) (2.594) (3.055) (1.683) (2.648) (2.501) Control Variables Yes Yes Yes Yes Yes Yes Yes Yes Yes Yes Year FE Yes Yes Yes Yes Yes Yes Yes Yes Yes Yes Industry FE Yes Yes Yes Yes Yes Yes Yes Yes Yes Yes County FE Yes Yes Yes Yes Yes Yes Yes Yes Yes Yes Observations 834 8,910 8,910 1,238 1,237 643 1,237 1,237 1,238 1,238 Adjusted R2 0.447 0.346 0.322 0.357 0.396 0.452 0.327 0.438 0.351 0.344

Panel B: The effect of CSR on operating performance variables: Local vs. non-local stakeholders
Gross Margin Sales Growth Sales per Employee (in
$000’s) Employee Growth
Local Customers
or Suppliers
Non-Local Customers
or Suppliers
Local
Customers Non-Local Customers
Local
Employees Non-Local Employees
Local
Employees Non-Local Employees
(1) (2) (3) (4) (5) (6) (7) (8)
Home CEO -0.026** -0.010 -0.006 -0.074 -37.780*** -82.705* -2.508 -1.840
(-2.115) (-0.209) (-0.090) (-1.346) (-3.082) (-1.819) (-1.012) (-1.066)
CSR -0.014* -0.021 -0.044 -0.114** -78.959*** 34.386 -1.922 0.489
(-1.765) (-0.755) (-0.834) (-2.082) (-2.725) (0.677) (-1.025) (0.355)
Home CEO × CSR 0.032*** -0.106 0.161* -0.051 58.853** 7.703 3.656* -6.337***
(2.882) (-1.285) (1.825) (-0.604) (2.054) (0.127) (1.784) (-2.696)
Control Variables Yes Yes Yes Yes Yes Yes Yes Yes
Year Fixed Effects Yes Yes Yes Yes Yes Yes Yes Yes
Industry Fixed Effects Yes Yes Yes Yes Yes Yes Yes Yes
County Fixed Effects Yes Yes Yes Yes Yes Yes Yes Yes
Observations 1,125 214 248 847 2,690 2,380 2,463 2,126
Adjusted R2 0.761 0.813 0.067 0.059 0.707 0.224 0.035 0.043
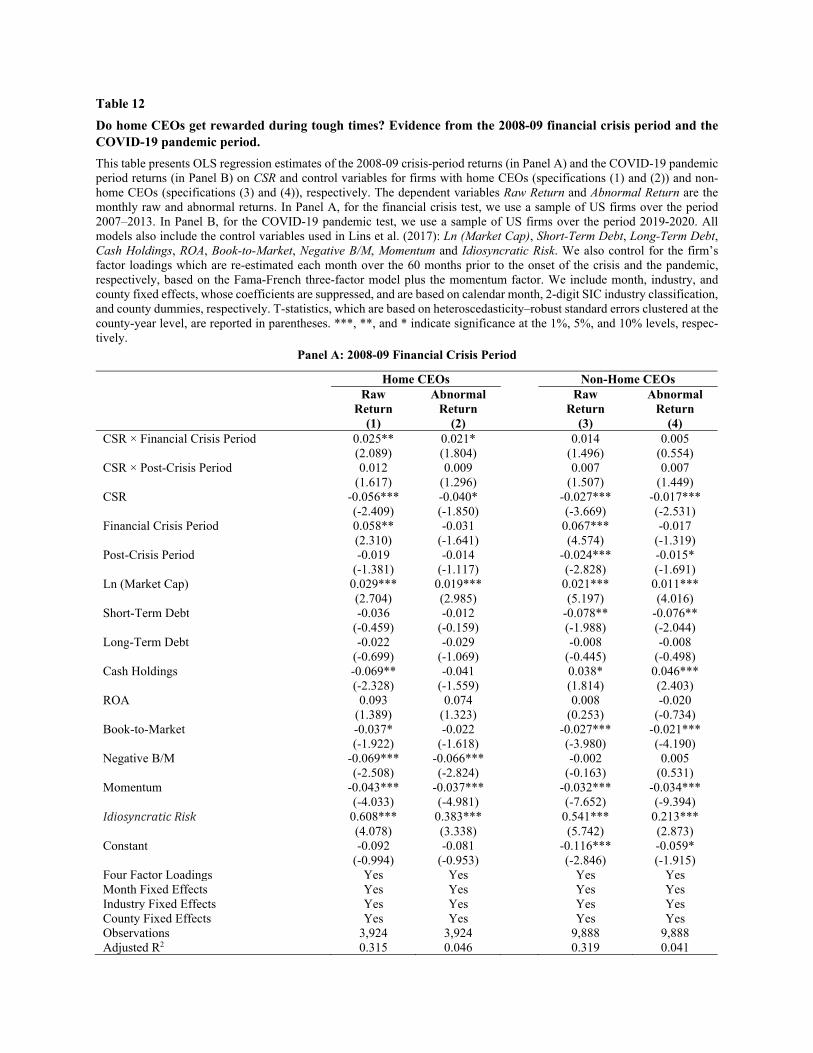
Table 12
Do home CEOs get rewarded during tough times? Evidence from the 2008-09 financial crisis period and the COVID-19 pandemic period.
This table presents OLS regression estimates of the 2008-09 crisis-period returns (in Panel A) and the COVID-19 pandemic period returns (in Panel B) on CSR and control variables for firms with home CEOs (specifications (1) and (2)) and non-home CEOs (specifications (3) and (4)), respectively. The dependent variables Raw Return and Abnormal Return are the monthly raw and abnormal returns. In Panel A, for the financial crisis test, we use a sample of US firms over the period 2007–2013. In Panel B, for the COVID-19 pandemic test, we use a sample of US firms over the period 2019-2020. All models also include the control variables used in Lins et al. (2017): Ln (Market Cap), Short-Term Debt, Long-Term Debt, Cash Holdings, ROA, Book-to-Market, Negative B/M, Momentum and Idiosyncratic Risk. We also control for the firm’s factor loadings which are re-estimated each month over the 60 months prior to the onset of the crisis and the pandemic, respectively, based on the Fama-French three-factor model plus the momentum factor. We include month, industry, and county fixed effects, whose coefficients are suppressed, and are based on calendar month, 2-digit SIC industry classification, and county dummies, respectively. T-statistics, which are based on heteroscedasticity–robust standard errors clustered at the county-year level, are reported in parentheses. ***, **, and * indicate significance at the 1%, 5%, and 10% levels, respec-tively.
Panel A: 2008-09 Financial Crisis Period
Home CEOs Non-Home CEOs Raw
Return Abnormal
Return Raw
Return Abnormal
Return (1) (2) (3) (4) CSR × Financial Crisis Period 0.025** 0.021* 0.014 0.005 (2.089) (1.804) (1.496) (0.554) CSR × Post-Crisis Period 0.012 0.009 0.007 0.007 (1.617) (1.296) (1.507) (1.449) CSR -0.056*** -0.040* -0.027*** -0.017*** (-2.409) (-1.850) (-3.669) (-2.531) Financial Crisis Period 0.058** -0.031 0.067*** -0.017 (2.310) (-1.641) (4.574) (-1.319) Post-Crisis Period -0.019 -0.014 -0.024*** -0.015* (-1.381) (-1.117) (-2.828) (-1.691) Ln (Market Cap) 0.029*** 0.019*** 0.021*** 0.011*** (2.704) (2.985) (5.197) (4.016) Short-Term Debt -0.036 -0.012 -0.078** -0.076** (-0.459) (-0.159) (-1.988) (-2.044) Long-Term Debt -0.022 -0.029 -0.008 -0.008 (-0.699) (-1.069) (-0.445) (-0.498) Cash Holdings -0.069** -0.041 0.038* 0.046*** (-2.328) (-1.559) (1.814) (2.403) ROA 0.093 0.074 0.008 -0.020 (1.389) (1.323) (0.253) (-0.734) Book-to-Market -0.037* -0.022 -0.027*** -0.021*** (-1.922) (-1.618) (-3.980) (-4.190) Negative B/M -0.069*** -0.066*** -0.002 0.005 (-2.508) (-2.824) (-0.163) (0.531) Momentum -0.043*** -0.037*** -0.032*** -0.034*** (-4.033) (-4.981) (-7.652) (-9.394) IdiosyncraticRisk 0.608*** 0.383*** 0.541*** 0.213*** (4.078) (3.338) (5.742) (2.873) Constant -0.092 -0.081 -0.116*** -0.059* (-0.994) (-0.953) (-2.846) (-1.915) Four Factor Loadings Yes Yes Yes Yes Month Fixed Effects Yes Yes Yes Yes Industry Fixed Effects Yes Yes Yes Yes County Fixed Effects Yes Yes Yes Yes Observations 3,924 3,924 9,888 9,888 Adjusted R2 0.315 0.046 0.319 0.041

Panel B: COVID-19 Pandemic Period
Home CEOs Non-Home CEOs
Raw Return
Abnormal Return
Raw Return
Abnormal Return
(1) (2) (3) (4)
CSR × COVID-19 Period 0.262*** 0.356*** -1.377*** -1.296*** (2.475) (3.404) (-3.208) (-2.864) CSR × Post-COVID-19 Period 0.361*** 0.408*** -1.439*** -1.361*** (3.226) (3.667) (-3.332) (-3.010) CSR 1.763*** 1.681*** 0.378*** 0.366*** (4.235) (4.056) (2.857) (2.644) COVID-19 Period -0.159*** -0.158*** 1.219*** 1.182*** (-3.363) (-3.101) (3.050) (2.783) Post-Covid-19 Period -0.157*** -0.119 1.277*** 1.253*** (-2.399) (-1.689) (3.150) (2.921) Ln (Market Cap) 0.283*** 0.272*** 0.105*** 0.098*** (5.621) (5.193) (4.209) (3.662) Short-Term Debt -0.498 -0.500 0.185 0.177 (-1.522) (-1.632) (1.137) (1.001) Long-Term Debt 0.075 0.146 0.257 0.268 (0.177) (0.361) (1.236) (1.160) Cash Holdings 0.102 0.064 -0.187* -0.161 (0.459) (0.288) (-1.857) (-1.531) ROA -0.990 -1.195 0.083 0.110 (-1.241) (-1.526) (0.186) (0.246) Book-to-Market 0.001 0.000 0.000 0.000 (0.889) (0.248) (0.175) (0.172) Negative B/M 0.140 0.089 -0.029 -0.031 (1.283) (0.823) (-0.182) (-0.186) Momentum -0.231*** -0.233*** -0.144*** -0.150*** (-5.926) (-5.756) (-6.088) (-6.110) IdiosyncraticRisk 9.394*** 9.106*** 2.352*** 2.214*** (4.830) (4.623) (3.192) (2.843) Constant -6.050*** -5.867*** -2.631*** -2.552*** (-5.829) (-5.275) (-4.202) (-3.884) Four Factor Loadings Yes Yes Yes Yes Month Fixed Effects Yes Yes Yes Yes Industry Fixed Effects Yes Yes Yes Yes County Fixed Effects Yes Yes Yes Yes Observations 339 339 959 959 Adjusted R2 0.467 0.250 0.413 0.107

Table 13
Controlling for corporate governance.
This table reports coefficients from OLS regressions for the effect of home CEOs on CSR activities after controlling for corporate governance. The dependent variable is the CSR score, which is the sum of adjusted CSR scores calculated from five CSR categories (community, environment, diversity, employee relations, and human rights). Home CEO is a dummy variable that is equal to one if the distance between the CEO’s birth county and the headquarters county is less than 100 miles, and zero otherwise. The variables used to proxy for weak corporate governance are: i) high entrenchment index (E-index); ii) low institutional own-ership; and iii) the proportion of independent directors. All variables are defined in the Appendix. All mod-els include the firm and CEO control variables used in Table 2; they also include year, industry, and county fixed effects, whose coefficients are suppressed, and are based on calendar year, 2-digit SIC industry clas-sification, and county dummies, respectively. T-statistics, which are based on heteroscedasticity–robust standard errors clustered at the county-year level, are reported in parentheses. *** and * indicate signifi-cance at the 1% and 10% levels, respectively.
CSR Score (1) (2) (3)
Home CEO 0.125*** 0.112*** 0.223*** (3.123) (4.037) (2.667)
High E-Index -0.015
(-0.584)
Low Institutional Ownership 0.066***
(3.600)
Independent Directors -0.009 (-0.121)
Home CEO × High E-Index 0.026
(0.497)
Home CEO × Low Institutional Ownership -0.003
(-0.073)
Home CEO × Independent Directors -0.146 (-1.290)
Constant 2.738*** 1.296*** 2.199*** (5.846) (4.262) (6.547)
Firm and CEO Control Variables Yes Yes Yes
Year Fixed Effects Yes Yes Yes
Industry Fixed Effects Yes Yes Yes
County Fixed Effects Yes Yes Yes
Observations 3,068 5,235 4,092
Adjusted R2 0.406 0.403 0.425

Table 14
Do indirect or direct private benefits drive the relation between home CEOs and CSR?
This table reports coefficients from OLS regressions for the effects of indirect or direct private benefits on the relation between home CEOs and CSR. The dependent variable is the CSR score, which is the sum of adjusted CSR scores calculated from five CSR categories (community, environment, diversity, employee relations, and human rights). Panel A reports the results for indirect private benefits. In particular, it presents the effects of CEO political posi-tion/connections on the relation between home CEOs and CSR. Panel B presents the results for direct private benefits. In particular, it presents the effects of CEO total and equity compensation on the relation between home CEOs and CSR. Home CEO is a dummy variable that is equal to one if the distance between the CEO’s birth county and the headquarters county is less than 100 miles, and zero otherwise. All other variables are defined in the Appendix. All models include year, industry, and county fixed effects, whose coefficients are suppressed, and are based on calendar year, 2-digit SIC industry classification, and county dummies, respectively. T-statistics, which are based on hetero-scedasticity– robust standard errors clustered at the county-year level, are reported in parentheses. ***, **, and * indicate significance at the 1%, 5%, and 10% levels, respectively.
Panel A: Indirect Benefits
(1) (2) (3) (4) (5) Home CEO 0.131*** 0.130*** 0.130*** 0.078*** 0.085*** (5.741) (5.700) (5.711) (3.160) (2.560) Political Position 0.127 (1.490) Home CEO × Political Position -0.163 (-1.510) Political Position (Pre-CEO) 0.134 (1.262) Home CEO × Political Position (Pre-CEO) -0.161 (-1.190) Political Experience (Post-CEO) 0.110 (1.122) Home CEO × Political Position (Post-CEO) -0.155 (-1.080) Political Contributions -0.006*** (-2.680) Home CEO × Political Contributions 0.010*** (2.855) Corporate Lobbying -0.001 (-0.560) Home CEO × Corporate Lobbying 0.005 (1.436) Constant 1.778*** 1.780*** 1.783*** 1.742*** 0.967** (5.841) (5.825) (5.858) (5.722) (2.276) Firm & CEO Control Variables Yes Yes Yes Yes Yes Year Fixed Effects Yes Yes Yes Yes Yes Industry Fixed Effects Yes Yes Yes Yes Yes County Fixed Effects Yes Yes Yes Yes Yes Observations 5,771 5,771 5,771 5,771 4,395 Adjusted R2 0.396 0.395 0.395 0.397 0.410

Panel B: Direct Benefits
(1) (2)
Home CEO 0.175* 0.129**
(1.678) (2.019)
Total Compensation -0.001
(-0.064)
Home CEO × Total Compensation -0.003
(-0.265)
Equity Compensation -0.002
(-0.479)
Home CEO × Equity Compensation 0.002
(0.294)
Constant -1.349*** -1.278***
(-4.975) (-4.839)
Firm & CEO Control Variables Yes Yes
Year Fixed Effects Yes Yes
Industry Fixed Effects Yes Yes
County Fixed Effects Yes Yes
Observations 5,678 5,678
Adjusted R2 0.403 0.399
Internet Appendix
A1. Robustness checks
A1.1. Alternative explanations for our results
Table A1 reports the results for a battery of robustness checks. First, Fee et al. (2013) argue
that manager effects can only be identified around turnover events, which do not occur randomly.
In addition, even if turnover events do occur randomly, the selection of incoming managers is
endogenous and will likely reflect firm/board preferences. Fee et al. (2013) provide evidence of
manager style effects only for firms with access to deep executive labor pools following
endogenous CEO turnover. They interpret this finding as change-seeking boards selecting
managers with characteristics that will deliver the board’s desired new policies. In section 3.5.1,
our analysis on CEO changes provides evidence of birthplace identity. However, it is not clear
whether CEO turnover is endogenous or exogenous. An alternative approach to test whether the
idiosyncratic styles of managers affect CSR within firms is to use a firm fixed effects model.
Yonker (2017a) notes that a firm fixed effects model allows us to control for time invariant
unobservable firm–specific variation that may be related to a specific firm’s CSR decision–
making, i.e., it captures differences in CSR activities between home and non-home CEOs within
the same firm. Model (1) of Table A1 presents the estimates for the firm fixed effects model.
Controlling for firm fixed effects, we still find a significantly positive relation between firms with
home CEOs and CSR score at the 1% level.1
A second concern is an inadequate control for industry. In model (2), we use the Fama and
French–48 industry classification (Fama and French, 1997) to define industries instead of the two–
digit Standard Industrial Classification (SIC) codes. We obtain similar results which ensures that
our previous findings are not affected by the definition of industry fixed effects used in the
analysis.
Third, approximately 19.94% of the CEOs in our sample were born in one of the Top 3 birth
counties in our sample (i.e., New York City, Cook County, and St. Louis City). To eliminate
concerns that our results are driven by these specific counties which dominate the observations of
1 We do not include county fixed effects in model (1) because firm fixed effects perfectly capture the variation of county fixed effects.

the “home CEO” variable, in model (3) we remove observations with CEOs born in these counties.
Again, our results remain unchanged.
Fourth, to address concerns that higher education might affect CSR engagement of CEOs, we
remove observations of firms with CEOs possessing an MBA or other master’s degree in model
(4). Our results are qualitatively similar.
Fifth, prior literature (see, e.g., Wu et al., 2015) has documented that firms with founder CEOs
are associated with greater engagement in corporate social responsibility activities. To address this
issue, we remove founder CEOs in model (5).2 Our results remain unaltered.
Sixth, Di Giuli and Kostovetsky (2014) find that the CSR score of firms differs significantly
based on the political preferences of their CEOs. Specifically, they find that the CSR score is
higher for firms with Democratic rather than Republican CEOs. To control for the political
preferences of CEOs, we rely on personal political contributions data from Hutton et al. (2014).
We create an indicator variable Republican CEO, which is a dummy variable that is equal to one
if a CEO is identified as a Republican CEO, and zero otherwise. In model (6), we show that
controlling for the political preferences of CEOs does not affect the positive relation between home
CEOs and CSR score.
Seventh, Hong, Kubik, and Scheinkman (2011) show that financial constraints are negatively
correlated with CSR and argue that CSR investments are less likely to be undertaken by firms
which are in tight financial conditions. To ensure that financial constraints do not capture the effect
of the home CEO variable on CSR score, we use the SA index of Hadlock and Pierce (2010) to
measure financial constraints in model (7).3 We obtain similar results to the baseline models after
controlling for the level of financial constraints in the firm.
Eighth, Bae et al. (2019) report that regional religiosity has a significant impact on the
investment behavior with respect to social responsibility of fund managers in the US. To address
this issue, in model (8), we control for religiosity using the definition of Hilary and Hui (2009).
Specifically, religiosity is defined as the number of religious adherents in the county to the total
population in the county. Controlling for county-level religiosity does not affect our main results.
Ninth, one could argue that the effect of home CEOs on CSR depends on how geographically
dispersed the firm is, i.e., how much the headquarters matter in terms of importance. If the CEO
2 We thank Rüdi Fahlenbrach for sharing data on founder CEOs. 3 For robustness, we also use the Kaplan and Zingales (1997) KZ index as a measure of financial constraints and obtain similar results.

recognizes that the recipients of CSR are likely to be from her hometown, there could be a larger
propensity to engage in CSR activities. Therefore, a plausible hypothesis is that for firms that are
highly dispersed and operate in multiple locations (for instance, food and beverage or retail), the
home CEO effect on CSR should be lower relative to a firm that is largely concentrated in the local
community (i.e., around its headquarters). In Model (9), we control for the intensity of a firm’s
local interest concentration using the measure of García and Norli (2012) and Lai et al. (2020) for
the level of concentration of the firm’s businesses in the state.4 Local business concentration is
a dummy variable taking the value of one if, in the firm’s 10-K report of the year, the number of
times that its headquarters state is cited is more than 50% of its citations of all US states.5 The idea
is that the more a firm mentions its headquarters state, the higher its concentration is. We also
interact “local business concentration” with “home CEOs” to investigate whether home CEO CSR
engagement differs by firm’s local interest concentration. We find that home CEOs continue to
have a significantly positive relation with CSR, though the interaction variable is insignificant at
conventional levels.
A1.2. Alternative definitions of home CEO and CSR
In our main analysis, we use 100 miles as a distance cutoff and define a CEO as a home CEO
if the distance between her birth county and the headquarters’ county is less than 100 miles. In this
section, in Panel A, we first examine if our results are robust to different definitions of home CEOs
and alternative distances as cutoffs to define home CEOs (e.g., 50 miles, or 200 miles as cutoffs,
respectively). Table A2 reports regression results using alternative definitions of home CEOs.
Model (1) uses a state-level measure of home CEOs based on hometown CEO data collected
by Yonker (2017b).6 Yonker manually gathers the Social Security Number (SSN) from the
LexisNexis online public records database for CEOs covered by ExecuComp database from 1997
to 2007.7 The 5-digit SSN is issued by the state when a resident applies for the first job or driver’s
license. Specifically, the first 3 digits indicate the state of issuance, while the fourth and fifth digits
are linked to the sequence of issuance. Therefore, the Social Security number identifies the year
4 It counts the occurrence of state names in the following sections of 10-K reports: ‘‘Item 1: Business,’’ ‘‘Item 2: Properties,’’ ‘‘Item 6a: Consolidated Financial Data,’’ and ‘‘Item 7: Management’s Discussion and Analysis.’’ Source: Diego Garcia’s website (http://leeds-faculty.colorado.edu/garcia/page3.html). 5 We also use different cutoff points (for example, 60% or 75%), obtaining similar results. 6 We again thank Scott Yonker for sharing his home CEO data. 7 The SSN has been used by several studies in the literature as a measure of CEO origin (see, e.g., Pool et al. 2012; Bernile et al. 2017; Jiang, et al. 2019).
and state in which a CEO acquired her Social Security number. Yonker (2017b) shows that more
than 80% of CEOs in his sample receive the SSN before the age of 17 years old. He argues that
SSN efficiently identifies CEO home states. Using this state-level measure of home CEO, we still
find a strong positive association, between home CEOs and CSR, which is statistically significant
at the 1% level.
In model (2), we use the Ln (Distance+1) as an alternative main variable of interest, instead
of a dummy, to measure the intensity of the home CEO effect. Ln (Distance+1) is the natural
logarithm of the physical distance (in miles) between the CEO’s birth county and the county in
which the firm’s headquarters are located. The key advantage of using this variable is that it is a
continuous measure of the birthplace identity level. We find that the coefficient on the home CEO
variable is negative and statistically significant (at the 1% level), which suggests that a CEO
engages in less CSR activities when the county of the firm’s headquarters is located farther away
from the CEO’s birth county.
In models (3) and (4), the home CEO variable is constructed using alternative distance cutoffs
to define whether a CEO is a home CEO; the cutoffs are 50 miles and 200 miles, respectively.
Running our baseline model using these alternative measures shows that the coefficients on Home
CEO retain their significance with a similar economic magnitude.
In Panel B, we perform two additional sensitivity tests related to the dependent variable. Prior
literature (see, e.g., Cronqvist and Yu, 2017) also uses the raw CSR score as an alternative measure
of CSR activities. The raw CSR score is the sum of CSR scores from the five CSR categories
(community, environment, diversity, employee relations, and human rights), calculated as the
number of CSR strengths across the five categories minus the number of CSR concerns across the
five categories. Using the raw CSR score measure in model (1) leaves our results unaltered.
Additionally, in model (2) we use an alternative CSR data provider (Thomson Reuters
ASSET4) to rule out the possibility that our results are driven by a specific methodology used by
different providers to measure CSR. Following Ioannou and Serafeim (2012) and Boubakri et al.
(2016), we construct our primary measure of a firm’s CSR performance (CSR), which is the
average of the firm’s environmental performance (EP) and social performance (SP) scores. A
firm’s environmental performance score captures “a company’s impact on living and non-living
natural systems, including the air, land and water, as well as complete ecosystems”, and is based
on the firm’s energy use, CO2 emissions, waste recycling, etc. A firm’s social performance score

measures “a company’s capacity to generate trust and loyalty with its workforce, customers and
society, through its use of best management practices” and is based on factors such as employee
turnover, injury rate, training hours, percentage of female employees, and the amount donated to
charitable organizations. Home CEOs continue to exhibit a significantly positive relation to the
level of CSR activities.

Table A1
Robustness checks.
This table presents the results of OLS regressions for the effect of home CEOs on CSR activities. The dependent variable is the CSR score, which is the sum of adjusted CSR scores calculated from five CSR categories (community, environment, diversity, employee relations, and human rights). Specification (1) presents the estimates of a model with firm fixed effects. Specification (2) uses Fama-French 48 industry classification for industry fixed effects. Specification (3) removes observations in which the CEO was born in one of the Top 3 birth counties in our sample (i.e., New York City, Cook County, and St. Louis City). Specification (4) removes observations in which the CEO has an MBA or Master’s degree. Specification (5) removes observations in which the CEO is also the founder of the company. Specification (6) includes an additional control variable, Republican CEO. Specification (7) includes the control variable, the Size-Age Index (SA Index), which measures firms' financial constraints as in Hadlock and Pierce (2010). Specification (8) includes the control variable, County-Level Religiosity. Specification (9) includes the control variable, Local Business Concentration. All models include the firm and CEO control variables used in Table 2. They also include year, industry, and county fixed effects, whose coefficients are suppressed, and are based on calendar year, 2-digit SIC industry classification (apart from specifications (1) and (2)), and county dummies, respectively. T-statistics, which are based on heteroscedasticity–robust standard errors clustered at the county-year level, are reported in parentheses. ***, **, and * indicate significance at the 1%, 5%, and 10% levels, respectively.
Firm Fixed
Effects Fama-
French 48
Remove Top 3 CEO Birth
Counties
Remove CEOs with MBA or
Master’s Degree
Remove Founder
CEOs
Republican CEO
Control
SA Index Control
County-Level
Religiosity Control
Local Business Concentration
Control (1) (2) (3) (4) (5) (6) (7) (8) (9) Home CEO 0.076*** 0.113*** 0.128*** 0.104*** 0.158*** 0.116*** 0.147*** 0.130*** 0.118*** (2.492) (5.102) (4.760) (3.675) (6.752) (4.477) (6.594) (5.802) (4.119)
Republican CEO -0.03 (-1.305)
SA Index
-0.054*** (-2.935)
County-Level Religiosity 0.081 (0.463)
Local Business Concentration 0.022 (1.014)
Local Business Con. × Home CEO -0.055
(-1.542)
Constant 3.914*** 1.178*** 2.039*** 2.750*** 1.856*** 2.676*** 1.950*** 0.995*** 2.274*** (13.464) (3.795) (6.097) (11.124) (7.288) (8.522) (7.138) (3.065) (9.332)
Firm & CEO Controls Yes Yes Yes Yes Yes Yes Yes Yes Yes
Firm FE Yes No No No No No No No No Year FE Yes Yes Yes Yes Yes Yes Yes Yes Yes Industry FE No Yes Yes Yes Yes Yes Yes Yes Yes County FE No Yes Yes Yes Yes Yes Yes Yes Yes Observations 5,654 5,771 4,664 3,250 5,014 3,912 5,771 5,564 3,580 Adjusted R2 0.563 0.394 0.418 0.430 0.414 0.427 0.399 0.398 0.413

Table A2
Alternative measures of home CEO and CSR.
This table reports coefficients from OLS regressions for the effect of home CEOs on CSR activities by using alternative measures of home CEOs in Panel A. The dependent variable is the CSR score, which is the sum of adjusted CSR scores calculated from five CSR categories (community, environment, diversity, employee relations, and human rights). In Specification (1), Home CEO is a dummy variable that is equal to one if the firm’s headquarters state is the same as the home state of the CEO. The home state of the CEO is measured with the first five digits of the CEO’s Social Security Numbers (Yonker, 2017b). In Specification (2), we use a continuous variable to define home CEOs, calculated as the natural logarithm of the distance between the CEO’s birth county and the headquarters county plus one. In specifications (3) and (4), Home CEO is a dummy variable that is equal to one if the distance between the CEO’s birth county and the firm headquarters county is less than 50 miles or 200 miles, respectively. All other variables are defined in the Appendix. Panel B presents: i) the results using raw CSR scores calculated from the five CSR categories rather than adjusted CSR scores as the dependent variable (specification (1)); and ii) the results using an alternative CSR data provider (Thomson Reuters ASSET4). The dependent variable in specification (2) is the average of the firm’s environmental performance (EP) and social performance (SP) scores. In Panel B, Home CEO is a dummy variable that is equal to one if the distance between the CEO's birth county and the headquarters county is less than 100 miles, and zero otherwise. All models include the firm and CEO control variables used in Table 2; they also include year, industry, and county fixed effects, whose coefficients are suppressed, and are based on calendar year, 2-digit SIC industry classification, and county dummies (except specification (1) in Panel A which includes state fixed effects), respectively. T-statistics, which are based on heteroscedasticity– robust standard errors clustered at the county-year level (except specification (1) which clusters the standard errors at the state-year level), are reported in parentheses. ***, **, and * indicate significance at the 1%, 5%, and 10% levels, respectively.
Panel A: Alternative Measures of Home CEO
Headquarters State = CEO Home State
Ln (Distance +1) Distance < 50
Miles Distance < 200
Miles
(1) (2) (3) (4) Home CEO 0.027*** -0.021*** 0.118*** 0.105*** (2.509) (-4.970) (5.306) (5.055) Constant -0.468*** 2.089*** 1.965*** 1.986*** (-2.499) (7.822) (7.448) (7.407) Firm & CEO Control Variables Yes Yes Yes Yes Year Fixed Effects Yes Yes Yes Yes Industry Fixed Effects Yes Yes Yes Yes County Fixed Effects No Yes Yes Yes State Fixed Effects Yes No No No Observations 6,992 5,771 5,771 5,771 Adjusted R2 0.246 0.394 0.394 0.394
Panel B: Alternative Measures of CSR Raw CSR Score
(1) ASSET4 (EP+SP)/2 Score
(2) Home CEO 0.686*** 0.085* (6.067) (1.877) Constant -4.730*** -1.327** (-4.001) (-2.100) Firm and CEO Control variables Yes Yes Year Fixed Effects Yes Yes Industry Fixed Effects Yes Yes County Fixed Effects Yes Yes Observations 5,771 2,150 Adjusted R2 0.484 0.703