Centrum growth patterns provide evidence for two small taxa of Hiodontidae in the Cretaceous...
12
Centrum growth patterns provide evidence for two small taxa of Hiodontidae in the Cretaceous Dinosaur Park Formation Michael G. Newbrey, Mark V.H. Wilson, and Allan. C. Ashworth Abstract: Disarticulated centra recovered from the Campanian Dinosaur Park Formation (Cretaceous) are used to de- scribe hiodontid age, growth, and longevity. Previous studies of Cretaceous centrum morphology have shown only one morphotype. However, growth characteristics can be used to test the one-taxon hypothesis. Age and growth characteris- tics indicate that Cretaceous hiodontids were shorter-lived (i.e., 7 years) and significantly smaller than extant Hiodon. The fossil centra also exhibit two significantly different growth patterns. Initially it was predicted that two factors could explain the presence of the two growth patterns: (1) sexual size dimorphism, and (2) variation in centrum size from multiple species. Sexual size dimorphism did not produce the two growth patterns because (1) H. alosoides maximum total length is significantly correlated with temperature, and (2) the paleotemperature in the depositional environment fluctuated approximately 6 °C mean annual temperature resulting in continuous growth variation. Concerning the sec- ond factor, the coefficient of variation (CV) observed in the Cretaceous centrum size data (0.23 CV) is 22% greater than that of the two extant species of Hiodon combined (0.18 CV) suggesting that at least two species of hiodontids were present in the Dinosaur Park Formation. The distribution of sizes of the smaller Cretaceous centra is not different from one extant species but is significantly different from two species suggesting that three taxa were not present. Résumé : Des centres désarticulés provenant de la Formation campanienne de Dinosaur Park (Crétacé) sont utilisés pour décrire l’âge, la croissance et la longévité d’hiodontidés. Les études précédentes de la morphologie de centres d’âge crétacé n’ont révélé qu’un seul morphotype. Or, des caractères associés à la croissance peuvent être utilisés pour vérifier l’hypothèse voulant qu’ils ne représentent qu’un seul taxon. Les caractères associés à l’âge et à la croissance indiquent que les hio- dontidés crétacés étaient de courte longévité (c.-à-d. sept ans) et considérablement plus petits que les Hiodon modernes. Les centres fossiles sont également caractérisés par deux modèles de croissance présentant des différences significatives. Initialement, il était anticipé que deux facteurs pouvaient expliquer l’existence de ces deux modèles : 1) un dimorphisme sexuel sur le plan de la taille et 2) la variabilité de la taille des centres de différentes espèces. Les deux modèles de croissance ne sont pas le résultat du dimorphisme sexuel associé à la taille, étant donné que 1) il existe une corrélation significative entre la longueur totale observée moyenne d’H. alosoides et la température, et 2) la paléotempérature annuelle moyenne du milieu sédimentaire fluctuait d’environ 6 °C, se traduisant par une variation continue de la croissance. En ce qui concerne le second facteur, le coefficient de variation « CV » des données relatives à la taille des centres crétacés (0,23 CV) est de 22 % supérieur au CV associé aux deux espèces modernes d’Hiodon combinées (0,18 CV), ce qui laisse croire qu’au moins deux espèces d’hiodontidés sont représentées dans la Formation de Dinosaur Park. La distribution des tailles des centres d’âge crétacé, plus petits, n’est pas différente de celle d’une espèce moderne, mais présente des différences significatives par rapport à celle des deux espèces, ce qui laisse croire que trois taxons n’y sont pas représentés. [Traduit par la Rédaction] Newbrey et al. 732 Introduction Hiodontids, which only exist in North America (NA) to- day (Lee et al. 1980), have inhabited the continent since at least the Campanian (Late Cretaceous). In the Cretaceous they are known only from small, isolated, morphologically similar centra (Brinkman and Neuman 2002). As a result, little is known about Cretaceous hiodontid taxonomic affini- ties and ecology because of the lack of complete specimens (Neuman and Brinkman 2005; Newbrey and Wilson 2005). However, the centra can provide information about charac- teristics of age and growth and therefore the biology of these Can. J. Earth Sci. 44: 721–732 (2007) doi:10.1139/E06-137 © 2007 NRC Canada 721 Received 1 August 2006. Accepted 19 December 2006. Published on the NRC Research Press Web site at http://cjes.nrc.ca on 29 June 2007. Paper handled by Associate Editor H. Sues. M.G. Newbrey. 1,2 Department of Biological Sciences, North Dakota State University, Fargo, ND 58105, USA. M.V.H. Wilson. Department of Biological Sciences, University of Alberta, Edmonton, AB T6G 2E9, Canada. A.C. Ashworth. Department of Geosciences, North Dakota State University, Fargo, ND 58105, USA. 1 Corresponding author (e-mail: [email protected]). 2 Present address: Department of Biological Sciences, University of Alberta, Edmonton, AB T6G 2E9, Canada.
-
Upload
columbusstate -
Category
Documents
-
view
0 -
download
0
Transcript of Centrum growth patterns provide evidence for two small taxa of Hiodontidae in the Cretaceous...
Centrum growth patterns provide evidence for twosmall taxa of Hiodontidae in the CretaceousDinosaur Park Formation
Michael G. Newbrey, Mark V.H. Wilson, and Allan. C. Ashworth
Abstract: Disarticulated centra recovered from the Campanian Dinosaur Park Formation (Cretaceous) are used to de-scribe hiodontid age, growth, and longevity. Previous studies of Cretaceous centrum morphology have shown only onemorphotype. However, growth characteristics can be used to test the one-taxon hypothesis. Age and growth characteris-tics indicate that Cretaceous hiodontids were shorter-lived (i.e., 7 years) and significantly smaller than extant Hiodon.The fossil centra also exhibit two significantly different growth patterns. Initially it was predicted that two factorscould explain the presence of the two growth patterns: (1) sexual size dimorphism, and (2) variation in centrum sizefrom multiple species. Sexual size dimorphism did not produce the two growth patterns because (1) H. alosoides maximumtotal length is significantly correlated with temperature, and (2) the paleotemperature in the depositional environmentfluctuated approximately 6 °C mean annual temperature resulting in continuous growth variation. Concerning the sec-ond factor, the coefficient of variation (CV) observed in the Cretaceous centrum size data (0.23 CV) is 22% greater thanthat of the two extant species of Hiodon combined (0.18 CV) suggesting that at least two species of hiodontids werepresent in the Dinosaur Park Formation. The distribution of sizes of the smaller Cretaceous centra is not different fromone extant species but is significantly different from two species suggesting that three taxa were not present.
Résumé : Des centres désarticulés provenant de la Formation campanienne de Dinosaur Park (Crétacé) sont utilisés pourdécrire l’âge, la croissance et la longévité d’hiodontidés. Les études précédentes de la morphologie de centres d’âge crétacén’ont révélé qu’un seul morphotype. Or, des caractères associés à la croissance peuvent être utilisés pour vérifier l’hypothèsevoulant qu’ils ne représentent qu’un seul taxon. Les caractères associés à l’âge et à la croissance indiquent que les hio-dontidés crétacés étaient de courte longévité (c.-à-d. sept ans) et considérablement plus petits que les Hiodon modernes. Lescentres fossiles sont également caractérisés par deux modèles de croissance présentant des différences significatives.Initialement, il était anticipé que deux facteurs pouvaient expliquer l’existence de ces deux modèles : 1) un dimorphismesexuel sur le plan de la taille et 2) la variabilité de la taille des centres de différentes espèces. Les deux modèles decroissance ne sont pas le résultat du dimorphisme sexuel associé à la taille, étant donné que 1) il existe une corrélationsignificative entre la longueur totale observée moyenne d’H. alosoides et la température, et 2) la paléotempérature annuellemoyenne du milieu sédimentaire fluctuait d’environ 6 °C, se traduisant par une variation continue de la croissance. En cequi concerne le second facteur, le coefficient de variation « CV » des données relatives à la taille des centres crétacés(0,23 CV) est de 22 % supérieur au CV associé aux deux espèces modernes d’Hiodon combinées (0,18 CV), ce qui laissecroire qu’au moins deux espèces d’hiodontidés sont représentées dans la Formation de Dinosaur Park. La distribution destailles des centres d’âge crétacé, plus petits, n’est pas différente de celle d’une espèce moderne, mais présente des différencessignificatives par rapport à celle des deux espèces, ce qui laisse croire que trois taxons n’y sont pas représentés.
[Traduit par la Rédaction] Newbrey et al. 732
Introduction
Hiodontids, which only exist in North America (NA) to-day (Lee et al. 1980), have inhabited the continent since atleast the Campanian (Late Cretaceous). In the Cretaceousthey are known only from small, isolated, morphologically
similar centra (Brinkman and Neuman 2002). As a result,little is known about Cretaceous hiodontid taxonomic affini-ties and ecology because of the lack of complete specimens(Neuman and Brinkman 2005; Newbrey and Wilson 2005).However, the centra can provide information about charac-teristics of age and growth and therefore the biology of these
Can. J. Earth Sci. 44: 721–732 (2007) doi:10.1139/E06-137 © 2007 NRC Canada
721
Received 1 August 2006. Accepted 19 December 2006. Published on the NRC Research Press Web site at http://cjes.nrc.caon 29 June 2007.
Paper handled by Associate Editor H. Sues.
M.G. Newbrey.1,2 Department of Biological Sciences, North Dakota State University, Fargo, ND 58105, USA.M.V.H. Wilson. Department of Biological Sciences, University of Alberta, Edmonton, AB T6G 2E9, Canada.A.C. Ashworth. Department of Geosciences, North Dakota State University, Fargo, ND 58105, USA.
1Corresponding author (e-mail: [email protected]).2Present address: Department of Biological Sciences, University of Alberta, Edmonton, AB T6G 2E9, Canada.

fishes (Newbrey and Wilson 2005). Here we describe the age,growth, and longevity characteristics of Cretaceous DinosaurPark Formation, southeastern Alberta, hiodontids identified byBrinkman and Neuman (2002). We also examine variation ingrowth patterns and estimate Cretaceous hiodontid taxonomicdiversity in the Dinosaur Park Formation.
In the fossil record, Hiodontiformes appear in the EarlyCretaceous in Asia (Li 1987), but have only been reportedfrom the Late Cretaceous and the Cenozoic of NA (Li et al.1997; Li and Wilson 1999; Brinkman and Neuman 2002).Most fossils of Hiodontiformes are Eocene and are repre-sented by complete individuals that have been studied sincethe mid-1960s (e.g., Cavender 1966; Wilson 1978; Grande1979; Hilton 2002).
Extant Hiodontidae are represented by two species, Hiodonalosoides Rafinesque and H. tergisus Lesueur. Representa-tives of the genus occur from the Canadian Arctic to theGulf Coast of Louisiana (Lee et al. 1980) and total lengths(TL) generally do not exceed 477 mm (Kennedy and Sprules1967). Extant species of Hiodon exhibit longevities of at least16 years (Donald et al. 1992) and sexual size dimorphism,with females attaining larger sizes (Kennedy and Sprules 1967;Scott and Crossman 1973).
Modern Hiodon exhibits a variety of growth-related charac-teristics for comparison to the Cretaceous centra, includinggrowth patterns, sexual size dimorphism, and size variation ofcentra between the two extant species. This information isused to interpret the patterns and variation found in the Cre-taceous hiodontid centra. Our objectives are twofold: (1) toexamine whether sexual size dimorphism may have beenpresent in the Cretaceous and therefore explain some varia-tion in fossil centra; (2) to examine the effects of intra- andinter-specific variation in centrum size.
Materials and methods
Fossil material examinedWe examined 44 fossil specimens from 19 localities in the
Campanian Dinosaur Park Formation that were deposited inthe Royal Tyrrell Museum (TMP), Drumheller, Alberta (Brink-man and Neuman 2002). The specimens are TMP 86.7.65;86.10.61; 86.11.70; 86.22.69; 86.37.85; 86.53.81; 86.60.32a;86.171.36a, 86.171.36b; 86.177.17; 86.179.6; 86.180.5a,86.180.5b; 86.193.9; 86.194.12; 86.195.9; 86.198.42;86.215.21; 86.220.17; 86.242.68a, 86.242.68b; 87.29.73;87.32.41; 87.158.29a, 87.158.29b, 87.158.29c, 87.158.29d;90.113.57a; 93.93.94; 93.93.95a, 93.93.95b; 93.143.4;95.147.2; 95.163.44a, 95.163.44b; 95.168.47; 95.171.10;95.182.34; 97.114.26; 2000.6.3; and four specimens withoutaccession numbers. All of the samples were collected usingscreenwashing techniques; screenwashing reduces size-relatedbias that would be present if the material was surface col-lected (Brinkman and Neuman 2002). The fossil centra didnot appear distorted so we assume there was no bias in ourmeasurements. Hiodontid centra have characteristic featuresthat permit them to be identified. The hiodontid atlas is dis-tinctive and identified as having a platycoelous anterior ar-ticular surface that is rough and quadrilobate, a tripartiteanterior articular surface, shallow neural arch articular facetsthat are located on the posterior half of the centrum, and a
pair of ventral parasagittal ridges that are expressed on theanterior end of the centrum (Brinkman and Neuman 2002;Hilton 2002: figs. 66, 68, 69). The precaudal centra are iden-tified as having shallow neural arch facets that are oval inshape, rib articular facets that are similar in size and positionrelative to the transverse process, and a loose woven net-work of bone covering the ventral and lateral surfaces of thecentrum (Brinkman and Neuman 2002).
Dried skeletal material examinedCentra from 12 dried skeletons of H. alosoides were ex-
amined: two skeletons from the Natural History Museumand Biodiversity Research Center (KU), University of Kansas,12728 and 12730; and 10 skeletons from the Bell Museum ofNatural History (JFBM), University of Minnesota, 38800, 40126,41718, 43306, 43308, 43310, 43311, 43312, 43313, and 43314.Centra from four skeletons of H. tergisus were also examined(JFBM 41120, 43320, 43331, 43332). The Hiodon skeletonscame from seven localities with mean annual temperatures rang-ing from 4.5 to 12.8 °C (Appendix A).
Populations examinedSexual size dimorphism data were from four populations
listed in Kennedy and Sprules (1967): Saskatchewan Delta,Manitoba; Lake Winnipegosis, Manitoba; Lake Claire, Alberta;and Sandy Lake, Ontario. Maximum total length (MTL) datawere from 10 populations including the four previouslylisted: Red Lakes, Minnesota (Grosslein and Smith 1959;Carlander 1969); Gavins Point, Missouri River, South Dakota(Claflin 1963); Fort Randall, South Dakota (Carlander 1969);Oahe, South Dakota (Carlander 1969); Lake Texoma,Oklahoma (Martin 1954; Carlander 1969); and Verdigris River,Oklahoma (Jenkins and Finnel 1957; Carlander 1969).
Annular growth criteriaIn growth studies of extant Hiodontidae, scales and opercula
are typically aged, and growth can be estimated (Carlander1969; Donald et al. 1992). However, Newbrey and Wilson(2005) reported that centra can also be used to estimate ageand longevity of extant and fossil Hiodontidae. Centra wereselected because they are the only ageable hiodontid struc-tures represented in the Dinosaur Park Formation. In ourstudy, we examined centra from the atlas to the last caudalcentrum; no fossil ural centra were available. We countedand summed the number of annuli to determine the age ofeach individual. Annuli on the fossil centra were character-ized by a dark grey band or a raised circular ridge (Newbreyand Wilson 2005) (Figs. 1, 2). To highlight the relief of an-nular features such as ridges, light was angled at 45° acrossthe surface of each centrum (Newbrey and Wilson 2005).Annuli on extant centra were defined as having translucentbands (i.e., winter growth) that were preceded by opaqueraised circular ridges with a finely papillose surface of sum-mer growth (Newbrey and Wilson 2005).
To measure growth on centra, the center of the notochordalforamen was marked using an ocular grid and radial distance(RD mm) to each sequential annular mark (i.e., toward thedistal margin) was determined to the nearest 0.01 mm usinga digital micrometer under a binocular dissecting microscope(Newbrey and Wilson 2005). No consistent orientation of
© 2007 NRC Canada
722 Can. J. Earth Sci. Vol. 44, 2007

the centra was used for RD measurements, as many Creta-ceous centra were partially incomplete. Newbrey and Wilson(2005) determined that the methodology has a mean mea-surement error of 0.06 ± 0.01 s.e. mm.
We compared estimated age, size, and longevity of extantHiodon centra to those of the Cretaceous centra. The fossilgrowth data were graphed and visually examined for discretegrowth pattern groups; groups were called growth pattern 1,growth pattern 2, etc. T-tests were then used to determinewhether the groups varied significantly in centrum size. Fossilcentra at age 3 years were also compared with extantcentrum RD at age 3 years using a T-test to examine for dif-ferences in size. All tests were performed with SYSTAT®
version 11.0 (2004) and test statistics or parameters wereexamined with α = 0.05.
Comparative methodology
Sexual size dimorphismGender-based size separation of Hiodon may suggest that
separate distributions in the fossil record could be the resultof sexual size dimorphism. Age and TL data were graphedfor four extant populations with gender-based data forH. alosoides listed in Kennedy and Sprules (1967) and Scottand Crossman (1973). We examined the gender-based growthdata for significant and biologically realistic parameters us-ing a von Bertalanffy (1938) growth curve:
TL e ( 0t
K t tL= −∞− −[ ])1
where the parameters: TLt = total length (mm), at t (age inyears); L∞ = theoretical maximum TL; K = the Brody growthcoefficient; t = time (age in years); and t0 = time at age zero(time at theoretical zero length). Gender-based data that ex-hibited characteristics of systematic aging error were elimi-nated from the data set. The von Bertalanffy equation inSYSTAT® (2004) was used to statistically examine the confi-dence limits associated with theoretical maximum size andgrowth parameters. Valid age assignments typically producerealistic and (or) significant maximum size (i.e., L∞) and Kgrowth parameters at the 95% confidence interval (Burnham-Curtis and Bronte 1996; Newbrey and Bozek 2003; Newbreyand Wilson 2005). If both the L∞ and K were significant, thedata were used in the analysis. If L∞ was significant and K wasnot, the data set was used, provided that the regression lineproduced a good fit to the data and K had a biologically realis-tic value. Significant growth data were graphed and qualita-tively analyzed for discrete gender-based size distributions.
Since temperature-influenced variation could result in non-discrete distributions of male and female sizes, MTL was re-gressed against mean annual temperature (MAT) to ascertainwhether there were significant influence. A significant influ-ence of temperature would result in non-discrete sexual groupsin the fossil record because the male and female data would
© 2007 NRC Canada
Newbrey et al. 723
Fig. 1. A hiodontid centrum (TMP 86.198.42) from the DinosaurPark Formation; five seasons of growth are indicated by arrows;filled circles indicate the points of measurement; (a) anterior viewfrom which the measurements were made; (b) circular ridges (i.e.,summer growth) are highlighted with angled light. The figures aremodified from Newbrey and Wilson (2005, fig. 5).
Fig. 2. A hypothetical longitudinal section through a centrum ofextant Hiodon in lateral view, anterior oriented toward the top,showing the pattern of annuli. Magnification is about ×40. Thefigure is taken from Newbrey and Wilson (2005, fig. 3).

overlap and form a continuous range of responses. Popula-tions of H. alosoides were examined from published litera-ture to acquire data for a comparative examination of MTL.The MTL from a population (n = 10) was used because sex-ually dimorphic TL data were less common (n = 4) in thepublished literature. Total length (TL) is the distance fromthe anterior-most tip of the head to the vertical plane of theposterior caudal fin tips (Hubbs and Lagler 1964). In somecases, fork length or standard length data were converted toTL by the conversion formulas provided by Carlander (1969).Maximum TL refers to the single largest-sized individual re-corded for a population. The MTL in a population was notedfor H. alosoides across its range and compared with MAT byregression analysis. Mean annual temperature (MAT) was usedto provide a standardized, independent variable for comparisonwith MTL. Mean annual temperature data were obtained fora location near each population using the WorldClimate da-tabase (Hoare 2003).
Centrum size among extant hiodontidsTo examine and interpret biologically significant variation in
RD of Cretaceous centra, differences in variation of centrumdiameter among extant species were examined using a T-test.The diameter was measured for each centrum from the atlasto the last preural centrum. The greatest lateral width wasquantified from the anterior face of each centrum, with theexception of the atlas, which was measured on the posteriorend. Only adult specimens were used to standardize varia-tion of centrum size. Adult ages were defined by examiningdata from Carlander (1969) and Kennedy and Sprules (1967)for an inflection (i.e., �70% of von Bertalanffy calculatedMTL) in growth; the fish selected had to be at least 5 years oldfor inclusion in the analysis. The inflection in growth usuallyappears at sexual maturity and is a diversion of energy fromsomatic growth to gonadal growth (Carlander 1969). A T-testwas used to examine the difference of mean centrum diameterbetween H. alosoides and H. tergisus individuals; each sample(n) was the mean of an individual (i.e., mean consisting ofcentra from atlas to the last preural centrum).
To determine whether temperature might have influencedcentrum diameter and whether it was necessary to furtherconstrain variation in the data set, we examined the effectsof MAT on MTL as described above. Maximum TL wasused as a proxy to determine whether centrum diameter wasaffected by MAT. Centrum size was assumed to be corre-lated with TL because sizes of other calcified structures arecorrelated with TL (Casselman 1996).
Variation in centrum sizeTo define the basis for comparison and interpretation of
centrum variation in Cretaceous hiodontids, the coefficientof variation (CV) of centrum diameter (i.e., extant) or RD(i.e., fossils) was used to identify the relative amount of vari-ation observed:
CV = 1
2d
n∑
−x
where CV = coefficient of variation; d = deviation from themean for each case; n = number in the sample; and x = samplemean. The CV of centrum distance (i.e., either centrum ra-
dial distance or diameter) is the standard deviation (S.D.;i.e., how tightly the data are clustered around the mean) ofcentrum distance divided by the mean centrum distance. TheCV becomes larger in value as the variation in the data in-creases but it is indifferent to the magnitude of data values(Fig. 3). If significant differences occur between the centrumdiameters of extant species, then the use of CV would haveinterpretative value for comparison to the fossil CV.
We used the relative magnitude of CV values to compareCretaceous hiodontids to extant H. alosoides and H. tergisus.If the Cretaceous hiodontids represented one species then itsCV should be less than that observed for the two extant speciescombined. The CV for Cretaceous Hiodontidae was calcu-lated from RD data at age 3 (n = 30). Whereas the CVwould be independent of the magnitude of size of centra andthe absolute values of temperature among the data sets,variation in MAT among the two data sets must be equiva-lent (e.g., both data sets vary by 6 °C). We determined thatthe MAT range for the Dinosaur Park Formation was 6 °C(He et al. 2005, figs. 3, 7: using Didymoceras stevensoni,Exiteloceras jenneyi (max. = 21 °C), and D. nebrascense(min. = 15 °C)) before we calculated the CV for extant spe-cies. To standardize variation, we included only specimensfrom extant populations within a temperature range of about6 °C. Extant hiodontid CV was calculated from centrum di-ameters for both species and sexes (i.e., 13 individuals),from a MAT range of 6.5 °C, and from all ages ≥ 5 years old(n = 38 centra). Four centra were used from each individual,including an atlas, a randomly selected abdominal centrum,a randomly selected caudal centrum, and the last preuralcentrum. Sample sizes were kept equal to minimize the ef-fects of unequal sample size on the calculation of S.D.;therefore, 13 centra from the pool of centra were again ran-domly selected for removal to limit the number to 38. Forcomparison, the CV was also calculated for each species andfor each individual (N = 13).
© 2007 NRC Canada
724 Can. J. Earth Sci. Vol. 44, 2007
Fig. 3. Comparison of the coefficients of variation (CV) for severalhypothetical data sets; all N = 6. The CV is influenced by thevariability of the data around the mean. The raw data used to cal-culate each CV are depicted next to the CV value. The number inparentheses is the difference between the minimum and maximumvalues. One CV value (i.e., 0.535) was replicated by three data sets.

Centrum size distributionTo examine the potential cause for the subgroups within
the Cretaceous growth patterns, we compared probabilitydistributions generated from extant centra to the distribu-tion of 30 fossil centra (i.e., centra <0.550 mm RD at age3). Two random distributions of 30 centra were generatedfor comparison to the fossils: (1) consisted of both speciesof Hiodon (n = 778 centra) to examine for the effects ofmultiple species, and (2) consisted of H. alosoides centra(n = 562) to examine for the effects of common centrumsizes. The fossil distribution was compared with those ofthe extant distributions by a χ2 goodness-of-fit test; α wascorrected for multiple comparisons (α = 0.05/2 = 0.025) us-ing a Bonferroni correction (Neter et al. 1996). It was pre-dicted that the size distribution of centra in individuals ofH. alosoides may be similar to the size distribution of theCretaceous hiodontids, which would suggest that distinctgroups were an artifact of finding common centrum sizes(i.e., compared with other sizes from the same individual)and not of two species.
The distributions of the extant data were separated intosmall and large centrum sizes; large extant centra have a RD>4.8 mm. Large fossil centra have a RD >0.375 mm but<0.550 mm. Data consisted of centra from the atlas to the lastpreural centrum. We assumed each Cretaceous centrum wasfrom a separate individual. If a fossil locality produced morethan one centrum of the same age, we randomly selected onecentrum to be retained in the data set to conform the data toour assumption and to avoid potential bias in the distribution.
Results
Growth patternsAge was estimated for 44 centra from the Dinosaur
Park Formation (Appendix B). The Cretaceous hiodontidsattain longevities up to at least 7 years old (TMP 86.37.85)(. In our sample of dried museum specimens, H. alosoidesexhibits ages up to 11 years old (JFBM 43308) and H.tergisus exhibits ages up to 12 years old (JFBM 43320)(Fig. 4a). The growth patterns of Cretaceous centra arerelatively linear compared with those of extant hiodontids(Fig. 4a). Extant Hiodon centrum growth appears to slow afterage 7. The Cretaceous centra (x = 0.46 ± 0.02 RD, n = 38) atage 3 are significantly smaller than those of extant individuals(x = 1.09 ± 0.04 RD, n = 16) of the same age (t = –14.714,d.f. = 20.9, p < 0.001). d.f. is the degree of freedom, and p isthe probability of a Type I error.
Growth trajectories of Cretaceous centra show two majorgrowth profiles (i.e., growth patterns 1 and 2) (Fig. 4a). Themajor division between the two patterns occurs after age 2(Fig. 4a). The profiles that form each growth pattern showsome overlap prior to age 2 and are difficult to distinguish inan age/frequency analysis of age class 2 (Fig. 4b). The inter-face between the two growth patterns at 2 years old occursat about 0.4 mm RD. At age 3, the distinction is more appar-ent with no individuals occurring between the sizes of 0.51and 0.56 mm RD (Fig. 4c). Centra of growth pattern 1 at age3 have a mean size of 0.63 ± 0.02 s.e. RD, but exhibit agesup to 7 years old (TMP 86.37.85) with a RD of 1.03 mm(Fig. 4a). Centra of growth pattern 2 at age 3 have a meansize of 0.41 ± 0.01 s.e. RD, but exhibit ages up to 6 years
old (TMP 2000.6.3) with a RD of 0.55 mm (Fig. 4a). Themean difference in centrum size between growth patterns 1and 2 is significant (t = 8.509, d.f. = 10.3, p < 0.001) at age 3.Growth pattern 2 within age class 3 consists of 80% of thecentra attributable to Cretaceous Hiodontidae. In addition, 44%of the localities that yielded hiodontid centra in the DinosaurPark Formation also produced both types of growth patterns.
Within each of the major growth patterns there also appearto be two subgroups (Figs. 4a, 4c). Within each subgroup,the growth profiles intermingle and cross over each otherprior to age 3, suggesting the major growth patterns shouldnot be further subdivided.
The modal age class from the Dinosaur Park Formationoccur at 3 years old (Fig. 5a). Abundance decreases at olderages, which indicates that old individuals are rare (Fig. 5a).The modal age classes for growth pattern 1 occur at 2 and5 years old (Fig. 5b). However, the modal age class forgrowth pattern 2 is 3 years old (Fig. 5c). To explore the po-tential causes of the various growth patterns and subgroupsof Cretaceous hiodontids and to test the null hypothesis ofa single fossil taxon, the effects of sexual size dimorphismand the effects of multiple species on the variation and dis-tribution of centrum size are examined.
Effects of sexual size dimorphismFour populations with gender-based data (Kennedy and
Sprules 1967) were analyzed using a von Bertalanffy growthequation, and three populations have at least one significantgrowth parameter (Appendix C). Concerning the Sandy Lakepopulation, only the males have significant growth parameters.Of the four populations analyzed, we corroborate that male andfemale H. alosoides are sexually size dimorphic; females attainnearly 480 mm TL while males only attain up to about400 mm TL (Fig. 6a). The gender-based size distinctions occurwithin populations (Fig. 6b), but among populations maleand female sizes completely overlap. Since there are so fewpopulations of Hiodon with gender-based growth data, MTLis used as a proxy to determine whether TL is correlatedwith MAT. For H. alosoides, MTL is negatively correlatedwith MAT (y = –6.873x + 426.284, R2 = 0.559, p = 0.013).
Variation in size of fossil and extant centraWhen compared with the diameter of the first 41 posterior
centra, the atlas of H. alosoides is more similar in diameter(x = 0.032 CV) than that of H. tergisus (x = 0.072 CV).There is overlap in the size of the atlas and preural centrabetween species of Hiodon (Fig. 7a). The mean centrum di-ameter (i.e., posteriormost preural centrum) of H. alosoides(x = 5.2 ± 0.13 s.e.) is significantly larger than that ofH. tergisus (x = 4.2 ± 0.18 s.e.) for ages 5 and older and forMAT’s from 6.3–7.4 °C (t = 4.381, d.f. = 6.7, p = 0.004).
Individuals of the two species of Hiodon (ages ≥5 years,6.5 °C MAT range) combined have a CV 22% smaller thanthat for all of the hiodontid fossils at age 3, which were alsoestimated to have lived within a MAT range of �6 °C (Table 1;Fig. 7b). The CV for individuals of Hiodon ranges from0.041 to 0.083 CV (Fig. 7b). The total CV for each extantspecies ranges from 0.097 to 0.101 (Table 1; Fig. 7b). Bycomparison, the CV for Cretaceous growth pattern 1 is 0.103and for growth pattern 2, 0.142.
© 2007 NRC Canada
Newbrey et al. 725

Distribution of centrum sizesIndividuals of extant species of Hiodon of ages 5 and
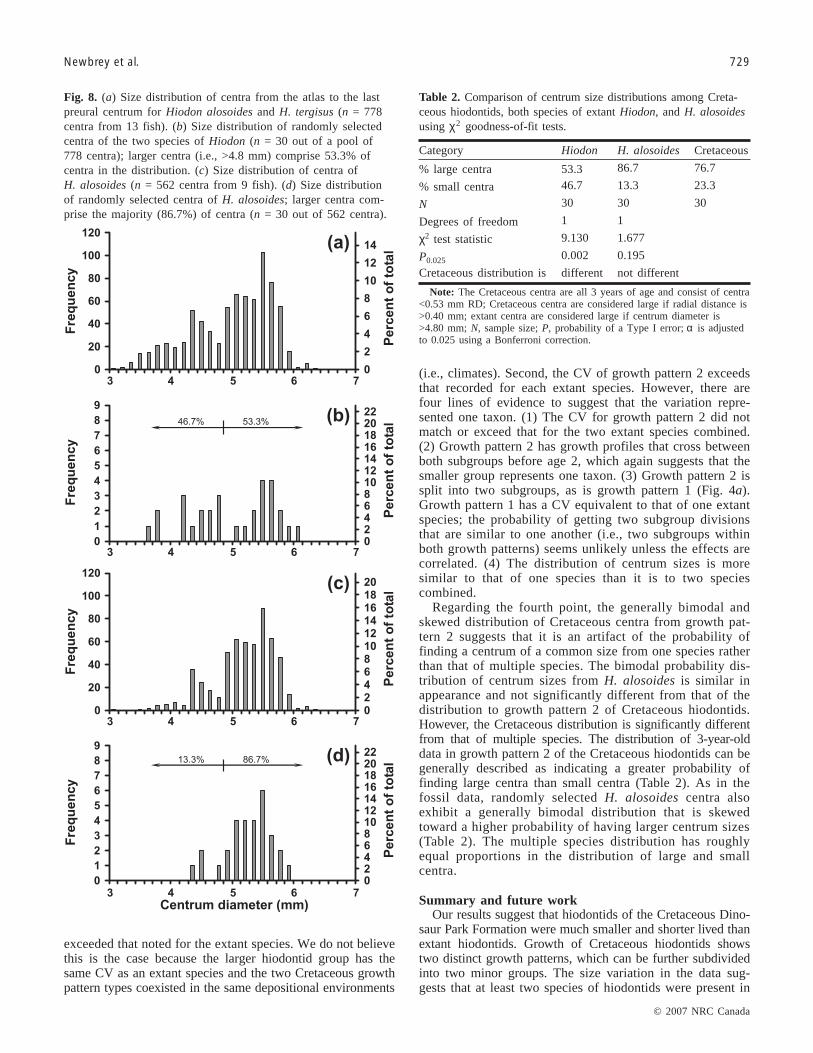
older and from a MAT range of 5.4 °C have centra (i.e., at-las to posteriormost preural centrum) that range in sizefrom 2.9 to 6.3 mm in diameter (n = 778 centra from 13fish; Fig. 8a). For both species, the distribution of size isgenerally bimodal and slightly skewed toward larger sizes(i.e., 64.6% of centra with a diameter of >4.8 mm; Fig. 8a).
Randomly selected centra produce a distribution of large andsmall centrum sizes that is roughly equivalent in proportion(Fig. 8b; Table 2).
Extant H. alosoides from ages 5 and older, and MATrange of 5.4 °C, have centra (i.e., atlas to posteriormostpreural centrum) that range from 2.9 to 6.3 mm diameter(n = 562 centra from 9 fish; Fig. 8c). The random distribu-tion of sizes of H. alosoides centra (n = 30 out of 562
© 2007 NRC Canada
726 Can. J. Earth Sci. Vol. 44, 2007
Fig. 4. (a) A composite of growth curves from individual centra of Cretaceous hiodontids (i.e., grey and black lines) and extantHiodon alosoides and H. tergisus (i.e., open symbols). The extant growth data were taken from Newbrey and Wilson (2005). Cretaceoushiodontids are depicted by two shades of grey because of minimal overlap in radial distance (RD mm), which permits the hypothesisof two growth patterns: growth patterns 1 and 2. (b) The distribution of centrum RD and the percent of the size class for age class 2.(c) The distribution of centrum RD and the percent of the size class for age class 3. The broken lines indicate the cutoff between twohypothesized growth patterns. The percentages indicate the totals for the corresponding size range within growth pattern 2.

centra) is generally bimodal and skewed toward larger sizes(i.e., 86.7% of centra with a diameter of >4.8 mm; Fig. 8d;Table 2).
Similar to H. alosoides, larger Cretaceous centra from thedistribution of age class 3, growth pattern 2, comprise the ma-jority of the centra (Table 2; Fig. 4c; i.e., 77% of centra witha RD >0.40 and <0.53 mm). Also similar to H. alosoides,smaller Cretaceous centra of growth pattern 2 from the distri-bution comprise the minority of the centra in the size distribu-tion (Table 2; Fig. 4c; 23%). A χ2 goodness-of-fit test indicatesthat the distribution for centra of Cretaceous growth pattern 2 isno different (p = 0.195) from that of one species, H. alosoides,but significantly different (p = 0.002) from the distribution ofboth extant species of Hiodon (Table 2).
Discussion
The hiodontid centra from the Dinosaur Park Formationare significantly smaller than those of extant hiodontids atadult sizes. Additionally, the Cretaceous specimens appear
to have a longevity of approximately half that of extantHiodon. The smaller sizes and shorter life spans suggest thata shift toward larger, longer-lived hiodontids must have oc-curred sometime after the Campanian.
The clustering of growth profiles and the distribution ofcentrum size within two age classes qualitatively suggest twomajor groups or four minor groups of Cretaceous hiodontids(Fig. 4a). Prior to this study, we expected to find evidencefor a single species based on the morphological similarity offossil centra (Brinkman and Neuman 2002). However, thedata exhibit two major groups that do not overlap in sizeexcept along their interface at age 1 from 0.25 to 0.27 mmRD. In comparison, minor groups have growth profiles thatoverlap. We infer that two factors may have played a role inproducing the Cretaceous hiodontid growth patterns: (1) sex-ual size dimorphism; (2) intra- or inter-specific variation incentrum size.
Effects of sexual size dimorphismPopulations of extant Hiodon are sexually dimorphic in a va-
riety of ways (e.g., anal fin shape and structure, Hilton 2002),including TL as shown in Kennedy and Sprules (1967). Ini-tially, we predicted that sexual dimorphism might explain thedifference in the size distribution of Cretaceous hiodontids.To explore the effects of sexual dimorphism in Cretaceoushiodontid data, we examined the gender-based difference in
© 2007 NRC Canada
Newbrey et al. 727
Fig. 5. (a) Age/frequency histogram of all centra of Hiodontidaefrom the Cretaceous Dinosaur Park Formation (n = 44).(b) Age/frequency histogram of centra hypothesized as growthpattern 1 (n = 12). (c) Age/frequency histogram of centra hy-pothesized as growth pattern 2 (n = 32).
Fig. 6. (a) The relationship between total length (TL mm) and agefor female and male Hiodon alosoides, which depicts overlap in TLbetween the sexes. (b) There is a significant relationship (p = 0.010)between maximum TL (MTL) and mean annual temperature (MAT)for H. alosoides, which helps to describe variation in TL. The opendiamonds represent data used in the regression analysis.

size at a given age for extant taxa and confirmed that temper-ature plays a confounding role in interpretation. Specifically,the sizes of males and females greatly overlap when the datasets are combined, and temperature significantly correlateswith variation in MTL. Furthermore, MAT varied at least
6 °C during the deposition of the Dinosaur Park Formation(He et al. 2005). The effect of MAT variation on Cretaceoushiodontids should result in a continuous distribution of in-distinguishable gender-size data, as seen in the Kennedy andSprules (1967) TL data in Fig. 6a rather than discrete groupsas seen in age class 3 (Fig. 4c).
Effects of variation and distribution of centrum sizeThe major size groups of Cretaceous centra (i.e., Fig. 4a)
appear to be a result of different growth patterns producedby different species. Variation was quantified for both spe-cies in Hiodon to test the hypothesis that the Cretaceouscentra represented one taxon as the morphological data sug-gested. To interpret centrum variation, the sizes of centrawere quantified from adult individuals of each extant species,and within a 1 °C range to control for the effects of tempera-ture. The centra of H. alosoides and H. tergisus within a1 °C range are significantly different in size, demonstratingthat meaningful variation occurs in size among species. TheCV from extant centra across a 6.5 °C MAT range was usedto match the variation related to the MAT range (He et al.2005) calculated for the time of deposition of the DinosaurPark Formation. We assume the difference between absolutetemperature among localities of Cretaceous and extant centrawill not influence the CV as the relationship between MTLand MAT appears to be linear (Fig. 6B). The variation (i.e.,CV) for all of the Cretaceous hiodontids exceeds the varia-tion calculated for the two extant species combined, whichsuggests that at least two hiodontid taxa inhabited the Dino-saur Park Formation depositional environment. In addition,the two groups of Cretaceous hiodontid growth profiles inFig. 4a are also significantly different in size, further corrob-orating that at least two Cretaceous taxa were present.
Since there is a significant difference in size of Cretaceouscentra, we calculated the CV for each type of Cretaceousgrowth pattern. The results show that growth pattern 1 hasvariation comparable to that of an extant species. However,growth pattern 2 has variation that exceeds that for one extantspecies, but is less than the CV for the two extant speciescombined. The large amount of variation within growth pat-tern 2 can be explained in two ways: (1) the temperaturerange exceeded our proxy used for the Dinosaur Park For-mation (i.e., 6 °C MAT range), or (2) growth pattern 2 couldbe a result of two species. First, if the temperature fluctuatedwithin a range greater than 6 °C then the variation may have
© 2007 NRC Canada
728 Can. J. Earth Sci. Vol. 44, 2007
Fig. 7. (a) The relationship between centrum diameter and centrumsequential order for Hiodon alosoides (black lines) and H. tergisus(grey lines) from 6.3 to 12.8 °C mean annual temperature (MAT)range. Each line represents an individual and includes centra fromthe atlas to ural 2. One vertebral column of H. tergisus was completebut only partially articulated and is depicted by a short caudalsequence. (b) The coefficient of variation (CV) of the hiodontidsfrom the Cretaceous Dinosaur Park Formation is greater than thatfor extant Hiodon. The extant CV includes centra from the atlas tothe last preural centrum (n = 13) within a 6.5 °C MAT range.Open symbols represent the CV from extant individuals.
Statistic Cretaceous Hiodon H. alosoides H. tergisus
Coefficient of variation 0.23 0.18 0.10 0.10
N 38 38 562 213
Standard deviation 0.11 0.86 0.50 0.42
Mean 0.46 4.84 5.19 4.20
Minimum 0.29 2.91 2.91 3.24
Difference (= max. – min.) 0.43 3.42 3.42 2.28
Number of fish 13 9 4
MAT range (°C) ~6 6.5 5.4 0.9
Note: Cretaceous hiodontid centrum size is measured in radial distance (mm) and extant Hiodon centrumsize is the diameter (mm). MAT, mean annual temperature; max., maximum; min., minimum; N, sample size.
Table 1. Comparison of the coefficient of variation and other relevant information between centrafrom the Cretaceous Dinosaur Park Formation and those of extant Hiodon.
exceeded that noted for the extant species. We do not believethis is the case because the larger hiodontid group has thesame CV as an extant species and the two Cretaceous growthpattern types coexisted in the same depositional environments
(i.e., climates). Second, the CV of growth pattern 2 exceedsthat recorded for each extant species. However, there arefour lines of evidence to suggest that the variation repre-sented one taxon. (1) The CV for growth pattern 2 did notmatch or exceed that for the two extant species combined.(2) Growth pattern 2 has growth profiles that cross betweenboth subgroups before age 2, which again suggests that thesmaller group represents one taxon. (3) Growth pattern 2 issplit into two subgroups, as is growth pattern 1 (Fig. 4a).Growth pattern 1 has a CV equivalent to that of one extantspecies; the probability of getting two subgroup divisionsthat are similar to one another (i.e., two subgroups withinboth growth patterns) seems unlikely unless the effects arecorrelated. (4) The distribution of centrum sizes is moresimilar to that of one species than it is to two speciescombined.
Regarding the fourth point, the generally bimodal andskewed distribution of Cretaceous centra from growth pat-tern 2 suggests that it is an artifact of the probability offinding a centrum of a common size from one species ratherthan that of multiple species. The bimodal probability dis-tribution of centrum sizes from H. alosoides is similar inappearance and not significantly different from that of thedistribution to growth pattern 2 of Cretaceous hiodontids.However, the Cretaceous distribution is significantly differentfrom that of multiple species. The distribution of 3-year-olddata in growth pattern 2 of the Cretaceous hiodontids can begenerally described as indicating a greater probability offinding large centra than small centra (Table 2). As in thefossil data, randomly selected H. alosoides centra alsoexhibit a generally bimodal distribution that is skewedtoward a higher probability of having larger centrum sizes(Table 2). The multiple species distribution has roughlyequal proportions in the distribution of large and smallcentra.
Summary and future workOur results suggest that hiodontids of the Cretaceous Dino-
saur Park Formation were much smaller and shorter lived thanextant hiodontids. Growth of Cretaceous hiodontids showstwo distinct growth patterns, which can be further subdividedinto two minor groups. The size variation in the data sug-gests that at least two species of hiodontids were present in
© 2007 NRC Canada
Newbrey et al. 729
Fig. 8. (a) Size distribution of centra from the atlas to the lastpreural centrum for Hiodon alosoides and H. tergisus (n = 778centra from 13 fish). (b) Size distribution of randomly selectedcentra of the two species of Hiodon (n = 30 out of a pool of778 centra); larger centra (i.e., >4.8 mm) comprise 53.3% ofcentra in the distribution. (c) Size distribution of centra ofH. alosoides (n = 562 centra from 9 fish). (d) Size distributionof randomly selected centra of H. alosoides; larger centra com-prise the majority (86.7%) of centra (n = 30 out of 562 centra).
Category Hiodon H. alosoides Cretaceous
% large centra 53.3 86.7 76.7
% small centra 46.7 13.3 23.3
N 30 30 30
Degrees of freedom 1 1
χ2 test statistic 9.130 1.677
P0.025 0.002 0.195
Cretaceous distribution is different not different
Note: The Cretaceous centra are all 3 years of age and consist of centra<0.53 mm RD; Cretaceous centra are considered large if radial distance is>0.40 mm; extant centra are considered large if centrum diameter is>4.80 mm; N, sample size; P, probability of a Type I error; α is adjustedto 0.025 using a Bonferroni correction.
Table 2. Comparison of centrum size distributions among Creta-ceous hiodontids, both species of extant Hiodon, and H. alosoidesusing χ2 goodness-of-fit tests.

the Dinosaur Park Formation because the variation in thefossils exceeds that of two extant species combined. Sexualsize dimorphism did not produce the two growth patterns be-cause (1) H. alosoides MTL is significantly correlated withtemperature, and (2) the paleotemperature in the depositionalenvironment fluctuated about 6 °C MAT resulting in contin-uous growth variation. The minor subgroups are concludedto be an artifact of finding common centrum sizes becausethe size distribution of the centra is not significantly differ-ent from that of a single species but is significantly differentfrom that of multiple species. Growth pattern 1 represents ataxon that lived up to at least 7 years old and growth pattern2 represents a taxon that lived up to at least 6 years old butwas smaller than that representing growth pattern 1. SinceH. alosoides is smaller in warmer climates and because Creta-ceous hiodontids seem to be small, we hypothesize that Ceno-zoic cooling may have favored evolution toward larger centraand body sizes. Future examination of Eocene hiodontidscould help elucidate this relationship. The techniques andstatistical tests used in this study have applicability for studyof fossil centra of other taxa.
Acknowledgments
Don Brinkman, Eric Hilton, and Hans-Dieter Sues aregratefully acknowledged for providing reviews and helpfulcomments on the manuscript. Don Brinkman, Royal TyrrellMuseum, also provided specimens of Campanian age forexamination, a taxonomic key used to identify centra, andhousing during research visits. Andrew Bently, Universityof Kansas, and Andrew Simons, University of Minnesota,provided access to extant hiodontid specimens. Fellowshipswere provided to Michael Newbrey by North Dakota WaterResources Research Institute, North Dakota State University,supported by the United States Geological Survey andNorth Dakota EPSCoR, supported by the National ScienceFoundation.
References
Brinkman, D.B., and Neuman, A.G. 2002. Teleost centra from upper-most Judith River Group (Dinosaur Park Formation, Campanian)of Alberta, Canada. Journal of Paleontology, 76: 138–155.
Burnham-Curtis, M.K., and Bronte, C.R. 1996. Otoliths reveal adiverse age structure for humper lake trout in Lake Superior.Transactions of the American Fisheries Society, 125: 844–851.
Carlander, K.D. 1969. Handbook of freshwater fishery biology.Vol. I. Iowa State University Press, Ames, Iowa.
Casselman, J.M. 1996. Age, growth and environmental require-ments of pike. In Pike Biology and Exploitation. Edited by J.F.Craig. Chapman and Hall, London. pp. 69–101.
Cavender, T.M. 1966. Systematic position of the North AmericanEocene fish, “Leuciscus” rosei Hussakof. Copeia, 1966: 311–320.
Claflin, T.O. 1963. Age and growth rate of goldeye, Hiodon alosoides(Rafinesque), in the Missouri River. M.A. thesis, University ofSouth Dakota, Vermillion, S.D.
Donald, D.B., Babaluk, J.A., Craig, J.F., and Musker, W.A. 1992. Eval-uation of the scale growth and operculum methods to determine ageof adult goldeyes with special reference to a dominant year-class.Transactions of the American Fisheries Society, 121: 792–796.
Grande, L. 1979. Eohiodon falcatus, a new species of hiodontid(Pisces) from the late Early Eocene Green River Formation ofWyoming. Journal of Paleontology, 53: 103–111.
Grosslein, M.D., and Smith Jr., L.L. 1959. The goldeye, Amphiodonalosoides (Rafinesque), in the commercial fishing of the RedLakes, Minnesota. US Fish and Wildlife Service Bulletin, 60(157):33–41.
He, S., Kyserb, T.K., and Caldwell, W.G.E. 2005. Paleoenvironmentof the Western Interior Seaway inferred from δ18O and δ13C val-ues of molluscs from the Cretaceous Bearpaw marine cyclothem.Palaeogeography, Palaeoclimatology, Palaeoecology, 217: 67–85.
Hilton, E.J. 2002. Osteology of the extant North American fishes ofthe genus Hiodon Lesueur, 1818 (Teleostei: Osteoglossomorpha:Hiodontiformes). Fieldiana, Zoology, New Series No. 100, Publi-cation 1520.
Hoare, R. 2003. WorldClimate [online]. Available from www.worldclimate.com [accessed 10 June 2006].
Hubbs, C.L., and Lagler, K.F. 1964. Fishes of the Great Lakes Re-gion. The University of Michigan Press, Ann Arbor, Mich.
Jenkins, R.M., and Finnel, J.C. 1957. The fishery resources of theVerdigris River in Oklahoma. Oklahoma Fishery Research Lab-oratory Report, 59: 1–46.
Kennedy, W.A., and Sprules, W.M. 1967. Goldeye in Canada. Fish-eries Research Board of Canada Bulletin, 161: 1–45.
Lee, D.S., Gilbert, C.R., Hocutt, C.H., Jenkins, R.E., McAllister, D.E.,and Stauffer, Jr., J.R. 1980. Atlas of North American freshwaterfishes. North Carolina State Museum of Natural History, Raleigh.Publication of the North Carolina Biological Survey, No. 1980–12.
Li G.-Q. 1987. A new genus of Hiodontidae from Louzigou Basin,east Jilin. Vertebrata PalAsiatica, 25: 91–107.
Li G.-Q., and Wilson, M.V.H. 1999. Early divergence of Hiodonti-formes sensu stricto in East Asia and phylogeny of some LateMesozoic teleosts from China. In Mesozoic Fishes—Systematicsand Fossil Record. Edited by G. Arratia and H.-P. Schultze. VerlagDr. Friedrich Pfeil, München, Germany. pp. 369–384.
Li G.-Q., Wilson, M.V.H., and Grande, L. 1997. Review of Eohiodon(Teleostei: Osteoglossomorpha) from western North America, witha phylogenetic reassessment of Hiodontidae. Journal of Paleontol-ogy, 71: 1109–1124.
Martin, M. 1954. Age and growth of the goldeye, Hiodon alosoides(Rafinesque), of Lake Texoma, Oklahoma. Proceedings of theOklahoma Academy of Science, 33: 37–49.
Neter, J., Kutner, M.H., Hachtsheim, C.J., and Wasserman, W.1996. Applied Linear Statistical Models. Irwin, Chicago.
Neuman, A.G., and Brinkman, D.B. 2005. Fishes of the fluvialbeds. In Dinosaur Provincial Park. Edited by P.J. Currie andE.B. Koppelhus. Indiana Press, Bloomington, Ind. pp. 167–185.
Newbrey, M.G., and Bozek, M.A. 2003. Age, growth, and mortalityof Joffrichthys triangulpterus (Teleostei: Osteoglossidae) from thePaleocene Sentinel Butte Formation, North Dakota, USA. Journalof Vertebrate Paleontology, 23: 494–500.
Newbrey, M.G., and Wilson, M.V.H. 2005. Recognition of annulargrowth on centra of Teleostei with application to Hiodontidae ofthe Cretaceous Dinosaur Park Formation. In Dinosaur Park Sym-posium. Edited by D.R. Braman, F. Therrien, E.B. Koppelhus,and W. Taylor. Special Publication of the Royal Tyrrell Museum,Drumheller, Alta. pp. 61–68.
Scott, W.B., and Crossman, E.J. 1973. Freshwater fishes of Can-ada. Fisheries Research Board of Canada Bulletin, 184.
Systat Software Inc. 2004. SYSTAT® statistics. Version 11.00.01[computer program]. Systat Software Inc., Richmond, Calif.
von Bertalanffy, L. 1938. A quantitative theory of organic growth.Human Biology, 10: 181–213.
Wilson, M.V.H. 1978. Eohiodon woodruffi n. sp. (Teleostei, Hio-dontidae) from the middle Eocene Klondike Mountain Formationnear Republic, Washington. Canadian Journal of Earth Sciences,15: 679–686.
© 2007 NRC Canada
730 Can. J. Earth Sci. Vol. 44, 2007

Appendix A. Extant Hiodon skeletons
Appendix B. Ages of fossil centra
References
Newbrey, M.G., and Wilson, M.V.H. 2005. Recognition of annulargrowth on centra of Teleostei with application to Hiodontidae ofthe Cretaceous Dinosaur Park Formation. In Dinosaur Park Sym-posium. Edited by D.R. Braman, F. Therrien, E.B. Koppelhus,and W. Taylor. Special Publication of the Royal Tyrrell Museum,Drumheller, Alta. pp. 61–68.
© 2007 NRC Canada
Newbrey et al. 731
MuseumCat.number
Struct.aged
Age(yrs.)
MAT(°C) Locality
Hiodon alosoides (N = 12)KU 12728 Op., C 7 12.8 Kansas River between Linwood and DeSota, Leavenworth-Johnson Counties, KansasKU 12730 Op., C 10 12.8 Kansas River between Linwood and DeSota, Leavenworth-Johnson Counties, KansasJFBM 38800 Op., C 8 4.5 Lake Sakakawea, North DakotaJFBM 40126 Op., C 8 4.5 Lake Sakakawea, North DakotaJFBM 41718 Op., C 8 8.1 Mississippi River at Ford Dam, St. Paul, MinnesotaJFBM 43306 Op., C 10 7.4 Minnesota River, 14 km west of St. Peter, MinnesotaJFBM 43308 Op., C 11 7.4 Minnesota River, 14 km west of St. Peter, MinnesotaJFBM 43310 Op., C 9 7.4 Minnesota River, 14 km west of St. Peter, MinnesotaJFBM 43311 Op., C 9 7.4 Minnesota River, 14 km west of St. Peter, MinnesotaJFBM 43312 Op., C 7 7.4 Minnesota River, 14 km of St. Peter, MinnesotaJFBM 43313 Op., C 8 7.4 Minnesota River, 14 km of St. Peter, MinnesotaJFBM 43314 Op., C 9 7.4 Minnesota River, 14 km of St. Peter, Minnesota
Hiodon tergisus (N = 4)JFBM 41120 Op., C 8 6.3 Black River, WisconsinJFBM 43320 Op., C 12 6.9 Chippewa River, WisconsinJFBM 43331 Op., C 5 7.2 St. Croix River at Franconia, Washington County, MinnesotaJFBM 43332 Op., C 8 7.2 St. Croix River at Franconia, Washington County, Minnesota
Note: C, centrum; Cat., catalog; JFBM, Bell Museum of Natural History; KU, University of Kansas; MAT, mean annual temperature; Op., operculum;Struct., structure; yrs., years.
Table A1. Age data from extant skeletons.
Museum Cat. number Struct. aged Age (yrs.)
Cretaceous Hiodontidae (Dinosaur Park Formation) (N = 44)TMP 86.7.65 C 3TMP 86.10.61 C 3TMP 86.11.70 C 3TMP 86.22.69 C 4TMP 86.37.85 C 7TMP 86.53.81 C 5TMP 86.60.32a C 2TMP 86.171.36a C 4TMP 86.171.36b C 3TMP 86.177.17 C 3TMP 86.179.6 C 2TMP 86.180.5a C 5TMP 86.180.5b C 5TMP 86.193.9 C 3TMP 86.194.12 C 4TMP 86.195.9 C 4TMP 86.198.42 C 5TMP 86.215.21 C 3TMP 86.220.17 C 4TMP 86.242.68a C 3TMP 86.242.68b C 2TMP 87.29.73 C 3TMP 87.32.41 C 2TMP 87.158.29a C 5TMP 87.158.29b C 1TMP 87.158.29c C 4TMP 87.158.29d C 4
Table B1. Age data from hiodontid fossils.Museum Cat. number Struct. aged Age (yrs.)
TMP 90.113.57a C 5TMP 93.93.94 C 2TMP 93.93.95a C 4TMP 93.93.95b C 3TMP 93.143.4 C 3TMP 95.147.2 C 5TMP 95.163.44a C 5TMP 95.163.44b C 6TMP 95.168.47 C 5TMP 95.171.10 C 3TMP 95.182.34 C 3TMP 97.114.26 C 5TMP 2000.6.3 C 6TMP not cat. (Aa) C 4TMP not cat. (Ab) C 5TMP not cat. (Ac) C 3TMP not cat. (Ad) C 4
Note: The ages for seven fossil centra (i.e., TMP 86.53.81, 86.179.6,86.198.42, 90.113.57b, 93.93.94, 95.163.44b, and 2000.6.3), were takenfrom Newbrey and Wilson (2005, figs. 2, 6). Boldfaced catalog numbersrepresent those centra classified as growth pattern 1 (i.e., large type). C,centrum; Cat., catalog; not cat., not cataloged; Struct., structure; TMP,Royal Tyrrell Museum; yrs., years.
Table B1 (concluded).

Appendix C. Hiodon alosoides growth data
References
Carlander, K.D. 1969. Handbook of freshwater fishery biology.Vol. I. Iowa State University Press, Ames, Iowa.
Claflin, T.O. 1963. Age and growth rate of goldeye, Hiodon alosoides(Rafinesque), in the Missouri River. M.A. thesis, University ofSouth Dakota, Vermillion, S.D.
Grosslein, M.D., and Smith Jr., L.L. 1959. The goldeye, Amphiodonalosoides (Rafinesque), in the commercial fishing of the Red Lakes,Minnesota. US. Fish and Wildlife Service Bulletin, 60(157): 33–41.
Jenkins, R.M., and Finnel, J.C. 1957. The fishery resources of theVerdigris River in Oklahoma. Oklahoma Fishery Research Lab-oratory Report, 59, pp. 1–46.
Kennedy, W.A., and Sprules, W.M. 1967. Goldeye in Canada. Fish-eries Research Board of Canada Bulletin, 161: 1–45.
Martin, M. 1954. Age and growth of the goldeye, Hiodon alosoides(Rafinesque), of Lake Texoma, Oklahoma. Proceedings of theOklahoma Academy of Science, 33: 37–49.
Scott, W.B., and Crossman, E.J. 1973. Freshwater fishes of Can-ada. Fisheries Research Board of Canada Bulletin, 184.
© 2007 NRC Canada
732 Can. J. Earth Sci. Vol. 44, 2007
Von B. parameters Von B. parameters 95% C.I.
NStruct.aged Gender
MAT(°C)
MTL(mm)
L(mm) K t0 L (mm) K t0
Lake Claire, Alberta (Kennedy and Sprules 1967; Scott and Crossman (1973)1298 Scales Female –3.4 478 500.0 0.165 0.094 450.211; 549.789 0.113; 0.217 –0.601; 0.790956 Scales Male –3.4 394 463.7 0.174 –0.085 397.298; 530.103 0.094; 0.254 –1.108; 0.939
Sandy Lake, Ontario (Kennedy and Sprules 1967; Scott and Crossman 1973)36 Scales Female 0.5 403 — — — –149.336; 1149.336 –0.205; 0.337 –35.739; 21.444100 Scales Male 0.5 333 336.6 0.386 1.042 328.066; 345.222 0.232; 0.539 –0.546; 2.629
Saskatchewan Delta, Manitoba (Kennedy and Sprules 1967; Scott and Crossman 1973)1305 Scales Female 1.6 472 485.9 0.170 –1.767 404.953; 566.921 0.070; 0.270 –3.338; –0.196782 Scales Male 1.6 403 429.7 0.218 –1.546 403.323; 456.048 0.165; 0.271 –2.127; –0.966
Lake Winnipegosis, Manitoba (Kennedy and Sprules 1967; Scott and Crossman 1973)656 Scales Female 1.7 355 394.8 0.384 0.048 286.871; 502.761 –0.115; 0.811 –2.300; 2.395680 Scales Male 1.7 344 351.2 0.537 0.770 331.303; 371.187 0.350; 0.724 0.305; 1.236
Red Lakes, Minnesota (Grosslein and Smith 1959)1165 Scales Unsexed 3.8 437
Oahe, South Dakota (Carlander 1969)641 Scales Unsexed 7.9 340
Missouri River, Gavins Point, South Dakota (Claflin 1963)266 Scales Unsexed 8.7 358
Fort Randall, South Dakota (Carlander 1969)436 Scales Unsexed 8.9 323
Verdigris River, Oklahoma (Jenkins and Finnel 1957; Carlander 1969)4 Scales Unsexed 16.0 310
Lake Texoma, Oklahoma (Martin 1954; Carlander 1969)891 Scales Unsexed 16.4 361
Note: Boldfaced values are non-significant parameters at the 95% confidence interval. K, Brody growth coefficient; L, length infinity; MAT, mean an-nual temperature; MTL, maximum total length; Struct., structure used to determine age; t0, time at theoretical age zero; Von B. parameters, vonBertalanffy equation parameters.
Table C1. Von Bertalanffy parameters were calculated for the first four populations with male and female growth data; age class datathat were not used in the analyses are indicated by “—”.