Central Inland Capture Fisheries Research Institute (Indian ...
192
-
Upload
khangminh22 -
Category
Documents
-
view
1 -
download
0
Transcript of Central Inland Capture Fisheries Research Institute (Indian ...


Bulletin No . 83 May 1998
Central Inland Capture Fisheries Research Institute(Indian Council of Agricultural Research)
Barrackpore 743 101 West Bengal India

Foreword
Fish production in open waters is a complex natural process which needsto be understood in consonance with the intricate changes that take placecontinuously in terms of habitat variables and biotic communities . In large water
. bodies, the production is based on wild untended populations which, in turn, isdependent on a complex community metabolism. The efforts to optirnise yield areclosely linked with the conservation of habitats and their biotic communities.Thus, there is a need to continue with open water fisheries research vis-a-visenvironmental management.
To enrich the knowledge and skill of the developmental officials ofSri Lanka, a l-month International training course on " Management of InlandOpen Water Fisheries" was organised at the Institute during May, 1998. Thisbooklet is the compendium of lectures delivered by the experts in the respectivefield during the training course. It is hoped that this booklet will be beneficial toall.
M.SillhaDirector

•.
;'
Content Page1. Inland Fisheries Resources of India and their 1
utilization. - Dr. M. Sinha
2. Estimation of inland fisheries resources base by - 14conventional and remote sensing techniques. L
- Sri R. A. Gupta
3. Assessment of openwater fishery dynamics through 22modelling approach for sustainable fish yield.- Sri S. K. Mandal
4. Concepts and methodologies for fishing management 25in reservoir ecosystem. - Sri C. Selvaraj
5. Classification, morphometry and basic Iimnological 35features for evaluating production potential of reservoir.
'- - Dr. M. Ramkrishnaiah
6. Riverine ecology, time scale changes and estimation 46of productive potential. - Dr. M. A. Khan
7. Time scale changes in water quality of the river 62Ganga and its impact on productivity.- Dr. R. S. Panwar
8. Biomonitoring of riverine system and anthropogenic 68pressure - Dr. A. K. Lall
9. Riverine fisheries in India; with special reference 78to the Ganga river system. - Dr. R. K. Tyagi
10. Hydrological changes, fish population trends and 83production potential of estuarine ecosystem withspecial emphasis on Hilsa. - Dr. D. K. De
11. Methodology for stress detection and prevention of 90major fish and prawn diseases in inland open water.- Dr. M. K. Das
12. Inventory and diagnosis of pathogens, causing 95various diseases in inland fishes/shrimps.- Dr. A. K. Ghosh.

13. Ecodynamics and importance of mangrove insustaining the coastal fisheries and aquatic biodiversity.- Dr. K. R. Naskar
108
14. Concepts and approaches for environmental impact 119assessment in inland waters.- Dr. M. K. Mukhopadhyay
15. Toxicology and biomonitoring as a tool for ecological 123management with the river Ganga as a case study.- Dr. S. K. Manna
16. Definition, classification and productive potential of 132floodplain wetlands and its importance in aquaticecosystem. - Dr. B. C. Jha
17. Management of floodplain wetlands for sustainable 141fishery and biodiversity conservation.- Dr. V. V. Sugunan
18. Harvest and Post-harvest techniques employed for inland 147open waters in India and their economic consideration.- Dr. P. K. Katiha
19. Mass awareness and Technology dissemination to 154achieve sustainable yield from open waters throughparticipating approach. - Shri. Utpal Bhaumik
20. Analytical methods for estimation of soil quality 161parameters. - Dr. D. Nath
21. Analytical methods for estimation of water quality 167parameters. - Dr. K. Chandra
--------~,..---"

· "
Inland Fisheries resources of India and their utilization
M. SinhaCentral Inland Capture Fisheries Research Institute,
Barrackpore-743 101, West Bengal
1. INTRODUCTION
Inland fish production in the country has registered a phenomenal increase during lastabout four decades. As against 0.2 million t produced in 195 I(the production of inland fish inthe country during 1995-96 is estimated at 2.2 million t.v'Ihe projected domestic requirement inthe country by 2002 AD is 12 million t,la half of which has to come from the inland sector. Toachieve this national goal, proper development/conservation of inland open waters is a must forwhich a scientific understanding of all types of inland fisheries resources is imperative to back uptheir optimum exploitation. In addition to its capability of achieving the goal of required fishproduction, the inland open water fisheries being a labour intensive activity its development hasthe potential to improve the quality of life of some of the most vulnerable sections of the society.Out of the estimated 0.71 million fishers in the country, 0.49 million are inland fishers who livein abject pov~rty. Number of fishers per km of river stretch has been estimated to be 3.2 inNarmada to 7.8 in Ganga, the average being 6.5. However, there exists as many opportunities toaugment the yield from inland fisheries resources as there are constraints which operate againstth~m·
Inland fishery resources of India, comprising vast expanse of rivers, canals, estuaries,lagoons, reservoirs and floodplain wetlands (lakes) are noted for their variety as well as their richproduction potential. (Table 1). The enormity and diversity of these systems demand separate,sector-wise approach in their development as they portray different pictures of environmentalparameters and production dynamics. Dotted with floodplains, oxbow lakes, quiescentbackwaters and interspersed deep pools, the rivers possess a mosaic of varying biotopes rangingfrom lotic to lentic habitats. A large number of river valley projects have been built andcommissioned since independence, as a part of our developmental activities, resulting in a chainof new aquatic resources like irrigation canals and reservoirs. Extensive areas under floodplainwetlands in the form of mauns, beels, chaurs, jheels are available in eastern U.P., northern Bihar,West Bengal, Assam, Tripura, Manipur, Arunachal Pradesh and Meghalaya. These are shallownutrient rich water bodies formed mainly due to change in river courses (or tectonic actions) andoffer ample scope for culture-cum-capture fisheries. The end saline areas of the river systems,known as estuaries, and lagoons also form an important component of fishery resources of thecountry.

Table 1. Inland Fishery Resources of India (compiled)
Rivers 45,000km
Reservoirs 3.15 million ha
Estuaries 2.7 million ha
Lagoons 0.19 million ha
Floodplain wetlands 0.24 million ha
2. RIVERINE FISHERIES
The extensive network of Indian rivers alongwith their tributaries, with a total length ofover 45,000 km constitute one of the major inland fisheries resource of the country. Indian riverscarry a surface run off of 167.23 million ha metres which is 5.6% of the total run off flowing inall the rivers of the world. The river systems of the country comprise 14 major rivers, eachdraining a catchment of more than 20,000 km", 44 medium rivers, having catchment between2000 and 20,000 km2 and innumerable small rivers and streams that have a drainage of less than2,000km2.
The Ganga river system, with its main tributaries like Yamuna, Ramganga, Ghagra, Gomti,Kosi, Gandak, Chambal, Sone etc., is the original habitat of the three major carp species of thesub-continent viz., catla, rohu, and mrigal, better known as Indian major carps, and continues tobe the source of its original germ plasm. The Gangetic system alone harbours not less than 265species of fishes. Similarly 126 species belonging to 26 families have been recorded from theBrahmaputra system. The peninsular rivers have been reported to bear at least 76 fish species.
The riverine scene, however, is a complex mix of artisanal, subsistence and traditionalfisheries with a highly dispersed and unorganised marketting system which frustrates all attemptsto collect regular data on fish yield. A firm database being elusive, for production trends, one hasto depend on the information collected by CIFRI from selected stretches of rivers Ganga,Brahmaputra, Narrnada, Tapti, Godavari and Krishna. Based on the studies made by CIFRI thefish yield in these rivers vary from 0.64 to 1.6 t per km. The catch statistics over the yearsindicate some disturbing trends in the riverine sector, especially the Ganga. The biologically andeconomically desirable species have started giving wayto the low value species, exhibiting analarming swing in the population structure of Gangetic carps. The average yield of major carpshas declined from 26.62 kg/ha/yr during 1958-61 to 2.55 kg/ha/yr during 1989-95. (Table 2).
L
2

Table 2. Estimated yield of Indian major carps in the river Ganga (in kg/ha/yr)(Jhingran, 1992-+ Personal communication)
Centres 1958-61 1961-69 1980-86 1989-95
Kanpur 83.5 24.3 - -
Allahabad 15.6 21.5 9.29 1.72
Buxar 17.1 3.8 7.00 -
Patna 13.3 13.3 5.08 3.04
Bhagalpur 3.6 7.5 2.90 2.90
Mean 26.62 14.08 6.07 2.55
A survey of river Brahmaputra in the state of Assam brought to light a decline in thefishery of the middle and lower stretches of the river since 1972. The survey also revealed large-scale destruction of brood fishes and juveniles. A detailed survey conducted earlier in theGodavari also indicated a depletion in fish yield. The production potential in lower Ganga wasestimated at 198.28 kg/ha/yr, whereas the actual fish yield was 30.03 kg/ha/yr and thus, only15.15% of the potential is harvested. In the middle stretch the utilisation of the potential ismarginally better than the lower stretch. However, in general, the potential is not fully utilisedand there is enough scope for further improvement.
Unfortunately, the anadromous hilsa fishery has almost disappeared from the stretch ofriver Ganga above the Farakka barrage where it used to contribute a lucrative fishery upto 1,500km up the sea mouth (up to Kanpur). Collapse of hilsa fisheries (Table 3) due to this river coursemodification has affected the lives of thousands of fishers along the riparian stretches in UttarPradesh and Bihar. Catadromous migrants like eels, freshwater prawn and Pang asius also seemto have been affected by such river course modifications.
Table 3. Average landings (in tons) of hilsa in middle stretch of river Ganga duringpre-Farakka and post-Farakka periods. (Jhingran, 1992)
Centres Pre-Farakka Post-Farakka
All ah ab ad 19.30 1.04 (94.61)
Buxar 31.97 0.60 (98.12)
Bhagalpur 3.95 0.68 (83.05)
Figures in parentheses denote % decline
A significant development with regard to hilsa fisheries has been the attempts to practiceits aquaranching for its revitalization. CIFRI has been successful in developing a hatcherymanagement practice for hilsa to stock the depleted stretches of the river with the produced seed.Attempts in this direction have borne fruits and a sample consignment of hilsa seed has been
3

stocked in the Ganga above Farakka barrage as well as in Ukai reservoir (Gujarat). This is thebeginning of an ambitious plan to set up a hilsa hatchery at Farakka and to take up a regularstocking programme. But the practicability and success of this ranching programme is still asubject of controversy.
Recent tagging studies of hilsa by CIFRI have conclusively proved that the fish is able tonegotiate the barrage during monsoons when the level of water on both sides is equal. Evidenceof its breeding upstream have also been found. But its usefulness in rejuvenating the hilsa fisheryis a matter of debate because of the required both way migration of fish in different stages of itslife cycle.
2.1 Factors influencing fish yield
A recent study (1995-96) by CIFRI covering 43 centres on river Ganga from its origin tothe sea mouth has revealed few starting facts of this aquatic environment. Environmentalaberrations like sandification of river bed upto Patna (over 90% sand), blanketing the river bedproductivity, and marked reduction in water volume due to increased sedimentation (caused dueto deforestation in the catchment areas) and increased water abstraction, accompanied with rivercourse modifications and irrational fishing practices appear to be key factors responsible fordecline in fishery. Taking the river water as a whole, following the method of composite samplingacross the river, pollution levels have been observed to be well within tolerance limits of fish andfish food organisms. This is quite in contrast to earlier observations of polluted stretches basedon point sampling in and around effluxion points. The present ecological condition of Gangawater may also be a direct result of Ganga Action Plan (Phase I) launched in the year 1985.
Flood control measures, sedimentation and increased water abstraction also effect theflood regime and inundation of grounds needed for feeding and breeding. In the Ganga basin,33.5 billion m' of water is presently held in storage reservoirs behind the weir and barrages apartfrom 18 major canal networks diverting the water to irrigate 7 m ha of agricultural land.
3. FISHERIES OF ESTUARIES AND LAGOONS
The various estuaries and lagoons in the country (Table 4) form an important componentof fisheries resources of the country. The fisheries of estuaries of India are above the subsistencelevel and contribute significantly to the production. The average yield is estimated to sway from45 to 75 kg/ha. The Hooghly-Matlah estuarine system, Chilka lagoon, Adyar and Mankanamestuaries, Pulicat lagoon, coastal belt of East Godavari, Vembanad lagoon and Mandovi estuaryhave also been identified to be excellent sources of naturally ocurring fish and prawn seed forexploitation for aquaculture purposes.
4

Table 4. Important Resources of Estuarine &. Lagoon fisheries in India(Updatedfront Jhingran, 1992)
Estuarine system Estima- Production level (t) Major fisheriested area(ha)
Hooghly-Matlah 802,900 20,000-40,000 Hilsa, Harpodon,Trichiurus, Lates, prawnsetc.
Godavaryestuary 18,000 c.5,OOO Mullets, prawns
Mahanadi estuary 3,000 c.S50 Mullets, bhetki, sciaenids,prawns
Narmada estuary 30,000 11148-13954 Prawn, Hilsa
Peninsular estuarine systems (Vasista, - c.2,000 Mullets, prawns, clupieds,Vinatheyam, Adyar, Karuvoli, Ponniar, crabsVellar, Killai & Coleroon)
Chilka lagoon 62,000 c.4,OOO Prawns, mullets, catfishesclupeids, perches,threadfins, sciaenids
Pul icat lake 36,900 760-1,370 Prawns, mullets, bhetki,(20.6-37.2 kg/ha) pearlspot, chanos
Vemhanad lake and Kerala backwaters 50,000 14,000-17,000 (fishes) Prawns, mullets, tilapia,88,000 (li ve clams) hhetki1,70,000 (dead shells)
Wetlands of West Bengal No data available on catcha. Freshwater bheries 9,600 -
b. Saline bheries 33,000
Mangroves 1,36,200 - No data available on catch
Mangroves are biologically sensitive ecosystems which play a vital role in breeding andnursery phases of many riverine and marine organisms of commercial value besides contributingthrough its own fishery. Nearly 85% of the Indian mangroves are restricted to Sunderbans inWest Bengal and Bay Islands. The Indian share of Sunderbans covers an area of 4,264 km2 ofwhich 3,106 km2has already been lost due to reclamation, leaving only 1158 km". Several of itscreeks are ideal sites for fish and prawn seed collection which sustains the aquaculture in theregion, providing livelihood to thousands of fishers. The Sunderbans fishery cornprises 18 speciesof prawn, 34 species of crabs and 120 species of fish besides 4 species of turtles.
River course modifications have played their part in estuarine fisheries also. A glaringexample of the same is the over all decline in the salinity of Hooghly-Matlah estuary aftercommissioning of Farakka barrage (Sinha et al., 1996) with gradient and marine zones beingpushed down towards sea. This has brought about distinct change in the species composition offishes caught, with freshwater species making their appearance in tidal zone and few neritic
5

species disappearing. However, the stock of hilsa continues to be the prime fish of this estuarycontributing 10-15% of the catch.
The likely impact of taming of river Narmada on its estuarine fishery is another suchexample. In a desk review (Anon, 1994) of likely impact of Narmada Sagar and Sardar Sarovaron the fisheries downstream, carried out by CIFRI for Narmada control Authority, it has beenpointed out that as per report of the Narmada Water Dispute Tribunal (Anon, 1978) there wouldbe 72.71% reduction in water availability downstream at 30 years of commencement ofconstruction. It may not change the salinity regime during non-monsoon months but the annualevent of dilution during monsoon months shall not be maintained. This shall effect the migratoryfauna, particularly Tenualosa ilisha and Macrobrachium rosenbergii, and accordingly the fish _yield of the downstream will decline. Stage attained at 45 years from the commencement ofconstruction, when freshwater release from Sardar Sarovar shall cease, will be very critical as itshall be associated with steep hike in salinity and in absence of compromising factor (freshwaterflow), the tidal ingress shall be more towards river side. It is most likely that the whole estuaryshall undergo a transformation into a biotope characterised by hypersaline condition with salinitytongue further invading inland. Fishery shall drastically change. There shall be a total collapseof prevailing floodplains providing congenial breeding and feeding sites to fishes. Mangroves shallalso be affected and the rich fishery harboured by them shall undergo a drastic change.
With the present height of 80.3 m attained by Sardar Sarovar dam, impact ofimpoundment are already discernible in the water downstream. They are in form of increasedtransparency, significant increase in dissolved oxygen, decline in the nutrient status and localizedspurts in planktonic biomass. Presently, there seems to be no adverse impact due to present levelof freshwater crunch in the downstream, but with further increase in dam height it is likely thatconsequences may be felt more prominently.
Recently conducted survey of Chilka lagoon in 1995-96 by CIFRI has indicated thatregulated discharge in coming rivers, siltation and anthropogenic pressure have made markednegative impact on its fishery. Considerable decrease in size (from 906 sq.km. in 1965 to 620sq.km. in 1995), siltation of lagoon bed and its connecting channel with the sea, profuse weedinfestation, decrease in salinity (from 7.0 - 25.5 ppt in November, 1957 to l.41 - 2.69 ppt inNovember 1995) and qualitative (28% prawn in 1965 to 14.4% prawn in 1995) as well asquantitative decline in the fishery (4237 tons in 1990 to 1672 tons in 1995) of this lagoon hasbeen observed.
4. RESERVOIR FISHERIES
Large number of river valley projects have been built and commissioned in our countrysince independence as part of developmental activities. More such projects are on the arvil.Though created basically for irrigation or power, it forms the most important fishery resource inthe country, at present, simply because of its magnitude. (Table 1).
Indian reservoirs are classified into large, medium and small (Table 5) based on their area.The fish yield from reservoirs in India is frustratingly low. At the present level of management,they yield, on an average about 30 kg/ha whereas, a production of 50-100 kg/ha can easily be
6

realised from large and medium reservoirs. The small reservoirs have the potential to yield evenmore (l00-300 kg/ha).
Table 5. Reservoir fishery resources ofIndia (After Sugunan, 1995 a)
Category Number Area (ha)
Smal « 1000 ha) 19,134 14,85,557
Medium (lOOO-5000 ha) 180 5,27,541
Large (> 5000 ha) 56 11,40,268
Total 19,370 31,53,366
The biological potential of reservoirs was not evaluated to any reliable level till 1970when CIFRI took up an All India Coordinated Research Project on Ecology and Fisheries ofReservoirs and gave a new dimension to the sporadic work carried out until then. These studiesbrought about an improvement in technical capabilities and provided guidelines for managing thereservoir fisheries. The three pronged strategy comprising enlargement of mesh size, increase infishing effort and stocking support has paid rich dividends (Table 6, Table 7). In large andmedium reservoir the stocking support is for the purpose of establishing a breeding populationof suitable species, whereas, in small reservoirs it is for the purpose of extensive aquaculture.
Table 6. Increase in fish yield obtained in medium and large reservoirs as a result ofscientific management technique (Anon, 1997)
Reservoirs Yield (kg/ha)Before After
Yeldari (Maharashtra) 3 37Girna (Maharashtra) 15 45Gandhisagar (Madhya Pradesh) 1 44Ukai (Gujarat) 30 110Gobindsagar (Himachal Pradesh) 20 100Pong (Himachal Pradesh) 8 64Bhavanisagar (Tamil Nadu) 30 94Sathanur (Tamil Nadu) 26 108
In contrast to the large multi-purpose reservoirs, the small irrigation reservoirs, createdon small intermittent water courses, serve to trap the surface run off for its abstraction duringseasonal irrigation demands. Experience has revealed that these water bodies offer immensepotential for fish husbandry through extensive aquaculture. Considering the urgent need toenhance inland fish production in the country, emphasis need be laid on a management approachof such water bodies based on optimum stocking of suitable species and effective recapture(culture based capture fisheries). A good response to this management option is discernible inmany of the small Indian reservoirs raising their yield to 70-275 kglha/yr (Table 7).
7

Table 7. Increase in fish yield obtained in small reservoirs after adopting scientificmanagement technique (Anon, 1997)
Reservoirs Yield (kg/ha)Before After
Chulliar (Kerala) 35 275Meenkara (Kerala) 10 105Markonhalli (Karnataka) 5 70Gulariya (V.P.) 33 170Bachhra (V.P.) NA 150Baghla (V.P.) NA 110Thirumoorthy (Tamil Nadu) 70 200Aliyar (Tarnil Nadu) .. 27 215
•Reservoir fisheries development is a must for a quantum jump in inland fish production
in future as well as improving the socio-econornic condition of 0.49 million fishers of the country.Sugunan (1995a) has compiled the present level of fish production and potential of differentcategories of reservoirs in the country (Table 8). It is evident therefrom that this resource alonehas the potential to yield 0.24 million ton of fish, with modest targets of average production, ifmanaged on scientific lines.
Table 8. Present yield and potential of production from different categories of reservoirsin India (After Sugunan, 1995 a)
Category Total Present Potentialavailablearea (ha) A vg. Fish A vg. Fish
Production production Production production(kg/ha) (t) (kg/ha) (t)
Small 1485557 49.90 74129 100 148556
Medium 527541 12.30 6488 75 39565
Large 1140268 11.43 l3033 50 57013
Total 3153366 29.7 93650 77.7 245134
5. FISHERIES OF FLOODPLAIN WETLANDS
India has extensive riverine wetlands in the form of oxbow lakes (locally called mauns,chaurs, beels, jheels) especially in the states of Assam, Bihar, eastern V.P. and West BengaLState-wise areas of wetlands associated with the floodplains of the riverine systems of Ganga andBrahmaputra are depicted in Table 9.
8

Table 9. Distribution of flood plain wetland in India, (Sugunan, 1995 b)
State River basins Local names Area (ha)
Arunachal Kameng, Subansiri, Dibang, Lohit, Dihing beel 2,500Pradesh & Tira
beel 1,00,000Assam Brahmaputra & Barak
mauns, 40,000Bihar Gandak & Kosi chaurs
16,500Manipur Iral, lmphal, Thoubal pat
213Meghalaya Someshwari & Jinjiram beel
500Tripura Gumti beel
42,500West Bengal Ganga & lchamati, beel, 40,000
Hooghly & Matlah bheries2,42,213
Total
Floodplain wetlands can be broadly divided into two categories, Those which haveretained their connection with the parent river through narrow channels atleast during monsoonare called open beels, while the ones which are cut off permanently from the parent rivers arecalled closed beels. Besides occuppying a prominent position among the culture based capturefisheries of India, by way of their magnitude as well as production potential, the open type offloodplain wetlands have vital bearing on the recruitment of population in the riverine ecosystemand provide excellent nursery grounds for several fish species and a host of other fauna and flora,
Nutrient-wise these bodies are extremely rich as reflected by rich organic carbon and highlevels of available nitrogen and phosphorous in their soil. But these nutrients are usually lockedup in the form of large aquatic plants, especially water hyacinth, and thus unable to contribute tofish productivity. The ecologically degraded condition of floodplain wetlands and lack of propermanagement measures have resulted in their swampification and rather paltry fish yield (100-300kg/ha/yr), against a production potential of 1000-1800 kg/ha/yr through scientific management,leaving a significantly wide gap between the actual yield and their harvest potential.
In most of the beels, marginal areas are utilised for agricultural purposes. These waterbodies are subjected to a variety of environmental stresses especially from pesticides and otheragricultural run off, municipal wastes and siltation. The siltation adversely effects thereproduction of fish by accumulation of sediments in the marginal areas of the beels which formthe breeding grounds for the fish. Adverse breeding conditions in open beels also adverselyeffectsthe concerned river's fishery as they are the ideal breeding grounds for riverine fish populations.
The floodplain wetlands, by virtue of their productive potential as well as magnitude,constitute one of the frontline areas, capable of contributing substantially to country's fish
9
--- ---- - -

production. The management strategy for this vital sector should be ,based on a category-wiseapproach. Optimum exploitation of floodplains with riverine connection should revolve roundthe concept of keeping the deeper central portion exclusively for capture fisheries and utilizationof margins and pockets for culture fisheries. Capture fisheries would entail monitoring ofrecruitment and subsequent growth of natural population. In closed wetlands stocking is themainstay of management, whereas in weed choked lakes, clearance of weeds and a detritivore-oriented stocking schedule would enhance the yield rate considerably (Yadava, 1987).These lakesalso provide ideal conditions for pen culture operations. CIFRI has evolved and demonstratedtechnologies for production of 3-4 tlha!6 months of major carps and 1,000-1,300 kg/ha!3 monthsof freshwater prawn through pen culture in such water bodies.
6. MAJOR CONSTRAINTS IN DEVELOPMENT OF INLAND FISHERIES
A number of diverse and complex problems confront the inland fishery managers. Theconstraints can be broadly grouped under four major heads viz., biological, environmental, socio-economic and legal.
6.1. Biological constraints
The extraction of fish riches from the rivers, based on the principle of maximum sustainedyield, has not been possible in the Indian context. Fishing has been guided by the principles ofeconomic profit rather than biological principles. The intensity of fishing, nature of exploitationand species orientation in the characteristic artisanal fisheries of Indian rivers are governed by (1)seasonality of riverine fishing activity; (2) unstable catch composition; (3) conflicting multipleuse of river water; (4) cultural stresses leading to nutrient loading; (5) lack of understanding ofthe fluvial system and infirm data base; (6) fragmentary and outmoded conservation measureslacking enforcement machinery; (7) inadequacyy of infrastructure and supporting services; (8)defective marketing and distribution systems; (9) demand directed by availability; affordability,and palatability, and (10) socio-economic and socio-cultural determinants (Jhingran, 1984).
Infirm database of inland fisheries resources has been another serious constraint plaguingthe development process. Even market intelligence statistics suffered from various drawbacks dueto disposal of appreciable quantity of fish that passed directly from the primary producers toconsumers. Through a Central Sector Scheme on Inland Fisheries Statistics, launched duringSeventh Plan by Union Ministry of Agriculture, CIFRI has been able to evolve a methodology fordata collection on inland fisheries. It is expected that in years to come the database in this fieldwould also be firm.
Absence of suitable fish yield models for the multi-species fisheries of our open waters isa major biological constraint for formulating a successful management strategy. Developing sucha model, keeping an eye on hydrology and fish stocks, accompanied with observance of closedseason and setting up of fish sanctuaries will definitely prove its efficacy in fostering recovery ofimpaired open water fishery of our country.
10
------ ~-- ----

6.2 Environmental constraints
Notwithtstanding the rather discouraging picture the riverine sector portrays, conservationand management of the biological resources of the rivers assume greater significance in the Indiancontext. Some definite steps have been taken in this direction during the last few years, amongwhich the Ganga Action Plan (GAP) is worth mentioning. GAP is a massive national projectlaunched in the year 1985 with a view to halting and reversing the process of environmentaldegradation in India's prime river, the Ganga. The main objectives were to improve the waterquality of the river Ganga and its tributaries to acceptable standards and to oversee theimplementation of a long-term programme for undertaking suitable measures for restoring thewater quality of the river Ganga. Till 1991, 368 mld of domestic sewage has been divertedthrough the efforts of GAP. Water quality of river Ganga has shown definite improvement at thestations that completed pollution abatement schemes (Table 10).
But the problem of sedimentation and water abstraction, two main factors adverselyeffecting fisheries of rivers and floodplain wetlands have not been given due attention so far in thefishery perspective.
Table 10 : Ecological changes in the river Ganga at Kanpur due to diversionof sewage effluents (After Jhingran 1992)
Zone Before diversion After diversion
1 2 3 4 1 2 3 4
Energy fixed by producers 4152 2968 3913 222 4352 3212 5309 5256(cal/mi/day)
Photosynthetic efficiency (%) 0.355 0.254 0.330 0.019 0.372 0.272 0.454 4.50
Fish production potential 144 103 136 8 151 I11 184 182(kg/ha/yr)
6.3 Socio-economic constraints
The riverine fishers constitute a section of economically weak, tradition-bound society.Most of them live at subsistence level or below poverty line. The environmental degradations andthe resultant decline in fish populations have deprived them of a steady catch. The problems arefurther compounded by the competition among fishers due to increase in their population.
Socio-economic milieu under which the inland fishermen operate is not conducive enoughto attract credit and infrastructure support for required modern crafts and gear from traditionalbanking and fmancial Institutions. A sector's ability to attract finance and specially loanable fundsdepends largely on evaluation of risk elements by prospective funding agencies. The migratorycharacter, seasonality of fishing activity and unstable catch composition of capture fishery doesadversely effect investment appraisal and assessment of funding possibilities because of variousreasons. There is an inescapable need to evolve some distinct criteria for financing the captureand culture based capture fisheries of inland open waters where the input-output relations arerelatively less precise. This would need evolving a new set of criteria for the creditworthiness andrepaying capacity of such fishers.
11

6.4 Legal constraints
Fisheries legislation in the country is, by and large, guided by the Indian Fisheries Act1897, which stipulates the closed season, defines the irrational fishing practices to be prohibitedand limits the minimum size of fishes and the mesh sizes to be employed. Prepared basically onempirical knowledge available at that time, this act can be termed, at best, as a reference materialfor law makers. In India, fisheries being a state subject, it is the prerogative of the stategovernments to frame 1U1eson conservation and management of riverine fisheries resources.Many states in India like West Bengal (till recently) and the states in North East have no fisherieslegislation. Rajasthan enacted fisheries legislation in 1984. Some states like Uttar Pradesh, ,-Andhra Pradesh, Madhya Pradesh and Kerala have some 1U1esfor regulation of fisheries but they "have played a subordinate role owing to enforcement problems. More efforts and emphasis areneeded for strict enforcement of the legal provisions.
The complexity of factors involved in regulation of fisheries in India stems largely fromthe common property nature of resources, difficulties in enforcing a limited access concept,divergent auctioning and leasing policies followed by different states and the multiplicity ofagencies that control the water resources and regulate the environmental parameters. Consideringthe urgent need for a comprehensive legislation, a legal sub committee has been constituted underthe Ganga Action Plan and a draft legislation prepared.
7. CONCLUSION'
The development of inland fisheries in India is a must to obtain the required quantity offish but it is at a critical point in its development.lDegradation and loss of fisheries habitats areincreasing and a national perspective' essential for the sustainable development and exploitationof our inland fisheries resources. Ecosystems are threatened by fast changing coastalconfigurations, wetlands loss, environmental perturbations and destructive fishing practices.These resources in developing countries are specially vulnerable because the national prioritiesfor their development are often in conflict with the norms of conservation. Developmentstrategies need to have a holistic approach suiting to all aspects of the resource. Un the integrateddevelopment of multipurpose use systems, it should be mandatory to develop all living resourcestogether."
Thus, a system which links the management of fisheries, forestry and agriculture to agro-industrial and hydro-electric units will facilitate optimization of production from the river basin.Sound environmental protection norms, keeping fisheries in perspective, accompanied with duepriority for proper utilisation of available inland fisheries resources is a must for sustainabledevelopment. CIFRI would continue to provide the required research back up to combine theenvironmental norms and sustainable development of inland fisheries resources in order to meet
I
the requirement of the country. It is essential that all concerned (scientists, planners anddevelopment agencies) work together for utilisation of this most important resource bestowed tous by nature.
12

8. REFERENCES
Anon., 1978. Report of Narmada Water Dispute Tribunal, Vol. IV. Government of India.
Anon., 1994. Studies on Fish Conservation in Narmada Sagar,Sardar Sarovar and itsDownstream. A Desk Review sponsored by Narrnada Control Authority. Central InlandCapture Fisheries Research Institute, Barrackpore.
Anon., 1997. Vision 2020. Perspective Plan of CIFRI (1995-2020). Central Inland CaptureFisheries Research Institute, Barrackpore.
Jhingran, AG., 1984. Development of riverine fisheries resources - some policy issues. InStrategy for development of inland fishery resources in India - Key issues in productionand marketting (Eds. U.K. Srivastava and S. Vathsala), Concept Publishing Company,New Delhi.
Jhingran, AG., 1992. Inland fisheries management in India - Development potential andconstraints. In FAO Fisheries Report No. 458 suppl. (Ed. E.A Balayut), FAO, Rome.
Sinha, M., M.K. Mukhopadhyay, P.M. Mitra, M.M. Bagchi, H.C. Karmakar, 1996. Impact ofFarakka barrage on the hydrology and fishery of Hooghly estuary. Estuaries, 19(3).
Sugunan, V.V., 1995 a. Reservoir Fisheries ofIndia. FAO Fisheries Technical Paper No. 345,FAO, Rome.
Sugunan, V.V., 1995 b. Floodplain wetlands - a fisheries perspective. In Conservation andsustainable use of Floodplain wetlands (Ed. J.R. Howes), Asian Wetland Bureau,Kuala Lumpur, A WB Publication, No. //3.
Yadava, Y.S., 1987. Studies on the limnology and productivity of an oxbow lake in DhubriDistrict of Assam (India). Unpublished Ph.D. Thesis, Gauhati University, Assam.
*************
13

14
Estimation of Inland Fisheries Resources base by conventional andRemote sensing Techniques.
R. A. GuptaCentral Inland Capture Fisheries Research Institute, Barrackpore.
Introduction
Inland fisheries resources are vast and diverse in nature and normally locatedthroughout the cross section of the land surface. These resources mainly comprise ponds,lakes, reservoirs, rivers, estuaries and lagoons, etc. Classification of these resources canbroadly be done under two major heads namely capture and culture fisheries.Inventorying and monitoring of these resources are essential as information on their areacoverage, spread and fish production is needed for planning and development. Theplanning process has not yielded desired results particularly in third world countries dueto lack of information on this front. Unless resources are extensively surveyed, it isdifficult to formulate appropriate policy for their optimum utilization. Any prioritizationalong with targeted levels of achievements can be suitably and precisely formulated ifreliability, timely availability and comparability of data base is ensured. Moreover,reliability and comparability of data are also essential as they are the basis for measuringthe success of various development projects and programmes being implemented invarious states for the benefit of the fishing communities.
Methods of Assessment :-
Inland capture and culture fisheries is a widely dispersed activity in most of thecountries. Hence monitoring and enumeration of these resources need large human andfinancial resources in order to collect reliable data. Hence, the total enumeration/censusis a very costly and complicated operation. The sample surveys based on sound statisticalmethods with larger coverage through point-source measurements may be the way out ofthis impass in order to develop comprehensive and reliable database useful for planners toformulate appropriate strategy for development of inland fisheries. Other methods whichmay be employed on a large scale to estimate the surface water spread, their shape ..anddistribution may be remote sensing techniques. In the succeeding text we will discussthese two methods in details for employing those for assessment of these resources.
Convention Methods based on Point Source Measurement: -
As discussed earlier, sample survey techniques are mostly used to gatherinformation on inland fisheries resources and productivity. For accurate and reliableassessment of production, it is essential that some sample survey methods are designedwith high degree of precision. But before we discuss these methods which are based onthe exploitation and marketing intelligence information, we would look into all thetypical resource categories and suggest appropriate classification so that suitable samplingprocedure may be formulated for each class.

15
Classification of water bodies: -
Inland fisheries resources cover diverse nature of water bodies which can bestated below:
Fresh water resources.
1. Aquaculture ponds and tanks3. Ox-bow lakes/ cut off meanders5. Swamps7. Waterlogged9. Ash ponds11. Rivers and canals
2. Large irrigation tanks4. Reservoirs6. Playas8. Quarries10. Excavations
Saline water
1. Lagoons 2. Estuaries3. Creek 4. Mangrove5. salt pans 6. Marsh7. Other Impoundments (such as berries of West Bengal)
So many of the above water bodies do not contribute significantly and, therefore,be left out from the perview of the classification for the purpose of fish productionassessment.
Selection of sample
Group - III
For assessment purposes, the resources may, thus, be classified into the followingbroad categories.
Group - I (Water bodies up to 10 ha. of water spread area)
1. Aquaculture ponds and tanks2. Brackishwater impoundments3. Waterlogged areas
Group - II
1. Large irrigation tanks2. Reservoirs and check dams.3. Lakes
1. Rivers2. Canals3. Estuaries4. Lagoons

16
5. Back waters
Sampling Design:
The whole state is divided into three nearly homogeneous groupscalled strata(each stratum comprising a number of districts) on the basis of certain characteristicssuch as climate, rainfall, soil quality etc. Strata should be formed in such a way thatgeographical contiguity of districts within the stratum is maintained. From each stratum asample of 30% districts may be selected at random for the sample survey. Furthersampling within each selected district is discussed for each group separately in thesucceeding paragraphs.
Sampling procedure for Group I water bodies:
Sampling frame should be prepared for each selected district by making a list ofvillages. This can be achieved by using the census records. Villages having waterbodiesof this group may be highlighted and clusters of five nearby villages may be formed fromamong the pond bearing villages. From these clusters a sample of nine clusters beselected by random sampling for assessment of water spread area. A further sampling offive ponds in each cluster is recommended for estimation of fish production.
The whole selection procedure may be encompassed under stratified three stagesampling where districts, clusters and ponds are first, second and third stage units ofselection respectively.
Sampling procedure for Group 11water bodies:
As far as area statistics is concerned, a total inventory of resource under eachstratum for group-II should be prepared and a sub group of small, medium and large unitsas defined elsewhere in the text be made. 25 to 30% sample water bodies at random fromeach subgroup of each stratum should be selected for collection of data on fish catch.Catch data from selected waterbodies is recorded in the following manner.
Investigations have shown that two types of exploitation pattern is adopted inthese waterbodies. They are:
(1) Waterbodies which are harvested for a short interval extending from afortnight to about a month during the year. These waterbodies are mostly small reserviorsand lakes which fall under the perview of state departments and exploitation is affectedeither by auctioning them to private contractors under certain terms and conditions orexploited departmentally by engaging contract labour. Hence, the bulk of harvest is a onetime operation which continues for a fortnight to about a month. Data for suchwaterbodies may be collected on total enumeration basis.
(2) Water bodies which are exploited round the year by fishermen cooperatives orindividual fisherman on the basis of licenses, free fishing, royalty or any other suchmode. In such situations 4 to 6 days may be selected for on the spot observation of catchand production may be assessed as per the formula given under estimation procedure.

17
In brief this procedure can be described as stratified two stage sampling whereselection of waterbody is the first stage and sample days is second stage of selection.
Sampling Procedure for Group illwater bodies:
Sampling frame for this group is prepared by enlisting district-wise all the fishingvillages/landing centres in each of the strata. 25 to 30% of these units are selected byrandom sampling from amongst the selected districts of each stratum at the second stage.For each selected unit 4 to 6 sampling days within a month are further selected at thethird stage for collection of catch data.
Hence, the above procedure may be termed as stratified three stage samplingwhere districts, villages and days of sampling form the first, second and the third stage ofsampling respectively. The observation of catch is made by the following procedure.
Each selected centre/fishing village is physically observed on two consecutivedays in each of the first and second fortnight during the month. On a selected day ofsampling at a centre, data is collected during 1200 to 1800 hrs. and on second day from0600 to 1200 hrs. Data on night landings, if any, in between the consecutive days arecollected by inquiry on the second day. On the selected day of observation theinvestigator should collect information on the total number of fishing units operated onthat day, and the total catch landed from the observed units and species composition. Heshould also ascertain the number of fishing holidays observed during the last month.However, the sampling days in a month may be increased depending on the availableresources and the units potential in fish landings.
(The diagrammatic representation of each stage of sampling for the above three groups isgiven in figure 1.)
Limitations of conventional method
The conventional method tend to be slow, arduous and suffers from the hazards ofsubjectivity. Moreover, in the conventional approach, there is no satisfactory solution forresource mapping in inaccessible or poorly accessible areas. Further, these methods areinaccurate, expensive and time consuming.
Remote Sensing Method
These methods offer the advantage of reliability, speed and cost effectiveness overthe conventional procedure. As a consequence, remote sensing methods are advancingvery rapidly and the technology is increasingly used as an operational modern procedurerather than an alternative experimental tool. The advantage of RS is providing synopticview and repetitive coverage of large areas to enable better understanding of theinterrelationships among the different ... and their land uses, physiographic units andenvironmental functions.
Basic concepts

18
Remote sensing literally means perception from a distance-teledetection. Broadly,it is an acquisition of data about specific objects or phenomena by an informationgathering device not in intimate contact with the subject under investigation. In a strictersense, remote sensing connotes a technology of acquisition and interpretation of dataabout the terrestrial and atmospheric objects and processes in the form of photographs,imagery, video tapes or other forms of recordings in a beyond the range of human visionand photographic sensitivity from a vantage point in air' or space to derive informationwhich can be quantified.
Aerial photography is the earliest form of remote sensing but remote sensingcommonly implies satellite remote sensing for detection of energy emitted or reflected bythe objects on earth's surface.
It invloves data reception, data transformation, processing, analysis, interpretationand generation of information in the form of text, tabular statement, and/or map. Thecomponents of the system are (I) radiation source (2) transmitting medium ,(3) target,and (4) a sensor
The reflectance and emittance of an object in different wave length bandsfollowed a pattern, called as spectral signature. The logic of RS, which is founded ininference draws from the spectral signature. Inference is used to know 'what' ,'where'and 'how much'.
Resolution, which is a measure of the ability of an optical system to distinguishbetween signals that are spatially near or spectrally similar controls soil differentiation formapping of soil at different categoric levels and monitoring of degradations, land usesand other dynamic aspects. Four types of resolutions namely, spectral, spatial,radiometric and temporal are considered in order to interprets remote sensing data.
Spectral resolution : - It refers to the locations of the spectral bands in the electromagnetic spectrum. Normally, the bands are selected to maximise the contrast betweenthe objects of interest and to minimise the atmosphere effect. Spectral resolution is theability of sensors to measure the spectral properties of the smallest targets. The specialresolutions of commonly available RS data are: LISS-I-72.S m , LISS-Il-36.2 m,SPRT-IO m.
Radiometre resolution refers to number of digital levels used to express the datacollected by the sensors. Temporal resolution of a sensor system refers to periodicity withwhich a given sensor collects the data of a specific area. Multidate data helps inextracting the information about the temporal variations of the object which is changingwith time. Temporal resolution ofIRS and land set TM are 22 and 16 days respectively.
RS Data Interpretation :- RS Data Interpretation for surface waterbodies can be definedas detecting , delineating and identifying water bodies at the chosen categoric levels(controlled by the scale of mapping as well as by spatial and spectral resolutions of RSdata) based on their spectral signatures gained as a result of ground truth. Two set of
19
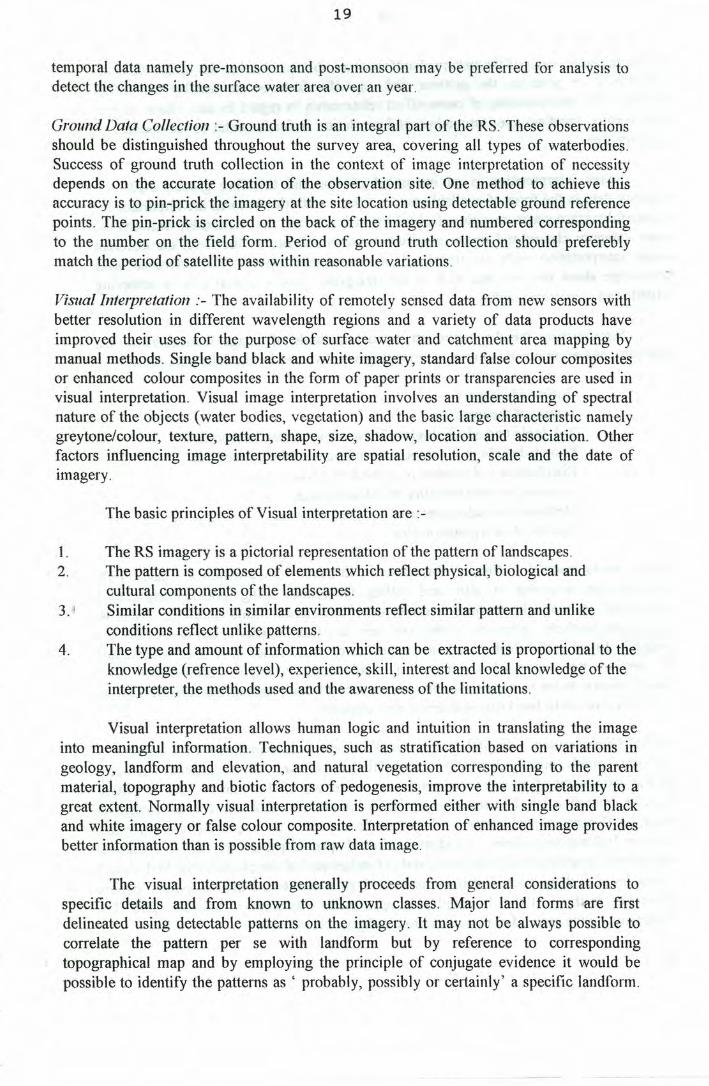
temporal data namely pre-monsoon and post-monsoon may be preferred for analysis todetect the changes in the surface water area over an year.
Ground Data Collection :- Ground truth is an integral part of the RS. These observationsshould be distinguished throughout the survey area, covering all types of waterbodies.Success of ground truth collection in the context of image interpretation of necessitydepends on the accurate location of the observation site. One method to achieve thisaccuracy is to pin-prick the imagery at the site location using detectable ground referencepoints. The pin-prick is circled on the back of the imagery and numbered correspondingto the number on the field form. Period of ground truth collection should prefereblymatch the period of satellite pass within reasonable variations.
Visual Interpretation :- The availability of remotely sensed data from new sensors withbetter resolution in different wavelength regions and a variety of data products haveimproved their uses for the purpose of surface water and catchment area mapping bymanual methods. Single band black and white imagery, standard false colour compositesor enhanced colour composites in the form of paper prints or transparencies are used invisual interpretation. Visual image interpretation involves an understanding of spectralnature of the objects (water bodies, vegetation) and the basic large characteristic namelygrey tone/colour, texture, pattern, shape, size, shadow, location and association. Otherfactors influencing image interpretability are spatial resolution, scale and the date ofimagery.
The basic principles of Visual interpretation are :-
1. The RS imagery is a pictorial representation of the pattern of landscapes.2. The pattern is composed of elements which reflect physical, biological and
cultural components of the landscapes.3. ! Similar conditions in similar environments reflect similar pattern and unlike
conditions reflect unlike patterns.4. The type and amount of information which can be extracted is proportional to the
knowledge (refrence level), experience, skill, interest and local knowledge of theinterpreter, the methods used and the awareness of the limitations.
Visual interpretation allows human logic and intuition in translating the imageinto meaningful information. Techniques, such as stratification based on variations ingeology, landform and elevation, and natural vegetation corresponding to the parentmaterial, topography and biotic factors of pedogenesis, improve the interpretability to agreat extent. Normally visual interpretation is performed either with single band blackand white imagery or false colour composite. Interpretation of enhanced image providesbetter information than is possible from raw data image.
The visual interpretation generally proceeds from general considerations tospecific details and from known to unknown classes. Major land forms are firstdelineated using detectable patterns on the imagery. It may not be always possible tocorrelate the pattern per se with landform but by reference to correspondingtopographical map and by employing the principle of conjugate evidence it would bepossible to identify the patterns as ' probably, possibly or certainly' a specific landform.

20
Further details in each of the patterns/landforms are abstracted using the image elementscollectively. In practice, the patterns and specific features are usually consideredtogether. The understanding of cause-effect relationship in regard to size, shape, colourtone, texture, shadow, site, association and resolution is fundamental to the success ofinterpretation.
Image interpretation is an integrated process and therefore ground truth andancillary data in the form of available maps, reports and other records are important forsuccessful surface water mapping. Guided by such data and the relationship between thewater category classes and image manifestations, established in the field, the differentimage interpretation units are translated into waterbody classes. The reference levelknowledge about the area and skill of the interpreter play a crucial role in achievingreliable and consistent results.
Summarising the discussion on manual methods of image interpretation, thereliability and accuracy of water cover mapping are governed by the following factors:
Quality of imagerySeason of the imageryPedologic and edaphologic reference level of the interpreterKnowledge about the resource conditions of the project areaDistribution and number of ground observation sitesAvailability and reliability of collateral dataMethods and techniques used for interpretationQuality of interpretation aids
Image Enhancement : - Image enhancement and shadow suppression are particularlyimportant for mapping in hilly and rolling landscapes using visual interpretationtechniques. Among the various enhancement techniques, band ratioing, principalcomponent analysis, greenness index and hue-saturation intensity transformation aregenerally found useful. Hybrid colour composites of band ratios have been widely usedto remove the topographic effects of shadowing.' Principles components (PC)transformation helps to negate the data redundancy of compressing information contentof the original multi-band data into fewer new channels.
Digital Classification :- Digital image classification involves grouping of a number ofindividual pixels (picture elements) into specified soil classes. The classification is basedon the assignment of an unknown pixel to the category of the known pixel of similarspectral characteristics. The underlying priciple is that the various WB calsses/ categoriesexhibit different spectral patterns which can be expressed in a quantative-multivariatefashion. It therefore follows : (1) identification of spectral pattern for each WB class atthe chosen categoric abstraction level, and (2) assignment of the pixels to the WB classeson the basis of their spectral characteristics with reference to the known spectral patterndeveloped in the first step by employing appropriate classification decision rules. Thefollowing are the major decision rules used in digital classification.
· 21
I. Minimum distance to the means - The unknown pixel with a feature vector f isassigned to that class whose mean vector is close to f Computationally this is a relativelysimple classifier with limited accuracy, especially when the variance of features are large.
2. Paralleipiped - It is based on calculating minimum and maximum brightness values ineach spectral band. A paralleipiped is thus a multidimensional rectangle defined by theupper and lower spectral limits of known pixels. The unknown pixel is assigned to theclass whose paralleipiped corresponds with the unknown pixel. Although fast, thisdecision rule does not employ rigorous statistical decision criteria.
3. Maximum Like\yhood - It is most commonly used algorithm in supervisedclassification. With this approach, 'each WB is evaluated statistically for its multivariateprobability density function. The probabilities are calculated from the mean, variance andcovariance between data channels for each class and the brightness value of each pixel inquestion. the pixel is assigned to the WB class for which it shows highest probability. Thepixel is left unclassified if the probability values are below the threshold. This classifier ismore rigorous and requires more processing time, but generally yields more accurateresults.
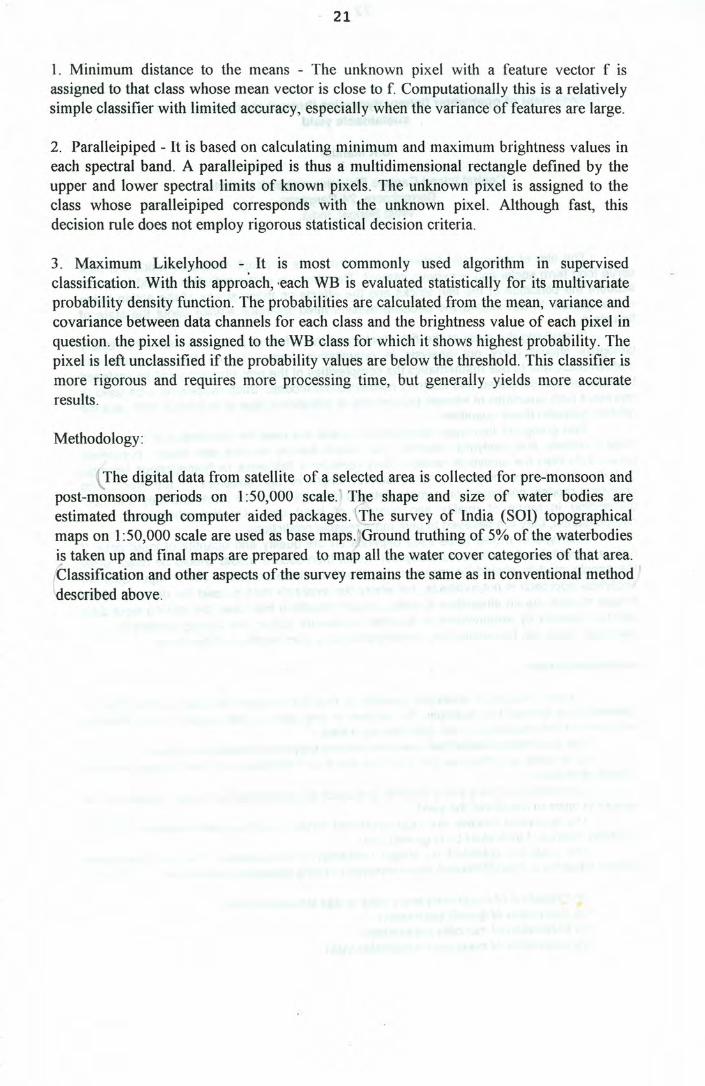
Methodology:
(The digital data from satellite of a selected area is collected for pre-monsoon andpost-monsoon periods on 1:50,000 scale. The shape and size of water bodies areestimated through computer aided packages. The survey of India (Sal) topographicalmaps on 1:50,000 scale are used as base maps.jGround truthing of 5% of the waterbodiesis taken up and final maps are prepared to map all the water cover categories of that area.tlassification and other aspects of the survey remains the same as in conventional method f
(described above.

22
Assessment of openwater fishery dynamics through modelling approach forsustainable yield
S.K.Mandal
Central Inland Capture Fisheries research InstituteBarrackpore, 24-Parganas,
West Bengal, India.
(j-he aim of open water fisheries management is to adopt measures which will bestserve long term social and economic interest. The planning of the activities should take intoaccount the condition of the fish stocks and the effects on these stocks of the action beingcontemplated. In this regard the decision makers need scientific advice about the state offish stock.
In studying the state of the fish stocks and the effect of fishery on them, the fisherybiologists should carry out analysis in quantitative terms. To do this we must usemathematics, and to use mathematics the complexities of the real situation must be replacedby more or less simplified and abstract mathematical models. Such models may be used torepresent both quantities of interest (abundance of population, size of individual fish), and therelation getween these quantities.
~wo groups of fish stock assessment models are used for description of fish stock :holistic models and analytical models~The simple holistic models use fewer populationparameters than the analytical models. They consider a fish stock as homogenous biomassand do not take into account , for example, length or age structure of the stock. Theanalytical models are based on a more detailed description of the stock and they are moredemanding in terms of quality and quantity of input data. On the other hand, as acompensation, they are believed to give more reliable predictions.
The type of model to be used depends on the quality and quantity of input data. Ifdata are available for advanced analytical model then such a model should be used, whilethe simple models should be reserved for situation where complete set of input data foranalytical approach is not available, but where the available data exceed the demand of thesimple models. As an alternative to using simple models in this case, the lacking input datacan be replaced by assumptions or qualified guesswork. Often, the lacking parameter for aparticular stock can be replaced by known parameters from another similar stock.
Analytical models
A basic feature of analytical models is that they require the age composition ofcatches to be known. For example, the number of one year old fish caught, the number oftwo year old fish caught, etc. may form the input data.
The basic ideas behind the analytical models may be expressed as follows:(i) If there are "too few old fish" the stock is overfished and the fishing pressure
should be reduced.(ii) If there are "very many old fish" the stock is underfished and more fish should be
caught in order to maximise the yield.The analytical models are "age-structured models" working with concepts such as
mortality-rates and individual body growth rate.rThe data are collected on length frequency of the species. The von Bertalanffy
growth equation is fitted Different steps involved in fitting analytical models are
(a) Collection oi length-frequency data or age structured data.(b) Estimation of growth parameters(c) Estimation of mortality parameters(d) Estimation of maximum sustainable yield

23
(a) Collection of length-frequency data or age structured data
Data are collected from landing centres/fishing villages on gearwise, sexwise andspecieswise catch and length-frequency. The sampling procedure adopted should be randomand it is preferable to collect data on commercially important fishes.
(b) Estimation of growth parameters
The study of growth means basically the determination of the body size as afunction of age. Therefore all stock assessment methods work essentially on agecomposition data. In temperate waters such data can usually be obtained through thecounting of year rings on hard parts such as scales and ototlths. Such rings are formed dueto strong fluctuations in environmental conditions from summer to winter and vice versa.
In the tropical areas such drastic changes do not occur and it is therefore verydifficult, if not impossible to use this kind of seasonal rings for age determination.
However, several numerical methods have been developed which allow theconversion of length frequency data into age composition. Although these methods do notrequire the reading of rings on hard parts, the final interpretation of the results become muchmore reliable if at least some direct readings are available. The best compromise for stockassessment of tropical species is therefore an analysis of large number of age readings onthe basis of rings.
The widely used von Betalanffy growth equation is described as
L(t) = L o: (1-exp(-k(t-to))),
where L(t) is the length at age t,L o: is asymptotic length (mean length of very oldfish),k is the curvature parameter and to is the initial condition parameter.
The parameter of the equation is estimated from length-frequency data. The meanlengths of age groups are determined by Bhattacharya's method. The mean length are usedto estimate the parameters of growth equation by Gulland & Holt plot.
(c) Estimation of mortality parameters
The growth is the positive aspect in the dynamics of a fish stock, where as mortality{death is the negative counterpart. The growth is described by a model and a number ofparameters. Similarly the death process is also described. The key parameters used whendescribing death are called mortality rates.
As it is difficult to get age composition data, the mortality coefficients are estimatedby linearised catch curve based on length composition data. Here we use past data andestimate parameter values under certain assumptions.
For predicting the development of fishery on future under different conditions such asfishing pressure and mesh size of the nets the fishery scientist may use length basedThompson and Bell biomass and yield prediction model. The analysis takes the fishingmortalities by length groups as input and calculates the number caught as well as the stocknumbers.
(d) Estimation of maximum sustainable yield
There are two baste models for estimating maximum sustainable yield(MSY)s fromfish stocks, namely the "yield per recruit" model of Beverton and Holt and its variant.

24
Holistic model
These models are used when data are limited . One of these models is surplus productionmodel. The surplus production methods use catch per unit effort as input. The data usuallyrepresent a time series of years and usually stem from sampling of commercial fishery.Themodels are based on the assumption that the biomass is proportional to the catch per uniteffort as shown if Fig.1 .
MSY --------
------~FISi-lii-/G EFFOr?T
CA TCH PERUNIT OF EFFOR T
YIELD
FISHING EFFOP T
Fig.1 :- Surplus production model
Estimation of maximum sustainable is done by the "surplus production" model ofSchaefer and its variants.
The Schaefer model - in its simplest version at least - is quite easy to handle. Thestep for estimating MSY by means of this model are:-
(i) Catch (Y) and effort (f) data are tabulated and catch per unit effort is computed.(ii) Catch-per -unit effort values against this corresponding values of effort are
plotted. A linear regression line is fitted to the data and intercept (a) and the regressioncoefficient (b) are determined.
Y/f = a + bf(Hi) MSY is estimated as a2 1(-4b),optimum effort f(msy) as a/(-2b) andyield (Y) for a given effort (f) as af -bf2
An alternative model was introduced by Fox. It gives a straight line when thelogarithm of (Y/f) are plotted on effort.
Here, the model is expressed asLn(Y(i)/f(i)) = c + d f(i)optimum effort is estimated as f(msy) = -1Id andMSY is estimated as MSY= -(1/d)exp(c-1)
Suggested Readings
1. Sparre,P., Urkin, E. and Venema,S.C., 1989.lntroduction to tropical fish stock assessment-Part I-Manual. FAO Fisheries Technical Paper 306/1.
2. PauIY,D., 1983.Some simple methods for the assessment of tropical fish stocks.FAO Fisheries Technical Paper NO.234. ••
3. Gulland,J.A., 1977 .Fish Stock Assessment-A Manual of Basic Methods,Vol-I.John Wileyand Sons, New York.

25
Concepts and Methodologies for Fishery Management in ReservoirEcosystems
C. SelvarajReservoir Division
Central Inland Capture Fisheries InstituteBangalore 560010
Introduction:
Though the vast water resources of the reservoirs offer immense scope for achieving highfish production, their potentiality is not being harnessed properly. As these reservoirs are mainlymeant for hydel power generation, flood control, irrigation, supply of drinking water, etc., thereis not much scope for altering the existing ecological conditions due to the sharp fluctuation inthe water level brought about by the constant inflow and outflow of the water. However, theirnatural biogenic production potentiality can be profitably exploited for enhancing the fish yieldthrough the adoption of scientific management techniques of judicious stocking and harvesting.However, a vast majority of them remain either undeveloped or underdeveloped due to theinadequate understanding of their production dynamics and consequent low level of adoption ofthe scientific management strategies. Hence, the Reservoir Division of the Central InlandCapture Fisheries Research Institute undertook detailed investigations to evaluate the productionpotentiality of some of the small reservoirs. The studies have brought to light the reasons for thelow fish yield being obtained as against the great production potentiality in these small reservoirsin Peninsular India. The ecology-based investigations carried out in Aliyar reservoir (av. area:324 ha) and Thirumoorthy reservoir (av. area: 234 ha) in Tamil Nadu have helped to formulatecertain valuable guidelines that would go a long way in bridging the wide gap between the greatproduction potentiality and the actual yield being obtained from these reservoirs. The studies onthe ecology-based scientific management in these reservoirs will help in embarking on fisherydevelopment in similar reservoirs.
I. Importance of ecological investigations:
\ The detailed investigations on various ecological parameters are the most important pre-requisites before undertaking any massive fishery development in the reservoirS)The formationof the reservoirs across the rivers bring about very conspicuous changes in the ecologicalconditions in the newly formed lotic environment which is influenced by the morphological,edaphic and climatological features. The production potentiality of the reservoir is determined bythe inherent quality of water and soil, inflow of .allochthonous nutrients, the quantity of theconstant inflow and outflow of water, etc. Hence, it~~fparamount importance to have a thoroughunderstanding of all the ecological conditions including the physico-chemical parameters ofwater and soil, the biotic communities like plankton, periphyton, bottom macrofauna, primaryproductivity, etc. before planning the course of actions for enhancing the fish yield from thereservoirs (Selvaraj et al., 1997) .
•

26
H. Importance of stocking:
Existing fish fauna : Detailed investigations have to be undertaken to assess the existing fishfauna in the reservoir. The studies would help to find out the existence of the unwanted as well asthe commercially important species of fishes and 'the extent of their contribution to the yield ofthe reservoir. Then, it can be decided about the introduction of the fast growing carps forenhancing the fish yield. It is also important to investigate the maturation and breeding behaviourof the different fast growing carps which are introduced into the reservoir. There were instanceswhere the carps introduced failed to attain proper maturation in their establishing in the reservoir(Joseph et al., 1990 ; Selvaraj et al., 1990 a). Hence the fishery has to be sustained throughregular stocking of advanced fingerlings of the fast growing major carps (Selvaraj et al., 1996-b).
Size of the fingerlings to be stocked: It is often noticed that enough care is not taken to decidethe size 0 f the fingerlings to be stocked. The fish seed produced in the government fish farms aredisposed off to private fish farmers as early fry in order to avoid heavy mortality due to over-crowding in the farm ponds. In their anxiety to achieve the target of seed production in the farmas well as achieving the target of stocking in the reservoir, the early fry are stocked in thereservoir, resulting in heavy mortality during the transport and also in the reservoir due topredation by piscivorous fishes already existing in the ecosystem. Hence, it is desirable to rearthe fry in the farm ponds till they attain the size of advanced fingerlings of more than 100 mm inlength. This ensures better survival of the seed stock in the reservoir (Table).
Density of stocking: The reservoirs are invariably stocked at high stocking density without anyrelevance to the carrying capacity of the reservoir, resulting in heavy mortality and poor fishyield. The studies have indicated that the stocking density can be drastically reduced when thereservoirs are stocked with advanced fingerlings of over 100 mm in length. It is found that it issufficeint to stock the small reservoirs at a low stocking density of 200-300 advanced fingerlingsof major carps (Fig. 1).
Ratio of differnt species stocked: Since detailed studies have already been undertaken, thequantum and quality of various biotic organisms available in the ecosystem are known. Hence,with the background knowledge of the food and feeding habits of different species of fish andalso the different feeding niches available in the reservoir, it becomes easy to decide about theratio of the species to be stocked.
The ratio of the different species also depends on their different growth rate in a particularecosystem with different feeding niches. Hence, it is highly essential to assess the growth rate ofdifferent species. This can be carried out through various marking techniques. The experimentson tagging of fishes have not yielded satisfactory results. However, the method of group markingthrough clipping of the pelvic fin has been proved to be more successful means to evaluate thegrowth rate of different fishes in the open water ecosystem (Selvaraj et al., 1987; Murugesan etal., 1990; Murugesan and Selvaraj, 1990).

27
Experiments carried out at Thirumoorthy reservoir have established that the manualremoval of the pelvic fin from advanced fingerlings of carps with fingers has proved to be veryeffective means of marking the carps. The process is easy to perform and saves a lot of time inmarking a large quantity of fingerlings at a time. The wound caused by clipping of the fin istreated with hydrogen peroxide, followed by an application of furacin cream to avoid anypossible infection. The rate of recovery of the clipped specimen was ranging from 5.8 % (rohu)to 43.2 % (catla). Thus the method of clipping for group marking helps not only for assessing thegrowth rate and survival of different species of fishes but also for formulating the stocking andexploitation strategies so as to achieve a sustained optimum yield from the reservoirs(Murugesan, et al., 1998).
Period of stocking: The reservoirs are often stocked within a short period between August andOctober every year, resulting in heavy competition for food among the seed of the same agegroup and also there is a great stress on the population density at a given time of the year. Thisresuts in stunted growth and subsequent heavy mortality, leading to poor fish yield. The studieshave indicated the need for stocking the seed through all the months of the year (Fig.2) to ensurebetter survival and growth of the stocked varieties of fishes (Selvaraj and Murugesan, 1990).
Ill. Importance of judicious harvesting:
It is advisable to operate gill nets with 50 mm meshbar so as to ensure the harvesting offishes of more than 1 kg in size. As it is well known, the financial return through the sale ofmajor carps of more than 1 kg in size is much more than the sale of undersized fishes due to thedifference in the selling price. Besides, the fishes must be provided with enough opportunity toattain the harvestable size within the shortest time possible because of their great growthpotentiality during the early part of their free-life period in the reservoir.
IV. Conclusion:
~hus, the adoption of t~e scientific r:nan~gement techniques resulted in a record fis.h yieldof 193.58 kg/ha/year from Aliyar reservoir WIth an average of 132.67 kg/ha/year dunng theperiod of 7 years. Simultaneously, the contribution to the total yield by t~!(major carps alsoimproved substantially (87.0 - 99.1 %) with an average of 95.0% (Fig. 3~}nterestingly, themedium and minor carps and also other miscellaneous uneconomic species of fish have almostdisappeared (Selvaraj and Murugesan, 1990). Besides, the catch per unit effort also increasedconspicuously (16.91 kg) as against the poor catch per unit effort of 4.95 kg obtained before theadoption of the scientific management techniques. As a result of the better management strategy,the revenue also increased substantially (669%).
rhe investigations have revealed that the fish yield depends more on the quality of theseed stocked rather than their quantity (Fig. 4). The studies have established that the smallreservoirs can contribute substantially to the freshwater fish production] Even at a modest yieldof 100 kg/ha/year, a significant improvement in the revenue can be achieved through theadoption of the scientific management techniques,

28
....The scientific management techniques developed at Aliyar reservoir were put to test in a
similar reservoir - Thirumoorthy reservoir (av. area: 234 ha) located under similar geoclimaticconditions, resulting in a record production of213.4 kg/ha/year during 1996-97, with an averageyield of 149.35 kg/ha/year (Selvaraj et al., 1994; Selvaraj et al., 1997; Murugesan, 1997).
Thus the results obtained in Aliyar and Thirumoorthy reservoirs have established thatthere is tnnendous scope for achieving several-fold increase in fish production from all suchreservoirs, irrespective of the area of the reservoir or the existing fisheries in the reservoirthrough the adaption on these techniques to suit to the local needs of any such reservoir in theregion,
References:
Joseph, K.O., C. Selvaraj, V.K. Murugesan and P.K. Aravindakshan, 1990. Observations on theeffect of low electrolyte reservoir water on carp 'eggs hatching and survival rate. In:(Eds.) Jhingran, Arun, G., V.K. Unnithan and Amitabha Ghosh. Contribution to thefisheries of inland open water systems in India, Part I, 141-146.
Murugesan, V.K., 1997. Yield optimization in small reservoirs - a case study in Thirumoorthyreservoir. In: Summer School on Fisheries Enhancement in Small Reservoirs andFloodplain Lakes, CIFRI, Bulletin No. 75, pp 133-139.
Murugesan, V.K. and C. Selvaraj, 1990. Observation on fin-clipping of carps cultivated inreservoirs. In: The Second Indian Fisheries Forum Proceedings, Mangalore, India, pp153-155.
Murugesan, V.K., C. Selvaraj and P.K. Aravindakshan, 1990. Growth of major carps in Aliyarreservoir based on the recovery of marked fish. In: (Eds.) Jhingran, Arun, G., V.K.Unnithan and Amitabha Ghosh. Contribution to the fisheries of inland open watersystems in India, Part I, 115-121.
Murugesan, V.K., C. Selvaraj and S. Manoharan, 1998. Role of fin-clipping in fisherydevelopment in reservoirs. In: Fourth National Seminar on Fish and their environment,Bangalore, 21-23 January, 1998 (Abstracts).
Selvaraj, c., 1997. Yield optimization in small reservoirs - a case study in Aliyar reservoir. In:Summer School on Fisheries Enhancement ill Small Reservoirs and Floodplain Lakes,CIFRI, Bulletin No. 75, pp 127-131.
Selvaraj, C., Mathew Abraham and K. Gopinathan, 1987. Validity of fin-clipping to 'study thegrowth rate of Gangetic carps in Aliyar reservoir, Tamil Nadu. 1. Inland Fish. Soc. India,
I
19 (1): 74-77.

29
Selvaraj, C., M. Kaliyamurthy and K.O. Joseph, 1990 a. Gonadal maturation in major carps withparticular reference to hydrological features of Aliyar reservoir. 1. Nat. Acad. Sci. India,59: (B) (ll): 147-154.
Selvaraj, C. and V.K. Murugesan, 1990. Effect of intensive stocking of advanced major carpsfingerlings on the fishery of Aliyar reservoir. In: The Second Indian Fisheries ForumProceedings, Mangalore, India, 157-159.
Selvaraj, C. and V.K. Murugesan, 1990. Management techniques adopted for achieving a recordfish yield from Aliyar reservoir. In: (Eds.) Jhingran, Arun, G., V.K. Unnithan andAmitabha Ghosh. Contribution to the fisheries of inland open water systems in India, Part1,86-98.
Selvaraj, C., V.K. Murugesan and P .K. Aravindakshan, 1990 b. Impact of stocking of advancedfingerlings on the fish yield from Aliyar reservoir. In: (Eds.) Jhingran, Arun, G., V.K.Unnithan and Amitabha Ghosh .. Contribution to the fisheries of inland open watersystems in India, Part I, 109-114.
Selvaraj, c., V.K. Murugesan, V.K. Unnithan and S. Manoharan, 1994. Fish productionpotentiality in small reservoirs in Tamil Nadu. 1. Inland Fish. Soc. India, 26(2): 9-16.
Selvaraj, c., V.K. Murugesan and S. Manoharan, 1997. Record fish yield from Thirumoorthyreservoir under scientific management. In: National Seminar on changing perspectiveson inland fisheries, Barrackpore, March 1997. (Abstracts).
Selvaraj, c., V.K. Murugesan and V.K. Unnithan, 1997. Ecology-based fishery management inAliyar reservoir. CIFRI Bulletin No. 72'

C.catla L.rohita C.mrigala C.carpio Himolitrix C.idellus Total
Total no. offingerlings 2,80,808 1,36,277 1,38,446 1,45,065 14,712 1,956 7,17,264stocked
Composition(%) 39.1 19.0 19.3 20.2 2.1 0.3 100 w
0
No. of fishharvested 39,715 34,252 43,246 32,264 1,643 4 1,51,124
Averagerecovery (%) 14.1 25.1 31.2 22.2 11.2 0.2 21.1
Table 1. Total quantity of fingerlings stocked and harvested from Aliyar Reservoir during 1985-92.
I l.

~ .... ~I
STO
CK
ING
(NO
.IN
LAK
HS)
-~
NW
-l>-
U1
(J)
-.j
eo(C
l0 I
I
(f)
1962
-63
...•. 019
63-6
4o A :::J
1964
-65
(Q -,19
65-6
6tu ...•. CD
1966
-67
tu :::J19
67-6
80
.. '<I19
68-6
9CO· 0.
.CJ
l19
69-7
0-l
:::J0
1970
-71
0»
A Z19
71-7
2-:.::
:"(j)
tuZ
1972
-73
-, ;;U0 CJ
l19
73-7
4CD (f
)Z
CD~
1974
-75
<A
0I
1975
-76
-,CJ
l0
..
t1976
-77
c ::::!-
1977
-78
:::J (Q-< m
1978
-79
->.
r<
00
(J)
-;;;:
1979
-80
~<C
I:T
1980
-81
<0
~N
1981
-82
1982
-83
1983
-84
1984
-85
1985
-86
1986
-87
1987
-88
1988
-89
1989
-90
1990
-91
1991
-92
~ 0N
-l>-
(J)
co~
~~
~N
00
'00
0N
-l>-
(J)
ce0
00
00
00
YIEL
D(k
g/ha
)
tE
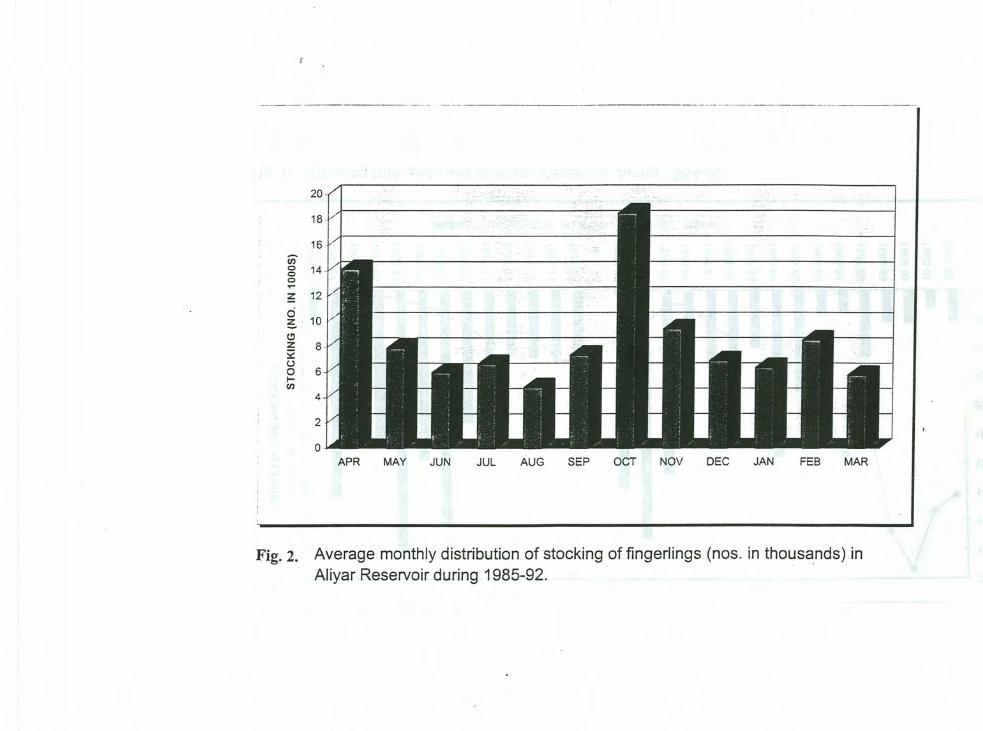
-------------------- ---_._._---------------------------------------------
eng 14o-~ 12o~ 10(!)z~oo 6~en
16
4
2
APR MAY JUN JUL AUG SEP OCT NOV DEC JAN FEB MAR
Fig. 2. Average monthly distribution of stocking of fingerlings (nos. in thousands) inAliyar Reservoir during 1985-92.
l L

100
90
80
70
60
50
401-
30
20I,
10
0io <0 r- co (]) 0 T"" N '" ~ lO <0 r- co (]) 0 T"" N '" ~ eo <0 r-, co (]) 0 T"" N
<0 <0 <0 <0 <0 r- r- ";- r- r- r- r- r- r- r-; co co "? co co co co co eo co (]) (]) O?~ ,;, ch r-:. ch 6 0 T"" N M ~ ,;, ch r-:. ch 6 0 T"" N M ~ ,;, ch r-:. ch 6 0 T""
<0 <0 <0 <0 <0 <0 r- r- r- r- r- r- r- r- r-, r- co co co co co co eo co co co (]) (])
en (]) en en (]) (]) (]) (]) (]) (]) (]) (]) (]) en (]) (]) (]) en (]) (]) (]) en en (]) (]) (]) (]) (])
T"" T"" T"" T"" T"" T"" T"" T"" T"" T"" T"" T"" T"" T"" T"" T"" T"" T"" T"" T"" T"" T"" T"" T"" T""
• Major carp ~ Miscellaneous Data not available for 1982-83
ww
Fig. 3. Percentage composition of commercial fish catch in Aliyar Reservoir before (1964-85) and after(1985-92) CICFRI management.

~
":rj •... ~ J:>. 3 -0 0> n. o -+, (J
)e-
e- o o z: ::J co o -+, 0> 0. < 0> ::J o CD 0.
:::n ::J co CD :l.
::J co (J) o ::J r+ :::T CD '< ro' 0. -+, a 3 ::t> -<' 0> ...., ::0 CD (J
) CD :< o :-'
Ili1•
o~
etID
P'u·
I'D0
Ii1
101
"
YIELD
(kgJha
)STO
CKmG
(nolh
~)~
~~
tu...
l...l
N~fJl
QJQ~
J~o
(Jl0
(JlQ
oo
oo
ac
oo
co
oo
o
n ID 11
'0
1862-8
5
1985·8
6
1986-8
7
1987-8
8
1988-8
9
1989-9
0
1990-9
1
1991-9
2
1ge5~9
2
-,
toE

35
Classification, morphometry and basic limnological features for evaluating fishyield potential of reservoirs
M. RAMAKRISHNIAHReservoir Division
Central Inland Capture Fisheries Research InstituteNo.22, Rajajinagar IV Block, Bangalore - 560010 India
Introduction
~eservoirs are man-made ecosystems constructed with a view to harnessing the immensepotential of river systems for irrigation, power generation and to meet water supply demands ofindustries, cities and townships) According to UNESCO report (1978) the total surface area ofworld's reservoirs is about 60 million hectares. The erstwhile USSR has an area of over 5 million
\ ha followed by USA with 4 • million ha and in Southeast Asia it is expected to reach 15 million haby the end ofthe century (Lapitzsky 1965, Bhukaswan, 1980). Some of the largest man-made lakesare in Africa and Russia. The reservoirs of India are not comparable in area to those of Africa andRussia. In India the reservoir resource is estimated at over 3 million ha which is expected to doublein the near future. In P.R. China the cultivable area under reservoirs is over 2 million haconstituting 40% of total freshwater area.
r-
Fisheries development is reservoirs on scientific lines is of recent origin. In USA theemphasis is for sport and in other countries it is mainly for production of commercial fisheries. Inrecent years China has made rapid strides in the development of reservoir fisheries. India is on thethreshold of a break through in this field) .
Classification of reservoirs
The need to evolve a classification for reservoirs from fisheries management point of viewis well recognised. However, there are no set norms or criteria to classify reservoirs according tothe size. Every country and state has its own norms. The Indian Institute of Management,Ahrnedabad (Srivatsava et al 1984) classified reservoirs into small « 1000 ha), medium (1000 -5000 ha) and large (> 5000 ha) ones .. In China they have been categorized as huge (> 6670 ha),large (670- 6670 ha), medium (70-760 ha), small (70-70 ha) and mini (6-7 ha) reservoirs.
In general reservoirs could be categorised as small and large and the distinguishing featuresmay be summarised as follows.

36
Small reservoirs "
Dams built of earth, stone ormasonry on small tributariesand streams.
Provided with concrete orstone spill way.
Single purpose reservoirs.
May dry up in summer.
Shore line not very irregular,sheltered areas absent.
Maintains connection with theriver above only during floodseason.
Shallow and biologically moreproductive
Can be subjected to experimentalmanipulation for testing ecosystemresponse to environmental modifi-cations.
Breeding of major carps do not takesplace, if occurs, it is invariablyobserved above spill way.
Fisheries development envisagesannual stocking and croppingpolicy.
Large reservoirs
Dams built with preciseengineering skill, elabo-rate with cement concreteor stone on long rivers.
Provided with morecomplex engineeringdevises.
Multipurpose.
Always maintain a conser-vative pool.
Shore line irregular,sheltered areas by way ofbays and coves present.
Maintains connection withparent river for prolongedperiods.
Deep and less productive
Cannot be subjected toexperimental manipulations
Breeding mostly observedin the head waters.
Fisheries developmentcombines principles ofculture and capturefisheries.
(Modified from Jhingran 1986)
-- ----------

37
Trophic changes in reservoirs
Reservoirs, being man made, differ from natural lakes in their origin and trophic evolutionand in morphometric and edaphic factors. Natural lakes commence with oligotrophy and evolve toeutrophy, the process being very slow. In contrast, reservoirs pass through three distinct phases,namely initial high fertility, trophic depression and final fertility (NeeI1967, Jhingran 1975)w
The newly formed impoundment inundates vast tracts of forest and agricultural land. Thedecay of submerged vegetation releases nutrients causing initial fertility leading to intensedevelopment of fish food organisms. This initial surge which may last 2 to 3 years is followed by astate of trophic depression caused by rapid utilization of the nutrients. This phase is marked by lowproduction of fish food organisms, lower fish growth, hence less production. Its duration isvariable and depends on the climatic and hydrological conditions of the impoundment. In Russiatrophic depression lasts 6 to 10 years in southern impoundments and upto 25 to 30 years in northernreservoirs(Lapitzky 1965). After the depression period the reservoir recovers with theaccumulation of nutrients. The final fertility is reported to be much lower at half of the initial phasein some reservoirs of USA (Kimsey 1957).
In tropical Indian reservoirs the trophic depression phase lasts for much shorter period dueto favourable climatic and drainage characteristics and the final fertility is also found to be of amuch higher magnitude than the initial one (Ramakrishniah 1988).
Indices of Reservoir productivity
The factors responsible for potential productivity of freshwater bodies have long interestedlirnnologists. The extensive work carried in Lake Survey in USA and Russia have given us.valuable information about the indices oflake productivity. Moyle (1949)in his pioneering work inMinnesota ponds used the results on productivity interchangeably with those obtained in lakes. Theresults of these investigations formed the basis in evaluating the productivity of a number of pondsin eastern and central part ofIndia on the basis of water quality (Bannerjee 1979) which were lateradopted t6~rvoirs (Jhingran and Sugunan 1991).
Factors affecting the biological productivity could be conveniently grouped into 3categories, namely climatic, edaphic and morphometric features (Rawson 1955). Edaphic factorsdetermine the primary trophic status of the reservoir. The extent of drainage area, its rate of erosionand run off are the important limiting factors in the supply of nutrients and organic matter. Basinmorphometry, particularly mean depth and climate to a considerable extent determine theutilization of nutrients. Rawson (1955) listed a combination of morphometric and lirnnologicalparameters as possible indices of lake productivity. They are area, mean depth, shore development,storage ratio, water level fluctuations higher mean temperature, average near bottom oxygen atmid-summer, average secchi-depth visibility, total dissolved solids and gases, average standingcrop of plankton and bottom fauna per unit area average catch of fish in standard gill net.

38...J
Morphometric and drainage characteristics
Mean depth
Mean depth (volume/area) is considered to be the most important parameter which isindicative of the extent of euphotic-littoral zone. It is an inverse correlate of shore development anddirect correlate of area and an exact correlate of volume when area held constant (Hayes 1957).Rawson (1955) has observed distinct inflexion in mean depth curves at 18 m which suggest thatwater mass below this depth serves a 'nutrient sink'. However, some of the deep reservoirs in Indiasuch as Gobindsagar (m.d=55 m), Nagarjunasagar (50 m) Aliyar (18 m) Amaravathy (13.7 m) Werefound to be productive. It appears that in Indian reservoirs depth is not a constraint for production.
Catchment
Catchment plays a major role in loading nutrients and organic matter into the reservoir. Theamount of loading of allochthonous inputs is a function of the ratio of catchment to reservoir area.In Indian reservoirs it has been observed that the catchment largely determines the quality of waterrather than the basin soil (Natarajan 1976). It can reasonably be predicted that higher the catchmentto reservoir area higher is the productivity ofthe reservoir.
Flushing rate
Flushing rate is important since it regulates both the degree and regime of nutrient loading(Vollenweider 1969). Flushing rate defines the retention time of any unit volume of water withinthe lake and is determined by the size and shape of the lake basin as well as by the in-flowing andout- flowing streams.
Shore development
Shore development index (S/2--.Jna,where S = shoreline length, a = area of the reservoir)indicate the degree of irregularity of shore line. Higher the value, higher the irregularity.Reservoirs with sheltered areas like bays and coves have dendritic shore line and extensive littoralareas and likely to be more productive.
Volume development
Volume development index (3 x mean depth/max, depth) indicated the nature of the basin.If the value is above one, the basin is cup shaped with its walls concave towards water. On theother hand if the value less than one, basin is saucer shaped with the walls convex towards water.Deep reservoirs with less of littoral areas generally have the VDI more than one and likely to beless productive.

39
.J
Limnological characteristics
Temperature
The. climatic factort especially temperature has a profound influence on utilization ofnutrients. It varies with latitude and altitude. Reservoirs at higher latitudes and altitudes aregenerally less productive than their counterparts at lower latitudes and altitudes. In tropicstemperature is not a constraint in biological productivity. Thermal stratification is not generallyobserved in Indian reservoirs of lower latitudes, when occurred it is ephemeral. High bottomtemperatures prevail in deep tropical reservoirs and the difference between surface and bottom- islow. However, in warm temperate zone thermal stratification occur regularly in summer, beingbroken by flood water in monsoon and convection currents in winter.
Turbidity
Inorganic turbidity caused from suspended colloidal particles prevent light penetration andreduces trophogenic zone. Inorganic turbidity may be of autochthonous or allochthonous origin.
Dissolved oxygen
DO above 5.0 ppm considered to be good for fish life. Oxygen deficit at the bottom insummer is a characteristic feature of productive reservoir. The oxygen curve is the most dependableindicator of productivity of the reservoir. Photosynthesis at the surface and tropholytic activity atthe bottom cause klinograde oxygen distribution and was recorded in all productive reservoirs inIndia. The strength of oxycline is a good index of the degree of productivity of reservoirs. In lowproductive waters oxygen curve is orthograde.
Apart from indicating the trophic status of the reservoir, the oxygen regime also aids infishing operation. As fish prefer well oxygenated waters, a knowledge of vertical distribution ofoxygen help operators- to lay gill nets at appropriate depths.
pH, carbon dioxide and alkalinity
pH between 7 and 8.5 are favourable for production. Change in pH with depth is an indexof productivity. In reservoirs with klinograde oxygen distribution the carbondioxide andbicarbonate concentration show a general inverse relationship with oxygen i.e., free CO2 and HC03increase with depth. Vertical difference in HC03 between the surface and the bottom indicate theutilization in the surface and accretion in the bottom due to trophogenic and tropholytic activityrespectively.
The alkalinity is generally caused by carbonates and bicarbonates of calcium andmagnesium. These with dissolved CO2 in water form an equilibrium which play an important rolein the productivity of the system. Based on the work in Minnesota lakes, Moyle (1949) classified

40
lake productivity on the basis of alkalinity. Lakes with a total alkalinity upto 20 ppm as very softwaters and have low productivity, 20-40 ppm as soft waters with low to medium productivity,41-90 ppm as hard waters with medium to high productivity and 100 ppm or more as hard waterswith high productivity.
This classification has been extensively applied to reservoirs as well. However, in Indianreservoirs, it has been shown that alkalinity is not a dependable parameter in assessing productivity.Soft water reservoirs with low alkalinity (20-40 ppm) such as Amaravathy, Aliyar and somereservoirs with catchment of western ghats are found to be highly productive.
Essential nutrients
Nitrogen is a basic constituent of protein and occurs in water in free state N, NH3, N03,
N02 and organic nitrogen. It is observed that a dissolved nitrogen concentration of 0.2 to 0.5 ppmmay be considered favourable for production. But many of the productive reservoirs in India haveNOrN in low concentration, often in traces.
Another essential nutrient is dissolved phosphorus (P04-P). A concentration of 0.1 to 0.2ppm is considered to be optimal in ponds and lakes for higher production. But in the mostproductive reservoirs of India this element was found in traces.
Organic matter
Organic matter in reservoir ecosystem comes from two sources - autochthonous throughphotosynthesis and allochthonous from the catchment through run off. Allochthonous input oforganic matter is very important in reservoir ecosystem. The amount of loading of allochthonousorganic matter is a function of relative size of the reservoir to its catchment. It varies from largevisible particles to dissolved fractions. Organic matter functions as a i) food source for benthicfeeding fishes and invertebrates, ii) as a substrate for bacterial growth and other micro organismsand iii) the dissolved organic compounds function as exogenous growth substances, vitamins andchelating agents. Organic matter by itself is of low nutritive value but it is often fortified by thecolonising bacteria and fungi and make it more nutritious. It forms the major part of the energyrequirement of zooplankton in reservoirs on account of its high concentration and is oftenconsidered as food larder for zooplankton (Moss 1980)·
Plankton
Plankton community plays a significant role in reservoir productivity as it is directly takenby certain fishes while the dead plankton adds to the organic matter budget of the reservoir.Plankton shows a pattern of seasonal dominance in reservoirs. A plankton pulse withpredominance of zooplankton generally occurs immediately after the monsoon inflows (Oct-Dec.)and the other during pre-monsoon months (Feb-May). In oligotrophic reservoirs zooplanktonpopulation dominates while in eutrophic reservoirs it is the phytoplankton. Bluegreen algae
41
(Microcystis) dominate in lower latitudes, dinoflagellates (Ceratium) in higher latitudes and greenalgae (Pediastrum, Spirogyra) in higher altitude reservoirs.
Copepods (Diaptomus, Cyclops) are the main constituents of zooplankton followed byc1adocerans (Diaphanosoma, Moina, Bosmina) and rotifera (Brachionus, Keratella)
Bottom macrofauna
High shore line development, variable slopes and vegetation association produce a largenumber of benthic habitats in reservoirs. Molluscs, dipteran larvae (Chironomus and Chaoborusioligochaetes constitute the major component of benthic macro fauna in reservoirs. Chironomidspredominate in reservoirs which show frequent oxygen deficits at the bottom. Molluscs prevail inalkaline waters with high calcium concentration. The main energy source of the community isfresh seston (sum ofparticulate organic matter living and dead) which by the activity of the animalsand bacteria is converted to more refractory sediment. Bottom deposits along with the fauna andflora account for the major fish food resource in reservoir ecosystem. The major carps C. mrigala,L. rohita, L. calbasu, L. fimbriatus and the common carp feed on this resource whereas molluscsare taken by P. pangasius.
Periphyton
Deposits of micro plants and animals on submerged substrate forms the food resource forbrowsing fishes such as L. rohita, L. calbasu and L. fimbriatus. The periphytic organisms arerepresented mainly by diatoms, green and blue-green algae. Presence of littoral aquatic vegetationenhances the substratum for periphyton.
Aquatic macrophytes
Aquatic macrophytes, generally do not take a permanent foot hold in reservoirs due to steepwater level fluctuations. However, they do occur in old eutrophic reservoirs. Submerged specieslike Hydrilla, Vallisneria, Potamogeton and Najas were found in some reservoirs. A high densityof macrophytes are undesirable as they lock-up essential nutrients and deprive them tophytoplankton. On the other hand a high diversity of macrophytes ensure diverse habitats forinvertebrate fish food organisms, there by increasing the diversity of these organisms as well.When present in moderate quantities macrophytes increase the stability of the ecosystem. Inreservoirs with submerged macrophytes L. rohita has done extremely well probably due to largebrowsing area provided by the macrovegetation.
Models for fish yield prediction
Prediction of fish yield potential is sine qua non for initiating scientific fisheriesmanagement of reservoirs. Such predictions may be approximate which could be refined during theprocess of development with the feed back obtained on the performance of different fish species.

42
According to Henderson et al (1973) timeliness in estimating fishery potential is more importantthan precision in the earlier period of development.
Several empirical models are available for the prediction of fish yield using morphometricand limnological parameters such as area, mean depth, total dissolved solids phosphorus, primaryproduction and phytoplankton (Rawson 1952, Ryder 1965, Oglesby 1967, Hanson and Legget1982). In Asian reservoirs Moreau and De Silva (1991) examined several parameters andconcluded that morphometric features appear to be more valuable as fish yield predictors thanbiological features. According to them water shed area, by itself or in combination with othermorphometric features such as mean dept~ appear to have potential for development of yieldpredictor models. Some of the widely used models are discussed below.
Morphoedaphic Index (MEI)
It is one of the simplest and widely used models. Proposed by Ryder (1965), MElcombines an edaphic factor, total dissolved solids (TDS) and a morphometric factor, mean depth(z). The relationship is expressed as :
MEI =TDS/z
The fish yield is calculated from the regression equation of the form Y = Kxa, where, Y=fish yield,
x=MEI and K=a constant that represents a co-efficient for climatic effects and 'a' an exponentappoximating 0.5. MEI has provided a useful first approximation of potential yields in northtemperate lakes and it was soon extended to lakes and reservoirs of Africa (Henderson andWelcomme 1974) and Sri Lanka (Wijeyaratne and Costa 1981). The model is a reasonablecompromise between unmanageable complexity and ecological over simplification (Ryder 1982).Its appropriate application pre-supposes both a fisheries and limnological expertise. Ryder (1982)advocated development of regional and infra-regional models for homogenous data sets where TDScould be replaced with any other useful variable in that particular data set.
In Indian reservoirs TDS and its positive correlates total alkalinity and conductivity arefound to be undependable to predict productivity. The regression equation of MEI (usingalkalinity) on fish yield for Indian reservoirs has the following form :
Y = 7.738 MEI°.469 (r = 0.34)
The low cOJ{,;elationis indicative of the low precision of the model. Jhingran (1986) andSreenivasan (1989)t?c;;~ntedout that MEI model is not strictly applicable for Indian reservoirs.
Ramakrishniah (1990) modified the MEI substituting a drainage parameter, the ratio ofcatchment to reservoir area, in place of TDS and the new Index is called Morphodrainage Index(MDI) The regression obtained between yield (kg/ha at FRL) and MDI for 20 reservoirs has thefollowing form :

43
Y = 4.012 MDIo.902 (r = 0.77)
The exponent being close to one, the yield (Y) could be approximately taken at four timesthe MD!. This model appears to be suitable for Indian reservoirs as a fish yield predictor. Its utilitylies in the fact that the parameters could be obtained from the dam authorities even before theformation of the impoundment. '
Tropbodynamic model
The relationship of fish yield to primary production has been described by Henderson er al(1973). They opined that most trophic transfer efficiencies may tend to be low in waters of lowprimary productivity and high in waters of high primary productivity. Melack (1976) drew aregression between fish yield (Fy) and gross photosynthesis (PG) for 15 Indian reservoirs which hasthe form;
log Fy = 0.122 PG + 0.95.
The superior predictive ability of PG was also recognized by Me Connel et al (1977).Natarajan (1979) stated that 1% of gross production provides a fairly dependable lirnnologicalguide to fish productivity in reservoirs. However, even in best managed Indian reservoirs less than0.2% of conversion of photosynthesis has been obtained as fish yield (Natarajan and Pathak 1983).
CLU.to:-~
The trophodynamic model is likely to be effective in systems driven largely by :-t<i:thonousinputs. On the other hand reservoirs with high flushing rate where allochthonous inputs are sizableeither MEI or MDI could be attempted to obtain a prediction of fish yield.
References
Bannerjee, S.M. 1979. Soil condition and water quality of man-made reservoirs of India. In:Summer institute on Capture and Culture Fisheries of the Man-made lakes in India. CIFRlBarrackpore, 7 July to 6 August, 1979.
Bhukaswan T. 1980. Management of Asian reservoir fisheries. FAO Tech paper, 207 : 69 p.
Hansen, L.M. and W.e. Legget 1982. Empirical prediction of fish biomass and yield. Can. JFish. Aquat. Sci., 39 : 267 - 263.
Hayes, F.R. 1957. On the variation of bottom fauna and fish yield in relation to trophic level andlake dimensions. J Res. Board Can., 14: 1 - 32.
Henderson, H.F., R.A. Ryder and A.W. Kudhongania. 1973. Assessing fishery potentials of lakesand reservoirs. J Fish. Res. Board Can., 30 ; 2000 - 2009.

44.1."
Henderson, H.F., and R.L. We1comme, 1974. The relationship of yield to morpho - edaphic indexand numbers of fisherman in African Inland Fisheries. CIFA Occas. Pap (1) : 19 p
Jhingran, A.G. 1986. Reservoir Fisheries Management in India. Bull. CIFRl, Barrackpore, 45 : 65p.
Jhingran, A.G. and V.V.Sugunan. 1990. General guidelines and planning criteria for small reservoirfisheries management. In : Proc. of National workshop on Reservoir Fisheries, 3-4 Jan.
1990, (eds. Jhingran AG. and V.K. Unnithan). Asian Fisheries Society, Indian Branch,Mangalore: 1-8.
Jhingran, V.G. 1965. Report on Inland Fisheries Research and Management and Fish culture in theUSSR. Mise. Contr. Cent. Inl. Fish. Res. Inst. Barrackpore, 5 : 27 p.
Kimsay, lB.1957. Fisheries problems in impounded waters of california and the lower Colaradoriver. Trans. Am. Fish. Soc., 87 : 319 - 332.
Lapitzsky, 1.1. 1965. Development of Fisheries and the ways of raising fish productivity in bigreservoirs. Rep. FAO/UNDP (TA), 2547 : 124-134.
McConnel, W.J., S. Lewis and lE. Olson 1977. Gross photosynthesis as an estimator of potentialfish production. Trans. Am. Fish. Soc., 106 : 417 - 423.
Melack, lM. 1976. Primary productivity and fish yield in tropical lakes. Trans. Am. Fish. Soc.,105 : 575 - 580.
Moreau, J. and S.S. De Silva. 1991. Predictive fish yield models for lakes and reservoirs of thePhilippines, Sri Lanka and Thailand. FAO Fisheries Technical Paper, No. 319 : 42 p
Moyle, lB. 1949. Some indices oflake productivity. Am. fish. Soc. Trans. 76: 322-334.
Moss. B. 1980. Ecology of Fresh waters. Blackwell Scientific Publications, London, 332 p.
Natarajan, AV. 1976. Ecology and state of fishery development in some of the man-madereservoirs of India. In: Symposium on the development and utilization of Inland Fisheryresources. Colombo, Sri Lanka, (27-29, October) Indo Pacif. Fish. Coun.,15 p
Natarajan, A V. 1979. Ecosystem oriented approach for reservoir fisheries development in India.Souvenir on the ICAR golden jubilee year, CIFRI, Barrackpore India, part I, 107-111.
Natarajan, AV. and V. Pathak 1983. Pattern of energy flow in freshwater tropical and sub-tropicalimpoundments. Bull. Cent. Inl. Fish. Res. Inst., Barrackpore, No. 36 : p 27

45
Neel, J.K. 1967. Reservoir Eutrophication 'and Dystrophication following impoundment. In :Reservoir Fisheries Resources Symposium (April 5-7, 1967). American Fisheries Society,Washington: 322- 332.
Oglesby, RT. 1977. Relationship of fish yield to-lake phytoplankton standing crop, production andmorphoedaphic factors. J Fish. Res. Board. Can., 34 : 2271 - 2279.
Rawson, D.S. 1952. Mean depth and the fish production of large lakes. Ecology, 33 : 513 - 521.
Rawson, D.S. 1955. Morphometry as the dominant factor in the productivity of large lakes. Verh,Inst. Ver. Limnol. 12 : 164 - 175.
Ramakrishniah, M. 1988. Observations on differeent trophic phases in a tropical impoundment :Nagarjunasagar, Andhra Pradesh. In : Contributions to the Fisheries of Inland Open watersystems in India Part I (Eds, A.G. Jhingran, V.K. Unnithan and Amitabh Ghosh), InlandFisheries Society oflndia ; 80-84.
Ramakrishniah, M. 1990. Morphodrainage Index, a fish yield predictor for Indian reservoirs. PaperPresented at the 2nd Asian Reservoir Workshop, held at Hangzhou, P.R China, 15-19October 1990.
Ryder, RA. 1965. A method of estimating the potential fish production of north- temperate lakes.Trans. Am. Fish. Soc., 94: 214 - 218.
Ryder, RA. 1982. The morphoedaphic index - use, abuse and fundamental concepts. Trans. Am.Fish. Soc., 111 : 154 - 164.
Sreenivasan, A. 1989. Principles of ecology and fisheries management in man-made lakes. P96-105. In : (A.G. Jhingran and V.V.Sugunan eds.) Conservation and Management ofInland Fisheries Resources of India. Inland Fisheries Society oflndia.
Srivastava, ux., D.K. Desai,V.K. Gupta, S. Sreenivasa Rao, G.S.Gupta, M. Raghavachari, S.Vatsala, Amarjeet Singh, V. Ravindra Bharathi, 1. Martin Santhakumar and S. SuryachandraRao, 1984. Inland Fish Marketing in India, Reservoir Fisheries. IIM , Ahrnedabad studyseries vol. IV a. Concept publishing company, New Delhi: 403 p.
Vollenweider, R.A. 1969. Moglichkeiten and Grentzen elementarer Modelle der stoffbilanz vonSeen. Arch. Hydrobiol., 66: 1-36.
Wijeyaratne, M.J.S. and M.H. Costa 1981. Stocking rate estimations of Tilapia mossambicafingerlings for some inland reservoirs of Sri Lanka. Int. Rev. Gesamat. Hydrobiol., 66 : 327-333.

46
RIVERINE ECOLOGY, TIME SCALE CHANGES AND ESTIMATION OF FISHPRODUCTION POTENTIAL
M. A. Khan;Central Inland Capture Fisheries Research Institute
Barrackpore
Introduction
Since time immemorial rivers are used by mankind more than any other type ofecosystem. Rivers offer a continuously renewable physical resource, the major source of waterfor multiple use such as agriculture domestic, industrial and for rapid removal of wastesubstances generated due to anthropogenic activities. They have also been subjected to otheruses such as transport, harvesting of food and for recreational activities. Further rivers have alsobeen regarded a hazards (petts, 1989) by flooding vast areas, changing course in response toprocesses of erosion and deposition, obstructing transport system across valleys and aiding in thetransmission of water associated diseases.
Human race had irrationally exploited riverine resources together with their floodplainsand had drastically altered them to save the urban areas and production systems. On account ofthis cultural eutrophication only a few large rivers system of the world retain their originalfunctional integrity and many have probably lost much of their capacity to adjust and recoverfrom severe perturbation. Rivers degradation is one of the most striking manifestation of thehuman failure to utilize renewable resources without deterioration of their natural basis whenwe examine the status ofIndian rivers in the above context, we found the same is valid for ourrivers too. Most of the Indian rivers specially where big cities are situated on their banks areunder stress due to burgeoising anthropogenic activities. They have lost their natural purity ofwater and are loosing bio-diversity too. Even, fish production is steadily declining. The fish yieldwas estimated to vary from 640 to 1610 kmyr' in 60's (Ganga-940, Narmada, 865.0; Godavari-1392 kg kmlyr") has come down to < than 600 kg ha yt "in 1990's. Further, population ofprized food fishes, viz., Gangetic carps and large cat fishes has gone down drastically ( 26.62 kgha' yr' in 1961 to 2.55 kg ha yt in 1995 for major carps) while those of weed fishes hadincreased manifold. Even qualitatively spawn (major carps) from river Yamuna has come downfrom 7385 ml in 1964 to a low of 606 ml in 1997 and qualitatively from a high of 84% to 38%during the above period. Similarly, plankton and benthos population has also been altered withan coi'esponding increase in bacterial population. These are the symptoms of degradation ofwater quality.
Thus, there is an emergent need of understanding the causes of ecodegradation andformulation of policies for recovery of aquatic wealth. Successful management strategies haveto take into consideration of fish stocks and the dynamics of their population together withregulatory measures for fishing. Thus, the understanding of river's ecology and estimation offish production and prediction for future catch become a basic pre-requisite for formulation ofmanagement policies.

47
1.0 Riverine fisheries
Nature has bestowed to India an extensive network of Indian rivers alongwith theirtributaries, with a total length of over 45000 kni constitute one of the major inland fisheriesresource of the country. Indian rivers carry a surface run off 167.23 million ha metres which is5.6% of the total run off flowing in the rivers of the world. The river system of the countrycomprise 14 major rivers, each draining a catchment of more than 20,000 km 2,44 medium rivers,having catchment between 2000 and 20,000 km2 and innumerable small streams that have adrainage of less than 20,000 km/.
1.1 Ecology of the rivers
The ecology oflndian rivers has not yet been properly understood. Though some sporadicwork in isolation has been done by individuals on various rivers. (Jhingran, 1990, Natarajan,1989, Khan et al. 1996). There is hardly available any data on time scale of any river exceptGanga and that too in the middle and lower stretch. Mostly work on this river has been done byscientists of CIFRI, but off late, few universities have also conducted work on the riversecology under Ganga action plan. The paucity of the data on time series did not permit us todescribed in detail the ecology of any other river. Due to this reason, the ecology of river Gangais describe by taken as an example of a case study. Ganga river system has a combined lengthof 12,500 km and harbour one of the richest fish fauna (265 species), while the Brahamaputraand Peninsular rivers have been reported to bear 126 and 76 fish species respectively. Theecology of the river and method for calculation of potential fish yield of the Ganga and otherimportant rivers is described in the following discussion.
2.0 Abiotic characteristics of the water
2.1 Physico-chemical parameters
Data in respect of physico-chemical parameters spread over a span of thirty five years(1960-1995) is portrayed in Table 1. pH of the water over the years has not been changed muchsince 1960 except at Allahabad where it had registered moderate increase. Carbon-dioxidefluctuated in a narrow range, except at Allahabad where it had considerably increased, in 1988but tumbled down again in 1995 to the level of 1960. Among the important chemical parameterswhich determine the productivity of the water, the role of total alkalinity is very important andit has significantly increased on all the centres. This reflects in qualitative changes in run offthe river. Similarly, chloride increased (ppm) from 10 to 15 in Kanpur; 12.1 to 19.0 inAllahabad; 21.0 to 25.0 in Varanasi; 10.7 to 20 in Patna and 11.2 to 28.0 in Bhagalpur. Steepincrease in the chloride content can be related to the discharge of sewage into the river.Sharp risein specific conductivity and total dissolved solids, the two interrelated parameters suggest aradical change in chemical status due to heavy discharge of organic wastes. They also suggest,the qualitative changes in water due to the discharge of chemical effluents and the catchmentmodifications.
The magnitude of increase in the specific conductivity, dissolved solids, alkalinity andchloride was maximum in Kanpur, a highly polluted zone. Despite consistent increasing trend

48
in all the other centres, the total alkalinity of Patna decreased from 141.75 to 139.65 ppm from1960 to 1987. Similar, decrease can be noticed in case of specific conductance which decreasedfrom 300 to 283.2 micromhos and the total dissolved solids from 148 to 138 (ppm). At Patna,the three main tributaries Gandak, Son and Punpun jointhe Ganga. Which has improved its waterqualities. The deoxygenating effect of sewage polluation is clearly discernible in Kanpur andAllahabad in Kanpur, before the treatment the dissolved oxygen had decreased from 7.75 ppmin 1960 to 2.74 ppm in 1987 with a corresponding increase in CO2 concentration from 2.2 ppmto 8.18 ppm. The nutrient status of the river in terms of phosphates and nitrates showed anincreasing trend, but the magnitude of increase was very low as the fertilizer leaching in the basinis not very significant. However, slicate showed significant increase at all the stations.
2.2 Biotic communities
2.2.1 Plankton communities
In river Ganga details studies on plankton were conducted in 1960 in a stretch of 1052km lying between Kanpur to Rajmahal by Pahwa & Mehrotra, (1966). They also related theabundance of plankton with certain hydrochemical parameters. These workers were able to detecta total number of 76 plankton species comprising 46 phytoplankton species (16-Bacillariophyceae, l S-Chlorophyceae, 10, Myxophyceae, 2, Chrysophyceae and one each ofDinophycea and Euglinophyceae) and 30 zooplankton species (Rotifera, 16, Copepoda, 2,Cladocera, 8 and Protozoa 4,) they further reported a dominance of Bacillariophyceae followedby Chlorophyceae with the exception at Bhagalpur where condition were riversed. Later on,studied conducted by CIFRI in 1986-87 revealed a gradual decreasing trend in population ofBacillariophycea and increase in Chlorophyceae population. Myxophyceae also registered aslight increase in its population. However, in 1995 the trend was more or less similar to that of1986-87 with the exception that Myxophyceae flora registered a further decrease from that of1986-87 level. This probably may be due to the effect of Ganga action plan which was initiatedin 1985 and is still continuing. Myxophyceae flora is generally considered as an indicator of'Eutrophic' water however, in 1986-87 the organic load was more due to direct discharge ofsewage in Ganga so Myxophyceae flora propagated but after 1986, it gradually started decreasingwith a corresponding amelioration in water quality. Khan, et al (1996) reported, 52 species ofphytoplankton as compared to 46 species reported by Pahwa & Mehrotra (op. cit 1966). Thisindicates that in recent time due to amelioration of water quality, the number of species hasincreased and hope that biodiversity would further enhance with the improvement of waterquality. The percentage composition and average production of plankton (ul') of the river Gangais portrayed in Table-2.
2.2.2 Macrobenthos
Macrobenthos are considered an indicator of organic pollution besides a good source offood to many species of fishes. The abundance of annelids and chironomids is in an indicatorof high organic load while molluscs and ephemeropterans denote a low level of nutrients. Theproduction pattern of the benthos in a stretch of river Ganga is portrayed in Table 3 for the years1960 and 1995. Average production ranges between 218 to 3476 um? being lowest at Bhagalpurand highest at Kanpur. The high production at Kanpur is due to high level of nutrients loading

49
on account of cultural eutrophication. Generally, the insects population dominated throughoutthe riverine stretch.
Annelids and insects have been reported in great quantity around discharge point ofnallahs with sluggish water current (Allahabad to Varanasi), molluscs were more where waterwas clean and current was comparatively fast (patna & Bhagalpur).
In the distribution of benthos current velocity plays utmost significant role. The natureof bottom soil and inflow of various pollutants are in no way less significant. All these factors,simultaneously, make the favourable or in unfavourable conditions for the macrofauna of streamto develop and thrive. On the basis of studies conducted by Khan et al., (1996) and Jhingran etal., (1989), the whole of the stretch lying between Kanpur to Patna is under influence ofmoderate to severe sewage pollution (H values between 0-2.6).
When production pattern is considered, it is observed that the production of benthos fromKanpur to Varanasi is lower in 1995 than that of 1960, while it has increased at Patna andBhagalpur. Probably, persisting high organic load and comparatively sluggish water current isconducive for higher benthic production on the above centres.
2.2.3 Fish communities
The data on fish catch statistics for the period of 1960 to 1995 is available for onlyAllahabad centre, though discontineous data at a some time of scale is available for Kanpur,Varanasi Patna, Bhagalpur and Lalgola centres too. The fish catch trend indicates a decliningtrend for whole of the stretch. Particularly in case of major carps, large cat fishes and hilsa(riverine stretch). The catches of AlIahabad and Patna landing centres are described to give anidea of status of presnet fishery and its deviation from the past. The same is valid for all othercentres located on the riverine stretch of the river.
2.2.3.1 Allahabad
Presently the average production estimate in the middle stretch at Allahabad was obtainedas 311.6 kg kmtyr' (major carps, 42.0; catfish, 84.0; hilsa, 2.6; others, 183.0 kgkm yr ). Acritical evaluation of data indicated a severe setback to fishery both qualitatively andquantitatively. During last three decades the stock structure has experienced sharp changes. AtAllahabad the production of prized major carps with the passage of time has come down to 46.2kg km' yr' from an average of 427.0 kg krnyr' in 1961-66. The first setback to this fishery wasobserved during 1972-78 for which the production estimate was 123.6 kg kmlyr". L. Calbasuemerged as principal component of this group leaving behind rnrigal which used to to contributemore than 50% of the major carps population. Probably the increase in organic load in waterencouraged its propagation and remained in a stable state till 1986 despite a continuous fall inother major carps. All of a sudden L. calbasu also followed the declining trend and tumbleddown to merely 0.98 t in 1993 from a maxima of 47.41 tin 1984. The fishery of large catfish alsoshowed a continuous decline and production estimate came down to 55.4 kg krnlyr' for thepresent from 207.6 kg kmlyr' of 1961-68. Hilsa fishery after a sudden drop around 1970,stabilized at a very low level of few hundred kilograms from an average of 20 t. Thus, adversly

50
affecting thousands of fishermen along the riparian stretches ofU. P. And Bihar. The fishery ofothers group remained stable over the years with minor quantitative fluctuations (177.2-278.2kg knY\'1·01
). But qualitatively this group also reflected a serious change. The catches ofcommercially important species, such as R. rita. C. Garua, E. vacha, P. pangasius, S. silondia,S. phasa, A. coila and 0. pabda showed a drastic decline and replanced by other species of lesscommercial importance, indicating symptoms of Pauly's ecosystem degradation syndreome.Some of the species of this group, viz., B. bagarius, P. coitor.O. pabda and large sized prawnshave almost disappeared from the catches.
2.2.3.2 Patna•
Fish landings at Patna have also revealed a sharp decline and production estimate havecome down to 629.8 kg krnlyr' (MC-76.0. CF-124.0, hilsa-l.8, others-428.0 kg krrryr') from181J.2 kg krnlyr' of 1961-66. Here also, the worst affected were major carps and hilsa for whichproduction estimates have come down to 76.0 and l.8 kg krn-Iyr-I 389.0 and 234.8 kg kmlyr',respectively. The contribution of large sized catfish also reduced to one third of 1961-68. Forother groups the catches were almost half of the past.
3.0 Fish production assessment methods
A number of methods are available in literature for estimation purposes. These are mainlybassed on ecological and physical parameters viz., current velocity, nature of bottom and thebanks, obstacles to flow, channel morphology, catchment area, etc., as the main factorsdetermining the choice of method in context to later method to be applied for such estimation.
For prediction of future catches, Welcome (1979) has summed up a number of methodsbased on statistical correlations between some environmental parameters and the catch assumingthat the dynamics of fish populations as well as catch in large rivers is a close positive correlateof hydrological regime. These methods have been found to give fairly accurate results.
The mthods applied for computing fish yield from Ganga river system and some futureapproaches are given below.
Fish production in river Ganga was estimated in its middle stretch extending from Kanpurto Bhagalpur by means of (1) C 14 technique (2) phytoplankton biomass estimation by measuringchlorophyll a concentration (Kanpur to Ghazipur only) (3) Catch estimation from wholesalemarkets at selected centres and (4) using relationships based on morphological features(Welcomme, 1976). Other methods available in literature and not used in the presentcommunication are- creel census (killing of fish in a segment ofriver and their total counting),by tagging experiments and by using catch per unit of effort data.
3.1 Estimation of fislt yield by C14 technique
Potential fish yield has been estimated of the river Ganga based on primary production,which has been estimated either by conventional dark and light bottle method (Strickland andParson 1968) or by C 14 technique. In river Ganga, Jhingran & Pathak (1988) have estimated fish

51
yield in the mid-stretch of the river. They converted carbon values into calories by multiplyingwith 9.82 and fish production potential was calculated by assuming the energy at fish level as0.5% of the net energy fixed by produceres (Odum, 1962).
The productrivity potentail of a water body depends on efficiency with which primaryproducers transform light energy into potential chemicals energy, and thus any change in theproducers population or its energy transformation rate will have a direct bearing on theproductivity of the system.
Considerable differences in energy transformation in different sectors of the the river onyear to year basis have been observed. However, overall picture indicates a poor phytoplanktonefficiency (0.077 to 0.316%). Consequently a poor harvest of the fish yield against a richpotential fish yield. When fish production estimates based on conversion of primary producersto fish flesh is compared with other large rivers of the world like Volga (0.033 to 0.077%),Mississippi (0.002%) and Solimoes river (0.031 %), Ganges photosynthetic efficiency is better.Fish production is governed by a host of factors such as latitude, climate, type of basin (edaphiceffect), temperature, affect of cultural eutrophication and fish species composition, whetherdominated by herbivores, omnivores or carnivores, as the food chain lengthens fish productiondecreases. Management skill also plays an important role as intelligent management alone candouble the fish yield. The void between fish potential and actual fish yield in Ganga can be filledby evolving suitable managerial techniques pertaining to local needs.
3.2 By primary producers biomass estimation
The biomass was estimated as chlorophyll a concentration expressed as (ugl' ) or mg m'(Khan et al., 1996). It is generally assumed that water rich in primary producers gives a highyield as fish and a good correlation (r=O.72 to 0.98) between primary producers and fish yieldhas been observed in various studies (Muller, 1966, Wolny and Grygierek, 1972).
In river Ganga chlorophyll a biomass ranged between 4.32 ugl' in summer to 19.02 ugl'in winter (Table 5), the average being 10.32 ugl'. This variation may be ascribed to seasonalfluctuations in primary producers population and kind to which they belonged. Wetzel (1975)reported that pigments concentration and types in a sample depend on the kind and quantity ofplankton in the water.
On the basis of concentration of chlorophyll a whole of the stretch may be classifiedunder eutrophic category. This is also supported by presence of phytoplankters like Microcystisaeroginosa, Asterionellaformosa and Oscillatoria spp. All the above forms are associated withenriched organic waters. Myxophycean forms are associated with enriched organic waters.Myxophycean flora are considered as poor food to fish because they (flora) are enveloped in agelatinous sheath which is impregnable to fish digestive enzymes and are passed out as suchoutside of the body. Thus, depriving energy to fish resulting in poor growth of the fish. However,they are utilized through detritus food chain, thus lowering the fish yield.
Indirect assessment of algal biomass may also be estimated by assuming that chlorophylla is 1.5% of dry weight and carbon is 50% of organic dry weight. Thus, cellular carbon may be

52
i
estimated as 35 times of the chlorophyll contents (Golterman and Kouwe, 1980). After assessingcarbon value from chlorophyll a estimation, the potential fish yield can be estimated followingCI4 methodology described somewhere else in this paper.
3.3 Methods based 011 physiography of the river-future approaches
A number of studies on these aspects are available on important rivers of the world butin context of Indian rivers only meagre information is available. Standing stock estimates basedon multiple fishing to the exhaustion of stock, mark and recapture experiments, and poisoninga sample area with piscicides (Welcomme, 1985) have their own limitations and the assessmentof the total fish population by these methods is not wholly reliable due to sampling errors, butthe combination of several methods and the taking of samples over large areas improves thereliability of estimates. The water regime plays a vital role and population densities are generallymuch higher during the low water regime than at higher when the fish are dispersed. In mostrivers flows are too swift during floods that it is not possible to get accurate samples and mostestimates have to be made during low water. Within main channel the estimates showed a widerange of fluctuations and attempts have been made to correlate other factors responsible for this.In general there is a progressive increase in biomass as one moves downstream. Malaisse (1969,1976) estimated l.3, 26.1 and 31.7 kg km:' biomass in successive downstream reaches forLuanza river, Zaire. Much work has been done on the fish populations of temperate rivers todetermine their ichthyomass. Mann (1965) found a biomass of 659 kg ha- 1 in the river Thames.Backiel (1971) estimatred that total ichthyomass in the Vistula river may be between 200 and1100 kg ha-l in the river (1961) and Huet and Timmermans (1963) obtained estimates inbetween 130 and 300 kg ha-l of fish by electrofishing in Belgian rivers. For river Ourthe,Philippart (1978) obtained an estimate of 315 kg ha- 1. For Ganga, Jhingran and Pathak (1988)have estimated potential ichthyomass varying from 50 to 208 kg ha'. The mean biomassfluctuations may be ascribed to various factors such as temperature or depth of water but themain correlate was with channel width and the relationship were established as
Ichthyomass = 6.9669 x 1.8456 (r=0.919)
An inverse relationship was established by Timmermans (1961) and Cuinat (1971) for Frenchnvers:
Biomass (kg ha') = 41.3 + 16.4SW-1
Where
S = slope and W = width.
Philippart (1978a) suggested a modified model for Belgian rivers:
B= 295 + O. 19A + 5. 72T+ 17.58S+ 16.8WWhere A = alkalinity; T= mean temperature; S= mean slope and W=mean width. Such
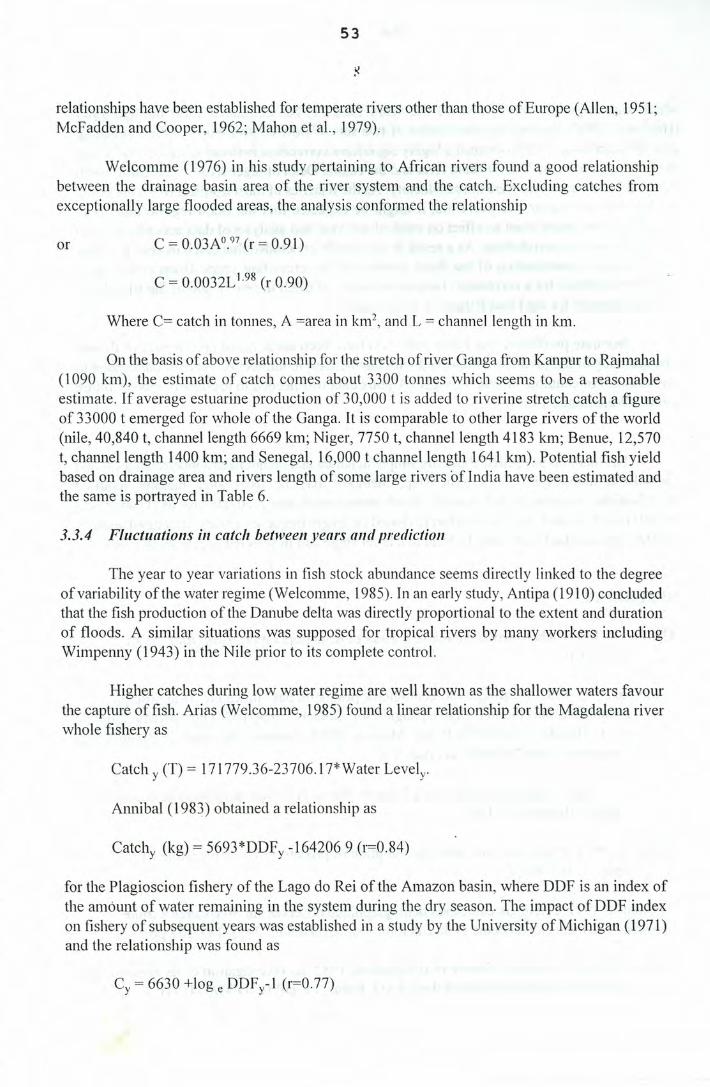
53
relationships have been established for temperate rivers other than those of Europe (Allen, 1951;McFadden and Cooper, 1962; Mahon et aI., 1979).
Welcomme (1976) in his study pertaining to African rivers found a good relat.ionshipbetween the drainage basin area of the river system and the catch. Excluding catches fromexceptionally large flooded areas, the analysis conformed the relationship
or C = 0.03Ao.97 (r = 0.91)
C = 0.0032L 1.98 (r 0.90)
Where C= catch in tonnes, A =area in km", and L = channel length in km.
On the basis of above relationship for the stretch of river Ganga from Kanpur to Rajmahal(1090 km), the estimate of catch comes about 3300 tonnes which seems to be a reasonableestimate. If average estuarine production of 30,000 t is added to riverine stretch catch a figureof 33000 t emerged for whole of the Ganga. It is comparable to other large rivers of the world(nile, 40,840 t, channel length 6669 km; Niger, 7750 t, channel length 4183 km; Benue, 12,570t, channel length 1400 km; and Senegal, 16,000 t channel length 1641 km). Potential fish yieldbased on drainage area and rivers length of some large rivers of India have been estimated andthe same is portrayed in Table 6.
3.3.4 Fluctuations in catch between years and prediction
The year to year variations in fish stock abundance seems directly linked to the degreeof variability of the water regime (Welcomme, 1985). In an early study, Antipa (1910) concludedthat the fish production of the Danube delta was directly proportional to the extent and durationof floods. A similar situations was supposed for tropical rivers by many workers includingWimpenny (1943) in the Nile prior to its complete control.
Higher catches during low water regime are well known as the shallower waters favourthe capture of fish. Arias (Welcomme, 1985) found a linear relationship for the Magdalena riverwhole fishery as
Catch y (T) = l71779.36-23706.17*Water Levely.
Annibal (1983) obtained a relationship as
Catchy (kg) = 5693*DDFy -164206 9 (r=0.84)
for the Plagioscion fishery of the Lago do Rei of the Amazon basin, where DDF is an index ofthe amount of water remaining in the system during the dry season. The impact of DDF indexon fishery of subsequent years was established in a study by the University of Michigan (1971)and the relationship was found as
Cy = 6630 +Iog e DDFy-l (r=O.77)

54
which was originally formulated for the years 1956-71, has continued valid through 1983(Hayward, 1984) despite the construction of two sets of flow control dams in the inteveningperiod. Welcomme (1975) obtained a highly significant correlation between catch in year y. andthe flood regime in the Y-1 for Shire river and the central Delta of niger river. Correlations withflooding in the same year were not satisfactory. As the fisheries of most trorpical rivers are basedon fish that are one or two years old, it might be expected that the flood regime inthe bothpreceding years might exert an effect on catch of any year and analysis of data accordingly leadto improvement in correlations. As a result it was finally concluded that catch in year Y is bestexplained by a combination of the flood histories of the preceding years. Dunn (1982) gavegraphical evidence for a correlation between an index of catch in year Y and of the frlood fiveyears previously for the Hilsa fishery of Bangladesh.
J
Accurate predictions for future fish yield have been made based on intensity of floods.The accuracy of the prediction improved with the increase in number of years of data added toregression. For example in case ofNiger 14 years data was needed to accurately predict futuretrends (Welcomme, 1985).
(The methods suggested above are simple in nature and do not need sopisticated tools andspecialized manpower. As a basic step, methods may be used after making requiredmodifications according to Indian needs. Much more complicated methods such as (1) analyticalmodels based on catch per unit of effort (2) based on length frequency (3) age structured analysis(4) Bayesian methods, etc. may be tried at a latter stage and in selected segments of rivers. i
REFERENCEAllen K. R. 1951. The Horokiwi stream; a study of trout population. Fish. Bull. N Z;
10,231 p.
* Annibal S. R. 1983. Avaliacao bio-ecologico e pesqueira das"pescadas" (Plagioscionsquamosissimus Heckel, 1840 e plaigioscion montei Soares, 1978) no "sistema Lago doRe I" Ilha do Careiro-Alvl-Brasil. Manaus, INPA (Institute Nacional de Pesquisas daAmazonia) Msc Dissertation., pag. Var.
* Antipa G. 1910. Regiunea inundabila a Dunarii. Starea ei actuala si mijloacele de a 0 pue invaloare. Bucharest, 318p.
Backiel T. 1971. Production and food consumption of predatory fish in the istula river. J FishBioI., 3, 369-405p.
* Cuinat R. 1971. Pricipaux caracteres demographique observes sur 50 rivieres a truitefrancaises. Influence de la pente et du calcium. Ann. Hydrobiol., 2 (2), 187-207 pp.
Dunn I. G. 1982. The Hilsa fishery of Bangladesh, 1982: an investigation of its present statuswith an evaluation of current data, FAO, Rome, FI: DP/BGD/811034, 71p.

55
, '\
Golterman H. L. And F. A. Kouwe 1980. Chemical budgets and nutrients. In the functioning offreshwat er ecosystems, eds. E. D. Lecren and R. H. Lowe Mc Connell, CambridgeUniversity Press, 133-35 pp.
Gupta R. A. And R. K. Tyagi 1992. Analytical approach to analysis of fish stocks of the GangaRiver System, 1. Inland Fish Soc. India, 24 (2), 20-27pp.
Hayward P. B. 1984. Status report on the Kafue fishery. In development on the Kafue Flats: thelast jive years. Kafue Basin Research project, Lusaka, University of Zambia, 58-73p.
* Huet M. And 1. A. Timmermans 1963. La population piscicole de la semois inferieur, grosseriviere Beige du type superieur de la zona a barbeau. Trav. Stn. Rech. Eaux. For.
Groenendaal-Hoeilaart (D), 36, 31p.
Jhingran A. G. 1990. Restoration of fisheries in the Ganga River System Proposed Action Plan.Working paper for the meeting of the Technical Sub-Committee of the Co-ordinationCommittee on Restoration of Fisheries in the Ganga River System.
Jhingran V. G.., Ahmad, S. H. And Singh, A. K. 1989. Application of Shannon Weaver indexas a measure of pollution of river Ganga at Patna, Bihar, India, Curr. Sci. 58: 717-720.
Khan, M. A., R. S. Panwar, A. K. Mathur, R. Jetly 1996. Final Report on "investigation onbiomonitoring and ecorestoration measures in selected stretches of the rivers Ganga andYam una, submitted to Ganga Project Directorate, Ministry of Environment, Govt. OfIndia, New Delhi.
Mahon R., E. K. Balon and D. L. G. Noakes 1979. Distribution, community structure andproduction in the Upper Speed River, Ontario, A preimpoundment study. Env. Biol. Fish,4 (3), 219-44pp.
* Malaisse F. 1969. Les facies d'un cours d'eau tropical: La Luanza (Haut-Katanga, Rep. Dem.Congo). Verh. Int. Ver. Theor Ange-y".Limnol., 17, 956-1040pp.
* Malaisse F. 1976. Ecologie de la riviere Luanza, edited by 1. 1. Symoens. Bruxelles, CercleHydrobiologique de Bruxelles, 151p.
Mann K. H. 1965. Energy transformations by fish in the river Thames. 1. Anim. Ecol.,40, 155-190pp.
McFadden 1. T. And E. L. Cooper 1962. An ecological comparison of six populations of browntrout (Salmo trutta). Trans. Am. Fish Soc., 91, 53-62 pp.
* Muller H. 1966. Die planktische primar produktion in karptenteichen unter EinflussVerschiedener phosphat-dungung. Verhandlungender Internationalen vereinigunfgurTheoretische und Angewantle Limnologie, 16.

56
Natarajan, A. V. 1989. Environmental impact of Ganga basin development on gene-pool andfisheries of Ganga river system. Can Spec. Publ. Aquat. Sci. 106: 545-560.
Odum H. T. 1962. Relationship between struct ure and function in the ecosystem. Jap. J. Ecol.,12, 108-18pp.
Pahwa, D. V. * Mehrotra, S. N. 1966. Observations on fluctutions in the abundance of planktonin relation to certain hydrobiological condition of river Ganga. Proc. Nat. Acad. Sci, IndiaB 36(2): 157-189.
Petts, G. A. 1989. Historical analysis of fluvial hydrosystems:2-l8In G. A. Petts, H. Moller &A. L. Rox, editors. Historical change oflarge alluvial rivers: Western Europe. John Wileyand Sons, Chichester.
* Philippart J. C. 1978. Evaluation des resources piscicoles et halieutiques dans les rivieres dubasin de la Meuse. Definition d'une methode d'etude. Paper presented at the ColloqueInternational problematique et question des eaux enterieueres, Liege, 16-19 May 1978,IIp.
* Philippart, J. C. 1978a. Etude des bases ecologique de l'amenagement piscicole de l'Ourthe,Grosse riviere de la zone a barbeau. Rep 8. Commission provinciale de liege du FondsPiscicole, Liege, Universite de Liege.
Strickland J. D. H. and T. R. Parsons 1968. A practical Handbook of water analysis. Bull. Fish.Bd. Can. 167,311 p.
* Timmermans J. A. 1961. La population piscicole de 1'Eau Blanche. Petite riviere du typesuperieur de la zone a barbeau. Trav. Stn. Rech. Eaux For Groenendaal Hoeilaart (D),30, 16p.
University of Michigan 1971. The fisheries of the Kafue River Flats, Zambia, in relation to theKafue Gorge Dam. Report prepared for the FAO/UN acting as executing agency for theUNDP. Ann Arbo, Michigan, University of Michigan Press, FI: SFIZAM 11: Tech. Rep.1,161p.
Welcomme R. L. 1975. The fisheries ecology of African flood-plains. CIFA Tech. Pap., 3, SIp.
Welcomme R. L. 1976. Some general and thoretical consideration on the fish yield of Africanrivers. J. Fish Bioi., 8, 351-64.
Welcomme R. L. 1979. The Fisheries Ecology of Floodplain Rivers. London, Longman. 317p.
Welcomme R. L. 1985. River fisheries. FAO fish. Tech. Pap .. 262, 330p.

57
.,.,\
Wetzel R. G. 1975. Limnology, W. B. Saunders Co., 743pp.
Wimpenny R. S. 1934. The fisheries of Egypt. Sci. Prog. Twentieth centur., Lond.,29(114), 210-27pp.
Wolny P. And E. Grygierek 1972. Intensification of fish ponds production. In productivityproblems offreshwat ers, Eds. Z. Kajak and A. Hillbricst-Ilkonska, Warsaw and Krakow,Polish Scientific Publishers, 563pp.
Jhingran, V. G., Ahmad, S. M. & Singh, A. K. 1989. Application of shannon-weaver Index asa measure of pollution of river Ganga at Patna, Bihar, India. Curr. Sci., 58: 717-20.
N atarajan, A. V. 1989. Environmental impact of Ganga basin development on gene-pool andfisheries of Ganga river system. Can. Spec. Pub!. Aquat. Sci., 106: 545-560.
* Indicates references not consulted in original

58
Table 1. Physico-chemical parameters of the waterof river Ganga
Year DO pH CO2 TA Sp. TDS Chlo- Phos- Nitrate SilicateCond. rides phate
Kanpur
1960 7.80 7.90 2.20 148 328 170 10.0 0.14 0.14 11.30
1987-88 2.70 7.20 8.20 160 565 278 15.0 0.15 0.16 21.8
1994-95 7.26 8.39 2.85 197.16 366.5 183 - 0.11 0.07 10.60
Allahabad
1960 8.40 8.10 1.50 142 285 148 12.1 0.15 0.17 11.9
1974 7.60 8.0 2.4 167 375 188 7.43 0.13 0.18 14.8
1987-88 8.0 8.12 0.68 171 398 198 19.0 0.18 0.22 18.1
1994-95 9.2 8.40 Nil 194 451 225 - 0.11 0.07 8.01
Varanasi
1960 7.0 8.0 3.1 127 257 130 21.0 0.04 0.10 8.3
1987-88 7.6 8.1 0.6 179 436 2.6 25.0 0.22 0.17 12.8
1994-95 8.09 8.21 1.1 181 463 231 - 0.16 0.16 9.39
Patna
1960 7.9 5.0 142 300 148 10.7 O. ID 0.14 10.6
1987-88 7.8 7.9 2.0 140 283 08 20.2 0.21 0.20 25.2
Bhagalpur
1960 6.9 8.2 2.3 131 268 234 11.2 0.09 0.14 9.3
1987-88 7.2 8.1 2.5 142 310 158 28.3 0.12 0.18 13.5

59
Table 2. Plankton composition and average population (ul') of primaryproducers in Ganga
Centre Year Plankton composition TotalU/I
Bacllariophyceae Ch lorophyceae Myxo-phyceae
Kanpur 1960 77.9 15.8 6.3 85.21
86-87 77.7 7.9 14.2 26.18
1994-95 *40.0 27.0 3.3 1336
Allahabad 1960 72.3 22.9 4.8 6608
86-87 51.1 35.8 12.4 5676
1994-95 *28.43 51.06 7.56 1507
Varanasi 1960 83.5 11.4 5.1 2323
1986-87 70.6 23.4 6.9 3765
1994-95 46.1 26.2 6.21 3300
Patna 1960 48.3 46.8 4.9 143
1986-87 37.4 15.0 11.6 850
1994-95 NA NA NA 919
Bhagalpur 1960 25.7 70.0 4.3 557
1986-87 24.0 69.5 6.5 1027
\994-95 NA NA NA \251
* percentage of zooplankton excluded
Table 3. Production of macrobenthos (um') in a stretch of river Ganga
1960 1995Kanpur 3476 1430Allahabad 1121 702Varanasi 880 1115Patna 1593 1600Bhagalpur 218 230

60
Table 4. Energy transformation, fish production potential and extent of utilisation ofpotential fish yield in river Ganga at different centres
Centre Year Av. Av. Rate Photosynt Fish Actual Extent ofCarbon of energy hetic production harvest utilisationproduction transfor- efficiency potential
mation
Il1gCIl1-2 calm? % kgha' yr-I kgh' yr' %day" day'
Kanpur 1987-88 234.5 1419 0.077 50.10 - -
Allahabad 1974 - 4501 0.241 160.44 21.33 13.29
1987-88 730.5 5906 0.316 208.70 28.69 13.74
Varanasi 1987-88 589.1 3243 0.173 112.20 - -
Patna 1987-88 293.0 3534 0.190 122.40 30.84 25.19
Bhagalpur 1972 - 3586 0.186 120.68 31.64 26.30
1987-88 420.0 4124 0.220 142.80 36.75 25.73(After Jhingran & Pathak, 1988)
Table 5. Chlorophyll a concentration (ugl') in water samples or river Ganga
Centre
Winter Summer Post Winter Summer PostMonsoon Moonsoon
Kanpur US 11.44 9.35 18.68 19.02 12.34 10.12
OS 18.26 11.25 13.12 17.68 10.88 11.18
Allahabad US 12.38 7.54 11.22 11.44 8.32 8
OS 10.04 8 8.62 10.68 9.12 11.2
Mirzapur US 10.32 7.3 10.02 10.66 8.16 7.6
OS 9.12 5.2 8.42 9.88 6.4 • 10.22
Varanasi US 9.76 8.44 10.26 10.004 8.12 12.66
OS 9.28 10.7 9.38 10.18 8.64 9.04
Ghazipur US 11.44 7.4 10.64 11.28 8.4 12.89
OS 10.92 4.32 8.88 9.66 5.86 10
Average 11.3 7.95 10.92 12.05 8.86 10.29
US-upstream, OS-downstream

61"
Table 6. Showing the potential fish yield from Indian rivers based on theirlength and basin area
River Length Basin area Catch(km) (million km") Area based Strem length based
tonnes tonnes
Himalayan river-
Ganga 2525 0.88 17443 17142yamuna 1376 0.37 5243 8588Brahamaputra 800 0.19 1782 3958
East Coast rivers
Godavari 1465 0.31 5936 6364Krishna 1401 0.26 5434 5365
Cauvery 800 0.09 1791 1917
Mahanadi 880 0.14 2088 2943
West coast rivers
Narmada 1312 0.10 4844 2124
Tapti 720 0.06 1454 1294
Mahi 533 0.02 802 446
*******

62
TIME SCALE CHANGES IN WATER QUALITY OF RIVER GANGA ANDITS IMPACT ON PRODUCTIVITY
R. S. Panwar
Riverine DivisionCentral Inland Capture Fisheries Research Institute
24, Pannalal Road, Allahabad- 211 002
The Ganga, a symbol of purity and an inspiration to millions, is today being chocked by thetons of dangerous chemicals and organic wastes which are emptied into it every day. The riverwhich has served man faithfully for ages fed him, watered his fields and washed his sins isnow a carrier of death and diseases.
Almost all the sewage of all the cities situated along the river is discharged into riverwhich is responsible for about 75 % of total pollution load. Further discharge of untreatedindustrial eiJuents and discharge from farms pesticides and fertilizers run off from the land-flow eventually into the river. In recent decades rapid development of agriculture and industryput severe strains on the river and to an extent resulted in some degradation of its quality.
The river has a total length of 2525 kms and a basin covering nearly 1/4 of the totalland mass of the country is unfortunately dangerously polluted. It drains an area 861404 km2and over 37% of Indian's population lives in the Ganga basin which is putting strains as ex-pected on the most sacred river. Due to gross pollution the flora and fauna of the river isdwindling very fast and water quality is being reduced to such an extent that for long stretchthe "Purest liquid" is no more pure and not fit for human consumption.
Thus problems of pollution of water have not only surfaced but begun to assume seriousdimensions in certain stretches of long course of the river, which is evidenced by spatio-temporal variations in nutrients and primary productivity. Primary productivity is the final outcourse of the metabolic actions of Abiotic and biotic parameters together depicts functionalaspects of the river.
The main sources of pollution in river Ganga are industrial, municipal and agriculturaleffluents. The total quantity of frehswater being used in the basin is estimated at 142.6 millioncubic metres, out of which 20% is finally discharged as waste water. Waste water generated inthe irrigation sector is 26,896 million cubic metres compared to 1528 million cubic metresfrom the industiral, domestic and other uses.
Industiral effluents
Survey of Central Pollution Board in 1981 showed that 317 major industrial unitsoperated all along the points of Ganga and its tributaries and only 30 % of the units followedsome control measures or other to contain the pollutional hazards. The total urban organic loaddue to industrial effluents expresed in terms of BOD has been estimated at 1.17 million kgday" for Ganga basin with UP accounting for more than threefourth of the load.

63
Municipal effluents
The sewage generated in the 692 cities and large towns all along the Ganga basin isestimated at 1528 million cubic metres. The total load in Ganga basin from the urban centre is2.504 million kg day' of which, the share of domestic sewage is 1.34 million kg day". UttarPradesh having 256 urban centres contribute 31 % of the total BOD load. Of the 692 urbancentres in Ganga basin, at least 100 of them discharge untreated sewage into river. Sewagewastes and effluents receive by Ganga at Haridwar, Farukhabad, Mirzapur and Bhagalpur are16 million litre day:' while Allahabad and Varanasi receive 100 mid-I, the load increases to154 mld' at Patna and 275 mld' at Kanpur.
Impact of sewage pollution
The major adverse impacts of sewage pollution are deoxygenation, high BOD load,rapid eutrophication and accumulation of heavy metals in the environment. Sharp fall in dis-solved oxygen (DO) in water puts the biotic communities under severe stress. While somespecies can tolerate a wide range of DO, many communities are highly sensitive to thisparameter.
The agriculture sector in the Ganga basin drains fresh water to the tune of 134484million cubic metre and generate waste discharge to the extent of 26,896 million cubic metres.It affects the riverine environment by an increase in salt and alkali levels in water, increasingthe nutrients load due to residual effects of chemical fertilizers and accumulation of pesticidesin the environment.
Nutrients
Nitrogen content of the fertilizers used in the Ganga basin is estimated at 887133 tfollowed by phosphorus (173445 t) and potassium (91 427 t). It is generally estimated that 10to 15 % of the nutrients added to the soils eventually find their way to the surface flow.
Pesticides
About 2573 t of pesticides are used in an year in the Ganga basin. Higher accumulationof DDT was 65-150 ppm recorded in molluscs followed by fish (31-460 ppb), plankton (15-150 ppb) and sediments (17-80 ppb). On the basis of ambient water, the bio-rnagnificationvalues were 2500 in plankton, 3600 in gastropod molluscs, 7500 in fish and 15800 in bivalvemolluscs. Among the pollutional hazard from the agriculture sector, the damage caused by thepesticides is the most lethal and interminable to the environment. The organochlorine pesti-cides are lipophilic, extremely toxic and non-biodegradable. Like heavy metals, they assumealarming proportions as they are prone to be biologically magnified and accumulated in fish,posing serious threat to the fish eating public. Most of the commonly used pesticides in Indialike DDT; BHC, endosulfan, ethyl parathion, methyl parathion, dimethorate, phosphamidon,carbaryl and 2,4-D have been screened to evaluate their toxicity. All of them have been foundto be toxic to fish food organisms and fish populations. Sub-lethal concentration of DDT andBHC adversely affect the fish at tissue level. Damage of liver cells, besides decline in growth,RBC count, Hb, and PVC level in blood has been noticed in carps (L. rohita and C. mrigala).
Heavy metals
Heavy metals residues have been detected in the tissues of fishes, molluscs and crabs.Highest bioaccumulation detected in Hooghly estuary is that of Zn (295.1 ppm) in the kidneyof fish followed by gonad (146.8 ppm). Ambient water in main Ganga around Kanpur hasshown higher metal accumulation. Heavy metals were found in molluscs tissue in river Ganga.Accumulation of Zn in gonad at a high level (146.8 ppm) was found to be detrimental to fishhealth affecting its productive potential in the long run. Fish food organisms such as Cyclopsand Daphnia are more sensitive to metals.

64
Thermal pollution
The adverse effect of heated discharge into the river causes mortality of fishes andabsence of aquatic life within 50 m of dishcarge point owing to high temperature (48-53°C) ofeffluents. The heated dishcarge pushes up temperature by 8-1O°Cwhich may cause mortality offish and fish food organisms. Temperature also exerts direct influence on toxicity. Thick matof fly ash accrued on the bottom over years may seal the nutrients away from the water andthereby affecting productivity. The power plant emit harmful gases like carbon monoxide,sulphur dioxide and enormous quanity of fly ash into the atmosphere besides dischargingheated wastes water, thus polluting both air and water. The discharge may destroy or reducefish food organisms and breeding grounds.
WIter quality changes
The physico-chemical parameters of river Ganga during sixties to that of 1995 in themiddle stretch vir., Kanpur, Allahabad, Varanasi, Patna and Bhagalpur have been presented intable. Although nummber of parameters have been studied but only those parameters werecritically studied which showed significant variation over the years.
pH in Ganga did not change much since 1960 except for a slight reduction in the upperzone possibly due to a high buffering capacity of Ganga water.
Dissolved oxygen: A signficant change in the DO contents was observed almost at all the cen-tres. These changes were studied by comparing the results obtained at the point above the citywith the corresponding results at the point below the city in order to detect decisively the effectof discharge thrown by the city in the river. The study indicated that the water quality deterio-rated at Kanpur and Varanasi upto 1992 and improved thereafter. The increase in organic loadin Ganga due to discharge of sewage wastes can be seen even at Kanpur where DO level has~educed ~rom 7.8 mg' to 2.7 m~-l (1987). The decline of DO wasof0llowe~ by correspondingIncrease In CO2 (2.2 to 8.8 mgl ) and BOD (24l.8 mgl"). On cerfln occasion DO was foundto be absent ana CO2 content reached to 36.0 mgl'.
Total alkalinity at Kanpur, Allahabad and Varanasi in middle stretch was signficantlyhigher during 1987 indicating the impact of industrial pollution. However, during subsequentyears the contents drop signficantly and almost attained the same levels are recordded at theabove city level.
The zone between Kanpur and Varanasi exhibited high phosphate and nitrogen contentsparticularly at the Ganga below the cities. The above nutrients level below the city indicatedaquatic pollution. This trend continued upto 1992 and thereafter the phsophate level particular-ly came down indicating considerably improvement of the Ganga. The phosphate level wasalso low at Patna and Bhagalpur, indicating better environment. The nitrate nitrogen wasgenerally under limit in lower stretch. Silicate values increased considerably at all the centres.
Chlorides increased from 10.0 to 25.6 m~l-l in Kanpur, 12.0 to 24.0 mgl' in Allaha-bad, 21 to 30 mgl' in Varanasi, 10.7 to 22.0 mgl in Patna and 11.2 to 28.3 mgl' in Bhagal-pur which may be due to discharge of sewage into the river. The rise in Sp. conductivity andtotal dissolved solids, the two interrelated parameters suggests a radical change in chemicalstatus due to heavy discharge of organic wastes.
Heavy metal study
Kanpur
WIter: The average concentration of Zn, Cr and As ranged between 24.6 and 42.4 j.tgl-l, l.61and 3.4 j.tgl-land 9.8 and 23.12 j.tgl-lin polluted water respectively at Kanpur centres, indicat-ing the maximum concentration of these metals at Jajmau (sewage) and lower at tannery from

65
1989-90 to 1992-93. The value of metals also reduced after 1989-90 at all the centres.
Soil sediments: The average (yearly') concentration of Zn, er and As fluctuated between 62.1and.88.1 ugg', 9.4 and 11.7 p.gg-l and 10.8 and 19.81 «ss' of soil respectively at Kanpurdunng 1989-90 to 1992-93. These values were recorded lower during 1992-93 indicating lessdeposition of organic matter at OF point.Fish tissue: The concentration of Zn, Cu and As ranged from 14.54 to 30.6 p.gg-l, 2.32 to 6.03p.gg-l and 1.8 to 4.74 p.gg-l in fish tissue (Puntius sp. and C. reba) respectively at Kanpur in1989-90.
The average concentration of Zn, Cr and As ranged from 8.6 to 15.8 p.gg-l, 1.8 to 3.1p.gg-land nil to 1.8 p.gg-l in bottom biota (Tubifex only) during 1990-91 and 1991-92 indicatingthe highest concentration of Zn and Cr at Jajmau.
Allahabad
WIter: The average yearly concentration of Zn, Cr and As ranged from 28.8 to 34.0 p.gl-l, 1.5to 4.0 p.gl-land 12.0 and 17.74 ugl' respectively indicating higher concentration of Zn and Asat Mehdaurighat (sewage) whereas Cr was higher at Mavaiya (industrial impact). The concen-tration of these metals showed reduction during subsequent years except Cr from 1989-90onwards.
Sediment: The concentration of Zn, Cr and As ranged from 61.0 to 80.87 p.gg-l, 8.82 to 15.8p.gg-land 10.0 to 16.36 ugg", respectively from 1989-90 to 1992-93, showing the same trendlike that of polluted water.
Fish tissue: The concentration of Zn, Cr and As fluctuated between 14.6 and 28.27 ugg", 2.71and 3.68 ugg' and 1.1 and 2.3 p.gg-lrespectively in fish flesh of C. reba and Puntius sp. Theconcentration of metals did not show any definite trend of its fluctuation over the years. '
Zn, Cr and As was detected between 11.4 and 13.8 p.gg-l, n.d. and 3.3 p.gg-l, n.d. and2.2 p.gg-lof bottom biota (Tubifex) respectively from 1990-91 to 1992-93.
VARANASI
WIter: The concentration of Zn, Cr and As fluctuated between 11.2 and 44.2 p.gl-l, n.d. and3.4 ugl' and 7.4 and 29.6 p.gl-l, respectively at Nagawa and Rajghat from 1989-90 to 1992-93. The concentration of those metals were quite high at Rajghat. The impact of effluent wasalarming at Rajghat as reflected by their values.
The concentration of metals in sediment, fish tissue and bottom biota were also high atRajghat all the yearsof observation due to high load of pollution in this stretch.
Primary productivity
Kanpur
The averape yearly gross and net carbon productio~ fluctuated between 103.12 and427.5 mgCmthr" and 37.5 and 313.5 mgC m-3hr-1 respectively at above out fall (AOF) andbelow out fall (BOF) of Bhagwatghat (textile) indicating highest production during 1991-92(BOF). The average production was higher at AOF from 1986-87 to 1990-91 whereas it washighest at BOF during 1991-92 and 1992-93. This may be due to increase in number of pri-mary producers.
Allahabad
Gross and net production at Mehdaurighat (BOF) ranged between 78 and 149 mg'Cm- .

-66
3hr-1 and 40 and 119 mgCm+hr' respectiveli' showing highest production during 1990-91 and1992-93. Respiration was 46 and 82 mgf.m hr'.
Gross and net production at non-polluted centres were 112 and 167 mgCm-3hr-1 and 58and 84 mg'CmPhr' respectively from 1986-87 to 1992-93. Highest productin was found in1991-92 which shows continuous increase from 1984-89 onwards and decreased slightly (163mgCm-hr') during 1992-93. Respiration was found in the ranre of 61 and 104 mgCm-3hr-l.Gross and net production ranged from 103 to 172 mg'Cm+hr and 53 and 102 mgCm-3hr-1
respectively at Mavaiya (Allahabad) from 1988-89 to 1992-93. Both gross and net productionwere found highest during 1990-91 showing incresing trend from 1988-89 onwards.
UJranasi
Primary production was measured at centres viz., Assi/Nagwa and Rajghat. Gross andnet production were 66 and 142 mgCm-3hr-1 and 24 and 126 mgCm-3hr-1 respectively from1986-87 and 1992-93 at Nagwa indicating both values of production were high during 1989-90at BOF. Higher vaues of production at this centre was recorded upto 1989-90 and later it waslow. It may be attributed due to diversion at Assi nala towards Nagawa side. Respiration was19 and 86 mgCm-3hr-1 at Nagwa. Gross and net production at Rajghat (sewage wastes) was 19and 140 mgCm-3hr-1 and 12 and 119 mgCm-3hr-1 respectively from 1987-88 to 1992-93 at AOFand BOF. As oxygen was completely utilized by consumer, no production was observed atBOF during 1991-93. Least production was also observed at BOF during 1989-90 because ofthe impact of sewage pollutents up to this centre.
The primary production during 1995 at Kanpur, Allahabad, Varanasi and Patna wererecorded 156 mgCm-3hr-1 (GP), 78 mgCm-3hr-1 (NP) and 94 mgCm+hr' (Respiration) atKanpur, 110 mgCm-3hr-1 (GP), 47 mgCm-3hr-1 (NP) and 65 mgCm-3hr-1 (Respiration) at Alla-habad, 125 mgCm-3hr-1 (GP)) 78 mgCm-3hr-1 (NP), 56 mgCm-3hr-1 (Res.) at Varanasi and 38mgCm-3hr-1 (GP), 26 mgCm hr' (NP) and 38 mgCm-3hr-1 (Res.) at Patna.
Productive potential and energy dynamics
The productivity potential of any water body depends on efficiency with which primaryproducers transform light energy into potential chemical energy. Thus any change in theproducer population or its energy transformation rate will have a direct bearing on the produc-tivity ~f the s>,~tem. Consi~serable differences have been noted in respect of the ener~y tra~s-formation efficiency at vanous zones. At Kanpur the rate was very low 1.419 cal m- d' withphotosynthetic efficiency being 0.77%. The rate of variation 136 (0.007%) to 4.156 Cal m-2d-1
(0.371 %) clearly shows the production potential of Ganga has decresed over the years due todeterioration in water quality. From Allahabad to Bhagalpur, there is considerable improve-ment in range of energy transformation by producers. Over two decases studies at Allahabadand Bhagalpur have shown that the efficency was gradually increased over the years. On anaverage of 0.259% of the incident light on the surface of river is fixed in this stretch. The richphytoplankton observed during 1960 clearly reflect that the energy transformation rate musthave been very high, especially at Kanpur but the potential has considerably declined over thelapse of three decades.
rIt may be concluded that.ihe water quality parameters viz. pH, DO, alkalinity, nitrate
and phosphate have shown significant improvement during 1994-95. The effect of otherparameters viz. Sp. conductivity, TDS, hardness and silicate were not very significant. Theconcentration of heavy metals didn't show any definite trend in fish tissues though in sedimentstheir values were higher. In respect to primary productivity it may be concluded that theirvalues showed enhanced t end, but fish yield (as per report) were not reciprocal to these valuesand energy transfer efficiency. Reasons need investigation, but author is of the opinion thatvolume of water plays major role in not getting the yield.
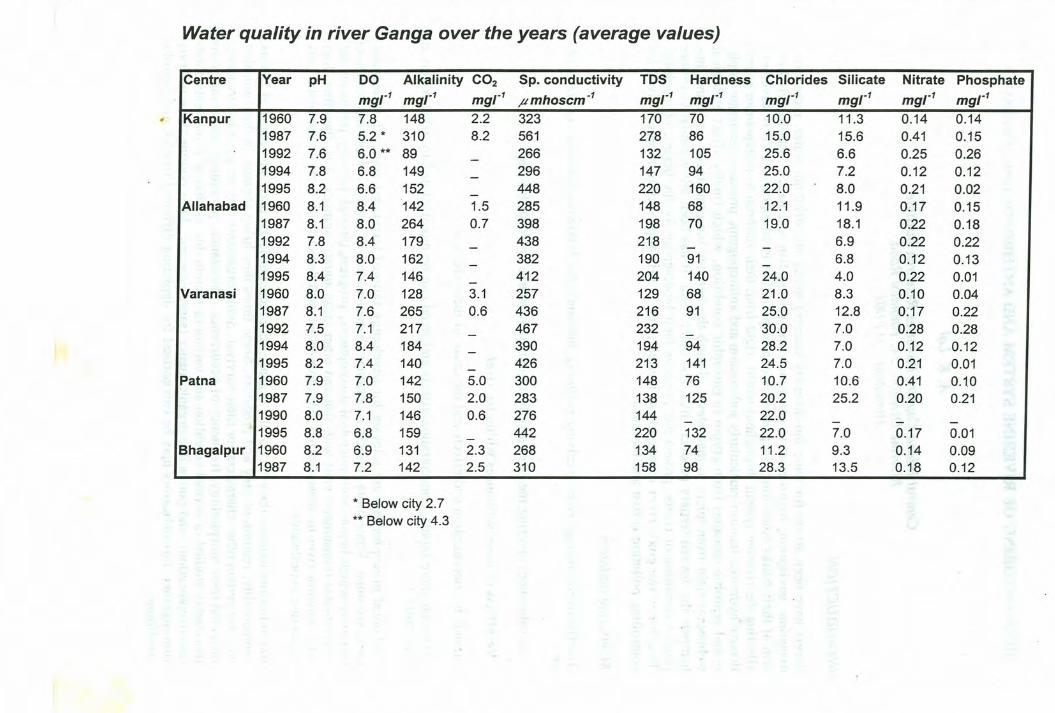
Water quality in river Ganga over the years (average values)
Centre Year pH DO Alkalinity CO2 Sp. conductivity TDS Hardness Chlorides Silicate Nitrate Phosphatemqt" mgr1 mql" jlmhoscm·1 mgr1 mqt" mqt" mgr1 mqt" mgr1
Kanpur 1960 7.9 7.8 148 2.2 323 170 70 10.0 11.3 0.14 0.141987 7.6 5.2 * 310 8.2 561 278 86 15.0 15.6 0.41 0.151992 7.6 6.0 ** 89 - 266 132 105 25.6 6.6 0.25 0.261994 7.8 6.8 149 - 296 147 94 25.0 7.2 0.12 0.121995 8.2 6.6 152 - 448 220 160 22.0 8.0 0.21 0.02
Allahabad 1960 8.1 8.4 142 1.5 285 148 68 12.1 11.9 0.17 0.151987 8.1 8.0 264 0.7 398 198 70 19.0 18.1 0.22 0.181992 7.8 8.4 179 - 438 218 - - 6.9 0.22 0.221994 8.3 8.0 162 - 382 190 91 - 6.8 0.12 0.131995 8.4 7.4 146 - 412 204 140 24.0 4.0 0.22 0.01
Varanasi 1960 8.0 7.0 128 3.1 257 129 68 21.0 8.3 0.10 0.041987 8.1 7.6 265 0.6 436 216 91 25.0 12.8 0.17 0.221992 7.5 7.1 217 - 467 232 - 30.0 7.0 0.28 0.281994 8.0 8.4 184 - 390 194 94 28.2 7.0 0.12 0.121995 8.2 7.4 140 - 426 213 141 24.5 7.0 0.21 0.01
Patna 1960 7.9 7.0 142 5.0 300 148 76 10.7 10.6 0.41 0.1.01987 7.9 7.8 150 2.0 283 138 125 20.2 25.2 0.20 0.211990 8.0 7.1 146 0.6 276 144 - 22.0 - - -1995 8.8 6.8 159 - 442 220 132 22.0 7.0 0.17 0.01
Bhagalpur 1960 8.2 6.9 131 2.3 268 134 74 11.2 9.3 0.14 0.091987 8.1 7.2 142 2.5 310 158 98 28.3 13.5 0.18 0.12
* Below city2.7** Below city4.3
r

68
BIOMONITORING OF RIVERINE SYSTEM AND ANTHROPOGENIC PRESSURE
A. K. Lal
Central Inland Capture Fisheries Research InstituteRiverine Division, 24, Pannalal Road,
Allahabad - 211 002
INTRODUCTION
. ivers have been abode for wide bio-diversity catering needs viz. drinking water, recreation,irrigation, navigation, hydro-electric generation and raising fish and hence fostering civiliza-tion at their banks since long' In present scenario pollution is an axiom which is adverselyaffecting the riverine system throughout world, right from their rhithron to metapotman zones.Bizarre hydraulic features particularly soil erosion and anthropogenic pressure accelerate troph-ic and saprobic cascades from crypto to eutrophic condition, which finally affect biologicalwebbbings right from micro to macrolevel, disturb the intricate bio-organismic cycle and thushampers the desired tertiary product' fish' and other biota. It has been felt essential to restorepristine condition of rivers, protect and preserve their biodiversity for the benefit of mankind.To achieve the goals river management is must, and in this approach to monitor river forcontrolling pollution is first and foremost.
Monitoring pollution
,!To effectively manage river receiving polluting substance the following information are need-ed:
- the substances entering the river and their quantities, source and distribution.
- the effects of these substances within the river.
- trends in concentration and effects and the cause of these changes.
- How far these inputs, concentration affects and trend can be modified and by what means atwhat cost? )
Ecological principles that are relevant for developing rational integrated approach to manage-ment are must. Since biota reflects functional characteristics of river by depicting means ofhierarchy which begins with microbial decomposers, progress through primary producers andinvertebrates (consumers) ends with fish and other large aquatic animals, it is, therefore, logi-cal to monitor river by means of bio-indicators which will depict fault if any in the biotic intri- .cacies due to pollutants.
Bio-indicators indicate the effect of the organic, inorganic nutrients, toxicants, physical factors,compatibility, relation of prey and predators. Some times they bring changes in their morphol-ogy and certain other characters for their survival. Some organisms may be good bio-indicatorsprovided their morphology, frequency of occurrence, abundance, phenology and ecology arethoroughly studied in normal condition and variations therein due to change is nutrients condi-tion (trophication), and putriscible organic matter (saprobication). After pooling these informa-tion together, bio-indicators may be categorised for depicting different trophic and saprobicconditions.

69
RELATION OF SAPROBITY TO TROPHICITY
Saprobity and trophicity are independent factors and must be studied separately in their devel-opment and interferences. Their features have been depicted in Table-L
IMPORTANCE OF THIS STUDY
In view of the growing need of biological monitoring, the International Union of biologicalScience (lUBS) decided in its XXI general assembly, held in Ottawa in 1982 to initiate aWorld wide programme for identifying and applying biological indicators in environmentalmonitoring especially to evaluate the effects of hazardous substances. Further Indian NationalScience Academy (INSA) in association with the IUBS, organised an International Symposiumon biological monitoring of the state of environment (bio- indicators) from 11-13 Oct, 1984 atNew Delhi. Subsequently, several other conferences organised on International and Nationallevels time to time.
CRITERIA FOR GOOD BIO-INDICATORS
Good bio-indicators should possess following criteria:
- should commonly be available.- should be very sensitive.- should have long life span.- should easily absorb toxicant of even lower concentration andretain or accumulate the toxicants for long period in its body.- should be sedentary, sessile or less mobile.- should be endemic, because diversity of a continent may differ from other continents due tochanges in their geographical conditions.
Some bio-indicators for survival and existence in the community during inter species competi-tion, certain morphometric changes "Occurviz., Cyclomorphosis in rotifers tBrachionus calyci-florus) and Cladocera (Daphnia sp.) etc. may be minutely observed.
Considering qualities of good bio-indictors mentioned above benthic invertebrates are mostideal bio-indicators for monitoring fluviatile aquatic ecosystem including rivers. Though othercommunities viz. Phytoplankton, Zooplankton, Periphyton have also been used for bio-moni-toring river water quality.
BIO-INDICTORS
i) Producers
Algae constituting phytoplankton as bio-indicators have been categorised by author as follows:
Gonatozygon kinhani, Tribonema spp., Hormidium spp., Bumillaria as bio-indicators of Oligo-trophic and Oligosaprobic water. Synedra ulna, Merismopedia Kuizing, Tabellaria sp., Pedias-trum ovaum, Closterium aciculare sp., Scenedesmus quadricauda, Ankistrodesmus sp., Kiri-chineriella sp. are indicators of Y. eutrophic and Y.mesosaprobic water. Euglena viridis,Scendesmus acuminatus, S.opoliensis, Synedra ulna, Nitzschia palaea, Ceratium sp., Cosmari-um sp. and Fragilaria sp., Hydrodictyon sp. are indicators of 6- eutrophic and 6- mesosaprobicwater. Chlorella vulgaris, Scenedesmus obliquus, Euglena acus, Eunotia praerupta, Pinnulariagibba, Volvox globata are indicators of a- eutrophic and a-mesosaprobic water. Spirulinafrinceps more than 10000 ul', Phacus sp., Trachlemonas sp., Eudorina sp., more than 100 ul
and Oscillatoria sp. more than 10000 ul' are indicators of Hyper eutrophic and polysaprobicwater such condition is rarely seen in riverine zone, except at outfall where the effluents (fromtanneries, sewage, paper pulp, sugar factories) are discharged in river. Gloeotrichia sp.,Rivularia sp., Treubaria varia, Tetraedon hemisphere are indicators of wetlands and sewage
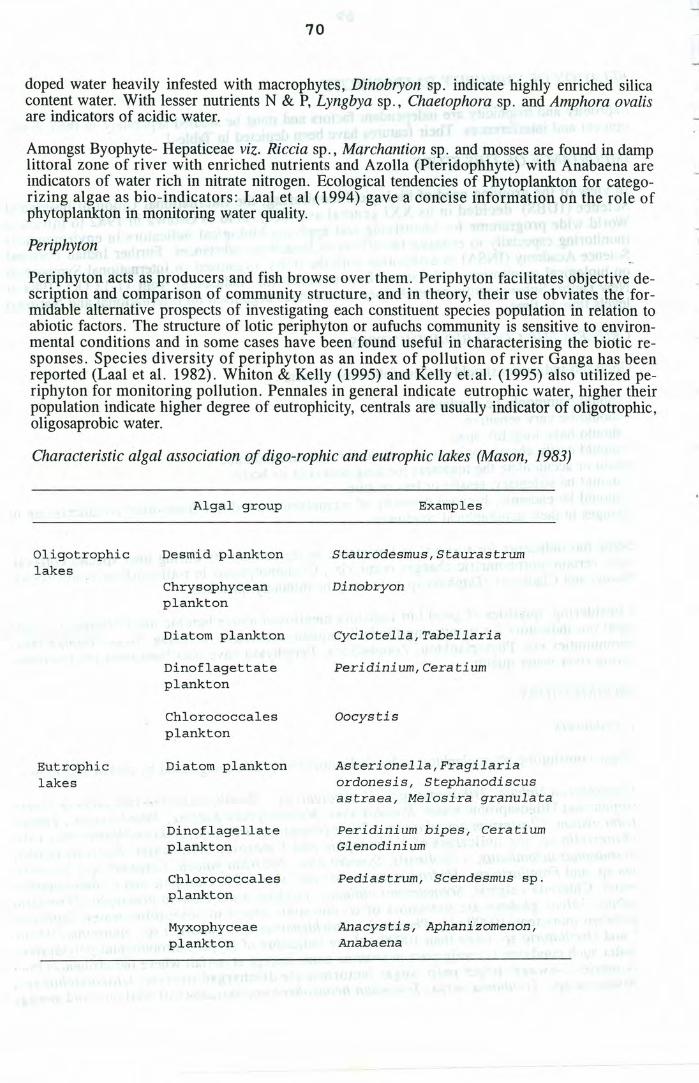
70
doped water heavily infested with macrophytes, Dinobryon sp. indicate highly enriched silicacontent water. With lesser nutrients N & P, Lyngbya sp., Chaetophora sp. and Amphora ovalisare indicators of acidic water.
Amongst Byophyte- Hepaticeae viz. Riccia sp., Marchantion sp. and mosses are found in damplittoral zone of river with enriched nutrients and Azolla (Pteridophhyte) with Anabaena areindicators of water rich in nitrate nitrogen. Ecological tendencies of Phytoplankton for catego-rizing algae as bio-indicators: Laal et al (1994) gave a concise information on the role ofphytoplankton in monitoring water quality.
Periphyton
Periphyton acts as producers and fish browse over them. Periphyton facilitates objective de-scription and comparison of community structure, and in theory, their use obviates the for-midable alternative prospects of investigating each constituent species population in relation toabiotic factors. The structure of lotic periphyton or aufuchs community is sensitive to environ-mental conditions and in some cases have been found useful in characterising the biotic re-sponses. Species diversity of periphyton as an index of pollution of river Ganga has beenreported (Laal et al. 1982). Whiton & Kelly (1995) and Kelly et. al. (1995) also utilized pe-riphyton for monitoring pollution. Pennales in general indicate eutrophic water, higher theirpopulation indicate higher degree of eutrophicity, centrals are usually indicator of oligotrophic,oligosaprobic water.
Characteristic algal association of digo-rophic and eutrophic lakes (Mason, 1983)
Algal group Examples
Oligotrophiclakes
Desmid plankton
Chrysophyceanplankton
Diatom plankton
Dinoflagettateplankton
Chlorococcalesplankton
Eutrophiclakes
Diatom plankton
Dinoflagellateplankton
Chlorococcalesplankton
Myxophyceaeplankton
Staurodesmus,Staurastrum
Dinobryon
Cyclotella, Tabellaria
Peridinium,Ceratium
Oocystis
Asterionella, Fragilariaordonesis, Stephanodiscusastraea, Melosira granulata
Peridinium bipes, CeratiumGlenodinium
Pediastrum, Scendesmus sp.
Anacystis, Aphanizomenon,Anabaena

71
Consumers
Zooplankton
Rotifers are small group of metazoa predominantly freshwater zooplankton, due to their ubiqui-ty, diversity and substantial contribution in food web in aquatic ecoystem serve as good bio-indicators for water quality more authentic for monitoring pollution (Laal and Karthikeyan,1993), A/c to author Floscularia ningens and Rotaria neptunia are indicators of sewage dopedwater bodies infested with macrophytes (hyper eutrophic and polysaprobic conditions). Poralessp. is indicator of a-eutrophic and o-mesosaprobic water. Testudinella sp.is indicator of B-eutrophic and polysaprobic conditions. Mytilina ventralis is indicator of acidic water (eutrophicand mesosaprobic conditions). Brachionus angularis and B. angularis Var Bidens are indica-tors of a-eutrophic and o-mesosaprobic water. Their occurrance coincide with abundance ofEuglena gracilis, E. viridis, Scenedesmus accuminatus, Microcystis aeruginosa, Chlorellavulgaris and Oscillatoria sp. Brachionus havaenesis is indicator of hyper eutrophic and polysa-probic water level when its population is below 100 ul-1,it is an indicator of a-eutrophic and a-mesosaprobic water. B. quadridentatus and B. caudatus are indicators of B-eutrophic and B-mesosaprobic water. B. rubens is indicator of hyper eutrophic and polysaprobic water bodies.Asplanchna sp. is indicator of a-eutrophic and a-mesosaprobic water and found in associationwith memebers of chlorococcales. Lapadella ovalis, platyas patulus are indicators of hypereutrophic and polysaprobic water viz. wet lands or swamps. Polyarthra ehrenberg, Synchaetagrandis, Keratella hiemalis are indicators of oligotrophic and oligo saprobic water. Keratellatropica, K. cochlearis, B. calyciflorus, Anuraeopsis fissa, Filinia longispina, F. opolienis arehaving wide tolerance. They occur in almost all types of water, their population increase withincrease in degree of trophicity and saprobity.
Members of c1adocera are useful indicators. Daphnia sp., Bosmina longirostris are indicatorsfor oligotrophic and oligo saprobic water. Chydorus sp., Macrothrix sp. and Alona sp. for a-eutrophic and o-mesosaprobic water infested with macrophytes. Moina sp. for hyper eutrophicand polysaprobic conditions. Their periodicity would help in selecting bio-indicators duringparticular period (Table 2).
Benthic macroinvertebrates
Detritus are the store house of energy in river and their source is litter waste from forest,pasture land and allochthonous city sewage and industrial effluents. It constitutes varied nichesand being utilised by various benthic macro invetebrates. Their occurrence, density and diver-sity reflect the water quality. Invertebrates comprising bottom biotal communities have defi-nite preferences for substrate and consequently as the type of substratum changes so does thefauna. Substrate is, therefore, one of important factor of dividing running water into an up-stream rhythral zone with fixed rock, stone or gravel and fine sand, and down stream potamonzone with mostly sand or mud.
Some invertebrates are filter feeders and have evolved various sieving mechenisms to obtainparticulate matter in suspension. Filter feeding is known in many trichoptera, ephemeropteraand diptera. Many species of plecoptera, trichoptera ephemeroptera and amphipods and somespecies of crayfish consume detritus and/or leafy material of terrestrial origin. Detrivores havebeen classified into functional group i.e. shredders, scrapers, filter feeders, collector andgatherers based on their preferable detritus feeding mechanism. Feeding of detritus from al-lochthonous material affect invertebrate population. Since benthic macro invertebtates providevaluable indicator of past and present water quality conditions because of their long life spanand central position in the food chain, they have been utilized as very authentic and ideal bio-indicators for monitoring water quality. Lamelidens marginalis, L. corrianus, Melenia striatel-la, tuberculata, M. plotia scarba are indicators of oligotrophic and oligosaprobic water butwhen available in large number with lesser species diversity (H) they indicate L-eutrophic andL-mesosaprobic water. Chironomus sp. and annelids are indicative for eutrophic and mesosa-probic water. Trichopterans are indicators of eutrophic water in plain and oligo to eutrophic in

72
rhithron zone. Indoplanorbis exustus indicate abundance of macrophytes found in quite widerange of trophic and saprobic condition.
Quantifying the bottom biotal communities in species diversity according to Shannon andWeaver (1964) i.e. H = ni/N log2 ni/N has been found very important in biomonitorng waterpollution. The greater the species diversity values of conditions in locality the larger is numberof speices which make up the biotic community stable and healthy is the principle behind thistechnique. Species diversity of bottom biota community for monitoring pollution due tocommunity sewage waste on river Ganga has been reported by Laal et al. (1984). This givesinformation about dominance (c) evenness 0) too of the species in a community.
Decomposers play a very significant role in the regulation of bio-geochemical cycle in anaquatic ecosystem Bilgrami and Dutta Munshi (1979, 1985), reported altogether ninetyeightfungal forms belonging to different calsses from polluted zones of river Ganga, Bilgrami andDutta Munshi (1979, 1985) reported total coliform, Faecal caliform, Faecal streptococci andEscherichia coli from river Ganga between Patna and Farakka. Decomposers are observed ineutrophic, hyper eutrophic and polysaprobic water.
UTILITY OF BIOMONITORING
Biomonitoring would be helpful in getting following information (1) Nature and type of soils(2) Nnutrients load of soil and water (3) Nature of bottom (4) Weed infestation their qualityand quantity and associated fauna of varied ecological niches, (5) Nature and extent of alloch-thonous nutrients brought in or if the source of nutrient is autochthonous it would inform aboutthe quality of the source. (6) These information would be helpful in river water managementfor keeping clean and stocking river with desirable fish to augment yield.
RIVERS OF INDIA
The different river systems in India have an estimated length of 45,000 km. form an anastomo-sis of canals that run into 11,26,554 km. The Ganga river system' with its main tributaries likeYamuna, Ganga, Ramganga, Ghagra, Gomti, Kosi, Gandok, Chambal, Sone, Tons, etc. hascombibed length of 12,500 km. and Brahamuptra has alinear drift of 4023 km. The peninsularrivers like Mahanadi, Godavari, Krishna and Cauvery have a length of 6437 km. RiverNarmada and Tapti and the west flowing drainages of the western ghats have a combinedlength of 3380 km. Based on the studies made by CIFRI in some selected stretches of theGanga, Brahamputra, Godavari and Krishna, the fish yields from these stretches was estimatedto vary from 0.64 to 1.61 tones per km.
ANTHROPOGENIC PRESSURE ON RIVER GANGA
Rhithron zone
In general hydrology of rhithron region of river largely depends upon riparian vegetation forthe supply of particulate organic matter, terrestrial insects etc. to sustain the aquatic biota andichthyfauna. Rhithron region of river Ganga, starts from Rishikesh and above. This study giveinformation about gradient of the cahannel, its width, bed depth and courses marked by falls,rapids, cascades if any, followed by less st eep reaches made of alternating riffle pool se-quences. Further study indicated that bed material are made of boulders, rocks cobbles, graveland sand. Flora, particualrly bryophytes viz. liver worts and mosses are established in rifflezones; while rooted, floating and emergent vegetation, epiphytes establish upon rocks, sub-merged woods and in rifles and pool.
Potamonic zone
This includes the plain stretch of river and it may be divided in upper (epi), middle (meta) andlower (hypo) potamonic regions. Arbitarily the entire stretch of Ganga was covered under

73
investigation. Plain is from Rishikesh to Farakka may be divided into epipotamon i.e. fromRishikesh to Allahabad, metapotamon from Allahabad (down stretch) to Barauni and lastlyhypopotamon from Barauni to Farakka. The channel in potamic sector is braided, showsmeandes and is prone to flooding. The channel substrate, shoreline and terrace are influencedby flooding pattern, erosion and deposition. Deposition of eroded mterial is also major causefor aising river bed level, influencing the hydrochemistry, hydrobiology and ultimately thefisheries of river. The irrational exploitation of forest resources of the upper zone (rhithron)compounded by erodable petrography of Himalayas resulted in a sedimentation yield as highat 1600 million yr", the highest in the world.
POLLUTION
Impact of Industiral Wzstes
The Ganga just below the rhithron segment is subjected to pollution by effluents dishcarged byantibiotic and heavy electrical factories at Rishikesh (9.02 MLD) and heavy pollution due todischarge of effluents from tanneries, woolen mills, textiles, jute mills, etc. at Kanpur (167MLD). The middle stretch suffers from pollution through drainage of effluents from fertilizersplants (5.50 MLD) at Allahabad. In Bihar maximum industrial pollution of Ganga takes placenear Mokamah-Barauni area where the effluents from Bata Shoe Factory, McDowell distillaryand oil refinery are discharged into the river. Water pollution severely affected the aquatic life.Mass death of fishes at various points in Ganga ecosystem have been reprted from time totime. Toxic compounds adversely affect the spawning grounds of fishes. Destruction ofspawn, fingerlings and fishes naturally means a substantial loss in the source of protein andalso a financial hazard to thousand of fishermen.
Mass scale of destructon of fingerlings reduces the potentiality of fish yield by 100 times as italso diminishes the popultion of future spawners. Indiscriminate killing of aquatic life of riverGanga is leading to shrinkage of its genetic diversity. Many important species on way to ex-tinction. Ecological significance of the threatened and link species needs proper evaluation.
Sewage pollution
Sewage effluents receive by the Ganga re 16 MLD from each of the citgies like Haridwar,Farukhabad, Mirzapur and Bhagalpur, 100 MLD from each of Allahabad and Varanasi, 154MLD from Patna and 275 MLD from Kanpur. The total quantity of organic pollution load interms of BOD all over the urban aras and factories in the Ganga basin amounts to 2.5 millionkg/day, out of this, urban load contributes 53.40% i.e. 1.33 m kg/day and rest by industrialsources. The urban areas in the Ganga basin generates about 152801 m3 of waste water perannum. The flow of BOD in the urban wastes comes to 22.8 kg/sec. Sewage is posing a seri-ous threat to the riverine environment and is amajor source of deoxygeneration in the riversand hence adversely affecting fish and their feeds. Apart from these, sewage pollution createunsafe situation for recreation as it provides conducive condition for pathogens which arehealth-hazazrd at the point where it is discharged in river.
If sewage flows through seperate channel before getting dishcarged in river Ganga, the sewagefed channel may be utilized for multiple utilization including fish culture. Fish culture in pensin Kol (drainage sewage to river Ganga) at Bhagalpur were conducted. 203 kg of fish wereobtained from pens area of O. 1 ha in three months without the application of fertilizers andsupplementary feeds. This experiment has proved that pen culture operation in sewage pollutedchannel hold bright prospect for augmenting fish production at minimum input cost; and suchapproach also lessens the impact of sewage pollution in river Ganga.
Thermal pollution
In Ganga basin ideal condition exist for setting up of thermal power plant due to availability ofnatural resources like coal and water in plenty. One of such power plant is at Singrauli, situat-

74
ed in the vicinity of Rihind reservoir. Environmental hazard loom large in Singrauli belt due toconstruction of four super thermal power plants viz. Singrauli (2000 MW), Vindhyanchal(2260 MW), Anpara (3130 MW) and Rihand (3,000 MW) in public sector and Renusagarthermal power sttion (210 KW) in private sector. Three more thermal power stations have alsobeen set up viz. Barauni, Kahalgaon and Farakka- in lower Ganga basin. At Kahalaon andFArakka there are National Thermal Power Corporation Plants. One nuclear thermal powerstation is also working at Narora, district- Aligarh. These power plants are discharging efflu-ents in the Ganga and its tributaries. They emit harmful gases like carbon monoxide, sulpherdioxide and enormous quantity of fly ash into the atmosphere besides discharging heated wastewater into the river/reservoir, thus polluting both the air and water. Fly ash makes a thicklayer over the water surface and thus abstains light penetration thereby disrupting the normalfood web and energy cycle involved in the formation of food web. It hampers yield of fish feedand ultimately the fish yield too. Further, deposition of fly ash make Ganga unsuitable forpurpose of recreation.
HEAVY METALS AND PESTICIDES
According to Ganga Action Plan's (GAP) investigation report of river Ganga system based onobservation from 27 different sampling centres between Rishikesh (Ll.P} and Ulberia (W.B.)Spatio-temporal variations in 10 heavy metals and 12 pesticides both of organochloride andorganophosphorus types during July 1986 to June 1991, findings were as follows. During thispeirod regular spatio-temporal variations trend were not observed. Arsenic and cadmium levelsand frequencies of their appearance in water samples were largely insignificant, except for afew locations; Rishikesh, Haridwar, Ram Ganga at Kannauj, Gandak at Patna, Baharamporeand Dakshineshwar- copper, nickle and zinc levels in river water samples were usually belowtheir permissible (WHO) limits (No limits prescribed for Ni) and in general have been insignif-icant. Iron and magnese both were very frequenly found present in the river water from all thelocations and most of the time their concentration levels were above their respective permissi-ble (WHO) limits. Chromium which mainly comes from the industiral and other anthoropogen-ic sources was usually detected in higher concentrations in water from Garhmukteshwar,Kalinadi and Ram GAnga at Kannauj, Kanpur (upper stretch), Allahabad (both stretches),Varanasi (both stretches). Lead levels were usually higher in river water from Garmuketesh-war, Kannauj (D/S), Kanpr (D/S), Allahabad (U/S) & D/S, Varanasi, U/S & D/S, Khurgi,Patna D/S, Rajmahal and Dakshineshwar. Mercury levels were also usually high in water fromKannuj, Kanpur U/S, Kanpur D/S, Allahabad U/S & D/S, Buxar and Patna near Gandhi setu.In general the concentration of heavy metals in river water were higher during monsoon (July-September) and their concentrations decline October onwards with time. Thus, it may be in-ferred that due to high run off during July-September from catchment including urban areastheir concentration increase.
Among pesticides, D.D.T and BHC have been the most commonly detected pesticides in riverwater through out the above period (July 1986-June,1991) and in majority of these, their resi-due levels have been found above their prescribed criteria; Environemnt Protection Agency(EPA). Endosulfan has also registered its presence at most of the sampling sites but theirappearance and residue levels have been comaparatively low. Residue levels of the pesticideswere usually higher during the winter months as compared to the summer and rainy season.Probable factors suggested by GAP for such trends have been lower temperture and time ofapplication of these pesticides.
In other tributaries like Ram Ganga is heavily polluted at Moradabad due to sewage discharge,at Gularia due to rubber factories waste, paper factories waste; and at Bareilly, Bajian due tosugar factories waste. Gomti is heavily polluted at Lucknow due to Mohan Meakins brewerieswaste, city sewage at Haidernallah and Indogulf's urea, paper, steel factories waste at Jagdish-pur. River Ghagra is being polluted and thus, it is obvious that river Ganga and its tributariesare being used as dumping channel needs management to restore pristine condition of river.
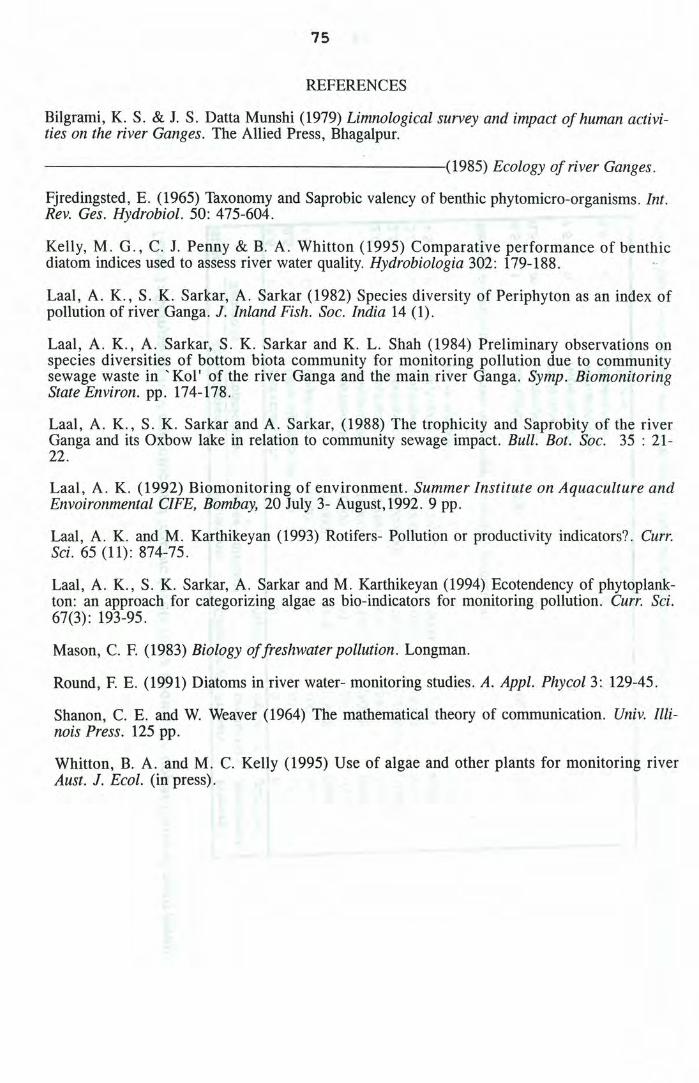
75
REFERENCES
Bilgrami, K. S. & 1. S. Datta Munshi (1979) Limnological survey and impact of human activi-ties on the river Ganges. The Allied Press, Bhagalpur.
---------------------(1985) Ecology of river Ganges.
Fjredingsted, E. (1965) Taxonomy and Saprobic valency of benthic phytomicro-organisms. Int.Rev. Ges. Hydrobiol. 50: 475-604.
Kelly, M. G., C. J. Penny & B. A. Whitton (1995) Comparative performance of benthicdiatom indices used to assess river water quality. Hydrobiologia 302: 179-188.
Laal, A. K., S. K. Sarkar, A. Sarkar (1982) Species diversity of Periphyton as an index ofpollution of river Ganga. J. Inland Fish. Soc. India 14 (1).
Laal, A. K., A. Sarkar, S. K. Sarkar and K. L. Shah (1984) Preliminary observations onspecies diversities of bottom biota community for monitoring pollution due to communitysewage waste in "Kol ' of the river Ganga and the main river Ganga. Symp. BiomonitoringState Environ. pp. 174-178.
Laal, A. K., S. K. Sarkar and A. Sarkar, (1988) The trophicity and Saprobity of the riverGanga and its Oxbow lake in relation to community sewage impact. Bull. Bot. Soc. 35: 21-22.
Laal, A. K. (1992) Biomonitoring of environment. Summer Institute on Aquacuiture andEnvoironmental CIFE, Bombay, 20 July 3- August, 1992. 9 pp.
Laal, A. K. and M. Karthikeyan (1993) Rotifers- Pollution or productivity indicators? Curr.Sci. 65 (11): 874-75.
Laal, A. K., S. K. Sarkar, A. Sarkar and M. Karthikeyan (1994) Ecotendency of phytoplank-ton: an approach for categorizing algae as bio-indicators for monitoring pollution. Curr. Sci.67(3): 193-95.
Mason, C. F. (1983) Biology offreshwater pollution. Longman.
Round, F. E. (1991) Diatoms in river water- monitoring studies. A. Appl. Phycol3: 129-45.
Shanon, C. E. and W. Weaver (1964) The mathematical theory of communication. Univ. Illi-nois Press. 125 pp.
Whitton, B. A. and M. C. Kelly (1995) Use of algae and other plants for monitoring riverAust. J. Ecol. (in press).

Table 1: Comparison of saprobic and trophic levels (data shows the upper limits of each level)
SI No. Abbreviations Planktonic Chlorophyll Primary PrimarySaprobity Trophic level algae individual production production
litre -1 mqm" mgCm-2d-1 gCm-2yr1
0.5 K Kathrotatrophic 1 0 0 00.5 X Ultra oligotrophic 100 0 50 101.5 0 Oligotrophic 1000 5 100 30
[10000] [20] [1500] [500]Intermediate 10000 20 250 100
,\0 mesotrophics [100000] [100] [4000] [2000]r--2.0 y-eutrophics /100000 300 500 150Y2.5 fJ fJ-eutrophics [10000000] [15000] [12000] [1000]3.5 a a-eutrophic 1000000 1000 15000 3004.5 P Polytrophic or 10000000 15000 12000 4000
hyper eutrophic
Sewage and industrial wastes exclusively secondary product ion
5.5 Isotrophic 1000 3 100 306.5 m Metatrophic= 0 + + +
Thiotrophic7.5 h Hypertrophic= 0 0 0 0
Methanotrophic8.5 u Ultratrophic= 0 0 0 0
Atrophic
Note: Values in bracket deals with eutrophication intermediate level mesotrophic equals the gamma-mesosaprobity (Fjerdingstad, 1965)

77
Table-2: Thermal affinities of some important planktonic bio-indicators intropical region in Gangetic Belt Laal (1992)
STENO THERMAL
COLD
PHYTOPLANKTON
WARM
Closterium nitizsch Volvox globatumChlorella vulgaris
cosmarium sp. Crucigenia sp.Eudorina sp.
Ceratium sp. Euglena viridisEuglena acusPhacus sp.Trachlemenas sp.
Filinia opoliensisAnuraeopsis fissaPorales .sp.Rotaria neptuniaTrichocera sp.Mytilina sp.
Floscularia sp.
Brachionus falcatus
B. forficulaB. havanaensisColurella obtrusa
Bosmina sp.
Oscillatoria chlorinaO. limosaO. tenuisSpirulina princeps
ZOO PLANKTONRotifers
Platiyas sp.Lapadella ovalisPompholyx sulcataAlbertia sp.SynchaetaConochilus sp.
Brachionus caudatus
Hexarthra sp.
EURY THERMAL
Scenedesmus sp.Pandorina sp.
Pediastrum duplexP. simpex
P.ovatumSpirogyra sp.Lyngbya sp.Ald.Bacillari -phyceae algae.
Microcystis aeru-ginosa.
Filinia longispinaFilinia terminalisKeratella tropicsK. cochlearisK. heimalisBrachionus-quadridentatus
B. angularisB. calyciflorusB. bakeri
B. rubensB. urceolarisHoraella sp.Lecane lunaL. ohiensisL. monostyla
CladoceraMoina brachiata Daphnia sp.Moina macrocopa Ceriodaphnia sp.Chydorus ScapholeberisMacrothrixA

78
Riverine fisheries in India with special reference toGanga river system
R. K. Tyagi
Riverine DivisionCentral Inland Capture Fisheries Research Institute
24 Panna Lal Road, Allahabad 211 002
JIndia's vast network of rivers and rivulets has been source for the many species of fishproviding livelihood to hundreds of thousands of fishermen. Riverine fishing has beenpopular in India since time immemorial as could be recorded from the mythological storyof Matsya Gandha and Bhismpitamaha in the Mahabharat. The various river systems inthe country have an estimated linear length of 45,000 km comprising 113 rivers and theirtributaries, 80% of the length being contributed by the 14 major rivers. The riverinefishery resources ofIndia comprise five major river systems (Fig. 1 ) as presented below:
River system (catchment areamillion km2)
Length (km) Important rivers
Ganga river system (0.98) 12,000 Ganga, Yamuna, Ramganga, Gomti,Chambal, Ghagra, Rapti, GandakKosi, Son, Tons, Ken, Betwa
Indus river system small segment Indus, Beas, Sutlej
Brahmaputra river system (0.51) 4023 Subansiri, Dihrong, Jai-bhareli,Dhansiri, Manas, Kalong, Digru,Kulsi, Krishnai, Jinari
Peninsular East coast system (1.21) 6437 Mahanadi, Godavari, Krishna,Cauvery
Peninsular West cost system (0.69) 3380 Narmada, Tapti

------------------~,79
c 0 e o Ljoo 5ClCl\C"",1<"'" )00 J W !Pt- f
Sc.Je', \', ~Cl,CJO<>JOO<3
880
1~tQ'<v"lf) aj TY'<7L'~

80
Fishery resources
In river Ganga, the commercial fishery in the upland waters is of very low order due toexploitation problem. The snow trouts (Schizothorax spp. and Schizothoraichthys spp.)and certain catfishes are common in the headwaters of the Ganga. Below 1067 m,mahseers (Acrossocheilus hexagonolepis Tor tor and T putitora), certain cyprinids(Labeo dyocheilus, L. pangusia and L. dero) and the catfish, Bagarius bagarius, form themajor food fishes. Angling, poisoning and trapping are the prevalent fishing practices inthe area. The stretch of the Ganga (1600 km) between Haridwar and Lalgolaghat providesthe richest source of freshwater capture fisheries in India. The commercial catches arecomprised of major carps (Cirrhinus mrigala, Cat/a cat/a, L. rohita and L. calbasu), _catfishes (Mystus aor, M. seenghala, Wallago attu, Eutropiichthys vacha, Clupisomagarua, Rita rita, Pangasius pangasius, Silonia silondia and Bagarius bagarius), minorcarps (Labeo bata and Cirrhinus reba) and featherbacks (Notopterus chitala and N.notopterusy. The anadromous hilsa used to be a very important fishery in the strech belowAllahabad but now it is restricted only in lower stretch below Farakka barrage withscarce report of its availability in the upper stretch. During monsoon, fishes of lessereconomic importance (Setipinna phasa, Gudusia chapra, Goniolosa manminna, Puntiusspp, M. cavasius, M. vittatus, Ailia coila, Chela spp., Aspidoparia morar, Osteobramacotio, Rhinomugil corsula and Macrobrachium lamarrei) form the bulk of catches.
The headwaters of Brahmaputra harbour mahseer (T tor, T mosal, T progeneius and A.hexagonolepis) and B. bagarius. In the middle and lower reaches the commercial catchesare mainly composed of major carps (c. mriga la, L. rohita, L. calbasu, C. cat/a), minorcarps (L. gonius, L. dero and C. reba), catfishes (w. attu, C. garua, S silondia, P.pangasius, M. aor, M. seenghala, B. bagarius, E. vacha, 0. pabda, 0. bimaculatus, M.vittatus, R. rita, A. coila, Clarias batrachus and Heteropneustes fossilis ) and otherspecies (S phas, G. chapra, Mastocembelus armatus, N. chitala, N. notopterus,Xenentodon cancila, Aspidoparia morar, Noemachilus spp. and Ambassis spp.). Hilsa aslike the case of Ganga, used to contribute a good deal in catches but presently itscontribution is very little.
The headwaters of Indus system harbour mahseer (T tor and T putitora), snow trout (Splagiostomus and S esocinus), some cyprinidus (L. dero, Garra gotyla and Barilius spp.),the exotic, brown and rainbow trouts. The Beas and the Sutlej contain indigenous carpsand catfishes akin to the Ganga drainage and are exploited commercially.
Mahanadi is the largest river of east coast river system and in its headwaters, mahseer(Tor mosal mahanadicus), B. bagarius and L. dyocheilus are abundant, though nocommercial fishery exists in this stretch due to rapids, gorges, temple sanctuaries anddifficult terrain. In its middle and lower stretches, fish fauna similar to that of the Gangadrainage occurs in addition to a few penninsular forms (Labeo fimbriatus). Hilsa occursonly in lower reaches. In the lower and middle reaches major carps and larger catfishesconstitute sizeable commercial fishery. J

81
In river Godavari, the main species supporting the commercial fishery, are Labeofimbriatus and Gangetic major carps, larger catfishes (Mystus spp., W attu, Siloniachildreni and B. bagarius). The anadromous hilsa used to make a significant fishery.
Tor khudree and T mussullab occur throughout the Cauvery river barring deltaic region.The commercial fishery is made up of carps' (A. hexagonolepis, Tor spp., Barbuscarnaticus, B. dubius, Labeo kontius), catfishes (Glyptothorax madraspatanus, Mystusspp., P. pangasius, W attu and S. silondia). Gangetic carps, transplanted into the river inthe beginning of the century, contribute significantly to commercial catches.
Among the rivers of west coast river system, Narmada and Tapti are the principal rivers. _In both the rivers, the fish fauna is akin to Ganga, excepting occurrence of Ritapavimentata. Among minor carps L. fimbriatus and Labeo boggut are important species.
The fishing gears and crafts
Gears: The riverine fishing gears are mostly simple in design and operation and as awhole are low energy fishing devices. Mechanised fishing gears and crafts are not usedanywhere. As far as gears are concerned, numerous type of gears are employed dependingupon environment and seasons, some selective to size and species and some not. Thegears used in the river Ganga based on the manner by which the capture is effected can beclassified as:
Sub-type Local nameTypeWith pocketWithout pocket
ChantaMahajal, Darwari, Karia, Chundhi, Do-dandi
Drag net
Gill net With foot ropeWithout foot rope
GochailTiarBara kamel, Chhota kamel, SanghalajalPurse net
Cast net Bhanwar jal
~coop net Jali
Hook and line Jor
Kuriar, Gopal jal, Bandal, Sirki, Ujhki, KohniTraps
Fishing crafts
For fishing, two types of boats are used: big boat known as 'Katra' and small boat orDongi. Big boats are used with big drag nets like Mahajal, Karia and Darwari. The small

82
boat or Dongi is used with almost all other types of net. The boat is very light and handyin use. Coracle is the most common craft in river Cauvery.
Present status of riverine fisheries in India with special reference to Ganga
Barring the studies conducted by Central Inland Capture Fisheries Research Institute, noother information is available on riverine fisheries in India. In 1976, NationalCommission on Agriculture estimated the catch/km from various rivers based on the datacollected by CIFRI. The catch ranged from 0.643 to 1.605 tlkm with an average of 1tlkm. During the post independence era, river basins witnessed an expeditious pace ofindustrialization, agricultural development and urbanization. These developmentalactivities along with flood control measures have adversely affected the riverine habitatand its fisheries. For the present the estimates are far from the earlier estimates and basedon the recent studies, it has come down to merely 0.357 t/krn for Ganga. The decline wasnot only quantitative but qualitative also. The remunerative capture fisheries of the yesteryears no longer exists, reasons being: i. the major carps, which used to contribute around50% of the total, have lost their prime position, contributing about 20% only, the averageannual yield rate of major carps from the Ganga is estimated to have fallen from 245.2kg/km of 1961-69 to only 43.4 kg/km; ii. the large catfishes yield rate has declined to85.9 kglkm from 197.7 kg/km of the earlier period; iii. the hilsa fishery has tumbleddown to merely 3.4 kg/km from an average of 176.7 kg/km; iv. the rest of the species alsoregistered a decrease to 224.3 kg/km as compared to 310.1 kg/km of the past. Ecologicalaberrations have adversely affected the spawn availability which used to be the primesource of stocking material for aquaculture. Situation is more or less the same for all ofthe Indian rivers. Some of the rivers have lost their lotic character and for the major part
I
of year they remain almost dry, especially among peninsular rivers.
(The decline in fishery has further increased the hardships of poor fisherfolk, whollydependent on this source for livelihood, needs to be lamented at national level to save thebiological wealth and uplift the socio-economic condition of fishermen community.

83
Hydrological changes, fish population trends andproduction potential of Hooghly estuarineecosystem with special emphasis of Hilsa
D.K. DeCentral Inland Capture Fisheries Research Institute
Barrackpore - 743 101 West Bengal India
Introduction
The Hooghly estuarine system located in the state West Bengal, India, betweenlatitude 21-23<N and longitude 88-890E is the largest among the estuaries on theIndian coast covering the gangetic delta called the Sunderbans. It is the world's largestdelta which supports many important commercial fisheries. The Sunderbans area iscriss-crossed by many major and minor estuaries and dominated by intertidal and flatsas well as rich mangrove forests. The total area of the entire estuarine system is about8,029 km'. The principal components of the estuarine system are the main Hooghlychannel, its five tributaries viz, Jalangi, Churni, Damodar, Rupnarayan and Haldi andthe adjacent estuaries viz., Saptamukhi, Thakuran, Matlah, Gosaba, Harinbhanga,Ichamati and Raimangal situated in the lower marine zone. These estuaries aredisconnected since long from the main Hooghly channel due to heavy deposition of siltin their upper reaches. The Hooghly main channel is a distributary of the Ganga whichis considered as the second major river of the world in terms of suspended load,
. discharging 1451XI06 tons annually. It is the main contributor of sediments to theBengal Fan which is the largest deep sea fan in the world. The heavy deposition ofsediments, carried by the Ganga-Hooghly resulted into formation of cluster of islandsin the lower estuarine areas - the Sunderbans.
The Hooghly estuary is a positive estuary of mixohaline type and a pattern ofincreasing salinity towards the mouth of the estuary. The dynamic estuarine ecosystemis subject to rapid changes by natural or man-made interferences. A major change inthe water quality and fishery resources was observed in the Highly estuarine systemafter commissioning of Farakka barrage across the river Ganga at Farakka. Prior to theconstruction of Farakka barrage both the river Bhagirathi and Hooghly estuary weredeprived of receiving sufficient freshwater and gradually. becoming in active as bulk ofdischarge used to flow through river Padma, the other off-shoot of river Ganga. Aftercommissioning of Farakka barrage in 1975, the main Hooghly estuary is fed directly bythe Ganga through man made feeder canal and Bhagirathi river. The additionaldischarge of freshwater into the system has sufficiently changed the ecology of theestuary. These changes significantly affect the biological and physico-chemical factorsresponsible for plankton, benthos and fish production.
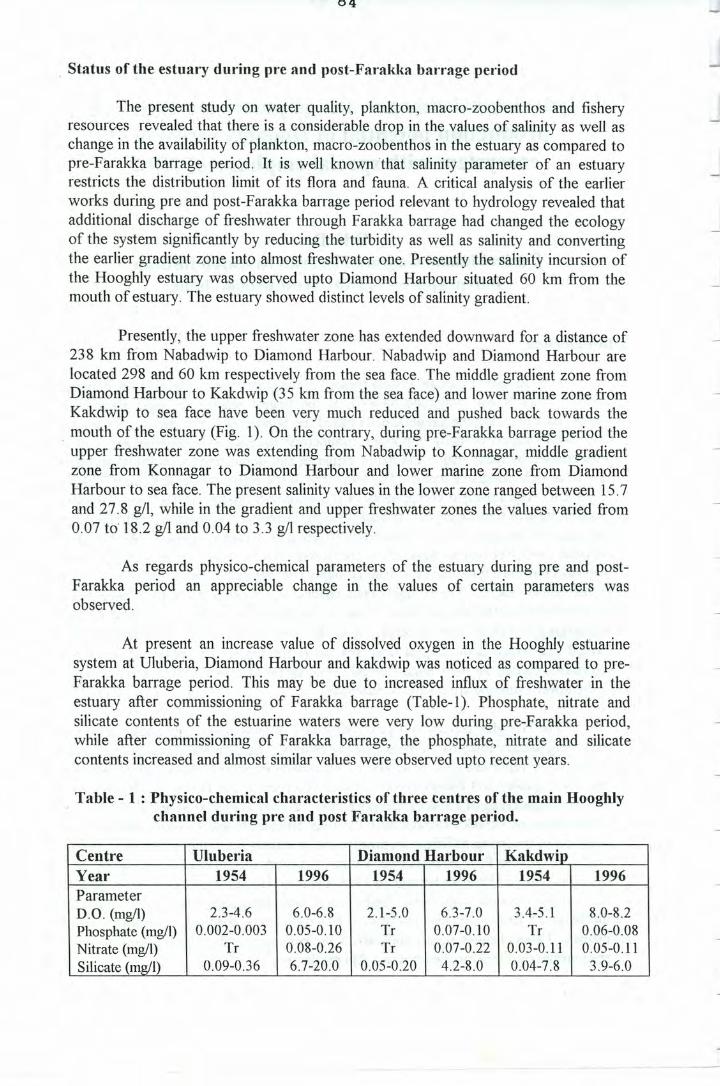
84
. Status of the estuary during pre and post-Farakka barrage period
The present study on water quality, plankton, macro-zoobenthos and fisheryresources revealed that there is a considerable drop in the values of salinity as well aschange in the availability of plankton, macro-zoobenthos in the estuary as compared topre-Farakka barrage period. It is well known 'that salinity parameter of an estuaryrestricts the distribution limit of its flora and fauna. A critical analysis of the earlierworks during pre and post-Farakka barrage period relevant to hydrology revealed thatadditional discharge of freshwater through Farakka barrage had changed the ecologyof the system significantly by reducing the turbidity as well as salinity and convertingthe earlier gradient zone into almost freshwater one. Presently the salinity incursion ofthe Hooghly estuary was observed upto Diamond Harbour situated 60 km from themouth of estuary. The estuary showed distinct levels of salinity gradient.
Presently; the upper freshwater zone has extended downward for a distance of238 km from Nabadwip to Diamond Harbour. Nabadwip and Diamond Harbour arelocated 298 and 60 km respectively from the sea face. The middle gradient zone fromDiamond Harbour to Kakdwip (35 km from the sea face) and lower marine zone fromKakdwip to sea face have been very much reduced and pushed back towards the
. mouth of the estuary (Fig. 1). On the contrary, during pre-Farakka barrage period theupper freshwater zone was extending from Nabadwip to Konnagar, middle gradientzone from Konnagar to Diamond Harbour and lower marine zone from DiamondHarbour to sea face. The present salinity values in the lower zone ranged between 15.7and 27.8 g/l, while in the gradient and upper freshwater zones the values varied from0.07 to' 18.2 g/l and 0.04 to 3.3 g/l respectively.
As regards physico-chemical parameters of the estuary during pre and post-Farakka period an appreciable change in the values of certain parameters wasobserved.
At present an increase value of dissolved oxygen in the Hooghly estuarinesystem at Uluberia, Diamond Harbour and kakdwip was noticed as compared to pre-Farakka barrage period. This may be due to increased influx of freshwater in theestuary after commissioning of Farakka barrage (Table-I). Phosphate, nitrate andsilicate contents of the estuarine waters were very low during pre-Farakka period,while after commissioning of Farakka barrage, the phosphate, nitrate and silicatecontents increased and almost similar values were observed upto recent years.
Table - 1: Physico-chemical characteristics of three centres of the main Hooghly. channel during pre and post Farakka barrage period.
Centre Uluberia Diamond Harbour KakdwipYear 1954 1996 1954 1996 1954 1996Parameter0.0. (mg/I) 2.3-4.6 6.0-6.8 2.1-5.0 6.3-7.0 3.4-5.1 8.0-8.2Phosphate (mg/l) 0.002-0.003 0.05-0.10 Tr 0.07-0.10 Tr 0.06-0.08Nitrate (mg/I) Tr 0.08-0.26 Tr 0.07-0.22 0.03-0.11 0.05-0.11Silicate (mg/l) 0.09-0.36 6.7-20.0 0.05-0.20 4.2-8.0 0.04-7.8 3.9-6.0

• SAMPLE CENTRESIIIII
8 I-c-NAWABGA~J ,
F(GURE •.1. '.HOOGHLY ESTUARY AND ITS VARIOUS. ,
FISH ING Z6N~S, -'};;<':;'.:.;
f
...

85
Plankton
The overall plankton production in the Hooghly estuary during post-Farakkabarrage period was high when compared with the earlier studies during pre-Farakkabarrage period. The total plankton production for the Hooghly estuarine stretch wasmaximum at Frazerganj (1262 u/l) and minimum at certain stretches of freshwater aswell as gradient zones of the estuary. The low production of plankton at thesestretches may be due to discharge of industrial effluent which caused maximumadverse effect on production of plankton. The bulk of plankton in the Hooghly wasconstituted by phytoplankton. Bacillariophyceae, Chlorophyceae and Cyanophyceaeare the principal groups in order of abundance. Phytoplankton production wasmaximum at Frazerganj in the Hooghly estuary as compared to other distributaries viz.Saptamukhi, Thakuran, Matlah, Roymangal and Ichamati.
Table - 2: Maximum plankton density (unit/liter) in the Hooghly estuarinet d . d tF kk b . dsys em urmg pre an pos ara a arraze perm
Estuary Zone 1956-61 1971-72 1996-97Hooghly Upper (Freshwater) 298 304 920
Middle (Gradient) 293 223 414Lower (Marine) 61 145 1267
Matlah - 356 - 585
Zooplankton commurunes were found to be represented by the copepods,rotifers and caldocerans and protozoans in order of abundance.
Macrozoobenthic fauna
Information on macrozoobenthic fauna of Hooghly estuarine system during preand post- Farakka barrage periods are very scanty. At present the overall population ofmacrozoobenthos ranged between 182/m2 and 1428/m2 and the maximum productionwas observed in freshwater zone of the estuary at Nabadwip. The overall compositionof the bottom macrofauna of the estuary was gastropods. The next important groupswere annilids and bivalves. Among gastropods, the dominant species viz. Thiaratuberculata, T. scabra, T. lineata, Bellamya bengalensis, B. dissimilis, Brotia costula,and Assaminea jrancassiae were observed in the freshwater zone, while Cerithidea
. cingulata, C. obtusa, Barnia candida, Neritina anriculata, Columbella duclosiana,Natica tigrina, Telescopium telescopium were maximum in lower marine zone of theestuary.
Fishery
The annual average prawn and fish yield from the estuarine system hasincreased from 9,481 tonnes during pre-barrage period to 43,000 tonnes during post-barrage period.
A wide variety of fish and prawn diversity was observed in the freshwater zone,particularly in the lower stretch of this zone from Uluberia to Diamond Harbour beingthe admixtured of fresh and saline water, euryhaline species were also encountred inthe region. The important fish and prawn fauna available in the upper freshwater zone

86
were Tenualosa ilisha, Mystus seenghala, Eutropichthys. vacha, Clupisoma garua,Setipinna phasa, Ailia coila, Mastacembelus armetus, Pangasius pangasius,Xenentodon cansula, Mystus cavasius, Ompok pavo, Mystus gulio, Notopterusnotopterus, N chitala, Wallago attu. Among prawns Macrobrachium rosenbergii,Mmalcolmsomii, M rude, Mivillosimanus and Mlamarrci, M m irabiles,Mibirminicum birminicum, Miscabriculum and Mdayanum were available in thestretch. The commercially important fish available in the lower stretch of freshwaterzone were Pama pama, S. phasa, T ilisa,Polynemous paradise us, Silago panijus andRhinomugil corsula. Among prawns, Macrobrachium rosenbergii, M mirabile andMetapenaeus brevicornis were the most dominant species. P.pama and S.phasa weremostly abundant during October to November, while peak fishing season forP. paradise us was March and April.
Dominant species in the gradient as well as marine zone of Hooghly includingother estuaries of Sunderbans (distributaries of Hooghly) were Harpodon nehereus,Trichurus spp., T ilisha, Setipinna spp. P. pama and prawns (Parapenaeopsis
. sculptilis, P. stylifera, Metapeneous brevicornis, M monoceros, Peaeus monodon,Piindicus, Explaemon stylifera, E.tunifres. Next to these other important fish specieswere Piparadiseus, Eleutheronema tetradactylum, Lates calcarifer, Polynemusindicus, Coilia spp. Stromateus cinereus, Tachysurus jella, Ilisha elongata, Racondarusselliana, Chirocentrus dorab, Sspanijus, Sciaena biauritus, Liza parsia, L. tade,Plotosus canius, Osteogeniosus militaris etc. etc.
In the Hooghly estuarine system, fishing exploitation by migratory bagnet wasan important feature of the lower estuarine zone during winter month from Novemberto January. The winter migratory bagnet fishery contributed to the tune of 65-75% ofthe total yield of the estuary. More than 90% catches are marketed as dry fish. Thedominant species contributing in the winter migratory bagnet fishery were H. nehereus,Trichiurus spp. Setipinna spp., Tijella, P.pama and Coilia spp. On the whole, thelower marine zone of the estuarine system during post Farakka barrage periodcontributed about 95% of the total catch of the entire Hooghly estuary and Sunderbansdeltaic region and the maximum contributors were H. nehereus (23.5-26.7%),Trichiurus spp. (13.1-15.2%), Setipinna spp. (13.1- %) and Prawns (6.6-6.9%).
The present trend of catch statistics shows that some fish species viz. Lizaparsia, Lates calcarifer, Pangasius pangasius, Elutheronema tetradactylum,
. Harpodon nehereus, Trichirus spp. of the estuarine system have shown a sharpdeclining trend or total absence in the upper and gradient zones of the estuary duringpost-Farakka barrage period. The average annual catch of Polynemus paradiseus inthe post barrage period have increased significantly in gradient zone. Harpodonnehereus, Trichiurus jella, Setipinna spp. and Pama pama have also shown animproved catch in the marine zone during post barrage period. On the contrary certainfreshwater fish and prawn species viz. Eutropichthys vacha, Clupisoma garua, Ritarita, Wallago attu, Mystus seenghala, M. aor, Cat/a cat/a, Labeo bata,Macrobrachium rosenbergii have made their appearance in the estuarine system.Contribution of dominant fish and prawn of Hooghly estuarine system during pre andpost-Farakka barrage period is presented in Table-3.

87
Hooghly estuarine system is a potential source of estuarine fish or prawn seed.The marine fish production is by and large dependent on estuaries since these serve asbreeding and nursery grounds for important sea fishes and prawns. The seed ofcommercially important prawn Penaeus monodon are available extensively alongwithseeds of other important penaeid (P. indicus) and Metapenaeid (Metapenaeusbrevicornis and M monoceros) prawn as well as fishes (Liza parsia, L. tade and Latescalcarifer). At present, the upper limit of availability of the marine fish and prawn seedhas become restricted to 50-60 km while during pre-Farakka barrage period seeds ofP.monodon and P.indicus were available from Uluberia and Nurpur centres ofHooghly main channel located 113 and 83 km respectively above the mouth of themain estuary. The ranges of salinity around Nurpur and Uluberia fluctuated between0.09 and 21.15 g/l and 0.50 and 9.45 g/l respectively (Chakraborty et. a11982) whileduring post-Farakka barrage period the salinity had gone down which varied between0.021 and 2.25 g/l at Nurpur and 0.014 and 0.04 g/l at Uluberia (Table-4).
Thus reduction in salinity due to increased freshwater discharge is apparentlythe probable reason for this. The overall availability of seed in the Hooghly estuarinesystem was found to be declined (Table-5).
Table - 3 : Contribution of dominant fishes and prawns (in t) of Hooghlyestuarine system.
Pre - Farakka barrage Post - Farakka barrageneriod period
SI. 1960-61 to 1966-67 to 1984-85 to 1994-95No. 1962-63 1974-751. Hilsa
Tennalosa ilisha 743.9 1457.1 2336.62. Mullets
Lizaparsia 39.5 30.8 18.2L.tade
3. ThreadfinPolynemus paradise us 74.4 63.9 296.7P. indicusEleutheronematetradactylum
4. PerchLates calcarifer 45.9 24.5 49.9
5. SciaenidsPamapama 118.9 203.7 4327.7Sciaena biauritus
6. CatfishesOsteogenious militarisTachysurus jella 152.5 109.6 992.9Pangasius pangasius

88
Pre - Farakka barrage Post - Farakka barrageperiod period
SI. 1960-61 to 1966-67 to 1984-85 to 1994-95No. 1962-63 1974-75
7. Other c1upiedsSetipinna spp.Ilisha elongata 136.2 437.8 408l.6Chirocentrus dorab
8. Ribbon fishTrichiurus sp. 83.1 454.0 2835.5
9. Bombay DuckHarpodon nehereus 797.1 2067.9 530l.0
10. Prompet RecordedStromateus cinereus under others 7l.6 866.3
1l. Prawns 574.1 1338.3 2939.312. Others 438.4 3222.3 9295.713. Total 3204.0 9481.5 33341.4
Table - 4 : Maximum abundance of prawn seed at Nurpur and Uluberia centresof Hooghly estuary during pre and post Farakka barrage period
Centre Species Pre- Farakka Post-Farakkabarrage period barrage period
Nurpur P. monodon 1,169 78P. indicus 30,485 AbsentSalinity (gll) l.90-21.15 0.021-2.25
Uluberia P. monodon 504 AbsentP. indicus 1,380 AbsentSalinity (gll) 0.50-9.45 0.014-0.04
Table - 5 : Maximum numbers of seed collected per shooting net per hour atdifferent stretches of the estuarine system during pre and post Farakka barrageperiod.
Species Pre - Farakka barrage Post - Farakka barrageperiod period
P. monodon 56-2,000 64-2,332P. indicus 80-30,485 9-8,940M brevicornis 7-1,910 43-2,240M monoceros 77-2,590 18,1,386L. persia 11-28,077 14-456L. tade 10-300 4-31L. calcarifer 40-598 2-25C. chanos 8-1,292 AbsentSalinity range (g/l) 23.94-34.59 12.81-21.12

89
On the contrary, seeds of M rosenbergii were moderately available duringMay to July in certain areas of Sunderbans, which was not reported from Sunderbansprior to construction of Farakka barrage, as the species started their downstreammigration towards sea face for spawning purposes. The range of downstreammigration of the species during pre-Farakka barrage period was found upto Uluberiaand Nurpur. Reduiction in salinity in Sunderbans might be one of the probable reasonsfor its extended downstream migration .
. Hilsa fisheries
The ecological changes in the Hooghly estuarine system as a result of increasedfreshwater discharge into the system through the Farakka barrage have an influence onthe biology and fishery of the anadromous hilsa. The general habitat of migratory hilsain the estuarine system has improved for its migration, breeding and growth. Theaverage annual landings of the species which remained at 1,500 tonnes prior to 1975has increased to more than 5,000 tonnes in recent years. Hilsa is the major componentof estuarine fishery accounting 15-20% of the total yield from Hooghly estuary. Theup-stream migration of hilsa towards the Hooghly estuary from the foreshore area ismainly for spawning. The upstream migration of Hilsa in the estuary is found with theadvent of South-West monsoon i.e. July to August and continuous upto FebruarytoMarch. The upstream migration of the fish is found associated mainly with the state ofsexual maturity. as well as volume of freshwater discharge from the estuary caused byrains or melting of the snow. Hilsa is a prolific breeder. Though the peak spawningperiod of the species is remarkably noticed during September to early November, thespawning is extended for a prolonged period upto FebruarylMarch. With regard to thesize and age composition of migratory hilsa, it is revealed that hilsa fishery iscontributed mainly by the individuals belonging to size range from 340 - 419 mm (3
. years), 420-451 mm (4 years) and 460-479 mm (5 years) and formed 37-42, 22-23 and11-16% by numbers. During post-Farakka barrage period, the species spawns in theentire freshwater zone by the estuary (Daimond Harbour to Nabadwip), while earlierobservations inferred that the lower and upper limits of the spawning grounds of hilsain the river were Baghbazar (Calcutta) to Madgachi a distance of about 155 and 250km respectively from the sea face. The probable raeson for extension of spawningground, observed during po~ barrage period may be due to increased discharge offreshwater into the estuary.l The barrage has changed the ecology signaificantly byreducing salinity as well as turbidity and converting the gradient zone into almostfreshwater zone. This change makes the environmental condition of the Hooghlyestuary more conducive for the spawning of hilsa. )

90
Methodology for stress detection and prevention of major fish andprawn diseases in inland open waters
Manas Kr. DasCentral Inland Capture Fisheries Research Institute
Barrackpore 743 101, West Bengal
Introduction
Mortality of fish or decline in a fish population in a water body is at present the soleindicator that the effects of environmental stress factors are exceeding the acclimation tolerancelimit of fish. However several physiological and whole animal changes occur that can be usedto provide prior information that the effect of stress will exceed acclimation tolerance limit offish and lead to dysfunction such as impaired fish health, growth or survival. These changes area direct or indirect result of the physiological response to environmental stress and can bequantified and used as predictive indices.
Definition of stress
The term stress or stressor or stress factor is defined as the force or challenge in responseto which there is a compensatory physiological change in fish. Thus, an environmental orbiological stress is of significance if it requires a compensating response by a fish, populationor ecosystem.
General Adaptation Syndrome (GAS)
The various physiological changes that occur as a fish respond to stressful stimulus arecompensatory or in other words it is adaptive in nature and are required for acclimation.Collectively these phenomenon has been termed General Adaption Syndrome.
Conceptual Frame work of Stress response
The conceptual frame work is to consider the stress response in terms of primarysecondary and tertiary changes.
i) Primary response: Following perception of a stressful stimulus by the central nervoussystem the stress hormones viz., cortisol and epinephrine are synthesized and released into theblood stream.
ii) Secondary response: Changes in the blood and tissue chemistry and in the haematologyoccur, such as elevated blood sugar levels and reduced clotting time. Diuresis begins followedby blood electrolyte losses and osmoregulatory dysfunction. Tissue changes, include depletionof liver glycogen and interrenal Vit. C, hypertrophy of interrenal body.

91
iii) Tertiary response: Manifest in reduction of growth, resistance to diseases, reproductivesuccess and survival. These may decrease recruitment to succeeding life stages as a resultpopulation decline occur.
Use of the physiological response as indicators
Several of the many changes that occur in response to stress can be used as measurableindices of the severity of stress on fish. These changes are a direct or indirect result of thephysiological response to environmental changes and can be quantified and used as predictiveindices.
Methods for stress diagnosis
Several biochemical and physiological procedures have been developed to assess theseverity of the physiological effects resulting from stress. The physiological parameters ofimportance for assessing stress in fish at the primary, secondary and tertiary levels are discussedbelow.
Primary stress response
Plasma cortisol: A relatively direct assessment of the severity and duration of the primary stressresponse can be obtained by monitoring the rise and fall of plasma cortisol or catecholamines(epinephrine and nor epinephrine) concentrations.
Secondary stress response
The secondary changes that occur mainly in the blood chemistry also characterize theseverity of stress in fishes viz., blood glucose, chloride, lactic acid. They are frequently used forassessing stress response. Hyperglycemia for blood glucose and hypochloremia for bloodchloride is the physiological effect of concern during stress response. Accumulation of lacticacid in muscle or blood hyperlacticemia is also an indicator of stress due to bright or severeexertion.
Haematology: The haematological parameters also provide useful information about an animalstolerance to stress.
Haemoglobin/Haematocrit: It increase or decrease following acute stress can indicate whetherhaemodilution or haemoconcentration has occurred.
Leucocyte decrease (leucopenia) commonly occur during the physiological response to acutestressors. The blood clotting time and changes in the leucocyte count are among the mostsensitive parameters indicating stress response.

92
Histopathology: Since many of the biochemical changes that occur in response to stress are theend result of cellular pathology histological examinations can frequently provide information onthe effect of stress factors on fish. For example interrenal hypertrophy, atrophy of the gastricmucosa and cellular changes in gills are indicative of stress response.
The physiological tests of importance and their interpretations are given in Table 1.
Tertiary stress response
Experience have shown that several tertiary stress responses including changes in themetabolic rate, health, behaviour, growth, survival and reproductive success can indicate thatunfavourable environmental conditions have exceeded acclimation tolerance limits of fish.
Metabolic rate: It is a fundamental aspect of animals performance and is affected by stress.
Reproduction : Detrimental effects on reproduction as manifested by oocyte atresia, spawninginhibition and decreased fecundity and hatching success are taken into consideration forassessing stress response.
Disease: Incidence of fish disease is an important indicator of environmental stress. Fish diseaseis actually the outcome of the interaction between the fish, their pathogens and the environment.If the environment deteriorates stressed fish is unable to resist the pathogens that they normallycan resist. Certain diseases are proving to be useful indicators that tolerances of adverseenvironmental conditions have been exceeded.
Conclusion
Thus it is apparent that(knowledge of the tolerance limits for acclimation to the single orcumulative effects of various biotic and abiotic stress factors is an important part of the data basefor species habitat relationship needed for effective fishery management. Such information willsolve many problems ranging from prediction ofthe tolerance fish will have for proposed habitatalterations to evaluation of the effects on fish health exerted by modem intensive fish culture.
Suggested reading
Stress and Fish. Ed. A.D. Pickering, 1981. Academic Press, London

Primary
Effects
Secondary
Effects
STIMULIExternal and Internal
+BRAIN(,~yHYPOTHALAMUS;; "
. ""ANTERIOR PITUITARY <,~Ti ~
I
INTERRENAL CELLS CHROMAFFIN CELLS
~ ~
CORTlCOSTEROIDS
..• - .•..-~~
CATECHOlAMINES
WHilE BLOODCELLS \
LIVER GL YCOGEN\
El EC 1ROLYH 1\BALANCE
BLOOD GLUCOSE IBLOOD LACTATE IPLASMA HA 1\MUSClE PROTEIN\
IMMUNQ,UPPRE5SION
I,HEART RATE IGILL· BLOOD FlqW IWATER CONTFNT
f,to,\twohtl !S"uwute,\
DIURESIS IDRINKING R.ATEIMELANOCYTES \

94
Table 1 : Recommended physiological tests to assess the tolerance limits of fish for abiotic and biotic stress factors(compiled from Passino 1984; Buckley et al., 1985). The interpretations of responses listed are general but notnecessarily universal; investigators should be aware that there may be some stressful situations that do not evokea change in one or more of these physiological conditions.
Physiological test Interpretation if results are
Low I High
Blood cell counts Blood variables
Erythrocytes Anemias, hemodilution due to Stress polycythemia, dehydration,impaired osmoregulation hemoconcentration due to gill damage
Leucocytes Leucopenia due to acute stress Leucocytosis due to bacterial infection
Thrombocytes Abnormal blood-clotting time Thromobcytosis due to acute or chronic stress
Chloride, plasma Gill chloride cell damage, Hemoconcentration, compromisedcompromised osmoregulation osmoregulation
Cholesterol, plasma Impaired lipid metabolism Chronic stress, dietary lipid imbalance
Clotting time, blood Acute stress, thrombocytopenia Sulfonamides or antibiotic disease treatmentsaffecting the intestinal rnicroflora
Cortisol, plasma Normal conditions Chronic or acute stress
Glucose, plasma Inanition Acute or chronic stress
Hematocrit, blood Anemias , hemodilution Hemoconcentration due to gill damage,dehydration, stress polycythemia
Hemoglobin, blood Anemias, hemodilution, nutritional Hemoconcentration due to gill damage,disease dehydration, stress polycythemia
Hemoglobin, mucus Normal conditions Acute stress
Lactic acid, blood Normal conditions Acute or chronic stress, swimming fatigue
Leucocrit Acute stress Leucocytosis, subclinical infections
Blood osmolality, plasma External parasite infestation, Dehydration, salinity increases in excess ofcontaminant exposure, osmoregulatory capacity, diuresis, acidosishemodilution
Blood total protein, plasma Infectious disease, kidney damage, Hemoconcentration, impaired water balancenutritional imbalance, inanition
Tissue variables
Adenylate energy charge, Bioenergetic demands of chronic No recognized significancemuscle and liver stress
Gastric atrophy Normal conditions Chronic stress
Glycogen, liver and muscle Chronic stress, inanition Liver damage due to excessive vacuolation,diet dtoo high in carbohydrates
Interrenal hypertrophy, cell No recognized significance Chronic stresssize and nuclear diameter
RNA: DNA ratios, muscle Impaired growth, chronic stress Good growth

95
Inventory and diagnosis of pathogens causing various diseasesin inland fishes/shrimps
Ajoy Kumar GhoshCentral Inland Capture Fisheries Research Institute
Barrackpore-743 101, West Bengal
Environmental deteriorations caused due to pollution, anthropogenic factors andintensification has lead to many types of disease outbreaks in inland fisheries and aquaculturein recent past. The economic impact of the disease, besides affecting the production directlyaffects the subsistence of fishermen and indirectly, the people engaged in fish transport,marketing, distribution, processing, net-making, in other fishery-related business which involvefinancial losses, either due to direct mortalities or consumer rejection. In most cases, theseoutbreakes are predisposed by stressors such as poor water quality or deteriorating environmentalconditions, inadequate nutrition, improper levels of dissolved gases, improper handling andtransport procedures and algal blooms.
(Mass awareness has been created in recent past to produce more fish for sustainabledevelopment to ensure proper use and management of biodiversity and bioresources.Enterpreneurs seldom can avoid loss if the fish stock suffers from acute diseases caused byenvironmental, or pathogenic agents, but diseases caused by protozoan, trematodes andcrustacean parasites can efficiently be avoided with prophylatic measures 'or cured by varioustrear.tments. An account of common fish diseases/causative organisms, diagnosis and control)is given below:
Fin fish diseases
The identification of causative orgnism for diagnosis of fish diseases is an importantaspect in aquaculture management. There are certain fish losses due to sudden fluctuations oftemperature or salinity of water or due to virulent pathogens. Regular fish health monitoring willhelp to solve the problem of diseases of fishes. Environmental management and supplement ofnutrious diet will pay dividends.
Bacterial diseases
Red spot diseases
Causative agent: Vibrio anguillarium
Diagnostic feature: Due to bacterial infections, fingerlings and juveniles of milk fish aregenerally affected in winter with Hemorrahagic spots on body surface; exopthalmic andhemorrahagic eyes respectively. Significant mortality associated with bacteria found in liver andkidney, mild congestion of eroded fins and belly affect fish growth.

Preventive measure : the causative organism is reported to be sensitive to chloramphenical.Control of blue green algal bloom has proved to be effective to combat the disease.Fungal disease
Causative agent: Saprolegnia sp.
Diagnostic feature : Fry or fingerling of fin fish are affected with missing scales, whitish orgreyish fungal growth on body, especially on margins of fins.
Preventive measure: Bath in malachite green or methylene blue mixed water will be effectivein controlling the fungal attack.
Protozoan parasite
Causative agent: Trichodina sp., Scyphidia sp.
Diagnostic feature : Gills are generally infested with the aforesaid parasites. Secretion ofmucous, irritation on gills and body surface are some ofthe characteristic features ofthis disease.
Preventive measure: as the fish fry and fingerlings are susceptible to attack by these parasites,dip treatment with formalin @ 1 ppm is to be done according to size and condition of the host.
Trematode infection
Causative agent: Heplorcchis varium
Diagnostic feature : The parasites are encysted in muscles of juveniles of fish of zoonoticsignificance.
Preventive measure: As the adult stage of the parasites remains in the fish eating birds, the finalhosts are not to be allowed nearer to the pond.
Crustacean parasite
Causative agent: Lernaea cyprinacea, Nerocila sp.
Diagnostic feature: Parasites observed protruding from nostrils, skin of fin, bases of tail of fish.Such parasites are encountered in water bodies having lot of muck and aquatic vegetation whichserve as substrate for laying eggs by the parasites.
Preventive measure: Adult stages of the parasite are to be eliminated through pond drying aswell as liming. Crustacean parasites are sometimes controlled by gammexene (10% activeingredient) @ 2 ppm.
Routine examination of fish health is of foremost importance for surveillance and fishhealth monitoring as well as taking earliest opportunity of combating any fish disease outbreak.

97
Shell fish (Shrimp) diseases
Prevalent diseases of Penaeus monodon
Prawn disease may be caused by microbial agents which are easily transmitted undercrowded conditions, such as those present in intensive culture systems, or by physical andchemical factors in the environment. Microbial agents consists of viruses, bacteria, fungi andprotozoans. The physico-chemical factors are non-pathogenic disease agents which includenutritional deficiency, poor pond water and soil conditions as well as environmental pollutants.The basic features of these diseases are discussed below with particular emphasis on thecausative agents and methods of prevention and treatment.
Hepatopancreatic parvo-like virus (HPV)
Causative agent: Hepat. topancreatioc parvo - like virus (HPV)
Diagnostic feature: Juvenile and sub adult are generally affected. Mass mortality within 2-3days.Preventive measure: To avoid using infected post larvae, if any
Monodon baculovirus (MBV)
Causative agent: Monodon baculovirus (MBV)
Diagnostic feature Pale bluish-grey to d: ark blue-black colouration and yellowish whitehepatopancreas
Preventive measure: To use MBV - free seed which can be obtained by disinfection of eggs withsuitable chemicals at the hatchery, ultra violate irradiation of water and maintaining farmhygiene. No specific treatment is known.
Baculovirus penaei (BP)
Causative agent: Baculovirus penaei (BP).
Diagnostic feature : Infected epithelial cells of hepatopancreas and less commonly anteriormidgut, causing high mortality in the post larval stage.
Preventive measure: To avoid manmade disease introduction. Limit access only to authorizedpersonnel. Through disinfection and drying of tanks, equipments and complete dry out offacilityat least for 5 days.

98
Baculovirus midgut gland Necrosis Virus (BMNV)
Causative agent: Baculovirus midgut gland necrosis virus (BMNV)
Diagnostic feature: Affects epithelial cells ofhepatopancreas as well as anterior midgut, causinghigh mortality in the post larval stage.
Preventive measure: No specific treatment is known.
Infectious hypodermal hematopoitic necrosis virus (IHHNV)
Causative agent: Believed to be caused by a member of the family Picaraviridae.
Diagnostic feature: Erratic swimming hebaviour, rising slowly to the water surface, hanging androlling over until ventral side is up.
Preventive measure: To avoid using infected post larvae and adhere strictly to quarantineprocedures.
Yellow Head disease (YHD)
Causative agent: Yellow head baculovirus (YBV)
Diagnostic feature: The attack may take place at any stage of life of the prawn. Head becomeyellowish in 65-72 hrs. It can cause 100% mortality within 3-5 days of the clinical signs. Thereare decreased feeding and weakness pale body colour, with swollen cephalothorax, swollen-brownish gills. It causes systemic destruction of many vital tissues, including the haemocytes,gills, connective tissues, lymphoid organs, heart etc.
Preventive measure: To improve general management. Initial disinfection of the water to killpossible wild prawn virus carriers, proper pond preparation between crops.
White spot disease (WSD)
Causative agent: Systemic Ectodermal and Mesodermal Baculovirus (SEMBV)
Diagnostic feature: White cuticular spots, often also with reddish body discolouration. Thedisease occurs in ongrowingjuvenile prawn of all ages and sizes (3 gm - 40 gm) but mostly fromone to three months after stocking in the grow-out ponds. White spot disease outbreaks occursalmost in all farming systems having stocking densities (extensive 4-6 pc./sq.m.; semiintensive10-25 pc./sq.m.; intensive >25 pc./sq.m.) and irregardless of water quality conditions (mostlywithin normal range) and salinities (0-40 ppt). The moribund prawn were first seen to swim tothe surface of the water and gather at the pond dykes. Typical clinical sign includes brokenantennae, circumscribed whitish spot pinpoint 1 mm in diameter in the cuticle or shell that firststarted in the carapace and fifh-sixth abdominal segments and later the entire body shell or'-reddish body discolouration,. empty guts and sometimes body shell/gills cuticular epibiont

"
fou~ing, sometimes lymphoid organ swelling. Prawn are being affected by the disease duringthe pre-moulting (pre-ecdysis) stage. The white spots were noticeable about 2 days after theprawn first appeared to get sick and a few had died. The prawn could still be feeding until thestart of mass mortalities. The high mortalities occur within 3-5 days (range 2-7 days) withmassive numbers of dead prawns found at the pond dykes or pond bottom.
Preventive measure: There is no way of treating SEMBV in the prawn, no chemicals or drugsare found to be effective presently. Horizontal transmission is suspected via the water, careerssuch as wild prawn e.g. Krill, Palaemon sp. and other crustaceans (e.g. crabs), the cultured prawnfeeding on these and dead prawn with the disease. Vectors such as birds or dogs spreadinginfected prawn carcasses, careless workers using contaminated equipment.
Avoidance of infection and contamination is the prime method of disease prevention.These are as follows:
a) To use closed or semi-closed and recycle system.b) To convert some culture ponds into a reservoir and avoid using water directly from the
sea, river and canal. 'c) To minimize water exchange.
d) Water in the reservoir or treatment pond can be sedimented, disinfected and aerated priorto use in the culture pond. Disinfection includes elimination of potential virus carrierssuch as wild prawn. The ideal disinfection method must still be worked out, but chlorineat 30 ppm. (Calcium hypochloride 60% active ingredient) is usually used.
e) To prevent entry of the wild prawn, crabs or fish into the culture pond.
f) To disinfect the contaminated water that had the disease, before discharge.
g) To remove top layer of the pond bottom sediment, drying at least 14 days and applydisinfectant for good pond bottom preparation.
Good management technique that could help to avoid a disease problem include:
i) Careful selection of healthy post-larvae.ii) To avoid overstocking.iii) To maintain good and stable water quality such as optimal DO, pH, alkalinity and
plankton turbidity.iv) Good feeding programme with nutritionally complete pelleted feed, avoiding the
use of fresh (potentially contaminated) foods.
v) to maintain a clean pond bottom by having a proper feeding and sufficient/properplacement of aerator. Farmers in all areas are urged to cooperate more closelywith one another especially with regard to disinfecting contaminated pond waterbefore discharge to the environment in attempt to prevent and control the diseaseoutbreaks further.

100
Bacterial disease
Bacterial infections of prawn have been observed by different workers. It has beennoticed that bacterial infection in the blood or body fluids is an event that usually followsweakening by some other conditions. Currently, some recognised bacteria in cultured tigerprawn with major economic impacts are cited below -:
Vibriosis
Causative agent: Vibrio alginolyticus
Diagnostic feature: It occurs one month after stocking post-larvae because of poor preparationof bottom and bad water quality which increases bottom algal blooms. Prawn becomes weakbecause of increase in pathogenic bacteria. Diseased prawn often exhibit brown or black spotson the carapace. Some prawn show white spots underneath the carapace. It causes septicaemicconditions and retards growth. This condition also aggravates due to high stocking densities,over-feeding and less water exchange. Those with white spots underneath may be lookinghealthy when they die. Mortality of those attacked by disease may have a range of 5-80% within2 or 3 days. At first stage of infection diseased prawn move to the water surface at the pondslope and exhibit dark colouration of the carapace with an empty gut
Preventive measure: To clean the pond bottom, decrease organic load, maintain optimum densityof phytoplankton, balancing water exchange and feeding the prawn properly with good qualitydiet. Antibiotic treatment with Oxytetracycline in feed for 7 days has given satisfactory results.Frequent water exchange, reducing feed level and compound diets with antibiotics such asChloramphenicol may prevent disease. Treatment involves mixing of Furacin @ 1 mg per litreof water and tylosin at 100 mg active ingredient per kg of feed for 10-15 days.
Luminous disease
Causative agent: Vibrio harveyi and V. splendicus
Diagnostic feature: Affected prawns are luminiscent in the dark and suffer mortalities.
Preventive measure: Disinfection of pond water with chlorine, elimination of waste materialsat the bottom. Nitrofuran has cured the disease in the laboratory.
Brown spot shell disease
Causative agent: Vibrio sp., Pseudomonas sp. and Beneckia sp.
Diagnostic feature: Brown colour start appearing on the shell.
Preventive measure: To provide water of good quality, remove dead and infected prawns, reducestock and feed adequately.

101
Filamentous bacterial disease
Causative agent: Leucothrix spp.
Diagnostic feature: This may be found on the external surfaces of shrimps and thrives in waterwhich in organic and inorganic substances. Vibrio and Aeromonas spp. Are found on the erodedareas of the shell of the juveniles and adults. The pathogens are also present in sea water andcould be the secondary invaders after physical trauma of the shell and underlying membranes.
Preventive measure: Disinfection of pond water with chlorine, elimination of waste materialsat the bottom as well as changing of water frequently. Nitrofuran has cured the disease inlaboratory conditions.
Black splinter disease
Causative agent: Vibrio vulnicus
Diagnostic feature rpris occurs in low salinity ponds ofless than 10 ppt. Black splinters appearin the muscles, sometimes extending out of the carapace. Splinter consists of dense connectivetissue surrounding the infected area, associated with melanin pigment, haemocytic aggregationsand having bacterial co'onies inside the splinter. Chronic inflammation is also noticed.
Preventive measure : To avoid stocking during the low salinity season and improved pondhygiene. At the first stage of infection when carapace have only black spots, and oxytetracylinemedicated diet may effectively control the disease.
Fungal disease
The knowledge of fungus infection of prawn has advanced recently and several fungi arenow known as prawn pathogens. One group infests larval prawns whereas another attacks thejuveniles or larger prawns. The most common genus affecting the larval prawns is Lagenidiumand the most common fungus affecting larger prawns is Fusarium. The well known diseaseIS :
Larval mycosis
Causative agent: Lagenidium spp., Fusarium spp.
Diagnostic feature: The fungi may replace the internal tissues of the prawns and may cause100% mortality within 2 days. The disease is noticed in hatcheries and rearing ponds, causingextensive mortality from 20 to 100%. The infection starts from a spore which attaches itself tothe eggs and germinates. The mycelium grows, rr;pfies through the body wall of larva, developsrapidly, replaces muscle and soft tissues in it.

102
Preventive measure: Chemical prophylaxis includes disinfections of spawners with Treflan R(5 ppm for 1 ha). Chemotherapy consists of Treflan R or Trifuralin baths @ 0.2 ppm for 24hours. Application of Malachite green @ 0.001 to 0.006 mg per liter of water may also beeffective.
Protozoan disease
Several protozoan diseases of prawn have been recorded parasites and commensals ofprawn may be grouped as Microsporidians, Gregarines, Body invaders, Apostome ciliates andEctocommensal protozoa.
Microsporidiosis
Causative agent: Microsporidians, Agmasoma spp.
Diagnostic feature: It induces sterility, exhibits whitish muscle where the striated muscle isdestroyed and replaced by causative organisms. Definitive diagnosis is by Methyl blue stainingof the tissues or histological techniques. Those infected with microsporidians are referred to as'milk' or 'cotton' shrimp.
Preventive measure: Disinfection of culture facilities with Iodine or chlorine is recommended.No satisfactory chemical treatment has been developed as yet. Usage of 0.0075 mg per litremalachite green in static condition for post larvae are tried with some success. Commercialbleach (purex - Fleecy or white bleachh) with 5-25% may show effective results. Sodiumhypochlorite can also be used. Improving water quality and following strict husbandry measuresare essential.
Gregarines
Gregarines are protozoans that are common inhabitants of the guts of wild and culturedprawn. They are present up to 75% in the prawns and do not cause serious damage. It shouldbe remembered that this species need a mollusc host to complete their life cycle, therefore, theoccurrence of molluscs should be minimized in the ponds and corals.
Body invaders
Protozoa have been noted to invade a prawn body and wander throughout. Two protozoa(Parauronema sp. and Leptomonas sp.) have been noted in weakened larval prawns. Advanceeffects of these protozoa are not fully understood.
Apostome ciliatesApostome ciliates are typically commensals rather than truft parasites. They exist in
resting stage on the body surface of a living crustacean. When the crustacean moults, theprotozoan is released and completes ~~_life cycle within the shed exoskeleton before enteringthe resting stage on a new crustacean. Apostome has been noted frequently in resting stage ofPenaeid prawns.
Ectocommensal protozoa
0.....-' Ectocommensal protozoa such as Epistylis spp., Vorticella spp. and Zoothamnium spp ..!Juefound frequently on host body surfaces, including gills, of an infested prawn.
Causative agent: Epistylis spp., Vorticella spp., Zoothamnium spp.
Diagnostic feature: Appearence of fuzzy mat on shell and gills. Larvae may not moult resultingultimately in death. The heavily infected prawn may show pink to orange discolouration of gills.
Preventive measure: Maintain good quality of water by avoiding high organic loading in thepond. If necessary, 25-30 ppm formalin can be applied in the pond at one day interval for threetimes. During the treatment, monitoring of dissolved oxygen in the pond must be maintained toprevent oxygen depletion in the water. A large amount of water exchange is required aftertreatment.
Metazoan disease
Metazoan diseases that have been found in prawns are recorded as trematodes (flukes),cestodes (tape worms), nematodes (round worms) and crustaceans. Some species are moreprevalent that others and yet none have been observed to cause widespread mortality. Theparasites may be found in various parts of the body of the host.
Trematodes
Trematodes (flukes) are present in shrimp as immature forms (metacercariae) encystedin various body tissues. Metacercariae of trematodes of the families Opecoelidae,Microphallidae and Echinostomatidae have been reported from commercial species of penaeidprawn. One species Opecoeloides fimbriatus, has been noted to be more common than others.
Causative agent: Opecoleloides fimbriatus, Microphallus sp.
Diagnostic feature: Tapeworms usually associated with tissues covering digestive gland. Roundworms are in and outside of organs in cephalothorax, but also in and along outside of intestine.Flukes are commonly encysted in tissues adjacent to organs in cephalothorax but also found inabdominal musculature and under exoskeleton.
Preventive measure : To strike the weak - link of the life cycle of a shrimp fluke, e.g.,Opecoeloides fimbriatus as follows:
7,
~ infective stage or cercaria penetrates shirmp - Cercaria migrates to the appropriatetissue and encysts forming a stage called metacercaria - Shrimp infected with metacercaria iseaten by fish which releases metacercaria of digested shrimp and metacercaria stage undergoesdevelopment until it forms an adult - Eggs laid by fluke pass out of fish with wastes. Eggs hatchand infective stage known as a miracidium IS released. The miracidium penetrates a snail and

104
multiplies in number within cysts called sporocysts - Cercarae develop within sporocyst. Whenfully developed, cercarae leaves the sporocysts and snail and swims in search of a prawn. Ifcontact is made with a prawn within a short period, the life cycle is completed.
Cestodes
Tapeworms in shrimp are reported as occurrence of the species of the generaProchristianella, Parachristianella and Renibulus are common. An uncommon tapeworm oftheCyclophyllidean group has been observed recently in wild shrimp.
Causative agent: Prochristianella sp., Parachristianells sp.
Diagnostic feature: Tapworms in shrimp are associated typically with the digestive gland. Theyare usually found imbedded in the gland or next to it, in the covering tissue. In prawn,tapeworms are present as immature forms, while adult forms are found in fish. Also, a small pear- shaped worm is common in the intestine. Tapeworms are most often encountered in wildprawn. Differentiation between tapeworm group is made in general body form and tentaculararmature.
Preventive measure: To break the life cycle of the tapeworm i.e., prawn eats a copepod or othersmall curstacean infested with larval tapeworm - tapeworm develops into advanced larval stagein tissues of prawn - fish ingests infected prawn - tapeworm develops into adult in gut (spiralvalve) of the fish and begins to release eggs - eggs pass out of the fish and are eaten by copepod -eggs hatch and larval worm develops inside copepod.
Nematodes
Nematodes occur more commonly in wild prawn than in cultured prawn. The degree ofinfection is probably related to the absence of appropriate hosts in prawn culture system.
Causative agent: Thynnascaris sp., Spirocamallannus sp., Leptolaimus sp.and Ascaropsis sp.
Diagnostic feature: Nematodes will occur within and arround most body organs, as well as inthe musculature. It is the juvenile stage of nematodes that infects prawn with the adult occuringin fishes.
Preventive measure: To pull down the vulnerable stage of the biology of the roundworm ofprawn e.g. prawn eats a copepod or other small crustacean infested with larval roundworm -roundworm develops into advanced larval stage in tissues of prawn - fish ingests infested prawn -roundworm develops into adult in gut of fish and begins to release eggs - eggs pass out of the fishwith faeces and are eaten by copepod.
105
Crustaceans
A bopyrid isopod stands as a good example of a parasite on prawn. Different species ofbopyrids infest various prawn species in nature and cause considerable damage to the culturists.The parasite detracts the value of prawn.
Causative agent: Palaegygae sp., Probopyrus sp.
Diagnostic feature: The colouration and large swelling on the side of the carapace of a host makean infested individual obvious. The large, distorted female isopod nearly usurps the host's entirebranchial chamber.
Preventive measure: The complicated life cycle ofbopyrid parasite shows that the dwarf maturemale remains near the posterior end among the female's pleopods. It broods many larvae withinits marsupium. When the host moults, many individuals of the first stage larva (epicardian) areliberated and swim toward light. After attaching to the copepod intermediate host, the larvametamorphoses into another larval stage which grows rapidly at the expense of the copepod, andwhen several are present, may even surpass the host-copepod's mass. That larva moults to formthe larva (cryptoniscus) infective for either a larval or young prawn. Disruption of host-symbiontmay be able to control the degree of infestation. Before releasing prawn seed in the culturesystem, it is better to eliminate the infested prawn.
Miscellaneous conditions
Barnacles
Barnacles have been noted on the exoskeleton of prawn but the condition is rare. It isthought that frequent moulting of prawn does not allow enough time for barnacles to becomeestablished on the skeleton. No known remedy. Frequent change of water may help.
Blisters
This condition is characterized by a fluid - filled blister forming on the side portion ofthecarapace. The cause of this condition is yet to be worked out.
Cramped prawn
This is a condition described for shrimp kept in a variety of culture situations. The tailis drawn under the body and becomes rigid to the point that it cannot be straightened. The distalportion ofthe abdomen may become infected and turn into 'tail rot '. The cause of cramping maybe due to handling of shrimps in air warmer that the culture water; overcrowding; low oxygenlevels; severe gill fouling and non-congenial salinity. Environmental conditions are to beimproved.

106
Darkened prawn
The conditions of darkening may be due to melanin pigment which is deposited at thesites of darkening. Tissue may be killed by toxic agents and subsequently turn dark. Gills areparticularly prone to darkening due to their fragile nature and their function as a collecting sitefor elimination of the body's waste products. Gills' darken upon exposure to metals at toxiclevels and as a result of infection by certain fungi (Fusarium sp.). Prawn appear darkened as aresult of semi transparent nature of the exoskeleton. Nutritional inadequacies are to be improved.
Gas bubbles
Gas bubbles will form in the blood of prawn if subjected to waters with large differencesin gas saturations. Iflarge amount of bubbling occurs in the blood, death will result.
Golden prawn
Another rare condition in penaeid prawn is a golden appearence in prawn tissue. Thecause is unknown but some suspect that is hereditary. The golden colour appears throughout thetissue and is not confined to the exoskeleton or tissues next to it.
Spontaneous necrosis
When prawn are exposed to stressful conditions, such as low oxygen or overcrowding,the muscles lose their normal transparency and become blotched with whitish areas throughout.Opaque muscles are characterisitc of this condition. If prawn are withdrawn from the adverseenvironment before prolonged stress exposure, they may either return to normal or die within afew minutes. In moderately affected prawn, only parts of the body return to normal; other parts,typically the last segments of the tail, are unable to recover. These prawn die within one or twodays. Prawn muscles with this condition are known to undergo necrosis (death or decay oftissue). The whitish condition can be confused with milk prawn (microsporidian infection).
Tumors
Conspicuous body swellings or enlargements of tissues have been reported in prawns.In most cases affected individuals are captured from polluted waters. Occurrence of prawn withevident tumors is rare in commercial catches.
Other organisms attached to prawn
The colonial hydro id Obelia bicuspidata, the blue-green alga Schizothrix calcicola anda leech, Myzobdella lugubris leidy are some of the organisms found attached to prawn. TheseorgEmsm~probablY attach to prawn as a convenience when they are present in great numbers inthe vicinit~ ofthe prawn. Leeches may be particular, however, they have been noted as commonresidents of the exterior of shrimp.

107
Abiotic factors
a) Dull hard shell disease indicates impending disease attack. This is attributed to excessivecalcium and phosphorus mobilisation due to over feeding. Application of good balanced feedin needed quantities, cleaning the pond bottom as well as changing the polluted water mayimprove the pond ecology.
b) Nephretic carcinoma of prawn may be due to magnesium deficiency resulting in impurityof blood. Calamine phosphate may yield better result.
c) Anorexia condition and choked gills of prawn are due to very low or high p~ value andturbid water ~spectively. Frantic movements for respiration, resulting in sudden mor{ality of thestocked prawn. Application of Sun alum (non-ferric) may be tried to get optimum level of pHand transparency of water.
Gross clinical signs of disease
Healthy prawns have clean shells, greenish-brown in colour with yellowish white andblack bands. There are many signs of unhealthy prawn which can be observed in growout ponds.The following are examples of gross clinical signs:
a) Lack of food in the intestines. Shrimp that are very sick cease to eat and those which arebecoming sick will eat less than usual. Empty intestines are a sign of diseased shrimp whilethose with nearly empty intestines may be in the first stage of disease.
b) Tail not extended. Shrimp will not 'flick' strongly and their tails will not curl. When baseof the tail is grasped, it will not extend fully.
c) Dull body surface and whitish opaque muscle tissue. Shrimp that are becoming diseasedwill have dull hard shells and shrimp in the stages of sever infection will have murky whitish orreddish coloured muscle tissue.
d) At night before the last feeding, the farmer should examine the edges of the ponds forshrimp. Prawn which are becoming sick will often come up and float by the edges of the ponds.If the shrimp's eyes appear red then the prawn is healthy. Normal prawn will swim away whenlight is directed near them. Diseased shrimp will take a longer time to escape the light and willhave paler eye colour. If the eyes are almost white then they are already severely affected.
ConclusionAlthough, it has been said that viruses and bacteria, are by far, the most important
causative agents, emerging trends show that mycosis and parasitosis play significant roles inmortality. As we know, prevention is far easier and more effective than cure. In many cases,cures are unknown, and it is therefore vital that trict vigilance to be maintained on water qualityand stage of the animals in the ponds) The slightest problem should be reported and taken careof. This habit of reporting all incidents must become second nature if we are to prevail againstthe ever-increasing list of diseases that affect shrimps in culture system.

lUt;
ECODYNAMICS AND IMPORTANCE OF M'ANGROVES IN SUSTAININGTHE COASTAL FISHERIES AND AQUATIC BIODIVERSITY
Kumudranjan Naskar
Central inland Capture Fisheries Research Station (ICAR)CGO -Complcx, (Znd Floor, C-Block)
DF - Block, Salt Lake, Calcutta - 700 064
Introduction
Mangroves, tho unique ecosystem, spread over nil pstimat.ed area of about. H millionhectares in the tropical and sub-t.rupical regions of the Glohe ofthese, the dominant mangrove zones in t.he world are restricted within the latitude 30°00' Sand 31°00' N of the Tropical and Sub-tropical deltaic lands, shelt.ered bays, coast lines,estuarine mouths and edges of the islands, where these lands arc frequent.ly or per iodicullyinundated with tidal sea water and also wash with up stream freshwater or bath with thefrequent monsoon precipitation -
1n these mangrove zones, ~elleral1y the temperat.ure Iluetuates bct.wer-n 20°C nnd3f:>°C, though these temperature ranges occasionally varies in some scrub-mangrove zones,i.e., 2°C- 4°C at 38°,1' S latitude in S. E. Australia (with the dominant species likeAvicennia marina) and BlOO'N lal.it.ude in -Inpnn (with t.he dominant. species likeKandelia candel) The most dominant world mangrove zones arereported from this Old World, the Indo . West Pacific regions, viz., East African coast,Malagasy, Seychelles, Pakistan, Mahlives, Sri Lanka. both east and west, coast. of India.Anduman & Nicohar Islands, Bangladesh, most. of the constal zones or S.I~. Asian ruunf.r ies,Tropical Australia, New Zealand etc. . The other important New Wurldmangals are also reported from west. coast. of Africa, both the east & west coasts uf tropicalS. America, Mexico and the coastal areas of N. America
Most of these world mangrove zones an~l areas have also been reported as theproductive ecosystem with diverse groups of salt water loving flora and fauna: which arcalso very much important. in regards to its interesting hio-diveraity or being the world'smost. important heritage sit.e within this sea-land interphase mangrove ocosystorn (Nnsk nr.WDG). The ideal mangrove ecosystem alternately inundate with tidal sea water duringhigh tides and also exposed during tidal receding time or low tides. As such, thesemangrove soil is saline, silty day and semi-fluid to compact in nature: where large group ofboth aquatic and ternsl.rial fauna find their preferred hahitats for food and sheltor. Besidesthese" large number algal flora also grow in these soil substratum as benthos and most ofthese algae are identified as the most. preferred natural food for both shell fish and fishspecies of these est.uarine ecosystems or mnngals.
Tomlinson (W8G) had reported only 40 species as t.he 'major and minor elementsof mangroves' or' true mangrove species' of the Old World, while in the New World ,the true mangrove species are only 8. nut, Chapman (W7(j) hnd reported the t.otalmangroves of the World m; no species; Iurt.herniore, UNESCO (I!JS3) had reported only (if)

109
2true mangrove species from the tropical and sub-tropical zones of the World. In anotherpublication, Mepham & Mepham (1984) had reported more than 900 angiosperm flora fromthe world mangrove zones and they had grouped these 963 species either under the list oftrue mangroves, mangrove associates, back man gals and others. Mepham & Mepham (1984)had also raised several pertaining questions regarding the definition and strict boundary ofthese world mangroves. These important mangrove zones or the ecosystems are thenatural habitats, breeding and grazing grounds or the nursery beds for large number of.estuarine and off-shore shell-fish and fin-fish species, insects, reptiles, amphibians, birds,mammals etc. €MacNae,1968). Mac Nae (1968) had also mentioned that "mangroves are thenatures' own aquaculture system" and he had cautioned that "no mangrove no prawn"';that is the prawn farming cannot be viable without the existence of mangroves. Tomlinson(1968) had mentioned 'the sea-land interphace, inter-tidal or tidal habitat tropicaland sub-tropical woody plants are mangroves' and 'the community of thesemangroves are mangals'. Lear & Turner (1977) had also suggested that 'mangrove isthe coastal ecosystem in a holistic manner', which includes its common habitat orinhabiting flora and fauna; this mangrove is the depository of diverse flora and fauna.
AB such, it is now worth mentioning that mangroves or the mangrove ecosystem ormangals includes certain group of flowering plants, cryptogamic flora, viz., fungi, algae,bryophytes, ferns and varied groups of fauna, viz., aquatic, mud-dwelling, terrestrial, treeliving animal species and / or Avi fauna. Biotic communities of this composite ecosystemthus can be grouped in a broad sense as flora and fauna of the mangroves or man gals. Allthese have vital and great role in moulding the mangrove ecosystem in a perfect and holisticmanner.
Definition of Mangroves
Several mangrove workers have recognised and defined the term 'mangrove'differently; but for the clear idea and understanding the uniform characterization of thesemangroves are essential. Few of these definitions of these mangroves are as follows:
a) Davies (1940) defined the mangrove as - " Plants which live in muddy, loose,wet - soils in tropical tide waters are mangroves".
b) Mac Nae (1968) defined the mangrove as - " Trees or bushes, growingbetween the level of high water of spring tide and level close to but above themean sea level". Mac Nae (1968) had also used the term 'mangal' for referring to themangrove forest community, while the term 'mangrove' for individual kind of tree species.
c) Aubreville (1970) defined the mangrove as - "Mangroves are the coastaltropical formations, found along the border of the sea and lagoons, reaching uptothe edges of the river to the point where the water is saline, growing in swampysoil and covered by sea water during high tides".

110
3d) Geriech (1973) reported that, mangrove occur at the edges of the tropical and
sub-tropical seas, in bays, lagoons and estuarine regions. Thus ''Mangroves are trees ofvarious species of several families, which grow only where they come intopermanent contact with sea water or brackishwater".
e) Blasco (1975 & 1977) defined mangrove as - ''The mangrove is a type ofcoastal woody vegetation that fringes muddy saline shores and estuaries intropical and sub-tropical regions".
f) Arroyo (1977) defmed the mangrove as - "A small group of true mangroveplants and associated species belonging to systematically unrelated families,possessing similar physiological characteristics and structural adaptations withcommon preference to the inter tidal habitat". The term 'mangrove' is also used forthe -
(i). Forest Ecosystem,(ii). The Component Vegetation, and(iii). Both Forest Ecosystem and Forest Vegetation.
g) Clough (1982) defined mangrove as - "They are the only trees amongstrelatively small group of higher plants, those have been remarkably successfulin colonising the intertidal zone at the inter phase between land and sea".
h) Tomlinson (1986) referred the term mangrove -"Either to the constituent ofplants of tropical intertidal forest communities or to the community itself".Tomlinson (1986) had critically analysed and stated these mangroves on the cosmopolitanbasis; these are basically three types, i.e., a) major elements of mangals, b) minorelements of mangals, c) mangrove associates, including the coastal species like backmangal, salt marsh flora, wet coastal communities, beach or coastal communities, low landswamp species, coastal swamps and swamp forest flora.
Mangrove in the more limited sense may thus be defined as - the (Tropical treesrestricted to intertidal and adjacent communities' or 'Mangroves is acommunity that contain mangrove plants'.
(i) Mepham & Mepham (1984) had also critically analysed 963 Angiosperm plantsand fern' species of the tidal and above tidal forests of the Indo-West Pacific Regions andhighlighted them thoroughly, citing several most interesting examples, as well as, raisedseveral debatable questions between the relationship and correct definition of 'Mangroves'.
In this context, it is very much urgent to ascertain or draw a clear cut boundary lineor define the term mangrove, prior to initiate any discussion on mangroves or mangals.
Area and Geographical Position of The Mangroves In Indian Sundarbans
Sundarbans, the largest deltaic tropical plain of India, is located in the southernpart of both the districts 24- Parganas South and 24 Parganas North and in the coastal

111
4belt of West Bengal. It lies between the longitude 88°1O'E and 89°10'E and latitudebetween 21°30'N and 22°15'N. These tidal delta Reserve forest area is about 4267 SQkm,including both the mangrove forest land and water ways; of which, 1750 sq km is underthe tidal rivers, creeks and brackish water lagoons. The actual mangrove forest area in theestuarine belt! deltaic zone of Indian Sundarbans is about 2179.05 SQ km (with densemangrove covers = 1952.87sQ km + 226.18 sparse mangrove covers) and the rest is thenaked beach or river flats. The entire area is intersected by large number of criss -crossnetwork of tidal rivers, canals and creeks, which divides the region into 75 forestcompartments under about 54 mangrove dominated islands futhermore, about 50 islands ofthese deltaic region were converted to human habitation, agricultural field. The denudedforest bed lying on the river banks, sand chars, forest floors and sea-shores is about 216.6 sqkm (Naskar & Guha Bakshi, 1987). The delta embraces several true estuaries and off-shootsofthe Bay of Bengal, viz., Hooghly, Baratala or Muriganga, Saptamukhi, Thakuran, Matla,Goasoba, Harinbari etc. along with large number of east to west flowing tidal rivers, creeksand canals (Naskar & Guha Bakshi,1987).
Since the later half of the eighteenth Century, more than 50% of the mangroveforests in the Indian Sundarbans were cleared or reclaimed for the human habitations,agicultural lands and brackishwater fisheries etc. (Naskar,1985). Out of the total 9630 sqkm Sundarbans regions of the Indian part, 13 rural blocks in the South 24 Parganas and 6rural blocks of the North 24 Parganas 'are now densely populated with more than 32 lakhrural people (Census, 1991); majority of them were migrated from the adjacent districtMidnapore and also the refugees from Bangladesh. Most of these rural people are livingmuch below abject proverty and they are solely or partly dependant on these virgin,fragile and degraded mangals of the Indian Sundarbans. Inspite of providing the longtermnatural resources, viz., shell-fish and fin-fish, timber, fuel wood, honey and wax, thesecoastal facing dense mangrove forests act as the wall and protect this newly silted up andfrequent tidal inundated cyclone prone and problem stricken areas. But, poverty andgreediness of the local people and business classes these nature's most interesting andworld's most important heritage site are ignored while the protection measures and lorconservation activities are less feeble in these Sundarbans mangals.
Considering these ecological roles, economical potentialities and degrading nature,since 1973 about 2585 sq. km S.E. part of the Indian Sundarbans was declared as the'Sundarbans Tiger Reserve', since 1976 the estuarine crocodile, Crocodilus porosus wasalso breeded and reared in the crocodile farm at Bhagbatpur at Namkhana Range and 3Wildlife Sanctuaries, oiz., Sajnakhali, Holiday Island and Luthian Island startedfunctioning and the Sundarbans mangrove forest was also declared as the 'National Park'since 1987. Besides these, with the objectives of overall conservation of the Sundarbans, i.e.,9630 sq km is declared as the 'Sundarbans Man and Biosphere Reserve'.

112 J
5As such, for detailed clarification of different zones of the Sundarbans
areas alon with the 0 ulation are shown below:Total Sundarbans Areas = 9630.00sq km
Total Mangrove Areas in Sundarbans = 4266.60sq kmMangrove Forest Zone = 2179.05sqkmEstuarine Rivers, tidal creeks & canals 1800.00sq km(approx.)1'1:alfe.d mudtlats, sea-shore & river banlr.s = 277.55 sq krn.(approx.)
. Mangrove Reclaimed Zones & Human habitations = 5363.40sq km(approx.) ITotal Population in the SundarIJans (19 Rural Blocks) is eboat J2 lakh (Census -1991) I
All these interesting and unique flora and fauna of the Sundarbans mangals andthe mangroves of the other regions have some close relationship or interaction with eachother. These mangrove flora and the mangrove habitat faunal biodiversity have immencevalue and most economic potentialities in the sustained production of large number andhuge quantities of the natural resources for the human soicety, which need only carefulobservation and for undertaking sympathetic conservation of all these biota.
Climatic And Physiognomic Factors Of The Mangroves
The mangrove species preferably grow in the saline soil and brackishwater zones,with the ranges 10 to 45 ppt, but for the effective mangrove seed germination and in thejuvenile conditions, these mangroves thrive well in the less saline conditions. As such, mostmangrove species bloom during the winter and summer months and the mature seedsbecome ready for germination during onset of the monsoon months, when the soil and watersalinity becomes less due to monsoon precipitation and also due to adequate supply ofupstream freshwater. These mangrove zones are spread over in the tropical and sub-tropical zones, with the average temperature ranges between 20°C and 35°C along with theaverage monsoon precipitation, i.e., 1000 mm to 3000 mm annually; these also requirecoastal aeridity and high humidity; but the mangrove cannot thrive well or cannot showbetter growth in the lower temperature ranges or near the freezing point or on the frost.Besides these, the silted up clayee, loamy soil and the river carried sediments are alsopreferred by most of these mangrove species. For having the salt excretory mechanism, saltaccumulation techniques, viz., the adaptations like - salt exclusion, salt iritrusion and saltaccumulation, the major mangroves develop some specialised morphological features likedeveloment of air breathing and mechanical supporting pneumatophores, knee roots,buttress roots, stilt roots, bow roots, blind root suckers, plank like roots, pneumatothods etc.The adaptations, like viviparous germination, fleshy and leathery leaf textures, sunkenstomata are also the unique morphological characters; all these help these mangroves togrow and survive in these salt water and saline soil phases, where other non mangroveplants can not grow.
Topography and Physiognomy
The Sundarbans fall under the Ganga - Brahmaputra delta system; the tidalflushing of sea water from Bay of Bengal through the network of tidal rivers and creeks

113
6have turned the water and soil of this deltaic land highly saline (Sah, et. al., 1987). Theriver Hooghly in the west and the Ichharnati-Bidya in the east mostly carry fresh waterfrom the upper stretches (Canga-Brahmaputra system). The land evolution of this estuarinedelta is very much devastating due to limit.ed supply of fresh water from the upper streams;which is also reported for having the tilting effect (neo-tectonic movement) of the flow of theriver Bhagirathi-Hooghly towards Padma of Bangladesh. Large areas in these deltaicmangrove forests are flooded with salt water during high tidal phase, while these vast tidalwetlands are covered by dense mangroves or halophytic herbs, shrubs and trees and the flatriver beds or sand dunes are naked without any forest coverage, remain exposed during .Iowtide (Naskar, 1983). These typical estuarine halophytic zones play dominant role inprotecting the coastal areas. However, due to neo-tectonic, geomorphic, edaphic factors andrapid increasing human pressure and several other biotic interferences, several hectaresmangrove free denuded tidal lands remain fallow as waste wetlands, which show highersalinity levels in comparison to mangrove forest covered areas (Deb,1956).
Soil Phase In The Mangals
The coastal strip extends to about 50 km - 70 km width from the Bay of Bengal.Coastal saline soils having an area of about 0.82 M ha have shown silty-clay to silty-clay-loam texture, chloride and sulphate of sodium (Yadav et al., 1983); the coastal saline soil isdeficient in Nitrogen and richness in Potassium (Bandopadhyay & Bandopadhyay, 1984).Coarse sand to clay or clay loam soil texture with varying organic matter have also beenreported in the soil of the mangrove delta (Natarajan & Ghosh, 1985). Rudra & Halder(1987) while studying the soil characteristics of Sundarbans have indicated a goodpercentage of acid soil and a variation of soil texture from heavy clay to light soil in a fewblocks. Adhikari et al. (1987) have detected appreciable amount of copper, manganese andpotassium and low concentration of nitrogen. Detritus derived from molluscan andcrustacean shells and especially mangroves decomposing leaves in tidal river basin soilsdeserves the study as it adds to the fertility of the soil (D'Souza and D'Souza, 1979) and forsustaining the growth of the mangrove herbs, shrubs and trees, besides fish and prawns(Choudhury, 1978). The electrochemical proportion of the mangrove muds of theSundarbans were studied by Sah et. al. (1985). The percentage of organic carbon and humuscarbon in the surface muds of the intertidal mangrove forests are due to the dense growth ofthe mangrove flora and very dominant mangrove dwelling biota.
Water Phase In The Mangals
Water salinity plays a dominant role on the survival and growth of different speciesof mangroves and algal flora and recruitment of certain types of fishes and prawns.Richness in nutrients in brackish water of the Sundarbans has been found favourable forgrowth of a variety of euryhaline fishes and prawns from their larval stage to fingerlings(Ghosh, 1980).
Stresses on the Indian Mangroves
Mencer and Hamilton (1984) have reported that during the last two centuries vastareas of these mangrove ecosystems of the World have been reclaimed to shrimp farms inthe S. E. Asian countries. Saengar, et al. (1983) emphasised that over increasing population

.J..J."*
7pressure and pollutant discharge from industries, oil refinaries, tanaries and urban areascaused dramatic change on these mangrove ecosystems, throughout the world. Naskar(1985) has reported that during the last two centuries more than 50% mangrove areas in theIndian Sundarbans are reclaimed and converted to agricultural fields, brackish waterfisheries and rural habitations. Chanda (1977) has also reported that the mangrove areas ofthe undivided Sundarbans reduced to more than 50% during the last two centuries.
During the recent times and for the sake of development of port and harbours,roadways, tourism and for other human needs vast mangrove areas in India and all over theglobe have been converted dramatically which have very detrimental effect in this fragileecosystem. AB the mangrove habitat and the tidal influenced water are ideal fordevelopment of seed farm, several hectares mangrove habitat lands have been cleared andreclaimed for prawn farms and brackishwater fisheries or for crab culture purposesthroughout the S. E. Asian countries and in Indian mangals, as well. For making moreprofit, dramatic and drastic collection of prawn seeds and exploitation of other prawn andfish juveniles have been identified as an alarming situation throughout the mangrovehabitats in India and other S. E. Asian countries. Besides all these, leaking of oil from thecountry boats and the pollutant discharge from the urban areas have also several alarmingeffect on the natural habitats of mangrove flora and fauna.
Roles Played by these Mangroves
Large number of fin-fish and shell-fish (prawns, crabs and molluscs) species arefound as the common inhabitants on the mangrove waterways (rivers, creeks, canals,marshes, lagoons and wetlands) or these estuarine, off-shore and marine species are fully orpartly dependent on these unique mangrove ecosystem. But it was not possible to assess ordraw a clear demarcating line between these species of mangrove-dwelling, mangrovedependent, non-mangrove dependent and obligatory dependent on mangroves.
These quantitative estimation of mangrove dwelling and mangrove dependent fishand fisheries are very much limited, as most of these fin-fish and shell fish species are usedto migrate from place to place during different season and different parts of their life-cycle.The only exceptions are the commercially important species of molluscs and resident crabs,gastropods etc. The present day's fishery statistics are mostly based on the fish landingdata, collected from the different seasons, times and from the different parts of themangrove habitats. All these data are not much much authentic, as because these datacollections are based on different heterogenous group of workers, whose collected data mayhave over or under estimation. Besides these, the use of diverse fishing crafts, gears andmesh size of the nets and also the fishing operations (effort) or the degree of involvement offishing community from zone to zone or from country to country these landing data mayreflect a' different picture and that may not be correlated with the mangroves of differentparts of the Globe.
The only possibilities for near accurate estimation and quantification are toinvestigate critically the habits and habitats of different species of fin-fish and shell-fishspecies of these mangrove habitats and comparison can also be made with that of themangrove cleared or reclaimed coastal or estuarine areas. Besides these, the investigation
115
8on the life cycle of each and every individual species along with their food habit, estimationof their migratory pathways and abundance or dominant harvest may help in thisquantitative processes.
In these context, few important and well documented publications are mentioned forsupporting the views of the direct correlation of mangroves with abundance of shell-fishspecies in the Indo-West Pacific regions, where mangroves are dominant on the estuarinemouths, sheltered coasts and lagoons. These important publications are -
(i) Mac Nae (1968, 1974) reported that the rivers, canals and lagoons in and aroundthe dense mangroves are the natural habitats and nursery grounds of varied fin - fish andshell - fish species, which are commercially much important; among these few mostimportant species are Chanos chanos, Mugil spp., Hilso spp. and Pomadasys sp.
(ii) Macintosh (1982) reviewed the different publications of different workers of thedifferent countries and highlighted an average 100 mangrove dwelling fish species from thedifferent mangrove habitats. These important publications are made by Odum & Heald(1972) for Florida, Ong (1978) for Malaysia, Prince Jeyaseelam & Krishnamurthy (1980) forIndia, Collette & Trott (1980) for New Guinea. Jothy (1984) has also reported that 29commercial fin-fish species under 23 families from the Malaysian mangrove waterways;among these few mentioned can be made for the Chanos chanos, Hilsa macrura, Latescalcarifer, Epinephelus tauvina, Liza spp., Plotosus canius.
(iii) Besides these, Jothy (1984) has listed 13 commercial species of shell fish andfive commercially important species of molluscs from the Malaysian mangrove waterways.These important edible molluscs/ cockles of the Malaysian mangroves are Anadara granosa;the other Oyster species are Crassosthea spp. and green mussel is Perna viridis.
(iv) Hall (1962) also attempted to relate marine prawn fisheries in the mangrovehabitat water ways and Namin (1977) has also explained that higher yield of prawns weredesired from mangrove associated tropical coastline.
(v) Daughery (1975) had also highlighted that the destruction of mangroves is oneof the major constraints for the declining trends of prawn catches.
(vi) Jana et al. (1974) supported and explained that several important fishes andprawns are now declining from the Indian Sundarbans mangals or estuarine zones due todeterioration of the mangrove vegetation.
(vii) Umali, et al. (1987) have also highlighted that mangroves not only support orexport the fishery within its own ecosystem boundary, but also supply or export nutrients inthe fisheries of the adjacent coastal areas; these mangrove waterways and mangroveecosystems are identified as the nursery grounds for many fish species.
Among the large number of important observation and publications few mentionmay be made here for the mangrove dependent fish and fisheries in India in general and theSundarbans man gals of West Bengal in particular. These important workers andpublications are Naidu(1942), Hora & Nair(1944), Mukherjee, et al. (1940), Pillay(1954),

116 ....J
9David (1959),Gopalkrishnan (1968), Ghosh (1973), Luthar (1973), Annonymous (1978),Ghosh (1980), Chakraborty, et al. (1981), Jhingran (1982), Natarajan (1983), Naskar &Chakraborty (1984), Chakraborty & Naskar (1986), Naskar & Guha Bakshi (1987), Naskar& Ghosh (1989), Sanyal (1996), Das & Nandi (1996) Naskar & Ghosh (1997) and severalothers. All these publications have highlighted the direct correlation of the mangroves andthe dominance of estuarine or off-shore fish and fisheries in and around the mangrovehabitats of the Indian Sundarbans .
.In addition to these economic and potential values, the mangrove forest flora alsoyield strong,durable hard timber and wood; mangrove reclaimed land is also identified asfertile land for paddy cultivation in several S.E. Asian countries, though in some casesthese mangrove renovated areas has the problem of acidity, particularly the dominance ofacid sulphate soil. Mangroves have several other economic and most valuable role in thehuman society, viz., mangrove bark yield tannin, mangrove flower nectar produce honeyand wax, mangrove forest is the only preferred habitats for large number of threatened,endemic, endangered and rare fauna in three tier system,i.e., aquatic form from tidal water,terrestrial form from mangrove forest flora and avifauna like birds and others. As such, themangrove ecosystem and forest areas are the attractive place for the tourist to meet theiraesthetic needs, scientists and the ecologist for their virgin field for investigations and thefisheries scientists, as well. For all such reasons, these are unresolved conflict between theworkers of these diverse fields and each of them claim mangrove ecosystem is their own andthey may think that they are the authority and mangrove should be under their domain orjurisdiction.; though these complex ecosystem is not the property of any individual group.
Besides all these direct economic impacts, mangroves also protect the coastal zonesfrom the cyclonic thrust and surges from the bay, along with the mitigation role played bythese mangroves byprotecting the deltaic lands from gradual erosion process of soil with thetidal flashing and also abate pollution.
Need for Conservat.ion of Mangroves
During the recent times mangroves and the mangrove ecosystem are identified asthe centre for rich diversity of different, interesting groups of flora and fauna. For theirimmense value, the mangroves and the mangrove ecosystem are now considered understrict protection and conservation measures for sustainable productivity and coastal landstability. The mangrove is the world's most important heritage site and the importance ofseveral flora and fauna are identified as most essential for the well being of human society.
Remarks and Comments
Con the basis of previous observations and studies, it is felt very much imperative toundertake few measures by imposing strict rules and making the rural people aware toprotect the environment, natural resources and educating them for healthy living andthinking for their own existence. \ The following line of works may be suggested in thisabove context: )
•

117
10a) Assure their daily meal by improving agriculture, aquaculture, goaterry, piggery,
dairy, poultry etc., based on the available local resources, possibilities and by providingtraining, financing, marketing and transport facilities. These approaches must provideemployment opportunity for large number of rural people including rural women, thosewho mostly belong to S.C./S.T'/OBClMinority communities.
_.b) Need to stop monoculture of prawn and to encourage the fishery 'owner in
polyculture, like the earlier years, by adopting the scientific methods formulated by theCentral or State Fishery Research Institutes. These polyculture practices must help to stopprawn seed collection and damage of natural fish and prawn juveniles' and the forestdestruction must be checked.
c) Strict ban on operation of fine mesh nylon nets is essential and it is alsonecessary to stop netting of brood fish and prawn during the breeding season.
d) Exploitation of mangrove wood for fuel requires to be banned on an urgent basisas the growth of mangroves is very slow in this saline soil and tidal inundated mangroveforest zone. These mangrove forests of the Sundarbans are already suffering and gettingdegraded since the last two centuries or more, due to tilting effect and neotectonicmovement of the freshwater flow of the river Ganga towards Padma, since the 16thCentury. Large scale forest destruction, clearing of forest area for human habitation oragricultural or brackishwater fish cultural purposes during the last two Centuries, i.e.,since the time of Tilman Henckel (1781) and migration of the refugees from Bangladesh,Midnapore,Orissa and Chhotanagpur Hill are identified as the main cause for destructionof Sundarbans mangal; the Sundarbans is now over populated with a total population ofmore than 321akh (1991 Census) in an area of about 5000 sq km., i.e., about 650 people / sqkm. This Sundarbans area is also situated in the tidal/cyclone prone coastal belt of Bengaland these mangrove forest act as the buffer agent and are known to minimise the cycloneeffect by about 50 . 60%; the existence of the dense coverage of the mangrove forest flora onthe silted up flat deltaic intertidal lands also add nutrients via decomposition andmineralisation processes of the mangrove litters, which is also estimated by others to beabout 6000 t /ha/yr.
Besides all these, fish, prawn, crab, honey and wax, wood and timber and othernatural resources, viz, fertile agricultural and aquaculturallands of the Sundarbans directlyand indirectly help the rural economy. So, only for the fire wood purposes the Sundarbansmangrove forest exploitation is uneconomic and illogical use of the natural forest products,particularly when the forest is in an alarming state.
e) Without education, these rural people cannot be made conscious about theirentity as human beings and cannot think about living as civilized human beings and thisresults in unlimited population growth, health hazard, scarcity for domestic place, illmentality and all these together must be reflected on the civilized people in the urbanareas.

llti
11
123"Socio-Economy <> Education <> Population Growth"
1 . 1These three urgent questions need to be solved urgently glvmg uniform sl.ress on
these three points simultaneously; otherwise. by single or hy limited approach beyond thesethree urgent points may not. solve the prohlcms or the Sundnrhnns mnngnls and it. is suret.hnt if th« present trend of cxnloit nt.ion continues for auot.hor GO years, Ill(' so muuyimportant. 'gene poor will get vanished from these Sundnrbana and the glam(lur of 'worldheritage site' will be lost within no time. M an is t.he highest biotic component. in allyecosystem, so without protecting the interest. of man the ecosystem protection will be aIruitluss effort.
119
CONCEPTS AND APPROACHES FOR ENVIRONMENTAL IMPACTASSESSMENT IN INLAND WATERS
M.K. MukhopadhyayCentral Inland Capture Fisheries Research Institute
Barrackpore-743 101, West Bengal
Introduction
Man himself, due to his uncontrolled population growth and indiscriminating use of thenatural resources is greatest threat to his environment. Though every spheare on the earth isexposed to human contamination, the environmental problems concentrate by and large to thewater may be subsurface or underground resources. What so ever may these pressure be on theenvironmental naturality, the developmental activities are inevitable; and man has to determine,however wisely, what pollutional changes are acceptable. In determining such acceptability,adequate informations regarding the probable impact of environmental alterations on itsinhabitants must be in record.
The gross pollution of water is clearly an immediate hazard to many aquatic resources,a hazard that can be documented biologically with relative case. Lesser environmental changesmay also be immediately determined to aquatic life, and as because they produce measurablechanges in the species involved, they can often be evaluated. Changes not likely to be harmfulin near future may in the long run be destructive to aquatic environments. In vast ecosystemslike rivers, lakes, estuaries, reservoirs etc., the ultimate effect of environmental distorsion likehyperthermastasis, eutrophication and accumulation of biologically stable metals, pesticides orradioactive substances are difficult to predict. Researches over the years lead to establish acomprehensive method of tackling the problems to a acceptable limit by Environmental ImpactAssessment (EIA) of the ecosystems.
What is EIA?
Environmental impact assessment is a procedure for assessing the environmentalimplications of a decision to enact legislation, to implement policies, plans and developmentprojects. The broad objectives of the procedure are (i) identification and examination ofsignificance of environmental impacts and (ii) assessment of whether or not the impacts can bemitigated. Finally, recommendation of preventive and corrective measures is the moto ofenvironmental impact assessment.
Till seventies the main concentration of aquatic pollutional research was on toxicityevaluation of contaminants in relation to different test organisms. With advancement in thinkingabout the problems, the concept changed to regularity in ecosystem testing to better insight intohow intricating populations within a community respond to contaminant exposure. Mainobjective of such testing necessiates careful attention to the boundaries of potential impact, themajor ecological components affected, and what state variables affect base line conditions.
120
Herricks and Cairn (1982) recommended a close coupling of prediction and monitoring, and theincorporation of appropriate toxicological testing in biomonitoring programmes of EIA. Uponthe ideas of several researchers in the field most acceptable monitoring programmes to assessdamages to an aquatic ecosystem should have criteria like,
i) As simple as possibleii) Most economicaliii} Should predict population and community responsesivy Generate data appropriate for inclusion in mathematical and statistical models.
Assessment measures
Evaluation of environmental impact in aquatic ecosystems consider numerous problems;local, regional and of national perspective. As a result, the programmes include acute, long-termand large-scale monitoring to assess the conditions at points, regions and the aquatic system intotality.
Acute toxicity assessment
Acute toxicity considers 'rapid damage to the organisms by the fastest acting mechanismof poisoning, fatal unless the organisms escape the toxic environment at an early state'.Mortality of exposed organisms in 96 hrs. is the accepted method of acute toxicity evaluation ofthe contaminants. Such experiments termed 'bioassay' are useful for toxicity evaluation in fieldconditions i.e., in situ as well as controlled conditions of laboratory. Flow-through laboratorytests are designed for the bioassay to replace toxicant and the dilution water either continuouslyor at intermittent intervals. Flow through tests are generally thought of as being superior to statictest because they maintain much higher water quality and ensure the health of the test organisms.In situ acute toxicity bioassay performed in natural flowing water for a discharged effluent,exposes test organisms in small enclosures at selective points adjoining the discharge resourceconsidering variability in the dilution rates. The resutls for in situ and laboratory acute bioassayare expressed in terms of lethal time (LT) or lethal concentration (LC) which ever is appropriateconsidering the nautre of toxicants and the mode of their contaminating the environment.
Chronic toxicity assessment
In chronic toxicity tests the organisms are exposed to a toxic anti contaminant over asignificant portion of their life cycle, typically one tenth or more of the organisms life time.Chronic studies usually measures contaminant's effect on growth, reproduction and also changesin behaviour, physiology and biochemical constituents under sublethal concentration. Thesestudies exposed embryos and young ones to toxicants. The early embryonic developmentalstages of major carp have been most effectively used as test organisms for acute toxicity bioassayin laboratory conditions for various toxicant and in situ experiments in evaluating the toxic effectof effluents in river ecosystems.

121
Long term ecotoxicological assessment
For toxicity bioassay there has been lacking in field toxicity and exposure assessment oncommunity structure sensetive to the complex aspects of chemical and physical environments.Most advance method to measure these aspects involves rating of community structure on indexvalues. The criteria for selecting indices of ecosystem and recevery include:
i) Intrinsic importance, emphasising endangered or commercially important species.ii) Early warning indicators,iii) Sensetive indicators,iv) Process indicators.
It may be noted that the more complex the ecosystem, the more field data are requiredto understand the cause and effect relationship. Such complecation in environment arises whenability to regulate water quality remains insufficient or ineffective in some respects due totremendous number of chemical in use. It becomes difficult to predict in situ toxicity underconditions of pulsed releases from complex mixtures in areas such as hazardous water sites orfrom nonpoint sources affecting the down stream aquatic communities. Complecatedrelationships between the environment and the organisms in such a situation can be drawn onunderstanding the water and soil quality contamination, bioconcentration, bioaccumulation andstress effect evaluation in the organisms of different trophic levels.
Water and soil quality monitoring
The principle media for aquatic sustinance; water and bottom sediments, controlqualitative also quantitative distribution of the organisms. Physico-chemical qualities liketemperature, transparency, dissolved oxygen, pH, alkalinity, hardness, chlorinity etc. areadequate in predicting the inhabitant population structure. For sediments, richness in nutrients,organic percent and mechanical compositions are indicative of the possible flora-faunalcomposition on the bottom of the aqutic systems. Spatio-temporal monitoring of water andsediment qualities provides information in time scale shifting in biocommunity structure withenvironmental changes.
Contaminant assessment
Organic refuses which form bulk of contaminants are non-persistant and non-residualmaterials and thus produce toxicity effect for restricted period limited to the areas ofcontamination. Problems are with non-biodegradable contaminants like metals, pesticides andradioactive material. However, toxic effect may have on the biocomponants, these contaminantstoxify the water and sediments first which immediately or in the long run contaminate theinhabitant population. Advancement in sofistication of instruments and analytical methodsresulted simplified and percised estimation of toxicants from water, sediments and bioticsamples.
J

1~2
Biocontration estimation..»:Bioconcentration is the accumulation of water born chemicals by the aquatic animals and
plants through non directory routs i.e., as the result of competing rates of chemical uptake andelimination. The bioconcentration of metals and other nonbiodegradable materials varies greatlywith the species and the specific contaminants. Size of organism can also influencebioconcentration rate. Metals initially accumulates in the gills of both invertebrates and fish.Putting altogether, bioconcentration is considered a complex system dependent upon the speciesor organism, exposure concentration and period, environmental factors and the specific toxicant.Methods of various toxicant estimation are available for suitable adoption.
Stress effect evaluation
In ecotoxicology the stress effect evaluation is a complex process utilising the biologicalstate of affairs for ascertaining time scale changes in individual biological constituents andcommunity structure as a whole. The reasons of such testing undertaken are to assess responsesof individual and population of a community under actual exposure conditions, to assess thepotential contaminant for indirect and sublethal effects; and to determine if threshold levels foreffect, measured in the laboratory, have any validity for ecosystem.
In ecotoxicological biomonitor~rogramme a sound experimental design is critical tothe assessment of ecological damages ~ 1991). The design requires an understanding of thecomplexity of the aquatic system such that confounding factors like current velocity, depth,transparency, organic matter, nutrients etc. are accounted for in sample comparison. Samplingapproach need be unbiased for better ascribing of changes in the flora and fauna toanthropocentric activities. ~he index of biotic integrity designed to reveal the integrative natureof fish communities responding to changes in water quality has been developed for application.Problems in biological activies like growth, reproduction, and recruitment potential of fish arealso ascertained as suportive evidneces for changes in community structure. )
./
References:
Herricks, E.E. and Cairn, J., Jr., Biological monitoring. Ill. Receiving system methodologybased on community structure, Water Res., 16, 141, 1982.
Karr, J.R., Biological integrity: A long-neglected aspect of water resource management,Ecol. Appl., 1,66,1991.

123
Toxicology and biomonitoring as a tool for ecological managementwith river Ganga as a case study
Sanjib Kr. "MannaCentral Inland Capture Fisheries Research Institute
Barrackpore 743 101, West Bengal
Introduction
The present era is the era of industrialization and overpopulation. To meet the populationdemand there has been over-exploitation of natural resources. Consequently, adverseenvironmental effects like species extinction, deforestation, acid-rain, green-house effects,hazardous waste disposal problems, intense eco-imbalances are on rise. It is a good sign thathuman race have become aware of resource crunch and environmental degradation. Manyprogrammes focussing on the conservation and monitoring of environment have been initiatedboth by developed and developing countries.
Conventionally, environmental monitoring are carried out by chemical analysis.However, with time it has been noted that physical or chemical methods of monitoring areinsufficient to measure the stress or toxicity on biota or life-processes from pollutants. Even themost sophisticated chemical analysis are just inadequate to inclntify all the biologically activecompounds present in waste. Hence, besides chemical analysis, biomonitoring of effluents,wastes or natural resources like water have been undertaken by many countries to see thetotalatarian effect of pollution or ecodegradation and formulation of suitable managementpractices.
In the present discussion we shall restrict ourselves on biomonitoring of aquaticecosystem with exphasis on the river Ganga.
Definition of terms
The term 'water pollution' can be referred to the addition to water of an excess ofmateiral (or heat) that is harmful to humans, animals or desirable aquatic life, or otherwise causessignificant departures from the normal activities of various living communities in or near bodiesof water. The undesirable effects of pollutants on life processes is called toxicity or toxic effectsand monitoring of such pollution by studying toxicity/stress on biota is biomonitoring. Variousfactors which cause pollution to water bodies are (i) sewage waste containing human excreta andhouse hold disposals, (ii) industiral effluents and heavy metals which change the physico-chemical properties of water, (iii) agrochemicals such as fertilizers and biocides and (iv)radioactive wastes which are mutagenic, carcinogenic and teratogenic.
J

124
Toxicology is the study of adverse effects of chemicals or other agents on living systems.Any chemical or biochemical in abnormal dose and abnormal route is toxic - is the true definitionoftoxinltoxicant applied in pharmacology and toxicology. However, we shall discuss only aboutthe toxicants present in the environment. These commonly enters the physiological systemsthrough natural routes. Extent of toxicity on the living systems depends on dose and durationof exposure. Toxicity of a chemical is greatly influenced by animal species, age, nutritional andhormonal status of the individual and interaction between genetic and environmental factors.
Methods of biomonitoring
As mentioned, water pollution can harm all the life processes, particularly aquatic floraand fauna directly, and higher plants and animals directly and indirectly. Gorwth and populationof aquatic flora and fauna can be monitored qualitatively as well as quantitatively to measure thepollution.
a) Algal assay: Algae are the primary producer in food chain and are very sensitive to pollutants.Hence algal bioassay are widely practised particularly for measuring chronic effects ofcontaminants over a span of several algal generations. In chemical specific approach whichidentify toxic chamicals, a diluent concentration series of test chemicals in prepared with thegrowth medium. The test alga is then grown on it for a definite period of time (ranging from 3-15 days). The growth response (growth rate, biomass production) is then converted to '% formof growth - inhibition'. When these are plotted against the chemical concentrations on alogprobit graph paper, a regression line can be drawn. The concentration of chemical thatinhibits 50% growth oftest alga (ECso, the effect concentration) is used to set the guidelines forthe maximum allowable chemical concentration in the receiving water. In the whole effluentapproach waste effluent water is diluted serially (for eg., 100%, 75%, 42%, 32%, 24%, 18% .0%) like a pure chemical; toxicity of the water can be measured, but lacks quantitative analysis.Cu-equivalent approach can be adopted to quantify the toxicity of a 100% test water. Toxicitiescaused by metal or organic pollutants can be interpreted by complexation approach usingchelators or quenching agents, like EDTA or hyamine respectively. Selenastrum spp., Chlorellavulgaris, Microcystis aeruginosa, Anabaena fios-aquae, Synedra sp.etc. are used for toxicitytests.
Like other biota algae are sensrtive to heavy metals and are used for bioassay.Selenastrum capricornutum have been widely recommended for toxicity assay. The mostcommon algal response to increased levels of heavy metals is a decrease in growth rate. Inheavily polluted water or effluents the algal population changes quantitatively, and/or there ischange in algal species dominating the ecosystem, or change in algal cell morphology.
b) Diatoms and periphytons : Frequency distribution of diatom flora have been correlated towater quality by many workers. Nygaard observed that centric diatoms are commonly foundin eutrophic water, whereas pennate diatoms predominate in oligotrophic water. Centricdiatoms/pennate diatoms ratio of 0.00 to 0.30 indicates oligotrophy, and a value of 0.00 to 1.75indicates eutrophy. Reports on particular diatoms indicating a particular pollutant are numerous.Organic nitrogenous materials have been shown to support the growth of large population ofNitzchia kuetzinquiana, N.palea and N.thermalis. Under anaerobic conditions there is an

125
abundance of N.thermalis and disappearance of Achuanthes mtnuttssima. The pennate diatomNavicula accomoda was reported to indicate sewage pollution. Navicula, Pinnularia andNitzchia develop profugely in water rich in pollution of animal origin. Diatoms thrive best inmesasaprobic zone. It is a general finding that the number of species comprised of diatoms inan ecosystem depends on regional geological environment of a water body and does not changemuch over time unless drastic environmental changes occur. So, caution should be taken inextrapolation of results.
Periphytons arte assemblages of attached form of algae occuring in all aquaticenvironments. These communities respond immediately to the pollutants like heavy metals,pesticides and fungicides, and also react to temperature and turbidity changes.
c) Bryophytes : Bryophytes are able to grow in many freshwater habitats in the presence of highconcentration of heavy metals and acid conditions. They have high capacity of accumulatingheavy metals which can be detected in these plants by chemical analytical methods. Althougha direct relatiionship between water metal concentration and those in bryophytes may not alwaysbe apparent, the accumulation in bryophytes facilitates analysis of contaminants which may bepresent in very low concentration in water samples.
d) Protozoa and rotifers : Environmental quality can be assessed by qualitative and quantitativeanalyses of protozoan colonization of artificial substrates like polyurethane; the entire microbialcommunity, instead of individual species should be studied.
Rotifers, the trochhelminthes, live mainly among aquatic vegetation and serves asindicator of water quality, especially the part dealing with saprobity (BODs). One is able tocharacterize each taxon with quantitative saprobiological data consisting of saprobic valence(with ten balls for each taxon), indicative weight of species, and the individual saprobic index.Zenosaprobic and oligosaprobic rotifers indicate at the same time, the oligotrophic conditionsand beta- and alpha-mesosaprobic rotifers are indicators for eutrophic conditions.
e) Zooplanktons : Monitoring heavy metal pollution - Among aquatic organisms bothphytoplankton and zooplankton play major role in the biogeochemical cycles of trace elementseither by bioaccumulation and later transfer to higher levels, or by resdistribution. Zooplanktonmetal levels respond to corresponding changes of metal concentration in the environment. Fordetermination of zooplankton heavey metals, the zooplankton samples are collected by towinga plankton net (mesh size 250 - 350 /-lm), dried at 60-70°C, powdered, weighed, digested in acidand metal concentration estimated by atomic absorption technique and expressed in /-lg/g dryweight.
Zooplankton bioassays are also carried out to test the toxicity of different metals toevaluate permissible limits of heavy metals in aquatic ecosystem for protection of aquatic life.4 types of tests exist: i) acute lethal and sublethal tests in the laboratory (30 sec to 4 days'screening test') using a single species (most commonly Daphinia sp.), (ii) Chronic sublethaltests in laboratory (several weeks, single species), (iii) chronic microcosm tests under simulatedfield conditions which measure responses of zooplankton populations to low levels of materials

126
as heavy metals, and (iv) acute or chronic in situ test ('effect monitoring' approach). Lethal,behavioral, developmental (rate, success, morphological aberations) and reproductive responsesare probably simplest to include in zooplankton assay.
Pollutants alter the community structure in an ecosystem in various ways, including areduction in species diversity, disappearance of certairi species, with others assuming dominanceand changes in the total biomass in the community. All these changes, unless drastic, may benatural, and without constant and long term study it is difficult at times, to distinguish betweenpollution induced and nature induced changes.
Study in fishes
So far, studies on some aquatic organisms, other than fish, have been outlined. Studiesof aquatic pollution and toxicology using fish as model at organismal, cellular, genetic,physiological, biochemical and at community level are exhaustive and are sensitive also.
a) Behaviour study: Fish population behaves varyingly to different environmental situations,which can be studied at laboratory or in natural ecosystem. However, study in natural ecosystemneeds laboratory confirmation. Fish response to different stressors are of following types:
i)fish can pass through the pollutants with no apparent reactionii) avoidance to pollutantsltoxicantsiii) dart or increased speed after encounteriv) lethality or twitching or spasm.
At community level there will be less or least fish population in the polluted area of thewater body which fish tries to avoid.
b) Fish bioassay : Man-made chemicals eventually find their way into the aquatic environmentwhere they are proving to be toxic to many organisms. In aquatic toxicology, fish have beenwidely and popularly acclaimed as a test species for evaluating the potency of toxicants to causelethality (acute toxicology) or many other sublethal responses, using selected behavioral,biochemical or physiological and haematological responses.
Acute or lethal toxicity: This is used to determine the level of the toxic agent that produces anadverse effect on a specified percentage of the test species in a short period of time. Acutetoxicity is measured experimentally for 50% mortality of test species during 24, 47, 72 and 96hours exposure time. Results are expressed as 96 hours median lethal concentration (96 hr LCso).
Chronic or sublethal toxicity assay: This type ofbioassay demonstrates the effects of long termexposure of test species to toxicant concentrations much lower than the lethal levels. The effectsmay produce conditions that may interfere with some of the normal life functions, which can bemeasured or monitored, rather than killing the organism directly. The data are useful in riskevaluation and development of a water quality criteria for protection and conservation of aquaticlife. However, the tests are time and money consuming and need expertisation.

127
i) L((e cycle tests: The test species are normally exposed to a constant level of poison duringtheir entire life span under controlled conditions. The most sensitive developmental stage in thelife cycle can be determined.
ii) Growth rate measurement: Growth rate measurement, by taking repeated reading of lengthand weight over a period, is a good indicator of health or the presence of stress factors. Length-weight relationship, relative condition factor etc are also of great significance.
iii) Histopathological changes: It is one of the important study area for assessing toxicity orstress. Changes at cellular and subcellular level can be studied by simple histological orhistochemical or immunocytochemical changes. Also, the site of action of toxicant can belocated. For e.g., high concentration of heavy metals induce gill damage with hyperplasia anddegenerative changes in secondary lamellae. Excess mucus production has also been noted.Phosphamidon toxicity results in hepatocyte necrosis and glomerular hypoplasia.
iv) Haematological changes: Haematological changes in response to various toxicants in fishis not well documented. Generally, in stressed situations these are depression in total WBC,RBC count and also in haemoglobin % and haematocrit values. However, under heavy metalstress increase in RBC, haematocrit, clotting time and hepatosomatic index has been recorded.Leucopenia, thrombocytopenia and decrease in ESR have also been noted. Haemotologicalresponses to various pesticides vary.
v) Biochemical and physiological changes: Changes in various biochemical and physiologicalparameters in response to various stress factors are the new study areas in aquatic/fish toxicology.Generally, in stressed situation there is significant decrease in total serum protein, liver andmuscle glycogen content, and hepatic Na, K, Ca, phosphate and iron reserve. Cu causedepression of liver SDH activity and increase in blood glucose level. Mn has been shown tocause liver damage and possibly myocardial damage and increase in GPT activity and cholesterolcontent. Pituitary gland cell type changes in Cd toxicity. The cells become deformed,vacuolized; diameter ofthyrotroph and gonadotroph cells decrease.
Metallothionein level greatly increases in heavy metal toxicity. Level of acetylcholineestrase enzyme decreases significantly in organophosphate and carbamate poisoning. However,the list in endless, but study of these changes need proper controls and expertizations.
vi) Immunotoxicology : Like any other body system immune system also can be a target for toxicdamage. It will either become downgraded, leading to degrees of suppression, or upgradedproducing autoallergic reactions and hypersensitivity responses. Generally, effects of thetoxicants like heavy metals or insecticides on this vital system is very slow and progressive andare overlooked until some major disorders or disease outbreak occurs. Less severeimmunosuppression may be confused with other problems like low grade infection and resultantreduced growth etc. Some insecticides like DDT, BHC etc. have been shown to suppress theimmune response, with consequent effect of disease outbreak.

128
vii) Reproductive toxicity and teratogenicitv : Reproductive toxicology in fish, unlike in highervertebrates in less clearly known, as is the nature of various toxicants and their effects on thissystem. There may be reduced spawn size, hatchabiiity, development and survival ofthe youngs.Ultimately, changes in species population may be engineered through this physiological systemin an polluted ecosystem.
Teratogenicity is most commonly seen with radioactive wastes polluting the ecosystem.However, very little progress has been made in fish biology over this topic. Fish may be usedas a model for teratogenicity study. In frog embryo teratogenicity assay (FET AX) usingXenopus embryo, mid-to-late blastula stage embryos are exposed to test agents in water for upto4 days and are assessed for mortality, pigmentation, growth, extent of development andabnormalities.
Studies on cellular damages by different chemicals in reproductivbe organs of fish arelacking. However, studies in other laboratory animals are many. t
Some of the xenobiotics such as DDT, ~-hexachlorocyclohexane, polychlorinatedbiphenyl (PCB), 7, 12-dimethylbenzanthracene (polycyclic aromatic hydrocarbon), 4-nonylphenol, coumestrol (phytoestrogen), synthetic estrogenic compounds of domestic originare estrogenic in nature. Most of these substances are hydrophobic and tend to bioaccumulatein aquatic organisms and are often transfered through the food chain. Though most of these areweakly estrogenic, but at least a few have been shown to stimulate vitellogenesis in both maleand female fishes, and may alter natural sex differentiation ratio. Thus they may have somepotentially deleterious consequences in fish population.
Zn, Cu and Al toxicity: Like other biological systems fishes are also sensitive to heavy metals.Here, toxicity effects of 3 heavy metals have been outlined as representative.
Fish uptakes Zn through gills and g.i tract. However, fish can tolerate a very high doseof Zn orally. Thus only Zn dissolved in water is of toxic concern. Acute lethality of dissolvedZn increases with decreasing water hardness and [H+]. At very high concentration of Zn fish diesfrom hypoxia caused by gross morphological damage to the gills - edema, inflammation, cell-sloughing and fusion - effects common for heavy metals at 'industrial' concentrations. At lowgrade and chronic toxicity there is impairment of branchial calcium uptake which leads to ahypocalcemia that may become terminal. The most sensitive gross effect is an impairment ofreproduction.
Though traces of Cu is essential part of some enzyymes, marginal increase in itsconcentration is toxic. Severe Cu exposure i.ru(haracterized by collapse and oven fusion of thelamellae and sloughing of lamillar epithelium. There is excess mucus secretion and aconcomitant sw.~lling of the mucous layer around the gill. Mucus secretion is a common stressresponse to a variety of environmental factors including heavy metals, ammonia and salinitychanges. The increase in gill permeability leads to passive ion efflux and severe ionoregulatorydisturbances.

129
Fishes exposed to Cu and Al experience elevated plasma ammonia levels and decreasedswimming performance.
Gill is the main target organ of AI toxicity in acidic soft waters. Branchial toxicity hasbeen suggested to result from the precipitation of insoluble Al(OA)3 on the gill membranesand/or the interaction of gill ligonds with positively charged AI.
Effects of nitrite: Concentration of nitrite in typically low in unpolluted water but may increasein hypoxic lakes and ponds and in water bodies containing decaying organic matter. Fishesactively bioaccumulate nitrite. Elevation of environmental chloride levels protects against nitriteaccumulation and toxicity. Nitrite induces oxidation of haemoglobin to methaemoglobin thatcannot transport oxygen. Nitrite does not disrupt reversible oxyften binding of haemocyanin ofcrustaceans to the same extent with haemoglobin.
Depletion of extracellular chloride is a characteristic effect in nitrite exposed fish &crustaceans. The active branchial Cl- uptake is replaced by N02- uptake, but the passive Clefflux persists, leading to a net chloride loss at the gills. Due to N02-, K+ is released fromintracellular compartments leading to decrease in red cell K+content, depletion of muscle K+andincrease in plasma K+. This affect membrane potentials, neurotransmissions, skeletal musclecontraction and cardiac function.

130
GANGA-ASCASESTUDY
The Ganga is a very important river system in India. Enormous studies have been carriedout on floral and fauna population in this river systems and the literature is exhaustive. Only afew salient points related to biodivbersity and biomonitoring of river Ganga will be mentioned.
Biological profile
Extensive reviews have been made on biological profile of the river Ganga by manyworkers.
Coliform count in various calender months show a systematic pattern. The count varies withsite of collection and the season of collection. An increased coliform count has been recordedin pre-monson season than post monsoon period, the count range from 0.10-11.40 x 10⁴/.
Premonsoon fecal coliform count is higher than in postmonsoon, and the count ranges from0.10-9.0 x 10⁴
/. Fecal coliform count has been higher in densely populated areas.
Algae - A total number of 577 algal species spreaded over 151 chlorophyceae, 198cyanophyceae, 223 chrysophyceae and 5 euglenophyceae have been recorded from Ganga water.A very large number of planktonic algae including diatoms formed broad chunk of algae.Plankton count shows existence of 199 to 44800 cellsllit. However, algal infestation showsmarked variance in time and space, kind of water, nutritional and pollutional extent. Qualitativealgal species shows there is sequential gradual increase from winter to summer months uptoApril. There is increase in number of algal species from Nov. To April. But during May-Augustgradual decline in 3 classes (chlorophyceae, bacillariophyceae and cyanophyceae) and thengradual increase from September to October could be registered. In main stretch of Gangamyxophyceae, bacillariophyceae and chlorophyceae predominate. About 27.26% desmids, 4-8%copepods, 11-12% cladocera, 1-11% rotifer, 1-9% protozoa have also been recorded.Gastropods, bivalves, chironomids etc. have also been found to variable extent.
Diverse algal forms exhibit a clearcut periodicity and succession. They may be groupedbroadly into summer, winter and rain forms of either annuals, perennials or epimerales nature.
Macrophytes - A total number of 36 macrophyte species have been recorded during differentmonths of the year.
Fish - There is a good deal of diversity in quantitative and qualitative distribution and occurrenceof major and minor carps. The fishes migrate and transmigrate in time and space. A totalnumber of 25 fish species have been recorded during different months. Some of the %occurrence of fish population is as follows:
Mystus tangra 20-21 %, Bagarius bagarius 19-20%, Eutropiichtyes vacha 14-15%, Chelalaubuca 26%, Labeo bata 4-5%, Labeo rohita 2-3%, Channa gachua 4-5%.

131
Algae and Pollution
Algae of high acidity -Eutrophic algae
4 chlorophycean and 1 bacillariophyceae;12 chlorophycean, 7 bacillariophycean, 1 euglenophyceanand 6 cyanophycean. "
Sewage algae 37 sewage algae - 17 chlorophycean,11 bacillariophycean2 euglenophycean7 cyanophyceanform
Allergenic algae 25 species.
Taste and odour algae -Toxic algae
30 species'4 cyanophycean <

13;!.
Definition, classification and productive potential of flood plain wetlandsand their importance in aquatic ecosystems
B. C. Jha
Central Inland Capture Fisheries Research Institute, Barrackpore - 743101, W. B.
Introduction
Wetlands are unique ecosystems representing the transitional phase between theterrestrial and aquatic systems as the water table is usually at or near the surface or the land is ~covered with shallow depth of water. Depending upon the state of wetness and its duration, thepattern of ecological succession operates in such systems and accordingly categorisation of itsuse as resource is delineated. The wetland ecosystems have been of prime concern to ecologistsbecause of their fragile nature. The wetlands which have the substrate of pre-dominantlyundrained hydric soils, due to perennial coverage of water, are highly productive in nature owingto extended Eu-photic zone right up to its bottom and thus support rich biological diversityincluding fish fauna. Fisheries though one ofthe major activities in such water bodies, practicedsince time immemorial, the wetlands have much wider spectrum of utilities such as:
-re-charging & de-charging of ground water, accumulation of flood water, shore-linestabilisation, trapping of toxic substances, trapping of nutrients, abode for many plants& animal species, sources of direct or indirect entertainments, protection & developmentof aquatic food chains, breeding, grazing grounds for riverine fish stock, regulator oflocal climate and so on.
The floodplains of Ganga and Brahamputra basins of India have extensive distributionof wetlands of different origins and of various categories. The people living in these parts of thecountry have very intimate relationship with the wetland ecosystems since centuries as most oftheir economic activities of rural population be it agriculture, horticulture, fisheries or cottageindustries are wholly or partially dependent on these water bodies. To be precise the utility andimportance of wetlands should be viewed under three broad aspects such as economic, aestheticand cultural. In recent years, however, the wetlands have been subjected to indiscriminateexploitation in the face of ever increasing human population and subsequent developmentalactivities in and around such water bodies. Changing characteristics of river valleys on accountof changing demographic and land use patterns have made the situation still grave due toconflicting demands and as a result the process of degradation has been accelerated many foldsthrough- out the globe in general and developing countries in particular. Most of the wetlandsare reeling under the threat of their extinction at an alarming rate. Utter neglect in the past andover exploitation in the present have made such ecosystems highly vulnerable in relation to theirproduction functions and biodiversity. Currently the floodplain wetlands are passing through acritical phase of eutrophication leading to swampification at a faster pace. The sustaineddestruction of all-important wetland ecosystems for one reasons or the other has starting posingmany environmental problems in the areas of their existence. It is time that a concerted efforts

13~
are being made to conserve the wetlands so as to conserve not only the aquatic biodiversity butthe human civilization as a whole.
Definition of wetlands
The concept of wetlands, which covers a wide range of water bodies, is rather hazy.Framing of a precise or definite definition for wetlands, therefore, is very difficult. Many personshave attempted to define wetlands in their own way and as a result many definitions came tothe fore (Maltby, 1991, welcome, 1979, Hutchinson, 1967, Leopold,1964 etc.) . According toRamsar Convention, however- the marshes, the fens, the peatlands( either natural or artificial,permanent or temprory, static or flowing, fresh, brackish or salty) are the areas covered underwetlands . One fact, however, has been accepted by one and all that wetlands are transitorysystems, representing both aquatic as well as terrestrial characteristics thereby neither can bedefined exclusively as aquatic nor purely terrestrial. But referring wetlands in the context of fishand fisheries is automatically implied to such ecosystems where fishery is an importantcomponent and thereby it must be an aquatic system with reasonable water depth.
Floodplain wetlands
The floodplain wetlands are considered as one of the prime fishery resources besidesbeing the repository of very rich biodiversity.The floodplain wetlands or the floodplain lakes ascommonly referred to are the continuum of rivers, hence play a pivotal role in the developmentand conservation of fish germ plasm of riverine stock. There can't be a separate or specificdefinition for these water bodies except the fact that these are associated with the floodplain ofcertain major river systems. The nomenclature offloodplain lakes or floodplain wetlands, as maybe called, has been coined for the sake of operational convenience only. The Ganga andBrahamputra river systems of India have the distinction of being very rich in floodplain wetlands( ~ 2 lakh ha) because of the geo-morphological features of the land-scape. Locally these lakesare known by different names such as mauns, chaurs, Dhars, tals, jheel (Bihar); Jheel, tal (UttarPradesh); beel (Assam & West Bengal );pat (Manipur) and so on. The local population oftheseStates of India are associated with such lakes from time immemorial for economic gains and,therefore, the floodplain lakes have tremendous bearing on the social and economic spheres ofthe society.
Origin of floodplain lakes
Three main reasons have been attributed for the formation of lakes such as constructive,obstructive and destructive. The origin of floodplain lakes fall under the categories of the latertwo such as:
- The origin of a typical ox-bow lake is a phenomenon of fluviatile activities of ariver course wherein a portion of the river is being obstructed due to excesstransportation and deposition of silt and ultimately the river channel diverted to someother route, leaving behind an isolated meander bend called as ox-bows. Meandering ofriver courses has been found more pronounced inflood plain where the intensity of floodused to be forceful and recurring in nature. Rivers ascending to the flat lands suddenlyfrom higher gradient have been found to be more prone to produce meandering bend outof which some such meanders used to transform into ox-bow lakes due to obstruction inits hydrology. The ox-bow lakes available in the Gandak basin of Ganga river system in

134
the State of Bihar represent this pattern of lake formation as most of the rivers aftertravelling at the higher gradient of foot-hills of lower Himalayas in Nepal suddenlydebouch to the flat and tectonically depressed land of North Bihar with high current Jvelocity and huge load of silt which gradually become instrumental in the formation ofloop-like or serpentine ox-bow lakes.
- The origin of tectonic lakes locally known as chaurs, pats, dhars, beels etc. is afunctionof geo-morphological changes brought about on the earth crust, leaving behind a trailof depressed land scape where monsoon run-off andflood waters accumulate and assumethe states of lakes of varied shape, dimension and depths. The tectonic lakes are generallyshallow and saucer shaped in extension. They may either be perennial or seasonal .depending upon the depth of the depression. The North-Eastern portion of North Biharand Assam have plenty of such lake area. These water bodies are known for their richbiodiversity reserves and beautiful refuge for migratory and resident avian fauna. TheKusheshwar sthan, Kabartal, Simri-Baktiarpur and Goga beel of North Bihar are thefamous lake area ( chaurs) of such type and are known to play very significant role in theover all ecological climate of the area besides performing a host of economic activitiesiJha & Chandra, 1997).
The difference between the Ox- bow lakes and tectonic lakes ( chaurs ) has beenpresented in Table 1.
Classification of floodplain wetlands
Broadly the floodplain wetlands can be classified into two groups such as A) Ox-bowlakes and B) Tectonic lakes based on their origin. However, each lake type can further beclassified as under.
A. Physically the ox-bow lakes can be of various types based on their riverine connection ( Sinha& Jha,1997 b) :
I ) lakes with riverine connection intact.ii) lakes without or defunct connecting channels.iii) lakes locked in between river and embankment and flood during monsoon.iv) incomplete lakes between the embankments and rivers which get lost during monsoon.
The ox-bow lakes can also be classified, artificially, as : Io _
I ) live or open lakes with functional connecting channels with the parent river or itstributaries.
ii) dead or closed lakes without or defunct connecting channels.iii) partially fluviatile lakes between the embankments and rivers.
B. Physically the tectonic lakes of Ganga and Brahamputra river systems can be classified invarious ways, such as a) based on their seasonality b) based on major bio-production etc. ( Sinha& Jha, 1997 a) :
135
a) based on duration of water retention or seasonality:
I ) permanent or perennial chaurs.ii) temprory or seasonal chaurs.
b) based on major bio-production:
I) chaurs where cultivation ofmakhana (Ferox eurryale), singhara (Trapa spinosa), etc.remains the major economic activities.
ii) chaurs where fish and fisheries remain the major activity.
Besides above said artificial or arbitrary classification more pragmatic approach for theirclassification can be adopted and accordingly the floodplain lakes need be classified on the basisof their trophocity or boidiversity for better management of their biological resources.
Ecological status of flood plain lakes in India(Jha, 1989,95,97, Jha and Chandra 1997, Sinha and Jha1997 b, Sugunan, 1995b, Yadava,1989)
JVery high concentration of dissolved organic matter in the soil phase indicating constantin-put of vegetative matter. )- Wide fluctuations in dissolved oxygen values.As low as almost nil to as high as 18 mg/lor even more. The low values indicating stressed condition on account of waste dischargein the system whereas high values indicating super- saturated condition, typical of weedinfested waters.- Generally poor level of nutrients at water phase as they are locked in the macrophyticchain.- Moderate to very high values of conductance subject to the nature of effluents in thesystem. Systems receiving sewage or other effluens indicate higher values as comparedto lakes free from such ingress.- Primary production values through phytoplanktonic chain have been found to be of
poor to moderate ranges, depending upon the quantum and texture of phytoplanktonabundance.-([he floodplain wetlands generally harbour poor density of plankton, a typical reflectionof weed infested water body)Poor availability of plant nutrients, P04& NO), owing totheir locking in the hydrophytic chain.-The nannoplanktonic assemblage has been found to be much larger as compared to netplankton and dominated by the high incidence of bacterioplankton. The phenomenon isa reflection of stressed aquatic regime, menifested by thick stand of macrophytes in suchsystems besides an indication of broken grazing chain for healthy propogation of carpfishery.- ~he floodplain wetlands of Ganga and Brahamputra river systems have been found topass through a phase of advanced eutrophication as reflected from high density ofmacrophytes to the tune of even 30 kg/m? at times All kinds of macrophytes viz.Submerged, emergent, free-floating and marginal have been found to dominate thefloodplain wetlands.- The benthic niche of most of such lakes has been found to be worst affected as the solid-liquid interface is either blanketted by the over growth of submerged vegetation orcovered under vegetational canopy of floting macrophytes creating a under water desert

13~
and inhibit the growth of desired benth-ic organisms on one hand, while the oxidative-micro zones responsible for the release of nutrients in the ambient water are being shieldedon the other.
Transfer of energy and productivity potential
The floodplain wetlands due to their shallow nature and riverine connection are highlyproductive but fragile ecosystems.In recent years, however, the channelisation of energy hasvisciated from beneficial bio-production for human welfare to unwanted production due to anumber of reasons, both man-induced and natural. In an aquatic ecosystem the resident bioticcommunities are known to linked each other for their survival and growth. This complex interdependence in a food chain and the flow of energy in the community metabolism are the key ofproduction functions.Proper undrstanding of trophic dynamics in a given aquatic ecosystem isessential to draw management packages. The transfer of energy in floodplain lakes and for thatmatter in all the quatic systems follows two established routes as under:
1) Energy fixed atthe level of producers-----to------- herbivores-----to-------predators (normal grazing chain)
2) Energy fixed at the levelof producers------to-----dead vegetative matters------to------ detritus feeders( detritus
chain)
The normal grazing chain of floodplain wetlands has gone wary in the face of fastchanging aquatic regime of such watwer bodies. Over colonisation of macrophytes inthese systems has made the production functions topsy- Turvey. The focus has nowshifted to the continuos pilation of detrital load at the bottom which remain largelyunutilized in absence of efficient grazers. The present fish yield from the lakes is only afraction of the total energy fixed at primary or producers level. The floodplain lakes beingweed choked in characteristics exhibit very high detrital load, even to the tune of 400-500 gm? . The primary production and energy conversion of some such lakes have beenpresented in Table 2. The photosynthetic efficiency of these lakes has been found to begoverned by two things viz., the level of management and the influx of waste materialsin the system. It has been observed that the photosynthetic efficiency in case offloodplain lakes of Bihar ranged between 3.26 %( stressed lakes) and 4.86 %( partiallymanaged nonstressed lakes ).Based on the level of primary production the productivitypotential offloodplain lakes available in the States of Assam, West Bengal & Bihar hasbeen worked-out in the range of 1000 to 2000 kg ha I yr'. Against this potential, however,the present level of yield ranges between 30 to 300 kg ha' yr' only and as such thereexists enough scope for fisheries development. Primary production and conversion ofenergy of a group of floodplain lakes of Bihar wetlands have been presented in Table Il& Ill.

13"
Table 1. Difference between ox-bows and tectonic floodplain lakes (after Sinha & Jha.1997)
Ox-bow lakes Chaurs( tectonic
1. The outer boundary of the lakes are The boundary of the lakes are never fixedgenerally fixed. rather changes with the quantity of water
ingress. Large scale swelling duringmonsoon and considerable shrinkage in leanmonths are the hall-mark of such lakes.
2.0x-bow lakes are the obstructed bends of Chaurs are not the part of any river and theyrivers as such generally serpentine in have no definite physical structure.Thephysical extension. physical extension depends on the shape of
the depression. However, most of them aregenerally saucer shaped.
3.The shore-line of ox-bows are invariably The tectonic lakes generally represent verystraight, being the cut-off portion of rivers. irregular and zig-zag shoreline.
4.0x-bows are relatively deeper than Chaurs are always shallow in characteristicschaurs.
5. The ingress of riverine water mayor may The topographical distribution of chaurs innot take place.If connecting channels exists floodplains, where occurrence of flood is aand are functional river water would entre regular phenomenon, are such that ingressotherwise not. of flood water is almost certain.
6. Less fluctuation in water spread area Characteristically the chaurs exhibit verybesides the ingress of waters, from rivers or high fluctuation in water expansion.Thecatchment, used to have meagre or no excess of flood waters used to gush-in withcurrent velocity which can uproot the greater force in such lakes as result theprevailing plants in the system and, vegetations are being uprooted to a largetherefore, the ox-bow lakes provide extent, preventing greater colonisation ofrelatively stable niche for the higher aquatic vegetations as compared to ox-colonisation of aquatic vegetation. bows.

139
Table 11 : Status and pattern of primary productionn certain flood plain lakes of Gandak basin,Bihar (Jha & Chandra,1997)
lakes pnmary energy Availableproduction fixation bottomMgCm3 hr' Cal rri'd' energy Cal m2
Larail 98.07-154.11 26136 38.66xl04
Mahisath 75.08-110.0 19988 39.13xl04
Dabadih 95.20-103.05 21411 46.29xl04
Kamaldaha 41.09-190.06 24975 51.26xl04
Table III : Transfer of energy in certain floodplain wetlandsunder Gandak basin Bihar (Sinha & Jha, 1997a)
lake Status primary solar energy toproduction to fish %fish %
Muktapur Free from 0.1622-0.2408 0.00335-0.01037external stress& partiallymanaged forfishery
Kanti Highly 0.1209-0.1873 0.00241-stressed by 0.009653thermal ashslury. Nofisherymanagement
Manika External 0.1831-0.3015 0.00463-stress factors 0.018431negligible,partiallymanaged
L
I'-

1~9
Motijheel Highly 0.1462-0.2517 0.00251-stressed due 0.010324.to sugarfactory andsewageeffluents,partiallymanaged
Tarkaulia External 0.1843-0.3047 0.00546-0.01776stress factoralmost absent,well managed
140References
Jha, B. C.(1989) : Beel fisheries resources in Bihar and Uttar Pradesh. CIFRI, BarrackporeBulletin No. 63.
Jha, B. C.(1995) :Fisheries of floodplain lakes of Gandak basin Bihar. In(ed.) Howes, 1. R.Conservation and sustainable use offloodplain wetlands. Asian Wet/andBureau, Kuala Lumpur. 123pp.
Jha, B. C.&K. Chandra(1997) :Kusheshar sthan chaur (North Bihar)- Status and prospeects of fisheries
development. CIFRI Bulletin No. 70.Jha, B. C. (1998) : Salient ecological features of mauns and chaurs of North Bihar and their
fisheries. In (ed.) Sugunan & Sinha. Fisheries enhancement of smallreservoir and floodplain lakes in India. CIFRI pub!. Barrackpore.
Sinha, M. &B. C. Jha (1997a ) : Uttar Bihar ke matsayakee jal sansadhan- vartaman awastha awem Bhavi
sambhawanayen. CIFRI, Barrackpore, Bulletin No. 69___ (1997 b) : Ecology and fisheries of ox-bow lakes( maun)- a threatened environment.
CIFRI, Barrackpore, Bulletin No. 74.Sugunan, V. V.(1995b) : Floodplain lakes-a fisheries prespective. In(ed.) Howes,1. R.
Conservation and sustainable use floodplain wetlands. AsianWetlands Bureau. Kuala Lumpur. 123pp.
Yadava, Y. S. ( 1995) : Floodplain lakes- a conservation prespective. In (ed.) Howes, 1. R.Conservation and sustainable use of floodplain wetlands. AsianWetlands Bureau. Kuala Lumpur. 113pp.

141
lVIANAGElVlENT OF FLOOD PLAIN WETLANDSFOR SUSTAINABLE FISHERY ANDBIODIVERSITY CONSERVATION
V. V. Sugunan
Floodplain Wetlands DivisionCentral Inland Capture Fisheries Research Institute
Rajgarh Road, Bhangagarh, Guwahati 781005
INTRODUCTION
~Floodplains and their associated wetlands are unique ecosystems providing livelihoodto millions of people all over the WOrld.JTIlis is particularly true in Asia where the low lyingfertile valley bottoms adjacent to major'rivers are thickly populated and used traditionally bythe local communities for azriculture. post-harvest. fisherv, livestock fanning. navigation and a
"-' - ~. ~.
number of other activities. Wetlands commonly found on the riverine floodplains are evolvedover many millennia through natural processes of flooding and river bed movement caused byextreme climatic and geological events. In the Indian subcontinent, these events are particularlypronounced due to the effects of monsoons. Floodplain wetlands play a vital role in themaintenance of stability in lowland ecosystems, facilitating effective retention and release offlood water as well as aDsorption and cycling of nutrients. However, due to man-madephysical modifications, many of the floodplains. have been lost or reduced often leading tomore catastrophic events such as extreme flooding and even loss of human lives. Floodplainwetlands are biologically sensitive areas as they provide breeding and nursery grounds for anumber of aquatic organisms. Therefore, they should be considered as a continuum of riverswith regard to conservation.
CONCEPTS AND DEFINITIONS
In the fisheries literature, terms like floodplains, wetlands, floodplain wetlands, etc areoften used loosely leading to ambiguity in expression. Some of the semantic confusion in theuse ofterminology has been sought to be removed by Sugunan (1997). Floodplains are the Hatland bordering rivers that is subject to flooding which tend to be most expansive along thelower reaches of rivers (Matlby, 1991). They are either permanent or temporary water bodiesassociated with rivers that constantly shift their beds especially in the potamon stretches.According to Leopold et al. (1964 (a typical floodplain will include the river channel, oxbowlakes, point bars, meander scrolls, sloughs, natural levees, backswamp deposits and sandsplays. Based on the flow of water, floodplains can be divided into two broad groups viz., theplain (lotic component) and the standing water (lentic component). Further, these are groupedinto fringing floodplains, internal deltas, and coastal deltaic floodplains (Welcomme, 1979).Wetlands, as defined by Ramsar Convention, include areas of marsh, fen, peatland or water,whether natural or artificial, permanent or temporary, with water that is static or flowing,

142
fresh, brackish or salt, including areas ofmarine water, the depth ofwhich at low tide doesnot exceed six metres. In simpler terms, wetlands occupy the transitional zone betweenpermanently wet and generally dry environments. 111ey share the characteristics of both theenvironments, and yet can not be classified exclusively as either aquatic or terrestrial (Maltby,1991).
Wetlands situated on floodplains of major rivers can be designated as Floodplainwetlands or Floodplain lakes which cover a variety of water bodies in India such as beels,jheels, 'mauns, pats, boars, hoars, etc. They can be typical oxbow lakes, (i.e., cut-off portionof meander bends), sloughs, meander scroll depressions, backswamps, residual channels ortectonic depressions (Sugunan, 1995), though it is often difficult to establish their actualidentity owing to natural as well as man-made modifications to the environment.
FLOODPLAIN WETLAND RESOURCES OF INDIA
The eastern and north-eastern states viz., Assam, West Bengal, Bihar and other north- .eastern states have more than 200,000 ha oft1oodplain wetlands which are mainly associatedwith the river systems of Ganga and Brahmaputra (Table 1).
Table 1. Distribution of floodplain wetlands in India
I States I Distribution I River basins II Local ~eal.I I I names I (ha)I I
Arunachal East Kameng, Lower Subansiri, Karneng,Subansi Bee! 2,500Pradesh East Siang, Dibang valley, Lohit, ri, Dibang.Lohit,
Changlang and Tirap Dihing andTirapAssam Brahmaputra and Barak valley . Brahmaputra I Bee!. Howr, 100,000 I
districts; : .. '
and Barak1 '
. - I AnoaBihar Saran, Chaparan, Saharsa, Muza Gandak and I Maun, 40,000 I
ffarpur, Darbhanga, Monghyr Kosi I Chaur, Hoarand Purnea
I Manipur Imphal, Thoubal and Bishnupur Iral, Imphal and Pat 16,500I
1110Ubal I
Megha- West Khasi Hills and East & Someswari and I Beel 213 !lava West Garo Hills Jinjirarn i ITripura North, South & West Tripura Gumti i Beel 500
I West 24 Parganas, Hooghly, Nadia, Hooghlyand I Beel, Bowr 42,500I Bengal Murshidabad, Dinajpur, Malda, Matlah I
Cooch Behar, Howrah and IMedinipur I
!I Total 202~210

143
The importance offloodplain wetlands emanates from a variety offactors such as:• Fishery,• lrrigati on,• Agriculture and post harvest (Jute retting etc)• Retention and release of/load water,• Source of waterfor drinking,• Source ofmiscellaneous vegetation (Trapa fruits, lotus, makh ana, reeds for
mat- weaving, firewood, etc)• Source ofedible animals (molluscs, turtle, etc.),• factlity for duck rearing,• Transport and communication routes,• Effective organic waste recycling systems, and• Rich biodiversity
Floodplain wetlands - a fisheries perspective
Since the floodplain wetlands ill:e rich in plant nutrients and are biologically diverseecosystems, they generally possess high potential for in.situ fish production. However, theirfish production potential vary widely depending on ecological conditions, recruitment from themain river, management measures followed, etc. TIle following management options have beenevolved for sustainable fisheries of the floodplain lakes as a result of research on their ecologyand fishery management.
Capture fisheries otooen floodplain lakes.... .•..
The open floodplain lakes which retain their connection with the main rivers arecharacterized by habitat variables akin to lotic waters for most parts of the year. They haveflowing water regime supporting low plankton and benthos biomass and high indices ofcommunity diversity.: With.s19W eutrophication process and low level of macrophyteinfestation rate, they provide a better environment for the ichthyo-denizens, Fish production inthem is governed by inherent natural productivity and the extent of autostocking from themainstream, TIle open lakes may be treated as a continuum ofthe main river and for developinga good capture fishery. TIIey also serve as feeding and breeding grounds of commerciallyimportant riverine fishes and, therefore, are important for the fishery of the parent river aswell. '.
Fishery management measures, followed in such lakes essentially centre round habitatconservation and fishing management 'Some of these measures are:
-' '- , .
i) Conservation of the habitatii) Ensuring proper recruitment by allowing free migration of brooders and juvenile
fishesiii) Regulation of fishing pressure based on fish stock assessmentiv) Devising and implementing regulations on mesh size, closed fishing seasons/grounds,
and so on.

144
Cultu re-based ,/f sheri es of closed floodplain lakes:
TIle closed floodplain lakes are those which are totally cut off fiom the parent river orconnected only for a 'le!)' brief period during the flood season. They remain more akin to lenticecosystems for most parts ofthe yem'. Since the volume of water exchange with the main riveris low, they tend to accumulate silt and plant nutrients received from their catchment areas yearalter yem'. As a result, they are tend to be eutrophic with high biomass in respect of plankton,benthos, macrophyte, weed-associated fauna, etc. often associated with low index ofcommunity diversity. Many of them are heavily infested with macrophytes, with poor planktonproduction where most of the energy transformation takes place through theheterotrophic/detritus food chain. In the absence of recruitment from rivers and heavymacrophyte infestation, fish production in them is often much lower than their productivepotential, Many weed-choked lakes are dominated by air-breathers and small-sized fishesresulting in low yields.,~ ..
Many ofthe fishery management measures followed in open lakes for conservation andsustainable use offish stocks are equally applicable to the closed ones where capture fishery'norms are practiced. Besides, fish production rates in closed lakes can be further raised bypracticing culture-based fisheries and various forms of enhancement. Culture-based fishery isbased on stocking and recapture of fast-growing fish species similar to that followed in smallreservoirs. Since floodplain lakes are usually shallower and richer in plant nutrients/fish foodorganisms than most reservoirs, they allow a higher stocking density to raise the fish yield.Chances of losing fish stock; are low in closed floodplain lakes, unlike reservoirs wheresubstantial stock loss takes place through irrigation canals/spillways. Stocking higherproportion of detritivores for effective utilization of energy accumulated at the detritus cangive better results. Determining optimal stocking density, stocking size, minimum size atcapture and selection of suitable candidate species are some ofthe crucial management optionsfor achieving optimal fish production from culture-based fisheries.
integration of cultur~ akd'cd'prure fisheries
Marginal areas of both open and closedfloodplain lakes can be cordoned off for penculture while leaving the remaining area for capture/culture-based fisheries. The pens can bemanaged more effectively by way of eradication of unwanted fishes, control of macrophytes,supplementary feeding, and so on. Since they are managed along culture fishery lines/norms,stocking density as well as fish production rates from them are quite high.
Conservation of biodiversfty .::-., •.,
The UNCED Conference in Rio de Jeneiro (1992) has defined biodiversity as "thevariability among living organisms from all sources including inter alia, terrestrial, marineand other aquatic ecosystems and the ecological complexes of which they are part; thisincludes diversity within species. between species and of ecosystems. " Thus, biodiversity notonly refers to protection species but also covers the whole spectrum of the naturalenvironment The importance of biodiversity stems from an array reasons/arguments such asprecautionary, moral, indicative, aesthetic and economic.

145
TIle precautionary argument is based on the premises of our inadequate knowledge tomake definite judgement on how much loss of biodiversity can be sustained without causingirretrievable damaze to the balance of nature. A more utilitarian arzument is the commercial- ~value of plants and animals, particularly the risk of losing valuable genes from the pool if duecare is not taken to preserve them. According to the moral argument, mankind should act as atrustee to look after the natural environment, improve it and hand over to the next generationwith pride. TIle indicative argument stresses on the ability of biodiversity to act as an indicatoror barometer ofthe health of an environment since a change in the biodiversitv is often the first
1- ."
indicator of environmental change. Aesthetic and cultural arguments are less appealing to manya developing societies. They are based on the premise that the biodiversity of landscapes andnatural ecosystems and the species they support can provide solace and a feeling ofhomeliness.,.
Biodiversity versus fishery development
-Many developing countries are facing the challenge to feed their large human
populations which are growing at a faster rate than food production including fish production.The dilemma faced by these countries is whether to feed the hungry millions today or topreserve their biological diversity for the posterity. Unless the philosophy of globalpartnership through redistribution of technologies and wealth to areas of need (as enshrined inthe Agenda 21 of Rio declaration) is followed in letter and spirit, it is difficult to achieve abalance between these two needs. Another probable way out is sustainable use of biologicalresources, wherever possible; A key element in this direction is the accurate determination ofthe carrying capacity of'thehabitat.I-CONCLUSION
- In is well recognized that depletion of wild stock of fish and the resultant erosion oftraditional inland fisheries in the floodplain wetlands are unavoidable to a great extent due tothe man-made changes that have already taken place.rlt is equally obvious that all water bodiescan not be preserved for the purpose of biodiversity conservation, without neglecting thegenuine developmental needs. It is also necessary to meet the pressing need faced by manydeveloping countries to increase fish production from all kinds of inland water bodies in orderto alleviate the problems of malnutrition and poverty. Thus, we have a delicate task at hand todovetail the twin objectives of! conservation as well as development of aquatic biologicalresources for human needs. ll1et'e is a growing realization that1he enhancement of'fisheries infloodplain wetlands can emerge as a possible solution to resolve the conflicts by combiningenvironmental concerns with the growing aquacultural ventures. J
.:~ )'
.•..
....

146
REFERENCES
Leopold.L, B., M. B. Walman and 1. P. Miller, 1964. Fluvial processes in geo-morphology. IY H Freeman, San Francisco, pp 522.
Maltby, E., 1991. Wetlands and their values. In Wetlands-facts on file. Oxford. NewYork, pp 223.
Sugunan, V. v., 1997. Floodplain wetlands, small water bodies, culture-basedfisheries and enhancement-conceptual framework and definitions. In (Eds)Sugunan, V. V. and M. Sinha Fisheries enhancement in small reservoirsand floodplain lakes in India Bulletin No. 75, Central Inland CaptureFisheries Research Institute, Barrackpore, pp 252.
Sugunan, V. V., 1995. Floodplain lakes- a fisheries perspective. In Howes J.R. (Ed.),1995. Conservation ands sustainable use of'floodplain wetlands,A.sian wetlandBureau, Kuala Lumpur, AWB !jJblication, No. 113: 67-75.
Welcomme, R. 1., 1979. Fisheries ecology of'floodplain rivers. Longman. London andNew York. pp 317.
.•.•...•..•.•.....••.~.•.•..•.•.•..• • • • ••• • ••

147
HARVEST AND POST-HARVEST TECHNIQUES EMPLOYED FORINLAND OPEN WATERS IN INDIA
AND THEIR ECONOMIC CONSIDERATION
P.K. KatihaCentral Inland Capture Fisheries Research Institute,
Barrackpore (W.B.) India.
India is bestowed with bountiful of inland open waters, in the form of rivers, reservoirs,floodplain wetlands and estuaries. Indian river systems comprised of 14 major, 44medium and innumerable small rivers, desert streams and canals (Sinha, 1997). Thesehave a length of over 0.17 m kms (Anonymous, 1996). Among the states, maximumriverine stretch is in Uttar Pradesh (31.2 thousand km) followed by Jammu and Kashmir(27.8 thousand km). After independence, several hydro-electric and irrigation projectsor river valley projects have been commissioned, which resulted in large number ofartificial impoundments, the reservoirs. These included 19134 small, 186 medium and56 large reservoirs with total water spread of over 3 m ha (Sugunan, 1995). Themaximum area under reservoirs is in the state of Maharastra followed by Orissa,Andhra Pradesh and Gujrat. The beels and oxbow and derelict waters are mainly inOrissa, Uttar Pradesh and Assam with an expanse of 0.79 m ha. The estuarine watersalso form an important part of inland open waters with 2.6 m ha. area. For all the typesof water bodies fish harvesting techniques used by the-fishers are almost common,although, their extent of prevalence varied across them. for some waters and regionsthese techniques ar~odified according to requirements. Similar is the case with post-harvest techniques. ~ ~redetailed description of these techniques for rivers, reservoirs,flood plain wetlands and estuaries is given in following paragraphs. Their economicconsideration is discussed combinedly for all the water bodies.
Harvesting techniques
Rivers
Most of the Indian rivers have an open access for fishing, except some stretches wherefishing rights have been transferred either to fishermen co-operatives and contractorsin the form of lease for one to few years or to individual licensee fishermen. In rivers thefish harvesting included either harvesting of mature fish or fish seed in the form ofspawn or juveniles. Although, the fishing of mature fishes is done all over the riverinestretches, but the spawn collection is location specific. The stretch of river Ganga inBihar is excellent for collection of riverine fish spawn. It is the major source of rawmaterial for production of stocking materials or fingerlings in West Bengal, which
'I
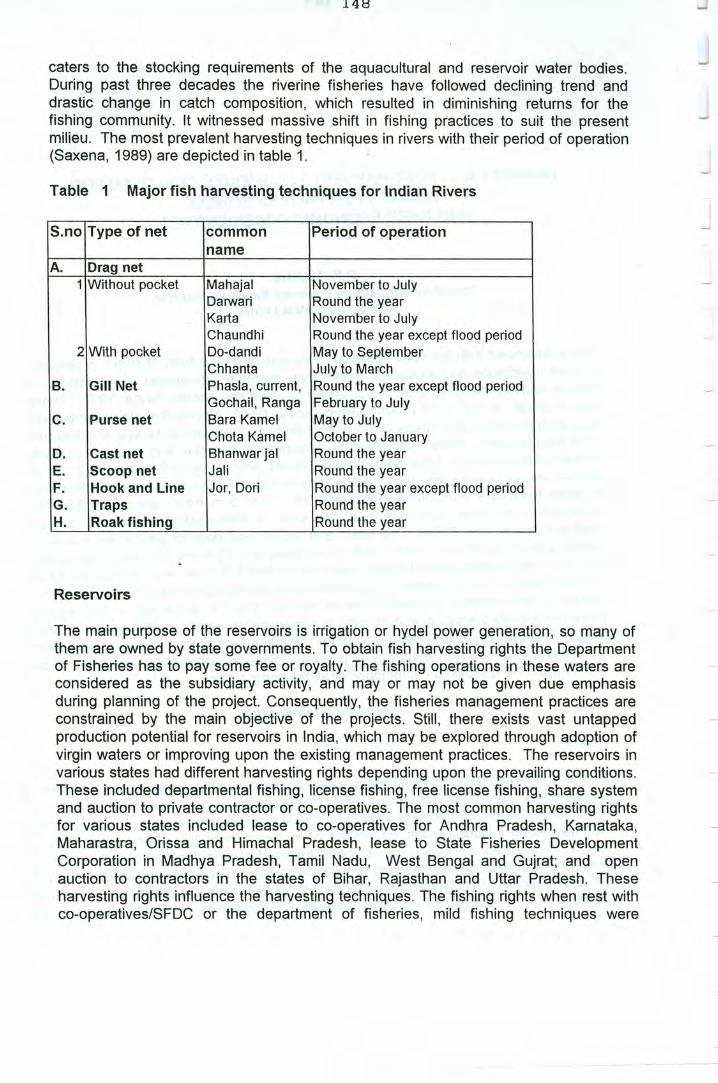
148
caters to the stocking requirements of the aquacultural and reservoir water bodies.During past three decades the riverine fisheries have followed declining trend anddrastic change in catch composition, which resulted in diminishing returns for thefishing community. It witnessed massive shift in fishing practices to suit the presentmilieu. The most prevalent harvesting techniques in rivers with their period of operation(Saxena, 1989) are depicted in table 1.
Table 1 Major fish harvesting techniques for Indian Rivers
S.no Type of net common Period of operationname
A. Drag net1 Without pocket Mahajal November to July
Darwari Round the yearKarta November to JulyChaundhi Round the year except flood period
2 With pocket Do-dandi May to SeptemberChhanta July to March
B. Gill Net Phasla, current, Round the year except flood periodGochail, Ranga February to July
C. Purse net Bara Kamel May to JulyChota Karnel October to January
D. Cast net Bhanwar jal Round the yearE. Scoop net Jali Round the yearF. Hook and Line Jor, Dori Round the year except flood periodG. Traps Round the yearH. Roak fishing 'Round the year
Reservoirs
The main purpose of the reservoirs is irrigation or hydel power generation, so many ofthem are owned by state governments. To obtain fish harvesting rights the Departmentof Fisheries has to pay some fee or royalty. The fishing operations in these waters areconsidered as the subsidiary activity, and mayor may not be given due emphasisduring planning of the project. Consequently, the fisheries management practices areconstrained by the main objective of the projects. Still, there exists vast untappedproduction potential for reservoirs in India, which may be explored through adoption ofvirgin waters or improving upon the existing management practices. The reservoirs invarious states had different harvesting rights depending upon the prevailing conditions.These included departmental fishing, license fishing, free license fishing, share systemand auction to private contractor or co-operatives. The most common harvesting rightsfor various states included lease to co-operatives. for Andhra Pradesh, Karnataka,Maharastra, Orissa and Himachal Pradesh, lease to State Fisheries DevelopmentCorporation in Madhya Pradesh, Tamil Nadu, West Bengal and Gujrat; and openauction to contractors in the states of Bihar, Rajasthan and Uttar Pradesh. Theseharvesting rights influence the harvesting techniques. The fishing rights when rest withco-operatives/SFDC or the department of fisheries, mild fishing techniques were

149
prevalent, i.e. gill nets, cast nets, traps, but in case of open access, license tofishermen and auction to contractors drag nets were also in use. The harvestingtechniques adopted under different fishing rights are summarised in table 2.
Table 2 The fishing rights and practices for reservoirs in India
S.no. Type of fishing right Harvesting techniques1 Lease to co-operatives/ state fish- Gill nets, cast nets, traps
eries development corporationI(SFDC)
2 Departmental fishing Gill nets3 Open access Drag nets, gill nets, hook & lines4 license to fishermen Drag net, gill nets, cast nets, hook and lines5 Auction to contractor Drag nets, cast nets, gill nets, hook & lines
Floodplain wetlands
Most of the floodplain wetlands are either managed by fishery co-operatives orprivately. The fish harvesting techniques for these waters are very traditional. Variouskinds of locally made gears and indigenous methods are in use for exploitation ofdifferent fish species and prawns. The classification of these gears (Choudhury, 1992)are mentioned in table 3.
Table 3 The fishing techniques for floodplain wetlands of India
S.no. Type of gear Name of gear Seasons of operationA. Moving1 Drag net Mahari jal Round the year
Ber jal Round the yearHarhari jal WinterMoi jal WinterPanti jal Winter
2 Dip Net Jata jal MonsoonDharma jalGhoka jal
3 Cast net Khewali/Asra jal Round the yearB. Stationary nets1 Gill net Fansi Round the year
Puthilangil MonsoonKoilangi andGaroilangiHook and lines Round the year
2 Traps Polo,Sepa, Round the yearJakoi, Jaluki,Dingora, Darki,Boldha

150
Estuaries
The estuarine fisheries. contributed significantly in Indian inland open water fishproduction. Open estuarine system included Hoogly-Matlah and Mahanadi estuarinesystems. Godavari estuarine system is the main estuary of peninsular India, whileVasishta, Vainatheyam, Adyar, Kajuveli, Ponriaiyar, Godilam, Paravanan, Vellar, Killaiand Coleroon are the small estuaries of this region. The main estuaries of North Westcoast are Narmada, Tapti and Mahi. These are also identified as excellent source ofnaturally occurring fish and prawn seed. Most of the estuaries are open for fishingactivities. The most prevalent harvesting techniques in these waters are bag nets(stationary), drift gill nets, trawl nets, seine nets (large and small), purse nets, lift nets,cast nets, set barrier nets , hook and lines and traps (Mitra et al., 1997). In case ofHoogly-Matlah estuary 74.7% of catch was of bag nets followed by drift gill net at16.3%. The remaining nets had only 9% of catch.
Post-harvest techniques
The fish catch from inland open waters mostly feed the domestic demands and ismarketed in raw form. The fish processing is very rare. Therefore, the post-harvesttechniques mainly concentrate on fish marketing activities. Similar to harvestingtechniques the post-harvest techniques are almost same for all the types of inland openwaters, but slight difference exists due to nature of resources and harvestingpersonnel.
Rivers
Most of the rivers have an open access, so, the fishermen either dispose this catch atriver site to local dealers or bring it to fish market for sale or auction. For leased outstretches, the fishermen hand over the catch to contractors or co-operatives. Theyfurther market it either themselves or pass over to the wholesalers cum commissionagent, who auction it for local consumption or send to secondary or terminal markets.
Reservoirs
For most of the reservoirs fishing rights are with some organisation or contractor. So,fishermen hand over the catch to them. The fishermen's remuneration is in the form ofroyalty or prices at some fixed rate. These organisations are disposing off the catchthrough contractors or wholesalers and commission agents or directly to theconsumers. The contractors or wholesaler cum commission agent may export it tobigger or terminal markets.
Floodplain wetlands
As indicated earlier, the floodplain wetlands are either managed by co-operatives orprivately. The catch from these water bodies is mostly auctioned at the local landingcentre. Local dealers take it to wholesale market or directly sell in retail market. In caseof local commission agent fish passes to wholesaler cum commission agent to reachthe retailer I secondary or terminal market.

151
Estuaries
Estuaries being the common property resource, individual fishermen hand over thecatch to local dealers, who act as commission agent or retailer. The local dealerpasses on the catch to the wholesaler! wholesaler cum commission agent or selldirectly to consumer.
Table 4 Most prevalent marketing channels for inland open water catches in IndiaI
Fisherman - Wholesaler cum commission agent - Retailer - ConsumerFisherman - Retailer - ConsumerFisherman - Local dealer! Local dealer cum commission agent - ConsumerFisherman - Local dealer - Wholesaler cum commission agent - Retailer - ConsumerFisherman - Local dealer cum retailer - ConsumerFisherman - Contractor! Contractor cum wholesaler - Retailer - ConsumerFisherman - Co-operative society - Contractor! Contractor cum wholesaler - Retailer -ConsumerFisherman - Co-operative society - Wholesaler cum commission agent - Retailer -consumerFisherman - Co-operative society - ConsumerFisherman - State Fisheries Department! SFDC - Contractor - Wholesaler cumcommission agent - Retailer - ConsumerFisherman - Consumer
Economic consideration
Majority of inland open waters are the common property resources, so, highlyvulnerable to irrational mode of exploitation and over concentration of fishing effort interms of manpower and number of nets (Paul, 1992). For profitable fisheries onsustainable basis, it is emergent to manage harvest and post-harvest activitiesoptimally. Due to very low socio-economic status and literacy level of the fishermencommunity, it is very difficult to gather the reliable information, particularly on economicparameters. The economic analysis is mainly concerned with the fishermen'sinvestment on fixed and variable inputs and the outcome of fishing activity. Theselection of harvesting techniques are generally based on physiography of water body,nature of fish stock and characteristics of raw material available. But above all, themost important factor for this selection is fishermen's financial capabilities, which forcehim either to purchase, hire or share the fisheries requisites. Centris paribus, followingquestions and options are involved in economic decision making.
1. Whether to purchase! hire! share the craft and gears?2. If purchase, at what cost and of which material and dimensions?3. If hire, at what rent and of which material and dimensions?4. If hire, for how many months?5. If share at what conditions?6. When and where to fish?7. For whom to fish at what rate of royalty! price?8. What should be the intensity and distribution of fishing effort over the year?9. Whether the remunerations for the catch would cover the costs incurred?

152
Due to very low income levels, the fisherman is constrained by financial obligations,which restrict him to follow rational post-harvest techniques. Yet, for an economicallyoptimum disposal of catch he has to decide:
1. How to sell?2. To whom to sell? and3. At what price to sell?
To examine the economic feasibility of harvest and post-harvest techniques, followingcost and income analysis (Katiha, 1994) should be done for all the agencies involvedin these activities. It would answer the questions posed above, exploring variousoptions.
A. Cost analysis
1. Cost A1
2. Cost A23. Cost B4. Cost C
B. Income analysis
Cash expenditure, license fee, boat rent, depreciation on fixedcapital, interest on working capital;Cost A1 + fishing rentCost A2 + imputed value of interest on fixed capital; andCost B + imputed value of family labour.
1.2.3.4.
Returns on Cost A1Returns on Cost A2Returns on Cost BReturns on Cost C
Gross income - Cost A1Gross income - Cost A2Gross income - Cost BGross income - Cost C
In short run, the fishermen can continue if returns on Cost A2 are met, but for long runthe Returns on Cost C must be positive.
References
Anonymous. 1996. Handbook on fisheries statistics. Fisheries Division, Department ofAgriculture and Co-operation, Ministry of Agriculture, Government of India, p. 128.
Choudhury, M. 1992. Fishing methods in flood plain lakes. FAO sponsored trainingprogramme on floodplain fisheries management. Compendium. (Ed. Y.S. Yadava andV.V. Sugunan) Vol. 2, pp In 163-166.
Katiha, P.K. 1994. Natural resource management: A case study of reservoir fisheries inHimachal Pradesh. Ph.D thesis. Unpublished. Department of Agricultural Economics,Or Y.S. Parmar University of Horticulture and Forestry, Solan (H..P), 125 p.

153
Mitra, P.M.; Karmakar, H.C.; Sinha, M.; Ghosh, A. and B.N. Saigal. 1997. Fisheries ofthe Hoogly-Matlah esturine system - An appraisal. Bulletin no. 67, Central InlandCapture Fisheries Research Institute, Barrackpore. p. 18
Paul, S. 1992. Pre-harvest and post-harvest management of floodplain fisheries. InFAO sponsored training programme on ttcoootein fisheries management. Compendium.(Ed. Y.S. Yadava and V. V. Sugunan) Vo12, pp 141-143.
Saxena, R.K. 1989. Fishing methods in river systems. In Conservation andmanagement ot inland capture fisheries resources of India (Ed. A. G. Jhingran and V. V.Sugunan), Inland Fisheries Society of India, Barrackpore. pp. 61-68.
Sinha, M. 1997. Inland fisheries resources of India and their utilisation. In Fisheriesenhancement of small reservoirs and ttooaotein lakes in India. (Ed. V.V. Sugunan andM. Sinha) , Bulletin 75, Central Inland Capture Fisheries Research Institute,Barrackpore. pp. 1-11
Sugunan, V.V. 1995. Reservoir fisheries in India. FAO Fisheries Technical Paper No.345, Food and Agriculture Organisation, Rome. 423 p.

154
Mass awareness and technology dissemination to achievesustainable yield from oper:-waters through participatory approach
Utpal BhaumikCentral Inland Capture Fisheries Research Institute
Barrackpore-743 101, West Bengal
Introduction
The process of technological innovation, technical and scientific communication andtechnology transfer has been the subjects of considerable research in recent years. From abehavioural point of view, technological change and innovation occur as a result of complex setsof human interactions; information flows and transfers; individual and organisational creativity;individual and organisational risk taking and decision making capabilities. Each of these factorsinvolve human beings with their motivations, perceptions, attitudes, beliefs, abilities, ambitions,personality and prior knowledge and experience.
Generally innovated technologies are sophisticated in nature and high input intensive.It is interdependent on so many inter-related practices each one of which have to be appliedrationally in time and in the manner recommended by the scientists. A communicator concernedwith open water fisheries, therefore, has to understand its characteristics in order to selectappropriate methods and techniques for effective and rapid communication of appropriatetechnology to the clientele for their easy adoption. To achieve development from within apopulation, requires working with people in their existing situation, with their existing resourcesand skills.
Strategy for effective communication for mass awareness
The present open water fisheries management strategy in the country calls for rapiddissemination of information on open water fisheries and technical know-how to the clientele inmass scale in the direction and bringing the gap between research system and target groups inthe field. The stra~eJy for transfer of technologies on open water fisheries for the members ofthe resource poor target group is to be treated henceforth as one of the essential inputs to overallactivity in the open water fishery develolpment programmes.
Types of information
Ideally any information system for sustainable fish production from open waters covers;
i) Information on natural resource and biodiversityii) Information on biology of fishesHi) Information on seed availabilityiv) Information pertaining to existing facilities and infrastructurev) Information on the available technologies and package of practices

155
vi) Information related to environmental impactvii) Information on crafts and gearsviii) Information related to conservation measuresix) Information pertaining to Government policies and programmes.
It has been felt that negligible effort so far has been made in the country to provide suchinformation to the target groups towards development of fisheries in open waters. Thus, a largegap has been created between awareness and adoption of measures on management of fisheriesin open water systems.
Communication planning for mass awareness
The prime objectives of the programmes towards development of fisheries in open waterbodies could not be achieved unless communication is taken as an important component andingradient of development efforts. The constructive application of communication fordevelopmental process calls for proper planning that takes equal note of the national prioritiesand needs, preferences of individual and of social priorities. An essential ingradient of suchcommunication planning is an understanding of the specific assets and limitation of each ofdifferent media. It may be appropriate to have an idea of the impact of each of these on thesociety.
Face to face oral strategy
Extension personnel through personal contacts will establish rapport with the receiver andwill communicate well tested messages to improve their skills, attitudes and knowledge.
Case studies
The case studies may come from all the areas of extension' activities of the fisheriesdevelopment in open waters. The case studies may be on achievements/activities of individualworker and experience of fishermen. The information can be compiled to give upto-date data.
Circulation
Information on management measures on open waters could be widely circulated in theform of circular letter, handout, leaflet, pamphlet, mimeograph etc.
Joint field visit
Joint field. visits of researcher and extension worker will enable them to understandabout success of the development programmes on open water fisheries and to identify theconstraints.

156
Group approach
Instead of the individual approach in communication, the group approach should beef9phasised to get the desired results in the field.
Use of Audio-Visual aids for mass awareness of the target group
A.V. aids play important role in effective communication of information on open waterfisheries management and resource conservation. The extension functionaries working infisheries developmental programme must be equipped with audio-visual equipments. Radio andTelevision have a great potential as a medium of mass communication. The authoritiesconcerned with Radio and TV may be coopted to ensure that they plan their programme tobroadcast/telecast information on open water fisheires management and conservation regularlyfor mass awareness of the target group to strengthen open water fisheires developmentmovement.
Extension system and holistic participatory approach
At every step of the management of fisheries in open water bodies people's participationin all the 4 extension systems viz., Research System, Extension System, Client System andSupport System, is of much more importance that the product or process put to use.
Local participation is not the only new criteria by which the management of fisheriesneed to be judged. It is equally important that the problems be approached holistically takinginto account of the full range of human and community potentials.
Open water fisheries management projects necessarily involves both individual and groupaction. The need for participatory approaches is probably maximum in such developmentalprojects. In fact, participatory approaches are indispensable for successful management of suchprojects.
The very purpose of development activity seen in its broadest socio-political sense is :
to enable people to critically understand their situations and problems;to identify their needs and to prioritize them;to evolve methods of resolving these needs and problems;to mobilize local resources;to implement activity in an organised manner; andtomonitor, evaluate and learn from the effort.
Naturally, the participation of the people is necessary for such an effort. Since,development efforts can not stipulate people's participation as in initial condition, suchparticipation should be actively promoted as an integral part of each practice of fisheriesmanagement and should work, within a time frame, towards an ideal (even if it may not bewholly achievable) condition.

157
People participation - a desired phenomenon
Encouraging people's participation in the management of fishery projects is not a newconcept. But whatever this widely talked of concept's name, the concept of people'sparticipation itself seems to mean many things to many people and there has been muchconfusion and misapplication in its implementation. Therefore, there is need to clearlyunderstand the level of people's participation, that is necessary to achieve the goals of a specificprogramme on fisheries. To arrive at such an understanding, people's participation should belooked at in terms of;
i) the quality of participationii) the types of participation possibleiii) the phases of participationiv) the proportion of those potentially affected who really participate in such schemesv) the representativeness and accountabiolity of the leader and the local organisations of the
potentially - affected communityvi) the degree of people's participation in terms oflabour and money inputs.
Participation, with its pefuliar dual nature of being a tool and an end to be achieved bythe tool, suggests that, no matter how little the participation to begin with, it is a positive steptowards not merely efficient and socially feasible action but towards development itself.Development, whelfare and problem-solving were, in the past, activities that families, kinfolkand communities talked. But with development and welfare increasingly and unfortunately,often exclusively becoming government responsibilities, or at best, agency functions, thequestion of who participate in whose activity becomes very relevant.
Generally speaking, it is the Government/Development agencies who, nowadays, dosomething for the beneficiearies, whether this involves transferring technology or buildinginfrastructure, or whatever other task, the effort is that of the agency.
Organisations in participatory management
Participatory management activity by its very nature means working in managementprocess with groups and communities. The research agency and change agents will have to makethe management of the fisheries in open water bodies possible by the people themselves ratherthan do it to or for them. This shift in thinking and will have dramatic implications to not onlymanagement process but to the agency's culture as well. That will emerge or needs to emerge,is a shift from the develolper-developee hierarchy to a situation of partnership where both theresearch/extension agency and the people see themselves as eo-workers in the managementprocess. This shift in approach might even require in the research/extension agency to hold backon what it believes to be true, scientific and modem, and begin a dialogue that, in time, willenable the beneficiary to, on his or her own, come to the same learning - perhaps to a learningwhich blends the research/extension agencies learning with indegenous learnings and realities.

158
There are two essential aspects to the organizational approach - one facilitates day-to-dayactivity, with the community choosing representatives to speak on its behalf or undertake specifictalks, the othe~one is more political aspects which involves empowering the community to makeit sure it gets Its rights and to hold external agencies responsible.
Research/extension agencies by their very nature.work with communities only for shortperiods of time. If the development activity has to be self-sustaining and self-perpetuating, thenthe participating people's organisation has to have permanence and the ability to sustain theinvolvement of the community.
An important fact worth considering is that the existence of an organisation in acommunity does not ensure people's participation. Organizations frequently benefit only the'wealthy and influential members of the community. There is also reality that several socio-cultural traditions tend to be authoritarian. In such communities, the leadership would opposeany form of organisation that promotes democratic and egalitarian norms. Theresearch/extension agency would then have to consider whether it should use an existingtraditional form of organisation in the community, a help it to from of organisation in thecommunity or help it to form a new organisation. Governments and research/extension agenciesin relevence to the development of the fisheries in open waters seem particularly attracted to thecooperative form of organisation. If it functions properly it can be an ideal organisation, ensuringdemocratic management and an egalitarian distribution of benefits. However, while there havebeen a few spectacular success, the experience in general with fishermen cooperative societieshas not been always good.
In India, government perceives the cooperatives as a channel for development benefitsto the community. It considers underdevelopment in fisheries as being due to the primitivenature of the traditional technology resulting in low productivity. So, its solution has been toenable fish farmers/fishermen to acquire assets that would help them to make better yield.
The role of the organisation in participatory management is, understandably, very,important and almost a necessary condition. However, it places a heavy burden on theGovernmentlResearch/Extension agency, which often has to strengthen the very organisation thatnot only will eventually have to hold it accountable. Government/Research/Extension agencieswith their own objectives can not be depended upon to display such benevolence at all the times.Participation through organisation is, in this sense, therefore, much more difficult to plan and isunpredictable in nature. It suggests that there is need for the research/extension agency tocommit itself first to participatory development and to the associated ideologies and attitudes,before it seeks strategies to foster organisation among fish farmers/fishermen.
Meaningful participatory approach
Participation grows out of meaningful relationships, that enable people to share and worktogether. There are several reasons why participation approaches succeed or fail. The reasonsmentioned below could be considered as 'do's' and 'don'ts' for the developmental agencies. Butit might be wiser to consider the suggestions more as guidance giving direction to the activityrather than deterrents to action.

Have a legitimate role: The management of open water fisheries is rather participatory projectwhere a sort of negotiated activity in which people and the research/extension/developmentalagencies to work together for commonly shared objectives. To be able to negotiate successfullyfish farmers/fishermen, scientists, extension functionaries, developmental officials, have not onlyto respect each group but also it must also feel that there is a legitimate role to play for thatgroup. The agencies and its members must really see a role in the organisational process beconsidered legitimate and successful participation will result.
Enable 'equalness' to facilitate negotiation: For negotiations to be conducted meaningfully,the fish farmerslfishermen, scientists, extension functionaries and developmental officialsinvolved, must be reasonably equal. Unfortunately, agencies and the people may negotiate with,are often at different levels not only in terms of power but in terms of knowledge and ability aswell. This could lead to the activity to be implemented being more agency oriented. So, theagencies has the key role and the responsibility of first creating 'equalness' through educationalprogrammes that develop communication and negotiation skills as well as power of analysis.
Begin witb the felt needs of the people: For participatory management to be successful, it isnecessary for all the groups (mentioned earlier) involved to know what is they want. Theagencies have their ownf mandate and the people have their own. Not only the content, but thepriorities may also vary. But if successful participation is the aim, the begining has to be madewith what the people consider, are their needs and which the agency agrees, are areas of concern.
Learn from and with people: Participation suggests that the people and the agency are agreedon to do something about the way things are to be moulded. But the agencies might not fullyappreciate the circumstances and predicament of the people unless it is willing to learn fromthem. Only by learning from, and with, the people - their social dynamics and their needs andpriorities, can the right agenda be mutually agreed upon and implemented with wholeheartedparticipation of all in the community.
Build confidence as a prelude: People may be dissatisfied, but they must do something aboutthat dissatisfaction. More important, they must have the confidence that they have the ability todo something about themselves. A whole range of cultural, social and historical factors,including past failures, can weaken this confidence. Thus, confidence-building is a task. Theagencies may have to set itself before participation can be assured.
Help organisation to emerge: Some form of organisation viz., Fishermen Cooperative Society,Fish Club etc. is necessary if participatory managtement is to succeed because there is a need totake decision, take responsibility for particular tasks, allocate tasks, all of which can be donebetter when a community or group is organised.
No autocratic behaviour: Scientists/extension functionaries/developmental officials often feelthat they alone know what needs to be done which are not democratic in their own functioningand not participative in their decision making, will find extremely difficult to convincecommunities they work. In most cases, the agencies and its characteristic and behaviour can bethe most important factors determining the success of participatory management.

160
Flexible approach: The agencies usually tend to specialise in order to be more efficient. Theirmanagerial cultures also tend to make them more rigid and time conscious. In participatorymanagement, where others are involved, these characteristic may work against the activity. Thepeople's needs may not coincide with the agency's capabilities, the time taken to achievesomething real in the field may not fit well with reporting and, budgeting schedules, mid coursecorrections may not be easy to bring in. Agencies need to have a far more flexible approach totheir work if they wish to promote participation. .
No place for unilateral decisions: The participatory approach grow out of the exchange of theagency's knowledge with people's blending in the process, the modern and the scientific withthe traditional and the indegenous.
If the agencies really intend to become participative, the directions, objectives andpriorities must evolve out negotiation and not out of unilateral decisions.
Need to realise limitations: If the agencies wish to work with a community and help to developit, it really has only two choices:
it can diversify its capabilities or bring in other agencies to be able to address the specialneeds of the people; or
it can accept its limiations and negotiate for the use of its particular ability, of coursekeeping in mind that management in these circumstances would only be partial.
The agencies must be more realistic about the objectives that can be achieved, given theirlimited capabilities.
Getting the people do more: Agencies must do less and help people do more. Since, the goalis to get the people to do it at their own, the agencies should design tools how they can get othersto do what agencies have the expertise to do. If the communities are to participate actively in themanagement process, the technology and techniques will have to be demystified, made simplerand more accessible. The agencies will have to release information freely to the people.
Coping with change: Working with communities, empowering them, enabling them to workwith justice, democracy, the agencies will find the community going through basic structuralchanges. The agencies have to face those changes and its implications, the agencies will haveto cope with it.
Conclusion
The experience with people's participation in fisheries related activities was initiallylimited. Significantly, it was the last sector to change from 'top-down' approach to a 'bottom-up' one. However,(at present concerted effort must be prioritised towards participatorymanagement approach for not only getting sustainable production of fishes from the open waterbodies of the country but also for alleviating poverty in the rural areas. )

161
Analytical methods for estimation of soilquality parameters
D. NathCentral Inland Capture Fisheries Research Institute
Barrackpore - 743 101, West Bengal
Estimation of certain soil quality parameters are very important for evaluationof productivity of a water body)The relationship of fishes with their physical andchemical environment in soil must be known if higher yields per unit area are desired.
Soil samples should be collected from different locations in each water body bymeans of an Ekman dredge. The samples should be mixed thoroughly to make arepresentative sample. The samples should be air dried in shade, ground to fine powderby gentle pressing with a wooden hammer, strained through a 2mm and then a 80 meshsieve and again air dried. The percentage of moisture in the soil may be determined by
. drying the soil in an oven at 103°C. Analysis is done with the air dried samples andresults are expressed on an oven dry basis.
METHODS OF ANALYSIS
1. pH
Soil pH is determined by electrometric method using a pH meter, the soilwater ratio being 1 : 2.5.
ProcedureTake 10 gm of soil in a 50 ml beaker and add 25 ml distilled water. The
suspension is stirred for 20 minutes. Now calibrate the pH meter with buffer solutionsof known pH and then immerse the electrode into the sample and determine the pH.For acidic soil sample use buffer solution having pH-4, while for neutral or alkaline soiladjust the instrument with a buffer solution having pH 7 or 9.
2. Organic Carbon
Organic carbon' is estimated following Walkley and Black's Wet dijestionmethod.
Reagentsa) IN Potassium dichromate solution: In an analytical balance, weigh 49.04
gm potassium dichromate ARlGR and dissolve it in one litre of distilled water.b) IN Ferrous solution: Dissolve 278.0 gm pure FeS04, 7H20 or 392.13 gm
of Mohr salt (Ferrous ammonium sulphate) in distilled water, add 15 ml of conc.H2S04 and make up the volume to one litre. This should be standardisedagainst N K2Cr207 so that 1 ml of Ferrous solution = 1 ml N K2Cr207.

162
c) Diphenylamine indicator: Dissolve 0.5 gm Diphenylamine in 100 ml cone.H2 S04 and 20 ml distilled water.d) Phosphoric acid (85%)e) Cone. Sulphuric acid (sp. gr. 1.84)
ProcedurePlace 1 gm soil sample in a 500 ml conical flask, add 10 ml of N K2Cr207 and
then add 20 ml of cone. H2S04. Mix by gentle rotation for one minute and allow themixture to stand for 30 minutes. Dilute with distilled water to 200 ml, add 5-10 ml ofphosphoric acid and 1 ml of diphenylamine indicator. The mixture is titrated with INFerrous solution.until the colour change to sharp green from a bluish colour.
Calculation: (10 - No. ofml ofN FeS04 solution required) X 0.3= Organic Carbon (%)
3. Total Nitrogen
Total nitrogen is estimated by Kjeldahl's method.
Reagentsa) Cone. H2S04.b) Salicylic acidc) Sodium thiosulphated) 12 N NaOH : Dissolve 480 gm Sodium hydroxide in one liter distilledwater.e) 0.1 N NaOH : Dissolve 4 gm NaOH Pellets in 1 liter distilled water.Standardise against 0.1 N H2S04.f) 0.1 N Na2C03 : Accurately weigh 5.3 gm analytical grade Sodium carbonatein a chemical balance and dissolve it in one litre of distilled water.g) 0.1 N H2S04 : Take 3 ml of cone. H2S04 and dilute itto 1080 ml withdistilled water. Standardise against 0.1 N H2S04.h) Potassium Sulphatei) Copper Sulphatej) Methyl red indicatork) Phenolpthalein indicator
ProcedureTake 5 ml of soil sample in a Kjeldahl flask, add 20 ml of cone. H2S04, 0.5 gm
Salicylic acid and Keep in cold for 10-20 minutes. Then add 2.5 gm Sodiumthiosulphate, a pinch of copper sulphate and 5 gm of potassium sulphate and digest themixture in a fume cupboard and for 1.5-2 hours until the contents are white and clean.Cool and add 50 ml water. Transfer the contents to a ammonia distillation flask. Make
. it alkaline with 80 ml of 12 N NaOH solution and distill off the ammonia collecting it in10 m! of 0.1 N H2S04 in a conical flask with a few drops of methyl red indicator.Collect about 150 ml of the distillate. Titrate the excess of 0.1 N H2S04 with 0.1 NNaOH till the solution turns colourless.
Calculation: (10 - No. of m! of 1 N NaOH required) X 0.014 X 2= Total Nitrogen(%) .

.1.0~
4. Available Nitrogen
Available nitrogen is determined by alkaline permanganate distillation methodas suggested by Subbiah and Asija.
Reagentsa) 0.02 N H2S04: Dilute 100 ml ofN H2S040fstandard stock solution to 500m1with distilled water.b) 0.02 N NaOH : Dilute 100 ml of 0.1 N NaOH of standard stock solution to500 ml with distilled water.c) Methyl red indicator: Dissolve 0.1 gm of methyl red powder in 25 ml ofethyl alcohol and make up the volume to 50 ml with distilled water.d) 0.32 % K Mn04 solution: Dissolve 3.2 gm of potassium permanganate indistilled water and make up the volume to 1 liter.e) 2.5 percent NaOH solution: Dissolve 25 gm of Sodium hydroxide indistilled water and make up to one liter.
ProcedureWeigh 5 gm of the soil sample in a 500 ml Kjeldahl flask. Add 50 m1of 0.32 %
KMn04 solution and 50 ml Of 2.5 % NaOH, 2 ml of liquid paraffin and 10-20 glassbeads and distill the mixture. Collect the distillate in a conical flask containing 10 m1of0.02 N H2S04 and a few drops of methyl red indicator. Collect about 60-75 mlofthedistillate. Titrate the excess of 0.02 N H2S04 with 0.02 N NaOH to a colourless endpoint.
Calculation: (10 - No. ofml of 0.02 N NaOH required) X 2.8 X 2= Available Nitrogen(mg/100 gm of soil)
5. Available phosphorus
There are a number of methods for determination of available phosphorus insoil which use different extractents. Of these Trough's method using 0.002 N H2S04 asextractants is commonly used, since the method is very simple and it gives a goodcorrelation with fish production.
Reagents. a) 0.002 N H2S04: Dilute 20 m1of standard 0.1 N H2S04 to one litre. Adjust
the pH to 3.0 with Ammonium Sulphateb) 50% H2S04.
c) 10% Ammonium Molibdate solutiond) Acid ammonium Molibdate solution: This may be prepared fresh at thetime of analysis. Add 15 m1of 50% H2S04 to 5 m1of 10% ammoniummolibdate solution.e) Stannous Chloride solution : Dissolve 1 gm of stannous chloride A.R. in 100m1of glycerin.

t) Standard phosphate solution (1 ml = 0.01 mg P) : Dissolve 4.388 gm ofPotassium dihydrogen phosphate (K H2P04) which has been dried over cone.H2S04, in distilled water and make upto one litre. This stock solution contains1 mg P per ml. Dilute 10 ml of this solution to one litre containing 0.01 mg Pper ml. (= 10 ppm).
ProcedureTake 1 gm sample in a 250 ml bottle, add 200 ml of 0.002 N H2S04 and shake
the mixture for 30 minutes in a mechanical shaker, keep it for 10 minutes and filter.Filter 50 ml of the solution and determine its phosphate content as follows : To 50 mlof the solution in a N essler Tube, add 2 ml of acid-ammonium molibdate reagent and 2drops of Stannous chloride, mix gently, wait for 5-7 minutes and measure the blue
. colour concentration in a spectrophotometer at 690 mu, Similarly, measure the colourphotometrically for two or three standard phosphate solution with known phosphateconcentrations and prepare a calibration curve, using a distilled water blank. From thecalibration curve, estimate the phosphate content of the soil solution. Prepare at leastone standard with each set of samples or once each day that tests are made. Thecalibration curve may deviate from a straight line at the upper concentrations of the 0.3to 2.0 mg/l range.
Calculation: No. ofml of standard X 0.01 X 4 X 100 = mgP/100 gm soil orPhosphate content in soil solution (mg/l) X 20= mg Pl1 00 gm of soil.
6. Calcium Carbonate
This method of determining HCI soluble calcium carbonate in a soil is useful forestimating the lime content of the soil.
Reagentsa) 0.5 N HCI solution: Dilute 40 cc cone. HCI to 960 cc with distilled water.Standardise against standard Na2C03.b) 0.5 N N aOH solution in one litre of distilled water.c) 0.5 NNa2C03 solution: Dissolve 26.5 gm pure sodium carbonate in onelitre of distilled water.d) Bromothymol Blue Indicator.
ProcedurePlace 5 gm soil sample in a 250 ml bottle, add 100 ml of 0.5 N HCI and shake
for one hour in a mechanical shaker. Allow to settle the suspension and pipette out 20ml of clear liquid. Transfer to a conical flask, add 4-5 drops of bromothymol blueindicator. Titrate it with 0.5 N NaOH till it is just blue (from yellow). Note the readingand carry out a blank taking 20 ml of 0.5 N HCI in a flask and titrating in the sameway.
Calculation: (Titrate for blank - Titre for soil solution) X 2.5= % of CaC03 in the sample.

165
7. Mechanical analysis
Gravitational method
Reagentsa) Hydrogen peroxide (6%)b) N HCIc) NNaOHd) 5% Silver nitrate solutione) Ammonium hydroxide
ProcedureTake 20 gm soil sample in a 500 ml beaker, add 30 ml H202 and keep the
beaker in a water bath. When oxidation of organic matter is complete, there will be nofrothing after addition of more H202. Cool, add 50 ml N HCI and 100 ml distilledwater to make the soil free from carbonates. Allow the content to stand for one hourwith occasional shaking. Filter the soil and wash it with hot water to remove the acid,which may be tested by AgN03 solution. Transfer the soil to one litre beaker, add 8 mlofN NaOH and shake for an hour in a mechanical shaker. Transfer the content to a 1litre tall cylinder, make up the volume and shake for one minute and allow to stand for4 monutes (28°C). Lower a 20 ml pipette, 10 cm deep and suck out 20 rnl of thecontent, dry it in a 50 ml beaker to a constant weight to get the weight of silt and clay.After 6 hours repeat the operation to get the weight of clay alone.
Calculation: Wt. of Clay + Silt = x, (wt. of sample after 4 minutes)Wt. of clay = X2= wt. of sample after 6 hours.From these readings percentage of clay, silt and sand can be found outas follows:Silt (%) = (x, - X2)X 250 CA)Clay (%) = X2X 250 - 1.6 (B)·Sand (%) = 100 - (Silt + Clay) = 100 - (A+B)
Cation exchange capacity of soil
PrincipleSoil is a negatively charged colloid and around this negatively charged layer a
positively charged layer is present. This positively charged layer consists mainly ofexchangeable cations, namely Ca+2, Mg+2, K+l etc. and H+ to a small extent. Soilcolloids have certain capacity for the exchange of these cations with other cations anda number of methods have been suggested to determine the CEC of soil.
In ammonium acetate method, when the soil is saturated with neutralammonium acetate solution, a portion of Nlf, + is absorbed by the soil and all thecations from the clay colloids are removed or exchanged through leaching by
. ammonium acetate solution due to mass action. Therefore the equivalent of ~ + ionsgoing to the clay colloids represent the exchangeable cations. Thus, the estimation ofNH/ in the soil will give as the CEC ofthe soil.

166, ;
Reagentsa) Neutral ammonium acetate solution: Dissolve 77.0 gms of ammoniumacetate in one litre distilled water. Adjust the pH to 7.0 by adding acetic acid or~OH solution.b) 40% ethyl alcohol.c) Ammonium Chloride (pinch only) for completing the process of exchange.d) N/I 0 H2S04 or 4% Boric acid (using mixed indicator of methyl red andbromocresol green)e) Nil 0 NaOH solutionf) 40% NaOH or 5 gms of anhydrous MgO.g) Methyl red indicator
Procedure
1. Take 10 gm soil sample in a 250 ml beaker and add 50 cc of neutral ammoniumacetate. Shake and heat at 70°C for half an hour.2. Cool the content and filter the soil on a Whatman No - 42 filter paper quantitatively.Wash the soil with neutral ammonium acetate solution several times. A pinch ofammonium chloride is added to the last washing .'3. The excess of ~ + in the soil is washed with 40% alcohol until the filtrate ischloride free. (Test with AgN03 and HN03).
4. The soil and filter paper is transferred to 500 rnl flask and distill with MgO, withsome paraffin oil. Collect the distillate in a conical flask containing 25 rnl of Nil 0H2S04 and 4 drops of methyl red. Collect about 200-~50 rnl of distillate.5. The excess ofN/IO H2S04 isback titrated with Nil 0 NaOH.
Calculation: CEC of soil = (B- T) X N X 100W
Where B = Blank titration in ml of standard alkali.T = Actual titration in ml of standard alkali.N = Normality of alkali (NaOH).W = Weight of soil taken.
References
1. De, S.K. 1962. Methods of soil analysis. Narayan Publishing House,Allahabad. 204 p.
2. Jhingran, Y.G., Natarajan, A.Y., Banerjee, S.M. and David, A. 1988.Methodology on Reservoir Fisheries Investigations in India. BulletinNo. 12 CICFRI, Barrackpore. 102 p.
3. Piper, C.S. 1966. Soil and Plant Analysis. Hans Publishers, Bombay. 368 p.

167
Analytical Methods for Estimation of Water QualityParameters
K. ChandraCentral Inland Capture Fisheries Research Institute
Barrackpore-7 43101 (West Bengal)
Introduction;
The purpose of the water Analysis is to know the exact composition of thesample at the particular point of time of sample collection After analysis is over, theresults may be interpreted to suit a particular purpose of either surveillance of waterquality,j§f effluent quality or to assess the performance of wastewater treatment plant.
General Information
1. Collect the sample along with the suspended matter, shaking may be required.Calibrate all the glass-ware. Use A.R. grade reagent. Express the results asmilligrams of parameters per litre of sample.
2. Statistical anlalysis of the data should be done before any conclusion is drawn.
3. In water samples the sum of anions (me/I) is equal to sum of cations (me/I)within reasonable limits if the ionic concentration is not excessive. This balanceis not possible for polluted samples.
Sampling
A sample has to be representative and valid both in time and space. Theparameters in the sample at the time of analysis should have the same values as those.atthe time and place of sampling. A sample will be representative depending upon thesampling techniques and preservation. A sample is valid if it represents the true picturewater quality at the sampling point. Quality of water depends on frequency ofsampling. Conditions at each sample source vary widely and sampling programmeneeds to the worked on the merits of the source.
Frequency of Sampling
Quality of water, flowing or stangnant , seldom remains the same in time. Thelarger the number of samples from which the mean is derived, the narrower will be thelimits of the probable difference between the observed and true values of the mean. Inorder to double the realiability of a mean value , the number of samples must be
p

168
increased four-fold, because confidence limits are proportional to the square of thenumber. Cost of sampling and analysis is directly related to the number of samples;hence a compromise between the increased reliability of data measured by confidencelimits and the cost of its collection has to be reached.
J
Effluents or water quality changes depending on the mass inputs and changes inrate of water flow or on volume. Characteristics of water quality vary; 1) randomly,e.g. during storm, spillages in factory; 11) cyclically due to rainfall pattern. Also theyvary with the production pattern in manufacture process, or depending upon thesourcees, e.g., a river or lake.
Sampling frequency at a source can be decided on the basis of the following stages:
1) Collection of information regarding factors causing changes in sample qualityand previous analytical data. .
. 2) Identifications of needs - highlighting the parameters of significance,depending on the source and requirement.
3) Preliminary study may be required to assess the existing water/ effluent qualityvariability nature in rerspect of concentrations of parameters. It is desirable tofollow
Sampling pattern as follows:
a) Weekly samples for one year
b) Daily samples for 7 days consecutively+
( 4 times /year)
c) Round the hour sampling for 24 hours+
( 4 times/year)
d) 4-hourly samples for 7-days - and 4-times/ year.
The analytical data collected as per the above procedure will help to lay proper.emphasis on parameters of relative importance, their ranges, interferences andfrequencies of their occurrences. This is applicable to rivers, lakes, industrial effluentoutfalls. concentration of a parameters is important, but is also equally important tocorrelate with the waste/ water flow to calculate the mass load. .
Sampling procedures:
The determinations fall into three groups.:
a) Conservative, not changing with time.
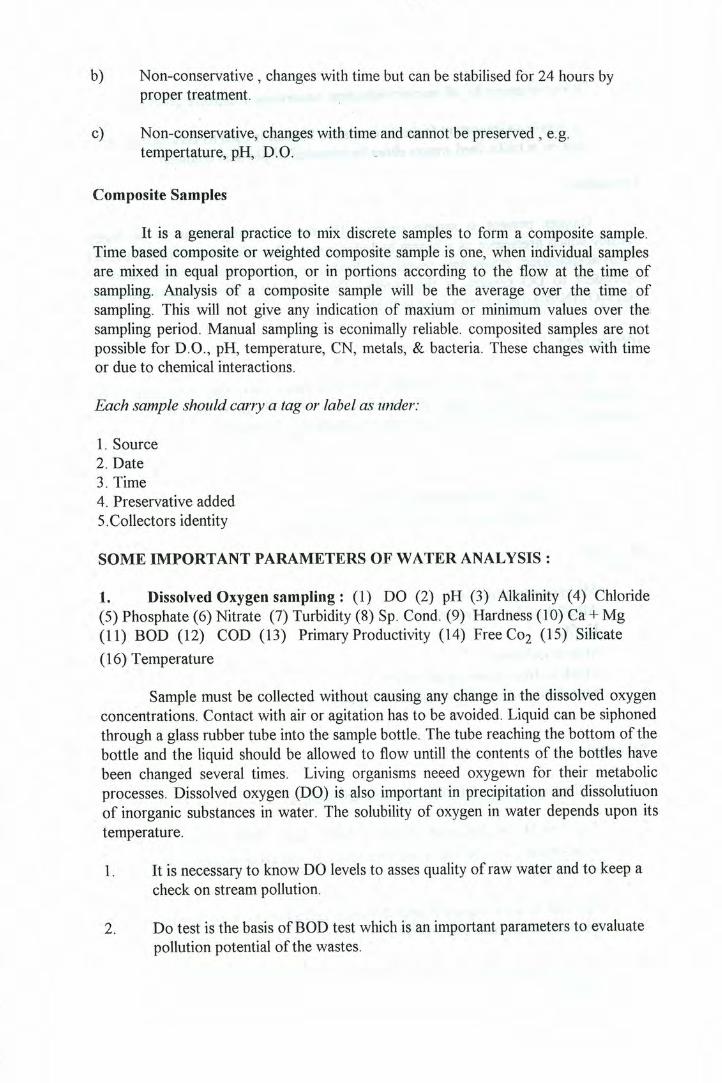
16:1
b) Non-conservative, changes with time but can be stabilised for 24 hours byproper treatment.
c) Non-conservative, changes with time and cannot be preserved, e.g.tempertature, pH, D.O.
Composite Samples
It is a general practice to mix discrete samples to form a composite sample.Time based composite or weighted composite sample is one, when individual samplesare mixed in equal proportion, or in portions according to the flow at the time ofsampling. Analysis of a composite sample will be the average over the time ofsampling. This will not give any indication of maxium or minimum values over thesampling period. Manual sampling is econimally reliable. composited samples are notpossible for D.O., pH, temperature, CN, metals, & bacteria. These changes with timeor due to chemical interactions.
Each sample should carry a tag or label as under:
1. Source2. Date3. Time4. Preservative added5.Collectors identity
SOME IMPORTANT PARAMETERS OF WATER ANALYSIS:
1. Dissolved Oxygen sampling: (1) DO (2) pH (3) Alkalinity (4) Chloride(5) Phosphate (6) Nitrate (7) Turbidity (8) Sp. Cond. (9) Hardness (10) Ca + Mg(11) BOD (12) COD (13) Primary Productivity (14) Free CO2 (15) Silicate(16) Temperature
Sample must be collected without causing any change in the dissolved oxygenconcentrations. Contact with air or agitation has to be avoided. Liquid can be siphonedthrough a glass rubber tube into the sample bottle. The tube reaching the bottom of thebottle and the liquid should be allowed to flow untill the contents of the bottles havebeen changed several times. Living organisms neeed oxygewn for their metabolicprocesses. Dissolved oxygen (DO) is also important in precipitation and dissolutiuonof inorganic substances in water. The solubility of oxygen in water depends upon itstemperature.
1. It is necessary to know DO levels to asses quality of raw water and to keep acheck on stream pollution.
2. Do test is the basis ofBOD test which is an important parameters to evaluatepollution potential of the wastes.

170
3. DO is necessary for all aerobic biological wastewater treatment processes.
4. Oxygen is an important factor in corrision. Do test is used to control amount of< oxygen in boiler feed waters either by chemical or physical methods.
Principles
Oxygen present in sample oxidizes the divalent manganeous to its highervalency which precipates as a brown hydrated oxide after addition of NaOH and KI.Upon acidification, manganese reverts to divalent state and liberates iodine from KIequivalent to DO content in the sample. This liberated iodine is titrated againstNa2S203 (N/80) using starch as an indicator.
Interference
Ferrous Ion, ferric ion, rutnte, microbial mass, and high suspended solidsconstitutes the main sources of interferences. Modifications in the estimationprocedures to reduce these interferences are decribed in the sequel.
Apparatus
1. BOD bottles capacity 300 ml .2. Sampling device for collection of samples.
Reagents
1. Manganese sulphate2. Alkali Iodide -azide reagent3. H2S044. Starch indicator5. Stock sodium thiosulphate O.lN6. Standard sodium thiosulphate O.025 N
Procedure
1. Collect sample in a BOD bottle using DO sampler.
2. Add 2 ml MnS04 followed by 2ml ofNaOH + KI + NAN3 . The tip of thepipet should be below the liquid level while adding these reagents. Stopperimmediately.
3. Mix well by inverting the bottles 2-3 times and allow the precipate to settleleaving 150 ml clear supernatant .
4. AIt this stage, add 2 ml conc., H2S04 . Mix well till precipitate goes intosolution.

171
5. Take 203 ml in a conical flask and titrate against Na2S203 using starch asindicator. When 2 ml MnS04 followed by 2ml NaOh + KI + NaN3 is added tothe sample as in (2) above 4.0 ml original sample is lost. Thus 203 ml taken fortitration will correspond to 200ml of original sample.200+ 300 / (300-4) = 203mI.
Calculation
(0.2+ 1000)ml of thiosulphateD.O. in mg/I
200
2. BIOLOGICAL OXYGEN DEMAND ( BOD)
APPARATUS
1. BOD bottles 300ml capacity2. Incubator, to be controlled at 200 C±
REAGENTS
1. Phosphate buffer2. Magnesium sulphate3. Calcium Chloride4. Ferric Chloride5. Sodium Sulphide Solution 0.025 N
Procedure
(a) Preparation of dilution water
1. Aerated the required volume of distilled water in a container by bubblingcompressed air for 1-2 days to attain DO saturation. Try to maintain thetemperature near 200C .
2. Add 1 ml each of phosphatew buffer, magnesium sulphate, calciumchloride and ferric chloride solution for each litre of dilution water. Mix well.
3. In the case of the waste which are not expected to have sufficient bacterialpopulation add seed to the dilution water. Generally, 2ml settled sewage. isconsidered sufficient for 1000 ml of dilution water.

172
(b) Dilution of sample.
l. Neutralise the sample to pH around 7.0 if it is highly alkaline or acidic.2. The sample should be free from residual Chlorine. If it contains residual
chlorine remove it by using Na2 S03 .
The following dilutions are suggested:
0.1% to 1%1% to 5%5% to 25%25% to 100%
ForForForFor
Strong trade waste.Raw or Settled sewageTreated EffluentRiver Water
3. Siphon the dilution prepared as above in 4 labelled BaD bottles and stopperimmediately.
4. Keep 1 bottle for determination of the initial DO and incubate 3 bottles at200C for 5-days. See that the bottles have a water seal.
5. Prepare a blank in duplicate by siphoning plain dilution watere ( without seed)to measure the O2 consumption in dilution water.
6. Fix the bottles kept for immediate DO determination and blank by adding 2 rnlMnS04 followed by 2ml NaOH + KI +NaN3 as decribved in the estimation ofDO.
7. Determine DO in the sample and in the blank on initial day and after 5 days.
8. Calculate BaD of the sample as follows:
Let DO = DO inthe sample bottle on Othday.D 1 = DO " "" " "5th dayCO = Do in the blank bottle on OthdayCl = Do in"" " " 5th day
CO--C1 =DO depletion in the dilution water aloneDo--D 1= DO depletion in sample+dilution water.(Do--D1) --(Co-Cl) =DO depletion due to microbesBOD mg/l = (DO--D1)--(Co--C1) mgX decimal fraction of sample used.If the sample is seeded find out BaD of seed in the above manner and applycorrection.
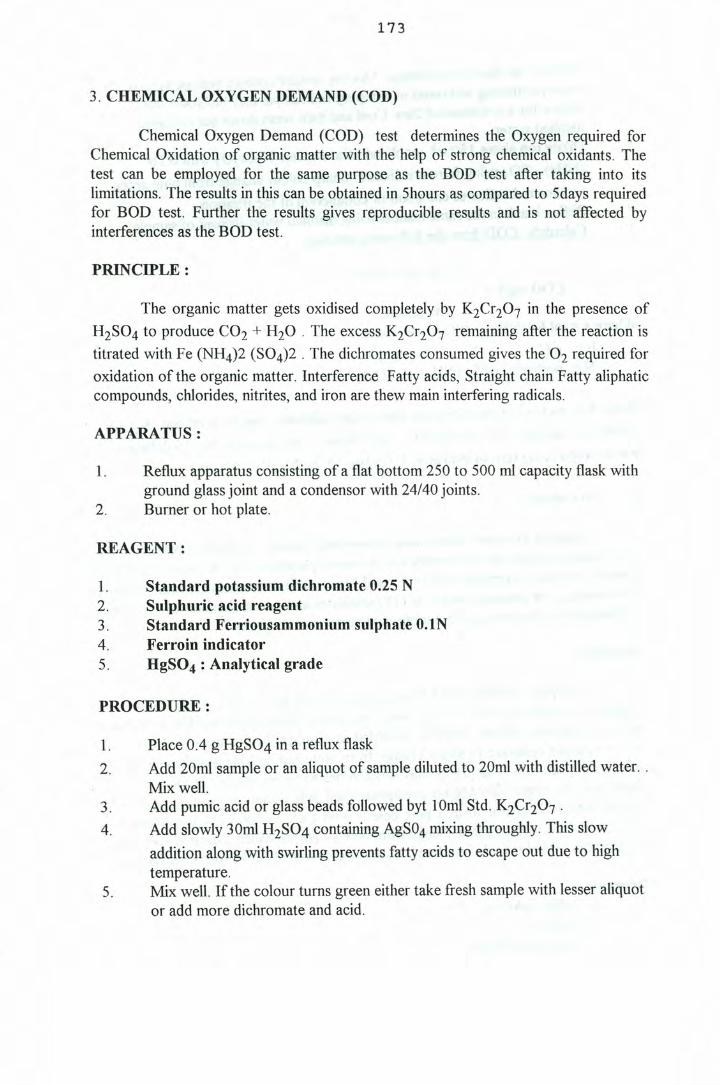
173
3. CHEMICAL OXYGEN DEMAND (COD)
Chemical Oxygen Demand (COD) test determines the Oxygen required forChemical Oxidation of organic matter with the help of strong chemical oxidants. Thetest can be employed for the same purpose as the BOD test after taking into itslimitations. The results in this can be obtained in 5hours as compared to 5days requiredfor BOD test. Further the results gives reproducible results and is not affected byinterferences as the BOD test.
PRINCIPLE:
The organic matter gets oxidised completely by K2Cr207 in the presence ofH2S04 to produce CO2 + H20. The excess K2Cr207 remaining after the reaction istitrated with Fe (NH4)2 (S04)2 . The dichromates consumed gives the 02 required foroxidation of the organic matter. Interference Fatty acids, Straight chain Fatty aliphaticcompounds, chlorides, nitrites, and iron are thew main interfering radicals.
APPARATUS:
1. Reflux apparatus consisting of a flat bottom 250 to 500 ml capacity flask withground glass joint and a condensor with 24/40 joints.
2. Burner or hot plate.
REAGENT:
1. Standard potassium dichromate 0.25 N2. Sulphuric acid reagent3. Standard Ferriousammonium sulphate O.lN4. Ferroin indicator5. HgS04 : Analytical grade
PROCEDURE:
l. Place 0.4 g HgS04 in a reflux flask2. Add 20ml sample or an aliquot of sample diluted to 20ml with distilled water. .
Mix well.3. Add pumic acid or glass beads followed byt 10ml Std. K2Cr207 .4. Add slowly 30ml H2S04 containing AgS04 mixing throughly. This slow
addition along with swirling prevents fatty acids to escape out due to hightemperature.
5. Mix well. If the colour turns green either take fresh sample with lesser aliquotor add more dichromate and acid.

174
J
9.10.
Connect the flask to condenser. Mix the contents before heating becauseimproper mixing will result in bumping and sample may be blown out.Reflux for a minimum of 2hrs. Cool and then wash down the condenser with,distilled water.Dilute top about 150 ml , cool and titrate excess K2Cr207 with O.IN(NH4) 2 S04 using ferroin indicator. Sharp colour change from blue greento wine red indicates end point or completion of the titration.Reflux blank in the same manner using distilled water instead of sample.Calculate COD from the following equation:
J
6.
7.
8.
(a--b) x 8000COD mg/I =
ml sampleWhere a = ml Fe (NH4h (S04) 2 for blank
b = ml" " " for sampleN = normality of Fe (NH4) 2 (S04h
Note: For standarisation of ferrous ammonium sulphate, use 10.0 ml Std. K2Cr207 ,acidify by adding 10.0 ml H2SO4 and titrate with Ferrous Am. Sulphate to bestandardised using ferroin indicator. Calculate: N by N 1 V 1 = N2 V2·
4. Hardness
Hardness in water causes scale formation in boilers . It is also objectional fromview point of water use for laundry and domestic purposes since it consumes a largerquantity of soap. Generally, salts of Ca and Mg contribute hardness to natural waters.Hardness may be classified either as (1) carbonates and non-carbonates or (2) calciumand magnesium hardness or temporary and permanent hardness.
Principle:
In alkaline condition EDT A reacts with Ca and Mg to form a soluble chealatedcomplex. Ca and Mg ions develop wine red colour with erichrome black "T" underalkaline condition. When EDT A . is added as a titrant the Ca and Mg divalent ionsget complexed resulting in sharp change from wine red to blue which indicates endpoint of the titration. The pH for this titration has to be maintained at 10 ± O.1 . At ahigher pH , ie. about 12.0 Mg ion precipitates and only Ca ion remains in solution. Atthis pH Murex indicator form a pink colour with Ca!". when EDTA is added Ca++gets complexed resulting in a change from pink to purple which indicates end point ofthe reaction. Metal ions do interfere but can be overcome by addition of inhibitors.
Reagents:1. Buffer Solution2. Inhibitor3. Eriochrome black "T"

175
4. Murex indicator5. Sodium hydroxide 2N6. Standard EDTA solution O.OlM7. Standard Calcium solution
PROCEDUREA. Total Hardness
Take 25ml or 50 ml well mixed sample in porcelaine dish or conical flask. Add1-2 ml buffer solution followed by 1ml inhibitor. Add a pinch of Eriochrome black "T"and titrate with standard EDT A ( 0.01M) till wine red colour changes to blue. Notedown the Vol. of EDTA required (A). Run a reagent blank if buffer is not checkedproperly. Note the Volume ofEDTA or Ca required by blank (B). Calculate Vol. ofEDTA required by sample, C= (A±B) from volume ofEDTA required in (A &B).Calculate as follows:Total hardness mg/l as CxDx1000
CaC03 = ----------------mlofsample
Where C= Vol. ofEDTA required by the sample, D= mg of CaCOr per 1.0ml EDTAO.01M used as titrant.
B. Calcium Hardness
Take 25ml or 30 ml sample in a porcelain dish. add 1ml NAOH to raise the pH. to 12.0 and a pinch of indicator. titrate with EDTA till pink colour changes to purple.Note the Vol. ofEDTA used (A' ).Calculate as follows:
Calcium hardness mg/l as A' x D X 1000CaC03= ----------------
ml sampleWhere A' = Vol. ofEDTA used by sample
D = mg CaC03 per 1.0 ml ofEDTA used for titrationMagnesium hardness= Total hardness - Ca hardness
5. ALKALINITY
Hydroxides, Carbonates and bicarbonates contribute alakalinity to a liquid.Alkalinity values provide guidance in applying proper doses of chemicals in water andwaste water treatment processes, particularly in coagulation, softening and operationalcontrol of anerobic digestion.

176
PRINCIPLES
Alkalinity can be obtained by neutralising OH, C03 and HC03 with standardH2S04. Titration to pH 8.3 or de-colourization of Phenolpthalein indicator will showcomplete neutralization of OH and 1/2 of C03 while to pH 4.4 or sharp chang fromyellow to pink of methyl orange indicator will indicate total alakalinity i.e., OH, C03,
and HC03.
Interferences
Colour, turbidity, iron, aluminium, and residual chlorine are prime sources ofinterferences. Colour and turbidity can be avoided using potentiometeric titrations andresidual chlorine can be removed by adding thiosulphate.
REAGENTS:
1. Standard H2S04 O.02N2. Phenolpthalein indicator3. Methyl Orange indicator
PROCEDURE:
Take 25 or 50ml sample in a conical flask and add 2-3 drops of phenolpthaleianindicator. If pink colour develops titrate with 0.02N H2S04 till it disappears or pH isabout 8.3. Note the volume ofH2S04 required. (A) Add 2-3 drops of methyl orangeto the same flask and continue titration till pH comes down to 4.4 or orange colourchanges to pink. Note the vol. of H2S04 added (B) In case pink colour does notappear after addition of phenolpthaleian continue as in 3 above. Calculate Total (T) ,Phenolpthaleian (P) and methyl orange (MO) alkalinity as follows and express in mg/las CaC03:
P-- alkalinity, mg/l as CaC03= AxlOOOI ml sample. Mo-- alakalinity , mg/l as CaC03 =
B x 1000lml sample. T-- alkalinity, mg/l as CaC03 = (A+B) x 10001 ml sample.
6. CHLORIDE:
Chlorides occur widely in water and waste waters and are usually associatedwith Na ion. Although chlorides are not harmful, concentrations beyond 250mg/1impart a peculiar taste to water rendering in unacceptable from aesthetic point of viewfor drinking purpose. Presence of chlorides above the usual background concentrationin a water source is also used as an indicator of pollution by domestic sewage.

177
PRINCIPLE:
Chloride ion is determined by titration with standard AgN03 in which AgCIprecipitates out. The end point is indicated by formation of red silver chromate fromexcess AgN03 and potassium chromate used as an indicator in netural to slightlyalkaline solution.
INTERFERENCE
Bromide, iodide, cyanide, sulfide, thiosulphate, sulfite, Iron, phosphate areprime sources of interferences.
REAGENTS:
1. Potassium Chromate Indicator.2. Silver Nitrate 0.0141N3. Sodium Chloride 0.0141 N4. Special reagent to remove color and turbidity: Dissolve 125 g. Alk(S04)2.
12 H20 or AlNH4 (S04)2 .12 H20 and dilute to 100 ml . Warm to 600C andadd 55ml cone. NH40H slowly. Allow to stand for lhr., Solution should befree from Chloride.
PROCEDURE:
Take 100ml sample and add 3ml special reagent. Mix well and allow to settle.Filter the supernatant for titration purpose. To the sample containing sulphite, addabout 1ml H202 after neutralization. In case of sulphide or thiosulphate is present raisethe pH of the sample to 8.3 or , more, add H202 lml, and then again neutralize thesample. Adjust the pH of the sample between 7.0 and 8.0 Take 50 ml well mixedsample adjusting to pH 7.0- 8.0 and add l.Oml K2Cr04 . Titrate with standard AgN03solution till AgCr04 starts precipating . Standarise AgN03 against Std. NaC!. Forbetter accuracy titrate distilled water (50) ml in the same way to establish reagentblank. Calculate as Follows:
(A-B) N x 35450Cl mg/l =
m!. sample
where A = ml AgN03 for sampleB= " " BlankN= Normality of AgN03 used.

178I
- II
•...•.
7. TURBIDITY.J
Suspension of particles in water with passage of light is called turbidity. Themethod is based on a comparison of the intensity of light scattered by a sample and astandard reference under same conditions. Higher the intensity of scattered light higherthe turbidity. Colour is the main sources of interferences in the measurement ofturbidity.
APPARATUS:
1. Turbidification or Klett Summerson meter at 690 mu providing 1cm light path.2. Nessleres tube, capacity 100ml.
REAGENTS
1. Strong Acid reagent2. Sodium hydroxide 3N.3. Phenolpthaleian indicator.4. Ammonium molybdate5. l-Amino 2-napthol 4 - sulphonic acid (ANSA)6. Stanous Chloride
PROCEDURE:
Prepare the caliberation curve in the range 0 - 400 unit by carrying outappropriate dilutions of solutions 3 and 4 above and taking readings on turbiditimeter.Take sample or suitably diluted aliquot and determine its turbidity either by visualcomparison with the diluted standards or by reading on turbiditimeter. Read turbidityfrom the standard curves and apply correction due to dilution, if necessary. Report thereadings in turbidity unit.
8. Orthophosphates:
Presence of phosphates in water analysis has a great significance . Phosphorousin small concentrations are used in water supplies to reduce scale formation. , toincrease carrying capacity of mains, to avoid corrosion in water mains, to remove Feanfd Mn in micro quantities and in coagulation especially in acid conditions . Thepresence of P04 in large quanties in fresh waters indicates pollution through sewage/or industrial wastes. It promotes growth of nuisance causing microorganisms. ThoughP04 poses problems in surface waters, its presence is necessary for biologicaldegradation of wastewater

179
PRINCIPLE:
Under the condition soluble P04 react with ammonium molybdate and producemolybdo phosphoric acid, which in turn, gets reduced to molybdenum blue afteradditions of a reducing agent such as NASA or Stanous Chloride. Colour developed isdirectly proportional to P04 concentration. Stanous chloride is more suitable for lowerphosphate concentrations.
REAGENTS:
1. Sulphuric acid (50%)2. Ammonium Molybdate (10%)3. Acid molybdate reagent4. Stanous Chloride solution5. Standard phosphate solution
PROCEDURE:
Place 5. ml of the sample in a Nesslers tube, add 2 ml of acid am. molybdatereagent and mix by gentle stirring, add 2 drops of stanous chloride, mix gently, waitfor five minutes and match the blue colour developed with standards prepared inphosphate free distilled water similarly as for nitrate.No. of standard phosphate x 0.01 x 20 = ppm ofP.
This can also be measured at 690 mu and 1 cm light path in a spectrophotometer.. Prepare standard graph using P04 solution in the range of 5--30 mg/l
- .9. NITROGEN:
Nitrogen estimation is of significance in sanitary engg. practices in manyrespects. Prior to introduction of bacteriological analysis procedures, determinations ofvarious forms of nitrogen in waters was done to asses its quality. Presence of organicand ammonia nitrogen (also called total nitrogen) is accepted as a chemical evidence ofrecent organic pollution, particularly of animal origin. On the other hand, presence ofthe oxidised form , nitrites and nitrates , indicates remote pollution. Nitrifiucation ofsewage nitrogen when it is treated in a sewage treatment plant may also be taken as anindex of degree of treatment. Ammonia above a certain level is toxic to fish life insurface water. Nitrates in drinking water has been reported to be the cause ofmethemaglobinemia. Presence of nitrogen in appropriate amount in waste water isnecessary for its treatment through biological processes. A knowledge of nitrogen inwastewater is important when it is used as irrigant.

180
Ammonia nitrogen
Ammonia produces a yellow colour compound when reacted with alkalineNessler reagent, provided the sample is clarified properly. Colour, turbidity, Ca, Mg,salts and Fe inthe sample constitutes the prime sources of interferences.
APPARATUS
1. Spectrophometer having a range of 300-700 mu.2. Nesslers tubes or 100 ml capacity volumetric flasks.
REAGENTS
1. Zinc Sulphate2. Sodium Hydroxide (6N)3. EDTA4. Rochelle salt solution5. Nesslers reagent6. Standard am. solution.
Procedure
Take 100 ml of sample. Add 1ml ZnS04 solution. and 0.4 ml NaOH to obtain apH of 10.5. Allow to settle and filter the supernatant through 42 No. What man filterpaper. Take a suitable aliquot of sample and dilute to 50 ml. Add 3 drops of Rochellesalt solution or Idrop ofEDTA, mix well. Add 2ml Nesslers reagent ifEDTA is usedor 1ml if Rochelle salt solution is used. Make up to 100ml Mix well and read %transmission after 10 min. at 410 mu or blue filter (42) , using a blank prepared in thesame way using distilled water instead of sample. Prepare a calibration curveusingsuitable aliquots of standard solution in the range of 5 to 120 ug/ 100ml for references
. following the same procedure as 1 to 5 but using the standard solution in place ofsample.
NITRATES:
Principle: Nitrates reacts with phenol disulphonic acid and produces a nitro-deratives which in alkaline solution develops yellow color due to rearrangement of itsstructure. The color produced follows BEER's Law and its proportional to theconcentration of N03 present in the sample. Chlorides and nitrites are the two mainsources of interferences. Pretreatment of sample is necessary when the interferingradicals are present.
APPARATUS
1. Colorimeter or Spectrophotometer having a range of 300-700 mu2. Nesselers tube cap. 100 ml3. Beakers Cap 100 ml.

181
REAGENTS
1. Phenol- disulphonic acid (PDA)2. Sod. hydroxide 12 N3. Stock Nitrate Solution4. Standard Nitrate solution.(KN03)
5. 0 AI. sulphate (10%)
PROCEDURE
Evaporate to dryness 50 ml of the sample in a white porcelain basin on waterbath. Cool and add 2ml of phenol disulphonic acid drop by drop and rub it throughlywith a glass rod. Wait for about 5 minutes and add 2 ml of aluminium sulphate solution.Now add 12 N NAOH solution slowly with stirring until it is alkaline. If nitrate ispresent a yellow colour will appear. Remove aluminium hydroxide by filterationProceed similarly with standard nitrate solution as for ammonia determination.
NO. ofml of standard solution requires X 0.001 X 20= ppm Nitrate --N.
10. pH
pH is the negative logarithm of hydrogen actrvity more commonly,concentration, for dilute solution. For measurement of pH, a glass electrode is usedalong with a calomel reference electrode. Glass is an ion exchange material withpreference for H- ions. Hydrogen ions are adsorbed on one surface and the possitivecharge of these are transmitted through the glass by Na+ ion displacement. Hydrogenions are desorbed on the other side. Therefore, a glass is a membrane specific forhydrogfen ions. The glass electrode consists of a glass bulb with dilute hydrochloricacid connected to the internal circuit through Ag-AgCl.
PRINCIPLE:
Nernst equation governing the effect of concentration of ions and formation ofsingle electrode potential across the glass membrane is the basic concept of the pHmeasurement.
PROCEDURE:
Switch on the instrument and wait for few minutes till it warms up. Set thepointer of the meter to Zero by turning "set zero control". Take buffer solution ofknown pH in a clean beaker. Immerse the electrodes in the solution to a depth of oneinch. Measure the temperature of solution by thermometer and adjust temperature. Putthe selector switch to proper pH range and set the pointer to the known pH of thebuffer by turning "Set buffer control". Now standardization is done. Put back theselector to zero and check once again with buffer. Wash the electrode by distilled

182
water and wip with tissue paper. Take unknown solution in a clean beaker and immersethe electrode in the sample. Put the selector to expected pH range and read the pHValue indicated by the pointer. Put back selector to zero position. Remove electrodes,wash with distilled water and leave at zero set. Electrodes should be always immersedin distilled water. pH meter can be used for finding out end points of acidimetry,precipitation and titrations.
2) Colorimetric methods:
The principle of colorimetric estimations of pH is to develop color in thesample with an indicator dye and to compare this with colour of glass discs, colorcharts or coloured buff ere solutions. The indicators used with range of pH are givenbelow:
INDICATOR pH range
Bromo-phenol blue 3.0 - 4.6
Bromo cresol green 3.8 - 5.4
Bromo cresol purple 5.2 - 6.8
Bromo thymol blue 6.0 - 7.6
Phenol red 6.8 - 8.4
Cresol red 7.2 - 8.8
Thymol blue 8.0 - 9.6
Place 10 ml of the sample in a small clear glass tube and add 0.5 ml ofindicator. To know which of the above indicators is to be used a preparatory test withUniversal indicator may be done which gives a very approximate value of the pH ;otherwise phenol red would be used first and then if necessary indicators of higher orlower ranges. For using these types of discs Lovibond pH comparator is required.
11. SPECIFIC CONDUCTIVITY
Specific conductivity offers a quick and convenient method for determinationof the dissolved salts in water collectively., the conductance of an electrolytes insolution being almost directly proportional to the ionic strength of that solution and thetotal conductance is equal to the sum of the several conductivities resulting from thevarious ionisable salts present.

183
PROCEDURE:
Specific conductivity is generally determined by a Conductivity meter. About50 ml of the sample is taken in a beaker and the electrode is dipped into the sample.The switch to the reading mode will indicate conductivity of the sample in m-mhos/cmat a particular temperature.
12.· SILICATE:
Silicate in water can be determined easily by colorometric methoids usingartificial standards.
REAGENTS:
1. Standard picric acid solution2. 10% Am. Molybdate solution3. 25% sulphuric acid ( by volume)
PROCEDURE:
Take 50ml of sample in a Nesslers tube add 2 ml Am. molybdate solution and0.5 m125% H2S04 . Stir and allow to stand for 10 minutes. Match the color of thesample and the standard following the usual procedures
NO. ofml of standard X 0.001 X 20 = mg Si per litre.
13. DISSOLVED FREE CARBON- Di-OXIDE:
As this is likely to escape easily from the sample , analysis should be doneimmediately after collecttion on the site.
REAGENT:
1. N/44 NaOH2. Phenolpthelaine indicator
PROCEDURE:
Take 50 ml of the sample in a nesslers tube add two drops of Phenolpthaleinindicator. If the water turns pink, there is no free carbon-di-oxide When the waterremains colour less add N/44 NaOH drop wise from a 10 ml graduated pipette with avery gentle stirring with a glass rod till the color turns pink.
NO. ofml ofN/44 NaOH required X 20 = ppm of free C02.

184
lit. CALCIUM AND MAGNESIUM:
The total alkalinity of water gives a fair idea of its Calcium and Magnesiumcontents but those can be determined accurately. by Versenate method.
REAGENTS:
1.Standard Sodium Versenate2. Indicator for Calcium and Magnesium (Erichrome Black 'T'+Na2C03 + Iso-propyl alcohol3. Indicator for calcium (solid) Am. purpurate+ NaCI4. N --NaOH5. Buffer solution6. Standard Ca++ solution (Stock)
Procedure:
A standard end point is first prepared by diluting 10 ml of standard stocksolution ofCa++ solution to 100 rnl with distilled wateradding 2 ml N NaOH and 0.2gm Calcium indicator to which 5 ml of Versenate solution is slowly added from apippete so that the indicator assumes the end point color. 100rnl of the unknownsample is now treated in the same way except that the addition of versenate iscontinued untill the tint of the unknown solution matches with that of thew standardprepared.
NO. of ml of versenate required = ppm of Ca++
2. Calcium +Magnesium :
100 ml of the water sample is slightly acidified with 0.01 N HCI equivalent tothe alkalinity and boiled 0.5 rnl of buffer solution is added and about 5 drops of
. Erichrome black "T" indicator. The sample is then titrated with standard versenatesolution.
(NO. ofrnl ofversenate required for Ca+ Mg-- No. ofrnl ofversenate required for Ca)X 0.61 = ppm of Mg.
t.r. DETERMINATION OF PRIMARY PRODUCTIVITY:
1. By measuring carbon assimilation using radio isotope C14
(a) selection of glass bottles of exactly same transparency.
One set of bottled made dark either by painting with black or preferablywrapping them completely with black tape or placing them inside small black plasticbags.
--------------------------------- -- ---

185
(b) Clamping of the glass stopper with a spring clip arrangement.
Care should be taken that under no circumstances the content of the bottle~ ,radioactive material should be leak through loose stoppers.
(c) Construction of the float to suspend the bottles in water for' in situ' experiments.
(d) Collection of water from different depths., treatments with NaHC03 -Na2C03solution containing C14 and replacement at the same depths.
In order that the whole of the eutrophic zone is covered, a predetermination of thelight inttensities at different depths is necessary.
The water is placed in bottles, 3 light bottles and 2 dark bottles treated withdiluted NaHC03 -Na2C03 solution containing C14 are replaced at the same depths by
tying them to the chords attached to the floats. The C14 ampoules generallly have aspecific activity of about 4 uc which may be too strong. So a dilution to one tenth thestrength is done just before treatment. For this it is necessary to have dilution waterhaving the same carbon - content (determined by alkalinity estimation and adjusting todesired strength). Nine ml of this dilution is placed in a stoppered glass bottle, the C14ampoule is broken and the content poured into it, taking all precautions that arenecessary for handling radio active materials. It is mixed throughly and the desiredquantity is taken out by an automatic pipette ( In no case succking should beattempted). After treatment with C14 and replacement of the bottle to respectivedepths, they are incubated for five hours generally from 7.0 hrs to 12 hrs. The bottlesare now taken out, immediately fixed with formaline and taken to laboratory forfilterattion. Filteration should be should be started immediately as otherwise theplankton may disintigrate and pass through filters. Filtering is done with 'millipore'filters HA. type with detachable tower type glass or perspex filters having suction
. arrangement. It is preferable to have the filteration done under a uniform suction of 0.3atmosphere. Aftere washing with water of the same environment and finally with dilutehydrochloric acid , the filters with the residue are removed to desiccators and dried.The filters thus processesd to a Radio Tracer Laboratory for estimating the activity ofC14 in them.
2. By measuring oxygen produced in photosynthesis using light and dark bottletechnique
This method is followed side by side with C14 technique for comparing resultsand can be followed in places where facilities for more precise technique with C14 arenot available. The experimental procedures are just the same as for C14 techniqueexcepting that the treatment with C14 solution omitted. Initial concentration of the DOof the dark and light bottles may be determined for an understanding of the respirationeffect though they may not figure in the final calculation.The method consists of taking water samples, containing a neutral plankton populationin glass bottles and exposing the bottles to light in the eutrophic zone . In a parellel
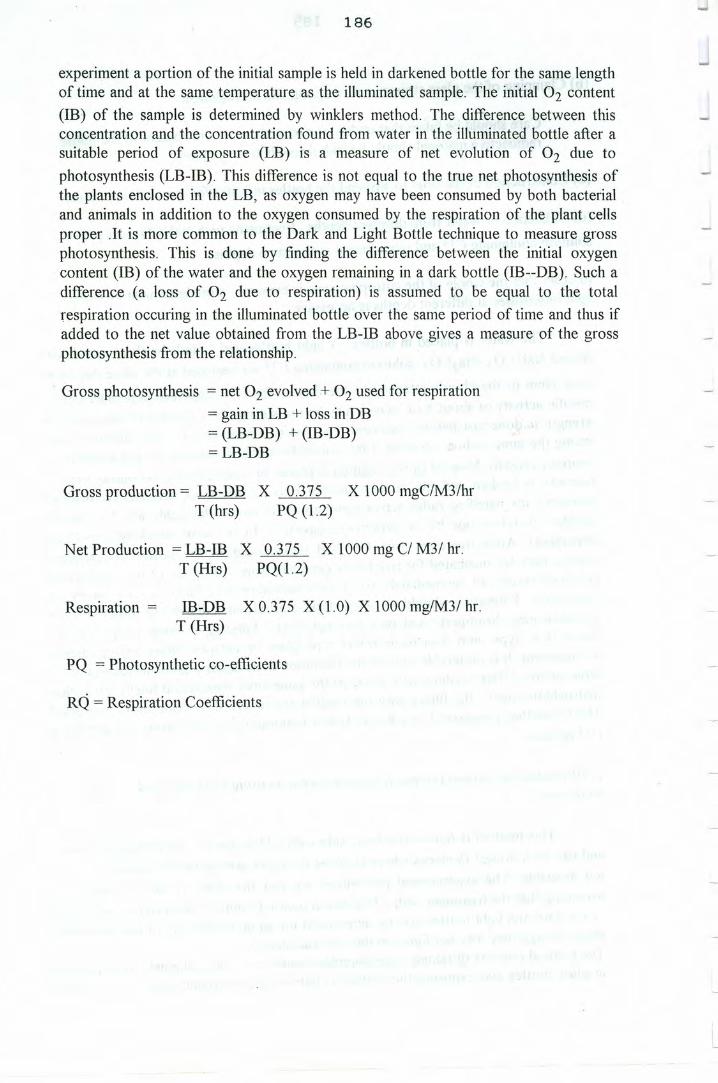
-186
experiment a portion of the initial sample is held in darkened bottle for the same lengthof time and at the same temperature as the illuminated sample. The initial 02 content(ID) of the sample is determined by winklers method. The difference between thisconcentration and the concentration found from water in the illuminated bottle after asuitable period of exposure (LB) is a measure of net evolution of 02 due tophotosynthesis (LB-IB). This difference is not equal to the true net photosynthesis ofthe plants enclosed in the LB, as oxygen may have been consumed by both bacterialand animals in addition to the oxygen consumed by the respiration of the plant cellsproper .It is more common to the Dark and Light Bottle technique to measure grossphotosynthesis. This is done by finding the difference between the initial oxygencontent (IB) of the water and the oxygen remaining in a dark bottle (IB--DB). Such adifference (a loss of 02 due to respiration) is assumed to be equal to the totalrespiration occuring in the illuminated bottle over the same period of time and thus ifadded to the net value obtained from the LB-IB above gives a measure of the grossphotosynthesis from the relationship.
Gross photosynthesis = net 02 evolved + 02 used for respiration= gain in LB + loss in DB= (LB-DB) + (IB-DB)=LB-DB
Gross production = LB-DB X 0.375 X 1000 mgC/M3/hrT (hrs) PQ (1.2)
Net Production = LB-IB X 0.375 X 1000 mg Cl M31 hr.T (Hrs) PQ(l.2)
Respiration = IB-DB X 0.375 X (l.0) X 1000 mg!M31 hr.T (Hrs)
PQ = Photosynthetic co-efficients
RQ = Respiration Coefficients
)