CEBoK Module 15 Earned Value Management (EVM)
143
© 2002-2013 ICEAA. All rights reserved. v1.2 Unit V - Module 15 1 Dumb and Dumber, http://www.imdb.com/title/tt0109686/ . Earned Value Management (EVM) Tracking cost and schedule performance on projects “What are my chances?” / “Not good.” / “You mean, not good like one out of a hundred?” / “I’d say more like one out of a million.” / … “So you’re telling me there’s a chance!” - Jim Carrey as Lloyd Christmas to Lauren Holly as Mary Swanson Presented at the 2017 ICEAA Professional Development & Training Workshop www.iceaaonline.com/portland2017
-
Upload
khangminh22 -
Category
Documents
-
view
0 -
download
0
Transcript of CEBoK Module 15 Earned Value Management (EVM)

© 2002-2013 ICEAA. All rights reserved.
v1.2
Unit V - Module 15 1
Dumb and Dumber, http://www.imdb.com/title/tt0109686/.
Earned Value Management
(EVM)
Tracking cost and schedule performance on projects
“What are my chances?” / “Not good.” / “You mean, not good like one
out of a hundred?” / “I’d say more like one out of a million.” / … “So
you’re telling me there’s a chance!”
- Jim Carrey as Lloyd Christmas to Lauren Holly as Mary Swanson
Presented at the 2017 ICEAA Professional Development & Training Workshop www.iceaaonline.com/portland2017
© 2002-2013 ICEAA. All rights reserved.
v1.2
Acknowledgments• ICEAA is indebted to TASC, Inc., for the
development and maintenance of the
Cost Estimating Body of Knowledge (CEBoK®)
– ICEAA is also indebted to Technomics, Inc., for the
independent review and maintenance of CEBoK®
• ICEAA is also indebted to the following individuals who have made
significant contributions to the development, review, and maintenance of
CostPROF and CEBoK ®
• Module 15 Earned Value Management (EVM)
– Lead authors: Jennifer M. Rose, Maureen L. Tedford
– Senior reviewers: Richard L. Coleman, Brian L. Octeau, Fred K. Blackburn,
Colleen M. Craig
– Managing editor: Peter J. Braxton
2Unit V - Module 15
Presented at the 2017 ICEAA Professional Development & Training Workshop www.iceaaonline.com/portland2017

© 2002-2013 ICEAA. All rights reserved.
v1.2
Unit V - Module 15 3
Unit Index
Unit I – Cost Estimating
Unit II – Cost Analysis Techniques
Unit III – Analytical Methods
Unit IV – Specialized Costing
Unit V – Management Applications
13.Economic Analysis
14.Contract Pricing
15.Earned Value Management (EVM)
16.Cost Management
Presented at the 2017 ICEAA Professional Development & Training Workshop www.iceaaonline.com/portland2017

© 2002-2013 ICEAA. All rights reserved.
v1.2
Unit V - Module 15 4
EVM Overview• Key Ideas
– Integrated baseline• Resource-loaded schedule
– Earned value• Objective progressing
– Extrapolation from Actuals
– Cost and schedule performance
• Practical Applications– EACs – risk-adjusted rollups
– EACs – alternative formulae
– Performance measurement• Contract vs. technical
• Analytical Constructs– AC (Actual Cost) = actuals to
date
– EV (Earned Value) = value of work performed
– PV (Planned Value) = budget
– EAC = AC + (BAC-EV)/PI
• Related Topics– Risk Management
– Project Management
– Schedule Analysis / Risk
Tip: This formula, while intuitive, may not be the
best predictor of EAC!BCWR
Presented at the 2017 ICEAA Professional Development & Training Workshop www.iceaaonline.com/portland2017

© 2002-2013 ICEAA. All rights reserved.
v1.2
Unit V - Module 15 5
0.0
500.0
1000.0
1500.0
2000.0
2500.0
3000.0
Fe
b
Ap
r
Ju
n
Au
g
Oct
De
c
Fe
b
Ap
r
Ju
n
Au
g
Management Reserve
CBB
PMB
BCWS
ACWP
BCWP
Cost Variance
Schedule
Variance
VAC
EAC or LRE
BAC
Schedule Delay
EVM within the
Cost Estimating Framework
PastUnderstanding your
historical data
PresentDeveloping
estimating tools
FutureEstimating the new
system
Earned Value
data elements
Estimate At
Complete (EAC)
formulae
EAC and
Predicted
Schedule
0.0
500.0
1000.0
1500.0
2000.0
2500.0
3000.0
Fe
b
Ap
r
Ju
n
Au
g
Oct
De
c
Fe
b
Ap
r
Ju
n
Au
g
Management ReserveCBB
PMB
BCWS
ACWP
BCWP
Cost Variance
Schedule
Variance
Presented at the 2017 ICEAA Professional Development & Training Workshop www.iceaaonline.com/portland2017

© 2002-2013 ICEAA. All rights reserved.
v1.2
Unit V - Module 15 6
EVM and Cost Estimating
• How should Cost Estimators be involved in EVM?
• Verify Realistic Baselines
– Control Accounts that trace to BOEs
– Cost Estimator participation in IBRs
• Develop Accurate EACs
– Statistical and risk-based methods
• Gather Cost Data to Support Estimating
– IPMR and other EV data serve as data sources for estimating analogous efforts
20
Presented at the 2017 ICEAA Professional Development & Training Workshop www.iceaaonline.com/portland2017

© 2002-2013 ICEAA. All rights reserved.
v1.2
Unit V - Module 15 7
EVM Outline
• Core Knowledge
– Introduction to Earned Value
– Earned Value Management (EVM)
Components
– Earned Value Analysis
• Summary
• Resources
• Related and Advanced Topics
Presented at the 2017 ICEAA Professional Development & Training Workshop www.iceaaonline.com/portland2017

© 2002-2013 ICEAA. All rights reserved.
v1.2
Unit V - Module 15 8
Introduction to Earned Value
• EVM Objectives
• The EVM Bottom Line and Benefits
• EVM Not Universally Right
• EVM Guidance and Contract
Requirements
Presented at the 2017 ICEAA Professional Development & Training Workshop www.iceaaonline.com/portland2017

© 2002-2013 ICEAA. All rights reserved.
v1.2
Unit V - Module 15 9
• Earned Value Management (EVM) integrates Technical Scope, Schedule, and Cost for definitized contract work
• Earned Value Management System (EVMS)– Planning tool– Reporting tool– Analysis and Decision Making tool
• Provides for integrated management of program planning and execution, which can enable…– Accomplishment of Technical Scope within Cost and
Schedule parameters– Reduced or Eliminated Schedule Delay– Reduced or Eliminated Cost Overrun
EVM Objectives
15
What?
Presented at the 2017 ICEAA Professional Development & Training Workshop www.iceaaonline.com/portland2017

© 2002-2013 ICEAA. All rights reserved.
v1.2
Unit V - Module 15 10
The EVM Bottom Line
• Yeah, yeah…“integrated management” is great, but costs $$. Why should I really do it?– The cost avoidance window of opportunity is
BEFORE contract is 15% complete
– According to a study of more than 700 major DoD programs, percent overrun at completion will be within 10% of percent overrun at 20% complete
– If you can’t plan the near-term work well, you won’t plan the far term work any better
• EVM requires all work on contract to be planned before beginning– Can provide early insight into areas of concern
and opportunity
“Cost Performance Index Stability,” David S. Christensen and Scott Heise, National Contract Management Journal, 1993
Why?
Presented at the 2017 ICEAA Professional Development & Training Workshop www.iceaaonline.com/portland2017
© 2002-2013 ICEAA. All rights reserved.
v1.2
Unit V - Module 15 11
Key EVM Benefits
• Imposes discipline on resource planning process through the development of work and planning packages
• Provides disciplined, standardized approach to measurement and terminology
• Ties cost and schedule performance to technical accomplishment of work
• Provides objective analysis of performance
1
Presented at the 2017 ICEAA Professional Development & Training Workshop www.iceaaonline.com/portland2017

© 2002-2013 ICEAA. All rights reserved.
v1.2
Unit V - Module 15 12
Basic EVM Example
• Managing projects without earned value provides only part of the picture
• Traditional approach:
– Budget work
– Record Actual expenses
• Example:
– Budgeted for 4 Aquaria to be built in November at $100 each
– At end of November, spent $300
– Great! I am $100 under budget…or am I?
Presented at the 2017 ICEAA Professional Development & Training Workshop www.iceaaonline.com/portland2017

© 2002-2013 ICEAA. All rights reserved.
v1.2
Unit V - Module 15 13
Basic EVM Example
• Example (continued):
– Did I accomplish $400 worth of work while
spending only $300?
– Earned value adds a new dimension – what
is the VALUE of work accomplished
Budget vs Actual Variance
$400 $300 $100
Earned
Value
Presented at the 2017 ICEAA Professional Development & Training Workshop www.iceaaonline.com/portland2017

© 2002-2013 ICEAA. All rights reserved.
v1.2
Unit V - Module 15 14
Basic EVM Example
• Example (continued):
– At the end of November I spent $300 but
only completed 2 Aquaria
Earned CostBudget Value Actual Variance
$400 $200 $300 - $100
– So I am not only overrunning Cost, I am
also behind schedule!
Presented at the 2017 ICEAA Professional Development & Training Workshop www.iceaaonline.com/portland2017

© 2002-2013 ICEAA. All rights reserved.
v1.2
EVM Not Universally Right
• EVM costs time and money to implement
• EVM is not the best management tool for all projects
• EVM is best suited/most beneficial for projects with:– Defined deliverables/products
– Longer durations• Guidance varies by organization
• Due to set up time required
– Strict budget limits or Firm Fixed Price (FFP) contracts
– A single contract encompassing all or most of the effort• Few to no interfaces with or dependence on efforts contracted separately
• EVM less suited for projects with:– Difficult to define or open-ended objectives
– Shorter durations
– Level of Effort (LOE) support hours as the primary deliverable
Unit V - Module 15 15
EVM is required on DoD and
other government contracts
above a certain threshold
When?
Presented at the 2017 ICEAA Professional Development & Training Workshop www.iceaaonline.com/portland2017

© 2002-2013 ICEAA. All rights reserved.
v1.2
Earned Value and the Acquisition Program, Prof Roberta Tomasini, DAU, 2008
Unit V - Module 15 16
EVM Guidance
Policy Updated June 2012
Cost Reimbursement & Incentive Contracts
(EVM on FFP, LOE & T&M Contracts Discouraged)
0
Contract Type
Contract Value (Then Year $M)
EVM System
Requirements
EVM Data
Requirements
Acquisition
FundingN
o M
an
dato
ry R
eq
uir
em
en
ts
20 50
Conformance with
ANSI / EIA 748
Formal EVMS
validation not required
Contract Performance Report
(DI-MGMT-81466) (Tailored)
Dollar thresholds are the same for all budget appropriation categories.
Color of money is no longer an EVM discriminator.
Integrated Master Schedule
(DI-MGMT-81650) (Tailored)
Conformance with
ANSI / EIA 748
Formal EVMS
validation required
Contract Performance Report
(DI-MGMT-81466) (5 formats)
Integrated Master Schedule
(DI-MGMT- 81650)
Risk
Based
Decision
How?
Integrated Program Management
Report (DI-MGMT-81861)Integrated Program Management
Report (DI-MGMT-81861)
Pre
7/1
/2012
Po
st
7/1
/20
12
Presented at the 2017 ICEAA Professional Development & Training Workshop www.iceaaonline.com/portland2017

© 2002-2013 ICEAA. All rights reserved.
v1.2
EVM Contract Requirements
Unit V - Module 15 17
$20M
$50M
Contracts >= $20M, but < $50M
EVMS must comply with guidelines in American
National Standards Institute/Electronic Industries
Alliance Standard 748, Earned Value Management
Systems (ANSI/EIA-748).
Formats 1, 5 – 7 mandatory, 2 – 4 optional
Contracts < $20M
Application of EVMS is optional
Contracts > =$50M
EVMS must be determined ANSI/EIA-748 compliant
by Cognizant Federal Agency
All formats mandatory
• Per DFARS 252.234 and the DoD IPMR
Implementation Guide, EVMS is required for cost and
incentive contracts and subcontracts as follows:
Note: EVMS is less
frequently used on
Firm-Fixed Price, Level
of Effort, and Time &
Material efforts
regardless of cost, as
well as short duration
contracts (e.g., < 1 yr)
NEW!
Presented at the 2017 ICEAA Professional Development & Training Workshop www.iceaaonline.com/portland2017

© 2002-2013 ICEAA. All rights reserved.
v1.2
Unit V - Module 15 18
EVM within the Acquisition Process
GOVERNMENT
PROVIDER
ACQUISITIONSTRATEGY
DEVELOPRFP
PROPOSAL
MGT VOLUME
TECH VOLUME
COST VOLUME
DEVELOP
NEGOTIATIONSOURCE SELECTION
AWARD PROJECT
ASSIGN BUDGETS
ASSESS RISK
DEVELOP MR
ESTABLISH Perf Meas. BASELINE
14
Program Execution
& Performance
Measurement
STATUSREPORTS
Earned Value and the Acquisition Program, Prof Roberta Tomasini, DAU, 2008
Presented at the 2017 ICEAA Professional Development & Training Workshop www.iceaaonline.com/portland2017
© 2002-2013 ICEAA. All rights reserved.
v1.2
Unit V - Module 15 19
Earned Value Management
(EVM) Components• Integrated Baseline Overview
• Work Breakdown Structure
• Assignment of Work
• Earned Value Data Elements
• Baseline Development
• Performance Measurement
Presented at the 2017 ICEAA Professional Development & Training Workshop www.iceaaonline.com/portland2017

© 2002-2013 ICEAA. All rights reserved.
v1.2
Unit V - Module 15 20
Integrated Baseline Overview
• Key component of EVM is the Resource Loaded Schedule– Elements of the Performance Measurement
Baseline (PMB) defined early in acquisition process by Government and Contractor
• WBS Structure
• Schedule
• BOEs (justification for time phased costs and effort)
– Time-Phased Budget / Resource Loaded Schedule initially defined for proposal and refined/baselined post negotiations
• Government review of PMB occurs via Integrated Baseline Review (IBR)
15
Presented at the 2017 ICEAA Professional Development & Training Workshop www.iceaaonline.com/portland2017

© 2002-2013 ICEAA. All rights reserved.
v1.2
Unit V - Module 15 21
WBS Definition/Overview
• Work Breakdown Structure (WBS): Product-oriented division of material and work tasks
• Used to organize and define product/work to be accomplished
• Different forms:– Program Summary WBS (Government), usually
referred to as WBS
– Contractor WBS, usually referred to as CWBS
– Cost Element Structure (CES)• Level and scope may depend on the underlying data and
methodology used in developing the estimate
– WBS typically several levels higher than CWBS
1
OSD EVM Website: http://www.acq.osd.mil/evm/
Presented at the 2017 ICEAA Professional Development & Training Workshop www.iceaaonline.com/portland2017

© 2002-2013 ICEAA. All rights reserved.
v1.2
Unit V - Module 15 22
WBS Importance to EVM
• WBS provides framework within which all
Earned Value planning is accomplished
• WBS must be:
– Comprehensive
• Matches program content
– Hierarchical
– “Sufficient” level of detail
• Sufficiency depends on size, complexity, risk, and other
factors
• For EVM, level of detail for tracking costs usually lower
than level for reporting costs
Presented at the 2017 ICEAA Professional Development & Training Workshop www.iceaaonline.com/portland2017

© 2002-2013 ICEAA. All rights reserved.
v1.2
Unit V - Module 15 23
WBS Example
• WBS Sample layout for the aquaria example1.0 Aquarium Development Program
1.1 Program Management / Systems Engineering
1.2 Design Aquarium
1.3 Develop/Integrate Aquarium
1.3.1 Material Acquisition
1.3.2 Material Integration
1.3.3 Development Documentation
1.4 Test Aquarium
1.5 Deploy Aquarium
2.0 Aquarium Maintenance Program2.1 Maintain Environment
2.2 Replace Material
2.3 Maintain/replace Fish Population
NOTE: Example
WBS is notcomprehensive or
extensively detailed.
This WBS does not
adhere to
MIL-STD-881C and
therefore needs a
comprehensive WBS
Dictionary.
4
Presented at the 2017 ICEAA Professional Development & Training Workshop www.iceaaonline.com/portland2017

© 2002-2013 ICEAA. All rights reserved.
v1.2
Unit V - Module 15 24
Organizational Breakdown
Structure (OBS) Definition• Functional breakdown of Organization
– Identifies the program’s organizational structure
– Supports the identification of the function
responsible for controlling overhead costs
• Typically aligns with Company’s Org Chart
• One piece of the framework used for planning
resources
• One popular organization technique involved
Integrated Product Teams (IPTs)
– Multi-disciplined
– Overarching IPT and Working-level IPT(s)
16
Defense Acquisition Guidebook,
https://akss.dau.mil/dag/DoD5000.asp?view=document&rf=GuideBook\IG_c10.3.asp.
Presented at the 2017 ICEAA Professional Development & Training Workshop www.iceaaonline.com/portland2017

© 2002-2013 ICEAA. All rights reserved.
v1.2
Unit V - Module 15 25
Assignment of Work –
Control Accounts• WBS cross-walked to OBS Control Accounts
– Identifies Responsibility
– Result is Control Account (sometimes called a Cost Account)
• Control Account is the focal point for integration of scope, cost, and schedule
• Control Account Manager (CAM) is person responsible for:– Developing plan for Control Account (Technical Scope,
Schedule Tasks, Budget/Resources)• Work Authorization Document (WAD)
– Managing Earned Value performance within Control Account• Monitoring EVM metrics
• Analyzing control account performance status
• Reporting variances
– Conducting risk management/mitigation as required
Presented at the 2017 ICEAA Professional Development & Training Workshop www.iceaaonline.com/portland2017

© 2002-2013 ICEAA. All rights reserved.
v1.2
Unit V - Module 15 26
Assignment of Work –
Work Packages• Work Packages are the lowest level at which
resources are allocated
• Within Control Accounts, work and planning packages defined at lowest level of detail– Work packages for near-term work
– Planning packages for far-term work
– Planning packages become more detailed work packages as time progresses
• Resources allocated to each work/planning package– Direct Labor
– Material
– Other Direct Charges (ODCs)
Tip: Typically 4-6
weeks long
Tip: Detail plan
typically 6 months out
Presented at the 2017 ICEAA Professional Development & Training Workshop www.iceaaonline.com/portland2017

© 2002-2013 ICEAA. All rights reserved.
v1.2
Unit V - Module 15 27
Assignment of Work Illustration
Control
Account
Biological Engineering
WorkPackages
PlanningPackages
OBS DATA SUMMARIZATION
AquariumDevelopment
Program
ProgramMgmt/Systems
Engineering
Develop/Integrate Aquarium
MaterialAcquisition
MaterialIntegration
DevelopmentDocument-
ation
Environ-mentalControl
PlantLife
TropicalFish
StructuralIntegration
BiologicalIntegration
IntegrationQualityControl
TropicalEngineering
Hydro Engineering
Aqua-Botanical Engineering
Marketing
FunctionalOrganization
Contract WBSDetailedElements
Contract WBSReportingElements
Program WBSElements
Hardware Engineering
Engineering
Operations
WBS
DATA
SUMMARIZATION
Aquatics Division
Control
Account
Control
Account
Control
Account
Control
Account
Graphic adapted from EVMS Basics Concepts, Sean Alexander, Meridianet
Presented at the 2017 ICEAA Professional Development & Training Workshop www.iceaaonline.com/portland2017

© 2002-2013 ICEAA. All rights reserved.
v1.2
Unit V - Module 15 28
Earned Value Data Elements
• Earned Value has five basic data elements:
Element Title Common Terminology
BCWSBudgeted Cost of Work
Scheduled
Planned Value (PV), Performance
Measurement Baseline (PMB), plan,
baseline
BCWPBudgeted Cost of Work
PerformedEarned Value (EV)
ACWP Actual Cost of Work Performed Actual Cost (AC), actuals
BAC Budget at Complete Planned Cost
EAC / LREEstimate at Complete / Latest
Revised EstimateForecasted Cost
Tip: EAC generally refers to the Government’s independent assessment of the
estimate at complete while LRE refers to the Contractor’s estimate at complete
Presented at the 2017 ICEAA Professional Development & Training Workshop www.iceaaonline.com/portland2017
© 2002-2013 ICEAA. All rights reserved.
v1.2
Unit V - Module 15 29Unit V - Module 15 29
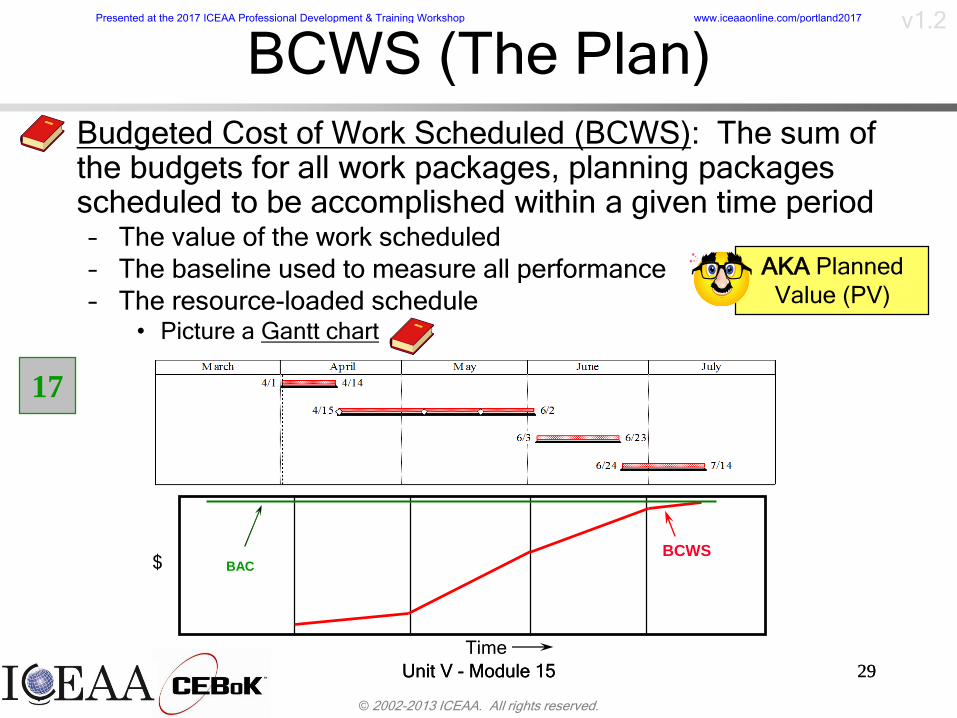
BCWS (The Plan)
• Budgeted Cost of Work Scheduled (BCWS): The sum of the budgets for all work packages, planning packages scheduled to be accomplished within a given time period– The value of the work scheduled
– The baseline used to measure all performance
– The resource-loaded schedule• Picture a Gantt chart
Time
$BCWS
BAC
17
AKA Planned
Value (PV)
Presented at the 2017 ICEAA Professional Development & Training Workshop www.iceaaonline.com/portland2017

© 2002-2013 ICEAA. All rights reserved.
v1.2
Unit V - Module 15 30Unit V - Module 15 30
BCWP (What Work Was Performed?)
• Budgeted Cost of Work Performed (BCWP): The sum of all budgets for completed work packages and completed portions of open work packages– The value of the work performed
– Dependent on BCWS – can only earnas much $ as is loaded in the completed BCWS tasks
Time now
Time
$BCWS
BCWP
BAC
AKA Earned
Value (EV)
Presented at the 2017 ICEAA Professional Development & Training Workshop www.iceaaonline.com/portland2017

© 2002-2013 ICEAA. All rights reserved.
v1.2
Unit V - Module 15 31Unit V - Module 15 31
ACWP (Cost Incurred)• Actual Cost of Work Performed (ACWP): The costs
actually incurred to accomplish the work earned within a specified time frame
Time
BAC
$BCWS
ACWPACWP
BCWP
Contractor’s
Accounting System
Labor
Travel
Invoices
Subcontract
Invoices
Material
General Ledger
ODCsExport actuals
to EVM database
AKA Actuals (AC),
Actual Value
Presented at the 2017 ICEAA Professional Development & Training Workshop www.iceaaonline.com/portland2017

© 2002-2013 ICEAA. All rights reserved.
v1.2
Unit V - Module 15 32
BAC and LRE (End of Work)
• Budget At Complete (BAC): Cumulative BCWS at
the end of the contract
• Latest Revised Estimate (LRE): The contractor’s
best guess at how much the effort will actually cost
at the end of the contract
Time
BAC
$BCWS
ACWPACWP
BCWP
LRE
Presented at the 2017 ICEAA Professional Development & Training Workshop www.iceaaonline.com/portland2017

© 2002-2013 ICEAA. All rights reserved.
v1.2
Unit V - Module 15 33
Baseline Development
Price
Cost (CBB) f Fee
Performance Measurement
Baseline (PMB)Management
Reserve
Undistributed
Budget
Work
Packages
Planning
Packages
Distributed Budget
(Control Accounts)
Control Accounts are
the management
control point for the
integration of scope,
schedule & cost$5M$85M
$90M$10M
$10M$100M
$110M
$40M $45M
MR covers
unanticipated,
in scope
changes
Work is tied to
an activity, but
is not detail-
planned
Earned Value is
measured against
the PMB
Contract Budget
Base
Presented at the 2017 ICEAA Professional Development & Training Workshop www.iceaaonline.com/portland2017

© 2002-2013 ICEAA. All rights reserved.
v1.2
Unit V - Module 15 34
Baseline Development – PMB
• Performance Measurement Baseline (PMB)
developed– Sum of all Work/Planning Package Budgets + UB
– Undistributed Budget (UB) is:• Work tied to an activity, but not detail-planned
• Used most often when new work added to contract
• Earned Value is Measured against the PMB
• Work packages and related budget (BCWS)
are time phased using logic-driven schedule– e.g., PERT chart showing dependencies
Tip: UB usually distributed within 60 days
18
Presented at the 2017 ICEAA Professional Development & Training Workshop www.iceaaonline.com/portland2017

© 2002-2013 ICEAA. All rights reserved.
v1.2
Unit V - Module 15 35
Baseline Development – MR
• Management Reserve (MR) set aside
while developing PMB
– Covers unanticipated, in scope changes
– MR % tied to level of risk and type of
contract• 2-4% low risk and/or Cost Plus
• 15%+ high risk and/or Firm Fixed Price
– More discussion on MR and its use is
covered under the Analysis of Past
Performance section
Tip: MR is most commonly 7-9% of CBB
14
19
Presented at the 2017 ICEAA Professional Development & Training Workshop www.iceaaonline.com/portland2017

© 2002-2013 ICEAA. All rights reserved.
v1.2
Unit V - Module 15 36
Baseline Development – CBB
• PMB and MR together form the Contract Budget Base (CBB) (“Cost”)
• CBB plus fee yields the Total Contract Value (“Price”)
• A time-phased graphic illustrating PMB and MR forming CBB is on the next slide
• EVM should be complemented by a disciplined Risk Management (RM) approach to identifying, quantifying, and addressing unknown future events
“Integrating EVM and RM: A Statistical Analysis of Survey Results,” Alissa C. Kumley, Northrop Grumman Corporation,
ISPA/SCEA Joint International Conference, 2005
3
Presented at the 2017 ICEAA Professional Development & Training Workshop www.iceaaonline.com/portland2017
© 2002-2013 ICEAA. All rights reserved.
v1.2
Unit V - Module 15 37
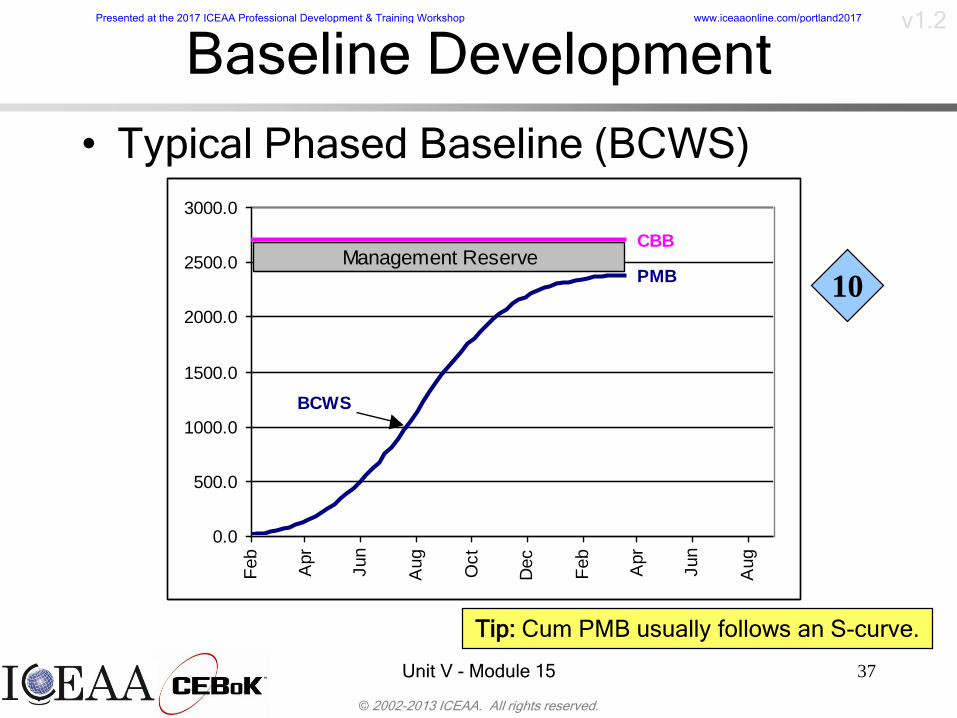
Baseline Development
• Typical Phased Baseline (BCWS)
0.0
500.0
1000.0
1500.0
2000.0
2500.0
3000.0
Feb
Apr
Jun
Aug
Oct
Dec
Feb
Apr
Jun
Aug
Management ReserveCBB
PMB
BCWS
Tip: Cum PMB usually follows an S-curve.
10
Presented at the 2017 ICEAA Professional Development & Training Workshop www.iceaaonline.com/portland2017
© 2002-2013 ICEAA. All rights reserved.
v1.2
Unit V - Module 15 38
Performance Measurement
• There are different ways to estimate progress of a project– Key issue is in-process work packages
• Value is earned (BCWP) when corresponding work is accomplished
• When value will be earned is determined before beginning work using common performance measurement methods
• Assignment of method should strive to reduce subjectivity
• Table on next slide outlines:– Most common methods
– When methods are typically employed
Presented at the 2017 ICEAA Professional Development & Training Workshop www.iceaaonline.com/portland2017

© 2002-2013 ICEAA. All rights reserved.
v1.2
Unit V - Module 15 39
Performance
Measurement – EV MethodsEV Method Description Type of Tasks that Use Method
Milestone
(Weighted)
Take performance as defined
Milestones (MS) are accomplished.
MSs can be weighted if one or more
are considered more important
Tasks that can be planned using
interim Milestones
Percent
Complete
Performance is taken based on
Percent of task completed
Work that does not have any
reasonable interim measurable MSs
0/100 All performance is taken when task is
complete
Short duration tasks - one month or
less
50/50
Or X%/Y%
50% (X%) performance taken when
task starts; 50% (Y%) performance
taken when task is complete
Short duration tasks - two months or
less
LOE Plan based on resource expenditure
plan – Performance always equals
Plan
Used for tasks that are more time-
oriented vice task oriented, such as
Program Management
Best Method for EVM
Presented at the 2017 ICEAA Professional Development & Training Workshop www.iceaaonline.com/portland2017

© 2002-2013 ICEAA. All rights reserved.
v1.2
Unit V - Module 15 40
Example –
Performance Measurement
• Determine the best earned value
measurement technique:
– Aquarium System Program Management
– Aquarium Design
– Aquarium Deployment to Site ATLANTIC
4
Presented at the 2017 ICEAA Professional Development & Training Workshop www.iceaaonline.com/portland2017

© 2002-2013 ICEAA. All rights reserved.
v1.2
Unit V - Module 15 41
Example –
Performance Measurement• Valid earned value measurement techniques:
– Aquarium System Program Management • LOE – most common method
• Milestone
– Aquarium Design• Most likely Design will be divided into smaller work
packages and multiple methods will be employed
• Milestone / Weighted Milestone – most common method
• Percent Complete
– Aquarium Deployment to Site ATLANTIC• 0/100
• X%/Y%
• Milestone Multiple Answers are Justifiable
Presented at the 2017 ICEAA Professional Development & Training Workshop www.iceaaonline.com/portland2017

© 2002-2013 ICEAA. All rights reserved.
v1.2
Unit V - Module 15 42
Earned Value Analysis• Elementary EV Analysis
• Analysis of Past Performance
• Variance Reports
• Projection of Future Performance
• Earned Value Review Process
Presented at the 2017 ICEAA Professional Development & Training Workshop www.iceaaonline.com/portland2017

© 2002-2013 ICEAA. All rights reserved.
v1.2
Unit V - Module 15 43
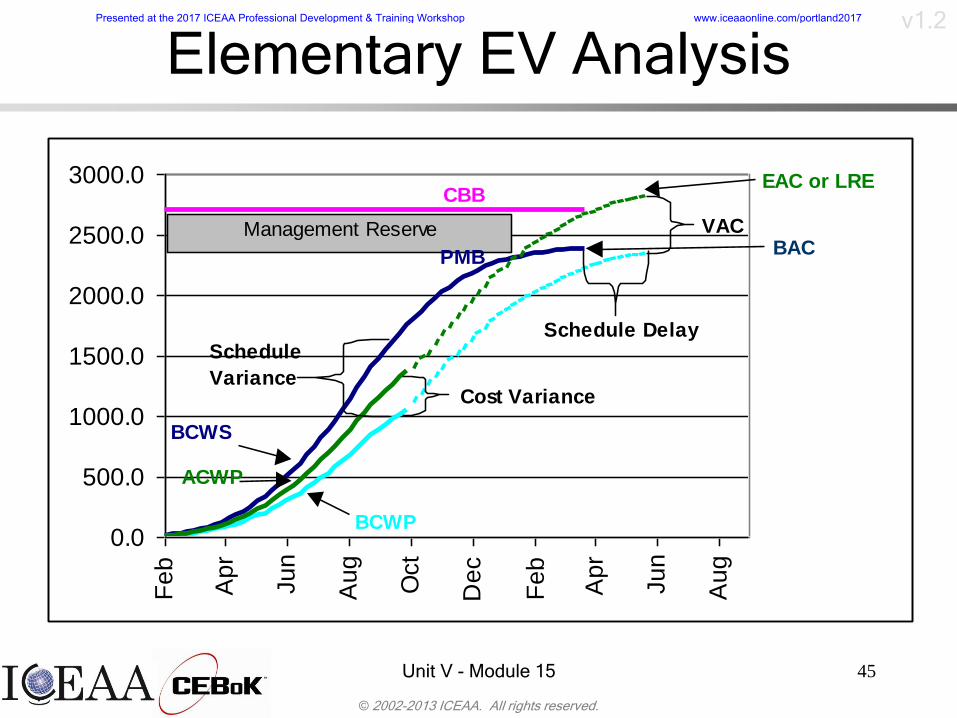
Elementary EV Analysis
• Common calculated Data Elements:
– Schedule Variance (SV) = BCWP – BCWS
– Cost Variance (CV) = BCWP – ACWP
0.0
500.0
1000.0
1500.0
2000.0
2500.0
3000.0F
eb
Ap
r
Ju
n
Au
g
Oct
De
c
Fe
b
Ap
r
Ju
n
Au
g
Management ReserveCBB
PMB
BCWS
ACWP
BCWP
Cost Variance
Schedule
Variance
AKA
Accomplishment
Variance
Presented at the 2017 ICEAA Professional Development & Training Workshop www.iceaaonline.com/portland2017

© 2002-2013 ICEAA. All rights reserved.
v1.2
Unit V - Module 15 44
Elementary EV Analysis
• Common calculated Data Elements:
– Variance at Complete (VAC) = BAC – LRE
– Estimate at Complete (EAC)
• Forecasting measure
• Various methods applicable
• Discussed in more detail later
– Budgeted Cost of Work Remaining (BCWR)
= BAC – BCWP
• Analysis of data, including sample
problems, in next section
Presented at the 2017 ICEAA Professional Development & Training Workshop www.iceaaonline.com/portland2017
© 2002-2013 ICEAA. All rights reserved.
v1.2
Unit V - Module 15 45
Elementary EV Analysis
0.0
500.0
1000.0
1500.0
2000.0
2500.0
3000.0F
eb
Ap
r
Ju
n
Au
g
Oct
De
c
Fe
b
Ap
r
Ju
n
Au
g
Management Reserve
CBB
PMB
BCWS
ACWP
BCWP
Cost Variance
Schedule
Variance
VAC
EAC or LRE
BAC
Schedule Delay
Presented at the 2017 ICEAA Professional Development & Training Workshop www.iceaaonline.com/portland2017

© 2002-2013 ICEAA. All rights reserved.
v1.2
Unit V - Module 15 46
Analysis of Past Performance
• CV, SV, and VAC: Most common and simplest derived earned value data
• Examine current and cumulative data points and trends– Cumulative data points good for determining
average performance
– Current data points good for assessing current performance and for highlighting anomalies, errors in data, and error corrections
– Trend lines good for assessing performance over time – Sudden trend changes should be examined
Presented at the 2017 ICEAA Professional Development & Training Workshop www.iceaaonline.com/portland2017

© 2002-2013 ICEAA. All rights reserved.
v1.2
Unit V - Module 15 47
Analysis of Past Performance
• Any variance over 10% is serious and should be examined– CV % = CV / BCWP = 1 – 1/CPI
– SV% = SV / BCWS = SPI - 1
• Focus on CV and SV (vice VAC)
• Variances are natural– Explained and managed, but not eliminated
• Variances, and emerging or present trends, can erase with a rebaseline
Tip: Sudden “healing” spikes in cum CV/SV
typically mean a rebaseline has occurred
“Understanding Program Resource Management through Earned Value Analysis.” Falls Church, Va.: Abba Consulting,
June 2006.
Presented at the 2017 ICEAA Professional Development & Training Workshop www.iceaaonline.com/portland2017

© 2002-2013 ICEAA. All rights reserved.
v1.2
Unit V - Module 15 48
Analysis of Past Performance
• CV, SV, and VAC:
-60.0
-50.0
-40.0
-30.0
-20.0
-10.0
0.0
10.0
20.0
30.0
Fe
b
Ma
r
Ap
r
Ma
y
Jun
Jul
Au
g
Se
p
Oct
No
v
De
c
Jan
Fe
b
Ma
r
CV SV VAC
Rebaseline
7
Va
ria
nce
Pe
rce
nta
ge
Presented at the 2017 ICEAA Professional Development & Training Workshop www.iceaaonline.com/portland2017

© 2002-2013 ICEAA. All rights reserved.
v1.2
Unit V - Module 15 49
Example – Past Performance
• Sample problem:
– Building 8 Aquaria
• Budgeted for 4 to be built in Nov and 4 to be built in Dec
at $100 each
– At the end of Nov, contractor spent $300 and
completed 2
– Contractor now expects the project to cost a total
of $1000
– For Month-end (ME) Nov, what is cumulative
BCWS? BCWP? ACWP?
– For ME Nov, what is cumulative CV? SV? VAC?
– What are those variances telling us?
2
5
6
Presented at the 2017 ICEAA Professional Development & Training Workshop www.iceaaonline.com/portland2017

© 2002-2013 ICEAA. All rights reserved.
v1.2
Unit V - Module 15 50
Example – Past Performance
• Answers:– BCWS = $400 BCWP = $200 ACWP = $300
– CV = - $100 SV = - $200 VAC = - $200
– What are those variances telling us?1. Overrunning now, accomplished less than planned, expect
overrun at complete, if task on critical path then expect a delay at complete – Facts based on data provided
2. Do not expect to repeat overrun for Aquaria #3-8 because VAC ≠ 4 * CV. Ask: Is this realistic? Why do they think overrun will not be repeated?
3. Built 2 in one month, now expect to build 6 in next month –Unlikely – Ask: How do they plan to accomplish this and not spend more $/system than budgeted
– Begin to plan for how to cover current overrun andexpected future overrun
Presented at the 2017 ICEAA Professional Development & Training Workshop www.iceaaonline.com/portland2017

© 2002-2013 ICEAA. All rights reserved.
v1.2
Unit V - Module 15 51
Past Performance – Indices• Cost Performance Index (CPI) and Schedule
Performance Index (SPI) display variances on a units-free scale– CV of $100 out of $2M is nothing
– CV of $100 out of $200 is significant
• Cost Performance Index (CPI)– Ratio of work performed to actual costs
– BCWP / ACWP
– Used to determine the value of every dollar of work accomplished (bang for the buck)
– < 1.0 is unfavorable > 1.0 is favorable
• Reciprocal of CPI– Provides the final cost of dollar’s worth of budgeted effort
– EAC Calculations use reciprocal of CPI to scale budgeted effort up to an expected completion cost
9
Presented at the 2017 ICEAA Professional Development & Training Workshop www.iceaaonline.com/portland2017

© 2002-2013 ICEAA. All rights reserved.
v1.2
Unit V - Module 15 52
Past Performance – Indices
• Schedule Performance Index (SPI)
– Ratio of value of work performed to value of work planned
– BCWP / BCWS
– Used to determine the efficiency at which scheduled work is being accomplished
– < 1.0 is unfavorable > 1.0 is favorable
• Analysis using CPI, SPI similar to that using CV, SV
• Table on next slide contains possible causes for CV/CPI and SV/SPI
Tip: Examine cost and schedule together graphically to assess
visually how variances may be impacting one another.
Presented at the 2017 ICEAA Professional Development & Training Workshop www.iceaaonline.com/portland2017
© 2002-2013 ICEAA. All rights reserved.
v1.2
Unit V - Module 15 53
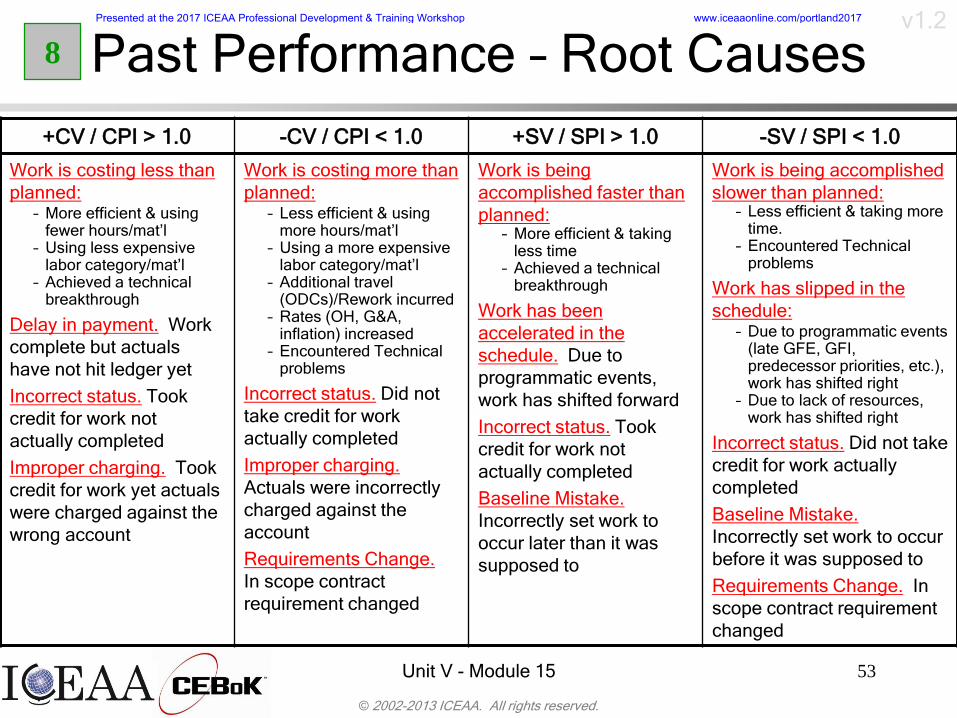
Past Performance – Root Causes
+CV / CPI > 1.0 -CV / CPI < 1.0 +SV / SPI > 1.0 -SV / SPI < 1.0
Work is costing less than
planned:– More efficient & using
fewer hours/mat’l– Using less expensive
labor category/mat’l– Achieved a technical
breakthrough
Delay in payment. Work
complete but actuals
have not hit ledger yet
Incorrect status. Took
credit for work not
actually completed
Improper charging. Took
credit for work yet actuals
were charged against the
wrong account
Work is costing more than
planned:– Less efficient & using
more hours/mat’l– Using a more expensive
labor category/mat’l– Additional travel
(ODCs)/Rework incurred– Rates (OH, G&A,
inflation) increased– Encountered Technical
problems
Incorrect status. Did not
take credit for work
actually completed
Improper charging.
Actuals were incorrectly
charged against the
account
Requirements Change.
In scope contract
requirement changed
Work is being
accomplished faster than
planned:– More efficient & taking
less time– Achieved a technical
breakthrough
Work has been
accelerated in the
schedule. Due to
programmatic events,
work has shifted forward
Incorrect status. Took
credit for work not
actually completed
Baseline Mistake.
Incorrectly set work to
occur later than it was
supposed to
Work is being accomplished
slower than planned:– Less efficient & taking more
time.– Encountered Technical
problems
Work has slipped in the
schedule:– Due to programmatic events
(late GFE, GFI, predecessor priorities, etc.), work has shifted right
– Due to lack of resources, work has shifted right
Incorrect status. Did not take
credit for work actually
completed
Baseline Mistake.
Incorrectly set work to occur
before it was supposed to
Requirements Change. In
scope contract requirement
changed
8
Presented at the 2017 ICEAA Professional Development & Training Workshop www.iceaaonline.com/portland2017

© 2002-2013 ICEAA. All rights reserved.
v1.2
Unit V - Module 15 54
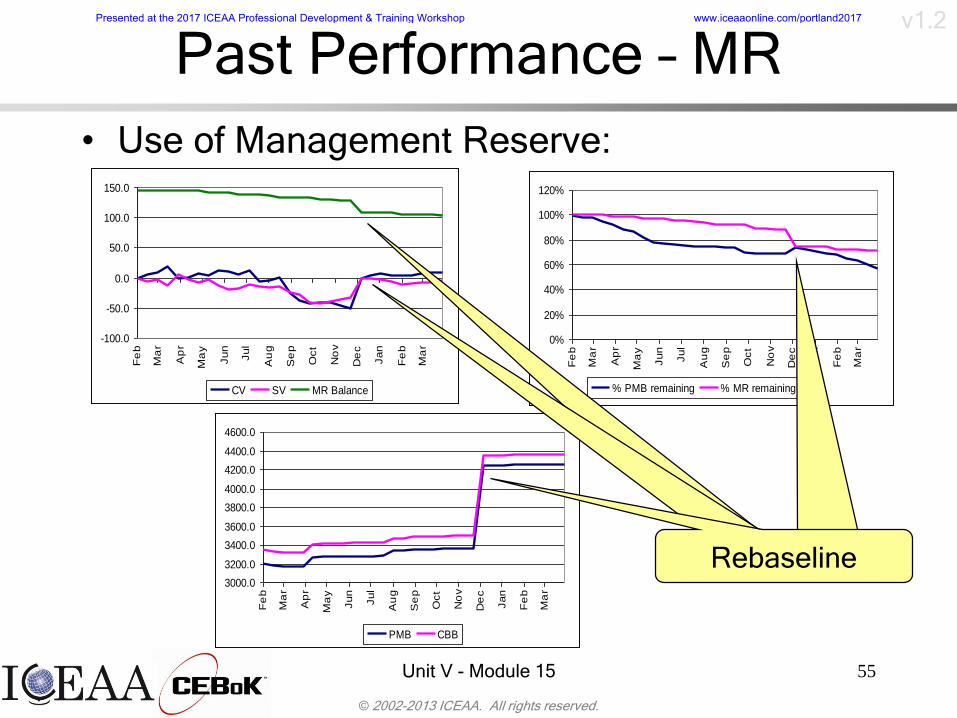
Past Performance – MR
• Use of Management Reserve:
– Should have a technical reason to apply MR
– Should not be used to fix negative cost variances
– MR usage could be an indicator of problems
– Helpful MR graphs:
• MR use with CV and SV to assess visually if MR being
used to cover problems
• % MR remaining with % PMB remaining to assess
visually if MR is expended at rate similar to how program
is executing (Alternative: MR Balance vs. BCWR)
• Graph CBB vs. PMB – As MR is used and incorporated
into the PMB, the CBB and PMB lines will merge
Tip: It is good to have some MR left at end of contract to cover
approved rate changes that can occur 3-4 years later
Presented at the 2017 ICEAA Professional Development & Training Workshop www.iceaaonline.com/portland2017
© 2002-2013 ICEAA. All rights reserved.
v1.2
Unit V - Module 15 55
-100.0
-50.0
0.0
50.0
100.0
150.0
Fe
b
Ma
r
Ap
r
Ma
y
Jun
Jul
Au
g
Se
p
Oct
No
v
De
c
Jan
Fe
b
Ma
r
CV SV MR Balance
0%
20%
40%
60%
80%
100%
120%
Fe
b
Ma
r
Ap
r
Ma
y
Jun
Jul
Au
g
Se
p
Oct
No
v
De
c
Jan
Fe
b
Ma
r
% PMB remaining % MR remaining
Past Performance – MR
• Use of Management Reserve:
3000.0
3200.0
3400.0
3600.0
3800.0
4000.0
4200.0
4400.0
4600.0
Fe
b
Ma
r
Ap
r
Ma
y
Jun
Jul
Au
g
Se
p
Oct
No
v
De
c
Jan
Fe
b
Ma
r
PMB CBB
RebaselineRebaselineRebaselineRebaseline
Presented at the 2017 ICEAA Professional Development & Training Workshop www.iceaaonline.com/portland2017

© 2002-2013 ICEAA. All rights reserved.
v1.2
Unit V - Module 15 56
Past Performance – Percentages
• Other useful data:– % planned = BCWS / BAC
– % complete = BCWP / BAC
– % spent = ACWP / BAC
• Conduct analysis such as– % planned >> % complete? Problem!
– % spent >> % complete? Problem!
– % of MR used >> % complete? Problem! (unless % complete close to 100%)
– Master schedule shows % complete >> or << Earned Value % complete? Possible problem – an indication that Schedule and EV are not in sync
Presented at the 2017 ICEAA Professional Development & Training Workshop www.iceaaonline.com/portland2017

© 2002-2013 ICEAA. All rights reserved.
v1.2
Unit V - Module 15 57
Past Performance – Percentages
• Graph of % planned, % complete, %
spent same as graph as BCWS, BCWP,
ACWP but on a “unit-free” scale
0.0%
10.0%
20.0%
30.0%
40.0%
50.0%
60.0%
70.0%
80.0%
Fe
b
Ma
r
Ap
r
Ma
y
Jun
Jul
Au
g
Se
p
Oct
No
v
% Planned % Complete % Spent
Presented at the 2017 ICEAA Professional Development & Training Workshop www.iceaaonline.com/portland2017

© 2002-2013 ICEAA. All rights reserved.
v1.2
Unit V - Module 15 58
Past Performance – Anomalies
Anomaly Concern
BCWS = BCWP = ACWP
(and <> 0)
Not really using Earned Value – “Perfect data”
BCWP > 0, ACWP = 0 “Free” performance
BCWP > 0 and BCWS = 0 BCWP is dependent on BCWS, so why is there
performance without planned performance
ACWP > 0 and BCWP = 0 What is being paid for without getting any performance?
BCWP or BCWS > BAC > 100% complete? > 100% planned?
BAC > 0 and EAC = 0 Work is planned (BAC/BCWS), but costs are expected
to come in at $0 (EAC/ACWP)?
EAC > 0 and BAC = 0 Cost (EAC/ACWP) are expected for element that has
no planned value (BAC/BCWS)?
BCWS, BCWP, ACWP
negative
Negative (“giving back”) plan, performance, actuals
BAC < 0 and/or EAC < 0 Negative (contractor giving to Government) total plan
(BAC) and/or total expected plan at complete (EAC)
Presented at the 2017 ICEAA Professional Development & Training Workshop www.iceaaonline.com/portland2017

© 2002-2013 ICEAA. All rights reserved.
v1.2
Unit V - Module 15 59
Example - Past Performance
• Sample Problem:
BCWS = $400 BCWP = $200 ACWP = $300
BAC = $800 LRE = $1000
– What percent of my budget has been spent
to date?
– For every $ I spend, how much value am I
receiving?
– I have used 50% of my MR to date. Should I
be concerned about having sufficient MR to
complete program?
10
Presented at the 2017 ICEAA Professional Development & Training Workshop www.iceaaonline.com/portland2017

© 2002-2013 ICEAA. All rights reserved.
v1.2
Unit V - Module 15 60
Example - Past Performance
• Answers:– What % of my budget has been spent to date?
• % spent = ACWP / BAC = $300/$800 = 37.5%
– For every $ I spend, how much value am I receiving?
• CPI = BCWP / ACWP = $200/$300 = 0.67
• For every $1 spent, I receive 67 cents of value
– I have used 50% of my MR to date. Should I be concerned about having sufficient MR to complete program?
• % complete = BCWP / BAC = $200/$800 = 25%
• Yes, I should be concerned
– Using MR twice as fast as I am completing work
– Only ¼ of the way through the program (relatively early)
Presented at the 2017 ICEAA Professional Development & Training Workshop www.iceaaonline.com/portland2017

© 2002-2013 ICEAA. All rights reserved.
v1.2
Unit V - Module 15 61
Variance Reports
• Variance reports (CPR Format 5 or similar report) are critical to earned value analysis process
• Variances should be explained at WBS level lower than reporting level
• Key elements in a variance report include:– Where is variance (WBS, labor/material, etc.)
– Cause
– Impact (CV or SV, and impact on VAC (Cost) and/or impact on completion date (Schedule)
– Action plan (what and when)
Warning: Variance reports written
at a summary level make it difficult
to pinpoint to which cost element(s)
the explanation refers.
Presented at the 2017 ICEAA Professional Development & Training Workshop www.iceaaonline.com/portland2017

© 2002-2013 ICEAA. All rights reserved.
v1.2
Unit V - Module 15 62
Variance Reports
• Typical variance reporting thresholds:– IPMR Format 5: Top 15 WBS elements
– (+) / - 10% and/or $X
– %/$ thresholds that increase with % complete
– PM’s “Top 10” or “Critical” tasks
• Focus tends to be on negative (-%/$)
• Important to look at “good performers” (+%/$) – Areas of opportunity
– Can reprogram resources to support problems and/or to accelerate schedule
• Variance reports actions should be captured and tracked in risk mitigation process
Presented at the 2017 ICEAA Professional Development & Training Workshop www.iceaaonline.com/portland2017

© 2002-2013 ICEAA. All rights reserved.
v1.2
Unit V - Module 15 63
Projection of Future Performance
• Strength of EV is it enables the identification of problems early
• Recall that final CV will be worse than the cumulative CV at the 20% completion point– Look for tendency to circumvent EVM's purpose as an “early
warning system”
– Delays in admitting/discovering cost growth is likely to result in even greater cost overrun
• Various ways to analyze and project future performance– TCPI metric designed to lend credibility (or not) to contractor
EAC (see future slide for more details)
– Formula-derived EAC• Example: EAC = ACWP + (BAC-BCWP)/CPI
• Based on EVM performance to date
• Equivalent to CPI Forecast on next slide
Presented at the 2017 ICEAA Professional Development & Training Workshop www.iceaaonline.com/portland2017

© 2002-2013 ICEAA. All rights reserved.
v1.2
Unit V - Module 15 64
Future Performance – EAC
• Objective, mathematical Estimates At Complete (EACs) can be calculated
• Most common are CPI and CPI * SPI– CPI Forecast
• ACWP + BCWR / CPI = BAC / CPI
• Assumes even cost performance across the entire project equal to performance experienced to date
• Referred to as “best case” EAC
– CPI * SPI Forecast• ACWP + BCWR / (CPI*SPI)
• Also assumes that past cost and schedule performance are indicative of future performance
• Adjusts estimate to account for schedule performance experienced to date
• Referred to as “worst case” EAC
Estimate To
Completion
(ETC)
Presented at the 2017 ICEAA Professional Development & Training Workshop www.iceaaonline.com/portland2017

© 2002-2013 ICEAA. All rights reserved.
v1.2
Unit V - Module 15 65
Future Performance – EAC
• Emphasis today is for government Program Offices to develop EACs independent of the EVMS
• Contractor LRE includes their assessment of cost risk, optimism, and only covers work on contract
• Independent EAC includes Government assessment of cost risk, less optimism, and work to be put on contract in the future– Should have technical input and buy-in from the
Program Team
– Sometimes equivalent to a revised cost estimate2
Presented at the 2017 ICEAA Professional Development & Training Workshop www.iceaaonline.com/portland2017

© 2002-2013 ICEAA. All rights reserved.
v1.2
Unit V - Module 15 66
Future Performance – EAC
• If done correctly, the EAC:
– Generates a credible story for time phased
budget submissions and for providing
direction to the contractor
– Helps avoid FY funding surprises
– Allows team to focus on corrective actions
• If EAC calculated outside of the EVMS,
can use Earned Value data to assess
the reasonableness of the EAC
Presented at the 2017 ICEAA Professional Development & Training Workshop www.iceaaonline.com/portland2017

© 2002-2013 ICEAA. All rights reserved.
v1.2
Unit V - Module 15 67
Warning: EVA does not typically
include cost estimating
methodologies (e.g., learning curve)
Future Performance – TCPI
• What is our (implicit) predicted future
performance based on data reported?
• Use the To-complete Cost Performance Index
(TCPI)
– TCPIBAC and TCPILRE
– Ratio of remaining work to complete to remaining $
available to be spent to achieve the BAC (or LRE)
– TCPIBAC = BCWR / (BAC – ACWP)
– TCPILRE = BCWR / (LRE – ACWP)
– Can also calculate TCPI for EAC forecasts
• “Indicator of the goodness” of the LRE/EAC
12
15
Presented at the 2017 ICEAA Professional Development & Training Workshop www.iceaaonline.com/portland2017

© 2002-2013 ICEAA. All rights reserved.
v1.2
Unit V - Module 15 68
Future Performance – TCPI and LRE
• TCPILRE most common to analyze because it reflects what the contractor thinks about their future performance
• Compare TCPI to CPI– TCPI < CPI
• Implies lower productivity is assumed for remaining work
• If significantly lower, Ask: What additional overrun are you anticipating in the future?
– TCPI > CPI • Implies higher productivity is assumed for remaining work
• If significantly higher, Ask: What measures are you taking to improve productivity so greatly?
• Significantly higher TCPI causes validity of EAC to be in question
Tip: TCPILRE greater than Cum CPI by more than
5% (0.05) is excessively optimistic
11
Presented at the 2017 ICEAA Professional Development & Training Workshop www.iceaaonline.com/portland2017

© 2002-2013 ICEAA. All rights reserved.
v1.2
Unit V - Module 15 69
Future Performance – LRE
• Can use Earned Value data to assess the reasonableness of the Contractor’s LRE (e.g., TCPI to CPI comparisons)
• Contractor typically uses estimating methods outside of EVMS to estimate the LRE (e.g., bottom-up analysis of remaining work)
• When analyzing LRE reasonableness, be aware that LRE also typically includes human input regarding future performance– Good: can account for special situations
– Bad: incorporates optimism that may be unintentionally exaggerated
Presented at the 2017 ICEAA Professional Development & Training Workshop www.iceaaonline.com/portland2017

© 2002-2013 ICEAA. All rights reserved.
v1.2
Unit V - Module 15 70
Future Performance – Graph
• Graph CPI and TCPI to see how similar
the lines are over time.
• Helpful to include 5% delta line for CPI
0.80
0.85
0.90
0.95
1.00
1.05
1.10
1.15
1.20
Fe
b
Ma
r
Ap
r
Ma
y
Ju
n
Ju
l
Au
g
Se
p
Oct
No
v
De
c
Ja
n
Fe
b
Ma
r
CPI TCPI-LRE CPI +/- 5%
Presented at the 2017 ICEAA Professional Development & Training Workshop www.iceaaonline.com/portland2017

© 2002-2013 ICEAA. All rights reserved.
v1.2
Unit V - Module 15 71
Future Performance – Graph
• Graph EACs with BAC and LRE to view trends
• More information on the EAC is contained in
Advanced Topics
1450.0
1500.0
1550.0
1600.0
1650.0
1700.0
1750.0
Jun Jul Aug Sep Oct Nov Dec Jan Feb Mar Apr May Jun
BAC LRE CPI EAC CPI*SPI EAC
Presented at the 2017 ICEAA Professional Development & Training Workshop www.iceaaonline.com/portland2017

© 2002-2013 ICEAA. All rights reserved.
v1.2
Unit V - Module 15 72
Example - Future Performance
• Sample Problem:
BCWS = $400 BCWP = $200 ACWP = $300
BAC = $800 LRE = $1000
– What is the TCPI to achieve the LRE?
– Is the LRE reasonable?
– Using independent forecasts, what is the
“best case” EAC? The “worst case” EAC?13
Presented at the 2017 ICEAA Professional Development & Training Workshop www.iceaaonline.com/portland2017

© 2002-2013 ICEAA. All rights reserved.
v1.2
Unit V - Module 15 73
Example - Future Performance
• Answers:
– What is the TCPI to achieve the LRE?• TCPILRE = BCWR / (LRE – ACWP)
= (800 – 200) / (1000 – 300)
= 600 / 700 = 0.86
– Is the LRE reasonable?• CPI = 0.67; TCPI-LRE = 0.86
• TCPILRE is is more than 5% higher than CPI
• LRE may not be reasonable– Need to investigate reasoning behind CPI and
assess the reasonableness of the plans for improving performance so drastically
Presented at the 2017 ICEAA Professional Development & Training Workshop www.iceaaonline.com/portland2017

© 2002-2013 ICEAA. All rights reserved.
v1.2
Unit V - Module 15 74
Example - Future Performance
• Answers (continued):
– Using independent forecasts, what is the
“best case” EAC? The “worst case” EAC?
• Best Case EAC = CPI Forecast
= BAC / CPI
= 800 / 0.67 = 1200
• Worst Case EAC = CPI*SPI Forecast
= ACWP + BCWR / CPI*SPI
= 300 + (800 – 200) / (0.67)*(0.5)
= 2100
Presented at the 2017 ICEAA Professional Development & Training Workshop www.iceaaonline.com/portland2017

© 2002-2013 ICEAA. All rights reserved.
v1.2
Unit V - Module 15 75
Future Performance – Other
• Other LRE data to consider:
– ACWP > BAC
• Is an ECP “in the works” but not yet on contract?
• Is this all overrun?
• Happens frequently when % complete approaches 100%
• Greater concern when % complete < 80%
– ACWP > LRE
• Forecast must be updated (also could be “in the works”)
• Do we expect a corresponding BAC change due to an
ECP or is this all overrun?
• Happens frequently when % complete approaches 100%
• Should happen less frequently than ACWP > BAC if LRE
is updated on a regular basis
14
Presented at the 2017 ICEAA Professional Development & Training Workshop www.iceaaonline.com/portland2017

© 2002-2013 ICEAA. All rights reserved.
v1.2
Unit V - Module 15 76
EAC Analysis - Example
• How is this project doing?
Performance Data
58.455.2
73.679.5
0
20
40
60
80
100
1 2 3 4 5 6 7 8 9 10 11 12 13 14 15 16 17
Period
$
BCWS BCWP ACWP BAC
Presented at the 2017 ICEAA Professional Development & Training Workshop www.iceaaonline.com/portland2017

© 2002-2013 ICEAA. All rights reserved.
v1.2
Unit V - Module 15 77
• EAC Predictions:
• Red Circle: ~ 15% complete. Overrun is 15 here
• Purple Oval: ~ 33% complete. Overrun stabilizes here at 24-28
• At 17th period, showing ~ 28% overrun
EAC Predictions
58.455.2
73.679.5
107.9
0
20
40
60
80
100
120
1 2 3 4 5 6 7 8 9 10 11 12 13 14 15 16 17
Period
$
BCWS BCWP ACWP BAC EAC CPI*SPI
EAC Analysis – Interpreting DataPresented at the 2017 ICEAA Professional Development & Training Workshop www.iceaaonline.com/portland2017

© 2002-2013 ICEAA. All rights reserved.
v1.2
Unit V - Module 15 78
Replan
76.875.5
76.8
109.4
111.9
0
20
40
60
80
100
120
1 2 3 4 5 6 7 8 9 10 11 12 13 14 15 16 17 18
Period
$
BCWS BCWP ACWP BAC EAC CPI*SPI
EAC Analysis – Replan
• The replan:
• Variances almost healed
• BAC close to EAC
Presented at the 2017 ICEAA Professional Development & Training Workshop www.iceaaonline.com/portland2017

© 2002-2013 ICEAA. All rights reserved.
v1.2
Unit V - Module 15 79
• 95% complete data:
• Established “award milestones” using unearned fee to incentivize contractor
• Also imposed cost-share clause for additional overrun to further incentivize contractor
Performance Data: 95% CMP
0
20
40
60
80
100
120
140
1 4 7 10 13 16 19 22 25 28 31 34
Period
$
BCWS BCWP ACWP BAC EAC CPI*SPI
EAC Analysis - OutcomePresented at the 2017 ICEAA Professional Development & Training Workshop www.iceaaonline.com/portland2017

© 2002-2013 ICEAA. All rights reserved.
v1.2
Unit V - Module 15 80
Earned Value Review Process
• How do you get a handle on all this data?
• Steps in a review process1. What questions are most important to your
organization? (Profitability, Budget, etc.)
2. What statistics will answer those questions?
3. What metrics do you like best?• Multiple metrics for same basic questions
• Don’t use all – analysis becomes redundant
4. What is the optimal EV reporting level? What are the variance reporting thresholds?
• Important to not be too high or too low
• Let the contractors manage the work
• Let government have sufficient oversight and insight
Presented at the 2017 ICEAA Professional Development & Training Workshop www.iceaaonline.com/portland2017

© 2002-2013 ICEAA. All rights reserved.
v1.2
Unit V - Module 15 81
Earned Value Review Process
1. How much progress have we made to date?
2. Are there any significant deviations from the
approved plan?
3. How efficiently are we meeting cost and
schedule objectives?
4. What is the trend (getting better or worse)?
5. Do I think program will come in on budget?
6. Does the contractor have a reasonable
estimate to complete the authorized scope
of work?
7. Do I have a reasonable estimate for
completing the authorized scope of work?
8. What actions can we take to get things back
on track?
Program Management Concerns Products of EV Analysis
1. % Complete (vs % spent)
2. CV, SV, VAC
3. CPI & SPI
4. Graphical Trend Analysis
5. TCPIBAC
6. TCPILRE
7. Statistical EAC Forecasting
Techniques
8. Variance Analysis and
Reports
Executive Overview of EVM course, MAJ Dick Cruver, NRO ACE EVMST, 1997
Presented at the 2017 ICEAA Professional Development & Training Workshop www.iceaaonline.com/portland2017

© 2002-2013 ICEAA. All rights reserved.
v1.2
Unit V - Module 15 82
Earned Value Review Process
• Examine trends as well as cumulative data points
• Examine current data for anomalies, errors in data, & error corrections
• Don’t use current data for forecasting performance trends – data too volatile
• Keep in mind: – Analyzing non-perfect data
– Errors in data may cause variances and forecasted EACs to appear worse than reality
– Poor EV data could be the result of using inappropriate performance measurement techniques – Assess need to change technique
Presented at the 2017 ICEAA Professional Development & Training Workshop www.iceaaonline.com/portland2017

© 2002-2013 ICEAA. All rights reserved.
v1.2
Unit V - Module 15 83
Earned Value Review Process
• Use your technical knowledge when examining data
• Always consider your existing knowledge of:
– What drove past variances
– What future risks and challenges lie ahead
• See Rules of Thumb in Advanced Topics section
• See DAU Gold Card in Summary section
Presented at the 2017 ICEAA Professional Development & Training Workshop www.iceaaonline.com/portland2017

© 2002-2013 ICEAA. All rights reserved.
v1.2
Unit V - Module 15 84
Analysis “One Chart”
• The “One Chart” captures a lot of valuable information:– CV and SV with +/- 10% thresholds to visually see when variances become
extreme
– Comparison to MR allows one to see easily if MR used to heal variances
– Various VACs with a sense of the time left to reach those EAC.
SV
MR
Cost Variance -37.6 Cost Variance at Complete
Schedule Variance -91.1 CPI*SPI -467.0 CPI -161.2
Management Reserve 18.0 Contractor 0.0 PM EAC 7.1
+/- 10% Thresholds
-500.0
-400.0
-300.0
-200.0
-100.0
0.0
100.0
200.0
300.0
Nov
-07
Feb-08
May-
08
Aug
-08
$K
Presented at the 2017 ICEAA Professional Development & Training Workshop www.iceaaonline.com/portland2017

© 2002-2013 ICEAA. All rights reserved.
v1.2
Unit V - Module 15 85
Summary
• Summary
• Gold Card
Presented at the 2017 ICEAA Professional Development & Training Workshop www.iceaaonline.com/portland2017

© 2002-2013 ICEAA. All rights reserved.
v1.2
Unit V - Module 15 86
EVM Summary
• EVM is a management technique
– Integrates technical, cost, and schedule data
– Facilitates objective, realistic management decisions
• Earned Value Management System (EVMS) is a multi-faceted EVM tool
– Planning tool
– Reporting tool
– Analysis and Decision Making tool
Presented at the 2017 ICEAA Professional Development & Training Workshop www.iceaaonline.com/portland2017

© 2002-2013 ICEAA. All rights reserved.
v1.2
Unit V - Module 15 87
EVM Summary
• Major Benefits of using EVM include:
– Improved planning• Clear definition of work prior to beginning work
• Accurate level of resources
• Quick, early problem identification
• Reduced cost and schedule risks
• Reduced propensity to add work without adding budget (out of scope changes)
– Objective performance measurement• Provides true cost and schedule condition
• Encourages accurate forecasting of cost to complete
Presented at the 2017 ICEAA Professional Development & Training Workshop www.iceaaonline.com/portland2017

© 2002-2013 ICEAA. All rights reserved.
v1.2
Unit V - Module 15 88
EVM Summary
• Major Benefits of using EVM include:
– Provides repeatable performance and
lessons learned data
– Provides sound data to justify requesting
resources
• Successful EVM relies on joint
partnership between Government and
Contractor
Presented at the 2017 ICEAA Professional Development & Training Workshop www.iceaaonline.com/portland2017
© 2002-2013 ICEAA. All rights reserved.
v1.2
Unit V - Module 15 89
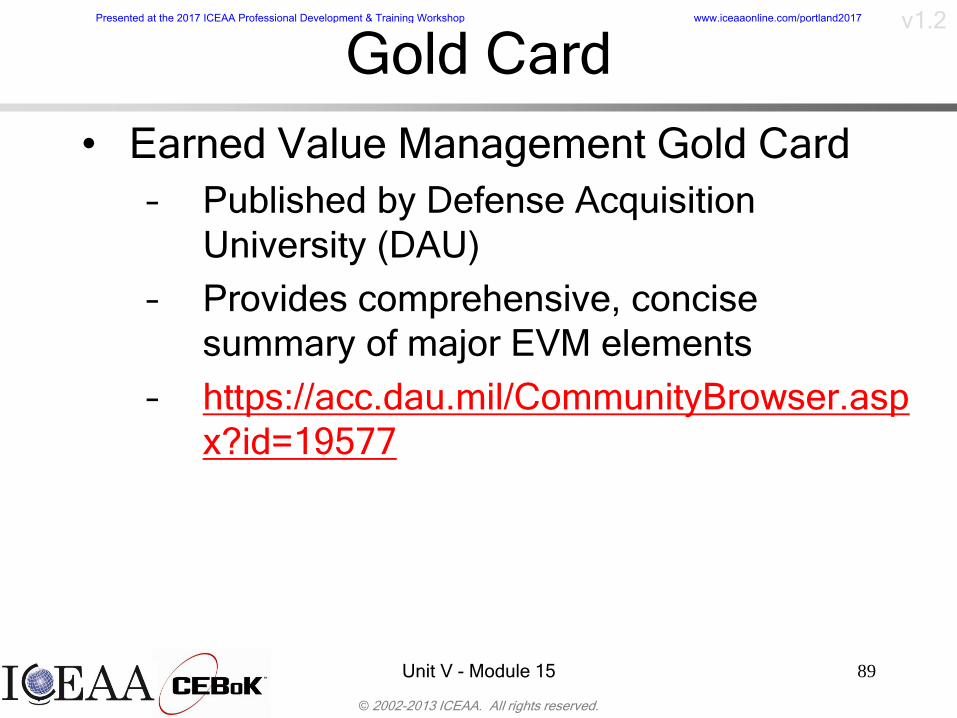
Gold Card
• Earned Value Management Gold Card
– Published by Defense Acquisition
University (DAU)
– Provides comprehensive, concise
summary of major EVM elements
– https://acc.dau.mil/CommunityBrowser.asp
x?id=19577
Presented at the 2017 ICEAA Professional Development & Training Workshop www.iceaaonline.com/portland2017

© 2002-2013 ICEAA. All rights reserved.
v1.2
Unit V - Module 15 90
DAU EVM Gold CardPresented at the 2017 ICEAA Professional Development & Training Workshop www.iceaaonline.com/portland2017

© 2002-2013 ICEAA. All rights reserved.
v1.2
Unit V - Module 15 91
Resources
• Web Resources
• EVM References
• Earned Value
Reports
Presented at the 2017 ICEAA Professional Development & Training Workshop www.iceaaonline.com/portland2017

© 2002-2013 ICEAA. All rights reserved.
v1.2
Unit V - Module 15 92
Web Resources• US DoD Earned Value: http://www.acq.osd.mil/evm/
– Policy, Papers, Tools, Links, and more
– Earned Value Management Implementation Guide and DoD 5000.2-R (under Policy)
– Earned Value Glossary and EVM “Gold Card” (under FAQ)
• Society and Company websites often have links to EVMS white papers, user groups, and other useful material– Access society websites via OSD EV Links site:
http://www.acq.osd.mil/evm/resources/index.shtml
• Acquisition Community Connection (ACC), https://acc.dau.mil/CommunityBrowser.aspx, “Participate in a Community,” “Earned Value Management” – Access company websites via ACC EV Tools site:
https://acc.dau.mil/CommunityBrowser.aspx?id=17809
Presented at the 2017 ICEAA Professional Development & Training Workshop www.iceaaonline.com/portland2017

© 2002-2013 ICEAA. All rights reserved.
v1.2
Unit V - Module 15 93
References• Regulations and Guidance:
– Earned Value Management Implementation Guide (EVMIG) Revision 1, DCMA, 2006
– DoD Regulation Guidance 5000.2, USD (AT&L), 2003
– Industry Standard Guidelines for Earned Value Management (EVM),American National Standards Institute Standard 748, 2006
– Guide to Analysis of Contractor Cost Data, AFMC, 1994
– GAO Cost Estimating and Assessment Guide: Best Practices for Developing and Managing Capital Program Costs, GAO-09-3SP, March 2,
2009
• Books– Cost/Schedule Control Systems Criteria: The Management Guide to
C/SCSC, Quentin W. Fleming, 1992
– Earned Value Project Management 3rd Edition, Quentin W. Fleming and Joel M. Koppleman, 2005
– Project Management Body of Knowledge (PMBOK) 4th Edition, Project Management Institute (PMI), 2008
– Practice Standard for Earned Value Management, Project Management Institute (PMI), 2005
– Project Management using Earned Value, Humphreys & Associates, 2002
Presented at the 2017 ICEAA Professional Development & Training Workshop www.iceaaonline.com/portland2017

© 2002-2013 ICEAA. All rights reserved.
v1.2
Unit V - Module 15 94
References• Courses
– EV 101: Earned Value for Managers course, National
Reconnaissance Office (NRO) Acquisition Center for Excellence
(ACE) Earned Value Management Support Team (EVMST), 1997
– Executive Overview of EVM course, MAJ Dick Cruver, NRO ACE
EVMST, 1997
– Introduction to Earned Value Management course, Mike Kennedy,
TASC, 2000
– BCF 102 Fundamentals of Earned Value Management, Defense
Acquisition University (DAU),
http://icatalog.dau.mil/onlinecatalog/courses.aspx?crs_id=80
– College of Performance Management (CPM) Vendors and
Services, http://www.mycpm.org/resources/vendors-and-services/
– Association for the Advancement of Cost Engineering International
(AACE) Certifications and Education Programs,
http://www.aacei.org/educ/
Presented at the 2017 ICEAA Professional Development & Training Workshop www.iceaaonline.com/portland2017

© 2002-2013 ICEAA. All rights reserved.
v1.2
Unit V - Module 15 95
References• Briefings
– Earned Value Management Systems (EVMS) Basic Concepts,
Sean Alexander, Meridianet
– The Earned Value Body of Knowledge (EV-BOK), Quentin W.
Fleming, Primavera Systems, Inc., 1998
– NRO Use of EVMS briefing, NRO ACE EVMST
– 7th Annual Cost Schedule Performance Management Conference materials, Various Authors, 1995
NEW!
Presented at the 2017 ICEAA Professional Development & Training Workshop www.iceaaonline.com/portland2017

© 2002-2013 ICEAA. All rights reserved.
v1.2
Unit V - Module 15 96
References• Miscellaneous
– wInsight IPT Survival Guide, Eleanor Haupt, NAVAIR, and MAJ
Cassy Robinson, USAFR, Joint Primary Aircraft Training System
Program,
http://www.earnedvalue.biz/downloads/winsight_resources/Masteri
ng.pdf
– Earned Value Homepage, Office of Secretary of Defense (OSD),
http://www.acq.osd.mil/evm, 2003
– Earned Value Management Gold Card, Defense Acquisition
University (DAU),
https://acc.dau.mil/CommunityBrowser.aspx?id=19577, 2012
– Earned Value Bibliography,
http://www.suu.edu/faculty/christensend/ev-bib.html
– “Cost Performance Index Stability,” David S. Christensen and Scott
Heise, National Contract Management Journal, 1993
Presented at the 2017 ICEAA Professional Development & Training Workshop www.iceaaonline.com/portland2017

© 2002-2013 ICEAA. All rights reserved.
v1.2
Unit V - Module 15 97
Integrated Program Management Report
• Integrated Program Management Report
(IPMR)
– Cost and Schedule reporting format (DI-MGMT-
81861) required for solicitations and RFPs issued
after July 1, 2012
– Replaces previously required CPR (DI-MGMT-
81466A) and IMS (DI-MGMT-81650)
– Formats 1 – 6 are reported monthly and Format 7 is annually
– Formats 1 – 4 remain similar to CPR reporting, Format 5 is revised and Formats 6 - 7 are new
NEW!
Presented at the 2017 ICEAA Professional Development & Training Workshop www.iceaaonline.com/portland2017

© 2002-2013 ICEAA. All rights reserved.
v1.2
Unit V - Module 15 98
IPMR Formats
• Format 1 (WBS Report)– Current period and cumulative data by WBS
• Format 2 (Functional Report)– Current period and cumulative data by functional categories
• Format 3 (Baseline Report)– PMB changes enacted in current month
• Format 4 (Manpower Report)– Actual and latest revised manpower reported by functional categories
• Format 5 (Variance Report)– Narrative summary of top 15 variances, impact, and corrective action
• Format 6 (Schedule Report)– Program Integrated Master Schedule (IMS)
• Format 7 (Historical Report)– Time-phased historical & forecast cost submission
NEW!
Presented at the 2017 ICEAA Professional Development & Training Workshop www.iceaaonline.com/portland2017

© 2002-2013 ICEAA. All rights reserved.
v1.2
Unit V - Module 15 99
Contract Performance Report
• Contract Performance Report (CPR)
– DI-MGMT-81466A
– Typically used for larger, higher interest
programs
– Most common formats requested by Government are Formats 1, 3, and 5
– Most companies manage by functional categories (Format 2 and 4)
Presented at the 2017 ICEAA Professional Development & Training Workshop www.iceaaonline.com/portland2017

© 2002-2013 ICEAA. All rights reserved.
v1.2
Unit V - Module 15 100
CPR Formats
• Format 1 (WBS Report)
– Current period and cumulative data by WBS
• Format 2 (Functional Report)
– Current period and cumulative data by functional categories
• Format 3 (Baseline Report)
– PMB changes enacted in current month
• Format 4 (Manpower Report)– Actual and latest revised manpower reported by functional
categories
• Format 5 (Variance Report)– Narrative summary of variances, impact, and corrective action
Presented at the 2017 ICEAA Professional Development & Training Workshop www.iceaaonline.com/portland2017

© 2002-2013 ICEAA. All rights reserved.
v1.2
Unit V - Module 15 101
Other Cost Reports
• Cost/Schedule Status Report (CSSR):– Similar to CPR Format 1, but reports only
cumulative data
– This report was rescinded with the March 2005 EVM memo from USD AT&L
– Contracts in place in March 2005 may still use this report
• Contract Funds Status Report (CFSR): Contractor’s estimate for contract funding requirements
• Contractor Cost Data Report (CCDR):– Primary method used to collect historical cost data
on DoD programs
4
Presented at the 2017 ICEAA Professional Development & Training Workshop www.iceaaonline.com/portland2017

© 2002-2013 ICEAA. All rights reserved.
v1.2
Unit V - Module 15 102
Related and Advanced Topics
• Earned Value History
• Integrated Baseline Review
• Baseline Analysis
• DCMA Tripwires
• EV, ES, and the IMS
• EVM/RM Integration
• Advanced EACs
• Rules of Thumb
Presented at the 2017 ICEAA Professional Development & Training Workshop www.iceaaonline.com/portland2017
© 2002-2013 ICEAA. All rights reserved.
v1.2
Unit V - Module 15 103
Earned Value History
• Cost/Schedule Control System Criteria (C/SCSC)– Established in 1967 by Government
– Defined minimal standards for contractor management control systems
– Based on studies of Industry and Gov’t practices
– Did not impose a specific system
• Industry Standard Guidelines for EVMS– Industry-defined standards and practices for
managing acquisitions
– Recognized by DoD in 1996 as a reliable basis for earned value management
http://www.acq.osd.mil/evm/resources/policies-standards.shtml
Presented at the 2017 ICEAA Professional Development & Training Workshop www.iceaaonline.com/portland2017

© 2002-2013 ICEAA. All rights reserved.
v1.2
Unit V - Module 15 104
Integrated Baseline Review (IBR)
• An Integrated Baseline Review (IBR) is conducted after contract award
– Government PM and technical staff work jointly with contractor counterparts
– Verify the technical content of the PMB
– Verify sufficiency of the related budgets and schedules
• IBR also supports understanding of risks inherent in the PMB
• Typically, follow-on IBRs occur after a major program event (e.g. rolling wave, re-plan, re-baseline, single-point-adjustment or OTB)
Presented at the 2017 ICEAA Professional Development & Training Workshop www.iceaaonline.com/portland2017

© 2002-2013 ICEAA. All rights reserved.
v1.2
Unit V - Module 15 105
What is Reviewed in an IBR?
Product Delivery Planning (Business Case, Program Execution Plan, Requirements Set)
Program Phases and Control Gates(Design, Develop, Test, Production, Deploy)
SRR PDR TRR IOC FOC
Technical / Prog Mgmt
Schedule
Resources
• SOW
• CWBS/OBS
• CWBS Dictionary
• Requirements
• Technical Framework
• Product to CWBS mapping
• BOM
• Program Management Plan
• Risk Management Plan
• Program Execution Plan
• Technical Planning Assumptions
and Risks
• RAM
• Work Authorizations
• Task Descriptions
• Budget Change Request
• BOE
• Planning Templates
• Integrated Master Schedule
• Summary, Intermediate, Detail
schedules
• Vertical and Horizontal Integration
• Schedule Margin / Reserve
• Critical Path
• Schedule Assumptions and Risks
• Dependencies: Internal, External,
GFx, Legacy / Heritage
• Entry and Exit Criteria
• Resource Loaded Schedule
• Control Account Plans-
Timephased budget and
resources
• Weekly name runs
• Staffing plans
• Time-phased forecast
• Reports (CPR, CFSR)
Risks and Opportunities (Quantified / Qualified)
Process
Framework and
Artifacts enables
Standard Work,
Templates,
Planning
Feeds
Demonstrate
Relationships in
Wall-walks,
Storyboards
With threaded
traces
Show
Presented at the 2017 ICEAA Professional Development & Training Workshop www.iceaaonline.com/portland2017

© 2002-2013 ICEAA. All rights reserved.
v1.2
Unit V - Module 15 106
Baseline Analysis
• Common Baseline Problems include:– Rubber Baseline
• Excessive changes
• “Kick the can down the road,” i.e., moving work toward end of contract - More painful to fix later
– Front-Loaded Baselines• Too much budget and insufficient work planned in early
stage off project
• Represents poor initial planning
– Out of Date baselines• Contract changes not incorporated into PMB in a timely
manner
• Baseline lacks sufficient detail to achieve adequate performance measurement
Presented at the 2017 ICEAA Professional Development & Training Workshop www.iceaaonline.com/portland2017

© 2002-2013 ICEAA. All rights reserved.
v1.2
Unit V - Module 15 107
Baseline Analysis - Rebaselining
• PMB changes frequently throughout the life of the contract– Typical to change at least quarterly due to added
work or unforeseen changes requiring use of MR
– Referred to as Baseline Change
• PMB is frequently Rebaselined at least once during project– Rebaseline represents major revamping of PMB
– Acceptable reasons to Rebaseline include:• Major new work awarded/added to contract
• Customer driven changes to end product
• Approval of new approach to solving customer problem
– Avoid rebaselining solely to eliminate variances
Presented at the 2017 ICEAA Professional Development & Training Workshop www.iceaaonline.com/portland2017

© 2002-2013 ICEAA. All rights reserved.
v1.2
Unit V - Module 15 108
Baseline Analysis – OTB
• Over Target Baseline (OTB) developed
when:
– Work performed is no longer consistent
with the PMB and CBB
– Contractor needs OTB to effect proper
management control
• OTB typically used when remaining
work is significantly greater than
available budget
Presented at the 2017 ICEAA Professional Development & Training Workshop www.iceaaonline.com/portland2017

© 2002-2013 ICEAA. All rights reserved.
v1.2
Unit V - Module 15 109
Baseline Analysis – OTB
• OTB, as with any major replan, should
be used with caution
– Masks contract performance
– Should be done early and only once
– Best to use OTB from current position and
not erase past variances
Presented at the 2017 ICEAA Professional Development & Training Workshop www.iceaaonline.com/portland2017

© 2002-2013 ICEAA. All rights reserved.
v1.2
Unit V - Module 15 110
Baseline Analysis – Post Rebaseline
• If rebaseline is major, it presents a challenge
for analyzing performance data
• A rebaseline usually eliminates all variances
– Often sets BCWS=BCWP=ACWP so CV=SV=0
– Updates BAC and LRE so VAC=0
– Cumulative Performance Indices hover near 1.0
• Cumulative data shows smaller % variances
since the base is larger
• Difficult to see if contractor is performing any
better than before rebaseline
Presented at the 2017 ICEAA Professional Development & Training Workshop www.iceaaonline.com/portland2017

© 2002-2013 ICEAA. All rights reserved.
v1.2
Unit V - Module 15 111
Baseline Analysis –
Post Rebaseline Tips• Better analysis conducted by
considering performance since the rebaseline
– Subtract cumulative BCWS, BCWP & ACWP at the rebaseline point from cumulative BCWS, BCWP & ACWP reported in current month’s reports
– Compute CV, SV, CPI, etc. using the modified values
– Provide measure of performance since the re-baseline
Presented at the 2017 ICEAA Professional Development & Training Workshop www.iceaaonline.com/portland2017

© 2002-2013 ICEAA. All rights reserved.
v1.2
Unit V - Module 15 112
Baseline Analysis - Example
• Example:
– January
• BCWS = BCWP = ACWP = $100
– July
• BCWS = $150; BCWP = $145; ACWP = $150
• Cumulative CPI, SPI:
– CPI = BCWP / ACWP = $145 / 150 = 0.97
– SPI = BCWP / BCWS = $145 / 150 = 0.97
– Looks good!
Presented at the 2017 ICEAA Professional Development & Training Workshop www.iceaaonline.com/portland2017

© 2002-2013 ICEAA. All rights reserved.
v1.2
Unit V - Module 15 113
Baseline Analysis - Example
• Performance Data since Rebaseline
– Jan to Jul BCWS = $150 – $100 = $50
– Jan to Jul BCWP = $145 – $100 = $45
– Jan to Jul ACWP = $150 – $100 = $50
• CPI, SPI since Rebaseline
– CPI = BCWP / ACWP = $45 / 50 = 0.9
– SPI = BCWP / BCWS = $45 / 50 = 0.9
– Not so good!
Presented at the 2017 ICEAA Professional Development & Training Workshop www.iceaaonline.com/portland2017
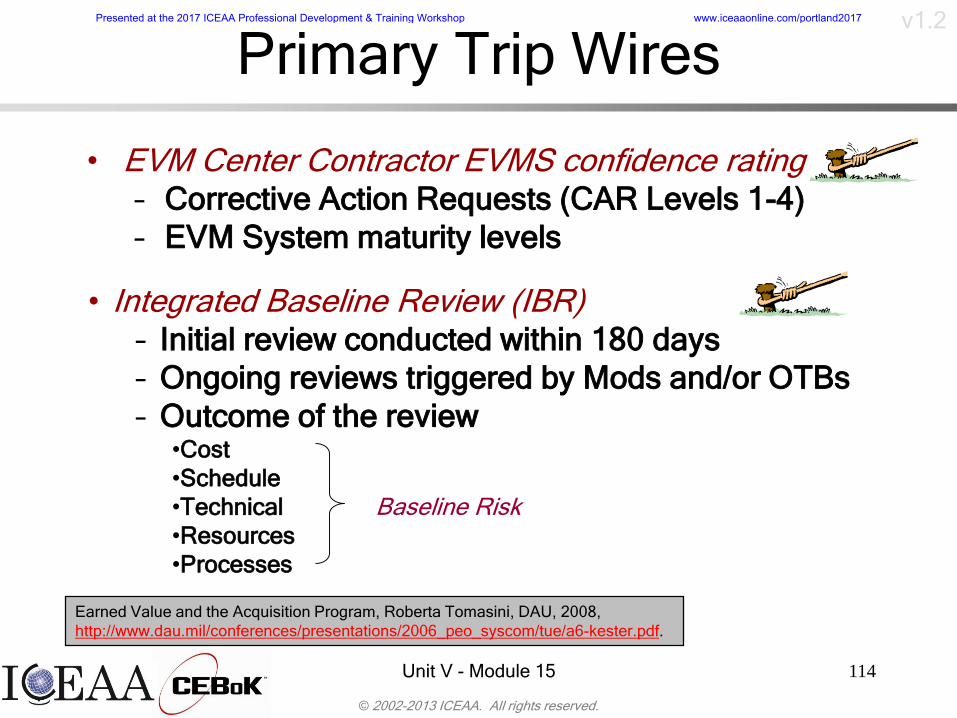
© 2002-2013 ICEAA. All rights reserved.
v1.2
Unit V - Module 15 114
• EVM Center Contractor EVMS confidence rating– Corrective Action Requests (CAR Levels 1-4)
– EVM System maturity levels
Primary Trip Wires
• Integrated Baseline Review (IBR)– Initial review conducted within 180 days
– Ongoing reviews triggered by Mods and/or OTBs
– Outcome of the review•Cost
•Schedule
•Technical Baseline Risk•Resources
•Processes
Earned Value and the Acquisition Program, Roberta Tomasini, DAU, 2008,
http://www.dau.mil/conferences/presentations/2006_peo_syscom/tue/a6-kester.pdf.
Presented at the 2017 ICEAA Professional Development & Training Workshop www.iceaaonline.com/portland2017

© 2002-2013 ICEAA. All rights reserved.
v1.2
Unit V - Module 15 115
• Baseline Execution Index (BEI) – IMS– Cum index less than 0.95
• Schedule Performance Index (SPI) – CPR– Cum index less than 0.95
• Critical Path Length Index (CPLI) – IMS– Cum index less than 0.95
• Cost Performance Index (CPI) – CPR– Cum index less than 0.95
• To Complete Performance Index (TCPI) – CPR– CPI to TCPI delta of 10%
• Contract Modifications– Contract Mods to Original Base value of 10%
• PMB Revisions – CPR, CFSR– Changes to Monthly Time-Phased PMB value of 5%
Secondary Trip Wire Metrics
Earned Value and the Acquisition Program, Roberta Tomasini, DAU, 2008,
http://www.dau.mil/conferences/presentations/2006_peo_syscom/tue/a6-kester.pdf.
Presented at the 2017 ICEAA Professional Development & Training Workshop www.iceaaonline.com/portland2017

© 2002-2013 ICEAA. All rights reserved.
v1.2
Unit V - Module 15 116
Earned Value and the IMS
• EVMS should be tied to the Integrated Master Schedule (IMS) in some fashion– Same WBS
– BCWS developed/updated using task information captured in IMS
– Sometimes BCWP % complete derived from IMS
• EVMS SV in terms of $ and %, not time– Treat EVMS SV as an indicator/warning
– True schedule analysis on IMS is best way to assess schedule status
– Earned Schedule analysis used to provide additional understanding of IMS issues
AKA Master
Schedule
Presented at the 2017 ICEAA Professional Development & Training Workshop www.iceaaonline.com/portland2017

© 2002-2013 ICEAA. All rights reserved.
v1.2
Unit V - Module 15 117
Master Program Schedule1.0
1.1 1.2 1.8
1.8.31.8.21.8.1 1.8.4
1.8.3.21.8.3.1 1.8.3.3
CA #1
CA #2
CA #3
ControlAccounts
WBS 1.1 ---WBS 1.2 ---WBS 1.3 ---WBS 1.4 ---
WBS 1.8 ---
1996-98 1999-01 2002-04
WBS 1.8.3.1WBS 1.8.3.2WBS 1.8.3.3WBS 1.8.3.4---------------
2002
Intermediate Schedule
WBS 1.8.3
2003 2004
WBSLevel 1
WBSLevel 2
WBSLevel 3
WBSLevel 4
x.2 ax.2 bx.2 cx.2 dPlanning Pkgsx.2 ppx. 2pp
1.8.3.1.2
Work Packages
Control Account #2 Schedule
FJ M A M J J A S O N D
Schedules and work plans are developed based on summary level constraints
and contractual milestones
IMS/EVM Integration via WBS
NEW!
Presented at the 2017 ICEAA Professional Development & Training Workshop www.iceaaonline.com/portland2017

© 2002-2013 ICEAA. All rights reserved.
v1.2
Unit V - Module 15 118
Earned Value and the IMS
• Compare SV to IMS task Schedule Delay– If task on critical path, SV corresponds to time
delay
– If task not on critical path, SV may not correspond to time delay, unless SV causes task to become critical
– Calculate Slip using EV data:
Slip(mths) = Cum SV / Avg 3-mth Cur BCWS • Translate into weeks (*4.3), workdays (*22), or calendar
days (*30)
• Variations on BCWS (ITD Avg, 6-mth Avg, Current)
• As average BCWS approaches 0 (near end of project), Slip rises exponentially – does not reflect reality
Presented at the 2017 ICEAA Professional Development & Training Workshop www.iceaaonline.com/portland2017

© 2002-2013 ICEAA. All rights reserved.
v1.2
Unit V - Module 15 119
Earned Value and the IMS
• EV and IMS are never completely in
sync
– Differences could be due to different
analytics
– Don’t get hung up on numbers, but focus
on qualitative inconsistencies
– Sort out & explain inconsistencies
– Recommend policy/procedure changes if
needed
Presented at the 2017 ICEAA Professional Development & Training Workshop www.iceaaonline.com/portland2017

© 2002-2013 ICEAA. All rights reserved.
v1.2
Unit V - Module 15 120
Critical Path (CP) vs. Non-CP SVs
Time now
SV causes task to
extend beyond
projected end date
Schedule delay
Pushes out this task
Pushes out this task
Schedule delay
at complete
Critical Path
9
Time now
SV causes task to
extend beyond
projected end date
Schedule delay
Pushes out this task
Pushes out this task
Critical Path
Tasks 5, 6, 7
Schedule delay at
complete for this task,
but still before CP end
date, so no schedule
delay for program
Non Critical Path
Tasks 1, 2, 3, 4
SV
on
CP
= D
ela
yS
V n
ot
on
CP
<>
De
lay
Presented at the 2017 ICEAA Professional Development & Training Workshop www.iceaaonline.com/portland2017

© 2002-2013 ICEAA. All rights reserved.
v1.2
Unit V - Module 15 121
Analysis of Past Performance -
Earned Schedule (ES)• Analysis of schedule performance using EVM is
limited– Measures schedule performance in cost, not in units of time
– SV always returns to zero, even if the project is behind schedule in terms of time
• Earned Schedule (ES) - new analytical technique – Stems from EVM and uses same data
– Bridge between EVM and integrated schedule analysis
– Provides a schedule metric in terms of time, not cost
• The PMI EVM Practice Standard includes information on ES, but notes it is an emerging practice– Use with caution
• www.earnedschedule.com provides a consolidated forum for ES information and resources
Presented at the 2017 ICEAA Professional Development & Training Workshop www.iceaaonline.com/portland2017

© 2002-2013 ICEAA. All rights reserved.
v1.2
Unit V - Module 15 122
Analysis of Past Performance –
SV(t) and SPI(t)• Note: ES metrics developed under PMI and therefore
use the PMI earned value terms of PV (aka BCWS) and EV (aka BCWP).
• ES calculated by comparing the PV to the EV for completed work and adding the fraction of the incomplete PV work– EScum = C + I where:
C = number of whole time increments of the PMB for which EV ≥ PV
I = (EV – PVC) / (PVC+1 – PVC)
• As work progresses, ES provides a SV(t) and SPI (t) metric to measure schedule performance in terms of time– SV(t) = ES – Actual Time (AT)
– SPI(t) = ES / AT
Presented at the 2017 ICEAA Professional Development & Training Workshop www.iceaaonline.com/portland2017

© 2002-2013 ICEAA. All rights reserved.
v1.2
Unit V - Module 15 123
Analysis of Past Performance –
SV($) vs. SV(t)
• Graphical Comparison of EVM’s SV and
ES’s SV:SV(t) vs SV($)
0
50
100
150
200
250
Time
$
PV EV
Time Now
PVcum
EVcum
SV(t)Behind schedule in time terms
ES AT
SV($)Behind schedule
in monetary terms
Presented at the 2017 ICEAA Professional Development & Training Workshop www.iceaaonline.com/portland2017
© 2002-2013 ICEAA. All rights reserved.
v1.2
Unit V - Module 15 124
EVM/RM Integration
• EVM is focused on integration of
technical, schedule, and cost
• Risk management is focused on
planning, tracking, handling, and
reporting risks
“Integrating EVM with RM A Statistical Analysis of Survey Results,” Alissa Kumley, Peter Braxton, Richard
Coleman, Wayne Abba, Gay Infanti, John Driessnack, SCEA/ISPA, 2005.
Presented at the 2017 ICEAA Professional Development & Training Workshop www.iceaaonline.com/portland2017

© 2002-2013 ICEAA. All rights reserved.
v1.2
Unit V - Module 15 125
EVM/RM Integration Key Findings• Training
– Training will help to overcome • Barriers associated with process immaturity and lack of knowledge/skills needed to integrate
• Improper EVM usage (perception that it is a financial tool)
– Training is needed to improve understanding of benefits of integrating EVM and RM
– Should reside in PM curriculum
– Should include techniques and tools for achieving process integration
• Policy – Policy changes & implementation guidance will help remove integration barriers
• Lack of management commitment
• Internal/external culture
• Emotional
• Process– Major barrier to process integration is organizational
– Overcoming these boundaries is necessary for integrations success
– NDIA PMSC should partner with other communities to create demand for process integration through cross-functional cooperation
“Integrating EVM with RM A Statistical Analysis of Survey Results,” Alissa Kumley, Peter Braxton, Richard Coleman, Wayne Abba, Gay Infanti,
John Driessnack, SCEA/ISPA, 2005
Presented at the 2017 ICEAA Professional Development & Training Workshop www.iceaaonline.com/portland2017

© 2002-2013 ICEAA. All rights reserved.
v1.2
Unit V - Module 15 126
Advanced EACs
• Other EAC calculations
– ACWP + BCWR
• May be acceptable for LOE only
– ACWP + BCWR/(0.8CPI + 0.2SPI)
• Use towards end of contract
• Variation – use X% CPI and Y% SPI provided X+Y=100%
and can justify reason behind X, Y selection
– Variations on CPI Forecast (BAC/CPI):
• 3 month CPI
• 6 month CPI
• Current month CPI (very volatile)
– Perform linear regression using ACWP vs. BCWP 8
Presented at the 2017 ICEAA Professional Development & Training Workshop www.iceaaonline.com/portland2017

© 2002-2013 ICEAA. All rights reserved.
v1.2
Unit V - Module 15 127
Progress-Based EACs
• EACs are notoriously difficult to predict
• Significant improvement in EAC prediction
can be achieved if there is a reliable
unbiased indicator of progress
– If the progress indicator is sufficiently granular,
unbiased EACs with standard errors of as little
as 10% can be achieved by the 20% progress
point and better SEEs are achievable at greater
progress
“Progress-based EAC calculations: Ending the EAC Tail Chase: An Unbiased EAC Predictor using Progress
Metrics,” Eric R. Druker, Richard L. Coleman, Elizabeth L. Boyadjis, Jeffrey R. Jaekle, SCEA, 2007
Presented at the 2017 ICEAA Professional Development & Training Workshop www.iceaaonline.com/portland2017

© 2002-2013 ICEAA. All rights reserved.
v1.2
Unit V - Module 15 128
Rules of Thumb – Cost
• Cum CPI usually stable once project is 15-
20% complete
• Cum CPI will not change more than 10% from
the value at the 20% complete point in time
• Percent overrun at completion will not be less
than percent overrun at 15% complete
• Statistically, subcontracts will overrun more,
in percent, than the prime contract
These are generally believed to
be true but may conflict with real-
world examples
Presented at the 2017 ICEAA Professional Development & Training Workshop www.iceaaonline.com/portland2017

© 2002-2013 ICEAA. All rights reserved.
v1.2
Unit V - Module 15 129
Rules of Thumb – Schedule
• Cum SPI usually stable once project is 15-20% complete
• Early SVs typically lead to CVs later – Managers tend to respond to schedule delays by applying more resources and overtime
• SV is self-healing:– As % complete approaches 100%, SV approaches 0
– Once % complete > 80%, place less emphasis on SV
• Programs relying heavily on software are typically further behind than non-software-intensive programs
These are generally believed to
be true but may conflict with real-
world examples
Presented at the 2017 ICEAA Professional Development & Training Workshop www.iceaaonline.com/portland2017

© 2002-2013 ICEAA. All rights reserved.
v1.2
Unit V - Module 15 130
Earned Value Tools
• Tools Overview
• EVMS Tools
• EV Analysis
Tools
Presented at the 2017 ICEAA Professional Development & Training Workshop www.iceaaonline.com/portland2017

© 2002-2013 ICEAA. All rights reserved.
v1.2
Unit V - Module 15 131
Tools Overview
• Two types of tools:
– Tools for implementing EVMS and
tracking/reporting earned value
– Tools for analyzing earned value data
• For more information on tools not
discussed in this presentation, see https://acc.dau.mil/CommunityBrowser.aspx?id=17609
Presented at the 2017 ICEAA Professional Development & Training Workshop www.iceaaonline.com/portland2017

© 2002-2013 ICEAA. All rights reserved.
v1.2
Unit V - Module 15 132
EVMS Tools
• Tools for implementing EVMS– Artemis Views
Artemis Management Systemshttp://www.aisc.com
– Dekker TRAKKERDekker Ltd.http://www.dekkerltd.com/
– Deltek
• Deltek Cobra
– http://www.deltek.com/products/ipm/cobra.aspx
• Deltek MicroFrame Project Manager (MPM)http://www.deltek.com/products/ipm/mpm.aspx
Presented at the 2017 ICEAA Professional Development & Training Workshop www.iceaaonline.com/portland2017

© 2002-2013 ICEAA. All rights reserved.
v1.2
Unit V - Module 15 133
EVMS Tools – Artemis Views
• “Artemis Views the industry leading enterprise
project and resource management solution
delivers enhanced project management
capability through a single, synchronized
product suite. With Earned Value
Management, organizations can manage and
control all cost related project and program
information on an enterprise level by using
familiar cost planning tools from a single,
graphical Windows-based application.”
– More information available on the Web
Presented at the 2017 ICEAA Professional Development & Training Workshop www.iceaaonline.com/portland2017
© 2002-2013 ICEAA. All rights reserved.
v1.2
Unit V - Module 15 134
EVMS Tools – Dekker TRAKKER®
• “Dekker TRAKKER® is the enterprise project management (EPM) engine that drives the Dekker PMIS™. TRAKKER comes equipped to manage cost, schedule, resource, performance and financial information, and can integrate with any existing software and servers you might already use, such as Microsoft® Project, Office or SQL Server. An earned value component is available for users who control their efforts via earned value management (EVM).” – More information available on the Web
Presented at the 2017 ICEAA Professional Development & Training Workshop www.iceaaonline.com/portland2017

© 2002-2013 ICEAA. All rights reserved.
v1.2
Unit V - Module 15 135
EVMS Tools – Deltek CobraTM
• Deltek Cobra is an easy-to-use, powerful system for managing project costs, measuring earned value and analyzing budgets, actuals and forecasts. Complete with an intuitive interface, helpful wizards and government compliance reporting, Deltek Cobra helps businesses comply with rigorous government standards such as:
– American National Standards Institute / Electronics Industry Alliance 748 for Earned Value Management Systems (ANSI 748)
– Office of Management and Budget (OMB) Circular No. A-11 Exhibit 300 and 53
– Cost/Scheduling Status Report/Defense Federal Acquisition Regulation Supplement (C/SSR DFARS) clauses
– Earned Value Management Implementation Guide (EVMIG) of the Defense Contract Management Agency (DCMA)
– NASA Interim Directive to NPR 7120.5C, NASA Program and Project Management Processes and Requirements
– Australian Department of Defense 5655
• More information available on the Web
Presented at the 2017 ICEAA Professional Development & Training Workshop www.iceaaonline.com/portland2017
© 2002-2013 ICEAA. All rights reserved.
v1.2
Unit V - Module 15 136
EVMS Tools – Deltek MPMTM
• Deltek MPM is a program-based earned value measurement
solution that is both easy to install and use. Used by hundreds of
organizations—including 8 of the top 10 aerospace and defense
contractors—Deltek's EVM software is compliant with ANSI/EIA-748
and supports critical programs for Department of Defense,
Department of Energy, NASA and Department of Transportation.
With MPM, you can:
– Identify trends early and adjust tactics to meet diverse program challenges
– Plan, track and analyze projects effectively throughout the entire program
lifecycle
– Enable cross-project analysis with MPM's comprehensive data warehouse
– Enhance pricing, planning and "what if" analysis with powerful utilities
– Improve managers' visibility with real-time project analysis
– Take advantage of more than 80 standard, government and compliance
reporting templates
– Support better decision making and increase customer satisfaction
• More information available on the Web
Presented at the 2017 ICEAA Professional Development & Training Workshop www.iceaaonline.com/portland2017

© 2002-2013 ICEAA. All rights reserved.
v1.2
Unit V - Module 15 137
EV Analysis Tools
• Tools for analyzing Earned Value
– wInsight
Deltek, Inc.
http://www.deltek.com/products/ipm/winsi
ght.aspx
– Dekker iPursuit
Dekker Ltd.
http://www.dekkerltd.com/ipursuit.aspx
Presented at the 2017 ICEAA Professional Development & Training Workshop www.iceaaonline.com/portland2017

© 2002-2013 ICEAA. All rights reserved.
v1.2
Unit V - Module 15 138
EV Analysis Tools – wInsight
• “Deltek wInsight™ is the de facto standard for analyzing, sharing, and reporting earned value management data. wInsight's standard set of reports provide early warning indicators to quickly identify variances in project performance, enabling organizations to proactively identify potential problems before they occur. wInsight is designed to give an easy to understand, program-level view to technical, schedule and financial professionals.”– More information available on the Web
Presented at the 2017 ICEAA Professional Development & Training Workshop www.iceaaonline.com/portland2017

© 2002-2013 ICEAA. All rights reserved.
v1.2
Unit V - Module 15 139
wInsight: Stoplight Table
WBS Description % Cmp BCWS BCWP ACWP SV SV CV CV BAC LRE VAC VAC CPI SPI TCPI-LRE CPI Fcst CPI*SPI Fcst
1 0 Project Level 76.8 32,548 31,969 34,381 -579 h -2,411 h 41,639 41,639 0 h 0.930 0.982 1.332 44780 44968
2 75.3 28,362 28,014 30,429 -348 h -2,415 h 37,215 37,489 -274 i 0.921 0.988 1.303 40422 40546
3 A PROGRAM MANAGEM 91.9 1,760 1,760 1,742 0 n 19 h 1,915 1,748 168 h 1.011 1.000 24.763 1895 1895
4 AC SUBCONTRACTORS 57.5 10,986 10,986 10,984 0 n 2 i 19,111 16,073 3,038 i 1.000 1.000 1.596 19107 19107
5 B System Engineer 91.5 1,507 1,493 1,196 -14 i 297 h 1,631 1,226 405 n 1.248 0.991 4.677 1307 1308
6 C Software Engine 98.9 7,959 7,872 8,677 -87 h -805 n 7,959 9,895 -1,936 n 0.907 0.989 0.072 8773 8774
7 D HARDWARE ENGINE 100.0 367 393 313 26 h 80 h 393 313 80 n 1.255 1.072 0.000 313 313
8 E Integration & T 88.1 3,232 3,028 4,943 -204 h -1,916 i 3,438 5,638 -2,200 n 0.612 0.937 0.591 5613 5658
9 F ILS IPT 84.4 443 374 493 -69 h -120 n 443 507 -65 n 0.757 0.844 4.921 584 601
10 G Hardware Fabric 90.7 2,108 2,108 2,081 0 n 28 h 2,325 2,089 236 n 1.013 1.000 26.530 2294 2294
11 [PMB] PERF MEASURE BL 76.8 32,548 31,969 34,381 -579 h -2,411 h 41,639 41,639 0 h 0.930 0.982 1.332 44780 44968
Presented at the 2017 ICEAA Professional Development & Training Workshop www.iceaaonline.com/portland2017

© 2002-2013 ICEAA. All rights reserved.
v1.2
Unit V - Module 15 140
wInsight: Future Baseline Tracking
BCWS Comparison
0.0
500.0
1,000.0
1,500.0
2,000.0
2,500.0
3,000.0
3,500.0
4,000.0
Dec-07 Jan-08 Feb-08 Mar-08 Apr-08 May-08 Jun-08 Jul-08 Aug-08 Sep-08 Oct-08 Nov-08 Dec-08 Jan-09
Fu
ture
Pla
n (
BC
WS
)
Nov-07 Dec-07 Jan-08 Feb-08 Mar-08
Presented at the 2017 ICEAA Professional Development & Training Workshop www.iceaaonline.com/portland2017

© 2002-2013 ICEAA. All rights reserved.
v1.2
Unit V - Module 15 141
wInsight: ACWP Chart
WBS Description % Cmp ACWP BAC LRE ACWP-BAC ACWP-LRE BCWP CV VAC CPI Fcst CPI*SPI Fcst
1 CLIN002ND 96.24 4,511.1 3,447.4 4,066.0 1063.7 445.1 3,317.8 i n 4,687.3 4,687.3
2 K 96.84 7,959.9 7,775.5 7,893.7 184.4 66.2 7,529.9 n n 8,219.5 8,219.1
3 CLIN001AH 98.23 13,952.0 13,909.4 13,909.9 42.6 42.1 13,663.8 h n 14,202.8 14,202.6
4 UM 99.27 1,953.8 1,916.0 1,916.0 37.8 37.8 1,902.0 i n 1,968.2 1,968.2
5 F 99.80 1,929.6 1,927.0 1,927.0 2.6 2.6 1,923.2 n n 1,933.4 1,933.4
6 C 99.88 24,577.9 24,181.9 24,181.9 396.0 396.0 24,153.8 n n 24,606.5 24,606.5
Presented at the 2017 ICEAA Professional Development & Training Workshop www.iceaaonline.com/portland2017

© 2002-2013 ICEAA. All rights reserved.
v1.2
Unit V - Module 15 142
wInsight: TCPI Chart
WBS DESCRIPTION %Cmp CPI TCPI-LRE CPI - TCPI CV CV BAC LRE VAC VAC SV SV CPI Fcst CPI*SPI Fcst
1 AC SUBCONTRACTORS 57.49 1.000 1.596 -0.596 2.3 i 19,111.1 16,073.2 3,037.9 i 0.0 n 19,107.1 19,107.1
2 PMB PERF MEASURE BL 76.78 0.930 1.332 -0.402 -2411.4 h 41,638.8 41,638.8 0.0 h -578.5 h 44,779.6 44,967.7
3 F ILS IPT 84.43 0.757 4.921 -4.164 -119.7 n 442.6 507.4 -64.8 n -68.9 h 584.4 601.1
4 COM COST OF MONEY 89.38 1.231 3.684 -2.453 42.1 h 250.9 189.4 61.5 h -18.3 h 203.8 205.6
5 G&A GEN & ADMIN 89.40 0.990 2.319 -1.329 -39.0 h 4,173.3 3,960.6 212.7 h -212.1 h 4,217.0 4,242.4
6 G Hardware Fabric 90.70 1.013 26.530 -25.517 27.8 h 2,324.5 2,088.7 235.8 n 0.0 n 2,293.9 2,293.9
7 B System Engineer 91.54 1.248 4.677 -3.429 296.8 h 1,631.2 1,225.9 405.3 n -13.8 i 1,307.0 1,308.0
8 A PROGRAM MANAGEM 91.91 1.011 24.763 -23.752 18.8 h 1,915.4 1,747.8 167.6 h 0.0 n 1,894.9 1,894.9
Presented at the 2017 ICEAA Professional Development & Training Workshop www.iceaaonline.com/portland2017

© 2002-2013 ICEAA. All rights reserved.
v1.2
Unit V - Module 15 143
EV Analysis Tools – iPursuit™
• “Dekker iPursuit® is a robust portfolio project management (PPM) analysis tool that can be used on a single project to monitor performance and ensure success, or that can be used to analyze an entire enterprise by linking to different, operational databases to establish the guidelines used for effective PPM. An optional earned value management (EVM) component is also available and can be used to easily extrapolate earned value information directly from Microsoft® Project.” – More information available on the Web
Presented at the 2017 ICEAA Professional Development & Training Workshop www.iceaaonline.com/portland2017