Economic Status and Acknowledgement of Earned Entitlement
14
Journal of Economic Behavior & Organization 118 (2015) 55–68 Contents lists available at ScienceDirect Journal of Economic Behavior & Organization j ourna l h om epa ge: w ww.elsevier.com/locate/jebo Economic status and acknowledgement of earned entitlement Abigail Barr a , Justine Burns b , Luis Miller c,∗ , Ingrid Shaw a University of Nottingham, School of Economics, Room B44, Sir Clive Granger Building, University Park, Nottingham NG7 2RD, UK b University of Cape Town, School of Economics, 5.03, New Building, Middle Campus, Cape Town, South Africa c University of the Basque Country (UPV/EHU), School of Economics and Business, Av. Lehendakari Aguirre 83, 48015 Bilbao, Spain a r t i c l e i n f o Article history: Received 9 January 2014 Received in revised form 13 February 2015 Accepted 16 February 2015 Available online 23 February 2015 JEL classification: D63 C91 C93 Keywords: Distributive justice Inequality Laboratory experiments a b s t r a c t We present a series of experiments that investigates whether tendencies to acknowledge entitlement owing to effort and productivity are associated with within-society economic status. Each participant played a four-person dictator game under one of two treatments, under one initial endowments were earned, under the other they were randomly assigned. The experiments were conducted in the United Kingdom, and South Africa. In both loca- tions we found that relatively well-off individuals make allocations to others that reflect those others’ initial endowments more when those endowments were earned rather than random; among relatively poor individuals this was not the case. © 2015 Elsevier B.V. All rights reserved. 1. Introduction The notion of distributive justice underpinning market-driven societies is that effort and productivity, owing to inherent talent or acquired ability, should be acknowledged and rewarded (Miller, 1976; Milne, 1986). In behavioural experiments, university students in the US and Europe have repeatedly acted in accordance with this notion. 1 However, Jakiela (2011) found that, in dictator games played with either windfalls or earnings, while US students exhibited a strong earned endow- ment effect, i.e., they were significantly more inclined to redistribute windfalls than earnings, poor Kenyan villagers did not. And Cappelen et al. (2013) found that, in dictator games played with earnings that depended on a mix of productivity and luck, students in Tanzania and Uganda rewarded productivity significantly less than students in Germany and Norway. Each of these two studies presents evidence of an Africa effect that is consistent with an argument put forward by Platteau (2000), that owing to Africa’s tribal structure and dependence on agriculture egalitarianism prevails and effort and productivity tend not to be rewarded. Such an Africa effect could, as Platteau points out, explain Africa’s slow economic development. ∗ Corresponding author. Tel.: +34 946013770. E-mail addresses: [email protected] (A. Barr), [email protected] (J. Burns), [email protected] (L. Miller), [email protected] (I. Shaw). 1 Contributions to this literature include Hoffman et al. (1994), Ruffle (1998), Konow (2000), Rutström and Williams (2000), Cherry (2001), Gantner et al. (2001), Cherry et al. (2002), Frohlich et al. (2004), Cappelen et al. (2007), Oxoby and Spraggon (2008), List and Cherry (2008). http://dx.doi.org/10.1016/j.jebo.2015.02.012 0167-2681/© 2015 Elsevier B.V. All rights reserved.
Transcript of Economic Status and Acknowledgement of Earned Entitlement
Ee
Aa
b
c
a
ARRAA
JDCC
KDIL
1
tufmAlotn
i
(
0
Journal of Economic Behavior & Organization 118 (2015) 55–68
Contents lists available at ScienceDirect
Journal of Economic Behavior & Organization
j ourna l h om epa ge: w ww.elsev ier .com/ locate / jebo
conomic status and acknowledgement of earnedntitlement
bigail Barra, Justine Burnsb, Luis Millerc,∗, Ingrid ShawUniversity of Nottingham, School of Economics, Room B44, Sir Clive Granger Building, University Park, Nottingham NG7 2RD, UKUniversity of Cape Town, School of Economics, 5.03, New Building, Middle Campus, Cape Town, South AfricaUniversity of the Basque Country (UPV/EHU), School of Economics and Business, Av. Lehendakari Aguirre 83, 48015 Bilbao, Spain
r t i c l e i n f o
rticle history:eceived 9 January 2014eceived in revised form 13 February 2015ccepted 16 February 2015vailable online 23 February 2015
EL classification:639193
eywords:istributive justice
nequalityaboratory experiments
a b s t r a c t
We present a series of experiments that investigates whether tendencies to acknowledgeentitlement owing to effort and productivity are associated with within-society economicstatus. Each participant played a four-person dictator game under one of two treatments,under one initial endowments were earned, under the other they were randomly assigned.The experiments were conducted in the United Kingdom, and South Africa. In both loca-tions we found that relatively well-off individuals make allocations to others that reflectthose others’ initial endowments more when those endowments were earned rather thanrandom; among relatively poor individuals this was not the case.
© 2015 Elsevier B.V. All rights reserved.
. Introduction
The notion of distributive justice underpinning market-driven societies is that effort and productivity, owing to inherentalent or acquired ability, should be acknowledged and rewarded (Miller, 1976; Milne, 1986). In behavioural experiments,niversity students in the US and Europe have repeatedly acted in accordance with this notion.1 However, Jakiela (2011)ound that, in dictator games played with either windfalls or earnings, while US students exhibited a strong earned endow-
ent effect, i.e., they were significantly more inclined to redistribute windfalls than earnings, poor Kenyan villagers did not.nd Cappelen et al. (2013) found that, in dictator games played with earnings that depended on a mix of productivity and
uck, students in Tanzania and Uganda rewarded productivity significantly less than students in Germany and Norway. Each
f these two studies presents evidence of an Africa effect that is consistent with an argument put forward by Platteau (2000),hat owing to Africa’s tribal structure and dependence on agriculture egalitarianism prevails and effort and productivity tendot to be rewarded. Such an Africa effect could, as Platteau points out, explain Africa’s slow economic development.∗ Corresponding author. Tel.: +34 946013770.E-mail addresses: [email protected] (A. Barr), [email protected] (J. Burns), [email protected] (L. Miller),
[email protected] (I. Shaw).1 Contributions to this literature include Hoffman et al. (1994), Ruffle (1998), Konow (2000), Rutström and Williams (2000), Cherry (2001), Gantner et al.
2001), Cherry et al. (2002), Frohlich et al. (2004), Cappelen et al. (2007), Oxoby and Spraggon (2008), List and Cherry (2008).
http://dx.doi.org/10.1016/j.jebo.2015.02.012167-2681/© 2015 Elsevier B.V. All rights reserved.
56 A. Barr et al. / Journal of Economic Behavior & Organization 118 (2015) 55–68
To our knowledge, Jakiela (2011) and Cappelen et al. (2013) are the only studies that identify systematic differencesin notions of distributive justice across societies using behavioural experimental methods. However, numerous analysesof attitudinal surveys such as the World Values Survey, the US General Social Survey and the European Social Surveyindicate that, within developed market-driven societies, the poor favour redistribution while the rich do not (Alesinaand Giuliano, 2011). This difference is consistent with early theoretical models of the political economy, which assumethat people care only about their own consumption.2 However, it is also consistent with models incorporating an other-regarding preference for fairness and Babcock and Loewenstein’s (1997) proposition that “people tend to arrive at judgmentsof what is fair or right that are biased in the direction of their own self-interests” (Babcock and Loewenstein, 1997:111).
In Kenya using a behavioural experiment similar to Jakiela’s (2011) conducted within the context of a field experiment,Jakiela et al. (2014) identified a causal effect running from academic achievement to acknowledgement of earned entitlement.If we assume that higher academic achievement is associated with higher expected future earnings, this finding is consistentwith Babcock and Loewenstein’s (1997) proposition.
The objective of this paper is to take a first step towards reconciling these distinct strands in the literature, i.e.: theexperimental studies focusing on US and European students who have repeatedly acknowledged earned entitlement; thestudies of Jakiela (2011) and Cappelen et al. (2013) identifying Africa-based subject pools that are less or entirely disinclinedto acknowledge earned entitlement; the survey-based analyses of Alesina and Giuliano (2011) and others, indicating thatpeople at the lower end of the income distributions of developed countries might also be less or entirely disinclined toacknowledge earned entitlement; and the recent study by Jakiela et al. (2014) revealing a causal effect that is consistentwith Babcock and Loewenstein (1997) within an African country.
The most notable lacuna in the body of evidence just described is experimental data pertaining to the notions of dis-tributive justice held by poorer people in developed countries. Such data would allow us to establish whether the observeddifferences in attitudes towards redistribution between the rich and poor in developed countries derive from nothing morethan a preference for own consumption or from other regarding preferences that depend on their relative economic status.In addition, if, in accordance with Babcock and Loewenstein (1997), we find that poor people in developed countries do notacknowledge earned entitlement, the prior discovery of people in Africa who do not acknowledge earned entitlement mustbe reviewed in a different light.
To address this lacuna we conducted a series of experiments designed to investigate whether an individual’s tendencyto acknowledge earned entitlement is associated with his or her economic status relative to others in the UK. We selectedunemployed residents of Oxford to represent low economic status individuals and students and employed individuals alsoresiding in Oxford as bases for comparison. The students allowed us to demonstrate that, when applied to the standardparticipant pool, our experiment yields the usual result, i.e., an earned endowment effect (EEE hereafter). However, theemployed are the better basis for comparison as they, rather than investing in their future economic status, are realizingtheir current actual economic status and are likely to be more comparable to the unemployed in terms of age, marital statusand familial responsibilities. We found a statistically significant EEE among the students and employed and no EEE amongthe unemployed.
Then, to investigate the generalizability of our findings, we extended the series to South Africa. We chose South Africabecause, while it is a middle income country, it is African, it has many problems in common with its lower income neighboursand, especially important given our objective, it has one of the highest inequality rates in the world (Finn et al., 2014). InSouth Africa, we focused on Cape Town, the location of one of the continent’s best universities. Thus, we were able tobuild a participant sample that was highly comparable to the Oxford sample in many regards, while varying in terms ofits wider societal context. In Cape Town, as in Oxford, we found a statistically significant EEE among the employed andno EEE among the unemployed. However, the average South African university student, like the Tanzanian and Ugandanstudents in Cappelen et al.’s (2013) study, tended not to acknowledge earned entitlement. Anticipating this and a less clear-cut distinction between the employed and unemployed, in South Africa our research design included the collection of dataon participants’ perceptions of their households’ economics status. When we used this data to re-categorize the Cape Townparticipants into the relatively well-off and the relatively poor, we found a highly statistically significant EEE among therelatively well-off, but not among the poor.3
Our findings support Babcock and Loewenstein’s (1997) proposition and indicate that it may explain variations in notionsof distributive justice not only within rich countries like the UK but also in middle income countries with high inequalitylike South Africa. At the same time, our findings are consistent with those of Cappelen et al. (2013) and suggest that, whileJakiela and co-authors’ findings are consistent with Platteau’s (2000) argument, they might alternatively be owing to thelow economic status of their Kenyan farmers relative to other Kenyans.
The remainder of the paper is organized as follows: Section 2, directly below, presents our experimental design, analyticalframework and hypotheses; Section 3 presents the results; and Section 4 concludes.
2 See Personn and Tabellini (2002) and Drazen (2002) for reviews of this literature.3 After conducting a similar but not identical re-categorization of the Oxford participants, we could not reject the hypothesis that the two datasets could
be pooled in a single regression analysis. The results of this exercise are reported in the on-line Supplementary Information (SI).
2
2
eotfsk
tcpttiw
(ifgaaost
2
rfitefTo
wim
eU
gi
A. Barr et al. / Journal of Economic Behavior & Organization 118 (2015) 55–68 57
. Empirical strategy
.1. Experimental design
At the core of the experimental design is a four person dictator game (4PDG). In this game, each participant i is initiallyndowed with a positive sum of money, yi, the initial endowments vary across the four participants, each knows his or herwn initial endowment and the initial endowments of the three other participants, and each is free to make final allocationso him or herself and to the others subject to the constraint that the sum of the four allocations must equal the sum of theour initial endowments. Once all the participants have made their allocation decisions, the decisions of one are randomlyelected to determine the final payoffs of all four participants. Play is one shot and anonymous, i.e., the participants nevernow the precise identities or full allocation sets of their three co-participants.
Prior to the 4PDG, the participants engaged in a real effort task and, in more than half of the experimental sessions,heir performance ranking in that task determined their initial endowments. However, in order to control for the possibleonditioning of final allocations on initial endowments even when they are not earned, in some experimental sessions thearticipants’ initial endowments were randomly assigned. These participants were also engaged in the real effort task, butheir performance in that task did not determine their initial endowment in the 4PDG. Below, we use the term “earnedreatment” when referring to the sessions in which the participants’ performance in the real effort task determined theirnitial endowments and “random treatment” when referring to the sessions in which the participants’ initial endowments
ere randomly assigned.The distribution of initial endowments across participants within sessions did not vary depending on the treatment
earned or random). In a session involving 16 Oxford-based participants (so four game sets of four participants), two receivednitial endowments of £20, four initial endowments of £14, two initial endowments of £12, two initial endowments of £10,our initial endowments of £8, and two initial endowments of £2.4 This enabled us to arrange the 16 participants into fourame sets, with each set’s initial endowments summing to £44.5 In sessions where initial 4PDG endowments were earned,ll 16 participants were ranked according to performance in the real effort task, their initial endowments were then assignedccordingly and then they were assigned to game sets. Basing initial endowments on performance rank rather than directlyn performance ensured the distribution of initial endowments was balanced across treatments and participant types.6 Inessions where initial 4PDG endowments were random, all 16 participants were simultaneously and randomly assignedheir initial endowments and to their game sets.
.2. Analytical framework
Several notions of distributive justice may guide participants’ decisions in the 4PDG. To characterize these notions, weely on the classification proposed by Cappelen et al. (2007). A participant applying a strict egalitarian ideal would equalizenal payoffs in the 4PDG, regardless of the treatment. A strict libertarian would leave initial endowments untouched in both,he random and the earned treatment. However, a meritocratic or liberal egalitarian participant would acknowledge initialndowments only in the earned treatment. Of course, we also expect to find purely selfish participants, who take everythingor themselves, and intermediate types, whose behaviour reflects a mix of two or more ideals as well as some selfishness.o include intermediate types in the analysis, we use an ad hoc variant of Cappelen et al.’s (2007) utility function to developur analytical framework.7
Consider a participant i with the following utility function:
Vi = xii − ˇi
∑
j /= i
(xij − mkij)
2
here xii is participant i’s allocation to him or herself in the 4PDG expressed as a proportion of the maximum amount that could allocate to him or herself (£44), xij is participant i’s allocation to participant j also expressed as a proportion of the
aximum amount that i could allocate to j (also £44), mkij
is the proportional allocation to j that participant i perceives as fair
4 In relative terms, the distribution of initial endowments in Cape Town was identical. We applied a conversion rate of £1–7 Rand to the initialndowments. At the time of the Oxford experiments, £1 was worth 1.64 USD and, at the time of the Cape Town experiments, 7 Rand was worth 1.03SD.5 In two of the four game sets initial endowments were highly unequal (£20, £14, £8, £2). In two they were relatively equal (£14, £12, £10, £8).6 See the on-line Supplementary Information for descriptive statistics and a full analysis.7 Our utility function differs from Cappelen et al.’s (2007) in three ways: we focus on proportional allocations and initial endowments because, in our
ame, the sums of the initial endowments and the final allocations are fixed; we condition on context because we conducted both earned and randomnitial endowment versions of the game; and we normalize so that the parameter on own final allocation is 1.
58 A. Barr et al. / Journal of Economic Behavior & Organization 118 (2015) 55–68
in context k, and ˇi is the preference parameter associated with adherence to own notions of distributive justice. Assumingan interior solution, maximizing Vi subject to the constraint
∑4j=1xij = 1 yields the optimal allocations, x∗
iiand x∗
ij /= i:
x∗ii = mk
ii + 32ˇi
x∗ij /= i = mk
ij − 12ˇi
Thus, i’s optimal allocations are directly related to the allocations that i perceives as fair and, as long as 0< ˇi < ∞, theallocation to self is greater than the fair allocation to self and the allocation to each of the others is less than the fair allocationto each of those others.
The two most likely determining factors of mkij
are participant j’s initial endowment expressed as a proportion of the sum
of all initial endowments, yj, and the equal division, y (= ¼), and given the model thus far, it is natural to express mkij
as the
weighted average of these two, mkij
= ˛kiyj + (1 − ˛k
i)y.
Two decision-making contexts were created, in one the initial endowments, yj, were earned (indicated below by k = e), inthe other they were random (indicated below by k = r). The weights assigned by different types of i to their co-participants’initial endowments in these two contexts depend on the extent to which they acknowledge effort and productivity. If indi-viduals prefer not to take from others, both ˛e
iand ˛r
iare greater than zero.8 Then, for individuals who do not acknowledge
effort and productivity ˛ei
equals ˛ri
and so their allocations to themselves and others are identically related to initial endow-ments in each of the contexts. In contrast, for individuals who do acknowledge effort and productivity ˛e
iwill be greater
than ˛ri, and their allocations to themselves and others will be more strongly related to initial endowments in the earned
treatment as compared to the random treatment.We can investigate whether any given type of experimental participant is subject to an EEE by estimating linear regression
Model 1:
x∗ij /= i = a0 + a1Ei + a2yj + a3(Ei ∗ yj) + εij
where Ei takes the value 1 if i played under the earned treatment and zero if i played under the random treatment, a0, a1, a2,and a3 are the coefficients to be estimated, and εij is the error term which is non-independent within i and will be adjustedaccordingly by clustering.9
If there are libertarian types in the sample, the average amount allocated to j will be increasing in j’s initial endowmentin the random treatment and the coefficient a2 will be positive. The more the sample tends towards liberal egalitarianism,the larger the coefficient a3. All other things being equal, an EEE manifests in two ways: a negative a1 and a positive a3.Graphically, the EEE constitutes an anti-clockwise rotation in the relationship between j’s initial endowment and i’s finalallocation to j as we move from the random to the earned treatment.
Initially, we estimate this model for each of our Oxford and Cape Town participant sub-samples in turn. Below, we refer tothese models as Model 1s, based only on the student sample in a particular location, Model 1e, based only on the employedsample in a particular location, and Model 1u, based only on the unemployed sample in a particular location. Then we poolacross pairs of sub-samples and introduce one sub-sample identifier and three more interaction terms. So, when comparingthe unemployed to the employed in Oxford, for example, we pool the two sub-samples and estimate Model 2:
x∗ij /= i = a0 + a1Ei + a2yj + a3(Ei ∗ yj) + a4Ui + a5(Ei ∗ Ui) + a6(yj ∗ Ui) + a7(Ei ∗ yj ∗ Ui) + εij
where Ui equals 1 if the decision-making participant i is unemployed and zero if i is employed. Now, the coefficients a0, a1,a2, and a3 pertain to the employed participants and the coefficients a4, a5, a6, and a7 identify any differences between theunemployed and the employed. Most importantly, a5 and a7 identify differences in the EEE.10
With these models fully specified, we can set out our hypotheses in precise terms.
Hypothesis 1. For high economic status individuals, i.e., students and employed people, the EEE is positive, so the coefficienta3 in Models 1s, 1e and 2 is positive and the coefficient a1 in Models 1s, 1e and 2 is negative.
Hypothesis 2. For low economic status individuals, i.e., unemployed people, the EEE is zero, so the coefficients a1 and a3 in
Model 1e are zero; the coefficients a5 and a7 in Model 2 are positive and negative respectively; and the sum of coefficientsa1 and a5 and the sum of coefficients a3 and a7 in Model 2 are zero.8 Bardsley (2008) and List (2007) show that final allocations in a two-person dictator game depend on the initial endowment distribution in a mannerthat is consistent with a preference not to take. Krupka and Weber (2013) show that a given final allocation is less socially acceptable if it is achieved bytaking rather than giving.
9 The validity of this approach depends on the assumption that ˇi and the mij are independent. If this is not the case εij may be correlated with yj , E andyj × E, leading to endogeneity bias. We address this issue in footnote 12.
10 In all estimations we exclude those participants who made the maximal allocation to themselves. Only 23 (5%) subjects behaved in this way.
3
3
E
6i
tucrpbooi
rMtat1
t
TP
TU
N
A. Barr et al. / Journal of Economic Behavior & Organization 118 (2015) 55–68 59
. Results
.1. Oxford, UK
We ran 15 experimental sessions in Oxford. All the sessions were conducted at the laboratory of the Nuffield Centre forxperimental Social Sciences.
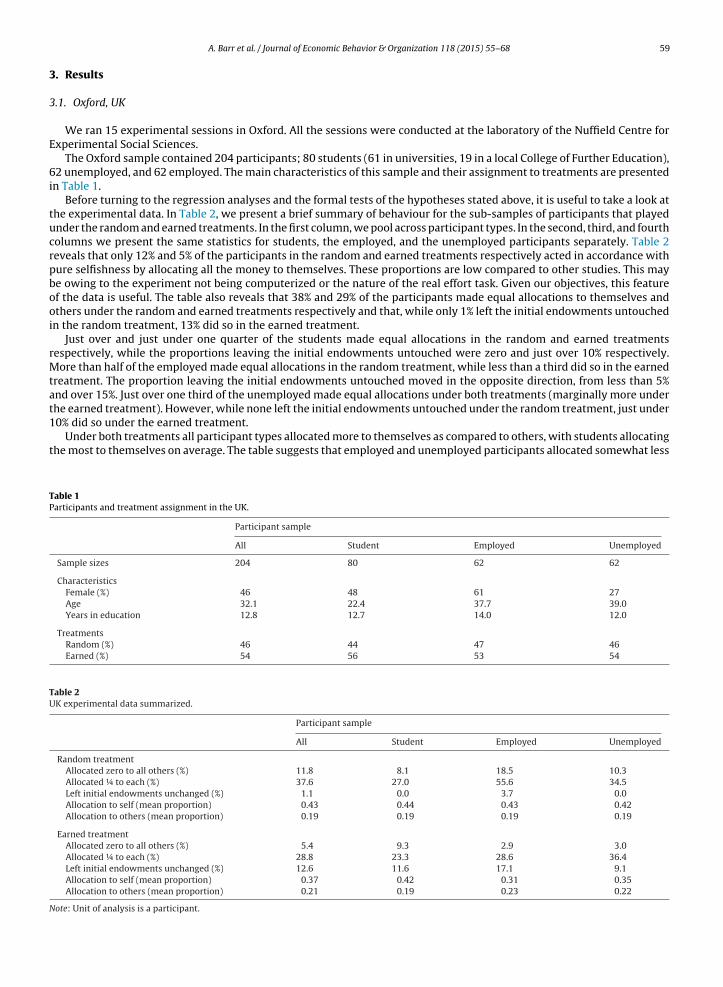
The Oxford sample contained 204 participants; 80 students (61 in universities, 19 in a local College of Further Education),2 unemployed, and 62 employed. The main characteristics of this sample and their assignment to treatments are presented
n Table 1.Before turning to the regression analyses and the formal tests of the hypotheses stated above, it is useful to take a look at
he experimental data. In Table 2, we present a brief summary of behaviour for the sub-samples of participants that playednder the random and earned treatments. In the first column, we pool across participant types. In the second, third, and fourtholumns we present the same statistics for students, the employed, and the unemployed participants separately. Table 2eveals that only 12% and 5% of the participants in the random and earned treatments respectively acted in accordance withure selfishness by allocating all the money to themselves. These proportions are low compared to other studies. This maye owing to the experiment not being computerized or the nature of the real effort task. Given our objectives, this featuref the data is useful. The table also reveals that 38% and 29% of the participants made equal allocations to themselves andthers under the random and earned treatments respectively and that, while only 1% left the initial endowments untouchedn the random treatment, 13% did so in the earned treatment.
Just over and just under one quarter of the students made equal allocations in the random and earned treatmentsespectively, while the proportions leaving the initial endowments untouched were zero and just over 10% respectively.ore than half of the employed made equal allocations in the random treatment, while less than a third did so in the earned
reatment. The proportion leaving the initial endowments untouched moved in the opposite direction, from less than 5%nd over 15%. Just over one third of the unemployed made equal allocations under both treatments (marginally more underhe earned treatment). However, while none left the initial endowments untouched under the random treatment, just under0% did so under the earned treatment.
Under both treatments all participant types allocated more to themselves as compared to others, with students allocatinghe most to themselves on average. The table suggests that employed and unemployed participants allocated somewhat less
able 1articipants and treatment assignment in the UK.
Participant sample
All Student Employed Unemployed
Sample sizes 204 80 62 62
CharacteristicsFemale (%) 46 48 61 27Age 32.1 22.4 37.7 39.0Years in education 12.8 12.7 14.0 12.0
TreatmentsRandom (%) 46 44 47 46Earned (%) 54 56 53 54
able 2K experimental data summarized.
Participant sample
All Student Employed Unemployed
Random treatmentAllocated zero to all others (%) 11.8 8.1 18.5 10.3Allocated ¼ to each (%) 37.6 27.0 55.6 34.5Left initial endowments unchanged (%) 1.1 0.0 3.7 0.0Allocation to self (mean proportion) 0.43 0.44 0.43 0.42Allocation to others (mean proportion) 0.19 0.19 0.19 0.19
Earned treatmentAllocated zero to all others (%) 5.4 9.3 2.9 3.0Allocated ¼ to each (%) 28.8 23.3 28.6 36.4Left initial endowments unchanged (%) 12.6 11.6 17.1 9.1Allocation to self (mean proportion) 0.37 0.42 0.31 0.35Allocation to others (mean proportion) 0.21 0.19 0.23 0.22
ote: Unit of analysis is a participant.
60 A. Barr et al. / Journal of Economic Behavior & Organization 118 (2015) 55–68
0.00
0.10
0.20
0.30
0.40
0.00 0.10 0.20 0.30 0.40 0.50
j's initial endowment (yj)
Earned Treatment
Students
0.00
0.10
0.20
0.30
0.40
0.00 0.10 0.20 0.30 0.40 0.50
Allocationtopar ticipantj
j's initial endowment (yj)
Random Treatment
Students
0.00
0.10
0.20
0.30
0.40
0.00 0.10 0.20 0.30 0.40 0.50
j's initial endowment (yj)
Employed
0.00
0.10
0.20
0.30
0.40
0.00 0.10 0.20 0.30 0.40 0.50
Allocationtopartici pantj
j's initial endowment (yj)
Employed
0.00
0.10
0.20
0.30
0.40
0.00 0.10 0.20 0.30 0.40 0.50
j's initial endowment (yj)
Unemployed
0.00
0.10
0.20
0.30
0.40
0.00 0.10 0.20 0.30 0.40 0.50
Allocat iontop articipantj
j's initial endowment (yj)
Unemployed
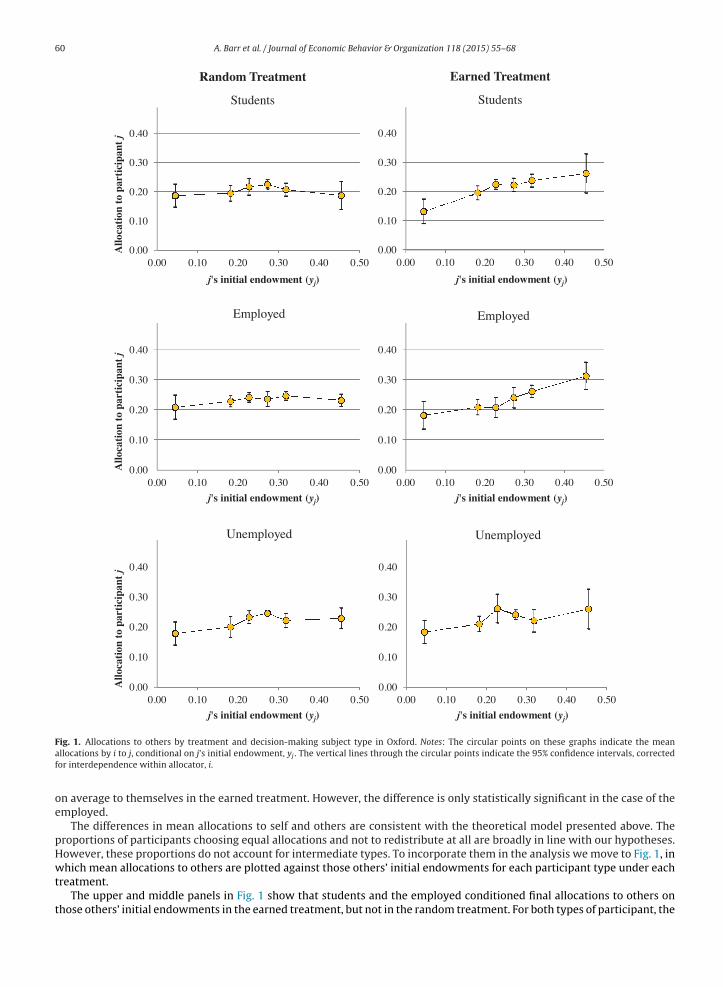
Fig. 1. Allocations to others by treatment and decision-making subject type in Oxford. Notes: The circular points on these graphs indicate the meanallocations by i to j, conditional on j’s initial endowment, yj . The vertical lines through the circular points indicate the 95% confidence intervals, correctedfor interdependence within allocator, i.
on average to themselves in the earned treatment. However, the difference is only statistically significant in the case of theemployed.
The differences in mean allocations to self and others are consistent with the theoretical model presented above. Theproportions of participants choosing equal allocations and not to redistribute at all are broadly in line with our hypotheses.However, these proportions do not account for intermediate types. To incorporate them in the analysis we move to Fig. 1, in
which mean allocations to others are plotted against those others’ initial endowments for each participant type under eachtreatment.The upper and middle panels in Fig. 1 show that students and the employed conditioned final allocations to others onthose others’ initial endowments in the earned treatment, but not in the random treatment. For both types of participant, the
A. Barr et al. / Journal of Economic Behavior & Organization 118 (2015) 55–68 61
Table 3Regression analysis of allocations to others in the UK. Dependent variable = participant i’s final allocation to participant j.
Students Employed Unemployed Unemployed compared with studentsand employed
Earned treatment (E) −0.063** (−0.027) −0.066** (−0.029) 0.001 (−0.026) −0.064*** (−0.02)j’s initial endowment (yj) 0.021 (−0.035) 0.064 (−0.047) 0.129** (−0.053) 0.037 (−0.029)yj × E 0.297*** (−0.098) 0.273*** (−0.103) 0.038 (−0.097) 0.294*** (−0.071)
Unemployed −0.023 (−0.022)Unemployed × E 0.064** (−0.032)yj × Unemployed 0.092 (−0.06)yj × unemployed × E −0.256** (−0.119)
Constant 0.197*** (−0.013) 0.216*** (−0.015) 0.182*** (−0.02) 0.205*** (−0.01)
Observations 219 168 174 561
Notes: Unit of analysis is an allocation by i to j; allocations to self (j = i) excluded; zero allocations by is who allocated all to themselves are excluded;coefficients from linear regressions presented; standard errors in parentheses; standard errors clustered to account for non-independence within i.*
Ent
tfaaittm
msnte
ste
iytn
3
sah
siash
Significant at the 10% level.** Significant at the 5% level.
*** Significant at the 1% level.
EE manifests as an anticlockwise rotation about a midpoint. In contrast, the graphs for the unemployed (lower panel) revealo such rotation. There appears to be a positive relationship between final allocations and initial endowments under bothreatments, but there is no evidence of an EEE here. Fig. 1 provides further but still preliminary support for our hypotheses.
In Table 3 we present a series of linear regressions conforming to either Model 1 or Model 2 above. The first, second, andhird columns contain estimations of Model 1 for students, the employed, and the unemployed respectively. The estimationsor students and the employed reveal the expected EEE: the coefficient a1, on the earned treatment identifier, E, is negativend significant; the coefficient, a3, on j’s initial endowment, yj, interacted with the earned treatment identifier, E, is positivend significant. Finally, the coefficient, a2, on j’s initial endowment, yj, uninteracted is insignificant. Together, these resultsndicate that the rotations in the relationships between final allocations and initial endowments from flat in the randomreatment to upward-sloping in the earned treatment that we observed in Fig. 1 are statistically significant. In the earnedreatment, a one percentage point increase in initial endowment leads to a 0.3 percentage point increase in final allocations
ade by students and a 0.27 percentage point increase in final allocations made by employed participants.The estimation for the unemployed tells a different story. Here the significant positive coefficient, a2, on j’s initial endow-
ent, yj, uninteracted indicates a positive relationship between those initial endowments and final allocations, while themall and insignificant coefficients a1, on E, and a3, on the interaction between yj and E, indicate no EEE. Finally, it is worthoting that the slope of the relationship between initial endowments and final allocations is considerably smaller in magni-ude than the slope in the earned treatment for students and the employed. Here, a one percentage point increase in initialndowment leads to a 0.13 percentage point increase in final allocations.
When we pool the student and employed samples and estimate an appropriately adjusted version of Model 2, we find noignificant differences in behaviour between the two participant types.11 However, when we pool across all three participantypes and estimate Model 2, distinguishing between the unemployed and the other two types, the coefficients and standardrrors reported in the fourth column of Table 3 are returned.
The significant positive coefficient, a5, on the interaction between the unemployed identifier and the earned treatmentdentifier, E, and the significant negative coefficient, a7, on the three way interaction between the unemployed identifier, Ui,j and E indicate that the unemployed are significantly different in terms of the treatment effect. In addition, linear restrictionests do not allow us to reject the hypotheses that a1 + a5 = 0 and a3 + a7 = 0 indicating, once again, that the unemployed areot subject to an EEE.12
.2. Cape Town, South Africa
We ran 15 experimental sessions in Cape Town using the same protocol we used in Oxford. At first glance, the participant
ample for the Cape Town experiment appeared very similar to the Oxford sample; it included 101 students, 72 employednd 63 unemployed people. However, while setting up for the recruitment it became clear that our assumptions aboutow participant types map onto economic status would not apply as well in Cape Town as in Oxford. First, the majority11 The estimations are not tabulated but are available from the authors on request.12 To investigate the robustness of the results presented in the far right-hand column of Table 3, we introduce a series of control variables and their corre-ponding interactions with yj , E and yj × E into the model. To minimize the problem of multicollinearity, we introduced each control plus its correspondingnteraction terms one control at a time. The key results presented above are robust to the inclusion, following this protocol, of several experimental variablesnd i’s age, sex and education. To control for differences in selfishness (ˇi), we re-estimated the models including allocator (i) fixed effects. The results areimilar, except that the unemployed are then found to exhibit a small, weakly significant EEE, driven by the unemployed who are relatively well of and,ence, not eligible for government transfers. See on-line Supplementary Information for details.
62 A. Barr et al. / Journal of Economic Behavior & Organization 118 (2015) 55–68
Table 4Participants and treatment assignment in South Africa.
Participant sample
All Students Employed Unemployed
Sample sizes 236 101 72 63
CharacteristicsFemale (%) 53 46 68 49Age 30.35 22.05 38.56 34.27Years in education 12.22 13.27 12.44 10.28Economic status
Rich (%) 3 3 0 5High income (%) 6 13 3 0Middle income (%) 39 54 46 7Low income (%) 33 22 36 47Poor (%) 19 8 15 42
TreatmentsUnearned (%) 39 33 42 46Earned (%) 61 67 58 54
(75%) of the unemployed in our Oxford sample were receiving means-tested government cash transfers at the time ofthe experiment indicating that they were indeed of relatively low economic status, while in Cape Town there were noequivalently indicative government cash transfers. Second, owing to the existence of the government cash transfers in theUK, unemployment in the UK is clearly defined whereas in South Africa it is not. Given this ambiguity combined with therebeing no safety-net and unemployment being high (around 25% as compared with just under 8% in the UK at the end of2010) we conjectured that there may be many Cape Town residents who work part time, casually or rarely and who variablyrefer to themselves as employed and unemployed. Third, in comparison to Brooks and Oxford University, the University ofCape Town, in partnership with various non-governmental organizations and the government, is far more actively seekingto include individuals from low income households among its enrolled students.
So, in Cape Town we asked the experimental participants to complete a more comprehensive post-experimental ques-tionnaire designed to give us an alternative measure by which to distinguish between individuals of low and high economicstatus. The resulting data supported our conjectures about type and economic status being only weakly associated in CapeTown. Ten out of the 63 unemployed people reported positive monthly earnings, with the average across those ten being960 Rand (142 USD) and the maximum being 2000 Rand (approximately 300 USD). The latter is considerably lower than theaverage stated monthly earnings of the self-proclaimed employed people, which are approximately 6000 Rand. However,30% of the self-proclaimed employed stated that they earned less than 2000 Rand.13
In addition, a question inviting the participants to categorize their households as either rich, upper income, middle income,low income, or poor revealed that there was considerable overlap not only between the employed and unemployed, but alsobetween the students and the other two groups. Table 4 shows that, while the unemployed in our sample were far morelikely than the employed and the students to perceive their households as low income or poor, there was greater variationin perceptions among the employed and students. So, 87% of the unemployed indicated that they were from low income orpoor households and 51% and 30% of the employed and the students respectively did likewise. Table 4 also shows that, as inOxford, individual characteristics varied markedly across the students, employed and unemployed sub-samples. However,here the relative characteristics of the sample seem to correspond closely with data from large-scale surveys. Specifically,relative to the employed, the unemployed are younger and more likely to be male (Bhorat, 2005).14
In Table 5, we present a brief summary of behaviour for the South African participants that played under the random andearned treatments. In the first column, we pool across all participants. In the second, third, and fourth columns we presentthe same statistics for students, the employed, and the unemployed participants separately. Then, in the fifth and sixthcolumns we present the same statistics for high and low status participants. We define high status participants as those whoreported that their households were rich or high or middle income and low status participants as those who reported thattheir households were poor or low income.15
Table 5 reveals that only 1% and 3% of the participants in the random and earned treatments respectively acted in accor-dance with pure selfishness. These proportions are even smaller than those observed in Oxford. The table also reveals that40% and 26% of the participants made equal allocations to themselves and others under the random and earned treatments
13 This percentage should be viewed with caution as earnings are notoriously difficult to measure using surveys. The proportion of self-proclaimed unem-ployed reporting positive monthly earnings is less likely to be subject to measurement error. Our data is consistent with Fields (2000), who describes SouthAfrica as having an “employment problem” rather than an unemployment problem and characterizes the problem as encompassing not only unemploymentbut also low hourly wages and low work hours.
14 They are also more likely to be of African origin.15 This approach yields two similarly sized sub-samples and obviates the problem that individuals from high income and rich households tend to understate
their economic status when asked this subjective question.
A. Barr et al. / Journal of Economic Behavior & Organization 118 (2015) 55–68 63
Table 5South African experimental data summarized.
Participant sample
All Student Employed Unemployed High economic status Low economic status
Random treatmentAllocated zero to all others (%) 1.1 3.0 0.0 0.0 2.3 0.0Allocated ¼ to each (%) 40.2 24.2 66.7 31.0 40.9 39.6Left initial endowments unchanged (%) 3.3 0.0 0.0 10.3 0.0 6.3Allocation to self (mean proportion) 0.34 0.44 0.28 0.29 0.36 0.32Allocation to others (mean proportion) 0.22 0.19 0.24 0.24 0.21 0.23
Earned treatmentAllocated zero to all others (%) 3.5 5.9 2.4 0.0 4.4 2.7Allocated ¼ to each (%) 26.4 11.8 38.1 41.2 15.9 36.0Left initial endowments unchanged (%) 9.7 11.8 9.5 5.9 13.0 6.7Allocation to self (mean proportion) 0.35 0.44 0.27 0.28 0.38 0.32
N
re
iziftu
alim
sa
phati
iaarsi
acfsfi
sisesr
Allocation to others (mean proportion) 0.22 0.19 0.24 0.24 0.21 0.23
ote: Unit of analysis is a participant.
espectively and that, while only 3% left the initial endowments untouched in the random treatment, 10% did so in thearned treatment.
Almost one quarter of the students made equal allocations in the random treatment, while only just over 10% did likewisen the earned treatment. The proportion leaving the initial endowments untouched moved in the opposite direction, fromero to over 10%. Two thirds of the employed made equal allocations in the random treatment, while less than 40% did son the earned treatment. Again, the proportion leaving the initial endowments untouched moved in the opposite direction,rom zero to just under 10%. As in Oxford, the unemployed were distinct. Just under one third made equal allocations underhe random treatment, while over 40% did so in the earned treatment. And the proportion leaving the initial endowmentsntouched moved in the opposite direction, from over 10% in the random treatment to just over 5% in the earned treatment.
Dividing the sample according to economic status reveals that just over 40% of the high status participants made equalllocations under the random treatment, while only just over 15% did so in the earned treatment. Once again, the proportioneaving the initial endowments untouched moved in the opposite direction, from zero in the random treatment to almost 15%n the earned treatment. In contrast, the low status participants were barely affected by treatment: in both, just under 40%
ade equal allocations (marginally fewer in the earned treatment) and just over 5% left the initial endowments unaltered.As in Oxford, under both treatments all participant types allocated more to themselves as compared to others, with
tudents allocating most to themselves on average. Average allocations to self and others are almost indistinguishablecross treatments.
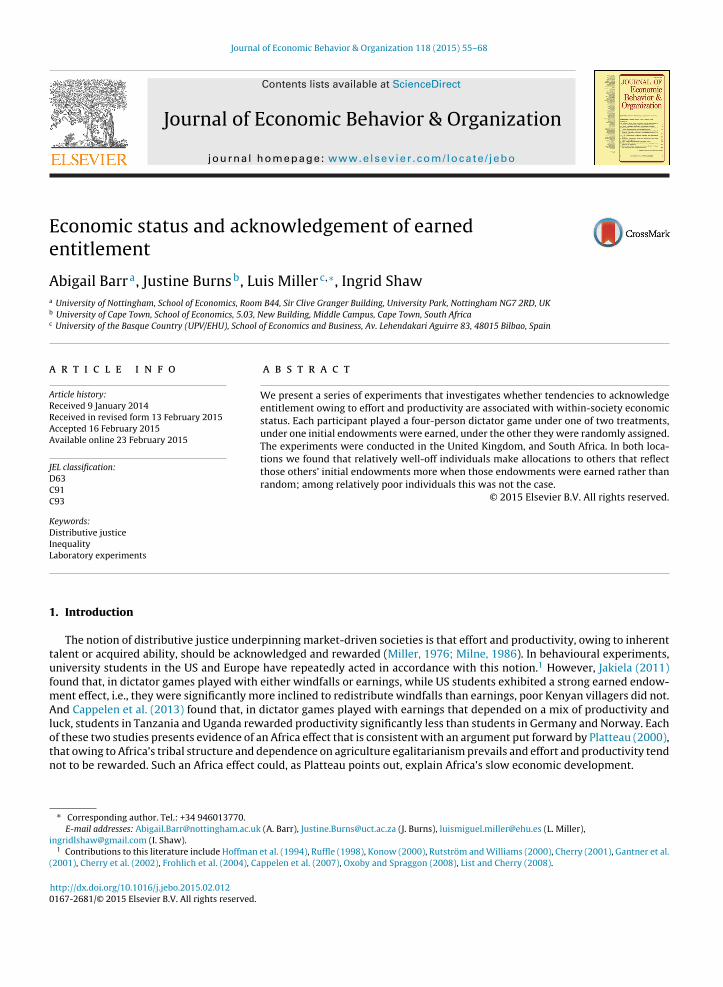
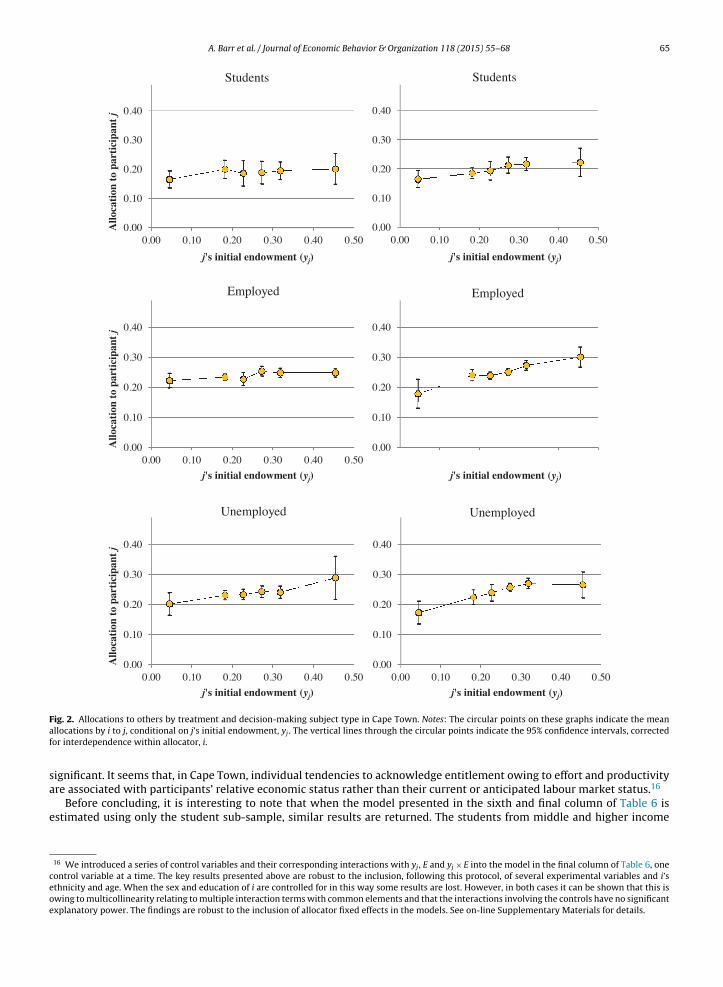
The differences in mean allocations to self and others are consistent with the theoretical model presented above. Theroportions of participants choosing equal allocations and electing not to redistribute at all are broadly in line with ourypotheses. However, to incorporate intermediate types in the analysis we must move to Figs. 2 and 3, in which meanllocations to others are plotted against those others’ initial endowments for the various participant types under eachreatment. In Fig. 2 the sample is divided into students, the employed, and the unemployed. In Fig. 3 the sample is dividednto participants with high and low economic status.
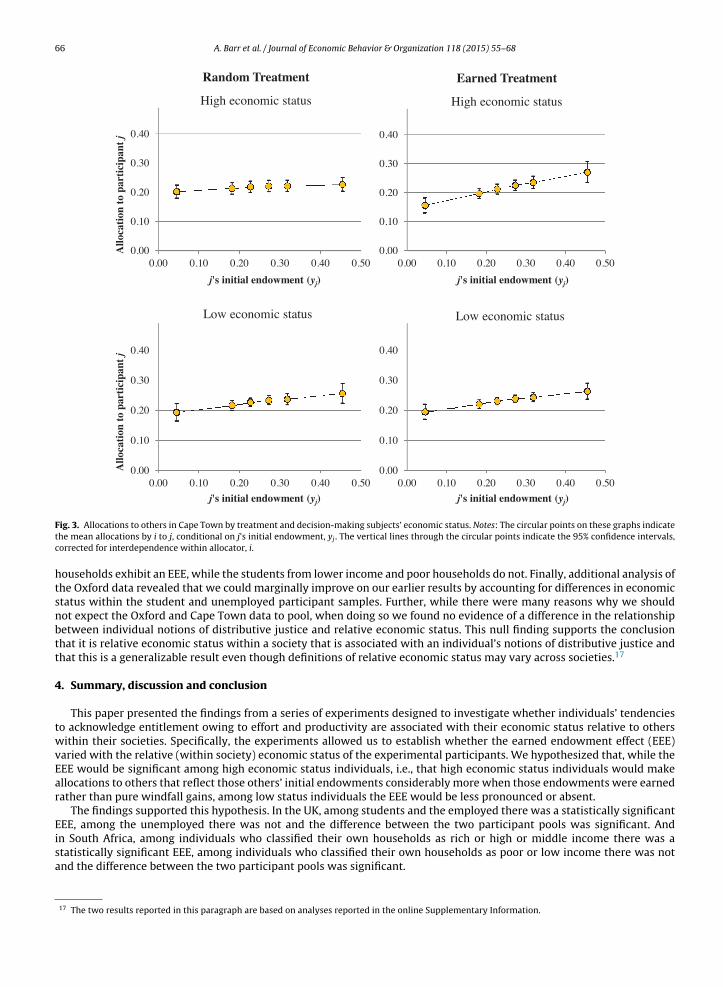
The middle panel of Fig. 2 reveals an EEE for the employed; they conditioned final allocations to others on those others’nitial endowments in the earned treatment, but not in the random treatment. The upper and lower panels reveal no sign ofn EEE for the students and the unemployed, although the lower panel suggests that the unemployed conditioned their finalllocations to others on those others’ initial endowments irrespective of treatment. In Fig. 3 the upper panel very clearlyeveals an EEE for the high economic status participants. In contrast, the lower panel reveals no evidence of an EEE for the lowtatus individuals, but clearly indicates that they conditioned final allocations to others on those others’ initial endowmentsn both the random and the earned treatments.
The regressions in the first three columns of Table 6 confirm that the employed were subject to an EEE, while the studentsnd the unemployed were not. They also reveal that not only the unemployed but also, to a lesser extent, the employedonditioned final allocations to others on those others’ initial endowments in the random treatment. The regressions in theourth and fifth columns confirm that the high economic status participants were subject to an EEE, while the low economictatus participants were not. They also reveal that low and, to a lesser degree, high economic status participants conditionednal allocations to others on those others’ initial endowments in the random treatment.
Despite the apparent differences between the regressions in the first and second columns of Table 6, when we pool thetudent and employed samples and estimate an appropriately adjusted version of Model 2, we find no significant differencen behaviour between the two types. Using a similar approach, we find no significant difference in behaviour between
tudents and the unemployed, and the employed and the unemployed. However, when we work with the full sample andstimate an appropriately adjusted version of Model 2 that includes an identifier for the participants with low economictatus and interacts this variable with yj, E and yj × E, the estimates presented in the sixth and final column of Table 6 areeturned. These reveal that the differences in treatment effects between the high and low status participants are statistically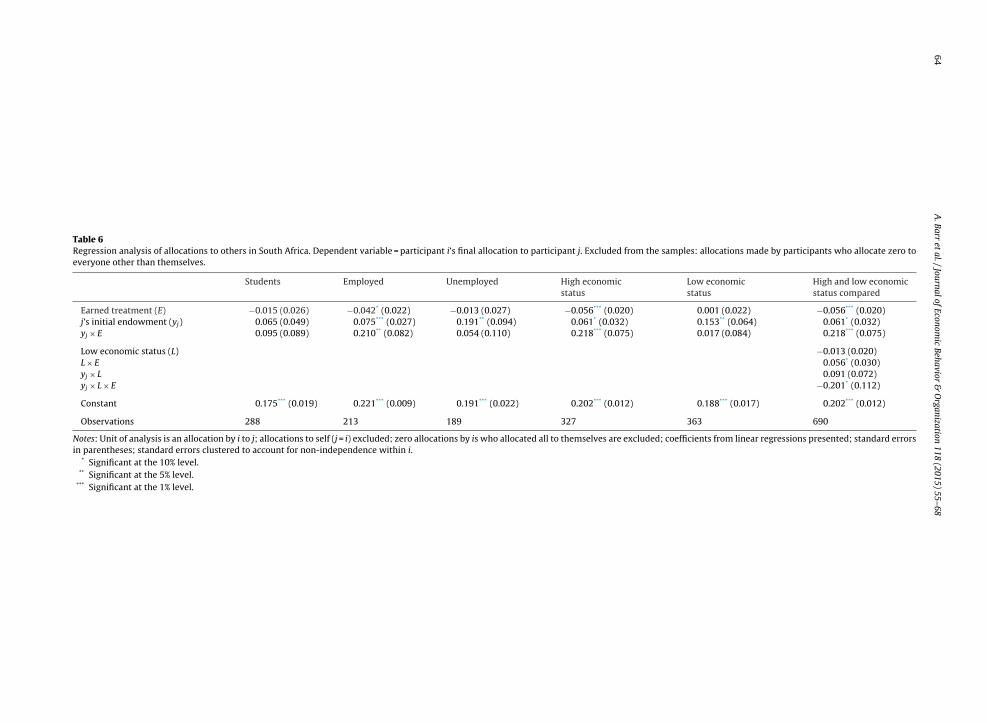
64
A.
Barr et
al. /
Journal of
Economic
Behavior &
Organization
118 (2015)
55–68
Table 6Regression analysis of allocations to others in South Africa. Dependent variable = participant i’s final allocation to participant j. Excluded from the samples: allocations made by participants who allocate zero toeveryone other than themselves.
Students Employed Unemployed High economicstatus
Low economicstatus
High and low economicstatus compared
Earned treatment (E) −0.015 (0.026) −0.042* (0.022) −0.013 (0.027) −0.056*** (0.020) 0.001 (0.022) −0.056*** (0.020)j’s initial endowment (yj) 0.065 (0.049) 0.075*** (0.027) 0.191** (0.094) 0.061* (0.032) 0.153** (0.064) 0.061* (0.032)yj × E 0.095 (0.089) 0.210** (0.082) 0.054 (0.110) 0.218*** (0.075) 0.017 (0.084) 0.218*** (0.075)
Low economic status (L) −0.013 (0.020)L × E 0.056* (0.030)yj × L 0.091 (0.072)yj × L × E −0.201* (0.112)
Constant 0.175*** (0.019) 0.221*** (0.009) 0.191*** (0.022) 0.202*** (0.012) 0.188*** (0.017) 0.202*** (0.012)
Observations 288 213 189 327 363 690
Notes: Unit of analysis is an allocation by i to j; allocations to self (j = i) excluded; zero allocations by is who allocated all to themselves are excluded; coefficients from linear regressions presented; standard errorsin parentheses; standard errors clustered to account for non-independence within i.
* Significant at the 10% level.** Significant at the 5% level.
*** Significant at the 1% level.
A. Barr et al. / Journal of Economic Behavior & Organization 118 (2015) 55–68 65
0.00
0.10
0.20
0.30
0.40
0.00 0.10 0.20 0.30 0.40 0.50
j's initial endowment (yj)
Students
0.00
0.10
0.20
0.30
0.40
0.00 0.10 0.20 0.30 0.40 0.50
Allocationtopar ticipantj
j's initial endowment (yj)
Students
0.00
0.10
0.20
0.30
0.40
j's initial endowment (yj)
Employed
0.00
0.10
0.20
0.30
0.40
0.00 0.10 0.20 0.30 0.40 0.50
Allocationtopartici pantj
j's initial endowment (yj)
Employed
0.00
0.10
0.20
0.30
0.40
0.00 0.10 0.20 0.30 0.40 0.50
j's initial endowment (yj)
Unemployed
0.00
0.10
0.20
0.30
0.40
0.00 0.10 0.20 0.30 0.40 0.50
Allocat iontop articipantj
j's initial endowment (yj)
Unemployed
Faf
sa
e
ceoe
ig. 2. Allocations to others by treatment and decision-making subject type in Cape Town. Notes: The circular points on these graphs indicate the meanllocations by i to j, conditional on j’s initial endowment, yj . The vertical lines through the circular points indicate the 95% confidence intervals, correctedor interdependence within allocator, i.
ignificant. It seems that, in Cape Town, individual tendencies to acknowledge entitlement owing to effort and productivity
re associated with participants’ relative economic status rather than their current or anticipated labour market status.16Before concluding, it is interesting to note that when the model presented in the sixth and final column of Table 6 isstimated using only the student sub-sample, similar results are returned. The students from middle and higher income
16 We introduced a series of control variables and their corresponding interactions with yj , E and yj × E into the model in the final column of Table 6, oneontrol variable at a time. The key results presented above are robust to the inclusion, following this protocol, of several experimental variables and i’sthnicity and age. When the sex and education of i are controlled for in this way some results are lost. However, in both cases it can be shown that this iswing to multicollinearity relating to multiple interaction terms with common elements and that the interactions involving the controls have no significantxplanatory power. The findings are robust to the inclusion of allocator fixed effects in the models. See on-line Supplementary Materials for details.
66 A. Barr et al. / Journal of Economic Behavior & Organization 118 (2015) 55–68
0.00
0.10
0.20
0.30
0.40
0.00 0.10 0.20 0.30 0.40 0.50
j's initial endowment (yj)
Earned Treatment
High economic status
0.00
0.10
0.20
0.30
0.40
0.00 0.10 0.20 0.30 0.40 0.50
Allocationtoparticipantj
j's initial endowment (yj)
Random Treatment
High economic status
0.00
0.10
0.20
0.30
0.40
0.00 0.10 0.20 0.30 0.40 0.50
j's initial endowment (yj)
Low economic status
0.00
0.10
0.20
0.30
0.40
0.00 0.10 0.20 0.30 0.40 0.50
Allocationtop articipantj
j's initial endowment (yj)
Low economic status
Fig. 3. Allocations to others in Cape Town by treatment and decision-making subjects’ economic status. Notes: The circular points on these graphs indicatethe mean allocations by i to j, conditional on j’s initial endowment, yj . The vertical lines through the circular points indicate the 95% confidence intervals,corrected for interdependence within allocator, i.
households exhibit an EEE, while the students from lower income and poor households do not. Finally, additional analysis ofthe Oxford data revealed that we could marginally improve on our earlier results by accounting for differences in economicstatus within the student and unemployed participant samples. Further, while there were many reasons why we shouldnot expect the Oxford and Cape Town data to pool, when doing so we found no evidence of a difference in the relationshipbetween individual notions of distributive justice and relative economic status. This null finding supports the conclusionthat it is relative economic status within a society that is associated with an individual’s notions of distributive justice andthat this is a generalizable result even though definitions of relative economic status may vary across societies.17
4. Summary, discussion and conclusion
This paper presented the findings from a series of experiments designed to investigate whether individuals’ tendenciesto acknowledge entitlement owing to effort and productivity are associated with their economic status relative to otherswithin their societies. Specifically, the experiments allowed us to establish whether the earned endowment effect (EEE)varied with the relative (within society) economic status of the experimental participants. We hypothesized that, while theEEE would be significant among high economic status individuals, i.e., that high economic status individuals would makeallocations to others that reflect those others’ initial endowments considerably more when those endowments were earnedrather than pure windfall gains, among low status individuals the EEE would be less pronounced or absent.
The findings supported this hypothesis. In the UK, among students and the employed there was a statistically significantEEE, among the unemployed there was not and the difference between the two participant pools was significant. And
in South Africa, among individuals who classified their own households as rich or high or middle income there was astatistically significant EEE, among individuals who classified their own households as poor or low income there was notand the difference between the two participant pools was significant.17 The two results reported in this paragraph are based on analyses reported in the online Supplementary Information.
oCeeeo
figgoGiesr
atsitwtpitult1etcg
ptabrsoA
A
pweSI
A. Barr et al. / Journal of Economic Behavior & Organization 118 (2015) 55–68 67
The objective of this paper is to take a first step towards reconciling three literatures, i.e.: the experimental studies focusingn US and European students who have repeatedly acknowledged earned entitlement; the studies of Jakiela (2011)andappelen et al. (2013) identifying Africa-based subject pools that are less or entirely disinclined to acknowledge earnedntitlement; the survey-based analyses of Alesina and Giuliano (2011) and others, indicating that people at the lowernd of the income distributions of developed countries might also be less or entirely disinclined to acknowledge earnedntitlement; and the study by Jakiela et al. (2014) revealing a causal effect of academic achievement on acknowledgementf earned entitlement within an African country.
That US and European students have been found, repeatedly, to acknowledge earned entitlement is consistent with ourndings. Like Cappelen et al. (2013) we found a difference between European and African students. However, by distin-uishing between students from relatively well off and poorer households we were able to reconcile this finding with theeneral model. This finding is not consistent with the findings of Jakiela et al. (2014). However, the inconsistency may bewing to differences in experimental design. All of our findings are consistent with the survey-based analyses of Alesina andiuliano (2011) and others and indicate that differences in attitudes to redistribution between rich and poor are, at least
n part, owing to differences in notions of distributive justice. Jakiela’s (2011) Kenyan farmers are distinct from all of ourxperimental participants. Their tendency not to acknowledge earned entitlement could be owing to their low economictatus relative to other Kenyans and, therefore, could be consistent with our findings. However, further work would beequired to establish that this is the case.
One of our findings was unexpected. For the low status participants in Cape Town and the unemployed in Oxford thebsence of an EEE was, in part, owing to such participants conditioning their allocations to others on those others’ ini-ial endowments even when those endowments were windfalls rather than earnings. This is consistent with the lowertatus individuals being less willing to take from others under any conditions. One possible explanation for this find-ng is that the laboratory context caused lower status participants to become more passive. However, Table 2 revealshat in Oxford the unemployed were the least likely to leave the initial endowment unchanged and Table 5 shows that,hile the low status participants in Cape Town were more inclined than the high status participants to leave the ini-
ial endowments unchanged in the earned treatment, in the random treatment they were less inclined to do so. Anotherossible explanation is that, lower status individuals may have been less attentive to the task and so stopped reallocat-
ng before reaching their otherwise preferred distribution. If this were the case, we would expect this lack of attentiono manifest also as lower productivity in the real effort task. However, in Oxford, it was the employed rather than thenemployed who were least productive and, in Cape Town, the relatively low status participants were only marginally
ess productive.18 Looking beyond the bounds of the experiment, there is one striking similarity between the low sta-us participants in the Cape Town sample and the unemployed in the Oxford sample; on average they had 11.2 and1.5 years of education respectively compared to 13.3 years of education for the rest of the participants. Perhaps theducation systems in both countries are devised to ensure that those who leave education prior to or having just takenheir first public exams are inculcated into believing that taking anything from other people is bad, while those whoontinue in education beyond this point are encouraged to think more freely. This would be worthy of further investi-ation.
Finally, there are certain aspects of our study that could be improved upon in future work. First and most importantly, ourarticipant samples are not representative of the national populations from which they were drawn. In particular, in bothhe UK and South Africa our samples were entirely urban. Second, our survey data covered only a few variables of interestnd did not go into as much depth concerning income and wealth as would have been ideal. Both of these concerns coulde addressed by embedding the experiment within existing household or individual surveys covering random samples ofespondents. Third, we conducted our experiment in only two societies. Ideally, one would conduct it in a larger number ofocieties that vary along different dimensions of interest. In particular, it would be interesting to replicate the experiment inne or more low income countries. Fourth, it is important to bear in mind that we have not identified a causal relationship.nd finally, our findings tell us nothing about the preferences of the very rich.
cknowledgements
We owe a considerable debt of thanks to Simon Headford, our script reader and long suffering recruiter of the unemployedarticipants in the UK experiment. We are also grateful to our research assistants and experimental participants. The researchas funded by The John Fell Fund, University of Oxford, grant 092/235. Neither the John Fell Fund nor any of the authors’
mployers has a financial interest in the topic of the paper. Luis Miller acknowledges the financial support received from the
panish Ministry of Economy and Competitiveness (grant ECO2012-30626) and the Basque Government (research groupT-783-13).18 See on-line Supplementary Information for details.

68 A. Barr et al. / Journal of Economic Behavior & Organization 118 (2015) 55–68
Appendix A. Supplementary data
Supplementary data associated with this article can be found, in the online version, at http://dx.doi.org/10.1016/j.jebo.2015.02.012.
References
Alesina, A., Giuliano, P., 2011. Preferences for redistribution. In: Benhabib, J., Bisin, A., Jackson, M. (Eds.), Handbook of Social Economics. North Holland Press.Babcock, L., Loewenstein, G., 1997. Explaining bargaining impasse: the role of self-serving biases. J. Econ. Perspect. 11, 109–126.Bardsley, N., 2008. Dictator game giving: altruism or artefact? Exp. Econ. 11, 122–133.Bhorat, H., 2005. Poverty, inequality and labour markets in Africa: a descriptive overview. In: Working Papers 05092, University of Cape Town, Development
Policy Research Unit.Cappelen, A.W., Hole, A.D., Sorensen, E.O., Tungodden, B., 2007. The pluralism of fairness ideals: an experimental approach. Am. Econ. Rev. 97 (3), 818–827.Cappelen, A.W., Moene, K.O., Sorensen, E.O., Tungodden, B., 2013. Needs vs entitlements – an international fairness experiment. J. Eur. Econ. Assoc. 11,
574–598.Cherry, T.L., 2001. Mental accounting and other-regarding behavior: evidence from the lab. J. Econ. Psychol. 22 (5), 605–615.Cherry, T.L., Frykblom, P., Shogren, J.F., 2002. Hardnose the dictator. Am. Econ. Rev. 92 (4), 1218–1221.Drazen, A., 2002. Political Economy in Macroeconomics. Princeton University Press, Princeton.Fields, G.S., 2000. The employment problem in South Africa. Trade Ind. Monit. 16.Finn, A., Leibbrandt, M., Levinsohn, J., 2014. Income mobility in a high-inequality society: evidence from the first two waves of the National Income Dynamics
Study. Dev. South. Afr. 31 (1), 16–30.Frohlich, N., Oppenheimer, J., Kurki, A., 2004. Modeling other-regarding preferences and an experimental test. Public Choice 119, 91–117.Gantner, A., Güth, W., Königstein, M., 2001. Equitable choices in bargaining games with joint production. J. Econ. Behav. Organ. 46, 209–225.Hoffman, E., McCabe, K.A., Shachat, K., Smith, V.L., 1994. Preferences, property rights, and anonymity in bargaining games. Games Econ. Behav. 7 (3),
346–380.Jakiela, P., 2011. Social preferences and fairness norms as informal institutions: experimental evidence. Am. Econ. Rev. 101 (3), 509–513.Jakiela, P., Miguel, E., te Velde, V., 2014. You’ve earned it: estimating the impact of human capital on social preferences. Exp. Econ., http://dx.doi.org/
10.1007/s10683-014-9409-9.Konow, J., 2000. Fair shares: accountability and cognitive dissonance in allocation decisions. Am. Econ. Rev. 90 (4), 1072–1091.Krupka, E.L., Weber, R.A., 2013. Identifying social norms using coordination games: Why does dictator game sharing vary? J. Eur. Econ. Assoc. 11 (3),
495–524.List, J., 2007. On the interpretation of giving in dictator games. J. Polit. Econ. 115 (3), 482–493.List, J., Cherry, T.L., 2008. Examining the role of fairness in high stakes allocation decisions. J. Econ. Behav. Organ. 65, 1–8.Miller, D., 1976. Social Justice. Clarendon Press, Oxford.Milne, H., 1986. Desert, effort and equality. J. Appl. Philos. 3, 235–243.
Oxoby, R., Spraggon, J., 2008. Mine and yours: property rights in dictator games. J. Econ. Behav. Organ. 65, 703–713.Personn, T., Tabellini, G., 2002. Political Economics: Explaining Economics Policy. MIT Press, Cambridge.Platteau, J., 2000. Institutions, Social Norms and Economic Development. Harwood Academic Publishers, Amsterdam.Ruffle, B.J., 1998. More is better, but fair is fair: tipping in dictator and ultimatum games. Games Econ. Behav. 23 (2), 247–265.Rutström, E., Williams, M.B., 2000. Entitlements and fairness: an experimental study of distributive preferences. J. Econ. Behav. Organ. 43 (1), 75–89.