C:\Documents and Settings\Jacob - Palawan Council for ...
186
-
Upload
khangminh22 -
Category
Documents
-
view
1 -
download
0
Transcript of C:\Documents and Settings\Jacob - Palawan Council for ...


iv
REPUBLIC OF THE PHILIPPINESOFFICE OF THE PRESIDENTPALAWAN COUNCIL FOR SUSTAINABLE DEVELOPMENTPalawan Center for Sustainable DevelopmentSta. Monica HeightsPuerto Princesa City, Palawan, Philippines 5300Email: [email protected]: (63-48) 434-4235, Fax: 434-4234
EDITORS-IN-CHIEF:Lualhati E. Tabugon, Aida M. Torres, Virginia B. CatainPlanning and Technical Services Department
TECHNICAL EDITORS:Karen M. Collins (USPCV), Christina D. Dalusung, Amelyn E.Dramayo, Rusela A. Suycano, Jose Rene F. Villegas
CONTRIBUTORS:Briccio T. Abela, Maria Cristina E. Abordo, Glenda M. Cadigal,Marilou C. Celzo, Delia A. Eleazar, John Francisco A. Pontillas,Perlita I. Quiling, Apollo V. Regalo, Joy C. Tablazon, Aida M.Torres, Jose Rene F. Villegas
DESIGN & LAYOUT:Jacob S. Maentz (USPCV)
COVER PHOTOGRAPHS:Women & Child: Palawan Tropical Forestry ProtectionProgram; School of Barracuda and Jack Fish: Jeurgen Freund;Orchid, Forest, Mangrove Aerial View: PCSDS - Celso Quiling
PHOTO CREDITS:All photos by PCSDS except Soft Coral with Feather Star (pg.1)and Bottle-Nosed Dolphins (pg.37) by Katherine Jack
GIS MAPS:Wilson R. Pambid, Fernando E. Padilla, Ryan T. Fuentes
FUNDING PARTNER:United Nations Educational, Scientific and CulturalOrganization (UNESCO)
ISBN
Philippine Copyright © 2005 by Palawan Council forSustainable Development, Puerto Princesa City, Philippines.ALL RIGHTS RESERVED.
This report can be reproduced as long as the convernors areproperly acknowledged as the source of information.
Reproduction of this publication for sale or other commercialpurposes is prohibited without the written consent of thepublisher.
PRINTED BY:Futuristic Printing Press, Puerto Princesa City, Philippines.
SUGGESTED CITATION:PCSDS. 2005. The State of the Environment 2004, Provinceof Palawan, Philippines. Palawan Council for SustainableDevelopment, Puerto Princesa City, Philippines.

v
Table Of Contents
List of Tables ....................................................................................................................... viiList of Figures ..................................................................................................................... viiiList of Maps ........................................................................................................................ ixList of Appendices ............................................................................................................. xAcronyms ............................................................................................................................ xi
I. INTRODUCTION ................................................................................................ 1
II. EXECUTIVE SUMMARY ................................................................................... 2
III. LAND RESOURCES
3.1 Rock Formations ........................................................................................ 93.2 Geomorphological Features ..................................................................... 93.3 Slope ............................................................................................................ 103.4 Soil Physical Characteristics ..................................................................... 103.5 Soil Chemical Characteristics ................................................................... 12
IV. LAND COVER
4.1 Forest Cover ............................................................................................... 214.2 Mangrove Forest and Fishponds ............................................................. 224.3 Grasslands, Brushland and Barelands .................................................... 224.4 Agricultural and Built-up Area ............................................................... 23
V. FOREST RESOURCES
5.1 Timber Production..................................................................................... 275.2 Non-Timber Production ........................................................................... 29
VI. VERTEBRATE WILDLIFE
6.1 Species Composition ................................................................................. 336.2 Local Abundance ....................................................................................... 336.3 Conservation Status................................................................................... 346.4 Species Account ......................................................................................... 34
VII. AGRICULTURAL RESOURCES
7.1 Crop Production ........................................................................................ 417.2 Livestock Production ................................................................................ 457.3 Poultry Production .................................................................................... 46

vi
VIII. WATER RESOURCES
8.1 Climate ........................................................................................................ 478.2 General Water Quality .............................................................................. 508.3 Nutrients ..................................................................................................... 598.4 Conclusion .................................................................................................. 618.5 Recommendations ..................................................................................... 62
IX. COASTAL RESOURCES
9.1 Mangrove Forest ........................................................................................ 679.2 Seagrass and Seaweed Communities...................................................... 749.3 Coral Reef.................................................................................................... 789.4 Reef Fisheries .............................................................................................. 819.5 Issues ........................................................................................................... 83
X. HUMAN RESOURCES
10.1 Population Distribution ............................................................................ 8910.2 Population Density .................................................................................... 8910.3 Population Growth .................................................................................... 9110.4 Population Structure ................................................................................. 9310.5 Dependency Ratio...................................................................................... 93
XI. REFERENCES ....................................................................................................... 99
XII. APPENDICES ....................................................................................................... 103
vii
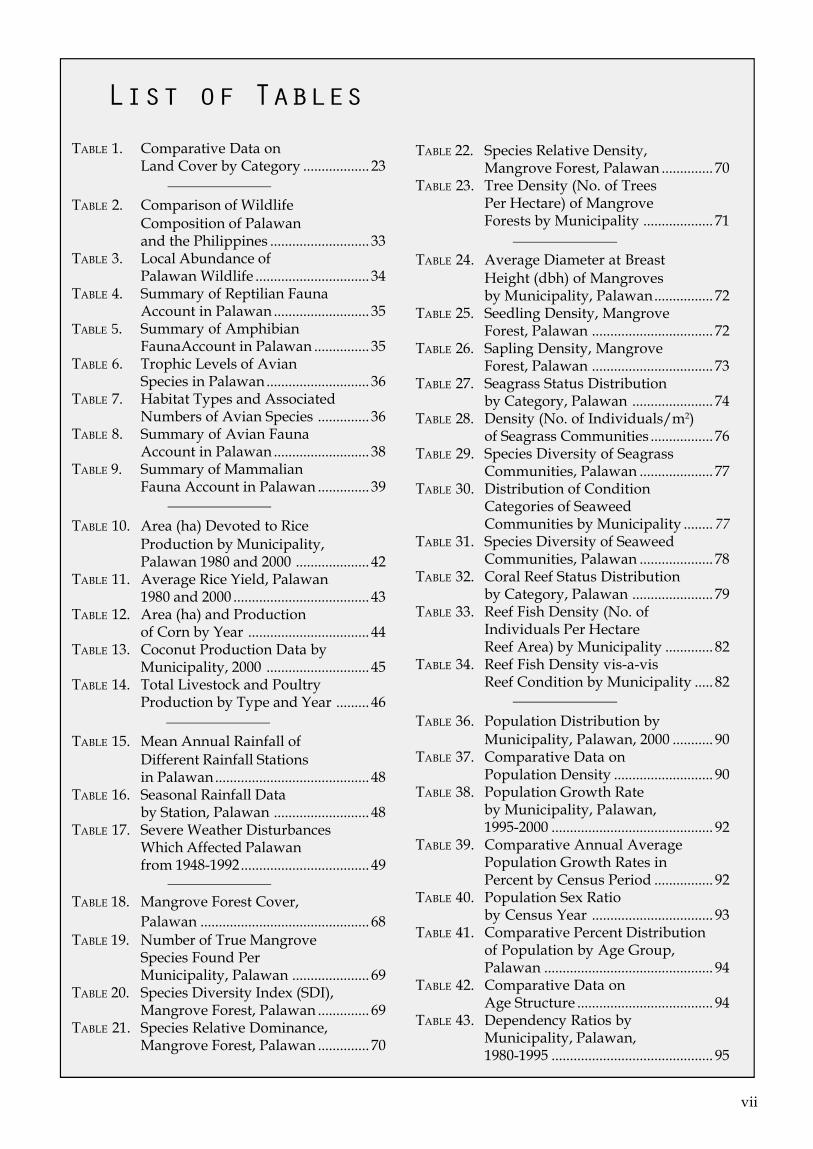
TABLE 1. Comparative Data onLand Cover by Category .................. 23
TABLE 2. Comparison of WildlifeComposition of Palawanand the Philippines ........................... 33
TABLE 3. Local Abundance ofPalawan Wildlife ............................... 34
TABLE 4. Summary of Reptilian FaunaAccount in Palawan .......................... 35
TABLE 5. Summary of AmphibianFaunaAccount in Palawan ............... 35
TABLE 6. Trophic Levels of AvianSpecies in Palawan............................ 36
TABLE 7. Habitat Types and AssociatedNumbers of Avian Species .............. 36
TABLE 8. Summary of Avian FaunaAccount in Palawan .......................... 38
TABLE 9. Summary of MammalianFauna Account in Palawan .............. 39
TABLE 10. Area (ha) Devoted to RiceProduction by Municipality,Palawan 1980 and 2000 .................... 42
TABLE 11. Average Rice Yield, Palawan1980 and 2000 ..................................... 43
TABLE 12. Area (ha) and Productionof Corn by Year ................................. 44
TABLE 13. Coconut Production Data byMunicipality, 2000 ............................ 45
TABLE 14. Total Livestock and PoultryProduction by Type and Year ......... 46
TABLE 15. Mean Annual Rainfall ofDifferent Rainfall Stationsin Palawan.......................................... 48
TABLE 16. Seasonal Rainfall Databy Station, Palawan .......................... 48
TABLE 17. Severe Weather DisturbancesWhich Affected Palawanfrom 1948-1992................................... 49
TABLE 18. Mangrove Forest Cover,Palawan .............................................. 68
TABLE 19. Number of True MangroveSpecies Found PerMunicipality, Palawan ..................... 69
TABLE 20. Species Diversity Index (SDI),Mangrove Forest, Palawan .............. 69
TABLE 21. Species Relative Dominance,Mangrove Forest, Palawan .............. 70
TABLE 22. Species Relative Density,Mangrove Forest, Palawan .............. 70
TABLE 23. Tree Density (No. of TreesPer Hectare) of MangroveForests by Municipality ................... 71
TABLE 24. Average Diameter at BreastHeight (dbh) of Mangrovesby Municipality, Palawan................ 72
TABLE 25. Seedling Density, MangroveForest, Palawan ................................. 72
TABLE 26. Sapling Density, MangroveForest, Palawan ................................. 73
TABLE 27. Seagrass Status Distributionby Category, Palawan ...................... 74
TABLE 28. Density (No. of Individuals/m2)of Seagrass Communities ................. 76
TABLE 29. Species Diversity of SeagrassCommunities, Palawan .................... 77
TABLE 30. Distribution of ConditionCategories of SeaweedCommunities by Municipality ........ 77
TABLE 31. Species Diversity of SeaweedCommunities, Palawan .................... 78
TABLE 32. Coral Reef Status Distributionby Category, Palawan ...................... 79
TABLE 33. Reef Fish Density (No. ofIndividuals Per HectareReef Area) by Municipality ............. 82
TABLE 34. Reef Fish Density vis-a-visReef Condition by Municipality ..... 82
TABLE 36. Population Distribution byMunicipality, Palawan, 2000 ........... 90
TABLE 37. Comparative Data onPopulation Density ........................... 90
TABLE 38. Population Growth Rateby Municipality, Palawan,1995-2000 ............................................ 92
TABLE 39. Comparative Annual AveragePopulation Growth Rates inPercent by Census Period ................ 92
TABLE 40. Population Sex Ratioby Census Year ................................. 93
TABLE 41. Comparative Percent Distributionof Population by Age Group,Palawan .............................................. 94
TABLE 42. Comparative Data onAge Structure ..................................... 94
TABLE 43. Dependency Ratios byMunicipality, Palawan,1980-1995 ............................................ 95
List of Tables

viii
FIGURE 1. Distribution of RockFormations, Palawan ....................... 10
FIGURE 2. Relief Features of Palawan ............. 11FIGURE 3. Slope Class Distribution.................. 12
FIGURE 4. Graph Showing PercentageLand Cover by Category,1992-1998, Palawan .......................... 22
FIGURE 5. Annual Timber Production ............ 28FIGURE 6. Annual Manifestation
of Confiscated Timber ..................... 28FIGURE 7. Percentage Distribution of
Total Timber Confiscatedfrom 1990 to 2000, Palawan ............ 28
FIGURE 8. Annual Almaciga ResinProduction, Palawan ....................... 29
FIGURE 9. Percentage Distributionof Total Almaciga Productionfrom 1999-2000, Palawan ................ 30
FIGURE 10. Annual Rattan Production.............. 31FIGURE 11. Percentage Distribution of
Rattan Production from1990-1999 by District, Palawan ...... 31
FIGURE 12. Annual Volume of RattanConfiscated, Palawan ...................... 31
FIGURE 13. Percentage Distribution ofRattan Confiscations from1990-1997, Palawan .......................... 32
FIGURE 14. Species Composition ofPalawan and the Philippines ......... 34
FIGURE 15. Rice Production PercentageDistribution, Palawan, 2000 ........... 44
FIGURE 16. pH Value of Water Samplesfrom River Stations inSouthern Palawan ............................ 50
FIGURE 17. pH Value of Water Samplesfrom River Stations inNorthern Palawan............................ 51
FIGURE 18. Concentration of Total SuspendedSolids in Water Samplesfrom River Stations inSouthern Palawan ............................ 51
FIGURE 19. Concentration of TotalSuspended Solids in WaterSamples from River Stations inNorthern Palawan ............................ 51
Southern Palawan ............................ 53FIGURE 23. Temperature Readings in Water
Samples from River Stations inNorthern Palawan............................ 54
FIGURE 24. Concentration of Dissolved Oxygenin Water Samples from RiverStations in Southern Palawan ........ 54
FIGURE 25. Concentration of Dissolved Oxygenin Water Samples from RiverStations in Northern Palawan ........ 54
FIGURE 26. Concentration of Total DissolvedSolids in Water Samples from RiverStations in Southern Palawan ....... 55
FIGURE 27. Concentration of Total DissolvedSolids in Water Samples from RiverStations in Northern Palawan ........ 55
FIGURE 28. Values of Color in Water Samplesfrom River Stations inSouthern Palawan ............................ 56
FIGURE 29. Values of Color in Water Samplesfrom River Stations inNorthern Palawan............................ 56
FIGURE 30. Concentration of Chloride inWater Samples from RiverStations in Southern Palawan ........ 57
FIGURE 31. Concentration of Chloride inWater Samples from River Stations in Northern Palawan .......... 57
FIGURE 32. Concentration of CalciumCarbonate in Water Samplesfrom River Stations inSouthern Palawan ............................ 57
FIGURE 33. Concentration of Calcium Carbonate in Water Samplesfrom River Stations inNorthern Palawan............................ 58
FIGURE 34. Total Hardness in Water Samplesfrom River Stations inSouthern Palawan ............................ 58
FIGURE 35. Total Hardness in Water Samplesfrom River Stations inNorthern Palawan............................ 58
FIGURE 20. Turbidity Readings in WaterSamples from River Stations inSouthern Palawan ............................ 52
FIGURE 21. Turbidity Readings in WaterSamples from River Stations inNorthern Palawan ............................ 52
FIGURE 22. Temperature Readings in WaterSamples from River Stations in
List Of Figures

ix
List Of MapsMAP 1.Broad Landforms Types, Palawan .................... 14
MAP 2.Soil Texture, Palawan ......................................... 15
MAP 3.Soil Depth, Palawan ............................................ 16
MAP 4.Soil Internal Drainage, Palawan........................ 17
MAP 5.Soil Organic Matter Content, Palawan............. 18
MAP 6.Soil Phosporous Content, Palawan................... 19
MAP 7.Forest Cover, Palawan, 1998 .............................. 24
MAP 8.Land Cover, Palawan, 1998 ................................ 25
MAP 9.Mean Annual Precipitation, Palwan,1949-2003 ............................................................... 63
MAP 10.Concentration of Total Suspended Solidsin Rivers, Palawan, 1998-2003 ........................... 64
MAP 11.Concentration of Total Dissolved Solidsin Rivers, Palawan, 1998-2003 ........................... 65
MAP 12.Feeding Trenches of Dugongs, Palawan,1999-2004 ............................................................... 84
MAP 13.Location of Tridacna InvertebrateMarine Species, Palawan, 1999-2004 ................ 85
MAP 14.Coral Reef Condition, Palawan,1999-2004 ............................................................... 86
MAP 15.Seagrass Condition, Palawan, 1999-2004 ......... 87
MAP 16.Reef Fish Density, Palawan, 1999-2004 ............ 88
MAP 17.Population Density, Palawan, 2000 .................. 96
MAP 18.Population of Growth Rate, Palawan,1995-2000 ............................................................... 97
FIGURE 36. Concentration of Nitrogen-Nitratein Water Samples from RiverStations in Southern Palawan ....... 59
FIGURE 37. Concentration of Nitrogen-Nitratein Water Samples from RiverStations in Northern Palawan ........ 60
FIGURE 38. Concentration of Nitrogen-Nitritein Water Samples of RiverStations in Southern Palawan ........ 60
FIGURE 39. Concentration of Nitrogen Nitritein Water Samples from RiverStations of Northern Palawan ........ 60
FIGURE 40A.Concentration of Phosphorousin Water Samples from RiverStations in Southern Palawan ........ 61
FIGURE 40B.Concentration of Phosphorousin Water Samples from RiverStations in Northern Palawan ........ 62
FIGURE 41. Average Number of Trees/Hectareof Mangrove Area PerMunicipality, Palawan .................... 71
FIGURE 42. Seedling and Sapling Density ofMangroves by Municipality .......... 73
FIGURE 43. Condition of SeagrassCommunity by Category ................ 75
FIGURE 44. Condition of SeaweedCommunity by Category ................ 75
FIGURE 45. Reef Condition by Category ........... 79FIGURE 46. Distribution of Reef Fish Density
by Municipality, Palawan ............... 81
FIGURE 47. Projected Population ofPalawan, 2000-2020 .......................... 91

x
Appendix A-1 ...................................................... 104Extent of Different Landforms ofPalawan Province.
Appendix A-2 ...................................................... 105Physical Soil Characteristic by LandManagement Unit, Palawan.
Appendix A-3 ...................................................... 111Chemical Soil Characteristic by LandManagement Unit, Palawan.
Appendix B-1 ....................................................... 1191992 Land Cover Data by Municipality,Palawan.
Appendix B-2 ....................................................... 1211998 Land Cover Data by Municipality,Palawan.
Appendix B-3 ....................................................... 123Comparative Land Cover Data, Palawan.
Appendix C-1 ....................................................... 128List of Palawan Wildlife Species withConservation Status.
Appendix C-2 ....................................................... 134List of Reptile Species in the PalawanFaunal Region.
Appendix C-3 ....................................................... 137List of Amphibian Species in the PalawanFaunal Region.
Appendix C-4 ....................................................... 138List of Avian Species in the PalawanFaunal Region.
List Of AppendicesAppendix D-1a .................................................... 150
Mean Annual Rainfall (mm) by Station,Palawan.
Appendix D-1b .................................................... 151Mean Monthly Rainfall (mm) by Station,Palawan.
Appendix D-2 ...................................................... 152Data on Water Quality parameters fromRiver Stations in Palawan.
Appendix E-1 ....................................................... 165List of Mangrove Species, Province ofPalawan.
Appendix E-2 ....................................................... 167List of Seagrass Species, Province ofPalawan.
Appendix E-3 ....................................................... 168List of Seaweed Species, Province ofPalawan.

xi
AcronymsBAS Bureau of Agricultural StatisticsCCGI Cuyo and Calamian Group of
IslandsCEC Cation Exchange CapacityCENRO Community Enrironment and
Natural Resource OfficeCI Conservation InternationalCITES Convention on International Trade
in Endangered Species of Fauna andFlora
CRA Coastal Resources AssessmentCWQC Classification Water Quality CriteriaDBH Diameter at Breast HeightDENR Department of Environment and
Natural ResourcesDO Dissolved OxygenECAN Environmentally Critical Areas
NetworkEEC European Economic CommunityEMES Environmental Monitoring and
Evaluation SystemENRO Environment and Natural Resource
Office (Provincal, Municipal or City)HNP Hydrometric Network ProgramIEP Integrated Environmental ProgramIP Indigenous Peoples
IUCN International Union for theConservation of Nature
JAFTA Japan Forest Technical AssociationLGU Local Government UnitNSO National Statistics OfficePAGASA Philippine Atmospheric,
Geophysical and AstronomicalServices Adminastration
PCA Philippine Coconut AuthorityPCSD Palawan Council for Sustainable
DevelopmentPCSDS Palawan Council for Sustainable
Development StaffPIADPO Palawan Integrated Area
Development Project OfficePPSRNP Puerto Princesa Subterranean River
National ParkPRWU Philippine Revised Water UsagePTFPP Palawan Tropical Forestry
Protection ProgramRA Republic ActSDI Shannon Diversity IndexSEP Strategic Environmental Plan for
PalawanTDS Total Dissolved SolidsTLA Timber License Agreement
Note: This list includes acronyms onlymentioned in the text of this report.


STATE OF THE ENVIRONMENT 1
II. Executive Summ
aryExecutive Sum
mary
I
INTRODUCTION
Considered as the nation’s last ecological frontier,Palawan is endowed with rich natural resources and highlydiverse flora and fauna which are essential to a balanceand stable ecology. It has a vast mangrove stand thatserves as pollutant sink and life support system for avariety of marine organisms. Also it is blessed with highlydiverse coral reefs which aside from being favorite divesites are home to numerous marine fish species includinginvertebrates. The Palawan reefs are said to account for36.30 percent of the total reef area in the Philippines.Moreover, Palawan’s seagrass meadows which serve asfeeding grounds for the rare and endangered species ofmarine turtles and sea cow or dugongs also abound inPalawan. Endowed with a productive marine ecosystem,it is thus believed that approximately forty percent (40%)of the country’s fish production comes from the 176fishing grounds in Palawan.
Palawan’s unique and fragile environment provided thebasis for the formulation of the Strategic EnvironmentalPlan/SEP for Palawan and its subsequent adoption as alaw (Republic Act 7611) that would govern the mode ofdevelopment in the Province. The main implementingstrategy of SEP is the Environmentally Critical AreasNetwork (ECAN). In support to ECAN as a supportmechanism is the Environmental Monitoring andEvaluation System (EMES).
The EMES under the SEP was the first attempt towards acomprehensive environmental monitoring and evaluationsystem in the Philippines. It is intended to measurechanges in environmental status through a systematic andreliable data generation, identify adverse environmentaltrends and crisis areas, recommend solutions, assess theimplementation of the SEP and suggest measures to makethe SEP more responsive to the changing needs. Underthe EMES, environmental reports are prepared to presentthe environmental condition of Palawan. The firstcomprehensive environmental report was produced in
1985 and the second was prepared in 1999. Subsequently,this report presents the latest information on the statusof Palawan’s environment as input to planners and policymakers in charting the future of Palawan.
Top: Soft Coral with Feather Star at Tubbataha Reef.Bottom: Palawan endemic Calamian Deer in Calauit
Game Preserve and Wildlife Sanctuary.

2 PALAWAN
II
EXECUTIVE SUMMARY
2.0 LAND RESOURCES
Land resources of Palawan were assessed in terms of rockcomposition that is, whether they belong to thesedimentary, igneous or metamorphic type of rock.Among the three, igneous rocks constitute the biggestportion accounting for about forty five percent (45%)of the aggregate rock formations in Palawan. This typeof rock is economically important because its existencebrought about the occurrence of mineral wealth such as
chromite, nickel, gold, mercury and manganese. However,in the context of forestry production its presence isunfavorable as only submarginal forest could thrive insuch formations. Following igneous rocks in terms ofareal coverage are sedimentary rocks which account forthirty five percent (35%) of the aggregate rock formationindicating a considerable potential area for agriculturaldevelopment. Covering the least area are metamorphicrocks which constitute approximately twenty percent(20%). Fortunately, despite the limited extent,metamorphic rocks are very valuable to Palawan. Theirpresence made possible the existence of caves andunderground channels as these occur in association withmetamorphic rocks of the limestone type. Consequently,such natural formations made Palawan a favoriteecological destination.
Geomorphological data of Palawan reveal that hills andmountains constitute a large portion (64%) of the Provincetotal land mass while only thirty six percent (36%) couldbe considered as lowland areas where most of thedevelopment occur. While the extensive hilly portionwhich is approximately forty nine percent (49%) may beutilized for agricultural production, this necessitates theadoption of intensive conservation measures as uplandcultivation will likely destroy lowland areas. Thus, utmostcare and consideration of Palawan’s landforms have tobe taken into account in planning its sustainabledevelopment.
In terms of soil characteristics, Palawan soils aregenerally acidic or have low soil pH whereinmicronutrients such as Fe, Al1, Mn1, Zn, Cn and Cobalthave their maximum availability but possible toxicity.There is therefore a need to correct the pH of Palawansoil or to identify and grow certain crops that will thrivein soil with low pH. Further, results of the soil surveyshowed that in most of the agricultural areas of Palawan,the cation exchange capacity (CEC) or the ability of soilto store and release important elements for plant growthis considered marginal and therefore in its natural state
Relief Features of Palawan
Hills48.9%
Plateau1.9%
Terraces7.7%
Coastal5.8%
River wash beach sand plateauscarpment
4.6%Mountains 14.8%
AlluvialPlains15.3%
Distribution of Rock Formations, Palawan
Metamorphic20%
Sedimentary35%
Igneous45%

STATE OF THE ENVIRONMENT 3
II. Executive Summ
aryExecutive Sum
mary
such soils are incapable of enhancing plant growth. Also,the organic matter content of Palawan soils is generallycharacterized as low to medium and its phosphoruscontent deficient. Thus application of fertilizers withthe appropriate amount of nitrogen and phosphorus isnecessary to improve soil fertility.
On-going threats to these resources include open pitmining, quarrying, indiscriminate utilization of fertilizers,herbicides, insecticides and other chemicals, and slash andburn farming.
2.1 LAND COVER
Land cover data sourced from satellite imageries revealan impressive increase in forest cover from 52 percent in1992 to 56 percent in 1998. Despite illegal timberextraction, a complete reversal from forest loss of 19,000ha/year between 1979 to 1984 to forest increase of8,402 ha/year was attained between 1992 to 1998. It isbelieved that the fast recovery of Palawan forest may beattributed largely to the imposition of total commerciallog ban in 1992. In addition, environmental educationefforts of locally based government and non-governmentorganizations to a certain degree are recognized ascontributory to improving forest cover by weaning thepeople from their destructive activities and involving themin protecting the forest.
As to mangrove forest, overall assessment indicates anincrease of 744 hectares in spatial extent from 1992 to1998 despite the conversion of certain mangrove standsinto fishponds as evidenced by the increase in fishpondareas from 170 to 1,495 hectares for the same period.The increase could be attributed to the naturalregeneration of certain undisturbed mangrove areas.
On the other hand, the increase of built-up areas from1,083 hectares to 13,279 hectares was probably triggeredby high population growth rate in Palawan. Further, land
devoted for agriculture also expanded by 114,352hectares to meet the demand for food by the increasingpopulation. Most of the built-up and agricultural landtransformations were presumed to have occurred ingrasslands which manifested a reduction in area of212,149 hectares.
2.2 FOREST RESOURCES
Information on forest resources utilization based onDENR records reveal that since 1992, when totalcommercial log ban was enforced in Palawan pursuant toRepublic Act 7611, annual total timber productionmanifested a decline. While volume of timber legallyproduced went down by 99.55% from 97,000 m3 in 1990to 435 m3 in 2000, illegal cutting of forest trees has notyet been totally eliminated as indicated by the totalconfiscated timber of 3,487 m3 from 1990-2000. Highdemand for wood as a consequence of high populationhad possibly led to more illegal timber extraction.
With respect to almaciga resin, data show a similardeclining annual collection from 739,736 kg in 1990 to184,732 kg in 2000. Loss of almaciga trees due to fellingby past logging concessionaires and improper tappingwere viewed to be the causes of the decline in resinproduction.
To sustain the benefits derived from these century oldtrees by the indigenous communities in particular, policieslike the total ban in the cutting of almaciga trees and thegranting of preferential rights to indigenous peoples (IP’s)in the awarding of almaciga resin concessions wereformulated. Accordingly, in recognition of the rights ofIP’s over their ancestral lands, applicants of almacigaconcessions are now required to secure Prior InformedConsent from the affected tribal communities before theyare granted resin concessions.
In the case of rattan, extraction thereof was reduced by38% from 4,053,055 lineal meters in 1990 to 2,512,999lineal meters in 2000. The decline may be attributedto the gradual depletion of rattan resources brought aboutby failure of licencees to undertake replenishment/reforestation programs. It appears that rattanconcessionaires are generally dependent upon the naturallygrown rattan which unfortunately cannot sustain theirdemand. It was also noted that with the decline in theannual production of rattan, the total annual confiscationsalso decreased.
Destructive practices in the collection of rattan andalmaciga resin such as improper tapping of almaciga treesand failure of rattan gatherers to plant rattan seedlingswere identified as threat in the sustainability of theseresources. Further, despite the imposition of a total
0.0010.0020.0030.0040.0050.0060.00
Per
cent
age
Are
a (%
)
Fore
stM
angr
ove
Area
Bru
shla
ndG
rass
land
A
gric
ultu
ral A
rea
Bar
e/R
ock
Are
asM
inin
g A
rea
Bui
lt-up
Are
aFi
shpo
ndLa
kes/
Wat
er B
ody
Clo
uds/
Sha
dow
Land Category
1992
1998
Percentage Land Cover by Category
Land Category

4 PALAWAN
commercial log ban in Palawan, illegal cutting of foresttrees for timber remains to be a threat to forest recovery.
2.3 VERTEBRATEWILDLIFE RESOURCES
Palawan’s Faunal diversity comprises 422 species ofterrestrial and marine vertebrate wildlife accounting for38.6% of the several wildlife species in the entire country.Some of these wildlife are endemic or found only in theprovince or have restricted ranges confined in a particulararea or island.
Common species based on occurrence and abundancestatus include 98 birds, 34 reptiles, 28 mammals, and 12amphibians. Rare species on the other hand account for30 reptiles, 26 birds, six amphibians, and two mammalspecies.
Species that are of conservation importance asdetermined by the International Union for theConservation of Nature (IUCN) are the following:Philippine Crocodile (Crocodylus mindorensis)[Critically Endangered], Philippine Cockatoo (Cacatuahaematuropygia) [Critically Endangered], PalawanPeacock Pheasant (Polypectron emphanum)[Endangered], Blue-naped Parrot (Tanygnathuslucionensis) [Endangered], Palawan Montane TreeSquirrel (Sundasciurus juvencus) [Endangered], PalawanSoft-furred Mountain Rat (Palawanomys furvus)[Endangered], Calamian Deer (Axis calamianensis)[Endangered], Palawan Stink-Badger (Mydaus marchei)[Vulnerable], Palawan Flying Fox (Acerodon leucotis)[Vulnerable], and the Dugong (Dugong dugong)[Vulnerable].
Species listed under the Convention on InternationalTrade in Endangered Species of Wild Fauna and Flora(CITES) Appendix 1, totally banned from trade are:Philippine Crocodile, all marine turtles, Peregrine Falcon(Falco peregrinus), Leopard Cat (Prionailurusbengalensis), Calamian Deer, all rorquals(Balaenopteridae), Sperm Whale (Physeter catadon),Finless Porpoise (Neophocaera phocaenoides), andDugong.
Examples of trade-regulated species listed under CITESAppendix 2 are the: Monitor Lizard (Varanus salvator),Reticulated Python (Python reticulatus), Malay CommonCobra (Naja sumatrana), and the rare King Cobra(Ophiophagus hannah); all diurnal raptors under OrderFalconiformes, (except the Peregrine Falcon) and allnocturnal raptors under Order Strigiformes; PalawanFlying Fox, Large Flying Fox (Pteropus vampyrus),Long-tailed Macaque (Macaca fascicularis), MalayanPangolin (Manis javanica), and all dolphin species(Delphinidae).
No trade restricted/regulated amphibian species arerecorded.
Having been endowed with such rich wildlife resources,Palawan remains to be ground for illegal wildlife hunting,trading, bioprospecting, and piracy thereby makingPalawan one of the biodiversity hotspots in thePhilippines.
0
20000
40000
60000
80000
100000
To
tal V
olu
me(
m3)
1991 1993 1995 1997 1999
Year
Annual Timber Production, Palawan
Annual Manifestation of ConfiscatedTimber, Palawan
(lin
eal
met
ers)
01,000,0002,000,0003,000,0004,000,0005,000,0006,000,0007,000,000
1991 1993 1995 1997 1999
Year
Vo
lum
e o
f C
on
fisca
ted
Tim
ber
(m
3)
0200400600800
1000120014001600
1991 1993 1995 1997 1999
Year
Annual Rattan Production, Palawan

STATE OF THE ENVIRONMENT 5
II. Executive Summ
aryExecutive Sum
mary
2.4 AGRICULTURAL RESOURCES
Rice is one of the major crops produced in Palawan andis generally grown in the uplands and paddy fields.Available data show that total land area devoted to ricewas reduced by 1,660 hectares from 1980 to 2000. Thereduction was mainly the result of non-production ofupland rice. All island municipalities except Balabacand all northern municipalities which used to be uplandrice producers ceased to grow upland rice. The ban onkaingin as well as the increase in environmentalawareness level of farmers are believed to havecontributed to the unpopularity of upland farming therebyreducing the area under upland rice cultivation. On onehand, an increase in the extent of paddy fields devotedto rice was manifested from 1980 to 2000.
In 2000, the yield for irrigated rice was placed at 4.5tons/ha which is higher than the 1999 regional andnational average of 3.23 and 3.75 tons/ha respectively.Similarly, average production for rainfed rice wasestimated at 3.12 tons/ha, still higher than the regionalaverage of 2.28 tons/ha. In its entirety, total riceproduction level was placed at 191,663 metric tons (cleanrice) in 2000. On the presumption that the per capitarice consumption of a Filipino is 125 kg/year, the riceproduction level of 191,636.02 was assessed to besufficient to feed Palawan’s population of 775,412 in thesaid year. However, with the high annual populationgrowth rate of Palawan for 1990-1995 estimated at 3.66%(higher than the national or regional average), it isexpected that rice shortage may set in by year 2007 unlessPalawan’s rice production level will be increased throughexpansion of farms under existing rice cultivationcomplemented by improved rice technology.
Meanwhile corn, also a major crop in Palawan, is mainlygrown for trading outside Palawan as feeds of livestockand poultry and for local human consumption in the formof green corn. While records show that the area utilizedfor corn production decreased from 20,676 hectares in1991 to 11,133 hectares in 2001, average production perhectare was noted to increase from 1.41 mt/ha in 1991 to2.22 mt/ha in 2001. The national average yield for cornin 1999 which was placed at 1.74 mt/ha is notably lowerthan the level obtained for Palawan in 2001.
Coconut is usually found along the coastal areas ofmainland Palawan. In 2000, the extent of coconutplantation was placed at 57,440 hectares, 69% (39,702hectares) were located in southern mainland Palawan, 16%(9,050 has.) was accounted for by the island municipalitiesand the remaining 15% (8,659 hectares) was shared bythe northern mainland municipalities. Brooke’s Pointregistered the highest aggregate area planted to coconut(12,859 hectares), followed by Balabac with 7,053
hectares. Cagayancillo has the lowest coconut area withonly 162 hectares. Southern mainland Palawanmanifested a relatively high production of 1.48 nuts/haor 66 nuts/tree. On a per municipality basis, SofroñioEspañola registered the highest average production at1.78 mt/ha while Araceli the lowest, with 0.87 mt/ha.On the basis of nuts/tree, Brooke’s Point manifested thehighest production rate of 71 nuts per tree whileMagsaysay recorded only 45 nuts per tree.
Aside from crop production, farmers also raise livestockand poultry both in their backyard and in commercial scaleto supplement their consumption requirement and otherfamily needs. Livestock commonly raised in the provinceare carabao, cattle and hogs. Carabao however is basicallyused as draft animals. Available data from various sourcesreveal a reduction in carabao population from 27,616 in1982 to 21,343 in 1991 attributable to the unregulatedsale of carabaos to Manila by declaring them unfit asworking animals. But from 1991 to 1995, carabaopopulation manifested an upward trend. As to cattleproduction, both backyard and commercial scale, therewas a significant increase from 1990 to 1993 indicatingthat cattle raising is a growing industry in the province.
The same trend was observed for hog/swine and poultrypopulation. In a span of 13 years (1982 to 1995) swine/hog population increased by about 124 percent whilepoultry population exhibited an increase of 24% from 1982to 1995. The huge increase in hog/swine and poultrypopulation could have been triggered by the demand froman increasing population and tourism-relatedestablishments such as hotels and restaurants in PuertoPrincesa City.
2.5 WATER RESOURCES
Water quality monitoring aims to generate baseline andcontinuous information on the quality of surface water,seasonal variations and possible effect of human activitieson the freshwater ecosystem. The water qualityparameters include water temperature, pH, dissolvedoxygen, conductivity, total dissolved solids, color,turbidity, alkalinity, hardness, chloride and nutrients suchas nitrogen nitrate, nitrogen nitrite, nitrogen ammonia andphosphorous.
River monitoring conducted in the selected catchmentsof Iraan, Calategas, Aramaywan, Labog Tigaplan,Guineratan, Inandeng and Abongan commenced inSeptember 1996. Results of the quarterly monitoring usingthe aforementioned water quality parameters showed thatthe water quality of these rivers did not exceed thepermissible level set by DENR standards for Class Afreshwater. However, on a number of occasions, samplestaken from the sites of Inandeng River manifested pH

6 PALAWAN
value below the minimum limit of 6.5. Likewise, on onesampling period, the suspended solids of water taken fromCalategas, Iraan and Labog rivers exceeded the 50 mg/Lpermissible level for Class A freshwater, an indicationof on-going pollution. Further, on several occasions,Guineratan and Abongan rivers exhibited high turbidityas reflected in the color intensity and concentration ofsuspended solids. In particular, Guineratan River locatedin the municipality of Roxas appeared to be always turbid,with average concentration of suspended solids placed at246.7 mg/L, much higher than the permissible level of 50mg/L. The poor water quality condition of GuineratanRiver is likely affected by open pit gold mining activitiesat its upper catchment that commenced in 1993. It isrecommended that a special study be undertaken to assessthe impact of said mining activity so that mitigatingmeasures be instituted.
In terms of dissolved oxygen, Abongan river manifestedthe lowest especially when streamflow is nil. This impliesthat aquatic organism will have a hard time surviving inAbongan river especially during summer.
Most of the monitored rivers have been subjected to sandand gravel quarrying activities specifically Labog riverwhich has been experiencing riverbank erosion. Theintensive utilization of rivers as source of quarry materialsis possibly due to the high demand for aggregates.Apparently, the policy on total commercial log ban entailedthe shift from wood to concrete materials thus puttingmore pressure on rivers. The institution of stabilizationmeasures to prevent further erosion of rivers is thereforea must.
2.6 COASTAL RESOURCES
The mangrove forest of the province was declared aMangrove Swamp Reserve in 1982 by virtue ofPresidential Proclamation 2152. Inspite of the law, themangrove cover of the province has shown a decliningtrend over the years from 1984 until 1992 as shown by itsreduction from 46,000 ha in 1984 to 36,192 ha in 1993or an average yearly reduction of 1090 ha. However,from 1992 to 1998, there was an increase of 744 hectaresin the extent of mangrove or an equivalent mangroveimprovement of 124 ha/year despite mangrove forest lostto fishpond alone was estimated at 1,642 ha from 1992 to1998. Conversion of mangrove forests into fishponds orsettlements, tree felling for tan debarking and charcoalmaking were some of the problems affecting the mangroveforest of Palawan.
A high degree of species diversity can be found in themangrove forest of the province. Data generated fromvarious coastal resources assessment (CRA) showed atotal of 23 “true mangrove” species belonging to 11
Fair34.72%
Good20.83%
Excellent2.78%Poor
41.67%
Poor17.38%
Excellent3.93% Good
34.43%
Fair44.26%
Condition of Seagrass Communityby Category, Palawan
Reef Condition by Category, Palawan
families present in the 18 municipalities of the province.Rhizophora apiculata (bakawan lalake) and Sonneratiaalba (pagatpat) were the dominant species. This iscomparable to the same number of species under 19families recorded for the Philippines.
Equally important are the seagrass beds which serve asnursery, breeding grounds and source of food for fish,marine turtles, dugong and other aquatic invertebrates.Physically, they interact with coral reefs and mangrovesin reducing wave energy thus protecting the coastal zonefrom erosion. Of the 216 sample sites surveyed in 19municipalities, 90 or 41.67% were in poor (0-25%vegetative cover) condition, 75 or 34.72% in fair (26-50%) condition, 45 or 20.83% were in good (51-75%)condition, and only 6 or 2.78% were in excellent (above75%) condition.
A high degree of species diversity was noted among theseagrass beds of the province. There was a total of 14species under two families, approximating the 16 speciesrecorded for the Philippines.

STATE OF THE ENVIRONMENT 7
II. Executive Summ
aryExecutive Sum
mary
The coral reef of the province has an approximate areaof 9,900 km2, of which 100 km2 or 1.01% is accountedby the Tubbataha Reef National Marine Park. This area,however, does not include the reefs of the Kalayaan IslandGroup. The CRA for the coral ecosystem in the provinceinvolving 305 sites in the same 19 municipalities showedthat only 3.93 % of the reefs are in excellent (75-100%live coral cover) condition. Most of the reefs (44.26 %)are in fair (25-49.9% live coral cover) condition. Reefsthat are in good (50-74.9% live coral cover) conditionconstitute 34.43% while 17.38% were in poor (less than25% live coral cover) condition.
The coastal resources of Palawan have been under threatfrom various destructive activities both in the terrestrialand the coastal areas. In the coral areas, the biggest threatat present is the live fish industry which thrives on the useof cyanide to catch the fish alive causing coral death.Further, dynamite fishing as well as the use of efficientgears within the municipal waters also contribute to coraldestruction resulting in the decline in fish catch.
2.7 HUMAN RESOURCES
The population of Palawan in 2000 was estimated at755,412, with Puerto Princesa City registering the highestcount at 161,912 accounting for 21 percent of theProvince’s total population. Except for Kalayaan, themunicipality of Cagayancillo had the least populationcount at 6,348 or 0.84 percent of the provincial total.However, in terms of population density, this municipalityregistered the highest at 412 persons/sq.km. San Vicentemunicipality was the least dense at approximately 26persons/sq.km., roughly half of the Province’s estimateddensity of 51 persons/sq.km. Palawan is fortunate to havethe lowest population density among the provinces in thecountry. However, it consistently exhibited a highpopulation growth rate, the latest being 3.6 percent perannum (based on the 1995 to 2000 censuses) which isgenerally higher than the regional and national average.
Further, Palawan’s population in 1995 appeared to beyoung as indicated by the computed median age placed at17.34 years which means that more than 50% of thepopulation is below 18 years of age. Accordingly,dependency ratio was high at 82 dependents for every 100productive individuals as compared to the national andregional estimate of 72 and 71, respectively. With thehigh dependency ratio, human productivity in Palawanwill tend to be low due to the increasing economic burden.

STATE OF THE ENVIRONMENT 9
II. Executive Summ
aryLand R
esources
III
LAND RESOURCES
Land is one of the major resources of Palawan.Understanding the condition of the province’s landresources is vital in planning for its sustainabledevelopment. Agricultural development for example mustbe dictated by soil characteristics and topography whilenatural landscape shaped by geological processes coulddirect tourism development in Palawan. In fact, evenoptions to exploit mineral wealth should be based on soundassessment of the biophysical condition of the mine site.Thus, characterizing Palawan’s land resources will inone way or another guide planners in charting the futureof the Province.
3.1 ROCK FORMATIONS
Based on the Geological Map of Palawan prepared bythe Bureau of Soils in 1979, as summarized in Figure 1,the rock formation of Palawan is composed ofsedimentary, igneous and metamorphic rocks.
Sedimentary rock accounts for 35 percent (35%) of thetotal rock formations and its presence indicates potentialarea for agricultural development. On the other hand,igneous rocks constitute about 45 percent (45%). Thistype of rock is economically important because itsexistence brought about the occurrence of mineral wealthsuch as chromite, nickel, gold, mercury and manganesein Palawan. Its presence, however, is disadvantageous interms of forest production because only submarginal notproductive forest could thrive in such formations. Amongthe three, metamorphic rocks cover the least area as itaccounts for only 20 percent of the total rock formationsin Palawan. The existence of this type of rock made itpossible the occurrence of caves and underground channelsas these occur in association with metamorphic rocks ofthe limestone type. Such natural formations made Palawana favorite tourism area.
3.2 GEOMORPHOLOGICAL FEATURES
The whole province of Palawan is divided into broadlandforms based on relief structures namely coastal,alluvial plains, terraces, plateau, hills, mountains andmiscellaneous landforms. Each landform is furtherpartitioned into several subdivisions based on the parentmaterial underlying them. Figure 2 shows the distributionof different broad landforms (see also Map 1 for thegeographical presentation while details of thegeomorphological data in Palawan is shown on AppendixA-1).
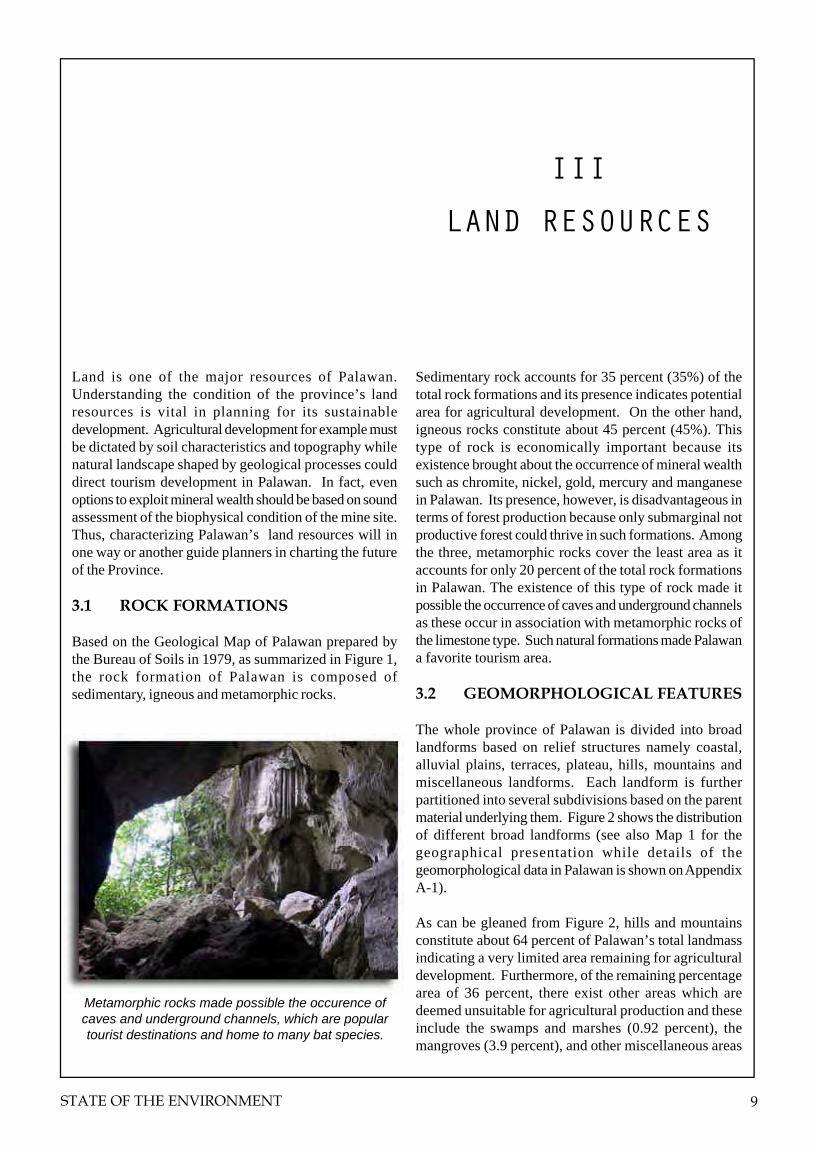
As can be gleaned from Figure 2, hills and mountainsconstitute about 64 percent of Palawan’s total landmassindicating a very limited area remaining for agriculturaldevelopment. Furthermore, of the remaining percentagearea of 36 percent, there exist other areas which aredeemed unsuitable for agricultural production and theseinclude the swamps and marshes (0.92 percent), themangroves (3.9 percent), and other miscellaneous areas
Metamorphic rocks made possible the occurence ofcaves and underground channels, which are populartourist destinations and home to many bat species.

10 PALAWAN
such as river wash, lakes, quarries, beach sand and saltbeds (4.7 percent). Constrained with such limitation,intention to utilize the extensive hilly area (which isapproximately 49 percent) for agriculture wouldnecessitate the adoption of intensive conservation measuresto prevent lowland destruction resulting from uplandcultivation. While Palawan’s topography favors tourismdevelopment, it is disadvantageous to agriculture. Thus,in planning for the sustainable development of Palawanparticularly in the aspect of agriculture, utmost care andconsideration of its landforms are essential.
3.3 SLOPE
Slope refers to the inclination of the surface of the soiland is mainly expressed in percent. This land characteristicis very essential in identifying areas with potential foragricultural and non-agricultural development. Palawan’sarea is divided into six (6) slope classes as shown on Figure3.
Areas belonging to slope classes 0 to 3, 3 to 8, and 8 to 18percent described respectively as level to nearby level,nearly level to gently sloping and gently sloping toundulating constitute about 28 percent and may be devotedfor annuals but with simple to intensive soil managementpractices. Undulating to rolling lands falling within theslope class from 18 to 30 percent comprise about 13percent only and is recommended for growing economictree crops with intensive soil management and conservationtreatment measures. Moreover, slope class from 30 to 50percent consisting of rolling to moderately steep slope hillsand mountains account for 24 percent of the total landarea. Such areas should be utilized only for agro-forestrywith intensive soil management and conservationmeasures. On the other hand, lands above 50 percentslope which are considered very steep hills and mountainsconstitute roughly 26 percent and should be set aside orretained as forest and wildlife sanctuary. Accordingly,such areas should be classified as core zones under theECAN zoning strategy.
3.4 SOIL PHYSICALCHARACTERISTICS
3.4.1 Soil Texture
The soil texture is correlated with the soil physicalcharacteristics. It has a direct bearing on the waterholding capacity of the soil. Soils high in sand havelarge pore spaces between them hence water percolatesfast. Therefore, they have low water holding capacity.Soils high in clay or silt on the other hand have abundantbut very small pore spaces which account for slow watermovement. They can store large amount of water andhence have high water holding capacity. The combinationof sand, clay or silt of soil result to medium capacity ofsoil to hold water.
For Palawan, results of the 1988 soil survey show thatthe soils in the alluvial plains, terraces and basaltic hillsare generally characterized as sandy clay loam to claywhile the limestone hills and plains have clay soils. Onthe other hand, hills and mountains which aremetamorphic have sandy clay loam to clay loam soilswhile those that are ultrabasic and volcanic haveprincipally loam to clay soils.
Map 2 shows the geographical presentation of the textureof Palawan’s soil for each land management unit whilethe corresponding tabular data is depicted in AppendixA-2.
3.4.2 Soil Depth
Soil depth is evaluated in terms of its relation to otherproperties of soil. The amount of nutrients, water andair that the soil can hold depends upon the soil depth.Hence, it is important in growing deep rooted crops. Soil
Metamorphic20%
Sedimentary35%
Igneous45%
Figure 1. Distribution of Rock Formations, Palawan.
The opening to the Underground River at PuertoPrincesa Subterranean River National Park.

STATE OF THE ENVIRONMENT 11
II. Executive Summ
aryLand R
esources
depth less than 20 cm is considered very shallow, 20 to50 cm shallow, 50 to 100 cm moderately deep, 100 to200 cm deep and more than 200 cm very deep.
In the case of Palawan, soil depth varies from deep inbroad and narrow alluvial plains, valleys and fans tomoderately deep in alluvial and residual terracesincluding limestone, shale/sandstone and metavolcanichills, indicating suitability thereof for deep rooted crops.On one hand, soil depth is considered shallow in basaltic,ultrabasic and metamorphic hills and metamorphic andultrabasic mountains including plateaus and sedimenthills so that only crops which thrive on shallow soilscould be grown. Geographical presentation of Palawansoil depth in each land management unit is shown onMap 3 while the corresponding tabular data is presentedin Appendix A-2.
3.4.3 Water Holding Capacity
Water holding capacity is the capacity of the soil to holdwater in form available to plants. It is dependent uponthe organic matter content and soil texture. It issignificant in growing rainfed crops which largely dependupon available soil moisture.
The water holding capacity of Palawan soils is generallycategorized as medium except in plateaus, ultrabasic andmetamorphic hills of high relief, and mountainous areaswhere it is largely low; and in fishponds and swampsand marshes where it is relatively high. This means thatcrops which do not require large amount of water maybe grown in Palawan. Details of the water holdingcapacity of Palawan soils per land management unit isillustrated in Appendix A-2.
3.4.4 Internal Drainage
Internal soil drainage is that quality of a soil that permitsthe downward flow of excess water through it.Hydrophytic crops such as rice thrive mostly poorlydrained to moderately well drained soils while welldrained to somewhat excessively drained is favorable todiversified crops.
As indicated on Appendix A-2, soil internal drainage areconsidered poorly drained to moderately well drained inalluvial plains, in broad alluvial, infilled and enclosedvalleys, collo-alluvial fans and in sloping to undulatingresidual terraces. As such, hygrophytic crops could thrivein such areas. On the other hand, high or low relief hillshave moderately well drained to well drained internal
Figure 2. Relief Features of Palawan.
Hills and mountains constitute about 64 percent ofPalawan’s total landmass where as coastal contributes
5.8 percent.
Hills48.9%
Plateau1.9%
Terraces7.7%
Coastal5.8%
River wash beach sand plateauscarpment
4.6%Mountains 14.8%
AlluvialPlains15.3%

12 PALAWAN
drainage and therefore may be suitable for diverse crops.Mountainous areas manifest well drained to somewhatexcessively drained internal drainage and thereforeunsuitable for growing crops. Map 4 demonstrates thegeographical presentation of the internal soil drainagefor each land management unit while the correspondingtabular data is shown in Appendix A-2.
3.4.5 External Drainage
External drainage or surface runoff refers to the relativerate for which water is removed by flow over the surfaceof the soil. It is classified as ponded, very slow, slow,medium, rapid, and very rapid. It is generally correlatedwith slope and erosion hazards. Soils which are pondedor with very slow runoff usually have no erosion hazardwhile soils with slow external drainage has little or noerosion hazard. Soils with medium runoff have slight tomoderate erosion hazard and soils with rapid runoff haveusually moderate to high erosion hazard. In soils withvery rapid runoff, erosion hazard is commonly high orvery high.
A reading of Appendix A-2 shows that external drainageis generally very slow in coastal zones but becomes rapidup to the hills and mountain. Considering that almost 64percent of the land area of Palawan are hills andmountains, erosion hazards would be moderate to highin quite an extensive area.
3.5 SOIL CHEMICALCHARACTERISTICS
The soil chemical characteristic contributes to the qualityin the growth of plants through the build up of itsbiochemical composition, not in rich quantity but inadequate or sufficient amount. The chemical
characteristics of soil per land management is shown onAppendix A-3.
3.5.1 Soil Reaction pH
Soil reaction pH is a measure of the degree of alkalinityor acidity of soil. Its significance depends in influencingthe availability of nutrients for plant growth. A soil ofpH 5.5 to 8.6 gives optimal availability while a pH valueof 5.0 and below allows the micronutrients such as Fe,Al1, Mn1, Zn, Cn and Cobalt to have their maximumavailability and possible toxicity.
For Palawan, except for limestone hills which has a soilpH that gives optimal availability of nutrients for plantgrowth and the mountains (where no data are available),the rest of the landforms have low soil pH wherein
Figure 3. Slope Class Distribution, Palawan.
18-3013%
0-323%
30-5024%
above 5026%
8-189%
3-85%
The geology of Palawan is variedwhich resulted in the forming ofsoils with very differentcharacteristics. The province isalso known to have rich depositsof metallic and non-metallicminerals, but no detailedgeological survey has been made.

STATE OF THE ENVIRONMENT 13
II. Executive Summ
aryLand R
esources
micronutrients have their maximum availability butpossible toxicity. Therefore, there is the necessity tocorrect the pH of Palawan soil or to identify and growcertain crops that will thrive most in soil with low pH.
3.5.2 Cation Exchange Capacity
Cation Exchange Capacity (CEC) is the ability of soil tostore and release important elements for plant growth.It is influenced by the texture and organic content of thesoil. A soil with more than 200 meq/100 g of soil hasadequate CEC but below 10 meg/100 g of soil, the CECis deficient.
Referring to Appendix A-3, CEC in Palawan soils isgenerally marginal particularly in most agricultural areaswhich include broad and narrow alluvial plains, infilledand broad alluvial valleys, collo-alluvial terraces andsloping to undulating residual terraces. This means thatsoils in the agricultural areas of Palawan in its naturalstate is not capable of enhancing plant growth.
3.5.3 Organic Matter Content
Organic matter content of a soil is indicative of the levelof nitrogen present. In general, for upland crops, soilorganic matter content of less than 2.0% is consideredlow while from 2.0%-3.5% it is categorized as mediumand more than 4.5% it is adequate. However, for thelowland or paddy rice areas organic matter content of morethan 3% is generally considered adequate.
As depicted on Appendix A-3, the organic matter contentof Palawan soils is generally characterized as low tomedium except in the sloping to undulating andundulating to rolling residual terraces and in the level toundulating undissected plateaus where the organic mattercontent is considered adequate. Thus, to improve thefertility of soils particularly in areas with low to mediumorganic matter content, application of fertilizers with theappropriate amount of nitrogen is necessary therebyincreasing agricultural production.
Map 5 illustrates the level of nitrogent content ofPalawan’s soil in each land management unit.
3.5.4 Phosphorous Content
Phosphorous is the second major soil nutrient necessaryfor the growth and development of plants. It stimulatesearly root development, hastens maturity of crops,increases the amount of grains and fruits, stimulatesflowering, aids in seed formation and is essential inripening of grain as in the strengthening of cereal straw.Values of availability index of phosphorous determinedby Olson’s method of less than 3 ppm in soil is considered
very deficient, 3-6 ppm in soil as deficient; 6-10 ppm insoil as possibly deficient and greater than 10 ppm in soilas adequate. With reference to Map 6 (see details inAppendix A-3), the soils of Palawan are basicallydeficient in phosphorous except for collo-alluvial plainswhere the phosphorous content is adequate. Accordingly,the deficiency in phosphorous may be corrected by theapplication of fertilizers with appropriate amount ofphosphorous.
3.5.5 Exchangeable Bases
Exchangeable bases (ca, mg and k) are determined ininitial ammonium acetate leachate from the cationexchange capacity determination. Calcium andmagnesium are micronutrients needed by the plants insmall quantity. They enhance the availability of plantuptake of elements such as phosphorous. Calcium ishigh if greater than 1 and low if less than 0.5 meq/100gof soil while magnesium is considered high if greaterthan 0.5 and low if less than 0.25 meg/100 g of soil.
Potassium on one hand is a soil nutrient which plays animportant role in plant growth and development especiallyin the production of starch, sugar, cellulose and protein.It increases plant resistance to certain diseases. Itcounteracts the effects of too much nitrogen in delayingmaturity and works against induced ripening as influencedby photosynthesis. Exchangeable potassium of soil is lowif less than 0.15 meg/100 g of soil and is high if greaterthan 0.25 meg/100g of soil.
Referring to Appendix A-3, the soils of Palawan isgenerally considered high in calcium and magnesiummicronutrients. However, there are certain areasparticularly the metavolcanic hills where saidmicronutrients are considered low. In plateaus andmetamorphic hills, calcium and magnesium areconsidered low to medium.
On the contrary, potassium is considered low in most ofthe low lying areas (i.e. broad plain, narrow alluvial plainsand limestone plains) which are generally devoted toagricultural production. Accordingly, application offertilizers with appropriate amount of potassium in suchareas is necessary to enhance plant growth and increaseresistance of plants to diseases. In other areas like valleys,alluvial fans, residual terraces and metamorphic andsandstone hills, potassium micronutrients range from lowto medium or medium to high. There are however certainareas where potassium micronutrients is basically highand these include limestone hills, basaltic hills andmetavolcanic hills.

��
��
��
��
�� ��
��
��
��
��
��
��
��
��
��
��
��
��
����� �����
���
�����
�����
������
������
�������
�������
�������
�������
�������
��������
�������
���������
���� ������
����!�"�#����
��$���������%���
#������#�����������
������������ ����� ����������������������������������������������������������� ������� ���������� ��������������������� ���������������� �������� ������������
������&��'��#'��������(���������) ������*+���������,���������(���������#��-��������#���.���#��(�����*/00�������������$����������1���������
���������������
� � ! " #����� ���
�������������� �����������������
������
�������
��� ���������
"
"
$
$
%
%
%�
%�
Map 1. Broad Landforms Types, Palawan.
14 PALAWAN

��
��
��
��
����
��
��
��
��
��
��
��
��
��
��
��
��
��
��
��
��
��
����
���� ����
����
�����
������
������
�����
������
�������
�����
������
�������
������
��������
�� �����
���������
���� ������
����������
����!�" �#����
��$������� ��%��
#������#����� ������
&�� �� ��
�� � �� �� �� ������
���������������
��������������
������������ ������ ���������
����������������
������������������������� �������������������������������������������������������������������� ���������������������������������������� ���������
�������
������'��(��#(� ������)���������* �����+,��������-�� �������)��������#��.��������#��/���#��)�����+011�������������$���� �����&���������
������
������
������
������
����
��������
����
��� �������
����
��� �������
����
��� �������
Map 2. Soil Texture, Palawan.
STATE OF THE ENVIRONMENT 15

��
��
��
��
�� ��
��
��
��
��
��
��
��
��
��
��
��
��
����� �����
���
�����
�����
������
������
�������
�������
�������
�������
�������
��������
�������
���������
���� ������
����!�"�#����
��$���������%���
#������#�����������
���������������� ���������������������������������
����������� ���������������
�� � �� �� �� ������� �
���������������
������&��'��#'��������(���������) ������*+���������,���������(���������#��-��������#���.���#��(�����*/00�������������$����������1���������
������
��������
������������
������
������
������
������
����
��� �������
����
��� �������
Map 3. Soil Depth, Palawan.
16 PALAWAN

��
��
��
��
�� ��
��
��
��
��
��
��
��
��
��
��
��
��
����� �����
���
�����
�����
������
������
�������
�������
�������
�������
�������
��������
�������
���������
���� ������
����!�"�#����
��$���������%���
#������#�����������
������&��'��#'��������(���������) ������*+���������,���������(���������#��-��������#���.���#��(�����*/00�������������$����������1���������
���������������
�� � �� �� �� ������
����������������� ����������� ������
��������������������������������������� ������������������������� ���������������������������������������������������������������������������������������������� ���������������������������������������������������������������������������������������������������������������������������������������� �������������������
������
�������
������ �������
������
������
!�����
!�����
"������ "������
"������ "������
Map 4. Soil Internal Drainage, Palawan.
STATE OF THE ENVIRONMENT 17

��
��
��
��
�� ��
��
��
��
��
��
��
��
��
��
��
��
��
����� �����
���
�����
�����
������
������
�������
�������
�������
�������
�������
��������
�������
���������
���� ������
����!�"�#����
��$���������%���
#������#�����������
���������������
�� � �� �� �� ������
��������������� ���� ��������������������
������������������������������������������������������������������������������
������&��'��#'��������(���������) ������*+���������,���������(���������#��-��������#���.���#��(�����*/00�������������$����������1���������
� � �
��������������
�������
������
������
������
������
����
��� �������
����
��� �������
Map 5. Soil Organic Matter Content, Palawan.
18 PALAWAN

��
��
��
��
�� ��
��
��
��
��
��
��
��
��
��
��
��
��
����� �����
���
�����
�����
������
������
�������
�������
�������
�������
�������
��������
�������
���������
���� ������
����!�"�#����
��$���������%���
#������#�����������
���������������� ��������������������������������������������������������������������
������������������� ���������������������
�� � �� �� �� ����������
���������������
������&��'��#'��������(���������) ������*+���������,���������(���������#��-��������#���.���#��(�����*/00�������������$����������1���������
� � ��
��������
������ �������
������
������
!�����
!�����
"������ "������
"������ "������
Map 6. Soil Phosporous Content, Palawan.
STATE OF THE ENVIRONMENT 19


STATE OF THE ENVIRONMENT 21
II. Executive Summ
a Land C
over
IV
LAND COVER
Land cover is an important aspect of Palawan’senvironment. It is a good indicator for assessing the stateof the environment at a macro level. For example, forestloss is usually an indication of a degraded environmentbecause of its adverse effect not only on the floral andfaunal biodiversity but also on the hydrology of aparticular area. Likewise, increase in grassland areascould be reflective also of a deteriorating soil conditionsince infertile lands are usually invaded by grass species.Thus, land cover data could provide the bases for comingup with sound and sustainable policies geared towardsthe sustainable development of Palawan.
Under the EMES, information on land cover are basicallysourced from LandSaT TM imageries although data onland cover of Palawan are available since 1979. Thereckoning period for monitoring land cover was set in1992, the year SEP was legitimized. Both the 1992baseline data and the 1998 monitoring data were derivedfrom processing and interpretation of LandSat Imageries.However, interpretation of the 1992 imageries was doneby a separate agency and only the results were made
available to PCSDS. As such, comparative analysis ofthe 1992 and 1998 data to account for changes was quitedifficult since one has to rely on information that appearedto be invalidated but could no longer be verified. Further,information captured from the interpreted images had somelimitations. For one, clouds were inevitably present andwere not totally eliminated from the imageries. Secondly,due to the position of the Satellite, cloud’s shadow werelikewise present in the imageries thus further increasingthe spatial extent of uncharacterized areas. Nonetheless,attempts to analyze changes in land cover were made inthis report. However, such comparison did not includethe islands of Cuyo, Agutaya, Magsaysay andCagayancillo as these municipalities were not covered bythe 1992 data.
4.1 FOREST COVER
Forest cover is estimated by accounting for the forestedarea of Palawan (except mangrove area) in proportion tothe total terrestrial area and is measured in percent. Basedon the interpretation and digital processing of the 1992LANDSAT TM imageries of Palawan carried out by JapanForest Technical Association as part of its wide area“Tropical Forest Resources Survey” as shown on Table1, the forest cover of mainland Palawan including theCalamian Group of Islands municipalities, Balabac andDumaran Islands was estimated at 51.79 percent in 1992(Land cover by municipality in 1992 is presented onAppendix B-1). On the other hand, the forest cover ofthe same area in 1998 was estimated at 55.84 percent asshown on Appendix B-2.
To account for the changes in forest cover, comparisonof the data set shall exclude the municipalities of Cuyo,Agutaya, Magsaysay and Cagayancillo as these were notcovered in the 1992 data. Table 1 shows the comparativedata on land cover resulting from the above-cited limitedanalysis while Appendix B-3 reflects the comparativeland cover data by municipality.
Forest cover contributes 55.84 percent of the totalland cover in Palawan (1998).

22 PALAWAN
As manifested in Table 1, a forest gain of 50,410 hectareswas achieved from 1992 to 1998 or an equivalent rate ofincrease of 8,402 ha/year. The data are rather impressivefor it must be recalled that based on the 1979 and 1984satellite data, Palawan was experiencing forest loss at therate of 19,000 ha/year (IEP). With the new informationat hand it would appear then that deforestation has alreadybeen arrested in Palawan and it is now on its way to forestrecovery. This quantitative increase in forest coverhowever does not reflect the qualitative condition ofPalawan’s forest. While spatial extent of forest may haveexpanded, the possibility that the forest condition in termsof stand density and diversity may have deteriorated isnot remote considering that illegal timber extraction hasnot been totally eliminated.
Nonetheless, it is believed that the fast recovery ofPalawan forests may be largely attributed to theimposition of commercial log ban in the Province. Thisis so because while illegal logging by private individuals
still exists in Palawan, the volume extracted by themcould not match the quantity being reaped by loggingconcessions so as to substantially affect the extent offorest cover. Illegal extraction of timber are usuallysporadic and thus its impact could not be captured in aLandSat Image. Additionally, environmental educationefforts of locally based government and non-governmentorganizations are also recognized as contributory toimproving forest cover by weaning the people from theirdestructive activities and involving them in protectingthe forest. A graphical representation of Palawan’s landcover data for 1992 and 1998 is shown in Figure 4.
4.2 MANGROVE FORESTAND FISHPONDS
Mangrove forest accounts for 3.55 and 3.63 percent ofthe total land area in 1992 and 1998 respectively. Anequivalent increase of 744 hectares in the extent ofmangrove areas was manifested for the period despite theconversion of certain mangrove stands into fishponds asevidenced by the increase in fishpond areas from 170 to1,495 hectares. The increase could be attributed to thenatural regeneration of certain undisturbed mangroveareas.
4.3 GRASSLANDS, BRUSHLANDSAND BARE LANDS
As indicated on Table 1, brushland increased from 17.21to 21.03 percent of the total terrestrial area or an increaseof approximately 51,668 hectares. Conversion of certaingrasslands into brushlands is viewed to have contributedto the expansion. The reduction in grassland areas placedat 212,149 hectares could be perceived not only astransformation through time of grasslands into brushlandsbut also conversion thereof into croplands, paddy field,other plantations, or built-up areas. In addition,misinterpretation of certain paddy fields in 1992 as
Figure 4. Graph Showing Percentage Land Cover by Category, 1992-1998, Palawan.
Mangrove forest within the Puerto PrincesaSubterranean River National Park,
Puerto Princesa City.
0.0010.0020.0030.0040.0050.0060.00
Per
cent
age
Are
a (%
)
Fore
stM
angr
ove
Area
Bru
shla
ndG
rass
land
A
gric
ultu
ral A
rea
Bar
e/R
ock
Are
asM
inin
g A
rea
Bui
lt-up
Are
aFi
shpo
ndLa
kes/
Wat
er B
ody
Clo
uds/
Sha
dow
Land Category
1992
1998
STATE OF THE ENVIRONMENT 23
II. Executive Summ
a Land C
over
Table 1. Comparative Data on Land Cover by Category, Palawan 1992 1998 Change
Land Cover Area (ha.) Percent Area (ha.) Percent Area (ha.) Percent Forest 738,886.00 51.79 789,296.00 55.84 50,410.00 4.05 Primary Forest 333,380.00 23.37 534,370.00 37.81 200,990.00 14.44 Mossy Forest 40,864.00 2.86 27,271.00 1.93 -13,593.00 -0.93 Residual Forest 335,893.00 23.54 203,938.00 14.43 -131,955.00 -9.11 Marginal Forest 27,651.00 1.94 19,059.00 1.35 -8,592.00 -0.59 Karst/Limestone 1,098.00 0.08 4,658.00 0.33 3,560.00 0.25 Mangrove Area 50,602.00 3.55 51,346.00 3.63 744.00 0.09 Brushland 245,585.00 17.21 297,253.00 21.03 51,668.00 3.82 Grassland 252,025.00 17.66 39,876.00 2.82 -212,149.00 -14.84 Agricultural Area 91,053.00 6.38 205,405.00 14.53 114,352.00 8.15 Coconut Plantation 26,397.00 1.85 70,463.00 4.99 44,066.00 3.13 Other Plantation 7,942.00 0.56 33,835.00 2.39 25,893.00 1.84 Paddy Field 42,893.00 3.01 80,178.00 5.67 37,285.00 2.67 Cropland 13,821.00 0.97 20,929.00 1.48 7,108.00 0.51 Bare/Rock Areas 9,607.00 0.67 8,943.00 0.63 -664.00 -0.04 Mining Area 1,468.00 0.10 1,090.00 0.08 -378.00 -0.03 Built-up Area 1,083.00 0.08 13,279.00 0.94 12,196.00 0.86 Fishpond 170.00 0.01 1,812.00 0.13 1,642.00 0.12 Lakes/Water Body 1,179.00 0.08 5,187.00 0.37 4,008.00 0.28 Clouds/Shadow 35,138.00 2.46
T O T A L 1,426,796.00 100.00 1,413,487.00 100.00
grasslands accounts for the reduction in grassland areas.Such misinterpreted paddy fields which were then correctlyinterpreted as paddy fields in 1998 also contributed to theincrease in paddy fields. Likewise, bare or rocky landarea which accounts for 0.67 percent of the total terrestrialarea in 1992 was decreased to 0.63 percent in 1998.Conversion of some of the bare lands into agriculture orsettlement areas as further evidenced by the expansionthereof may have contributed to the estimated reductionin bare areas of 664 hectares.
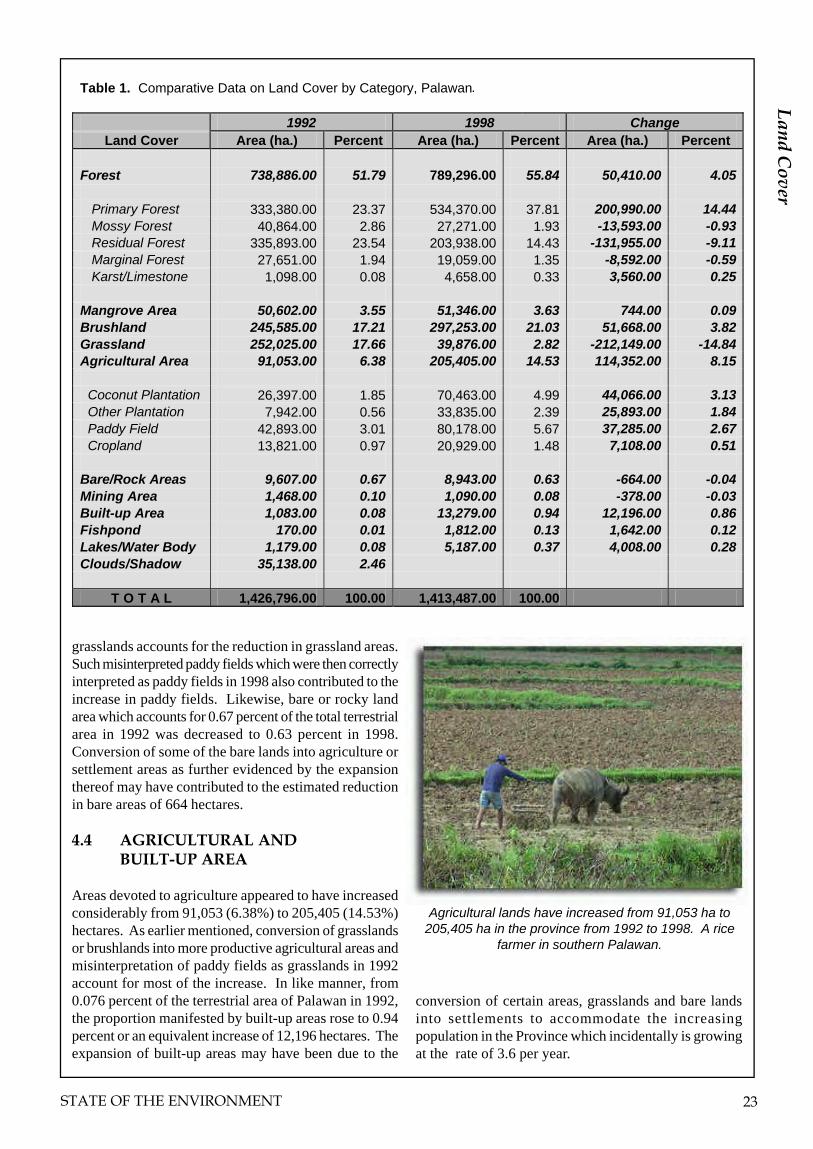
4.4 AGRICULTURAL ANDBUILT-UP AREA
Areas devoted to agriculture appeared to have increasedconsiderably from 91,053 (6.38%) to 205,405 (14.53%)hectares. As earlier mentioned, conversion of grasslandsor brushlands into more productive agricultural areas andmisinterpretation of paddy fields as grasslands in 1992account for most of the increase. In like manner, from0.076 percent of the terrestrial area of Palawan in 1992,the proportion manifested by built-up areas rose to 0.94percent or an equivalent increase of 12,196 hectares. Theexpansion of built-up areas may have been due to the
conversion of certain areas, grasslands and bare landsinto settlements to accommodate the increasingpopulation in the Province which incidentally is growingat the rate of 3.6 per year.
Agricultural lands have increased from 91,053 ha to205,405 ha in the province from 1992 to 1998. A rice
farmer in southern Palawan.
.

�����������
��������������������� ��������� ���� ������������������
���������
� ��������������� � �� �� �� �� �� !"#$#%&
������� ��������
�' '(')
*+
!)������������������
� ��������
��
��
��
��
�� ��
��
����
��
��
��
��
��
��
��
��
��
�� ��
��
��
��
�')��,#)$#
�!-'&
�'.$'.
� ��/!
�*"'%') �%',# �
�0!% ')
�'%%'1*#+!)
�!2%!)�!�&3')! '
4%!!5#&�!�)$
4'$'%'+'
�!&#��+'
�*#%$!�%�),#&' �$.
!%!)
4*&*')6'
* �!)
�)'3',')
*.!�'6&'.&'.
�6*$'.'
4' '0',
'6'.'),� !
������������
�!)72!%#&$#/'%#'&
�'$�)' %!'/�*)�,�3' 82##/#%%!'/
�� �*)�,�3' �$.�*)�,�3' 0!*)/'%.
�!%#&$#/'%#'&
�')6%!9#2!%#&$
�:�,$!0#%����;<(3,�=3' '(')=3' %#,')>'3%
�!*%,#��??�')/�'$���"'6#%�#& �%#3'%#/')/3%!/*,#/0.
��*�*��+������
���.-�������.
���6�9��3��.-
����$
Map 7. Forest Cover, Palawan, 1998.
24 PALAWAN

�������������� �������������
�� ���� ����������� �����������
������������
��
��
��
��
�� ��
��
����
��
��
��
��
��
��
��
��
��
�� ��
��
��
��
������ ����
����
������
�����
������� ��� ���
������
����������
�������������
�!���"���
�������
#��������
"�����"��� ����$���
$��
�����%�
$����
&����� ��
$����%������
�%�����
�����
$�%���� ���
&'$��('����"
��"�')��*��"*(&(""(���
&�������
"���+
��
��� �������������
,- - ,- .- /- 0- 1����������$���&����������2�3�,45--4---
6�(�����&���������������$��'��"�'#�$�('�$&��1���"*��'(��')�20//
&67'�����6�
������������������������� ! � "�� !��� "# ��
���$�����
"������������� ����
'�8%�+��9��������������������5:.4:;-����������������������������������,;4,;2��������������������������������,-.4.:5���%�������������������������������2<4-/-1�������������������������������.4/5/���%�=��������������������������5:4/;. ���9������������������������������,<04.,/$ ����������������������������;-40:;'�9���"���������������������������:<4,,:>�����������������������������������..4</0"����������������������������������0-420-$�����������������������������������,-4<:- ����� !�������������������������2-40:<�����%��������������������������������24-<- ����8����������������������������������2:40;<)��9����������������������������������2402,?�����������������������������������/4.2;�9���+� ��������������������������/:4..;����������
� "%��&����'�())*�+���������� ��', +
��� �32<<0�&���������(��%�����
Map 8. Land Cover, Palawan, 1998.
STATE OF THE ENVIRONMENT 25


STATE OF THE ENVIRONMENT 27
II. Executive Summ
a Forest R
esources
V
FOREST RESOURCES
Monitoring of forest resources under EMES is confinedonly to timber and major non-timber products. Timberproducts in general cover legally produced/harvested andconfiscated timber or lumber while non-timber productsconsist mainly of almaciga resin and rattan derived fromboth legal and illegal sources. Data are designed to begenerated through secondary sources mostly from theProvincial and District Offices of the Department ofEnvironment and Natural Resources in Palawan.Unfortunately, available data from DENR are generallyincomplete. Nonetheless, establishment of trends on forestresources utilization based on information gathered fromthe DENR is attempted in this report.
5.1 TIMBER PRODUCTION
The extent of timber produced in Palawan is beingaccounted by recording the volume of timber manifestedby holders of Timber License Agreement (TLA), of PrivateLand Timber Permits and of Harvesting Permits in Agro-Forestry and Integrated Social Forestry Areas includinglumber or timber apprehended and confiscated by lawenforcement agencies of the government. The volumeof timber produced in Palawan from 1990 to 2000 isillustrated in Figure 5, as shown, a downward trend inthe volume of timber harvested from the forests ofPalawan was manifested. The reduction was particularlyremarkable from 1992 until recently. From as high as97,000 m3 in 1990, the volume legally produced wentdown to as low as 435 m3 in 2000. The decline wasgenerally brought about by the imposition of a totalcommercial log ban in Palawan’s natural forests pursuantto Republic Act 7611 otherwise known as the StrategicEnvironmental Plan for Palawan Act. As a result of thelog ban, all TLA’s in Palawan were cancelled sometimein 1993. It was likewise observed that from 1994 until1998, the total volume extracted oscillated around 2,000m3 but dramatically increased to 8,405 in 1999. Theabrupt increase was mainly due to yields from theplantations and not from natural forests as in the case ofthe other years.
In terms of confiscated timber, no definite time trendcould be drawn from existing data as shown on Figure6. However, suffice it to say that illegal cutting offorest trees has not yet been eliminated in Palawan.As demonstrated on Figure 7, of the seven districts,District IV-26 covering Puerto Princesa City,Cagayancillo, Cuyo, Agutaya, Magsaysay and Kalayaanregistered the highest total volume of timber confiscationsat 2,166.45 m3 for the period from 1990-2000 accountingfor 54.89 percent of the total confiscations in Palawan.District IV-23 covering the Calamian Group of Islands
Almaciga (Agathis philippinensis) is a premiumhardwood tree species that produces a resin
processed into Manila Copal.
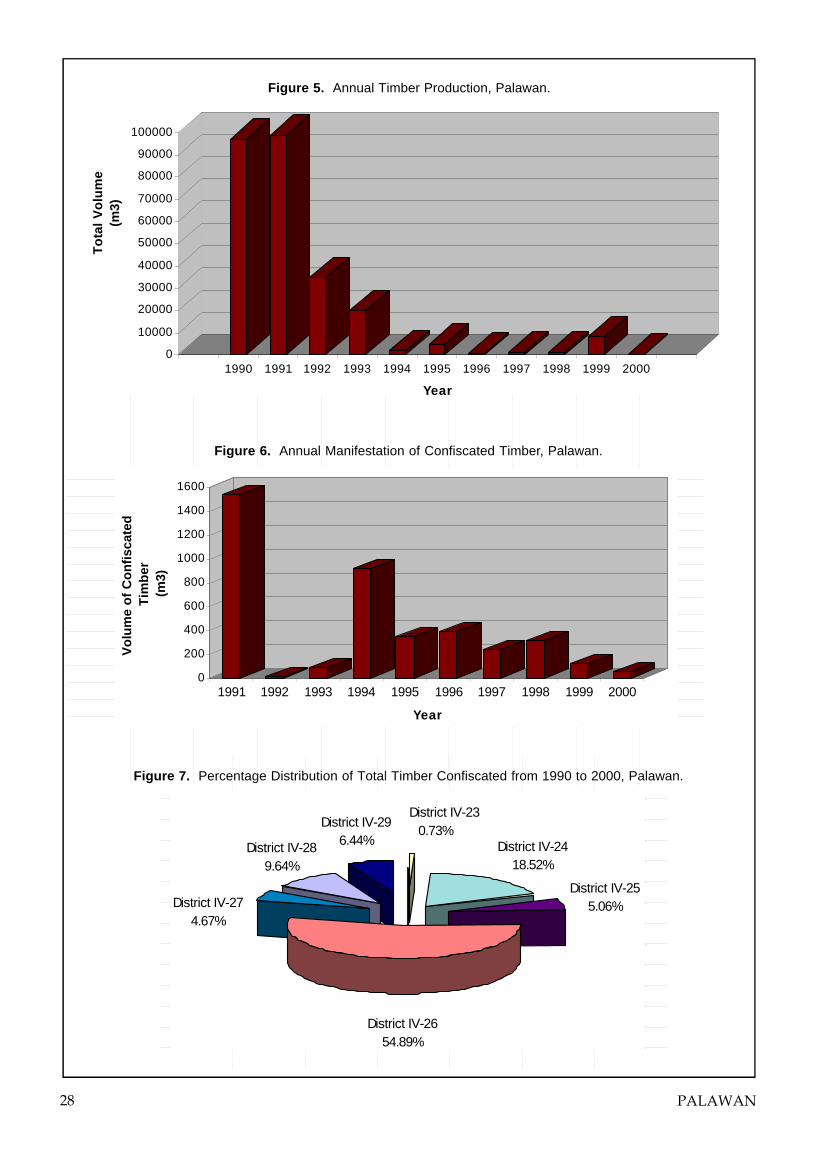
28 PALAWAN
Figure 5. Annual Timber Production, Palawan.
Figure 6. Annual Manifestation of Confiscated Timber, Palawan.
District IV-289.64%
District IV-274.67%
District IV-230.73%
District IV-296.44%
District IV-26 54.89%
District IV-2418.52%
District IV-255.06%
Figure 7. Percentage Distribution of Total Timber Confiscated from 1990 to 2000, Palawan.
0
10000
20000
30000
40000
50000
60000
70000
80000
90000
100000
To
tal V
olu
me
(m3)
1990 1991 1992 1993 1994 1995 1996 1997 1998 1999 2000
Year
0
200
400
600
800
1000
1200
1400
1600
Vo
lum
e o
f C
on
fisca
ted
T
imb
er(m
3)
1991 1992 1993 1994 1995 1996 1997 1998 1999 2000
Year
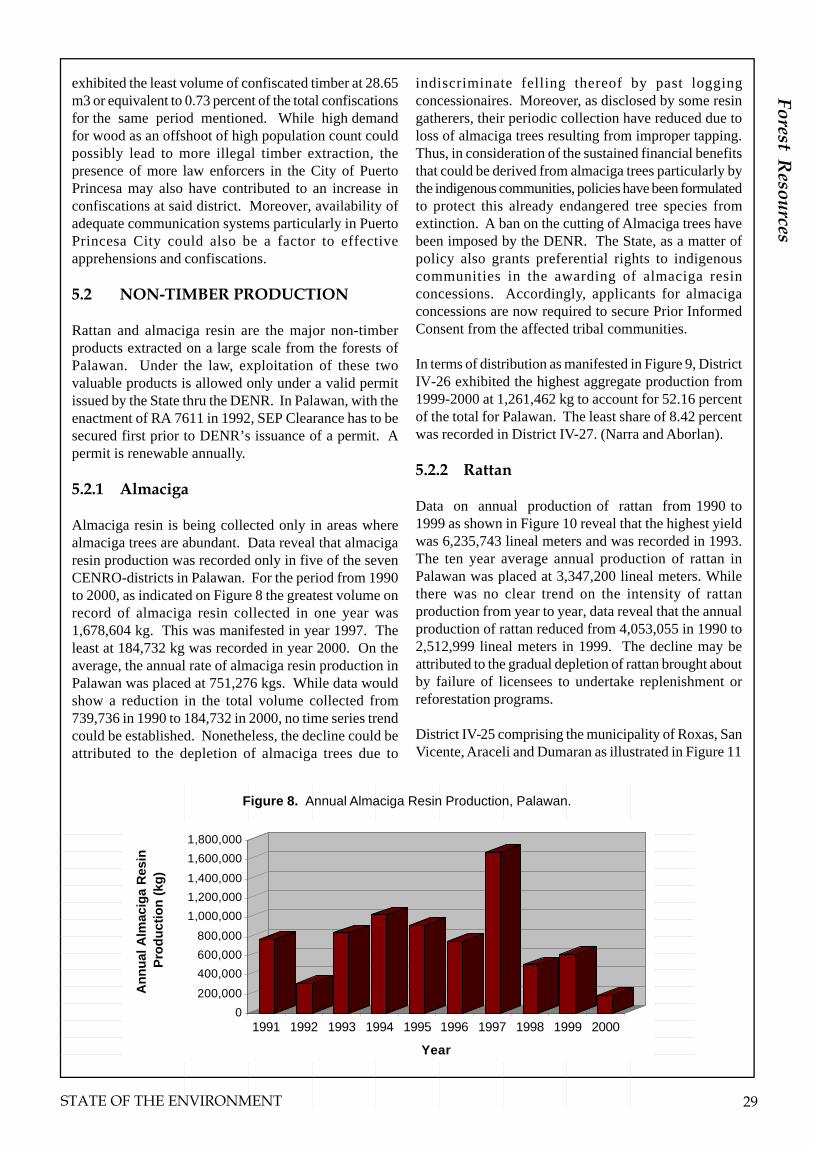
STATE OF THE ENVIRONMENT 29
II. Executive Summ
a Forest R
esources
exhibited the least volume of confiscated timber at 28.65m3 or equivalent to 0.73 percent of the total confiscationsfor the same period mentioned. While high demandfor wood as an offshoot of high population count couldpossibly lead to more illegal timber extraction, thepresence of more law enforcers in the City of PuertoPrincesa may also have contributed to an increase inconfiscations at said district. Moreover, availability ofadequate communication systems particularly in PuertoPrincesa City could also be a factor to effectiveapprehensions and confiscations.
5.2 NON-TIMBER PRODUCTION
Rattan and almaciga resin are the major non-timberproducts extracted on a large scale from the forests ofPalawan. Under the law, exploitation of these twovaluable products is allowed only under a valid permitissued by the State thru the DENR. In Palawan, with theenactment of RA 7611 in 1992, SEP Clearance has to besecured first prior to DENR’s issuance of a permit. Apermit is renewable annually.
5.2.1 Almaciga
Almaciga resin is being collected only in areas wherealmaciga trees are abundant. Data reveal that almacigaresin production was recorded only in five of the sevenCENRO-districts in Palawan. For the period from 1990to 2000, as indicated on Figure 8 the greatest volume onrecord of almaciga resin collected in one year was1,678,604 kg. This was manifested in year 1997. Theleast at 184,732 kg was recorded in year 2000. On theaverage, the annual rate of almaciga resin production inPalawan was placed at 751,276 kgs. While data wouldshow a reduction in the total volume collected from739,736 in 1990 to 184,732 in 2000, no time series trendcould be established. Nonetheless, the decline could beattributed to the depletion of almaciga trees due to
indiscriminate felling thereof by past loggingconcessionaires. Moreover, as disclosed by some resingatherers, their periodic collection have reduced due toloss of almaciga trees resulting from improper tapping.Thus, in consideration of the sustained financial benefitsthat could be derived from almaciga trees particularly bythe indigenous communities, policies have been formulatedto protect this already endangered tree species fromextinction. A ban on the cutting of Almaciga trees havebeen imposed by the DENR. The State, as a matter ofpolicy also grants preferential rights to indigenouscommunities in the awarding of almaciga resinconcessions. Accordingly, applicants for almacigaconcessions are now required to secure Prior InformedConsent from the affected tribal communities.
In terms of distribution as manifested in Figure 9, DistrictIV-26 exhibited the highest aggregate production from1999-2000 at 1,261,462 kg to account for 52.16 percentof the total for Palawan. The least share of 8.42 percentwas recorded in District IV-27. (Narra and Aborlan).
5.2.2 Rattan
Data on annual production of rattan from 1990 to1999 as shown in Figure 10 reveal that the highest yieldwas 6,235,743 lineal meters and was recorded in 1993.The ten year average annual production of rattan inPalawan was placed at 3,347,200 lineal meters. Whilethere was no clear trend on the intensity of rattanproduction from year to year, data reveal that the annualproduction of rattan reduced from 4,053,055 in 1990 to2,512,999 lineal meters in 1999. The decline may beattributed to the gradual depletion of rattan brought aboutby failure of licensees to undertake replenishment orreforestation programs.
District IV-25 comprising the municipality of Roxas, SanVicente, Araceli and Dumaran as illustrated in Figure 11
0
200,000
400,000
600,000
800,000
1,000,000
1,200,000
1,400,000
1,600,000
1,800,000
An
nu
al A
lmac
iga
Res
in
Pro
du
ctio
n (
kg)
1991 1992 1993 1994 1995 1996 1997 1998 1999 2000
Year
Figure 8. Annual Almaciga Resin Production, Palawan.

30 PALAWAN
Marketable timber trees such ashigh-priced dipterocarps arerelatively scarce in Palawan’sforest. Commercial loggers focusedtheir interest in the island only afterthe forests elsewhere in thePhilippines have been exploited. In1992, a total commercial log ban inPalawan was imposed pursuant tothe SEP Law (RA 7611).
Ipil (Intsia bijuga)
District IV-26
52.16%
District IV-25
13.99%
DistrictIV-27
8.42%
District IV-28
15.08%
District IV-29
10.35%
Figure 9. Percentage Distribution of Total Almaciga Production from 1999-2000, Palawan.
manifested the highest ten year aggregate production at12,607,852 lineal meters to account for 37.67 ofPalawan’s total production while District IV-29 (Brooke’sPoint, Bataraza and Balabac) contributed the least shareof 1.45 percent in the total rattan production for the saidperiod.
In terms of confiscated rattan as indicated in Figure 12,the aggregate volume confiscated from 1990 to 1997totalled to 709,609 lineal meters. The highest annualconfiscation was placed at 374,681 kg and wasreflected in 1992. Except for the 1992 figure, dataalso reveal a declining trend for annual volume ofconfiscated rattan. As the annual production also declinefrom 1990 to 1999, the total volume confiscated alsodecreased from 152,451 to 13,073 lineal meters in thesame period. The presence of environmental groupswhether organized by LGUs or by non-governmententities and the vigilance of the community and lawenforcers in tracking down illegal activities are viewedto have deterred environmental law violators fromengaging in illegal activities.
The district which registered the highest aggregateconfiscations from 1990 to 1997 placed at 229,242 linealmeters was District IV-26. As presented in Figure 13,District IV-26 contributed the highest share of 32.30percent in the total confiscations. Again it may beinferred that confiscations tend to be highest in areaswith greater number of law enforcers as in this district.The least confiscations accounting for only 1.13 percentof the total was manifested by District IV-28. (Quezonand Rizal).

STATE OF THE ENVIRONMENT 31
II. Executive Summ
a Forest R
esources
Figure 10. Annual Rattan Production, Palawan.
Figure 11. Percentage Distribution of Rattan Production from 1990-1999 by District, Palawan.
Figure 12. Annual Volume of Rattan Confiscated, Palawan.
0
1,000,000
2,000,000
3,000,000
4,000,000
5,000,000
6,000,000
7,000,000A
nn
ual
Rat
tan
Pro
du
ctio
n(l
inea
l met
ers)
1991 1992 1993 1994 1995 1996 1997 1998 1999
Year
0
50,000
100,000
150,000
200,000
250,000
300,000
350,000
400,000
Vo
lum
e o
f C
on
fisc
ated
R
atta
n (li
nea
l met
ers)
1991 1992 1993 1994 1995 1997
Year
District IV-28
21.32%
DistrictIV-27
9.38%
DistrictIV-26
17.75%
District IV-25
37.67%
DistrictIV-24
10.5%
DistrictIV-23
1.93%
DistrictIV-29
1.45%

32 PALAWAN
Figure 13. Percentage Distribution of Rattan Confiscations from 1990-1997, Palawan.
DistrictIV-29
12.9%
DistrictIV-23
1.84%DistrictIV-24
27.05%
District IV-25
9.86%
DistrictIV-26
32.3%
DistrictIV-27
14.92%
District IV-28
1.13%

STATE OF THE ENVIRONMENT 33
II. Execuve Summ
aryV
ertebrate Wildlife
VI
VERTEBRATEWILDLIFE
Palawan and its associated islands and island groupscomprise a unique biotic composition as compared to otherislands and island-provinces in the Philippines.Zoogeographical studies have revealed that the Palawansub-archipelago is a separate faunal subregion asdelineated by the Wallacean biogeographical line.
Palawan has a rich faunal biodiversity comprising 422species of terrestrial and marine vertebrate wildlifeaccounting for 38.6% of the several wildlife species inthe entire country. Some of these wildlife are endemic orfound only in the province or have restricted rangesconfined in a particular area or island. Herpetofaunalstudies were conducted in the last two to five years, butfurther verification and checklist updates are needed. Formammalian and avifaunal data, several studies were alsoconducted. A consolidation of these data is imperative tocome up with a general listing of wildlife for the Palawanmainland and its associated islands.
The forests of Palawan have also unique features ascompared to other Philippine forests. This terrestrialecosystem has adapted to relatively low rainfall, higheraltitudes, and varied substrates, which are mostlylimestone. Generally, these forests have an open-canopyceiling, allowing a high rate of biomass turnover. Thisprocess thus creates more habitat-niches that can supportseveral plant and animal species.
6.1 SPECIES COMPOSITION
The following table lists the vertebrate classes of speciesfound in Palawan and its associated islands and islandgroups. Also reflected is the percentage composition inrelation to records of wildlife species in the Philippines.
The preceding table shows that avian species are mostabundant having 261 species and a percentage compositionof 45.6% from the 572 avian species in the Philippines.This is followed by mammals having 67 terrestrial andmarine species and a 33.3% composition from the 201mammals in the country. Figure 14 shows a graphicalrepresentation of these data.
6.2 LOCAL ABUNDANCE
Table 3 characterizes each vertebrate group based on localabundance. It is however presumed that these data are
Table 2. Comparison of Wildlife Composition of Palawan and the Philippines.
Vertebrate Class Palawan Philippines Percent
Mammals 67 201 33.3%
Birds 261 572 45.6% Reptiles 72 240 30.0% Amphibians 22 81 27.1%
Two Palawan Bearcats (Arctictis binturong) raised incaptivity on Calauit Island.

34 PALAWAN
relative as these may vary from one particular area toanother.
Table 3 shows that there are 98 species of birds, 34species of reptiles, 28 species of mammals, and 12 speciesof amphibians common in the province. Rare species onthe other hand account for 30 reptiles, 26 birds, sixamphibians, and two mammal species.
6.3 CONSERVATION STATUS
Species that are of conservation importance asdetermined by the International Union for theConservation of Nature (IUCN) and the Convention onInternational Trade in Endangered Species of Wild Faunaand Flora (CITES) are discussed per vertebrate group.Appendix C-1 presents a summary of their conservationand ecological status.
6.4 SPECIES ACCOUNT
6.4.1 Herpetofaunal Community
Figure 14. Species Composition of Palawan and the Philippines
201
572
240
81
67
261
72
22
0 100 200 300 400 500 600 700
Mammals
Birds
Reptiles
Amphibians
Ver
tebr
ate
Gro
up
No. of Species
Palawan
Philippines
Table 3. Local Abundance of Palawan Wildlife.
Vertebrate Class
Total Species C LC FC
MC U Ra LU Unc Unk
Mammals 67 28 7 7 10 2 0 1 12 Birds 261 98 12 33 90 26 2 0 0 Reptiles 72 34 5 1 1 30 0 0 1 Amphibians 22 12 0 0 4 6 0 0 0
Note: C = Common, LC = Locally Common, FC/MC = Fairly-Moderately Common,
U = Uncommon, Ra = Rare, LU = Locally Uncommon, Unc = Uncertain, Unk = Unknown.
6.4.1.1 Reptiles
There are 72 recorded reptilian species for the province,accounting for 30% out of the 240 reptile species in thePhilippines. This vertebrate group is represented by fourorders: (1) TESTUDINATA (Turtles), with two familiesand five species; (2) CROCODILIA (Crocodiles, Caimansand Alligators), with one family and two species; (3)SAURIA (Lizards), with five families and 24 species; and(4) SERPENTES (Snakes), with eight families and 40species. Racers and rot snakes emerged to be the largestfamily consisting of 29 species.
Out of these 72 reptilian species, 63 are terrestrial,including the two species of Crocodiles: PhilippineCrocodile (Crocodylus mindorensis) and EstuarineCrocodile (Crocodylus porosus), which are also aquaticin habits. The former is an endangered and endemicspecies, while the latter though delisted from the 2000IUCN list is still banned for trade under CITES Appendix1. Both species have only a limited number in the wilddue to persecution and habitat loss. Also included with

STATE OF THE ENVIRONMENT 35
II. Execuve Summ
aryV
ertebrate Wildlife
terrestrial and semi-aquatic habits are two species of theFamily Emydidae (Freshwater Turtles). These are theMalayan Freshwater Turtle (Cuora amboinensis), andthe Serrate-Shelled Leaf Turtle (Cyclemys dentata) whichwas recorded in the Puerto Princesa Subterranean RiverNational Park (PPSRNP) in 1999.
Other marine reptiles include the endangered sea turtlesof the Chelonidae family: Green Turtle (Chelonia mydas),Hawksbill Turtle (Eretmochelys imbricata), Olive RidleyTurtle (Lepidochelys olivacea), and Loggerhead Turtle(Caretta caretta). These turtles are also banned for tradeunder CITES Appendix 1. Sightings have been recordedat El Nido, Tubbataha Reef, and Malampaya Soundamong others. Further, Trade-regulated species listedunder CITES Appendix 2 are the following: MonitorLizard (Varanidae: Varanus salvator), Reticulated Python(Boidae: Python reticulatus), Malay Common Cobra(Elapidae: Naja sumatrana), and the rare King Cobra(Elapidae: Ophiophagus hannah).
The following table summarizes the reptilian faunaaccount for Palawan. (Please see below Table 8 fordefinations of table headings). A detailed list andbiological information of recorded reptiles in Palawanis found in Appendix C-2.
6.4.1.2 Amphibians
There are 22 recorded amphibian species for the province,accounting for 27.1% out the 81 amphibian species inthe Philippines. This vertebrate group is represented bytwo orders: (1) GYMNOPHIONA (LimblessAmphibians), with 1 family and one species; and (2)
Table 4. Summary of Reptilian Fauna Account in Palawan.
Total Species:
72 65 (terrestrial/ semi-aquatic) 7 (marine)
Percentage from Philippine Species:
30% (from 240 species)
Restricted Range Endemic Species (found only in Palawan)
14
Local Endemic Species (found in Palawan and other provinces):
12
Restricted Range Non-Endemic Species (found only in Palawan):
5
Non-Endemic Species: 41
ANURA (Tailless Amphibians, Frogs and Toads), withsix families and 22 species.
The dominant Family Taxon is of the Family Ranidae(True Frogs), having 8 representative species. This groupcomprises the majority of Philippine Frogs having spindle-shaped or tapered bodies, smooth and slimy skins,protruding eyes, and webbed toes. They inhabit bodiesof water and wet to moist situations, occupying mostlyforested areas.
Three Philippine endemic species are found only inPalawan. These are: Philippine Discoglossid Frog(Discoglossidae: Barbourula busuangensis), PalawanToadlet (Bufonidae: Pelophryne albotaeniata), andMary’s Frog (Ranidae: Micrixalus mariae). ThePhilippine Discoglossid Frog inhabits primary forests andfeeds on aquatic invertebrates. It is a rare and aquaticfrog inhabiting clean, cool mountain streams at lowerelevations. It has been recorded in Busuanga, CulionIsland, PPSRNP, and mainland Palawan. The PalawanToadlet is a terrestrial-arboreal bufonid that inhabitsprimary forests. This rare species has been recorded fromThumb Peak and Mt. Balabag in mainland Palawan.Meanwhile, Mary’s Frog is a rare aquatic frog that alsoinhabits forested areas. The species has been recordedat 850masl from Mt. Balabag along the MantalingajanRange in mainland Palawan.
There are also four rare and uncommon non-endemicspecies that are restricted only in the province. Theseare: Southeast Asian Wood Frog (Ranidae: Ranasanguinea); and three of the Rhacophoridae family,Peter’s Tree Frog (Nyctixalus pictus), Rough-SkinnedTree Frog (Philautus longicrus), and Everett’s Tree rog(Rhacophorus everetti).
Table 5. Summary of Amphibian Fauna Account in Palawan.
Total Species: 22
Percentage from Philippine Species:
27.1% (from 81 species)
Restricted Range Endemic Species (found only in Palawan)
3
Local Endemic Species (found in Palawan and other provinces):
3
Restricted Range Non-Endemic Species (found only in Palawan):
4
Non-Endemic Species: 12

36 PALAWAN
Table 6. Trophic Levels of Avian Species in Palawan.
Trophic Level # of species
Relative Proportion
(%)
Graminivore 7 2.7 Frugivore 12 4.6 Graminivore-Frugivore 7 2.7 Faunivore 35 13.4 Faunivore-Herbivore 17 6.5 Faunivore-Frugivore 3 1.1 Raptorial 23 8.8 Piscivore 9 3.4 Insectivore 64 24.5 Insectivore-Larvae Feeders 10 3.8 Insectivore-Frugivore 24 9.2 Invertebrate Feeders 40 15.3 Invertebrate-Fruit Feeders 2 0.8 Invertebrate Feeders-Pollinators 6 2.3 Omnivore-Scavengers 2 0.8
Table 7. Habitat types and associated number of avian species in Palawan.
Habitat Type # of
associated species
Forests: Old Growth, Residual, Secondary Growth, Patches 130
Forest Edge: Marginal types near other ecosystems 66
Clearings: small to medium open spaces 21
Grasslands: extensive tracts of monotypic or dual species of grass species including pastures. 31
Scrub: woody shrubs, herbs, stunted trees, and thickets 36
Open Areas: extensive general type without canopy cover 39
Orchards / Plantations: monocrop plant species like coconut or mango 17
Mixed Cultivation / Settlements: multicrop species including agricultural areas and human habitations 31
Ricefields: type specific either pre- or post- planting, and flooded conditions 56
Inland Waters: rivers, lakes, ponds, and streams outside forest areas 38
Fishponds: type specific may or may not be in agricultural areas 13
Wetlands / Marshes: water-logged land including swamps and bogs 50
Estuaries: confluence of the sea and lower ends of rivers 11
Mangroves: may be inland or along the coast 37
Coast/Coral-Sandy Flats: coastline with or without sandy substrate and exposed coral reefs 51
Coral-Sandy-Rocky Islets: exposed coral reefs away from the coast that may or may not be covered with sand 10
Small Islets with Vegetation: offshore land with clumped or sparse trees and other vegetation 10

STATE OF THE ENVIRONMENT 37
II. Execuve Summ
aryV
ertebrate Wildlife
No threatened and trade-restricted species are recorded.
Table 5 summarizes the amphibian fauna account forPalawan. (Please see below Table 8 for definitions of tableheadings). A detailed list and biological information ofrecorded amphibians in Palawan is found in Appendix C-3.
6.4.2 Avian Community
6.4.2.1 Local Abundance
There are 261 recorded avian species with 276 subspeciesor races for the province, accounting for 45.6% out the572 avian species in the Philippines. This conspicuousand abundant vertebrate group is represented by 17orders.
The dominant Family Taxa are Family Scolopacidae(Sandpipers and Snipes = 22 species) and FamilyArdeidae (Herons, Egrets and Bitterns = 17 species)which consists mostly of migratory species like the GreenSandpiper (Tringa ochropus), Common Snipe (Gallinagogallinago), Chinese Egret (Egretta eulophotes), and GreatEgret (Egretta alba) among others. The relativelyundisturbed condition of some islands and islets ofPalawan is contributory to the migration of avian speciesin the province as to resident breeders, the FamilyColumbidae (Pigeons and Doves) is well-represented by14 species.
6.4.2.2 Residency Status and Trophic Levels
Out of the 261 recorded avian species, the following willbe based on the 276 races since there are cases whereone race is confined to a specific island as compared toits syntype found in another locality or island; or that,one race is a resident breeder while its syntype ismigratory.
Four Philippine Endemic species are recorded in theprovince: Philippine Cockatoo (Cacatuahaematuropygia), Philippine Coucal (Centropus viridis),
Philippine Swiftlet (Collocalia mearnsi), and PygmySwiftlet (Collocalia troglodytes). These species are foundin Palawan and other Philippine provinces only. Thereare 21 restricted range endemic species like the PalawanPeacock Pheasant (Polyplectron emphanum) andPalawan Hornbill (Anthracoceros marchei), amongothers. These species are found only in Palawan and noother localities. There are also 12 restricted-range non-endemic species like the Banded Bay Cuckoo(Cacomantis sonneratii schlegeli) and the Ashy Drongo(Dicrurus leucophaeus leucophaeus). Although found inother parts of the world, such species can also be foundonly in Palawan. For migratory species and passagevisitors, 93 races have been recorded.
Varieties of feeding guilds were exemplified, indicativeof a wide variety of food sources that determineecosystem quality in the province.
Table 6 shows that among the trophic levels reflected,the 64 generalist insectivores (24.5% of total avianspecies) were most dominant, indicating the abundanceof insect species in the diverse ecosystems of theprovince. This is followed by 40 invertebrate-feeders at15.3% due to the coastline and riverine bird species thatrely on such food sources in those areas. Faunivoresrank third at 13.4% as these 35 species feed on variousvertebrate or invertebrate animals.
6.4.2.3 Habitat Distribution
Table 8 shows the distribution of avian species based onhabitat preferences. The numbers do not total to 261species since some have overlapping habitats and feedingareas.
The habitat types presented in Table 7 show that theforested areas yielded the most number of associated
Blue-Naped Parrot (Tanygnathus lucionensis).
Bottle-Nosed Dolphins (Tursiops truncatus)

38 PALAWAN
species, having 130 representative species. This isfollowed by the forest edge type having 66 associatedspecies. Most avian species also prefer ricefields,wetlands, and scrub vegetation. Shoreline birds alsooccupy coasts, and offshore exposed coral reefs.However, some species tend to overlap habitatpreferences as previously stated.
Threatened species as classified by the InternationalUnion for the Conservation of Nature (IUCN) are thefollowing: Philippine Cockatoo [Critically Endangered],Palawan Peacock Pheasant [Endangered], Blue-Naped
Parrot (Tanygnathus lucionensis) [Endangered], andPalawan Scops-Owl (Otus fuliginosus) [Vulnerable]among others. Trade-regulated species listed underCITES Appendix 2 are the following: all diurnal raptorsunder Order Falconiformes, except the Peregrine Falcon(Falco peregrinus), which is under CITES Appendix 1[totally banned from trade]; and all nocturnal raptorsunder Order Strigiformes, among others.
The following table summarizes the avian fauna accountfor Palawan. A detailed list and biological information ofrecorded avifauna in Palawan is found in Appendix C-4.
6.4.3 Mammalian Community
There are 67 recorded terrestrial and marine mammalsfor the province, accounting for 33.3% out the 201mammalian species in the Philippines. This vertebrategroup is represented by ten orders.
The dominant Family Taxon is of the FamilyVespertilionidae (Vesper and Evening Bats), having 12representative species. This group consists of small tomedium sized insectivorous bats, and having thecharacteristic echolocation ability to maneuver and catchprey in low-light situations. One such species is theLesser Asian House Bat (Scotophilus kuhlii), commonlyfound in urban and agricultural areas, buildings, andsecondary forests as well.
Out of the 67 mammal species, 57 are terrestrial in habits,while ten are found in the marine environment. This wouldinclude the three representative species of FamilyBalaenopteridae, or Rorquals. These are large whalebonewhales having the skin of the throat marked with deeplongitudinal furrows. One such species is the rareHumpback Whale (Megaptera novaeangliae)-sightingsof which have been documented in Taytay, Roxas, andEl Nido. Other marine species would include the fourdolphin species of the Family Delphinidae, the SpermWhale (Physeteridae: Physeter catodon), FinlessPorpoise (Phocoenidae: Neophocaena phocaenoides),and the Dugong (Dugongidae: Dugong dugon).
A total of 16 restricted-range Philippine endemic speciesare found only in Palawan. These include: PalawanShrew (Soricidae: Crocidura palawanensis), PalawanFlying Squirrel (Sciuridae: Hylopetes nigripes), andPalawan Porcupine (Hystricidae: Hystrix pumila) among
Table 8. Summary of Avian Fauna Account in Palawan.
Total Species: 261 Total Subspecies or Races 276 Percentage from Philippine Species:
45.6% (from 572 species)
Philippine Endemics: 4 Restricted Range Philippine Endemics: 21
Endemic Races (Indigenous): 31
Restricted Range Endemic Races (Indigenous):
44
Restricted Range Non-Endemics: 12
Non-Endemic Resident Breeders including Migratory Forms:
71
Note:
Phil. Endemics = only in the Philippines (Palawan and OtherProvinces)Ex. Philippine Cockatoo (Cacatua haematuropygia)- can also be found in Guimaras, Leyte, Luzon, Polillo, amongothers.
Restricted Range Phil. Endemics = also as Palawan Endemics,found only in Palawan.Ex. Palawan Hornbill (Anthracoceros marchei)- found in Mainland Palawan, Balabac, Busuanga, and Calauit
Endemic Races = Subspecies that are found in Palawan andother provinces, there may be other subspecies that are foundin other provinces or countries.Ex. Black-naped Oriole (Oriolus chinensis chinensis)-can be found in Palawan, Mindoro, Luzon, Negros, amongothers-another race (Oriolus chinensis suluensis) is also endemicbut found only in Sulu Province.-the species (Oriolus chinensis) has a range from the MalayPeninsula to Borneo
Restricted Range Endemic Races = Subspecies that are foundonly in Palawan, there may be other subspecies that are foundin other provinces or countries.Ex. Brown Hawk-Owl (Ninox scutulata palawanensis)-another race (Ninox scutulata randi) is also endemic and foundin Basilan, Cebu, Luzon, and Marinduque.
-the species (Ninox scutulata) has a range from Siberia, Japan,and China
Restricted Range Non-Endemics = Species or subspecies thatare not endemic but can be found only in Palawan.Ex. Copper-throated Sunbird (Nectarinia calcosthetha)-can be found in the Malay Peninsula, Sumatra, Java, andPalawan.

STATE OF THE ENVIRONMENT 39
II. Execuve Summ
aryV
ertebrate Wildlife
Table 9. Summary of Mammalian Fauna Account in Palawan.
Total Species: 67 57 (terrestrial) 10 (marine)
Percentage from Philippine Species:
33.3% (from all 201 species) 31.8% (from 179 terrestrial species) 45.4% (from 22 marine species)
Philippine Endemics: 2 terrestrial
Restricted Range Philippine Endemics: 16 terrestrial
Restricted Range Endemic Races (Indigenous):
3 terrestrial
Restricted Range Non-Endemics: 7 terrestrial
Non-Endemic Species:
29 terrestrial 10 marine
others. Still, there are also seven non-endemic speciesthat are restricted only in the province. Some of theseare: Oriental Small-Clawed Otter (Mustelidae: Amblonyxcinereus), Binturong or Palawan Bearcat (Viverridae:Arctictis binturong), and Greater Mouse-Deer(Tragulidae: Tragulus napu), among others.
Threatened species as classified by the IUCN are asfollows: Palawan Montane Tree Squirrel (Sciuridae:Sundasciurus juvencus) [Endangered], Palawan Soft-Furred Mountain Rat (Muridae: Palawanomys furvus)[Endangered], CalaMian Hog-Deer (Cervidae: Axiscalamianensis) [Endangered], Palawan Stink-Badger(Mustelidae: Mydaus marchei) [Vulnerable], PalawanFlying Fox (Pteropodidae: Acerodon leucotis)[Vulnerable], and the Dugong [Vulnerable] among others.
Species totally banned from trade under CITES Appendix1 are the following: Leopard Cat (Felidae: Prionailurusbengalensis), Calamian Hog-Deer, all rorquals(Balaenopteridae), Sperm Whale, Finless Porpoise, andDugong. Meanwhile, trade-regulated species under CITESAppendix 2 are as follows: Palawan Flying Fox, LargeFlying Fox (Pteropodidae: Pteropus vampyrus), Long-Tailed Macaque (Cercopithecidae: Macaca fascicularis),Malayan Pangolin (Manidae: Manis javanica), and all
BirdsHalcyon smyrnensis White-throated KingfisherNumenius madagascariensis Far-eastern CurlewNumenius tahitiensis Bristle-thighed Curlew
MammalsRhinolophus macrotis Big-eared Horseshoe BatRhinolophus creaghi Creagh’s Horseshoe BatMurina cyclotis Round-eared Tube-nose BatHaeromys pusillus Pygmy Tree Mouse
ReptilesDogania subplana Soft-shelled Freshwater TurtleDibamus argenteus Philippine Blind-earless LizardDibamus novaeguinae Blind-earless LizardHemiphyllodactylus insularis Small Smooth-scaled GeckoLepidodactylus lugubris Mourning GeckoMabuya indeprensa Four-striped MabuyaSphenomorphus victoria Victoria’s SphenomorphusGerarda prevostiana Gerard’s Water SnakeNatrix (Rhabdophis) spilogaster Northern Water SnakeNaja naja meolepis Philippine Common Cobra
AmphibiansRana cancrivora Asian Brackish Water FrogRhacophorus pardalis Gliding Tree FrogRana vittigera Common Ricefield Frog
The following species have been encountered and/or recorded from different surveys orinventories by Conservation International Philippines (CI) and the Katala FoundationIncorporated which will be added to the Central Database of the PCSDS:
dolphin species (Delphinidae). The following table (Table9) summarizes the mammalian fauna account for Palawan.A detailed list and biological information of recordedmammalian species in Palawan is found in Appendix C-5.


STATE OF THE ENVIRONMENT 41
II. Executive Summ
a A
gricultural Resources
VII
AGRICULTURALRESOURCES
Despite Palawan’s limited potential area for agriculturaldevelopment brought about by unfavorable landformsand soil characteristics, farming remains to be theprimary occupation of many Palaweños. Cropproduction complemented with backyard livestock andpoultry raising are the main activities of the farmers.As agricultural resources are an important aspect notonly of Palawan’s economy but also of its environment,acquisition of relevant information thereof is importantin planning for the sustainable development of Palawan.The lack of opportunities in agricultural areas usuallyresults in overexploitation of forest resources thusdegrading the environment.
A number of crops are grown in Palawan, but forpurposes of monitoring only rice, corn, cashew, mangoand coconut as the major crops, are considered in thisreport. As to animal production only carabao, cattle,hogs and chicken are commonly raised in the provinceand therefore form part of the monitoring scheme.However, in terms of data availability, the latestinformation on livestock and poultry is rather oldcompared to crop data.
7.1 CROP PRODUCTION
7.1.1 Rice
Rice is generally grown in paddy fields, rainfed areasand uplands. In 1980, the total area under ricecultivation for the whole province was 49, 793 hectares.However, in 2000 the area was narrowed down to48,126.70 hectares as shown in Table 10. As furtherindicated, the reduction of 1,666.30 hectares comesmainly from the regulated utilization of upland areasfor rice production. In 1980, of the total area underrice cultivation, 30,218 hectares were irrigated, 1,093hectares were rainfed areas and 7,482 hectares were inthe uplands. Incidentally, Narra has the largest areadevoted to rice cultivation.
Further analysis of the data on Table 10 indicates thatsome municipalities manifest an increasing trend inspatial extent of paddy fields particularly Narra where amarked expansion of 11,587.3 hectares from the 1980figure of 8,795 was realized in 2000. The massiveconstruction of irrigation projects in Narra during thelast quarter of the 21st century has enticed farmers to gointo paddy rice cultivation thereby increasing the arealextent of irrigated areas in said municipality. Moreover,the municipalities of Taytay and Dumaran also exhibitedan increase of 668 hectares or 52.39 percent and 323hectares or 62.48 percent respectively over the 1980record. The same increasing trend was manifested inthe southern municipalities of Palawan. In contrast,however, northern and island municipalities showed adecreasing trend in the extent of paddy rice areas. Withrespect to lands under rainfed rice production, theSouthern and Northern Municipalities in the mainlandexhibited an increasing trend while the islandmunicipalities showed a decreasing trend as revealed inTable 10.
A rice paddy field in Northern Palawan. The top fourrice producing municipalities in the province include
Narra, Taytay, Rizal, and Quezon.

42 PALAWAN
As to the expanse of land devoted to upland ricecultivation, a reduction of 2,344.49 hectares from the1980 record of 7,482 hectares was documented in 2000.The decline could be attributed to the strict enforcementof environmental laws in the Province especially duringthe nineties. Records also show that in 2000, except for
IRRIGATED RAINFED UPLAND TOTAL
MUNICIPALITY 1980*** 2000 1980*** 2000 1980*** 2000 1980*** 2000
PALAWAN
30218.00
30397.12
12093.00
17357.77
7482.00
371.26
49793.00
48126.15
Mainland 27437.00 30075.12 9849.00 16732.77 5892.00 230.26 38998.00 47038.15
Southern Municipalities
20254.00 25459.37 5741.00 10814.91 2575.00 230.26 19499.00 36504.54
Puerto Princesa City 759.00 179.90 0.00 204.91 1001.00 25.01 1760.00 409.82 Aborlan 1698.00 435.00 946.00 378.00 275.00 0.00 2919.00 813.00 Narra 8795.00 20382.00 172.00 4737.90 0.00 0.00 8967.00 25119.90 Quezon 3717.00 1787.17 1361.00 1333.90 775.00 0.00 5853.00 3121.07 Rizal* 0.00 985.30 0.00 2619.20 0.00 0.00 0.00 3604.50 Sofronio Espanola** 0.00 230.00 0.00 952.00 0.00 112.00 0.00 1294.00 Brooke's Point 4828.00 936.00 2640.00 110.00 167.00 0.00 7635.00 1046.00 Bataraza 457.00 524.00 622.00 479.00 357.00 93.25 1436.00 1096.25
Northern Municipalities 7183.00 4615.75 4108.00 5917.86 3317.00 0.00 14608.00 10533.61
Roxas 3500.00 600.00 1202.00 1266.50 401.00 0.00 5103.00 1866.50 San Vicente 1107.00 1028.00 650.00 218.60 617.00 0.00 2374.00 1246.60 Taytay 1275.00 1943.00 1140.00 3375.00 807.00 0.00 3222.00 5318.00 El Nido 784.00 204.75 764.00 431.76 1000.00 0.00 2548.00 636.51 Dumaran 517.00 840.00 352.00 626.00 492.00 0.00 1361.00 1466.00
Island Municipalities 2781.00 322.00 2244.00 625.00 1590.00 141.00 6615.00 1088.00
Agutaya 0.00 0.00 0.00 0.00 0.00 0.00 0.00 0.00 Araceli 340.00 0.00 654.00 332.50 335.00 0.00 1329.00 332.50 Balabac 415.00 0.00 654.00 0.00 356.00 141.00 1425.00 141.00 Busuanga 180.00 83.00 320.00 80.00 377.00 0.00 877.00 163.00 Cagayancillo 0.00 0.00 0.00 0.00 0.00 0.00 0.00 0.00 Coron 1846.00 239.00 616.00 140.00 272.00 0.00 2734.00 379.00 Cuyo 0.00 0.00 0.00 0.00 250.00 0.00 250.00 0.00 Linapacan 0.00 0.00 0.00 0.00 0.00 0.00 0.00 0.00 Magsaysay 0.00 0.00 0.00 0.00 0.00 0.00 0.00 0.00 Culion 0.00 0.00 0.00 72.50 0.00 0.00 0.00 72.50 Kalayaan 0.00 0.00 0.00 0.00 0.00 0.00 0.00 0.00
* Barangay of Quezon
ras/riceprod/emesari
** Barangay of Brooke's Point *** BAEX Socio-Economic Profile, Palawan, 1980 Source: 1980 Census of Agriculture, National Summary Volume I, Final Report
National level 3,640,882 hectares Regional level 406,067 hectares Palawan level 51,493 hectares
Balabac, all island municipalities as well asmunicipalities in Northern Palawan have ceased toproduce upland rice. On the other hand, all southernmunicipalities of mainland Palawan remained to beupland rice producers.
Table 10. Area (ha) devoted to Rice Production by Municipality, Palawan 1980 and 2000.

STATE OF THE ENVIRONMENT 43
II. Executive Summ
a A
gricultural Resources
The manner by which rice is grown determines thequantity produced per hectare. In general, irrigated landsproduce more compared to rainfed areas and uplands assupply of water is usually adequate. For Palawan, 2000data as shown on Table 11 reveal that yield in irrigatedrice was placed at 4.50 tons/ha. and is relatively higherthan the regional and national 1999 average productionlevel placed at 3.23 and 3.35 metric ton per hectarerespectively. In like manner, the average production forrainfed rice in Palawan estimated at 3.12 mt/ha is higherthan the regional average of 2.28 metric tons per hectare.As to upland rice, the average yield realized by farmersin 2000 was 1.97 mt/ha.
Further analysis of the 1980 and 2000 rice productiondata (see Table 11) also shows that on an annual basis,there is a marked difference in the average yield forirrigated rice. In the span of twenty (20) years, there wasan increase of 1.79 tons/ha or about 66.05 percent overthe 1980 average annual production rate. Similarly, yieldof rainfed rice increased by 0.64 mt/ha. or about 25.81percent of the 1980 figure. Increase in the use of fertilizersand pesticides may have contributed to the improvementin production.
Palawan produced a total of 191,636 metric ton of palayin 2000. If the population carrying capacity of Palawanwill be based on the per capita rice consumption of a Table 11. Average Rice Yield, Palawan, 1980 and 2000.
Average Yield (tons/ha)
Type of Southern Northern Island Average Regional National Rice Fields Municipalities Municipalities Municipalities Average* Average*
Irrigated
1980 2.706 2.720 2.701 2.709 3.250 2000 4.730 3.280 3.450 4.500 3.230 3.350
Rainfed 1980 2.500 2.500 2.410 2.480 2.000 2000 2.950 2.910 3.630 3.120 2.28
Upland 1980 2.020 2.02 1.804 1.970 no data 2.000 2000 1.750 no data 2.280 1.970 no data no data
* 1999
Source: Economic Potentials and Development Constraints of Palawan pp. 77.
Filipino estimated at 125 kg/year, the estimated riceproduction level is deemed sufficient to feed 996,507persons which is relatively lower than the actualpopulation of 775,412 in said year. This means that fornow, Palawan is generally sufficient in rice. However,
Agriculture in Palawan isgenerally more difficult thanelsewhere in the Philippinesbecause the soils are poor innutrients. Hence, sites for growingcrops have to be selected morecarefully.
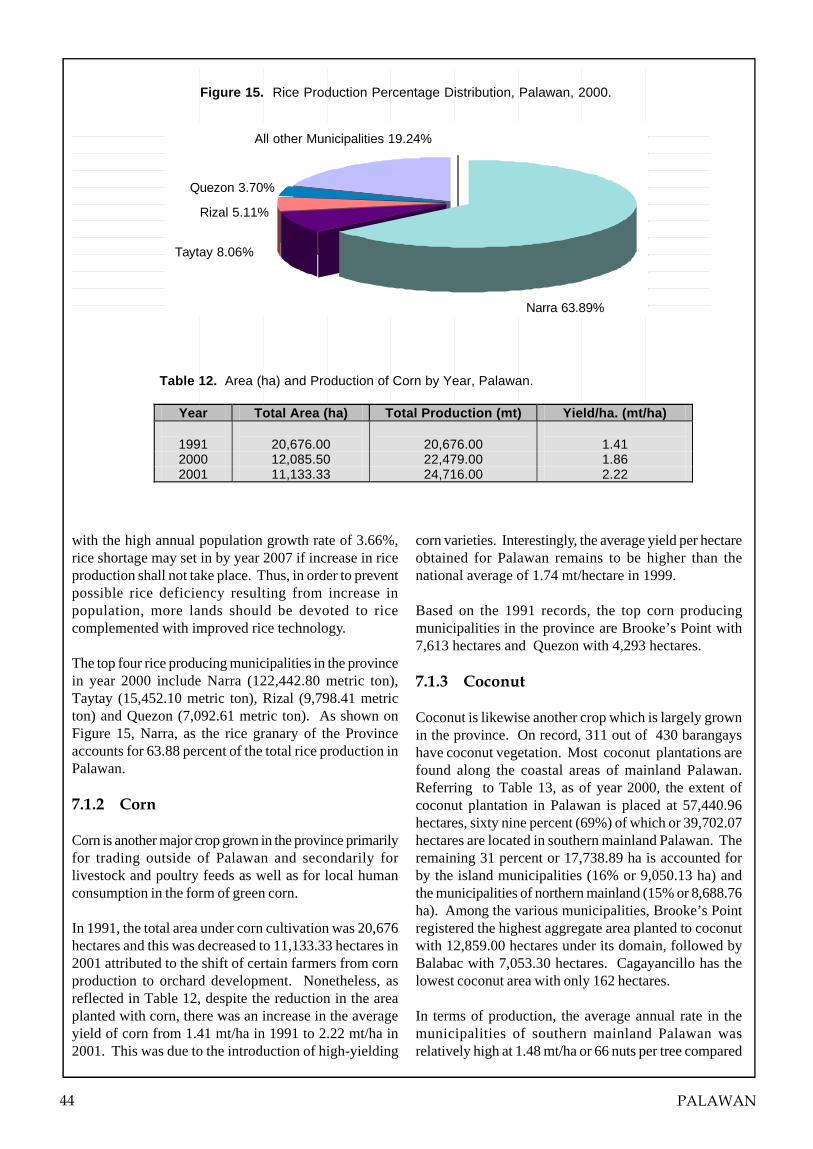
44 PALAWAN
Figure 15. Rice Production Percentage Distribution, Palawan, 2000.
Table 12. Area (ha) and Production of Corn by Year, Palawan.
Year Total Area (ha) Total Production (mt) Yield/ha. (mt/ha)
1991
20,676.00
20,676.00
1.41 2000 12,085.50 22,479.00 1.86 2001 11,133.33 24,716.00 2.22
with the high annual population growth rate of 3.66%,rice shortage may set in by year 2007 if increase in riceproduction shall not take place. Thus, in order to preventpossible rice deficiency resulting from increase inpopulation, more lands should be devoted to ricecomplemented with improved rice technology.
The top four rice producing municipalities in the provincein year 2000 include Narra (122,442.80 metric ton),Taytay (15,452.10 metric ton), Rizal (9,798.41 metricton) and Quezon (7,092.61 metric ton). As shown onFigure 15, Narra, as the rice granary of the Provinceaccounts for 63.88 percent of the total rice production inPalawan.
7.1.2 Corn
Corn is another major crop grown in the province primarilyfor trading outside of Palawan and secondarily forlivestock and poultry feeds as well as for local humanconsumption in the form of green corn.
In 1991, the total area under corn cultivation was 20,676hectares and this was decreased to 11,133.33 hectares in2001 attributed to the shift of certain farmers from cornproduction to orchard development. Nonetheless, asreflected in Table 12, despite the reduction in the areaplanted with corn, there was an increase in the averageyield of corn from 1.41 mt/ha in 1991 to 2.22 mt/ha in2001. This was due to the introduction of high-yielding
corn varieties. Interestingly, the average yield per hectareobtained for Palawan remains to be higher than thenational average of 1.74 mt/hectare in 1999.
Based on the 1991 records, the top corn producingmunicipalities in the province are Brooke’s Point with7,613 hectares and Quezon with 4,293 hectares.
7.1.3 Coconut
Coconut is likewise another crop which is largely grownin the province. On record, 311 out of 430 barangayshave coconut vegetation. Most coconut plantations arefound along the coastal areas of mainland Palawan.Referring to Table 13, as of year 2000, the extent ofcoconut plantation in Palawan is placed at 57,440.96hectares, sixty nine percent (69%) of which or 39,702.07hectares are located in southern mainland Palawan. Theremaining 31 percent or 17,738.89 ha is accounted forby the island municipalities (16% or 9,050.13 ha) andthe municipalities of northern mainland (15% or 8,688.76ha). Among the various municipalities, Brooke’s Pointregistered the highest aggregate area planted to coconutwith 12,859.00 hectares under its domain, followed byBalabac with 7,053.30 hectares. Cagayancillo has thelowest coconut area with only 162 hectares.
In terms of production, the average annual rate in themunicipalities of southern mainland Palawan wasrelatively high at 1.48 mt/ha or 66 nuts per tree compared
Quezon 3.70%
All other Municipalities 19.24%
Rizal 5.11%
Taytay 8.06%
Narra 63.89%

STATE OF THE ENVIRONMENT 45
II. Executive Summ
a A
gricultural Resources
Table 13. Coconut Production Data by Municipality, Palawan, 2000.
Municipality
# of Coconut Producing.
Bgys.
Area Planted to Coconut (ha)
Copra Production. (metric ton)
Avg. Copra Production.
(mt./ha)
Avg. # of nuts/tree
(pcs.)
Palawan 311 57,440.96 82,447.76 1.44 57
Mainland 215 48,390.83 69,729.43 1.44 62
Southern Municipalities 145 39,702.07 58,729.10 1.48 66
Puerto Princesa City 36 5,780.57 7,825.95 1.35 68 Aborlan 18 4,062.40 5,094.22 1.25 56 Narra 18 5,627.00 8,021.73 1.43 61 Quezon 14 5,176.20 5,253.12 1.02 69 Rizal 11 2,251.20 2,056.47 0.91 69 Sofronio Espanola 9 1,467.70 2,605.08 1.78 65 Brooke's Point 27 12,859.00 24,821.18 1.93 71 Bataraza 12 2,478.00 3,051.35 1.23 68
Northern Municipalities
70 8,688.76 11,000.33 1.27 55
Roxas 25 4,118.16 6,626.17 1.61 69 San Vicente 10 882.60 1,232.57 1.40 60 Taytay 16 1,433.00 977.65 0.68 45 El Nido 5 1,235.00 1,210.44 0.98 54 Dumaran 14 1,020.00 953.50 0.93 48 Island Municipalities 96 9,050.13 12,718.33 1.41 50
Agutaya 8 48.23 45.05 0.93 48 Araceli 13 327.00 265.13 0.81 51 Balabac 15 7,053.30 10,611.11 1.50 64 Busuanga 15 202.60 238.19 1.18 52 Cagayancillo 5 162.00 165.55 1.02 46 Coron 8 226.00 234.07 1.04 44 Cuyo 11 342.00 387.37 1.13 47 Linapacan 10 229.00 239.02 1.04 52 Magsayasay 11 460.00 532.84 1.16 45 Culion - - - - - Kalayaan - - - - - Source; Coconut Industry Profile, PCA, Palawan
to Island Municipalities which registered only 1.41 mt/ha or 50 nuts per tree. On a per municipality basis,average production rate in terms of metric tons perhectare is highest in Brooke’s Point at 1.93 and lowestin Taytay at 0.68. On one hand, on the basis of nuts pertree, Brooke’s Point manifested the highest averageannual rate at 71 while Coron depicted the least annualharvest placed at 44 nuts per tree. This means thatcoconut trees in Brooke’s Point are generally productivecompared to other municipalities.
7.2 LIVESTOCK PRODUCTION
Aside from crop production, farmers are also engagedin livestock and poultry raising to supplement theirconsumption requirement and other family needs.
As of 1995, livestock and poultry population in theprovince are being raised both in the backyards and incommercial scale. As to livestock, there are generallyonly three types of livestock which are raised largely inPalawan and these are carabao, cattle and hogs. Carabaohowever are basically used as draft animals. Aggregateprovincial data on livestock and poultry production from1982 to 1995 is presented on Table 14.
As indicated, 1982 record shows that there were 27,616heads of carabao in the province, but was increased to32,483 in 1995. However, during the intervening years,a reduction in carabao population was manifested fromtime to time. This situation could be attributed to theunregulated sale of carabao to Manila by declaring themunfit as working animals.

46 PALAWAN
Table 14. Total Livestock and Poultry Production by Type and by Year.
P O P U L A T I O N (# Heads) LIVESTOCK POULTRY
Year Carabao Cattle Backyard Commercial Swine Goat Chicken Ducks
1982 a/ 27,616 17,552 - 46,814 - 482,006 - 1983 a/ 27,914 18,304 - 48,321 - 511,473 - 1984 a/ 28,485 17,748 - 43,807 - 47,350 - 1992 b/ 20,211 14,000 1,024 82,204 20,150 641,953 22,826 1993 c/ 27,855 16,978 14,055 93,085 22,873 584,660 20,075 1994 c/ 20,720 18,204 12,258 98,808 24,525 586,164 20,842 1995 d/ 32,483 19,502 104,768 24,939 599,294 21,309
Source:
a/
BAEcon: Ministry of Agriculture, Economic Potentials and Development Constraints of Palawan, PIADPO, November 1986
b/ Bureau of Agricultural Statistics, Central Officer: PCSDS, Palawan, Statistics A1.02 c/ Bureau of Agricultural Statistics, Palawan d/ Provincial Planning and Development Office
In the case of cattle, they are being raised both in thebackyard and in commercial scale since 1980. However,available data in the said year do not reflect segregationof the population into backyard and commercial scale. Itwas only from 1992 up to 1994, where concerned agenciesstarted to segregate census on commercial and backyardscale cattle raising in the province. Due to limited dataas shown in Table 14, no trend in commercial scale cattleproduction was obtained. Nonetheless, an unusualincrease in cattle population from 1,024 heads in 1992 to14,055 heads in 1993 was manifested. Unexpectedlyhowever, the following year commercial productiondecreased by 1,797 heads or about 12.79% of 1993.
In terms of backyard production, the trend was observedto fluctuate from 1982 to 1995. It was further noted thatthe aggregate population of cattle raised in backyards isgenerally high compared to those raised on a commercialscale. Nonetheless, the rise in the inventory of cattleheads from 1882 to 1995 is an indication that cattle raisingis a growing industry in the province.
In the case of hog/swine population, the general trendshowed an increase. In 1982, hog population wasestimated to be 46,814 heads while in 1995 it increasedto 104,768 heads. The rise in swine production could beattributed to high demand for pork consumption broughtabout by the increase in population as well as the numberof tourism related establishments (hotels and restaurants)in the province especially in Puerto Princesa City whichserves as a ready market for the said commodity.
7.3 POULTRY PRODUCTION
As in the preceding trends, data show that chickenproduction had also rose tremendously from 482,006 in1982 to 599,294 in 1995. Again, the increase could alsohave been triggered by the demand for more poultryproducts arising from increase in population and in thenumber of tourism related establishments such as hotelsand restaurants particularly in Puerto Princesa Citywhich serves as a ready market for the said commodity.

STATE OF THE ENVIRONMENT 47
II. Executive Summ
a W
ater Resources
VIII
WATER RESOURCES
Water is an important resource to the people of Palawan,both for today and future generations. The growing trendof population accounts for the increasing demand fordomestic water consumption. While the people are mainlydependent on groundwater for their domestic waterrequirements, the area with available groundwater(shallow and deep well area) is only 2,242 sq km or15.05% of the province’s total land area. The rest areconsidered difficult areas because supply of groundwateris scarce. On the other hand, the agriculture sector is themain user of the surface water. There are 43 existingcommunal irrigation systems with a service area of 10,492hectares. However, only 47% is considered functional.
Monitoring of Palawan’s water resources is one of theon-going activities of PCSDS. Currently, a total offourteen rivers (10 in Southern Palawan namely: Iraan,Aborlan, Batang-Batang, Calategas, Aramaywan, Labog,Pulot, Tigaplan, Tamlang and Panitian; and four inNorthern Palawan: Bacungan, Guinaratan, Inandeng andAbongan) are being monitored in terms of water quality.The aim is to generate information as bases for planningand policy formulation as well as to detect pollution andother environmental hazards at an early stage. Regularmonitoring was scheduled quarterly.
Water samples collection was done by manual grabmethod. The general water quality parameters beingmeasured in-situ include pH, dissolved oxygen (DO), andtemperature, while those that are determined in thelaboratory consist of nitrate and nitrite content, turbidity,conductivity, total dissolve solids, suspended solids,alkalinity and hardness. Stream flow of the rivers arealso being measured using Valeport current meter.
8.1 CLIMATE
Palawan is generally typhoon-free except for northerntowns which are occasionally visited by storms. Heavy
rainfall often accompanied by the southwest monsoon isusually experienced in July and August.
The province has 2 types of climate. The western sectionexperiences 2 pronounced dry and wet seasons (Type I)while the eastern section has no pronounced seasons(Type III).
8.1.1 Rainfall
There are five PAGASA (Philippine Atmospheric,Geophysical and Astronomical ServicesAdministration)stations in Palawan namely Puerto Princesa City (wherefirst rainfall observations started in 1949). OtherPAGASA stations are in Aborlan, Brooke’s Point, Cuyoand Coron. Other stations were established in Batarazaby the Rio Tuba Nickel Mining Corporation and inTagbita, Rizal by another mining firm.
The Hydrometric Network Program (HNP) implementedby the Palawan Integrated Area Development ProjectOffice (PIADPO) and funded by the European Economic
Tigaplan River, Brookes Point, one of the rivers inPalawan which has excellent general water quality.

48 PALAWAN
Table 15. Mean Annual Rainfall of Different Rainfall Stations in Palawan.
Rainfall Stations Duration Mean Annual Rainfall (mm)
Puerto Princesa a/ 1949-2003 1334.2 Aborlan a/ 1977-1999 3083.3 Brooke's Point a/ 1956-1989 1558.0 Coron a/ 1961-2002 2290.6 Cuyo a/ 1961-1995 2104.4 Rio Tuba b/ 1983-1999 1712.4 Tagbita c/ 1973-1984 3323.0 Cabayugan, Puerto Princesa d/ 1997-2003 3986.9 Poblacion, El Nido d/ 2001-2003 4601.0 Poblacion, Quezon d/ 1997-2003 2929.7 Magara, Roxas d/ 1998-2003 3372.2 Abongan, Taytay d/ 1998-2003 2739.7 Mainit Brooke' Point d/ 1998-2003 2909.4
Table 16. Seasonal Rainfall Data by Station, Palawan.
Station Period of Data Capture
Number of Dry Months
Number of Intermediate
Month
Number of Wet Months
Puerto Princesa 1999 to 2003 5 7 0 Aborlan 1977 to 1999 1 4 7 Brooke's Point 1956 to 1989 4 8 0 Coron 1961-92/1997-2002 5 2 5 Cuyo 1962 to 1965 5 3 4 Rio Tuba, Bataraza 1985 to 2003 4 7 1 Tagbita 1973 to 1984 1 4 7 Cabayugan, PPC 1997 to 2003 2 2 8 Poblacion, El Nido 2001 to 2003 5 0 7 Poblacion, Quezon 1997 to 2003 2 4 6 Magara, Roxas 1998 to 2003 2 4 6 Abongan, Taytay 1998 to 2003 3 2 7 Mainit, Brooke's Pt. 1998 to 2003 1 6 5 Notes: dry months - less than 100 mm rainfall intermediate months - from 101-250 mm rainfall wet months - greater than 250 mm rainfall
Community (EEC) had installed rainfall stations in 1985.However, collection of data was disrupted when theautomatic rainfall equipment malfunctioned in 1986.
To date, the PCSDS operates and maintains six (6)manually operated rain gauges in six (6) differentmunicipalities. The five (5) automatic weather stationsinstalled by the Palawan Tropical Forest ProtectionProgram (PTFPP) the previous years were all non-operational.
8.1.2 Annual Rainfall
The mean annual rainfall from the different rainfallmonitoring stations in the province is shown in Table15. Of the 13 stations (5 PAGASA, 6 PCSDS and 1mining company), El Nido registered the highest meanannual rainfall at 4601.0 mm followed by Cabayugan inPuerto Princesa City at 3986.9 mm. The least mean annualrainfall was manifested by Puerto Princesa City with1334.2 mm. The average annual rainfall of all stations is
Source:a/ PAGASAb/ Rio Tuba Nickel Mines Co.c/ Soriano Mining Co.d/ PCSDS Rainfall Stations

STATE OF THE ENVIRONMENT 49
II. Executive Summ
a W
ater Resources
Table 17. Severe Weather Disturbances Which Affected Palawan from 1948-1992.
Year Tropical Depression Date Affected Area
1948 Tropical Depression of Rena Nov. 30-Dec. 1 Puerto Princesa 1949 Storm Nov. 10-13 Cuyo, Calamian Group
Storm Nov. 4-8 Cuyo, Calamian Group Typhoon Oct 31-Nov. 3 Cuyo, Calamian Group Typhoon Betty Dec. 2-7 Cuyo, Calamian Group
1950 Typhoon Delilah Nov. 18-22 Cuyo, Calamian Group 1951 Typhoon Amy Dec. 5-16 Cuyo, Calamian Group 1954 Typhoon Elsie May 5-9 Cuyo, Calamian Group
Typhoon Tilda Nov. 27-30 Cuyo, Calamian Group Tropical Storm Dec. 23-27 Puerto Princesa
1955 Typhoon Patsy Nov. 26-Dec. 2 Puerto Princesa 1958 Tropical Depression Nov. 19-24 Northern Palawan 1960 Typhoon Karen Apr. 20-26 Cuyo, Calamian Group
Tropical Storm Moning Nov. 27-29 Cuyo, Calamian Group 1967 Typhoon Bebeng Mar. 2-5 Cuyo, Calamian Group
Typhoon Yayang Nov. 6-8 Puerto Princesa 1968 Typhoon Reming Nov. 13-21 Puerto Princesa 1969 Typhoon Titang Oct. 16-22 Northern Palawan
Tropical Storm Uding Oct. 24-27 Northern Palawan 1972 Typhoon Undang Dec. 1-8 Cuyo & Rest of Northern
Palawan 1977 Typhoon Kuring Jun 13-14 Whole Province 1979 Tropical Storm Karing May 10-16 Northern Palawan 1981 Tropical Storm Unsing Oct. 12-14 Puerto Princesa & Cuyo 1985 Tropical Depression Rubing Oct. 12-13 Puerto Princesa
Typhoon Saling Oct. 16-19 Puerto Princesa Tropical Storm Edeng Jun. 26-28 Calamian Group Typhoon Unsang Oct. 21-26 Calamian Group Tropical Storm Welpring Nov. 1-2 Whole of Palawan Nov. 4-5 Whole of Palawan Typhoon Yoning Nov. 5-8 Whole of Palawan
1989 Tropical Depresson Ibiang Jul. 20-21 Whole of Palawan Typhoon Saling Oct. 9-11 Calamian Group
1990 Typhoon Marian May 19 Crossed Mindanao & Palawan as a low pressure area
Tropical Depression May 22-23 Crossed Palawan as a low pressure area
1991 Tropical Storm Bebeng Apr. 24-26 Whole Palawan Tropical Storm Thelma Nov. 2-7 Southern Palawan
1992 Typhoon Osang Oct. 16-18 Whole Palawan Typhoon Paring Oct. 18-27 Calamian Group
estimated at 2,734.4 mm. Map 9 shows the geographiclocation of the rainfall station and the correspondingcomputed mean annual rainfall. Details of the total annualrainfall of Palawan are indicated in Appendix D-1a.
8.1.3 Seasonal Rainfall
Seasonal rainfall of Palawan consists of wet, intermediateand dry months. Months with mean monthly precipitation(mmp) of more than 250 mm are considered wet whilethose with mmp of less than 100 mm are categorized asdry. Those with mmp of 100 mm to 250 mm are classifiedas intermediate months. These definitions are vital in termsof agricultural production because they roughly
correspond when soil moisture deficits can be expectedto be insignificant, important for short periods orpronounced for long periods. Data on mean monthlyrainfall by station is reflected in Appendix D-1b.
Based on available data as shown on Table 16, Cabayuganmanifested the highest number of wet months placed ateight (8) months in one year, followed by Aborlan, Tagbita,El Nido and Taytay with seven (7) months. PuertoPrincesa and Brooke’s Point have no defined wet months.
8.1.4 Weather Disturbances
From the period 1948-1992, 24 typhoons, 13 tropicalstorms and five tropical depressions hit Palawan. Most

50 PALAWAN
occurrences were on the northern part, particularly inCuyo and Calamian Group of Islands (CCGI) (see Table17) with 19 attacks of weather disturbances. FollowingCCGI is Puerto Princesa with eight (8) weatherdisturbances on the record. Disturbances usually occurin the months of October to December and some duringthe wet months of May and June.
8.2 GENERAL WATER QUALITY
Interpretation of data pertaining to the general waterquality of rivers in Palawan consists of comparativeanalysis between the results of both on-site measurementsand laboratory tests performed on samples taken frommonitoring sites and the standards set in the PhilippineRevised Water Usage and Classification Water QualityCriteria (PRWU and CWQC) as provided inAdministrative Order No. 34, series of 1990 issued byDepartment of Environment and Natural Resources. Sincewater sampling was done only for at least once or twice ayear, average annual concentration was not computed.Instead the average concentration based on data generatedis used in the discussion. Data on the water qualityparameters are shown in Appendix D-2.
8.2.1 pH
The pH value represents the hydrogen ion activity inwater. Most natural waters have a pH ranging from pH5 to pH 9 and are often slightly acidic or basic due to thepresence of carbonates and bicarbonates. Any deviationfrom the normal pH for a given water indicatescontamination of acidic or basic wastes.
The results of the on-site measurements of pH (AppendixD-2) during wet and dry season for all of the samplingsites are within the PRWU and CWQC for freshwater
which is between pH 6.5 to pH 8.5 except for two sites.The Inandeng River has a pH value of 5.9 on March2000 while Iraan River has a pH of 6.4 and 6.25 forDecember 1999 and May 2000 respectively. Based onthe 1988 Soil and Land Resources Evaluation Study madeon the chemical properties of the soil within the catchmentareas, the pH values range from 4 to 6. The said acidiccharacteristics of the soil possibly influenced the low pHvalues on several occasions in some of the catchments.
During the August 2000 sampling the pH values of riverswere within the 6.5 to 8.5 range. Figures 16 and 17illustrate in graphical form the pH values obtained fromthe samples in southern and northern Palawan respectively.
8.2.2 Suspended Solids
Suspended solids are materials that float in suspension inwater which could possibly come from natural soil erosion,organic matter within the body of water or waste fromhuman activities. These materials are carriers of organicand inorganic pollutants including heavy metals, pathogensand nutrients.
As shown on Figure 18, the amount of suspended solidsin samples taken from the rivers of Southern Palawanwere within the 50 mg/L maximum limit for Class Afreshwater of the PRWU and CWQC except for fewoccasions which occurred during the wet season of 1998and 2000 for Calategas, Iraan, Aramaywan, and LabogRivers.
In the case of Northern Palawan as indicated on Figure19, samples taken from Guineratan River exhibited thehighest concentration of suspended solids with an averageof 246.7 mg/L followed by Abongan River which has 77mg/L. Except for Bacungan River, the sample
Figure 16. pH Value of Water Samples from River Stations in Southern Palawan.
0.001.002.003.004.005.006.007.008.009.00
10.00
Iraan
Calateg
as
Aramay
wanLa
bog
Tigap
lan
Aborl
an
Batan
g-Bata
ng
Panitia
nPu
lot
Tamlan
g
Municipality
pH L
evel
(st
anda
rd:
6.5
-8.5
)
Lowest
Average
Highest

STATE OF THE ENVIRONMENT 51
II. Executive Summ
a W
ater Resources
Figure 17. pH Value of Water Samples from River Stations inNorthern Palawan.
Figure 19. Concentration of Total Suspended Solids in WaterSamples from River Stations in Northern Palawan.
Co
nce
ntr
atio
n o
f To
tal S
uspe
nded
So
lids,
mg
/L (
stan
dar
d:
max
. of
50)
Figure 18. Concentration of Total Suspended Solids in WaterSamples from River Stations in Southern Palawan.
0.00
50.00
100.00
150.00
200.00
250.00
Iraan
Calateg
as
Aramay
wanLa
bog
Tigap
lan
Aborl
an
Batan
g-Bata
ng
Panit
ian Pulot
Tamlan
g
Municipality
Su
spen
ded
So
lids,
mg
/L (
stan
dar
d:
m
ax. o
f 50
)
Lowest
Average
Highest
0.00
200.00
400.00
600.00
800.00
1,000.00
1,200.00
1,400.00
Guineratan Inandeng Abongan Bacungan
Municipality
Lowest
Average
Highest
0.00
1.00
2.00
3.00
4.00
5.00
6.00
7.00
8.00
9.00
Guineratan Inandeng Abongan Bacungan
Municipality
pH L
evel
(st
anda
rd:
6.5
-8.5
)
Lowest
Average
Highest

52 PALAWAN
concentration obtained from the other rivers exceeded theDENR standards of 50 ppm set for Class A freshwater atleast once during the survey period. The averageconcentration of total suspended solids in each river stationis indicated in Map 10.
8.2.3 Turbidity
Turbidity is a measure of water cloudiness due tosuspended solids. Just as Guineratan River registered the
highest concentration of suspended solids, it likewiseexhibited the highest value of turbidity as manifestedin Figures 20 and 21. Again, Abongan River rankedsecond in terms of turbidity.
Generally , the concentration of solids and values ofturbidity are higher during wet season compared to dryseason. It can be explained by the sediments that gowith the run off water during wet season.
Figure 20. Turbidity Readings in Water Samples from RiverStations in Southern Palawan.
Figure 21. Turbidity Readings in Water Samples from RiverStations in Northern Palawan.
High values of suspended solids and turbidity of water at the Guineratan River were due to the gold mining activities at theupper part of the catchment. Stripping of the top soil to extract the ore and the subsequent neglect to rehabilitate andrestore the mined out areas brought about the degradation of the river water resulting in the high values of suspendedsolids and turbidity obtained from the samples. Findings of the investigation conducted by the Environment and NaturalResources Office (ENRO) of the Provincial Government of Palawan showed that said gold mining operation which startedin 1993 have not ceased even up to the present despite the expiration of the small scale gold panning permits issued to goldpanners.
0
50
100
150
200
250
Iraan
Calateg
as
Aramay
wanLa
bog
Tigap
lan
Aborl
an
Batan
g-Bata
ng
Panitia
nPu
lot
Tamlan
g
Municipality
FTU
Lowest
Average
Highest
0
100
200
300
400
500
600
700
800
Guineratan Inandeng Abongan Bacungan
Municipality
FT
U
Lowest
Average
Highest

STATE OF THE ENVIRONMENT 53
II. Executive Summ
a W
ater Resources
8.2.4 Temperature
On-site temperature readings depend on the amount ofsunlight and time of measurement. As shown in Figures22 and 23, the temperature readings range from 23.36 ºCto 34.8 ºC and 26.1 ºC to 30.1 ºC for the sampling sitesin Southern and Northern Palawan respectively. Thehighest and lowest values were taken at noontime and earlymorning at Aramaywan River.
8.2.5 Dissolved Oxygen
Dissolved Oxygen (DO) is a very important indicatorfor the survival of aerobic organisms in water. ThePRWU and CWQC has set a minimum standardconcentration of 5 mg/L DO for Class A freshwater.
Concentration of DO is higher during wet season comparedto dry season because of greater stream flow that givesmore aeration to the river water as indicated on Figure24 and 25. The DO levels at the monitoring sites in
Figure 22. Temperature Readings in Water Samples from RiverStations in Southern Palawan.
0.05.0
10.015.020.025.030.035.040.0
Iraan
Calateg
as
Aramay
wanLa
bog
Tigap
lan
Aborl
an
Batan
g-Bata
ng
Panit
ian Pulot
Tamlan
g
Municipality
Tem
per
atu
re R
ead
ing
s oC
elsi
us
Lowest
Average
Highest
Southern Palawan are within the PWRU and CWQC forfreshwater except for 1999 sampling while Iraan,Calategas and Aramaywan Rivers manifested values lessthan the standard of 5 mg/L of DO.
During the sampling period on March 2000, the DO levelsof Guineratan River and Inandeng River were 2.8 and 3.0mg/L respectively. The low levels can be attributed tothe decomposition of organic substances observed in theriver and very slow river flow. Nonetheless, the DO levelswent back to normal during the succeeding wet season.
8.2.6 Conductivity and TotalDissolved Solids (TDS)
Conductivity is a measurement of water’s capacity forconveying electrical conductance and is directly relatedto the concentrations of ionized substances in water.Conductivity is commonly used to determine the TDSin water.
Guineratan River, Roxas, contains highvalues of suspended soil and turbidity brought
about by gold mining activities at the uppercatchment.

54 PALAWAN
Figure 24. Concentration of Dissolved Oxygen in Water Samplesfrom River Stations in Southern Palawan.
0.00
2.00
4.00
6.00
8.00
10.00
12.00
Iraan
Calateg
as
Aramay
wanLa
bog
Tigap
lan
Aborl
an
Batan
g-Bata
ng
Panit
ian Pulot
Tamlan
g
Municipality
Co
nce
ntr
atio
n o
f Dis
solv
ed O
xyg
en
mg
/L (s
tan
dar
d:
min
. of 5
)
Lowest
Average
Highest
Figure 25. Concentration of Dissolved Oxygen in Water Samplesfrom Stations in Northern Palawan.
Co
nce
ntr
atio
n o
f D
isso
lved
Oxy
gen
mg
/L(s
tan
dar
d:
min
. of
5)
0.01.02.03.04.05.06.07.08.09.0
10.0
Guineratan Inandeng Abongan Bacungan
Municipality
Lowest
Average
Highest
Figure 23. Temperature Readings in Water Samples from RiverStations in Northern Palawan.
0.0
5.0
10.0
15.0
20.0
25.0
30.0
35.0
Guineratan Inandeng Abongan Bacungan
Municipality
Tem
per
atu
re R
ead
ing
s, o
Cel
siu
s
Lowest
Average
Highest

STATE OF THE ENVIRONMENT 55
II. Executive Summ
a W
ater Resources
To
tal
Dis
solv
ed S
olid
s, m
g/L
(sta
nd
ard
: m
ax. o
f 1,
000)
Figure 26. Concentration of Total Dissolved Solids in Water Samplesfrom River Stations in Southern Palawan.
Except for Labog River which is affected by saline waterfrom the coastal area particularly during high tide, theconductivity and TDS measurements obtained fromsouthern (Figure 26) and northern (Figure 27) Palawanmonitoring stations were found to be within the PWRUand CWQC standard of 1,000 ppm for Class A freshwater.
8.2.7 Color
Color in water results from leaching of organic debris,metallic salts and dissolved or suspended materials. Theapparent color includes not only the color due tosubstances but also that of suspended matter. The natureof the soil within the catchment area also affects the colorof the water that drains to the river being sampled.
As illustrated in Figure 28, Labog River has the highestvalues of color compared to other rivers in SouthernPalawan. The valued obtained ranged from 54 to 523
Figure 27. Concentration of Total Dissolved Solids in Water Samplesfrom River Stations in Northern Palawan.
units. At the time of the samplings, traces of river bankerosion were noted and gravel and sand extraction at theupstream, thereby affecting the color values. Moreover,decomposing organic matter such as leaves, trunks andmangrove bark left at the river bank under the bridgecould also have affected the values obtained.
As to the other sites, Calategas River has values of colorranging from 37 to 1,022 units; Aramaywan River withcolor units ranged from 42 to 720, and of Iraan Riverwith color ranged from 29 to 281 units.
Only Tigaplan River with color values ranging from 0 to101 units or an average value of 34.39 units had met the50 units PWRU and CWQC for Class A freshwaters.
In case of Northern Palawan as manifested in Figure 29,all sampling sites exhibit values that exceeded the 50color units set by the PRWU and CWQC for Class A
050
100150200250300350400450500
Guineratan Inandeng Abongan Bacungan
Municipality
To
tal D
isso
lved
So
lids,
mg
/L
(sta
ndar
d:
max
. of
1,00
0)
Lowest
Average
Highest
05000
100001500020000250003000035000400004500050000
Labo
gIra
an
Calateg
as
Aramay
wan
Tigap
lan
Aborl
an
Batan
g-Bata
ng
Panitia
nPulo
t
Tamlan
g
Municipality
Lowest
Average
Highest

56 PALAWAN
Pt-
Co
Un
its
(st
and
ard
: m
ax o
f 50
)
Figure 29. Values of Color in Water Samples from River Stationsin Northern Palawan.
0
500
1000
1500
2000
2500
3000
3500
Guineratan Inandeng Abongan Bacungan
Municipality
Lowest
Average
Highest
freshwater. Results of analysis show that GuineratanRiver has manifested the highest vale of color at 3,303units obtained during the November 1998 samplingfollowing several days of heavy rains caused by weatherdisturbances.
8.2.8 Chloride
Chloride is present in water as metallic salt but in lowconcentrations. The chloride concentrations of thesamples from the monitoring stations ranged from 1 to53 mg/L except for Labog River which manifestedexceedingly higher values as it is being affected byoceanic tides. Figures 30 and 31 illustratesconcentrations of chloride in samples obtained frommonitoring stations in Southern and Northern Palawanrespectively.
8.2.9 Total Alkalinity
Alkalinity is a characteristic of water which refers to thecapability of water to neutralize acid by its bicarbonate,carbonate or hydroxide content. Natural water usuallycontains less alkaline than wastewater or polluted waters.
The alkalinity of water samples from monitoring sitesranges between 11 to 215 mg/L CaCO3 wherein IraanRiver has the highest value. On the other hand, Calategasand Labog rivers exhibited the highest average value ofalkalinity which is 144 mg/L in calcium carbonateconcentration while Inandeng River had the lowest whichis only 15.6 mg/L. Total alkalinity of water samplesdrawn from monitoring sites in Southern and NorthernPalawan is shown on Figures 32 and 33 respectively.
Figure 28. Values of Color in Water Samples from River Stationsin Southern Palawan.
0
200
400
600
800
1,000
1,200
Iraan
Calateg
as
Aramay
wanLa
bog
Tigap
lan
Aborl
an
Batang
-Batan
g
Panitia
nPu
lot
Tamlan
g
Municipality
Lowest
Average
Highest
Pt-
Co
Un
its
(sta
nd
ard
: m
ax. o
f 50)

STATE OF THE ENVIRONMENT 57
II. Executive Summ
a W
ater Resources
Figure 30. Concentration of Chloride in Water Samplesfrom River Stations in Southern Palawan.
0
5001,000
1,500
2,000
Iraan
Calateg
as
Aramay
wanLa
bog
Tigap
lan
Aborl
an
Batan
g-Bata
ng
Municipality
Ch
lori
de,
mg
/LLowest
Average
Highest
Figure 31. Concentration of Chloride in Water Samples from RiverStations in Northern Palawan.
Figure 32. Concentration of Calcium Carbonate in Water Samplesfrom River Stations in Southern Palawan.
0.0
5.0
10.0
15.0
20.0
25.0
30.0
35.0
40.0
45.0
Guineratan Inandeng Abongan Bacungan
Municipality
Ch
lori
de,
mg
/L
Lowest
Average
Highest
0.0
50.0
100.0
150.0
200.0
250.0
Iraan
Calate
gas
Aramay
wanLa
bog
Tigap
lan
Aborl
an
Batang
-Batan
g
Panitia
nPulo
t
Tamlan
g
Municipality
Cal
ciu
m C
arb
on
ate,
mg
/L
Lowest
Average
Highest
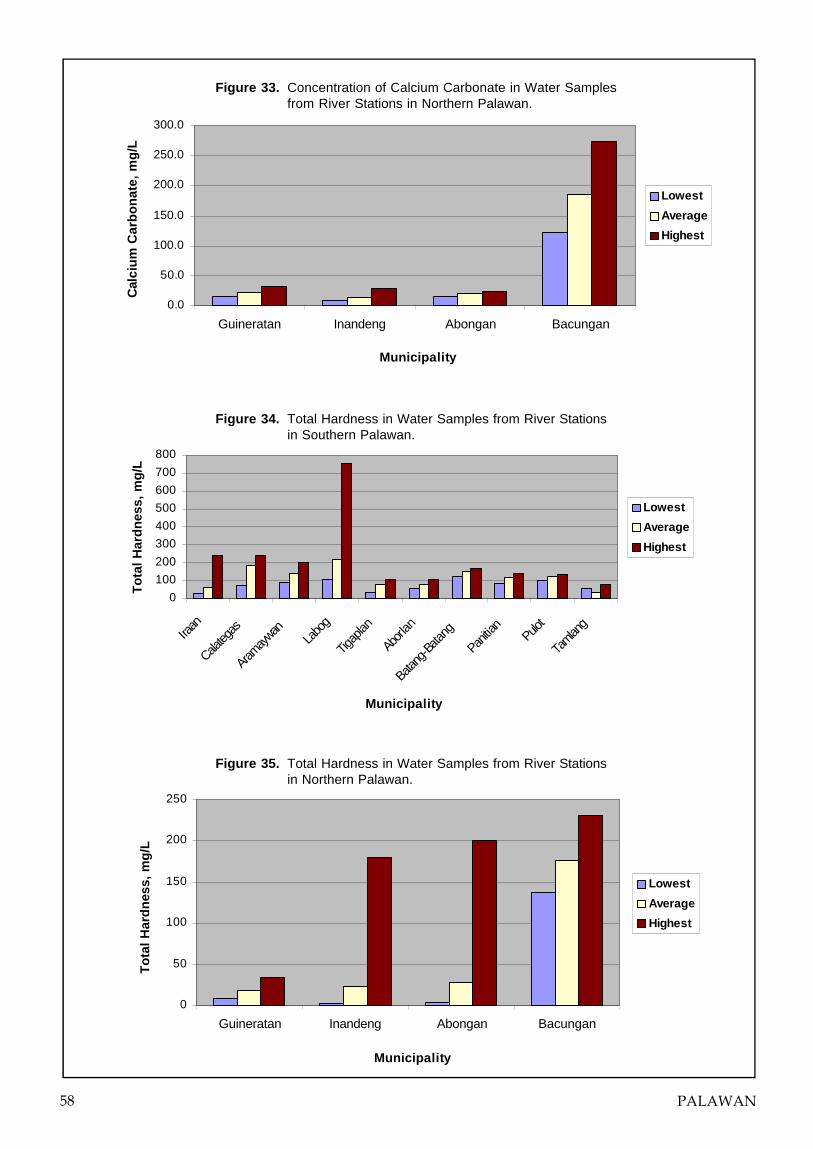
58 PALAWAN
Figure 33. Concentration of Calcium Carbonate in Water Samplesfrom River Stations in Northern Palawan.
0.0
50.0
100.0
150.0
200.0
250.0
300.0
Guineratan Inandeng Abongan Bacungan
Municipality
Cal
ciu
m C
arb
on
ate,
mg
/L
Lowest
Average
Highest
Figure 34. Total Hardness in Water Samples from River Stationsin Southern Palawan.
Figure 35. Total Hardness in Water Samples from River Stationsin Northern Palawan.
0
50
100
150
200
250
Guineratan Inandeng Abongan Bacungan
Municipality
To
tal H
ard
nes
s, m
g/L
Lowest
Average
Highest
0100200300400500600700800
Iraan
Calateg
as
Aramay
wanLa
bog
Tigap
lan
Aborl
an
Batang
-Batan
g
Panitia
nPulo
t
Tamlan
g
Municipality
To
tal H
ard
nes
s, m
g/L
Lowest
Average
Highest

STATE OF THE ENVIRONMENT 59
II. Executive Summ
a W
ater Resources
Batang-Batang River, Narra, partially supplies thewater requirments of the Narra alluvial plains,
Palawan’s widest paddy ricefield.
8.2.10 Total Hardness
Hardness represents the total concentration of calciumand magnesium expressed as their calcium carbonateequivalent. When other polyvalent metal ions are presentin significant amounts, they also are determined andreported as hardness.
Based on the results of analysis as shown on Figures 34(Southern Palawan) and 35 (Northern Palawan),Calategas and Iraan River had the highest value which is238 mg/L calcium carbonate and Guineratan River hadthe lowest value which is 8 mg/L. Further, as indicated,the hardness of water is lower during wet season comparedto the dry season because of dilution from rainfall.
8.3 NUTRIENTS
Nitrogen and phosphorous are major nutrients that movefrom land to bodies of water where they become part ofthe aquatic food chain. These nutrients are essential forgrowth but excessive inputs will cause eutrophication thattrigger algal blooms.
8.3.1 Nitrogen Nitrate and Nitrite
Nitrogen occurs in water as nitrate and nitrite ions andin cationic form as ammonium. Ammonium cations arestrongly absorbed on mineral surfaces while anionicspecies such as nitrate are readily transported in waterand are stable over a considerable range of conditions.
Figure 36. Concentration of Nitrogen-Nitrate in Water Samplesfrom River Stations in Southern Palawan.
Water samples from the sampling sites as illustrated inFigures 36, 37, 38 and 39 have nitrate concentrationsranging from 0.00 to 7. 5 mg/L. Inandeng River had thehighest value of nitrate (7.5 mg/L) while Iraan andGuineratan Rivers had the lowest (0 mg/L). Iraan,Inandeng and Abongan Rivers had the lowest value with0 mg/L nitrite concentration while Guineratan River hadthe highest value which is 0.119 mg/L. Higherconcentration of nitrate and nitrite were observed duringwet season possibly caused by the carabao and cowsusing the river as a temporary corral and leaving theleaching waste behind.
0.0
0.5
1.0
1.5
2.0
2.5
3.0
3.5
4.0
4.5
5.0
Iraan
Calateg
as
Aramay
wanLa
bog
Tigap
lan
Aborl
an
Batan
g-Bata
ng
Panit
ian Pulot
Tamlan
g
Municipality
Nit
rog
en-N
itra
te, m
g/L
(st
anda
rd:
max
. of
10)
Lowest
Average
Highest

60 PALAWAN
Figure 37. Concentration of Nitrogen-Nitrate in Water Samplesfrom River Stations in Northern Palawan.
Nit
rog
en-N
itra
te,
mg
/L(s
tan
dar
d:
max
. of
10)
0
1
2
3
4
5
6
7
8
Guineratan Inandeng Abongan Bacungan
Municipality
Lowest
Average
Highest
Figure 38. Concentration of Nitrogen-Nitrite in Water Samplesof River Stations in Southern Palawan.
Nit
rog
en-N
itri
te,
mg
/L(s
tan
dar
d:
max
. of
10)
Figure 39. Concentration of Nitrogen-Nitrite in Water Samplesfrom River Stations of Northern Palawan.
0.000
0.020
0.040
0.060
0.080
0.100
0.120
Guineratan Inandeng Abongan Bacungan
Municipality
Lowest
Average
Highest
Nit
rog
en-N
itri
te, m
g/L
(sta
nd
ard
: m
ax. o
f 10
)
0.00
0.02
0.04
0.06
0.08
0.10
0.12
Iraan
Calateg
as
Aramay
wanLa
bog
Tigap
lan
Aborl
an
Batan
g-Bata
ng
Panitia
nPulo
t
Tamlan
g
Municipality
Lowest
Average
Highest
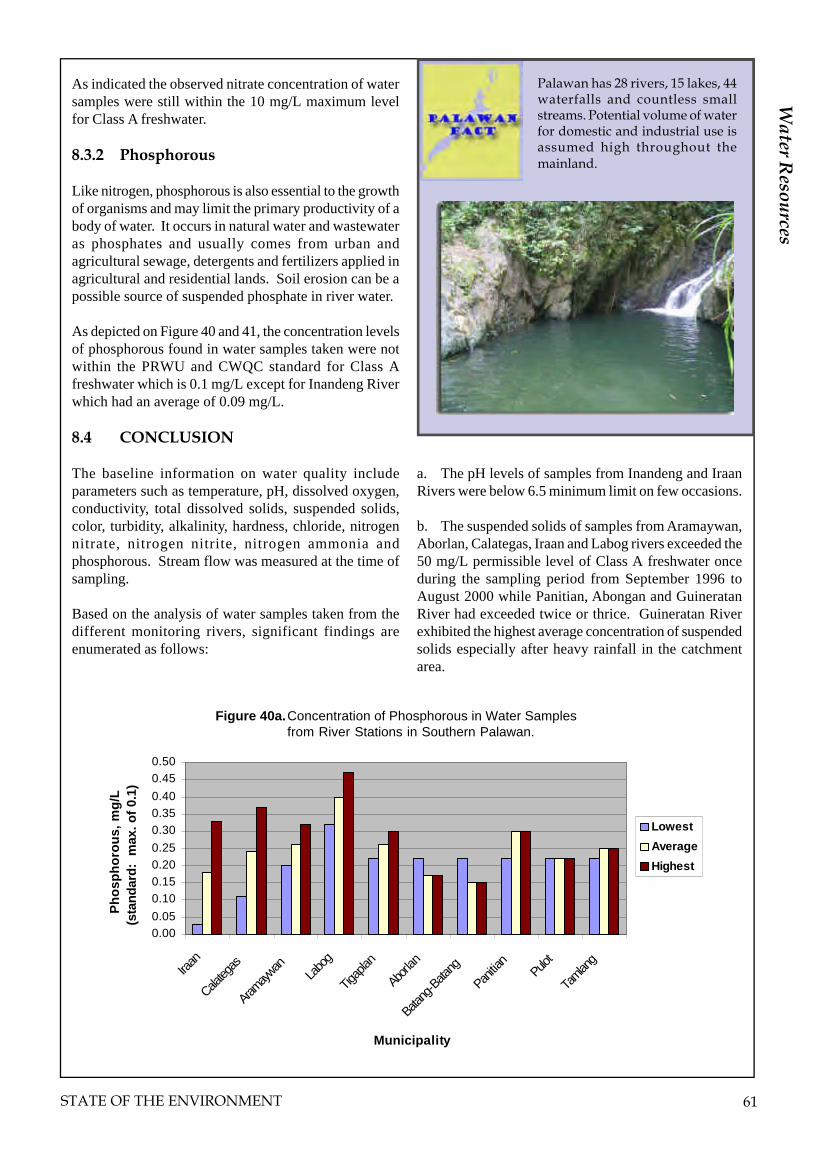
STATE OF THE ENVIRONMENT 61
II. Executive Summ
a W
ater Resources
As indicated the observed nitrate concentration of watersamples were still within the 10 mg/L maximum levelfor Class A freshwater.
8.3.2 Phosphorous
Like nitrogen, phosphorous is also essential to the growthof organisms and may limit the primary productivity of abody of water. It occurs in natural water and wastewateras phosphates and usually comes from urban andagricultural sewage, detergents and fertilizers applied inagricultural and residential lands. Soil erosion can be apossible source of suspended phosphate in river water.
As depicted on Figure 40 and 41, the concentration levelsof phosphorous found in water samples taken were notwithin the PRWU and CWQC standard for Class Afreshwater which is 0.1 mg/L except for Inandeng Riverwhich had an average of 0.09 mg/L.
8.4 CONCLUSION
The baseline information on water quality includeparameters such as temperature, pH, dissolved oxygen,conductivity, total dissolved solids, suspended solids,color, turbidity, alkalinity, hardness, chloride, nitrogennitrate, nitrogen nitrite, nitrogen ammonia andphosphorous. Stream flow was measured at the time ofsampling.
Based on the analysis of water samples taken from thedifferent monitoring rivers, significant findings areenumerated as follows:
a. The pH levels of samples from Inandeng and IraanRivers were below 6.5 minimum limit on few occasions.
b. The suspended solids of samples from Aramaywan,Aborlan, Calategas, Iraan and Labog rivers exceeded the50 mg/L permissible level of Class A freshwater onceduring the sampling period from September 1996 toAugust 2000 while Panitian, Abongan and GuineratanRiver had exceeded twice or thrice. Guineratan Riverexhibited the highest average concentration of suspendedsolids especially after heavy rainfall in the catchmentarea.
0.000.050.100.150.200.250.300.350.400.450.50
Iraan
Calateg
as
Aramay
wanLa
bog
Tigap
lan
Aborl
an
Batan
g-Bata
ng
Panit
ian Pulot
Tamlan
g
Municipality
Ph
osp
ho
rou
s, m
g/L
(sta
ndar
d:
max
. of
0.1)
Lowest
Average
Highest
Figure 40a.Concentration of Phosphorous in Water Samplesfrom River Stations in Southern Palawan.
Palawan has 28 rivers, 15 lakes, 44waterfalls and countless smallstreams. Potential volume of waterfor domestic and industrial use isassumed high throughout themainland.
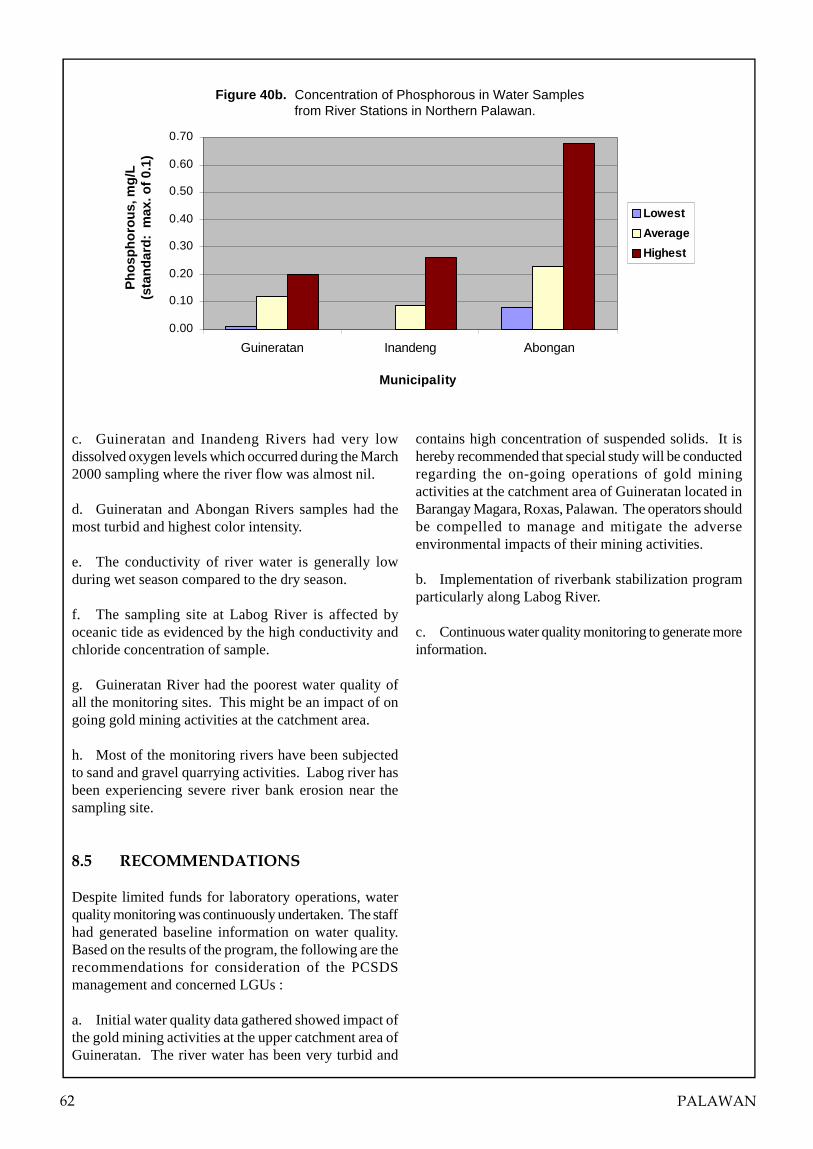
62 PALAWAN
Ph
osp
ho
rou
s, m
g/L
(sta
nd
ard
: m
ax. o
f 0.1
)
Figure 40b. Concentration of Phosphorous in Water Samples from River Stations in Northern Palawan.
0.00
0.10
0.20
0.30
0.40
0.50
0.60
0.70
Guineratan Inandeng Abongan
Municipality
Lowest
Average
Highest
c. Guineratan and Inandeng Rivers had very lowdissolved oxygen levels which occurred during the March2000 sampling where the river flow was almost nil.
d. Guineratan and Abongan Rivers samples had themost turbid and highest color intensity.
e. The conductivity of river water is generally lowduring wet season compared to the dry season.
f. The sampling site at Labog River is affected byoceanic tide as evidenced by the high conductivity andchloride concentration of sample.
g. Guineratan River had the poorest water quality ofall the monitoring sites. This might be an impact of ongoing gold mining activities at the catchment area.
h. Most of the monitoring rivers have been subjectedto sand and gravel quarrying activities. Labog river hasbeen experiencing severe river bank erosion near thesampling site.
8.5 RECOMMENDATIONS
Despite limited funds for laboratory operations, waterquality monitoring was continuously undertaken. The staffhad generated baseline information on water quality.Based on the results of the program, the following are therecommendations for consideration of the PCSDSmanagement and concerned LGUs :
a. Initial water quality data gathered showed impact ofthe gold mining activities at the upper catchment area ofGuineratan. The river water has been very turbid and
contains high concentration of suspended solids. It ishereby recommended that special study will be conductedregarding the on-going operations of gold miningactivities at the catchment area of Guineratan located inBarangay Magara, Roxas, Palawan. The operators shouldbe compelled to manage and mitigate the adverseenvironmental impacts of their mining activities.
b. Implementation of riverbank stabilization programparticularly along Labog River.
c. Continuous water quality monitoring to generate moreinformation.
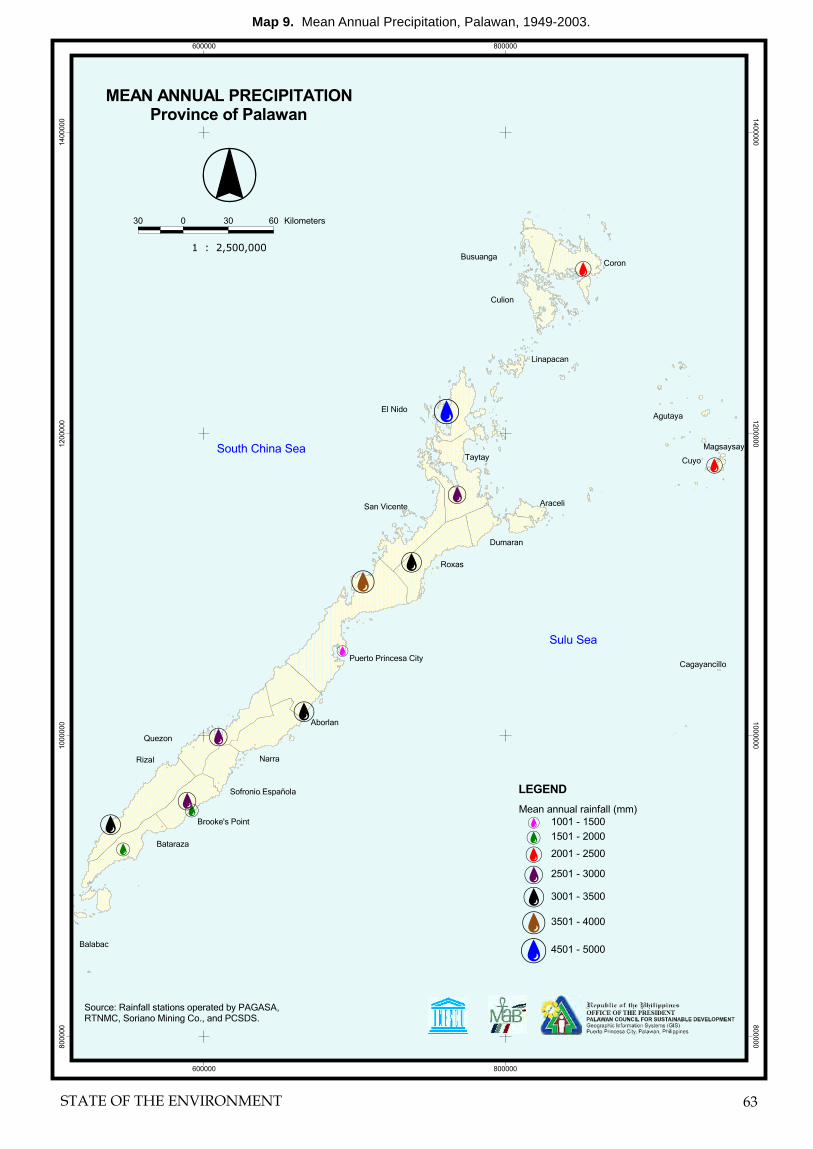
��
��
��
��
����
��
��
��
��
��
��
��
��
��
��
��
��
��
��
��
����
��
��
��
��
��
��
��
��
��
����
����
���� ����
����
�����
������
������
�����
������
�������
�����
������
�������
������
��������
�� �����
���������
���� ������
����������
����!�" �#����
��$������� ��%��
#������#����� ������
&�� �� ��
��������������������� ��������������������
�� � �� �� �������
���������������
������'�����$�� ������ �������������#�(���)��&�)���������&��������*)�����#����*
������������������������� ������������� �����������
�� �����������
�� �����������
�� �����������
�� �����������
�� �����������
������
�������������
�������
������
������
������
������
����
��������
����
��� �������
����
��� �������
����
��� �������
Map 9. Mean Annual Precipitation, Palawan, 1949-2003.
STATE OF THE ENVIRONMENT 63
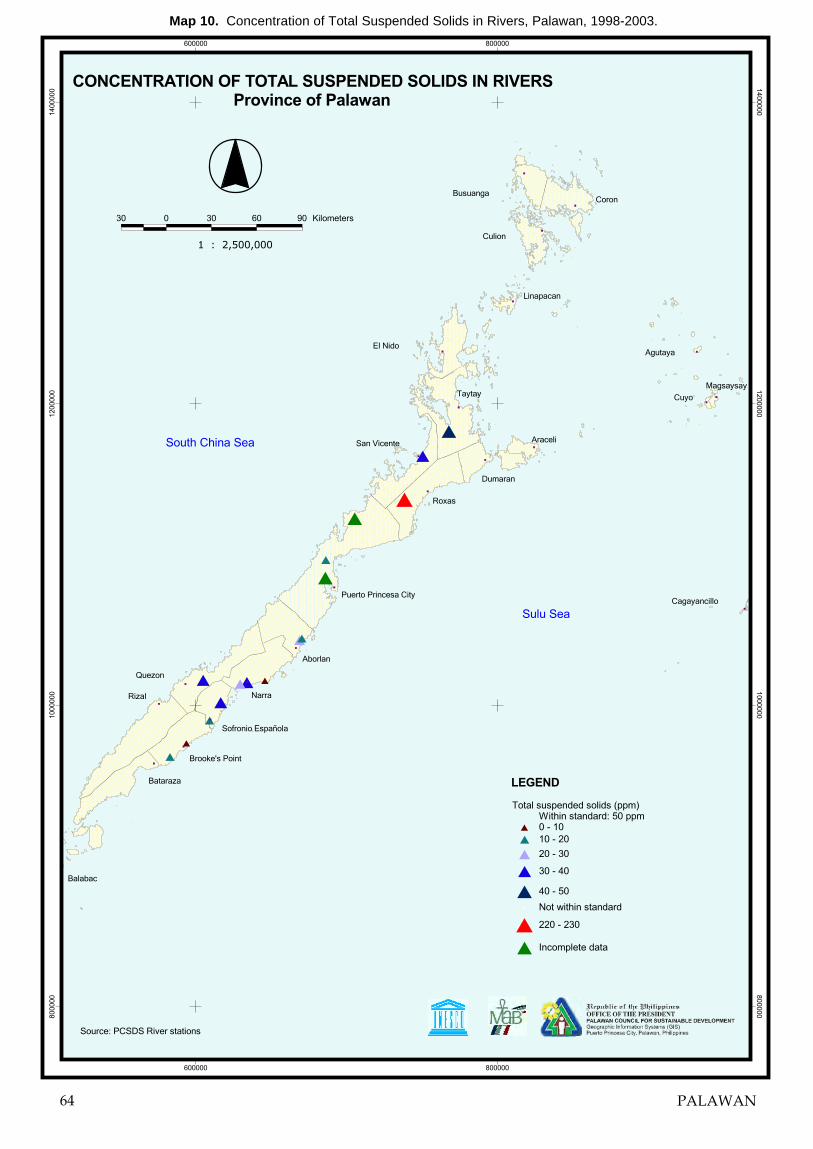
��
����
��
��
�
�
��
�
�
��
��
��
��
����
��
��
��
��
��
��
��
��
��
��
��
��
��
��
��
��
����
���� ����
����
�����
������
������
�����
������
�������
�����
������
�������
������
��������
�� �����
���������
���� ������
����������
����!�" �#����
��$������� ��%��
#������#����� ������
&�� �� ��
�������������������� ��������������������������������������
�� � �� �� �� ������
���������������
������'�#�������(��� ������
������ � ����� ���� ������������ ��������������
� ������� �������� �������� �������
� �������� ���� ������ �������
� ���������
� !�"���������
#�����$�����#�
#����#�
������
������
������
%�����
%�����
%�����
%������������ �������
������� �������
������� �������
Map 10. Concentration of Total Suspended Solids in Rivers, Palawan, 1998-2003.
64 PALAWAN

��
��
��
��
����
��
��
��
��
��
��
��
��
��
��
��
��
��
��
��
��
��
��
����
����
�
�
�
�
�
�
����
���� ����
����
�����
������
������
�����
������
�������
�����
������
�������
������
��������
�� �����
���������
���� ������
����������
����!�" �#����
��$������� ��%��
#������#����� ������
&�� �� ��������������
���������������
� � � � ����������
��������������������� ����� ���� ������� �����������������
������'�#�������(��� ������
���������������������������� ��������������� ������ � ���� � � ����� � �� ���
� � ����
� � ����� � !���"����������
� ��� �������
� #$����������
�������
�
�
%
%
%
%
�
�
�
�
�&
�&
������
Map 11. Concentration of Total Dissolved Solids in Rivers, Palawan, 1998-2003.
STATE OF THE ENVIRONMENT 65


STATE OF THE ENVIRONMENT 67
II. Executive Summ
aryC
oastal Resources
IX
COASTAL RESOURCES
9.1 MANGROVE FOREST
9.1.1 Importance of Mangroves
Mangroves are plants specially adapted to grow well inestuarine environments in their peculiar environment niche.Mangroves provide an array of benefits. They act asbuffers during storms providing storm shelter from strongwinds and wave action. They also act as filters, absorbingnoxious contaminants. Silt from floods and run-offs settleat the base of these wetlands preventing siltation of oceans,rivers and lakes. As a life support system, mangroveswamps also support a wide variety of fish and othermarine life, almost sixty-six percent (66%) of the seafoodwe eat are produced by this wetland (Tan 1992).Mangrove wetlands also serve as shelter for a variety ofwaterfowl and other birds.
Mangroves are likewise economically important.Traditionally, mangrove wetlands are not given muchimportance and were considered nuisance to be eliminated.Today, people are more aware that mangroves haveeconomic importance and are now considered a valuableresource that ought to be protected and conserved. InPalawan, mangrove trees are commonly utilized by localcommunities as materials for house and fence constructionand fishing gear fabrication, and as firewood and charcoal.The bark is also used as tuba wine clarifier and as a sourceof tannin and turpentine.
9.1.2 Mangrove Forest Cover
The Landsat data for the mangrove cover of the provinceexcluding Cuyo, Magsaysay, Agutaya, and Cagayancillobetween 1979 to 1998 is shown in Table 18. As indicated,from 1992 to 1998, an overall increase of 744 hectareswas observed. Some areas registered increase in mangrovecover during the intervening years from 1984 to 1998.Between the years 1979 and 1984, 450 ha of mangroveforest was lost which can be attributed to fishponddevelopment, a major cause of mangrove forest decline.
Mangrove forest of Malunao Island, Barangay SanJuan, Aborlan.
In 1992 the mangrove forest for mainland Palawan wasestimated at 36,193 hectares (Landsat Images, JAFTA,1992), a decline of 9,808 ha or 21.32% from that of themangrove forest cover in 1984 computed at 46,000.00ha (Satellite Images, 1984), Table 18. The rate ofreduction was placed at 1226/ha. A decline in themangrove forest cover between the years 1984 to 1992was recorded in the municipalities of Bataraza 4,4112ha (40.10%), Puerto Princesa 3,248 ha (44.50%),Brooke’s Point. 2,466 ha (91.35%), Quezon 1,908 ha(57.81%), Rizal 1,448 ha (38.10%), and El Nido 343ha (12.69%). However, there was an increase in themangrove areas in the municipalities of Espanola,Taytay, San Vicente, Narra, Aborlan, Roxas, andDumaran.
A slowdown in the destruction of mainland Palawan’smangrove forest was recorded after 1992 when theStrategic Environmental Plan for Palawan was signed intolaw and began to be implemented. Data showed thatmangrove forests in Palawan has improved from a

68 PALAWAN
Table 18. Mangrove Forest Cover, Palawan.
MANGROVE FOREST COVER
CHANGE IN COVER
Municipality 1979 1984
1992 1998 1979- 1984
1984- 1992
1992-1998
Mangrove Mangrove Fish pond Mangrove
Fish pond Mangrove
Fish pond Ha. Ha. Ha.
MAINLAND 46,450 46,000 450 36,193 170 38,278 1,812 -450 -9,807 2,085
Bataraza 11,100 11,000 6,588 5,738 -100 -4,412 -850
Brooke's Pt. 2,350 2,700 150 234 524 23 350 -2,466 291
Rizal 3,800 2,352 3,066 3,800 -1,448 714
Espanola 834 67 1,499 340 834 665
Pto. Prin. 8,050 7,300 150 4,052 103 5,995 530 -750 -3,248 1,943
Taytay 6,340 6,400 6,510 5,466 125 60 110 -1043
San Vicente 1,400 800 995 1,469 43 -600 195 474
Narra 1,200 600 100 859 1,031 152 -600 259 172
Aborlan 1,000 900 1,183 1,391 78 -100 283 208
Quezon 5,350 3,300 1,392 2,753 287 -2050 -1,908 1,361
Roxas 3,000 2,900 50 3,512 2,028 0.09 -100 612 -
-1484
El Nido 3,110 2,700 2,357 2,381 -410 -343 24
Dumaran 3,550 3,600 5,325 4,937 234 50 1,725 -388
ISLAND 14,409 13,068 -1340
Culion 2,558 2,251 -306
Coron 2,051 2,139 88
Busuanga 1,405 1,512 107
Araceli 2,735 2,680 -55
Linapacan 2,798 375 -2423
Balabac 2,862 4,111 1,249 GRAND TOTAL 46,450 46,000 450 50,602 170 51,346 1,812 -450 -4,601 747 Sources: Satellite Images, 1979 and 1985, Mainland Palawan Landsat Images, JAFTA,1992 Landsat Images, 1998
declining rate of 1,266ha/yr from 1984 to 1992 (mainlandPalawan) to an increasing rate of 124 ha/yr. from 1992to 1998 (whole Province except Cuyo, Agutaya,Magsaysay and Cagayancillo). However, there arecertain municipalities that manifested reduction in coverand these include Araceli 55 ha (2%), Bataraza 850 ha(16.3%), Culion 307 ha (13.6%), Dumaran 388 ha(7.3%), Linapacan 2,423 ha (86.6%), Roxas 1,484 ha
(42.2%) and Taytay 1,044 ha (16%). Related fishpondareas which are usually converted mangrove forestsincreased to 1,812 in 1998 from only 170 ha in 1992.
9.1.3 Species Composition and Diversity
While there are a total of 47 “true mangrove species”and associated species belonging to 26 families (Melana
744
-1,341

STATE OF THE ENVIRONMENT 69
II. Executive Summ
aryC
oastal Resources
Table 19. Number of True Mangrove Species Found Per Municipality, Palawan.
Municipalities Number of Species Aborlan 15 Busuanga 16 Araceli 13 Coron 13 Culion 14 Dumaran 17 Española 16 Narra 15 Roxas 17 San Vicente 12 Brooke's Point 10 Quezon 9 Magsaysay 8 El Nido 13 Bataraza 14 Cuyo 10 Rizal 13 Taytay 16
Table 20. Species Diversity Index (SDI), Mangrove Forest, Palawan.
Shannon Weiner Index (SDI)
Municipality Highest Value Location Lowest Value Location Aborlan 2.0900 Apo-aporawan River 0.0700 Calver Point Bataraza 1.6923 Iwahig I 0.6852 Rio Tuba Culion 1.5310 Piday 0.0030 Ugnisan Cuyo 1.9868 San Carlos Bay 0.2771 Maringien Dumaran 1.5313 Danleg 0.3350 Baras Bay El Nido 1.7896 Teneguiban 0.2905 Devil River Espanola 2.0551 Punang I 0.3768 Isumbo Magsaysay 1.4153 Adunbrat Island 0.6193 Los Angeles Narra 1.9400 Raza Island II 0.0000 Banking Island Quezon 1.3480 Tagusao River 0.1990 Iwahig River Rizal 1.4793 Campung Ulay 0.8314 Culasian Roxas 2.0700 Tumarabong 0.4700 Flat Island I
and Gonzales 1996), the Philippines has around 28 “truemangrove species” (Field Guide to the Identification ofSome Mangrove Plant Species in the Philippines-Ecosystem Research and Development Service, Region7. Fishery Sector Program-DENR) under 19 families. Theresource inventory for the mangrove forest of the provinceinvolving eighteen (18) out of the twenty four (24)municipalities revealed a total of 23 “true mangrove”
species belonging to 11 families. As shown in Table 19,the maximum number of true mangrove species in a singlemunicipality was recorded at seventeen (17), found inthe Municipalities of Dumaran and Roxas while thelowest at eight (8) was documented in Magsaysay.
Appendix E-1 shows the list of mangrove species foundin each municipality surveyed.
The species diversity was further measured using theShannon Weiner Index (SDI). As indicated in Table 20,the municipality of Aborlan has jurisdiction over Apo-aporawan River where the highest SDI at 2.09 wasrecorded. On the other hand, the municipality of Narrahas site Mainland III with the lowest level of speciesdiversity having an SDI of zero, indicating that only onemangrove species was encountered in the site. Generally,most of the survey sites have relatively high speciesdiversity indicating stability in the face of man-madenatural perturbations since stability is more correlatedwith diversity than productivity.
9.1.4 Relative Dominance
Based on the total area occupied by a species as indicatedby the computed stand basal area, the species Rhizophoraapiculata (bakawan-lalake), Sonneratia alba (pagatpat)and Brugueira gymnorrhiza (Busain) dominate the truemangrove flora of Palawan. In particular, as illustratedin Table 21, Aborlan (26.52%), Quezon (71.60%),Dumaran (56.38%), Bataraza (42.64%), El Nido(60.27%) and Culion (48.31%) municipalities aredominated by Rhizophora apiculata while themunicipalities of Cuyo (40.47%) and Magsaysay(75.15%) were dominated by Sonneratia alba. Themunicipalities of Roxas, Sofroñio Española and Narrawere dominated by Brugueira gymnorrhiza at 23.29%,20.69% and 20.29% respectively.
9.1.5 Relative Density
Referring to Table 22 the species with the highest relativedensity per site include R. apiculata for the municipalities

70 PALAWAN
Table 21. Species Relative Dominance, Mangrove Forest, Palawan.
Relative Dominance, % Municipality Highest Species Lowest Species
Aborlan 26.5200 R. apiculata 0.03 B. cylindrica Bataraza 42.6400 R. apiculata 0.03 H. littoralis Culion 48.3051 R. apiculata 0.21 B. cylindrica Cuyo 40.4655 S. alba 0.01 C. tagal Dumaran 56.3800 R. apiculata 0.02 F. sylvatica El Nido 60.2700 R. apiculata 0.03 H. littoralis Magsaysay 75.1500 S. alba 0.17 C. tagal Narra 20.2900 B. gymnorrhiza 0.07 H. littoralis Quezon 71.6000 R. apiculata 0.01 A. corniculatum Rizal 55.5100 R. apiculata 0.01 B. cylindrica Roxas 23.2880 B. gymnorrhiza 0.01 B. parviflora Sofronio Espanola 20.6900 B. gymnorrhiza 0.03 H. littoralis
Table 22. Species Relative Density, Mangrove Forest, Palawan. Municipality Highest Species Lowest Species
Aborlan
33.73
R. apiculata
0.040
A. marina
Bataraza 48.84 R. apiculata 0.060 L. racemosa Culion 50.97 R. apiculata 0.002 B. sexangula Cuyo 34.09 Avicennia marina 0.150 Aegiceras floridum Dumaran 63.09 R. apiculata 0.050 F. sylvatica; A. corniculatum El Nido 60.76 R. apiculata 0.040 H. littoralis Magsaysay 37.43 S. alba 0.520 C. tagal, X. granatum Narra 32.14 Ceriops tagal 0.130 H. littoralis,
A. corniculatum Quezon 73.74 R. apiculata 0.174 S. alba, A. corniculatum, C.
tagal Rizal 56.33 R. apiculata 0.140 B. cylindrical Roxas 29.64 R. apiculata .0344 B. parviflora S. Española 19.19 R. apiculata
0.040 Avicennia officinalis,
Xylocarpus moluccensis
of Rizal (56.33%), Quezon (73.74%), Dumaran(63.09%), Aborlan (33.73%), Culion (50.97%), S.Española (19.19%), El Nido (60.76%), Roxas (29.64%)and Bataraza (48.84%); C. tagal for the municipality ofNarra (32.14%); Sonneratial Alba for the municipalityof Magsaysay (37.43%) and Aviscenia marina for Cuyo(34.091%).
9.1.6 Tree Density
Palawan mangrove forests are not only rich in speciescomposition but are also thick in stands. Of the tenmunicipalities surveyed, Dumaran exhibited the highestaverage tree density placed at 4,910 trees/hectare whileRizal has the lowest at 1,171 trees/hectare. BarangayBohol, the site with the highest density placed at 8,500trees/hectare is located in Dumaran while Ransang, thesite with the lowest density at 112 trees/ha, is found inRizal.
Figure 41 demonstrates the comparative average treedensity per hectare mangrove forest stand in themunicipalities covered by the survey while Table 23 showsthe sites with the highest and lowest tree density in eachmunicipality covered by the survey.
In terms of tree sizes as indicated by the average diameterat breast height (dbh) of the mangrove trees contained inthe survey plots, Quezon municipality exhibited thehighest average dbh at 16.23 cm indicating that themangroves therein are relatively older and more mature.The lowest average dbh of 7.77 cm was registered in themunicipality of Culion indicating that the mangrove thereinare relatively young. Among the eighty (80) survey sites,Aporawan River of Aborlan manifested the highest averagedbh at 29.73 cm. while the lowest dbh of 4.93 cm. wasregistered by site Tagpait of Aborlan. Table 24 illustratesthe average diameter at breast height of mangroves treesin each municipality covered by the survey.
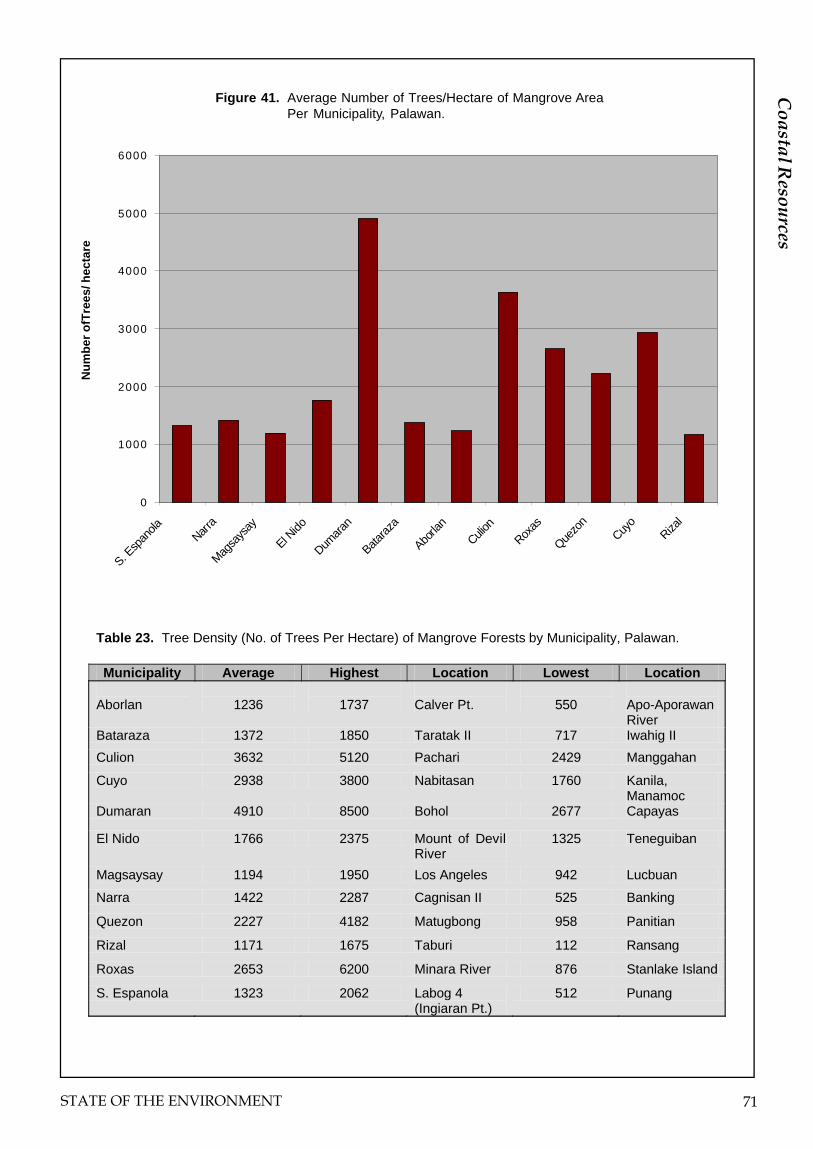
STATE OF THE ENVIRONMENT 71
II. Executive Summ
aryC
oastal Resources
0
1000
2000
3000
4000
5000
6000
S. Esp
anola
Narra
Magsa
ysay
El Nido
Dumara
n
Bataraz
a
Aborla
nCuli
onRox
as
Quezo
nCuy
oRiza
l
Nu
mb
er o
fTre
es/ h
ecta
reFigure 41. Average Number of Trees/Hectare of Mangrove Area
Per Municipality, Palawan.
Table 23. Tree Density (No. of Trees Per Hectare) of Mangrove Forests by Municipality, Palawan. Municipality Average Highest Location Lowest Location
Aborlan
1236
1737
Calver Pt.
550
Apo-Aporawan River
Bataraza 1372 1850 Taratak II 717 Iwahig II
Culion 3632 5120 Pachari 2429 Manggahan
Cuyo 2938 3800 Nabitasan 1760 Kanila, Manamoc
Dumaran 4910 8500 Bohol 2677 Capayas
El Nido 1766 2375 Mount of Devil River
1325 Teneguiban
Magsaysay 1194 1950 Los Angeles 942 Lucbuan
Narra 1422 2287 Cagnisan II 525 Banking
Quezon 2227 4182 Matugbong 958 Panitian
Rizal 1171 1675 Taburi 112 Ransang
Roxas 2653 6200 Minara River 876 Stanlake Island
S. Espanola 1323 2062 Labog 4 (Ingiaran Pt.)
512 Punang

72 PALAWAN
Table 25. Seedling Density, Mangrove Forest, Palawan.
Municipality Highest Location Lowest Location Average Aborlan 108,750 Tagpait 8750 Puntog Island 57,500 Bataraza 32,500 Igang-Igang 1,667 Rio Tuba II 17,807 Culion 14,073 Chindonan 400 Kabulihan II 4,867 Cuyo 10,067 Maringian 300 Nabitasan 3,282 Dumaran 5,665 Pulain Bay 0 Bohol 3,048 El Nido 162,500 Teneguiban 0 San Fernando,
Barok and Pinamudian
2,097
Magsaysay 12,500 Los Angeles 6,667 Adumbrat River Poblacion
11,875
Narra 72,500 Cagnisan II 2,000 Linda Island 23,644 Quezon 11,894 Matugbong I 145 Matugbong II 909 Rizal 65,833 Puntabaja 5,500 Canipaan 14,597 Roxas 12,160 Taradungan 0 Tumarbong 3,867 S. Española 106,250 Pulot Shore 0 Gardener 37,634
Table 24. Average diameter at breast height (dbh) by Municipality, Palawan.
Average Diameter at Breast Height, cm
Municipality
Highest
Site
Lowest
Site Grand Mean
Aborlan
29.73
Aporawan River
4.93
Tagpait
14.95
Bataraza Culion
16.64 11.92
Iwahig II Koring-Koring
9.01 6.44
Rio Tuba I Ditopiac
11.89 7.77
Cuyo 26.58 Balading 7.12 San Carlos Bay, Tandol
11.30
Dumaran 15.17 Danleg 8.66 Poblacion 12.03 El Nido 12.84 Teneguiban 8.63 Devil River 9.73 Magsaysay 18.04 Adumbrat Is. 7.06 Lucbuan 11.64 Narra 22.09 Banking Island 8.39 Caguisan 12.09 Quezon 24.57 Tagdarangin
Odiong Creek 8.34 Malanot II 16.23
Rizal 23.32 Puntabaja 10.80 Taburi 15.86 Roxas 28.57 Barbacan R. 8.78 Minara R. 13.44 S. Espanola 14.93 Punang I 7.37 Pulot Shore 10.32
9.1.7 Seedlings and Saplings
Findings of the resource assessment as indicated in Figure42 also show that seedlings and saplings density arerelatively high in Aborlan, Narra, S. Española,Bataraza, Magsaysay and Rizal suggesting a disturbedstate of most mangrove communities therein. Theunderlying principle is that disturbed conditions ofmangroves due to cutting and clearing directlycontributes to seedlings and sapling count as propagulesare able to recolonize these areas because of the low levelof competition for sunlight and root space.
On one end, mangrove areas of Dumaran, Cuyo, Roxas,Quezon and Culion municipality having relatively lowseedling and sapling densities may be said to be lessdisturbed. Highest seedling density at 162,500
individuals/ha was registered in site Teneguiban of ElNido while the lowest at zero was documented in sitesBohol in Dumaran; Tumarabong in Roxas; Gardener inEspanola; and San Fernando, Barok and Pinamudian inEl Nido. In terms of sapling density, highest at 29,733individuals/ha was in Pinataray River in SofroñioEspañola while that lowest at zero was documented in12 sites (see Table 26).
Seedling and sapling count also indicate ability ofmangrove stands for natural regeneration. As surveyresults show, the disturbed mangroves of Aborlan, Narra,Rizal, Magsaysay, Bataraza and Española have in generalbetter potential for natural regeneration. Thus,intervention such as reforestation may no longer benecessary provided such degraded areas be protected

STATE OF THE ENVIRONMENT 73
II. Executive Summ
aryC
oastal Resources
Table 26. Sapling Density, Mangrove Forest, Palawan.
Municipality Highest Location Lowest Location Average Aborlan
15,400
Tagpait
0
Calver Point/Aporawan River
2,670
Bataraza 4,133 Iwahig II 0 Buliluyan, Malunao Island
1,046
Culion 4,686 Korin II 0 Kabulihan II 1,351
Cuyo 2,400 Kaniki 36 Balading 602
Dumaran 4,389 Ilian River 0 Banas Bay 1,764
El Nido 7,467 San Fernando 133 Pinamudian 3,910
Magsaysay 2,400 Rizal 2,267 Lucbuan, Adumbrat
1,050
Narra 25,200 Cagnisan II 400 Rasa II 6,312
Quezon 6,568 Matugbong I 0 Marikit Island 405
Rizal 3,300 Panalingaan 0 Canipaan 1,277
Roxas 3,733 Minara River 0 Tumarbong 2,305
S. Española 29,733 Pinataray River 0 Bessie, Gardiner, Isumbo
6,257
Figure 42. Seedling and Sapling Density of Mangroves by Municipality, Palawan.
0
10000
20000
30000
40000
50000
60000
70000
Espa
nola
Narra
Magsa
ysay
El Nido
Dumara
n
Batar
aza
Aborl
anCulio
nRox
as
Quezo
nCuy
oRiza
l
Seedling
Sapling
About 40% of the 117,000hectares (DENR 1995) ofremaining mangrove forestcover of the Philippines occur inPalawan.

74 PALAWAN
Table 27. Seagrass Status Distribution by Category, Palawan.
Site
Total No. of Survey Site
Excellent
Good
Fair
Poor
Year
Aborlan 7 0 2 3 2 2003 Agutaya 10 1 4 3 2 2002 Araceli 10 0 4 4 2 2003 Bataraza 12 1 1 4 6 2003 Brooke’s Point 6 0 3 2 1 2001 Busuanga 15 0 1 5 9 1999 Coron 2 0 1 1 0 1999 Culion 21 0 0 3 18 1999 Cuyo 11 0 7 4 0 2003 Dumaran 16 1 3 7 5 2001 El Nido 14 0 4 3 7 2002 Magsaysay 10 1 2 4 3 2002 Narra 12 0 1 8 3 2002 Quezon 13 0 2 2 9 2001 Rizal 17 0 5 5 7 2003 Roxas 8 0 1 3 4 2004 S. Española 6 0 2 2 2 2001 San Vicente 10 1 2 1 6 2000 Taytay 16 1 0 11 4 2001
Total 216 6 45 75 90
PERCENTAGE 100 2.78 20.83 34.72 41.67
from further destructive activities and be allowed torecover naturally without disturbance.
9.1.7 General Observations
Despite the declaration of Palawan as a MangroveSwamp Reserve, human-induced perturbations wereobserved during the surveys. Evidence of mangrovecuttings and clearings to give way to fishponddevelopment were noted in certain survey sites. Also,signs of mangrove natural regeneration were evident incertain disturbed mangrove communities as indicated bythe high sapling and seedling count reaching as high as162,500 per hectare obtained in these areas. Mangrovestands having close canopies, an indication of its goodcondition, were also encountered during the assessment.Sighting of saltwater crocodiles (Crocodylus porosus)at numerous sites i.e. Panitian River (Narra), DipuyaiRiver (Busuanga), Bolog River (Araceli), Decala River(San Vicente), Buding River (San Vicente) and DarapitanRiver (San Vicente) were also reported.
9.2 SEAGRASS AND SEAWEEDSCOMMUNITY
9.2.1 Importance of Seagrass and Seaweeds
Seagrass are submerged flowering plants of the marineenvironment which generally thrive in shallow water
coastal areas and are adapted to live in a saline medium.Seagrass are ecologically important for they serve asnursery and breeding grounds and source of food for fish,turtles, dugong and other aquatic invertebrates. Theyinteract with coral reefs and mangroves in reducing waveenergy and regulating water flow. Due to the thicknessof their underground root systems, they are effectivesediment retainers and binders hence serving as bufferagainst wave action and storm surges (Fortes 1995).Economically, seagrass are also important because theyare used as upholstery and packing materials, stuffing ofmattresses, compost for fertilizers, materials for weavingbaskets and many others.
Syringodium isoetijolium, Cymodacea totundata, andThalassia hemprichii. Barangay Binudac, Culion.

STATE OF THE ENVIRONMENT 75
II. Executive Summ
aryC
oastal Resources
Seaweeds like seagrass are similarly important marineresources. They perform a vital role in primaryproduction and growth of the reef system. They serve ashabitats to lots of marine organisms and as food not onlyto fish and aquatic invertebrates but also to man.Economically, seaweeds are good source of chemicalsand gels and are used in manufacturing some of our dailycommodities.
9.2.2 Seagrass
9.2.2.1 Vegetative Cover
Seagrass meadows are one of the marine resources ofPalawan that is vital to the preservation of the dugongs(Dugong dugon), already an endangered species as listedin the IUCN and CITES. The protection of this importantresource is paramount not only to maintain biodiversitybut also to sustain fishery production.
Results of the analysis of the percent vegetative cover usingthe Quadrat Sampling method is illustrated in Figure 43below. As shown in Table 27, out of the 216 sites,only 6 sites or 2.78% were in excellent condition (76-100% percent vegetative cover), 45 sites or 20.83 percentin good condition (51-75% vegetative cover), and 75 sitesor 34.72 percent considered in fair vegetative cover. Theremaining 90 sites or 41.67% were classified as poor incondition (0-25% vegetative cover). Notwithstanding thegeneral poor condition of the seagrass beds covered bythe survey, Dugongs are still believed to graze thereon asevidenced by the presence of their feeding trenches incertain sites. Map 12 shows the location of the seagrassbeds where feeding trenches of Dugong were noted.
9.2.2.2 Density
The density measured in terms of the number ofindividuals per square meter was computed for all thesample sites. As illustrated in Table 28, the mostdense sites include Maraquit in Araceli with 12,946individuals/m2, Mambalot in Brooke’s Point with 12,392individuals/m2. Least dense sites comprise Isugod inQuezon at 6 individuals/m2, Albaguen Island in SanVicente with 13 individuals/m2, Batacalan in El Nidowith 34 individuals/m2, Mariquit in Aborlan with 37individuals/m2.
9.2.2.3 Species Composition and Diversity
The Philippines has sixteen (16) identified seagrassspecies of which thirteen (13) were found in the surveysites under two families with two unidentified speciesunder the genera Halophila. However, the number ofspecies found in each seagrass community or sample siteranged only from one (1) to ten (10). Incidentally, therewere two species Thalassodendron ciliatum andHalophila decipiens which were recorded only in the
Figure 44. Condition of Seaweeds Community by Category, Palawan.
Thalassodendron ciliatum. Barangay Bonog, Rizal.
Figure 43. Distribution of Seagrass Community Condition by Category, Palawan.
Fair34.72%
Good20.83%
Excellent2.78%Poor
41.67%
Poor89.74%
Fair7.18%
Excellent0.51%
Good2.57%

76 PALAWAN
Table 28. Density (No. of Individuals/m2) of Seagrass Communities, Palawan.
Municipality Average Highest Value
Location Lowest Value
Location
Aborlan 385 681 Sombrero Is. 37 Mariquit Agutaya 806 1744 Central 466 Algeciras Araceli 2932 12946 Maraquit 112 Capansanlan Bataraza 434 1580 Tagbila 66 Taratak Brooke’s Point 7598 12392 Mambalot 680 Oring-oring Busuanga 888 3885 Punda 24 Sagrada Coron 1497 2303 North Bulalakaw 692 Colbi Culion 594 3114 Deborda 46 Baldat Cuyo 794 1758 Caponayan 385 Manamoc Dumaran 456 1219 Capayas 60 Pangolasian El Nido 540 946 Buluang 34 Batacalan Magsaysay 780 1403 San Carba 247 Los Angeles Narra 626 1841 Cudil 222 Aramaywan Quezon 119 415 Tabon 6 Isugod Rizal 1275 3236 Tabionan 120 Sinadayang Roxas 1440 4256 South Verde Is. 88 Flat Island S. Española 417 927 Gardiner 206 Bintangan Is. San Vicente 717 2662 Boayan Is. 13 Albaguen Is. Taytay 3694 16236 Poblacion 122 Canique
municipality of San Vicente. Seagrass species found inthe different municipalities covered by the surveys arelisted in Appendix E-2.
In the context of species diversity as measured using theShannon Diversity Index (SDI), the best site is Casian inTaytay municipality which registered the highest SDIcomputed at 2.09. Sixteen of the sites registered zeroSDI which indicate the presence of only one (1) species.Table 29 shows the highest and lowest diversity indicesof the seagrass communities in each of the municipalitiescovered by the various surveys.
9.2.3 Seaweeds
9.2.3.1 Vegetative Cover
Seaweeds can be found to occur in seagrass beds althoughat times such associations were absent. Results ofassessment in 195 sites where seaweeds were present asshown on Table 30 indicate that only one site (Tagusao inQuezon municipality) or 0.51% was classified as excellentin terms of relative abundance measured as percentvegetative cover. Also, five sites (Sta. Monica, Sibaltan,Buluang and Palabuayan of El Nido; and B. Honda Pt.in Quezon) or 2.57% were classified as good and fourteen
(14) sites or 7.18% were considered fair in vegetativecover. The remaining 175 sites or 89.74% were classifiedas poor in vegetative cover.
Figure 44 is a graphical presentation of the percentagedistribution across condition categories of seaweedcommunities in Palawan.
9.2.3.2 Species Composition and Diversity
A total of 69 species belonging to 20 families and 4 classeswere recorded for the nineteen surveyed municipalities.The highest number of species encountered in one sitewas 29 and was documented at Binolican in Taytay andSiabtabon in Araceli. Two species namely Halimedamacroloba and H. opuntia were notably present in all ofthe survey sites. Appendix E-3 lists the seaweed speciesencountered during the surveys in the differentmunicipalities of Palawan.
The most diverse sites as indicated by the computedShannon Diversity Index (SDI) were Binolican in Taytaywith SDI of 2.86, Bantayan in Busuanga with SDI of2.39 and Pangolasian in Dumaran with SDI of 2.36. Theleast diverse sites with SDI of zero (only one specieswas encountered) were: Gardiner’s Island and Labog inS. Espanola; Salvacion and Punda in Busuanga; Cabuyao,Baldat, and Lamud in Culion; Poblacion in Araceli;Poblacion, Port Barton, Albaguen Is., and Gawid in SanVicente; Tagusao, B. Honda Pt., Tinagong Pati, Mariquitand Tabon in Quezon; Linda Island and Caguisan inNarra; Central in Agutaya; and Lucbuan in Magsaysay,Caponayan in Cuyo and Tagpait and Cutter Point inAborlan (Refer to Table 31).
Seagrasses are particularly morevulnerable as a resource than areseaweeds. They respond to thenegative impacts of eutrophication,siltation and toxic chemicals.

STATE OF THE ENVIRONMENT 77
II. Executive Summ
aryC
oastal Resources
Table 29. Species Diversity of Seagrass Communities, Palawan.
Shannon Weiner Index Municipality Highest Location Lowest Location
Value Value Aborlan Agutaya
1.90 1.91 1.51
Malunao Puntog Central
1.43 0.00 0.47
Puntog Marikit Pt. Villasol
Araceli 1.77 Dagman 0.00 Capansanlan
Bataraza 1.73 Sapa 0.10 Gull Reef
Brooke's Point 1.29 Maasin 0.38 Oring-oring
Busuanga 1.73 Punda 0.00 Coral Bay, Sagrada,
Cuyo 1.86 Basacar 0.75 Capanayan
Dumaran 1.72 Bacao 0.30 Cagsaleng
El Nido 1.95 Sta. Monica 0.11 Batacalan
Magsaysay 1.7 Canipo 0.94 Bodavan
Narra 1.91 Rasa Is. 0.61 George Island
Quezon 1.89 Nakoda Island 0.00 Double Is., Mariquit, Hummock Pt., Isugod and Tagusao
Rizal 1.79 Tinugpan 0.00 Sinadayang
Roxas 1.75 Green Island 0.00 Flat Island
S. Española 1.67 King's Paradise/ Arrecife Island
0.39 Sand Bar
Taytay 2.09 Casian 0.00 Canique, Langnayan
Table 30. Distribution of Condition Categories of Seaweed Communities by Municipality, Palawan.
Site Total No. of Survey Site
Excellent
Good
Fair
Poor
Year
Coron 2 0 0 0 2 1999 Busuanga 9 0 0 0 9 1999 Culion 19 0 0 0 19 1999 Roxas 8 0 0 0 8 2004 Araceli 9 0 0 2 7 2000 San Vicente 9 0 0 2 7 2000 Taytay 15 0 0 1 14 2000 Brooke’s Point 7 0 0 2 5 2000 Dumaran 14 0 0 1 13 2001 Sofroñio Española 6 0 0 0 6 2001 Quezon 10 1 1 2 6 2001 Narra 12 0 0 0 12 2002 El Nido 14 0 4 3 7 2002 Magsaysay 10 0 0 0 10 2002 Agutaya 10 0 0 1 9 2002 Bataraza 10 0 0 0 10 2003 Cuyo 11 0 0 0 11 2003 Aborlan 6 0 0 0 6 2003 Rizal 14 0 0 0 14 2003
Total 195 1 5 14 175 Percentage 0.51 2.57 7.18 89.74

78 PALAWAN
Table 31. Species Diversity of Seaweed Communities, Palawan.
Shannon Weiner Index
Municipality Highest Site Lowest Site Value Value
Aborlan Agutaya
1.87 2.27
Malinao Island Algeciras
0 0
Tagpait, Cutter Point Central
Araceli 2.25 Taloto 0.00 Poblacion Brooke's Point 1.44 Maasin 0.19 Oring-oring Busuanga 2.39 Bantayan 0.00 Salvacion, Punda Coron 1.57 Bulalakaw 0.99 Colbi Island Culion 1.84 Botnongan 0.00 Lamud, Cabuyao, Baldat Cuyo 2.38 Balading 0 Caponayan Dumaran 2.36 Pangolasian 0.21 Capayas El Nido 1.91 Sibaltan Island 0.11 Batcalan Magsaysay 2.19 Caymamis; Cocoro 0 Lucbuan Narra 1.86 Burirao; Aramaywan 0 Linda and Caguisan Quezon 0.81 Nakoda Island 0.00 Tagusao, B. Honda Pt.,
T. Pati, Mariquit and Tabon Rizal 1.43 Tinagpan 0 Tabionan Roxas 2.12 Stanlake Island 0.51 Punao Island S. Española 2.5 Bintaugan 0.00 Gardiner's Island, Labog San Vicente 1.62 Kemdeng 0.00 Poblacion, Port Barton,
Gawid and Albaguen Island Taytay 2.86 Binolican 0.19 Batas I
9.3 CORAL REEF
9.3.1 Importance of Corals
Corals are communities of small animals called polypswhich feed on algae and bacteria found in tropical waters.Coral reefs are made up of calcium carbonate skeletonsthat are cemented together by calcareous algae and otherorganisms. Corals need warm, clear water to developsuch as those waters found in the Philippines.
Most corals found around Palawan are in shallow waterfringing reefs not reaching depth greater than 35 meters.Many are in near shore tidal areas with lower visibilitythan is expected for thriving reefs. Water temperaturein coral reefs found in Palawan have been recorded from25C-28C.
Coral reefs are considered among the most biologicallyproductive ecosystem in the world and supply the mainfood source for the Philippine Islands. They areecologically important because they serve as fish habitat,breeding and nursery grounds and as wave breakers toprotect inland shores. Corals are also considered ahabitat link between mangroves and seagrasses that arehighly productive and biologically diverse.
9.3.2 Benthic Cover
Results of the coral reef assessment conducted in Palawanemploying Line Intersect Method, Reef Check and MantaTow manifested a gloomy picture of the Provinces’ coralreef ecosystem as shown on Figure 45. Assessment ofthe best sites in terms of benthic life forms in 305 sitescovering nineteen (19) municipalities showed that only12 sites or 3.93 percent were considered in excellentcondition (75-100% live coral cover) and these arelocated at Middle Rock in San Vicente; Renambakan in
Putog Reef, Roxas.
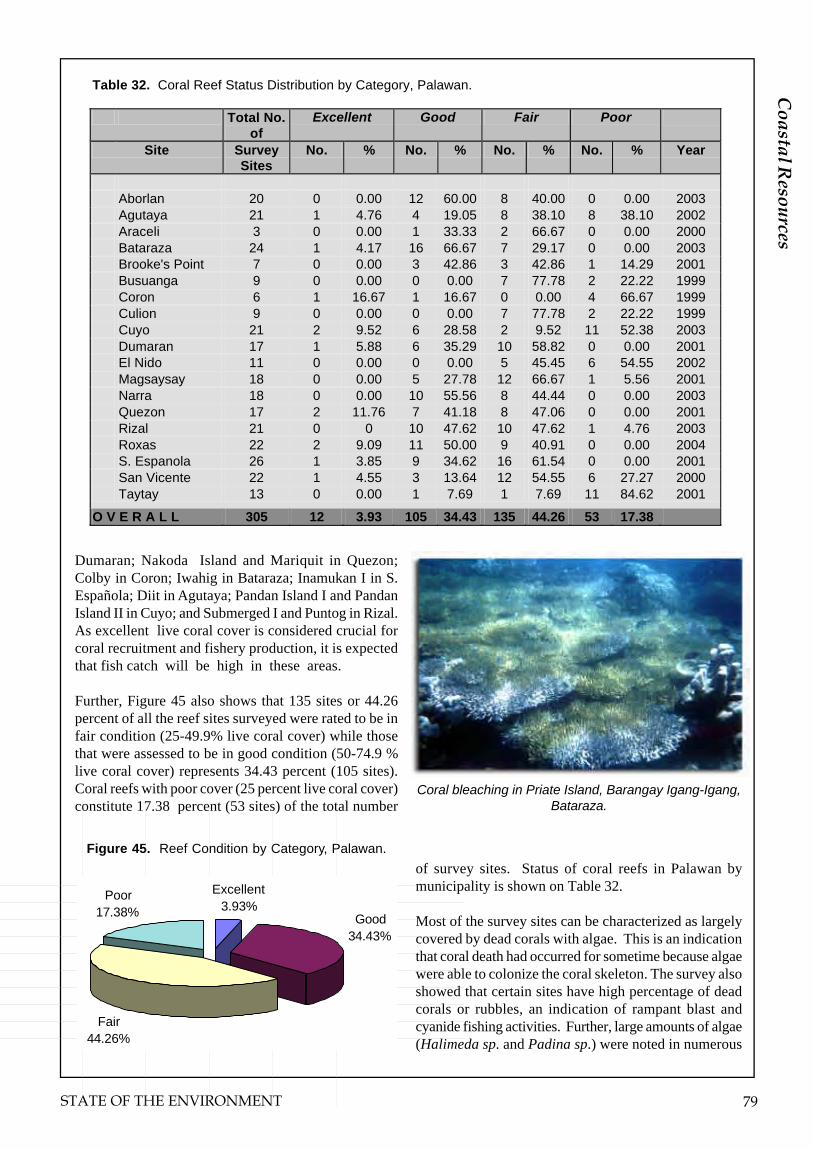
STATE OF THE ENVIRONMENT 79
II. Executive Summ
aryC
oastal Resources
Figure 45. Reef Condition by Category, Palawan.
Table 32. Coral Reef Status Distribution by Category, Palawan.
Total No. of
Excellent Good Fair Poor
Site Survey Sites
No. % No. % No. % No. % Year
Aborlan 20 0 0.00 12 60.00 8 40.00 0 0.00 2003 Agutaya 21 1 4.76 4 19.05 8 38.10 8 38.10 2002 Araceli 3 0 0.00 1 33.33 2 66.67 0 0.00 2000 Bataraza 24 1 4.17 16 66.67 7 29.17 0 0.00 2003 Brooke's Point 7 0 0.00 3 42.86 3 42.86 1 14.29 2001 Busuanga 9 0 0.00 0 0.00 7 77.78 2 22.22 1999 Coron 6 1 16.67 1 16.67 0 0.00 4 66.67 1999 Culion 9 0 0.00 0 0.00 7 77.78 2 22.22 1999 Cuyo 21 2 9.52 6 28.58 2 9.52 11 52.38 2003 Dumaran 17 1 5.88 6 35.29 10 58.82 0 0.00 2001 El Nido 11 0 0.00 0 0.00 5 45.45 6 54.55 2002 Magsaysay 18 0 0.00 5 27.78 12 66.67 1 5.56 2001 Narra 18 0 0.00 10 55.56 8 44.44 0 0.00 2003 Quezon 17 2 11.76 7 41.18 8 47.06 0 0.00 2001 Rizal 21 0 0 10 47.62 10 47.62 1 4.76 2003 Roxas 22 2 9.09 11 50.00 9 40.91 0 0.00 2004 S. Espanola 26 1 3.85 9 34.62 16 61.54 0 0.00 2001 San Vicente 22 1 4.55 3 13.64 12 54.55 6 27.27 2000 Taytay 13 0 0.00 1 7.69 1 7.69 11 84.62 2001
O V E R A L L 305 12 3.93 105 34.43 135 44.26 53 17.38
Dumaran; Nakoda Island and Mariquit in Quezon;Colby in Coron; Iwahig in Bataraza; Inamukan I in S.Española; Diit in Agutaya; Pandan Island I and PandanIsland II in Cuyo; and Submerged I and Puntog in Rizal.As excellent live coral cover is considered crucial forcoral recruitment and fishery production, it is expectedthat fish catch will be high in these areas.
Further, Figure 45 also shows that 135 sites or 44.26percent of all the reef sites surveyed were rated to be infair condition (25-49.9% live coral cover) while thosethat were assessed to be in good condition (50-74.9 %live coral cover) represents 34.43 percent (105 sites).Coral reefs with poor cover (25 percent live coral cover)constitute 17.38 percent (53 sites) of the total number
of survey sites. Status of coral reefs in Palawan bymunicipality is shown on Table 32.
Most of the survey sites can be characterized as largelycovered by dead corals with algae. This is an indicationthat coral death had occurred for sometime because algaewere able to colonize the coral skeleton. The survey alsoshowed that certain sites have high percentage of deadcorals or rubbles, an indication of rampant blast andcyanide fishing activities. Further, large amounts of algae(Halimeda sp. and Padina sp.) were noted in numerous
Coral bleaching in Priate Island, Barangay Igang-Igang,Bataraza.
Poor17.38%
Excellent3.93%
Good34.43%
Fair44.26%

80 PALAWAN
Giant Clam (Tridacna gigaws)Barangay Mabini, El Nido.
Soft corals of Barangay Sarong,Bataraza.
Foliose and massive corals inPaga-paga Island, Barangay
Malitud, Bataraza.
About 40% of the nation’s coralreefs can be found in Palawanand are still in better conditioncompared to the rest in thePhilippines.
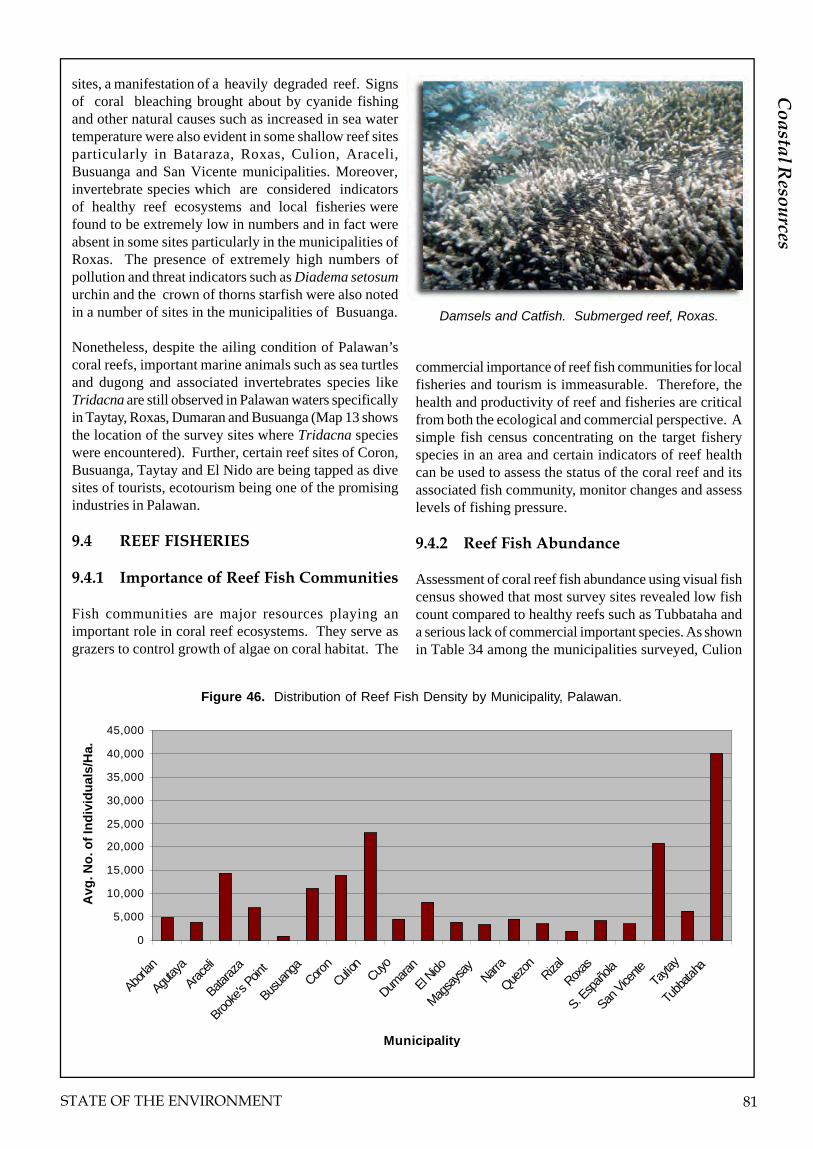
STATE OF THE ENVIRONMENT 81
II. Executive Summ
aryC
oastal Resources
sites, a manifestation of a heavily degraded reef. Signsof coral bleaching brought about by cyanide fishingand other natural causes such as increased in sea watertemperature were also evident in some shallow reef sitesparticularly in Bataraza, Roxas, Culion, Araceli,Busuanga and San Vicente municipalities. Moreover,invertebrate species which are considered indicatorsof healthy reef ecosystems and local fisheries werefound to be extremely low in numbers and in fact wereabsent in some sites particularly in the municipalities ofRoxas. The presence of extremely high numbers ofpollution and threat indicators such as Diadema setosumurchin and the crown of thorns starfish were also notedin a number of sites in the municipalities of Busuanga.
Nonetheless, despite the ailing condition of Palawan’scoral reefs, important marine animals such as sea turtlesand dugong and associated invertebrates species likeTridacna are still observed in Palawan waters specificallyin Taytay, Roxas, Dumaran and Busuanga (Map 13 showsthe location of the survey sites where Tridacna specieswere encountered). Further, certain reef sites of Coron,Busuanga, Taytay and El Nido are being tapped as divesites of tourists, ecotourism being one of the promisingindustries in Palawan.
9.4 REEF FISHERIES
9.4.1 Importance of Reef Fish Communities
Fish communities are major resources playing animportant role in coral reef ecosystems. They serve asgrazers to control growth of algae on coral habitat. The
commercial importance of reef fish communities for localfisheries and tourism is immeasurable. Therefore, thehealth and productivity of reef and fisheries are criticalfrom both the ecological and commercial perspective. Asimple fish census concentrating on the target fisheryspecies in an area and certain indicators of reef healthcan be used to assess the status of the coral reef and itsassociated fish community, monitor changes and assesslevels of fishing pressure.
9.4.2 Reef Fish Abundance
Assessment of coral reef fish abundance using visual fishcensus showed that most survey sites revealed low fishcount compared to healthy reefs such as Tubbataha anda serious lack of commercial important species. As shownin Table 34 among the municipalities surveyed, Culion
Damsels and Catfish. Submerged reef, Roxas.
0
5,000
10,000
15,000
20,000
25,000
30,000
35,000
40,000
45,000
Aborla
n
Agutay
a
Araceli
Bataraz
a
Brooke
’s Po
int
Busua
nga
Coron
Culion
Cuyo
Dumara
n
El Nido
Magsa
ysay
Narra
Quezo
nRiza
l
Roxas
S. Esp
añola
San V
icente
Tayta
y
Tubb
ataha
Municipality
Avg
. No
. of I
nd
ivid
ual
s/H
a.
Figure 46. Distribution of Reef Fish Density by Municipality, Palawan.

82 PALAWAN
Table 34. Reef Fish Density vis-a-vis Reef Condition by Municipality, Palawan.
Municipality
Average No. of
Ind./Ha.
Indicator Species No. of
Ind./Ha.
Target Speices No. of
Ind./Ha.
Coral Cover
(%)
Category
Survey Year
Aborlan 4,857 2,433 2,424 52.94 Good 2003 Agutaya 3,781 1,943 1,838 32.73 Fair 2002 Araceli 14,400 10,148 4,252 51.67 Good 2000 Bataraza 6,986 3,063 3,923 56.62 Good 2003 Brooke’s Point 900 900 49.87 Fair 2001 Busuanga 11,087 10,028 1,059 31.03 Fair 1999 Coron 13,840 10,240 3,600 1999 Culion 23,093 17,675 5,418 31.99 Fair 1999 Cuyo 4,428 2,264 2,164 48.42 Fair 2003 Dumaran 8,071 3,711 4,360 37.02 Fair 2001 El Nido 3,746 2,159 1,587 26.85 Fair 2002 Magsaysay 3,350 1,891 1,459 42.69 Fair 2002 Narra 4,414 2,478 1,936 50.48 Good 2002 Quezon 3,514 1,428 2,086 55.38 Good 2001 Rizal 1,929 959 970 49.15 Fair 2003 Roxas 4,086 2,534 1,552 47.13 Fair 2004 S. Española 3,474 1,423 2,051 46.06 Fair 2001 San Vicente 20,798 2,311 18,487 47.92 Fair 2000 Taytay 6,200 2,335 3,865 19.21 Poor 2001 Tubbataha 40,000 11,140 1992
showed the highest average fish density placed at 23,093individuals per hectare. Next to Culion were San Vicente(20,700 individual/ha), Araceli (14,400 individual/ha),Coron (13,840 individual/ha) and Busuanga (11,087individual/ha). Municipalities that manifested low fishdensities were Rizal (1,929 individual/ha) and Brooke’sPoint (900 individual/ha). On a per site basis, the highestfish density so far was estimated at 93,900 individual/ha and was documented in Oyster Bay in the municipalityof San Vicente. The lowest fish density of 200 individual/
Table 33. Reef Fish Density (No. of Individuals Per Hectare Reef Area) by Municipality, Palawan.
Municipality Average Highest Location Lowest Location Aborlan 4,857 9,900 Sombrero II 760 Tigman Agutaya 3,871 7,840 Mandit IV 1,260 Quinluban Island Araceli 14,400 23,440 Mantulali Island 7,520 Casiran Bataraza 6,986 37,840 Arreciffe I 1,040 Segyam Brooke’s Pt. 900 3,320 Kalaparan 480 Pangobilian Busuanga 11,087 27,600 Balagbagan 8,640 Kadius Culion 23,093 34,040 Chindonan Island I 11,040 Chindonan Island II Cuyo 4,428 6,660 Pamalican Island 2,000 Pandan Island II Dumaran 8,071 20,240 Talataen 840 Kapayas II El Nido 3,746 11,940 Bangkaloyan 1,200 Pinamantayan Pt. Magsaysay 3,350 5,280 Cocoro Island II 1,480 Taguayen Island Narra 4,414 8,160 San Isidro 460 Emelina Quezon 3,514 8020 Double Island 1,040 Tinagong Pati Rizal 1,929 4,600 Tinagpan 540 Gandan Point Roxas 4,086 13,640 Submerged Reef III 1,420 Flat Island S. Espanola 3,474 17,920 Kings II 200 Near Malalong San Vicente 20,789 93,920 Oyster 400 Alimanguan Taytay 6,200 10,400 Talakanen 1,920 Apulit Tubbataha 40,000
ha on the other hand was manifested by site NearMalalong in the municipality of S. Española.
Relating the results of the fish census to the reef conditionof the survey sites in terms of coral cover as shown onTable 34 it was observed that in some cases, sites withrelatively good coral cover have low fish count forcommercially important species, an indication ofoverfishing. Thus, it would then appear from the datathat coral reefs of Quezon, Narra and Aborlan are

STATE OF THE ENVIRONMENT 83
II. Executive Summ
aryC
oastal Resources
relatively overfished as the general condition is ratedgood but the density of the target or commerciallyimportant fish species is rather low. Figure 46 illustratesin graphical form the reef fish density in eachmunicipality surveyed.
Meanwhile, the overall status of reef fisheries in most ofthe survey sites is dominated by damsels, an indicator ofa degraded reef, which account for 28.1% of the totalfish count. Second in rank in fish abundance are fusiliers(planktivores) at 21.19%. It must be noted also thatbutterfly fish (4.10%), an indicator of a healthy reefcommunity were low in numbers and in fact were missingin other sites. The absence of large predators such asgroupers (2.17%) and sweetlips (0.16%) were likewiseobserved in most sites. Overall findings thereforeindicate heavy harvesting of marine species and overfishing. Fish density for each species in eachmunicipality surveyed is shown in Appendix E.4.
9.5 ISSUES
The coastal resources of Palawan have been under threatfrom various destructive activities both in the terrestrialand the coastal areas. In the coral reef, the biggest threatat present is the live fish industry which thrives on theillegal use of cyanide to catch fish alive causing coraldeath. Further, dynamite fishing as well as the use ofefficient gears within the municipal waters also contributeto coral destruction resulting in the decline in fish catch.

����
��
������
��
������
����
��
��
��
�� ��
��
����
��
����
��
��
��
��
��
��
��
����
��
��
����������
���
�����
�������
��������������
�������
�����������
���������� �����
���� � �!���
�������
"� ������
!#��$�!%�&����&%�'
&����
�� ���(�
&�����
)��������
�(����
&���*�( �� ��
&�(���������
������
������
������
������
������
������������� �������
������� �������
������� �������
�� � �� �� ���� ���
���������������������
����������������������
�������� ���������������������������������
)�+���
��������������� ������������������� ����� ��!�
�
,���%�+����&-���$,��#+$�+�!��.��������!���/��
"����� ��#��� ����������$��%������ "�������� ���
84 PALAWAN
Map 12. Feeding Trenches of Dugongs, Palawan, 1999-2004.

����
��
������
��
������
����
��
��
��
�� ��
��
����
��
����
��
��
��
��
��
��
��
����
��
��
����������
���
�����
�������
��������������
�������
�����������
���������� �����
���� � �!���
�������
"� ������
!#��$�!%�&����&%�'
&����
�� ���(�
&�����
)��������
�(����
&���*�( �� ��
&�(���������
������
������
������
������
������
������������� �������
������� �������
������� �������
)$&��%$��$+��%��&���%����������*�%����!�&%��
!��,��������!���-���� � �� �� ���� ���
���������������������
����������������������
�������� ���������������������������������
)�.���
��������������� ������������������� ����� ��!�
�
"����� ��#��� ����������$��%������ "�������� ���
STATE OF THE ENVIRONMENT 885
Map 13. Location of Tridacna Invertebrate Marine Species, Palawan, 1999-2004.

����
�
�
�
���
�������
������
���������
����
�
���
��
��
�
�
��� ��
�
��
����
��
��
�
���������
�
��
�����
�
�����
�����
�
��� �
� � �����
��
�
� �
��
������
�������������������������
�
�
���
�
����������
����������������
� � ������
���
�
��
��
�� �
�
���
� � �
��
� �
��������
��������� ����
��
�
����� �
� � ��
�� �
��
�
� �
����
������
�
�
�
�
�
�
����
��
�
���
� �
��
������
�������������������������
�
�
���
�
� � �
��
���
�����
���� �
�� �
�
�
�
��
�
�
�
�����
�
�
�
� ����
��������
������
�
�
�
����
��
��
��
�� ��
��
����
��
����
��
��
��
��
��
��
��
����
��
��
��
�
� ��
� ���
��
�
����������
���
�����
�������
��������������
�������
�����������
���������� �����
���� � �!���
�������
"� ������
!#��$�!%�&����&%�'
&����
�� ���(�
&�����
)��������
�(����
&���
*�( �� ��
&�(���������
������
������
������
������
������
������������� �������
������� �������
������� �������
&$�)�&$��%�%$�!��+��������!���,���� � �� �� ���� ���
���������������������
)�-���
������������
��� !���"#$%$�"� &'���� � ()� *���� ��
�� �+������� ���
���+����+�������������
�����+�� ��,��������,���������������������
�+������$������ �����+���� �������� ����� ���#�
Map 14. Coral Reef Condition, Palawan, 1999-2004.
86 PALAWAN
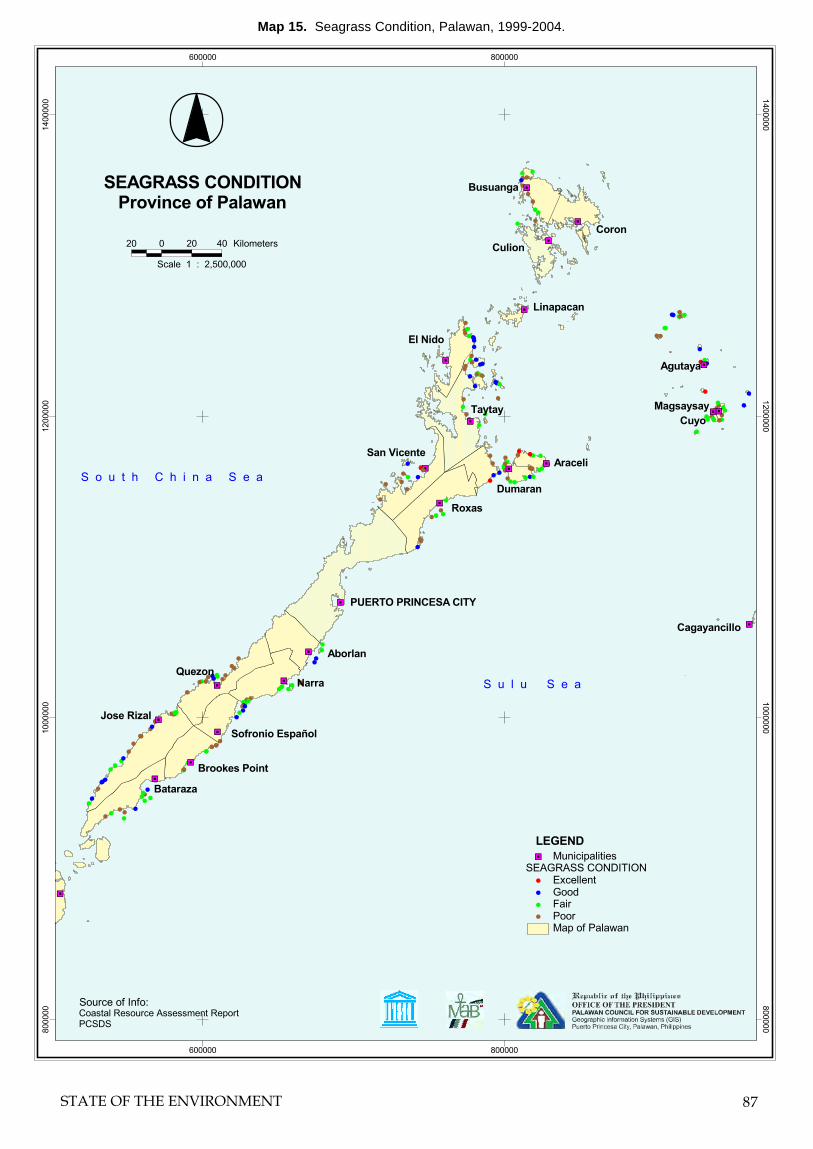
�� ��
��
�
� ������
���
�����������
������
�����
������
��
���
��
�
������
� �����
����
��
����
����
��
���
�
����
��
�����
���
����
�
����
�� ���
��
�
�
�
����
��
�� ��� �����
��� ���
�
�
���
�
�����
��
��
�
��
���� ���
������
����
�
�
�
�� ��
��
��
�
��
��
��
��
�� ��
��
����
��
����
��
��
��
��
��
��
��
����
��
��
�
� ��
���� ��
���
�
��
��
� �
��
�
�
��
��
����
�����
��
����
��� ��
������
������
������
������
������
������
��� ���
�� ����
��������
���������
����������
���!���� �
������������
���"���#���
#$���%�#�&�� ���&�'
�(���������)��
*��������*��������
������
������
������
������
������
������������� �������
������� �������
������� �������
��+�� ��%�&�&%#�,������(�#���-��
�� � �� �� ���� ���
���������������������
����������������������
�������� ���������������������������������
��+��
������������
� !"#!����$%&'('$%� )���� � "*� +���� ��
�� ��������� ���
��������'������ ��#�������!�������� �#��� ���&�
STATE OF THE ENVIRONMENT 87
Map 15. Seagrass Condition, Palawan, 1999-2004.

��
��
��
��
��
����
��
����
��
��
��
��
�� �� ��
��
��
��
��
��
��
����
��
����
��
��
��
��
�� �� ��
��
��
��
��
��
��
�� ��
��
��
��
��
��
��
��
��
��
��
��
�� ��
��
��
��
���������
������ ������� �
����� ����������
���������� �
�������� ���
����� ����
� �������
��������
������
�������
������
�����
���� �
!�"���
������
��� ��
#����
$�����
����
%�&��
���% ���
����������������
���������������� �����������������
� � � � ����������
���������������
�������
�����
�����'����!����������������������"���(
��������������� � ����� �� �� ����� �� �� ������
�� ��� ������
�� ��� �������
� ��������������!� �"� �������������#�� � ������ �� ��� ������
�� ��� ���$�
�� � � ������
�
�
�
�
�
�
��
��
�$
�$
Map 16. Reef Fish Density, Palawan, 1999-2004.
88 PALAWAN

STATE OF THE ENVIRONMENT 89
II. Executive Summ
aryH
uman R
esources
X
HUMAN RESOURCES
Human resource is a very valuable resource in thesustainable development of Palawan. Trends in populationgrowth are important in assessing population carryingcapacity of the Province especially since Palawan isgenerally mountainous and therefore any increase inpopulation is feared to adversely affect the uplands andother ecologically sensitive areas for lack of opportunitiesin the lowlands. Likewise, population structure is viewedto be relevant in economic development as youngpopulation tend to be less productive because of a highdependency ratio. Thus, monitoring of the Province’shuman resources will enable planners to formulatestrategic plans and programs to accommodate thegrowing population without necessarily compromisingthe fragile environment of the Province.
In describing the population of Palawan, the discussionwill be mainly focused in Puerto Princesa City and thetwenty three (23) municipalities excluding Kalayaan. Thisis because Kalayaan is a special municipality in the sensethat its inhabitants are all military personnel and thereforecould not be characterized in the same manner as the othermunicipalities.
10.1 POPULATION DISTRIBUTION
Results of the 2000 Population Census Survey carriedout by the National Statistics Office is reflected on Table36. As indicated, the total population of Palawan in 2000was 755,412. Puerto Princesa City, the capital ofPalawan registered the highest population at 161,912accounting for 21.43 percent of the province’s totalpopulation. Among the municipalities of Palawan, thetop five in terms of population are Narra (56,845), Taytay(53,657), Brooke’s Point (48,928), Roxas (47,242) andQuezon (41,669). Except for Kalayaan with populationcount of 223, the Municipality of Cagayancillomanifested the least population at 6,348 accounting foronly 0.84 percent of Palawan’s aggregate population
Other municipalities with relatively low population countare Linapacan (9,198), Agutaya (10,422), Magsaysay(10,885) and Araceli (10,894).
10.2 POPULATION DENSITY
The overall population density for Palawan in 2000 isestimated at 51 persons/sq km, an increase of 8 persons/sq km from the 1995 estimate of 43 persons/sq kmReferring to Table 36, Cagayancillo registered the highestpopulation density at 412 persons/sq.km., followed byMagsaysay (393), Agutaya (321) and Cuyo (319). Exceptfor Cuyo, these municipalities happen to be those whichalso registered the least population. The municipality of
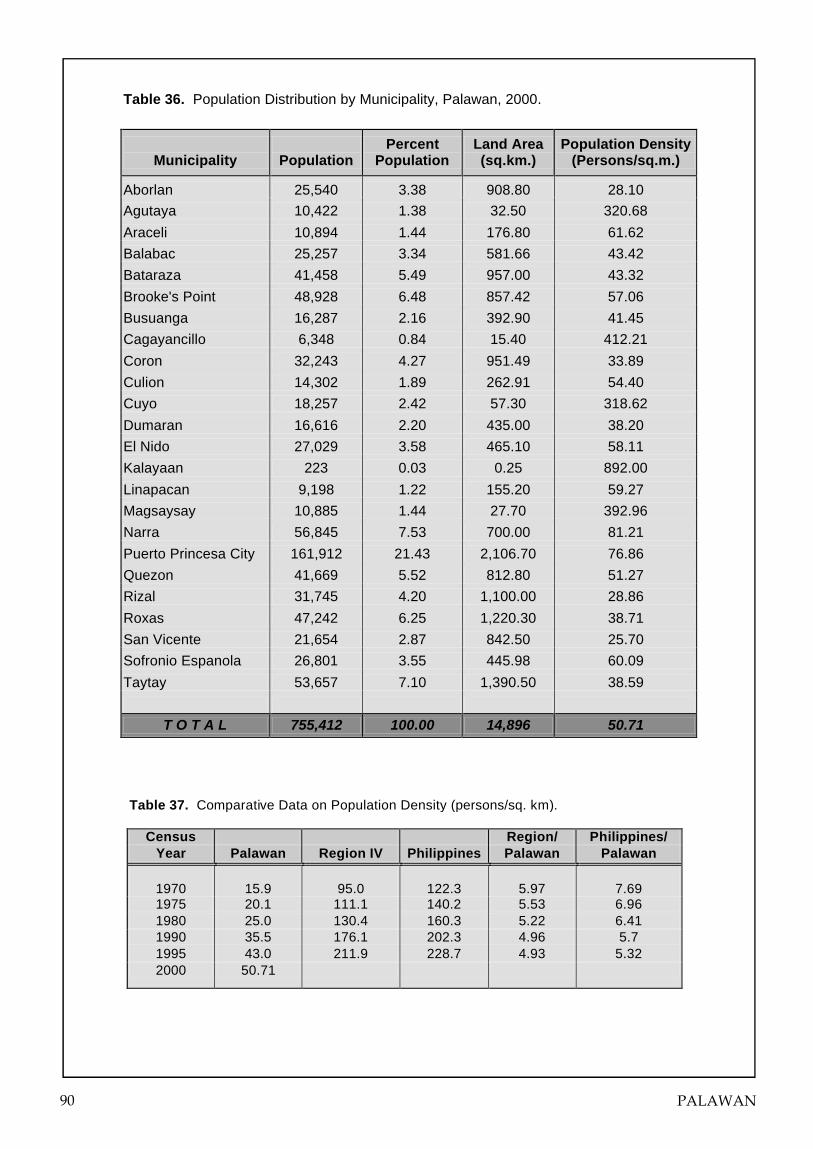
90 PALAWAN
Table 36. Population Distribution by Municipality, Palawan, 2000.
Municipality
Population
Percent Population
Land Area (sq.km.)
Population Density (Persons/sq.m.)
Aborlan 25,540 3.38 908.80 28.10 Agutaya 10,422 1.38 32.50 320.68
Araceli 10,894 1.44 176.80 61.62 Balabac 25,257 3.34 581.66 43.42 Bataraza 41,458 5.49 957.00 43.32
Brooke's Point 48,928 6.48 857.42 57.06 Busuanga 16,287 2.16 392.90 41.45 Cagayancillo 6,348 0.84 15.40 412.21
Coron 32,243 4.27 951.49 33.89 Culion 14,302 1.89 262.91 54.40 Cuyo 18,257 2.42 57.30 318.62
Dumaran 16,616 2.20 435.00 38.20 El Nido 27,029 3.58 465.10 58.11 Kalayaan 223 0.03 0.25 892.00
Linapacan 9,198 1.22 155.20 59.27 Magsaysay 10,885 1.44 27.70 392.96 Narra 56,845 7.53 700.00 81.21
Puerto Princesa City 161,912 21.43 2,106.70 76.86 Quezon 41,669 5.52 812.80 51.27 Rizal 31,745 4.20 1,100.00 28.86
Roxas 47,242 6.25 1,220.30 38.71 San Vicente 21,654 2.87 842.50 25.70 Sofronio Espanola 26,801 3.55 445.98 60.09
Taytay 53,657 7.10 1,390.50 38.59
T O T A L 755,412 100.00 14,896 50.71
Table 37. Comparative Data on Population Density (persons/sq. km).
Census Region/ Philippines/ Year Palawan Region IV Philippines Palawan Palawan
1970
15.9
95.0
122.3
5.97
7.69
1975 20.1 111.1 140.2 5.53 6.96 1980 25.0 130.4 160.3 5.22 6.41 1990 35.5 176.1 202.3 4.96 5.7 1995 43.0 211.9 228.7 4.93 5.32 2000 50.71
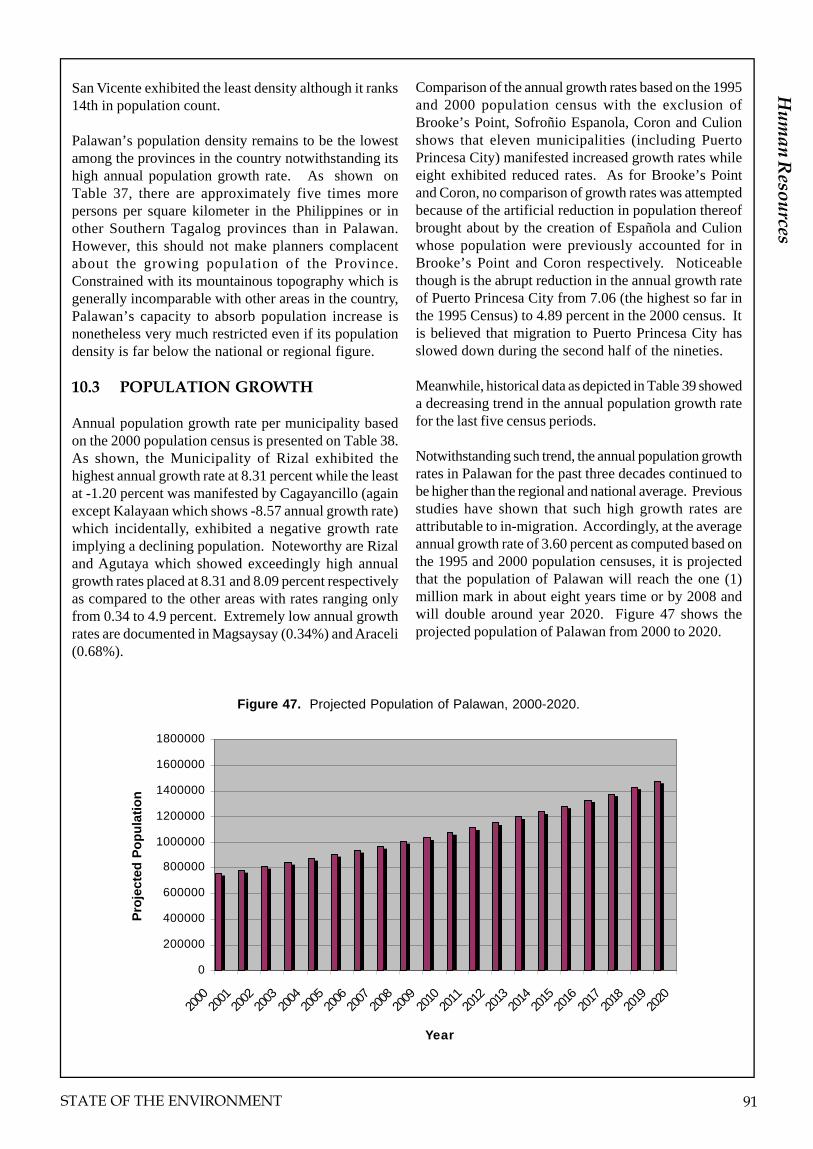
STATE OF THE ENVIRONMENT 91
II. Executive Summ
aryH
uman R
esources
San Vicente exhibited the least density although it ranks14th in population count.
Palawan’s population density remains to be the lowestamong the provinces in the country notwithstanding itshigh annual population growth rate. As shown onTable 37, there are approximately five times morepersons per square kilometer in the Philippines or inother Southern Tagalog provinces than in Palawan.However, this should not make planners complacentabout the growing population of the Province.Constrained with its mountainous topography which isgenerally incomparable with other areas in the country,Palawan’s capacity to absorb population increase isnonetheless very much restricted even if its populationdensity is far below the national or regional figure.
10.3 POPULATION GROWTH
Annual population growth rate per municipality basedon the 2000 population census is presented on Table 38.As shown, the Municipality of Rizal exhibited thehighest annual growth rate at 8.31 percent while the leastat -1.20 percent was manifested by Cagayancillo (againexcept Kalayaan which shows -8.57 annual growth rate)which incidentally, exhibited a negative growth rateimplying a declining population. Noteworthy are Rizaland Agutaya which showed exceedingly high annualgrowth rates placed at 8.31 and 8.09 percent respectivelyas compared to the other areas with rates ranging onlyfrom 0.34 to 4.9 percent. Extremely low annual growthrates are documented in Magsaysay (0.34%) and Araceli(0.68%).
Comparison of the annual growth rates based on the 1995and 2000 population census with the exclusion ofBrooke’s Point, Sofroñio Espanola, Coron and Culionshows that eleven municipalities (including PuertoPrincesa City) manifested increased growth rates whileeight exhibited reduced rates. As for Brooke’s Pointand Coron, no comparison of growth rates was attemptedbecause of the artificial reduction in population thereofbrought about by the creation of Española and Culionwhose population were previously accounted for inBrooke’s Point and Coron respectively. Noticeablethough is the abrupt reduction in the annual growth rateof Puerto Princesa City from 7.06 (the highest so far inthe 1995 Census) to 4.89 percent in the 2000 census. Itis believed that migration to Puerto Princesa City hasslowed down during the second half of the nineties.
Meanwhile, historical data as depicted in Table 39 showeda decreasing trend in the annual population growth ratefor the last five census periods.
Notwithstanding such trend, the annual population growthrates in Palawan for the past three decades continued tobe higher than the regional and national average. Previousstudies have shown that such high growth rates areattributable to in-migration. Accordingly, at the averageannual growth rate of 3.60 percent as computed based onthe 1995 and 2000 population censuses, it is projectedthat the population of Palawan will reach the one (1)million mark in about eight years time or by 2008 andwill double around year 2020. Figure 47 shows theprojected population of Palawan from 2000 to 2020.
Figure 47. Projected Population of Palawan, 2000-2020.
0
200000
400000
600000
800000
1000000
1200000
1400000
1600000
1800000
2000
2001
2002
2003
2004
2005
2006
2007
2008
2009
2010
2011
2012
2013
2014
2015
2016
2017
2018
2019
2020
Year
Pro
ject
ed P
op
ula
tio
n

92 PALAWAN
Table 39. Comparative Annual Average Population Growth Rates in Percent by Census Period.
Census Period
Palawan Province
Region IV Southern Tagalog
Philippines
1970 - 1975 4.86 3.19 2.78 1975 - 1980 4.38 3.25 2.71
1980 - 1990 3.58 3.05 2.35 1990 - 1995 3.67 3.53 2.32 1995 - 2000 3.60
Source: NSO Census of Population of 1975, 1980, 1990, 1995 and 2000
Table 38. Population Growth Rate by Municipality, Palawan, 1995-2000.
Municipality 1995 Population
2000 Population
Percent Population
Growth Rate (%)
Aborlan 21650 25,540 10.1480 3.6043 Agutaya 7250 10,422 9.2517 8.0872 Araceli 10556 10,894 9.2960 0.6777 Balabac 21677 25,257 10.1369 3.3296
Bataraza 33303 41,458 10.6324 4.8055 Busuanga 15843 16,287 9.6981 0.5940 Cagayancillo 6717 6,348 8.7559 -1.2035
Coron 27040 32,243 10.3811 3.8431 Culion 13024 14,302 9.5682 2.0261 Dumaran 13980 16,616 9.7181 3.7709
El Nido 21948 27,029 10.2047 4.5632 Kalayaan 349 223 5.4072 -9.1517 Linapacan 7269 9,198 9.1267 5.1729
Magsaysay 10714 10,885 9.2951 0.3399 Narra 48339 56,845 10.9481 3.5344 Puerto Princesa City 129577 161,912 11.9948 4.8896
Quezon 36856 41,669 10.6375 2.6650 Rizal 21876 31,745 10.3655 8.3058 Roxas 44370 47,242 10.7630 1.3531
San Vicente 19449 21,654 9.9829 2.3280 Sofronio Espanola 22986 26,801 10.1962 3.3452
Taytay 47095 53,657 10.8904 2.8347
T O T A L 640,486 755,412 13.5350 3.5998

STATE OF THE ENVIRONMENT 93
II. Executive Summ
aryH
uman R
esources
10.4 POPULATION STRUCTURE
Unlike population count, data on population structurecontained in this report are based on the 1995 populationcensus as the results of the 2000 census regardingpopulation structure are not yet released. Although notthe latest, this information still provides the generalpicture of Palawan’s population structure which does notchange much with time as data herein would show.
10.4.1 Sex Structure
The provincial sex ratio based on the 1995 PopulationCensus as demonstrated on Table 40 was computed at106.95 males per 100 females and is low relative to the1980 and 1990 Census figures recorded at 115.6 and 107.5respectively. A further examination of Table 40 alsoreveals that the computed sex ratios for Palawan arerelatively higher compared with the regional and nationalfigures for all census years mentioned. This means thatthe excess of males over females in Palawan is to a certainextent greater than with the other provinces of Region IVor of the whole country.
10.4.2 Age Structure
Records of the 1995 population census as presented inAppendix F-1 show that the province’s population isrelatively young with the child group comprising about42.34 percent of the total population. San Vicentemunicipality has the highest percentage (45.77%) of childgroup while Cuyo has the lowest placed at 35.97. On theother hand, the highest percentage of elderly populationwas recorded in Magsaysay (7.05%) while the lowest is inBalabac at 1.15 percent. The median age or the value whichdivides the age distribution into two equal parts wasestimated to be 17.34 or below 18 years which is anindication further that the population of Palawan as a wholeis relatively young.
Table 40. Population Sex Ratio on by Census Year.
Census Year
Area 1980 1990 1995
Palawan 115.6 107.5 106.95
Region IV 102.4 102.1 101.5
Philippines 100.7 101.1 101.5
Meanwhile, for the past 15 years (1980 to 1995) therewas no significant alteration in the age structure ofPalawan’s population as illustrated on Table 41. Datashow that changes in the percentage of householdpopulation belonging to the child age group, elderlygroup and the working age group over the same periodare barely 0.45, 0.26 and 0.71 percent respectively. Suchchanges are nil compared to the size of the population.It is therefore expected that the population will remainto be young in the coming decades.
In relation to the regional (Southern Tagalog) and thenational age distribution, Palawan’s population is said tobe younger since the percentage of its child age group ishigher by 4% as reflected on Table 42. The relativelyyoung population of Palawan is further reflected by thefact that its median age of 17.34 is lower than the regionalfigure of 19.7 and national figure of 19.43.
10.5 DEPENDENCY RATIO
Dependency ratio refers to the ratio of the dependentpopulation over the productive age group. A highdependency ratio is not a good indicator of a growing or
Palawan has become a target for settlers with thedepletion of natural resources all over the country.In 1995, population growth in the province waspegged at 3.93% due largely to migration. It slippedto 3.6% in 2000. 61% of the total population ofPalawan were migrants.

94 PALAWAN
Table 42. Comparative Data on Age Structure
Age Category Philippines Region IV Palawan
Dependent Age Group 41.85 41.36 44.92 0 - 14 38.33 38.05 42.34 65 and over 3.52 3.31 2.58
Working Age Group 58.15 58.64 55.09 15 - 24 20.02 19.81 19.33 25 - 64 38.13 38.83 35.76
Median Age 19.43 19.7 17.34
Dependency Ratio 71.97 70.53 81.52
developing economy. Productivity will tend to be lowdue to increase in economic burden.
Table 43 illustrates the dependency ratios in eachmunicipality of Palawan from 1980 to 1995. Asindicated in 1995, Coron, Linapacan and San Vicentehave the highest dependency ratio with 92 dependentsfor every 100 productive population. Dumaranmunicipality ranks second with 91 dependents for every100 economically active individuals. The municipalitiesof Busuanga and Cuyo manifested the lowestdependency ratio placed at 72 dependents for every 100productive individuals. Taking the province as a whole,the dependency ratio is placed at 82 dependents for every100 productive individuals.
A comparison of the 1980, 1990 and 1995 populationdata shows an insignificant change in dependency ratios.However, compared with the dependency ratios inSouthern Tagalog and in the Philippines placed at 70.53and 71.97 respectively, the difference is quite considerableas indicated on Table 42. It may be inferred then that
Table 41. Comparative Percent Distribution of Population by Age Group, Palawan.
Census Year Age Group
1980 1990 1995
Dependent Age Group 44.64 45.54 44.91 0-14 42.32 43.09 42.34
65 and over 2.32 2.45 2.58 Working Age Group 55.36 54.46 55.09 15-24 20.34 19.59 19.33 25-64 35.02 34.87 35.76 Source: NSO, Census of Population for 1980, 1990 & 1995
Palawan’s population manifests a more dependentpopulation compared to Region IV and of the countryas a whole. Thus, economic development would be evenmore difficult in Palawan than any other area in thePhilippines.

STATE OF THE ENVIRONMENT 95
II. Executive Summ
aryH
uman R
esources
Table 43. Dependency Ratios by Municipality, Palawan, 1980-1995.
Municipality 1980 1990 1995
Palawan 84:100 85:100 82:100
Aborlan 95:100 84:100 83:100 Agutaya 87:100 75:100 80:100 Araceli 79:100 80:100 80:100 Balabac 61:100 87:100 90:100 Bataraza 86:100 86:100 84:100 Brooke's Point 61:100 88:100 88:100 Busuanga 50:100 137:100 72:100 Cagayancillo 89:100 76:100 80:100 Coron 90:100 89:100 92:100 Cuyo 81:100 74:100 72:100 Dumaran 121:100 92:100 91:100 El Nido 87:100 86:100 90:100 Linapacan 112:100 95:100 92:100 Magsaysay 79:100 81:100 76:100 Narra 87:100 83:100 83:100 Quezon 79:100 85:100 86:100 Roxas 89:100 86:100 81:100 San Vicente 92:100 87:100 92:100 Sofronio Espanola 90:100 Taytay 90:100 188:100 89:100 Rizal 79:100 82:100
Source: NSO, 1980, 1990, 1995 Census of Population.
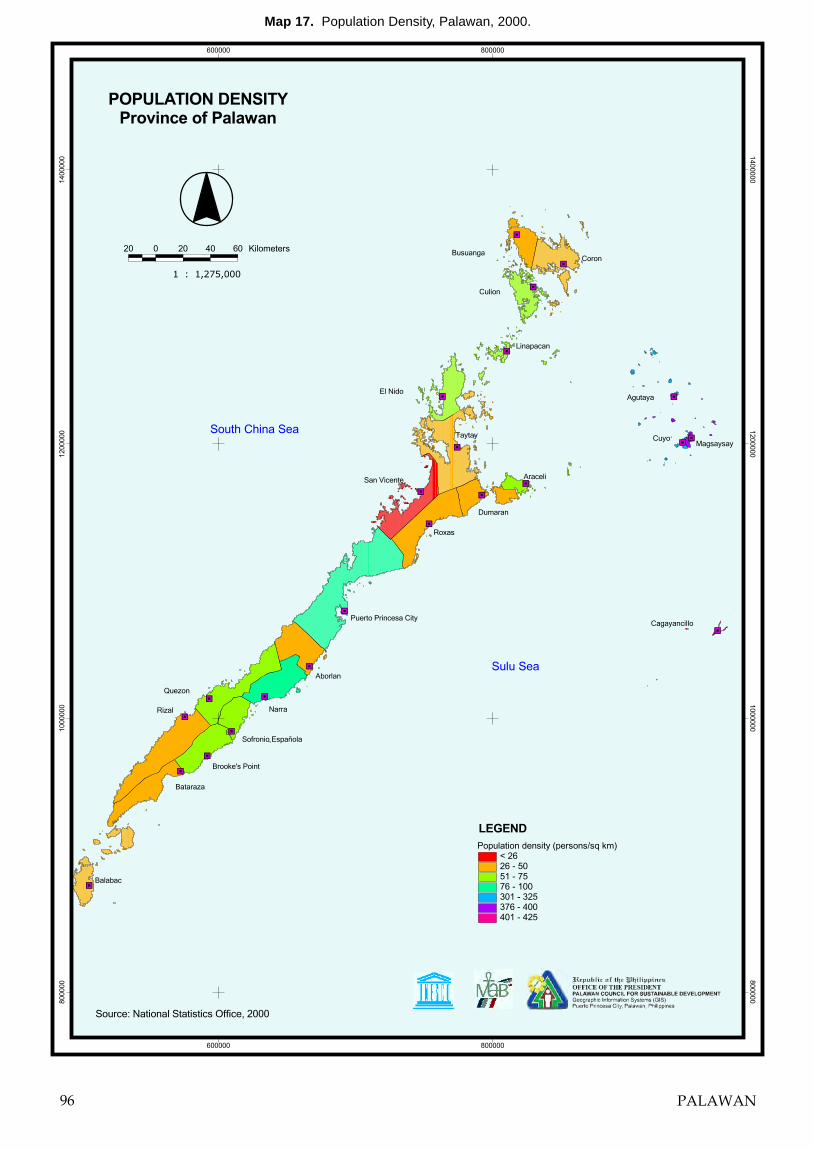
��
��
��
��
�� ��
��
��
��
��
��
��
��
��
��
��
��
�� ��
��
��
��
��
����
���� ����
����
�����
������
������
�����
������
�������
�����
������
�������
������
��������
�� �����
���������
���� ������
����������
����!�" �#����
��$������� ��%��
#������#����� ������
&�� �� ��
����������� ������� � � ��������������������������������������������
��������������� �����������������
�� � �� �� �� ��������
���������������
������'������������� ��� �($$���)�*+++
�����
!���!��
!���"#"��!��
������
������
$�����
$�����
$�����
$������������ �������
������� �������
������� �������
Map 17. Population Density, Palawan, 2000.
96 PALAWAN

��
��
��
��
�� ��
��
��
��
��
��
��
��
��
��
��
��
�� ��
��
��
��
��
����
���� ����
����
�����
������
������
�����
������
�������
�����
������
�������
������
��������
�� �����
���������
���� ������
����������
����!�" �#����
��$������� ��%��
#������#����� ������
&�� �� ��
���������������
�� � �� �� �� ������
�������������� ���������������������
��������������
���������������������������������������������������� ����!���"
�����
�������
������
������
!�����
!�����
!���
��!�����
����
��� �������
����
��� �������
����
��� �������
������'������������� ��� �($$���)�*+++
Map 18. Population of Growth Rate, Palawan, 1995-2000.
STATE OF THE ENVIRONMENT 97


STATE OF THE ENVIRONMENT 99
References
Alcala, A.C. 1986. Guide to Philippine Flora and Fauna. Vol X. Amphibians and Reptiles. NaturalResources Mgt. Center and University of the Philippines, Quezon City.
Alcala, A.C. and W.C. Brown. 1998. Philippine Amphibians. An Illustrated Field Guide. Bookmark, Inc.
BAEcon: Ministry of Agriculture. Economic Potentials and Development Constraints ofPalawan. PIADPO. November 1986.
BAEX Socio-Economic Profile, Palawan. 1980.
Bureau of Agricultural Statistics. Central Officer: PCSDS, Palawan, Statistics A1.02.
Bureau of Soils and Management. 1988. The Physical Environment (Volume I). Soil/Resource Evaluation Project.Palawan Province.
Bureau of Soils. 1979. Geological Map of Palawan.
Census of Agriculture, 1980. National Summary Volume 1, Final Report.
CITES. www.cites.org
Coastal Resource Assessment Report of the Municipality Brooke’s Point. 2000. Palawan Council for SustainableDevelopment Staff (PCSDS).
Coastal Resource Assessment Report of the Municipality of Araceli. 2000. Palawan Council for SustainableDevelopment Staff (PCSDS).
Coastal Resource Assessment Report of the Municipality of Bataraza. 2003. Palawan Council for SustainableDevelopment Staff (PCSDS).
Coastal Resource Assessment Report of the Municipality of Busuanga. 1999. Palawan Council for SustainableDevelopment Staff (PCSDS)
Coastal Resource Assessment Report of the Municipality of Coron. 1999. Palawan Council for SustainableDevelopment Staff (PCSDS).
Coastal Resource Assessment Report of the Municipality of Culion. 1999. Palawan Council for SustainableDevelopment Staff (PCSDS).
Coastal Resource Assessment Report of the Municipality of Cuyo. 2000. Palawan Council for SustainableDevelopment Staff (PCSDS).
Coastal Resource Assessment Report of the Municipality of Dumaran. 2001. Palawan Council for SustainableDevelopment Staff (PCSDS).
Coastal Resource Assessment Report of the Municipality of El Nido. 2002. Palawan Council for SustainableDevelopment Staff (PCSDS).
Coastal Resource Assessment Report of the Municipality of Magsaysay. 2002. Palawan Council for SustainableDevelopment Staff (PCSDS).
Coastal Resource Assessment Report of the Municipality of Quezon. 2001. Palawan Council for SustainableDevelopment Staff (PCSDS).
Coastal Resource Assessment Report of the Municipality of Rizal. 2003. Palawan Council for SustainableDevelopment Staff (PCSDS).

100 PALAWAN
Coastal Resource Assessment Report of the Municipality of San Vicente. 2000. Palawan Council for SustainableDevelopment Staff (PCSDS).
Coastal Resource Assessment Report of the Municipality of Taytay. 2000. Palawan Council for SustainableDevelopment Staff (PCSDS).
Coastal Resource Monitoring Report of the Municipality of Aborlan. 2003. Palawan Council for SustainableDevelopment Staff (PCSDS).
Coastal Resource Monitoring Report of the Municipality of Narra. 2002. Palawan Council for SustainableDevelopment Staff (PCSDS).
Coastal Resource Monitoring Report of the Municipality of Roxas. 2004. Palawan Council for SustainableDevelopment Staff (PCSDS).
Coastal Resource Monitoring Report of the Municipality of S. Española. 2001. Palawan Council for SustainableDevelopment Staff (PCSDS).
Coconut Industry Profile, PCA, Palawan.
Crombie, R.I. 1994. A working list of the currently recognized species of amphibians and reptiles found in the Philippines(unpublished manuscript). National Museum of Natural History. Smithsonian Institution Washington D.C. USA.
DENR. Administrative Order No. 34 Series of 1990.
Dickinson, E.C., R.S. Kennedy, and K.C. Parkes. 1991. The Birds of the Philippines. British Ornithologists’ UnionChecklist No. 12.
Fortes, M.D. 1995. Seagrasses of East Asia: Environmental and Management Perspectives. UNEP. Bangkok.
Heaney, L.R., D.S. Balete, M.L. Dolar, A.C. Alcala, A.T.L. Dans, P.C. Gonzales, N.R. Ingle, M.V. Lepiten, W.L.R.Oliver, P.S. Ong, E.A. Rickart, B.R. Tabaranza, Jr., and R.C.B. Utzurrum. 1998. A synopsis of the MammalianFauna of the Philippine Islands. Fieldiana: Zoology Series.
Hunting Technical Services Limited. 1983. Final Report of Water Resources Annex.
Hunting Technical Services Limited. 1985. Environment Monitoring Evaluation System (EMES) Annual Report.
Ingle, N.R. and L.R. Heaney. 1992. A Key to the Bats of the Philippine Islands. Fieldiana Zoology, 69:1-44.
IUCN Red List of Threatened Species. www. redlist.org
Japan Forest Technical Association. 1992. Tropical Forest Resources Survey.
Kennedy, R.S., P.C. Gonzales, E.C. Dickinson, H.C. Miranda, Jr., and T.H. Fisher. 2000. A Guide to the Birds ofthe Philippines. Oxford University Press.
Melana and Gonzales. 1996. Field Guide to the Identification of Some Mangrove Plant Species in the Philippines.Department of Environment and Natural Resources, Philippines.
National Statistics Office. 1975. Census of Population.
National Statistics Office. 1980. Census of Population
National Statistics Office. 1990. Census of Population
National Statistics Office. 1995. Census of Population
National Statistics Office. 2000. Census of Population
PAGASA. 1949-2003.

STATE OF THE ENVIRONMENT 101
PCSDS Rainfall Stations. 1997-2003.
PCSDS. 1996. LANDSAT Images.
PCSDS. 2000. Land Cover Map of Palawan.
PCSDS. 1996-2003. Laboratory Reports.
Philippine Coconut Authority. Coconut Industry Profile, Palawan.
Rabor, D.S. 1986. Guide to Philippine Flora and Fauna Vol. XI. Birds and Mammals. Nat. Res. Mgt. Center andUniversity of the Philippines.
Rio Tuba Nickel Mines Co. 1985-2003.
Soriano Mining Company. 1973-1984.
Tan. J.M.L. 1995. A Field Guide to Whales and Dolphins of the Philippines (reprinted 1997). Bookmark, Inc.
Wildlife Conservation Society of the Philippines. 1997. Philippine Red Data Book, College, Laguna, Philippines.
World Conservation Monitoring Centre. 2000. IUCN Red List of Threatened Animals. International Union forConservation of Nature and Natural Resources - The World Conservation Union.


STATE OF THE ENVIRONMENT 103
APPENDICES

104 PALAWAN
AREALANDFORM TYPES (HA) PERCENT
01 Fishpond 525 0.04COASTAL 02 Mangrove and/or nipa 26070 3.9
03 Beach ridges and swales build-up 26594 1.8506 River Levee 1410 0.107 River terrace 6595 0.4609 Broad Plain 26799 1.87
BROAD ALLUVIAL PLAINS 10 Swamp and marshes, tree types 4555 0.3211 Swamp and marshes, grass types 8629 0.616 Infilled valley/localized valley 21276 1.4817 Inland valley/enclosed valley 31438 2.1918 Collu-alluvial valley 30008 2.0919 Narrow alluvial plains 17736 1.24
MINOR ALLUVIAL PLAINS 20 Broad alluvial valley 31545 2.1921 Alluvial terrace 39422 2.7422 Level to gently sloping 23532 1.63
TERRACES (Residual Soils) 23 Gently sloping to undulating 44357 3.0824 Undulating to rolling 42935 2.98
PLAINS 36 Limestone Plain 1560 1.1045 Plateau undissected 11115 0.77
PLATEAU 46 Plateau dissected 13672 0.9552 Undulating to rolling, dissected upper volcanic
plateau, steep side slope and dissected scarp 2542 0.1764 Limestone hills, low relief 5501 0.3865 Limestone hills, high relief 9217 0.64
HILLS (Sedimentary) 69 Shale/sandstone hills, low relief 14996 1.0470 Shale/sandstone hills, hig relief 31724 2.2180 Complex, unconsolidated sediments hills, low
and high relief 31015 2.1683 Basaltic hills, low relief 11483 0.8
HILLS (Volcanic) 84 Basaltic hills, high relief 9591 0.6689 Ultrabasic hills, low relief 11557 0.890 Ultrabasic hills, high relief 28012 1.95104 Metamorphic hills, low relief 85302 5.94
HILLS (Metamorphic) 105 Metamorphic hills, high relief 190902 13.29110 Meta-volcanic hills, low relief 228889 15.93111 Meta-volcanic hills, high relief 43813 3.05118 Karstic limestone mountain, rocky 66660 4.64131 Metamorphic mountain 15978 1.11
MOUNTAINS 132 Ultrabasic mountain 144804 1.03136 Low, meta-volcanic mountain 69978 4.87137 High, meta-volcanic mountain 44570 3.1169 Beach sand 22094 1.54170 River wash 2088 0.15
MISCELLANEOUS 172 Plateau scarpment 40621 2.83174 Lakes 80 0.01178 Quarry 1692 0.117182 Salbed 52 0.003
mm/annexA_1/emes manual (2001)
APPENDIX A-1. The Different Geomorphic Units and Land Management Units and their Extent of Palawan Province, 1988-89
LAND MANAGEMENT UNITS

STATE OF THE ENVIRONMENT 105
WaterTexture Depth Holding Internal External
(cm) Capacity Soil Soil(%) Drainage Drainage
01 FISH POND
This land unit occupies the smallest area Sandy Moderately High Poorly Pondedlocated in the municipality of Roxas and Puerto clay loam deep drainedPrincesa City. They were formerly mangrove to clayarea and developed into fishponds. The area isapproximately 525 hectares or 0.04 percent.
02 MANGROVE
This land management unit is sporadically Loamy Moderately Medium Poorly Pondedlocated along the beach and mostly along sand to deep drainedmouth of rivers and creeks. The biggest area is clayfound at the head of the Malampaya Sound andin the municipality of Roxas. The approximatearea is 56,070 hectares or equivalent to 3.9%.
03 BEACH RIDGES AND SWALES
This land unit was classified along the Sandy to Shallow Low Somewhat Rapidseashore of Palawan Islands. It covers 26,594 silt loam excessivelyhectares or 1.85%. drained
06 RIVER LEVEE
This land unit was identified in Barangay Silt loam Deep Medium Moderately SlowAbongan, municipality of Taytay and covers to silty well drained1,410 hectares or 10%. clay loam to some-
what poorlydrained
07 RIVER TERRACE
The area of this soil unit was classified in Sandy Deep Medium Moderately SlowBrgy. Bacungan, Puerto Princesa City and in clay loam well drainedthe municipality of Quezon and Narra. It has to clayan approximated area of 6,595 has. or loamequivalent to 0.46%.
09 BROAD PLAIN
It was mapped in the municipality of Sandy Deep Medium Moderately SlowBataraza, Brooke's Point, Quezon, Rizal, clay loam well drainedNarra, Aborlan,Taytay and Puerto Princesa to clay to poorly City. The area is approximately 26,799 drained hectares or 1.87%.
PHYSICAL CHARACTERISTICS
APPENDIX A-2. Physical Soil Characteristic by Land Management Unit, Palawan.
Land Management Unit

106 PALAWAN
WaterTexture Depth Holding Internal External
(cm) Capacity Soil Soil(%) Drainage Drainage
16 INFILLED VALLEYS
This landscape was sporadically classified Sandy Deep Medium Moderately Slowin all the municipalities of the mainland and clay loam wellsome islands municipalities except Agutaya, to clay drained toCuyo and Magsaysay. The area covered is poorlyapproximately 21,279 has. or equivalent to drained 1.48%.
17 ENCLOSED VALLEYS
This land unit was mapped in the municipalities Sandy Deep Medium Moderately Slow to of Busuanga, Coron, El Nido, Taytay, San clay loam well drained moderateVicente, Dumaran, Roxas, Quezon, Rizal, to clay to poorlyBrooke's Point, Aborlan and Puerto Princesa drainedCity. It has an aggregate area of 31,438 has.or 2.19 percent.
18 COLLO-ALLUVIAL FAN
This LMU was mapped in the municipalities Sandy Deep Medium Moderately Slowof Narra, Brooke's Point and Bataraza with a clay loam well drainedtotal area of 30,008 has. or 2.09 percent. to clay to some-
what poorlydrained
19 NARROW ALLUVIAL PLAINS
Mapped in the municipality of Busuanga, Silty clay Deep Low Somewhat SlowCoron, El Nido, Taytay, Cuyo, Araceli, San loam to poorly Vicente, Dumaran, Roxas, Aborlan, Quezon, clay drained to Rizal, Brooke's Point, Bataraza and Puerto poorly Princesa City. It covered an aggregate area of drained17,736 has. or equivalent to 1.24%.
20 BROAD ALLUVIAL VALLEY
This land management unit is widely spread Sandy Deep Medium Moderately Slowin most of the municipalities of Palawan except clay loam well drainedCuyo, Magsaysay and Agutaya. The area is to clay to poorly31,545 hectares or equivalent to 2.19 percent. drained
21 ALLUVIAL TERRACE
Classified in the municipalities of Aborlan, Clay loam Moderately Medium Moderately Slow to Narra, Brooke's Point and Bataraza with an to clay Deep well drained Mediumaggregate area of 39,422 hectares or 2.74%. to some-
what poorlydrained
APPENDIX A-2. Physical Soil Characteristic by Land Management Unit, Palawan (continued).
PHYSICAL CHARACTERISTICS
Land Management Unit

STATE OF THE ENVIRONMENT 107
WaterTexture Depth Holding Internal External
(cm) Capacity Soil Soil(%) Drainage Drainage
22 LEVEL TO GENTLY SLOPING, RESIDUALTERRACE
Classified in most of the municipalities of Sandy moderately Low Well SlowPalawan and Puerto Princesa City except clay loam deep drained toNarra and Aborlan. The area covered is to clay somewhatapproximately 23,532 hectares or equivalent to poorly1.63%. drained
23 SLOPING TO UNDULATING RESIDUALTERRACE
Sporadically classified in most municipalities Sandy Moderately Medium Moderately Slow toof the province except Narra and Aborlan. It has clay loam deep well drained Mediuman approximate area of 44,357 hectares or to clay to some-3.08%. what poorly
drained24 UNDULATING TO ROLLING, RESIDUAL
TERRACE
Mapped in the municipalites of El Nido, Clay loam Moderately Medium Well MediumTaytay, Cuyo, Magsaysay, San Vicente, to clay deep drained toAraceli, Dumaran, Roxas, Aborlan, Narra, moderatelyQuezon, Brooke's Point, Bataraza and Puerto well drainedPrincesa City with an aggregate area of 42,935hectares or 2.98%.
36 LIMESTONE PLAIN
This land facet is located in the municipalities Clay Moderately High Somewhat Slowof Quezon, Rizal and Puerto Princesa City with a deep poorly total area of 15,860 hectares or 1.10%. drained
45 PLATTEAU, UNDISSECTED
Identified in the municipality of Coron with an Sandy Moderately Low Moderately Slow toaggregate area of 11,115 hectares or 0.77%. clay loam deep well medium
to clay drainedloam
46 PLATTEAU, DISSECTED
Located in the municipality of Busuanga, Sandy Shallow Low Moderately Slow toCoron, Quezon, Bataraza and Puerto Princesa clay loam well drained mediumCity. It has an aggregate area of 14,672 hectares to clay to well or 0.9%. loam drained
APPENDIX A-2. Physical Soil Characteristic by Land Management Unit, Palawan (continued).
PHYSICAL CHARACTERISTICS
Land Management Unit

108 PALAWAN
WaterTexture Depth Holding Internal External
(cm) Capacity Soil Soil(%) Drainage Drainage
64 LIMESTONE HILLS, LOW RELIEF
The area of this land management was Clay Moderately High Moderately Rapidmapped in the municipality of Quezon, Rizal, deep well drainedBrooke's Point, Bataraza. It has an aggregate to some-area of 5,501 hectares or equivalent to 0.38%. what poorly
drained65 LIMESTONE HILLS, HIGH RELIEF
This land management unit is found in the Clay Moderately Medium Moderately Rapidmunicipality of Quezon, Rizal, Brooke's Point deep well drainedandBatarazawith an approximate area of 9,217 to well hectares or 0.64%. drained
69 SHALE/SANDSTONE HILLS, LOW RELIEF
Classified in the municipality of Roxas, Clay loam Moderately Medium Moderately RapidQuezon, Rizal, Brooke's Point, Bataraza and to clay deep well drainedPuerto Princesa City. The area is approximately14,996 has. or 1.04%.
70 SHALE/SANDSTONE HILLS, HIGH RELIEF
Located in the municipality of Quezon, Clay loam Moderately Medium Moderately RapidRizal, Bataraza, Brooke's Point and Puerto to clay deep well drainedPrincesa City. It has an approximate area31,724 has. or equivalent to 2.21%.
80 UNCONSOLIDATED COMPLEX SEDIMENTHILLS, LOW AND HIGH RELIEF
Classified in the municipality of Bataraza, Sandy Shallow Low Well MediumBrooke's Point, Rizal, Quezon, Narra, Aborlan clay loam drainedand Puerto Princesa City. The area is to clayapproximately 31,015 hectares or equivalent to2.16%.
83 BASALTIC HILLS, LOW RELIEF
Identified in the municipality of Magsaysay, Sandy Shallow Medium Well RapidCuyo and Agutaya with an approximate area of clay loam drained11,438 hectares or 0.80%. to clay
84 BASALTIC HILLS, HIGH RELIEF
Found in the municipality of Agutaya, Cuyo Sandy Shallow Medium Well Rapidand Magsaysay with an aggregate area of 9,591 clay loam to high drainedhectares equivalent to 0.66 percent. to clay
PHYSICAL CHARACTERISTICS
Land Management Unit
APPENDIX A-2. Physical Soil Characteristic by Land Management Unit, Palawan (continued).

STATE OF THE ENVIRONMENT 109
WaterTexture Depth Holding Internal External
(cm) Capacity Soil Soil(%) Drainage Drainage
89 ULTRABASIC HILLS, LOW RELIEF
This land unit was classified in the municipality Clay loam Moderately Medium Moderately Rapidof Bataraza, Brooke's Point, Quezon, Narra, to clay deep well drainedAborlan and Puerto Princesa City. The area is to wellapproximate 11,557 has. or 0.80 percent. drained
90 ULTRABASIC HILLS, HIGH RELIEF
The unit was identified in the municipality of Clay Shallow Medium Moderately RapidAborlan, Narra, Brook'es Point, Quezon, Rizal, well drainedBataraza and Puerto Princesa City. It has an to wellapproximate area of 28,012 has. or 1.95 percent. drained
104 METAMORPHIC HILLS, LOW RELIEF
This land unit occupies the low relief hills from Sandy Shallow Low Well Rapidthe municipality of Busuanga, Coron, El Nido, clay loam drainedTaytay, San Vicente, Araceli, Dumaran to Roxas to clay and the northern portion of Puerto Princesa City. loamIt is approximately 85,302 has. or 5.94 percent.
105 METAMORPHIC HILLS, HIGH RELIEF
This unit occupies the highest hills from Sandy Shallow Low Well RapidBusuanga to northern portion of Puerto Princesa clay loam drainedCity. It has an aggregate area of 190,902 has. or to clay 13.29 percent. loam
110 METAVOLCANIC HILLS, LOW RELIEF
Mapped in the municipality of El Nido, Roxas, Clay loam Moderately Low Well RapidSan Vicente, Quezon, Brooke's Point, Rizal, to clay deep drainedBataraza and Puerto Princesa City with a total area of 228,889 hectares or 15.96%.
111 METAVOLCANIC HILLS, HIGH RELIEF
Classified in the municipality of Bataraza, Clay loam Moderately Low Well Rapid toRizal, Brooke's Point, Quezon, Roxas, San to clay deep drained very rapidVicente, El Nido and Puerto Princesa City. Thearea is about 43,813 hectares or equivalent to3.05%.
131 METAMORPHIC MOUNTAINS
Mapped in the municipality of Roxas, Brooke's Sandy Shallow Low Well drainedRapid toPoint and Puerto Princesa City. It has an clay loam rapid very rapidaggregate area of 15,978 has. or 1.11 percent. to clay
loam
PHYSICAL CHARACTERISTICS
Land Management Unit
APPENDIX A-2. Physical Soil Characteristic by Land Management Unit, Palawan (continued).

110 PALAWAN
WaterTexture Depth Holding Internal External
(cm) Capacity Soil Soil(%) Drainage Drainage
132 ULTRABASIC MOUNTAIN
This unit classified in the municipality of Clay loam Shallow Low Moderately Rapid toBataraza, Rizal, Brooke's Point, Quezon, Narra, to clay well drained very rapidAborlan and Puerto Princesa City. It is to well represented by Mt. Calibugon, Scapado Peak, drainedTripal Top, Central Anipahan Peak, Bulian Peak,Paltate Range and Victoria range with highestelevation of more or less 1600 meters. The areacovered is approximately 14,804 hectares or equivalent to 1.03%.
136 LOW, META-VOLCANIC MOUNTAIN (LMU)
This LMU occupies an elevation from 500 to Clay loam Moderately Well drainedRapid1000 meters mapped widely in the municipality of to clay deepBrooke's Point and small area in El Nido and alsofound in the mountain boundary of Roxas and Puerto Princesa City toward south direction. It isrepresented by Addisonand Strip Peak. It has anapproximate area of 69,978 hectares or equivalentto 4.87%.
137 HIGH, META-VOLCANIC MOUNTAIN (LMU)
This represent the Mantalingan range from Clay loam Moderately Well drainedRapid1000 to more than 2200 meters highest elevation to clay deepfound in the municipality of Brooke's with anapproximate area of 44,473 hectares or 3.10percent.
mm/annexA_2/emes report 1999
Source: The Physical Environment (Volume I) Department of Agriculture Bureau of Soils and Management Manila, 1998
PHYSICAL CHARACTERISTICS
Land Management Unit
APPENDIX A-2. Physical Soil Characteristic by Land Management Unit, Palawan (continued).

STATE OF THE ENVIRONMENT 111
Cation OrganicReaction Exchange Matter Available
(pH) Capacity Content Phospho- Potas- Manga- Cal-(meq/100g) (%) rous sium nese cuim
01 FISH POND
This land unit occupies 3.5; maximum Adequate Medium Possibly High to High Highthe smallest area located in availabilityand Deficient Lowthe municipalities of Roxas possibleand Puerto Princesa City. toxicity ofThey were formerly mangrove micro-nutrientsarea and developed intofishponds. The area isapproximately 525 hectaresor 0.04 percent.
02 MANGROVE
This land management 4.2 to 5.2; Adequate Medium Very High High Highunit is sporadically located maximum Deficientalong the beach and mostly availability andalong mouth of rivers and possiblecreeks. The biggest area is toxicity offound at the head of the micro-nutrientsMalampaya Sound and in themunicipality of Roxas. Theapproximate area is 56,070hectares or equivalent to3.9%.
03 BEACH RIDGES AND SWALES
This land unit was 4.7 to 7.9; Marginal Low Deficient Low High Highclassifief along the seashore optimalofPalawan Islands. It covers availability of26,594 hectares or 1.85%. nutrients
06 RIVER LEVEE
This land unit was 4.1 to 4.6; Adequate Low Deficient Low High Highidentified in Barangay maximumAbongan, Municipality of availability andTaytay to covers 1,410 possiblehectares or 0.10%. toxicity of
micro-nutrients
APPENDIX A-3. Chemical Soil Characteristics by Land Management Unit, Palawan.
CHEMICAL CHARACTERISTICSEXCHANGEABLE BASES
Land Management Unit

112 PALAWAN
Cation OrganicReaction Exchange Matter Available
(pH) Capacity Content Phospho- Potas- Manga- Cal-(meq/100g) (%) rous sium nese cuim
07 RIVER TERRACE
The area of this soil unit 5.8 to 6.1; Adequate Medium Deficient Medium toHigh Highwas classified in Brgy. optimal LowBacungan, Puerto Princesa availability ofCity and in the municipality of nutrientsQuezon and Narra. It has anapproximate area of 6,595has. or equivalent to 0.46%.
09 BROAD PLAIN
It was mapped in the 3.9 to 6.7; Marginal Medium Deficient Low High Highmunicipality of Bataraza, marginalBrooke's Point, Quezon, availability of Rizal, Narra, Aborlan, Taytay nutrientsand Puerto Princesa City. The area is approximately26,799 hectares or itrepresents 1.87%.
16 INFILLED VALLEYS
This landscape was 4.1 to 6.5; Marginal Medium Deficient Medium High Highsporadically classified in all marginal to lowthe municipalities of the availability ofmainland and some island nutrientsmunicipalities exceptAgutaya, Cuyo andMagsaysay. The areacovered is approximately21,279 has. or equivalent to1.48%.
17 ENCLOSED VALLEYS
This land was mapped 4.2 to 4.7; Adequate Medium Possibly High to High Highin the municipalities of maximum deficient mediumBusuanga, Coron, El Nido, availability andTaytay, San Vicente, possibleDumaran , Roxas, Quezon, toxicity ofRizal, Brooke's Point, Aborlan micro-nutrientsand Puerto Princesa City. Ithas an aggregate area of31,438 has. or 2.19 percent.
EXCHANGEABLE BASESCHEMICAL CHARACTERISTICS
Land Management Unit
APPENDIX A-3. Chemical Soil Characteristics by Land Management Unit, Palawan (Continued).

STATE OF THE ENVIRONMENT 113
Cation OrganicReaction Exchange Matter Available
(pH) Capacity Content Phospho- Potas- Manga- Cal-(meq/100g) (%) rous sium nese cuim
18 COLLO-ALLUVIAL FAN
This LMU was mapped 4.7 to 6.6; Adequate Medium Adequate High to High Highin the municipalities of Narra, marginal mediumBrooke's Point and Bataraza availabilityofwith a total area of 30,008 has. nutrientsor 2.09 percent.
19 NARROW ALLUVIAL PLAINS
Municipality of Busuanga, 4.6 to 5.9; Marginal Low Deficient Low High HighCoron, El Nido, Taytay, Cuyo, maximumAraceli, San Vicente, availability and Dumaran, Roxas, Aborlan, possibleQuezon, Rizal, Brooke's toxicity ofPoint, Bataraza and Puerto micro-nutrientsPrincesa City. It covered anaggregate area of 17,736 has.or represent 1.24%.
20 BROAD ALLUVIALVALLEY
This land management 4.2 to 5.6; Marginal Medium Deficient Medium High Highunit is widely spread in most maximum to low to lowof the municipalities of availability andPalawan except Cuyo, possibleMagsaysay and Agutaya. toxicity ofThe area is 31,545 hectares micro-nutrientsor equivalent to 2.19 percent.
21 ALLUVIAL TERRACE
Classified in the 5.4; marginal Marginal Medium Possibly Low High Highmunicipalities of Aborlan, availability of DeficientNarra, Brooke's Point and nutrientsBataraza with an aggregatearea of 39,422 hectares orequivalent to 2.74%.
CHEMICAL CHARACTERISTICSEXCHANGEABLE BASES
Land Management Unit
APPENDIX A-3. Chemical Soil Characteristics by Land Management Unit, Palawan (Continued).

114 PALAWAN
Cation OrganicReaction Exchange Matter Available
(pH) Capacity Content Phospho- Potas- Manga- Cal-(meq/100g) (%) rous sium nese cuim
22 LEVEL TO GENTLYSLOPING, RESIDUALTERRACE
Classified in most of the 4.2 to 5; Marginal Medium Deficient High to High Highmunicipalities of Palawan and maximum mediumPuerto Princesa City except availability andNarra and Aborlan. The area possiblecovered is approximately toxicity of23,532 hectares or equivalent micor-nutrientsto 1.63%.
23 SLOPING TO UNDULATINGRESIDUAL TERRACE
Sporadically classified in 4.0 to 5.9; Marginal Medium Possibly Medium High Highmost municipalities of the maximum deficientprovince except Narra and availability andAborlan. It has an possibleapproximate area of 44,357 toxicity ofhectares or 3.08%. micro-nutrients
24 UNDULATING TO ROLLING,RESIDUAL TERRACE
Mapped in the 4.2 to 6.9; Adequate Medium Possibly High High Highmunicipalities of El Nido, optimal deficientTaytay, Cuyo, Magsaysay, availability ofSan Vicente, Araceli, nutrientsDumaran, Roxas, Aborlan,Narra, Quezon, Brooke'sPoint, Bataraza and PuertoPrincesa City with anaggregate area of 42,935hectares. It represents2.98%.
36 LIMESTONE PLAIN
This land facet is located 5.4 to 6.1; Marginal Hight to Possibly Low High Hiighin the municipalities of optimal medium deficientQuezon, Rizal and Puerto availability ofPrincesa City with a total area nutrientsof 15,860 hectares or 1.10%.
CHEMICAL CHARACTERISTICSEXCHANGEABLE BASES
Land Management Unit
APPENDIX A-3. Chemical Soil Characteristics by Land Management Unit, Palawan (Continued).

STATE OF THE ENVIRONMENT 115
Cation OrganicReaction Exchange Matter Available
(pH) Capacity Content Phospho- Potas- Manga- Cal-(meq/100g) (%) rous sium nese cuim
45 PLATTEAU, UNDISSECTED
Identified in the munci- 4.7; maximum Marginal Medium Possibly Medium Low to Low topality of Coron with an availability and deficient to Low Medium Mediumaggregate area of 11,115 possiblehectares or 0.77%. toxicity of
micro-nutrients46 PLATTEAU DISSECTED
Located in the munici- 4.5 to 4.8; Deficient to Medium Deficient Low Low Lowpality in Busuanga, Coron, maximum marginal to lowQuezon, Bataraza and Puerto availability andPrincesa City. It has an possibleaggregate area of 14,672 toxicity ofhectares or 0.95%. micro-nutrients
64 LIMESTONE HILLS,LOW RELIEF
The area of this land 7.1 to 7.3; Adequate Medium Possibly High High Highmanagement was mapped in optimal deficientthe municipality of Quezon, availability ofRizal, Brooke's Point, nutrientsBataraza. It has anaggregate area of 5,501hectares or equivalent to0.38%.
65 LIMESTONE HILLS,HIGH RELIEF
This land management 5.8 to 6.1; optimalAdequate High to Possibly High to High Highunit is found in the availability of medium Deficient lowmunicipality of Quezon, Rizal, nutrientsBrooke's Point and Batarazawith an approximate area of9,217 hectares or 0.64%.
69 SHALE/SANDSTONEHILLS, LOW RELIEF
Classified in the munici- 5.8 to 6.1; Adequate Medium Deficient Low Medium Mediumpality of Roxas, Quezon, optimal to low to high to highRizal, Brooke's Point, availability ofBataraza and Puerto Princesa nutrientsCity. The area isapproximately 14,996 has.representing 1.04%.
Land Management Unit
CHEMICAL CHARACTERISTICSEXCHANGEABLE BASES
APPENDIX A-3. Chemical Soil Characteristics by Land Management Unit, Palawan (Continued).

116 PALAWAN
Cation OrganicReaction Exchange Matter Available
(pH) Capacity Content Phospho- Potas- Manga- Cal-(meq/100g) (%) rous sium nese cuim
70 SHALE/SANDSTONEHILLS, HIGH RELIEF
Located in the munici- 4.5 to 5.00; Adequate Medium Very High to High Highpality of Quezon, Rizal, maximum to low deficient mediumBataraza, Brooke's Point and availability andPuerto Princesa City. It has possiblean approximate area of toxicity of 31,724 has. or equivalent to micro-nutrients2.21%.
80 COMPLEX UNCON-SOLIDATED SEDIMENTHILLS, LOW AND HIGHRELIEF
Classified in the munici- 4.9; maximum Deficient Medium Very Low High Highpality of Bataraza, Brooke's availability and deficientPoint, Rizal, Quezon, Narra, possibleAborlan and Puerto Princesa toxicity ofCity. The area is micro-nutrientapproximately 31,015hectares. It represents2.16%.
83 BASALTIC HILLS, LOWRELIEF
Identified in the munici- 4.9 to 5.2; Adequate Medium Deficient High High Highpality of Magsaysay, Cuyo marginaland Agutaya with an availability ofapproximate area of 11,438 nutrientshectares or 0.80%.
84 BASALTIC HILLS, HIGHRELIEF
Found in the municipality 6.0 to 6.2; Adequate Medium Deficient High High Highof Agutaya, Cuyo and optimalMagsaysay with an aggregate availability ofarea of 9,591 hectares or nutrientsequivalent to 0.66 percent.
CHEMICAL CHARACTERISTICSEXCHANGEABLE BASES
Land Management Unit
APPENDIX A-3. Chemical Soil Characteristics by Land Management Unit, Palawan (Continued).

STATE OF THE ENVIRONMENT 117
Cation OrganicReaction Exchange Matter Available
(pH) Capacity Content Phospho- Potas- Manga- Cal-(meq/100g) (%) rous sium nese cuim
89 ULTRABASIC HILLS,LOW RELIEF
This land unit was classi- 4.6 to 6.0; Adequate Medium Deficient Low High Highfied in the municipality of marginalBataraza, Brooke's Point, availability ofQuezon, Narra, Aborlan and nutrientsPuerto Princesa City. Thearea is approximate 11,557has. or 0.80 percent.
90 ULTRABASIC HILLS,HIGH RELIEF
This unit was identified 4.7 to 6.0; Adequate Medium Possibly Low High Highin the municipality of Aborlan, marginal deficientNarra, Bataraza and Puerto availability ofPrincesa City. It has an nutrientsapproximate area of 28,012has. or 1.95 percent.
104 METAMORPHIC HILLS.LOW RELIEF
The land unit occupies 4.1 to 4.9; Deficient Medium Deficient Medium Mediumthe low relief hills from the maximum to lowmunicipality of Busuanga, availability andCoron, El Nido, Taytay, San possibleVicente, Araceli, Dumaran to toxicity ofRoxas and the northern micro-nutrientsportion of Puerto PrincesaCity. It is approximately85.302 has. or 5.94 percent.
105 METAMORPHIC HILLS, HIGH RELIEF
The unit occupies the 4.2 to 4.9; Marginal Medium Deficient Medium Low Lowhighest hills from Busuanga maximum to lowto northern portion of Puerto availability andPrincesa City. It has an possibleaggregate area of 190,902 toxicity ofhas. or 13.29 percent. micro-nutrients
EXCHANGEABLE BASESLand Management Unit
CHEMICAL CHARACTERISTICS
APPENDIX A-3. Chemical Soil Characteristics by Land Management Unit, Palawan (Continued).

118 PALAWAN
Cation OrganicReaction Exchange Matter Available
(pH) Capacity Content Phospho- Potas- Manga- Cal-(meq/100g) (%) rous sium nese cuim
110 METAVOLCANIC HILLS,LOW RELIEF
Mapped in the munici- 4.9; maximum Deficient Medium Possibly High Low Lowpality of El Nido, Roxas, San availability and deficientVicente, Quezon, Brooke's possiblePoint, Rizal, Bataraza and toxicity ofPuerto Princesa City with micro-nutrientstotal area of 228,889 hectaresor 15.93%.
111 METAVOLCANIC HILLS,HIGH RELIEF
Classified in the munici- 4.9; maximum Deficient Medium Possibly High Low Lowpality of Bataraza, Rizal, availability and deficientBrooke's Point, Quezon, possibleRoxas, San Vicent, El Nido toxicity ofand Puerto Princesa City. micro-nutrientsThe areas is about 43,813hectares or equivalent to3.0%.
mm/annexA_3/emes report 1999
Source: The Physical Environment (Volume I) Department of Agriculture Bureau of Soils and Management Manila, 1998
Land Management Unit
CHEMICAL CHARACTERISTICSEXCHANGEABLE BASES
APPENDIX A-3. Chemical Soil Characteristics by Land Management Unit, Palawan (Continued).

STATE OF THE ENVIRONMENT 119
APPE
ND
IX B
-1.
1992
Lan
d C
over
by
Cat
egor
y by
Mun
icip
ality
, Pal
awan
.
Prov
ince
Abor
-Ar
a-B
alab
acB
ata-
Bro
oke'
sB
u-C
oron
Cul
ion
Dum
a-El
Lina
-N
arra
Puer
toQ
uezo
n la
nce
lira
zaPo
int
suan
gara
nN
ido
paca
nPr
ince
saF
ores
t Cov
er
738,
886
46,3
9511
214
,742
22,8
1325
,940
21,0
4726
,212
18,3
3318
,281
23,5
024,
253
46,5
0915
5,83
256
,992
Prim
ary
fore
st33
3,38
021
,008
05,
731
8,92
78,
958
6,24
45,
298
4,53
412
,735
5,20
085
414
,344
82,3
5420
,260
Mos
sy fo
rest
40,8
644,
924
493
1,83
45,
546
6,15
611
,748
5,24
8R
esid
ual f
ores
t33
5,89
318
,260
112
8,48
712
,225
14,4
8114
,803
16,7
2713
,799
17,5
462,
863
19,4
5652
,450
30,7
00M
argi
nal f
ores
t27
,651
2,20
352
41,
163
667
4,18
775
46,
551
8,74
677
3K
arst
/lim
esto
ne1,
098
52
536
253
411
Man
grov
e ar
eas
50,6
021,
183
2,73
52,
862
6,58
823
41,
405
2,05
12,
558
5,32
52,
357
2,79
885
94,
052
1,39
2B
rush
land
245,
585
8,92
05,
349
14,1
0214
,441
7,79
16,
792
6,33
38,
609
18,7
6912
,801
58,
403
29,9
4515
,169
Coc
onut
pla
ntat
ion
26,3
971,
235
289,
731
1,78
11,
637
1,09
914
220
373
331,
473
3,15
12,
388
Oth
er p
lant
atio
n7,
942
496
358
376
6,71
2G
rass
land
252,
025
11,1
598,
605
5,85
618
,216
16,6
6810
,299
25,8
0310
,708
12,4
1614
,471
517
,687
14,5
6010
,239
Pad
dy fi
eld
42,8
933,
764
222
651,
015
6,15
144
053
41,
116
1,06
174
03
5,15
13,
581
1,67
6C
ropl
and
13,8
2142
18
1,98
738
51,
860
658
874
694
6895
671
81,
236
Bar
e/ro
cky
area
s9,
607
5540
053
1422
2,30
13
92,
109
209
385
90M
inin
g ar
ea1,
468
708
708
52B
uilt-
up a
rea
1,08
361
112
169
125
2377
176
17F
ishp
ond
170
103
Clo
uds/
shad
ow35
,138
956
316
5,69
41,
167
1,69
070
11,
787
206
861
6,27
213
2,79
41,
268
2,00
6La
kes
1,17
948
176
Tota
l1,
426,
796
74,0
8817
,375
55,5
0067
,279
62,8
6242
,960
66,9
0142
,829
56,7
9562
,285
13,8
5784
,170
213,
771
91,2
81
Cat
egor
y
Mun
icip
ality

120 PALAWAN
APPENDIX B-1. 1992 Land Cover by Category by Municipality, Palawan (continued).
Roxas Rizal San Sofronio TaytayVicente Espanola
Forest Cover 47,402 91,359 50,058 15,198 53,906Primary forest 29,772 42,715 38,105 5,556 20,785Mossy forest 31 4,131 28 725Residual forest 17,599 43,396 11,912 8,837 32,240Marginal forest 1,109 13 80 881Karst/limestone 8
Mangrove areas 3,512 2,352 995 834 6,510Brush land 28,758 16,614 10,487 11,560 20,737Coconut plantation 1,017 797 492 1,117Other plantationGrassland 13,233 13,600 7,437 12,423 28,640Paddy field 3,501 1,534 2,246 3,538 6,555Cropland 1,064 559 53 2,060 220Bare/rocky areas 37 153 302 18 3,447Mining areaBuilt-up area 262 22 25 101 12Fishpond 67Clouds/shadow 1,127 479 1,225 4,423 2,153Lakes 622
Total 99,913 127,469 73,320 51,339 122,802
Source: 1992 LANDSAT TM Tropical Forest Resources Survey Japan Forest Technical Association
MunicipalityCategory

STATE OF THE ENVIRONMENT 121
APPE
ND
IX B
-2.
1998
Lan
d C
over
Dat
a by
Cat
egor
y by
Mun
icip
ality
, Pal
awan
.
Prov
ince
Abor
-Ar
a-B
alab
acB
ata-
Bro
oke'
s B
u-C
oron
Cul
ion
Dum
a-El
Li
na-
Nar
raPu
erto
Que
zon
lan
celi
raza
Poin
tsu
anga
ran
Nid
opa
can
Prin
cesa
Fore
st C
over
483,
095
44,2
5540
713
,773
26,0
7430
,684
19,5
2727
,884
16,1
3219
,625
24,1
145,
283
41,3
0015
3,76
260
,275
Prim
ary
fore
st31
7,22
627
,178
8,90
411
,512
21,9
7414
,876
17,5
8211
,114
14,1
3411
,934
2,98
623
,482
109,
031
42,5
19M
ossy
fore
st18
,568
326,
335
5,86
42,
317
4,02
0R
esid
ual f
ores
t12
4,44
214
,961
407
4,86
913
,419
2,30
34,
651
8,42
85,
018
5,49
112
,170
2,29
75,
405
32,0
1213
,011
Mar
gina
l for
est
19,0
112,
112
1,03
66,
544
8,64
967
0K
arst
/lim
esto
ne
3,84
84
7572
1,87
410
51,
753
55M
angr
ove
area
s37
,818
1,39
12,
680
4,11
15,
738
524
1,51
22,
139
2,25
14,
937
2,38
137
51,
031
5,99
52,
753
Bru
shla
nd20
0,29
99,
472
9,37
213
,307
14,8
166,
741
13,3
3315
,484
14,8
7219
,459
24,3
993,
709
11,7
8827
,459
16,0
88C
ocon
ut p
lant
atio
n51
,201
3,40
71,
315
11,5
434,
910
9,02
448
31,
324
495
1,42
22,
021
772
4,33
94,
149
5,99
7O
ther
pla
ntat
ion
31,3
952,
631
625
1,77
91,
438
4,72
46,
692
4,64
264
020
72,
209
788
4,30
571
5G
rass
land
36,0
473,
614
2,39
22,
312
3,18
71,
177
2,65
78,
204
4,51
545
937
41,
379
2,26
93,
084
424
Pad
dy fi
eld
50,3
955,
841
497
929
3,83
110
,047
5832
234
32,
884
2,10
831
15,5
924,
484
3,42
8C
ropl
and
17,3
411,
625
2,34
62,
909
5915
226
918
11,
302
5724
57,
274
922
Bar
e/ro
cky
area
s7,
275
326
2,52
658
91,
191
2699
31,
211
413
Min
ing
area
1,09
01,
009
180
Bui
lt-up
are
a10
,962
239
289
322
3,11
71,
606
189
783
660
145
665
108
1,00
195
788
1F
ishp
ond
1,30
478
2323
415
253
028
7W
ater
bod
y2,
358
962
287
340
5331
394
411
419
958
325
5
T O
T A
L93
0,58
072
,975
####
#51
,456
68,2
9962
,567
42,6
6663
,495
44,0
9149
,601
57,9
1913
,923
79,6
9821
3,87
392
,438
Land
Cov
er (1
998)

122 PALAWAN
APPENDIX B-2. 1998 Land Cover Data by Category by Municipality, Palawan (continued).
Roxas Rizal San Sofronio TaytayVicente Espanola
Forest Cover 52,671 104,538 57,916 19,270 71,806Primary forest 32,495 71,102 52,934 12,203 48,410Mossy forest 572 6,898 16 1,217Residual forest 19,537 26,240 4,577 5,750 23,392Marginal forest 6 29 13Karst/limestone 61 269 376 100 4
Mangrove areas 2,028 3,066 1,469 1,499 5,466Brushland 30,846 7,080 5,811 21,760 31,457Coconut plantation 3,794 5,800 1,823 2,416 5,429Other plantation 561 810 397 628 44Grassland 308 710 533 856 1,422Paddy field 7,095 3,005 3,337 2,840 13,506Cropland 631 1,171 296 1 1,489Bare/rocky areas 304 345 487 136 396Mining areaBuilt-up area 77 1,098 90 491 561Fishpond 43 340 125Water body 28 144 129 38 2,490
T O T A L 98,343 127,767 72,331 50,275 134,191
Source: 1998 LANDSAT TMPalawan Council for Sustainable Development Staff (PCSDS)
Land Cover (1998)

STATE OF THE ENVIRONMENT 123
APPE
ND
IX B
-3.
Com
para
tive
Land
Cov
er D
ata
by M
unic
ipal
ity, P
alaw
an.
1992
1998
Cha
nge
1992
1998
Cha
nge
1992
1998
Cha
nge
1992
1998
Cha
nge
For
est C
over
46
,395
44,2
55-2
,140
112
407
295
14,7
4213
,773
-969
22,8
1326
,074
3,26
1P
rimar
y fo
rest
21,0
0827
,178
6,17
05,
731
8,90
43,
173
8,92
711
,512
2,58
5M
ossy
fore
st4,
924
-4,9
2449
332
-461
Res
idua
l for
est
18,2
6014
,961
-3,2
9911
240
729
58,
487
4,86
9-3
,618
12,2
2513
,419
1,19
4M
argi
nal f
ores
t2,
203
2,11
2-9
152
4-5
241,
163
1,03
6-1
27K
arst
/lim
esto
ne4
45
7570
Man
grov
e ar
eas
1,18
31,
391
208
2,73
52,
680
-55
2,86
24,
111
1,24
96,
588
5,73
8-8
50B
rush
land
8,92
09,
472
552
5,34
99,
372
4,02
314
,102
13,3
07-7
9514
,441
14,8
1637
5C
ocon
ut p
lant
atio
n1,
235
3,40
72,
172
281,
315
1,28
79,
731
11,5
431,
812
1,78
14,
910
3,12
9O
ther
pla
ntat
ion
2,63
12,
631
625
625
1,77
91,
779
Gra
ssla
nd11
,159
3,61
4-7
,545
8,60
52,
392
-6,2
135,
856
2,31
2-3
,544
18,2
163,
187
-15,
029
Pad
dy fi
eld
3,76
45,
841
2,07
722
249
727
565
929
864
1,01
53,
831
2,81
6C
ropl
and
421
1,62
51,
204
8-8
1,98
72,
346
359
385
2,90
92,
524
Bar
e/ro
cky
area
s55
326
271
400
2,52
62,
126
5358
953
6M
inin
g ar
ea70
81,
009
301
Bui
lt-up
are
a23
923
928
928
961
322
261
112
3,11
73,
005
Fis
hpon
d78
78La
kes/
Wat
er B
ody
9696
22
287
287
340
340
Clo
uds/
shad
ow95
6-9
5631
6-3
165,
694
-5,6
941,
167
-1,1
67
Tota
l74
,088
72,9
75-1
,113
17,3
7517
,579
204
55,5
0051
,456
-4,0
4467
,279
68,2
991,
020
Bat
araz
aB
alab
ac
Cat
egor
y
Mun
icip
ality
Abor
lan
Arac
eli

124 PALAWAN
APPE
ND
IX B
-3.
Com
para
tive
Land
Cov
er D
ata
by M
unic
ipal
ity, P
alaw
an (c
ontin
ued)
.
1992
1998
Cha
nge
1992
1998
Cha
nge
1992
1998
Cha
nge
1992
1998
Cha
nge
For
est C
over
25
,940
30,6
844,
744
21,0
4719
,527
-1,5
2026
,212
27,8
841,
672
18,3
3316
,132
-2,2
01P
rimar
y fo
rest
8,95
821
,974
13,0
166,
244
14,8
768,
632
5,29
817
,582
12,2
844,
534
11,1
146,
580
Mos
sy fo
rest
1,83
46,
335
4,50
1R
esid
ual f
ores
t14
,481
2,30
3-1
2,17
814
,803
4,65
1-1
0,15
216
,727
8,42
8-8
,299
13,7
995,
018
-8,7
81M
argi
nal f
ores
t66
7-6
674,
187
-4,1
87K
arst
/lim
esto
ne72
721,
874
1,87
4M
angr
ove
area
s23
452
429
01,
405
1,51
210
72,
051
2,13
988
2,55
82,
251
-307
Bru
shla
nd7,
791
6,74
1-1
,050
6,79
213
,333
6,54
16,
333
15,4
849,
151
8,60
914
,872
6,26
3C
ocon
ut p
lant
atio
n1,
637
9,02
47,
387
1,09
948
3-6
1614
21,
324
1,18
220
349
529
2O
ther
pla
ntat
ion
1,43
81,
438
496
4,72
44,
228
358
6,69
26,
334
376
4,64
24,
266
Gra
ssla
nd16
,668
1,17
7-1
5,49
110
,299
2,65
7-7
,642
25,8
038,
204
-17,
599
10,7
084,
515
-6,1
93P
addy
fiel
d6,
151
10,0
473,
896
440
58-3
8253
432
2-2
121,
116
343
-773
Cro
plan
d1,
860
59-1
,801
658
152
-506
874
269
-605
694
181
-513
Bar
e/ro
cky
area
s14
1,19
11,
177
22-2
22,
301
-2,3
013
-3M
inin
g ar
ea70
8-7
08B
uilt-
up a
rea
169
1,60
61,
437
118
918
825
783
758
2366
063
7F
ishp
ond
2323
Lake
s/W
ater
Bod
y53
5331
3148
139
4-8
7C
loud
s/sh
adow
1,69
0-1
,690
701
-701
1,78
7-1
,787
206
-206
Tota
l62
,862
62,5
67-2
9542
,960
42,6
66-2
9466
,901
63,4
95-3
,406
42,8
2944
,091
1,26
2
Bro
oke'
s Po
int
Bus
uang
aC
oron
Cul
ion
M
unic
ipal
ityC
ateg
ory

STATE OF THE ENVIRONMENT 125
APPE
ND
IX B
-3.
Com
para
tive
Land
Cov
er D
ata
by M
unic
ipal
ity, P
alaw
an (c
ontin
ued)
.
1992
1998
Cha
nge
1992
1998
Cha
nge
1992
1998
Cha
nge
1992
1998
Cha
nge
For
est C
over
18
,281
19,6
251,
344
23,5
0224
,114
612
4,25
35,
283
1,03
046
,509
41,3
00-5
,209
Prim
ary
fore
st12
,735
14,1
341,
399
5,20
011
,934
6,73
485
42,
986
2,13
214
,344
23,4
829,
138
Mos
sy fo
rest
5,54
6-5
,546
6,15
65,
864
-292
Res
idua
l for
est
5,49
15,
491
17,5
4612
,170
-5,3
762,
863
2,29
7-5
6619
,456
5,40
5-1
4,05
1M
argi
nal f
ores
t75
4-7
546,
551
6,54
4-7
Kar
st/li
mes
tone
210
853
6-5
362
53
Man
grov
e ar
eas
5,32
54,
937
-388
2,35
72,
381
242,
798
375
-2,4
2385
91,
031
172
Bru
shla
nd18
,769
19,4
5969
012
,801
24,3
9911
,598
53,
709
3,70
48,
403
11,7
883,
385
Coc
onut
pla
ntat
ion
731,
422
1,34
933
2,02
11,
988
772
772
1,47
34,
339
2,86
6O
ther
pla
ntat
ion
640
640
207
207
6,71
22,
209
-4,5
0378
878
8G
rass
land
12,4
1645
9-1
1,95
714
,471
374
-14,
097
51,
379
1,37
417
,687
2,26
9-1
5,41
8P
addy
fiel
d1,
061
2,88
41,
823
740
2,10
81,
368
331
285,
151
15,5
9210
,441
Cro
plan
d1,
302
1,30
268
57-1
195
624
5-7
11B
are/
rock
y ar
eas
926
172,
109
-2,1
0920
999
378
4M
inin
g ar
ea52
1-5
1B
uilt-
up a
rea
145
145
665
665
108
108
771,
001
924
Fis
hpon
d23
423
415
215
2La
kes/
Wat
er B
ody
44
114
114
199
199
Clo
uds/
shad
ow86
1-8
616,
272
-6,2
7213
-13
2,79
4-2
,794
Tota
l56
,795
49,6
01-7
,194
62,2
8557
,919
-4,3
6613
,857
13,9
2366
84,1
7079
,698
-4,4
72
Lina
paca
nN
arra
El N
ido
Dum
aran
M
unic
ipal
ityC
ateg
ory

126 PALAWAN
APPE
ND
IX B
-3.
Com
para
tive
Land
Cov
er D
ata
by M
unic
ipal
ity, P
alaw
an (c
ontin
ued)
.
1992
1998
Cha
nge
1992
1998
Cha
nge
1992
1998
Cha
nge
1992
1998
Cha
nge
For
est C
over
15
5,83
215
3,76
2-2
,070
56,9
9260
,275
3,28
347
,402
52,6
715,
269
91,3
5910
4,53
813
,179
Prim
ary
fore
st82
,354
109,
031
26,6
7720
,260
42,5
1922
,259
29,7
7232
,495
2,72
342
,715
71,1
0228
,387
Mos
sy fo
rest
11,7
482,
317
-9,4
315,
248
4,02
0-1
,228
3157
254
14,
131
6,89
82,
767
Res
idua
l for
est
52,4
5032
,012
-20,
438
30,7
0013
,011
-17,
689
17,5
9919
,537
1,93
843
,396
26,2
40-1
7,15
6M
argi
nal f
ores
t8,
746
8,64
9-9
777
367
0-1
036
61,
109
29-1
,080
Kar
st/li
mes
tone
534
1,75
31,
219
1155
4461
618
269
261
Man
grov
e ar
eas
4,05
25,
995
1,94
31,
392
2,75
31,
361
3,51
22,
028
-1,4
842,
352
3,06
671
4B
rush
land
29,9
4527
,459
-2,4
8615
,169
16,0
8891
928
,758
30,8
462,
088
16,6
147,
080
-9,5
34C
ocon
ut p
lant
atio
n3,
151
4,14
999
82,
388
5,99
73,
609
1,01
73,
794
2,77
779
75,
800
5,00
3O
ther
pla
ntat
ion
4,30
54,
305
715
715
561
561
810
810
Gra
ssla
nd14
,560
3,08
4-1
1,47
610
,239
424
-9,8
1513
,233
308
-12,
925
13,6
0071
0-1
2,89
0P
addy
fiel
d3,
581
4,48
490
31,
676
3,42
81,
752
3,50
17,
095
3,59
41,
534
3,00
51,
471
Cro
plan
d71
87,
274
6,55
61,
236
922
-314
1,06
463
1-4
3355
91,
171
612
Bar
e/ro
cky
area
s38
51,
211
826
9041
332
337
304
267
153
345
192
Min
ing
area
8080
Bui
lt-up
are
a17
695
778
117
881
864
262
77-1
8522
1,09
81,
076
Fis
hpon
d10
353
042
728
728
7La
kes/
Wat
er B
ody
583
583
7625
517
928
2814
414
4C
loud
s/sh
adow
1,26
8-1
,268
2,00
61,
127
-1,1
2747
9-4
79
Tota
l21
3,77
121
3,87
310
291
,281
92,4
383,
163
99,9
1398
,343
-1,5
7012
7,46
912
7,76
729
8
Riz
alPP
CR
oxas
Que
zon
M
unic
ipal
ityC
ateg
ory

STATE OF THE ENVIRONMENT 127
APPE
ND
IX B
-3.
Com
para
tive
Land
Cov
er D
ata
by M
unic
ipal
ity, P
alaw
an (c
ontin
ued)
.
1992
1998
Cha
nge
1992
1998
Cha
nge
1992
1998
Cha
nge
For
est C
over
50
,058
57,9
167,
858
15,1
9819
,270
4,07
253
,906
71,8
0617
,900
Prim
ary
fore
st38
,105
52,9
3414
,829
5,55
612
,203
6,64
720
,785
48,4
1027
,625
Mos
sy fo
rest
2816
-12
725
1,21
749
2R
esid
ual f
ores
t11
,912
4,57
7-7
,335
8,83
75,
750
-3,0
8732
,240
23,3
92-8
,848
Mar
gina
l for
est
1313
080
-80
881
-881
Kar
st/li
mes
tone
376
376
100
100
44
Man
grov
e ar
eas
995
1,46
947
483
41,
499
665
6,51
05,
466
-1,0
44B
rush
land
10,4
875,
811
-4,6
7611
,560
21,7
6010
,200
20,7
3731
,457
10,7
20C
ocon
ut p
lant
atio
n49
21,
823
1,33
11,
117
2,41
61,
299
5,42
95,
429
Oth
er p
lant
atio
n39
739
762
862
844
44G
rass
land
7,43
753
3-6
,904
12,4
2385
6-1
1,56
728
,640
1,42
2-2
7,21
8P
addy
fiel
d2,
246
3,33
71,
091
3,53
82,
840
-698
6,55
513
,506
6,95
1C
ropl
and
5329
624
32,
060
1-2
,059
220
1,48
91,
269
Bar
e/ro
cky
area
s30
248
718
518
136
118
3,44
739
6-3
,051
Min
ing
area
Bui
lt-up
are
a25
9065
101
491
390
1256
154
9F
ishp
ond
4343
6734
027
312
512
5La
kes/
Wat
er B
ody
129
129
3838
622
2,49
01,
868
Clo
uds/
shad
ow1,
225
-1,2
254,
423
-4,4
232,
153
-2,1
53
Tota
l73
,320
72,3
31-9
8951
,339
50,2
75-1
,064
122,
802
134,
191
11,3
89.0
0
Sou
rce:
1
992
LAN
DS
AT
TM
Tro
pica
l For
est R
esou
rces
Sur
vey
J
apan
For
est T
echn
ical
Ass
ocia
tion
19
98 L
AN
DS
AT
TM
Pal
awan
Cou
ncil f
or S
usta
inab
le D
evel
opm
ent S
taff
(PC
SD
S)
San
Vice
nte
Sofr
onio
Esp
anol
aTa
ytay
M
unic
ipal
ityC
ateg
ory

128 PALAWAN
APPE
ND
IX C
-1.
List
of P
alaw
an W
ildlif
e Sp
ecie
s w
ith C
onse
rvat
ion
Stat
us.
IUC
NC
ITE
S
Cla
ss A
ves
Ord
er C
icon
iifor
mes
Fam
ily A
rdei
dae
Egr
etta
eul
opho
tes
Chi
nese
Egr
etV
U*
**
**
*G
orsa
chiu
s go
isag
iJa
pane
se N
ight
-Her
onE
N*
*O
rder
Fal
coni
form
esF
amily
Pan
dion
idae
Pan
dion
hal
iaet
usO
spre
yII
**
*F
amily
Acc
ipitr
idae
Avi
ceda
jerd
oni
Jerd
on's
Baz
aII
*Pe
rnis
ptil
orhy
nchu
sO
rient
al H
oney
Buz
zard
*II
**
Ela
nus
caer
uleu
sB
lack
-sho
ulde
red
Kite
II*
Hal
iast
ur in
dus
Bra
hmin
y K
iteII
**
**
**
Hal
iaee
tus
leuc
ogas
ter
Whi
te-b
ellie
d S
ea E
agle
II*
**
**
**
**
Icht
hyop
haga
icht
hyae
tus
Gre
y-he
aded
Fis
h-E
agle
IIC
ircus
spi
lono
tus
Eas
tern
Mar
sh-H
arrie
rII
*A
ccip
iter
gula
risJa
pane
se S
parr
owH
awk
II*
**
Acc
ipite
r so
loen
sis
Chi
nese
Gos
haw
kII
*A
ccip
iter t
rivirg
atus
Cre
sted
Gos
haw
k*
II*
**
**
**
But
astu
r in
dicu
sG
rey-
face
d B
uzza
rdII
**
*Sp
ilorn
is c
heel
aC
rest
ed S
erpe
nt-E
agle
*II
**
**
*H
iera
aetu
s ki
ener
iiR
ufou
s-be
llied
Eag
leII
*S
piza
etus
cirr
hatu
sC
hang
eabl
e H
awk-
Eag
leII
**
**
Fam
ily F
alco
nida
eF
alco
tinn
uncu
lus
Eur
asia
n K
estr
elII
**
Fal
co s
ever
usO
rient
al H
obby
II*
**
Fal
co p
ereg
rinus
Per
egrin
e F
alco
nI
**
Ord
er G
allif
orm
esF
amily
Meg
apod
iidae
Meg
apod
ius
cum
ingi
i *T
abon
Scr
ubF
owl
II*
**
**
**
**
*F
amily
Pha
sian
idae
Poly
plec
tron
em
phan
umPa
law
an P
eaco
ck P
heas
ant
*V
UI
**
**
**
Ord
er C
hara
driif
orm
esF
amily
Cha
radr
iidae
Cha
radr
ius
pero
nii
Mal
aysi
an P
love
rN
T*
**
Spec
ies
Com
mon
Nam
e
RESTR
Con
serv
atio
n
VAR
Mta
Calauit
Busuanga
Culion
El Nido
Rasa
Mainland
Sta
tus
reco
rds
refle
ct C
alam
iane
s on
ly, n
o sp
ecifi
c ar
ea m
entio
ned
Ursula
Balabac
Tubbataha
Coron
SVRTF
PPSRNP

STATE OF THE ENVIRONMENT 129
APPE
ND
IX C
-1.
List
of P
alaw
an W
ildlif
e Sp
ecie
s w
ith C
onse
rvat
ion
Stat
us (c
ontin
ued)
.
IUC
NC
ITE
SF
amily
Bur
hini
dae
Esa
cus
mag
niro
stris
Bea
ch T
hick
-Kne
eN
T*
Ord
er C
olum
bifo
rmes
Fam
ily C
olum
bida
eD
ucul
a pi
cker
ingi
iG
rey
Impe
rial-P
igeo
nV
U*
**
**
Cal
oena
s ni
coba
rica
Nic
obar
Pig
eon
NT
I*
**
**
Ord
er P
sitta
cifo
rmes
Fam
ily P
sitta
cida
eC
acat
ua h
aem
atur
opyg
iaPh
ilipp
ine
Coc
kato
oC
RI
**
**
**
**
**
Tan
ygna
thus
luci
onen
sis
Blu
e-na
ped
Par
rot*
*N
TII
**
**
**
**
*Pr
ioni
turu
s pl
aten
aeB
lue-
head
ed R
acqu
et-ta
il*
VU
II*
**
**
**
**
*O
rder
Str
igifo
rmes
Fam
ily T
yton
idae
Tyto
cap
ensi
sG
rass
Ow
lII
**
Fam
ily S
trig
idae
Otu
s m
anta
nane
nsis
Man
tana
ni S
cops
-Ow
l*
NT
II*
**
Otu
s fu
ligin
osus
Pala
wan
Sco
ps O
wl
*N
TII
**
**
Nin
ox s
cutu
lata
Bro
wn
Haw
k-O
wl
*II
*St
rix s
elop
uto
Spot
ted
Woo
d-O
wl
*II
**
**
Ord
er C
orac
iifor
mes
Fam
ily B
ucer
otid
aeA
nthr
acoc
eros
mar
chei
Pala
wan
Hor
nbill
*V
UII
**
**
**
**
**
*O
rder
Pas
serif
orm
esF
amily
Cam
peph
agid
aeP
eric
rotu
s ci
nnam
omeu
sS
mal
l Min
ivet
*N
T*
**
Fam
ily O
riolid
aeO
riolu
s xa
ntho
notu
sD
ark-
thro
ated
Orio
le*
NT
**
*F
amily
Par
idae
Paru
s am
abili
sPa
law
an T
it*
NT
**
**
**
**
Fam
ily T
imal
iidae
Mal
acop
tero
n pa
law
anen
seM
elod
ious
Bab
bler
***
*N
T*
**
**
*Pt
iloci
chla
falc
ata
Falc
ated
Gro
und-
Bab
bler
*V
U*
**
**
Stac
hyris
hyp
ogra
mm
ica
Pala
wan
Str
iped
-Bab
bler
*N
T*
*
Culion
El Nido
Spec
ies
Com
mon
Nam
e
RESTR
Con
serv
atio
n
Ursula
SVRTF
PPSRNP
VAR
Mta
Calauit
Busuang
Sta
tus
Rasa
Mainland
Balabac
Tubbatah
Coron

130 PALAWAN
APPE
ND
IX C
-1.
List
of P
alaw
an W
ildlif
e Sp
ecie
s w
ith C
onse
rvat
ion
Stat
us (c
ontin
ued)
.
IUC
NC
ITE
SF
amily
Mus
cica
pida
eFi
cedu
la p
late
nae
Pala
wan
Fly
catc
her
*E
N*
**
**
Cyo
rnis
lem
prie
riPa
law
an B
lue
Flyc
atch
er*
NT
**
**
**
**
*T
erps
ipho
ne a
troc
auda
taJa
pane
se P
arad
ise-
Fly
catc
her
NT
*Te
rpsi
phon
e cy
anes
cens
Blu
e Pa
radi
se-F
lyca
tche
r*
NT
**
**
**
**
Fam
ily S
turn
idae
Gra
cula
relig
iosa
Hill
Myn
a*
II*
**
**
*
Cla
ss M
amm
alia
Ord
er In
sect
ivor
aF
amily
Sor
icid
aeC
roci
dura
pal
awan
ensi
sPa
law
an S
hrew
*V
U*
**
Ord
er S
cand
entia
Fam
ily T
upai
idae
Tupa
ia p
alaw
anen
sis
Pala
wan
Tre
e Sh
rew
*V
UII
**
**
**
*O
rder
Chi
ropt
era
Fam
ily P
tero
podi
dae
Ace
rodo
n le
ucot
isPa
law
an F
lyin
g Fo
x*
VU
II*
**
**
Pte
ropu
s va
mpy
rus
Larg
e F
lyin
g F
oxII
**
Fam
ily R
hino
loph
idae
Rhi
nolo
phus
virg
oY
ello
w-fa
ced
Hor
sesh
oe B
atN
T*
**
Fam
ily V
espe
rtilio
nida
eM
yotis
mac
rota
rsus
Phi
lippi
ne L
arge
-foo
ted
Myo
tisN
T*
Fam
ily M
olos
sida
eC
heiro
mel
es to
rqua
tus
Gre
ater
Nak
ed B
at*
NT
*M
ops
sara
sino
rum
Sul
awes
i Mas
tiff B
atN
T*
Ord
er P
rimat
esF
amily
Cer
copi
thec
idae
Mac
aca
fasc
icul
aris
Long
-tai
led
Mac
aque
NT
II*
**
**
**
Ord
er P
holid
ota
Fam
ily M
anid
aeM
anis
java
nica
Mal
ayan
Pan
golin
NT
II*
**
**
Calauit
Busuang
Culion
Spec
ies
Com
mon
Nam
e
RESTR
Con
serv
atio
n
PPSRNP
VAR
Coron
Rasa
Mainland
Sta
tus
Mta
Ursula
Balabac
Tubbatah
El Nido
SVRTF

STATE OF THE ENVIRONMENT 131
APPE
ND
IX C
-1.
List
of P
alaw
an W
ildlif
e Sp
ecie
s w
ith C
onse
rvat
ion
Stat
us (c
ontin
ued)
.
IUC
NC
ITE
SO
rder
Rod
entia
Fam
ily S
ciur
idae
Hyl
opet
es n
igrip
esPa
law
an F
lyin
g Sq
uirr
el*
NT
**
*Su
ndas
ciur
us ju
venc
usN
orth
ern
Pala
wan
Tre
e Sq
uirr
el*
EN
**
*Su
ndas
ciur
us m
oelle
ndor
ffiC
ulio
n Tr
ee S
quirr
el*
NT
*Su
ndas
ciur
us ra
bori
Pala
wan
Mon
tane
Tre
e Sq
uirr
el*
VU
**
**
Sund
asci
urus
ste
erii
Sout
hern
Pal
awan
Tre
e Sq
uirr
el*
NT
**
Fam
ily M
urid
aeH
aero
mys
sp.
APa
law
an P
ygm
y Tr
ee M
ouse
*V
U*
*M
axom
ys p
angl
ima
Pala
wan
Spi
ny R
at*
NT
**
**
**
Pala
wan
omys
furv
usPa
law
an S
oft-f
urre
d M
ount
ain
Rat
*E
N*
Ord
er C
arni
vora
Fam
ily F
elid
aeP
riona
iluru
s be
ngal
ensi
sLe
opar
d C
atI
**
Fam
ily M
uste
lidae
Am
blon
yx c
iner
eus
Orie
ntal
Sm
all-c
law
ed O
tter
*N
TII
**
**
Myd
aus
mar
chei
Pala
wan
Stin
k-B
adge
r*
VU
**
**
**
*F
amily
Viv
errid
aeA
rctic
tis b
intu
rong
whi
tei
Bin
turo
ng /
Pal
awan
Bea
rCat
*V
U*
**
**
Ord
er A
rtio
dact
yla
Fam
ily S
uida
eS
us b
arba
tus
ahoe
noba
rbus
Bea
rded
Pig
*V
U*
**
**
*F
amily
Tra
gulid
aeT
ragu
lus
napu
nig
rican
sB
alab
ac C
hevr
otai
n*
EN
**
Fam
ily C
ervi
dae
Axi
s ca
lam
iane
nsis
Cal
amia
n D
eer
*E
NI
**
*O
rder
Cet
acea
Fam
ily B
alae
nopt
erid
aeB
alae
nopt
era
acut
oros
trat
aM
inke
Wha
leN
TI
*B
alae
nopt
era
eden
iB
ryde
's W
hale
DD
I*
Meg
apte
ra n
ovae
angl
iae
Hum
pbac
k W
hale
VU
I*
*F
amily
Del
phin
idae
Glo
bice
phal
a m
acro
rhyn
chus
Sho
rt-f
inne
d P
ilot W
hale
CD
II*
Ste
nella
atte
nuat
aP
antr
opic
al S
potte
d D
olph
inC
DII
*
Culion
El Nido
Spec
ies
Com
mon
Nam
e
RESTR
Con
serv
atio
n
Ursula
SVRTF
PPSRNP
VAR
Mta
Calauit
Busuang
Sta
tus
Rasa
Mainland
Balabac
Tubbatah
Coron

132 PALAWAN
APPE
ND
IX C
-1.
List
of P
alaw
an W
ildlif
e Sp
ecie
s w
ith C
onse
rvat
ion
Stat
us (c
ontin
ued)
.
IUC
NC
ITE
SS
tene
lla lo
ngiro
stris
Spi
nner
Dol
phin
CD
II*
*T
ursi
ops
trun
catu
sB
ottle
nose
Dol
phin
DD
II*
**
**
Fam
ily P
hyse
terid
aeP
hyse
ter
cato
don
Spe
rm W
hale
VU
I*
*F
amily
Pho
coen
idae
Neo
phoc
aena
pho
caen
oide
sF
inle
ss P
orpo
ise
DD
I*
*O
rder
Sire
nea
Fam
ily D
ugon
gida
eD
ugon
g du
gon
Dug
ong
VU
I*
**
**
Cla
ss R
eptil
iaO
rder
Tes
tudi
nata
Fam
ily C
helo
nida
eC
aret
ta c
aret
taLo
gger
head
Tur
tleE
NI
*C
helo
nia
myd
asG
reen
Tur
tleE
NI
**
**
*E
retm
oche
lys
imbr
icat
aH
awks
bill
Tur
tleE
NI
**
**
*Le
pido
chel
ys o
livac
eaO
live
Rid
ley
Tur
tleE
NI
*D
erm
oche
lys
coria
cea*
***
Leat
herb
ack
CR
I*
Ord
er C
roco
dilia
Fam
ily C
roco
dylid
aeC
roco
dylu
s m
indo
rens
isPh
ilipp
ine
Cro
codi
le**
***
CR
I*
Cro
cody
lus
poro
sus
Est
uarin
e C
roco
dile
I*
**
*O
rder
Sau
riaF
amily
Var
anid
aeVa
ranu
s sa
lvat
orM
onito
r Liz
ard
II*
**
**
Ord
er S
erpe
ntes
Fam
ily B
oida
eP
ytho
n re
ticul
atus
Ret
icul
ated
Pyt
hon
II*
**
Fam
ily E
lapi
dae
Naj
a su
mat
rana
Mal
ay C
omm
on C
obra
II*
Oph
ioph
agus
han
nah
Kin
g C
obra
II*
Calauit
Busuang
Culion
Spec
ies
Com
mon
Nam
e
RESTR
Con
serv
atio
n
PPSRNP
VAR
Coron
Rasa
Mainland
Sta
tus
Mta
Ursula
Balabac
Tubbatah
El Nido
SVRTF

STATE OF THE ENVIRONMENT 133
APPE
ND
IX C
-1.
List
of P
alaw
an W
ildlif
e Sp
ecie
s w
ith C
onse
rvat
ion
Stat
us (c
ontin
ued)
.
IUC
NC
ITE
SC
lass
Am
phib
iaO
rder
Anu
raF
amily
Dis
cogl
ossi
dae
Bar
bour
ula
busu
ange
nsis
Phili
ppin
e D
isco
glos
sid
Frog
*V
U*
**
*F
amily
Buf
onid
aePe
loph
ryne
alb
otae
niat
aPa
law
an T
oadl
et*
VU
**
Fam
ily R
anid
aeM
icrix
alus
mar
iae
Mar
y's
Frog
*V
U*
NO
TE: N
OM
EN
CLA
TUR
E F
OLL
OW
S T
HA
T O
F K
EN
NE
DY
, ET
AL.
, 200
0 FO
R A
VIF
AU
NA
; HE
AN
EY
, ET
AL.
, 199
8 FO
R M
AM
MA
LS; A
ND
AFU
AN
G A
ND
GO
NZA
LES
, 199
5 FO
R R
EP
TILE
S.
* T
he P
CS
D in
199
3 pa
ssed
res
olut
ion
no.9
3-22
dec
larin
g th
e T
abon
bird
as
an e
ndan
gere
d sp
ecie
s in
Pal
awan
** T
he B
lue-
nape
d P
arro
t was
cla
ssifi
ed b
y th
e IU
CN
as
End
ange
red
in 1
996,
but
the
2000
list
ing
re-c
lass
ifies
the
spec
ies
as N
ear-
thre
aten
ed,
w
hich
is r
athe
r in
appr
opria
te fo
r th
e P
alaw
an F
auna
l Reg
ion
***
The
Mel
odio
us B
abbl
er w
as c
lass
ified
by
the
IUC
N a
s E
ndan
gere
d in
199
6, b
ut th
e 20
00 li
stin
g re
-cla
ssifi
es th
e sp
ecie
s as
Nea
r-th
reat
ened
****
The
Lea
trhe
rbac
k w
as r
epor
ted
and
sigh
ted
at T
ariti
en, B
acun
gan,
Pue
rto
Prin
cesa
in 2
001
****
*The
Phi
lippi
ne C
roco
dile
is r
epor
ted
to b
e lo
cally
ext
inct
in th
e w
ild, b
ut th
e C
FI h
as b
red
the
spec
ies
in c
aptiv
ity
Spec
ies
Com
mon
Nam
e
RESTR
Con
serv
atio
n
Mta
Calauit
Busuang
Culion
El Nido
Rasa
Mainland
Sta
tus
Ursula
Balabac
Tubbatah
Coron
SVRTF
PPSRNP
VAR

134 PALAWAN
APPE
ND
IX C
-2.
List
of R
eptil
e Sp
ecie
s in
the
Pala
wan
Fau
nal R
egio
n.
CLA
SS R
EPTI
LIA
Ord
er T
estu
dina
taF
amily
Em
ydid
aeC
uora
am
boin
ensi
sM
alay
an F
resh
wat
er T
urtle
Mai
nlan
dN
EC
Str
eam
s, S
wam
py o
r M
oist
Are
asC
ycle
mys
den
tata
Ser
rate
-she
lled
Leaf
Tur
tleS
PS
RN
PLE
LCT
erre
stria
lF
amily
Che
loni
dae
Car
etta
car
etta
Logg
erhe
ad T
urtle
Mai
nlan
d W
ater
sN
ELC
Mar
ine
Wat
ers
Che
loni
a m
ydas
Gre
en T
urtle
Bus
uang
a, E
l Nid
o, M
alam
paya
, Tub
bata
ha,
Urs
ula,
Ras
aN
ER
aM
arin
e W
ater
s
Ere
tmoc
hely
s im
bric
ata
Haw
ksbi
ll T
urtle
Bal
abac
, Bus
uang
a, E
l Nid
o, M
alam
paya
, T
ubba
taha
, Ras
aN
ELC
Tro
pica
l and
Sub
-tro
pica
l Sea
s
Lepi
doch
elys
oliv
acea
Oliv
e R
idle
y T
urtle
El N
ido
NE
Ord
er C
roco
dilia
Fam
ily C
roco
dylid
aeC
roco
dylu
s m
indo
rens
isP
hilip
pine
Cro
codi
leB
usua
nga
LER
aIn
land
lake
s an
d H
eadw
ater
sC
roco
dylu
s po
rosu
sE
stua
rine
Cro
codi
leB
alab
ac, B
usua
nga,
Mal
ampa
yaN
ER
aB
rack
ish
and
Fre
shw
ater
Riv
er S
yste
ms
Ord
er S
auria
Fam
ily G
ekko
nida
eC
osym
botu
s pl
atyu
rus
Fla
t-bo
died
Hou
se G
ecko
Mai
nlan
dN
EC
Hum
an H
abita
tions
, Gar
dens
, Coc
onut
Gro
ves
Cyr
toda
ctyl
us a
nnul
atus
Sm
all B
ent-
toed
Gec
koM
ainl
and
LEC
For
este
d A
reas
(0-
1200
mas
l), L
imes
tone
Cav
es
Cyr
toda
ctyl
us r
edim
icul
usP
alaw
an B
ent-
toed
Gec
koT
hum
b P
eak
PE
-Pw
nR
aF
ores
ted
Are
as (
300-
1000
mas
l)
Geh
yra
mut
ilata
Ten
der-
skin
ned
Hou
se G
ecko
Mai
nlan
dN
EC
Hum
an H
abita
tions
, Man
grov
es, B
rush
land
s, C
ocon
ut
Gro
ves,
Low
land
For
ests
(0-
500
mas
l)G
ekko
ath
ymus
Sm
ooth
-sca
led
Nar
row
-dis
ked
Gec
koT
hum
b P
eak
PE
-Pw
nR
aF
ores
ted
Are
as
Gek
ko g
ecko
Tok
ay G
ecko
Mai
nlan
d, R
asa
NE
CH
uman
Hab
itatio
ns, M
angr
oves
, Bru
shla
nds,
Coc
onut
G
rove
s, L
owla
nd F
ores
tsG
ekko
mon
arch
usV
aria
ble-
back
ed N
arro
w-d
iske
d G
ecko
Mai
nlan
dLE
CF
ores
ted
Are
as
Gek
ko p
alaw
anen
sis
Pal
awan
Nar
row
-dis
ked
Gec
koM
ainl
and
PE
-Pw
nR
aLo
wla
nd F
ores
ts, S
mal
l Cav
es, D
ry S
trea
m B
eds
Hem
idac
tylu
s fr
enat
usC
omm
on H
ouse
Gec
koM
ainl
and,
Ras
aN
EC
Hum
an H
abita
tions
, Gar
dens
, Coc
onut
Gro
ves
Lupe
rosa
urus
pal
awan
ensi
sP
alaw
an F
lap-
legg
ed G
ecko
Cor
on, T
hum
b P
eak
PE
-Pw
nR
aF
ores
ted
Are
asF
amily
Aga
mid
ae
Cal
otes
cris
tate
llus
Indo
nesi
an C
alot
esS
PS
RN
P, M
ainl
and
NE
CF
ores
ted
Are
as, S
tream
s, G
arde
ns, C
ocon
ut G
rove
s
Dra
co v
olan
s vo
lans
Mal
ay F
lyin
g Li
zard
SP
SR
NP
, Mai
nlan
dN
EC
For
este
d A
reas
, Coc
onut
Gro
ves
Gon
yoce
phal
us s
empe
riW
hite
-spo
tted
Ang
lehe
adC
alam
iane
s G
roup
LER
aF
ores
ted
Are
as (
0-10
00 m
asl)
Fam
ily S
cinc
idae
Das
ia g
riffin
iG
riffin
's K
eel-s
cale
d T
ree
Ski
nkS
PS
RN
P, M
ainl
and
PE
-Pw
nR
aLo
wla
nd F
ores
tsE
moi
a at
roco
stat
aG
ray
Sw
amp
Ski
nkM
ainl
and
NE
CR
ock
Cre
vice
s at
Man
grov
e A
reas
Lam
prol
epis
sm
arag
dina
Spo
tted
Gre
en T
ree
Ski
nkS
PS
RN
P, M
ainl
and
NE
CF
ores
ted
Are
as, G
arde
ns, C
ocon
ut G
rove
s (0
-666
m
asl)
Spec
ies
Com
mon
Nam
eTy
pe L
ocal
ityEn
dem
icity
Occ
Hab
itat

STATE OF THE ENVIRONMENT 135
APPE
ND
IX C
-2.
List
of R
eptil
e Sp
ecie
s in
the
Pala
wan
Fau
nal R
egio
n (c
ontin
ued)
.
Lipi
nia
quad
rivita
tum
Bla
ck-s
trip
ed S
lend
er T
ree
Ski
nkM
ainl
and
NE
CC
ultiv
ated
Are
as, C
ocon
ut G
rove
s, P
alm
s, F
ores
ted
Are
as (
0-76
0 m
asl)
Lygo
som
a qu
adru
pes
Orie
ntal
Sle
nder
Ski
nkC
uyo
NE
-Pw
nR
aC
ultiv
ated
Are
as, C
ocon
ut G
rove
s, F
ores
ted
Are
as
Mab
uya
m. m
ultic
arin
ata
Tw
o-st
riped
Mab
ouya
SP
SR
NP
, Mai
nlan
dN
EC
Cos
mop
olita
n (0
-733
mas
l)M
abuy
a m
ultif
asci
ata
Com
mon
Mab
ouya
SP
SR
NP
, Mai
nlan
dN
EC
Cos
mop
olita
n (0
-133
3 m
asl)
Sph
enom
orph
us p
alaw
anen
sis
Pal
awan
Sph
enom
orph
usV
icto
ria-A
napa
lan
Ran
geP
E-P
wn
Ra
For
este
d A
reas
Sph
enom
orph
us w
right
iW
right
's S
phen
omor
phus
Mai
nlan
dP
E-P
wn
Ra
For
este
d A
reas
Fam
ily D
ibam
idae
Dib
amus
leuc
urus
Mal
ay B
lind-
Ear
less
Ski
nkM
ainl
and
NE
Ra
Cul
tivat
ed A
reas
, For
este
d A
reas
(0-
600
mas
l)F
amily
Var
anid
ae
Var
anus
sal
vato
rM
onito
r Li
zard
Cor
on, M
ainl
and,
Mal
ampa
ya, S
PS
RN
P,
Urs
ula,
Ras
aLE
LCM
angr
oves
, Cul
tivat
ed A
reas
, For
este
d A
reas
(0-
1166
m
asl)
Ord
er S
erpe
ntes
Fam
ily T
yphl
opid
aeR
amph
otyp
hlop
s br
amin
usB
rahm
iny
Blin
d S
nake
Mai
nlan
dN
EC
Cul
tivat
ed A
reas
, For
este
d A
reas
Fam
ily X
enop
eltid
aeX
enop
eltis
uni
colo
rS
unbe
am B
urro
win
g S
nake
Mai
nlan
dLE
Ra
Sub
terr
anea
nF
amily
Boi
dae
Pyt
hon
retic
ulat
usR
etic
ulat
ed P
ytho
nM
ainl
and,
Mal
ampa
yaN
ELC
For
este
d A
reas
(0-
1333
mas
l)F
amily
Acr
ocho
rdid
aeA
croc
hord
us g
ranu
latu
sS
mal
l War
ty S
nake
Mai
nlan
dN
EC
Man
grov
es, R
iver
Out
lets
Fam
ily C
olub
ridae
Aha
etul
la p
. pra
ssin
aP
hilip
pine
Vin
e S
nake
Mai
nlan
dN
EC
For
este
d A
reas
(0-
800
mas
l)A
plop
eltu
ra b
oaS
nail-
eatin
g S
nake
Bal
abac
, Mai
nlan
dN
ER
aF
ores
ted
Are
asB
oiga
ang
ulat
aP
hilip
pine
Blu
nt-h
eade
d S
nake
SP
SR
NP
LER
aF
ores
ted
Are
as (
0-25
00 m
asl)
Boi
ga c
ynod
onLa
rge
Blu
nt-h
eade
d T
ree
Sna
keM
ainl
and
NE
CF
ores
ted
Are
as (
low
alti
tude
s)B
oiga
den
drop
hila
mul
ticin
cta
Pal
awan
Blu
nt-h
eade
d T
ree
Sna
keB
alab
ac, S
PS
RN
P, R
asa
LEC
For
este
d A
reas
Boi
ga s
chul
tzei
Sch
ultz
's B
lunt
-hea
ded
Tre
e S
nake
SP
SR
NP
NE
UF
ores
ted
Are
asC
alam
aria
ger
vais
iG
erva
is' W
orm
Sna
keM
ainl
and
LEC
Sub
terr
anea
nC
alam
aria
pal
awan
ensi
sP
alaw
an W
orm
Sna
keM
ainl
and
PE
-Pw
nR
aS
ubte
rran
ean
Cal
amar
ia v
irgul
ata
Sou
ther
n W
orm
Sna
keM
ainl
and
NE
Ra
For
este
d A
reas
Cer
beru
s ry
ncho
psD
og-f
aced
Wat
er S
nake
Mai
nlan
dN
EC
Man
grov
es, B
rack
ish
Wat
erC
hrys
opel
ea p
arad
isi
Par
adis
e T
ree
Sna
keM
ainl
and
NE
CC
ocon
ut G
rove
s, F
ores
ted
Are
as (
0-50
0 m
asl)
Den
drol
aphi
s c.
cau
dolin
eatu
sLi
ned
Sle
nder
Tre
e S
nake
SP
SR
NP
, Mai
nlan
d, U
rsul
aN
EC
Cul
tivat
ed A
reas
, Sw
amps
, Str
eam
s, F
ores
ted
Are
as
Den
drol
aphi
s pi
ctus
Com
mon
Bro
nze-
back
ed S
nake
SP
SR
NP
, Mai
nlan
d, U
rsul
aN
EC
For
este
d A
reas
, Str
eam
s, S
wam
psD
ryop
hiop
s ru
besc
ens
Mal
ay K
eel-b
ellie
d W
hip
Sna
keC
oron
NE
-Pw
nR
aN
o da
ta a
vaila
ble
Dry
ocal
amus
phi
lippi
nus
Phi
lippi
ne D
ryoc
alam
usB
alab
ac, M
ainl
and
PE
-Pw
nC
No
data
ava
ilabl
eE
laph
e er
ythr
ura
phili
ppin
aC
omm
on R
at S
nake
Bal
abac
, Bus
uang
a, M
ainl
and
NE
CH
uman
Hab
itatio
ns a
long
Veg
etat
ed A
reas
Gon
yoso
ma
oxyc
epha
lum
Arb
orea
l Rat
Sna
keM
ainl
and
LEF
CF
ores
ted
Are
asLi
opel
tis p
hilip
pina
Phi
lippi
ne L
iope
ltine
Sna
keB
usua
nga,
Mai
nlan
dP
E-P
wn
Unk
No
data
ava
ilabl
e
Occ
Hab
itat
Spec
ies
Com
mon
Nam
eTy
pe L
ocal
ityEn
dem
icity

136 PALAWAN
APPE
ND
IX C
-2.
List
of R
eptil
e Sp
ecie
s in
the
Pala
wan
Fau
nal R
egio
n (c
ontin
ued)
.
Liop
eltis
tric
olor
Indo
nesi
an L
iope
ltine
Sna
keM
ainl
and
NE
-Pw
nR
aN
o da
ta a
vaila
ble
Lyco
don
aulic
usC
omm
on W
olf S
nake
Mai
nlan
dN
EC
Hum
an H
abita
tions
alo
ng V
eget
ated
Are
asLy
codo
n su
bcin
ctus
sea
liS
outh
ern
Wol
f Sna
keS
PS
RN
P, M
ainl
and
NE
-Pw
nR
aF
ores
ted
Are
as (
0-16
00 m
asl)
Olig
odon
per
kins
iP
erki
n's
Sho
rt-h
eade
d S
nake
Cul
ion
PE
-Pw
nR
aN
o da
ta a
vaila
ble
Olig
odon
ver
tebr
alis
Sou
ther
n S
hort
-hea
ded
Sna
keB
alab
ac, B
usua
nga,
Mai
nlan
dN
ER
aN
o da
ta a
vaila
ble
Opi
stho
trop
is ty
pica
Pal
awan
Str
eam
Sna
keM
ainl
and
PE
-Pw
nR
aF
ores
t Str
eam
s (3
00 m
asl)
Psa
mm
odyn
aste
s pu
lver
ulen
tus
Dar
k-sp
otte
d R
ock-
Vip
erM
ainl
and
NE
CF
ores
ted
Are
as (
1000
+ m
asl)
Sib
ynop
his
bivi
ttatu
sW
hite
-str
iped
Sna
keC
ulio
n, T
hum
b P
eak
PE
-Pw
nR
aF
ores
ted
Are
as (
900
mas
l)Z
aocy
s ca
rinat
usK
eel-s
cale
d M
ount
ain
Rat
Sna
keS
PS
RN
P, M
ainl
and
NE
-Pw
nR
aN
o da
ta a
vaila
ble
Rha
bdop
his
chry
sarg
aS
outh
ern
Wat
er S
nake
SP
SR
NP
PE
-Pw
nR
aF
ores
t Str
eam
sT
ropi
dono
phis
den
drop
hiop
sS
potte
d W
ater
Sna
keM
ainl
and
LEC
For
est S
trea
ms
(0-7
00 m
asl)
Fam
ily E
lapi
dae
Mat
icor
a in
test
inal
is b
iline
ata
Str
iped
Cor
al S
nake
Bus
uang
a, M
ainl
and
NE
Ra
For
este
d A
reas
Naj
a su
mat
rana
Mal
ay C
omm
on C
obra
Mai
nlan
dN
EC
For
este
d A
reas
Oph
ioph
agus
han
nah
Kin
g C
obra
Mai
nlan
dN
ER
aF
ores
ted
Are
asF
amily
Hyd
roph
idae
Hyd
roph
is b
elch
eri
Bel
cher
's H
ydro
phis
Mai
nlan
d w
ater
sN
ER
aM
arin
e W
ater
sH
ydro
phis
fasc
iatu
sS
mal
l-hea
ded
Hyd
roph
isM
ainl
and
wat
ers
NE
CM
arin
e W
ater
sH
ydro
phis
orn
atus
Orn
ate
Hyd
roph
isM
ainl
and
wat
ers
NE
CM
arin
e W
ater
sH
ydro
phis
spi
ralis
Spi
ral H
ydro
phis
Mai
nlan
d w
ater
sN
ER
aN
o da
ta a
vaila
ble
Lape
mis
har
dwic
kii
Har
dwic
k's
Sea
Sna
keM
ainl
and
wat
ers
NE
CT
urbi
d W
ater
sLa
ticau
da c
olub
rina
Yel
low
-lipp
ed S
ea S
nake
Mai
nlan
d w
ater
sN
EC
Coa
stal
Roc
ks a
nd C
oral
Ree
fsLa
ticau
da la
ticau
daB
lack
-lipp
ed S
ea S
nake
Mai
nlan
d w
ater
sN
EC
Coa
stal
Roc
ks a
nd C
oral
Ree
fsLa
ticau
da s
emifa
scia
taH
alf-
band
ed S
ea S
nake
Mai
nlan
d w
ater
sN
EC
Coa
stal
Roc
ks a
nd C
oral
Ree
fsP
elam
is p
latu
rus
Yel
low
-bel
lied
Sea
Sna
keM
ainl
and
wat
ers
NE
CC
oast
al S
hallo
w M
arin
e W
ater
sF
amily
Vip
erid
aeT
rimer
esur
us w
agle
riW
agle
r's P
it V
iper
SP
SR
NP
, Mai
nlan
dN
EC
Man
grov
es, F
ores
ted
Are
asT
rimer
esur
us s
chul
tzei
Sch
ultz
e's
Pit
Vip
erR
aF
ores
ted
Are
as (
0-10
00 m
asl)
NO
TE: N
OM
EN
CLA
TUR
E F
OLL
OW
S T
HA
T O
F A
FUA
NG
AN
D G
ON
ZALE
Z., 1
995
Occ
Hab
itat
Spec
ies
Com
mon
Nam
eTy
pe L
ocal
ityEn
dem
icity

STATE OF THE ENVIRONMENT 137
APPE
ND
IX C
-3.
List
of A
mph
ibia
ns S
peci
es in
the
Pala
wan
Fau
nal R
egio
n.
CLA
SS A
MPH
IBIA
Ord
er G
ymno
phio
naF
amily
Cae
cilii
dae
Icht
hyop
his
web
eri
Phi
lippi
ne C
aeci
lian
Mai
nlan
dLE
Ra
For
este
d A
reas
, Sub
terr
anea
nO
rder
Anu
raF
amily
Dis
cogl
ossi
dae
Bar
bour
ula
busu
ange
nsis
Phi
lippi
ne D
isco
glos
sid
Fro
gB
usua
nga,
Cul
ion,
SP
SR
NP
, Mai
nlan
dP
E-P
wn
Ra
Prim
ary
For
ests
, For
est S
trea
ms
Fam
ily P
elob
atid
aeLe
ptob
rach
ium
has
selti
Has
selt'
s T
oad
SP
SR
NP
, Mai
nlan
dN
EU
For
este
d A
reas
(40
-134
0 m
asl)
Meg
ophr
ys m
onta
naS
outh
east
Asi
an H
orne
d T
oad
SP
SR
NP
, Mai
nlan
dN
EC
For
este
d A
reas
, For
est S
trea
ms
(400
-182
5 m
asl)
Fam
ily B
ufon
idae
Buf
o m
arin
usG
iant
Mar
ine
Toa
d /
Com
mon
Toa
dM
ainl
and
NE
CO
pen
Are
as, F
ores
t Cle
arin
gsB
ufo
bipo
rcat
us p
hilip
pini
cus
Phi
lippi
ne T
oad
Bal
abac
, Bus
uang
a, C
ulio
n, S
PS
RN
PLE
UO
pen
Are
as (
<100
mas
l)P
elop
hryn
e al
bota
enia
taP
alaw
an T
oadl
etT
hum
b P
eak,
Mt.
Bal
abag
PE
-Pw
nR
aM
ossy
For
ests
(13
33-1
500
mas
l)F
amily
Ran
idae
Mic
rixal
us m
aria
eM
ary'
s F
rog
Mt.
Bal
abag
(M
anta
linga
jan
Ran
ge)
PE
-Pw
nR
aF
ores
ted
Are
as (
850
mas
l)
Occ
idoz
yga
laev
isC
omm
on S
mal
l-hea
ded
Fro
gS
PS
RN
PN
EC
For
est S
trea
ms,
Ditc
hes,
Pon
ds, H
uman
Hab
itatio
ns
(0-1
200
mas
l)
Ran
a m
agna
aca
nthi
Gia
nt P
hilip
pine
Fro
gB
alab
ac, B
usua
nga,
Cul
ion,
Mai
nlan
d,
SP
SR
NP
LEC
For
est S
trea
ms
(0-2
000
mas
l)
Ran
a m
icro
disc
a pa
law
anen
sis
Sm
all-d
iske
d F
rog
Mai
nlan
dN
EC
For
est F
loor
and
Str
eam
s (0
-200
0 m
asl)
Ran
a ni
coba
riens
isN
icob
ar F
rog
SP
SR
NP
, Mai
nlan
dN
EC
For
este
d A
reas
, Ditc
hes,
Cle
arin
gs, C
ultiv
ated
Are
as
Ran
a sa
ngui
nea
Sou
thea
st A
sian
Woo
d F
rog
Bal
abac
, Bus
uang
a, C
ulio
n, M
ainl
and
NE
-Pw
nU
For
est F
loor
and
Str
eam
s (0
-200
0 m
asl)
Ran
a si
gnat
a m
oelle
ndor
ffiV
aria
ble-
back
ed F
rog
Bus
uang
a, C
ulio
n, M
ainl
and,
SP
SR
NP
NE
CF
ores
t Str
eam
s (0
-330
mas
l)S
taur
ois
nata
tor
Roc
k F
rog
Bus
uang
a, M
ainl
and,
SP
SR
NP
NE
CF
ores
t Str
eam
s (0
-130
0 m
asl)
Fam
ily R
haco
phor
idae
Nyc
tixal
us p
ictu
sP
eter
's T
ree
Fro
gM
ainl
and
NE
-Pw
nR
aF
ores
ted
Are
as (
150-
300
mas
l)P
hila
utus
long
icru
sR
ough
-ski
nned
Tre
e F
rog
Bal
abac
, Mai
nlan
dN
E-P
wn
Ra
For
este
d A
reas
(0-
1300
mas
l)
Pol
yped
ates
leuc
omys
tax
Com
mon
Tre
e F
rog
SP
SR
NP
NE
CF
ores
ted
Are
as, O
pen
Are
as, H
uman
Hab
itatio
ns
Pol
yped
ates
mac
rotis
Bro
wn-
Str
iped
Tre
e F
rog
Bal
abac
, Bus
uang
a, C
alau
it, D
umar
an,
Mai
nlan
dN
EC
For
este
d A
reas
, Cul
tivat
ed A
reas
Rha
coph
orus
eve
retti
Pal
awan
Tre
e F
rog
Cal
auit,
Mai
nlan
dN
E-P
wn
UF
ores
ted
Are
as (
350-
1000
mas
l)F
amily
Mic
rohy
lidae
Cha
perin
a fu
sca
Spo
tted-
belly
Nar
row
-mou
thed
Fro
gM
ainl
and
NE
CF
ores
t Str
eam
s (0
-122
0 m
asl)
Kal
oula
bal
eata
bal
eata
Sm
ooth
-fin
gere
d N
arro
w-m
outh
ed F
rog
Mai
nlan
dN
EC
Ter
rest
rial,
Arb
orea
l
NO
TE: N
OM
EN
CLA
TUR
E F
OLL
OW
S T
HA
T O
F A
LCA
LA A
ND
BR
OW
N, 1
998
Occ
Hab
itat
Spec
ies
Com
mon
Nam
eTy
pe L
ocal
ityEn
dem
icity

138 PALAWAN
APPE
ND
IX C
-4.
List
of A
vian
Spe
cies
in th
e Pa
law
an F
auna
l Reg
ion.
Ord
er P
odic
iped
iform
esF
amily
Pod
icip
edid
aeT
achy
bapt
us r
ufic
ollis
phili
ppen
sis
Littl
e G
rebe
Mai
nlan
dLE
Res
iden
tU
ncom
mon
Ord
er P
elec
anifo
rmes
Fam
ily A
nhin
gida
eA
nhin
ga m
elan
ogas
ter
mel
anog
aste
rO
rient
al D
arte
rM
ainl
and
NE
Res
iden
tLo
c U
ncom
mon
Fam
ily S
ulid
aeS
ula
dact
ylat
rape
rson
ata
Mas
ked
Boo
byT
ubba
taha
(no
rth
isle
t)N
ER
esid
ent
Rar
e
Sul
a su
laru
brip
esR
ed-f
oote
d B
ooby
Ban
cora
n, C
agay
anci
llo, C
awili
, Cal
usa,
Man
uc
Man
ukan
, Mai
nlan
d, T
ubba
taha
(so
uth
isle
t)N
ER
esid
ent
Unc
omm
on
Sul
a le
ucog
aste
rpl
otus
Bro
wn
Boo
byA
rena
, Ban
cora
n, M
anuc
Man
ukan
, Ras
a, T
ubba
taha
NE
Res
iden
tU
ncom
mon
Fam
ily F
rega
tidae
Fre
gata
min
orm
inor
Gre
at F
rigat
ebird
Are
na, B
anco
ran,
Cag
ayan
cillo
, Caw
ili, M
anuc
M
anuk
an, T
ubba
taha
, Urs
ula
NE
Res
iden
tU
ncom
mon
Fre
gata
arie
lar
iel
Less
er F
rigat
ebird
Agu
taya
, Bal
abac
, Cag
ayan
cillo
, Cuy
o, M
ainl
and,
T
ubba
taha
, Urs
ula
NE
Mig
/Res
(?)
Unc
omm
on
Ord
er C
icon
iifor
mes
Fam
ily A
rdei
dae
Ard
ea s
umat
rana
(mon
otyp
ic)
Gre
at-b
illed
Her
onB
usua
nga,
Mai
nlan
d, R
asa,
SP
, El N
ido,
Tub
bata
haN
ER
esid
ent
Unc
omm
on
Ard
ea p
urpu
rea
man
ilens
isP
urpl
e H
eron
Cal
auit,
Mai
nlan
d, R
asa
NE
Res
iden
tF
airly
Com
mon
Egr
etta
gar
zetta
garz
etta
Littl
e E
gret
Cag
ayan
cillo
, Mai
nlan
d, U
rsul
a, S
P, T
ubba
taha
NE
Mig
rant
Com
mon
Egr
etta
sac
rasa
cra
Eas
tern
Ree
f-E
gret
Bal
abac
, Ban
cora
n, C
agay
anci
llo, C
ulio
n, C
uyo,
D
alah
ican
, Lum
buca
n, M
anuc
Man
ucan
, Mai
nlan
d,
Tub
bata
ha, U
rsul
a, C
oron
, Ras
a, E
l Nid
o, S
PN
ER
esid
ent
Unc
omm
on
Egr
etta
eul
opho
tes
(mon
otyp
ic)
Chi
nese
Egr
etM
ainl
and,
Tub
bata
ha, C
alau
it, E
l Nid
o, S
P, V
A, R
asa
NE
Mig
rant
Rar
e
Egr
etta
inte
rmed
ia(m
onot
ypic
)In
term
edia
te E
gret
Mai
nlan
d, M
al-T
y, T
ubba
taha
NE
Mig
rant
Loc
Unc
omm
onE
gret
ta a
lba
mod
esta
Gre
at E
gret
Mai
nlan
d, E
l Nid
o, T
ubba
taha
NE
Mig
rant
Unc
omm
on
Bub
ulcu
s ib
isco
rom
andu
sC
attle
Egr
etB
alab
ac, B
usua
nga,
Cuy
o, D
alah
ican
, Mai
nlan
d, M
al-
Ty,
SP
, Tub
bata
haN
ER
es/M
igLo
c C
omm
on
But
orid
es s
tria
tus
carc
inop
hilu
sLi
ttle
Her
onC
agay
anci
llo, C
alam
iane
s, C
uyo,
Mai
nlan
d, R
asa,
El
Nid
o, S
PN
ER
esid
ent
Fai
rly C
omm
on
Gor
sach
ius
gois
agi
(mon
otyp
ic)
Japa
nese
Nig
ht-H
eron
Mai
nlan
d, V
AN
EM
igra
ntR
are
rufo
linea
tus
Bal
abac
, Mai
nlan
dLE
-Pw
nku
tteri
Bus
uang
aLE
Spe
cies
Sub
spec
ies
Typ
eC
omm
on N
ame
Gor
sach
ius
mel
anol
ophu
sM
alay
an N
ight
-Her
onR
esid
ent
Unc
omm
on
Typ
e Lo
calit
yE
ndem
icity
Res
iden
cyO
ccur
renc
e

STATE OF THE ENVIRONMENT 139
APPE
ND
IX C
-4.
List
of A
vian
Spe
cies
in th
e Pa
law
an F
auna
l Reg
ion
(con
tinue
d).
Nyc
ticor
ax n
yctic
orax
nyct
icor
axB
lack
-cro
wne
d N
ight
-Her
onB
usua
nga
NE
Mig
rant
Unc
omm
onN
yctic
orax
cal
edon
icus
man
illen
sis
Ruf
ous
Nig
ht-H
eron
Mai
nlan
d, R
asa
NE
Res
iden
tU
ncom
mon
Ixob
rych
us s
inen
sis
(mon
otyp
ic)
Yel
low
Bitt
ern
Cuy
o, M
ainl
and,
Tub
bata
haN
ER
esid
ent
Unc
omm
onIx
obry
chus
eur
hyth
mus
(mon
otyp
ic)
Sch
renc
k's
Bitt
ern
Mai
nlan
dN
EM
igra
ntR
are
Ixob
rych
us c
inna
mom
eus
(mon
otyp
ic)
Cin
nam
on B
itter
nM
ainl
and,
Tub
bata
ha, S
PN
ER
esid
ent
Com
mon
Dup
etor
flav
icol
lisfla
vico
llis
Bla
ck B
itter
nM
ainl
and
NE
Res
iden
tU
ncom
mon
Ord
er A
nser
iform
esF
amily
Ana
tidae
Den
droc
ygna
arc
uata
arcu
ata
Wan
derin
g W
hist
ling-
Duc
kC
uyo,
Mai
nlan
dN
ER
esid
ent
Com
mon
Ana
s qu
erqu
edul
a(m
onot
ypic
)G
arga
ney
Mai
nlan
dN
EM
igra
ntC
omm
onA
ythy
a fu
ligul
a(m
onot
ypic
)T
ufte
d D
uck
Mai
nlan
dN
EM
igra
ntU
ncom
mon
Ord
er F
alco
nifo
rmes
Fam
ily P
andi
onid
aeha
liaet
usM
ainl
and,
Ras
am
elvi
llens
isB
alab
ac, M
ainl
and
Fam
ily A
ccip
itrid
aeA
vice
da je
rdon
im
agni
rost
risJe
rdon
's B
aza
Mai
nlan
dN
ER
esid
ent
Unc
omm
onP
erni
s pt
ilorh
ynch
uspa
law
anen
sis
Orie
ntal
Hon
eyB
uzza
rdC
alau
it, M
ainl
and
LE-P
wn
Res
iden
tC
omm
onE
lanu
s ca
erul
eus
hypo
leuc
usB
lack
-sho
ulde
red
Kite
Bus
uang
aN
ER
esid
ent
Unc
omm
on
Hal
iast
ur in
dus
inte
rmed
ius
Bra
hmin
y K
iteC
alam
iane
s, C
alau
it, C
uyo,
Mai
nlan
d, R
asa,
Cor
on,
Mal
-Ty,
El N
ido
NE
Res
iden
tC
omm
on
Hal
iaee
tus
leuc
ogas
ter
(mon
otyp
ic)
Whi
te-b
ellie
d S
ea E
agle
Ban
cora
n, C
alau
it, C
oron
, Cul
ion,
Man
uc M
anuk
an,
Mai
nlan
d, U
rsul
a, R
asa,
Mal
-Ty,
SP
, El N
ido
NE
Res
iden
tU
ncom
mon
Icht
hyop
haga
icht
hyae
tus
(mon
otyp
ic)
Gre
y-he
aded
Fis
h-E
agle
Cal
amia
nes
NE
Res
iden
tR
are
Circ
us s
pilo
notu
ssp
ilono
tus
Eas
tern
Mar
sh-H
arrie
rM
ainl
and
NE
Mig
rant
Unc
omm
onA
ccip
iter
gula
risgu
laris
Japa
nese
Spa
rrow
Haw
kM
ainl
and,
Ras
a, E
l Nid
oN
EM
igra
ntU
ncom
mon
Acc
ipite
r so
loen
sis
(mon
otyp
ic)
Chi
nese
Gos
haw
kC
agay
anci
llo, M
ainl
and
NE
Mig
rant
Fai
rly C
omm
on
Acc
ipite
r tr
ivirg
atus
pala
wan
usC
rest
ed G
osha
wk
Bal
abac
, Cul
ion,
Lin
apac
an, M
ainl
and,
Ras
a, U
rsul
a,
SP
, El N
ido
LE-P
wn
Res
iden
tF
airly
Com
mon
But
astu
r in
dicu
s(m
onot
ypic
)G
rey-
face
d B
uzza
rdB
alab
ac, C
agay
anci
llo, C
ulio
n, C
uyo,
Mai
nlan
dN
EM
igra
ntF
airly
Com
mon
Spi
lorn
is c
heel
apa
law
anen
sis
Cre
sted
Ser
pent
-Eag
leB
alab
ac, B
usua
nga,
Mai
nlan
d, S
P, E
l Nid
o, R
asa
LE-P
wn
Res
iden
tC
omm
onH
iera
aetu
s ki
ener
iifo
rmos
usR
ufou
s-be
llied
Eag
leM
ainl
and
NE
Res
iden
tU
ncom
mon
Spi
zaet
us c
irrha
tus
limna
eetu
sC
hang
eabl
e H
awk-
Eag
leB
usua
nga,
Cul
ion,
Mai
nlan
d, V
A, R
asa
NE
Res
iden
tU
ncom
mon
Fam
ily F
alco
nida
eF
alco
tinn
uncu
lus
inte
rstin
ctus
Eur
asia
n K
estr
elB
usua
nga,
Mai
nlan
dN
EM
igra
ntU
ncom
mon
Fal
co s
ever
usse
veru
sO
rient
al H
obby
Cul
ion,
Mai
nlan
d, E
l Nid
oN
ER
esid
ent
Unc
omm
onF
alco
per
egrin
usca
lidus
Per
egrin
e F
alco
nC
oron
, Mai
nlan
dN
EM
igra
ntU
ncom
mon
Unc
omm
onP
andi
on h
alia
etus
Osp
rey
NE
Mig
rant
Spe
cies
Sub
spec
ies
Typ
eC
omm
on N
ame
Typ
e Lo
calit
yE
ndem
icity
Res
iden
cyO
ccur
renc
e

140 PALAWAN
APPE
ND
IX C
-4.
List
of A
vian
Spe
cies
in th
e Pa
law
an F
auna
l Reg
ion
(con
tinue
d).
Ord
er G
allif
orm
esF
amily
Meg
apod
iidae
cum
ingi
iB
alab
ac, B
usua
nga,
Cal
auit,
Cul
ion,
Mai
nlan
d, U
rsul
a,
El N
ido,
Ras
a, M
al-T
y, S
PN
E
pusi
llus
Cag
ayan
cillo
LEF
amily
Pha
sian
idae
Gal
lus
gallu
sph
ilipp
ensi
sR
ed J
ungl
eFow
lB
alab
ac, B
usua
nga,
Cal
auit,
Cul
ion,
Mai
nlan
d, M
al-T
y,
SP
LER
esid
ent
Com
mon
Pol
yple
ctro
n em
phan
um(m
onot
ypic
)P
alaw
an P
eaco
ck P
heas
ant
Mai
nlan
d, S
V, M
a, M
al-T
y, S
P, E
l Nid
o, C
ulio
nP
E-P
wn
Res
iden
tU
ncom
mon
Cot
urni
x ch
inen
sis
linea
taB
lue-
brea
sted
Qua
ilC
alau
it, C
ulio
n, M
ainl
and,
Mal
-Ty
LER
esid
ent
Com
mon
Fam
ily T
urni
cida
eT
urni
x su
scita
tor
hayn
aldi
Bar
red
But
tonq
uail
Bus
uang
a, C
alau
it, C
ulio
n, M
ainl
and
LE-P
wn
Res
iden
tC
omm
onO
rder
Gru
iform
esF
amily
Ral
lidae
Gal
liral
lus
stria
tus
stria
tus
Sla
ty-b
reas
ted
Rai
lB
usua
nga,
Mai
nlan
dN
ER
esid
ent
Unc
omm
onG
allir
allu
s to
rqua
tus
torq
uatu
sB
arre
d R
ail
Cag
ayan
cillo
, El N
ido(
?), U
rsul
aN
ER
esid
ent
Com
mon
Ral
lina
fasc
iata
(mon
otyp
ic)
Red
-legg
ed C
rake
Bal
abac
, Cul
ion,
Mai
nlan
dN
ER
es?/
Mgr
?R
are
Ral
lina
euriz
onoi
des
euriz
onoi
des
Sla
ty-le
gged
Cra
keC
agay
anci
lloLE
Res
iden
tU
ncom
mon
Por
zana
pus
illa
pusi
llaB
aillo
n's
Cra
keM
ainl
and
NE
Mig
rant
Unc
omm
onP
orza
na fu
sca
fusc
aR
uddy
-bre
aste
d C
rake
Cag
ayan
cillo
NE
Res
iden
tU
ncom
mon
Por
zana
cin
erea
ocul
aris
Whi
te-b
row
ed C
rake
Mai
nlan
dLE
Res
iden
tC
omm
onA
mau
rorn
is p
hoen
icur
usja
vani
caW
hite
-bre
aste
d W
ater
hen
Bus
uang
a, C
ulio
n, M
ainl
and,
SP
NE
Res
iden
tC
omm
onG
allic
rex
cine
rea
(mon
otyp
ic)
Wat
erco
ckM
ainl
and
NE
Res
iden
tF
airly
Com
mon
Gal
linul
a ch
loro
pus
loza
noi
Com
mon
Moo
rhen
Mai
nlan
d, T
ubba
taha
LER
esid
ent
Com
mon
Ful
ica
atra
atra
Eur
asia
n C
oot
Mai
nlan
dN
EM
igra
ntU
ncom
mon
Ord
er C
hara
driif
orm
esF
amily
Ros
trat
ulid
aeR
ostr
atul
a be
ngha
lens
isbe
ngha
lens
isG
reat
er P
aint
ed-S
nipe
Mai
nlan
dN
ER
esid
ent
Com
mon
Fam
ily C
hara
driid
aeP
luvi
alis
squ
atar
ola
(mon
otyp
ic)
Gre
y P
love
rC
alau
it, C
uyo,
Mai
nlan
d, T
ubba
taha
(no
rth
isle
t)N
EM
igra
ntC
omm
on
Plu
vial
is fu
lva
(mon
otyp
ic)
Asi
an G
olde
n-P
love
rB
alab
ac, C
alam
iane
s, C
uyo,
Mai
nlan
d, R
asa,
T
ubba
taha
NE
Mig
rant
Com
mon
dubi
usC
agay
anci
llo, M
ainl
and,
Tub
bata
haR
esid
ent
curo
nicu
sB
alab
ac, M
ainl
and,
Cuy
o (s
pp),
Urs
ula
Mig
rant
Cha
radr
ius
alex
andr
inus
deal
batu
sK
entis
h P
love
rC
uyo,
Mai
nlan
d, R
asa,
Tub
bata
ha, U
rsul
aN
EM
igra
ntC
omm
onC
hara
driu
s pe
roni
i(m
onot
ypic
)M
alay
sian
Plo
ver
Bal
abac
, Dum
aran
, Mai
nlan
d, U
rsul
aN
ER
esid
ent
Unc
omm
on
Cha
radr
ius
mon
golu
sm
ongo
lus
Less
er S
and-
Plo
ver
Cag
ayan
cillo
, Cuy
o, M
ainl
and,
Tub
bata
ha, U
rsul
aN
EM
igra
ntC
omm
on
Cha
radr
ius
dubi
usLi
ttle
Rin
ged-
Plo
ver
NE
Com
mon
Meg
apod
ius
cum
ingi
iT
abon
Scr
ubF
owl
Res
iden
tLo
c C
omm
on
Spe
cies
Sub
spec
ies
Typ
eC
omm
on N
ame
Typ
e Lo
calit
yE
ndem
icity
Res
iden
cyO
ccur
renc
e

STATE OF THE ENVIRONMENT 141
APPE
ND
IX C
-4.
List
of A
vian
Spe
cies
in th
e Pa
law
an F
auna
l Reg
ion
(con
tinue
d).
Cha
radr
ius
lesc
hena
ultii
(mon
otyp
ic)
Gre
ater
San
d-P
love
rC
agay
anci
llo, C
uyo,
Mai
nlan
dN
EM
igra
ntC
omm
onC
hara
driu
s ve
redu
s(m
onot
ypic
)O
rient
al P
love
rM
ainl
and
NE
Mig
rant
Rar
eF
amily
Sco
lopa
cida
eN
umen
ius
arqu
ata
orie
ntal
isE
uras
ian
Cur
lew
Mai
nlan
d, R
asa,
Tub
bata
haN
EM
igra
ntU
ncom
mon
Num
eniu
s ph
aeop
usva
riega
tus
Whi
mbr
elC
agay
anci
llo, C
uyo,
Mai
nlan
d, R
asa,
Tub
bata
haN
EM
igra
ntC
omm
onLi
mos
a la
ppon
ica
baue
riB
ar-t
aile
d G
odw
itC
uyo,
Tub
bata
haN
EM
igra
ntU
ncom
mon
Lim
osa
limos
aB
lack
-tai
led
God
wit
Tub
bata
haN
EM
igra
ntR
are
Trin
ga to
tanu
seu
rhin
usC
omm
on R
edsh
ank
Bal
abac
, Ban
cora
n, C
uyo,
Mai
nlan
dN
EM
igra
ntC
omm
onT
ringa
neb
ular
ia(m
onot
ypic
)C
omm
on G
reen
shan
kM
ainl
and,
Ras
a, T
ubba
taha
NE
Mig
rant
Com
mon
Trin
ga o
chro
pus
(mon
otyp
ic)
Gre
en S
andp
iper
Mai
nlan
d, T
ubba
taha
NE
Mig
rant
Unc
omm
on
Trin
ga g
lare
ola
(mon
otyp
ic)
Woo
d S
andp
iper
Bus
uang
a, C
uyo,
Mai
nlan
d, R
asa
NE
Mig
rant
Com
mon
Trin
ga s
tagn
atili
s(m
onot
ypic
)M
arsh
San
dpip
erM
ainl
and
NE
Mig
rant
Unc
omm
on
Act
itis
hypo
leuc
os(m
onot
ypic
)C
omm
on S
andp
iper
Agu
taya
, Bal
abac
, Ban
cora
n, C
agay
anci
llo, C
ulio
n,
Cuy
o, D
alah
ican
, Lin
apac
an, M
anuc
Man
ukan
, M
ainl
and,
Ras
a, E
l Nid
oN
EM
igra
ntC
omm
on
Xen
us c
iner
eus
(mon
otyp
ic)
Ter
ek S
andp
iper
Mai
nlan
d, E
l Nid
oN
EM
igra
ntF
airly
Com
mon
Het
eros
celu
s br
evip
es(m
onot
ypic
)G
rey-
taile
d T
attle
rC
agay
anci
llo, C
uyo,
Man
uc M
anuk
an, M
ainl
and,
Ras
a,
Tub
bata
haN
EM
igra
ntC
omm
on
Are
naria
inte
rpre
sin
terp
res
Rud
dy T
urns
tone
Cag
ayan
cillo
, Man
uc M
anuk
an, M
ainl
and,
Ras
a,
Tub
bata
haN
EM
igra
ntF
airly
Com
mon
Gal
linag
o st
enur
a(m
onot
ypic
)P
inta
il S
nipe
Mai
nlan
dN
EM
igra
ntF
airly
Com
mon
Gal
linag
o m
egal
a(m
onot
ypic
)S
win
hoe'
s S
nipe
Mai
nlan
dN
EM
igra
ntC
omm
onG
allin
ago
galli
nago
galli
nago
Com
mon
Sni
peM
ainl
and
NE
Mig
rant
Fai
rly C
omm
onC
alid
ris te
nuiro
stris
(mon
otyp
ic)
Gre
at K
not
Cuy
o, M
ainl
and
NE
Mig
rant
Rar
e to
Unc
Cal
idris
ruf
icol
lis(m
onot
ypic
)R
ufou
s-ne
cked
Stin
tB
alab
ac, C
uyo,
Mai
nlan
d, T
ubba
taha
NE
Mig
rant
Com
mon
Cal
idris
sub
min
uta
(mon
otyp
ic)
Long
-toe
d S
tint
Mai
nlan
dN
EM
igra
ntC
omm
onC
alid
ris a
cum
inat
a(m
onot
ypic
)S
harp
-tai
led
San
dpip
erM
ainl
and
NE
Mig
rant
Unc
omm
onC
alid
ris fe
rrug
inea
(mon
otyp
ic)
Cur
lew
San
dpip
erM
ainl
and,
Ras
aN
EM
igra
ntF
airly
Com
mon
Phi
lom
achu
s pu
gnax
(mon
otyp
ic)
Ruf
f (m
), R
eeve
(f)
Mai
nlan
d, T
ubba
taha
NE
Mig
rant
Rar
eLi
mic
ola
falc
inel
lus
sibi
rica
Bro
ad-b
illed
San
dpip
erM
ainl
and
NE
Mig
rant
Unc
omm
onF
amily
Pha
laro
podi
dae
Pha
laro
pus
loba
tus
(mon
otyp
ic)
Red
-nec
ked
Pha
laro
peM
ainl
and,
Ram
esam
ey, T
ubba
taha
NE
Mig
rant
Unc
omm
onF
amily
Gla
reol
idae
Gla
reol
a m
aldi
varu
m(m
onot
ypic
)O
rient
al P
ratin
cole
Ban
cora
n, M
ainl
and
NE
Res
/Mig
(?)
Com
mon
Fam
ily B
urhi
nida
eE
sacu
s m
agni
rost
rism
agni
rost
risB
each
Thi
ck-K
nee
Mai
nlan
dN
ER
esid
ent
Rar
e
Spe
cies
Sub
spec
ies
Typ
eC
omm
on N
ame
Typ
e Lo
calit
yE
ndem
icity
Res
iden
cyO
ccur
renc
e
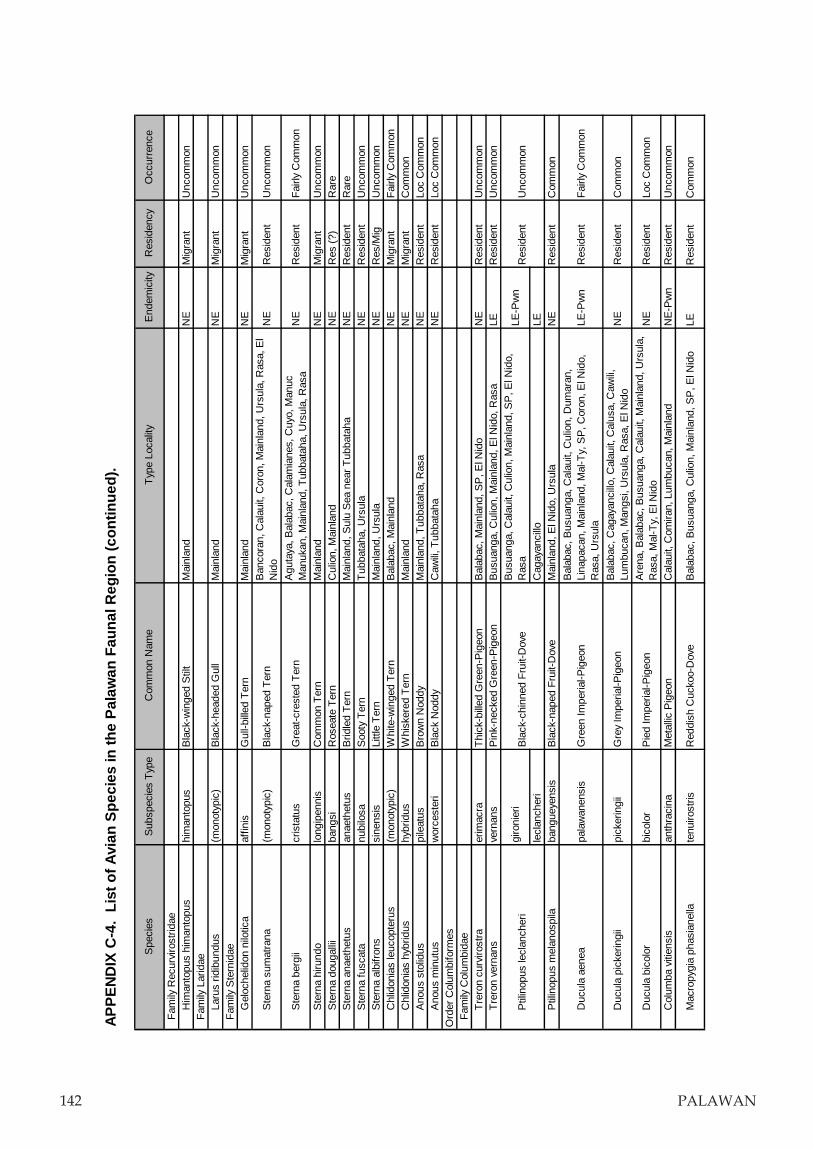
142 PALAWAN
APPE
ND
IX C
-4.
List
of A
vian
Spe
cies
in th
e Pa
law
an F
auna
l Reg
ion
(con
tinue
d).
Fam
ily R
ecur
viro
strid
aeH
iman
topu
s hi
man
topu
shi
man
topu
sB
lack
-win
ged
Stil
tM
ainl
and
NE
Mig
rant
Unc
omm
onF
amily
Lar
idae
Laru
s rid
ibun
dus
(mon
otyp
ic)
Bla
ck-h
eade
d G
ull
Mai
nlan
dN
EM
igra
ntU
ncom
mon
Fam
ily S
tern
idae
Gel
oche
lidon
nilo
tica
affin
isG
ull-b
illed
Ter
nM
ainl
and
NE
Mig
rant
Unc
omm
on
Ste
rna
sum
atra
na(m
onot
ypic
)B
lack
-nap
ed T
ern
Ban
cora
n, C
alau
it, C
oron
, Mai
nlan
d, U
rsul
a, R
asa,
El
Nid
oN
ER
esid
ent
Unc
omm
on
Ste
rna
berg
iicr
ista
tus
Gre
at-c
rest
ed T
ern
Agu
taya
, Bal
abac
, Cal
amia
nes,
Cuy
o, M
anuc
M
anuk
an, M
ainl
and,
Tub
bata
ha, U
rsul
a, R
asa
NE
Res
iden
tF
airly
Com
mon
Ste
rna
hiru
ndo
long
ipen
nis
Com
mon
Ter
nM
ainl
and
NE
Mig
rant
Unc
omm
onS
tern
a do
ugal
liiba
ngsi
Ros
eate
Ter
nC
ulio
n, M
ainl
and
NE
Res
(?)
Rar
eS
tern
a an
aeth
etus
anae
thet
usB
ridle
d T
ern
Mai
nlan
d, S
ulu
Sea
nea
r T
ubba
taha
NE
Res
iden
tR
are
Ste
rna
fusc
ata
nubi
losa
Soo
ty T
ern
Tub
bata
ha, U
rsul
aN
ER
esid
ent
Unc
omm
onS
tern
a al
bifr
ons
sine
nsis
Littl
e T
ern
Mai
nlan
d, U
rsul
aN
ER
es/M
igU
ncom
mon
Chl
idon
ias
leuc
opte
rus
(mon
otyp
ic)
Whi
te-w
inge
d T
ern
Bal
abac
, Mai
nlan
dN
EM
igra
ntF
airly
Com
mon
Chl
idon
ias
hybr
idus
hybr
idus
Whi
sker
ed T
ern
Mai
nlan
dN
EM
igra
ntC
omm
onA
nous
sto
lidus
pile
atus
Bro
wn
Nod
dyM
ainl
and,
Tub
bata
ha, R
asa
NE
Res
iden
tLo
c C
omm
onA
nous
min
utus
wor
cest
eri
Bla
ck N
oddy
Caw
ili, T
ubba
taha
NE
Res
iden
tLo
c C
omm
onO
rder
Col
umbi
form
esF
amily
Col
umbi
dae
Tre
ron
curv
irost
raer
imac
raT
hick
-bill
ed G
reen
-Pig
eon
Bal
abac
, Mai
nlan
d, S
P, E
l Nid
oN
ER
esid
ent
Unc
omm
onT
rero
n ve
rnan
sve
rnan
sP
ink-
neck
ed G
reen
-Pig
eon
Bus
uang
a, C
ulio
n, M
ainl
and,
El N
ido,
Ras
aLE
Res
iden
tU
ncom
mon
giro
nier
iB
usua
nga,
Cal
auit,
Cul
ion,
Mai
nlan
d, S
P, E
l Nid
o,
Ras
aLE
-Pw
n
lecl
anch
eri
Cag
ayan
cillo
LEP
tilin
opus
mel
anos
pila
bang
ueye
nsis
Bla
ck-n
aped
Fru
it-D
ove
Mai
nlan
d, E
l Nid
o, U
rsul
aN
ER
esid
ent
Com
mon
Duc
ula
aene
apa
law
anen
sis
Gre
en Im
peria
l-Pig
eon
Bal
abac
, Bus
uang
a, C
alau
it, C
ulio
n, D
umar
an,
Lina
paca
n, M
ainl
and,
Mal
-Ty,
SP
, Cor
on, E
l Nid
o,
Ras
a, U
rsul
aLE
-Pw
nR
esid
ent
Fai
rly C
omm
on
Duc
ula
pick
erin
gii
pick
erin
gii
Gre
y Im
peria
l-Pig
eon
Bal
abac
, Cag
ayan
cillo
, Cal
auit,
Cal
usa,
Caw
ili,
Lum
buca
n, M
angs
i, U
rsul
a, R
asa,
El N
ido
NE
Res
iden
tC
omm
on
Duc
ula
bico
lor
bico
lor
Pie
d Im
peria
l-Pig
eon
Are
na, B
alab
ac, B
usua
nga,
Cal
auit,
Mai
nlan
d, U
rsul
a,
Ras
a, M
al-T
y, E
l Nid
oN
ER
esid
ent
Loc
Com
mon
Col
umba
viti
ensi
san
thra
cina
Met
allic
Pig
eon
Cal
auit,
Com
iran,
Lum
buca
n, M
ainl
and
NE
-Pw
nR
esid
ent
Unc
omm
on
Mac
ropy
gia
phas
iane
llate
nuiro
stris
Red
dish
Cuc
koo-
Dov
eB
alab
ac, B
usua
nga,
Cul
ion,
Mai
nlan
d, S
P, E
l Nid
oLE
Res
iden
tC
omm
on
Ptil
inop
us le
clan
cher
iB
lack
-chi
nned
Fru
it-D
ove
Res
iden
tU
ncom
mon
Spe
cies
Sub
spec
ies
Typ
eC
omm
on N
ame
Typ
e Lo
calit
yE
ndem
icity
Res
iden
cyO
ccur
renc
e

STATE OF THE ENVIRONMENT 143
APPE
ND
IX C
-4.
List
of A
vian
Spe
cies
in th
e Pa
law
an F
auna
l Reg
ion
(con
tinue
d).
Str
epto
pelia
bito
rqua
tadu
sum
ieri
Isla
nd C
olla
red-
Dov
eA
guta
ya, B
usua
nga,
Cag
ayan
cillo
, Cal
auit,
Cul
ion,
C
uyo,
Mai
nlan
d, U
rsul
a, C
oron
, Mal
-Ty,
El N
ido
LER
esid
ent
Unc
omm
on
Str
epto
pelia
chi
nens
istig
rina
Spo
tted
Dov
eB
alab
ac, B
usua
nga,
Cul
ion,
Mai
nlan
d, S
PN
ER
esid
ent
Com
mon
Geo
pelia
str
iata
stria
taZ
ebra
Dov
eM
ainl
and,
Urs
ula,
Mal
-Ty
NE
Res
iden
tC
omm
on
Cha
lcop
haps
indi
cain
dica
Em
eral
d D
ove
Cag
ayan
cillo
, Cal
auit,
Cul
ion,
Cuy
o, M
ainl
and,
El N
ido,
U
rsul
a, R
asa,
Mal
-Ty,
SP
NE
Res
iden
tC
omm
on
Cal
oena
s ni
coba
rica
nico
baric
aN
icob
ar P
igeo
nB
alab
ac, C
awili
, Lum
buca
n, M
angs
i, M
ainl
and,
Urs
ula,
R
asa,
El N
ido
NE
Res
iden
tR
are
Ord
er P
sitta
cifo
rmes
Fam
ily P
sitta
cida
e
Cac
atua
hae
mat
urop
ygia
(mon
otyp
ic)
Phi
lippi
ne C
ocka
too
Bal
abac
, Cal
auit,
Cul
ion,
Mai
nlan
d, B
usua
nga,
SV
, R
asa,
Cor
on, M
al-T
y, S
P, E
l Nid
oP
ER
esid
ent
Rar
e
Tan
ygna
thus
luci
onen
sis
salv
ador
iiB
lue-
nape
d P
arro
tB
usua
nga,
Cal
auit,
Cul
ion,
Mai
nlan
d, R
asa,
Cor
on, M
al-
Ty,
SP
, El N
ido
NE
Res
iden
tU
ncom
mon
Prio
nitu
rus
plat
enae
(mon
otyp
ic)
Blu
e-he
aded
Rac
quet
-tai
lB
alab
ac, B
usua
nga,
Cal
auit,
Cul
ion,
Dum
aran
, M
ainl
and,
SV
, VA
, Ma,
Mal
-Ty,
SP
, El N
ido,
Ras
aP
E-P
wn
Res
iden
tU
ncom
mon
Ord
er C
ucul
iform
esF
amily
Cuc
uild
aeC
lam
ator
cor
oman
dus
(mon
otyp
ic)
Che
stnu
t-w
inge
d C
ucko
oM
ainl
and
NE
Mig
rant
Rar
eC
ucul
us s
parv
eroi
des
spar
vero
ides
Larg
e H
awk-
Cuc
koo
Bus
uang
a, M
ainl
and
NE
Mig
rant
Unc
omm
onC
ucul
us fu
gax
pect
oral
isH
odgs
on's
Haw
k-C
ucko
oC
agay
anci
llo, M
ainl
and,
El N
ido
LER
esid
ent
Unc
omm
onho
rsfie
ldi
Mai
nlan
dsa
tura
tus
Man
gsi
Cac
oman
tis s
onne
ratii
schl
egel
iB
ande
d B
ay C
ucko
oM
ainl
and,
Ras
aN
E-P
wn
Res
iden
tR
are
Cac
oman
tis m
erul
inus
mer
ulin
usP
lain
tive
Cuc
koo
Bal
abac
, Mai
nlan
d, E
l Nid
o, R
asa,
Mal
-Ty,
SP
NE
Res
iden
tC
omm
on
Cac
oman
tis v
ario
losu
sse
pulc
ralis
Bru
sh C
ucko
oB
usua
nga,
Mai
nlan
d, E
l Nid
o, T
ubba
taha
NE
Res
iden
tC
omm
onC
hrys
ococ
cyx
xant
horh
ynch
usxa
ntho
rhyn
chus
Vio
let C
ucko
oM
ainl
and
NE
-Pw
nR
esid
ent
Unc
omm
onS
urni
culu
s lu
gubr
ism
inim
usD
rong
o C
ucko
oB
alab
ac, C
alau
it, M
ainl
and,
Ras
a, S
PLE
-Pw
nR
esid
ent
Fai
rly C
omm
on
Eud
ynam
is s
colo
pace
am
inda
nens
isC
omm
on K
oel
Cag
ayan
cillo
, Cuy
o, L
umbu
can,
Mai
nlan
d, E
l Nid
o,
Urs
ula,
Cor
on, M
al-T
yLE
Res
iden
tLo
c C
omm
on
Pha
enic
opha
eus
curv
irost
risha
rrin
gton
iC
hest
nut-
brea
sted
Mal
koha
Bal
abac
, Bus
uang
a, C
alau
it, C
ulio
n, D
umar
an,
Mai
nlan
d, U
rsul
a, S
PLE
-Pw
nR
esid
ent
Fai
rly C
omm
on
Cen
trop
us s
inen
sis
bubu
tus
Gre
ater
Cou
cal
Bal
abac
, Mai
nlan
d, M
al-T
y, S
PN
ER
esid
ent
Loc
Com
mon
Cen
trop
us b
enga
lens
isja
vane
nsis
Less
er C
ouca
lB
alab
ac, C
alam
iane
s, C
alau
it, M
ainl
and,
Ras
a, E
l Nid
oN
ER
esid
ent
Com
mon
Cen
trop
us v
iridi
svi
ridis
Phi
lippi
ne C
ouca
lC
agay
anci
llo, C
uyo,
Cor
onP
ER
esid
ent
Com
mon
Unc
omm
onC
ucul
us s
atur
atus
Orie
ntal
Cuc
koo
NE
Mig
rant
Spe
cies
Sub
spec
ies
Typ
eC
omm
on N
ame
Typ
e Lo
calit
yE
ndem
icity
Res
iden
cyO
ccur
renc
e

144 PALAWAN
APPE
ND
IX C
-4.
List
of A
vian
Spe
cies
in th
e Pa
law
an F
auna
l Reg
ion
(con
tinue
d).
Ord
er S
trig
iform
esF
amily
Tyt
onid
aeT
yto
cape
nsis
amau
rono
taG
rass
Ow
lC
alam
iane
s, C
alau
it, M
ainl
and
LER
esid
ent
Fai
rly C
omm
onF
amily
Str
igid
aem
anta
nane
nsis
Sou
ther
n co
ast,
Ras
a, U
rsul
aN
E-P
wn
cuye
nsis
Cuy
o, D
icab
aito
, Lin
apac
anLE
-Pw
nO
tus
fulig
inos
us(m
onot
ypic
)P
alaw
an S
cops
Ow
lM
ainl
and,
SP
, VA
, Ma,
Urs
ula
PE
-Pw
nR
esid
ent
Unc
omm
onpa
law
anen
sis
Mai
nlan
d, R
asa
LE-P
wn
Res
iden
tja
poni
caC
uyo
NE
Mig
rant
Str
ix s
elop
uto
wie
pken
iS
potte
d W
ood-
Ow
lB
usua
nga,
Mai
nlan
d, S
P, E
l Nid
oLE
-Pw
nR
esid
ent
Unc
omm
onO
rder
Cap
rimul
gifo
rmes
Fam
ily P
odar
gida
eB
atra
chos
tom
us ja
vens
isch
asen
iJa
van
Fro
gmou
thB
usua
nga,
Cul
ion,
Mai
nlan
d, S
P, E
l Nid
oLE
-Pw
nR
esid
ent
Unc
omm
onF
amily
Cap
rimul
gida
eC
aprim
ulgu
s in
dicu
sjo
taka
Gre
y N
ight
jar
Mai
nlan
dN
EM
igra
ntR
are
Cap
rimul
gus
mac
ruru
sjo
hnso
niLa
rge-
taile
d N
ight
jar
Bus
uang
a, C
alau
it, C
ulio
n, M
ainl
and,
Ras
a, C
oron
, Mal
-T
y, S
P, E
l Nid
oLE
-Pw
nR
esid
ent
Fai
rly C
omm
on
Ord
er A
podi
form
esF
amily
Apo
dida
epa
law
anen
sis
Mai
nlan
d, S
P, E
l Nid
o, S
V, V
A, M
aLE
-Pw
nam
elis
Cag
ayan
cillo
NE
Col
loca
lia m
earn
si(m
onot
ypic
)P
hilip
pine
Sw
iftle
tM
ainl
and
PE
Res
iden
tC
omm
on
Col
loca
lia fu
ciph
aga
germ
ani
Edi
ble-
nest
Sw
iftle
tC
agay
anci
llo, C
ulio
n, C
uyo,
Mai
nlan
d, s
mal
l NW
is
land
s, S
P, E
l Nid
oN
ER
esid
ent
Unc
omm
on
Col
loca
lia e
scul
enta
spp.
Glo
ssy
Sw
iftle
tB
usua
nga,
Cal
auit,
Mai
nlan
d, S
P, E
l Nid
oN
ER
esid
ent
Com
mon
Col
loca
lia tr
oglo
dyte
s(m
onot
ypic
)P
ygm
y S
wift
let
Cal
auit,
Mai
nlan
d, C
oron
, Mal
-Ty,
SP
, El N
ido
PE
Res
iden
tF
airly
Com
mon
Hiru
ndap
us g
igan
teus
giga
nteu
sB
row
n-ba
cked
Nee
dlet
ail
Cul
ion,
Mai
nlan
d, M
al-T
yN
E-P
wn
Res
iden
tU
ncom
mon
Apu
s pa
cific
uspa
cific
usF
ork-
taile
d S
wift
Urs
ula
NE
Mig
rant
Unc
omm
onO
rder
Cor
aciif
orm
esF
amily
Cor
aciid
ae
Eur
ysto
mus
orie
ntal
iscy
anoc
ollis
Dol
larb
irdB
usua
nga,
Cag
ayan
cillo
, Cul
ion,
Cuy
o, M
ainl
and,
R
asa,
SP
NE
Res
iden
tF
airly
Com
mon
Fam
ily A
lced
inid
ae
Alc
edo
atth
isbe
ngal
ensi
sC
omm
on K
ingf
ishe
rB
alab
ac, C
agay
anci
llo, C
ulio
n, C
uyo,
Mai
nlan
d, R
asa,
T
ubba
taha
NE
Mig
rant
Com
mon
Alc
edo
men
intin
gam
adon
iB
lue-
eare
d K
ingf
ishe
rB
alab
ac, B
usua
nga,
Cul
ion,
Mai
nlan
d, S
P, E
l Nid
oLE
-Pw
nR
esid
ent
Unc
omm
on
Spe
cies
Sub
spec
ies
Typ
eC
omm
on N
ame
Typ
e Lo
calit
yE
ndem
icity
Res
iden
cyO
ccur
renc
e
Otu
s m
anta
nane
nsis
Man
tana
ni S
cops
-Ow
lR
esid
ent
Fai
rly C
omm
on
Nin
ox s
cutu
lata
Bro
wn
Haw
k-O
wl
Unc
omm
on
Col
loca
lia v
anik
oren
sis
Isla
nd S
wift
let
Res
iden
tC
omm
on

STATE OF THE ENVIRONMENT 145
APPE
ND
IX C
-4.
List
of A
vian
Spe
cies
in th
e Pa
law
an F
auna
l Reg
ion
(con
tinue
d).
Cey
x er
ithac
usru
fidor
saO
rient
al D
war
f Kin
gfis
her
Bal
abac
, Bus
uang
a, C
ulio
n, M
ainl
and,
SP
, El N
ido
NE
Res
iden
tU
ncom
mon
Hal
cyon
cap
ensi
sgo
uldi
Sto
rk-b
illed
Kin
gfis
her
Bal
abac
, Cal
auit,
Cul
ion,
Mai
nlan
d, M
al-T
y, S
P, R
asa
LER
esid
ent
Unc
omm
on
Hal
cyon
cor
oman
dalin
aeR
uddy
Kin
gfis
her
Mai
nlan
d, E
l Nid
oLE
-Pw
nR
esid
ent
Unc
omm
on
Hal
cyon
pile
ata
(mon
otyp
ic)
Bla
ck-c
appe
d K
ingf
ishe
rB
alab
ac, M
ainl
and,
El N
ido
NE
Mig
rant
Rar
e
Hal
cyon
chl
oris
colla
risW
hite
-col
lare
d K
ingf
ishe
rB
anco
ran,
Cag
ayan
cillo
, Cal
amia
nes,
Cal
auit,
Cuy
o,
Dal
ahic
an, L
umbu
can,
Man
uc M
anuk
an, M
ainl
and,
T
ubba
taha
, Urs
ula,
Ras
a, C
oron
, Mal
-Ty,
El N
ido
NE
Res
iden
tC
omm
on
Fam
ily M
erop
idae
Mer
ops
virid
isam
eric
anus
Blu
e-th
roat
ed B
ee-e
ater
Cag
ayan
cillo
, Cul
ion,
Dum
aran
, El N
ido
LER
esid
ent
Fai
rly C
omm
onF
amily
Buc
erot
idae
Ant
hrac
ocer
os m
arch
ei(m
onot
ypic
)P
alaw
an H
ornb
illB
alab
ac, B
usua
nga,
Cal
auit,
Mai
nlan
d, M
a, V
A, C
ulio
n,
SV
, Cor
on, M
al-T
y, S
P, E
l Nid
oP
E-P
wn
Res
iden
tU
ncom
mon
Ord
er P
icifo
rmes
Fam
ily P
icid
aeM
ulle
ripic
us p
ulve
rule
ntus
pulv
erul
entu
sG
reat
Sla
ty W
oodp
ecke
rB
alab
ac, M
ainl
and,
SP
NE
-Pw
nR
esid
ent
Unc
omm
on
Chr
ysoc
olap
tes
luci
dus
eryt
hroc
epha
lus
Gre
ater
Fla
meb
ack
Bal
abac
, Bus
uang
a, C
alau
it, M
ainl
and,
Mal
-Ty,
SP
, El
Nid
oLE
-Pw
nR
esid
ent
Fai
rly C
omm
on
Dry
ocop
us ja
vens
isha
rgitt
iW
hite
-bel
lied
Woo
dpec
ker
Mai
nlan
d, S
PLE
-Pw
nR
esid
ent
Fai
rly C
omm
onD
inop
ium
java
nens
eev
eret
tiC
omm
on F
lam
ebac
kB
alab
ac, B
usua
nga,
Cul
ion,
Mai
nlan
d, R
asa,
SP
LE-P
wn
Res
iden
tU
ncom
mon
Ord
er P
asse
rifor
mes
Fam
ily P
ittid
aepr
opin
qua
Bal
abac
, Mai
nlan
d, S
PLE
-Pw
nth
omps
oni
Cal
auit,
Cul
ion
LE-P
wn
eryt
hrog
aste
rC
agay
anci
lloLE
Pitt
a so
rdid
apa
law
anen
sis
Hoo
ded
Pitt
aB
alab
ac, C
alau
it, C
oron
, Cul
ion,
Mai
nlan
d, S
P, E
l Nid
oLE
-Pw
nR
esid
ent
Com
mon
Fam
ily H
irund
inid
aeR
ipar
ia r
ipar
iaiji
mae
San
d M
artin
Mai
nlan
dN
EM
igra
ntR
are
Hiru
ndo
rust
ica
guttu
ralis
Bar
n S
wal
low
Bal
abac
, Ban
cora
n, C
uyo,
Man
uc M
anuk
an, M
ainl
and,
U
rsul
a, R
asa,
El N
ido,
Tub
bata
haN
EM
igra
ntC
omm
on
Hiru
ndo
tahi
tica
java
nica
Pac
ific
Sw
allo
wB
alab
ac, B
usua
nga,
Cal
auit,
Cuy
o, D
alah
ican
, Lu
mbu
can,
Mai
nlan
d, R
asa,
Cor
on, M
al-T
y, E
l Nid
oN
ER
esid
ent
Com
mon
Hiru
ndo
daur
ica
strio
lata
Red
-rum
ped
Sw
allo
wM
ainl
and
NE
Res
iden
tLo
c C
omm
on
End
emic
ityR
esid
ency
Occ
urre
nce
Spe
cies
Sub
spec
ies
Typ
eC
omm
on N
ame
Typ
e Lo
calit
y
Pitt
a er
ythr
ogas
ter
Red
-bel
lied
Pitt
aR
esid
ent
Fai
rly C
omm
on

146 PALAWAN
APPE
ND
IX C
-4.
List
of A
vian
Spe
cies
in th
e Pa
law
an F
auna
l Reg
ion
(con
tinue
d).
Fam
ily C
ampe
phag
idae
Cor
acin
a st
riata
diff
icili
sB
ar-b
ellie
d C
ucko
o-S
hrik
eB
alab
ac, B
usua
nga,
Cul
ion,
Mai
nlan
d, C
oron
, Mal
-Ty,
S
P, E
l Nid
oLE
-Pw
nR
esid
ent
Com
mon
Lala
ge n
igra
chile
nsis
Pie
d T
rille
rC
agay
anci
llo, C
alam
iane
s, C
uyo,
Mai
nlan
d, U
rsul
a,
Ras
a, S
P, E
l Nid
oLE
Res
iden
tC
omm
on
Per
icro
tus
diva
ricat
usdi
varic
atus
Ash
y M
iniv
etB
alab
ac, M
ainl
and
NE
Mig
rant
Unc
omm
onP
eric
rotu
s ci
nnam
omeu
sig
neus
Sm
all M
iniv
etM
ainl
and,
Urs
ula,
SP
NE
-Pw
nR
esid
ent
Fai
rly C
omm
onF
amily
Chl
orop
seid
ae
Chl
orop
sis
pala
wan
ensi
s(m
onot
ypic
)Y
ello
w-t
hroa
ted
Leaf
bird
Bal
abac
, Bus
uang
a, C
alau
it, C
oron
, Cul
ion,
Dum
aran
, M
ainl
and,
Mal
-Ty,
SP
, El N
ido,
SV
, VA
, Ma,
Ras
aP
E-P
wn
Res
iden
tC
omm
on
Aeg
ithin
a tip
hia
aequ
anim
isC
omm
on Io
raD
umar
an, M
ainl
and,
Mal
-Ty,
Ras
a, S
P, E
l Nid
oN
E-P
wn
Res
iden
tF
airly
Com
mon
Fam
ily P
ycno
notid
aeP
ycno
notu
s at
ricep
sat
ricep
sB
lack
-hea
ded
Bul
bul
Cal
auit,
Dum
aran
, Mai
nlan
d, E
l Nid
o, R
asa,
SP
NE
-Pw
nR
esid
ent
Com
mon
Pyc
nono
tus
plum
osus
cine
reifr
ons
Oliv
e-w
inge
d B
ulbu
lB
usua
nga,
Cul
ion,
Mai
nlan
d, R
asa,
Cor
on, M
al-T
y, S
P,
El N
ido
LE-P
wn
Res
iden
tF
airly
Com
mon
Crin
iger
bre
sfr
ater
Gre
y-ch
eeke
d B
ulbu
lB
alab
ac, B
usua
nga,
Mai
nlan
d, S
P, E
l Nid
o, R
asa
LE-P
wn
Res
iden
tC
omm
onH
ypsi
pete
s pa
law
anen
sis
(mon
otyp
ic)
Sul
phur
-bel
lied
Bul
bul
Mai
nlan
d, S
P, E
l Nid
o, V
A, M
aP
E-P
wn
Res
iden
tU
ncom
mon
Fam
ily D
icru
ridae
Dic
ruru
s le
ucop
haeu
sle
ucop
haeu
sA
shy
Dro
ngo
Bal
abac
, Bus
uang
a, C
ulio
n, M
ainl
and,
Ras
a, S
P, E
l N
ido,
Cor
on, M
al-T
yN
E-P
wn
Res
iden
tF
airly
Com
mon
pala
wan
ensi
sB
alab
ac, B
usua
nga,
Cul
ion,
Mai
nlan
d, M
al-T
y, S
P, E
l N
ido,
Ras
a, U
rsul
aLE
cuye
nsis
Cuy
oLE
-Pw
nF
amily
Orio
lidae
Orio
lus
xant
hono
tus
pers
uasu
sD
ark-
thro
ated
Orio
leC
ulio
n, M
ainl
and,
SP
NE
-Pw
nR
esid
ent
Fai
rly C
omm
on
Orio
lus
chin
ensi
sch
inen
sis
Bla
ck-n
aped
Orio
leB
alab
ac, B
usua
nga,
Cag
ayan
cillo
, Cal
auit,
Cul
ion,
C
uyo,
Mai
nlan
d, S
P, E
l Nid
o, R
asa,
Cor
on, M
al-T
y,
Urs
ula
LER
esid
ent
Com
mon
Iren
a pu
ella
twee
ddal
eiA
sian
Fai
ry B
lueb
irdB
alab
ac, B
usua
nga,
Cal
auit,
Cul
ion,
Mai
nlan
d, S
P, E
l N
ido,
Ras
aLE
-Pw
nR
esid
ent
Com
mon
Fam
ily C
orvi
dae
Cor
vus
enca
pusi
llus
Sle
nder
-bill
ed C
row
Bal
abac
, Bus
uang
a, C
alau
it, C
oron
, Cul
ion,
Dal
ahic
an,
Mai
nlan
d, R
asa,
Mal
-Ty,
SP
, El N
ido
LER
esid
ent
Loc
Com
mon
Cor
vus
mac
rorh
ynch
osph
ilipp
inus
Larg
e-bi
lled
Cro
wC
agay
anci
llo, C
uyo,
Mai
nlan
dLE
Res
iden
tC
omm
onF
amily
Par
idae
Par
us a
mab
ilis
(mon
otyp
ic)
Pal
awan
Tit
Bal
abac
, Cal
auit,
Mai
nlan
d, M
a, V
A, S
V, S
P, E
l Nid
o,
Ras
aP
E-P
wn
Res
iden
tU
ncom
mon
Spe
cies
Sub
spec
ies
Typ
eC
omm
on N
ame
Typ
e Lo
calit
yE
ndem
icity
Res
iden
cyO
ccur
renc
e
Dic
ruru
s ho
ttent
ottu
sS
pang
led
Dro
ngo
Res
iden
tC
omm
on

STATE OF THE ENVIRONMENT 147
APPE
ND
IX C
-4.
List
of A
vian
Spe
cies
in th
e Pa
law
an F
auna
l Reg
ion
(con
tinue
d).
Fam
ily S
ittid
aeS
itta
fron
talis
pala
wan
aV
elve
t-fr
onte
d N
utha
tch
Bal
abac
, Mai
nlan
d, S
PLE
-Pw
nR
esid
ent
Com
mon
Fam
ily T
imal
iidae
Tric
hast
oma
cine
reic
eps
(mon
otyp
ic)
Ash
y-he
aded
Bab
bler
Bal
abac
, Mai
nlan
d, S
P, V
A, M
aP
E-P
wn
Res
iden
tF
airly
Com
mon
Mal
acop
tero
n pa
law
anen
se(m
onot
ypic
)M
elod
ious
Bab
bler
Bal
abac
, Mai
nlan
d, S
P, V
A, M
a, E
l Nid
oP
E-P
wn
Res
iden
tU
ncom
mon
Ptil
ocic
hla
falc
ata
(mon
otyp
ic)
Fal
cate
d G
roun
d-B
abbl
erB
alab
ac, M
ainl
and,
SP
, VA
, Ma
PE
-Pw
nR
esid
ent
Unc
omm
on
Sta
chyr
is h
ypog
ram
mic
a(m
onot
ypic
)P
alaw
an S
trip
ed-B
abbl
erM
ts B
oran
gbat
o, M
anta
linga
jan,
and
Vic
toria
, VA
PE
-Pw
nR
esid
ent
Com
mon
Mac
ronu
s gu
laris
woo
diS
trip
ed T
it-B
abbl
erB
alab
ac, M
ainl
and,
Ras
a, S
P, E
l Nid
oLE
-Pw
nR
esid
ent
Com
mon
Fam
ily T
urdi
dae
Bra
chyp
tery
x m
onta
nasi
llim
ani
Whi
te-b
row
ed S
hortw
ing
Mts
Man
talin
gaja
n an
d V
icto
riaLE
-Pw
nR
esid
ent
Com
mon
Cop
sych
us n
iger
(mon
otyp
ic)
Whi
te-v
ente
d S
ham
aB
alab
ac, B
anta
c, B
usua
nga,
Bat
as, C
oron
, Cul
ion,
D
umar
an, L
inap
acan
, Mai
nlan
d, M
a, U
rsul
a, R
asa,
SP
, E
l Nid
o, V
AP
E-P
wn
Res
iden
tC
omm
on
Mon
ticol
a so
litar
ius
phili
ppen
sis
Blu
e R
ock-
Thr
ush
Agu
taya
, Bal
abac
, Cag
ayan
cillo
, Cul
ion,
Cuy
o,
Mai
nlan
d, E
l Nid
oN
EM
igra
ntC
omm
on
Zoo
ther
a da
uma
aure
aS
caly
Gro
und-
Thr
ush
Mai
nlan
dN
EM
igra
ntU
ncom
mon
Tur
dus
obsc
urus
(mon
otyp
ic)
Eye
brow
ed T
hrus
hB
usua
nga,
Mai
nlan
d, S
PN
EM
igra
ntU
ncom
mon
Fam
ily S
ylvi
idae
Ger
ygon
e su
lphu
rea
sim
plex
Gol
den-
belli
ed F
lyea
ter
Mai
nlan
dLE
Res
iden
tLo
c C
omm
onS
eice
rcus
mon
tisxa
ntho
pygi
usY
ello
w-b
reas
ted
War
bler
Mai
nlan
dLE
-Pw
nR
esid
ent
Unc
omm
on
Phy
llosc
opus
bor
ealis
kenn
icot
tiA
rctic
War
bler
Bal
abac
, Cag
ayan
cillo
, Cul
ion,
Cuy
o, M
ainl
and,
Ras
a,
El N
ido,
Tub
bata
haN
EM
igra
ntC
omm
on
Phy
llosc
opus
triv
irgat
uspe
ters
eni
Mou
ntai
n Le
af-W
arbl
erM
ainl
and,
SP
LE-P
wn
Res
iden
tC
omm
onA
croc
epha
lus
orie
ntal
is(m
onot
ypic
)O
rient
al R
eed-
War
bler
Mai
nlan
d, T
ubba
taha
NE
Mig
rant
Com
mon
Meg
alur
us p
alus
tris
forb
esi
Str
iate
d G
rass
bird
Mai
nlan
dLE
Res
iden
tC
omm
onLo
cust
ella
lanc
eola
ta(m
onot
ypic
)La
nceo
late
d W
arbl
erM
ainl
and,
Tub
bata
haN
EM
igra
ntU
ncom
mon
Locu
stel
la o
chot
ensi
s(m
onot
ypic
)M
idde
ndor
ff's
War
bler
Mai
nlan
dN
EM
igra
ntU
ncom
mon
Orth
otom
us c
ucul
latu
svi
ridic
ollis
Mou
ntai
n T
ailo
rbird
Mai
nlan
dLE
-Pw
nM
igra
ntF
airly
Com
mon
Ort
hoto
mus
ser
iceu
sse
riceu
sR
ufou
s-ta
iled
Tai
lorb
irdB
alab
ac, B
usua
nga,
Cul
ion,
Mai
nlan
d, E
l Nid
o, R
asa,
C
oron
, Mal
-Ty,
SP
NE
Res
iden
tC
omm
on
Cis
ticol
a ju
ncid
isni
gros
tria
taZ
ittin
g C
istic
ola
Cul
ion,
Mai
nlan
dLE
-Pw
nR
esid
ent
Com
mon
Cet
tia v
ulca
nia
pala
wan
aS
unda
Bus
h-W
arbl
erM
t. M
anta
linga
jan
LE-P
wn
Res
iden
tLo
c C
omm
onF
amily
Mus
cica
pida
eM
usci
capa
sib
irica
sibi
rica
Dar
k-si
ded
Fly
catc
her
Cul
ion,
Mai
nlan
dN
E-P
wn
Mig
rant
Rar
eM
usci
capa
dau
uric
ada
uuric
aA
sian
Bro
wn
Fly
catc
her
Mai
nlan
d, R
asa
NE
Mig
rant
Rar
e
Mus
cica
pa g
risei
stic
ta(m
onot
ypic
)G
rey-
stre
aked
Fly
catc
her
Bal
abac
, Bus
uang
a, C
agay
anci
llo, C
ulio
n, C
uyo,
M
ainl
and,
El N
ido,
Tub
bata
haN
EM
igra
ntC
omm
on
End
emic
ityR
esid
ency
Occ
urre
nce
Spe
cies
Sub
spec
ies
Typ
eC
omm
on N
ame
Typ
e Lo
calit
y

148 PALAWAN
APPE
ND
IX C
-4.
List
of A
vian
Spe
cies
in th
e Pa
law
an F
auna
l Reg
ion
(con
tinue
d).
Mus
cica
pa fe
rrug
inea
(mon
otyp
ic)
Fer
rugi
nous
Fly
catc
her
Mai
nlan
dN
EM
igra
ntR
are
Fic
edul
a na
rcis
sina
narc
issi
naN
arci
ssus
Fly
catc
her
Mai
nlan
dN
EM
igra
ntR
are
Fic
edul
a hy
pery
thra
rara
Sno
wy-
brow
ed F
lyca
tche
rM
anta
linga
jan
Ran
geLE
-Pw
nR
esid
ent
Com
mon
Fic
edul
a pl
aten
ae(m
onot
ypic
)P
alaw
an F
lyca
tche
rM
ainl
and,
SP
, El N
ido,
VA
, Ma
PE
-Pw
nR
esid
ent
Unc
omm
onF
iced
ula
wes
term
anni
pala
wan
ensi
sLi
ttle
Pie
d F
lyca
tche
rM
ts M
anta
linga
jan
and
Vic
toria
LE-P
wn
Res
iden
tF
airly
Com
mon
cyan
omel
ana
Bal
abac
, Mai
nlan
d, S
P, T
ubba
taha
NE
cum
atili
sM
ainl
and
NE
Cyo
rnis
lem
prie
ri(m
onot
ypic
)P
alaw
an B
lue
Fly
catc
her
Bal
abac
, Bus
uang
a, C
alau
it, C
ulio
n, M
ainl
and,
SP
, El
Nid
o, V
A, M
aP
E-P
wn
Res
iden
tU
ncom
mon
Cyo
rnis
ruf
igas
tra
phili
ppin
ensi
sM
angr
ove
Blu
e F
lyca
tche
rM
ainl
and,
SP
, El N
ido
LER
esid
ent
Com
mon
Cul
icic
apa
helia
nthe
apa
naye
nsis
Citr
ine
Can
ary-
Fly
catc
her
Mai
nlan
dLE
Res
iden
tC
omm
on
Rhi
pidu
ra ja
vani
cani
grito
rqui
sP
ied
Fan
tail
Cal
auit,
Cul
ion,
Cuy
o, M
ainl
and,
Urs
ula,
Ras
a, E
l Nid
oLE
Res
iden
tC
omm
on
Ter
psip
hone
atr
ocau
data
perio
phth
alm
ica
Japa
nese
Par
adis
e-F
lyca
tche
rM
ainl
and
NE
MB
Com
mon
Ter
psip
hone
cya
nesc
ens
(mon
otyp
ic)
Blu
e P
arad
ise-
Fly
catc
her
Ban
tac,
Bat
as, B
usua
nga,
Cor
on, C
ulio
n, L
inap
acan
, M
ainl
and,
SP
, El N
ido,
VA
, Ma,
Ras
aP
E-P
wn
Res
iden
tU
ncom
mon
Hyp
othy
mis
azu
rea
azur
eaB
lack
-nap
ed M
onar
chB
alab
ac, B
usua
nga,
Cal
auit,
Cor
on, C
ulio
n, M
ainl
and,
R
asa,
SP
, El N
ido
LER
esid
ent
Com
mon
Fam
ily P
achy
ceph
alid
aeP
achy
ceph
ala
gris
ola
plat
eni
Man
grov
e W
hist
ler
Mai
nlan
d, S
P, E
l Nid
oLE
-Pw
nR
esid
ent
Com
mon
Fam
ily M
otac
illid
ae
Mot
acill
a ci
nere
aro
bust
aG
rey
Wag
tail
Bal
abac
, Cal
auit,
Cul
ion,
Mai
nlan
d, U
rsul
a, R
asa,
SP
, E
l Nid
o, T
ubba
taha
NE
Mig
rant
Com
mon
sim
illim
aB
alab
ac, C
alam
iane
s, C
alau
it, M
ainl
and
taiv
ana
Mai
nlan
dM
otac
illa
alba
ocul
aris
Whi
te W
agta
ilB
alab
ac, M
ainl
and
NE
Mig
rant
Rar
e
Ant
hus
nova
esee
land
iae
lugu
bris
Ric
hard
's P
ipit
Bal
abac
, Bus
uang
a, C
ulio
n, M
ainl
and,
Ras
a,
Tub
bata
haN
ER
esid
ent
Com
mon
Ant
hus
cerv
inus
(mon
otyp
ic)
Red
-thr
oate
d P
ipit
Mai
nlan
dN
EM
igra
ntR
are
Ant
hus
hodg
soni
hodg
soni
Oliv
e T
ree-
Pip
itM
ainl
and,
El N
ido
NE
Mig
rant
Unc
omm
onA
nthu
s gu
stav
igu
stav
iP
echo
ra P
ipit
Cag
ayan
cillo
, Mai
nlan
d, T
ubba
taha
NE
Mig
rant
Unc
omm
onF
amily
Arta
mid
ae
Art
amus
leuc
oryn
chus
leuc
oryn
chus
Whi
te-b
reas
ted
Woo
d-S
wal
low
Bus
uang
a, C
alau
it, C
ulio
n, C
uyo,
Dal
ahic
an,
Lum
buca
n, M
angs
i, M
ainl
and,
Urs
ula,
El N
ido
NE
Res
iden
tC
omm
on
Fam
ily L
aniid
aeLa
nius
sch
ach
nasu
tus
Long
-tai
led
Shr
ike
Cul
ion,
Urs
ula
LER
esid
ent
Com
mon
Spe
cies
Sub
spec
ies
Typ
eC
omm
on N
ame
Typ
e Lo
calit
yE
ndem
icity
Res
iden
cyO
ccur
renc
e
Cya
nopt
ila c
yano
mel
ana
Blu
e-an
d-W
hite
Fly
catc
her
Mig
rant
Rar
e
Com
mon
Mot
acill
a fla
vaY
ello
w W
agta
ilN
EM
igra
nt

STATE OF THE ENVIRONMENT 149
APPE
ND
IX C
-4.
List
of A
vian
Spe
cies
in th
e Pa
law
an F
auna
l Reg
ion
(con
tinue
d).
Lani
us c
rista
tus
luci
onen
sis
Bro
wn
Shr
ike
Agu
taya
, Bal
abac
, Cag
ayan
cillo
, Cul
ion,
Cuy
o,
Lum
buca
n, M
ainl
and,
Urs
ula,
Ras
a, S
P, E
l Nid
o,
Tub
bata
haN
EM
igra
ntC
omm
on
Fam
ily S
turn
idae
Apl
onis
pan
ayen
sis
pana
yens
isA
sian
Glo
ssy
Sta
rling
Agu
taya
, Bal
abac
, Bus
uang
a, C
agay
anci
llo, C
alau
it,
Cul
ion,
Cuy
o, M
anuc
Man
ukan
, Mai
nlan
d, U
rsul
a,
Ras
a, C
oron
, SP
, El N
ido
NE
Res
iden
tC
omm
on
Stu
rnus
phi
lippe
nsis
(mon
otyp
ic)
Che
stnu
t-ch
eeke
d S
tarli
ngLi
napa
can,
Mai
nlan
d, T
ubba
taha
NE
Mig
rant
Unc
omm
on
Gra
cula
rel
igio
sapa
law
anen
sis
Hill
Myn
aB
alab
ac, B
usua
nga,
Cul
ion,
Mai
nlan
d, M
al-T
y, S
P, E
l N
ido
LE-P
wn
Res
iden
tU
ncom
mon
Fam
ily N
ecta
riniid
aeA
nthr
epte
s m
alac
ensi
spa
ragu
aeP
lain
-thr
oate
d S
unbi
rdB
alab
ac, C
alau
it, C
ulio
n, M
ainl
and,
Ras
a, E
l Nid
oLE
-Pw
nR
esid
ent
Com
mon
Nec
tarin
ia c
alco
stet
ha(m
onot
ypic
)C
oppe
r-th
roat
ed S
unbi
rdB
alab
ac, M
ainl
and,
Urs
ula,
Ras
a, E
l Nid
oN
E-P
wn
Res
iden
tC
omm
on
Nec
tarin
ia ju
gula
risau
rora
Oliv
e-ba
cked
Sun
bird
Agu
taya
, Bal
abac
, Bus
uang
a, C
agay
anci
llo, C
alau
it,
Cul
ion,
Cuy
o, D
umar
an, L
umbu
can,
Mai
nlan
d, U
rsul
a,
Ras
a, S
P, E
l Nid
oLE
-Pw
nR
esid
ent
Com
mon
Nec
tarin
ia s
pera
tatr
ochi
lus
Pur
ple-
thro
ated
Sun
bird
Bal
abac
, Bus
uang
a, C
ulio
n, D
alah
ican
, Mai
nlan
d,
Urs
ula,
Mal
-Ty,
SP
, El N
ido,
Cor
on, R
asa
NE
Res
iden
tC
omm
on
Aet
hopy
ga s
helle
yish
elle
yiLo
vely
Sun
bird
Bal
abac
, Bus
uang
a, C
ulio
n, M
ainl
and,
SP
, El N
ido
PE
-Pw
nR
esid
ent
Loc
Com
mon
Ara
chno
ther
a lo
ngiro
stra
dilu
tior
Littl
e S
pide
rhun
ter
Mai
nlan
d, S
P, E
l Nid
o, R
asa
LE-P
wn
Res
iden
tU
ncom
mon
Fam
ily D
icae
idae
plat
eni
Bal
abac
, Mai
nlan
d, M
a, V
A, E
l Nid
o, R
asa,
Mal
-Ty,
SP
culio
nens
isB
usua
nga,
Cal
auit,
Cul
ion
Dic
aeum
aer
ugin
osum
affin
eS
trip
ed F
low
erpe
cker
Mai
nlan
d, S
P, E
l Nid
oP
E-P
wn
Res
iden
tU
ncom
mon
Dic
aeum
pyg
mae
umpa
law
anor
umP
ygm
y F
low
erpe
cker
Bal
abac
, Cal
auit,
Cul
ion,
Mai
nlan
d, U
rsul
a, C
oron
, Mal
-T
y, S
P, E
l Nid
oP
E-P
wn
Res
iden
tC
omm
on
Fam
ily Z
oste
ropi
dae
Zos
tero
ps n
igro
rum
richm
ondi
Yel
low
ish
Whi
te-E
yeC
agay
anci
lloP
E-P
wn
Res
iden
tC
omm
onZ
oste
rops
mon
tanu
spa
rkes
iM
ount
ain
Whi
te-E
yeM
ainl
and
LE-P
wn
Res
iden
tC
omm
onF
amily
Plo
ceid
aeP
asse
r m
onta
nus
nasu
tus
Eur
asia
n T
ree
Spa
rrow
Cal
auit,
Mai
nlan
d, E
l Nid
o, T
ubba
taha
NE
Res
iden
tC
omm
onF
amily
Est
rildi
dae
Lonc
hura
leuc
ogas
trapa
law
ana
Whi
te-b
ellie
d M
unia
Bal
abac
, Bus
uang
a, C
alau
it, C
ulio
n, M
ainl
and,
SP
NE
Res
iden
tC
omm
on
Lonc
hura
pun
ctul
ata
caba
nisi
Sca
ly-b
reas
ted
Mun
iaC
alau
it, M
ainl
and,
El N
ido
LER
esid
ent
Com
mon
Lonc
hura
mal
acca
jago
riC
hest
nut M
unia
Bal
abac
, Cal
amia
nes,
Cal
auit,
Mai
nlan
d, M
al-T
y, E
l N
ido
NE
Res
iden
tC
omm
on
NO
TE: N
OM
EN
CLA
TUR
E F
OLL
OW
S T
HA
T O
F K
EN
NE
DY
, ET
AL.
, 200
0
End
emic
ityR
esid
ency
Occ
urre
nce
Spe
cies
Sub
spec
ies
Typ
eC
omm
on N
ame
Typ
e Lo
calit
y
Prio
noch
ilus
plat
eni
Pal
awan
Flo
wer
peck
erP
E-P
wn
Res
iden
tC
omm
on

150 PALAWAN
APPENDIX D-1a. Mean Annual Rainfall (mm) by Station by Year, Palawan.
YEAR Puerto Aborlan Brooke's Coron Cuyo Rio Tag- Cabayugan Poblacion Poblacion Magara Abongan Mainit Mean Princesa a/ Point a/ a/ Tuba bita Puerto El Nido Quezon Roxas Taytay Brookes
a/ a/ b/ Princesa Pointd/ d/ d/ d/ d/ d/
1949 2229.7 2229.7
1950 1330.0 1330.0
1951 1560.4 1560.4
1952 1788.1 1788.1
1953 1083.4 1083.4
1954 1587.3 1587.3
1955 1436.1 1436.1
1956 2117.5 2255.2 2186.4
1957 1263.7 1552.9 1408.3
1958 1680.4 1886.8 1783.6
1959 1785.7 1714.9 1750.3
1960 1599.4 1633.9 1616.7
1961 1125.7 1223.4 123.8 1383.7 964.2
1962 1673.1 2446.1 194.6 2603.7 1729.4
1963 1453.4 1556.9 1239.2 2370.1 1654.9
1964 1689.4 1612.6 1626.1 2290.5 1804.7
1965 1769.4 1881.7 3011.7 2350.6 2253.4
1966 1710.9 2425.8 2847.4 2092.1 2269.1
1967 1379.1 1595.3 2556.0 2967.5 2124.5
1968 1262.0 1279.7 2121.8 1705.1 1592.2
1969 1452.5 1164.7 2802.3 2365.6 1946.3
1970 1829.3 1542.3 2444.5 2112.8 1982.2
1971 1991.5 988.5 2494.7 2885.6 2090.1
1972 1034.1 1479.1 2193.8 1969.8 1669.2
1973 1890.0 1614.6 2083.6 2901.2 3699.9 2437.9
1974 1440.9 1434.4 2077.3 2207.8 4326.3 2297.3
1975 2147.1 1890.8 1844.3 1699.8 3950.5 2306.5
1976 1996.0 1566.8 2319.3 2227.3 2806.4 2183.2
1977 1653.0 1823.4 1211.8 2380.6 3427.9 2099.3
1978 1743.9 4951.4 1018.9 1878.2 2611.0 2440.7
1979 1492.8 1760.2 1135.8 3759.8 2281.4 2895.0 2220.8
1980 1714.5 1859.4 1617.0 1850.4 1878.2 4340.0 2209.9
1981 1569.0 1535.4 1700.3 1954.9 1598.3 2642.0 1833.3
1982 1357.2 1725.0 1249.2 3143.4 2097.3 3029.0 2100.2
1983 1582.0 1660.0 1560.0 2559.0 2277.0 1710.0 3320.0 2095.4
1984 1402.6 12234.5 1949.6 2985.2 2949.1 2393.3 3144.0 3865.5
1985 1362.3 2344.9 1877.9 1719.5 2681.6 2508.5 2082.5
1986 1353.9 1597.1 1395.8 1785.9 2027.7 2329.5 1748.3
1987 1064.8 1814.3 1256.9 3038.8 74.6 1777.5 1504.5
1988 1666.3 1632.2 902.6 2497.0 3390.4 2458.6 2091.2
1989 1513.8 1601.2 903.7 2918.7 1862.2 2069.9 1811.6
1990 1144.3 1437.3 507.8 2498.9 2767.2 1772.3 1688.0
1991 986.1 1288.8 524.7 2030.7 1218.6 1092.8 1190.3
1992 1380.9 1363.6 799.7 1977.7 1754.2 1126.4 1400.4
1993 1442.9 1848.7 789.5 2227.9 1671.4 1596.1
1994 1158.1 1633.0 1157.8 2280.9 1335.8 1513.1
1995 1748.6 1680.4 883.9 2329.0 1810.7 1690.5
1996 1281.6 1924.8 751.4 1677.4 1408.8
1997 1123.0 1093.7 807.1 1903.4 1747.7 2610.5 1038.7 1474.9
1998 1719.5 1961.9 1944.8 2400.0 1200.0 4382.3 2282.4 2210.0 2833.0 1944.8 2287.9
1999 2227.0 2570.2 3362.5 2626.9 2423.7 4205.5 3244.0 3845.6 3006.7 3362.5 3087.5
2000 1762.7 3430.3 2730.0 2370.3 4701.9 2229.7 3586.5 2078.6 3430.3 2924.5
2001 1535.0 3263.7 2971.3 2663.0 3760.7 5314.0 4144.9 2937.5 2867.5 6263.7 3572.1
2002 1086.2 2634.2 1917.3 3194.4 5219.0 1899.8 3149.5 2604.5 2608.5 2701.5
2003 907.7 1976.0 3676.6 3270.0 4963.5 2761.7 3049.2 2845.3 2931.3
Mean 1532.5 2319.2 1538.0 2276.8 2173.9 1906.3 3349.3 3790.3 4601.0 2829.0 3081.8 2739.9 3409.2 2734.4
Source: PAGASA and PCSDS

STATE OF THE ENVIRONMENT 151
APPE
ND
IX D
-1b.
M
ean
Mon
thly
Rai
nfal
l (m
m) f
rom
Diff
eren
t Wea
ther
Sta
tions
, Pal
awan
.
DU
RAT
ION
1949
to19
77-9
919
56-8
919
61-9
219
62-9
519
85-2
003
1973
-84
1997
-200
320
01-2
003
1997
-200
319
98-2
003
1998
-200
319
98-2
003
2003
1997
-200
2
PPC
Abor
lanBr
ooke
's Co
ron
Cuyo
Rio
Tuba
Tagb
itaCa
bayu
gan
Pobl
acio
n Po
blac
ion
Maga
raAb
onga
nMa
init
Poin
tPP
CEl
Nid
oQu
ezon
Roxa
sTa
ytay
Broo
kes P
t.
Janu
ary
29.4
122.
984
.615
.29.
168
.813
7.0
53.0
48.0
99.6
67.3
31.6
157.4
Febr
uary
22.8
71.8
36.6
23.4
0.6
46.8
161.
381
.438
.063
.449
.814
.880
.8
Mar
ch36
.912
4.7
36.0
10.4
5.9
53.4
70.5
135.3
37.0
121.1
172.0
67.5
138.1
April
42.3
139.
244
.721
.236
.274
.911
6.4
126.1
36.0
102.1
129.0
118.0
116.0
May
133.
510
7.1
116.
917
5.0
166.
613
0.3
222.
536
4.666
6.018
0.323
3.229
7.818
1.6
June
167.
326
2.0
141.
935
9.9
347.
220
9.8
358.
839
3.062
4.028
2.524
8.221
6.126
1.5
July
164.
132
2.9
161.
745
5.7
379.
621
2.2
426.
054
3.581
5.023
5.930
9.029
4.021
8.6
Augu
st18
0.0
265.
015
8.6
453.
940
6.0
240.
832
9.2
731.3
902.0
409.8
499.3
417.8
299.6
Sept
embe
r19
3.0
458.
916
3.4
342.
333
8.5
222.
537
0.9
499.1
499.0
338.9
401.9
297.8
209.8
Oct
ober
13.6
403.
917
1.1
251.
224
9.4
274.
547
3.5
501.0
602.7
432.0
405.1
360.2
337.5
Nov
embe
r20
3.7
474.
824
1.6
116.
712
9.4
176.
831
5.4
303.6
251.7
360.6
436.8
327.9
392.4
Dec
embe
r14
7.8
330.
020
0.9
65.8
35.9
111.
034
1.5
255.0
80.0
303.5
320.6
296.2
516.1
No.
of d
ry
mon
ths
51
45
54
12
52
23
1
No.
of I
nter
-
med
iate
mo.
74
82
37
42
04
42
6
No.
of w
et
mon
ths
07
05
41
78
76
67
5
Sou
rce:
PA
GA
SA
& P
CS
DS

152 PALAWAN
APPE
ND
IX D
-2.
Dat
a on
Wat
er Q
ualit
y Pa
ram
eter
s fr
om R
iver
Sta
tions
, Pal
awan
.
Dat
a fo
r Fig
ure
16 -
pH
Val
ues
of W
ater
Sam
ples
from
Riv
er S
tatio
ns in
Sou
ther
n P
alaw
an
1996
1998
Sam
plin
g S
tatio
nS
ept.
Oct
.A
pr.
July
Dec
.M
ayA
ug.
May
Aug
Mar
Jun
Feb
Jun
Sep
Low
est
Ave
rage
Hig
hest
Sou
ther
n P
alaw
an:
09/9
610
/98
04/9
907
/99
12/9
905
/00
08/0
005
/01
08/0
103
/02
06/0
202
/03
06/0
309
/03
Iraa
n8.
307.
126.
867.
136.
406.
256.
907.
107.
327.
907.
307.
087.
627.
076.
257.
178.
30C
alat
egas
7.07
7.83
7.27
7.50
7.28
7.52
7.60
6.96
8.00
8.10
8.15
7.46
8.33
8.10
6.96
7.66
8.33
Ara
may
wan
8.10
8.03
7.97
7.70
7.83
7.89
7.60
8.24
8.38
7.56
8.71
6.95
6.95
7.91
8.75
Labo
g6.
857.
967.
737.
507.
307.
707.
807.
347.
777.
137.
666.
986.
857.
487.
96T
igap
lan
7.27
7.61
7.50
7.35
7.10
7.38
7.38
7.99
8.30
7.22
8.49
7.70
7.10
7.61
8.49
Abo
rlan
7.60
7.89
7.76
8.15
7.47
8.29
8.10
7.47
7.89
8.29
Bat
ang-
Bat
ang
8.20
8.65
8.20
8.38
7.58
8.44
7.59
7.58
8.15
8.65
Pan
itian
8.20
8.16
7.82
7.40
8.15
6.93
6.93
7.78
8.20
Pul
ot8.
188.
147.
398.
277.
247.
247.
848.
27T
amla
ng7.
548.
037.
547.
788.
03
Dat
a fo
r Fig
ure
17 -
pH
Val
ues
of W
ater
Sam
ples
from
Riv
er S
tatio
n in
Nor
ther
n P
alaw
an
1998
Nov
.A
pr.
July
Jan.
Mar
.Ju
lyJa
nM
ayM
arJu
nS
epD
ecF
ebJu
nA
ugLo
wes
tA
vera
geH
ighe
stN
orth
ern
Pal
awan
:11
/98
04/9
907
/99
01/0
003
/00
07/0
001
/01
05/0
103
/02
06/0
209
/02
12/0
202
/03
06/0
308
/03
Gui
nera
tan
7.60
7.60
7.10
6.60
6.50
7.40
7.00
7.50
7.71
7.35
7.36
7.33
7.01
7.73
6.71
6.50
7.23
7.73
Inan
deng
7.61
6.60
7.20
6.90
5.90
7.18
7.15
7.05
7.79
7.22
6.96
6.99
6.76
7.20
7.40
5.90
7.06
7.79
Abo
ngan
7.80
6.70
6.96
6.96
6.60
7.00
7.45
7.35
7.38
7.26
7.26
7.18
6.81
7.24
7.17
6.60
7.14
7.80
Bac
unga
n8.
348.
228.
148.
307.
238.
337.
247.
237.
948.
34
2002
1999
1999
2000
2001
2001
2003
2003
2002
2000

STATE OF THE ENVIRONMENT 153
APPE
ND
IX D
-2.
Dat
a on
Wat
er Q
ualit
y Pa
ram
eter
s fr
om R
iver
Sta
tions
, Pal
awan
(con
tinue
d).
Dat
a fo
r Fig
ure
18 -
Con
cent
ratio
n of
Sus
pend
ed S
olid
s of
Wat
er S
ampl
es f
rom
Riv
er S
tatio
ns i
n S
outh
ern
Pal
awan
1996
1998
Sou
ther
n P
alaw
an:
Sep
t.M
ar.
Oct
.A
pr.
July
Dec
.F
eb.
May
May
Aug
Mar
Jun
Feb
Jun
Sep
Dec
Low
est
Ave
rage
Hig
hest
09/9
603
/98
10/9
804
/99
07/9
912
/99
05/0
008
/00
05/0
108
/01
03/0
206
/02
02/0
306
/03
09/0
312
/03
Iraa
n5
1010
728
910
9020
74
72
476
218
.71
90
Cal
ateg
as8
555
1245
1213
1931
4817
2313
3622
420
536
.25
224
Ara
may
wan
815
3818
3419
721
914
111
150
131
25.4
315
0
Labo
g21
4018
1224
136
5316
1735
236
226
39.4
223
6
Tig
apla
n4
222
66
715
56
64
58
122
7.68
22
Abo
rlan
2035
916
1282
378
827
.38
82
Bat
ang-
Bat
ang
214
30
34
55
04.
5014
Pan
itian
1474
1648
3070
1914
38.7
174
Pul
ot11
1717
1447
1010
19.3
347
Tam
lang
524
22
10.3
324
Dat
a fo
r Fig
ure
19-
Con
cent
ratio
n of
Sus
pend
ed S
olid
s of
Wat
er S
ampl
es f
rom
Riv
er S
tatio
ns in
Nor
ther
n P
alaw
an
1998
1999
Nor
ther
n P
alaw
an:
Nov
.A
pr.
July
Jan.
Mar
.Ju
lyJa
nM
ayM
arJu
nS
epD
ecF
ebJu
nA
ugN
ovLo
wes
tA
vera
geH
ighe
st
11/9
804
/99
07/9
901
/00
03/0
007
/00
01/0
105
/01
03/0
206
/02
09/0
212
/02
02/0
306
/03
08/0
311
/03
Gui
nera
tan
1284
102
2215
454
1762
6438
014
422
512
873
780
236
422
4.28
1284
Inan
deng
338
194
1311
1318
1216
714
397
617
58
337
.47
167
Abo
ngan
263
2285
3734
2214
3712
255
1015
4013
524
548
.69
263
Bac
unga
n3
279
220
921
112
12.6
327
2000
2001
2002
2003
2001
2002
2003
1999
2000
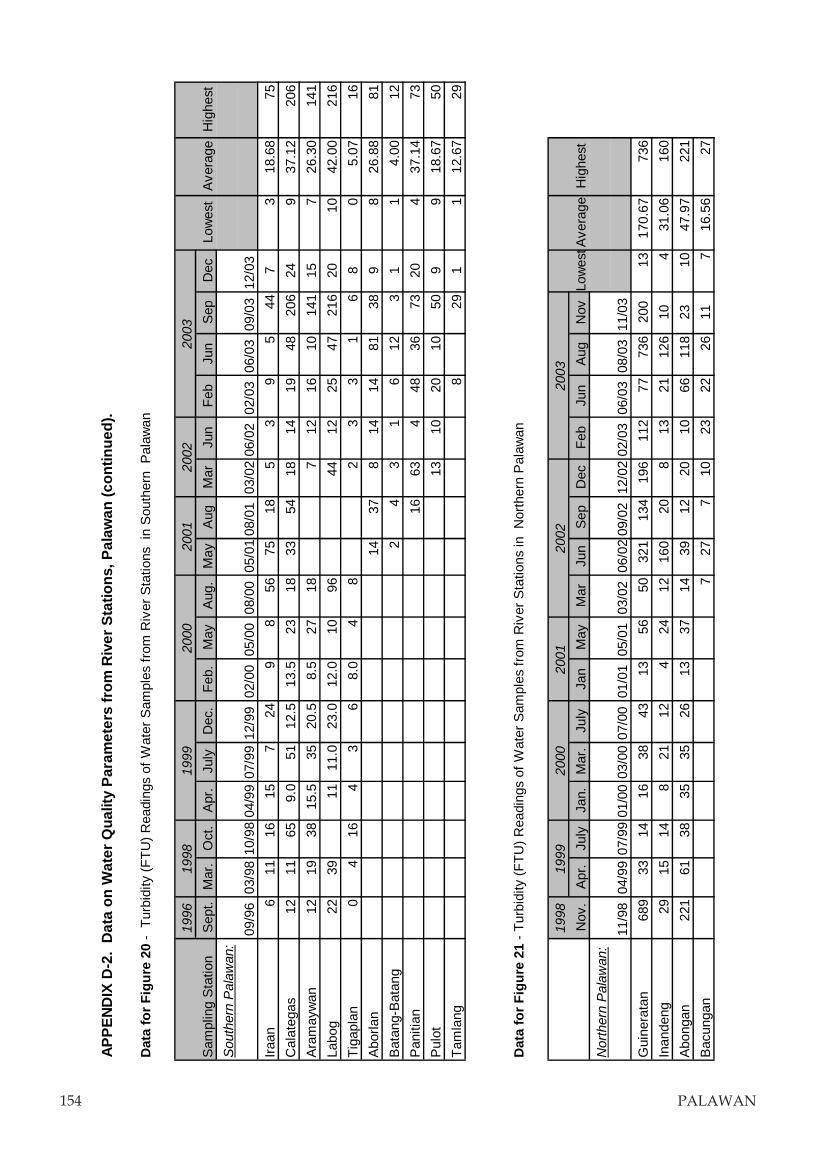
154 PALAWAN
APPE
ND
IX D
-2.
Dat
a on
Wat
er Q
ualit
y Pa
ram
eter
s fr
om R
iver
Sta
tions
, Pal
awan
(con
tinue
d).
Dat
a fo
r Fig
ure
20 -
Tur
bidi
ty (
FT
U)
Rea
ding
s of
Wat
er S
ampl
es fr
om R
iver
Sta
tions
in
Sou
ther
n P
alaw
an
1996
1998
1999
2000
Sam
plin
g S
tatio
nS
ept.
Mar
.O
ct.
Apr
.Ju
lyD
ec.
Feb
.M
ayA
ug.
May
Aug
Mar
Jun
Feb
Jun
Sep
Dec
Low
est
Ave
rage
Hig
hest
Sou
ther
n P
alaw
an:
09/9
603
/98
10/9
804
/99
07/9
912
/99
02/0
005
/00
08/0
005
/01
08/0
103
/02
06/0
202
/03
06/0
309
/03
12/0
3
Iraa
n6
1116
157
249
856
7518
53
95
447
318
.68
75
Cal
ateg
as12
1165
9.0
5112
.513
.523
1833
5418
1419
4820
624
937
.12
206
Ara
may
wan
1219
3815
.535
20.5
8.5
2718
712
1610
141
157
26.3
014
1
Labo
g22
3911
11.0
23.0
12.0
1096
4412
2547
216
2010
42.0
021
6
Tig
apla
n0
416
43
68.
04
82
33
16
80
5.07
16
Abo
rlan
1437
814
1481
389
826
.88
81
Bat
ang-
Bat
ang
24
31
612
31
14.
0012
Pan
itian
1663
448
3673
204
37.1
473
Pul
ot13
1020
1050
99
18.6
750
Tam
lang
829
11
12.6
729
Dat
a fo
r Fig
ure
21 -
Tur
bidi
ty (
FT
U)
Rea
ding
s of
Wat
er S
ampl
es fr
om R
iver
Sta
tions
in N
orth
ern
Pal
awan
1998
1999
2000
Nov
.A
pr.
July
Jan.
Mar
.Ju
lyJa
nM
ayM
arJu
nS
epD
ecF
ebJu
nA
ugN
ovLo
wes
tAve
rage
Hig
hest
Nor
ther
n P
alaw
an:
11/9
804
/99
07/9
901
/00
03/0
007
/00
01/0
105
/01
03/0
206
/02
09/0
212
/02
02/0
306
/03
08/0
311
/03
Gui
nera
tan
689
3314
1638
4313
5650
321
134
196
112
7773
620
013
170.
6773
6
Inan
deng
2915
148
2112
424
1216
020
813
2112
610
431
.06
160
Abo
ngan
221
6138
3535
2613
3714
3912
2010
6611
823
1047
.97
221
Bac
unga
n7
277
1023
2226
117
16.5
627
2001
2002
2003
2001
2002
2003
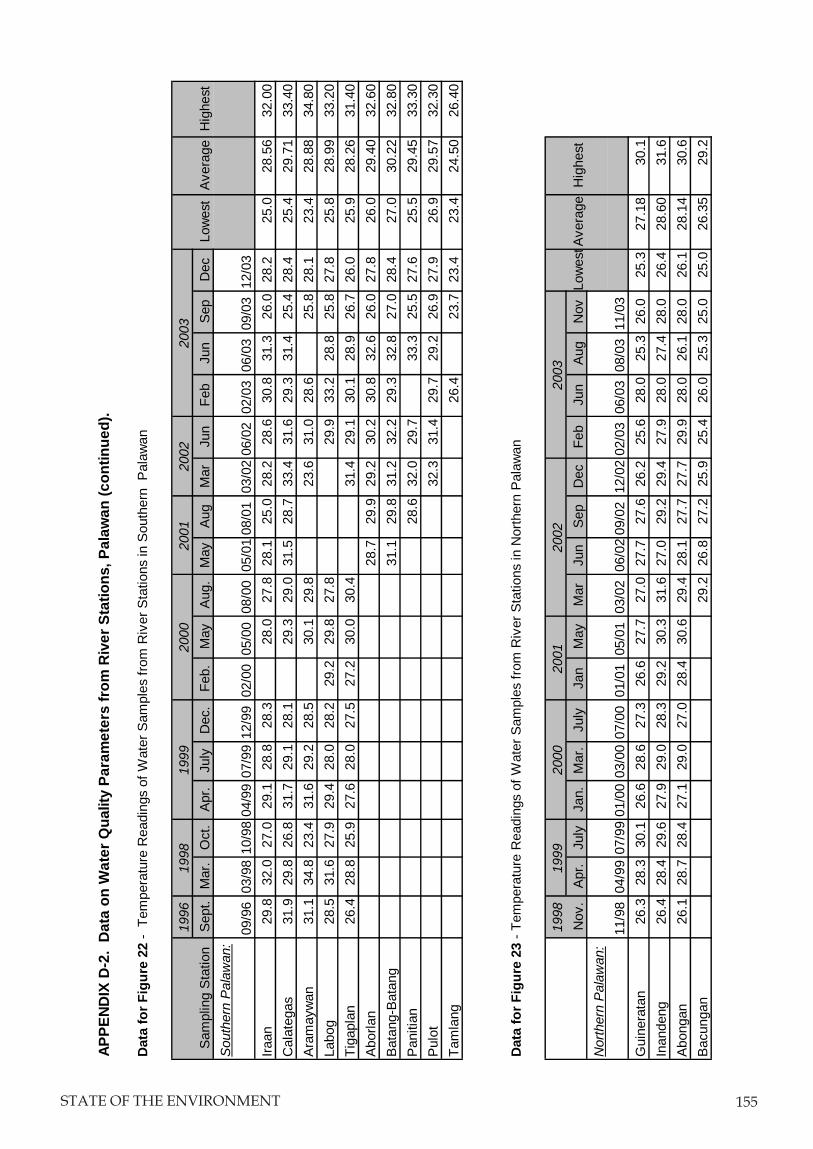
STATE OF THE ENVIRONMENT 155
APPE
ND
IX D
-2.
Dat
a on
Wat
er Q
ualit
y Pa
ram
eter
s fr
om R
iver
Sta
tions
, Pal
awan
(con
tinue
d).
Dat
a fo
r Fig
ure
22 -
Tem
pera
ture
Rea
ding
s of
Wat
er S
ampl
es fr
om R
iver
Sta
tions
in S
outh
ern
Pal
awan
1996
1998
1999
2000
Sam
plin
g S
tatio
nS
ept.
Mar
.O
ct.
Apr
.Ju
lyD
ec.
Feb
.M
ayA
ug.
May
Aug
Mar
Jun
Feb
Jun
Sep
Dec
Low
est
Ave
rage
Hig
hest
Sou
ther
n P
alaw
an:
09/9
603
/98
10/9
804
/99
07/9
912
/99
02/0
005
/00
08/0
005
/01
08/0
103
/02
06/0
202
/03
06/0
309
/03
12/0
3
Iraa
n29
.832
.027
.029
.128
.828
.328
.027
.828
.125
.028
.228
.630
.831
.326
.028
.225
.028
.56
32.0
0
Cal
ateg
as31
.929
.826
.831
.729
.128
.129
.329
.031
.528
.733
.431
.629
.331
.425
.428
.425
.429
.71
33.4
0
Ara
may
wan
31.1
34.8
23.4
31.6
29.2
28.5
30.1
29.8
23.6
31.0
28.6
25.8
28.1
23.4
28.8
834
.80
Labo
g28
.531
.627
.929
.428
.028
.229
.229
.827
.829
.933
.228
.825
.827
.825
.828
.99
33.2
0
Tig
apla
n26
.428
.825
.927
.628
.027
.527
.230
.030
.431
.429
.130
.128
.926
.726
.025
.928
.26
31.4
0
Abo
rlan
28.7
29.9
29.2
30.2
30.8
32.6
26.0
27.8
26.0
29.4
032
.60
Bat
ang-
Bat
ang
31.1
29.8
31.2
32.2
29.3
32.8
27.0
28.4
27.0
30.2
232
.80
Pan
itian
28.6
32.0
29.7
33.3
25.5
27.6
25.5
29.4
533
.30
Pul
ot32
.331
.429
.729
.226
.927
.926
.929
.57
32.3
0
Tam
lang
26.4
23.7
23.4
23.4
24.5
026
.40
Dat
a fo
r Fig
ure
23 -
Tem
pera
ture
Rea
ding
s of
Wat
er S
ampl
es fr
om R
iver
Sta
tions
in N
orth
ern
Pal
awan
1998
1999
2000
Nov
.A
pr.
July
Jan.
Mar
.Ju
lyJa
nM
ayM
arJu
nS
epD
ecF
ebJu
nA
ugN
ovLo
wes
tAve
rage
Hig
hest
Nor
ther
n P
alaw
an:
11/9
804
/99
07/9
901
/00
03/0
007
/00
01/0
105
/01
03/0
206
/02
09/0
212
/02
02/0
306
/03
08/0
311
/03
Gui
nera
tan
26.3
28.3
30.1
26.6
28.6
27.3
26.6
27.7
27.0
27.7
27.6
26.2
25.6
28.0
25.3
26.0
25.3
27.1
830
.1
Inan
deng
26.4
28.4
29.6
27.9
29.0
28.3
29.2
30.3
31.6
27.0
29.2
29.4
27.9
28.0
27.4
28.0
26.4
28.6
031
.6
Abo
ngan
26.1
28.7
28.4
27.1
29.0
27.0
28.4
30.6
29.4
28.1
27.7
27.7
29.9
28.0
26.1
28.0
26.1
28.1
430
.6
Bac
unga
n29
.226
.827
.225
.925
.426
.025
.325
.025
.026
.35
29.2
2003
2001
2002
2003
2001
2002

156 PALAWAN
APPE
ND
IX D
-2.
Dat
a on
Wat
er Q
ualit
y Pa
ram
eter
s fr
om R
iver
Sta
tions
, Pal
awan
(con
tinue
d).
Dat
a fo
r Fig
ure
24 -
Con
cent
ratio
n of
Dis
solv
ed O
xyge
n of
Wat
er S
ampl
es fr
om R
iver
Sta
tions
in S
outh
ern
Pal
awan
1996
1998
1999
2000
Sam
plin
g S
tatio
nS
ept.
Mar
.O
ct.
Apr
.Ju
lyF
eb.
May
Aug
.M
ayA
ugF
ebJu
nS
epD
ecLo
wes
t A
vera
geH
ighe
st
Sou
ther
n Pa
law
an09
/96
03/9
810
/98
04/9
907
/99
02/0
005
/00
08/0
005
/01
08/0
102
/03
06/0
309
/03
12/0
3
Iraa
n10
.50
7.89
7.93
4.68
4.88
5.25
6.30
5.0
5.4
5.4
5.1
7.1
7.4
4.68
6.37
10.5
0
Cal
ateg
as7.
448.
824.
854.
905.
075.
605.
25.
47.
04.
47.
17.
64.
406.
118.
82
Ara
may
wan
5.06
7.04
9.96
5.23
5.21
6.03
4.40
7.4
6.5
8.1
7.7
4.40
6.60
9.96
Labo
g7.
317.
924.
805.
206.
805.
906.
387.
74.
66.
37.
64.
606.
407.
92
Tig
apla
n8.
017.
378.
455.
205.
026.
715.
796.
905.
16.
77.
48.
65.
026.
778.
60
Abo
rlan
5.3
5.6
5.6
5.4
7.1
7.3
5.30
6.05
7.30
Bat
ang-
Bat
ang
6.4
5.5
5.4
6.6
7.0
8.1
5.40
6.48
8.10
Pan
itian
5.1
6.6
5.4
7.3
7.9
5.10
6.48
7.90
Pul
ot5.
16.
26.
28.
35.
106.
438.
30
Tam
lang
7.7
8.1
9.3
7.70
8.38
9.30
Dat
a fo
r Fig
ure
25 -
Con
cent
ratio
n of
Dis
solv
ed O
xyge
n of
Wat
er S
ampl
es fr
om R
iver
Sta
tions
in
Nor
ther
n P
alaw
an
1998
1999
2000
2003
Nov
.A
pr.
July
Jan.
Mar
.Ju
lyJa
nM
ayA
ugLo
wes
t A
vera
geH
ighe
st
Nor
ther
n P
alaw
an11
/98
04/9
907
/99
01/0
003
/00
07/0
001
/01
05/0
108
/03
Gui
nera
tan
7.34
4.94
2.80
6.15
4.9
6.2
7.7
2.80
5.72
7.70
Inan
deng
7.81
4.59
3.07
5.74
5.6
5.4
6.2
3.07
5.49
7.81
Abo
ngan
7.31
4.15
5.40
5.20
4.7
5.4
7.3
4.15
5.64
7.31
Bac
unga
n8.
68.
608.
608.
60
2001
2003
2001
Sam
plin
g S
tatio
n

STATE OF THE ENVIRONMENT 157
APPE
ND
IX D
-2.
Dat
a on
Wat
er Q
ualit
y Pa
ram
eter
s fr
om R
iver
Sta
tions
, Pal
awan
(con
tinue
d).
Dat
a fo
r Fig
ure
26 -
Con
duct
ivity
of W
ater
Sam
ples
from
Riv
er S
tatio
ns in
Sou
ther
n P
alaw
an
1996
1998
1999
2000
Sam
plin
g S
tatio
nS
ept.
Mar
.O
ct.
Apr
.Ju
lyD
ec.
Feb
.M
ayA
ugM
arJu
nF
ebJu
nS
epD
ecLo
wes
t A
vera
geH
ighe
st
Sou
ther
n P
alaw
an09
/96
03/9
810
/98
04/9
907
/99
12/9
902
/00
05/0
108
/01
03/0
206
/02
02/0
306
/03
09/0
312
/03
Labo
g44
047
960
227
358
359
327
377
1950
090
341
516
238
346
4155
07.0
6947
960.
00
Iraa
n98
417
9210
096
8898
9592
113
9211
089
9488
119.
604
417.
00
Cal
ateg
as35
022
629
135
835
036
334
131
440
640
441
938
028
037
222
634
6.70
141
9.00
Ara
may
wan
330
418
226
288
280
157
331
301
346
290
254
285
157
292.
088
418.
00
Tig
apla
n14
827
012
717
415
917
617
319
311
718
741
016
816
011
718
9.38
841
0.00
Abo
rlan
144
151
229
182
226
200
138
157
138
178.
375
229.
00
Bat
ang-
Bat
ang
231
250
298
307
273
310
265
263
231
274.
625
310.
00
Pan
itian
285
296
268
293
390
228
293
228
342.
167
390.
00P
ulot
327
255
314
290
231
273
231
281.
667
327.
00T
amla
ng15
412
616
512
614
8.33
316
5.00
Dat
a fo
r Fig
ure
27 -
Con
duct
ivity
of W
ater
Sam
ples
from
Riv
er S
tatio
ns in
Nor
ther
n P
alaw
an
1998
1999
2000
Nov
.A
pr.
July
Jan.
Mar
.Ju
lyJa
nM
ayM
arJu
nS
epD
ecJa
nJu
nA
ugN
ovLo
wes
t A
vera
geH
ighe
stN
orth
ern
Pal
awan
11/9
804
/99
07/9
901
/00
03/0
007
/00
01/0
105
/01
08/0
306
/02
09/0
212
/02
01/0
306
/03
08/0
311
/03
Gui
nera
tan
3782
6465
4275
7475
6666
7472
7390
6580
3768
.644
90In
ande
ng49
5648
4943
5048
4652
4653
5150
7046
4843
50.3
2570
Abo
ngan
4673
6470
2366
6970
7374
6767
6054
6223
62.4
7374
Bac
unga
n47
734
536
144
230
283
378
3033
0.85
747
7
2001
2002
2003
Sam
plin
g S
tatio
n
2001
2002
2003

158 PALAWAN
APPE
NDIX
D-2
. D
ata
on W
ater
Qua
lity
Para
met
ers
from
Riv
er S
tatio
ns, P
alaw
an (c
ontin
ued)
.
Data
for F
igur
e 28
- C
olor
of W
ater
Sam
ples
from
Riv
er S
tatio
ns i
n S
outh
ern
Pal
awan
1996
1998
1999
2000
Sam
plin
g S
tatio
nS
ept.
Mar
.O
ct.
Apr
.Ju
lyD
ec.
Feb
.M
ayA
ug.
May
Aug
Mar
Jun
Feb
Jun
Sep
Dec
Low
est
Ave
rage
Hig
hest
Sout
hern
Pal
awan
09/9
603
/98
10/9
804
/99
07/9
912
/99
02/0
005
/00
08/0
005
/01
08/0
103
/02
06/0
202
/03
06/0
309
/03
12/0
3
Iraan
2958
8176
4312
651
4428
241
398
3127
2310
186
3823
95.0
2941
3
Cal
ateg
as66
3735
244
277
7471
133
8918
828
596
7079
212
1022
131
3718
9.73
510
22
Ara
may
wan
6310
422
981
194
109
4213
889
4255
6426
720
2613
9.71
472
0
Labo
g12
621
739
161
6412
568
5452
324
154
119
170
1014
110
5422
2.46
710
14
Tiga
plan
016
101
2019
3253
2842
1115
158
1345
027
.767
101
Abo
rlan
114
223
3866
5440
415
950
3813
8.50
040
4
Bat
ang-
Bat
ang
26
30
937
93
08.
625
37
Pan
itian
8233
885
237
156
356
113
8219
5.28
635
6
Pul
ot62
4581
4222
848
4284
.333
228
Tam
lang
1911
47
746
.667
114
Data
for F
igur
e 29
- Col
or o
f Wat
er S
ampl
es fr
om R
iver
Sta
tions
in
Nor
ther
n P
alaw
an
1998
1999
2000
Nov
.A
pr.
July
Jan.
Mar
.Ju
lyJa
nM
ayM
arJu
nS
epD
ecFe
bJu
nA
ugN
ovLo
wes
tA
vera
geH
ighe
st
Nor
ther
n Pa
law
an11
/98
04/9
907
/99
01/0
003
/00
07/0
001
/01
05/0
103
/02
06/0
209
/02
12/0
202
/03
06/0
308
/03
11/0
3
Gui
nera
tan
3303
321
7979
196
249
9730
822
316
5673
283
456
235
728
8055
079
776.
531
3303
Inan
deng
159
7985
4011
459
2013
154
792
8957
6798
624
5120
157.
344
792
Abo
ngan
1171
187
207
159
195
130
7022
262
216
5210
811
530
260
013
352
245.
563
1171
Bac
unga
n36
140
4640
115
9412
157
3681
.125
140
Sam
plin
g S
tatio
n
2003
2001
2002
2003
2001
2002

STATE OF THE ENVIRONMENT 159
APPE
ND
IX D
-2.
Dat
a on
Wat
er Q
ualit
y Pa
ram
eter
s fr
om R
iver
Sta
tions
, Pal
awan
(con
tinue
d).
Dat
a fo
r Fig
ure
30 -
Chl
orid
e of
Wat
er S
ampl
es fr
om R
iver
Sta
tions
in
Sou
ther
n P
alaw
an
1996
1998
1999
2000
Sep
t.M
ar.
Apr
.Ju
lyD
ec.
Feb
.M
ayA
ug.
May
Aug
Low
est
Ave
rage
Hig
hest
Sou
ther
n P
alaw
an09
/96
03/9
804
/99
07/9
912
/99
02/0
005
/00
08/0
005
/01
08/0
1
Iraa
n1.
06.
010
.03.
38.
321
.017
.019
.025
.541
.21.
015
.200
25.5
Cal
ateg
as6.
05.
07.
09.
112
.423
.021
.024
.050
.041
.25.
019
.900
50.0
Ara
may
wan
4.0
10.0
5.0
9.9
7.4
15.0
25.0
24.0
4.0
12.5
4025
.0
Labo
g20
.0>1
750
12.0
53.0
9.9
28.0
28.0
17.0
9.9
239.
740
1750
.0
Tig
apla
n2.
05.
04.
05.
86.
619
.526
.018
.02.
010
.860
26.0
Abo
rlan
43.0
33.0
33.0
38.0
0043
.0
Bat
ang-
Bat
ang
44.0
39.6
39.6
41.8
0044
.0
Pan
itian
34.5
Pul
ot
Tam
lang
Dat
a fo
r Fig
ure
31 -
Chl
orid
e of
Wat
er S
ampl
es fr
om R
iver
Sta
tions
in N
orth
ern
Pal
awan
1998
1999
2000
2002
Nov
.A
pr.
July
Jan.
Mar
.Ju
lyJa
nM
ayJu
nLo
wes
tA
vera
geH
ighe
stN
orth
ern
Pal
awan
11/9
804
/99
07/9
901
/00
03/0
007
/00
01/0
105
/01
06/0
2G
uine
rata
n26
.041
.07.
528
.422
.027
.023
.522
.012
.07.
523
.30
41In
ande
ng3.
020
.013
.035
.526
.029
.521
.021
.522
.03.
021
.30
35.5
Abo
ngan
33.0
26.0
28.9
32.1
22.5
22.5
25.0
24.5
17.0
17.0
25.7
033
Bac
unga
n28
.028
.028
.00
28
Sam
plin
g 20
01
Sta
tion
2001
Sta
tion
Sam
plin
g

160 PALAWAN
APPE
ND
IX D
-2.
Dat
a on
Wat
er Q
ualit
y Pa
ram
eter
s fr
om R
iver
Sta
tions
, Pal
awan
(con
tinue
d).
Dat
a fo
r Fig
ure
32 -
Tot
al A
lkal
inity
of W
ater
Sam
ples
from
Riv
er S
tatio
ns in
Sou
ther
n P
alaw
an
1996
1998
1999
2000
Sam
plin
g S
tatio
nS
ept.
Mar
.A
pr.
July
Dec
.F
eb.
Aug
.M
ayA
ugM
arF
ebJu
nS
epD
ecLo
wes
tA
vera
geH
ighe
st
Sou
ther
n P
alaw
an09
/96
03/9
804
/99
07/9
912
/99
02/0
008
/00
05/0
108
/01
03/0
202
/03
06/0
309
/03
12/0
3
Iraa
n18
.021
5.0
28.0
35.0
25.0
36.0
27.0
31.5
33.0
28.0
28.0
43.2
28.5
33.0
18.0
43.5
1421
5.0
Cal
ateg
as17
8.0
53.0
140.
015
3.0
152.
017
8.0
154.
015
8.0
148.
016
8.0
164.
018
8.8
141.
018
2.0
53.0
154.
130
188.
0
Ara
may
wan
112.
020
0.0
113.
011
7.0
118.
013
6.0
153.
515
0.0
133.
014
4.0
128.
012
7.0
112.
013
5.96
020
0.0
Labo
g17
6.0
133.
014
9.0
134.
017
0.0
105.
017
2.0
91.0
170.
810
8.0
152.
091
.014
1.89
017
6.0
Tig
apla
n75
.012
3.0
64.0
64.0
67.0
66.0
61.0
77.0
67.0
92.0
69.0
73.0
61.0
74.8
3312
3.0
Abo
rlan
57.3
63.0
82.0
82.0
95.6
52.5
67.0
52.5
71.3
4395
.6
Bat
ang-
Bat
ang
104.
511
5.0
125.
011
6.0
168.
812
4.0
134.
010
4.5
126.
760
168.
8
Pan
itian
118.
012
2.0
102.
512
9.6
110.
012
5.0
102.
511
7.85
012
9.6
Pul
ot14
0.0
120.
013
8.0
112.
012
2.0
112.
012
6.40
014
0.0
Tam
lang
58.5
74.0
74.0
58.5
68.8
3374
.0
Dat
a fo
r Fig
ure
33 -
Tot
al A
lkal
inity
of W
ater
Sam
ples
from
Riv
er S
tatio
ns in
Nor
ther
n P
alaw
an
1999
2000
Apr
.Ju
lyJa
n.M
ar.
July
Jan
May
Mar
Jun
Dec
Jun
Aug
Low
est
Ave
rage
Hig
hest
Nor
ther
n P
alaw
an04
/99
07/9
901
/00
03/0
007
/00
01/0
105
/01
03/0
206
/02
12/0
206
/03
08/0
3
Gui
nera
tan
26.0
29.0
20.5
20.0
22.0
20.0
22.5
15.0
16.0
27.0
30.8
15.0
15.0
021
.983
30.8
Inan
deng
15.0
28.0
11.5
12.5
11.0
9.2
9.0
9.0
9.0
14.0
21.0
10.0
9.00
13.2
6728
.0
Abo
ngan
22.0
23.0
22.0
24.0
17.5
16.5
19.0
17.0
16.0
19.0
22.0
14.5
14.5
019
.375
24.0
Bac
unga
n20
8.0
168.
027
4.0
153.
212
3.0
123.
0018
5.24
027
4.0
2001
2001
2002
2002
2003
2003
Sam
plin
g S
tatio
n

STATE OF THE ENVIRONMENT 161
APPE
ND
IX D
-2.
Dat
a on
Wat
er Q
ualit
y Pa
ram
eter
s fr
om R
iver
Sta
tions
, Pal
awan
(con
tinue
d).
Dat
a fo
r Fig
ure
34 -
Tot
al H
ardn
ess
of W
ater
Sam
ples
from
Riv
er S
tatio
ns in
Sou
ther
n P
alaw
an
1996
2002
Sep
Mar
Oct
Apr
Jul
Dec
Feb
May
Aug
May
Aug
Jun
Feb
Jun
Sep
Dec
Low
est
Ave
rage
Hig
hest
Sou
ther
n P
alaw
an09
/96
03/9
810
/98
04/9
907
/99
12/9
902
/00
05/0
008
/00
05/0
108
/01
06/0
202
/03
06/0
309
/03
12/0
3
Iraa
n31
238
3230
2931
125
3118
532
3129
3228
3228
61.0
723
8
Cal
ateg
as19
223
818
617
918
020
020
619
220
018
117
270
223
188
139
194
7018
3.75
238
Ara
may
wan
118
188
126
127
133
137
148
9120
010
416
612
911
613
891
137.
1420
0
Labo
g20
718
015
915
915
317
813
311
618
230
075
710
315
610
321
4.08
757
Tig
apla
n82
101
8275
7884
8135
7576
8480
7210
635
79.3
610
6
Abo
rlan
6670
7110
887
5871
5875
.86
108
Bat
ang-
Bat
ang
124
136
168
156
163
132
156
124
147.
8616
8
Pan
itian
133
8113
112
110
214
081
118.
0014
0
Pul
ot10
213
613
410
713
510
212
2.80
136
Tam
lang
7758
8058
71.6
780
Dat
a fo
r Fig
ure
35 -
Tot
al h
ardn
ess
of W
ater
Sam
ples
from
Riv
er S
tatio
ns in
Nor
ther
n P
alaw
an
1998
1999
2000
Nov
.A
pr.
July
Jan.
July
Jan
May
Mar
Jun
Dec
Jan
Jun
Aug
Nov
Low
est
Ave
rage
Hig
hest
Nor
ther
n P
alaw
an11
/98
04/9
907
/99
01/0
007
/00
01/0
105
/01
03/0
206
/02
12/0
201
/03
06/0
308
/03
11/0
3
Gui
nera
tan
830
1916
1713
934
1729
1418
1217
818
.036
34
Inan
deng
1018
014
119
911
162
1110
129
102
22.3
7918
0
Abo
ngan
1020
025
1716
415
1418
2017
1310
174
28.2
7120
0
Bac
unga
n18
813
923
122
814
813
816
313
817
6.43
023
1
2003
2001
2003
Sam
plin
g S
tatio
n
2001
2002
Sam
plin
g S
tatio
n
1998
1999
2000

162 PALAWAN
APPE
ND
IX D
-2.
Dat
a on
Wat
er Q
ualit
y Pa
ram
eter
s fr
om R
iver
Sta
tions
, Pal
awan
(con
tinue
d).
Dat
a fo
r Fig
ure
36 -
Nitr
ogen
Nitr
ate
of W
ater
Sam
ples
from
Riv
er S
tatio
ns i
n S
outh
ern
Pal
awan
1996
1999
2000
Sam
plin
g S
tatio
nS
ept.
Mar
.O
ct.
Dec
.F
eb.
May
Aug
.M
ayA
ugM
arJu
nF
ebS
epD
ecLo
wes
tA
vera
geH
ighe
st
Sou
ther
n P
alaw
an09
/96
03/9
810
/98
12/9
902
/00
05/0
008
/00
05/0
108
/01
03/0
206
/02
02/0
309
/03
12/0
3
Iraa
n0.
800.
403.
700.
100.
011.
500.
170.
000.
851.
200.
240.
400.
400.
400.
000.
726
3.7
Cal
ateg
as0.
900.
504.
600.
040.
052.
200.
060.
550.
400.
500.
041.
101.
100.
200.
040.
874
4.6
Ara
may
wan
0.7
0.6
2.7
0.04
70.
043
1.6
0.06
0.40
0.03
0.30
0.90
0.20
0.03
0.63
22.
7
Labo
g1.
001.
803.
400.
120.
071.
700.
072.
000.
050.
701.
000.
200.
051.
009
3.4
Tig
apla
n1.
100.
504.
600.
100.
011.
800.
040.
600.
100.
600.
200.
400.
010.
837
4.6
Abo
rlan
0.46
0.70
0.80
0.10
1.00
0.40
0.50
0.10
0.56
61.
0
Bat
ang-
Bat
ang
1.20
0.95
1.50
0.15
1.10
0.40
1.00
0.15
0.90
01.
5
Pan
itian
0.45
0.30
0.14
0.50
0.70
0.20
0.14
0.38
20.
7
Pul
ot1.
600.
100.
600.
400.
200.
100.
580
1.6
Tam
lang
0.90
0.20
0.80
0.20
0.63
30.
9
Dat
a fo
r Fig
ure
37 -
Nitr
ogen
Nitr
ate
of W
ater
Sam
ples
from
Riv
er S
tatio
ns i
n N
orth
ern
Pal
awan
1998
2000
Nov
.Ja
n.M
ar.
July
Jan
May
Mar
Jun
Sep
Dec
Aug
Nov
Low
estA
vera
geH
ighe
st
Nor
ther
n P
alaw
an11
/98
01/0
003
/00
07/0
001
/01
05/0
103
/02
06/0
209
/02
12/0
208
/03
11/0
3
Gui
nera
tan
1.40
0.05
00.
220.
240.
050
0.11
50.
10.
170.
90.
500.
000.
312
1.4
Inan
deng
7.50
0.04
0.02
80.
120.
040.
550.
10.
070.
115
0.13
0.6
0.10
0.04
0.78
37.
5
Abo
ngan
6.70
0.08
0.15
0.02
0.14
0.7
0.3
0.13
0.05
50.
130.
90.
300.
020.
800
6.7
Bac
unga
n0.
70.
210.
275
0.12
0.6
0.30
0.12
0.36
80.
7
2002
2001
2002
2003
2003
1998
2001

STATE OF THE ENVIRONMENT 163
APPE
ND
IX D
-2.
Dat
a on
Wat
er Q
ualit
y Pa
ram
eter
s fr
om R
iver
Sta
tions
, Pal
awan
(con
tinue
d).
Dat
a fo
r Fig
ure
38 -
Nitr
ogen
Nitr
ite o
f Wat
er S
ampl
es fr
om R
iver
Sta
tions
in
Sou
ther
n P
alaw
an
1996
1999
2000
Sam
plin
g S
tatio
nS
ept.
Mar
.Ju
lyD
ec.
Feb
.M
ayA
ug.
May
Aug
Mar
Jun
Feb
Sep
Low
est
Ave
rage
Hig
hest
09/9
603
/98
10/9
812
/99
02/0
005
/00
08/0
005
/01
08/0
103
/02
06/0
202
/03
09/0
3
Iraa
n0.
001
0.00
70.
007
0.00
70.
008
0.00
00.
016
0.01
60.
006
0.00
40.
001
0.00
60.
005
00.
0064
60.
016
Cal
ateg
as0.
002
0.00
40.
007
0.00
10.
007
0.01
10.
010
0.03
30.
028
0.00
40.
006
0.00
50.
006
0.00
10.
0095
40.
033
Ara
may
wan
0.00
60.
011
0.00
60.
001
0.00
80.
009
0.01
80.
001
0.00
70.
010
0.01
80.
001
0.00
863
0.01
8
Labo
g0.
001
0.00
90.
008
0.01
30.
006
0.00
10.
048
0.10
00.
009
0.00
40.
004
0.00
10.
0184
50.
100
Tig
apla
n0.
003
0.00
50.
020
0.00
60.
014
0.00
60.
008
0.00
30.
004
0.00
50.
003
0.00
740
0.02
0
Abo
rlan
0.01
40.
011
0.00
30.
004
0.00
50.
006
0.00
30.
0071
70.
014
Bat
ang-
Bat
ang
0.01
20.
001
0.00
40.
004
0.00
50.
006
0.00
10.
0053
30.
012
Pan
itian
0.00
90.
003
0.01
20.
006
0.00
40.
003
0.00
680
0.01
2
Pul
ot0.
001
0.00
40.
007
0.00
60.
001
0.00
450
0.00
7
Tam
lang
0.00
40.
003
0.00
30.
0035
00.
004
Dat
a fo
r Fig
ure
39 -
Nitr
ogen
Nitr
ite o
f Wat
er S
ampl
es fr
om R
iver
Sta
tions
in N
orth
ern
Pal
awan
1999
2000
2003
Apr
.Ju
lyJa
n.M
ar.
July
Jan
May
Mar
Jun
Sep
Dec
Aug
Low
estA
vera
geH
ighe
st
Nor
ther
n P
alaw
an04
/99
07/9
901
/00
03/0
007
/00
01/0
105
/01
03/0
206
/02
09/0
212
/02
08/0
3
Gui
nera
tan
0.01
50.
005
0.00
40.
003
0.01
90.
008
0.00
10.
003
0.11
90.
038
0.02
40.
001
0.00
10.
0200
00.
119
Inan
deng
0.00
00.
006
0.00
10.
006
0.00
20.
004
0.00
50.
001
0.06
50.
008
0.00
40.
001
0.00
00.
0085
80.
065
Abo
ngan
0.00
90.
006
0.00
70.
002
0.00
10.
004
0.00
20.
000
0.02
40.
006
0.00
10.
000
0.00
00.
0051
70.
024
Bac
unga
n0.
003
0.02
00.
004
0.00
40.
005
0.00
30.
0072
00.
005
1998
2001
2003
Sam
plin
g S
tatio
n
2002
Sou
ther
n P
alaw
an
2001
2002

164 PALAWAN
APPENDIX D-2. Data on Water Quality Parameters from River Stations, Palawan (continued).
Data for Figure 40 Phophorous(as Total Phosphates) Concentration of
Water Samples from River Stations in Southern Palawan
2000 2003
Aug Feb Lowest Average Highest
Southern Palawan
08/00 02/03
Calategas 0.33 0.03 0.33 0.18 0.03
Calategas 0.37 0.11 0.37 0.24 0.11
Aramaywan 0.32 0.2 0.32 0.23 0.20
Labog 0.47 0.32 0.47 0.40 0.32
Tigaplan 0.30 0.22 0.30 0.26 0.22
Aborlan 0.17 0.17 0.17
Batang-Batang 0.15 0.15 0.15
Panitian 0.30 0.30 0.30
Pulot 0.22 0.22 0.22
Tamlang 0.25 0.25 0.25
Data for Figure 41 Phophorous (as Total Phosphates) Concentration of Water Samples
from River Stations in Norther Palawan
2000
Sampling Station Jan. Mar. July Jan May Lowest Average Highest
Northern Palawan
01/00 03/00 07/00 01/01 05/01
Guineratan 0.20 0.01 0.15 0.01 0.12 0.20
Inandeng 0.15 0.0203 0.26 0.02 0.00 0.02 0.09 0.26
Abongan 0.34 0.68 0.11 0.08 0.09 0.08 0.26 0.68
2001
Sampling Station

STATE OF THE ENVIRONMENT 165
APPE
ND
IX E
-1.
Lis
t of M
angr
ove
Spec
ies,
Pro
vinc
e of
Pal
awan
.
MU
NIC
IPA
LITY
2004
2000
2002
2001
2003
2003
2002
2002
2003
2000
2000
2000
2001
Rox
asB
rook
e's
Nar
raQ
uezo
nB
atar
aza
Abor
lan
El
Mag
-R
izal
Cuy
oTa
ytay
San
Sofr
onio
Poin
tN
ido
says
ayVi
cent
eEs
paño
la
1R
hizo
phor
a st
ylos
aB
akau
an-b
ato
xx
xx
xx
xx
xx
xx
2R
hizo
phor
a m
ucro
nata
Bak
auan
-bab
aex
xx
xx
xx
xx
xx
xx
3R
hizo
phor
a ap
icul
ata
Bak
auan
-lala
kex
xx
xx
xx
xx
xx
xx
4S
onne
ratia
cas
eola
risP
edad
ax
xx
x5
Cer
iops
taga
lT
anga
lx
xx
xx
xx
xx
xx
x6
Bru
guie
ra g
ymno
rrhiz
aB
usai
nx
xx
xx
xx
xx
xx
x7
Bru
guie
ra s
exan
gula
Pot
otan
xx
xx
xx
xx
x8
Son
nera
tia a
lba
Pag
atpa
tx
xx
xx
xx
xx
xx
x9
Bru
guie
ra c
ylin
dric
aP
otot
an-la
lake
xx
xx
xx
xx
10X
yloc
arpu
s gr
anat
umT
abig
ix
xx
xx
xx
xx
xx
x11
Cer
iops
dec
andr
aM
alat
anga
lx
xx
xx
xx
xx
x12
Lum
nitz
era
race
mos
aK
ulas
ix
xx
xx
xx
13X
yloc
arpu
s m
oluc
cens
isP
iaga
ux
xx
xx
xx
xx
x14
Bru
guie
ra p
arvi
flora
Lang
arai
xx
xx
xx
xx
15A
egic
eras
flor
idum
Tin
duk-
tindu
kan
xx
xx
x16
Exc
oeca
ria a
gallo
cha
But
a-bu
tax
xx
xx
xx
17A
egic
eras
cor
nicu
latu
mS
agin
g-sa
ging
xx
x18
Tarr
ietia
syl
vatic
a19
Avi
cenn
ia m
arin
aB
unga
lon
xx
xx
xx
x20
Avi
cenn
ia a
lba
Pia
pix
x21
Avi
cenn
ia o
ffici
nalis
Api
-api
xx
xx
22A
vice
nnia
lana
taB
unga
lon
xx
23X
yloc
arpu
s ru
mph
ii
1S
cyph
ipho
ra h
ydro
philla
cea
Nila
dx
xx
x2
Her
itier
a lit
tora
lisD
ungo
n-la
tix
xx
xx
xx
x3
Lum
nitz
era
litto
rea
Sag
asa
xx
4N
ypa
frutic
ans
Nip
ax
xx
xx
5H
isbi
scus
tilia
ceus
Mal
ubag
ox
6A
cros
tichu
m a
ureu
mLa
golo
xx
7S
apiu
m in
dicu
m8
Thes
pesi
a po
puln
eaB
anilo
9E
ryth
rina
orie
ntal
isD
apda
p10
Ints
ia b
ijuga
Ipil
11P
anda
nus
tect
oriu
sP
rickl
y pa
ndan
12La
gers
troem
ia s
peci
osa
Ban
aba
13O
rchi
dsx
x14
Bau
hini
mal
abar
ica
But
a-bu
ta
SPEC
IES
True
Man
grov
es
Man
grov
e A
ssoc
iate
s

166 PALAWAN
APPENDIX E-1. List of Mangrove Species, Province of Palawan (continued).
MUNICIPALITY2000 1999 2001 1999 1999
Araceli Culion Dumaran Busuanga Coron
1 RhizophoraBakauan-bato x x x x x2 RhizophoraBakauan-babae x x x x x3 RhizophoraBakauan-lalake x x x x x4 Sonneratia Pedada x5 Ceriops tagTangal x x x x6 Bruguiera gBusain x x x x x7 Bruguiera sPototan x x x x8 Sonneratia Pagatpat x x x x x9 Bruguiera cPototan-lalake x x
10 XylocarpusTabigi x x x x11 Ceriops de Malatangal x x x x x12 LumnitzeraKulasi13 XylocarpusPiagau x x x x14 Bruguiera pLangarai x15 Aegiceras fTinduk-tindukan x16 ExcoecariaButa-buta x17 Aegiceras cSaging-saging x18 Tarrietia sylvatica x19 Avicennia mBungalon20 Avicennia aPiapi21 Avicennia oApi-api x22 Avicennia l Bungalon23 Xylocarpus rumphii x
1 ScyphiphorNilad x x2 Heritiera lit Dungon-lati x x x3 LumnitzeraSagasa x x x x4 Nypa frutic Nipa x5 Hisbiscus t Malubago x6 AcrostichumLagolo x x7 Sapium indicum x8 Thespesia Banilo x9 Erythrina o Dapdap x
10 Intsia bijugaIpil x11 Pandanus Prickly pandan x12 Lagerstroe Banaba x13 Orchids14 Bauhini maButa-buta x
SPECIES
True Mangroves
Mangrove Associates

STATE OF THE ENVIRONMENT 167
APPE
ND
IX E
-2. L
ist o
f Sea
gras
s Sp
ecie
s, P
rovi
nce
of P
alaw
an.
2002
2002
1999
2003
1999
2000
2000
2001
2003
2003
2003
2001
2002
2002
Agu
taya
Nar
raR
oxas
Bat
araz
aC
ulio
nA
race
liB
rook
e's
Que
zon
Riz
alA
borla
nC
uyo
Sof
roni
oM
ag-
El
Poi
ntE
spañ
ola
says
ayN
ido
1E
nhal
us a
coro
ides
Enh
ax
xx
xx
xx
xx
xx
xx
x2
Cym
odoc
ea ro
tund
ata
Cyr
ox
xx
xx
xx
xx
xx
xx
x3
Hal
odul
e un
iner
vis
Hdu
nx
xx
xx
xx
xx
xx
xx
4Th
alas
sia
hem
pric
hii
Tha
lx
xx
xx
xx
xx
xx
xx
x5
Syr
ingo
dium
isoe
tifol
ium
Syr
ix
xx
xx
xx
xx
xx
xx
6H
alop
hila
ova
lisH
ovs
xx
xx
xx
xx
xx
xx
xx
7Th
alas
sode
ndro
n ci
liatu
mT
hci
xx
xx
xx
8H
alod
ule
pini
folia
Hdp
ix
xx
xx
xx
xx
xx
xx
x9
Cym
odoc
ea s
erru
lata
Cys
ex
xx
xx
xx
xx
xx
xx
10H
alop
hila
bec
carii
Hab
ex
xx
xx
xx
xx
11H
alop
hila
min
orH
min
xx
xx
x12
Hal
ophi
la s
p.H
alo
x13
Hal
ophi
la d
ecip
iens
Had
ex
x
SEA
GR
ASS
SPE
CIE
S
2001
1999
2000
2001
1999
Dum
aran
Bus
uang
a nS
anT
ayta
yC
oron
Vic
ente
1E
nhal
us a
coro
ides
Enh
ax
xx
xx
2C
ymod
ocea
rotu
ndat
aC
yro
xx
xx
x3
Hal
odul
e un
iner
vis
Hdu
nx
xx
xx
4Th
alas
sia
hem
pric
hii
Tha
lx
xx
xx
5S
yrin
godi
um is
oetif
oliu
mS
yri
xx
xx
6H
alop
hila
ova
lisH
ovs
xx
xx
x7
Thal
asso
dend
ron
cilia
tum
Thc
ix
8H
alod
ule
pini
folia
Hdp
ix
xx
x9
Cym
odoc
ea s
erru
lata
Cys
ex
xx
xx
10H
alop
hila
bec
carii
Hab
ex
xx
11H
alop
hila
min
orH
min
xx
x12
Hal
ophi
la s
p.H
alo
13H
alop
hila
dec
ipie
nsH
ade
x
SEA
GR
ASS
SPE
CIE
S

168 PALAWAN
APPE
ND
IX E
-3.
List
of S
eaw
eed
Spec
ies,
Pro
vinc
e of
Pal
awan
.
2002
2002
1999
2003
1999
2000
2000
2001
2003
2003
2003
2001
2002
2002
Agu
taya
Nar
raR
oxas
Bat
araz
aC
ulio
nA
race
liB
rook
e's
Que
zon
Riz
alA
borla
nC
uyo
Sof
roni
oM
ag-
El
Poi
ntE
spañ
ola
says
ayN
ido
1H
alim
eda
opun
tiaH
aop
xx
xx
xx
xx
xx
xx
xx
2H
alim
eda
mac
rolo
baH
ama
xx
xx
xx
xx
xx
xx
xx
3A
ctin
otric
hia
sp.
Act
ix
xx
xx
xx
xx
x4
Avr
ainv
illea
sp.
Avl
ax
xx
x5
Val
onia
sp.
Val
ox
xx
xx
xx
6D
icty
ota
cerv
icor
nis
Dic
ex
xx
xx
xx
xx
xx
xx
7P
adin
a sp
.P
adi
xx
xx
xx
xx
xx
xx
xx
8C
aule
rpa
serr
ulat
aC
asr
xx
xx
xx
xx
9C
aule
rpa
sertu
lario
ides
Cas
tx
xx
xx
xx
x10
Cau
lerp
a ra
cem
osa
Car
ax
xx
xx
xx
xx
xx
xx
11G
alax
aura
obl
onga
taG
alo
xx
x12
Sar
gass
um s
p.S
arg
xx
xx
xx
xx
xx
xx
x13
Cod
ium
edu
leC
odi
xx
xx
xx
xx
x14
Udo
tea
orie
ntal
isU
dor
xx
xx
xx
xx
xx
15H
alim
eda
cylin
drac
eaH
acy
xx
xx
xx
xx
x16
Neo
mer
is s
p.N
eom
xx
xx
xx
xx
xx
17C
aule
rpa
broc
hypu
sC
aba
xx
x18
Cha
etom
orph
a cr
assa
Chc
rx
xx
19H
ypne
a sp
.H
ypn
xx
xx
xx
xx
x20
Dic
tyos
phae
ria c
aver
nosa
Dic
ax
21E
uche
uma
sp.
Euc
hx
xx
22G
raci
laria
sal
icor
nia
Gra
sx
xx
xx
x23
Gra
cila
ria fi
rma
Gra
fx
24C
hlor
odes
mis
hild
ebra
ndtii
Chh
ix
x25
Ent
erom
orph
a in
test
inal
isE
nte
xx
xx
26G
raci
laris
sp.
Gra
cx
xx
xx
xx
xx
xx
27La
uren
cia
sp.
Laur
xx
xx
28H
ydro
clat
us c
lath
ratu
sH
ydr
xx
xx
29A
nady
omen
e pl
icat
aA
nad
x30
Turb
inar
ia s
p.T
urb
xx
xx
xx
x31
Am
phiro
a sp
.A
mph
x32
Cau
lerp
a ta
xifo
liaC
ata
xx
xx
xx
xx
33C
aule
rpa
lent
ilifer
aC
ale
xx
xx
xx
34C
aule
rpa
mic
roph
ysa
Cam
ix
35D
icty
osph
aeria
ver
slys
ilD
ive
x36
Hal
imed
aH
ali
x37
Ulv
a re
ticul
ata
Ulre
x38
Val
onia
fast
igia
taV
afa
x39
Chl
orod
esm
is fa
stig
iata
Chf
ax
x40
Cod
ium
ara
bicu
mC
oar
xx
xx
SEA
WEE
D S
PEC
IES

STATE OF THE ENVIRONMENT 169
APPE
NDIX
E-3
. Li
st o
f Sea
wee
d Sp
ecie
s, P
rovi
nce
of P
alaw
an (c
ontin
ued)
.
2001
1999
2000
2001
1999
Dum
aran
Bus
uang
anS
anT
ayta
yC
oron
Vic
ente
1H
alim
eda
opun
tiaH
aop
xx
xx
x2
Hal
imed
a m
acro
loba
Ham
ax
xx
xx
3A
ctin
otric
hia
sp.
Act
ix
x4
Avr
ainv
illea
sp.
Avl
a5
Val
onia
sp.
Val
ox
6D
icty
ota
cerv
icor
nis
Dic
ex
xx
x7
Pad
ina
sp.
Pad
ix
xx
xx
8C
aule
rpa
serr
ulat
aC
asr
xx
xx
9C
aule
rpa
sertu
lario
ides
Cas
tx
x10
Cau
lerp
a ra
cem
osa
Car
ax
xx
11G
alax
aura
obl
onga
taG
alo
xx
12S
arga
ssum
sp.
Sar
gx
xx
x13
Cod
ium
edu
leC
odi
14U
dote
a or
ient
alis
Udo
rx
xx
x15
Hal
imed
a cy
lindr
acea
Hac
yx
x16
Neo
mer
is s
p.N
eom
xx
xx
x17
Cau
lerp
a br
ochy
pus
Cab
ax
18C
haet
omor
pha
cras
saC
hcr
19H
ypne
a sp
.H
ypn
xx
20D
icty
osph
aeria
cav
erno
saD
ica
21E
uche
uma
sp.
Euc
hx
22G
raci
laria
sal
icor
nia
Gra
s23
Gra
cila
ria fi
rma
Gra
f24
Chl
orod
esm
is h
ildeb
rand
tiiC
hhi
25E
nter
omor
pha
inte
stin
alis
Ent
e26
Gra
cila
ris s
p.G
rac
xx
27La
uren
cia
sp.
Laur
28H
ydro
clat
us c
lath
ratu
sH
ydr
xx
x29
Ana
dyom
ene
plic
ata
Ana
d30
Turb
inar
ia s
p.T
urb
xx
x31
Am
phiro
a sp
.A
mph
x32
Cau
lerp
a ta
xifo
liaC
ata
xx
x33
Cau
lerp
a le
ntilif
era
Cal
e34
Cau
lerp
a m
icro
phys
aC
ami
35D
icty
osph
aeria
ver
slys
ilD
ive
36H
alim
eda
Hal
i37
Ulv
a re
ticul
ata
Ulre
38V
alon
ia fa
stig
iata
Vaf
a39
Chl
orod
esm
is fa
stig
iata
Chf
a40
Cod
ium
ara
bicu
mC
oar
x
SEA
WEE
D S
PEC
IES

170 PALAWAN
APPE
ND
IX E
-3.
List
of S
eaw
eed
Spec
ies,
Pro
vinc
e of
Pal
awan
(con
tinue
d).
2002
2002
1999
2003
1999
2000
2000
2001
2003
2003
2003
2001
2002
2002
Agu
taya
Nar
raR
oxas
Bat
araz
aC
ulio
nA
race
liB
rook
e's
Que
zon
Riz
alA
borla
nC
uyo
Sof
roni
oM
ag-
El
Poi
ntE
spañ
ola
says
ayN
ido
41M
asto
pora
rose
aM
aro
xx
42C
lado
phor
a v
agab
unda
Cla
vx
43La
uren
cia
nidi
fica
Lani
xx
44Ja
nia
sp.
Jani
ax
x45
Hal
imed
a in
cras
sata
Hai
ncx
xx
46La
uren
cia
papi
llosa
Laup
x47
Hyp
nea
boe
rges
enii
Hyb
ox
48D
icty
ota
cave
rnos
aD
ica
x49
Cau
lerp
a cu
pres
siod
esC
auc
x50
Cau
lerp
a ur
villa
naC
aur
xx
51C
odiu
m e
duli
Coe
dx
x52
Tyde
mar
ia e
xped
ition
isT
yex
xx
53A
cata
bula
ria m
ajor
Acm
ax
54Li
agor
a ce
rano
ides
Lice
x55
Liag
ora
farin
osa
Lifa
x56
Aca
ntho
pora
spi
cife
raA
csp
x57
Bry
opsi
s pl
umos
oB
rlpx
58U
lva
Ulv
ax
59C
odiu
m s
p.C
oge
x60
Ana
dyom
ene
plic
ata
Anp
lx
61S
phac
elar
is tr
ibul
oide
sS
ptr
62H
alim
enia
dila
tata
Had
i63
Cau
lerp
a in
cras
sata
Cac
u64
Hal
imed
a ve
lasq
uezi
iH
ave
65A
ceta
bula
ria s
p.A
cet
66H
alic
oryn
e w
right
iiH
awr
67A
urai
nville
a er
ecta
Ave
r68
Dic
tyot
a di
chot
oma
Did
i69
Gra
cila
ria v
erru
cosa
Gra
v
SEA
WEE
D S
PEC
IES

STATE OF THE ENVIRONMENT 171
APPE
ND
IX E
-3.
List
of S
eaw
eed
Spec
ies,
Pro
vinc
e of
Pal
awan
(con
tinue
d).
2001
1999
2000
2001
1999
Dum
aran
Bus
uang
a nS
anT
ayta
yC
oron
Vic
ente
41M
asto
pora
rose
aM
aro
xx
42C
lado
phor
a v
agab
unda
Cla
v43
Laur
enci
a ni
dific
aLa
ni44
Jani
a sp
.Ja
nia
x45
Hal
imed
a in
cras
sata
Hai
ncx
x46
Laur
enci
a pa
pillo
saLa
up47
Hyp
nea
boe
rges
enii
Hyb
o48
Dic
tyot
a ca
vern
osa
Dic
a49
Cau
lerp
a cu
pres
siod
esC
auc
50C
aule
rpa
urvi
llana
Cau
rx
xx
51C
odiu
m e
duli
Coe
dx
52Ty
dem
aria
exp
editi
onis
Tye
xx
xx
53A
cata
bula
ria m
ajor
Acm
a54
Liag
ora
cera
noid
esLi
ce55
Liag
ora
farin
osa
Lifa
56A
cant
hopo
ra s
pici
fera
Acs
p57
Bry
opsi
s pl
umos
oB
rlp58
Ulv
a U
lva
59C
odiu
m s
p.C
oge
60A
nady
omen
e pl
icat
aA
npl
x61
Sph
acel
aris
trib
uloi
des
Spt
rx
62H
alim
enia
dila
tata
Had
ix
63C
aule
rpa
incr
assa
taC
acu
x64
Hal
imed
a ve
lasq
uezi
iH
ave
x65
Ace
tabu
laria
sp.
Ace
tx
66H
alic
oryn
e w
right
iiH
awr
x67
Aur
ainv
illea
erec
taA
ver
x68
Dic
tyot
a di
chot
oma
Did
ix
69G
raci
laria
ver
ruco
saG
rav
x
SEA
WEE
D S
PEC
IES