CCMS: Oracle - SAP Help Portal
232
PUBLIC 2021-11-15 CCMS: Oracle © 2021 SAP SE or an SAP affiliate company. All rights reserved. THE BEST RUN
-
Upload
khangminh22 -
Category
Documents
-
view
0 -
download
0
Transcript of CCMS: Oracle - SAP Help Portal

PUBLIC2021-11-15
CCMS: Oracle
© 2
021 S
AP S
E or
an
SAP affi
liate
com
pany
. All r
ight
s re
serv
ed.
THE BEST RUN

Content
1 CCMS: Oracle. . . . . . . . . . . . . . . . . . . . . . . . . . . . . . . . . . . . . . . . . . . . . . . . . . . . . . . . . . . . . . . 4
2 Getting Started in CCMS with Oracle DBA. . . . . . . . . . . . . . . . . . . . . . . . . . . . . . . . . . . . . . . . . 6
3 The DBA Cockpit. . . . . . . . . . . . . . . . . . . . . . . . . . . . . . . . . . . . . . . . . . . . . . . . . . . . . . . . . . . . 83.1 Central System Data. . . . . . . . . . . . . . . . . . . . . . . . . . . . . . . . . . . . . . . . . . . . . . . . . . . . . . . . . . 103.2 Maintenance Actions in the DBA Cockpit. . . . . . . . . . . . . . . . . . . . . . . . . . . . . . . . . . . . . . . . . . . . 103.3 Displaying the Audit Log. . . . . . . . . . . . . . . . . . . . . . . . . . . . . . . . . . . . . . . . . . . . . . . . . . . . . . . . 113.4 Configuration of Systems for Remote Monitoring. . . . . . . . . . . . . . . . . . . . . . . . . . . . . . . . . . . . . . 12
Configuring Systems for Remote Monitoring Using Remote Database Connections. . . . . . . . . . . 13Configuring Systems for Remote Monitoring Using the System Landscape Directory (SLD). . . . . . . . . . . . . . . . . . . . . . . . . . . . . . . . . . . . . . . . . . . . . . . . . . . . . . . . . . . . . . . . . . . . . . 18
3.5 The DBA Cockpit on a Local System and on SAP Solution Manager. . . . . . . . . . . . . . . . . . . . . . . . . 20Architecture Overview: End-to-End Monitoring and Alerting in SAP Solution Manager and DBA Cockpit. . . . . . . . . . . . . . . . . . . . . . . . . . . . . . . . . . . . . . . . . . . . . . . . . . . . . . . . . . . . . . . . .23Setting Up Database Monitoring and Alerting in SAP Solution Manager. . . . . . . . . . . . . . . . . . . .25Setting Up Remote Monitoring Manually. . . . . . . . . . . . . . . . . . . . . . . . . . . . . . . . . . . . . . . . . 26
3.6 Performance (Oracle). . . . . . . . . . . . . . . . . . . . . . . . . . . . . . . . . . . . . . . . . . . . . . . . . . . . . . . . . 26SAP/Oracle Database Monitor. . . . . . . . . . . . . . . . . . . . . . . . . . . . . . . . . . . . . . . . . . . . . . . . .27Performance Overview. . . . . . . . . . . . . . . . . . . . . . . . . . . . . . . . . . . . . . . . . . . . . . . . . . . . . . 28Wait Event Analysis. . . . . . . . . . . . . . . . . . . . . . . . . . . . . . . . . . . . . . . . . . . . . . . . . . . . . . . . 38SQL Statement Analysis. . . . . . . . . . . . . . . . . . . . . . . . . . . . . . . . . . . . . . . . . . . . . . . . . . . . .62Statistical Information. . . . . . . . . . . . . . . . . . . . . . . . . . . . . . . . . . . . . . . . . . . . . . . . . . . . . . 70Feature Monitoring. . . . . . . . . . . . . . . . . . . . . . . . . . . . . . . . . . . . . . . . . . . . . . . . . . . . . . . . 98Additional Functions. . . . . . . . . . . . . . . . . . . . . . . . . . . . . . . . . . . . . . . . . . . . . . . . . . . . . . .105
3.7 Space (Oracle). . . . . . . . . . . . . . . . . . . . . . . . . . . . . . . . . . . . . . . . . . . . . . . . . . . . . . . . . . . . . 121Space Overview. . . . . . . . . . . . . . . . . . . . . . . . . . . . . . . . . . . . . . . . . . . . . . . . . . . . . . . . . . 122Space Statistics Collector. . . . . . . . . . . . . . . . . . . . . . . . . . . . . . . . . . . . . . . . . . . . . . . . . . . 123Database Overview. . . . . . . . . . . . . . . . . . . . . . . . . . . . . . . . . . . . . . . . . . . . . . . . . . . . . . . . 127Users Overview. . . . . . . . . . . . . . . . . . . . . . . . . . . . . . . . . . . . . . . . . . . . . . . . . . . . . . . . . . 128Users Detailed Analysis. . . . . . . . . . . . . . . . . . . . . . . . . . . . . . . . . . . . . . . . . . . . . . . . . . . . .130Tablespaces Overview. . . . . . . . . . . . . . . . . . . . . . . . . . . . . . . . . . . . . . . . . . . . . . . . . . . . . .132Tablespaces Detailed Analysis. . . . . . . . . . . . . . . . . . . . . . . . . . . . . . . . . . . . . . . . . . . . . . . . 137Segments Overview. . . . . . . . . . . . . . . . . . . . . . . . . . . . . . . . . . . . . . . . . . . . . . . . . . . . . . . 140Segments Detailed Analysis. . . . . . . . . . . . . . . . . . . . . . . . . . . . . . . . . . . . . . . . . . . . . . . . . 144Segments Detailed Analysis (Aggregated). . . . . . . . . . . . . . . . . . . . . . . . . . . . . . . . . . . . . . . 148Collector Logs. . . . . . . . . . . . . . . . . . . . . . . . . . . . . . . . . . . . . . . . . . . . . . . . . . . . . . . . . . . 151
2 PUBLICCCMS: Oracle
Content

BW Analysis. . . . . . . . . . . . . . . . . . . . . . . . . . . . . . . . . . . . . . . . . . . . . . . . . . . . . . . . . . . . .1533.8 Jobs (Oracle). . . . . . . . . . . . . . . . . . . . . . . . . . . . . . . . . . . . . . . . . . . . . . . . . . . . . . . . . . . . . . 155
Central Calendar. . . . . . . . . . . . . . . . . . . . . . . . . . . . . . . . . . . . . . . . . . . . . . . . . . . . . . . . . 155DBA Planning Calendar (Oracle). . . . . . . . . . . . . . . . . . . . . . . . . . . . . . . . . . . . . . . . . . . . . . 158Displaying DBA Logs (Oracle). . . . . . . . . . . . . . . . . . . . . . . . . . . . . . . . . . . . . . . . . . . . . . . . 168Display of the Backup Logs (Oracle). . . . . . . . . . . . . . . . . . . . . . . . . . . . . . . . . . . . . . . . . . . . 169
4 Database System Check. . . . . . . . . . . . . . . . . . . . . . . . . . . . . . . . . . . . . . . . . . . . . . . . . . . . . 1754.1 Configuring Database System Check (Oracle). . . . . . . . . . . . . . . . . . . . . . . . . . . . . . . . . . . . . . . 1764.2 Displaying Alert Messages from Database System Check. . . . . . . . . . . . . . . . . . . . . . . . . . . . . . . 181
5 Update Statistics for the Cost-Based Optimizer in CCMS (Oracle). . . . . . . . . . . . . . . . . . . . . 1845.1 Updating Statistics in the DBA Planning Calendar (Oracle). . . . . . . . . . . . . . . . . . . . . . . . . . . . . . 1855.2 Updating Statistics for a Single Table (Oracle). . . . . . . . . . . . . . . . . . . . . . . . . . . . . . . . . . . . . . . 1865.3 Updating Statistics for Groups of Tables in CCMS (Oracle). . . . . . . . . . . . . . . . . . . . . . . . . . . . . . 1905.4 Configuring Update Statistics in CCMS (Oracle). . . . . . . . . . . . . . . . . . . . . . . . . . . . . . . . . . . . . . 191
6 Maintaining Database Parameters (Oracle). . . . . . . . . . . . . . . . . . . . . . . . . . . . . . . . . . . . . . .196
7 Monitoring the Oracle Database. . . . . . . . . . . . . . . . . . . . . . . . . . . . . . . . . . . . . . . . . . . . . . . 2017.1 Space Management Alerts. . . . . . . . . . . . . . . . . . . . . . . . . . . . . . . . . . . . . . . . . . . . . . . . . . . . .2027.2 Database Performance Alerts. . . . . . . . . . . . . . . . . . . . . . . . . . . . . . . . . . . . . . . . . . . . . . . . . . 2057.3 Database Backup and Restore Alerts. . . . . . . . . . . . . . . . . . . . . . . . . . . . . . . . . . . . . . . . . . . . . 2077.4 Database Consistency Alerts. . . . . . . . . . . . . . . . . . . . . . . . . . . . . . . . . . . . . . . . . . . . . . . . . . . 2087.5 Database Health Alerts. . . . . . . . . . . . . . . . . . . . . . . . . . . . . . . . . . . . . . . . . . . . . . . . . . . . . . . 2097.6 Information on Oracle Database Alerts. . . . . . . . . . . . . . . . . . . . . . . . . . . . . . . . . . . . . . . . . . . . 227
CCMS: OracleContent PUBLIC 3

1 CCMS: Oracle
Use
You can perform most regularly-recurring database administration tasks from within the SAP System by using the DBA tools of the CCMS. After installation, reorganizations and certain other tasks are the only tasks that you cannot perform from within the SAP System, as shown in the following table:
Database Task Executed Using
Installation SAP Software Provisioning Manager (SWPM) on operating-system level
Data backup
Backup database files and redo log files
SAP (CCMS), operating system (BRARCHIVE, BRBACKUP)
Performance optimizing
Monitor and optimize database performance
SAP (CCMS), operating system
Access optimizing
Configure cost-based optimizer, create and update statistics
SAP (CCMS), operating system (BRCONNECT)
Monitoring
Monitor database using alert monitor, check database and DBA action logs
SAP (CCMS), operating system (BRCONNECT)
Check
Analyze space (number of objects, fragmentation, bottlenecks), check configuration (control file, online redo log files, INIT.ORA parameters)
SAP (CCMS), (BRCONNECT)
Reorganization
Reorganize tables
Operating system (BRSPACE)
Other tasks
For example, database recovery (restore and recovery)
Operating system (BRRECOVER)
4 PUBLICCCMS: Oracle
CCMS: Oracle

Features
The main CCMS tools for database administration are:
● Display of the Backup Logs [page 169] (in the DBA Cockpit): Check the status of database backups● The DBA Planning Calendar [page 158] (in the DBA Cockpit): Automatically schedule and execute
database operations (for example, database backups, update statistics, and database checks)● Displaying DBA Logs [page 168] (in the DBA Cockpit): Access action logs created by BRSPACE,
BRBACKUP, BRARCHIVE, BRCONNECT or an external program● The Database System Check [page 175] (Transactions DB16 and DB17): Configure and check important
database parameters to be able to recognize critical database situations in time.● Update Statistics [page 184] (Transactions DB20 and DB21): Configure the cost-based optimizer, and
check and update optimizer statistics● Online Maintenance of Database Parameters [page 196] (Transaction DB26): Details and history of
database parameters● Maintaining Database Connection Information (Transaction DBCO): Information about additional,
nonstandard database connections● The SAP/Oracle Database Monitor [page 27]: Detailed database performance information and histories
For more information about Oracle database administration with the SAP System, see .
CCMS: OracleCCMS: Oracle PUBLIC 5

2 Getting Started in CCMS with Oracle DBA
Before starting to use the Computing Center Management System (CCMS) for Oracle database administration (DBA) tasks you need to set up certain things.
1. Set up hardware for database backups and offline redo log backups to, for example, tape drives and tapes.Database backups and offline redo log backups are not interactive. When they are executed from the DBA Planning Calendar, the operator is not informed when a tape needs to be changed.Therefore, you need one of the following:○ The number of tape drives required to hold all tapes needed. The advantage of this is that BRBACKUP
uses tape drives in parallel thus increasing the speed of the backupIf you start BRBACKUP and BRARCHIVE as separate actions, assign them to separate tape drives using the initialization profile init<DBSID>.sap. This allows you to use different tapes for database backups and offline redo log backups
○ An automatic tape changer, supported by BRBACKUP. This devices changes the tapes as required by BRBACKUP and BRARCHIVEFor more information, see , parameter descriptions for backup_dev_type and rewind_offline
Enter the tape drives to use in the BRBACKUP/BRARCHIVE initialization profile init<DBSID>.sap.For more information, see .
2. Set up authorizations.To use the DBA Planning Calendar, you need authorizations for database administration and background job scheduling. The profiles S_RZL_ADMIN and S_BTCH_ALL must be entered for the administrator.For more information, see the documentation on profile maintenance and authorizations for background jobs.
NoteExternal programs must be able to run on the database server so that actions affecting the database can be executed from other application servers.
3. Set up users and authorizations for the database system and operating system.DBA Planning Calendar actions are executed under the authorizations of the host system user with which an SAP application server was started. This is usually the user <SAPSID>adm on UNIX, or SAPService<SAPSID> on Windows.The user <SAPSID>adm or SAPService<SAPSID> must be:○ Specified as a trusted user OPS$ in the Oracle database○ Granted the SAPDBA role
For more information, see the Oracle database documentation.These prerequisites are normally met in the standard SAP System.
4. Configure BRBACKUP, BRARCHIVE, and BRCONNECT.BRBACKUP, BRARCHIVE, and BRCONNECT use the backup parameter file init<DBSID>.sap.If you are using different tape drives for BRBACKUP and BRARCHIVE, you must adjust the backup parameter file init<DBSID>.sap. If you are using multiple tape drives, you must also specify these in the configuration file.Set the following parameters:○ For BRBACKUP: tape_address, tape_address_rew
6 PUBLICCCMS: Oracle
Getting Started in CCMS with Oracle DBA

○ For BRARCHIVE: tape_address_arch, tape_address_rew_arch
NoteIf you have scheduled BRBACKUP and BRARCHIVE to start in one action, the system only uses the tape drives defined for BRBACKUP.
For more information, see .
CCMS: OracleGetting Started in CCMS with Oracle DBA PUBLIC 7

3 The DBA Cockpit
Use
The DBA Cockpit is a platform-independent tool that you can use to monitor and administer your database. It provides a graphical user interface (GUI) for all actions and covers many aspects of handling a database system landscape.
You access the DBA Cockpit by calling transaction DBACOCKPIT. Then, the initial screen DBA Cockpit: System Configuration Maintenance appears.
Features
The entry screen of the DBA Cockpit is divided into the following areas:
● Application toolbarProvides a minimum of functions, for example, to display or hide the areas on the left side.
● System landscape toolbarProvides central functions to manage the system landscape, for example:○ Access to system configuration where you configure and set up your system landscape
8 PUBLICCCMS: Oracle
The DBA Cockpit

○ Management of database connections○ Lets you choose the system to monitor. Also, additional information about a distributed database
system is displayed if available.● Navigation frame
Displays a tree structure divided at the top level into the main task areas of database administration. These are, for example, performance monitoring, space management, and job scheduling. Within each task area, there is a set of related action nodes.
● Central system dataThis area is common to most actions. It provides, for example, the following data:○ Time of last refresh○ Database startup time○ Name of database
It is not available for all database platforms. For more information, see the corresponding database-specific section.
● Action areaDisplays the details of the currently selected action.
● Action message windowOnly appears with certain actions and displays additional information that is related to the selected action.
● Framework message windowDisplays the message window provided by the framework. Unlike the classic SAP GUI messaging process, the framework message window contains a complete history of all messages sent during the session. In addition, you can:○ Clean up the window by choosing Delete.○ Collapse or expand the window by choosing Minimize Message Window or Show Message Window.○ Check if a long text for a message is available by double-clicking the message or by choosing Show
Longtext.
NoteChanges to the screen area sizes are user-specific and are restored when you next start the DBA Cockpit.
Activities
You can use the DBA Cockpit to:
● Navigate between different actions● Change to another action without closing the previous action and still hold all data retrieved by this action
You can return to this action without data loss by double-clicking the previous action in the navigation frame or by choosing Back.
● Handle central configuration● Monitor remote systems using remote database connections
To use the functions offered for remote monitoring, you must configure the system you want to monitor. The local system is configured automatically when you start the DBA Cockpit for the first time.After having configured the connection and depending on the database, more actions are required to configure the database monitor and to set up database administration.
Constraints
CCMS: OracleThe DBA Cockpit PUBLIC 9

For systems that are monitored using a remote database connection, constraints depend on whether:
● The database release of the remote system is compatible to the database release of the local system.● You want to monitor an ABAP-only or a Java-only SAP system.
3.1 Central System Data
Definition
Most of the DBA Cockpit screens display central system data of the selected screen.
Structure
The central system data displayed is as follows (not all fields are displayed on all screens):
Field Description
DB Name Database name
DB Server Database server name
DB Release Database release number
Started Date and time when database was started
3.2 Maintenance Actions in the DBA Cockpit
The DBA Cockpit provides a set of actions to monitor and to maintain the database. To be able to perform these actions, the SAP user requires some additional authorizations.
The maintenance actions provided in the DBA Cockpit set locks to prevent parallel processing. All changes to the database are recorded in an audit log file.
Authorization Check
When you start the DBA Cockpit or change to another system in the DBA Cockpit, an authorization check is performed.
Granting of Database Permissions
10 PUBLICCCMS: Oracle
The DBA Cockpit

To be able to access the database, the user used for remote monitoring must at least have sufficient authorizations.
● Local systems use the connect user for monitoring tasks. This user already has sufficient permissions. If more authorizations are required for administrative actions, a second connection using the database administration user is used.
● Systems monitored via remote database connections use the user specified for the database connections. This user must have sufficient authorizations.
Locking of Actions
For each maintenance action that you have selected using the DBA Cockpit, a lock is set for the system being monitored. All locks are released when you exit the DBA Cockpit or when you change to another system.
Auditing of Maintenance Actions
NoteThe following only applies to Oracle.
When you make changes that affect database objects such as database configuration parameters or tablespaces, an audit log is written. You can display this audit log in the DBA Cockpit.
Related Information
Displaying the Audit Log [page 11]
3.3 Displaying the Audit Log
Use
You can track changes to the database made from the DBA Cockpit and to the monitoring setup using the maintenance actions provided in the DBA Cockpit. Changes made from outside - for example, using native database commands - are not displayed here.
Procedure
1. Call the DBA Cockpit.2. In the navigation frame, choose Audit.
CCMS: OracleThe DBA Cockpit PUBLIC 11

The DBA Cockpit: Audit Log screen appears. The audit log consists of the following fields:
Field Description
Date Start date of the action
Time Start time of the action
System Target system on which the action was performed
Action Type of action (name of the action in the DBA Cockpit)
Command Type of command (for example, ADD, DELETE or EDIT)
Object Name of the modified object (for example, database or tablespace name)
User Name of the SAP user who performed the action
From System System from where the action was performed
3. By default, the system displays all audit entries logged during the current week. If you want to display another week, double-click a day in the calendar.To display more than one week, you can change the field Number of Days.
4. To display the details of an action, select the corresponding action and choose Details.In the lower half of the screen, the SQL statements that have been executed are displayed.
3.4 Configuration of Systems for Remote MonitoringTo be able to use the DBA Cockpit to monitor remote systems, you have to configure those systems in the DBA Cockpit. You can configure your database system either using database information that is stored in the system landscape directory (SLD) for automatic generation and update of system entries or manually using database connections and system entries.
You access the screen The DBA Cockpit: System Configuration Maintenance by choosing System Configuration in the DBA Cockpit. A list of all monitored systems is displayed with an icon showing the configuration status of a system (activated or deactivated). You can change the configuration status of a system by clicking on the icon.
NoteIn the event of severe errors, we recommend that you deactivate your system to prevent further problems. After you have investigated and corrected the error, you have to activate your system again.
Normally, when you start the DBA Cockpit, the local system is set as default system. To change this setting, select a system from the list and choose Default System.
NoteThis setting only applies to the user currently logged on to the system. It is not a system-wide setting.
12 PUBLICCCMS: Oracle
The DBA Cockpit

You use one of the following methods to monitor a system remotely:
● Remote database connectionsThis method uses additional connections. It is the main access method for monitoring and administration tasks and is mandatory. You can specify remote connections for any database and maintain the connections using the DBA Cockpit. For more information, see the section Maintenance Actions in the DBA Cockpit.
● RFC connectionFor this method you have to assign an RFC connection to your system. RFC connections are available for SAP ABAP systems only. You can use RFC connections:○ As an optional access path for ABAP-related monitoring functions, for example, for the consistency
check of the ABAP Dictionary. That is, the DBA Cockpit uses the RFC connection in parallel to the database connection for the same system.
○ As an optional access path for ABAP-related monitoring functions, for example, for the consistency check of the ABAP Dictionary. That is, the DBA Cockpit uses the RFC connection in parallel to the database connection for the same system.
NoteYou can only maintain RFC connections with transaction SM59, not with the DBA Cockpit.
See also:
3.4.1 Configuring Systems for Remote Monitoring Using Remote Database Connections
Use
You use this procedure to configure systems that you want to monitor using remote database connections.
NoteDepending on the database platform of the selected system, some options might not be available. In this case you cannot enter any data in the corresponding fields.
Prerequisites
● Your application server must have client software installed to access the remote database that you want to monitor.
● The system(s) you want to monitor must have a database release supported by your version of the DBA Cockpit.
● The user for the database connection must have sufficient database permissions. For more information, see Maintenance Actions in the DBA Cockpit.
Procedure
CCMS: OracleThe DBA Cockpit PUBLIC 13

Adding a System
1. Call the DBA Cockpit.The screen DBA Cockpit: System Configuration Maintenance appears. It displays a list of all systems available with a Configuration Status icon, which shows the current system status (Activated or Deactivated).
NoteWhen you start the DBA Cockpit for the first time, the local system is automatically added to the list of all systems available. At least one system entry is displayed.
2. Choose Add.The screen Configuration: System Administration - Add System Entry appears.
3. Specify the connection data as follows:1. In the System field, enter the name of the system you want to monitor.
NoteThis name is a unique ID and does not need to be the SAP system ID. You can choose any name except the SAP system ID of the local system, which is reserved for the local system entry.
Except for the local system entry, Remote Database is already selected.2. Select Database Connection.
Enter the name of the database connection. If the database connection does not yet exist, you are directed to the DB Connections: Add Connection Entry screen where you can specify all relevant data for the new connection. For more information, see
3. After you have saved your entries, you are redirected to the screen System Administration Details.4. If an additional RFC destination is used for special ABAP monitoring functions or if the connection is
initially routed using an RFC connection (MS SQL Server only), select RFC Destination, too.5. If required, enter the name of the RFC connection.
4. After the connection data has been completed, it is displayed on the System Data tab page. You can enter a description of your system on the Administration Data tab.
5. Save your changes.
Changing the Connection Parameters of a System
1. Perform step 1 as described above under Adding a System.2. Select a system.3. Choose Edit.
The screen Configuration: System Administration - Change System Entry appears.4. Enter your changes in the corresponding fields.5. Save your changes.
Deleting a System Entry
1. Perform step 1 as described above under Adding a System.2. Select a system.3. Choose Delete.
14 PUBLICCCMS: Oracle
The DBA Cockpit

3.4.1.1 Configuration of Database Connections
Purpose
This section describes how you set and maintain technical attributes for remote database connections. The DBA Cockpit uses these connections for administration and monitoring or for application programs that use secondary connections to external databases.
Process Flow
1. You call the DBA Cockpit and choose DB Connections in the system landscape toolbar.The screen DBA Cockpit: Database Connections appears displaying a list of all available database connection definitions grouped by database platform:
Column Description
Remote Database Connections Name of database connection
NoteThis is a unique name that you can freely choose.
DB Name Name of database
DB Host Name of database host
DB Schema Name of the database schema to be monitored
User Name of the connection user
Permanent Specifies whether the connect user must be permanently available
Max. Connections Maximum allowed number of open connections
Opt. Connections Optimal number of connections
By default, the database connections that are defined in the local system are displayed.
NoteMS SQL Server only:
You can also display the database connections of another ABAP system via RFC by entering an RFC destination in the appropriate field.
NoteDB2 for IBM i only:
For more information about the privileges required for the connection user, see SAP Note 2031950 - IBM i: Authorities for Database Remote Connections.
CCMS: OracleThe DBA Cockpit PUBLIC 15

2. You are able to perform one of the following tasks:○ You add database connections.○ You change an existing database connection.○ You delete a database connection.○ You test a database connection.
See also:
●●●●
3.4.1.1.1 Adding a Database Connection
Use
You can use this procedure to add a database connection in the DBA Cockpit.
Procedure
1. Call the DBA Cockpit.2. In the system landscape toolbar, choose DB Connections.3. Choose Add.
The screen DB Connections - Add Connection Entry appears.4. In the Connection Name field, specify the name of the connection.
NoteThis name is a unique ID that you can choose freely except for names that are reserved by SAP for generated connections.
For example, you cannot use administrator connections or connections that are used by systems from the system landscape directory (SLD).
5. Specify the database connection attributes as follows:1. In the Database System field, specify the name of the database platform.2. In the Connection Maximum field, enter an appropriate value.
This value limits the number of database connections that are currently held by the SAP system. The SAP system does not let you exceed this limit.
3. In the Connection Optimum field, enter an appropriate value.This value is a flexible limit that can be exceeded if required.
4. If you want the connection to be mandatory for the SAP system, choose Permanent Connection. This parameter defines the availability of the database connection.It is then handled like the local default connection. This means that, if this database connection is not available for a work process, the work process of the SAP system cannot run.
16 PUBLICCCMS: Oracle
The DBA Cockpit

CautionOnly set this parameter if this connection is absolutely required to run your SAP system.
5. In the User Name field, enter the name of the connect user. Make sure that you choose a user with the appropriate authorizations.For more information, see Maintenance Actions in the DBA Cockpit.
6. In the Password field, enter a password for the connect user.6. In the Connection Parameters table, specify the following additional database-specific attributes:
Attribute Description
TNS Name Name of Oracle Transparent Network Substrate (TNS)
Character Set Name of character set
National Character Set Name of national character set
NoteTo support upcoming new connection parameters and for support scenarios, you might have to add connection parameters in an unchecked raw format.
To enable this, choose Guided Mode <-> Expert Mode and switch to the expert mode. In expert mode, you can enter connection parameters as a string instead of using the guided mode.
However, we recommend that you do not use the expert mode.
7. To confirm your entries, choose Add.
Result
As soon as the connection has been specified, the DBA Cockpit connects automatically to the newly added database system and displays data on the System Data tab page.
3.4.1.1.2 Changing a Database Connection
1. Call the DBA Cockpit.2. In the system landscape toolbar, choose Database Connections.3. Select a database connection entry and choose Edit.
The screen DB Connections - Change Connection Entry appears.4. Enter your changes in the appropriate fields as described in .5. Save your changes.
CCMS: OracleThe DBA Cockpit PUBLIC 17

3.4.1.1.3 Testing a Database Connection
Use
You test a database connection to make sure that, for example, you entered the correct user and password information as well as the correct technical connection data, such as host name.
Procedure
1. Call the DBA Cockpit.2. In the system landscape toolbar, choose Database Connections.3. Select a system and choose Test.
The result is displayed in the action message window below.
3.4.1.1.4 Deleting a Database Connection
1. Call the DBA Cockpit.2. In the system landscape toolbar, choose DB Connections.3. Select a system and choose Delete.
CautionIf the selected database connection is still in use by a system that is registered in the DBA Cockpit, you cannot delete it.
3.4.2 Configuring Systems for Remote Monitoring Using the System Landscape Directory (SLD)
Use
The system landscape directory (SLD) contains data from all database systems available in your system landscape. You can use this data to set up the system configuration in the DBA Cockpit instead of setting it up manually.
When you set up the DBA Cockpit for the first time, you use this procedure to import the appropriate data from the SLD. During production operation, you use the procedure to synchronize the data between the SLD and the DBA Cockpit periodically.
Procedure
1. To import database connection data from the SLD, call the DBA Cockpit.2. In the system landscape toolbar, choose System Configuration.
The screen The DBA Cockpit: System Configuration Maintenance appears.3. Choose SLD System Import.
18 PUBLICCCMS: Oracle
The DBA Cockpit

The SLD System Import screen appears. Depending on the system landscape, one or more of the following nodes are displayed:○ New Database Systems in the SLD
All database systems registered in the SLD that are so far unknown to the DBA Cockpit are displayed.○ Changed Systems from Earlier SLD Imports
All database systems for which the main data differs between the SLD and the DBA Cockpit are displayed.
○ Systems No Longer Registered in the SLDAll systems that were originally imported from the SLD into the DBA Cockpit but that are no longer registered in the SLD are displayed.
○ Systems Identical in the SLD and in the DBA CockpitAll systems that are registered in the SLD and that are identical in the DBA Cockpit are displayed.
○ Unsupported Database Systems in the SLDAll database systems that are registered in the SLD but not supported by the DBA Cockpit are displayed.
NoteEach database system is described as follows:
<Name (System ID) of the Database System> on <Main Database Host> ( <Database Platform> )
The actions allowed for each database system are displayed in the second column of the tree.
4. To import database system data, select the actions that you want to execute for the selected database systems and choose Import. By default, only the import of new database systems is selected.The selected actions are executed. A short message for each executed action is displayed in the message window below.
NoteConnection data that is retrieved from the SLD might not be complete for one of the following reasons:
· Depending on the data provided by a system to the SLD, some connection data can be incomplete.
· User or password data is generally not available via SLD.
When you establish the connection to an imported system, the DBA Cockpit checks the completeness of a configured system. That is, if necessary, you are prompted for user, password and connection information.
If additional connection information is required, enter the required data according to the maintenance dialog that is described in
CCMS: OracleThe DBA Cockpit PUBLIC 19

3.5 The DBA Cockpit on a Local System and on SAP Solution Manager
Use
The DBA Cockpit is part of every SAP NetWeaver-based system. You can run the DBA Cockpit locally on an SAP NetWeaver-based system by calling the DBACOCKPIT transaction. Alternatively, you can run the DBA Cockpit on your SAP Solution Manager system, where you can access all databases in your system landscape using remote connections. If you use the DBA Cockpit as part of the SAP Solution Manager system, this allows you to update and administrate all databases from a central system rather than logging on to each individual system separately.
DBA Cockpit on a Local System
20 PUBLICCCMS: Oracle
The DBA Cockpit

DBA Cockpit on an SAP Solution Manager System
SAP Solution Manager is the free SAP toolset in your system landscape to monitor the full stack of an SAP system: from the operating system up to the business process. SAP Solution Manager is typically installed on a separate system, where it provides central access to tools, methods, and preconfigured contents that you can use during the evaluation, implementation, and operations of your systems. For database administrators, SAP Solution Manager offers a range of tools for root cause analysis, alerting, and reporting.
The tools of the DBA Cockpit complement the available SAP Solution Manager tools, which provide high-level overviews of possible database issues, including reporting and alerting functions. In addition to the high-level overviews of SAP Solution Manager, the DBA Cockpit serves as an in-depth analysis tool for database-related issues.
CCMS: OracleThe DBA Cockpit PUBLIC 21

Available Database Monitoring in SAP Solution Manager and the DBA Cockpit
The DBA Cockpit not only provides more tools for the expert database administrator, but it also plays an important part in the SAP Solution Manager infrastructure. The remote database monitoring infrastructure of the DBA Cockpit is used by SAP Solution Manager to extract metrics from remote databases. These metrics are then passed on to the different applications in SAP Solution Manager.
22 PUBLICCCMS: Oracle
The DBA Cockpit

3.5.1 Architecture Overview: End-to-End Monitoring and Alerting in SAP Solution Manager and DBA Cockpit
Use
The architecture of SAP Solution Manager comprises a number of tools and frameworks that collect detail data about databases and their statuses automatically. The tools and frameworks for automatic discovery of databases and database details include the landscape management database (LMDB), the Diagnostics Agent, and the extractor framework:
Data Collection and Database Monitoring and Alerting with SAP Solution Manager
Landscape Management Database (LMDB)
In SAP Solution Manager, all elements of a system landscape are modeled in the Landscape Management Database (LMDB). The core task of the LMDB is to provide information about the entire system landscape at a central location. The LMDB copies available data from the system landscape directory (SLD), but it enriches the data copied from SLD with additional information. For example, the SLD can provide the information which databases are available. For each database, the LMDB adds details such as the cluster topology of the database. All SAP Solution Manager applications are based on LMDB.
CCMS: OracleThe DBA Cockpit PUBLIC 23

Diagnostics Agent
The Solution Manager Diagnostics Agent (Diagnostics Agent), which is installed on every local system of your system landscape, gathers information from the managed systems and reports the information to the SAP Solution Manager system. This includes information about the availability of the database and its host.
The Diagnostics Agent uses SAP Host Agent to discover all databases installed on a host. The Diagnostics Agent and the SAP Host Agent transfer some basic information, such as the database host, the database type and its name, to the SLD. In addition, the Diagnostics Agent reports technical attributes like cluster topology, database release, and properties required for a remote database connection to the LMDB. This kind of information mapped in the LMDB with the data provided by the SLD. Information about databases that do not run with an SAP system are also pushed to the LMDB by the Diagnostics Agent.
DBA Cockpit Backend, Extractor Framework, and Data Flow
The DBA Cockpit backend performs data collection via remote database connection and calculates the metrics of the monitored databases, such as performance KPIs, space, or buffer pool quality. The DBA Cockpit takes snapshots of database statuses, and thus is able to generate historical data (time series), which allows database administrators to keep track of short- and mid-term developments in the database. The data collected by the DBA Cockpit backend is also fed into the extractor framework, the central infrastructure for SAP Solution Manager for data collection and distribution.
The extracted data is reused by the following engines and stores:
● Alert Calculation Engine (ACE)● Metric-Event-Alert (MEA) Store● SAP BW for reporting
These engines and stores further process the raw data taken from the databases and generate alerts and metrics for BW reporting, which are then passed on to the different SAP Solution Manager applications, such as the alert inbox, reporting functions and also the BW reporting screens in the DBA Cockpit.
Predefined Alerting Templates Shipped by SAP
During the SAP Solution Manager setup, you can find predefined monitoring and alerting templates that contain the definitions or values of metrics, events, and alerts (MEA). Depending on the defined threshold values, incidents and notifications are then automatically triggered. For IBM IBM Db2 databases, predefined metrics, events, and alerts are available for the following:
● Database availability● Database exceptions, such as locks, missing backups, or error messages● Database performance issues, such as bad buffer quality or problems with disk space usage
NoteThe availability of the end-to-end alerting in SAP Solution Manager depends on your support license.
24 PUBLICCCMS: Oracle
The DBA Cockpit

3.5.2 Setting Up Database Monitoring and Alerting in SAP Solution Manager
Procedure
To set up the end-to-end monitoring and alerting infrastructure, you use the standard transactions for setting up SAP Solution Manager. You need to perform the following steps:
1. Install the Diagnostics Agent on your database systems.The Diagnostics Agent gathers information from the managed systems and reports them to the SAP Solution Manager system. This also includes information about the availability of the database and its host. You need to install a Diagnostics Agent on each server (virtual hostname) that you want to monitor. You can use the SAP installation tool to install the Diagnostics Agent.
2. Configure data suppliers in the system landscape directory (SLD).Use the transaction System Landscape Directory: Local Administration ( RZ70) to configure SLD data suppliers in the system landscape. Here, you need to provide the port and the host of the SLD. The SLD data suppliers are programs that collect the database attributes Database Host, Database Type and Database Name at defined periods. Once the SLD data suppliers are up and running, they push database attributes from the database to the SLD.
3. Connect the Diagnostics Agent to SAP Solution Manager.Use the transaction SAP Solution Manager Configuration (SOLMAN_SETUP) System Preparation to connect the SAP Diagnostics Agent to SAP Solution Manager.
4. Configure the systems managed by SAP Solution Manager.Use the transaction SAP Solution Manager Configuration (SOLMAN_SETUP) Managed System Configuration to perform the following activities:○ Connect the SAP Diagnostics Agent to the managed databases○ Specify system parameters required to configure the managed databases
Most of these parameters, such as hosts or ports, are automatically detected by the Diagnostics Agent, so only a password is required here.
○ Trigger automatic configuration activitiesThis includes the setup of database extractors, which collect data for monitoring the databases in SAP Solution Manager.
5. Set up technical monitoring, including alerting.Use the transaction SAP Solution Manager Configuration (SOLMAN_SETUP) Technical Monitoring to set up the technical monitoring of databases in SAP Solution Manager. You set up the following:○ Activation or deactivation of auto-notifications (for example, e-mail notifications) about database
alertsAs a default, auto-notification is activated.
○ Recipients and recipient lists of auto-notifications○ Assignment of monitoring templates to selected systems in scope for monitoring
Monitoring templates contain the definitions or values of metrics, events, and alerts (MEA) that trigger incidents and notifications. The SAP templates have predefined settings, but you can also adapt the templates to your customer-specific needs.
CCMS: OracleThe DBA Cockpit PUBLIC 25

More Information
● Complete setup of SAP Solution Manager: Documentation for SAP Solution Manager on SAP Help Portal at http://help.sap.com/solutionmanager
● Additional database-specific setup steps: SAP Note 1027146● Overall architecture: Architecture Overview: End-to-End Monitoring and Alerting in SAP Solution Manager
and DBA Cockpit
3.5.3 Setting Up Remote Monitoring Manually
Use
If you do not use SAP Solution Manager for monitoring, you can also set up the DBA Cockpit and databases for remote monitoring as follows:
● By manually creating database connections and system configuration entries in the DBA CockpitThis is relevant, for example, if you want to monitor a database using the DBA Cockpit and without configuring the database for monitoring in SAP Solution Manager. For more information, see Configuring Systems for Remote Monitoring Manually.
● By using database information that is stored in the system landscape directory (SLD) for automatic generation and update of system entries in the DBA CockpitThis option is deprecated and only available in the SAP GUI version of the DBA Cockpit. Do not use this option if you use SAP Solution Manager. For more information, see Configuring Systems for Remote Monitoring Using the System Landscape Directory.
● By configuring database connections on the Database Connections screen of the DBA CockpitYou can use the Database Connections screen to set up database connections that are used for non-monitoring components, for example, for the access to external data resources by SAP BW. For more information, see Configuring Database Connections.
RecommendationWe recommend that you use SAP Solution Manager for the setup and monitoring of your system landscape (see Setting Up Database Monitoring and Alerting in SAP Solution Manager).
3.6 Performance (Oracle)
Use
You can use the Performance menu in the DBA Cockpit to monitor your Oracle database [page 27]:
● Performance overview [page 28]● Wait event analysis [page 38]
26 PUBLICCCMS: Oracle
The DBA Cockpit

● SQL statement analysis [page 62]● Statistical information [page 70]● Feature monitoring [page 98]● Additional functions [page 105]
3.6.1 SAP/Oracle Database Monitor
Use
You can use the SAP/Oracle database monitor in the DBA Cockpit to monitor your database running with Oracle or Oracle Real Application Cluster (RAC). It is an expert tool.
NoteThe documentation in this section refers to the new SAP/Oracle Database Monitor.
For more information on the old SAP/Oracle Database Monitor, based on ST04N, see SAP/Oracle Database Monitor (Old).
Integration
The database monitor is part of the Computing Center Management System (CCMS). You can start it from the DBA Cockpit.
The monitor obtains information from the Oracle performance views (V$, GV$, and DBA-views).
Prerequisites
You need to apply SAP Note 706927 before using the database monitor.
Features
The monitor:
● Gives a general overview of database performance● Provides different ways of looking at the monitoring information:
○ A main monitor [page 28] with an overview of the database○ Detailed analyses using sub-monitors, grouped as follows:
○ Wait event analysis [page 38]○ SQL statement analysis [page 62]
CCMS: OracleThe DBA Cockpit PUBLIC 27

○ Statistical information [page 70]○ Feature monitoring [page 98]○ Additional functions [page 105]
● Fully supports Oracle Real Application Cluster (RAC)● Does not support Multiple Components in One Database (MCOD)
Activities
1. Start the database monitor from the DBA Cockpit by choosing Performance Performance Overview .
NoteThe following steps are generally valid for all screens, including screens in the sub-monitors.
2. If your SAP system uses Oracle RAC, in DB Instances you double-click the required RAC instance or Total for all RAC instances.
3. To refresh the display, choose Refresh.
3.6.2 Performance Overview
Definition
This is the main screen in the SAP/Oracle Database Monitor [page 27]. It gives you an overview of the performance of your Oracle database.
Use
You start the database monitor from the DBA Cockpit by choosing Performance Performance Overview . You see an overview of database performance.
You can right-click a field and choose Details to see the values for each instance if you are running an Oracle Real Application Cluster (RAC).
If you are running RAC, you choose in DB Instances whether to display overview information for one RAC instance or for the total of all RAC instances.
NoteThe appearance of a yellow or red light indicates that the difference in percent for the value of at least one instance from the average of all instances exceeds a certain limit.
28 PUBLICCCMS: Oracle
The DBA Cockpit

Structure
The fields are grouped as follows:
● General information, data source is V$INSTANCE
Field Description
DB instance Name of the current database instance
This is the SAP-SID in non-RAC environments.
DB node Host name of the selected DB node
This is the database server in non-RAC environments.
DB release Release of the current database
Day, time Current day and time
Start up at Date and time when the current database instance started
Time since start Time since start of the current database instance, in days-hours-minutes-seconds
DB Time <Busy wait time> + <CPU time session>
● Sizes
Field Description
Database Buffer Size Size of the data buffer
○ Non-RAC or RAC detail: data buffer size of the current instance
○ RAC total: total instance-related database buffersData source: V$SGA
- Size default pool Size of the default buffer pool, calculated as follows:
select value from v$parameter where name = 'db_cache_size'
Data source: gv$sga_dynamic_components
- Size keep pool Size of the keep buffer pool, calculated as follows:
select value from v$parameter where name = 'db_keep_cache_size'
Data source: gv$sga_dynamic_components
CCMS: OracleThe DBA Cockpit PUBLIC 29

Field Description
- Size others Sum of the sizes of all other buffer caches pools, calculated as follows:
select inst_id, round(sum(CURRENT_SIZE)/1024,0) othersize from gv$sga_dynamic_components where component = 'DEFAULT 2K buffer cache' or component = 'EFAULT 4K buffer cache' or component = 'DEFAULT 8K buffer cache' or component = 'DEFAULT 16K buffer cache' or component = 'DEFAULT 32K buffer cache' or component = 'RECYCLE buffer cache' group by inst_id
Can be displayed in detail as a pop-up
Data source: gv$sga_dynamic_components
In-Memory-Size Size available to in-memory data, configurable as of Oracle 12.
Shared pool size Size of the shared pool
○ Non-RAC or RAC detail: shared pool size of the current instance
○ RAC total: total shared pool size for all instancesData source: V$SGA_DYNAMIC_COMPONENTS
Logical reads Number of logical read operations
○ Non-RAC or RAC detail: logical reads of the current instance
○ RAC total: total logical read operations for all instancesData source: V$SYSSTAT
Physical reads Number of physical read operations
○ Non-RAC or RAC detail: physical reads of the current instance
○ RAC total: total physical read for all instancesData source: V$SYSSTAT
Physical writes Number of physical write operations
○ Non-RAC or RAC detail: physical writes of the current instance
○ RAC total: total physical write operations for all instancesData source: V$SYSSTAT
30 PUBLICCCMS: Oracle
The DBA Cockpit

Field Description
Read by other sess Number of buffer busy wait situations
○ Non-RAC or RAC detail: total waitstat counters of the current instance
○ RAC total: total waitstat counters for all instancesData source: GV$SYSTEM_EVENT
Read by other sess time Sum of buffer busy wait times
○ Non-RAC or RAC detail: sum of wait times for all wait counters of the current instance
○ RAC total: sum of wait times for all wait counters for all instancesData source: V$WAITSTAT
● Quality
Field Description
Data Buffer Quality Data buffer quality, calculated as follows:
100% - (( physicalreads - physicalreads_direct - physicalreads_directlob) / ( sess_logicalreads - physicalreads_direct - physicalreads_directlob))
Non-RAC or RAC detail: data buffer quality of the current instance
RAC total: average of quality for all instance-related data buffer
Data source: V$SYSSTAT
DD-cache Quality Data dictionary cache quality as percentage, calculated as follows:
100% - ( totalget_misses / totalgets)
○ Non-RAC or RAC detail: data buffer quality of the current instance
○ RAC total: average cache quality for all instancesData source: V$ROWCACHE
CCMS: OracleThe DBA Cockpit PUBLIC 31

Field Description
SQL area getratio Ratio of gethits to gets as a percentage, calculated as follows:
sum ( gethits) / sum ( gets) x 100
○ Non-RAC or RAC detail: get ratio of the current instance
○ RAC total: average of all instance-related get ratiosData source: V$LIBRARYCACHE
SQL area pinratio Ratio of pinhits to pin s as a percentage, calculated as follows:
sum ( pin hits) / sum ( pins) x 100
○ Non-RAC or RAC detail: pin ratio of the current instance
○ RAC total: average of all instance-related pin ratiosData source: V$LIBRARYCACHE
SQLA Reloads/pins Ratio of reloads to pin s as a percentage, calculated as follows:
sum ( reload s) / sum ( pins) x 100
○ Non-RAC or RAC detail: reloads per pin ratio of the current instance
○ RAC total: average of all instance-related pin ratiosData source: V$LIBRARYCACHE
● Log buffer
Field Description
Size Size of the redo log buffer
○ Non-RAC or RAC detail: redo log buffer size of the current instance
○ RAC total: total instance-related redo log buffer sizesData source: V$SGA
Entries Number of redo log buffer entries
○ Non-RAC or RAC detail: redo log buffer entries of the current instance
○ RAC total: sum of all instance-related redo log buffer entriesData source: V$SYSSTAT
32 PUBLICCCMS: Oracle
The DBA Cockpit

Field Description
Allocation retries Number of redo buffer allocation retries
○ Non-RAC or RAC detail: allocation retries of the current instance
○ RAC total: total instance-related log buffer allocation retriesData source: V$SYSSTAT
Redo log space wait Redo log wait in seconds
○ Non-RAC or RAC detail: Redo log wait time of the current instance
○ RAC total: sum of instance-related redo log wait timesData source: V$SYSSTAT
Redo log groups Number of redo log groups
Log files [in use] Number of active log files
○ Non-RAC or RAC detail: active log files for the current instance
○ RAC total: total active log filesThe figure in brackets refers to the number of active log files in use.Data source: V$LOGFILE
● Time Statistics
Field Description
Busy wait time Busy wait time, calculated as the sum of the time waited for all non-idle events.
○ Non-RAC or RAC detail: busy wait time for the current instance
○ RAC total: total instance-related busy wait timesData source: V$SESSION_EVENT
CPU time session CPU time session, calculated as sum of CPU time used by this session
○ Non-RAC or RAC detail: total CPU time for the current instance
○ RAC total: total CPU time for all instancesData source: V$SYSSTAT
CCMS: OracleThe DBA Cockpit PUBLIC 33

Field Description
Time/User call Time for each user call, calculated as follows:
(busy wait time + CPU time) / user calls
○ Non-RAC or RAC detail: time for the current instance○ RAC total: average time for all instances
Data source: V$SESSION_EVENT and V$SYSSTAT
Sessions busy Busy sessions as a percentage, calculated as follows:
(busy wait time + CPU time) / total wait time
○ Non-RAC or RAC detail: percentage for the current instance
○ RAC total: average percentage for all instancesData source: V$SESSION_EVENT and V$SYSSTAT
CPU usage CPU usage as a percentage, calculated as follows:
CPU time / (elapsed time x CPU count)
○ Non-RAC or RAC detail: percentage for the current instance
○ RAC total: average percentage for all instancesData source: V$SYSSTAT, V$INSTANCE, and V$PARAMETER
Number of CPUs Number of CPUs
○ Non-RAC or RAC detail: CPUs for the current instance○ RAC total: total CPUs for all instances
Data source: V$PARAMETER
● Calls
Field Description
User calls Number of user calls
○ Non-RAC or RAC detail: user calls for the current instance
○ RAC total: total user calls for all instancesData source: V$SYSSTAT
User commits Number of user commits
○ Non-RAC or RAC detail: user commits for the current instance
○ RAC total: total user commits for all instancesData source: V$SYSSTAT
34 PUBLICCCMS: Oracle
The DBA Cockpit

Field Description
User rollbacks Number of user rollbacks
○ Non-RAC or RAC detail: user rollbacks for the current instance
○ RAC total: total user rollbacks for all instancesData source: V$SYSSTAT
Recursive calls Internal SQL statement or SQL statement in PL/SQL statement
Parse count Total number of parse calls (hard and soft)
User/recursive calls Ratio of user to recursive calls
Log Reads/User calls Number of logical reads per user call.
● Redo Logging
Field Description
Redo writes Number of redo log writes
○ Non-RAC or RAC detail: redo log writes for the current instance
○ RAC total: total redo log writes for all instancesData source: V$SYSSTAT
OS blocks written Number of operating system redo blocks written
○ Non-RAC or RAC detail: redo blocks written for the current instance
○ RAC total: sum of written redo blocks for all instancesData source: V$SYSSTAT
Latching time Redo writer latching time in seconds
Non-RAC or RAC detail: redo writer latching time for the current instance
RAC total: total latching time for all instances
Data source: V$SYSSTAT
Redo write time Redo write time in seconds
○ Non-RAC or RAC detail: redo write time for the current instance
○ RAC total: total redo write time for all instancesData source: V$SYSSTAT
CCMS: OracleThe DBA Cockpit PUBLIC 35

Field Description
Volume written Volume amount written
○ Non-RAC or RAC detail: redo log data written for the current instance
○ RAC total: total redo log data written for all instancesData source: V$SYSSTAT
● Table scans and fetches
Field Description
Short table scans Number of short table scans
○ Non-RAC or RAC detail: short table scans for the current instance
○ RAC total: total short table scans for all instancesData source: V$SYSSTAT
Long table scans Number of long table scans
○ Non-RAC or RAC detail: long table scans for the current instance
○ RAC total: total long table scans for all instancesData source: V$SYSSTAT
Table fetch by rowid Number of table fetches by row ID
○ Non-RAC or RAC detail: table fetches by row ID for the current instance
○ RAC total: total table fetches by row ID for all instancesData source: V$SYSSTAT
Fetch by contin. row Number of fetches by continued row
○ Non-RAC or RAC detail: table fetches by continued row for the current instance
○ RAC total: total table fetches by continued row for all instancesData source: V$SYSSTAT
● Sorts
36 PUBLICCCMS: Oracle
The DBA Cockpit

Field Description
Sorts (memory) Number of sorts in memory
○ Non-RAC or RAC detail: sorts in memory for the current instance
○ RAC total: total sorts in memory for all instancesData source: V$SYSSTAT
Sorts (disk) Number of sorts in disk
○ Non-RAC or RAC detail: sorts on disk for the current instance
○ RAC total: total sorts on disk for all instancesData source: V$SYSSTAT
Sorts (rows) Number of sorted rows
○ Non-RAC or RAC detail: sorted rows in memory for the current instance
○ RAC total: total rows for all instancesData source: V$SYSSTAT
WA exec. optimal mode Number of work area executions in optimal mode
○ Non-RAC or RAC detail: work area executions in optimal mode for the current instance
○ RAC total: total work area executions in optimal mode for all instancesData source: V$SYSSTAT
WA exec. one pass mode Number of work area executions in one-pass mode
○ Non-RAC or RAC detail: work area executions in one-pass mode for the current instance
○ RAC total: total work area executions in one-pass mode for all instancesData source: V$SYSSTAT
WA exec. multipass mode Number of work area executions below the one-pass memory requirement
○ Non-RAC or RAC detail: work area executions in multipass mode for the current instance
○ RAC total: total work area executions in multipass mode for all instancesData source: V$SYSSTAT
● Top System EventsThis shows the system events in descending order of Wait Time.
CCMS: OracleThe DBA Cockpit PUBLIC 37

3.6.3 Wait Event Analysis
Use
These sub-monitors in the SAP/Oracle Database Monitor help you analyze SQL statements.
3.6.3.1 Session Monitor
Definition
This sub-monitor in the SAP/Oracle Database Monitor lets you check the Oracle session list and related resource information. In addition, you can see an execution plan and the SQL statement performed by a session. If a session performs an SQL statement from an ABAP program you can display the ABAP source.
Use
You choose Performance Wait Event Analysis Session Monitor in the DBA Cockpit.
Structure
This screen contains the following information:
Column Description
SID Session ID
ORA proc. Oracle shadow process ID
SAP instance name SAP instance name
Client system Client system
Client proc. Client process ID
Status Session status
Event Event name
SQL Text Text of SQL statement
38 PUBLICCCMS: Oracle
The DBA Cockpit

Column Description
Logical reads Logical reads
Phys. Reads Physical reads
Block Changes Block changes
Consistent Changes Consistent changes
Last wait time Last wait time (>0 wait time,0 wait,-1 wait short,-2 unknown
Seconds in Wait Seconds in wait
P1 Text Description of first parameter
P1 First additional parameter
P2 Text Description of second parameter
P2 Second additional parameter
P3 Text Description of third parameter
P3 Third additional parameter
Block Gets Block gets
Consistent Gets Consistent gets
User Database user of the session
PGA_USED_MEM PGA memory currently used
PGA_ALLOC_MEM PGA memory currently allocated
PGA_FREEABLE_MEM Allocated memory that can be freed
PGA_MAX_MEM Maximum PGA memory ever allocated
SAP_USER (Kernel 7.1) SAP logon user
Client_Info (Kernel 7.1) Connection handle: Transaction: Main program
You can double-click a row to display the detail screen with the complete SQL statement. From the detail screen you can choose Explain SQL statement to display the execution plan.
You can choose the following:
● Reset Point to reset all fields in the result list from GV$SESS_IO to null. This means that you set a start point.
● Since Reset to display the results since the start point
CCMS: OracleThe DBA Cockpit PUBLIC 39

Integration
This monitor is based on the following views:
● GV$SQL● GV$SQLTEXT
3.6.3.2 Buffer Busy Waits
Definition
This sub-monitor in the SAP/Oracle Database Monitor lets you check buffer busy waits in the Oracle database.
A buffer busy wait indicates that there are some buffers in the buffer cache that multiple processes are attempting to access concurrently. This event happens because one of the following is true:
● An Oracle block is being read into the buffer cache by another session and the session is waiting for that read to complete.
● The buffer is already in the buffer cache but in an incompatible mode (that is, some other session is changing the buffer).
Use
You choose Performance Wait Event Analysis Buffer Busy Wait in the DBA Cockpit.
Structure
NoteEntries marked “RAC only” appear only for Oracle Real Application Cluster (RAC).
● Buffer Busy WaitsThis tab page contains information on buffer busy waits:
Column Description
Inst Id
RAC only
Database instance ID
Class Class of block
40 PUBLICCCMS: Oracle
The DBA Cockpit

Column Description
Ttl waits Total number of waits due to this class of block
Tm Wait (ms) Total of all wait times for all waits due to this class of blocks in milliseconds
Avg Tm wait (ms) Average duration of wait due to this class of block in milliseconds
%BBW/Inst Percentage of waits due to this class of block for each instance
% of Time of BBW/Inst Percentage of time spent waiting due to this class of block for each instance
%BBW Percentage of waits due to this class of block for all instances
% of Time of BBW Percentage of time spent waiting due to this class of block for all instances
NoteIn single-instance - that is, non-RAC - environments, the following is true:
○ %BBW/Inst shows the same value as %BBW○ % of Time of BBW/Inst shows the same value as % of Time of BBW
● RAC only: Buffer Busy Waits with Total LinesThis tab page shows the same information as in the table above plus Total lines for each Class of buffer busy wait. This helps you identify a buffer cache contention problem that is not caused by a specific instance.
3.6.3.3 System Event
Definition
This sub-monitor in the SAP/Oracle Database Monitor lets you check the following wait events and system events in the Oracle database:
● Busy waits summary● Wait event details● Oracle view GV$SYSTEM_EVENT
CCMS: OracleThe DBA Cockpit PUBLIC 41

Use
You choose Performance Wait Event Analysis System Event in the DBA Cockpit. Then you choose the required tab page Busy Waits Summary, Wait event details, or GV$SYSTEM_EVENT.
You can choose the following:
● Reset to define a starting point for a measurement so that you can trace the measurement values over a time period
● Since Reset to display the measurement values for a time period between the current time and the time that you chose Reset
● Since DB Start to display all measurement values for the time period between the database start and the current time (default setting)
Structure
NoteEntries marked “RAC only” appear only for Oracle Real Application Cluster (RAC)
● Busy Waits SummaryThis tab page displays a summary of busy waits:
Column Description
Inst Id
RAC only
Database instance ID
Session type Type of session.
For example, BACKGROUND for system sessions, USER for application sessions.
User Name Name of the user connected to the database. For example, SAP applications connect as user SAPR3.
PName Process name
Sessions Number of sessions connected to the database
Busy wait time (ms) Wait time spent busy in milliseconds
Total wait time (ms) Total time waiting for an event in milliseconds
Busy W (%) Busy wait time as percentage of Total wait time
● Wait event details
42 PUBLICCCMS: Oracle
The DBA Cockpit

This tab page displays details of wait events:
Column Description
Inst ID
RAC only
Database instance ID
Event Name of the event that caused the wait
Wait time (ms) Time waiting for the event in milliseconds
% of non-idle Percentage of non-idle waiting time caused by this event
% of tot. resp. Percentage of total response time caused by this event
Waits Number of waits
Timeouts Number of timeouts
Avg. WT (ms) Average wait time in milliseconds
● GV$SYSTEM_EVENTThis tab page displays details from the Oracle view GV$SYSTEM_EVENT:
Column Description
Event Name of the event that caused the wait
Inst ID
RAC only
Database instance ID
Wait time (ms) Time waiting for the event in milliseconds
Wait% Inst/Evt. Percentage of time spent waiting for an event
Waits Number of waits
Timeouts Number of timeouts
Avg. WT (ms) Average wait time in milliseconds
NoteThis tab page shows events and wait times per instance in descending order of the event's total wait time.
In a RAC environment, you see by default the wait times for each instance and the total wait times for all instances. If required, you can restrict the display to a single instance.
CCMS: OracleThe DBA Cockpit PUBLIC 43

3.6.3.4 System Event History
Definition
This sub-monitor in the SAP/Oracle Database Monitor gives you an overview of the history of system events of the Oracle instance(s). It helps you to work out whether:
● The load has changed during the last few days● The instances have load peaks● One instance has more load compared to the other instances, in a RAC environment
Use
You choose Performance Wait Event Analysis System Event History in the DBA Cockpit.
For more information about system events of a specific day, you can double-click a row in one of the two tab pages. This provides the data in hourly units for the selected day. You can double-click again to show all system events of the selected hour.
Structure
● With idle eventsThis tab page displays data for all system events including idle events.
● Without idle eventsThis tab page excludes idle events.
Both tab pages display the following:
Column Description
Weekday Day of the week when the snapshot was created
Date Date of the snapshot
From Start of snapshot interval
To End of snapshot interval
Event Name of the wait event
Time Waited (ms) Total amount of time waited for the event in milliseconds
Total Waits in % Percentage of time waited compared to total value
Average Wait (ms) Average amount of time waited for the event in milliseconds
44 PUBLICCCMS: Oracle
The DBA Cockpit

Column Description
Total Timeouts Total number of timeouts for the event
Total Waits Total number of waits for the event
Time Waited (micro seconds) Total amount of time waited for the event in microseconds
3.6.3.5 Filesystem Requests
Definition
This submonitor in the SAP/Oracle Database Monitor lets you check filesystem requests in the Oracle database. It monitors the activity of filesystem requests with the Oracle GV$FILESTAT view
Use
You choose Performance Wait Event Analysis Filesystem requests in the DBA Cockpit.
This monitor helps you to minimize the time needed to read or write data from or to a file, so that you can identify the frequently used data files and put them on separate disks to avoid contention, if necessary. Data file activity has an important effect on database performance.
Structure
NoteEntries marked “RAC only” appear only for Oracle Real Application Cluster (RAC).
● IO per FileThis tab page displays current statistics on physical file accesses per data file:
Column Description
File# File number
Inst id
RAC only
Instance ID
Full path Full file name including path
CCMS: OracleThe DBA Cockpit PUBLIC 45

Column Description
Reads Number of reads
Blk Reads Number of block reads
Blk/Rd Number of blocks per read
Rd Avg(ms) Read average time in milliseconds
Rds/File(%) Percentage of reads per file
Sgl Blk Rds Number of single block reads
Sgl Blk Rds Avg(ms) Average time for single block reads in milliseconds
Writes Number of writes
Blk wrts Number of block writes
Wrt Avg(ms) Average time for writes in milliseconds
BBW Number of buffer busy waits
Avg BBW(ms) Average buffer busy wait time in milliseconds
BBW/File(%) Percentage of buffer busy waits per file
● I/O per File With Total Lines - RAC onlyThis tab page displays the same information as in the table above plus Total lines for each Full path. This helps you identify a filesystem request problem that is not caused by a specific instance.
● Total per DeviceThis tab page displays current statistics on total physical file accesses per disk device. There are also entries for each file on the device.
Column Description
File# File number
Inst id
RAC only
Instance ID
Name / Device Full file name including path
Reads Number of reads
Blk Rds Number of block reads
Blk/Rd Number of blocks per read
Rd Avg(ms) Read average time in milliseconds
46 PUBLICCCMS: Oracle
The DBA Cockpit

Column Description
Rds/File(%) Percentage of reads per file
% of Ttl Blk Rds Percentage of total block reads
Sgl Blk Rds Number of single block reads
Sgl Blk Rds Avg(ms) Average for single block reads in milliseconds
Writes Number of writes
Blk wrts Number of block writes
Wrt Avg(ms) Average time for writes in milliseconds
BBW Number of buffer busy waits
Avg BBW(ms) Average buffer busy wait time in milliseconds
BBW/File(%) Percentage of buffer busy waits per file
● I/O per PathThis tab page displays current statistics about total physical file accesses per path.
Column Description
Path File number
Reads Number of reads
Blk Rds Number of block reads
Blk/Rd Number of blocks per read
Rd Avg(ms) Read average time in milliseconds
Rds/File(%) Percentage of reads per file
% of Ttl Blk Rds Percentage of total block reads
Sgl Blk Rds Number of single block reads
Sgl Blk Rds Avg(ms) Average for single block reads in milliseconds
Writes Number of writes
Blk wrts Number of block writes
Wrt Avg(ms) Average time for writes in milliseconds
BBW Number of buffer busy waits
CCMS: OracleThe DBA Cockpit PUBLIC 47

Column Description
Avg BBW(ms) Average buffer busy wait time in milliseconds
BBW/File(%) Percentage of buffer busy waits per file
3.6.3.6 Enqueue Stat
Definition
This sub-monitor in the SAP/Oracle Database Monitor helps you monitor enqueues and so reduce wait events.
Use
You choose Performance Wait Event Analysis Enqueue Stat in the DBA Cockpit.
NoteEntries marked “RAC only” are only relevant for Oracle Real Application Cluster (RAC).
Structure
● v$enqueue statThis tab page contains the following information:
Column Description
Instance Id
RAC only
Database instance ID
Enqueue Type Type of enqueue requested
Total Requests Total number of enqueue requests or enqueue conversions for this type of enqueue
% Requests Requests for this enqueue type as a percentage of total requests
48 PUBLICCCMS: Oracle
The DBA Cockpit

Column Description
Total Waits Total number of times an enqueue request or conversion resulted in a wait
% Waits Waits for this enqueue type as a percentage of total waits
Total Grants Number of times an enqueue request or conversion was granted
% Grants Grants for this enqueue type as a percentage of total requests
Total Fails Number of times an enqueue request or conversion failed
% Fails Fails for this enqueue type as a percentage of total fails
Cumulative Wait Time Cumulative (that is, total) amount of time in milliseconds spent waiting for the enqueue or enqueue conversion
% Wait Time Wait time for this enqueue type as a percentage of total wait time
% Wait / Uptime Cumulative wait time for this enqueue type as a percentage of the total database uptime
○ Generating totalsFor numeric columns, you can select the column and choose Total to generate totals. For example, you can generate totals for the column Total Requests.
○ Generating subtotalsFor the non-numeric columns you can select the column and choose Subtotals to generate subtotals. For example, you can generate subtotals for the column Enqueue Type.
● RAC only: v$enqueue stat with Total LinesThis tab page appears only for RAC systems when you are monitoring the whole system, that is, you have selected Total under DB Instances.The tab page displays the same information as in the table above plus total lines for all instances, marked with Instance ID set to zero.
Integration
This monitor is based on the view GV$ENQUEUE_STAT.
CCMS: OracleThe DBA Cockpit PUBLIC 49

3.6.3.7 Lock Monitor
Definition
This sub-monitor in the SAP/Oracle Database Monitor helps you monitor currently active locks that are causing other requests to wait.
Use
You choose Performance Wait Event Analysis Lock Monitor in the DBA Cockpit. You can display active locks in the following ways:
● Without DBA Objects
NoteEntries marked “RAC only” are only relevant for Oracle Real Application Cluster (RAC).
Structure
This screen contains the following information:
● Without DBA Objects - by omitting DBA objects, this has a performance advantage● With DBA Objects● Blocking Graph - uses an Oracle 10g technique
You can also view details on the locks displayed and also related locks:
● Detailed lock displayYou can double-click a row to view the detailed lock display, including the SQL statement.
NoteIn some cases, (G)V$SESSION does not provide certain required and DBA_OBJECTS also does not provide any object name. This means the monitor cannot evaluate the primary key values of the row involved, which means that nothing can be displayed.
● Related locksFrom the detailed lock display, you can choose Linked Lock to display the related lock holders or waiters:○ For a lock holder, the lock holder itself and all lock waiters are displayed.○ For a lock waiter, the lock waiter itself and the related lock holder are displayed.
50 PUBLICCCMS: Oracle
The DBA Cockpit

3.6.3.8 Latch Monitor
Definition
This sub-monitor in the SAP/Oracle Database Monitor lets you view Oracle latch activity. A latch is a low-level serialization mechanism to protect shared data structures by preventing concurrent access to shared data structures in the Shared Global Area (SGA). Processes often have to wait to obtain a latch in order to access the data, which wastes CPU cycles.
Use
You choose Performance Wait Event Analysis Latch Monitor in the DBA Cockpit.
Structure
NoteEntries marked “RAC only” are only relevant for Oracle Real Application Cluster (RAC).
● Latch OverviewYou can use this tab page to identify the latches with the worst hit rates and the latches causing the most sleeps. There might be a problem if one of the library cache latches is causing the most sleeps.This tab page displays the following information:
Column Description
Name Latch name
Inst Id
RAC only
Instance ID
Wait time Elapsed time waiting for the latch in microseconds
% Wait time Wait time as a percentage of total wait time
Gets Number of times the latch was requested in willing-to-wait mode and the requestor had to wait
Misses Number of times the latch was requested in willing-to-wait mode and the requestor had to wait
Misses/Gets Ratio of Misses to Gets
CCMS: OracleThe DBA Cockpit PUBLIC 51

Column Description
Sleeps Number of times a willing-to-wait latch request resulted in a session sleeping while waiting for the latch
% Sleeps Sleeps as a percentage of total sleeps
Immediate Gets Number of times a latch was requested in no-wait mode
Immediate Misses Number of times a no-wait latch request did not succeed (that is, missed)
Spin Gets Willing-to-wait latch requests which missed the first try but succeeded while spinning
Sleep 1 Waits that slept once
Sleep 2 Waits that slept twice
Sleep 3 Waits that slept three times
Sleep 4 Waits that slept four times
To see the children of the selected latch, select a row and choose Latch Children.
● Latches Overview with Total Lines - RAC onlyThis tab page displays the same information as in the table above plus Total lines for each Name. This helps you identify a latch monitor problem that is not caused by a specific instance.
● Latch HolderThis tab page shows details of the latch holders, based on the view GV$LATCHHOLDER. It helps you to identify if the session holding the latch is changing and to check whether a latch is stuck on a particular session.This tab page displays the following information:
Column Description
Name Latch name
Inst ID
RAC only
Instance ID
SID ID of the session that owns the latch
● Latch ChildrenThis tab page shows the number of children for the latches shown
Column Description
Name Latch name
52 PUBLICCCMS: Oracle
The DBA Cockpit

Column Description
Inst ID
RAC only
Instance ID
Count Number of children
● Latch Holders SQL StmtThis tab page shows the SQL statements that are currently being executed by the latch holders, based on the view GV$LATCHHOLDER. Be sure to refresh the display frequently. To view the detailed SQL statement, choose More Details.
Column Description
Name Latch name
Inst ID
RAC only
Instance ID
SID ID of the session that owns the latch
● Cache Buffers Chains
NoteBefore you view, make sure that you have implemented SAP Note 159510 and use SAP$BH instead of X$BH.
This tab page shows cache buffer chains, based on the view GV$LATCH_CHILDREN. The default view is the top 200, ordered by wait time (descending) and sleeps (descending). You can use it to identify hot blocks (that is, frequently accessed blocks) in the buffer cache and also, in some cases, poorly tuned SQL statements.
Column Description
Name Latch name
Inst ID
RAC only
Instance ID
Address Address of the latch object
Wait Tm(ms) Elapsed time waiting for the latch in microseconds
% Wait Tm Wait time as a percentage of total wait time
% Ttl Wait Tm Percentage of total wait time
CCMS: OracleThe DBA Cockpit PUBLIC 53

Column Description
Gets Number of times the latch was requested in willing-to-wait mode and the requestor had to wait
% Gets Percentage of total gets
Misses Number of times the latch was requested in willing-to-wait mode and the requestor had to wait
% Misses / Gets Misses as a percentage of gets
Sleeps Number of times a willing-to-wait latch request resulted in a session sleeping while waiting for the latch
% Sleeps Sleeps as a percentage of total sleeps
% Ttl Sleeps Percentage of total sleeps
Imm Gets Number of times a latch was requested in no-wait mode
Imm Misses Number of times a no-wait latch request did not succeed (that is, missed)
% Imm Misses / Imm Gets Percentage of immediate misses to immediate gets
Waits Holding Ltc Number of waits for the latch while the waiter was holding a different latch
Spin Gets Willing-to-wait latch requests that missed the first try but succeeded while spinning
% Sleeps / Gets Percentage of sleeps to gets
You can choose All Cache Buffers Chains to view all entries, not just the first 200.You can choose Hot Blocks to view the most frequently accessed blocks in the buffer cache.
● Latch Protected Stmts in Library CacheThis tab page shows statements in the library cache that are protected by a latch. The library cache latch serializes access to the objects in the library cache. Every time an SQL statement, a PL/SQL block, or a stored object (that is, procedures, packages, functions, or triggers) is executed this latch is acquired.○ On tab page SQL Stmts for Latches of Top-20 SQL Statements, you can see the latches from the top 20
SQL statements:
Column Description
Name Latch name
Inst ID
RAC only
Instance ID
54 PUBLICCCMS: Oracle
The DBA Cockpit

Column Description
User User ID
Executions Number of executions
% Executions Percentage of executions
Parse Calls Number of parse calls
% Parse Calls Percentage of parse calls
Parse Calls / Executions (%) Parse calls as a percentage of executions
○ On tab page SQL Stmts for Top Latch Protected SQL Stmts you can see the latches from the top protected SQL statements:
Column Description
Child latch Latch name
Inst ID
RAC only
Instance ID
Address Address of the latch object
Child latch Number of the child latch
Hash value Hash value of the SQL statement
User Name Name of the user connected to the database. For example, SAP applications connect as user SAPR3.
Executions Number of executions that took place on this object since it was brought into the library cache
Parse Calls Number of parse calls for this child cursor
Parse calls / Exe Number of parse calls for each execution
% Parse Calls Percentage of parse calls
CPU Time(ms) CPU time in milliseconds
CPU Time/Exe (ms) CPU time in milliseconds for each execution
% CPU Time Percentage of CPU time
Elapsed time Elapsed time in milliseconds
Elapsed time/Exe Elapsed time in milliseconds for each execution
CCMS: OracleThe DBA Cockpit PUBLIC 55

Column Description
% Elapsed Time Percentage of elapsed time
Disk Reads Number of disk reads for this child cursor
Disk reads/Exe Number of disk reads for each execution
% Disk Reads Percentage of disk reads
Buffer Gets Number of buffer gets for this child cursor
Buffer Gets/Exe Number of buffer gets for each execution
% Buffer Gets Percentage of buffer gets
Rows processed Number of rows the parsed SQL statement returns
Rows processed/Exe Number of rows processed for each execution
Module Name of the module that was executing at the time that the SQL statement was first parsed
SQL Stmt SQL statement for this child cursor
You can select a row and choose Execution Plan of SQL Statement to see the execution plan of the selected SQL statement.You can select a row and choose Call Point in ABAP Program to see the ABAP call point of the selected SQL statement
3.6.3.9 Active Session History
Definition
This sub-monitor in the SAP/Oracle Database Monitor lets you view the Oracle active session history views, which provide sampled session activity in the database instances.
Use
You choose Performance Wait Event Analysis Active Session History in the DBA Cockpit.
Before the system displays the data, you have to specify the data range in the area Preselect data pool:
● Data sourceSelect the view gv$active_session_history to display current data or view dba_active_session_history to display historical information.
56 PUBLICCCMS: Oracle
The DBA Cockpit

● From and ToSpecify a time frame for the data that has to be displayed.
Use the following functions in Preselect data pool to complete the selection values:
● Avail. timeframe gives you information about available data in the two views. This function offers the option to take over this time frame in the selection fields.
● Set to last hour fills the time-frame selection with data from the last hour.
Finally, choose Load data to read the selected data.
Structure
● ASH ListThis tab page displays the selected data in an ALV list, sorted by timestamp in descending order.
Column Description
Sample timestamp Time at which the sample was taken
Session ID Session ID
Sess State Session state
Event Name Event name
Sequence number of wait Sequence number to uniquely identify wait
First additional parameter First additional parameter
Parameter 2 Second additional parameter
Third additional parameter Third additional parameter
Wait time [mics] Total wait time in microseconds for the event for which the session last waited if the session was on the CPU when sampled
CCMS: OracleThe DBA Cockpit PUBLIC 57

Column Description
Time waited [mics] If the session state is waiting, this is the time in microseconds that the session actually spent waiting for the event. This column is set for waits that were in progress at the time the sample was taken.
NoteIf a wait event lasted for more than a second and was caught waiting in more than one session sample row, the actual time spent waiting for that wait event is populated in the last of those session sample rows. At any given time, this information is not available for the latest session sample.
Dictionary object number of the object Object ID of the object that the session is referencing
Object name Object name
File number File number
Block number ID of the block that the session is referencing
This information is only available if the session was waiting for cluster, concurrency, and user I/O wait events
SQL_ID SQL identifier of the SQL statement that the session was executing at the time of sampling
SQL String SQL string
SQL Child # SQL child ID
SQL statement hash SQL hash ID
Session serial number Session serial number
Oracle user identifier Oracle user ID
OPCODE Indicates what phase of operation the SQL statement was in
Service Hash Hash to identify service
Sess. Type Session type
Operating system Program name Name of the operating system program
Name of the currently executing module Name of the currently executing module
Currently executing action Name of the currently executing action
58 PUBLICCCMS: Oracle
The DBA Cockpit

Column Description
Client ID Client ID of the session
Blocking Session ID Session identifier of the blocking session
Populated only when the session was waiting for enqueues or a buffer busy wait.
Bl. Sess. St. Status of the blocking session
Blck Session Serial # Serial number of the blocking session
QC Session ID Query coordinator session ID
This information is only available if the sampled session is a parallel query slave.
QC Instance ID Query coordinator instance ID
This information is only available if the sampled session is a parallel query slave.
Sample ID ID of the sample
● ASH GraphicThis tab page displays the selected data in a time chart graphic. Here you have the option to change the graphics display interactively.○ In the upper area there are the following features:
Feature Description
Key fig. (y axis) Key figure used as the value for the y axis.
You can choose between the number of Active sessions or the Time waited.
Series type Characteristic represented by a line or series in the chart
You can choose between Wait event or Wait event Class.
Select Series Filter for the wait events or wait event classes displayed in the chart
TOP n Filter to restrict the display to the top n number of elements
Time interval Time interval of the timestamps for summation of values in the chart
If you choose the interval size millisec (sampled info) the values in the y axis are the unchanged values from the ASH views. All other options are “condensed”, which means that the values in the y axis are accumulated in intervals of, for example, 1 minute, 10 seconds, and so on.
Refresh chart Refreshes the display immediately to reflect any changes made to the parameters above
CCMS: OracleThe DBA Cockpit PUBLIC 59

Feature Description
Save chart to frontend file Saves the chart to a front-end file
You can choose a file type and a resolution in pixels.
Print graphic Prints the chart on your front-end printer
Graphic settings on / off Starts or ends a mode where you can change graphic settings
For example, you can change the chart type, the dimensions of the chart, colors, and textures.
Load settings from frontend
Save settings to frontend
Defines graphic settings in front-end files
You can use this to transport settings between different systems.
Load settings in database
Save settings in database
Delete settings in database
Prompts you for an ID
The ID is used to process the current graphic settings by:
○ Loading the settings from the database○ Saving the settings in the database○ Deleting the settings from the database
You can use this to share the same settings with other users.
○ You have two more navigation functions that are not indicated explicitly on the interface:○ Change the display from Wait event classes to all Wait events for a class
Click on a wait event class in the chart's legend section (at the bottom of the screen) to display changes to all wait events belonging to the selected wait event class.
○ Detail information for a single pointClick on a point in the chart (line or bar) to see more detailed information:○ Tab Wait events
Shows history data from the active session○ Tab File request
Shows file statistics information, which refers to the selected point. This means that the displayed files were accessed by sessions that met the wait event (or wait event class) within the time interval of the selected point.Note that the values of the key figures are based on the current system status, not on the selected time frame.Double-click a line to show accessed blocks for this file with timestamp.
○ Tab SQL statementContains SQL statistics for statements referred to by the selected point. This means that the listed statements were processed by sessions that met the wait event (or wait event class) within the time interval of the selected point.Note that the values of the key figures are based on the current system status and not on the selected time frame.Double-click a line to show the timestamp of the sampled information. Choose Explain plan to display an Execution Plan for the selected SQL statement.
60 PUBLICCCMS: Oracle
The DBA Cockpit

3.6.3.10 Workload Reporting
Definition
This sub-monitor in the SAP/Oracle Database Monitor lets you display very detailed reports from Oracle's Active Workload Repository.
For more information, see SAP Note 1028068 . You can see the default values for workload reporting in SAP Note 1485598 .
Use
You choose Performance Wait Event Analysis Workload Reporting in the DBA Cockpit.
Choose one of the following to get the report you require:
● AWR report (text)Workload report with text output
● AWR report (web)Workload report with web page display
● AWR DIFF report (text)Workload compare period report (difference report) with text output
● AWR DIFF report (web)Workload Compare period report (difference report) with web page display
● SQL report (text)Workload SQL report with text output
● SQL report (web)Workload SQL report with web page display
● ASH report (text)Active session history report with text output
● ASH report (web)Active session history report with web page display
● ADDM report (text)Automatic database diagnostic monitor (ADDM), only available as text output
NoteFor more information about the reports, see the Oracle documentation about the Active Workload Repository.
You need to enter the following parameters for the report:
● Begin Snapshot and End Snapshot for all reports● Begin Snapsh. 2 and End Snapshat 2 for compare period reports only● SQL ID for SQL reports● AvgBlReadT, “average block read time”, in milliseconds for the ADDM report.
This is the average time to read a single database block. This value is used in the ADDM report for parameter DBIO_EXPECTED.
CCMS: OracleThe DBA Cockpit PUBLIC 61

For more information about this parameter, see the Oracle documentation. Oracle uses a default value of 10 milliseconds. The current monitor proposes gv$system_event-time_waited_mico / gv_system_event-total_waits for event db_file_sequential_read.
Structure
The monitor displays reports according to the format you selected:
● TextThe display uses an editor with search and download functions.
● WebThe HTML display uses a browser area with navigation functions and right-click functions similar to a normal web browser.
3.6.3.11 IO Redo Logs per Hour
Definition
This sub-monitor in the SAP/Oracle Database Monitor lets you display the number of IO redo log switches. For more information, see SAP note 1704439 .
You choose Performance Wait Event Analysis IO Redo Log Per Hour
You can change the minimum and maximum time between log switches if required.
Structure
The number of IO redo log switches is displayed per hour by date, weekday, and time of day between the minimum and maximum time in seconds.
3.6.4 SQL Statement Analysis
Use
These sub-monitors in the SAP/Oracle Database Monitor help you analyze SQL statements.
62 PUBLICCCMS: Oracle
The DBA Cockpit

3.6.4.1 Shared Cursor Cache
Definition
This function in the DBA Cockpit lets you check the shared cursor cache and related resource information. In addition, you can see an execution plan and the SQL statement. If the SQL statement is part of an ABAP program you can display the ABAP Source.
Use
You choose Performance SQL Statement Analysis Shared Cursor Cache in the DBA Cockpit and specify the filter and sort criteria.
You can choose the following:
● Explain to display the execution plan● ABAP source to show the source code of the ABAP program● Table selection to restrict the display to SQL statements that use the specified table● Reset Point to reset all fields in the result list for each SQL statement to null. This means that you set a start
point● Since Reset to display the results since the start point
You can also double-click a row to display a detail screen with the complete SQL statement. From the detail screen you can choose Explain to display the execution plan.
Structure
This screen contains the following information:
Column Description
Executions Total number of executions
Disk Reads Number of disk reads
Reads/Exec Number of disk reads per execution
Buffer Gets Number of buffer gets
999999999999 means overflow
Bgets/Exec. Number of processed rows
Proc. Rows Processed rows for execution
CCMS: OracleThe DBA Cockpit PUBLIC 63

Column Description
Rproc/Exec Number of buffer gets per row
Elapsed time Elapsed time in microseconds
Elapsed Time/Exec Elapsed time per execution
SQL Statement SQL statement
CPU Time CPU time in microseconds
CPU Time/Exec CPU time per execution
Wait Time Wait time in microseconds
Wait Time/Exec Wait time per execution
SQL Sort Sort orders for statement
Direct Writes Direct writes
Open curs. Number of open cursor versions
Users Number of users of cursor version
Versions Number of loaded cursor versions
Share mem Total shareable memory
Pers. mem. Persistent memory
Runtime mem. Total runtime memory
Number of "invalidations" Number of invalidations
Loads Number of loads or reloads
Parse call Number of parse calls
Program Name Name of calling program
User User
Curs.Ex Number of users executing this cursor
Inst. ID Instance ID
First Load time First cursor load time
Last load time Last cursor load time
Last active time Last active time of query plan
64 PUBLICCCMS: Oracle
The DBA Cockpit

Column Description
Application wait time Application wait time in milliseconds
Concurrency wait time Concurrency wait time in milliseconds
Cluster wait time Cluster wait time in milliseconds
User I/O wait time User I/O wait time in milliseconds
3.6.4.2 Table Access
Definition
This sub-monitor in the SAP/Oracle Database Monitor lets you view the shared cursor cache from the viewpoint of the tables accessed. This helps you to identify performance problems for a table rather than for a statement, such as a missing index on a table.
Use
You choose Performance SQL Statement Analysis Table Access in the DBA Cockpit.
Structure
NoteEntries marked “RAC specific” are only relevant for Oracle Real Application Cluster (RAC). In a non-RAC database, the values in these columns are zero.
● Summary on Table LevelThis screen displays the following information:
Column Description
Instance ID
RAC only
Instance ID
Owner Table owner
CCMS: OracleThe DBA Cockpit PUBLIC 65

Column Description
Table Table name
Size (kB) Table size in kilobytes
Type Type of object (v$object dependency)
Buffer pool Default buffer pool of the object
Executions Total number of executions of all statements accessing this table
Cache Hit Ratio Cache hits calculated with the following formula:
100 x (1- (sum of disk reads / sum of buffer gets))
Disk Reads Total number of disk reads executed on this table
Disk Read Ratio Sum of (disk reads / physical reads)
Buffer Gets Total number of buffer gets for the table
Logical Read Ratio Sum of buffer gets / (sum of buffer gets + sum of disk reads)
Rows Proc. Total number of rows returned or accessed by the statements on this table
Rows/Exec Number of rows processed / number of executions
Bufgets/Record Number of buffer gets / number of rows processed
Sorts Total number of sorts done by the statements on this table
CPU Time (ms) Total CPU time in milliseconds used by all statements on this table for parsing, executing, or fetching.
Users Opening Total number of users executing the statement
Opening Version Total number of statements related to this table having the child cursor locked
Loaded Version Total number of statements related to this table having the context heap locked
# Childs Maximum number of the child cursor
Sharable Mem. Total amount of shared memory used by the statement in bytes
66 PUBLICCCMS: Oracle
The DBA Cockpit

Persistent Mem. Sum of the fixed amount of memory used for the lifetime of this statement in bytes
Runtime Mem. Sum of the fixed amount of memory required during the execution of this statement in bytes
# Invalidations Total number of times any cursor has been invalidated
Parse Calls Total number of parse calls for all the statements
ITL Waits Number of Interested Transaction List (ITL) waits for this table
Buffer Busy Waits Number of buffer busy waits for this table
DB Block Changes Number of database blocks changed for this table
Global Cache CR Blocks Served
RAC specific
Number of global cache CR blocks served for this table
Global Cache Current Blocks Served
RAC specific
Number of global cache current blocks served for this table
Logical Reads Number of logical reads for this table
Physical Reads Number of physical reads for this table
Physical Reads Direct Number of direct physical reads for this table
Physical Writes Number of physical writes for this table
Physical Writes Direct Number of direct physical writes for this table
Row Lock Waits Number of row lock waits for this table
● Detail of Operations for <Table Name>You can double-click a row on the screen Summary on Table Level to see the details of operations for a table. The only differences from the previous screen are:○ The column Operation is new.○ The column Table no longer appears.
● Details of Statements for <SQL Statement>You can double-click a row on the screen Detail of Operations for <Table Name> to display the detail screen with the complete SQL statement in the final column.From this screen you can select a row and choose:○ Execution Plan of SQL statement to display the execution plan○ Call Point in ABAP Program to display the ABAP coding, positioned at the calling point of the parsed
statement
CCMS: OracleThe DBA Cockpit PUBLIC 67

3.6.4.3 Column Usage
Definition
This sub-monitor in the SAP/Oracle Database Monitor lets you check the contents of the system table SYS.COL_USAGE$. The table SYS.COL_USAGE$ lets you monitor the usage of predicates on columns (equal, like, and so on) in select statements. If _column_tracking_level is set to 1, smon updates the table at intervals, so it is not always up-to-date.
Use
You choose Performance SQL Statement Analysis Column Usage in the DBA Cockpit.
After calling this sub-monitor, you can specify selection parameters:
● Owner name● Table name● Column name
Choose Select to start the query. You can use Reset Selection to clear the selection fields for a different query.
Structure
The result set is a table:
Column Description
Owner Table owner
Table name Table name
Column name Column name
Equ. Pred Number of equal predicats
Equal Join Number of equal joins
NonEquJoin Number of non-equal joins
Range Pred Number of range predicats
Like Pred Number of like predicats
NULL Pred Number of null predicats
68 PUBLICCCMS: Oracle
The DBA Cockpit

Column Description
Date Date of analysis
Integration
Before you can use this sub-monitor, you must create the following synonyms:
● sap_syscol for the database object SYS.COL$● sap_sysobj for the database object SYS.OBJ$● sap_sysusage for the database object SYS.COL_USAGE$● sap_sysuser for the database object SYS.USER$
See also SAP Note 706927 , which has an attached script to create all objects required to run the database monitor.
3.6.4.4 System Statistics for the CBO
Definition
This sub-monitor in the SAP/Oracle Database Monitor provides an overview of I/O and CPU statistics for the Cost-Based Optimizer (CBO). This allows the optimizer to generate relevant costs for system-resource plans. For each plan, the CBO optimizer computes estimates for I/O and CPU costs. For more information, see SAP Note 1159158 .
The collected statistics are:
● Single block read time in ms● Multi-block read time in ms● CPU speed in MHz● Average multi-block_read_count in number of blocks
The system statistics must be collected when the system has an average workload.
The statistics are gathered with the PL/SQL DBMS_STATS package:
● DBMS_STATS.CREATE_STAT_TABLE - create a user table to collect the statistics● DBMS_STATS.GATHER_SYSTEM_STATS - collect statistics for a special time frame● DBMS_STATS.IMPORT_SYSTEM_STATS - transfer the data from the user table to the dictionary tables● DBMS_STATS.DELETE_SYSTEM_STATS - delete any existing system statistics from the dictionary
Use
You choose Performance SQL Statement Analysis System Statistics for CBO in the DBA Cockpit.
CCMS: OracleThe DBA Cockpit PUBLIC 69

The sub-monitor only displays information if one of the following is true:
● System statistics are collected for the system● System statistics are activated by import into SYS.AUXSTAT$
Structure
● DDIC StatsThe displayed data is the result of the following SQL query:select table_name, last_analyzed from dba_tableswhere owner = 'SYS'order by LAST_ANALYZED asc
● Fixed object statsThe monitor displays for which "fixed objects" a statistic exists. "Fixed Objects" are, for example, the performance views. The displayed data is the result of the following SQL query:select table_name, last_analyzed from dba_tab_statisticswhere owner = 'SYS' and table_name LIKE 'X$%'order by last_analyzed asc
● System StatisticsThis uses the evaluation with DBMS_STATS.GET_SYSTEM_STATS to display system statistics that currently exist.
● Saved StatisticsThis displays data that was created using the procedure DBMS_STATS.CREATE_STAT_TABLE for tables.
● Locked/Missing Table StatisticsThis lists tables that have locked statistics or tables for which the IGNORE indicator is set in the table DBSTATC. In addition, you can recognize tables that have missing statistics.For information about the SQL query used, see SAP Note 1159158 .
3.6.4.5 Oracle Tuning Advisor
Definition
For more information on how to enable the Oracle tuning advisor, see SAP Note 1136582 . You must have purchased the Oracle Tuning Pack to use this functionality.
3.6.5 Statistical Information
Use
These sub-monitors in the SAP/Oracle Database Monitor show statistical information.
70 PUBLICCCMS: Oracle
The DBA Cockpit

3.6.5.1 SGA Monitor
Definition
This sub-monitor in the SAP/Oracle Database Monitor lets you monitor the System Global Area (SGA).
Use
You choose Performance Statistical Information SGA Monitor in the DBA Cockpit.
Structure
NoteEntries marked “RAC only” are only relevant for Oracle Real Application Cluster (RAC).
● SGAThis screen provides basic information about the SGA components.The Oracle views GV$SGA and GV$SGA_DYNAMIC_FREE_MEMORY supplies the information displayed.If there are multiple instances, total rows are displayed.
Column Description
Comp .grp. SGA component group
Inst Id
RAC only
Instance ID
Instance Name
RAC only
Instance name
Mem. size Memory size in bytes
● SGA (detail)This tab page provides detailed information about the SGA components.The Oracle view GV$SGASTAT supplies the information displayed.
Column Description
Pool Pool in which the memory of this SGA component name resides
CCMS: OracleThe DBA Cockpit PUBLIC 71

Column Description
SGA component name SGA component name
Inst Id
RAC only
Instance ID
Instance Name
RAC only
Instance name
Mem. size Memory size in bytes
● Curr. SGA resize op.This tab page provides information about current resize operations on the SGA.The Oracle view GV$SGA_CURRENT_RESIZE_OPS supplies the information displayed.○ Full
This view groups the information by component and shows totals for all instances.
Column Description
Component name SGA component name
Inst ...
RAC only
Instance ID
Instance Name
RAC only
Instance name
Op. type Type of operation, grow or shrink
Op. mode Mode of operation, manual or automatic
Parameter for the resize op. Parameter used in the resize operation
Parameter value at the start Parameter value at the start of the operation
Desired param. value Desired parameter value after the resize
Curr. value Current value of the parameter
Start time of the operation Start time of the operation
Start date Start date of the operation
Upd. time Last time progress was made for the operation
Upd. date Last date progress was made for the operation
○ Sort by ComponentThis tab page sorts the information by component. There are no instance totals.
72 PUBLICCCMS: Oracle
The DBA Cockpit

This tab page displays the same information as the table above.
● Dyn. SGA ComponentsThis tab page displays information about dynamic SGA components. It summarizes information from all completed SGA resize operations since instance startup. All sizes are in bytes.The Oracle view GV$SGA_DYNAMIC_COMPONENTS supplies the information displayed.○ Full
This view groups the information by component and shows totals for all instances.
Column Description
Component SGA component name
Inst ...
RAC only
Instance ID
Instance Name
RAC only
Instance name
Curr. value Current size of the component
Min. size Minimum size of the component since instance startup
Max. size Maximum size of the component since instance startup
Operations Number of operations since instance startup
Last op. Last completed operation for the component
Last mode Mode of last completed operation for the component
Start time Start time of the last completed operation for the component
Op. Date Start date of the last completed operation for the component
Granul. Granularity of the last completed operation for the component
○ Sort by ComponentThis tab page sorts the information by component. There are no instance totals.This tab page displays the same information as the table above.
● Comp. SGA Resize op.This tab page displays information about the last 100 completed SGA resize operations (excluding in-progress operations). All sizes are in bytes.The Oracle view GV$SGA_RESIZE_OPS supplies the information displayed.○ Full
This view groups the information by component and shows totals for all instances.
CCMS: OracleThe DBA Cockpit PUBLIC 73

Column Description
Component name SGA component name
Inst ...
RAC only
Instance ID
Instance Name
RAC only
Instance name
Op. type Type of operation, grow or shrink
Op. mode Mode of operation, manual or automatic
Parameter for the resize op. Parameter used in the resize operation
Parameter value at the start Parameter value at the start of the operation
Desired param. value Desired parameter value after the resize
Real. value after resize Real parameter value after the resize
Status Completion status of the operation: normal, cancel, or error
Start Time Start time of the operation
End Time End time of the operation
○ Sort by ComponentThis tab page sorts the information by component. There are no instance totals.This tab page displays the same information as the table above.
● Cache Advisory stat.This tab page displays information to predict the number of physical reads for the cache size corresponding to each row.The Oracle view GV$DB_CACHE_ADVICE supplies the information displayed.○ Full
This tab page groups the information by component and shows totals for all instances. It only shows size factor one.
Column Description
Pool ID Buffer pool identifier
Pool name Buffer pool name
Inst ...
RAC only
Instance ID
74 PUBLICCCMS: Oracle
The DBA Cockpit

Column Description
Instance Name
RAC only
Instance name
Block Size Block size in bytes for buffers in this pool
Status Status of the advisory:
○ ON - currently running○ OFF - disabled
Cache (MB) Cache size for prediction in MB
SizeFactor Physical read factor for this cache size
This is the ratio of the number of estimated physical reads to the number of reads in the real cache.
CacheSize Cache size for prediction in buffers
Phys.R. F. Physical read factor.
This is the ratio of the number of estimated physical reads to the number of reads in the real cache.
PhysReads Estimated number of physical reads for this cache size
○ Size for estimationThis tab page displays the same information as the table above for all size factors.
● Shared pool adviceThis tab page displays information to predict the number of physical reads for the cache size corresponding to each row.The Oracle view GV$SHARED_POOL_ADVICE supplies the information displayed.○ Full
This tab page groups the information by component and shows totals for all instances. It only shows size factor one.
Column Description
InstID...
RAC only
Instance ID
Instance Name
RAC only
Instance name
Size (MB) Shared pool size for estimate
Sizefactor Size factor with respect to the current shared pool size
CCMS: OracleThe DBA Cockpit PUBLIC 75

Column Description
lib. cache Estimated memory in use by the library cache
Mem. Obj. Number of library cache memory objects
Parse time Estimated elapsed parse time saved (in seconds) because library cache memory objects are found in a shared pool of the specified size
ParseFact Estimated parse time saved factor with respect to the current shared pool size
CacheHits Estimated number of times a library cache memory object was found in a shared pool of the specified size
○ Size for estimationThis tab page displays the same information as the table above for all size factors.
● Buffer pool statisticThe tab page displays information about all buffer pools available for the instance. The “sets” are the LRU latch sets.The Oracle view GV$BUFFER_POOL_STATISTICS supplies the information displayed.
Column Description
Inst ...
RAC only
Instance ID
Instance Name
RAC only
Instance name
Pool ID Buffer pool identifier
Name Buffer pool name
Block Size Block size in bytes
Set MSi... Buffer Pool Maximum Set Size
Repl.Lst Number of buffers on replacement list
WriteList Number of buffers on write list
B.In Set Number of buffers in set
Got By Set Number of buffers gotten by the set
Written Number of buffers written by the set
76 PUBLICCCMS: Oracle
The DBA Cockpit

Column Description
Scanned Number of buffers scanned in the set
Free wait Free buffer wait statistic
WriteCompl Write complete wait statistic
BusyWait Buffer busy wait statistic
FreeInsp. Free buffer inspected statistic
DirtyBuff. Dirty buffers inspected statistic
BlkChange Database blocks changed statistic
BlkGets Database blocks gotten statistic
Cons.Gets Consistent gets statistic
PhysReads Physical reads statistic
PhysWrites Physical writes statistic
3.6.5.2 PGA Monitor
Definition
This sub-monitor in the SAP/Oracle Database Monitor lets you monitor the Program Global Area (PGA).
Use
You choose Performance Statistical Information PGA Monitor in the DBA Cockpit.
Structure
NoteEntries marked RAC only are only relevant for Oracle Real Application Cluster (RAC).
● Status○ PGA Status
CCMS: OracleThe DBA Cockpit PUBLIC 77

This tab page shows the following information about the PGA configuration based on the view GV$PGASTAT:
Column Description
Name Name of the statistic
Inst Id
RAC only
Instance ID
Inst Name
RAC only
Instance name
Statistic value Statistic value
Unit Statistic unit, such as bytes.
○ SQL Workarea○ View SQL WORKAREA
This tab page shows the following information about the PGA configuration based on the view GV$SQL_WORKAREA:
Column Description
Inst Id
RAC only
Instance ID
Inst Name
RAC only
Instance name
Workarea Address Address of the parent cursor handle
Parent address Address of the work area handle. This is the "primary key" for the view.
Hash Value Hash value of the parent statement in the library cache
Chil...
- Number of this child cursor
Number of the child cursor that uses this work area
Operation Type Type of operation using the work area ( SORT, HASH JOIN, GROUP BY, BUFFERING, BITMAP MERGE, or BITMAP CREATE)
78 PUBLICCCMS: Oracle
The DBA Cockpit

Column Description
Oper. ...
- Operation ID
Unique number used to identify the operation in the execution plan
Sizi
- Sizing
Sizing policy for this work area ( MANUAL or AUTO)
EstOptSiz
- Estimated Optimal Size
Estimated size (in KB) required by this work area to execute the operation completely in memory (optimal execution).
Est 1pSiz
- Estimated Onepass Size
Estimated size in KB required by this work area to execute the operation in a single pass
Last Mem
- Memory Used for Last Execution
Memory in KB used by this work area during the last execution of the cursor
Last Exec
- Last Execution
Indicates whether this work area runs using OPTIMAL, ONE PASS, or ONE PASS memory requirement (or MULTI-PASS), during the last execution of the cursor
Last De...
- Degree of parallelism of last exec
Degree of parallelism used during the last execution of this operation
Tot. Execs
- Total Executions
Number of times this work area was active
Opt. Execs
- Optimal Executions
Number of times this work area ran in optimal mode
Onepass
- Onepass Executions
Number of times this work area ran in one-pass mode
Multipa...
- Multipasses Executions
Number of times this work area ran below the one-pass memory requirement
Act. Time
- Average Active Time
Average time this work area is active in hundredths of a second
Max Tseg...
- Maximum Temporary Segment Size
Maximum temporary segment size in bytes created by an instantiation of this work area. This column is null if this work area has never spilled to disk.
CCMS: OracleThe DBA Cockpit PUBLIC 79

Column Description
Last Tseg
- Last Temporary Segment Size
Temporary segment size in bytes created in the last instantiation of this work area. This column is null if the last instantiation of this work area did not spill to disk.
○ Top 10 mem. cache conThis tab page shows the top 10 consumers of memory cache, based on the view GV$SQL_WORKAREA. The information shown is the same as in the table above.
○ One-multipass workareaThis tab page shows the work areas, the SQL text, the number of executions in the different modes, and the percentage of the total number of executions. The information shown is based on the views GV$SQL and GV$SQL_WORKAREA:
Column Description
SQL Text First thousand characters of the SQL text for the current cursor
Optimal ...
- Optimal Executions
Number of times this work area ran in optimal mode
Optimal Pe
- Optimal Percentage
Optimal Executions as a percentage of Total Executions
Onepass ...
- Onepass Executions
Number of times this work area ran in one-pass mode
Onepass Pe
- Onepass Percent
Onepass Executions as a percentage of Total Executions
Multipass ...
- Multipasses Executions
Number of times this work area ran below the one-pass memory requirement
Multipass ...
- Multipasses Percent
Multipasses Executions as a percentage of Total Executions
Total Exec
- Total Executions
Number of times this work area was active
○ SQL Workarea Histogram○ Histogram
80 PUBLICCCMS: Oracle
The DBA Cockpit

This tab page shows how many work areas were executed in optimal, one-pass, or multi-pass mode. The information shown is based on the view GV$SQL_WORKAREA_HISTOGRAM:
Column Description
Inst Id
RAC only
Instance ID
Inst Name
RAC only
Instance name
Low bound Lower bound for the optimal memory requirement of work areas included in this row (bytes)
High Bound Higher bound for the optimal memory requirement of work areas included in this row (bytes)
Opt. Execs
- Optimal Executions
Number of times this work area ran in optimal mode
Onepass
- Onepass Executions
Number of times this work area ran in one-pass mode
Multipa -
Multipass Executions
Number of times this work area ran below the one-pass memory requirement
Tot. Execs
- Total Executions
Number of times this work area was active
○ Percent optimalThis tab page shows how many work areas were executed in optimal, one-pass, or multi-pass mode and the percentage. The information shown is based on the view GV$SQL_WORKAREA_HISTOGRAM:
Column Description
Inst Id
RAC only
Instance ID
Inst Name
RAC only
Instance name
CCMS: OracleThe DBA Cockpit PUBLIC 81

Column Description
Optimal
- Optimal Executions
Number of work areas with an optimal memory requirement between LOW_OPTIMAL_SIZE and HIGH_OPTIMAL_SIZE that have been executed in optimal mode since instance startup
Optimal Pe
- Optimal Percent
Optimal Executions as a percentage of Total Executions
Onepass ...
- Onepass Executions
Number of work areas with an optimal memory requirement between LOW_OPTIMAL_SIZE and HIGH_OPTIMAL_SIZE that have been executed in one-pass mode since instance startup
Onepass Pe
- Onepass Percent
Onepass Executions as a percentage of Total Executions
Multipas ...
- Multipasses Executions
Number of work areas with an optimal memory requirement between LOW_OPTIMAL_SIZE and HIGH_OPTIMAL_SIZE that have been executed in multi-pass mode since instance startup
Multipas ...
- Multipasses Percent
Multipasses Executions as a percentage of Total Executions
Total Exec
- Total Executions
Number of times this work area was active
○ Workarea ExecutionsThis tab page shows how often work areas were executed in different modes. The information shown is based on the view GV$SYSSTAT.
Column Description
Inst Id
RAC only
Instance ID
Inst Name
RAC only
Instance name
Name Statistic name
Value Statistic value
% Percentage of executions for each statistic name
82 PUBLICCCMS: Oracle
The DBA Cockpit

● Snapshot○ Current Operations
This tab page shows currently active operations. The information shown is based on the view GV$SQL_WORKAREA_ACTIVE.
Column Description
Inst Id
RAC only
Instance ID
Inst Name
RAC only
Instance name
SID Session identifier
Oper. Type Type of operation using the work area (sort, hash join, group by, buffering, bitmap merge, or bitmap create)
Exp. Size
- Expected workarea size
Expected size in KB for the work area
Act. Used
- PGA Memory Currently
Amount of PGA memory in KB currently allocated for this work area
Max Mem
- Maximum memory used
Maximum amount of memory used by this work area
Passes
- Number of Passes
Number of passes for this work area
TmpSeg ...
- Temporary Segment Size
Size in bytes of the temporary segment used for this work area.
SQL Text Text of SQL statement
○ PGA Memory UsageThis tab page shows currently active operations. The information shown is based on the view GV$PROCESS.
Column Description
OS Program Name Operating system program name
Inst Id
RAC only
Instance ID
CCMS: OracleThe DBA Cockpit PUBLIC 83

Column Description
Inst Name
RAC only
Instance name
PGA Memory PGA memory currently used by the process
PGA Memory PGA memory currently allocated by the process
Max PGA Memory Maximum PGA memory allocated by the process
Process St. Process status
SQL Text Text of SQL statement
● PGA Advice○ Target Advice Size
This tab page predicts how the cache hit percentage and over allocation count statistics displayed by the V$PGASTAT performance view would be impacted if the value of the PGA_AGGREGATE_TARGET parameter is changed. The prediction is performed for various values of the PGA_AGGREGATE_TARGET parameter, selected around its current value. The advice statistic is generated by simulating the past workload run by the instance.The information shown is based on the view V$PGA_TARGET_ADVICE.
Column Description
Inst Id
RAC only
Instance ID
Inst Name
RAC only
Instance name
TARGET (MB) Operating system program name
Val
- Estimated value of the cache hit percent
Value of PGA_AGGREGATE_TARGET for this prediction (in bytes)
Overall.Cn.
- Overalloc. count
Estimated number of PGA memory over-allocations if the value of PGA_AGGREGATE_TARGET is set to PGA_TARGET_FOR_ESTIMATE.
○ Advice Histogram
84 PUBLICCCMS: Oracle
The DBA Cockpit

Column Description
Inst Id
RAC only
Instance ID
Inst Name
RAC only
Instance name
PGA_TARGET PGA_TARGET_FACTOR, equal to PGA_TARGET_FOR_ESTIMATE divided by current value of PGA_AGGREGATE_TARGET.
LOW KB Lower boundary for the optimal memory requirement of work areas included in this row, in bytes
HIGH_KB Upper boundary for the optimal memory requirement of work areas included in this row, in bytes
Optimal Ex
- Optimal Executions
Number of work areas with an optimal memory requirement between LOW KB and HIGH_KB, which are predicted to run optimally when PGA_AGGREGATE_TARGET = PGA_TARGET_FOR_ESTIMATE.
Onepass Ex
- Onepass Executions
Number of work areas with an optimal memory requirement between LOWKB and HIGH_KB, which are predicted to run one-pass when PGA_AGGREGATE_TARGET = PGA_TARGET_FOR_ESTIMATE.
Multipasse
- Multipasses Executions
Number of work areas with an optimal memory requirement between LOWKB and HIGH_KB, which are predicted to run multi-pass when PGA_AGGREGATE_TARGET = PGA_TARGET_FOR_ESTIMATE.
3.6.5.3 Undo Statistics
Definition
This sub-monitor in the SAP/Oracle Database Monitor lets you check the undo statistics provided by the Oracle view GV$UNDOSTAT. You can see:
● Daily summaries● Undo statistics: daily and average values
CCMS: OracleThe DBA Cockpit PUBLIC 85

● Maximum space consumption for undo tablespaces
Use
You choose Performance Statistical Information Undo Statistics and the required tab page Daily Summaries, Undo statistics, or Max space consumption.
Structure
NoteEntries marked “RAC only” appear only for Oracle Real Application Cluster (RAC)
● Daily SummariesThis tab page displays daily summaries of undo statistics:
Column Description
Instance Id
RAC only
Database instance ID
begin date Begin date for the analysis
begin time Begin time for the analysis
end date End date for the analysis
end time End time for the analysis
last active undo tablespace Last active undo tablespace.
If more than one undo tablespace was active in the analysis period, the active undo tablespace that was active at the end of the period is reported.
total number of undo blocks Total number of undo blocks
You can use this column to obtain the consumption rate of undo blocks, and thereby estimate the size of the undo tablespace needed to handle the workload on your system.
total number of transactions Total number of transactions
86 PUBLICCCMS: Oracle
The DBA Cockpit

Column Description
length of the longest query (sec) Length of the longest query in seconds
You can use this statistic to estimate the proper setting of the UNDO_RETENTION initialization parameter.
highest Nbr. of TAs executed Concurrently Highest number of transactions executed concurrently
attempts to obtain undo space Number of attempts to obtain undo space by stealing unexpired extents from other transactions
unexpired undo blocks removed Number of unexpired undo blocks removed so they can be used by other transactions
unexpired undo blocks reused Number of unexpired undo blocks reused by other transactions
attempts to steal expired undo blocks Number of attempts to steal expired undo blocks from other undo segments
expired undo blocks stolen from segments Number of expired undo blocks stolen from other undo segments
expired undo blocks reused Number of expired undo blocks reused within the same undo segments
number of occurrences of ORA-01555 Number of occurrences of ORA-01555
You can use this statistic to decide whether or not the UNDO_RETENTION initialization parameter is set properly in view of the size of the undo tablespace. You can reduce the occurrence of this error by increasing the value of UNDO_RETENTION.
nbr of times space was requested Number of times space was requested in the undo tablespace and there was no free space available. That is, all of the space in the undo tablespace was in use by active transactions. You can correct this by adding more space to the undo tablespace.
number of transactions per second Number of transactions per second
NoteEach row in the table shows information for a 10-minute period, as shown by the difference between Begin Time and End Time. The information is derived from the view GV$UNDOSTAT, which also holds information in this way.
You can see information from the previous 7 days, since there are 1008 rows in the view GV$UNDOSTAT.
CCMS: OracleThe DBA Cockpit PUBLIC 87

● Undo statisticsThis tab page displays the same information as above, with individual tab pages for each day.There is also a Daily statistics tab page showing the statistics - maximum, minimum, average, and total - for each day.
NoteRAC only
The tab page Undo statistics does not appear when you choose DB instances Total to show the total of all RAC instances.
● Max Space ConsumptionThis tab page displays maximum space consumption for undo tablespaces:
Column Description
Instance Id
RAC only
Database instance ID
undo tablespace name Name of the undo tablespace for which the maximum space consumption has been computed
total undo tablespace size in MB Total size of the undo tablespace in MB
max. used undospace in MB Maximum used undo space in MB
max. used in % Used undo space as a percentage of the maximum
3.6.5.4 Performance Database
Definition
This sub-monitor in the SAP/Oracle Database Monitor gives you an overview of the load and performance of the Oracle instance.
Use
You choose Performance Statistical Information Performance Database in the DBA Cockpit.
You can use this sub-monitor to see if:
● The database load has changed recently● The database instance has load peaks● One database instance is more heavily loaded than other instances - useful with Oracle Real Application
Cluster (RAC)
88 PUBLICCCMS: Oracle
The DBA Cockpit

Structure
The following structure applies to the tabs Overview, Intervals, Peak 10-12, Peak 14-16:
Column Description
Weekday Day of the week for the snapshot
Date Date of the snapshot
Time Time of the snapshot
User Calls Number of user calls such as login, parse, fetch, or execute
Recursive Calls Internal SQL statement or SQL statement in PL/SQL statement
User / Recursive Calls Ratio of user to recursive Calls
User Commits Number of commits and rollbacks
Parses Total number of parse calls (hard and soft). A soft parse is a check on an object already in the shared pool, to verify that the permissions on the underlying object have not changed.
Reads / User Call Amount of logical reads per user call. Should be less than 20.
Logical Reads Sum of "db block gets" and "consistent gets"
Physical Reads Number of physical reads
Physical Reads Direct Number of reads directly from disk, bypassing the buffer cache
Physical Reads Direct (LOB) Number of LOB reads directly from disk, bypassing the buffer cache
Buffer Quality Percentage of how many db blocks are found in the db cache and haven't to read from disk.
Physical Writes Number of physical reads
Table Fetch by RowID Number of rows accessed by RowID, including all rows accessed using indexes
Table Fetch Continued Row Number of times when second row piece of chained rows is fetched. A high number indicates that rows are chained.
Table Scans Rows Gotten Number of rows accessed by all full table scans. This is not the same as the number of rows returned because only qualifying rows are returned.
CCMS: OracleThe DBA Cockpit PUBLIC 89

Column Description
Table Scans Blocks Gotten Number of blocks accessed by all full table scans
Redo Blocks Written Total number of redo blocks written
Redo Write Time (ms) Total redo write time since database start in milliseconds
Avg. Redo Write time (msec) Average time the LGWR needs to write the redo log information from buffer to disk in milliseconds
Buffer Busy Waits Number of times block access failed because another process held the block in incompatible mode. If this statistic is over 10% of logical reads then use V$WAITSTAT to check contention.
Buffer Busy Waits Time (sec) Total buffer busy wait time since database start in seconds
Avg. Buffer Busy Waits Time (msec) Average time a session has to wait for the event buffer busy waits in milliseconds
Full Table Scans Sum of full table scans for long and short tables:
● Short table scans are against tables with 4 or less database blocks.
● Long table scans are against tables with 5 or more database blocks.
Note the following about the tabs:
● All tabs include load and performance data for the days where snapshot information is available.● The Overview tab displays the data accumulated since database start on a daily basis.● The Intervals tab displays the data for each day.
NoteTo see the load and performance data for every snapshot on a certain day, double-click the desired day in the Overview or Intervals tab.
● The tabs Peak 10 - 12 and Peak 14 - 16 show the load and performance data at the peak times of 10:00 to 12:00 and 14:00 to 16:00. You cannot double-click here.
3.6.5.5 System Metrics
Definition
This monitor in the SAP/Oracle Database Monitor gives you metrics on the Oracle database system with data derived from the GV$SYSMETRIC_HISTORY or DBA_HIST_SYSMETRIC_HISTORY view.
For more information about the licensing of the diagnostic pack, see SAP Notes 1028068 and 1250596 .
90 PUBLICCCMS: Oracle
The DBA Cockpit

Use
You choose Performance Statistical Information System Metrics in the DBA Cockpit.
NoteThe default display when you start the monitor is from GV$SYSMETRIC_HISTORY with a timeframe of the last hour.
You can set the following fields in the Selection box:
● Metrics datasourceUse this to display data from the GV$-VIEW or the DBA View.
● Avail. TimeframeUse this to set the timeframe for the displayed data, either with use GV$-VIEW or use DBA view. In each case, the monitor uses the maximum available timeframe, as shown in the From and TO fields.
● Set to last HourUse this to set the timeframe for the displayed data to the last hour, as shown in the From and TO fields.
You choose Load Data to refresh the data in the table.
Structure
● System Metrics
Column Description
Snapshot ID Unique snapshot ID
Database ID Database ID for snapshot
Instance number Instance number for snapshot
Begin Time Begin of snapshot time interval
End Time End of snapshot time interval
Int Size Time interval in hundredths of a second
Group ID Metric group ID
Metric ID Metric ID
Metric Name Metric name
Value Metric value
Metric Unit Metric unit description
CCMS: OracleThe DBA Cockpit PUBLIC 91

● System Metrics GraphThis is a graph of the information from the System Metrics tab. No graph is initially displayed.Select the required parameters in Metric Group and Metric Name. The selection here includes all possible metric values, even if your system has been set up not to gather certain metrics.Choose Reload Graph to display the graph:○ The vertical Y axis of the graph is dynamic, based on the maximum value of the selected metric in the
chosen timeframe. The unit of measure for the selected metric in the vertical axis is displayed in the METRIC UNIT field.
○ The horizontal X axis shows time information for the selected data.○ You can click on a colored node in the graph to see a popup showing all timestamps and values for that
particular node.
3.6.5.6 System Summary Metrics
Definition
This monitor in the SAP/Oracle Database Monitor gives you system summary metrics on the Oracle database system with data derived from the GV$SYSMETRIC_SUMMARY or DBA_HIST_SYSMETRIC_SUMMARY view.
For more information about the licensing of the diagnostic pack, see SAP Notes 1028068 and 1250596 .
Use
You choose Performance Statistical Information System Summary Metrics in the DBA Cockpit.
NoteThe default display when you start the monitor is from GV$SYSMETRIC_SUMMARY with a timeframe of the last hour.
You can set the following fields in the Selection box:
● Metrics datasourceUse this to display data from the GV$-VIEW or the DBA View.
● Avail. TimeframeUse this to set the timeframe for the displayed data, either with use GV$-VIEW or use DBA view. In each case, the monitor uses the maximum available timeframe, as shown in the From and TO fields.
● Set to last HourUse this to set the timeframe for the displayed data to the last hour, as shown in the From and TO fields.
You choose Load Data to refresh the data in the table.
92 PUBLICCCMS: Oracle
The DBA Cockpit

Structure
● System Summary
Column Description
Snapshot ID Unique snapshot ID
DB ID Database ID for snapshot
Inst_ID_CH Instance number for snapshot
Snapshot begin time Begin of snapshot time interval
Snapshot end time End of snapshot time interval
Int size Time interval in hundredths of a second
Group ID Metric group ID
Metric ID Metric ID
Metric Name Metric name
Metric Unit Metric unit description
Num Interv Number of intervals observed
Minval Minimum value observed
Maxval Maximum value observed
Average Average over the period
StdDeviat One standard deviation
● System Summary GraphThis is a graph of the information from the System Summary tab. No graph is initially displayed.Select the required parameters in Metric Group and Metric Name. The selection here includes all possible metric values, even if your system has been set up not to gather certain metrics.Choose Reload Graph to display the graph:○ The graph differs according to the selected view:
○ For the GV$ view there is only one timestamp stored, you only see three single points in the graph for maximum, minimum, and average values. There is no line in the graph.
○ For the DBA view, you see three lines for the selected metric, one for the minimum, one for the maximum, and one for the average values.
○ Numeric values for the overall Minimum Value, Maximum Value, and Average Value are shown above the graph.
○ The vertical Y axis of the graph is dynamic, based on the maximum value of the selected metric in the chosen timeframe. The unit of measure for the selected metric in the vertical axis is displayed in the METRIC UNIT field.
CCMS: OracleThe DBA Cockpit PUBLIC 93

○ The horizontal X axis shows time information for the selected data.○ You can click on a colored node in the graph to see a popup showing all timestamps and values for that
particular node.
3.6.5.7 File Metrics
Definition
This monitor in the SAP/Oracle Database Monitor gives you file metrics with data derived from the GV$FILEMETRIC_HISTORY or DBA_HIST_FILEMETRIC_HISTORY view.
For more information about the licensing of the diagnostic pack, see SAP Notes 1028068 and 1250596 .
Use
You choose Performance Statistical Information File Metrics in the DBA Cockpit.
NoteThe default display when you start the monitor is from GV$FILEMETRIC_HISTORY with a timeframe of the last hour.
You can set the following fields in the Selection box:
● Metrics datasourceUse this to display data from the GV$-VIEW or the DBA View.
● Avail. TimeframeUse this to set the timeframe for the displayed data, either with use GV$-VIEW or use DBA view. In each case, the monitor uses the maximum available timeframe, as shown in the From and TO fields.
● Set to last HourUse this to set the timeframe for the displayed data to the last hour, as shown in the From and TO fields.
You choose Load Data to refresh the data in the table.
Structure
● File Metrics
Column Description
Snapshot ID Unique snapshot ID
94 PUBLICCCMS: Oracle
The DBA Cockpit

Column Description
DB ID Database ID for snapshot
Inst_ID_CH Instance number for snapshot
Fst file# File number
File name File name
Tablespace Tablespace name
CreatTime Timestamp of file creation
Snapshot begin time Begin of snapshot time interval
Snapshot end time End of snapshot time interval
Int size Time interval in hundredths of a second
Group ID Metric group ID
AvgRdTime Average file read time
AvgWrtTime Average file write time
Phys rds Number of physical reads
Phys wrt Number of physical writes
Blk rd Number of physical block reads
Blk wr Number of physical block writes
● File Metrics GraphThis is a graph of the information from the File Metrics tab. No graph is initially displayed.Select what you want to display in FILE/TABLESPACE:○ SINGLE DATAFILE - this is the default
In Selection Box for Datafile or Tablespace double-click to select the required datafile.○ FOR TABLESPACE - displays all datafiles of a tablespace
In Selection Box for Datafile or Tablespace double-click to select any datafile from the required tablespace.
○ ALL DATAFILES - displays all datafiles on the systemThis disregards any selection in Selection Box for Datafiles or Tablespaces.We only recommend this for small systems because for larger systems the display becomes too cluttered.
In IO Selection you can select the required input/output metric for the graph. The default is Avg READ and WRITE TIMES. When you change this selection, to refresh the graph display you have to repeat the selection described above in Selection Box for Datafile or Tablespace (or you can also repeat the selection of ALL DATAFILES if you are viewing all datafiles).
CCMS: OracleThe DBA Cockpit PUBLIC 95

The graph has the following features:○ The vertical Y axis of the graph is dynamic, based on the maximum value of the metric selected in IO
Selection for the chosen timeframe.○ The horizontal X axis shows time information for the selected data.○ You can click on a colored node in the graph to see a popup showing all timestamps and values for that
particular node.○ At the bottom of the graph there is a legend showing the meaning of each colored line. If there is not
enough room, the legend cannot be displayed, which can happen if you select all datafiles or a large tablespace with many datafiles.
3.6.5.8 Wait Class Metrics
Definition
This monitor in the SAP/Oracle Database Monitor gives you wait class metrics on the Oracle database system. Data is derived from the GV$WAITCLASSMETRIC_HISTORY or DBA_HIST_WAITCLASSMET_HISTORY view.
For more information about the licensing of the diagnostic pack, see SAP Notes 1028068 and 1250596 .
Use
You choose Performance Statistical Information Wait Class Metrics in the DBA Cockpit.
NoteThe default display when you start the monitor is from GV$WAITCLASSMETRIC_HISTORY with a timeframe of the last hour.
You can set the following fields in the Selection box:
● Metrics datasourceUse this to display data from the GV$-VIEW or the DBA View.
● Avail. TimeframeUse this to set the timeframe for the displayed data, either with use GV$-VIEW or use DBA view. In each case, the monitor uses the maximum available timeframe, as shown in the From and TO fields.
● Set to last HourUse this to set the timeframe for the displayed data to the last hour, as shown in the From and TO fields.
You choose Load Data to refresh the data in the table.
96 PUBLICCCMS: Oracle
The DBA Cockpit

Structure
● Wait Class
Column Description
Snapshot ID Unique snapshot ID
DB ID Database ID for snapshot
Inst_ID_CH Instance number for snapshot
W Class ID Identifier for the class of the wait event
W Class NA Name for the class of the wait event
Snapshot begin time Begin of snapshot time interval
Snapshot end time End of snapshot time interval
Intsize Time interval in hundredths of a second
Group ID Metric group ID
AvgWtCnt Average wait count
DBTimeWait Database wait time
Time waited Elapsed wait time waited
Wait Cnt Number of times waited
● Wait Class GraphThis is a graph of the information from the Wait Class tab. No graph is initially displayed.Select the required parameters in Waitclass and Wait Statistics, then choose Reload Graph to display the graph:○ The vertical Y axis of the graph corresponds to the selected Wait Statistic and is dynamic, based on the
maximum value of the selected metric in the chosen timeframe.○ The horizontal X axis corresponds to the selected Waitclass.○ You can click on a colored node in the graph to see a popup showing all timestamps and values for that
particular node.
3.6.5.9 DNFS Monitor
Definition
This monitor in the SAP/Oracle Database Monitor supports the Direct Network File System (DNFS) in Oracle version 11.2.
CCMS: OracleThe DBA Cockpit PUBLIC 97

NoteSince the DNFS feature is only available as of Oracle 11.2, the monitor is hidden for systems running with older versions of the Oracle database. See SAP Note 1366285 .
Use
You choose Performance Statistical Information DNFS Monitor in the DBA Cockpit.
Structure
● Channel SumsThis displays the result of the following query:select path, sum(sends), sum(recvs)from v$dnfs_channels group by path
● ChannelsThis displays the result of the following query:select pnum, svrname, path, ch_id, svr_id, sends, recvs, pingsfrom v$dnfs_channels
● ServersThis displays the result of the following query:select id, svrname, dirname, mntport, nfsport, wtmax, rtmaxfrom v$dnfs_servers
3.6.6 Feature Monitoring
Use
These sub-monitors in the SAP/Oracle Database Monitor show features.
3.6.6.1 Automatic Segment Space Management
Definition
This sub-monitor in the SAP/Oracle Database Monitor lets you check the automatic segment space management (ASSM) of the database. You can see:
● Tablespaces with ASSM
98 PUBLICCCMS: Oracle
The DBA Cockpit

● All tablespaces● Tables with ASSM● Tables without ASSM
ASSM simplifies and blocks the storage of tables and indexes by replacing linked-list freelists with bitmap freelists, which are faster and more efficient. ASSM reduces buffer busy waits [page 40].
Use
You choose Performance Feature Monitoring Automatic Segment Space Management in the DBA Cockpit and then the required tab page.
In Tables with ASSM and Tables without ASSM, output is limited to the first 50 tables. Choose Select Table to display information from a table of your choice.
Structure
NoteEntries marked “RAC only” appear only for Oracle Real Application Cluster (RAC)
● Tablespaces with ASSMThis tab page displays information on tablespaces with ASSM:
Column Description
Name Name of tablespace
Block Size Tablespace blocksize
Status Tablespace status.
For example, ONLINE, OFFLINE, INVALID.
Contents Type of tablespace: TEMPORARY for dedicated temporary tablespaces or PERMANENT for tablespaces that can store both temporary sort segments and permanent objects.
Extent Management Extent management, LOCAL or DICTIONARY
Allocation Type Allocation type, USER ,SYSTEM or UNIFORM
Segment Space Mngt Segment space management, AUTO
● All TablespacesThis tab page shows the same information as in the table above, but includes tablespaces with and without ASSM.
CCMS: OracleThe DBA Cockpit PUBLIC 99

● Tables with ASSMThis tab page displays information on tablespaces with ASSM:
Column Description
Table Name Name of table
Tablespace Name Name of tablespace
Used Space (Bytes) Used space in the table in bytes
Unused Space (Bytes) Unused space in the table in bytes
Meta Data Blocks Total blocks reported by DBA_TABLES minus sum of values reported by PL/SQL routine SPACE_USAGE
NoteChoose Select Table to display information on a selected single table or a group of tables.
● Tables without ASSMThis tab page shows the same information as in the table above, but only for tables without ASSM.
3.6.6.2 Online Redefinition
Definition
This sub-monitor in the SAP/Oracle Database Monitor lets you check the online redefinition of tables in the database. You can see:
● Tables in redefinition mode● Operations overview
Online redefinition lets you redefine tables - add, rename, or drop columns - while keeping the table fully online and available.
This monitor makes it easier for you to get detailed information about which tables have been redefined online, when, and which Data Manipulation Language (DML) operations took place.
Use
You choose Performance Feature Monitoring Online Redefinition in the DBA Cockpit and then the required tab page.
100 PUBLICCCMS: Oracle
The DBA Cockpit

Structure
NoteEntries marked “RAC only” appear only for Oracle Real Application Cluster (RAC).
● Tables in redefinition modeThis tab page displays the tables that are currently in online redefinition mode:
Column Description
Table Name Name of table
Created Date when the table was created
DML Operation DML operation
Occurrence Number of times for this DML operation on the table
● Operations OverviewThis tab page displays the time of each DML operation on the redefined tables:
Column Description
Table Name Name of table
Operation DML operation
Date Date when the table was created
Hour Hour at which the redefinition occurred
Occurrence Number of times for this DML operation on the table
3.6.6.3 Resumable Space Allocation
Definition
This sub-monitor in the SAP/Oracle Database Monitor lets you check the resumable space allocation. If a statement is suspended for space allocation reasons, the resumable space allocation feature enables the statement to be resumed, so that the work done so far is saved.
CCMS: OracleThe DBA Cockpit PUBLIC 101

Use
You choose Performance Feature Monitoring Resumable Space Allocation .
Structure
NoteEntries marked “RAC only” appear only for Oracle Real Application Cluster (RAC)
This screen displays the following information:
Column Description
User ID User ID of the resumable statement owner
Username User name of the resumable statement owner
Session ID Session identifier
Inst ID Instance ID of resumable statement
Coord Inst_ID Inst ID on which the Parallel Coordinator is running
Coord Sess ID Session ID of the Parallel Coordinator
Status Statement status.
Possible values: RUNNING, SUSPENDED, ABORTED, ABORTING, TIMEOUT
Timeout Timeout of the resumable statement
Start Time Local start time of the resumable statement
Suspend Time Local last time when the resumable statement was suspended
Resume Time Local last time when the resumable statement was resumed
Name The name given in the resumable clause of this resumable statement.
SQL Text SQL text of the resumable statement
Error Number The error code of the last correctable error
Error Parameter 1 Parameter for error message 1
102 PUBLICCCMS: Oracle
The DBA Cockpit

Column Description
Error Parameter 2 Parameter for error message 2
Error Parameter 3 Parameter for error message 3
Error Parameter 4 Parameter for error message 4
Error Parameter 5 Parameter for error message 5
Error Message The error message corresponding to Error Number.
3.6.6.4 Parallel Query
Definition
This sub-monitor in the SAP/Oracle Database Monitor lets you check parallel queries. Instead of using a single process for one SQL statement, in parallel queries the work is spread across multiple processes. This is useful where there is a lot of data in operations like full table scans of large tables, creation of large indexes, or bulk inserts, updates, and deletes.
For more information, see SAP Note 1731514 .
Use
You choose Performance Feature Monitoring Parallel Query in the DBA Cockpit.
If the RFC connection is maintained, additional information such as DDIC information and the position of the ABAP source call is available for the select query. If an RFC connection is not maintained, only the explain plan can be viewed for the query.
Structure
This screen displays the following information:
Column Description
SID Session identifier
Instance Oracle instance
CCMS: OracleThe DBA Cockpit PUBLIC 103

Column Description
Username Oracle user name
SQL ID SQL identifier
Role Role of the process during parallel execution
Action Name of action currently being executed
SQL Text SQL statement text
Degree Degree of parallelism being used
Req Degree Degree of parallelism requested when the statement was started
3.6.6.5 Segments with Activated Parallelism
Definition
This sub-monitor in the SAP/Oracle Database Monitor shows the segments that have parallel degree activity based on the Oracle SQL script Segments_ParallelDegreeActive.txt given in SAP note 1438410 . This monitor displays the segments in the instance having parallel degree active. The data shown is based on the Oracle Automatic Workload Repository (AWR). For more information, see SAP note 1704439 .
You choose Performance Feature Monitoring Segments with Activated Parallelism
Structure
Column Description
Owner Segment owner
Segment name Segment name
Command Alter command for the segment
Segment type Segment type
Degree Degree of parallelism
Instances Number of instances
104 PUBLICCCMS: Oracle
The DBA Cockpit

3.6.7 Additional Functions
Use
These sub-monitors in the SAP/Oracle Database Monitor show additional functions.
3.6.7.1 SQL Command Editor
Definition
This sub-monitor in the SAP/Oracle Database Monitor lets you display the results of native Oracle select statements, which you enter in an editor.
If your statement selects only content of tables with owner SYS or PUBLIC, the monitor displays the result of the select statement. Otherwise the monitor executes statements and displays miscellaneous runtime information.
Use
You choose Performance Additional Functions SQL Command Editor in the DBA Cockpit.
You can use the editor in the following ways:
● InteractiveThe sub-monitor consists of an editor screen where you enter the SQL statement and a result screen that displays the result of the SQL statement.
● BatchThe result is written to a spool list.
● Database tableThe result is written to a database table. This lets you store and read it later, or evaluate it with an SQL script. To do this, make an entry of the form &&&<RESULT_ID>&&& before the SQL query.
Example&&&ATEST&&&SELECT * FROM V$INSTANCE
The system stores the result with the ID ATEST in table ORA_SQLC_DATA. The table ORA_SQLC_HEAD stores the result structure.
For more information, see SAP Note 1114566 .● Explain plan
You have the option to display an SQL execution plan (explain). For more information, see SAP Note 1297012 .
CCMS: OracleThe DBA Cockpit PUBLIC 105

Structure
You can choose:
● SQL Command Save or Load or DeleteThese functions ask you for an ID so that the statement can be saved to, loaded to, or deleted from the SAP database.The advantage of storing your statements is that you can share the same statement with other users.
● SQL Command ParseThis function starts a simple parser to check the syntax. This parser only makes sure that the monitor is able to generate a display structure and display the result of the statement. It also checks the owner of the tables and views that have to be read.It does not check the complete Oracle syntax. Therefore, it does not guarantee that the statement can be executed.
● SQL Command ExecuteThis function starts the parser, executes the statement, and displays the result of the statement.
● SQL Command Execute BackgroundThis function creates a background job for the execution of the current SQL statement. It is best to execute in the background when you expect a long runtime for the statement.The system asks for some parameters as follows:1. Background job parameters
○ Statement IDThis is the ID for saving the current SQL statement in the SAP database. The current statement is stored under this ID for later execution. If you use the default value $TMP_JOB, this overwrites an already existing statement with this ID. Use this default only if you are sure that there is no other job that uses this ID awaiting execution.
○ Print result of statementSelect this box if you want to get the resulting data.
○ Print runtime data for statementSelect this to receive the runtime information for the statement.
○ Start execution immediatelySelect this to start execution immediately.
○ Scheduled start atSelect this to start execution at the date and time you enter.
○ No start afterYou can prevent the system from executing the statement after this time. For example, this is useful to prevent execution when you expect the system load to be high.
○ Print timeHere you can select whether the results are sent to the SAP spooler only or if they are printed immediately.
2. Background print parametersHere you can specify the printer and other print parameters.
● Goto Job overviewAfter starting a statement in background execution you can find your job here.
● Goto Spool requestsAfter starting a statement in background execution you can find your spool lists here.
● Save as local file or Load local file
106 PUBLICCCMS: Oracle
The DBA Cockpit

You can save your SQL statement to a local file or load an SQL statement from a local file into the editor.
Syntax
● A statement must have the following syntax:SELECT [ hint ] [ { DISTINCT | UNIQUE } | ALL ] select_listFROM table_reference [, table_reference]...[ WHERE condition ][ hierarchical_query_clause ][ group_by_clause ][ HAVING condition ][ { UNION | UNION ALL | INTERSECT | MINUS } ( subquery )][ order_by_clause ]You can put comments between "/*+" and "*/"
● A select list must have the following syntax:{ * |{[table_alias.]dbfieldname | expression} alias [,[table_alias.]dbfieldname | expression} alias] ... }An expression within this select list can use a calculation operator such as +, -, *, /, ||. Unary functions (LN, MIN, AVG ...), null, or numbers, are also allowed.
● A table reference must have the following syntax:{(select statement) [table_alias] | table [table_alias]}
● If you enter one of the following commands, you receive the same table information as if you had entered the command with the same name on Oracle with SQLPLUS:○ DESC <table name>○ DESCR <table name>○ DESCRIBE <table name>
Otherwise the syntax follows the SQL standard.
Conventions and Restrictions
● Each column specified in the select list becomes a column in the output list.● If a select list element is specified with a column alias, this alias is used as header text in the output list.
Otherwise the program uses the field name of the select list element as header text. If a select list element is an expression (that is, without a database field), the alias is obligatory.
CautionFor every expression that is not a database field, use a column alias.
ExampleThe following statement cannot be processed because the only select list element is an expression.
select to_char(startup_time,'YYYY-MM-DD-HH24.MI.SS') from v$instance …
Since expressions are not always related to exactly one database field, the monitor requires an alias name:
select to_char(startup_time,'YYYY-MM-DD-HH24.MI.SS') as startup from v$instance
CCMS: OracleThe DBA Cockpit PUBLIC 107

● Every column alias that is specified in the select list of a sub-query can be used in the same way as a database field name in the select statement.
● If more than one table is specified in the from clause, the columns are matched to one table for reasons of uniqueness. If a column name occurs in more than one table, uniqueness cannot be guaranteed. In this case you have to specify a table alias before the column name (that is, database field name).
CautionWhen more than one table is specified and column names that have to be outputted occur in more than one table, use a table alias.
ExampleIf both table_a and table_b have a field with identical name, field_1, you have to specify the table alias for uniqueness:
select a.field_1 as tc_a, b.field_1 as tc_b from table_a a, table_b b
● The SAP List Viewer (ALV) does not display leading blanks that the Oracle LPAD editing function has inserted into the SQL statement. To display leading blanks, you need to switch to list output by choosing View in the ALV grid.
Example
Here are some examples to show features of this sub-monitor:
● This statement shows an interesting rate statistics for read, write, and hit using a sub-select:select LogicalIO, PhysicalReads, PhysicalReadsDirect,PhysicalReadsDirectLob, PhysicalWrites,round((1-(PhysicalReads-PhysicalReadsDirect- PhysicalReadsDirectLob)/(LogicalIO-PhysicalReadsDirect- PhysicalReadsDirectLob))*100,2)HitRatiofrom (select SUM(DECODE(Name, 'session logical reads',Value,0)) LogicalIO,SUM(DECODE(Name,'physical reads',Value,0)) PhysicalReads,SUM(DECODE(Name,'physical writes',Value,0)) PhysicalWrites,SUM(DECODE(Name,'physical reads direct',Value,0)) PhysicalReadsDirect,SUM(DECODE(Name,'physical reads direct (lob)', Value,0))PhysicalReadsDirectLobfrom v$sysstatwhere name in ('session logical reads','physical reads','physical reads direct','physical reads direct (lob)', 'physical writes'))
● This statement shows runtime statistics for reading SAP table t100 and a rowid statistic:Select rowid, a.* from t100 a
● This statement shows how to use a table cast:select * from table(dbms_xplan.display())
108 PUBLICCCMS: Oracle
The DBA Cockpit

3.6.7.2 Display GV$-Views
Definition
This sub-monitor in the SAP/Oracle Database Monitor lets you see list the views existing in an Oracle database and display their contents. The list of views is taken from V$fixed_view_definition.
Use
You choose Performance Additional Functions Display GV$ Views in the DBA Cockpit.
Structure
The GV$ views are arranged in a two-column list in alphabetic order of the views' names.
To see more detail, double-click an entry in the table.
The columns displayed in detail depend on the view. For more information, see the Oracle documentation.
Integration
Some features or services in Oracle have their own views. When such features are not active, their related views do not provide any result.
One such feature is the Oracle Log Miner. Its related views ( logmnr_*) cannot be queried unless the service is up and running.
3.6.7.3 Display DBA Tables
Definition
This sub-monitor in the SAP/Oracle Database Monitor lets you display the contents of Oracle database DBA tables, which contain information for database administrators.
Use
You choose Performance Additional Functions Display DBA Tables in the DBA Cockpit.
CCMS: OracleThe DBA Cockpit PUBLIC 109

Structure
You see a list of the DBA tables in the database.
3.6.7.4 Display USER Views
Definition
This sub-monitor in the SAP/Oracle Database Monitor lets you see list the USER views existing in an Oracle database and display their contents.
You choose Performance Additional Functions Display User Views in the DBA Cockpit.
Structure
The USER views are arranged in a two-column list in alphabetic order of the views' names.
To see more detail, double-click an entry in the table.
The columns displayed in detail depend on the view. For more information, see the Oracle documentation.
3.6.7.5 Database Parameters
Definition
This sub-monitor in the SAP/Oracle Database Monitor lets you view the active Oracle database parameters and the contents of the init<SID>.ora file. You can also see the history of changes to the parameters. You can use this sub-monitor to view parameters on different instances of an Oracle Real Application Cluster (RAC).
Data is retrieved at run time from the database through a query to the views V$PARAMETER and V$SPPARAMETER. The view V$SPPARAMETER shows the current values of the parameters in the Oracle spfile but not the current values used by the instance. This view returns NULL values if a server parameter file (spfile) is not being used by the instance. You can also check this by looking at the value of the parameter SPFILE in the view V$PARAMETER.
The view V$PARAMETER shows the current values for the parameters used (not the spfile values). If a parameter in the database is changed, it is logged in the alert file. This lets us retrieve the history of changes to each parameter.
110 PUBLICCCMS: Oracle
The DBA Cockpit

Use
● For each instance, you need to create a table called sap_alert_<Inst_ID> in order to access the corresponding alert log file data. For this you need to perform the following commands to create this table to access the external alert log file1. Create the path of the alert log file :
[ create directory DIR_1 as 'ALERT_LOG_PATH' ; ]ALERT_LOG_PATH contains the path of the alert log file of the required instance.
2. Create the database table corresponding to the above alert log file by issuing the following SQL command:[ CREATE TABLE sap_alert_<INST_ID>(entry VARCHAR2(2000) ) ORGANIZATION EXTERNAL(TYPE oracle_loader DEFAULT DIRECTORY DIR_1 ACCESS PARAMETERS(RECORDS DELIMITED BY NEWLINENOBADFILENOLOGFILENODISCARDFILEFIELDS TERMINATED by ' 'MISSING FIELD VALUES ARE NULL(entry )) location('ALERT_LOG_FILE_NAME') ); ]
Notice the directory DIR_1 near the top of the above command. Make sure that you provide the file name in the ALERT_LOG_FILE_NAME.Make sure that the tables match the alert log file path whenever its directory or its name changed.
● To start the sub-monitor, you choose Performance Additional Functions Database Parameters in the DBA Cockpit.
Structure
● Active ParametersThis tab page displays the parameters that are currently active in the database. It displays the following information:
Column Description
Instance ID Instance ID
SID Name of the RAC instance
Parameter Name of the active parameter
Parameter value Value of the parameter
Value in SPFILE Value in SPFILE (if present)
● Parameters History
CCMS: OracleThe DBA Cockpit PUBLIC 111

This tab page uses the alert log file to display all changes in database parameters.Choose Show parameters history to display the following information:
Column Description
Instance ID Instance ID
SID Name of the RAC instance
Parameter Name of the parameter
Value Value of the parameter
Timestamp Timestamp for this value of the parameter
Scope Indicates whether the parameter change is only temporary, or persistent and in memory
Target instance RAC instance for which the change applies
● SPFILEThis tab page displays the contents of the init<SID>.ora file. It displays the following information:
Column Description
SID Name of the instance
Parameter Name of the parameter
Value Value of the parameter
ISpecified Whether the parameter was specified in the server parameter file
Ordinal Position - that is, ordinal number - of the parameter value (0 if a server parameter file was not used to start the instance)
Useful only for parameters for which values are lists of strings.
● Compare Parameter Config.This tab page only appears for RAC.
112 PUBLICCCMS: Oracle
The DBA Cockpit
3.6.7.6 Alert Log
Definition
This sub-monitor in the SAP/Oracle Database Monitor lets you check the database message log (also known as the alert log).
Use
You choose Performance Additional Functions Alert Log .
To generate the required display of the message log, you specify the parameters:
● Select content○ Read all messages
All messages are displayed.○ Read all msg. w/o logswitch and checkpoint
All messages are displayed except log-switch and checkpoint messages.○ Read only alerts
Only alerts are displayed.● Select time
○ Entries starting fromEnter the date and time from which messages are to be displayed.
○ All availableAll available messages are displayed.
● Max lines to be displayedThe display is restricted to the maximum number of lines.
Structure
The message log is displayed in chronological order.
NoteOn Oracle Real Application Cluster (RAC), when you select Total under DB Instances, a merged message log for all instances is displayed. The sub-monitor adds the column Instance ID to the list.
You can use the scrolling functions, such as Day, to quickly find the required part of the message log.
Trace files in the message log display are highlighted. You can display the content of a trace file by selecting the relevant row and choosing Show trace file.
CCMS: OracleThe DBA Cockpit PUBLIC 113

Integration
To use this sub-monitor, your system must meet at least one of the following requirements:
● Message log
Access Method to Message Log Requirement
BRTOOLS using file type alert_log BRTOOLS must be installed on the database instances. All administrative files, such as servernames, must be maintained correctly.
BRTOOLS using file type alert_log with specified sysid BRTOOLS must be installed on the database instances.
This method is more tolerant of missing administrative file entries than the previous method.
BRTOOLS using file type file BRTOOLS have to be installed on the database instances.
This method is more tolerant of missing administrative file entries than the previous methods.
RFC call and READ dataset The instance server must also host a SAP application server. The data file must be accessible by the application server.
Message log is read from an external table The external table must exist, as described below.
● Trace fileThe sub-monitor tries to read the trace file using BRTOOLS. Therefore, you must make sure that BRTOOLS is installed on the database instance and that all administrative files are maintained correctly.For more information, see SAP Note 446172 .Make sure that the trace file has not been deleted if you want to view it.
● The alert log is read from an "external table," which is normally set up by the installation. If the external table has not already been created, you can create it with the script attached to SAP Note 1546456 .
3.6.7.7 Checkpoints
Definition
This sub-monitor in the SAP/Oracle Database Monitor displays all checkpoints found in the current alert_<SID>.log.
114 PUBLICCCMS: Oracle
The DBA Cockpit

Use
1. You set the init.ora parameter LOG_CHECKPOINTS_TO_ALERT to TRUE so that the information required by the monitor is written to the alert file.
2. You choose Performance Additional Functions Checkpoints in the DBA Cockpit.3. You make the following entries:
○ Select timeEnter a start date and time for the displayed checkpoints in Entries starting from or select All available to display all entries.
○ Max. lines to be displayedEnter the maximum number of lines for the display.
Structure
This screen contains the following information:
Column Description
Checkpoint Number Number of the checkpoint
Start Date Time the checkpoint ended
Start Time Time the checkpoint started
End Date Date the checkpoint ended
End Time Time the checkpoint ended
Duration (sec) Duration of the checkpoint in seconds
In Parallel For parallel checkpoints, the number of checkpoints
NoteParallel checkpoints are indicated by:
● A number in the in Parallel column indicating how many parallel checkpoints● A yellow background color
CCMS: OracleThe DBA Cockpit PUBLIC 115

3.6.7.8 Oracle Net
Definition
This sub-monitor in the SAP/Oracle Database Monitor gives you an overview of the Oracle Net configuration of the Oracle Database
Use
You choose Performance Additional Functions Oracle Net in the DBA Cockpit.
When you start the monitor or when you first switch to a different tab page, a pop-up prompts you for the path name to the network/admin directory, for example, /sapmnt/db_sw/oracle/101_64/software/network/admin/. As long as you remain inside this area of the monitor, the pop-up no longer appears when you have already entered the correct path name for a particular tab page.
Structure
Oracle Net consists of the following tab pages:
● tnsnames.ora● sqlnet.ora● listener.ora
Integration
The files listed above on the tab pages are read from an "external table," which is normally set up by the installation. If the external table has not already been created, you can create it with the script attached to SAP Note 1546456 .
3.6.7.9 User End to End Trace
Prerequisites
The trace files are written to the directory specified by the Oracle parameter USER_DUMP_DEST, normally $ORACLE_HOME/saptrace/usertrace.
116 PUBLICCCMS: Oracle
The DBA Cockpit

CautionWhen the trace is active, make sure that there is enough space in the file system containing the trace directory.
There are the following restrictions for the trace:
● It is only available as of SAP Kernel 7.1 and Oracle 10.2.0.2.● The SAP schema users of the database that is, SAP<SID>, SAPR3, or SAPSR3 must have the EXECUTE
permissions to the package DBMS_MONITOR.This means that user SYS must have executed GRANT EXECUTE ON DBMS_MONITOR TO SAP<SID>.
Context
This function in the SAP/Oracle DBA Cockpit lets you set the trace for individual users on the Oracle database. The Oracle database server writes a trace for all actions that the user executes.
Do not confuse this trace with SAP transaction ST05. Only use the trace when SAP/Oracle Development Support requests you to do so for problem diagnosis.
Procedure
1. Choose Performance Additional Functions User End to End Trace in the DBA Cockpit.
2. Enter a user name in SAP user, paying attention to uppercase or lowercase.
3. If you want to include wait information in the trace, select Tracing Waits.
4. If you want to include bind information in the trace, select Tracing Binds.
5. Choose Enable Trace to start the trace.
You can see a list of all users with an active trace.
NoteThe trace remains active even after a stop and restart of the database. Therefore, you have to explicitly turn it off.
6. To turn off the trace, select it from the list of active traces and choose Disable Trace. If required, you can turn off multiple or all traces.
SAP/Oracle Development Support can evaluate the trace files using Oracle command line tools (such as trcsess).
CCMS: OracleThe DBA Cockpit PUBLIC 117

3.6.7.10 User End to End Stats Trace
Prerequisites
Trace information is written to the table v$client_stats and is lost if the database is stopped.
There are the following restrictions for the trace:
● It is only available as of SAP Kernel 7.1 and Oracle 10.2.0.2.● The SAP schema users of the database that is, SAP<SID>, SAPR3, or SAPSR3 must have the EXECUTE
permissions to the package DBMS_MONITOR.This means that user SYS must have executed GRANT EXECUTE ON DBMS_MONITOR TO SAP<SID>.
Context
This function in the SAP/Oracle DBA Cockpit lets you set the trace for the statistics of individual users on the Oracle database.
Procedure
1. Choose Performance Additional Functions User End to End Stats Trace in the DBA Cockpit.
2. Enter a user name in SAP user, paying attention to uppercase or lowercase.
3. Choose Enable Trace to start the trace.
You can see a list of all users with an active trace.
NoteThe trace remains active even after a stop and restart of the database. Therefore, you have to explicitly turn it off.
4. To view the results of the trace, select the appropriate user in the column Display stats.
5. To turn off the trace, select it from the list of active traces and choose Disable Stats. If required, you can turn off multiple or all traces.
118 PUBLICCCMS: Oracle
The DBA Cockpit

3.6.7.11 Program End to End Trace
Prerequisites
The trace files are written to the directory specified by the Oracle parameter USER_DUMP_DEST, normally $ORACLE_HOME/saptrace/usertrace.
CautionWhen the trace is active, make sure that there is enough space in the file system containing the trace directory.
There are the following restrictions for the trace:
● It is only available as of SAP Kernel 7.1 and Oracle 10.2.0.2.● The SAP schema users of the database that is, SAP<SID>, SAPR3, or SAPSR3 must have the EXECUTE
permissions to the package DBMS_MONITOR.This means that user SYS must have executed GRANT EXECUTE ON DBMS_MONITOR TO SAP<SID>.
Context
This function in the SAP/Oracle DBA Cockpit lets you set the SQL trace for individual programs on the Oracle database server.
Do not confuse this trace with SAP transaction ST05. Only use the trace when SAP/Oracle Development Support requests you to do so for problem diagnosis.
Procedure
1. Choose Performance Additional Functions Program End to End Trace in the DBA Cockpit.
2. Enter a program name in Program, paying attention to uppercase or lowercase.
3. If you want to include wait information in the trace, select Tracing Waits.
4. If you want to include bind information in the trace, select Tracing Binds.
5. Choose Enable Trace to start the trace.
You can see a list of all programs with an active trace.
NoteThe trace remains active even after a stop and restart of the database. Therefore, you have to explicitly turn it off.
CCMS: OracleThe DBA Cockpit PUBLIC 119

6. To turn off the trace, select it from the list of active traces and choose Disable Trace. If required, you can turn off multiple or all traces.
SAP/Oracle Development Support can evaluate the trace files using Oracle command line tools (such as trcsess).
3.6.7.12 Program End to End Stats Trace
Prerequisites
Trace information is written to the table v$client_stats and is lost if the database is stopped.
There are the following restrictions for the trace:
● It is only available as of SAP Kernel 7.1 and Oracle 10.2.0.2.● The SAP schema users of the database - that is, SAP<SID>, SAPR3, or SAPSR3 - must have the EXECUTE
permissions to the package DBMS_MONITOR.This means that user SYS must have executed GRANT EXECUTE ON DBMS_MONITOR TO SAP<SID>.
Context
This function in the SAP/Oracle DBA Cockpit lets you set the trace for the statistics of individual programs on the Oracle database.
Procedure
1. Choose Performance Additional Functions Program End to End Stats Trace in the DBA Cockpit.
2. Enter a program name in Program, paying attention to uppercase or lowercase.
3. Choose Enable Trace to start the trace.
You can see a list of all programs with an active trace.
NoteThe trace remains active even after a stop and restart of the database. Therefore, you have to explicitly turn it off.
4. To view the results of the trace, select the appropriate program in the column Display stats.
5. To turn off the trace, select it from the list of active traces and choose Disable Stats. If required, you can turn off multiple or all traces.
120 PUBLICCCMS: Oracle
The DBA Cockpit

3.6.7.13 Bundle Patches
Definition
This sub-monitor in the SAP/Oracle Database Monitor shows the installed bundle patches (if any) on the system. For more information, see SAP note 1727180 .
You choose Performance Additional Functions Bundle Patches .
Structure
Column Description
Action Time Time of patch action
Action Patch action
Namespace Namespace
Version Patch version
Bundle series Type of bundle patch
Comments Further information
3.7 Space (Oracle)
Use
You can use the User menu in the DBA Cockpit to monitor the space in your Oracle database:
● Space overview● Database overview● Users overview● Users detailed analysis● Tablespaces overview● Tablespaces detailed analysis● Segments overview● Segments detailed analysis● Segments detailed analysis (aggregated)● Collector logs
CCMS: OracleThe DBA Cockpit PUBLIC 121

● BW analysis
3.7.1 Space Overview
Definition
This screen in the DBA Cockpit gives you an overview of the space in your Oracle database. It uses a collector job to periodically retrieve data from the cluster table MONI.
You choose Space Space Overview in the DBA Cockpit to call up the space overview.
Structure
The fields are as follows:
Field Description
Database
Name Database name
DEFAULT means the local database.
DB system ORA for Oracle
Size Size of the database in GB
Free size Free space in the database in GB
Used Percentage used space in database
Equal to 100 * Free size / Size.
Users
Total number Number of database users
Maximum size Maximum size used by a user
The user name is in brackets.
Maximum # segments Maximum number of segments used by a user
The user name is in brackets.
Tablespaces
Total number Total number of tablespaces
122 PUBLICCCMS: Oracle
The DBA Cockpit

Field Description
Maximum size Size of the biggest tablespace
The tablespace name is in brackets.
Minimum free space Minimum free space not used by a tablespace
The tablespace name is in brackets.
Segments
Number Number of the objects Tables, Indexes, Others
Size Total size of the objects in MB
More 100 ext. Number of objects with more than 100 extents
Compressed Number of compressed objects
No logging Number of objects with “no logging”
Critical Number of critical objects
3.7.2 Space Statistics Collector
Use
The Space Statistic Collector collects data for the space monitor in the DBA Cockpit.
Integration
A standard background job, SAP_COLLECTOR_FOR_PERFMONITOR, starts the collector. The data is physically stored in cluster table MONI.
Prerequisites
You must make sure that the collector is set up as described in SAP Note 868063 .
CCMS: OracleThe DBA Cockpit PUBLIC 123

Features
The collector is based on program RSORACOL. This report must be included in table TCOLL as one of the components of standard SAP job SAP_COLLECTOR_FOR_PERMONITOR with the following parameters:
● RNAME: RSORACOL● RENUM: 1 ● SYTYP: S (or C if 620)● ALTSY● DAYOW: XXXXXXX● TIMOD: XXXXXXXXXXXXXXXXXXXXXXXX
The setup process as described in “Prerequisites” above creates at least one entry in table ORA_MON_DBCON and many entries in table DB02_COLL_PLAN:
● The table ORA_MON_DBCON provides a list with the connection names of the databases to be monitored. The databases can be local or remote, running SAP or not. The only requirement is that the connection names must match those stored in table DBCON. The local database is always called DEFAULT.
● The table DB02_COLL_PLAN provides a list of collector modules - ABAP function modules that collect data - with their specific settings such as module name, module_id, schedule, MONI key where data is stored, dependencies, and so on.All these function modules currently belong to SAP function group SDBORA3. There is normally one collector module for each submonitor in the DBA Cockpit.
Example
The collector module US-GE-MD (SMON_ID=200) collects the data displayed in sub-monitor Space Statistics User Overview .
A normal collection job runs as follows:
1. The standard SAP job SAP_COLLECTOR_FOR_PERMONITOR runs hourly and starts the program RSORACOL.
2. The program RSORACOL reads the table ORA_MON_DBCON to:1. Get the connection names of the databases to be monitored.2. Check whether the database connection is active or inactive
3. For each database, RSORACOL executes a set of collector modules according to their schedules and according to settings stored in table DB02_COLL_PLAN.If required, RSORACOL establishes a native connection to remote databases.
4. As collector modules finish, they store collected data in cluster table MONI under a specific monikey. Program RSORACOL then immediately writes a log entry to table DB02_COLL_LOG.
5. The previous two steps are repeated for each database to be monitored.
There is a logging mechanism in the collector program. Every time a collection module completes a collection and exports it to MONI a log entry is written to table DB02_COLL_LOG. The log entry contains a time stamp, submonitor ID, return code, and other information.
124 PUBLICCCMS: Oracle
The DBA Cockpit

Activities
Configuration
You can configure the space statistics collector as follows:
● You add databases to the monitoring list or delete them as described in SAP Note 868063 . The local database is always called DEFAULT and does not appear in the F4 help.
● You can change database settings in the table ORA_MON_DBCON except CON_NAME:
Column Description
CON_NAME Database connection name, as stored in table DBCON
STATUS Status of the database monitoring
MAX RUNTIME Maximum runtime in seconds desired for collector modules
Default: 1800 seconds
MAX UPLOAD Maximum size in KB desired to be written to MONI per collector module
Default: 1,000,000 KB
LOG LIFE Time in days desired to retain logs
Default: 100 days
DESCRIPTION Short text
● We recommend that you do not normally modify table DB02_COLL_PLAN, which contains the collector module settings. If required, you can modify certain fields like MONIFILL, SCH_DATE, SCH_TIME, or PARAM but we recommend you to raise an SAP support message before doing so.The table DB02_COLL_PLAN looks as follows:
Column Description
CON_NAME Database connection name, as stored in table DBCON
SMON_ID Sub-monitor ID for this collector module
SMON_NAME Sub-monitor name for this collector module
FUNCNAME Function module name
MONIFILL MONI filler, part of the MONI key
CCMS: OracleThe DBA Cockpit PUBLIC 125

Column Description
RANK Rank
Relevant for sub-monitors that are organized hierarchically.
STATUS Collector module status
SCH_DATE Schedule date
SCH_TIME Schedule time
PROCESS_TYPE Process type
This differs according to the data source. For example, data from Oracle views is process type snapshot, S.
SOURCE_SMON Source sub-monitor id
Some collector modules gather data from other collector modules, which means there can be dependencies between monitors.
PARAM Some collector modules accept or require parameters.
For example, the collector module for top table sizes sets the length of the ranking.
Remote Monitoring
So that you can use the space monitor to monitor Oracle databases remotely, the collector program can also collect data from remote databases using a native connection.
Make sure that you meet the following prerequisites to enable data collection from remote databases:
1. The tnsnames.ora files attached to local Oracle clients contain a specific entry for the remote database.If your local system does not run Oracle, you need to at least install the Oracle client software and then adapt the tnsnames.ora files.
2. The native connection to the remote database exists in table DBCON and it works without problems.3. The database connection exists in table ORA_MON_DBCON.
Do not make this entry manually. For more information about setting up collectors for new databases, see “Prerequisites” above.
Troubleshooting
If the space monitor in the DBA Cockpit is not up-to-date or contains no data, see SAP Note 1002840 . For further support, you can create a message in component BC-CCM-MON-ORA.
126 PUBLICCCMS: Oracle
The DBA Cockpit

3.7.3 Database Overview
Definition
This monitor in the SAP/Oracle Database Monitor lets you display the space usage on the database, including history information. It uses a collector job to periodically retrieve data from the cluster table MONI.
Use
You choose Space Database Overview in the DBA Cockpit.
You can choose Without Duplicates on the History tab to remove any duplicates in the data.
Structure
The fields on the tab Main data are self-explanatory.
The tab History contains the following information for the sub-tab Days display (the columns are analogous for the sub-tabs Weeks and Months):
Column Description
Date Date of last analysis
Name Database name
Size (Gb) Database size in GB
Chg. Size/day Change of database size per day in GB
Free (Gb) Database free space in GB
Chg. Free/day Change in database free space per day in GB
Used (%) Percentage used space in the database
Chg. Used/day Change in database used space per day
Users Number of database users
Chg. Users/day Change in number of users per day
Tablespaces Number of tablespaces
Chg. Tablespaces/day Change in number of tablespaces per day
CCMS: OracleThe DBA Cockpit PUBLIC 127

Column Description
Segments Number of segments
Chg. Segments/day Change in number of segments per day
Data (%) Percentage of space containing data
Chg. Data/day Change in data space per day
Temp (%) Percentage of space containing temporary data
Chg. Temp/day Change in temporary space per day
Tables (%) Percentage of space containing tables
Chg. Tables/day Change in number of tables per day
Indexes (%) Percentage of space containing indexes
Chg. Indexes/day Change in number of indexes per day
Others (%) Percentage of space occupied by other objects (that is, objects other than tables and indexes, such as lobs, clusters, or rollbacks)
Chg. Others/day Change in number of other objects per day
Each sub-tab on the History tab contains an average display separately at the top followed by detailed displays for each time period.
3.7.4 Users Overview
Definition
This monitor in the SAP/Oracle Database Monitor lets you display the database users, including history information. It uses a collector job to periodically retrieve data from the cluster table MONI.
Use
You choose Space Users Overview in the DBA Cockpit.
128 PUBLICCCMS: Oracle
The DBA Cockpit

Structure
This screen contains the following information:
● The tab Main Data:
Column Description
User name User name
User id User ID
Size (MB) Size of data assigned to user in MB
# Segments Number of segments owned by the user
# Tables Number of tables owned by the user
# Indexes Number of indexes owned by the user
# Extents Number of extents owned by the user
Def. Tablespace Name of default tablespace for user
Temp. tablespace Name of temporary tablespace for user
Account status Status of user account
Profile Name of user profile
Creation Date Date user account was created
Creation Time Time user account was created
● The tab Summary History contains the following information for the sub-tab Days (the columns are analogous for the sub-tabs Weeks and Months):
Column Description
Begin analysis date Date when the analysis begins
End analysis date Date when the analysis ends
User name User name
User id User ID
Size (MB) Size in MB
Chg. Size/day Average daily change in size in MB
CCMS: OracleThe DBA Cockpit PUBLIC 129

Column Description
# Segments Number of segments
Chg. Segm/day Average daily change in number of segments
# Tables Number of tables
Chg. Tables/day Average daily change in number of tables
# Indexes Number of indexes
Chg. Indexes/day Average daily change in number of indexes
# Extents Number of extents
Chg. Extents/day Average daily change in number of extents
3.7.5 Users Detailed Analysis
Definition
This monitor in the SAP/Oracle Database Monitor lets you display detailed information about the database users, including history information. It uses a collector job to periodically retrieve data from the cluster table MONI.
Use
You choose Space Users Detailed Analysis in the DBA Cockpit.
The system prompts you to enter selection criteria for the users.
You enter selection criteria to restrict the display to the required users.
When the main grid is populated, you can double-click any row to display it in a more concise form in the Main data tab.
130 PUBLICCCMS: Oracle
The DBA Cockpit

Structure
This screen contains the following information:
● The tab Main data:
Column Description
User name User name
User id User ID
Password Password
Account status Status of the user account
Def. tablespace Default tablespace name for user
Temp. tablespace Temporary tablespace name for user
Profile Profile name of user
Resource consumer gr. Resource consumption group of user
External name External name of user
Creation date User creation date
Creation time User creation time
Acc. lock date Date user account was locked
Acc. expiry date Date user account expires
● The tab History contains the following information for the sub-tab Days (the columns are analogous for the sub-tabs Weeks and Months):
NoteEach sub-tab on the History tab contains an average display separately at the top followed by detailed displays for each time period. The table below shows the average display. The detailed display is very similar.
Column Description
Date Analysis date
User name User name
User id User ID
CCMS: OracleThe DBA Cockpit PUBLIC 131

Column Description
Size (MB) Size in MB
Chg. Size/day Average daily change in size in MB
# Segments Number of segments
Chg. Segm/day Average daily change in number of segments
# Tables Number of tables
Chg. Tables/day Average daily change in number of tables
# Indexes Number of indexes
Chg. Indexes/day Average daily change in number of indexes
# Extents Number of extents
Chg. Extents/day Average daily change in number of extents
3.7.6 Tablespaces Overview
Definition
This monitor in the SAP/Oracle Database Monitor lets you display the tablespaces in the database, including history information. It uses a collector job to periodically retrieve data from the cluster table MONI.
Use
You choose Space Tablespaces Overview in the DBA Cockpit.
132 PUBLICCCMS: Oracle
The DBA Cockpit

Structure
This screen contains the following information:
● Tab Main Data:
Column Description
Tablespace name Name of tablespace
Size (MB) Size of tablespace in MB
Free (MB) Size of free space in the tablespace in MB
Used (%) Percentage of available space used in the tablespace
Autoextend Autoextend option
Total size (MB) Total size of tablespace in MB
Sum of all free fragments Total size of all free fragments in MB
Total used (%) Percentage of the total space used in tablespace
# Files Number of files in tablespace
# Segments Number of segments in tablespace
# Extents Number of extents in tablespace
Status Status of tablespace
Contents Type of tablespace data
Compress for Type of compression (as of Oracle 11.2)
Encrypted Tablespace encryption (as of Oracle 11.2)
Encrypt algorithm Encryption algorithm (as of Oracle 11.2)
● Tab Storage Management:
ColumnDescription
Tablespace name Tablespace name
Extent management Extent management tracking, DICTIONARY or LOCAL
Allocation type Type of extent allocation for tablespace
SSM Segment space management tracking, AUTO or MANUAL
CCMS: OracleThe DBA Cockpit PUBLIC 133

ColumnDescription
Block size (KB) Tablespace block size in KB
Init. extent (MB) Default initial extent size of tablespace in MB
Next extent (MB) Next extent size of tablespace in MB
Min. extents Minimum number of extents for tablespace
Max. extents Maximum number of extents for tablespace
PCT increase (%) Percentage increase of extents for tablespace
● Tab Data/Temp. Files (both sub-tabs have the same columns):
Column Description
File name File name
File id ID of the database data file
Tablespace name Tablespace name to which file belongs
Size (MB) Size of file in MB
# Blocks Number of Oracle blocks in the file
Status Status of file, INVALID or AVAILABLE
Rel. file number File number in the tablespace
Autoextensible Autoextensibe indicator for tablespace
Maxsize (MB) Maximum size of file in MB
Maxblocks Maximum size of file in Oracle blocks
Increment by Default increment for autoextension
User size (MB) Size of useful portion of file in MB
User blocks Size of useful portion of file in Oracle blocks
● Tab Freespace statistics:○ Sub-tab Overview:
Column Description
Tablespace name Tablespace name
134 PUBLICCCMS: Oracle
The DBA Cockpit
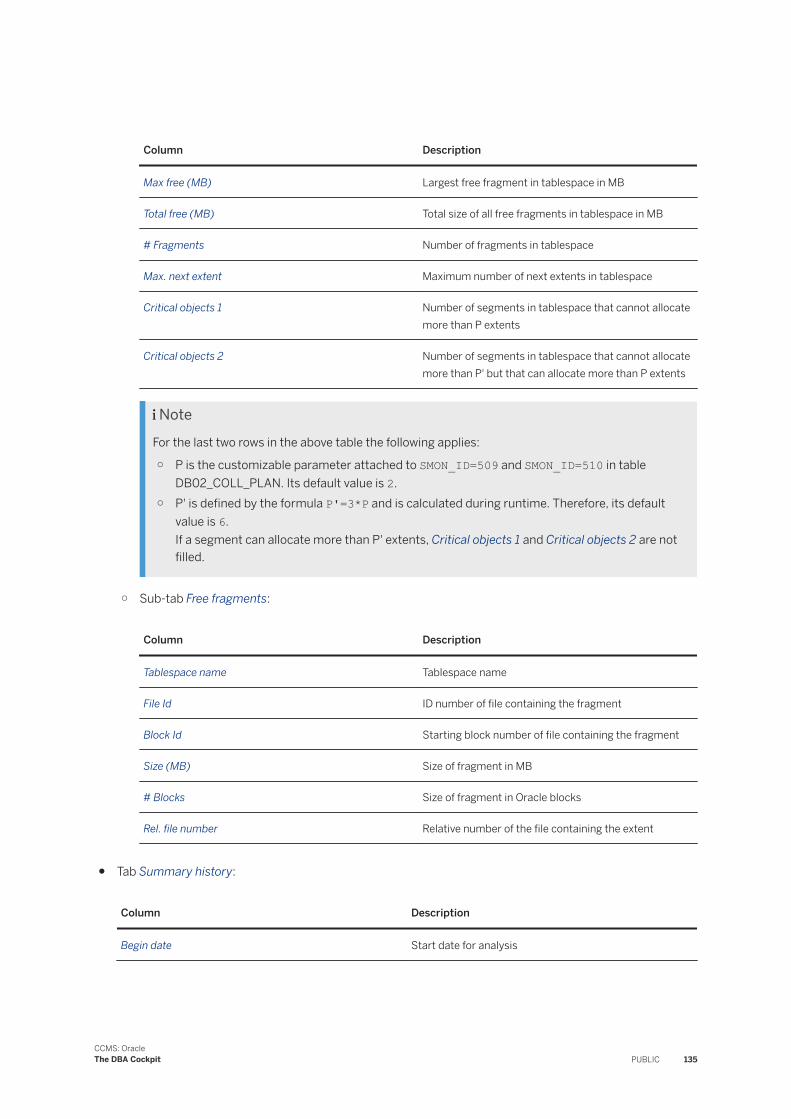
Column Description
Max free (MB) Largest free fragment in tablespace in MB
Total free (MB) Total size of all free fragments in tablespace in MB
# Fragments Number of fragments in tablespace
Max. next extent Maximum number of next extents in tablespace
Critical objects 1 Number of segments in tablespace that cannot allocate more than P extents
Critical objects 2 Number of segments in tablespace that cannot allocate more than P' but that can allocate more than P extents
NoteFor the last two rows in the above table the following applies:
○ P is the customizable parameter attached to SMON_ID=509 and SMON_ID=510 in table DB02_COLL_PLAN. Its default value is 2.
○ P' is defined by the formula P'=3*P and is calculated during runtime. Therefore, its default value is 6.If a segment can allocate more than P' extents, Critical objects 1 and Critical objects 2 are not filled.
○ Sub-tab Free fragments:
Column Description
Tablespace name Tablespace name
File Id ID number of file containing the fragment
Block Id Starting block number of file containing the fragment
Size (MB) Size of fragment in MB
# Blocks Size of fragment in Oracle blocks
Rel. file number Relative number of the file containing the extent
● Tab Summary history:
Column Description
Begin date Start date for analysis
CCMS: OracleThe DBA Cockpit PUBLIC 135

Column Description
End date End date for analysis
Tablespace name Tablespace name
Size (MB) Size of tablespace in MB
Chg. size/day Change in used size of tablespace per day
Free (MB) Free size in MB
Chg. free/day Change in free space in tablespace per day
Used (%) Percentage used space in tablespace
Chg. Used/day Change in used space in tablespace per day
Autoextend Autoextend flag, YES or NO
Total size (MB) Total size of tablespace in MB
Change of total size per day (MB/day) Change in total size of tablespace per day
Sum of all free fragments (MB) Total of all free fragments in tablespace in MB
Chg. free/day (MB/day) Change in free size in tablespace per day
Total used (%) Percentage of total space used in tablespace
Chg. Total used /day (%/day) Change in percentage of total space used in tablespace per day
# Files Number of files in tablespace
Chg. #files/day Change in number of files in tablespace per day
# Segments Number of segments in tablespace
Chg. #segments/day Change in number of segments in tablespace per day
# Extents Number of extents
Chg. #extents/day Change in number of extents in tablespace per day
136 PUBLICCCMS: Oracle
The DBA Cockpit

3.7.7 Tablespaces Detailed Analysis
Definition
This monitor in the SAP/Oracle Database Monitor lets you display detailed information about the tablespaces in the database, including history information. It uses a collector job to periodically retrieve data from the cluster table MONI.
Use
You choose Space Tablespaces Detailed Analysis in the DBA Cockpit.
The system prompts you to enter selection criteria for the tablespaces. You enter selection criteria to restrict the display to the required tablespaces. When the main grid is populated, you can double-click any row to display it in a more concise form in the Main data tab.
Structure
This screen contains the following information:
● The tab Main data:
Column Description
Tablespace name Tablespace name
Status Tablespace status, ONLINE, OFFLINE, or READ.
Contents Tablespace contents, PERMANENT or TEMPORARY
Logging Default logging attribute for tablespace
Forced logging Forced logging mode for tablespace
Extent management Extent management tracking, DICTIONARY or LOCAL
Allocation type Type of extent allocation for tablespace
Plugged in Specifies whether a tablespace is transported to an instance
Segment space mgment Segment space management tracking, AUTO or MANUAL
Def. table compression Default table compression mode, DISABLED or ENABLED
CCMS: OracleThe DBA Cockpit PUBLIC 137

Column Description
Size (MB) Size of tablespace in MB
Free (MB) Size of free space in tablespace in MB
Block size (KB) Tablespace in KB
Initial extent (MB) Default initial extent size of tablespace in MB
Next extent (MB) Default next extent size of tablespace in MB
Min. extents Default minimum number of extents for tablespace
Max. extents Default maximum number of extents for tablespace
PCT increase (%) Default percent increase of extent size for tablespace
Min. Extent length (MB) Minimum extent size for tablespace in MB
Compress for Type of compression (as of Oracle 11.2)
Encrypted Tablespace encryption (as of Oracle 11.2)
Encrypt algorithm Encryption algorithm (as of Oracle 11.2)
● The tab Files:
Column Description
File name File name
File id ID of the database data file
Tablespace name Tablespace name to which file belongs
Size (MB) Size of file in MB
#Blocks Number of blocks in file
Status Status of file, INVALID or AVAILABLE
Relative file number File number in the tablespace
Autoextend Autoextensibe indicator for tablespace
Maxsize (MB) Maximum size of file in MB
Maxblocks Maximum size of file in Oracle blocks
Increment by Default increment for autoextension
138 PUBLICCCMS: Oracle
The DBA Cockpit

Column Description
User size (MB) Size of useful portion of file in MB
User blocks Size of useful portion of file in Oracle blocks
● The tab Freespace:
Column Description
Tablespace name Tablespace name to which segment belongs
File id ID of database data file containing the fragment
Block Id Starting block number of file containing the fragment
Free (MB) Size of fragment in MB
# Blocks Size of fragment in Oracle blocks
Relative file number File number in tablespace containing the extent
● The tab History contains the following information for the sub-tab Days (the columns are analogous for the sub-tabs Weeks and Months):
NoteEach sub-tab on the History tab contains an average display separately at the top followed by detailed displays for each time period. The table below shows the average display. The detailed display is very similar.
Column Description
Date Date of analysis
Tablespace name Name of tablespace
Size (MB) Tablespace size in MB
Maxsize (MB) Maximum size of tablespace in MB
Free (MB) Size of free space in tablespace in MB
Maxblocks Maximum size of tablespace in Oracle blocks
Increment by Default increment for autoextension
User size (MB) Total space available for data in the tablespace or datafile in MB
CCMS: OracleThe DBA Cockpit PUBLIC 139

Column Description
Autoextend Autoextensibe indicator for tablespace
User blocks Number of blocks available for data in the tablespace
Block id Starting block number of file containing tablespace
Total free (MB) Total size of all free fragments in tablespace in MB
Chg. free/day (MB/day) Change in free size in tablespace per day
Total used (%) Percentage of total space used in tablespace
Chg. Total used/day (%/day) Change in percentage of total space used in tablespace per day
# Files Number of files in tablespace
Chg. #files/day Change in number of files in tablespace per day
# Segments Number of segments in tablespace
Chg. #segments/day Change in number of segments in tablespace per day
# Extents Number of extents
Chg. #extents/day Change in number of extents in tablespace per day
3.7.8 Segments Overview
Definition
This sub-monitor in the SAP/Oracle Database Monitor lets you display the segments in the database, including history information. It uses a collector job to periodically retrieve data from the cluster table MONI.
Use
You choose Space Segments Overview in the DBA Cockpit.
140 PUBLICCCMS: Oracle
The DBA Cockpit

Structure
This screen contains the following information:
● Main Data shows all segments
Column Description
Type Segment type
Size (MB) Segment size in MB
Avg. Size (MB) Average segment size in MB
# Segments Number of segments
# Extents Number of extents
More 100 Extents Number of segments of the specified segment type with more than 100 extents
Compressed Number of segments of the specified segment type that are compressed to reduce disk use
No Logging Number of segments of the specified segment type that do not log creation or modification in the redo log file
Not created Number of objects that have not yet been created on the database (as of Oracle 11.2)
● Top Sizes and Top Extents (the columns are identical)Top Sizes shows the segments with the largest sizes together with their space allocation fields.Top Extents shows the segments with the highest number of extents
Column Description
Owner Segment owner
Name Segment name
Partition Partition name
Type Segment type
Tablespace Tablespace name of segment
Size (MB) Segment size in MB
# Extents Number of extents
# Blocks Number of blocks
CCMS: OracleThe DBA Cockpit PUBLIC 141
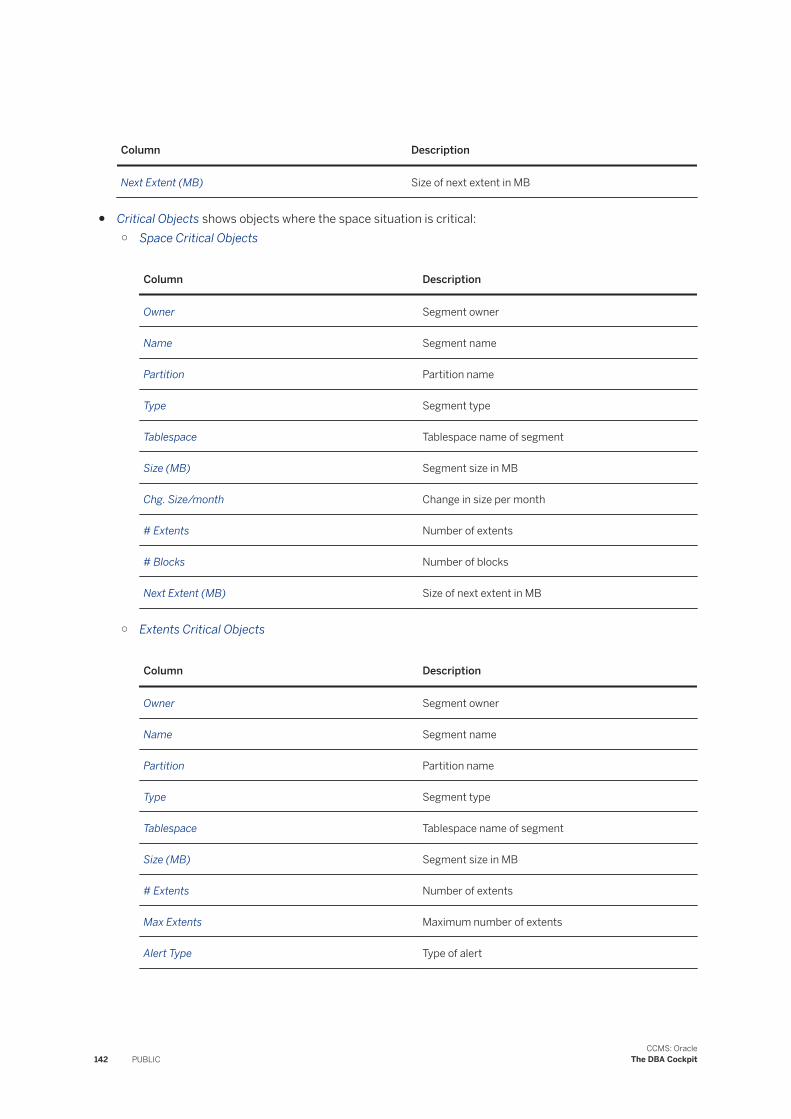
Column Description
Next Extent (MB) Size of next extent in MB
● Critical Objects shows objects where the space situation is critical:○ Space Critical Objects
Column Description
Owner Segment owner
Name Segment name
Partition Partition name
Type Segment type
Tablespace Tablespace name of segment
Size (MB) Segment size in MB
Chg. Size/month Change in size per month
# Extents Number of extents
# Blocks Number of blocks
Next Extent (MB) Size of next extent in MB
○ Extents Critical Objects
Column Description
Owner Segment owner
Name Segment name
Partition Partition name
Type Segment type
Tablespace Tablespace name of segment
Size (MB) Segment size in MB
# Extents Number of extents
Max Extents Maximum number of extents
Alert Type Type of alert
142 PUBLICCCMS: Oracle
The DBA Cockpit

● Summary History shows the history of changes to segments - the sub-tab Days is shown below (the columns are analogous for Weeks and Months)
Column Description
Begin date Start date for analysis
End date End date for analysis
Type Segment type
Size (MB) Segment size in MB
Chg. Size/day Change in segment size per day
Avg. Size (MB) Average segment size in MB
Chg. Avg. Size/Day Change in average segment size per day
# Segments Number of segments
Chg. Segments/Day Change in number of segments per day
#Extents Number of extents
Chg. Extents/day Change in number of extents per day
More 100 Extents Number of segments of the specified segment type that have more than 100 extents
Chg. More 100 Extents/day Change in number of segments of the specified segment type that have more than 100 extents per day
Compressed Number of segments of the specified segment type that are compressed to reduce disk use
Chg. Compressed/Day Change in number of segments of the specified segment type that are compressed to reduce disk use per day
Nologging Number of segments of the specified segment type that do not log creation or modification in the redo log file
Chg. Nologging/day Change in number of segments of the specified segment type that do not log creation or modification in the redo log file per day
CCMS: OracleThe DBA Cockpit PUBLIC 143

3.7.9 Segments Detailed Analysis
Definition
This sub-monitor in the SAP/Oracle Database Monitor lets you display selected segments in the database, including history information.
For the History tab, it uses a collector job to periodically retrieve data from the cluster table MONI. For the other tabs, it gathers data with an SQL statement in real time.
Use
You choose Space Segments Detailed Analysis in the DBA Cockpit.
The system prompts you to enter selection criteria for the segments. You enter selection criteria to restrict the display to the required segments. When the main grid is populated, you can double-click any row to display it in a more concise form in the Main data tab.
Structure
This screen contains the following information:
● Main data:
Column Description
Owner Owner name
Segment Name Segment name
Partition Name Partition name
Type Segment type
Tablespace Tablespace for segment
Header File Number of header files
Header Block Number of header blocks
Freelists Number of process freelists allocated in this segment
Freelist Group Number of freelist groups allocated in this segment
Relative FNO Relative number of the file containing the segment header
144 PUBLICCCMS: Oracle
The DBA Cockpit

Column Description
Buffer Pool Buffer pool
Size [MB] Size in MB
Extents Number of extents
Blocks Number of blocks
Initial Extents [MB] Size in MB of the initial extent of the segment
Next Extents [MB] Size in MB of the next extent to be allocated to the segment
Min Extents Number of minimum extents allowed in the segment
Max Extents Number of maximum extents allowed in the segment
PCT increase Percent increase in the size of the next extent to be allocated
Compressed Number of segments of the specified segment type that are compressed to reduce disk use
NoLogging Number of segments of the specified segment type that do not log creation or modification in the redo log file
Compress for Type of compression (as of Oracle 11.2)
● Tables + Indexes and Partitions (the columns are identical):
Column Description
Owner Owner name
Segment Segment name
Partition Partition name
Type Segment type
Tablespace Tablespace for segment
Size (MB) Segment size in MB
# Extents Number of extents
# Blocks Number of blocks
Initial Extents [MB] Size in MB of the initial extent of the segment
CCMS: OracleThe DBA Cockpit PUBLIC 145

Column Description
Next Extents [MB] Size in MB of the next extent to be allocated to the segment
Min. Extents Minimum number of extents allowed in the segment
Max. Extents Maximum number of extents allowed in the segment
Pct. Increase Percent increase in the size of the next extent to be allocated
Buffer Pool The default buffer pool to be used for segments blocks
● The tab Extents:
Column Description
Owner Owner name
Segment Segment name
Partition Partition name
Type Segment type
Tablespace Tablespace for segment
Extent Id Extent ID
File Id File ID
Block Id Block ID
Bytes Number of bytes
Blocks Number of blocks
Relative FNO Relative number of the file containing the segment header
● The tab Storage:The Main Data sub-tab shows the following information:
Column Description
Space
Allocated space (Kb) Allocated space in KB
Allocated blocks Number of allocated blocks
146 PUBLICCCMS: Oracle
The DBA Cockpit

Column Description
Allocated extents Number of allocated extents
Used blocks Number of blocks used
Never used blocks Number of blocks never used
Free in used blocks (%) Free space in used blocks as percentage
Total free space (%) Total free space as percentage
Block structure
Block Size (Kb) Size of block in KB
PCT free (%) Percentage free in block
PCT used (%) Percentage used in block
Transactions initial Number of initial transactions
Transactions maximum Number of maximum transactions
Header minimum (byte) Minimum header size in bytes
Extent structure
Initial extent (Kb) Size of initial extent in Kb
Next extent (Kb) Size of next extent in Kb
Min extents Minimum number of extents
Max extents Maximum number of extents
PCT increase (%) Percentage increase in extents
Rows
Total Total number of rows
Chained Number of chained rows
Avg. length (Bytes) Average row length in bytes
Avg. length + header (Bytes) Average row length including header in bytes
Avg. initial length (Bytes) Average initial row length in bytes
You can also view this information graphically in the Histogram sub-tab.
CCMS: OracleThe DBA Cockpit PUBLIC 147

● The tab History contains the following information for the sub-tab Days (the columns are analogous for the sub-tabs Weeks and Months):
NoteEach sub-tab on the History tab contains an average display separately at the top followed by detailed displays for each time period. The table below shows the average display. The detailed display is very similar.
Column Description
Date Date of analysis
Owner Owner name
Name Segment name
Partition Partition name
Type Segment type
Tablespace Tablespace for segment
Size (MB) Segment size in MB
Chg. Size/day Change in segment size per day
# Extents Number of extents
Chg. Extents/day Change in number of extents per day
# Blocks Number of blocks
Chg. Blocks/day Change in number of blocks per day
Next Extent [MB] Size in MB of the next extent to be allocated to the segment
Chg. Next Extent/day Change in size of extents per day
3.7.10 Segments Detailed Analysis (Aggregated)
Definition
This sub-monitor in the SAP/Oracle Database Monitor lets you display aggregated information on selected segments in the database and associated tables and indexes, partitions, and lobs, including history information and information.
For the History tab, it uses a collector job to periodically retrieve data from the cluster table MONI. For the other tabs, it gathers data with an SQL statement in real time.
148 PUBLICCCMS: Oracle
The DBA Cockpit

Use
You choose Space Segments Detailed Analysis (Aggregated) in the DBA Cockpit.
The system prompts you to enter selection criteria for the segments. You enter selection criteria to restrict the display to the required segments. When the main grid is populated, you can double-click any row to display it in a more concise form in the Main data tab.
Structure
This screen contains the following information:
● Main Data
Column Description
Owner Name of segment owner
Object name Object name
Object type Object type
Tablespace Tablespace name
Partitioned Whether segment is partitioned
Lobs Whether segment has lobs
Size [MB] Size in MB
Extents Number of extents
Blocks Number of blocks
# Partitions Number of partitions
# Lobs Number of lobs
Compress for Type of compression (as of Oracle 11.2)
Created Indicates whether the object has been created on the database (as of Oracle 11.2)
● Tables + Indexes
Column Description
Owner Name of object owner
CCMS: OracleThe DBA Cockpit PUBLIC 149

Column Description
Object Object name
Object type Object type
Tablespace Tablespace name
Size [MB] Size of object in MB
Extents Number of extents
Blocks Number of blocks
Partitioned Whether object is partitioned
# Partitions Number of partitions
Lobs Whether object has lobs
# Lobs Number of lobs
● Partitions
Column Description
Owner Name of object owner
Root name Root name of partition
Sub component name Subcomponent name of partition
Sub component type Subcomponent type of partition
Tablespace Tablespace name of partition
Size [MB] Size of partition in MB
# Extents Number of extents in partition
# Blocks Number of blocks in partition
Initial extents Number of initial extents in partition
Next extents Number of next extents in partition
Minimum extents Minimum number of next extents in partition
Maximum extents Maximum number of next extents in partition
Percentage increase Percentage increase in number of extents allocated
150 PUBLICCCMS: Oracle
The DBA Cockpit

Column Description
Buffer pool Buffer pool of the partition
● LobsThe information shown here is the same as the table above.
● History
NoteEach sub-tab on the History tab contains an average display separately at the top followed by detailed displays for each time period. The table below shows the average display. The detailed display is very similar.
Column Description
Date Date of analysis
Owner Name of object owner
Root name Root name of object
Type Segment type
Chg. Size Change in segment size per day
# Extents Number of extents
Change in #Extents / day Change in number of extents per day
# Blocks Number of blocks
Change in #Blocks / day Change in number of blocks per day
# Partitions Number of partitions
Change in #Partitions / day Change in number of partitions per day
# Lobs Number of lobs
Change in #Lobs / day Change in number of lobs per day
3.7.11 Collector Logs
Definition
This monitor in the SAP/Oracle Database Monitor lets you display information about the collection job.
CCMS: OracleThe DBA Cockpit PUBLIC 151

Use
You choose Space Additional Functions Collector Logs in the DBA Cockpit.
Structure
This screen contains the following information:
● The tab Overview:
Column Description
Dataset size (KB) Size in KB of the total amount of collected data stored in cluster table MONI
Avg. upload/mod (KB) Average collected data per collector module in KB
Avg. duration/mod Average runtime per module
Avg. upload/day (KB) Average collected data per day in KB
Avg. duration/day Average runtime per day
Max. upload (KB) Largest collection in terms of size in KB
Module ID Module ID
Date Date of largest collection in terms of size
Time Time of largest collection in terms of size
Max. duration Longest collection in terms of runtime
Module ID Module ID
Date Date of longest collection in terms of runtime
Time Time of longest collection in terms of runtime
● The tab Modules with more statistical information and logs for each collector module:
Column Description
Module ID Collector module ID
Module name Collector module name
Status Current status
152 PUBLICCCMS: Oracle
The DBA Cockpit

Column Description
Last col. date Date of last collection
Last col. time Time of last collection
Last upload (KB) Size of last collection in KB
Last duration Duration of last collection
Avg. upload (KB) Average upload within the previous LOG_LIFE days
Avg. duration Average duration within the previous LOG_LIFE days
Max. upload (KB) Largest upload within the previous LOG_LIFE days
Date max. upload Date of largest upload
Max. duration Longest runtime within the previous LOG_LIFE days
Date max. duration Date of longest runtime
Where LOG_LIFE appears in the above table, this refers to the number of days used in the analysis. LOG_LIFE is from the table ORA_MON_DBCON and is set to 100 days by default.
3.7.12 BW Analysis
Definition
This monitor in the SAP/Oracle DBA Cockpit lets you display SAP Business Information Warehouse (BW) objects belonging to the database.
You choose Performance Additional Functions BW Analysis in the DBA Cockpit.
Structure
The following BW object types are each highlighted using a different row color, since they are the aggregated data for each BW area:
● PSA area● ODS and Changelog● Cubes and related● BW master data● Basis and Cross-Application
Double-click a row to display the BW objects belonging to the selected object type.
CCMS: OracleThe DBA Cockpit PUBLIC 153

Double-click again a row to display the BW segments belonging to the selected BW object.
Double-click a BW segment displays the data below in the tabstrips.
The screen contains the following information:
● Top screen area
Column Description
BW Area BW area
BW Object Type BW object type
Details Details
# BW Objects Number of BW objects
# BW Root Objects Number of BW root objects
# Partitions Number of partitions
Size [MB] Size in MB
Extents Number of extents
Blocks Number of blocks
● Main Data● Partitions and LOBs
Column Description
Owner Name of partition or lob owner
Root name Root name of partition or lob
Sub component name Sub-component name of partition or lob
Sub component type Sub-component type of partition or lob
Tablespace Tablespace name of partition or lob
Size [MB] Size of partition or lob in MB
# Extents Number of extents for partition or lob
# Blocks Number of blocks for partition or lob
Initial extents Number of initial extents for partition or lob
Next extents Number of next extents for partition or lob
154 PUBLICCCMS: Oracle
The DBA Cockpit

Column Description
Minimum extents Minimum number of next extents for partition or lob
Maximum extents Maximum number of extents for partition or lob
Percentage increase Percentage increase in number of extents allocated
Buffer pool Buffer pool of the partition
3.8 Jobs (Oracle)
Use
You can use the DBA Cockpit for the following jobs:
● DBA Planning Calendar● DBA logs● Backup logs
3.8.1 Central Calendar
Use
The Central Calendar is part of the DBA Cockpit in the SAP system. It gives you a single point from which to manage database administration (DBA) actions in an integrated SAP environment. The actions available differ according to the database platform but the method of use is the same. Examples of actions are backups, database system checks, and so on.
NoteThe Central Calendar is only for viewing DBA actions by system.
However, you can easily switch to the DBA Planning Calendar for any SAP system registered in the DBA Cockpit to plan - that is, schedule, change, delete, or execute - DBA actions.
The Central Calendar gives you a single point from which to manage:
● Databases of different types and versions on remote SAP systems● Databases for different versions of the SAP system● Databases of non-ABAP SAP systems
Integration
CCMS: OracleThe DBA Cockpit PUBLIC 155
The Central Calendar runs with all database platforms delivered as a standard part of the SAP system and supported by SAP (except DB2 for i5/OS, which has good equivalent tools).
Features
● You can manage in real time systems directly administered from the system where the DBA Cockpit is running as well as remote systems, including non-ABAP systems.
● You can quickly check the color-coded status for each system to see if actions have executed successfully.● You can quickly check the number of actions and number of actions with the highest status severity for
each system, as shown in the following example:
TipThe entry for February 2007 in the cell for Thursday February, 08 is:
3 FUD 2
On system FUD for Thursday 8th January 2007 (in the past), there were 3 actions planned, 2 of which had the highest status severity. For example, the highest status severity might be "Warning", in which case the entry is displayed with a yellow background.
Activities
1. On the system where you normally run the DBA Cockpit, you plan a regular job in the DBA Planning Calendar to update the results from remote systems using the action Central Calendar Log Collector. For example, you plan this job to run daily at 06:00.
2. You define the systems you want to monitor in the DBA Cockpit by setting the flag Collect Central Planning Calendar Data for each system.
3. You regularly check the results using the Central Calendar.4. If you need to schedule, change, delete, or execute actions, you switch to the DBA Planning Calendar.
For more information, see Using the Central Calendar.
3.8.1.1 Using the Central Calendar
Use
You can use the Central Calendar in the DBA Cockpit to view actions on all the databases of your SAP Systems.
Prerequisites
● You have defined the systems to be displayed in the Central Calendar by double-clicking the required system in the screen DBA Cockpit: System Configuration Maintenance and selecting Collect Central Planning Calendar Data.For more information, see Configuring Systems for Remote Monitoring Using Remote Database Connections.
● In an ABAP system, make sure that you schedule the jobs for the remote database in the central monitoring system. Jobs that have been scheduled in the remote system are not displayed.
● In the DBA Planning Calendar of the DBA Cockpit where you call the Central Calendar, you have planned the action Central Calendar Log Collector to run regularly. This collects information from the defined remote systems for display in the Central Calendar.
156 PUBLICCCMS: Oracle
The DBA Cockpit

For more information, see Setting Up the DBA Planning Calendar.
Procedure
1. Start the Central Calendar from the DBA Cockpit by choosing Jobs → Central Calendar.The Central Calendar is displayed. If you have already run or planned actions, you see entries by day, one for each system.Here is an example of entries for Thursday February, 08 affecting two systems, FUD and FIB:
Tip
3 FUD 2
4 FIB 1
On system FUD for Thursday 8th January, there were three actions planned, two of which had the highest status severity. For example, the highest status severity for FUD might be "Finished with warning", in which case the entry for FUD is displayed with a yellow background. This means that two actions ended with a warning.
On system FIB for the same day, there were four actions planned, one of which ended with the highest severity. For example, the highest severity for FIB might be "Finished with error", in which case the entry for FIB is displayed with a red background. This means that one action ended with an error.
The following table shows the color-coded statuses in the Central Calendar, which you can also see by choosing Legend:
Color Status
Light blue Planned
Dark blue Running
Green Finished successfully
Yellow Finished with warning
Red Finished with error
Dark yellow No longer available
Dark red Scheduling failed
2. To see a summary of the actions for a day, double-click the day header.The system displays a summary of the actions and status for each system on the day you selected, as in the following example:
Tip
System Total No longer available
Scheduled Running Finished Warning Error Overdue
CCMS: OracleThe DBA Cockpit PUBLIC 157

FUD 3 1 2
FIB 4 3 1
3. To see the individual actions for a system, double-click the entry for the system on the required day.You see the relevant day in the DBA Planning Calendar. You can perform all usual functions in the DBA Planning Calendar.
4. To refresh the display for the system from which you called the Central Calendar, choose Refresh.5. To refresh the display for all systems, choose Remote Refresh.
You can remotely refresh the display as follows:
Method How the Refresh Runs
Run in Dialog Runs in dialog mode, which can take a long time, so not normally recommended
Start immediately Runs immediately in the background as a job
Schedule at Runs in the background at the time that you specify
NoteWe recommend that you schedule action Central Calendar Log Collector to run regularly, as described above in "Prerequisites".
6. If required, you can customize the calendar display as follows:○ Specify a factory calendar in Calendar ID.
Holidays are displayed in the same background color as weekend days. This in no way restricts the planning of actions in the DBA Planning Calendar.
○ Switch to day, week, or month view by choosing Administration → View Day, Administration → View Week, or Administration → View Month.
○ Choose Save Settings and change Number of Weeks or Entries per Day in the display.
3.8.2 DBA Planning Calendar (Oracle)
Use
You use the DBA Planning Calendar to automate database administration actions that have to be performed regularly. You are able to schedule operations such as online backups, have them automatically performed, and then check that the operation was successful.
The main function of the DBA Planning Calendar is to define the start times and parameters for database actions. Since these actions run without administrator interaction, you have to make sure in advance that the necessary resources are available.
158 PUBLICCCMS: Oracle
The DBA Cockpit

Integration
The DBA Planning Calendar is part of the Computing Center Management System (CCMS). You can start it from the DBA Cockpit.
Make sure that you meet the following requirements for BR*Tools when using the DBA Planning Calendar:
● BR*Tools 6.40: minimum patch level 42● BR*Tools 7.00: minimum patch level 24
If you are using the DBA Planning Calendar on a remote system, BR*Tools running on that system must meet the above requirements. For more information, see SAP Note 1025707 .
Features
Initial Screen
The initial screen of the DBA Planning Calendar is divided into the following frames:
● The frame on the left contains all information and parameters to select the set of actions to be displayed. You can:○ Select the system from which you want to read planning data.○ Select the category of an action:
○ DBA ActionsThese are actions that you can plan.
○ External ActionsThese are actions that are performed externally.
○ All ActionsThese are all actions.
○ Select the week to be displayed using the calendar control.The default is the current week. To navigate to another week, double-click the week you want to display.
○ Select a factory calendar.Specifying a factory calendar only has an impact on the calendar display. Holidays are the same color as weekend days. It does not result in any restrictions for planned actions.
● The frame on the right contains a list of all plannable actions that are currently available for your database.● The frame in the lower half of the screen contains the calendar.
By default, the week view with top-bottom layout is displayed, that is, one week starting with Monday. To change to a left-right split view, choose Logs Left-Right Split View Layout . If you want to change from a week view to a day or month view, choose the corresponding button in the tool bar.
NoteYou can only switch the layout for the week or month view. For the day view, only the left-right split view layout is available.
To change your preferred settings - that is, the layout and the view - choose Save Settings.
CCMS: OracleThe DBA Cockpit PUBLIC 159

The calendar shows the actions that were scheduled using background processing. These actions are then automatically executed. Once the action has run, the status is indicated using the following colors:
Color Meaning
Light blue The action has not yet started.
Dark blue The action has not yet finished.
Green The action has run successfully.
Yellow The action has finished with a warning.
Check the job log for details.
Red An error has occurred and the action was interrupted.
Check the job log for details and reschedule the action.
Dark yellow No more information is available.
Dark red Scheduling failed, that is, there is no status available and the action is overdue.
You can display the meaning of each color by choosing Legend.
Drag & Drop of Actions
You can move or copy actions within the calendar by using the drag & drop function.
Related Information
Setting Up the DBA Planning Calendar (Oracle) [page 160]
3.8.2.1 Setting Up the DBA Planning Calendar (Oracle)
Use
You need to set up the DBA Planning Calendar because - when you start your system for the first time - there are no actions planned. For this you need to do the following:
The most important thing when setting up the DBA Planning Calendar is to choose a pattern of actions covering your regular database administration (DBA) needs, specifying any required action parameters and taking account of any dependencies between actions, as described in the procedure below.
160 PUBLICCCMS: Oracle
The DBA Cockpit

ExampleYou set up a pattern to do the following:
● Check and update database statistics daily at 05:00.● Check database daily at 06:00.● Back up the database online and the logs daily at 22:00.● Clean up logs weekly at 07:00 on Sunday.
The DBA Planning Calendar offers you a number of preselected patterns, which you can later edit as required.
Caution● Some of the actions available have an impact on database performance and availability. Check the
start and end times of scheduled actions to make sure that they do not impact each other and that they do not impact other activities in your system.
● You cannot perform all required DBA actions from the DBA Planning Calendar or the DBA Cockpit. For more information on actions that you must perform with the SAP system down, such as offline database backup, see the SAP Database Administration Guide for your database
You can schedule the following actions with the DBA Planning Calendar:
Tasks Actions
Database backup and recovery Whole database offline + redo log backup
Whole database online backup
Whole database online + redo log backup
Full database offline + redo log backup
Full database online backup
Full database offline backup
Full database online + redo log backup
Incremental database offline + redo log backup
Incremental database online backup
Incremental database offline backup
Incremental database online + redo log backup
Partial database offline backup
Partial database online
Prepare for RMAN Backup
CCMS: OracleThe DBA Cockpit PUBLIC 161

Tasks Actions
Redo log backup
Space Management Adapt next extents
Compress database
Other Check database
Check and update optimizer statistics
Cleanup logs
Initialize tape
Validate structure
Verify database
Central Calendar Log Mirror
Prerequisites
Check the following before you start using the DBA Planning Calendar:
● SAP system authorizationsCheck that you have authorization for DBA and background job scheduling, which is provided by profiles S_RZL_ADMIN and S_BTCH_ALL.Check that external programs are able to run on the database server so that actions affecting the database can be performed from other application servers.
● Database system authorizationsCheck that actions requiring authorization to connect to the database are permitted. Some actions, such as online backup, require higher levels of authorization.Before scheduling database backups, see the information on how to back up the database in the SAP Database Administration Guide for your database.
● Hardware and backup mediaCheck that you have enough hardware (such as tape drives) and backup media (such as tapes) for the backup strategy you intend to use.You make sure that the media are initialized and ready so that the operator does not have to interrupt scheduled backup runs. For example, check that tapes are already in the specified tape drive or tape changer. You might require different tape drives for database backups and log backups.
You also need to make sure that the for BR*Tools - init<DBSID>.sap by default - is set up correctly for backup and archiving.
162 PUBLICCCMS: Oracle
The DBA Cockpit

Procedure
1. Start the DBA Planning Calendar from the DBA Cockpit by choosing Jobs DBA Planning Calendar .2. Choose Pattern Setup.3. Follow the wizard to set up a pattern of recurring actions to cover your regular DBA needs.
You can navigate between the actions in the pattern by choosing Next and Previous.4. When you have finished defining the pattern, choose Save on the last screen to enter the pattern into the
DBA Planning Calendar.
CautionWhen you start using the DBA Planning Calender in production operation, make sure that you check the results daily to make sure that actions have been executed correctly.
3.8.2.2 Configuring the Back End of the DBA Planning Calender (Oracle)
Use
You can configure the back end of the DBA Planning Calender to control the execution of background jobs. You can configure the back end for all systems, for selected database platforms, or for single systems only.
The system is configured by using the first available configuration from the following:
1. The system-specific configuration2. The configuration for the database platform3. The configuration valid for all platforms4. The standard configuration - current user, selection of background server by background dispatcher, high
priority
Procedure
1. Call the DBA Cockpit and choose Jobs Back End Configuration .
Note
Alternatively, choose Goto Back End Configuration from the menu in the DBA Planning Calendar.
2. In the Selected Scope group box, choose the scope of the configuration entry.3. In Background Dispatching group box, choose appropriate values as follows:4. Save your changes.
CCMS: OracleThe DBA Cockpit PUBLIC 163

3.8.2.3 Scheduling an Action (Oracle)
Procedure
1. To add new actions to the DBA Planning Calendar, you can use one of the following options:○ Double-click a calendar cell.○ Position the cursor on a calendar cell and choose Add.○ Drag and drop an action from the action pad into a calendar cell.
NoteYou can also use drag and drop to move actions within the calendar. If you want to copy an action, keep the CTRL key pressed while using drag & drop.
A dialog box appears with the details of an action.2. If you chose the first or second option in the first step, you can select the action you want to schedule from
the group box Action Description. In the Planned Start field, you can enter date and time when the action is to start. If you are entering an action for today and want to start the action immediately, choose Execute.If you chose the final option in the first step, the corresponding action is already listed as default.The parameters for the required action are displayed under Action Parameters. They vary depending on the action.
3. On the Action Parameters tab page, change or enter the basic parameters for the action.4. On the Recurrence tab page, enter a recurrence pattern.
CautionThe system warns you if there is a conflict with an existing action, but it does not prevent you from inserting the new action.
You must decide whether the actions might conflict in terms of database access or performance. The system does not check for conflicts between actions with identical start times, but checks for actions within a range of approximately 30 minutes.
5. To schedule the action, choose Add.
3.8.2.4 Changing an Action (Oracle)
Use
This section tells you how to change an action in the DBA Planning Calendar.
If you want to change a recurring action, the changes only affect recurrences of the action in the future. The action is split into two actions, one describing the old action and one the new action.
164 PUBLICCCMS: Oracle
The DBA Cockpit

Prerequisites
If you want to change an action, it must be in the state Planned (that is, not already executed).
NoteIf an action has already been executed, you can only display [page 167] it.
Procedure
1. Call the DBA Cockpit
2. Choose Jobs DBA Planning Calendar in the navigation frame of the DBA Cockpit.3. Position the cursor on a calendar cell and choose Edit.
A dialog box with the action parameters and recurrence pattern appears.4. Apply your changes and activate them by choosing either Change Current Occurrence or Change All
Occurrences.
3.8.2.5 Deleting an Action (Oracle)
Prerequisites
If you want to delete an action from the DBA Planning Calendar, it must be in the state Planned (that is, not already executed).
NoteIf an action has already been executed, you can only display [page 167] it.
Procedure
1. Call the DBA Cockpit.
2. Choose Jobs DBA Planning Calendar in the navigation frame.3. Double-click a calendar cell or position the cursor on a calendar cell and choose Delete.
A dialog box appears with a list of all actions to be deleted, where you can decide if you want to delete only a single occurrence of a recurring action or all occurrences.
4. To delete an action, choose Delete.
CCMS: OracleThe DBA Cockpit PUBLIC 165

3.8.2.6 Re-Executing an Action (Oracle)
Use
You might have to re-execute an action in the DBA Planning Calendar. To do this, you choose an action that has already finished and repeat it immediately.
ExampleHere are two examples when you might want to schedule an action for re-execution:
● An action such as a database backup has failed and you need to repeat it after correcting the error.● To solve a resource bottleneck you need to re-execute an action immediately rather than wait until its
next scheduled execution.
Procedure
1. Double-click the action you want to re-execute.The Display Details of Action dialog box appears where you can see the action parameters.
2. Check and, if necessary, change the action parameters.3. Choose Re-Execute.
NoteIf the action parameters are correct, you only need to position the cursor on the action and choose Execute.
The action is scheduled for immediate re-execution.
3.8.2.7 Displaying the Status of a Day's Actions (Oracle)
Procedure
1. Double-click the header cell for a particular day.The display switches to the day view. All scheduled actions are displayed.
NoteUnsuccessful or interrupted actions are shown in red.
2. If you want to view other days, select a new day by double-clicking a day on the calendar control at the left side of the screen.
3. To return to the week view, choose Week.
166 PUBLICCCMS: Oracle
The DBA Cockpit

3.8.2.8 Displaying Scheduled Actions (Oracle)
Use
You can view all action-related information from the DBA Planning Calendar:
● Action parameters● Job logs if the action has already run
These logs provide detailed information on the results of an action.● Recurrence patterns
The status of an action is indicated by the color of the calendar cell where an action is inserted.
Procedure
1. Select the action by double-clicking a calendar cell or by positioning the cursor on a cell and choosing Action Details.The Display Details of Action dialog box appears. In the Action Description group box, scheduling information and the return status of the finished action is displayed.
2. Choose Action Parameters to see how the action is defined.Some actions do not have any parameters.
3. For recurring actions, choose Recurrence to see when the action is scheduled to be repeated.
4. For actions that have finished, choose Action log Show Action/Detail Log to see information about the action.
CautionThe timestamp is used to assign logs to scheduled actions.
An action log is assigned to the action which has the same type and the closest corresponding timestamp. In some cases, for example, if no background work process is available, the action is delayed and even postponed until after the next scheduling time.
Unfortunately, this means that the action log is then assigned to the next scheduling time and the original scheduling time log is incorrect. This is the case if the logs for the previous schedules are displayed for the next schedule of the same type.
5. For jobs that have finished, choose Job Log to see information about the background job that executed the action.To display long texts, if any are available, double-click a message.
6. For actions that write log files to the database server, choose Program Log.Not all actions write program logs to the database server.
CCMS: OracleThe DBA Cockpit PUBLIC 167

3.8.2.9 Troubleshooting (Oracle)
Use
Since any action scheduled in the DBA Planning Calendar can fail, you must at least check the more critical actions such as database backups.
Procedure
1. To check whether the background job was executed correctly, consult the job log. If no job log exists, the background job was probably not started.For more details, call transaction SM37 and display the job overview.
NoteThe names of all jobs scheduled in the DBA Planning Calendar start with DBA. The job log also tells you whether an external program was started.
2. If you are sure that the background job ran successfully, consult the job log or program log (if available).3. After you have corrected the error, execute the action manually using Execute, making sure there are no
conflicts with other scheduled actions.
NoteIf you want to completely clean up your jobs, choose the Cleanup pushbutton. This deletes all jobs, all scheduling data, and all related protocol records. It also resets the DBA Planning Calendar to its initial state.
We recommend that you clean up after an SAP system upgrade or if jobs have become corrupt.
3.8.3 Displaying DBA Logs (Oracle)
Use
You can use the DBA Cockpit to view the database administration (DBA) logs created by various SAP tools during operations on the Oracle database.
Procedure
1. Call the DBA Cockpit and choose Jobs DBA Logs .
168 PUBLICCCMS: Oracle
The DBA Cockpit

2. Choose one of the following:○ To look at the logs for operations created using BR*Tools, choose BRSPACE, BRCONNECT,
BRARCHIVE, or BRBACKUP.○ To look at the logs for other operations, choose Others.○ To look at the logs for non-SAP data archiving, choose Data Archiving.○ To look at the logs for all operations, choose All.
You see a list of operations in the logs as follows:
Heading Description
Operation start Date and time for the start of the operation
Operation end Date and time for the end of the operation
FID Function ID indicating type of operation
RC Return code
For more information, see .
Database Operation Description of the operation
If required, choose Select Options to restrict the logs displayed.To see more detailed information about the database operation entries in any of the above logs, double-click the required line in the table.
3. Choose Function IDs for a list of all possible database operations, showing function ID, the program that executes the operation, and an explanation of the operation.You can double-click any line to jump to the list of logs for all database operations.
3.8.4 Display of the Backup Logs (Oracle)
Use
This section tells you how to display information on backup for your Oracle database, including the status of the backups and the backup logs.
Process
You choose one of the following functions:
● Database backupsUse this to display the BRBACKUP logs, either as an overview or for the last successful or unsuccessful backup. See Displaying Logs for Database Backups (Oracle) [page 170].
● Redo log backups
CCMS: OracleThe DBA Cockpit PUBLIC 169

Use this to display the location and status of the redo log directory as well as the amount of free space available in the directory, the backup status of offline redo logs, and BRARCHIVE backup action logs. See Displaying Logs for Redo Log Backups (Oracle) [page 171].
● Recovery reportUse this to check whether your backups are adequate for a database recovery and display the backup and redo logs currently required to recover the database. See Displaying the Recovery Report (Oracle) [page 173].
3.8.4.1 Displaying Logs for Database Backups (Oracle)
Use
Database backups provide information about backups of database data files for the Oracle database. You can find the date and time of the last successful backup and the last unsuccessful backup (return code not equal to 0 or 1). You can get an overview of how up-to-date your backups are. We recommend that you keep several generations of recent successful backups.
Procedure
1. Call the DBA Cockpit and choose Jobs Backup Logs .2. In Database backups, choose one of the following:
○ To see the last backup, choose Last successful backup or - if an unsuccessful backup exists - Last unsuccessful backup.You see the BRBACKUP action log:
Heading Description
Tape Tape name
Position Position of the file on the tape
Backup time Time the backup of the file ended
Compressn Compression rate (if compression was used)
DF ID Oracle data file ID
Backint ID Backup ID of Backint interface (only if external backup program was used)
Redo No. Log sequence number of the online redo log file
Tablespace name Tablespace name
170 PUBLICCCMS: Oracle
The DBA Cockpit

Heading Description
TS Status Oracle tablespace status
DF Status Oracle data file status
File Name Oracle data file name
To look at the system log for a data file in the backup, place the cursor on the relevant line and choose Detail log. For more information, see .
○ To see an overview of all existing backup logs, choose Overview of database backups (backups with errors are highlighted in red):
Heading Description
Backup function Type of backup
Start of backup Time the backup started
End of backup Time the backup ended
RC BRBACKUP return code
For more information, see .
Action ID/Log File system log name <Action ID>.<Function ID>
For more information, see .
To see more information about a backup, double-click the appropriate line to display the BRBACKUP action log, which is described in the first table above.To look at the system log for a data file in the backup, place the cursor on the relevant line and choose Detail log. For more information, see .
3.8.4.2 Displaying Logs for Redo Log Backups (Oracle)
Use
Redo log backups provide information about backups of the offline redo log files for the Oracle database. The system displays the amount of free space available in the archiving directory and the number of offline redo log files from the last generation that have not yet been backed up.
CCMS: OracleThe DBA Cockpit PUBLIC 171

Procedure
1. Call the DBA Cockpit and choose Jobs Backup Logs .2. In Redo log backups, choose one of the following:
○ To display an overview of the offline redo log files, choose Overview of redo log files:
Heading Description
Redo No Log sequence number
Archiving Time Time the offline redo log file was created
Tape Tape name
Position Position of the file on the tape
Backup time Time the offline redo log file was backed up
Backint ID Backup ID of Backint interface (only if external backup program was used)
Offline Redo Log Name Directory and name of the offline redo log file
○ To display an overview of all available backup logs for offline redo log backups, choose Overview of redo log backups (backups with errors are highlighted in red):
Heading Description
Function Type of backup
Operation Start Time redo log backup started
Operation End Time redo log backup ended
RC BRARCHIVE return code
For more information, see .
Action ID/Log File system log name <Action ID>.<Function ID>
For more information, see .
172 PUBLICCCMS: Oracle
The DBA Cockpit

To see more information about a redo log backup, double-click the appropriate line to display the BRARCHIVE action log:
Heading Description
Function Backup functions:
○ SaveCreates first copy of the offline redo log file
○ CopyCreates second copy of the offline redo log file
○ DelDeletes offline redo log file from the archiving directory
RedoNo. Log sequence number
Archiving time Time the offline redo log file was created (that is, archived)
Tape name Tape name
Pos. Position of the file on the tape
Backup time Time the offline redo log file was backed up
Compr Compression rate (if compression was used)
Backint ID Backup ID of Backint interface (only if external backup program was used)
Offline redo log file name Directory and name of the offline redo log file
To look at the system log for a redo log file in the backup, place the cursor on the relevant line and choose Detail log. For more information, see .
3.8.4.3 Displaying the Recovery Report (Oracle)
Context
The recovery report provides important information for use in the event of an Oracle database failure requiring database recovery. It displays the backups and redo logs currently required to recover the database .
CCMS: OracleThe DBA Cockpit PUBLIC 173

Procedure
1. Call the DBA Cockpit and choose Jobs Backup Logs Recovery Report .
The system display information about the last successful backup, such as backup type and tape names. This tells you which backup to use for a recovery. The report also checks whether the required redo log files are available, backed up on tape or in the archiving directory. Therefore, you know which files to restore in the event of a recovery.
2. Check the recovery report regularly to detect possible gaps in your backups:○ Missing redo log files mean that if an error occurs, you can no longer restore the database to the
current point in time. In this case, perform a complete database backup as soon as possible.○ If there are too many redo log files, a recovery to the current point in time might take too long. In this
case, perform a complete database backup as soon as possible.
Next Steps
174 PUBLICCCMS: Oracle
The DBA Cockpit

4 Database System Check
Use
You can use the database system check in the Computing Center Management System (CCMS) to identify existing and approaching critical situations in your Oracle database system in time. The database system check can be executed only with the database in the OPEN state. The database system check examines the following:
● Space (fill level and fragmentation)● Physical consistency (availability of data files, control files, and redo log files)● Specific problems based on DBA experience● Results of database operations● Oracle alert messages: alert_<DBSID>.log● Oracle profile parameters: init<DBSID>.ora
Integration
The database system check uses functionality.
Activities
To optimize the check of the Oracle database system, do the following:
● Configure the database system check according to your requirementsFor more information, see Configuring Database System Check [page 176].
● Automate the database system check in the DBA Planning Calendar. If you have selected an action pattern in the DBA Planning Calendar, the database system check is automatically planned to run daily every morning. See entry Check database in the calendar.For more information, see DBA Planning Calendar [page 158] and Scheduling an Action [page 164].
● Monitor the results and take action for all alerts from the database system checkFor more information, see Displaying Alert Messages from Database System Check [page 181].
CCMS: OracleDatabase System Check PUBLIC 175

4.1 Configuring Database System Check (Oracle)
Use
This section describes how you can configure the Oracle database system check [page 175] in the Computing Center Management System (CCMS) to:
● Add new conditions of type ORA or PROF● Exclude individual conditions from the check● Specify threshold values for the conditions● Create object-specific conditions to exclude them from the check● Create object-specific conditions to set individual threshold values● Specify corresponding corrective actions● Maintain the condition description
Prerequisites
● The configuration data for the database system check is stored in the DBCHECKORA table.● Changed or new condition take effect the next time Check database is executed by the DBA Planning
Calendar [page 158] or you execute a .● If a condition is met during a database system check, an alert is raised in the Oracle database monitor
[page 201]. For more information, see Displaying Alert Messages from Database System Check [page 181].
Procedure
1. Choose Administration CCMS DB Administration DB System Check Configuration . Alternatively, call transaction DB17.In Number of Database Check Conditions, you can see an overview of the current status of the check conditions:○ Database Administration: Number of database administration check conditions○ Database Operations: Number of database operation check conditions○ Database Messages: Number of Oracle alert check conditions○ Database Profile: Number of Oracle parameter check conditions○ Active: Number of active check conditions○ Inactive: Number of inactive check conditions○ Total: Total number of check conditions
In the table you can see the following columns:
176 PUBLICCCMS: Oracle
Database System Check

Column Description
Type Type of alert the condition is assigned to:
○ DBAThese conditions check database space (fill level and fragmentation), physical consistency (availability of data) and DBA-specific problems, in the database system.
○ DBOThese conditions check DBA operations that:○ Terminated or had errors between the time of
the last check and the current time. A terminated operation or one with errors is reported only once.
○ Have not been processed successfully since a specific (time) period
○ ORAThese are Oracle alert conditions. If there is an error, these are read from the Oracle alert file, alert_<DBSID>.log, and an alert is reported. You can define any number of new conditions (that is, Oracle error code or Oracle message strings).
○ PROFThese profile conditions compare the values of the Oracle database conditions with the values in the DBCHECKORA configuration table. You can define any number of new conditions (that is, Oracle profile conditions).
Condition The technical name of the condition.
○ Type DBA, see .○ Type DBO, see .○ Type ORA, see “Oracle Messages” in Database Health
Alerts [page 209].○ Type PROF, see “Profile Parameters” in Database
Health Alerts [page 209].
CCMS: OracleDatabase System Check PUBLIC 177

Column Description
Object Object-specific instance of a condition of type DBA or DBO. The instance can be used to exclude the object from the check or to individualize the object settings.
To specify object-specific instances of the condition, a corresponding master condition must exist. This master condition is the standard for all specific instances of the condition. This master condition does not contain any object specifications.
NoteOnly function IDs can be specified for conditions of type DBO. All function IDs used by DBA tools can be found in the table DBAFID.
Actv. Indicates whether the condition is active ( green) or inactive ( red)
Level Severity of the alert message:
E Error
W Warning
A Exception due to a deviation from the SAP standard (for example, a condition for a PROF alert message is not within the value range we recommend)
178 PUBLICCCMS: Oracle
Database System Check

Column Description
Operands,
Val.,
Unit
Definition of the threshold value using operand, value and unit.
Possible operands are: equal to, not equal to, less than, less than or equal to, greater than, greater than or equal to and greater than and less than.
The possible units are:
○ D Days○ G Gigabyte○ H Hours○ K Kilo○ M Megabyte or minutes○ P Percent○ R Rate○ S Seconds
ExampleWith Operand = >, V alue = 80 and Unit = P, an alert is triggered when the value of the condition checked exceeds 80%.
Period, Unit These fields are not used by BRCONNECT.
Date Date the last time the condition was changed
User User who made the last changes to the condition
CorrType Tool to use for the corrective measures:
○ D DBA action○ E Text editor○ H Hotline○ P DBA program○ R SAP report○ T SAP transaction
CorrMeasure Corrective measures to fix an alert for the condition
Description Description of condition
1. To display details about a selected condition, choose Details.The system displays details of the selected condition, as shown in the table below for creating a new condition.
2. To create a new condition of type ORA or PROF:1. Select an existing condition of the required type ORA or PROF.2. Choose Create with template.
CCMS: OracleDatabase System Check PUBLIC 179

3. Enter data in the fields displayed:
Screen Area Field Description
Condition definition Condition Type See Type in table above.
Choose Database message, to add a new condition of type ORA or Database Profile to add a new condition of type PROF.
Condition Name See Condition in table above.
Check object See Object in table above.
Active flag See Actv. in table above. Enter Yes to activate the parameter.
Condition level See Level in table above.
Check condition See Operands, Val., Unit in table above.
Description See Description in table above.
Repetition period Duration and Time Unit Not used
Corrective measure Correction type See CorrType in table above.
Corrective action See CorrMeasure in table above.
Changed by User and Date The user and date of the last change (you cannot enter data in these fields)
4. Choose Save to save your changes
3. To change a selected existing condition:1. Select an existing condition.2. Choose Change.3. Enter data in the fields displayed as described in the table above for creating a new condition.
NoteWhen you change an existing condition, you cannot enter data in all fields.
4. To make a selected condition object-specific, choose Copy for object and enter the name of the object in Check Object, then do the following:○ To exclude an object from the check, select No for Active Flag.○ To set an individualized threshold, enter data as described in the table above for creating a new
condition, making sure to enter data in the check condition fields.
180 PUBLICCCMS: Oracle
Database System Check

NoteYou cannot make all conditions object-specific.
5. To activate or deactivate a condition, select the relevant condition and select the Actv. field for that condition.The condition switches to active or not active.
4.2 Displaying Alert Messages from Database System Check
Use
This section describes how you can view alert messages for the Oracle database system check [page 175] in the Computing Center Management System (CCMS).
CautionAlways deal with alert messages as quickly as possible. Alert messages with severity E (error) are serious problems for which we recommend you to take immediate action.
For more information on alerts raised here, see Database Health Alerts [page 209].
Procedure
1. Choose Administration CCMS DB Administration DB System Check Display alerts . Alternatively, choose transaction DB16.The system shows the following display:
Screen Area Field Description
Check results Red light Number of error alerts
Yellow light Number of warning alerts
Gray light Number of exception alerts, that is, where there is a deviation from the SAP standard value
Total The sum of errors, warnings, and exceptions
CCMS: OracleDatabase System Check PUBLIC 181

Screen Area Field Description
Settings View the last Controls the period for which the alerts are displayed
Refresh every Controls the refresh interval for the alerts
Delete after Controls the period after which alerts are deleted
Alert table Level Severity of the alert message:
E: Error (for errors of alert type DBA take immediate action)
W: Warning
A: Exception due to a deviation from the SAP standard (for example, a parameter for a PROF alert message is not within the value range we recommend)
C: An error occurred, but it has been fixed
Date Date of alert
Time Time of alert
Days Age in days of alert
Type Alert message type ( DBA, DBO, ORA, and PROF) to which the parameters of the database system check are assigned
For more information, see Configuring Database System Check [page 176].
Name The technical name of the condition.
Type DBA, see .
Type DBO, see .
Type ORA, see “Oracle Messages” in Database Health Alerts [page 209].
Type PROF, see “Profile Parameters” in Database Health Alerts [page 209].
Object An object-specific alert of type DBA or DBO.
182 PUBLICCCMS: Oracle
Database System Check

Screen Area Field Description
Number Number of alerts of the same kind
Description Description of the alert
2. You can perform the following actions:○ Refreshing the alert display
Choose Refresh to read the check results again and so refresh the alert display.To automatically refresh the display, choose Settings Auto-refresh Activate . To set the time interval for automatic refresh, choose Settings Auto-refresh Time interval .
○ Starting database system checkChoose Start to immediately start the database system check.
○ Viewing standard or history○ Choose Standard to view all open messages in the selected time period.○ Choose History to view all messages.
○ Configuring the database system checkChoose Configure to configure database system check [page 176].
○ Viewing the database operations monitorChoose DBA Operations to display the DBA logs [page 168].
○ Working with individual alerts○ To see full details of an alert, double-click on the alert and choose Check log.
○ To delete a selected alert, choose Edit Delete .
○ To reset a selected alert that you have fixed, choose Edit Reset.
○ To refresh a selected alert, choose Edit Refresh .○ Configuring the alert display
○ Choose Settings View Time Period and enter the number of days for which you want to view alerts. For example, if you enter 5 days, you see standard or history alerts for the last five days.
○ Choose Settings Auto-delete Activate to automatically delete alerts after the specified time interval. To set the time interval, choose Settings Auto-delete Time Interval .
○ To save your settings, choose Settings Save settings .
CCMS: OracleDatabase System Check PUBLIC 183

5 Update Statistics for the Cost-Based Optimizer in CCMS (Oracle)
Use
You can update statistics on the Oracle database using the Computing Center Management System (CCMS).
By running update statistics regularly, you make sure that the database statistics are up-to-date, so improving database performance. The Oracle cost-based optimizer (CBO) uses the statistics to optimize access paths when retrieving data for queries. If the statistics are out-of-date, the CBO might generate inappropriate access paths (such as using the wrong index), resulting in poor performance.
The CBO is a standard part of the SAP system. If statistics are available for a table, the database system uses the cost-based optimizer. Otherwise, it uses the rule-based optimizer.
You can also run update statistics for your Oracle database using BRCONNECT. Refer to . This is the recommended way to update statistics.
NoteUpdate statistics after installations and upgrades
You need to update statistics for all tables in the SAP system after an installation or an upgrade. This is described in the relevant installation or upgrade documentation.
Process
1. You use the DBA Planning Calendar in CCMS to schedule regular execution of check statistics and, if necessary, update statistics. For more information, see Updating Statistics in the DBA Planning Calendar (Oracle) [page 185].
2. If required, you run one-off checks on tables to see if the table's statistics are out-of-date, and then run an update statistics for the table if required. This is useful, for example, if the data in a table has been significantly updated, but the next scheduled run of update statistics is not for a long time.You can check, create, update, or delete statistics for:○ Single tables [page 186]○ Groups of tables [page 190]
3. If required, you configure update statistics [page 191] by amending the parameters in the control table DBSTATC . This control table contains a list of the database tables for which the default values for update statistics are not suitable. If you change this table, all runs of update statistics - in BRCONNECT, CCMS, or the DBA Planning Calendar - are affected.Configuring update statistics makes sense with large tables, for which the default parameters might not be appropriate.Do not add, delete, or change table entries unless you are aware of the consequences.
184 PUBLICCCMS: Oracle
Update Statistics for the Cost-Based Optimizer in CCMS (Oracle)

5.1 Updating Statistics in the DBA Planning Calendar (Oracle)
Prerequisites
● You are ready to use CCMS [page 6].● You know how to use the DBA Planning Calendar.
For more information about scheduling an action (for example, update statistics) in the DBA Planning Calendar, see Scheduling an Action (Oracle) [page 164]. Update statistics is one of the predefined action patterns in the DBA Planning Calendar, so you do not need to add it separately.
● You can prioritize the statistics for critical tables by changing entries in the control table DBSTATC. For more information, see Configuring Update Statistics in CCMS (Oracle) [page 191].
● If you want to update statistics for a single table or a group of tables, instead of for all tables (as in this procedure), see the following:○ Updating Statistics for a Single Table (Oracle) [page 186]○ Updating Statistics for Groups of Tables in CCMS (Oracle) [page 190]
Context
You can use the DBA Planning Calendar in the Computing Center Management System (CCMS) to schedule check and update statistics for the cost-based optimizer in the Oracle database.
All tables in the database are then automatically checked and updated on a regular basis.
NoteThe action that you plan with this procedure now includes both check statistics and update statistics in a single integrated phase. This is equivalent to the two-phase approach previously used. For more information, see .
Procedure
1. Choose Administration CCMS DB Administration DBA Planning Calendar . Alternatively, call transaction DB13.
2. Choose the day when you want the statistics to be checked and updated.3. Choose Create action.4. Select Check and update optimizer statistics to check and update statistics.5. Enter data as required in the fields Start Time, Period (weeks), and Calendar.
CCMS: OracleUpdate Statistics for the Cost-Based Optimizer in CCMS (Oracle) PUBLIC 185

RecommendationWe recommend you to schedule this action every week, preferably at a time when the database is not under heavy load. It might take several hours to complete and can significantly load the system.
6. Choose Continue.
Results
The check and update statistics are now scheduled. They are executed at the scheduled date and time. For more information about looking at the results, see Displaying the Status of a Day's Actions (Oracle) [page 166].
5.2 Updating Statistics for a Single Table (Oracle)
Use
You can use this procedure to update the statistics for a single table in your Oracle database if required. For example, use this function when:
● You or SAP EarlyWatch Alert determine that the statistics for a particular table are out-of-date. That is, you have a performance problem relating to out-of-date table statistics.
● You import a large amount of data into a particular table (for example, using batch input). The additional records make the statistics inaccurate.
Update statistics is an online action that does not basically affect system operation, although it creates a certain amount of additional load on the database.
Prerequisites
● This procedure uses .● For more information on updating statistics in the DBA Planning Calendar, see Updating Statistics in the
DBA Planning Calendar (Oracle) [page 185].
Procedure
1. Choose Administration CCMS DB Administration Cost-based optimizer Create statistics . Alternatively, call transaction DB20.
2. Enter the name of the table in Table (do not enter a generic name or pattern) and choose Refresh information to display information about current table statistics.
186 PUBLICCCMS: Oracle
Update Statistics for the Cost-Based Optimizer in CCMS (Oracle)

The system displays the following information:
Screen Area Field Description
Status Status message The system displays a status message and a color-coded status indicator for the displayed table:
Green: Statistics are up-to-date
Yellow: Statistics are not up-to-date
Red: Statistics are damaging or missing
Gray: Ignore flag is set in DBSTATC for this table
New method The update statistics method to be used the next time update statistics runs:
E Estimate table statistics including indexes
EH Estimate table statistics and create histograms
EI Estimate table statistics and verify index structure
EX Estimate table statistics, create histograms, and verify index structure
C Compute table statistics including indexes
CH Compute table statistics and create histograms
CI Compute table statistics and verify index structure
CX Compute table statistics, create histograms, and verify index structure
For more information, see .
New sample size The sample size to be used the next time update statistics runs. For more information, see .
Last refresh Old method The update statistics method used in the last run of update statistics. See New method above for possible values.
CCMS: OracleUpdate Statistics for the Cost-Based Optimizer in CCMS (Oracle) PUBLIC 187

Old sample size The sample size for create statistics in the last run of update statistics. For more information, see .
Date Date when the last statistics were created
Time Time when the last statistics were created
Number of Table Entries Old value Number of rows in the table when the last statistics were created
New value Current number of rows in the table
Deviation old / new Percentage deviation between Old value and New value
Deviation new / old Percentage deviation between New value and Old value
DBSTATC Settings Use The service or application for which the table entry is used:
A (application monitor) For the SAP application monitor (ST07) and the optimizer
O (optimizer) Only for the optimizer (standard setting)
188 PUBLICCCMS: Oracle
Update Statistics for the Cost-Based Optimizer in CCMS (Oracle)

Active Control flag, indicating if and how the statistics are updated or created, and in which context they are used. The possible settings are:
A (Active) Statistics are checked and updated if needed.
N (No) Statistics cannot be created. You can only set this if Use is O. BRCONNECT deletes existing statistics during next run of brconnect -f stats.
P (Priority) Priority Statistics (P) are checked and updated if needed before statistics with lower priority (A).
R (Restrictive) Statistics can be temporarily created. Set this for pool or cluster tables if Use is A. BRCONNECT deletes statistics immediately after they have been stored in the DBSTATTORA and DBSTATIORA tables.
U (Unconditional) Statistics are updated without checking during every run of brconnect -f stats.
I (Ignore) BRCONNECT does not check whether create or update statistics is required. If statistics are present, they are not updated or deleted.
Analysis method See New method in screen area Status above.
Sample size See New sample size in screen area Status above.
History Statistics results are archived to the DBSTATHORA and DBSTAIHORA tables.
Customer Suppresses warnings issued by BRCONNECT if pool or cluster tables were specified in the DBSTATC table to always have statistics. Only use this field in exceptional circumstances.
Update BRCONNECT updates statistics once without check, even when Active is I, N, or R. When it has finished, brconnect -f stats resets the Update field.
CCMS: OracleUpdate Statistics for the Cost-Based Optimizer in CCMS (Oracle) PUBLIC 189

Check BRCONNECT checks once whether new statistics are required and updates them if necessary, even when Active is I, N, or R. If required, you can manually change the entries in the DBSTATC control table with transaction DB21. When it has finished, brconnect -f stats resets the Check field.
3. Choose Create statistics to update statistics for the table using the values in Status. We recommend you to only change the values in Status in exceptional circumstances.
4. The system updates statistics for the table and updates Last statistics and Number of table entries.5. Choose Delete statistics to delete statistics for the table.6. Choose Check structure to , using with the option -t <table name> -v cascade.7. Choose Standard Operations to update statistics for groups of tables in the database [page 190].8. Choose Configure to configure update statistics [page 191], that is, edit the DBSTATC table.9. Choose DBA Operations to display DBA logs [page 168].
5.3 Updating Statistics for Groups of Tables in CCMS (Oracle)
Prerequisites
This procedure uses .
Context
You can use this procedure to update the statistics for groups of tables in your Oracle database.
RecommendationWe normally recommend you to schedule update statistics in the DBA Planning Calendar [page 185], so that it is automatically executed at regular intervals.
190 PUBLICCCMS: Oracle
Update Statistics for the Cost-Based Optimizer in CCMS (Oracle)
Procedure
1. Choose Administration CCMS DB Administration Cost-based optimizer Create statistics . Alternatively, call transaction DB20.
2. Choose Standard operations.3. Select one of the following:
○ Update StatisticsDeletes unwanted statistics, checks statistics for each table and updates them if required, using with the option -t all.
○ Update Statistics (DBSTATC)Updates statistics for tables with an entry in the DBSTATC control table, using with the option -t dbstatc_tab.
○ Create missingCreates statistics for all tables and indexes that ought to have statistics but do not currently, using with the option -t missing.
○ HARMFULusing with the option -d harmful.
4. Choose Start to activate the selected function.5. To check the results, choose DBA Operations.
For more information, see Displaying DBA Logs (Oracle) [page 168].
5.4 Configuring Update Statistics in CCMS (Oracle)
Use
The table DBSTATC controls the update of statistics for the cost-based optimizer. The entries in the control table DBSTATC are administered according to the . Only change the control table under special circumstances.
This procedure lets you:
● Display the control table, to check the settings for the CBO update statistics. Use this, for example, to check if a statistics update is planned, the last time settings were changed, or which method was used to update the statistics.
● Change the default method for collecting statistics
Prerequisites
At delivery, the control table DBSTATC contains more than 400 entries. The tables in the control table are those (among others) that:
● Require regular updates of their CBO statistics
CCMS: OracleUpdate Statistics for the Cost-Based Optimizer in CCMS (Oracle) PUBLIC 191

● Belong to the application monitor● Are to be excluded from statistic updates● Require a special analysis method
CautionIf you are not completely certain a change is required, do not add, delete or edit any of the entries in the control table. Deleting entries may delay updating of old CBO statistics. Adding and editing entries may unnecessarily increase runtimes for updates of CBO statistics, or reduce the effectiveness of the statistics.
Procedure
1. Choose Administration CCMS DB Administration Cost-based optimizer Configuration . Alternatively, call transaction DB21.
2. Check the control table entries.The table includes the following columns:○ Database object: Name of the SAP table, whose statistics are to be checked and updated○ Database: Database system type (for example, ORACLE or space, which means relevant for all
database systems)○ Use: Use of the table in the SAP System:
○ A: For the application monitor ( ST07) and also for the optimizer○ O: Only for the optimizer (default setting)
○ Active: Control flag, indicating if and how the statistics are updated or created, and in which context they are used. The possible settings are:○ A (Active)
Statistics are checked and updated if needed.○ N (No)
Statistics cannot be created. You can only set this if Use is O. BRCONNECT deletes existing statistics during the next run of brconnect -f stats.
○ P (Priority)Priority Statistics (P) are checked and updated if needed before statistics with lower priority (A).
○ R (Restrictive)Statistics can be temporarily created. Set this for pool or cluster tables if Use is A. BRCONNECT deletes statistics immediately after they have been stored in the DBSTATTORA and DBSTATIORA tables.
○ U (Unconditional)Statistics are updated without checking during every run of brconnect -f stats.
○ I (Ignore)BRCONNECT does not check whether create or update statistics is required. If statistics are present, they are not updated or deleted.
NoteOnly set this to N in emergencies. For the CBO, setting R is sufficient.
192 PUBLICCCMS: Oracle
Update Statistics for the Cost-Based Optimizer in CCMS (Oracle)

○ TODO: When set, the statistics for the table are updated or created during the next update statistics run. To force an update of statistics for a table, set the TODO flag yourself.
○ Analysis: Analysis method used to update or create the statistics. You can manually change the setting if required. The possible analysis methods are:○ E
Estimate table statistics including indexes○ EH
Estimate table statistics and create histograms○ EI
Estimate table statistics and verify index structure○ EX
Estimate table statistics, create histograms, and verify index structure○ C
Compute table statistics including indexes○ CH
Compute table statistics and create histograms○ CI
Compute table statistics and verify index structure○ CX
Compute table statistics, create histograms, and verify index structureFor more information, see .
○ Sample: Shows the sample size for update statistics. For more information, see .○ Hist: Statistics results are archived to the DBSTATHORA and DBSTAIHORA tables.○ Cust: Suppresses warnings issued by BRCONNECT if pool or cluster tables were specified in the
DBSTATC table to always have statistics. Only use this field in exceptional circumstances.3. Choose New entries to add tables to the control table DBSTATC as follows:
Screen Area Field Description
Object information Database object Table name (for example, APQD)
Object type Database object type (default setting: 01 for table)
Object owner Owner of the object (default setting SAPR3).
Database type Database system type (for example, ORACLE).
You do not normally have to enter this field
EDM Cluster An area in the Enterprise Data Model (EDM)
CCMS: OracleUpdate Statistics for the Cost-Based Optimizer in CCMS (Oracle) PUBLIC 193

Screen Area Field Description
Default settings Use This identifies the service or application for which the table entry is used:
A (application monitor)
For the SAP application monitor (ST07) and the optimizer
O (optimizer)
Only for the optimizer (standard setting)
Active flag See Active above.
Changed on Date the entry in the DBSTATC control table was changed.
Analysis method See Method above
Sample size Sample size for updating statistics
For more information, see .
History Statistics results are archived to the DBSTATHORA and DBSTAIHORA tables
Customer flag Suppresses warnings issued by BRCONNECT if pool or cluster tables were specified in the DBSTATC table to always have statistics
Only use this field in exceptional circumstances.
ToDo settings Changed on Date the ToDo entry in the DBSTATC control table was changed.
Check BRCONNECT checks once whether new statistics are required and updates them if necessary, even when Active is I, N, or R.
When it has finished, brconnect -f stats resets the Check field.
Update BRCONNECT updates statistics once without check, even when Active is I, N, or R.
When it has finished, brconnect -f stats resets the Update field.
Save the new entry and exit the table maintenance function.
194 PUBLICCCMS: Oracle
Update Statistics for the Cost-Based Optimizer in CCMS (Oracle)

Note
An alternative method to add entries to the control table is to choose Edit Copy as... . Choosing Copy as... means you only have to modify and save the copied entry.
4. Choose Details to edit a selected table entry.5. Choose Delete to delete a selected entry from the table DBSTATC.
More Information
●● Updating Statistics in the DBA Planning Calendar (Oracle) [page 185]
CCMS: OracleUpdate Statistics for the Cost-Based Optimizer in CCMS (Oracle) PUBLIC 195

6 Maintaining Database Parameters (Oracle)
Use
This procedure lets you:
● Display and change the current Oracle database parameters online● Check the status and validity of the Oracle database parameters● Display the history of the Oracle database parameters
Procedure
To call DB parameter maintenance, choose Administration CCMS DB administration DB parameters . Alternatively, call transaction DB26.
The frame Number of database profile parameters includes the number of:
● All Oracle database parameters● Oracle database parameters currently at their default value● Database parameters modifiable for the system (command ALTER SYSTEM ...)● Database parameters modifiable for the session (command ALTER SESSION ...)● Parameters modified since the last database start● Database parameters in alert status, for which the current value is different than the value specified in the
database system check (table DBCHECKORA)
The individual database parameters are displayed in a table. The table includes the following columns:
Column Meaning
Name Name of the database parameters
Value Value of the database parameter
196 PUBLICCCMS: Oracle
Maintaining Database Parameters (Oracle)

Column Meaning
Status Status of the database parameter
Red
The value of the database parameter is different than the threshold value or not within the validity range specified in the database system check. The severity of this value is set to Error.
Yellow
The value of the database parameter is different than the threshold value or not within the validity range specified in the database system check. The severity of this value is set to Warning.
Green
The value of the database parameter is identical to the threshold value or within the validity range specified in the database system check
Gray
The parameter is not checked by the database system check.
More information:
Configuring Database System Check [page 176]
Changed Whether the parameter has been changed since the last database start
FALSE
The parameter has not been changed since the last database start.
MODIFIED
The parameter was changed using the command ALTER SESSION ... since the last database start.
SYSTEM_MOD
The parameter was changed using the command ALTER SYSTEM ... since the last database start.
CCMS: OracleMaintaining Database Parameters (Oracle) PUBLIC 197

Column Meaning
Default Whether the parameter set to its default value
TRUE
Parameter is set to default value
FALSE
Parameter is not set to default value
Ses.modif. Whether the database parameter can be modified for the session?
TRUE
The parameter can be modified during the session using the command ALTER SESSION ...
FALSE
The parameter cannot be modified during the session.
NoteModifying a parameter immediately affects the database user session in which the parameter was modified. In the SAP context this means that the change affects all SAP user sessions for which dialog steps are processed by this database work process.
Since this does not involve all SAP user sessions, changes to session-modifiable parameters are not supported.
198 PUBLICCCMS: Oracle
Maintaining Database Parameters (Oracle)

Column Meaning
Sys.modif. Can the database parameter be modified for the whole system?
IMMEDIATE
The parameter can be changed using the command ALTER SYSTEM .... This means that it takes effect for all current database user sessions and for the entire database.
DEFERRED
The parameter can be changed using the command ALTER SYSTEM ... and it takes effect for all future database user sessions (for example, for SAP application servers started after the change went into effect).
FALSE
The parameter is not system-modifiable.
NoteTo use the command ALTER SYSTEM ... you must have an authorization for ALTER SYSTEM for the database.
Adjusted Was the parameter automatically adjusted by the database system?
TRUE
The parameter was automatically adjusted by the database system.
FALSE
The parameter was not automatically adjusted by the database system.
Description Oracle description for the database parameter
Displaying Specific Views of Database Parameters
● To display all database parameters, choose Selection criteria All .
● To display all system-modified database parameters, choose Selection criteria System modifiable .
● To display all session-modified database parameters, choose Selection criteria Session modifiable .
● To display all Oracle database system parameters with the default value, choose Selection criteriaDefault .
● To display all Oracle database system parameters that are not set to the default value, choose Selection criteria Not default .
CCMS: OracleMaintaining Database Parameters (Oracle) PUBLIC 199

● To display all parameters modified since the last database start, choose Selection criteria Modified since startup .
● To display all parameters checked using the function Database System Check since the last database start, choose Selection criteria With check .
● To display all parameters in alert status, choose Selection criteria In alert status .
Updating Database Parameter Display
To update the display of database parameters, choose Refresh.
Displaying Details and History for a database parameter
1. Select an entry.2. Choose Details and history.
In addition to the details and history for the database parameter, the system also displays the threshold value specified in the database system check.
Displaying History for all Database Parameters
Choose Goto Total history .
● To display only the database parameters modified since the SAP System was implemented, choose With history.
● To display only the database parameters modified since a certain date, choose Selection date.● To display a history for all database parameters, choose All parameters.
Changing Database Parameters
Only system-modifiable database parameters can be changed online. These parameters have either the value IMMEDIATE or DEFERRED in the Sys.modif column.
1. Select an entry.2. Choose Change.3. Change the value of the database parameter.4. Choose Save.
NoteTo make the change effective even after a database restart, you must maintain the database parameter in the init<DBSID>.ora Oracle initialization file or server parameter spfile.
You can usually find this file in:
○ $ORACLE_HOME/dbs for UNIX○ %ORACLE_HOME%\database for Windows
We recommend you to use BRSPACE for this. For more information, see .
Displaying the init<DBSID>.ora Oracle Initialization File
To display the Oracle initialization file init<DBSID>.ora, choose Display Oracle profile.
200 PUBLICCCMS: Oracle
Maintaining Database Parameters (Oracle)

7 Monitoring the Oracle Database
Use
With the Oracle database alert monitor, you can keep track of the following database functions for your SAP System:
● Space management [page 202] to monitor tablespaces and segments.● Performance [page 205] to monitor optimizer statistics, buffers, logs, and checkpoints● Backup/restore [page 207] to monitor database and redo log backup● Consistency [page 208] to check the consistency between the indexes, database objects, and database
tables included in the ABAP Dictionary and those in the Oracle data dictionary.● Health [page 209] to monitor BRCONNECT database system checks
By configuring data collection tools, or methods, to run periodically, alerts are automatically updated and fed into the monitoring architecture. Analysis tools provide additional information about the alert conditions, and auto-react tools can be configured to automatically respond when an alert occurs.
For more information, see Information on Oracle Database Alerts [page 227].
Prerequisites
Many alerts, especially those under Health, are based on , which delivers much of the data required for database monitoring to the SDBAD table. This avoids time-consuming access to the Oracle data dictionary view DBA_SEGMENTS.
RecommendationTherefore, we recommend you to schedule at least daily BRCONNECT database checks in the DBA Planning Calendar, so that the alerts in the database monitor are up-to-date.
For more information, see Database System Check [page 175] and SAP Note 483659 .
NoteDatabase system check in the SAP System uses BRCONNECT by default from SAP Web Application Server 6.10 onwards. If you have an older release that still uses SAPDBA and you want to change to BRCONNECT, see SAP Note 403704 .
Process
1. To start the Oracle database monitor, choose Administration CCMS Control/Monitoring Alert Monitor SAP CCMS Monitor Templates Database . Alternatively, call transaction RZ20.
CCMS: OracleMonitoring the Oracle Database PUBLIC 201

2. Open the monitors and check the results.3. If any alerts have been raised, take the necessary action to correct the problem.
NoteSome data collection tools, or methods, provide data for more than one node. Thresholds for these methods and how frequently they are scheduled to run can be configured through the node to which the method is attached. Unless otherwise noted, a node's collection and analysis methods are available from the node itself.
7.1 Space Management Alerts
Definition
You might see the alerts described here when monitoring your Oracle database [page 201].
Note[BRCONNECT] below means that the alert is raised by the .
[OPTIONAL] below means that the alert can be turned off here and shown only in the Health monitoring tree. Such alerts always have corresponding Health alerts, as described in Database Health Alerts [page 209].
For more information, see Information on Oracle Database Alerts [page 227].
Structure
Tablespaces
<tablespace name>
Cause: Tablespace alerts can be raised as follows (data file autoextend is taken into account before alert is raised):
● Freespace: Amount of freespace in the tablespace● Used space: Percentage of used space in the tablespace● Status: Tablespace status (online or offline)
Action: , if necessary, based on your estimate of anticipated growth.
If you add a tablespace, run the RSDBMON0 report from Transaction SE38 so the new tablespace is recognized and represented as a new node in the Tablespaces subtree.
If you drop a tablespace, delete the node representing that tablespace.
Segments
Segments with too few allocatable extents
202 PUBLICCCMS: Oracle
Monitoring the Oracle Database

Cause: The number of segments with too few allocatable extents has exceeded the configured threshold. “Too few” is defined in the properties of another monitor node, “Fewest allocatable extents for a segment”. All segments that would raise a yellow or red alert in that node ( Fewest allocatable extents for a segment) are counted and included in this node. Only segments in the SAP schema for which PCTINCREASE is set to zero are considered.
Action: To determine which segments are affected, run the analysis method, which will list all segments with fewer allocatable extents than specified in the node's thresholds. If the NEXT storage parameter for this segment is set too high, decrease it to allow the segment to allocate more extents. If NEXT is set as intended, add another data file to the tablespace or activate the feature to autoextend data files.
The collection method that resides at this node feeds other nodes as well.
NoteRunning the collection and analysis methods associated with this node can be very resource intensive if you do not run the BRCONNECT database system check at least once a day.
Fewest allocatable extents for a segment
Cause: The smallest number of extents left for any segment has fallen below the configured threshold. Only segments in the SAP schema for which PCTINCREASE is set to zero are considered.
Action: To determine which segments are affected, run the analysis method, which will list all segments with fewer allocatable extents than specified in the node's thresholds. If the NEXT storage parameter for this segment is set too high, decrease it to allow the segment to allocate more extents. If NEXT is set as intended, add another data file to the tablespace or activate the feature to autoextend data files.
NoteRunning the collection and analysis methods associated with this node can be very resource intensive if you do not run the BRCONNECT database system check at least once a day.
Segments approaching MAX_EXTENTS
Cause: The number of segments that trigger red or yellow alerts for the node Fewest extents left before max_extents has exceeded the configured threshold.
Action: Increase the segment's storage parameter MAX_EXTENTS if you expect the segment to grow.
NoteRunning the collection and analysis methods associated with this node can be very resource intensive if you do not run the BRCONNECT database system check at least once a day.
Fewest extents left before MAX_EXTENTS
Cause: The smallest number of allocatable extents for any segments before MAX_EXTENTS is reached has fallen below the configured threshold.
Action: If you expect the segment to grow and, therefore, allocated more extents, increase the segment's MAX_EXTENTS storage parameter.
Running the collection and analysis methods associated with this node can be very resource intensive if you do not run the BRCONNECT database system check at least once a day.
CCMS: OracleMonitoring the Oracle Database PUBLIC 203

Most allocated extents in any segment
Cause: The number of allocated extents any segment has exceeded the configured threshold. Having few allocated extents per segment was significant when Oracle's maximum MAX_EXTENTS value was relatively low based on Oracle's block size. MAX_EXTENTS can now have a value of “unlimited”, eliminating this concern. Having many extents should not cause problems, assuming none of the segments in this tablespace have PCTINCREASE set to non-zero and that the NEXT storage parameter settings for all segments in this tablespace are either all the same or multiples of one another.
Action: If you prefer segments with fewer allocated extents, you can use BRSPACE to reorganize the object.
Segments with non-zero PCTINCREASE
Cause: Segments have a PCTINCREASE value other than zero. Because Oracle now allows a MAX_EXTENTS setting of “unlimited”, setting PCTINCREASE to something other than zero no longer makes sense. Setting PCTINCREASE to non-zero can potentially introduce unnecessary fragmentation into your tablespace. Only segments in the SAP schema are considered.
PCTINCREASE was important when the largest number for MAX_EXTENTS was still relatively small and based on Oracle's block size. Since you should now always be able to avoid reaching MAX_EXTENTS simply by setting its value high enough, you no longer need PCTINCREASE for allocating larger and larger extents to avoid reaching MAX_EXTENTS. This no longer makes sense since you should always be able to avoid reaching MAX_EXTENTS by simply setting its value high enough.
Action: Evaluate whether the segment's storage parameter can be set to zero.
Segments in wrong tablespace [BRCONNECT] [OPTIONAL]
Cause: A segment is in the wrong tablespace, as raised by the BRCONNECT database check. See condition IN_WRONG_TABLESPACE in .
Action: Reassign the segment to the correct tablespace using online reorganization with BRSPACE.
The non-standard equivalent to this optional alert is Segment in wrong tablespace in Database Health Alerts [page 209].
Rollback segment extension failed [BRCONNECT] [OPTIONAL]
Cause: There is the following message in the Oracle alert log:
ORA-01562 Failed to extend rollback segment
The rollback segment named in the alert message tried unsuccessfully to allocate an extent of the size specified by the rollback segment's NEXT storage parameter. This allocation failed because the rollback segment is stored in a tablespace with no free extent large enough. Since rollback segments should be stored in tablespace PSAPROLL and PSAPUNDO, this is most likely the tablespace affected.
Action: If the rollback segment's NEXT storage parameter is set higher than intended, decrease its value. Otherwise, use BRSPACE to add a data file to the affected tablespace (most likely PSAPROLL or PSAPUNDO).
The non-standard equivalent to this optional alert is Failed to extend rollback in Database Health Alerts [page 209].
204 PUBLICCCMS: Oracle
Monitoring the Oracle Database

7.2 Database Performance Alerts
Definition
You might see the alerts described here when monitoring your Oracle database [page 201].
Note[BRCONNECT] below means that the alert is raised by the .
[OPTIONAL] below means that the alert can be turned off here and shown only in the Health monitoring tree. Such alerts always have corresponding Health alerts, as described in Database Health Alerts [page 209].
For more information, see Information on Oracle Database Alerts [page 227].
Structure
Optimizer
Last successful update statistics
Cause: Threshold is exceeded for number of days since the last successful run of with options -t all. Return codes 0 (success) or 1 (success with warning) indicate a successful update statistics.
Action: Run brconnect -f stats -t all.
Last brconnect -f stats run
Cause: Failed last run of , regardless of the options used. For more information, see LAST_STATS_FAILED in .
Action: Run brconnect -f stats.
Harmful statistics [BRCONNECT] [OPTIONAL]
Cause: There are tables or indexes that have statistics, although they should not have these (for example, pool and cluster tables).
Action: Remove statistics from these tables or indexes. For more information, see .
The non-standard equivalent to this optional alert is Harmful statistics in Database Health Alerts [page 209].
Missing statistics [BRCONNECT] [OPTIONAL]
Cause: There are tables or indices that do not have any statistics, although they should have these.
Action: Create statistics for these tables or indexes. For more information, see .
The non-standard equivalent to this optional alert is Missing statistics in Database Health Alerts [page 209].
Buffers
Buffer cache
Cause: The buffer cache hit ratio fell below the configured threshold.
CCMS: OracleMonitoring the Oracle Database PUBLIC 205

Action: Increase the size of the buffer cache only if the previous size increase improved the buffer cache hit ratio. For most applications, the buffer cache hit ratio should be above 90%. Applications that mostly execute long table scans cannot benefit as much from the buffer cache since such applications tend to overwrite the buffer cache. For additional information on how to tune the buffer cache, refer to Oracle's documentation.
Library cache
Cause: The library cache hit ratio exceeded the configured threshold.
Action: Increase the size of the shared pool in which the library cache resides until the V$LIBRARYCACHE.RELOADS value is near 0. This is done by increasing the value of the init<DBSID>.ora parameter SHARED_POOL_SIZE. The application should use identical SQL statements whenever possible. For more information, see the Oracle documentation.
Redo log buffer
Cause: The number of redo entries per redo log space request fell below the configured threshold. Oracle recommends at least 5000 redo entries per redo log space request.
Action: Increase the size of the redo log buffer by increasing the init<DBSID>.ora parameter log_buffer until the number of redo entries per redo log space request stops increasing. .
Locks
Age of oldest exclusive transaction lock
Cause: Age of the oldest exclusive transaction lock.
Action: Identify why the exclusive transaction lock is so old by identifying which transactions or programs own the lock.
Deadlocked resource [BRCONNECT] [OPTIONAL]
Cause: Result of the search in the alert log for the following Oracle message:
ORA00060: Deadlock while waiting for resource.
Action: Identify why the resource is deadlocked by searching for more information in the Oracle trace files.
The non-standard equivalent to this optional alert is Deadlock waiting for resource in Database Health Alerts [page 209].
Checkpoints
Checkpoint not complete [BRCONNECT] [OPTIONAL]
Cause: Result of the search in the alert log for the Oracle message: Checkpoint not complete. After a log switch, data is written from the database buffer into the datafiles, or synchronized. This error occurs if the next log switch is activated before the data has been written completely to the data files.
Action: If this error occurs often, there is a database performance problem. To correct the problem, enlarge the online redo log files. For more information, see the Oracle documentation.
The non-standard equivalent to this optional alert is Checkpoint not complete in Database Health Alerts [page 209].
206 PUBLICCCMS: Oracle
Monitoring the Oracle Database

7.3 Database Backup and Restore Alerts
Definition
You might see the alerts described here when monitoring your Oracle database [page 201].
Note[BRCONNECT] below means that the alert is raised by the .
[OPTIONAL] below means that the alert can be turned off here and shown only in the Health monitoring tree. Such alerts always have corresponding Health alerts, as described in Database Health Alerts [page 209].
For more information, see Information on Oracle Database Alerts [page 227].
Structure
Archiving
Last successful archive log backup
Cause: The threshold for the number of days since the last successful backup of the offline redo log files, which includes BRARCHIVE return codes of 0 (successful) or 1 (successful but with warnings), has been exceeded.
Action: Run BRARCHIVE to back up the offline redo log files. For more information, see .
Last brarchive run
Cause: The last BRARCHIVE run has an invalid status. This includes all BRARCHIVE runs, regardless of whether the offline redo log files were actually backed up or not. For example, this might include a run to only delete offline redo log files.
For more information, see LAST_ARCHIVE_FAILED in .
Action: Correct the problem and repeat the BRARCHIVE run. For more information, see .
Archiver destination full
Cause: The number of archive logs that will still fit into the archiver destination is below the preconfigured threshold.
Action: Either back up and delete offline redo log files with BRARCHIVE or add more space to the archiver destination to accommodate more archive logs.
Archiving off
Cause: Your database is running, but online redo logs are not being archived.
Action: Using BRSPACE, and .
Backup Status
Last successful complete database backup
CCMS: OracleMonitoring the Oracle Database PUBLIC 207

Cause: The threshold for the number of days since the last successful complete database backup, which includes BRBACKUP return codes of 0 (successful) or 1 (successful but with warnings), has been exceeded.
Action: Run BRBACKUP to perform a complete database backup. For more information, see .
Last brbackup run
Cause: The last BRBACKUP run has an invalid status. This includes all BRBACKUP runs, regardless of whether a complete database backup was performed. For example, this might include a run to perform an incremental backup.
For more information, see LAST_BACKUP_FAILED in .
Action: Correct the problem and repeat the BRBACKUP run. For more information, see .
Tablespace in backup mode [BRCONNECT] [OPTIONAL]
Cause: The tablespaces named in the alert message are currently in backup mode, which reduces the performance of the SAP System.
Action: Confirm that no database backup is running, either with BRBACKUP or an external tool. Then to cancel the backup mode.
The non-standard equivalent to this optional alert is Tablespace in backup mode in Database Health Alerts [page 209].
7.4 Database Consistency Alerts
Definition
You might see the alerts described here when monitoring your Oracle database [page 201].
Structure
Consistency Check
Cause: Threshold for number of days since the last successful run of the consistency check is exceeded.
Action: Run the consistency check. For more information, see Database System Check [page 175].
Objects Missing in Database
Primary indexes, Secondary indexes, Tables, Views
Cause: Some ABAP Dictionary objects were not found in the database. If an object was intentionally deleted from the databases during development or if a database error occurred during creation, this missing object list can be significant for customer objects. Objects not being found in the database can lead to incomplete or incorrect transports and cancelled conversions.
Action: Unless there has been either an incomplete transport or a canceled conversion, simply create the object in the database.
208 PUBLICCCMS: Oracle
Monitoring the Oracle Database

Unknown Objects in ABAP Dictionary
Database tables, Database indexes, Database views, Database tables without unique index
Cause: Objects were found in the database that are not defined in the ABAP Dictionary. Since these objects do not belong to the SAP System or cause problems, this list is primarily for information. These objects are usually created directly via the database. If the author is unknown, the purpose of the object can sometimes be determined using the display function. Because the data display in the SAP System is based on ABAP Dictionary definitions, data can be displayed only via the database.
Action: Customer tables, views and indexes should always be created with the ABAP Dictionary. This is the only way to ensure that the objects are recognized by the SAP System and that problems such as collisions can be avoided during upgrading.
Inconsistent Objects
Primary indexes, Secondary indexes, Tables, Views
Cause: Objects exhibit inconsistencies between their ABAP Dictionary definitions and their database data dictionary definitions.
Action: Compare the object's definition in the ABAP Dictionary with that in the database data dictionary and update the incorrect one.
Other Checks
Primary indexes, Secondary indexes, Tables, Views, Primary index not unique
Cause: Several checks are performed, including whether the primary indexes of tables defined in the ABAP Dictionary were created uniquely in the database and whether there are objects in the SAP tables that either cannot be described at all or cannot be completely described in the ABAP Dictionary.
Optional Indexes
Too many indexes created, Indexes not created
Cause: Indexes defined in the ABAP Dictionary as optional database indexes have been found.
All the indexes which are defined in the ABAP Dictionary but for which a flag is set that they should not be created on the database to their system configuration or database system are displayed here as well.
Action: Determine if these indexes have either been created or not been created as intended.
7.5 Database Health Alerts
Definition
You might see the alerts described here when monitoring your Oracle database [page 201]. You can see which database objects are causing an alert by looking at the contents of the message container in the corresponding node.
Note[BRCONNECT] below means that the alert is raised by the .
CCMS: OracleMonitoring the Oracle Database PUBLIC 209

[NON-STANDARD] below means that the alert has an equivalent alert in another monitoring tree. If required, you can turn off the equivalent alert in the other monitoring tree and only show the alert here.
For more information, see Information on Oracle Database Alerts [page 227].
Structure
Database health check
Last successful database check
Cause: The threshold for the number of days since the last successful database check, which includes BRCONNECT return codes of 0 (successful) or 1 (successful but with warnings), has been exceeded.
Action: Run .
Last brconnect -f check run
Cause: The last run of brconnect -f check has an invalid status.
Action: Correct the problem and repeat .
Last evaluation of check results
Cause: Using information stored in the DBMSGORA table by the last run of , the collection method of this node feeds all others marked with [BRCONNECT].
Action: You can start the collection method of this node manually if you want to immediately evaluate the last database check run.
Start of database check
This lets you directly start the database check with .
Database administration
The alerts in this section correspond to the checks stored in the DBCHECKORA table for database administration.
Archiver destination full [BRCONNECT] [NON-STANDARD]
Cause: The used space in the archiver destination directory is above the preconfigured threshold. For more information, see ARCHIVER_STUCK in .
Action: Either back up and delete offline redo logs using BRARCHIVE or add more space to the archiver destination to accommodate more logs.
The standard equivalent to this alert is Archiver destination full in Database Backup and Restore Alerts [page 207].
Control file not mirrored [BRCONNECT]
Cause: The control file is not mirrored. For more information, see CONTROL_FILE_MIRROR in .
Action: Edit the init<DBSID>.ora profile and add the additional control files under the parameter CONTROL_FILES. We recommend you have at least three copies of the file. Each copy of the file must be stored on a separate physical hard disk. After you edit the profile, to activate your changes.
210 PUBLICCCMS: Oracle
Monitoring the Oracle Database

NoteIf you only use hardware mirroring, you can inactivate this check. For more information, see Configuring Database System Check (Oracle) [page 176].
Missing control file [BRCONNECT]
Cause: The control file is missing. For more information, see CONTROL_FILE_MISSING in .
Action: Look for the parameter CONTROL_FILES, in the init<DBSID>.ora initialization file to determine which directories the control files are stored in. Make sure you can display all the files and that they are available in the file system. Restore access to any non-accessible files.
Critical autoextendable file [BRCONNECT]
Cause: There are data files with an activated auto extend feature that would consume the entire remaining free disk space if extended. A check is made to see whether the file system can be brought to overflow, due to the existing parameter setting ( NEXT and MAXSIZE) during the automatic file extension. For more information, see CRITICAL_FILE in .
Action: Add more space to the file system or reduce the autoextend parameters.
Critical segment [BRCONNECT] [NON-STANDARD]
Cause: There are segments with too few allocatable extents due to lack of free space in the tablespace. “Too few” is defined in the CHKVAL field of the DBCHECKORA table (range is 1 to 5).
For more information, see CRITICAL_SEGMENT in .
Action: If the NEXT storage parameter for this segment is set too high, decrease it to allow the segment to allocate more extents. If NEXT is set as intended, add another data file to the tablespace.
The standard equivalent to this alert is Segments with too few allocatable extents in Space Management Alerts [page 202].
Data file mismatch [BRCONNECT]
Cause: There are data files that are flagged as MISSING in the Oracle dictionary.
For more information, see DATA_FILE_MISMATCH in .
Action: Execute CREATE CONTROLFILE using Oracle SQLPLUS, specifying either the correct file or no file at all.
Missing data file [BRCONNECT]
Cause: There are data files that no longer exist in the file system.
For more information, see DATA_FILE_MISSING in .
Action: Perform .
Database file offline [BRCONNECT]
Cause: There are data files or online redo log files that are offline.
For more information, see FILE_OFFLINE in .
CCMS: OracleMonitoring the Oracle Database PUBLIC 211

Action: Close all applications and enter the following commands using Oracle SQLPLUS:
1. connect / as sysdba2. shutdown immediate3. startup mount4. alter database data file <data file> online;5. alter database open
Alternatively, use .
File system full [BRCONNECT]
Cause: The fill level of file systems on the database host is too high. All file systems are checked by default against the same threshold value. However, you can define different threshold values for individual file systems by specifying the file system in the OBJECT field of the DBCHECKORA table (transaction DB17).
For more information, see FILE_SYSTEM_FULL in .
Action: Increase the amount of space in the file system.
Harmful statistics [BRCONNECT] [NON-STANDARD]
Cause: There are tables or indexes that have statistics, although they should not have these (for example, pool and cluster tables).
For more information, see HARMFUL_STATISTICS in .
Action: Remove statistics from these tables or indexes. For more information, see .
The standard equivalent to this alert is Harmful statistics in Space Management Alerts [page 202].
Invalid file type [BRCONNECT]
Cause: There are database files that have an illegal operating system type, for example, block raw files on UNIX or compressed files on Windows.
For more information, see INVALID_FILE_TYPE in .
Action: Troubleshoot to determine the cause of the problem. If you are not sure how to proceed, contact SAP technical support.
Segment in wrong tablespace [BRCONNECT] [NON-STANDARD]
Cause: A segment is in the wrong tablespace, as raised by the BRCONNECT database check. For more information, see IN_WRONG_TABLESPACE in .
Action: Use , which moves the tables into a tablespace of the correct type.
The standard equivalent to this alert is Segment in wrong tablespace in Space Management Alerts [page 202].
Missing index [BRCONNECT] [NON-STANDARD]
Cause: There are tables that do not have any indexes and are not specified in the DBDIFF table exception.
For more information, see MISSING_INDEX in .
Action: Create the missing indexes using transaction SE11.
The standard equivalents to this alert in Database Consistency Alerts [page 208] are:
● Objects missing in database: Primary indexes
212 PUBLICCCMS: Oracle
Monitoring the Oracle Database

● Objects missing in database: Secondary indexes● Unknown objects in ABAP dictionary: Tables without unique index
Missing statistics [BRCONNECT] [NON-STANDARD]
Cause: There are tables or indexes that do not have any statistics, although they should have these.
For more information, see MISSING_STATISTICS in .
Action: Create statistics for these tables or indexes. For more information, see .
The standard equivalent to this alert is Missing Statistics in Database Performance Alerts [page 205].
Database in NOARCHIVELOG mode [BRCONNECT] [NON-STANDARD]
Cause: The database is running, but online redo logs are not being archived.
For more information, see NOARCHIVELOG_MODE in .
Action: Using BRSPACE, and .
The standard equivalent to this alert is Archiving Off in Database Backup and Restore Alerts [page 207].
Segment with non-zero PCTINCREASE [BRCONNECT] [NON-STANDARD]
Cause: Segments have a PCTINCREASE value other than zero. Since Oracle now allows a MAX_EXTENTS setting of "unlimited", setting PCTINCREASE to something other than zero no longer makes sense. Setting PCTINCREASE to non-zero can potentially introduce unnecessary fragmentation into your tablespace. Only segments in the SAP schema are considered.
For more information, see PCTINCREASE_NOT_ZERO in .
Action: Evaluate whether the segment"s storage parameter can be set to zero.
The standard equivalent to this alert is Segments with non-zero PCTINCREASE in Space Management Alerts [page 202].
Redolog file not mirrored [BRCONNECT]
Cause: The online redo logs are not mirrored. Mirroring is required for safe operation. For more information, see REDOLOG_FILE_MIRROR in
Action: Using Oracle SQLPLUS, activate mirroring of the online redo logs in your database, with the statement ALTER DATABASE ADD LOGFILE MEMBER.
Missing redolog file [BRCONNECT]
Cause: An online redo log is missing, which reduces the effect of mirroring. Mirroring is required for safe operation. For more information, see REDOLOG_FILE_MISSING in .
Action: First, check the file that cannot be accessed, and check the system for problems (network problems, server down, and so on). One possible action ( only for Oracle experts, as an error could result in an incomplete chain of offline redo logs, which might prevent a full recovery of the database): If a second member of the group that cannot be accessed exists, delete the non-accessible member. Using Oracle SQLPLUS, execute:
ALTER SYSTEM SWITCH LOGFILE
Then, check if the status of the online redo logs in the table V$logfile is correct, and execute:
ALTER DATABASE ADD LOGFILE MEMBER
CCMS: OracleMonitoring the Oracle Database PUBLIC 213

Tablespace full [BRCONNECT] [NON-STANDARD]
Cause: A tablespace is full. All tablespaces are checked by default against the same threshold value. However, you can define different threshold values for individual tablespaces by specifying the tablespace name in the OBJECT field of the DBCHECKORA table, using transaction DB17.
For more information, see TABLESPACE_FULL in .
Action: , if necessary, based on your estimate of anticipated growth.
Tablespace in backup mode [BRCONNECT] [NON-STANDARD]
Cause: A tablespace is in backup mode, which reduces the performance of the SAP System. For more information, see TABLESPACE_IN_BACKUP in .
Action: Confirm that no database backup is running, either with BRBACKUP or an external tool. Then cancel the backup mode by using BRSPACE to .
The standard equivalent to this alert is Tablespace in backup mode in Database Backup and Restore Alerts [page 207].
Tablespace offline [BRCONNECT]
Cause: A tablespace is offline. For more information, see TABLESPACE_OFFLINE in .
Action: Use BRSPACE to .
Segment with too many extents [BRCONNECT] [NON-STANDARD]
Cause: There are tables or indexes, for which the number of allocated extents exceeds the specified threshold value. All tables or indices are checked by default against the same threshold value. However, you can define different threshold values for individual tablespaces by specifying the tablespace name in the OBJECT field of the DBCHECKORA table (transaction DB17).
For more information, see TOO_MANY_EXTENTS in .
Action: Increase the MAXEXTENTS limit for the table or index using SQLPLUS with one of the following commands:
ALTER TABLE <name> STORAGE (MAXEXTENTS <number>);
ALTER INDEX <name> STORAGE (MAXEXTENTS <number>);
If you prefer segments with fewer allocated extents, you can use BRSPACE to .
Alternatively, use the -l|limit option of .
The standard equivalent to this alert is Segments approaching MAX_EXTENTS in Space Management Alerts [page 202].
DBA Operations
The alerts in this section correspond to the checks stored in the DBCHECKORA table for database operations.
Last successful archive log backup too old [BRCONNECT] [NON-STANDARD]
Cause: The last successful backup of the offline redo log files with BRARCHIVE is too old. For more information, see ARCHIVE_TOO_OLD in .
Action: Perform an .
214 PUBLICCCMS: Oracle
Monitoring the Oracle Database

The standard equivalent to this alert is Last successful archive log backup in Database Backup and Restore Alerts [page 207].
Last successful complete database backup too old [BRCONNECT] [NON-STANDARD]
Cause: The last successful complete backup of the database with BRBACKUP is too old. For more information, see BACKUP_TOO_OLD in .
Action: Perform a .
The standard equivalent to this alert is Last successful complete database backup in Database Backup and Restore Alerts [page 207].
Last archive log backup failed [BRCONNECT] [NON-STANDARD]
Cause: The last backup of the offline redo logs with BRARCHIVE has an invalid status. For more information, see LAST_ARCHIVE_FAILED in .
Action: Correct the problem and repeat the BRARCHIVE run. For more information, see .
The standard equivalent to this alert is Last brarchive run in Database Backup and Restore Alerts [page 207].
Last complete database backup failed [BRCONNECT] [NON-STANDARD]
Cause: The last complete database backup with BRBACKUP has an invalid status. For more information, see LAST_BACKUP_FAILED in .
Action: Correct the problem and repeat the BRBACKUP run. For more information, see .
The standard equivalent to this alert is Last brbackup run in Database Backup and Restore Alerts [page 207].
Last operation failed [BRCONNECT]
Cause: The last DBA operation failed, which is identified by a function ID specified in the OBJECT field of the DBCHECKORA table. For more information, see LAST_OPERATION_FAILED in .
Action: Correct the problem and repeat the operation. For more information, see the corresponding function in .
Last update statistics failed [BRCONNECT] [NON-STANDARD]
Cause: The last update of the optimizer statistics with BRCONNECT failed. For more information, see LAST_STATS_FAILED in .
Action: Correct the problem and repeat . For more information, see .
The standard equivalent to this alert is Last brconnect -f stats run in Database Performance Alerts [page 205].
Last successful operation too old [BRCONNECT]
Cause: The last successful DBA operation, identified by a function ID specified in the OBJECT field of the DBCHECKORA table, is too old.. For more information, see OPERATION_TOO_OLD in .
Action: Correct the problem and repeat the operation. For more information, see the corresponding function in the .
Last successful update statistics too old [BRCONNECT] [NON_STANDARD]
Cause: The last successful update statistics run is too old. For more information, see STATS_TOO_OLD in .
Action: Correct the problem and repeat . For more information, see .
CCMS: OracleMonitoring the Oracle Database PUBLIC 215

The standard equivalent to this alert is Last successful update statistics in Database Performance Alerts [page 205].
Oracle Messages
The alerts below correspond to the DBCHECKORA check conditions for database messages in the Oracle alert log. You can find the complete messages with time stamp and text in the message container of the corresponding Monitoring Tree Element (MTE) in the alert monitor.
Deadlock while waiting for resource [BRCONNECT] [NON_STANDARD]
Cause: There is the following message in the Oracle alert log:
ORA-00060: Deadlock detected while waiting for resource
Action: Check the Oracle log / trace file.
The standard equivalent to this alert is Deadlocked resource in Database Performance Alerts [page 205].
Error archiving log file [BRCONNECT]
Cause: There is the following message in the Oracle alert log:
ORA-00255: Error archiving log
Action: Check the archive directory.
Archiver error [BRCONNECT]
Cause: There is the following message in the Oracle alert log:
ORA-00257: Archiver error
Action: Check the archive directory.
Error creating archive log [BRCONNECT]
Cause: There is the following message in the Oracle alert log:
ORA-00270: Error creating archive log
Action: Check to determine whether the storage medium is functioning. Also check whether enough storage space is available.
Error writing archive log [BRCONNECT]
Cause: There is the following message in the Oracle alert log:
ORA-00272: Error writing archive log
Action: Check to determine whether the storage medium is functioning. Also check whether enough storage space is available.
Database file cannot be read [BRCONNECT]
Cause: There is the following message in the Oracle alert log:
ORA-00376: File cannot be read at this time
Action: Check the status of the file. Bring the file online if necessary. Contact SAP technical support for additional help, as there are multiple potential causes for this problem.
Fatal error in background process [BRCONNECT]
216 PUBLICCCMS: Oracle
Monitoring the Oracle Database

Cause: There is the following message in the Oracle alert log:
ORA-00447: Fatal error in background process
Action: Check the Oracle alert log / trace file.
LGWR process terminated with error [BRCONNECT]
Cause: There is the following message in the Oracle alert log:
ORA-00470: LGWR process terminated with error
Action: Check the Oracle alert log / trace file.
DBWR process terminated with error [BRCONNECT]
Cause: There is the following message in the Oracle alert log:
ORA-00471: LGWR process terminated with error
Action: Check the Oracle alert log / trace file.
PMON process terminated with error [BRCONNECT]
Cause: There is the following message in the Oracle alert log:
ORA-00472: PMON process terminated with error
Action: Check the Oracle alert log / trace file.
ARCH process terminated with error [BRCONNECT]
Cause: There is the following message in the Oracle alert log:
ORA-00473: ARCH process terminated with error
Action: Check the Oracle alert log / trace file.
SMON process terminated with error [BRCONNECT]
Cause: There is the following message in the Oracle alert log:
ORA-00474: SMON process terminated with error
Action: Check the Oracle alert log / trace file.
Oracle internal error [BRCONNECT]
Cause: There is the following message in the Oracle alert log:
ORA-00600: I nternal error code
Action: Contact Oracle or SAP technical support.
Oracle server session terminated by fatal error [BRCONNECT]
Cause: There is the following message in the Oracle alert log:
ORA-00603: ORACLE server session terminated by fatal error
Action: Check the Oracle alert log / trace file.
I/O error writing database file [BRCONNECT]
CCMS: OracleMonitoring the Oracle Database PUBLIC 217

Cause: There is the following message in the Oracle alert log:
ORA-01114: IO error writing block to file Action: Check to determine whether the storage medium is functioning. Also check whether enough storage space is available.
I/O error reading database file [BRCONNECT]
Cause: There is the following message in the Oracle alert log:
ORA-01115: IO error reading block from file
Action: Check to determine whether the storage medium is functioning.
File verification check failed [BRCONNECT]
Cause: There is the following message in the Oracle alert log:
ORA-01122: Database file failed verification check
Action: Make sure you are using the correct data file and control file for the database and check the last recovery or database copy.
Cannot shutdown - data file in backup mode [BRCONNECT]
Cause: There is the following message in the Oracle alert log:
ORA-01149: Cannot shutdown - file has online backup set
Action: Terminate the backup.
Snapshot too old [BRCONNECT]
Cause: There is the following message in the Oracle alert log:
ORA-01555: Snapshot too old
Action: Change the configuration of the rollback segments to enlarge them. Only execute this operation when the database load is low.
Failed to extend rollback [BRCONNECT] [NON_STANDARD]
Cause: There is the following message in the Oracle alert log:
ORA-01562: Failed to extend rollback segment
Action: Use BRSPACE to PSAPROLL or PSAPUNDO.
The standard equivalent to this alert is Rollback segment extension failed in Space Management Alerts [page 202].
Database block corrupted [BRCONNECT]
Cause: There is the following message in the Oracle alert log:
ORA-01578: ORACLE data block corrupted
Action: Recover the database. Choosing a recovery strategy requires a careful analysis of the failure. We recommend you contact SAP technical support for help with this problem. For more information, see .
Max. extents reached for rollback segment [BRCONNECT]
Cause: There is the following message in the Oracle alert log:
ORA-01628: Max extents reached for rollback segment
218 PUBLICCCMS: Oracle
Monitoring the Oracle Database

Action: Increase the MAXEXTENTS value.
Max. extents reached saving undo for tablespace [BRCONNECT]
Cause: There is the following message in the Oracle alert log:
ORA-01629: Max extents reached saving undo for tablespace
Action: Increase the MAXEXTENTS value.
Max. extents reached in temp segment in tablespace [BRCONNECT]
Cause: There is the following message in the Oracle alert log:
ORA-01630: Max. extents reached in temp segment in tablespace
Action: Increase the MAXEXTENTS value.
Max. extents reached in table [BRCONNECT]
Cause: There is the following message in the Oracle alert log:
ORA-01631: Max. extents reached in table
Action: Increase the MAXEXTENTS value.
Max. extents reached in index [BRCONNECT]
Cause: There is the following message in the Oracle alert log:
ORA-01632: Max. extents reached in index
Action: Increase the MAXEXTENTS value.
Unable to extend rollback segment in tablespace [BRCONNECT]
Cause: There is the following message in the Oracle alert log:
ORA-01650: Unable to extend rollback segment in tablespace
Action: Extend the tablespace.
Unable to extend save undo segment for tablespace [BRCONNECT]
Cause: There is the following message in the Oracle alert log:
ORA-01651: Unable to extend save undo segment for tablespace
Action: Extend the tablespace.
Unable to extend temp segment in tablespace [BRCONNECT]
Cause: There is the following message in the Oracle alert log:
ORA-01652: Unable to extend temp segment in tablespace
Action: Extend the tablespace.
Unable to extend table in tablespace [BRCONNECT]
Cause: There is the following message in the Oracle alert log:
ORA-01653: Unable to extend table in tablespace
Action: Extend the tablespace.
CCMS: OracleMonitoring the Oracle Database PUBLIC 219

Unable to extend index in tablespace [BRCONNECT]
Cause: There is the following message in the Oracle alert log:
ORA-01654: Unable to extend index in tablespace
Action: Extend the tablespace.
Unable to extend cluster in tablespace [BRCONNECT]
Cause: There is the following message in the Oracle alert log:
ORA-01655: Unable to extend cluster in tablespace
Action: Extend the tablespace.
Max. extents reached in cluster [BRCONNECT]
Cause: There is the following message in the Oracle alert log:
ORA-01656: Max. extents reached in cluster
Action:
Unable to extend lob segment in tablespace [BRCONNECT]
Cause: There is the following message in the Oracle alert log:
ORA-01680: Unable to extend LOG segment in tablespace
Action: Extend the tablespace.
Max. extents reached in LOB segment in tablespace [BRCONNECT]
Cause: There is the following message in the Oracle alert log:
ORA-01681: Max. extents reached in LOB segment in tablespace
Action: Increase the MAXEXTENTS value.
Unable to extend index partition [BRCONNECT]
Cause: There is the following message in the Oracle alert log:
ORA-016 83 : Unable to extend index partition
Action: Extend the tablespace.
Max. extents reached in table partition [BRCONNECT]
Cause: There is the following message in the Oracle alert log:
ORA-016 84 : Max. extents reached in table partition
Action: Increase the MAXEXTENTS value.
Max. extents reached in index partition [BRCONNECT]
Cause: There is the following message in the Oracle alert log:
ORA-01685: Max. extents reached in index partition
Action: Increase the MAXEXTENTS value.
Unable to extend table partition [BRCONNECT]
220 PUBLICCCMS: Oracle
Monitoring the Oracle Database

Cause: There is the following message in the Oracle alert log:
ORA-01688: Unable to extend table partition
Action: Extend the tablespace.
Unable to extend lob segment in tablespace [BRCONNECT]
Cause: There is the following message in the Oracle alert log:
ORA-01691: Unable to extend lob segment in tablespace
Action: Extend the tablespace.
Unable to extend lob segment partition in tablespace [BRCONNECT]
Cause: There is the following message in the Oracle alert log:
ORA-01692: Unable to extend lob segment partition in tablespace
Action: Extend the tablespace.
Max. extents reached in lob segment [BRCONNECT]
Cause: There is the following message in the Oracle alert log:
ORA-01693: Max. extents reached in lob segment
Action: Increase the MAXEXTENTS value.
Max. extents reached in lob segment partition [BRCONNECT]
Cause: There is the following message in the Oracle alert log:
ORA-01694: Max. extents reached in lob segment partition
Action: Increase the MAXEXTENTS value.
Exception encountered: core dump [BRCONNECT]
Cause: There is the following message in the Oracle alert log:
ORA-07445: Exception encountered: core dump
Action: Call the hotline.
Destination not available for archiving log file [BRCONNECT]
Cause: There is the following message in the Oracle alert log:
ORA-16014: Log sequence not archived, no available d estination s
Action: Check the archive destination.
Log file cannot be archived [BRCONNECT]
Cause: There is the following message in the Oracle alert log:
ORA-16038: Log sequence cannot be archived
Action: Check the archive destination.
Write error on log file [BRCONNECT]
CCMS: OracleMonitoring the Oracle Database PUBLIC 221

Cause: There is the following message in the Oracle alert log:
ORA-1 9502 : Write error on file
Action: Check the archive destination.
Failed to create log file [BRCONNECT]
Cause: There is the following message in the Oracle alert log:
ORA-1 9504 : Failed to create file
Action: Check the archive destination.
Failed to set size of blocks for file [BRCONNECT]
Cause: There is the following message in the Oracle alert log:
ORA-19510: Failed to set size of blocks for file
Action: Check the disk.
Unable to write the header block of file [BRCONNECT]
Cause: There is the following message in the Oracle alert log:
ORA-27044: Unable to write the header block of file
Action: Check the disk.
Number of bytes read/written is incorrect [BRCONNECT]
Cause: There is the following message in the Oracle alert log:
ORA-27063: Number of bytes read/written is incorrect
Action: Check the disk.
File I/O error [BRCONNECT]
Cause: There is the following message in the Oracle alert log:
ORA-27072: I/O error
Action: Check the disk.
Unable to extend segment in undo tablespace [BRCONNECT]
Cause: There is the following message in the Oracle alert log:
ORA- 30036 : Unable to extend segment in undo tablespace
Action: Extend the tablespace.
Checkpoint not complete [BRCONNECT] [NON-STANDARD]
Cause: There is the following message in the Oracle alert log:
Checkpoint not complete
Action: If this alert message occurs often, there is a database performance problem. To correct the problem, enlarge the online redo log files. For more information, see the Oracle documentation.
The standard equivalent to this alert is Checkpoint not complete in Database Performance Alerts [page 205].
222 PUBLICCCMS: Oracle
Monitoring the Oracle Database

Corrupt block [BRCONNECT]
Cause: There is the following message in the Oracle alert log:
Corrupt block: Database block is corrupted
Action: Check the consistency of database blocks.
Profile Parameters
The alerts in this section correspond to the checks stored in the DBCHECKORA table for the database profile. The parameters and the thresholds are contained in the DBCHECKORA table, and correspond to the SAP recommendations on delivery. However, we might later change the recommendations.
Only Oracle 10g profile parameters are shown here. For parameters relating to earlier Oracle releases, see previous versions of this documentation.
RecommendationIf there are new recommendations, as specified in SAP Notes 124361 and 180605, change the DBCHECKORA table accordingly.
compatible [BRCONNECT]
Cause: Current setting is outside the range of values preconfigured for this check in transaction DB17 [page 176].
Database for compatibility with Oracle 10
Action: Verify that this value is set as intended. If so, readjust the preconfigured range of values in transaction DB17.
control_file_record_keep_time [BRCONNECT]
Cause: Current setting is outside the range of values preconfigured for this check in transaction DB17 [page 176].
Retention time for information on RMAN backups in the control file
Action: Verify that this value is set as intended. If so, readjust the preconfigured range of values in transaction DB17.
cursor_space_for_time [BRCONNECT]
Cause: Current setting is outside the range of values preconfigured for this check in transaction DB17x.
Database system uses more space for cursors
Action: Verify that this value is set as intended. If so, readjust the preconfigured range of values in transaction DB17 [page 176].
db_block_buffers [BRCONNECT]
Cause: Current setting is outside the range of values preconfigured for this check in transaction DB17 [page 176].
Number of blocks in the database buffer cache
Action: Verify that this value is set as intended. If so, readjust the preconfigured range of values in transaction DB17.
CCMS: OracleMonitoring the Oracle Database PUBLIC 223

db_block size [BRCONNECT]
Cause: Current setting is outside the range of values preconfigured for this check in transaction DB17 [page 176].
Size (bytes) of the Oracle database blocks
Action: Verify that this value is set as intended. If so, readjust the preconfigured range of values in transaction DB17.
db_files [BRCONNECT]
Cause: Current setting is outside the range of values preconfigured for this check in transaction DB17 [page 176].
Maximum number of data files
Action: Verify that this value is set as intended. If so, readjust the preconfigured range of values in transaction DB17.
db_file_multiblock_read_count [BRCONNECT]
Cause: Current setting is outside the range of values preconfigured for this check in transaction DB17 [page 176].
Number of blocks read during a complete table scan I/O operation
Action: Verify that this value is set as intended. If so, readjust the preconfigured range of values in transaction DB17.
filesystemio_options [BRCONNECT]
Cause: Current setting is outside the range of values preconfigured for this check in transaction DB17 [page 176].
I/O operations on file system files
Action: Verify that this value is set as intended. If so, readjust the preconfigured range of values in transaction DB17.
log_archive_start [BRCONNECT]
Cause: Current setting is outside the range of values preconfigured for this check in transaction DB17 [page 176].
The setting LOG_ARCHIVE_START = TRUE means that automatic archiving is activated when the Oracle instance is started.
Action: Verify that this value is set as intended. If so, readjust the preconfigured range of values in transaction DB17.
log_buffer [BRCONNECT]
Cause: Current setting is outside the range of values preconfigured for this check in transaction DB17 [page 176].
Size (bytes) of the redo log buffer in the SGA
Action: Verify that this value is set as intended. If so, readjust the preconfigured range of values in transaction DB17.
224 PUBLICCCMS: Oracle
Monitoring the Oracle Database

log_checkpoints_to_alert [BRCONNECT]
Cause: Current setting is outside the range of values preconfigured for this check in transaction DB17 [page 176].
Log checkpoint begin/end to alert file
Action: Verify that this value is set as intended. If so, readjust the preconfigured range of values in transaction DB17.
max_dump_file_size [BRCONNECT]
Cause: Current setting is outside the range of values preconfigured for this check in transaction DB17 [page 176].
Maximum size of the dump file
Action: Verify that this value is set as intended. If so, readjust the preconfigured range of values in transaction DB17.
open_cursors [BRCONNECT]
Cause: Current setting is outside the range of values preconfigured for this check in transaction DB17 [page 176].
Maximum number of open cursors per user process
Action: Verify that this value is set as intended. If so, readjust the preconfigured range of values in transaction DB17.
optimizer_mode [BRCONNECT]
Cause: Current setting is outside the range of values preconfigured for this check in transaction DB17 [page 176].
Controls how the optimizer behaves (for example, rule-based = RULE, or cost-based = CHOOSE).
Action: Verify that this value is set as intended. If so, readjust the preconfigured range of values in transaction DB17.
parallel_execution_message_size [BRCONNECT]
Cause: Current setting is outside the range of values preconfigured for this check in transaction DB17 [page 176].
Message buffer size for parallel execution
Action: Verify that this value is set as intended. If so, readjust the preconfigured range of values in transaction DB17.
parallel_threads_per_cpu [BRCONNECT]
Cause: Current setting is outside the range of values preconfigured for this check in transaction DB17 [page 176].
Number of parallel execution threads per CPU
Action: Verify that this value is set as intended. If so, readjust the preconfigured range of values in transaction DB17.
recyclebin [BRCONNECT]
CCMS: OracleMonitoring the Oracle Database PUBLIC 225

Cause: Current setting is outside the range of values preconfigured for this check in transaction DB17 [page 176].
Disable recyclebin processing
Action: Verify that this value is set as intended. If so, readjust the preconfigured range of values in transaction DB17.
remote_os_authent [BRCONNECT]
Cause: Current setting is outside the range of values preconfigured for this check in transaction DB17 [page 176].
Allow remote clients to use auto-logon accounts
Action: Verify that this value is set as intended. If so, readjust the preconfigured range of values in transaction DB17.
replication_dependency_tracking [BRCONNECT]
Cause: Current setting is outside the range of values preconfigured for this check in transaction DB17 [page 176].
Tracking dependency for replication parallel propagation
Action: Verify that this value is set as intended. If so, readjust the preconfigured range of values in transaction DB17.
shared_pool_size [BRCONNECT]
Cause: Current setting is outside the range of values preconfigured for this check in transaction DB17 [page 176].
Size in bytes of the shared pool in the System Global Area (SGA)
Action: Verify that this value is set as intended. If so, readjust the preconfigured range of values in transaction DB17.
star_transformation_enabled [BRCONNECT]
Cause: Current setting is outside the range of values preconfigured for this check in transaction DB17 [page 176].
Enable the use of star transformation
Action: Verify that this value is set as intended. If so, readjust the preconfigured range of values in transaction DB17.
statistics_level [BRCONNECT]
Cause: Current setting is outside the range of values preconfigured for this check in transaction DB17 [page 176].
Statistics level
Action: Verify that this value is set as intended. If so, readjust the preconfigured range of values in transaction DB17.
timed_statistics [BRCONNECT]
226 PUBLICCCMS: Oracle
Monitoring the Oracle Database

Cause: Current setting is outside the range of values preconfigured for this check in transaction DB17 [page 176].
Generation of time-related statistics
Action: Verify that this value is set as intended. If so, readjust the preconfigured range of values in transaction DB17.
trace_enabled [BRCONNECT]
Cause: Current setting is outside the range of values preconfigured for this check in transaction DB17 [page 176].
Enable tracing
Action: Verify that this value is set as intended. If so, readjust the preconfigured range of values in transaction DB17.
undo_management [BRCONNECT]
Cause: Current setting is outside the range of values preconfigured for this check in transaction DB17 [page 176].
Enable automatic undo management
Action: Verify that this value is set as intended. If so, readjust the preconfigured range of values in transaction DB17.
undo_tablespace [BRCONNECT]
Cause: Current setting is outside the range of values preconfigured for this check in transaction DB17 [page 176].
Undo tablespace name
Action: Verify that this value is set as intended. If so, readjust the preconfigured range of values in transaction DB17.
7.6 Information on Oracle Database Alerts
Use
Some monitoring tree elements (MTEs) for alerts when you monitor the Oracle database [page 201], especially Database Health Alerts [page 209], are marked in this documentation as follows:
● BRCONNECTThese MTEs are based on the most recent , using the command brconnect -f check. The conditions for the corresponding checks are specified in the DBCHECKORA table. If required, you can configure the database system check [page 176].For more information on the check conditions, see SAP Note 435290 .BRCONNECT stores the results of the checks in the DBMSGORA table. The MTE Last evaluation of check results evaluates the results of the most recent BRCONNECT checks and, if required, generates alerts in the corresponding MTE nodes.
CCMS: OracleMonitoring the Oracle Database PUBLIC 227
You can also run a one-off database system check using the MTE Start of database check in the Health monitoring tree to immediately start a new database system check and update the database monitor.You can also view the results of the database check directly, without using the database alert monitor. For more information, see Displaying Alert Messages from Database System Check [page 181].The BRCONNECT MTEs are dynamically set up during the initialization of the monitoring infrastructure, based on the check conditions set up in the DBCHECKORA table. If one of these MTEs does not have a corresponding check condition in the DBCHECKORA table (because the check is inactive), it does not appear in the Oracle database monitor.Therefore, these MTEs can dynamically appear and disappear, depending on whether the corresponding check conditions exist. The MTE always appears at the relevant position in the monitoring tree, as specified in this documentation.You can set up new check conditions in the following categories:○ DBO: Concrete database operations (function ID)○ ORA: Oracle messages (message code, message text)○ PROF: Oracle profile parameters (parameter names)
You can only set up new check conditions for database administration when the corresponding BRCONNECT functionality is available. For conditions that do not use the OBJECT field in the DBCHECKORA table, you can set up your own name for the corresponding MTE. To do this, specify #RZ20 followed by the new name, as shown in the following example:
ExampleThis is an example of how to specify a new dynamic MTE:
TYPE field: DBO
PARAM field: DBV
OBJECT field: #RZ20 Database verification
The result is that a new MTE called Database verification is set up in the Oracle database monitor under Health DBA operations .
For more information on the BRCONNECT check conditions, see:
○○
Then do the following to re-initialize the Oracle context for database alert monitoring in the RZ20 transaction, so as to incorporate your new check conditions:1. Find out on which application servers the Oracle context exists by calling transaction RZ21 and
entering Topology Context Overview Segment Name , then Topology Segment Overview Destination .
2. Log on to the application server where the Oracle context exists.
3. Start the Oracle database monitor by choosing Administration CCMS ControlMonitoring Alert-Monitor SAP CCMS Monitor Templates Database , or call transaction RZ20.
4. Choose Extras Activate Maintenance Function .
5. Select Oracle and reset all alerts by choosing Edit Nodes (MTE) Reset .
6. Select Oracle and delete the Oracle tree by choosing Edit Nodes (MTE) Delete .7. Recreate the Oracle context on this application server by calling transaction SE38 in and entering
RSDBMON0 in Program then choosing Execute.
228 PUBLICCCMS: Oracle
Monitoring the Oracle Database

● NON-STANDARD and OPTIONALNON-STANDARD MTEs from the Health monitoring tree are not set up in the standard database monitor because identical or similar MTEs are already present at another point in the monitoring tree. However, if you want to set up the NON-STANDARD but not the OPTIONAL MTEs, use SQLPLUS to add the following row to the SORAMON table:connect sapr3/<password> or connect sap<sid>/<password>insert into soramon (category, timestamp, value)values ('SYSCHECK ALL_COND', '20020101000000', 1)Then re-initialize the Oracle context as described above.The result is that all NON-STANDARD alerts are reported only in the Health part of the database monitoring tree.You can also have the alerts reported at both points of the monitoring tree by using SQLPLUS to add the following row to the SORAMON table:connect sapr3/<password> or connect sap<sid>/<password>insert into soramon (category, timestamp, value)values ('SYSCHECK ALL_COND', '20020101000000', 2)
CCMS: OracleMonitoring the Oracle Database PUBLIC 229

Important Disclaimers and Legal Information
HyperlinksSome links are classified by an icon and/or a mouseover text. These links provide additional information.About the icons:
● Links with the icon : You are entering a Web site that is not hosted by SAP. By using such links, you agree (unless expressly stated otherwise in your agreements with SAP) to this:
● The content of the linked-to site is not SAP documentation. You may not infer any product claims against SAP based on this information.● SAP does not agree or disagree with the content on the linked-to site, nor does SAP warrant the availability and correctness. SAP shall not be liable for any
damages caused by the use of such content unless damages have been caused by SAP's gross negligence or willful misconduct.
● Links with the icon : You are leaving the documentation for that particular SAP product or service and are entering a SAP-hosted Web site. By using such links, you agree that (unless expressly stated otherwise in your agreements with SAP) you may not infer any product claims against SAP based on this information.
Videos Hosted on External PlatformsSome videos may point to third-party video hosting platforms. SAP cannot guarantee the future availability of videos stored on these platforms. Furthermore, any advertisements or other content hosted on these platforms (for example, suggested videos or by navigating to other videos hosted on the same site), are not within the control or responsibility of SAP.
Beta and Other Experimental FeaturesExperimental features are not part of the officially delivered scope that SAP guarantees for future releases. This means that experimental features may be changed by SAP at any time for any reason without notice. Experimental features are not for productive use. You may not demonstrate, test, examine, evaluate or otherwise use the experimental features in a live operating environment or with data that has not been sufficiently backed up.The purpose of experimental features is to get feedback early on, allowing customers and partners to influence the future product accordingly. By providing your feedback (e.g. in the SAP Community), you accept that intellectual property rights of the contributions or derivative works shall remain the exclusive property of SAP.
Example CodeAny software coding and/or code snippets are examples. They are not for productive use. The example code is only intended to better explain and visualize the syntax and phrasing rules. SAP does not warrant the correctness and completeness of the example code. SAP shall not be liable for errors or damages caused by the use of example code unless damages have been caused by SAP's gross negligence or willful misconduct.
Bias-Free LanguageSAP supports a culture of diversity and inclusion. Whenever possible, we use unbiased language in our documentation to refer to people of all cultures, ethnicities, genders, and abilities.
230 PUBLICCCMS: Oracle
Important Disclaimers and Legal Information

CCMS: OracleImportant Disclaimers and Legal Information PUBLIC 231

www.sap.com/contactsap
© 2021 SAP SE or an SAP affiliate company. All rights reserved.
No part of this publication may be reproduced or transmitted in any form or for any purpose without the express permission of SAP SE or an SAP affiliate company. The information contained herein may be changed without prior notice.
Some software products marketed by SAP SE and its distributors contain proprietary software components of other software vendors. National product specifications may vary.
These materials are provided by SAP SE or an SAP affiliate company for informational purposes only, without representation or warranty of any kind, and SAP or its affiliated companies shall not be liable for errors or omissions with respect to the materials. The only warranties for SAP or SAP affiliate company products and services are those that are set forth in the express warranty statements accompanying such products and services, if any. Nothing herein should be construed as constituting an additional warranty.
SAP and other SAP products and services mentioned herein as well as their respective logos are trademarks or registered trademarks of SAP SE (or an SAP affiliate company) in Germany and other countries. All other product and service names mentioned are the trademarks of their respective companies.
Please see https://www.sap.com/about/legal/trademark.html for additional trademark information and notices.
THE BEST RUN