![p~ - f\ Cc.-oS] - USAID](https://static.fdokumen.com/doc/165x107/631320b8c72bc2f2dd03ea3e/p-f-cc-os-usaid.jpg)
cc hl - Christchurch City Holdings
110
ORION CHRISTCHURCH AIRPORT LYTTELTON PORT COMPANY ENABLE SERVICES CITY CARE RED BUS ECOCENTRAL annual Christchurch City Holdings Christchurch City Holdings Limited is a wholly-owned subsidiary of Christchurch City Council. c c hl report . 2015
-
Upload
khangminh22 -
Category
Documents
-
view
1 -
download
0
Transcript of cc hl - Christchurch City Holdings

ORION
CHRISTCHURCH AIRPORT
LYTTELTON PORT COMPANY
ENABLE SERVICES
CITY CARE
RED BUS
ECOCENTRAL
annualChristchurch City HoldingsChristchurch City Holdings Limitedis a wholly-owned subsidiary of Christchurch City Council.
cc hl
report.2015

2015 snapshot
C H R I S T C H U R C H C I T Y H O L D I N G S L I M I T E D I 2 0 1 5 A N N U A L R E P O R T
The CCHL group has grown significantly in value over the years, and the Council is in the position of owning a valuable portfolio of trading assets. We will work proactively with the Council in implementing its capital release programme over the next few years.
the dividendCCHL paid to Christchurch City Councilfor the 2015 year.
increase in container numbers through Lyttelton Portover the past 30 years.
Red Bus tripsduring the year
work on the Christchurch airport campusThe largest employment sitein the South Island.
New Zealanders serviced by City Care
the capital and dividend paymentsCCHL has madeto the Councilsince 1995Allowing major investments in community assets, while reducing the impact on rates.
$1.1 billion
$46.0 million
6,000
2 million10 times 3.8
million
2015 and beyond

86,500
the numberof subsidiary companies thatmake up CCHLOrion, Christchurch Airport,Lyttelton Port Company,Enable Services, City Care,Red Bus and EcoCentral.
tonnes of material diverted from
landfill by EcoCentral
the number ofhomes & businesses
to which Orion distributes power
the number of homes, businesses, schools & healthcare facilities that can now access fibre broadband services
191,000
97,620
seven
the rebuildThe CCHL group continues to play a vital role in the rebuild of Christchurch and Canterbury following the series of earthquakes that struck the region in 2010 and 2011. CCHL remains ready to assist its 100% shareholder Christchurch City Council as it addresses the multitude of challenges in rebuilding Christchurch.


1
Contents
C H R I S T C H U R C H C I T Y H O L D I N G S L I M I T E D I 2 0 1 5 A N N U A L R E P O R T
02 The CCHL group
03 About CCHL
04 The CCHL group subsidiaries
08 Chairman’s report
12 Financial overview
15 Corporate governance statement
17 CCHL board of directors
18 Subsidiary and associated companies:
18 Orion New Zealand Ltd
20 Christchurch International Airport Ltd
22 Lyttelton Port Company Ltd
24 Enable Services Ltd
26 City Care Ltd
28 Red Bus Ltd
30 EcoCentral Ltd
32 Monitored entities:
32 Canterbury Development Corporation
34 Financial statements
100 Statutory information
102 Independent auditor’s report
104 10 year summary
105 Directory and group contacts
Photo courtesy www.rsphotos.co.nz

C H R I S T C H U R C H C I T Y H O L D I N G S L I M I T E D I 2 0 1 5 A N N U A L R E P O R T
2
THE CCHL Group
▲ ▲
▲
▲ ▲
▲
▲ ▲
89.3%Orion
New Zealand Ltd
75%Christchurch
International Airport Ltd
100%Lyttelton PortCompany Ltd
100%EnableServices Ltd
100%City Care Ltd
100%EcoCentral Ltd
CanterburyDevelopmentCorporation
100%Red Bus Ltd
INFR
AST
RU
CT
UR
EC
ON
TR
AC
TIN
G
100%Christchurch City
Holdings LtdConnetics Ltd 100% Enable Networks Ltd
Associate
is the commercialand investment arm of
MO
NIT
OR
ING
RO
LE
Christchurch City Holdings
cc hl

C H R I S T C H U R C H C I T Y H O L D I N G S L I M I T E D I 2 0 1 5 A N N U A L R E P O R T
3
ABOUT CCHL
Christchurch City Holdings Ltd (CCHL) is the commercial and investment arm of Christchurch City Council (the Council). The company is responsible for managing the Council’s investment in seven fully or partly-owned trading companies –
Orion New Zealand Ltd, Christchurch International Airport Ltd, Lyttelton Port Company Ltd, Enable Services Ltd, City Care Ltd, Red Bus Ltd and EcoCentral Ltd.
CCHL also monitors the Canterbury Development Corporation on behalf of the Council.
CCHL’s key purpose is to invest in and promote the establishment of key infrastructure and this now extends to assisting the Council in the rebuild and redevelopment of Christchurch following the Canterbury earthquakes, and to working with the Council to implement its capital release programme as outlined in its Long Term Plan. Provisionally, this involves the release of up to $750m of capital from CCHL over the next three years through a combination of restructuring and asset sales.
Financial contributionChristchurch City Council’s decision in 1993 to retain its key infrastructural assets through the establishment of CCHL has created a successful public ownership model. The model has enabled CCHL to make over $1.1 billion of capital and dividend payments to the Council since 1995, allowing major investments in community assets, while reducing the impact on rates from such investments.
Over the same period, the asset value of CCHL through its trading companies has grown from some $400m to $3.3bn. Total group equity has risen from $261m in 1995 to over $1.9bn today (of which $1.6bn is attributable to Christchurch City Council as the 100% shareholder of CCHL).
CCHL’s ordinary dividend to the Council for the 2016 year is forecast at $46.0m, plus the return of any restructuring or sale proceeds, potentially amounting to $200m.
Independent governance of trading companiesOne reason for such a strong growth and return rate is the independent and commercial approach taken by the boards and management of the trading companies.
CCHL places a great deal of emphasis on ensuring the group has first class governance processes in place. Through a structured, independent process, CCHL recommends director appointments to subsidiary companies and monitors those companies on behalf of the Council. Further detail regarding the company’s corporate governance polices is set out onpage 15.
Accountability to the CouncilCCHL is accountable to the Council through a number of mechanisms, including:
• Approval of CCHL’s annual Statement of Intent;
• Council appointment of CCHL directors (four councillors and four external);
• Confirmation of director appointments to subsidiary companies;
• Periodic reporting to the Council; and
• Publication of half year and annual reports.CCHL’s key
purpose is to invest in and promote the
establishment of key
infrastructure.

C H R I S T C H U R C H C I T Y H O L D I N G S L I M I T E D I 2 0 1 5 A N N U A L R E P O R T
4
THE CCHL Group subsidiaries
Orion owns and operates the electricity distribution network that provides power to around 191,000 homes and businesses. Orion aims to provide a safe, resilient, reliable and cost effective electricity distribution network.
As one of the largest electricity distributors in New Zealand, Orion’s network covers remote rural areas, regional towns and the city of Christchurch. Its network traverses 8,000 square kilometres between the Waimakariri and Rakaia rivers and from the Canterbury coast to Arthur’s Pass.
Electricity retailers pay Orion for the network delivery service and include this in their retail charges to homes and businesses.
Around 190 employees work directly for Orion, and most days a further 300 contractors work on the network. All of these people are critical to Orion’s business as they plan, engineer, operate and control the network, manage finances and contracts, and give customers the best service they can.
Orion owns Connetics – an electrical contracting service provider to utility network operators, local authorities, developers and commercial/industrial customers.
Christchurch Airport is the natural gateway to the South Island, which has long been the engine room of New Zealand’s international tourism industry. It is the busiest and most strategic southern air connection to the world's trade and tourism markets, with more than 75,000 commercial aircraft movements and 5.93m passengers welcomed in the past year.
The airport is a major driver of the South Island regional economy and of regional economic development, with some 6000 personnel working on the airport campus in passenger, freight, export and logistics related businesses, making it the largest single site of employment in the South Island.
The South Island visitor economy employs approximately 63,000 full-time equivalent workers.
89.3%Christchurch International Airport LtdOrion New Zealand Ltd
The recently commissioned Waimakariri substation 66kV switch room, built to reinforce
the power network in northern Christchurch.
75%
MILLION
$635Value in CCHL’sbalance sheet
MILLION
$753Value in CCHL’sbalance sheet
Singapore Airlines and the airport celebrated 50 years of Singapore’s independence.

C H R I S T C H U R C H C I T Y H O L D I N G S L I M I T E D I 2 0 1 5 A N N U A L R E P O R T
5
MILLION
$459Value in CCHL’sbalance sheet
Lyttelton Port Company Ltd
100%
Enable Services Ltd (ESL) is an investor in a fibre broadband network that is transforming how people in greater Christchurch use technology to do business, learn, provide community services, communicate with family and be entertained. The potential of fibre broadband to deliver tremendous value to our community as an enabler of future innovation and economic growth is beginning to be realised in Christchurch.
ESL is a shareholder in Enable Networks Ltd (ENL), along with Government agency Crown Fibre Holdings Ltd – as part of the national ultra-fast broadband (UFB) initiative. Today, 86,500 homes, businesses, schools and healthcare facilities within our community can connect to ENL’s fibre broadband network. This number of potential customers will grow to 180,000 across Christchurch and parts of Waimakariri and Selwyn by 31 December 2018.
ESL is also an infrastructure service company contracted to build and operate the network and to provide a range of management services to ENL. As the provider of network and management services, ESL has generated over 550 new jobs within the local community since the project began in 2011.
Enable Services Ltd
100%
MILLION
$86Value in CCHL’sbalance sheet
Connecting a home to fibre broadband.
Lyttelton Port of Christchurch (LPC) is the South Island’s biggest port and the third largest container terminal inNew Zealand.
The port facilitates import and export trade for the region, playing a vital role in supporting the economy, businesses, people and the global transport network.
A full array of shipping services, including stevedoring and cargo handling, are offered for a diverse range of trades.On the water, full marine services are provided including the provision of tugs and pilots to escort ships into and out of the port.
Over 376,000 TEUs (20-foot equivalent units) of containerised cargo travels through the port each year. The port is fully serviced by rail. LPC’s coal facility is the largest in New Zealand.
Situated six kilometres from the Lyttelton Container Terminal is LPC’s inland port, CityDepot. This container storage and repair facility has the capacity to store up to 10,000 TEUs.
Under development is LPC’s Midland Port at Rolleston which will provide a container rail link to and from the port early next year. It will service the increasing productivity from the Canterbury plains and reduce road congestion.
LPC is the largest employer in Lyttelton with over 500permanent staff and operates 24 hours a day, 365 days a year.
Lyttelton Port as seen from the village.

C H R I S T C H U R C H C I T Y H O L D I N G S L I M I T E D I 2 0 1 5 A N N U A L R E P O R T
6
THE CCHL Group subsidiaries CONTD.
City Care is a leading provider of construction, maintenance and management services across the builtenvironment. City Care delivers its services to over twomillion New Zealanders, from 17 offices and depotsthroughout New Zealand.
Since its launch in 1999 as a company operating solely inChristchurch, City Care has grown into a large, profitable national entity. It now holds a major portion of the local government infrastructure maintenance market, with 13 cityand district council clients (including Christchurch City Council) and is recognised as a major player within the building, civil construction, water and wastewater, green space, roading, construction and facilities management sectors.
In 2011, City Care joined four other contractors in signing theStronger Christchurch Infrastructure Rebuild Team (SCIRT)agreement to rebuild Christchurch’s earthquake damagedroads, water networks and bridges. This work is expected to continue until the end of 2016.
City Care is known for the calibre and dedication of itspeople who are proud to work around the clock in theircommunities to keep things working 24/7.
City Care Ltd Red Bus Ltd
Red Bus Limited operates an extensive passenger transport business in Canterbury with approximately 230 employees and 122 vehicles.
Red Bus’ vision is to lead the way in passenger transport.The company aims to achieve this by operating a profitable and innovative passenger service while maintaining its reputation as a good employer. The company is very conscious of its responsibilities in getting Christchurch residents to work, school and other engagements around the city and district.
Each year, the company’s urban bus fleet delivers 3.4m passenger trips and travels around 5.7m kilometres, delivering an average of 9,400 passenger trips every day on services that operate 20 hours a day, seven days a week.
Red Bus’ urban services are predominantly operated under contract to Environment Canterbury (ECan), the planner and regulator for Canterbury public transport.
The company also operates two commercial urban services without ratepayer subsidy, alongside its charter, tourism and ‘Red Travel’ coach services.
MILLION
$113Value in CCHL’sbalance sheet
MILLION
$44Value in CCHL’sbalance sheet
100%
Drivers were trained on a simulatorbefore the bus exchange opened.
100%
Artist's impression of the Margaret MahyFamily Playground. (Image courtesy of CERA).

C H R I S T C H U R C H C I T Y H O L D I N G S L I M I T E D I 2 0 1 5 A N N U A L R E P O R T
7
EcoCentral Ltd
EcoCentral Ltd manages the processing of household and commercial refuse and the automated sorting of recycling throughout the Canterbury region. The company is committed to reducing the amount of waste going to landfill and finding ways to ensure Christchurch leads the way in recycling.
EcoCentral Ltd manages:
• EcoSort, a large facility that receives all the ‘yellow bin’ recycling from Christchurch and surrounding areas. Here the materials are automatically sorted, baled and sold as reclaimed material either in New Zealand or overseas.
• EcoDrops, three transfer stations that manage the city’s recycling and refuse. Each station accepts unwanted household items, recycling, hazardous waste, general refuse, green waste and hardfill.
• EcoShop, on Blenheim Road, is the retail outlet for the household recycled goods received from the EcoDrop transfer stations. Goods are inspected by workshop staff before they are sold in the shop.
MILLION
$9Value in CCHL’sbalance sheet
100%
Cans, baled up and ready for recycling.
Canterbury Development Corporation is owned by Christchurch City Council, but is not part of the CCHL group. However, at the request of the Council, CCHL has assumed a monitoring role for this organisation.
CDC’s role is to support, encourage and influence the economic success of the greater Christchurch region.The organisation works with business, government agencies and private sector experts to drive exports and innovation, generate wealth and provide better ways to develop a strong economy.
In 2013 CDC developed the Christchurch Economic Development Strategy (CEDS) in partnership with key stakeholders including Christchurch City Council, government agencies and business representatives. CDC reports quarterly on the progress of these projects, many of which are led by other organisations.
CDC also undertakes significant activity in its innovation, business partner and business services areas.
Canterbury Development Corporation
CDC Client Manager ManufacturingJohn Hamilton with Tom Thomson, Managing
Director Elastomer Products Ltd.
Monitored by CCHL

C H R I S T C H U R C H C I T Y H O L D I N G S L I M I T E D I 2 0 1 5 A N N U A L R E P O R T
8 Group Group SoI 2015 2014 forecast $'000 $'000 $'000
Profit before tax for yearas reported 177,995 454,801 118,000
Insurance proceeds recognised (29,000) (357,732) –
Investment property gains (18,086) (9,223) (5,100)
(47,086) (366,955) (5,100)
Underlying profit before tax 130,909 87,846 112,900
Chairman’s REPORT
The high quality decision-making
and disaster-preparedness of
our companies is undoubtedly
a major strength of the group
and we value the very positive relationships we
have with each one of them.
The CCHL group has grown significantly in value over the years, and its 100% shareholder Christchurch City Council is in the position of owning a valuable portfolio of commercial assets.
The Council has determined that it will need to raise a substantial amount of capital from CCHL through its capital release programme in order to keep its forecast debt within appropriate limits. CCHL is committed to working proactively in executing the Council's capital release strategy over the next few years.
FinancialGroup
The reported consolidated profit for the year was $132.3m. This is significantly lower than the $402.6m recorded in the 2014 financial year. There were a numberof one-off factors – in particular the recognition of insurance revenues by Lyttelton Port Company Ltd in 2014 – that make a direct comparison of the results misleading.
The following table adjusts the reported pre-tax group profits of 2015 and 2014, and the forecasts in last year’s Statement of Intent (SoI), for the above-noted factors to arrive at an underlying profit before tax figure:
The CCHL group continues to play a vital role in the recovery of Christchurch and Canterbury following the series of earthquakes that struck the region in 2010 and 2011. Overall the group is in strong financial shape, with many of the companies now experiencing improved profitability and growth as they return to business as usual.
The underlying profit before tax for the year has improved by some $43m from the 2014 result, and is $18m higher than the SoI forecast.
The main reasons for the improvement over the previous year are:
• an improvement in Christchurch International Airport Ltd’s underlying pre-tax profit reflecting improved passenger numbers, the implementation of aeronautical price increases, gains on asset sales and the containment of costs despite increased activity levels.
• increased profitability in Lyttelton Port Company Ltd, reflecting a reduction in costs directly related to the earthquakes.
• an improvement in Orion New Zealand Ltd’s result, reflecting increased revenue, higher numbers of connections and containment of costs.
The $18m improvement over last year’s SoI forecasts was due in the main to higher than budgeted results from Orion New Zealand Ltd.
Further information regarding the financial results and position of the group and parent company is provided in the “Financial overview” section on pages 12 to 14, and in the reviews of the individual companies on pages 18 to 31.

C H R I S T C H U R C H C I T Y H O L D I N G S L I M I T E D I 2 0 1 5 A N N U A L R E P O R T
9
Parent companyThe parent company’s net profit for the year of $68.8m was well up on the previous year’s result of $37.1m, mainly reflecting the receipt of special dividends from Orion New Zealand Ltd and Lyttelton Port Company Ltd – the latter being part of the takeover offer referred to below.
Parent company reserves increased by $248m, primarily as a result of revaluations of the company’s investments in Christchurch International Airport Ltd, Lyttelton Port Company Ltd and Enable Services Ltd. Note 2 to the financial statements provides an analysis of the valuation methodologies and assumptions.I note, however, that these valuations are specifically for financial reporting purposes and may well differ from market value.
The company paid an ordinary dividend to Christchurch City Council of $46m which, when taking into account an adjustment for subvention receipts voluntarily foregone by CCHL, met the budgeted dividend in CCHL’s Statement of Intent.
During the year, CCHL completed its full takeover of Lyttelton Port Company Ltd, and de-listed it from NZX. Owning 100% of the port will provide flexibility for any future restructuring options.
Electricity networkOrion New Zealand Ltd recorded a profit of $82.6m for the 2015 financial year, $34.6m above its Statement of Intent target and $32.1m above last year. Included in the result was the final settlement of Orion's earthquake claims, which added $24.0m to the post-tax result.
In total, Orion has received some $53m in respect of its earthquake claims, mainly relating to substation repairs and business interruption costs. It is pleasing that Orion has finally settled these complex claims.
The company has continued to invest in rebuild projects to reinstate the network following the earthquakes, taking into account changes in the
distribution of the city’s and region’s population and businesses. It plans to invest a further $300m into the network over the next four years.
Orion has reviewed its capital structure and is planning to return $90m of capital to shareholders by way of a pro-rata share buyback.This will reduce Orion's equity and increase its debt by $90m, moving the company towards a more efficient capital structure, well within prudent levels.
AirportChristchurch International Airport Ltd recorded a significantly improved result, up from $15.7m to $39.3m. This reflected growth in passenger numbers, new airline capacity, increased aeronautical charges (reflecting CIAL’s investment in new infrastructure), continuing development of property, and improved retail and parking options. Additionally, there were upwards revaluations of investment properties and a one-off gain on sale of land to NZTA relating to the SH1 enhancement project NZTA is undertaking adjacent to Christchurch Airport.
International passenger movements increased by 7.0% and domestic passengers by 3.3%. Further capacity commitments already signalled by various airlines indicate Christchurch Airport will have strong aeronautical growth in the current financial year, particularly in international. There are new international airline services from China Southern Airlines, China Airlines, Singapore Airlines, Virgin Australia, Qantas and Fiji Airlines, and Air New Zealand has added significant domestic airline capacity, especially on the Christchurch – Auckland route.
The airport recognises that long haul growth will predominantly come from foreign carriers, connecting Christchurch and the South Island with Australia, Asia and beyond, as Air New Zealand is focusing on growing and dominating the hub it has created at Auckland. Overall, the outlook for the current year appears promising.
Port Lyttelton Port Company Ltd recorded a solid result and continues to be in a strong financial position, with improvements in operational performance starting to be realised and the port redevelopment plan moving forward.
There has been strong competition in the market over the year. Despite this, container volumes have remained steady, exceeding LPC’s annual target by almost 9,000 TEUs (20-foot equivalent units). General cargo volumes also exceeded expectations for the year, in particular dry bulk and motor vehicles. Coal, while down on the previous year, also delivered volumes in line with expectations.
LPC has taken responsibility for the accident at the port on 28 August 2014 in which Brad Fletcher was killed.LPC pleaded guilty and was sentenced on a charge under the Health and Safety in Employment Act.
Health and safety is a major priority for the company. It has processes in place for both port users and staff to discuss and raise safety issues and have them resolved.
The company has undertaken significant development activity during the year, including the restoration of Cashin Quay 2 as a container wharf – parts of the new wharf are already in use and it will be fully operational in early 2016. Land reclamation in Te Awaparahi Bay has increased to 8.4 hectares.
The Christchurch City Council project to reopen Sumner Road is progressing and when open, it will reconnect Lyttelton with Sumner. This will deliver a more resilient and safe alternative access route to and from Lyttelton. LPC is also continuing to progress the Dampier Bay development to provide a 200-berth marina, improved public access to the waterfront and an area of commercial activity.

C H R I S T C H U R C H C I T Y H O L D I N G S L I M I T E D I 2 0 1 5 A N N U A L R E P O R T
10
Chairman’s REPORT CONTD.
BroadbandEnable Services Ltd had another successful year, with fibre broadband network deployment completed to over 27,000 homes and business premises in the 2015 year – some 15% ahead of the plan agreed with Crown Fibre Holdings Ltd. As at 30 June 2015, Enable had completed 44% of the total network build.
Rates of fibre uptake have been very pleasing, with an overall rate of 14.2%. In some communities, uptake is much higher – eg. Rolleston is almost at 40%; Lincoln and Halswell are close to 30% and several other areas over 20%. Vodafone entered the local residential fibre broadband market in September 2014, following Spark's entry in early 2014.
By mid-2016, Enable is aiming to be two thirds through its deployment programme, which includes ensuring that fibre broadband services are available to 90% of businesses and all 151 schools by 31 December 2015. Enable is also targeting connecting a further 12,000 new customers in the 2016 financial year.
ContractingCity Care continued to perform well during the 2015 financial year, with an after-tax return on average equity of 19.2%.
City Care Ltd continued to be an integral part of the Christchurch city rebuild, through its participation in the Stronger Christchurch Infrastructure Rebuild Team (SCIRT) that is responsible for rebuilding the City’s horizontal infrastructure including damaged roads, fresh water, wastewater and stormwater networks. The company also undertook the rebuild and refurbishment of such local landmarks as the Cholmondeley Children's Centre in Governor's Bay and the Waltham Community Pool.
During the year, City Care acquired Command Building Services, a provider of heating, ventilation and air conditioning (HVAC) services.
Shortly after the year end, City Care also acquired Apex Environmental, a specialised industrial water and wastewater consultancy business. Both of these acquisitions will enhance City Care's capability, capacity and expertise in these areas.
City Care also had significant involvement in emergency response operations – in particular some major flooding events in Dunedin and various locations in the lower and central North Island.
Public transportRed Bus Ltd is gradually improving its financial performance, returning a small profit for the year after a $0.6m loss in 2014. Patronage levels on Red Bus's urban passenger services have remained relatively consistent, and the company continues to explore new ways of growing the business. During the year it established Red Travel coach services which added scale, range and capacity to the company’s charter and tourism services.
It is also seeking commercial passenger transport opportunities similar to the Darfield and Oxford services, with one additional regional service currently being assessed, and through the continued expansion of Red Travel, Charter, The Rebuild Tour and Akaroa Shuttle. Inbound tourism is expected to grow again through 2016 as hotels, retail and business activities reopen in Christchurch.
RecyclingEcoCentral Ltd recorded another improved result for the year, and has continued to repay debt. It continues to play a key role in Christchurch’s infrastructure.
Trading through the EcoDrop transfer stations continued to be strong, and operations at the EcoSort have been steadily improving in terms of efficiency and quality. The EcoShop, while small in relation to the other activities, also performed particularly well.
Economic developmentThe Canterbury Development Corporation is owned by Christchurch City Council, but is not part of the CCHL group. However, at the request of the Council, CCHL has assumed a monitoring role for this organisation.
CDC’s role is to support, encourage and influence the economic success of the Greater Christchurch region. The organisation works with business, government agencies and private sector experts to drive exports and innovation, generate wealth and provide better ways to develop a strong economy.
Following the launch of the updated Canterbury Economic Development Strategy (CEDS) in 2013, the focus for 2015 was on the delivery of the projects identified in the strategy.CDC reports quarterly on the progress of these projects, many of which are led by other organisations.
There was also significant activity and progress in CDC’s innovation, business partner and business services areas.
District Energy SystemIn the year under review, CCHL continued to work with its partners – Canterbury District Health board, Christchurch City Council, the Canterbury Earthquake Recovery Agency, Cofely Energy Services and Pioneer Generation – to introduce a District Energy System into the Christchurch central city.
At this stage two energy hubs appear to offer greatest potential. One of these is around the Christchurch Hospital, with potential for connection to the Metro Sports Facility.The second is around the Council's Head Office (the Civic Centre) withpotential connection to the redeveloped King Edward Barracks site. Detailed commercial negotiations are currently underway with key foundation customers in these hubs.

11
C H R I S T C H U R C H C I T Y H O L D I N G S L I M I T E D I 2 0 1 5 A N N U A L R E P O R T
As of the end of June 2015, at the end of the DES Alliance period, responsibility for the project transitioned to the newly-formed Christchurch District Energy Company (CDEC), a joint venture between Pioneer Generation and Cofely Energy Services. Important city stakeholders, including the Council, CERA and the CDHB will continue to be involved in the CDEC governance.
CCHL has therefore completed its role as a catalyst for the District Energy Scheme, and is pleased to see that the project has taken a life of its own and continues to develop and grow.
GovernanceThe CCHL board recognises that good governance is critical to the ongoing success of the group, and this continues to be a key focal point of its activities.
CCHL has a governance and appointments committee whose role is to recommend director appointments, review governance policies and ensure that good succession policies are in place for key governance positions on both the parent and subsidiary companies.
Last year CCHL established an intern director programme for positions on the boards of CCHL and the subsidiary companies. The feedback from the companies and the interns has been overwhelmingly positive, and through mutual agreement, the existing intern positions have been extended to December 2015.
CCHL remains committed to the ownership and monitoring role entrusted to it by its shareholder, Christchurch City Council.
The quality of governance that results from this focus has been recognised by the business community in Christchurch, and by local authorities elsewhere in New Zealand which seek to emulate the CCHL model. In particular, we are delighted at the number and calibre of the experienced and talented people who continue to put their names forward for consideration as directors within the group.
AcknowledgementsThe CCHL board and management are particularly appreciative of the contribution made by the boards, management and all the staff of our subsidiary companies as they continue to grow and rebuild in this post-earthquake environment.
The high quality decision-making and disaster-preparedness of our companies is undoubtedly a major strength of the group and we value the very positive relationships we have with each one of them.
The board would also like to acknowledge the on-going commitment of a small but hard working executive team. They continue to achieve a great deal in a difficult and high pressure environment.
Bruce IrvineChairman
CCHL intern directors. (left to right). Jane George (Enable),Elizabeth Kirby (CIAL),Shannon Goldsmith (CCHL),Jonathan Lyttle (CCHL),Leah Scales (Red Bus),Donna Frew (Orion),Gabrielle Wall (City Care),Claire Evans (LPC).

C H R I S T C H U R C H C I T Y H O L D I N G S L I M I T E D I 2 0 1 5 A N N U A L R E P O R T
12
Investment overview
CCHL records investments in subsidiaries at fair value, and reviews them annually for material changes in value. The board considers that recording assets at fair value rather than historical cost ensures greater accountability for its custodianship of these investments.
The subsidiary and associated companies are independent profitable businesses, and not subsidised in any way by CCHL or the Council.
The top table at right summarises the carrying value of CCHL’s main investments as at balance date, and compares them to the carrying value at the previous year end.
Return on investment
The bottom chart at right shows what CCHL has earned on its investments – since CCHL acquired each investment and over the last 10 years.
The chart uses an annualised internal rate of return (IRR) methodology. This includes dividends received and changes in the value of each investment. The valuation of each investment is an important, but necessarily subjective, input in the IRR calculations. Nevertheless, CCHL believes that IRR is a good indicator of investment returns over long periods.
CCHL acquired its shares in Orion from Christchurch City Council in 1993. CCHL has benefitted from impressive returns from Orion. Orion achieved significant one-offgains when it sold its electricity retail activities (Southpower) in 1999 and its North Island natural gas distribution operations (Enerco) in 2001. Since then, Orion’s earnings have been relatively consistent with those of a regulated infrastructure company.CCHL acquired its shares in the airport from Christchurch City Council in 1995. CCHL has benefitted from good returns from this investment. After relatively high earnings early on in relation to the original cost of investment, earnings have since stabilised, partly due to quake impacts and partly due to increased competition and regulation. The airport’s return from its aeronautical operations has been particularly affected by the reduction in passenger numbers since the earthquakes, coinciding with the major capital investment in completing the Integrated Terminal Project.
The overall return from the port, also acquired in 1995, in part reflects the impact of an improved 2015 revaluation following its delisting during the year. While the port's physical assets suffered extensive damage from the earthquakes, trading volumes have held up well, particularly in the container trade.
Enable Services, which won the Crown’s ultra-fast broadband fibre roll-out contract for Christchurch in 2011, has made and will continue to make losses during the fibre network build period. However, CCHL forecasts that Enable’s earnings and IRR will be in line with expected returns from an infrastructure company over a 30 year period. The 2015 closing valuation reflects this earnings expectation.
Financial Overview
Overview
The CCHL parent company does not undertake trading operations in its own right. Its primary assets are its investments in its operating subsidiaries and associated companies, and advances to its subsidiaries and shareholder Christchurch City Council.
CCHL investment returns
IRR since inception
-10% -5% 0 5% 10% 15% 20% 25%
Orion
CIAL
LPC
Enable
City Care
Red Bus
IRR over last 10 years
CCHL investments
$m
800 -
700 -
600 -
500 -
400 -
300 -
200 -
100 -
0 -Orion CIAL LPC Enable City Care Red Bus EcoCentral Loans
2015 2014
EcoCentral

13
C H R I S T C H U R C H C I T Y H O L D I N G S L I M I T E D I 2 0 1 5 A N N U A L R E P O R T
CCHL assets and equity
CCHL group net debt and gearing
$m
3,500 -
3,000 -
2,500 -
2,000 -
1,500 -
1,000 -
500 -
0 -2006 2007 2009 2009 2010 2011 2012 2013 2014 2015
Assets Equity
2006 2007 2009 2000 2010 2011 2012 2013 2014 2015
Gearing (%) Net debt ($m)
- 40%
- 35%
- 30%
- 25%
- 20%
- 15%
- 10%
- 5%
- 0%
$m
800 -
600 -
400 -
200 -
0 -
CCHL acquired City Care from Christchurch City Council in 2002. City Care has been a strong performer, especially due to sharply increased workloads post-quakes.
CCHL acquired Red Bus from the Council in 1995. Red Bus has performed steadily, but its recent earnings have reduced due to increased competition, post-quakes disruptions and reduced demand.
EcoCentral has only been in the CCHL group since 2011, and was recapitalised in 2012.
Growth in group assets and equity overthe last 10 years.
This chart shows the growth in groupassets and equity over the last 10 years. This growth has been achieved in addition to the payment of $473m of dividends to the Council over the same period.
Group net debt and gearing
This chart shows the level of the CCHL group’s net debt and gearing levels overthe last 10 years.
Parent and group net debt levels remain relatively low for a group that predominantly comprises stable infrastructure businesses, and interest cover ratios are correspondingly conservative. The increase in net debt from 2009 to 2013 is largely the result of Christchurch International Airport Ltd’s terminal redevelopment programme and the continued expansion of Enable Services Ltd’s broadband construction programme.
The large Lyttelton Port Company Ltd insurance settlement in early 2014 resulted in a significant reduction in group net debt, although this will reverse over time as the port’s earthquake repair and reinstatement programme progresses.

C H R I S T C H U R C H C I T Y H O L D I N G S L I M I T E D I 2 0 1 5 A N N U A L R E P O R T
14
Group position and results FINANCIAL OVERVIEW CONTD.
Total assets have increased by $135m.
This reflects the elevated capital expenditure programmes of Orion New Zealand Ltd and Lyttelton Port Company Ltd as they reconstruct and enhance their earthquake-damaged assets.
Additionally, Christchurch International Airport Ltd recognised some revaluation gains on its investment property portfolio.
Net debt has increased by 52% to $629m.
This primarily reflects additional borrowing by CCHL to fund Enable's ongoing build programme for the UltraFast broadband network,the purchase of the minority shares in Lyttelton Port Company Ltdand the major capital repair programme of the port company.
This underlying increase primarily arises from Orion, which recorded improved operating revenues, and the airport, which recorded improved aeronautical revenues and gains on revaluation of its investment properties.
The underlying group trading profitability – excluding insurance revenues and unrealised valuation gains – has improved.
This mainly reflects improvements in the trading performance of the airport, Orion and the port company, and is discussed further in the Chairman’s review.
2014 2015
2014 2015
2014 2015
2014 2015
3,166 3,301
413 629
986 1,049
88 131
NET DEBT ($’m)
OPERATING REVENUE excluding insurance ($m)
UNDERLYING NET PROFIT BEFORE TAX ($m)
TOTAL ASSETS ($m)

C H R I S T C H U R C H C I T Y H O L D I N G S L I M I T E D I 2 0 1 5 A N N U A L R E P O R T
15
Corporate Governance Statement
Role of the boardThe primary role of the board is the governance of the company.The board undertakes stewardship on behalf of the shareholders to ensure the ongoing health and viability of the company.
The board effectively represents, and promotes the interests of the shareholders with a view to adding long-term value to the company’s shares.
The board has all the powers necessary for managing, and for directing and supervising the management of the business and affairs of the company.
Having regard to its role, the board directs and overviews the business and affairs of the company, including in particular:
• Ensuring that the company goals are clearly established, and that strategies are in place for achieving them;
• Establishing policies for strengthening the performance of the company and subsidiaries, to ensure enhancement of shareholder value;
• Overviewing the role the company and its subsidiaries can play in the provision of essential infrastructure services for the region;
• Monitoring the performance of subsidiaries;
• Deciding on whatever steps are necessary to protect the company’s financial position and the ability to meet its debts and other obligations when they fall due, and ensuring that such steps are taken;
• Ensuring that the company’s financial statements are true and fair and otherwise conform with law;
• Ensuring that the company adheres to high standards of ethics and corporate behaviour;
• Ensuring that the company has appropriate risk management/regulatory compliance policies in place;
• Approving and implementing the business plan and Statement of Intent of the company, and
• Reviewing and approving the company’s capital investments and distributions.
The board monitors economic, political, social and legal issues and other relevant external matters that may influence or affect the development of the business or the interests of the shareholder and, if thought appropriate, will take outside expert advice on these matters.
Board relationship with shareholderThe board uses its best endeavours to familiarise itself with issues of concern to the shareholder.
The board aims to ensure that the Council is informed of all major developments affecting the company’s and group’s state of affairs, while at the same time recognising that commercial sensitivity may preclude certain information being made public. Within this constraint, information is communicated to the Council through periodic reports to the Council, occasional seminars and through both the annual report and the half yearly report.
The board recommends to the Council the appointment of directors to subsidiary companies and the adoption of the subsidiary Statements of Intent.
Conduct of DirectorsThe conduct of directors is required to be consistent with their duties and responsibilities to the company and, indirectly, to the shareholder.In carrying out its role the board places emphasis on strategic issues and policy.
Directors are expected to keep themselves abreast of changes and trends in the business and in the company’s environment and markets.
Directors use their best endeavours to attend board meetings and to prepare thoroughly and are expected to participate fully, frankly and constructively in board discussions and other activities and to bring the benefit of their particular knowledge, skills and abilities to the board table.
Directors are entitled to have access, at all reasonable times, to all relevant company information and to management.
Directors are expected to strictly observe the provisions of the Companies Act 1993 applicable to the use and confidentiality of company information.
Board Chairperson The shareholder appoints from among the directors a Chairperson.
The Chairperson is responsible forrepresenting the board to the share-holder, and for ensuring the integrity and effectiveness of the governance process of the board.
The Chairperson is responsible for maintaining regular dialogue with theCEO over all operational matters and consults with the remainder of the board promptly over any matter that gives him or her cause for major concern.
The Chairperson acts as facilitator atmeetings of the board to ensure thatdiscussion results in logical and understandable outcomes.
The Chairperson leads a board and director evaluation exercise every two years.
The Deputy Chairperson may fulfil the Chairperson’s responsibilities in the absence of the latter.
This statement gives readers an overview of the company’s main corporate governance policies, practices and
processes adopted or followed by the CCHL board.

C H R I S T C H U R C H C I T Y H O L D I N G S L I M I T E D I 2 0 1 5 A N N U A L R E P O R T
16
Board committeesThe board has two standing committees namely the Audit and Risk Management Committee and the Governance and Appointments Committee. Other committees are formed for specific purposes and disbanded as required.
The purposes of the standing committees are as follows:
• The Audit & Risk Management Committee provides a forum for effective communication between the board and the auditors.
The Committee reviews the annual and half-yearly financial statements prior to their approval by the board, the effectiveness of management information and systems of internal control, the efficiency and effectiveness of the external audit functions and the financial role of management and policy. The Committee also keeps under review risk management issues and practices of CCHL and its subsidiaries.
• The Governance & Appointments Committee reviews the policies of the board and conducts an annual review and appointment process regarding the directors of the subsidiaries and advises on appointment of the best people to meet the companies’ needs.
Board composition and mixThe composition of the board reflects the duties and responsibilities it has to discharge and perform in the interests of shareholders, and in setting the company’s strategy and seeing that it is implemented.
The board comprises eight directors: four councillors and four appointed external to the Council. This mix is to ensure that the board has the confidence of the Council and has strong commercial expertise so that it can effectively carry out its role as a buffer between the Council and its commercial trading entities.
Generally, the requirements for board membership are the ability and experience to make sensible business decisions and recommendations, entrepreneurial talent for contributing to the creation of shareholder value, the ability to see the wider picture, the ability to ask the hard questions, high ethical standards, sound practical sense, and a total commitment to furthering the interests of the shareholder and the achievement of the company goals.
Directors’ remunerationThe board recommends to the shareholder on a triennial basis thelevel of remuneration paid to directors.
Protocol on conflicts of interestThe board maintains a separate policyon conflicts of interest which meets allcurrent legislative requirements.
The board maintains a full and updated interest register which is available at all board meetings.
Board and director evaluationsThe board, every two years, evaluates its own performance, and its own processes and procedures to ensure that they are not unduly complex, that each director is performing adequately and that the board as a whole is effectively fulfilling its role.
Indemnities and insuranceThe company provides directors with, and pays the premiums for, directors’ and officers’ liability insurance cover while acting in their capacities asdirectors, to the fullest extent permitted by the Companies Act 1993.
The company indemnifies all directors and the CEO to the fullest extent allowed for, and in compliance with the requirements of the Companies Act 1993.
The Chief ExecutiveThe CEO is an employee of the company and employed in terms of a contract between the CEO and the company.
On an annual basis the Chairperson will undertake a performance appraisal with the CEO and set appropriate key performance targets for the year ahead.
Board – management relationshipThe board delegates management of the day to day affairs, and management responsibility of the company, to the executive team under the leadership of the CEO to deliver the strategic direction and goals determined by the board.
All board authority conferred on management is delegated through the CEO.
The CEO is responsible to the board to provide advice and implement board policy.
The CEO:• Ensures that appropriate, relevant
reporting systems are in place and maintained to provide relevant, complete, accurate and timely information to the board;
• Provides day to day management of the company;
• Acts as a spokesperson for the company unless the Chairperson has specifically adopted this role for a particular issue; and
• Meets business plan and Statement of Intent targets set by the board.
When the board agrees with the CEO to achieve specific results directed towards the company goals, the CEO is authorised to make any decision and take any action directed at achieving those specific results.
The CEO is expected to act within all specific authorities delegated to him or her by the board.
Corporate Governance Statement CONTD.

17
C H R I S T C H U R C H C I T Y H O L D I N G S L I M I T E D I 2 0 1 5 A N N U A L R E P O R T
Andy PearceRaf Manji Sarah Smith Bob Lineham
Raf Manji is a City Councillor.He was appointed to the CCHL board in December 2013.He is a director of Sustento Ltd.
Andy Pearce was appointed to the CCHL board in 2006.He is Chairman of Focus Genetics Management Ltd, Hawke’s Bay Regional Investment Company Ltd and Regional Committee, Canterbury Water Strategy, and a director of Bank of New Zealand and a number of other companies.
Sarah Smith was appointed to the CCHL board in November 2007.She is Chair of Ngai Tahu Tourism Ltd and a director of SLI Systems Ltd and a number of other companies. Sarah is also a trustee of Ohinetahi Charitable Trust and Warren Architects Education Charitable Trust.
Bob Lineham has been the Chief Executive of CCHL since it was established in 1993.Bob is also a director of Red Bus Ltd and a member of the Canterbury District Health board Quality, Finance, Audit and Risk Committee.
BSc (Hons), MSc, PhD, FNZIM
BCom, FCA, FNZIM, CF.InstD
Chief ExecutiveBCom, CA, CF.Inst.DBA Econ. (Manchester),
Grad DipArts (PolSci) Dist. (Canty), MIntLAw & Pols,First Class Hon. (Canty)
Board of Directors
Bruce Irvine was first appointed to the CCHL board in November 2003, and became Chairman in November 2007. Bruce is Chairman of Heartland Bank Ltd and is a director of a number of other public and private companies.He is also a trustee of the Christchurch Symphony Trust.
Vicki Buck is the Deputy Mayor of Christchurch, and was appointed to the CCHL board in December 2013.Vicki is also a director of NZ Windfarms Ltd and Think Inc Ltd.
Bill Dwyer joined the CCHL board in 2005.Bill is a former managing partner of Lane Neave Lawyers, a director of Coconut Culture and a trustee of the Wavertree Trust.
Jamie Gough is a City Councillor.He was appointed to the CCHL board in December 2013.He is a director of the Gough Group and Gough Corporation Holdings Ltd and various other companies, and a trustee of the Antony Gough Trust.
Yani Johanson is a City Councillor. He was appointed to the CCHL board in December 2013. He is a trustee of the Arts Centre Trust.
Vicki BuckBruce Irvine Jamie GoughBill Dwyer Yani JohansonBCom, LLB, FCA, F.Inst.D
ChairmanLL.B (Hons), B.Ed CM.Inst.DMA (Hons) PolSci.

18
network connectionsduring the yearTotal network connections now exceed Orion’s pre-quake level for the first time.
5 year summary
Operating revenue 222.1 245.3 260.9 269.5 332.9
Profit 28.4 54.2 49.0 50.5 82.6
Dividends 38.0 34.0 32.0 34.0 56.0
Total assets 821.4 861.2 888.8 1,039.7 1,083.9
Shareholders’ equity 599.6 619.6 636.9 733.00 759.7
2011 2012 2013 2014 2015 $m $m $m $m $m
700 -
600 -
500 -
400 -
300 -
200 -
100 -
0 -2011
Electricity maximum demand(MW)
2012 2013 2014 2015
89.3%Owned by Christchurch City Holdings Ltd
4,000 -
3,000 -
2,000 -
1,000 -
0 -2011
SAIDI(Average customer minutes of interruption)
2012 2013 2014 2015
A team from Connetics installing one of three 66kV cables connecting the Papanui and new
Waimakariri zone substations.
*Includes the impact of earthquakes & storm events.
*
2,100 more
homes & businessesOrion owns and operates the electricity
distribution network that provides power to around 191,000 homes and businesses.
191,000

19
A dependable electricity supply is vital to the economic wellbeing of central Canterbury. It is also essential to
social wellbeing, particularly with Canterbury’s cold winters, clean air issues, lack of reticulated gas and with
many homes still quake-damaged.
Prior to the Canterbury earthquakes, Orion managed one of the highest
performing electricity distribution networks in New Zealand. In 2015,
the company made good progress in its ongoing quest to restore its
network reliability to pre-quake levels by 2019.
C H R I S T C H U R C H C I T Y H O L D I N G S L I M I T E D I 2 0 1 5 A N N U A L R E P O R T
A Connetics team laying cables under the Bridge Street road bridge.
Orion New Zealand LTD
Financial performanceThe final settlement of Orion’s earthquake insurance claims provided a $24m boost in profit for the year. Orion achieved a net profit of $83m after tax – $35m above its statement of intent target and $32m above last year.
Orion is investing far more than its $53m of total insurance receipts torestore its network, support the wider rebuild and meet the needs of a changing region. It has invested over $80m in network-related capital expenditure in each of the past twoyears, and will top that again in thecoming year. This is more than $30ma year above its normal capital expenditure levels.
Orion is continuing to control its operating costs. Network operating costs were around $1m below last year’s.
The company’s debt is rising due to the significant capital expenditure programme, which should be largely complete by 31 March 2018. It has reviewed its capital structure and isnow planning to return $90m of capital to its two council shareholders by way of a pro-rata share buy-back, subject to acceptable rulings from Inland Revenue. This will reduce shareholders’ equity and increase interest bearing debt by $90m, enabling a more efficient capital structure, well within prudent levels.
Orion subsidiary Connetics is busy with significant post-quake commercial and residential development workloads. Connetics’ net profit was 37% above last year.
Orion met its Commerce Commission targets for network reliability.On average, a customer would have had 1.2 network outages during the year and around two hours without power. Its network reliability is still better than average by New Zealand standards but is lower than the pre-quake levels.
Safety firstSafety is Orion’s single biggest priority and it takes all practicable steps to ensure people are safe around its network.
It has a particular focus on contractors with the large upswing in post-quake demolition and construction work. To-date there have been no serious harm electrical accidents related to consented projects.
Looking aheadOrion is focused on assessing and adapting to new technology.For example, the use of electric vehicles, household solar photovoltaic systems and other forms of distributed power generation systems are expected to become more common.
Even with these technology innovations, Orion believes that a safe, resilient and reliable electricity distribution network will remain essential for the community for the foreseeable future.
Network developmentIntegral to Orion’s plan to restore its network, support the quake rebuild and meet the needs of a changing region is its new Christchurch-wide high voltage interconnected ring. In 2015 work began on new 66kV underground cables across the north of the city which, together with the just completed Waimakariri and planned Marshland zone substations, will form a northern loop that will be complete by winter 2018.
By spring 2015 Orion will have completed the eastern side of the ring with the installation of 66kV underground cables from the Bromley grid exit point to the Dallington andRawhiti zone substations. They replaceunderground cables that were damaged beyond repair in the quakes and will enable two temporary overhead lines, hastily erected after the February 2011 quake, to be removed.
Orion has also completed more thanhalf of its 11kV underground cable repairs and replaced 70% of its damaged power poles.
With the Christchurch CBD recovery now in full swing, Orion was kept busy over the year with new connections for large central city developments. Total network connections grew by 2,100 during the year and now exceed Orion’s pre-quake level for the first time.
Keeping the lights onOrion’s role is to provide its 191,000 customers with a safe, dependable and cost-effective power supply.
Two major weather events affected Orion’s network during the year. Strong winds and heavy rain struck Banks Peninsula in April 2014 and a wind storm hit rural Canterbury in November 2014.

20
passengerswelcomed
through ChristchurchAirport in the past year.
Christchurch Airport is New Zealand’s fastest growing entry point for Chinese visitors.
5 year summary
Total revenue 97.4 119.8 125.2 139.9 177.4
Profit after tax 21.8 19.6 18.4 15.7 39.3
Dividends 8.5 17.2 8.8 6.6 9.9
Total assets 964.5 1,036.1 1,086.0 1,176.7 1,212.8
Shareholders’ equity 601.1 618.0 668.4 745.2 766.8
2011 2012 2013 2014 2015 $m $m $m $m $m
7m -
6m -
5m -
4m -
3m -
2m -
1m -
0m -2011
Total passengers(millions)
2012 2013 2014 2015
75%Owned by Christchurch City Holdings Ltd
90,000 -
80,000 -
70,000 -
60,000 -
50,000 -
40,000 -2011
Total aircraft movements(thousands)
2012 2013 2014 2015
personnel work onthe airport campusthe largest single site of employment in the South Island.
6,000
5.9 3 million

21
C H R I S T C H U R C H C I T Y H O L D I N G S L I M I T E D I 2 0 1 5 A N N U A L R E P O R T
Christchurch International Airport LTD
Growth in passenger numbers, new airline capacity, revised aeronautical charges (reflecting CIAL’s investment
in new infrastructure), continuing development of property (enhanced by market demand for on-airport sites
and planning changes), and improved retail and parking options, have all contributed to the financial
performance achieved in 2015. They also set the airport up for further
improved performance this financial year.
Financial performance Before a deferred tax adjustment,which is a non-cash item, the company’safter tax surplus for 2015 year was $37.8m (2014: $18.0m). As a consequence of this result, and the anticipated on-going performance of the business over the current planning horizon, the board has been able to signal to shareholders a significant growth in dividend payments.
During the 2015 year, the company achieved a one-off gain on sale of assets to NZTA, relating to the SH1 enhancement project NZTA is undertaking adjacent to Christchurch Airport. That gain of approximately $5.1m was not forecast, so the board has decided to pass 100% of the gain to shareholders as part of the company’s final dividend for 2015 year. As a consequence of the improved financial performance of the business and the one-off realised gain noted, total dividends for the 2015 year will be $20.6m (2014: $7.6m).
Passenger movementsAeronautical growth has been satisfactory at Christchurch Airport, despite some industry structural issues (other than for Trans-Tasman flights) relating to New Zealand’s national carrier focusing on building Auckland Airport as its international hub. Last financial year international passenger movements increased at Christchurch Airport by 7.0% and domestic passengers by 3.3%. Further capacity commitments already signalled by various airlines indicate Christchurch Airport will have strong aeronautical growth in the current financial year, particularly in international.
Service quality outcomesChristchurch Airport was again, for the third consecutive year, rated the number one airport in Australasia by independent international customer surveys.
Commercial outcomes
The company has materially improved its financial performance across all areas in which it operates (aeronautical, property development, retail and car parking).
Christchurch Airport has championed regional development for the whole of the South Island, and has highlighted the importance of a balanced approach to tourism flows through the country. There is likely to be some detriment to South Island regional development in the current emphasis on Auckland as the entry point for tourists. Christchurch Airport is of the view that it is in the national interest to ensure distribution of tourism benefits throughout the country. It has been active in defending the integrity of the Open Skies policy against ongoing erosion by anti-competitive airline alliances which undermine this policy.
The airport delivers a significant social and economic dividend for both the city and the South Island. Independent economic analyses show that the airport has a 50:1 economic multiplier, so for every dollar the company generates, the wider economy receives 50 dollars of economic value.
Health and safetySafety and security is a priority for CIAL, with its focus on migrating its safety culture from a hazard based focus to a risk based focus. Over the past year and going forward, the company’s emphasis is on growing its safety leadership and its safety culture. Lead and lag indicators
all moved in a pleasing direction, supported by a very active health andsafety committee. This has been assisted by the company’s online Health and Safety system visAbility,which allows every member of the teamto deal with health and safety matters in real time as they arise, from any mobile device or desk top computer.
Looking aheadThe 2016 year has started with a lot of promise. CIAL’s aviation development team has increased airline seat numbers to Christchurch by another 550,000 – on top of the extra 220,000 during 2015 (so 770,000 extra airline seats over the two year period). The airport has new international airline services from China Southern Airlines, China Airlines, Singapore Airlines, Virgin Australia, Qantas and Fiji Airlines. Air New Zealand has added significant domestic airline capacity, especially on the Christchurch-Auckland route.
Operationally, the airport company is moving into a new phase, growing its business and positioning itself as an important gateway for New Zealand inbound tourism. Long haul growth will predominantly come from foreign carriers. The company has acknowledged the advice from New Zealand’s national carrier that it sees its best outcomes in continuing to grow and dominate the hub it has created at Auckland. For that reason CIAL is pursuing with some vigour opportunities with foreign carriers to ensure its vision of tourism support for enhanced regional development of the South Island may be better achieved.
From the board down, the airport company’s emphasis is on growing
its safety culture.

22
Revenue 91.6 104.5 110.7 115.8 109.1
Profit 24.1 17.2 16.9 343.2 20.6
Dividends 3.0 – – 2.0 22.2
Total assets 236.9 273.5 270.7 597.5 589.5
Shareholder’s equity 155.2 172.0 190.1 533.1 531.7
400,000 -
350,000 -
300,000 -
250,000 -
200,000 -
150,000 -
100,000 -
50,000 -
0 -
Total container volume(TEUs)
3 mil -
2.5 mil -
2 mil -
1.5 mil -
1 mil -
0.5 mil -
0 -
Coal exports(tonnes)
Container volumes have exceeded LPC’s annual target.
5 year summary 2011 2012 2013 2014 2015 $m $m $m $m $m
100%Owned by Christchurch City Holdings Ltd
2011 2012 2013 2014 2015 2011 2012 2013 2014 2015
*Excluding insurance payout.
*
container volumesExceeded LPC’s annual targetby almost 9,000 TEUs (20-footequivalent units).
increase incontainer numbers
over the past 30 years.
10 times
8,967

C H R I S T C H U R C H C I T Y H O L D I N G S L I M I T E D I 2 0 1 5 A N N U A L R E P O R T
23
It has been another good year for Lyttelton Port of Christchurch (LPC). The outlook remains strong, with
the company’s future linked to global trade predictions for continuing growth in India, China and Africa and
forecasts for high quality food demand to double.
Strong export growth is, and will remain, a key driver for the port. Container numbers have increased ten fold
in the last 30 years and are set to double over the next decade and double again by 2041. The port is positioning
to meet this growth.
Lyttelton Port Company LTD
The almost-complete Cashin Quay 2 wharf in August 2015.
Health and safetyHealth and safety remains a significant priority. LPC has in place processes for all port users and staff to raise safety issues and have them resolved. The accident at the port in which LPC mechanic Brad Fletcher was killed in August last year deeply affected everyone who knew him. LPC took responsibility for the accident, thoroughly investigated what occurred and has put in place new operating procedures. All staff take personal responsibility for safety, reporting incidents and suggesting improvements.
Customer focusLPC’s focus is on providing excellent customer service and future-proofing the port’s development and operational performance to ensure it can meet predicted growth.
The company’s long term vision, the Port Lyttelton Plan (PLP), is the framework for this. The PLP received overwhelmingly positive feedback from the community. This was provided to Environment Canterbury (ECan) with a package of information including specialists’ assessments. Following further public consultation, ECan presented the Minister for Canterbury Earthquake Recovery with the draft Lyttelton Port Recovery Plan (LPRP). LPC looks forward to the Minister’s decision. The LPRP will be a milestone in the port’s development and give greater certainty in planning effectively for the future.
In the short term LPC is concentrating operationally on increasing crane rates and decreasing truck turnaround times in the Container Terminal. It is also repairing and strengthening inner harbour jetties which are the hub ofservices for imports of bulk fuels, fruit, fertiliser, grain, gypsum, cement, the fishing industry and log exports.
• Planning is underway to build a new oil berth. LPC has the largest gas and oil terminal in the South Island and will ensure uninterrupted supply during the project.
Financial performanceLPC continues to be in a strong financial position with trading ahead of budget for the year. Despite significant competition in the market, container volumes have remained steady – exceeding the company’s annual target by almost 9,000 TEUs (20-foot equivalent units).
General cargo volumes also exceeded expectations, particularly dry bulk and motor vehicles. Coal, whist down on the previous year, delivered volumes in line with expectations. The volume outcomes, supported by operational improvements, have led to a better than expected financial result.
Looking ahead –port fit for the futureThe year ahead will be challenging as market conditions tighten. LPC remains committed to continuous operational improvement to provide customers with a port fit for the future and excellent service delivery.
The port has gained two significant new customers. Golden Bay Cement began shipping cement to Lyttelton earlier this year, using LPC’s CityDepotin Woolston for storage and distribution. LPC also secured The Warehouse as the first customer for MidlandPort, its new Inland Port at Rolleston.
Key developments• MidlandPort is under development
and will provide a rail link with the port early next year. It will service the increasing freight requirements of the mid-Canterbury plains and improve container freight efficiency while reducing road congestion and costs for customers.
• The rebuilding of the Container Terminal’s Cashin Quay 2 wharf doubles container vessel berth capacity providing customers with greater operational efficiency. It will be fully operational early 2016.
• Land reclamation in Te Awaparahi Bay has increased to 8.4 hectares providing increasing space for Container Terminal operations.
• Resealing of the log storage area in front of Norwich Quay will be completed by the end of the year, reducing dust and creating a more robust work area.

24
12,295
5 year summary
Revenue 4.9 11.9 46.4 63.8 74.4
Profit/(loss) 0.5 (0.9) (3.7) (7.5) (10.0)
Dividends – – – – –
Total assets 32.4 47.6 83.4 128.8 191.5
Shareholder’s equity 23.1 22.3 21.6 20.6 13.6
2011 2012 2013 2014 2015 $m $m $m $m $m
100%Owned by Christchurch City Holdings Ltd
homes, businessesand schools
can now access fibre broadband services.
Enable fibre ducting being deployed.
total fibrebroadbandcustomers
86,500
2012 2013 2015
14,000 -
12,000 -
10,000 -
8,000 -
6,000 -
4,000 -
2,000 -
0 -
Connections(Total customers - cumulative)
Customers able to access fibre(Total customers)
100,000 -
80,000 -
60,000 -
40,000 -
20,000 -
0 -
2014 2012 2013 20152014

25
Enable Services Ltd (ESL)’s 2015 performance continues to reflect a dual role in the delivery of fibre broadband
to greater Christchurch – investment in Enable Networks Ltd (ENL) as it grows, and network build and
operation services provider to ENL. Enable CEO Steve Fuller visiting a network build worksite.
C H R I S T C H U R C H C I T Y H O L D I N G S L I M I T E D I 2 0 1 5 A N N U A L R E P O R T
Enable Services LTD
Financial performanceESL’s revenue grew ahead of target, with an increase of $10.6m to $74.4m. The majority of this revenue came directly from the ENL network build and operational contracts. The net loss increased – as it has year-on-year since the fibre broadband roll-out began – to $10.0m. Increases in net loss early in the investment in fibre broadband are expected, before these begin to taper and the business moves towards a NPAT-positive positon in the next five years.
Health and safety Ensuring that health and safety remains at the forefront of every aspect of the business has been a key focus for ESL in 2015 and will remain a focus in the coming year.
ESL introduced a new health and safety vision – Think Safe, Work Safe, Home Safe – and has worked closely with all its partners to ensure it continues to maintain excellence in health and safety practice across all aspects the UFB project.
Building the networkESL’s Network Delivery Alliance completed its most ambitious network deployment programme to date in 2015, passing 27,207 premises.The deployment result was some 15 percent ahead of the plan agreed with Crown Fibre Holdings Ltd and also exceeded the commitment made to CCHL through the Statement of Intent.
Included in the premises passed were 2,759 greenfield premises (taking the total to nearly 4,500) and 23 additional schools (the total reached is 134).
The network build is now 48% complete, with 86,500 homes, businesses and schools now able to access fibre broadband services – an increase of 30,000 potential customers in the past year.
The Year Five deployment programme to reach 33,000 more homes and businesses was announced on 1 July 2015. This will be the most aggressive deployment to date and will see two thirds of the network complete by mid 2016. This programme includes ensuring that fibre broadband services are available to over 90 percent of all businesses and all 151 schools by 31 December 2015.
In addition, the business has published indicative deployment plans to the end of the network roll-out. A focus for the coming year is confirming these plans, to provide greater certainty to the community about when fibre broadband will be available.
Slingshot, the remaining mass-market retail service provider, will enter the market and all retailers are expected to increase their focus on connecting customers to fibre broadband early in the new year. These factors, combined with Enable’s marketing efforts, will ensure a target of connecting 12,000 new customers in the 2016 financial year will be met.
In 2015, great strides were made towards Christchurch’s own fibre network provider being the best in New Zealand – and the whole business will remain focused on continuing to move towards this in 2016.
7,811 new customers connected to the network during the year – increasing total connections to 12,295. 29 new schools connected to fibre broadband, extending the total of number of connected schools to 104.
At year end, the uptake rate acrossthe entire network was 14.2%– with some areas well in excess of this. Rolleston uptake was almost at 40%, Halswell and Lincoln close to 30%, and Burnside, Bishopdale, Bryndwr, Casebrook and Addington over 20% each.
Vodafone entered the local residential fibre broadband market in September 2014, following Spark’s entry in early 2014. This meant four of the top five residential providers were connecting customers to the network for most of the year.
A strong indicator of ENL’s growing success is its UFB revenue growth of over 60% – from $5.08m in 2014 to $8.35m – as more people make the switch to fibre.
Looking aheadThe business’ key drivers in the 2016 financial year will be delivering excellence in customer experience in everything it does, while also continuously improving productivity and efficiency across all areas of the business.

26
5 year summary
Revenue 237.5 354.0 351.1 350.8 333.5
Profit 11.3 16.5 2.8 12.9 10.2
Dividends 6.4 7.9 6.3 5.7 5.7
Total assets 86.4 96.3 118.3 110.4 108.5
Shareholder’s equity 37.6 46.2 43.3 50.6 55.7
2011 2012 2013 2014 2015 $m $m $m $m $m
100%Owned by Christchurch City Holdings Ltd
New Zealanders serviced by City Care
from 17 offices and depots nationwide. (MW)
1,800 -
1,600 -
1,400 -
1,200 -
1,000 -
800 -
600 -
400 -
200 -
0 -2011
Staff numbers
2012 2013 2014 2015
employees throughout New Zealand
City Care contributed to the rebuild and refurbishment of Cholmondeley Children’s Centre in Governors Bay.
City Care provides safe and reliable traffic management services.
2 million
1,473

27
C H R I S T C H U R C H C I T Y H O L D I N G S L I M I T E D I 2 0 1 5 A N N U A L R E P O R T
City Care LTD
City Care performed strongly in 2014/15, returning a pleasing financial
result while continuing to work hard on delivering an expanding
portfolio of projects and strengthening core capabilities.
Financial performanceNet profit after tax was $10.2m and revenue was $334m, with an after tax return on average equity of 19.2%. City Care paid dividends to CCHL totalling $5.7m.
AcquisitionsDuring the year City Care acquired Apex Environmental and Command Building Services.
A specialist industrial water and wastewater consultancy business, Apex operates across key industrial markets including local authorities, dairy, textiles, wineries and food and beverage. With its capability and reputation for delivering quality turn-key industrial water and wastewater treatment projects, Apex has added considerable strength and expertise to City Care’s market-leading three waters service offerings.
Command Building Services has provided heating, ventilation and air conditioning (HVAC) services for 35 years, and its acquisition will significantly enhance City Care’s capability, capacity and expertise across HVAC and other mechanical related services.
Key projectsIn 2014/15, City Care’s participation in the Stronger Christchurch Infrastructure Rebuild Team (SCIRT) entered its fourth year, with a total of 36 SCIRT projects worked on during the year.
The company also contributed to the rebuild and refurbishment of a number of historic buildings, community hubs and iconic landmarks throughout the country, including Wellington’s Museum of City and Sea, Waltham Community Pool and Cholmondeley Children’s Centre in Governors Bay.
During the year City Care built state-of-the-art learning environments for the Ministry of Education and won a joint contract to build the Margaret Mahy
Family Playground, a one-of-a-kind, all-ages playground which will anchor the regeneration of Christchurch’s central city living landscape. The company also retained the Facilities Management contract for the largest New Zealand-owned service station chain, Z Energy.
Environmental excellenceCity Care and Auckland Council celebrated their longstanding partnership by gaining international recognition for the quality of Auckland parks, in the form of three Green Flag Awards. The Green Flag Awards were launched in the United Kingdom 18 years ago and are now an international standard for great parks.
City Care holds one of four Auckland City Council parks maintenance contracts. Three of the five Auckland parks to earn a prestigious Green Flag last year are managed by City Care.
Emergency responseCity Care’s renowned emergency response capability was called upon on a number of times during the year as communities suffered the devastating effects of extreme weather events.
In June, Dunedin suffered a one-in-100 year flood, with more than 175 millimetres of rain falling in 24 hours. Less than three weeks later, the lower and central North Island (including the major centres of Wellington and New Plymouth) was devastated by a ‘weather bomb’ that resulted in more than 400 people being evacuated from their homes and a state of emergency declared in a number of towns.
City Care’s full resources were called upon to mitigate flood encroachment and to respond to extreme pressure on wastewater and stormwater systems in communities ranging from Wanganui and Waitotara in the north to suburbs throughout Dunedin in the south.
These events highlighted once again the critical importance of being able to call upon the capability of experienced, skilled and committed teams of specialists when disaster strikes.
PeopleAn expanding portfolio of projects and clients and a number of strategic acquisitions have demanded a continuing focus on employing and training the right people to deliver City Care’s service offerings. The company employs 1473 people and makes a significant annual investment to deliver a comprehensive range of training opportunities to its staff. City Care works with six industry training organisations as well as a number of tertiary institutions and private training providers, and during the 2014/15 year had more than 300 people in training. 66 team members completed National Certificates at Level 3 or above in the past year and 269 staff are actively studying towards National Certificates, trades or other qualifications..
Health and safetyDuring the year City Care continued to invest significantly in its health and safety strategy, restructuring the H&S team into a shared services functional group and appointing a new General Manager of Safety. In early 2015 a health and safety consultant from Australia was engaged to conduct a company-wide review in conjunction with the GM of Safety, from which recommendations for improvement were identified and implemented. Over the next three years City Care’s H&S processes will undergo significant change, with the goal of becoming the contracting industry leader in health and safety.
Looking aheadIn 2016 City Care will continue pursuing its vision – to build great communities – by winning new contracts, driving innovation and constant improvement, and investing in the systems and people who deliver City Care’s services. Underpinning everything City Care does is its deep commitment to provide outstanding services to clients and the people of New Zealand, and in 2016 City Care will be developing even closer relationships with all customers and stakeholders.

28
5 year summary
Revenue 30.4 19.0 17.2 17.4 18.3
Profit/(loss) 6.2 0.1 (0.6) (0.6) –
Dividends – – – – 1.8
Total assets 51.9 47.7 49.4 44.0 42.0
Shareholder’s equity 37.6 37.7 39.2 38.6 36.7
2011 2012 2013 2014 2015 $m $m $m $m $m
100%Owned by Christchurch City Holdings Ltd
12m -
10m -
8m -
6m -
4m -
2m -
0m -2011
Passengers carried(millions)
2012 2013 2014 2015
50% -
40% -
30% -
20% -
10% -
0% -2011
Lost time incidents(million hours)
2012 2013 2014 2015
passenger trips during the year
A Red Bus outside the new Christchurch bus interchange.
reductionin fuel consumptionthrough the introduction of telematics.
4%
3.8m

29
Red Bus LTD
C H R I S T C H U R C H C I T Y H O L D I N G S L I M I T E D I 2 0 1 5 A N N U A L R E P O R T
Central to Red Bus’ pleasing performance was the negotiation of urban
service contracts with Environment Canterbury (Ecan), the launch of
Red Travel coach services and leasing of surplus property.
Financial performanceFollowing challenging trading conditions following the 2011 earthquakes, Red Bus Ltd returned to profit during the 2014/15 financial year. The company made a tax paid profit of $18,000. Although this is a small profit, it is a significant improvement on the $0.62m loss in 2014. The company continued to maintain positive operating cash flows during the year.
InvestmentsRed Bus continues to invest in new equipment, technology and ongoing training to continue its leadership in service standards and grow capability.
This year investments included:
• Purchase of four coaches, three vans and the launch of Red Travel coach services, adding scale, range and capacity to the company’s charter and tourism services.
• Implementation of a fleet telematics system with real time driver performance feedback that is reducing fuel consumption and improving customer comfort and operational safety.
• Purchase of a workshop brake testing machine enabling onsite Certificate of Fitness testing and ensuring high braking standards are maintained across the bus fleet.
• Continued people investment in the Safe and Fuel Efficient Driver (SAFED) training programme alongside telematics, ensuring drivers have the appropriate skills to deliver customers safely and efficiently.
Passenger numbersRed Bus safely delivered 3.8 million passenger trips over the year. Patronage on Red Bus urban contracts (3,420,000 passenger trips in 2014/15) was slightly lower than the 3,445,000 passenger trips in 2014. Passenger numbers in the second half of the year were lower than in the same period for 2014.
School passenger trips continue to show strong growth at 3.7% this year and are now 9% above the pre-earthquake 2010 level.
There is good progress underway in the central city rebuild but the overall network passenger trip numbers remain around 18% below the pre-earthquake numbers. A complete recovery of these passenger numbers is expected to take many years.
Opening of the new bus interchangeThe new Christchurch bus interchange, which is the first of the central city anchor projects, opened on 25 May at half capacity. The herringbone design is proving operationally successful with drivers rapidly becoming familiar and comfortable with the reversing pattern.
Fleet telematics systemRed Bus’ telematics system trial began late 2014. The system provides drivers with instant in-cab feedback on five key performance factors: speeding, over-revving, excess idling, heavy braking and accelerating. The trial was successful in reducing the frequency of these factors while achieving a 4% reduction in fuel consumption. It has also achieved a reduction in greenhouse gas and exhaust emissions. As a result of this trial success the telematics system was rolled out across most of bus and coach fleet in March 2015 with the positive trial results being repeated in the larger fleet.
Driver trainingRed Bus continues to be a leader in urban driver training. In preparation for the new bus interchange opening, a driving simulator was purchased that allowed drivers to practice before their first physical drive through of the bus interchange. The driving simulator will continue to be used for training new drivers.
Health and safetyRed Bus is continually investing in ongoing training to ensure high standards of workplace health and safety are achieved. Initiatives during the year included the Safe and Fuel Efficient Driver (SAFED) training programme and telematics. Delivering customers safely to their destinations is a key outcome of both programmes. 49 drivers completed the Safe and Fuel Efficient Driver (SAFED) training programme in 2015 and 55% of Red Bus drivers hold a National Certificate level driving qualification.
Looking aheadUrban passenger transport services are expected to remain relatively flat in the coming year with a small service increase planned for Lyttelton and Eastgate/Rapaki services in the first quarter. Additional service growth will only occur if central city patronage demand increases markedly in the coming 12 months.
ECan is expected to re-tender the urban school services predominantly held by Red Bus during the second quarter.A new Rangiora urban route is also due to be tendered late 2015.
Red Bus continues to explore commercial passenger transport opportunities similar to Darfield and Oxford services with one additional regional service currently being assessed.
Red Bus seeks to diversify and grow the revenue base outside Christchurch urban services through the continued expansion of Red Travel, Charter, The Rebuild Tour and Akaroa Shuttle. Inbound tourism is expected to grow again through 2016 as hotels, retail and business activities reopen in Christchurch.
The company intends to retain its focus on improving operational efficiency, customer service excellence and safety results while continuing to grow the business and meet or exceed projected budget results.
Improving on the 2015 safety record is an essential operational objective this year.

30
net profit returnedby EcoCentral Ltd
$2m
Part of the excellent vinyl selectionto browse at EcoShop.
5 year summary
Revenue 18.6 30.2 32.9 35.7 38.9
Profit/(loss) 0.8 (3.2) 0.6 0.9 2.0
Dividends – – – 0.2 0.2
Total assets 21.6 17.4 18.2 17.4 16.4
Shareholder’s equity 1.9 (1.2) 4.0 4.7 6.6
2011 2012 2013 2014 2015 $m $m $m $m $m
60.0 -
50.0 -
40.0 -
30.0 -
20.0 -
10.0 -
0 -2011
EcoSort volumes*
(tonnes)
2012 2013 2014 2015
100%Owned by Christchurch City Holdings Ltd
120.0 -
100.0 -
80.0 -
60.0 -
40.0 -
20.0 -
0 -2011
Diverted from landfill*
(tonnes)
2012 2013 2014 2015
tonnes divertedfrom landfill
*CCHL aquired 100% of the shares in EcoCentral Ltd on 1 January 2011.
These tables shows the results and position of EcoCentral Ltd since this aquisition.
97,620

31
EcoCentral had another successful year. The EcoDrops, EcoSort and EcoShop have each continued in their
vital role within the rejuvenating Christchurch, each with a focus not only on profitability, but also on stringent
compliance to environmental and waste minimisation initiatives.
Management and staff across all business units have displayed
exemplary dedication to making this another successful year.
C H R I S T C H U R C H C I T Y H O L D I N G S L I M I T E D I 2 0 1 5 A N N U A L R E P O R T
EcoCentral LTD
EcoCentral’s team is meticulouswhen it comes to recycling.
Financial performanceParticular attention over 2014/15 was placed on the repayment of debt. A combination of cost control, strong operating cash flow, and consistency of commodity prices have meant that despite the high value of the NZD for much of the 2015 year, a significant amount of debt has been paid down. The sturdy balance sheet and proactive foreign exchange policy is well placed to alleviate most ill effects, should the projected downturn in incoming volumes be observed during the coming year.
EcoDrop The EcoDrop transfer stations have continued to trade particularly well. The impact of earthquake-related material remains evident in both general refuse volume and items diverted to the recycling centres. Handling such volumes in premises which remain in a state of awaiting earthquake repairs has been an ongoing challenge for staff and customers alike. Ensuring the correct and safe disposal of all material at EcoDrops remains of utmost importance. Camera coverage has been extended this year, which will aid in identifying any instance of incorrect disposal, or of material contamination, and swift rectification.
EcoSort Operations at the EcoSort recycling centres have been steadily improving in terms of efficiency and quality. This improvement has been based on a focus on preventative plant maintenance, staggered reactive maintenance and upgrading critical spare requirements. The result has been less plant downtime and greater throughput of product. While external factors of incoming product volume and commodity prices are outside
EcoCentral's control, these have worked in EcoCentral’s favour this year, both holding constant for much of the year.
EcoShop The EcoShop recycled goods retail outlet has continued to flourish alongside the ongoing flow of residential movement in Christchurch. A variety of one-of-a-kind items have been diverted from landfill and sold at the EcoShop this year, with the result that the number of customers keen to bag a similar intriguing bargain for themselves has also grown. A growth in customer base is evident not only in the ever-growing lines outside the door before opening time, but in the number of first-time customers as well.
Health and safetyThe year saw further development of EcoCentral’s health and safety culture. Staff understand the importance of reporting and of strict adherence to standard procedure at all times, and their dedication in this area is reflected in EcoCentral gaining AS/NZS 4801, as well as tertiary ACC accreditation.
Looking aheadFurther health and safety measures will be adopted in the coming year. EcoCentral is about to install new fall protection measures at the Metro EcoDrop pit face. The updated design is to be rolled out to all stations in 2016. This additional measure will require some accommodation by the public when they visit the sites; but fall protection bars are the industry standard to which a transfer station should operate, and will ensure EcoCentral can continue to provide an essential service safely for everyone.

32
$355,000
key agenciesinvolved in the
Christchurch Economic Development Strategy
100%Owned by Christchurch City Council
GreenHouse innovation hub
in fundingissued under the Regional
Business Partner Programme
CDC building, Cashel Street, Christchurch
over 25

33
Canterbury Development Corporation LTD
C H R I S T C H U R C H C I T Y H O L D I N G S L I M I T E D I 2 0 1 5 A N N U A L R E P O R T
CDC InnovationCDC Innovation supports start-ups, existing business and industry partners to improve innovation processes and commercialisation outcomes. Highlights during the year included:
• delivery of two intakes of the Hi-Growth Launch Programme
• confirmation of funding for the FoodSouth food innovation centre and pilot production plant (due to open at Lincoln University in late 2015)
• active involvement in the development and tenancy of the Christchurch Innovation Precinct
• opening of the GreenHouse innovation hub
• involvement in investment and screening committees for national research and commercialisation funding
• hosting 10 events featuring leading innovation specialists
• CDC Innovation also provides early stage investment to high-tech start-up companies via CDC subsidiary CRIS Ltd.
CDC Business ServicesCDC develops and delivers programmes to support business growth. Over the past year businesses have engaged with:
• Productivity improvement services – Operational Excellence and Lean Office programmes targeting productivity improvement in the manufacturing sector from the factory floor to the back office
• Internships – Employer information sessions for technology businesses demonstrating the value interns can bring. As a result, CDC placed over 25 interns into local businesses
• Business Mentoring – Businesses are matched with volunteer mentors
who provided assistance with specific challenges or opportunities
• Canterbury Manufacturing Pathways – A collaboration between CDC and others linking students directly to employment or further education in the sector.
• Education trade mission to India – A follow-up to the trade mission
in May 2014, which was led and funded by Education New Zealand and Immigration New Zealand for the purposes of expanding networks and attracting students to Christchurch.
Canterbury Regional Business Partner ProgrammeDuring the year, under the nationally funded Regional Business Partner Programme (delivered through a jointventure entity with Canterbury Employers’ Chamber of Commerce), CDC issued $355,000 in funding toassist in building management capability in high-growth potential businesses in Christchurch.
In addition, 320 businesses received assessments and had actions or referrals identified to assist in accelerating growth (which included research and development assistance, governance programmes and productivity improvement services). This is the fifth year of delivery of this programme.
Christchurch Economic Development StrategyCDC developed the Christchurch Economic Development Strategy (CEDS) in 2013 in partnership with its key stakeholders including Christchurch City Council, government agencies and business representatives. The focus for CDC during the 2014/15 year was the monitoring of over 50 CEDS economic development projects and programmes led by over 25 key
agencies (including CDC) across the region. Ongoing engagement with these key agencies enables CDC to report quarterly on progress of the implementation of the CEDS projects, many of which are led by other organisations. During the coming year CEDS will be revised and re-endorsed.
CDC contributes to CEDS by focusing on three areas:
• influencing the rebuild and environment for economic growth
• helping businesses accelerate their growth
• enabling the achievement of commercial outcomes from new ideas.
Looking aheadCDC’s vision is a better way of life for residents through a strong economy. With this in mind, the key themes influencing CDC’s priorities and partnerships over the next three years are:
• the importance for the city to complete rebuild and development projects
• the transition of rebuild and recovery functions and responsibilities and the establishment of the Transition board
• as the rebuild nears its peak there needs to be greater focus on the growth of the underlying (non-rebuild) economy’s sectors such as manufacturing, technology and agriculture
• strengthening the Regional Innovation System to drive successful new product and service outcomes
• national government resources in the long term continuing to be focused on export growth, business capability building and support of innovation.
Canterbury Development Corporation (CDC) is a wholly owned subsidiary (Council Controlled Organisation) of
Christchurch City Council. CDC is tasked with leading economic development for the city.
The aims of CDC are to:
· Enhance the regional innovation system and have the region recognised as the leader in commercialisation.
· Support businesses and sectors with high-growth potential to get bigger and better.
· Forecast changes in economic, workforce and infrastructure dynamics.

C H R I S T C H U R C H C I T Y H O L D I N G S L I M I T E D I 2 0 1 5 A N N U A L R E P O R T
34
CCHL Financial Statements FOR THE YEAR ENDED 30 JUNE 2015
DIRECTORS’RESPONSIBILITY
The directors are responsible for ensuring that the financial statements give a true and fair view of the financial position of the company and Group as at 30 June 2015, and the financial performance and cash flows for the year ended on that date.
The directors consider that the financial statements of the company and Group have been prepared using appropriate accounting policies, consistently applied and supported by reasonable judgments and estimates, and that all relevant financial reporting and accounting standards have been followed.
The directors consider that proper accounting records have been kept, which enable, with reasonable accuracy, the determination of the financial position of the company and Group and facilitate compliance of the financial statements with the Financial Reporting Act 1993.
The directors consider they have taken adequate steps to safeguard the assets of the company and to prevent and detect fraud and other irregularities.
The directors have pleasure in presenting the financial statements, set out on pages 40 to 105, of Christchurch City Holdings Limited for the year ended 30 June 2015.
The board of Directors of Christchurch City Holdings Limited authorises these financial statements for issue on16 September 2015.
For and on behalf of the board.
Bruce IrvineChairmanChristchurch16 September 2015
Sarah SmithDirectorChristchurch16 September 2015
statement

C H R I S T C H U R C H C I T Y H O L D I N G S L I M I T E D I 2 0 1 5 A N N U A L R E P O R T
35
TABLE OF ContentsFINANCIAL STATEMENTS
Statement of financial position 36
Statement of comprehensive income 37
Statement of changes in equity 38
Statement of cash flows 40
NOTES TO THE FINANCIAL STATEMENTS
GROUP STRUCTURE
1. Significant changes in the period 412. Shares held in subsidiaries 413. Business combinations 474. Non-controlling interests in subsidiary companies 485. Associated companies 496. Joint arrangements 50
KEY ASSETS ANDLIABILITIES
7. Property, plant and equipment 51
8. Investment property 55
9. Borrowings and finance costs 57
PROFIT AND LOSS INFORMATION
10. Operating revenue 61
11. Operating costs 62
12. Income taxes 64
13. Finance income 66
OTHER ASSETS AND LIABILITIES
14. Loans and other financial assets 67
15. Debtors, inventory and other assets 68
16. Cash and cash equivalents 70
17. Intangible assets 71
18. Creditors and other payables 72
19. Provisions and other liabilities 72
▲
▲
▲
▲
▲
▲ ▲
▲
AREAS OF JUDGEMENT AND FINANCIAL RISK
20. Areas of judgement and financial risk 7420(a) Critical judgements, estimates and
assumptions 7420(b) Credit risk 7520(c) Liquidity risk 7520(d) Interest rate risk 7720(e) Interest rate sensitivity 7820(f) Interest rate hedging activity 7820(g) Foreign exchange risk 7820(h) Commodity price and demand risk 79
UNRECOGNISED ITEMS
21. Capital and operating lease commitments 8022. Contingent liabilities and assets 8123. Events after the balance sheet date 82
OTHER DISCLOSURES
24. Share capital and dividends 83
25. Reserves 8326. Related party disclosures 8427. Reconciliation of profit to net cash operating flows 8828. Classification of assets and liabilities 8828(a) Classification of financial assets and liabilities 8928(b) Non-financial assets measured at fair value 9029. Statement of accounting policies 93
PERFORMANCE STATEMENT
30. Performance against Statement of Intent targets 95
Statutory information 100
Independent auditor's report 102

C H R I S T C H U R C H C I T Y H O L D I N G S L I M I T E D I 2 0 1 5 A N N U A L R E P O R T
36
Statement of financial position AS AT 30 JUNE 2015
The accompanying notes form part of and are to be read in conjunction with these financial statements.
Note Group 2015 Group 2014 Parent 2015 Parent 2014
$’000 $’000 $’000 $’000
Non-current assets Investments in subsidiaries 2 – – 2,098,200 1,760,000 Investments in associates 5 40,790 37,245 – – Property, plant and equipment 7 2,405,062 2,315,656 184 – Investment property 8 255,092 193,175 – – Loans and other financial assets 14(b) 100,604 59,987 216,787 169,837 Intangible assets 17 59,548 54,782 – – Debtors, inventory and other assets 15(a),(b) 12,162 14,227 – 4
Total non-current assets 2,873,258 2,675,072 2,315,171 1,929,841 Current assets Cash and cash equivalents 16 89,811 221,921 6,877 2,341 Debtors, inventory and other assets 15(a),(b) 226,890 171,304 2,564 1,916 Loans and other financial assets 14(a) 111,057 97,456 18,487 25,000
Total current assets 427,758 490,681 27,928 29,257
Total assets 3,301,016 3,165,753 2,343,099 1,959,098
Non-current liabilities Borrowings 9 660,513 649,379 323,000 306,500 Net deferred tax liabilities 12(e) 323,510 331,525 – – Provisions and other liabilities 19(a),(b) 30,403 16,918 12,479 4,024
Total non-current liabilities 1,014,426 997,822 335,479 310,524 Current liabilities Borrowings 9 192,020 79,486 165,000 78,000 Creditors and other liabilities 18 111,215 91,803 3,399 2,387 Provisions and other liabilities 19(a),(b) 36,045 32,152 75 159 Current tax liabilities 18,891 19,057 – –
Total current liabilities 358,171 222,498 168,474 80,546
Total liabilities 1,372,597 1,220,320 503,953 391,070
Net assets 1,928,419 1,945,433 1,839,146 1,568,028 Equity Capital and other equity instruments 24 71,435 71,435 71,435 71,435 Reserves 433,440 443,979 1,463,855 1,215,543
Retained earnings 1,154,447 1,056,351 303,856 281,050
Parent entity interests 1,659,322 1,571,765 1,839,146 1,568,028 Non-controlling interests 4 269,097 373,668 – –
Total equity 1,928,419 1,945,433 1,839,146 1,568,028

C H R I S T C H U R C H C I T Y H O L D I N G S L I M I T E D I 2 0 1 5 A N N U A L R E P O R T
37
Statement of comprehensive income FOR THE YEAR ENDED 30 JUNE 2015
The accompanying notes form part of and are to be read in conjunction with these financial statements.
Note Group 2015 Group 2014 Parent 2015 Parent 2014
$’000 $’000 $’000 $’000
Operating and other revenue 10 1,077,954 1,343,671 84,372 48,603 Operating expenses 11 757,073 747,717 3,119 2,469 Share of (losses)/profits of associates 5 (3,255) (5,158) – –
Earnings before interest, tax, depreciation and amortisation
317,626 590,796 81,253 46,134
Depreciation 7 98,586 96,622 11 –Impairment (reversal) 17, 7 3,485 (1,290) – –Amortisation 17 4,200 4,311 – –
Earnings before interest and tax 211,355 491,153 81,242 46,134
Finance income 13 17,129 8,159 13,096 9,662Finance costs 9(e) 50,489 44,511 25,523 18,708
Net finance costs 33,360 36,352 12,427 9,046
Profit before income tax expense 177,995 454,801 68,815 37,088Income tax expense/(credit) 12 45,713 52,170 – –
Profit for the year 132,282 402,631 68,815 37,088 Other comprehensive income Items that will not be recycled to profit or loss: Revaluation of assets 736 185,408 – –Items that may be recycled to profit or loss in future: Fair value through equity financial assets – – 253,191 117,809Cash flow hedges (15,330) 13,799 (4,879) 2,972Share of other comprehensive income of associates – – – –
(14,594) 199,207 248,312 120,781Income tax relating to other comprehensive income 5,961 (48,674) – –
Other comprehensive income for the year, net of tax (8,633) 150,533 248,312 120,781
Total comprehensive income for the year, net of tax 123,649 553,164 317,127 157,869 Profit for the year attributable to: Owners of the parent 113,497 323,234 68,815 37,088Non-controlling interests 18,785 79,397 – –
132,282 402,631 68,815 37,088 Total comprehensive income attributable to: Owners of the parent 106,810 447,929 317,127 157,869Non-controlling interests 4 16,839 105,235 – –
123,649 553,164 317,127 157,869

C H R I S T C H U R C H C I T Y H O L D I N G S L I M I T E D I 2 0 1 5 A N N U A L R E P O R T
38
Statement of changes in equity FOR THE YEAR ENDED 30 JUNE 2015
Attributable Asset to equity Non- Share revaluation Hedging Retained holders of controlling capital reserve reserve earnings parent interests TotalGroup Note 24 25 25 4 $’000 $’000 $’000 $’000 $’000 $’000 $’000
Balance as at 1 July 2013 71,435 332,028 (12,299) 784,623 1,175,787 274,592 1,450,379
Profit for the year – – – 323,234 323,234 79,397 402,631Other comprehensive income for year: Revaluation of assets – 154,601 – – 154,601 30,807 185,408Revaluation of derivative financial instruments – – 11,228 – 11,228 2,571 13,799Tax associated with revaluation movements – (37,178) (3,956) – (41,134) (7,540) (48,674)
Other comprehensive income for year – 117,423 7,272 – 124,695 25,838 150,533 Transfer on disposal of revalued assets – (421) – 421 – – – Deferred tax transferred – (34) – 34 – – – Reversal of deferred tax on realisation of asset – 10 – (10) – – – Dividends paid or provided for 24,4 – – – (52,000) (52,000) (5,704) (57,704)Adjustment for share acquisitions – – – 49 49 (455) (406)
Balance as at 30 June 2014 71,435 449,006 (5,027) 1,056,351 1,571,765 373,668 1,945,433
Profit for the year – – – 113,497 113,497 18,785 132,282 Other comprehensive income for year: Revaluation of assets – 728 – – 728 8 736 Revaluation of derivative financial instruments – – (12,615) – (12,615) (2,715) (15,330)Tax associated with revaluation movements – (34) 5,234 – 5,200 761 5,961
Other comprehensive income for year – 694 (7,381) – (6,687) (1,946) (8,633) Transfer on disposal of revalued assets – (3,852) – 3,852 – – – Dividends paid or provided for 24,4 – – – (46,009) (46,009) (12,644) (58,653)Adjustment for share acquisitions 3(a) – – – 26,756 26,756 (108,766) (82,010)
Balance as at 30 June 2015 71,435 445,848 (12,408) 1,154,447 1,659,322 269,097 1,928,419
The accompanying notes form part of and are to be read in conjunction with these financial statements.

C H R I S T C H U R C H C I T Y H O L D I N G S L I M I T E D I 2 0 1 5 A N N U A L R E P O R T
39
Fair value through Share equity Hedging Retained capital reserve reserve earnings TotalParent Note 24 25 25 $’000 $’000 $’000 $’000 $’000
Balance as at 1 July 2013 71,435 1,101,149 (6,387) 295,962 1,462,159
Profit for the year – – – 37,088 37,088Investment revaluations – 117,809 2,972 – 120,781Dividends paid or provided for 24 – – – (52,000) (52,000)
Balance as at 30 June 2014 71,435 1,218,958 (3,415) 281,050 1,568,028
Profit for the year – – – 68,815 68,815Investment revaluations – 253,191 (4,879) – 248,312Dividends paid or provided for 24 – – – (46,009) (46,009)
Balance as at 30 June 2015 71,435 1,472,149 (8,294) 303,856 1,839,146
The accompanying notes form part of and are to be read in conjunction with these financial statements.

C H R I S T C H U R C H C I T Y H O L D I N G S L I M I T E D I 2 0 1 5 A N N U A L R E P O R T
40
▲
▲
▲
Statement of cash flows FOR THE YEAR ENDED 30 JUNE 2015
The accompanying notes form part of and are to be read in conjunction with these financial statements.
Note Group 2015 Group 2014 Parent 2015 Parent 2014 $’000 $’000 $’000 $’000
Cash flows from operating activities Receipts from customers and other sources 980,015 947,552 – 2Interest received 4,486 2,848 12,764 9,233Dividends received – – 84,140 48,175Proceeds from insurance 10,876 13,003 – –Payments to suppliers and employees (756,635) (764,370) (2,805) (2,349)Interest and other finance costs paid (38,611) (41,591) (24,718) (17,834)Income tax paid (30,262) (21,714) – –Subvention payments (17,714) (1,081) – –
Net cash provided by/(used in) operating activities 27 152,155 134,647 69,381 37,227 Cash flows from investing activities Payment for equity investment in subsidiaries/associates (500) (3,747) (85,008) (6,902)Advances made (2,636) (20,208) (636) (15,208)Proceeds from repayment of related party loans – 11,450 28,000 18,450Amounts advanced to related parties – (2,867) (64,500) (47,500)Payment for property, plant and equipment (283,851) (133,411) (192) –Proceeds from sale of property, plant and equipment 9,916 6,872 – –Proceeds from insurance 18,124 372,954 – –Payment for goodwill (553) – – –Payment for intangible assets (9,546) (5,672) – –Payment for investment properties (41,536) (14,569) – –Proceeds from sale of investment properties 5,708 7,619 – –Maturity of/(investment in) term deposits (39,867) (87,324) – –
Net cash (used in)/provided by investing activities (344,741) 131,097 (122,336) (51,160) Cash flows from financing activities Proceeds from borrowing 141,701 154,700 118,501 101,500Repayment of borrowings (22,572) (137,681) (15,001) (35,000) Repayment of finance leases – (44) – –Capitalised bond issue costs/amortised borrowing costs – (256) – –Dividends paid (46,009) (52,000) (46,009) (52,000)Dividends paid – non–controlling interests (12,644) (5,704) – –
Net cash provided by/(used in) financing activities 60,476 (40,985) 57,491 14,500
Net decrease in cash and cash equivalents (132,110) 224,759 4,536 567Cash and cash equivalents at beginning of year 221,921 (2,838) 2,341 1,774
Cash and cash equivalents at end of year 16 89,811 221,921 6,877 2,341

C H R I S T C H U R C H C I T Y H O L D I N G S L I M I T E D I 2 0 1 5 A N N U A L R E P O R T
41
▲
▲
▲
▲
▲
▲
▲▲
Group Structure
1. Significant changes in the period
Lyttelton Port Company Ltd takeoverIn October 2014, CCHL entered into a lock up agreement with Port Otago Ltd (POL) to acquire POL’s 15.5% shareholding in Lyttelton Port Company Ltd, and make a full takeover offer for the remaining 4.8% of shares not owned by CCHL or POL or CCHL. The takeover was successfully completed and CCHL now owns 100% of Lyttelton Port Company Ltd (2014: 79.7%).
Capital release programmeCCHL’s 100% shareholder Christchurch City Council has completed its Long Term Plan, which contemplates the release of up to $750m of capital from CCHL over the next three year financial years - the ‘capital release programme’. This will almost certainly involve capital restructuring at subsidiary level and the sale of some assets, although the final shape of the programme is yet to be determined by the Council.
It is important to note that the carrying values of the shares owned by CCHL in its trading subsidiaries as at 30 June 2015 are based on financial accounting standards, and may not reflect their true market value.
2. Shares held in subsidiaries Parent Parent Parent Parent 2015 2014 Note 2015 2014
$’000 $’000
Entity name Business Effective ownership Carrying value
Orion New Zealand Ltd Electricity network 89.3% 89.3% 2(a) 753,000 753,000
Christchurch International Airport Ltd Airport 75.0% 75.0% 2(b) 635,000 534,200
Lyttelton Port Company Ltd Port 100% 79.7% 2(c) 458,500 260,800
Enable Services Ltd Broadband network 100% 100% 2(d) 86,000 40,900
City Care Ltd Contracting 100% 100% 2(e) 112,900 136,300
Red Bus Ltd Passenger transport 100% 100% 2(f) 43,500 23,000
EcoCentral Ltd Waste recycling 100% 100% 2(g) 9,300 11,800
Total investment in subsidiaries 2,098,200 1,760,000
Additionally, CCHL has five wholly-owned companies which hold no assets and have not traded. These are CCHL (2) Ltd, CCHL (3) Ltd, CCHL (4) Ltd, CCHL (5) Ltd, CCHL (6) Ltd and Christchurch City Networks Ltd.
Balance datesAll group entities other than Orion New Zealand Ltd have a balance date of 30 June. Orion’s balance date is 31 March. The principal reason for this is that the electricity industry, including the regulatory regime, in New Zealand is based on a universal 31 March balance date. Additionally, seasonal factors make it more appropriate for Orion to report at 31 March rather than 30 June. The costs and disadvantages associated with changing Orion’s balance date would outweigh any benefits arising.
Valuation of shares in subsidiary companiesCCHL’s investments in its subsidiary companies are stated at fair value in the parent company’s balance sheet. Fair value is determined by independent valuation, with valuations performed by an independent, external valuer with sufficient regularity to ensure no investments are included at a valuation that is materially different from fair value. Further detail is provided below.
Companies not revalued in 2015The investments in all of the trading subsidiaries, except Orion New Zealand Ltd and Christchurch International Airport Ltd, were revalued as at 30 June 2015. The carrying values of the latter two companies were reviewed by independent valuers Ernst & Young (EY) as at 30 June 2015 to determine whether there had been any significant indicators of material value change since their last full valuations, as detailed below.
The following section provides more detail about the valuation methodology for each company:
Notes to the financial statements FOR THE YEAR ENDED 30 JUNE 2015

C H R I S T C H U R C H C I T Y H O L D I N G S L I M I T E D I 2 0 1 5 A N N U A L R E P O R T
42
Notes to the financial statements FOR THE YEAR ENDED 30 JUNE 2015
GROUP STRUCTURE contd.
2(a) Orion New Zealand Ltd
The investment in Orion New Zealand Ltd (Orion) was valued by EY as at 30 June 2014 using the discounted cash flow methodology. The company’s forecast cash flows for the next five years to 2019 were assessed, and discounted back to the valuation date, using a discount rate that reflected not only the time value of money but also risk associated with the business’s future operations. Orion’s weighted average cost of capital (WACC), assessed at 6.7% post-tax, was used to discount its future cash flows.
Orion’s regulated Customised Price path (CPP) period also ends in 2019. A terminal cash flow, to allow for cash flows beyond 2019, was assessed and discounted back to the valuation date. In assessing the terminal value, allowance was made for a conservative price adjustment to enable Orion to maintain a market return on its assets and maintain its investment in the network, and a 2.5% growth rate.
Sensitivity analysis of the impact of different assumptions on Orion’s enterprise value as at 30 June 2014:
Change in Decrease Increase (m) (m)
WACC (+ or – 0.25%) (59) 67
Cash expenses (+ or – 10%) (19) 19
Capital expenditure (+ or – 5%) (74) 74
It is noted in relation to the sensitivity analysis that there is to a degree, a natural valuation hedge, as material changes in these variables may be compensated by a regulatory corrective price adjustment at a future price reset.
2015 review
EY met with Orion management to discuss key changes in the business and reviewed updated financial and capital expenditure forecasts. EY concluded that there had been no material changes in the business, and that any changes in assessed WACC due to a reduction in the risk free rate would be more or less offset by a reduction in terminal value as a consequence of a lower long term regulatory return. Overall, EY concluded that, while there were some indicators of improvement in value, such movement was unlikely to be material and hence the carrying value of $753m is still appropriate.
2. Shares held in subsidiaries (contd.)

C H R I S T C H U R C H C I T Y H O L D I N G S L I M I T E D I 2 0 1 5 A N N U A L R E P O R T
43
2(b) Christchurch International Airport Ltd
The investment in Christchurch International Airport Ltd (CIAL) was valued as at 30 June 2013 using a combination of methods – a discounted cash flow approach for the core airport operations (comprising the aeronautical land, sealed surfaces and infrastructure, and the terminal facilities), a net asset value approach for the airport’s property portfolio assets and a cost basis for various recently-acquired trading activities including the International Antarctic Centre, the Wash and Craddocks.
Core airport operations
The company’s forecast cash flows for the next ten years were assessed, and discounted back to the valuation date, using a discount rate that reflected not only the time value of money but also risk associated with the business’s future operations. A terminal cash flow, to allow for cash flows beyond the explicit forecast period, was also assessed and discounted back to the valuation date. CIAL’s weighted average cost of capital (WACC), assessed at 7.0% post-tax, was used to discount its future cash flows. A valuation cross-check, comparing the implied EBITDA multiple with other airport companies and with recent airport transactions, supported the discounted cash flow valuation of the core airport operations of $541m.
Sensitivity analysis of the impact of different assumptions on the value of CIAL’s core airport operations as at 30 June 2013:
Change in Decrease Increase (m) (m)
Revenue (+ or – 5%) 120 (120)
WACC (+ or – 5%) 70 (55)
Capital expenditure (+ or – 5%) 45 (45)
Operating expenditure (+ or – 5%) 20 (20)
Property portfolio
The airport’s property portfolio, which comprises land and buildings not associated with the core airport operations, the car parking building, and properties classified as investment properties, was valued on a net asset basis, on the grounds that:
• a ready market exists for property and hence direct valuation methods for individual assets are available;
• hypothetically these assets could be sold without materially affecting the core airport operations; and
• some assets are held for strategic purposes and hence their value under an earnings approach may be understated.
CIAL had engaged an independent valuer to undertake the valuation of the property portfolio. Based on the valuation figures provided, the value of the property portfolio was assessed at $464m.
After deducting the company’s net debt as at 30 June 2013, the value of CCHL’s 75% shareholding was assessed at $534.2m.
2015 review
EY met with airport management to discuss the current state of the aeronautical business, and compared current financial forecasts with those used in their 2013 valuation. EY concluded that it was unlikely that the value of the core airport operations had changed materially since 2013.
However, there has been a substantial uplift in the value of the airport’s property portfolio, based on independent valuation of the company’s investment properties and car parking land as at 30 June 2015. Incorporating the updated value of these property assets has the effect of increasing the value of CCHL’s investment in CIAL from $534.2m to $635.0m, and this uplift has been recognised in the CCHL parent balance sheet.
The sensitivity of CIAL’s investment property to different input assumptions is summarised in Note 8.

C H R I S T C H U R C H C I T Y H O L D I N G S L I M I T E D I 2 0 1 5 A N N U A L R E P O R T
44
Notes to the financial statements FOR THE YEAR ENDED 30 JUNE 2015
GROUP STRUCTURE contd.
2(c) Lyttelton Port Company Ltd
Prior to the 2015 financial year, the value of CCHL’s investment in Lyttelton Port Company Ltd (LPC) was based on the quoted price on the New Zealand Stock Exchange as at 30 June 2014 for shares in the company.
In November 2014 CCHL completed a full takeover of LPC, and de-listed the company from the Stock Exchange. The minority shares were acquired at a price of $3.95 per share. Additionally the port company paid a special dividend as a condition of the takeover offer of $0.20 per share.
EY was commissioned to value the shares in LPC as at 30 June 2015. After considering various valuation methodologies, EY concluded that a capitalisation of maintainable earnings valuation was the most appropriate for the company’s circumstances. LPC suffered extensive physical damage after the 2011 earthquakes and, while receiving insurance settlements totalling $438m, faces a major capital repair and development programme over the next few years. The company’s board has not yet approved a final multi-year capital budget, or related forecasts, and hence a DCF valuation is not appropriate at this time.
In determining LPC’s maintainable earnings, EY reviewed recent and forecast financial performance, with EBITDA being considered an appropriate measure of maintainable earnings. Historical EBITDA was adjusted to remove the significant uplift in revenue that occurred as a direct result of additional import activity following the earthquakes. Expected future improvements to EBITDA as a result of the completion of earthquake repairs to wharves and other assets have not been factored in the maintainable earnings calculations, however, due to the aforementioned forecasting uncertainties.
EY then estimated an appropriate earnings multiple, based on observable port company transactions in Australasia, but adjusted downwards to reflect the uncertainties associated with the damaged state of the company’s assets and the major repair programme that lies ahead. Applying this multiple to the assessed maintainable earnings results in an enterprise value of $232.5m. To this is added the company’s substantial cash holdings as a result of the insurance settlement and the value of the land held at Rolleston (which has not yet been developed and hence has not contributed to EBITDA) to give a total mid-point equity value of $458.5m.
Sensitivity analysis of the impact of different assumptions on LPC’s enterprise value as at 30 June 2015:
Change in Decrease Increase (m) (m)
Revenue (+ or - 5%) 43.4 (43.4)
EBITDA (+ or - 5%) 3.4 (3.4)
Overheads (- or + 5%) 31.3 (31.3)
EBITDA multiple (- or + 0.5 times) 15.5 (15.5)
2(d) Enable Services Ltd
The investment in Enable Services Ltd (ESL) was valued as at 30 June 2015 using a two stage process. ESL is both a shareholder in, and contractor to, associate company Enable Networks Ltd (ENL), which is partly owned by Crown Fibre Holdings Ltd (CFH) and partly by ESL. ESL is contracted to build a fibre optic network for ENL and sell it to ENL as stages are completed. ESL receives funding from CCHL which it then invests in ENL in the form of non-voting equity and notes. ENL uses the proceeds from this funding to pay ESL for its contracting services. Hence ESL’s major assets are construction work in progress and its investment in ENL. ENL also receives equity funding from CFH in the form of ‘A’ shares, which carry voting rights.
CCHL’s investment in ESL was valued using the net asset value (as a going concern) methodology. Included in the net assets of ESL is its investment in ENL, which has been separately valued using the discounted cash flow methodology. The net asset valuation of ESL therefore incorporates the discounted cash flow valuation of ENL.
ENL’s forecast cash flows for the next ten years were assessed, and discounted back to the valuation date, using a discount rate that reflected not only the time value of money but also risk associated with the business’s future operations. A terminal cash flow, to allow for cash flows beyond the explicit forecast period, was also assessed and discounted back to the valuation date.
The company’s weighted average cost of capital, assessed at 9.5% post-tax, was used to discount its future cash flows.
From the resulting enterprise value was deducted the value attributed to CFH’s ‘A’ shares and debt owed to ESL to arrive at a mid-point value of ESL’s interest in ENL of $106.5m. To this was then added the other assets and liabilities of ESL (including $160m of debt) to arrive at an overall value for CCHL’s investment in ESL of $86.0m.
Sensitivity analysis of the impact of different assumptions on ENL’s equity value as at 30 June 2015:
2. Shares held in subsidiaries (contd.)

C H R I S T C H U R C H C I T Y H O L D I N G S L I M I T E D I 2 0 1 5 A N N U A L R E P O R T
45
Change in Decrease Increase (m) (m)
Revenue (+ or - 5%) 28.9 (29.2)
WACC (- or + 5%) 34.2 (29.9)
Capital expenditure (- or + 5%) 13.4 (13.8)
Operating expenses (+ or – 5%) 5.6 (6.0)
2(e) City Care Ltd
The investment in City Care Ltd (City Care) was valued as at 30 June 2015 using the future maintainable earnings methodology. In determining the company’s maintainable earnings, EY reviewed recent and forecast financial performance, with EBITDA being considered an appropriate measure of maintainable earnings. Historical and forecast EBITDA was adjusted for gains and losses on the sale of property, plant and equipment, and averaged to determine a maintainable level for the ongoing business. No adjustment was made to EBITDA in relation to City Care’s unexpectedly poor result in 2013, as it is considered that contracting companies can and do experience significant peaks and troughs in their business.
EY then determined an appropriate EBITDA multiple, taking into account the multiples of listed contracting companies (discounted for size and liquidity), and further adjusted to take account of the (temporary) favourable trading conditions that City Care has experienced since the earthquakes, the recent loss of some key contracts and the gradual winding down of the SCIRT contract.
Applying the resultant multiple to the assessed maintainable earnings resulted in an enterprise value of $111.4m. To this was added surplus land at Springs Road, independently valued by Colliers International at $9.1m, less net debt of $7.6m, to arrive at an assessed mid-point equity value of $112.9m.
A sensitivity analysis of the impact of different assumptions on City Care’s enterprise value was performed as at 30 June 2015 as follows:
Change in Decrease Increase (m) (m)
EBITDA (+ or - 5%) 4.3 (4.4)
EBITDA multiple (- or + 0.5 times) 12.9 (13.0)
Gross margin (- or + 5%) 10.6 (10.7)
2(f ) Red Bus Ltd
The investment in Red Bus Ltd (Red Bus) was last valued as at 30 June 2012 using the realisation of assets methodology. The combined effects of the Canterbury earthquakes, the loss of contracts by Red Bus and the move by Environment Canterbury to impose gross contracts significantly impacted the company’s profitability. Consequently, it was considered appropriate at that stage to value the company on a net asset orderly realisation basis. This methodology included significant discounts, which include realisation costs, liquidation costs and an incentive for a purchaser.
EY revalued the company as at 30 June 2015. They considered that, as Red Bus’ financial performance has improved over the last three years, and is forecast to continue to improve, it was now appropriate to value the company on a net asset going concern basis rather than on a net asset orderly realisation basis. An earnings-based methodology was not considered appropriate given that recent years have not been profitable and a number of routes will be coming up for tender.
Taking the above factors into account, the value of CCHL’s equity investment in Red Bus as at 30 June 2015 was assessed at a mid-point of $43.5m.
Given the method of valuation, it is considered that there is limited sensitivity to variation in input assumptions.

C H R I S T C H U R C H C I T Y H O L D I N G S L I M I T E D I 2 0 1 5 A N N U A L R E P O R T
46
Notes to the financial statements FOR THE YEAR ENDED 30 JUNE 2015
GROUP STRUCTURE contd.
2(g) EcoCentral Ltd
The investment in EcoCentral Ltd (EcoCentral) was valued as at 30 June 2015 using the capitalisation of maintainable earnings methodology. This was considered the most appropriate basis of valuation given that EcoCentral is a well-established, mature company with a consistent record of profitability.
EY assessed EBITDA as being a suitable measure of profitability, and reviewed historical and forecast EBITDA to determine an appropriate level of maintainable earnings. EY then determined an appropriate EBITDA multiple, based on companies in similar industries but discounted to take account of size and liquidity, and the temporary favourable trading conditions following the Canterbury earthquakes.
The resultant midpoint enterprise value of EcoCentral was assessed at $13.3m which, after deduction of debt, equates to an equity value of $9.3m.
A sensitivity analysis of the impact of different assumptions on EcoCentral’s equity value was performed as at 30 June 2015 as follows:
Change in Decrease Increase (m) (m)
Overhead expenses (+ or - 5%) 5.7 (5.7)
Revenue (+ or - 5%) 6.3 (6.3)
EBITDA multiple (- or + 0.5 times) 1.8 (1.8)
Accounting policy
Subsidiaries
Subsidiaries are all those entities over which the Group has the power to govern the financial and operating policies so as to obtain benefits from their activities. Control is achieved when the Group is exposed, or has rights, to variable returns from its involvement with the investee and has the ability to affect those returns through its power over the investee.
The financial statements of the subsidiaries (other than Orion New Zealand Ltd – see above) are prepared for the same reporting period as the parent company, using consistent accounting policies. In preparing the consolidated financial statements, all inter-company balances and transactions, income and expenses and profit and losses resulting from intra-group transactions are eliminated in full.
Subsidiaries are fully consolidated from the date on which control is transferred to CCHL and cease to be consolidated from the date control ceases. The purchase method of accounting is used to account for the consolidation of subsidiaries.
The acquisition of subsidiaries is accounted for using the acquisition method of accounting. The acquisition method of accounting involves recognising at acquisition date, separately from goodwill, the identifiable assets acquired, the liabilities assumed and any non-controlling interest in the acquiree. The identifiable assets acquired and the liabilities assumed are measured at their acquisition date fair values. The difference between the above items and the fair value of the consideration (including the fair value of any pre-existing investment in the acquiree) is goodwill or a discount on acquisition.
A change in the ownership interest of a subsidiary that does not result in a loss of control is accounted for as an equity transaction. The difference between the carrying value of the non-controlling interests and the consideration paid is recognised directly in equity attributable to the parent, in accordance with the requirements of NZ IAS 27.
Non-controlling interests are allocated their share of net profit after tax in the statement of comprehensive income and are presented within equity in the consolidated balance sheet, separately from the equity of the owners of the parent.
Joint ventures
Joint ventures are those entities over whose activities the Group has joint control, established by contractual agreement. The Group’s share of the assets, liabilities, revenues and expenses of any joint venture is incorporated into the Group’s financial statements on a line by line basis using the proportionate method.
2. Shares held in subsidiaries (contd.)

C H R I S T C H U R C H C I T Y H O L D I N G S L I M I T E D I 2 0 1 5 A N N U A L R E P O R T
47Assets acquired in business combination
Property, plant and equipment 297 – – –
Other payables (185) – – –
Total identifiable net assets 112 – – –
Goodwill 17 553 – – –
Total 665 – – –
Consideration
Cash 415 – – –
Contigent consideration 250 – – –
665 – – –
Note Group 2015 Group 2014 Parent 2015 Parent 2014 $’000 $’000 $’000 $’000
3(a) CCHL takeover of Lyttelton Port Company Ltd
In October 2014, CCHL acquired the remaining 20.43% of the shares in Lyttelton Port Company Ltd (LPC) that it did not already own, taking its shareholding in LPC from 79.57% to 100%. The consideration for the purchase of these shares was $3.95 per share. Additionally, LPC paid a special dividend to all shareholders prior to the takeover of $0.20 per share.
In the parent company financial statements, the special dividend was recorded as revenue, and the purchase consideration as an addition to carrying value of the investment. The investment was subsequently revalued at balance date as described in Note 2.
In the group financial statements, the non-controlling interest in the average net asset value of LPC of $108.8m (20.43% of $532.4m) was debited to non-controlling interests, as shown in the statement of changes in equity. The difference of $26.8m between the acquisition cost of $82.0m and the non-controlling interest of $108.8m, attributable to CCHL, was credited to group retained earnings. It was not considered appropriate to recognise this as a gain though profit or loss given that the acquisition was an increase in the holding of an existing investment rather than a new business combination.
3(b) City Care Ltd acquisition
In September 2014, City Care Ltd acquired the assets and business of Command Management Ltd and related companies - a heating, ventilation and air conditioning installation and servicing business. The consideration and assets acquired are detailed below. The contingent consideration, currently held in an escrow account, is payable upon a target EBIT being achieved within 12 months of completion date.
3. Business combinations
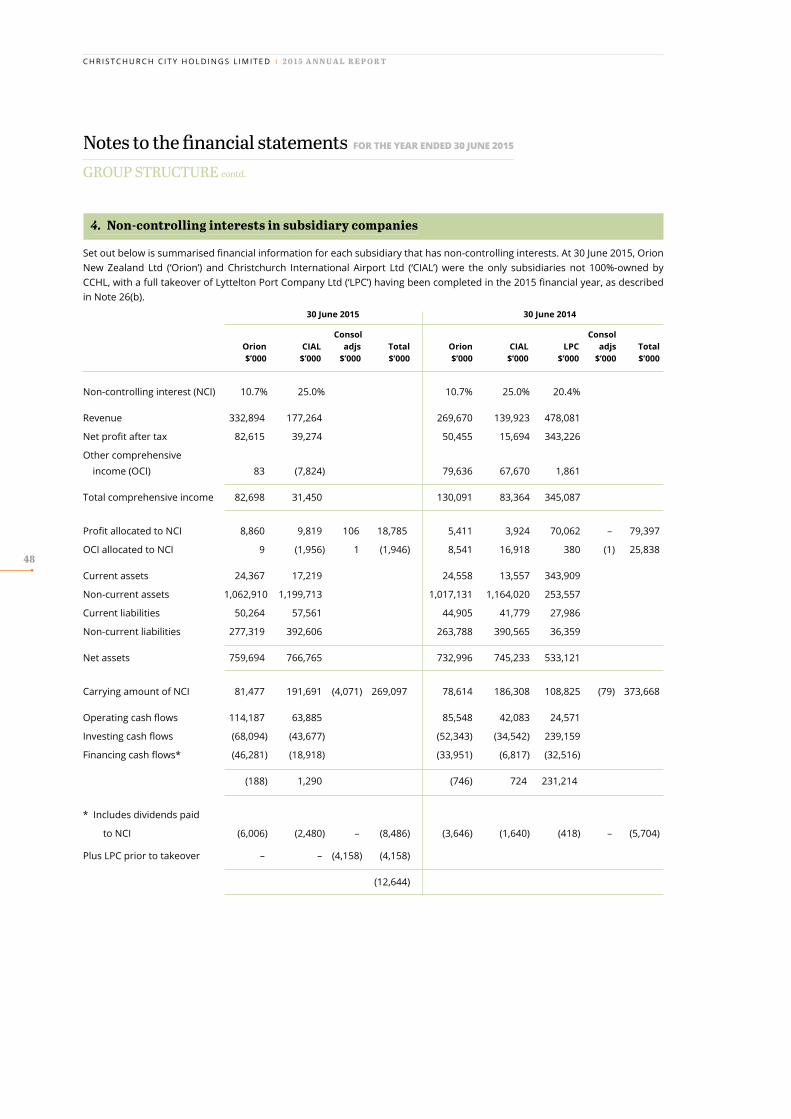
C H R I S T C H U R C H C I T Y H O L D I N G S L I M I T E D I 2 0 1 5 A N N U A L R E P O R T
48
Notes to the financial statements FOR THE YEAR ENDED 30 JUNE 2015
GROUP STRUCTURE contd.
Set out below is summarised financial information for each subsidiary that has non-controlling interests. At 30 June 2015, Orion New Zealand Ltd (‘Orion’) and Christchurch International Airport Ltd (‘CIAL’) were the only subsidiaries not 100%-owned by CCHL, with a full takeover of Lyttelton Port Company Ltd (‘LPC’) having been completed in the 2015 financial year, as described in Note 26(b).
30 June 2015 30 June 2014
Consol Consol Orion CIAL adjs Total Orion CIAL LPC adjs Total
$’000 $’000 $’000 $’000 $’000 $’000 $’000 $’000 $’000
Non-controlling interest (NCI) 10.7% 25.0% 10.7% 25.0% 20.4%
Revenue 332,894 177,264 269,670 139,923 478,081
Net profit after tax 82,615 39,274 50,455 15,694 343,226
Other comprehensive income (OCI) 83 (7,824) 79,636 67,670 1,861
Total comprehensive income 82,698 31,450 130,091 83,364 345,087
Profit allocated to NCI 8,860 9,819 106 18,785 5,411 3,924 70,062 – 79,397
OCI allocated to NCI 9 (1,956) 1 (1,946) 8,541 16,918 380 (1) 25,838
Current assets 24,367 17,219 24,558 13,557 343,909
Non-current assets 1,062,910 1,199,713 1,017,131 1,164,020 253,557
Current liabilities 50,264 57,561 44,905 41,779 27,986
Non-current liabilities 277,319 392,606 263,788 390,565 36,359
Net assets 759,694 766,765 732,996 745,233 533,121
Carrying amount of NCI 81,477 191,691 (4,071) 269,097 78,614 186,308 108,825 (79) 373,668
Operating cash flows 114,187 63,885 85,548 42,083 24,571
Investing cash flows (68,094) (43,677) (52,343) (34,542) 239,159
Financing cash flows* (46,281) (18,918) (33,951) (6,817) (32,516)
(188) 1,290 (746) 724 231,214
* Includes dividends paid
to NCI (6,006) (2,480) – (8,486) (3,646) (1,640) (418) – (5,704)
Plus LPC prior to takeover – – (4,158) (4,158)
(12,644)
4. Non-controlling interests in subsidiary companies

C H R I S T C H U R C H C I T Y H O L D I N G S L I M I T E D I 2 0 1 5 A N N U A L R E P O R T
49
Balance at start of year 37,245 34,599 – –
Further investment 6,800 7,804 – –
Share of total recognised revenues and expenses (3,255) (5,158) – –
40,790 37,245 – –
Summarised financial statements of associates
Assets 144,371 92,362
Liabilities (97,392) (52,575)
Revenue 8,492 5,234
Net profit/(loss) (6,137) (8,141)
Enable Networks Ltd (ENL) is the only associated company of the Group. Its principal place of business is Christchurch and is incorporated in New Zealand. Its balance date is 30 June. There is no goodwill included in its carrying value (2014: Nil).
Enable Services Ltd (ESL) entered an agreement with Crown Fibre Holdings Ltd (CFH) and ENL on 31 May 2011 relating to the construction, deployment and operation of the UFB network for the greater Christchurch area. ENL is jointly owned by ESL and CFH, and purchases the network in stages as it is constructed by ESL. Funding arrangements are summarised as follows:
A Shares
A shares have voting rights but do not receive dividends. ESL funds approximately 33% of the cost of the Communal Infrastructure in return for A shares in ENL as a non-cash transaction. The remaining 67% is funded by CFH to ENL in cash.
B Shares
B shares have dividend rights but do not have voting rights. Where free cash flow in ENL is insufficient to purchase UFB network, ENL is funded by ESL using a hierarchy of specified equity, then debt through note instruments and if required through B shares.
All A shares and B shares in ENL convert to ordinary shares in 2021.
Associate status
Although ESL holds the substantial majority of total shares issued in ENL, it only holds approximately 44% (2014: 49%) of the voting shares and does not control ENL. It is deemed to hold significant influence over ENL through its holding of A and B shares and therefore accounts as an associate for ENL.
Note Group 2015 Group 2014 Parent 2015 Parent 2014 $’000 $’000 $’000 $’000
Accounting policy
Associated companies
Associates are entities over which the Group has significant influence but not control, generally accompanying a shareholding of between 20% and 50% of the voting rights.
Investments in associates are accounted for in the consolidated financial statements using the equity method, after initially being recognised at cost.
The Group’s share of its associates’ post-acquisition profits or losses is recognised through profit or loss, and its share of post-acquisition movements in reserves is recognised in reserves. The cumulative post-acquisition movements are adjusted against the carrying amount of the investment.
When the Group’s share of losses in an associate equals or exceeds its interest in the associate, including any other unsecured receivables, the Group does not recognise further losses, unless it has incurred obligations or made payments on behalf of the associate.
Unrealised gains on transactions between CCHL and its associates are eliminated to the extent of the Group’s interest in the associates. Unrealised losses are also eliminated unless the transaction provides evidence of an impairment of the asset transferred. Accounting policies of associates are either changed where necessary to ensure consistency with the policies adopted by CCHL, or appropriate adjustments made in the consolidation.
5. Associated companies
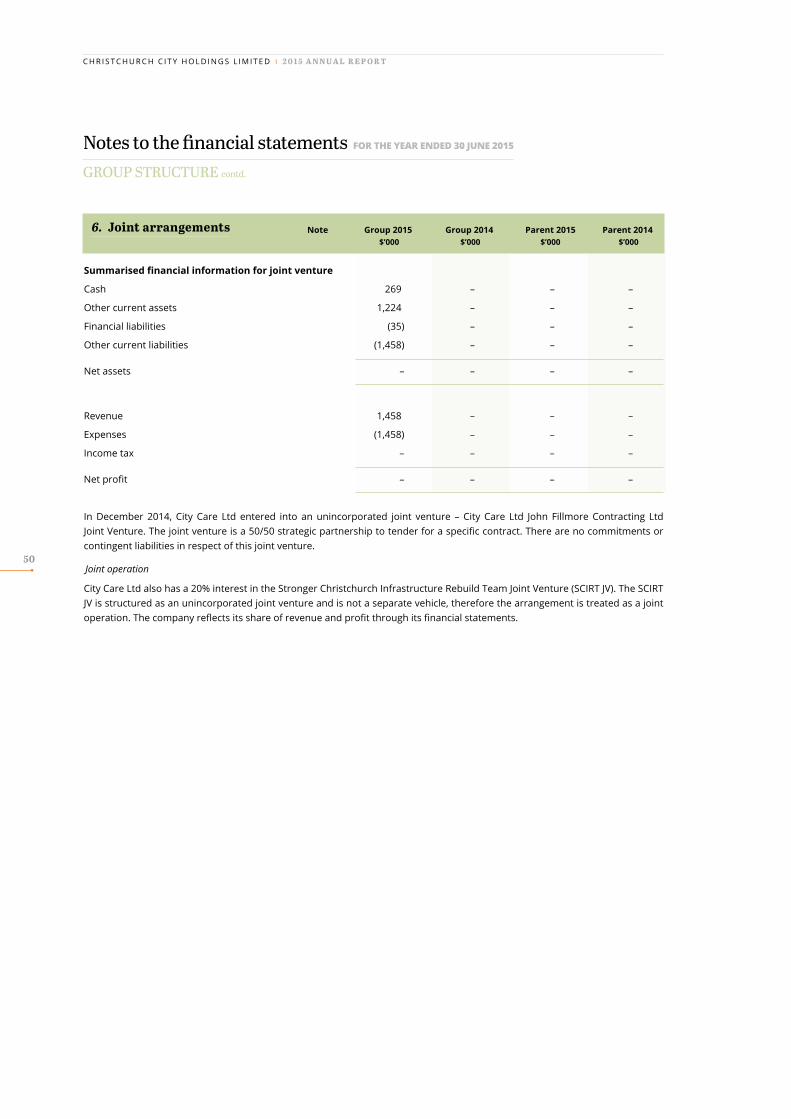
C H R I S T C H U R C H C I T Y H O L D I N G S L I M I T E D I 2 0 1 5 A N N U A L R E P O R T
50
▲
▲
▲
Notes to the financial statements FOR THE YEAR ENDED 30 JUNE 2015
GROUP STRUCTURE contd.
Note Group 2015 Group 2014 Parent 2015 Parent 2014 $’000 $’000 $’000 $’000
Summarised financial information for joint venture
Cash 269 – – –
Other current assets 1,224 – – –
Financial liabilities (35) – – –
Other current liabilities (1,458) – – –
Net assets – – – –
Revenue 1,458) – – –
Expenses (1,458) – – –
Income tax – – – –
Net profit – – – –
In December 2014, City Care Ltd entered into an unincorporated joint venture – City Care Ltd John Fillmore Contracting Ltd Joint Venture. The joint venture is a 50/50 strategic partnership to tender for a specific contract. There are no commitments or contingent liabilities in respect of this joint venture.
Joint operation
City Care Ltd also has a 20% interest in the Stronger Christchurch Infrastructure Rebuild Team Joint Venture (SCIRT JV). The SCIRT JV is structured as an unincorporated joint venture and is not a separate vehicle, therefore the arrangement is treated as a joint operation. The company reflects its share of revenue and profit through its financial statements.
6. Joint arrangements

C H R I S T C H U R C H C I T Y H O L D I N G S L I M I T E D I 2 0 1 5 A N N U A L R E P O R T
51
▲
▲
▲
▲
▲
▲
▲▲
Key Assets & Liabilities
7. Property, plant & equipment
Notes to the financial statements FOR THE YEAR ENDED 30 JUNE 2015
Freehold Plant & distribution Specialised Work in Group land Buildings equipment system assets progress Total $’000 $’000 $’000 $’000 $’000 $’000 $’000
Gross carrying amount
Cost/valuation at 1 July 2013 415,982 387,125 335,955 830,231 368,128 68,772 2,406,193
Additions 3,619 11,882 39,847 61,135 19,137 – 135,620
Disposals – (1,953) (7,285) (4,510) (257) – (14,005)
Re-classified as held for sale – – (1,833) – – – (1,833)
Net movements in work in progress – – – – – 28,004 28,004
Net revaluation increments/(decrements) 4,403 7,086 – 17,208 (5,598) – 23,099
Transfers (762) 2,172 3,382 (89) 14,893 (19,250) 346
Cost/valuation at 30 June 2014 423,242 406,312 370,066 903,975 396,303 77,526 2,577,424
Additions 46,295 2,471 21,316 45,632 44,660 – 160,374
Additions through business combinations – – 292 – – – 292
Disposals (5,590) (232) (7,699) (1,205) – – (14,726)
Reversal of re-classification as held for sale – – 1,833 – – – 1,833
Net movements in work in progress – – – – – 32,669 32,669
Net revaluation increments/(decrements) 619 – – 116 – – 735
Transfers and other (3,449) 5,132 3,416 – 5,891 (10,641) 349
Cost/valuation at 30 June 2015 461,117 413,683 389,224 948,518 446,854 99,554 2,758,950
Accumulated depreciation & impairment
Accumulated balance at 1 July 2013 (1,644) (47,686) (165,323) (56,784) (66,393) – (337,830)
Disposals – 780 6,276 560 3 – 7,619
Revaluation adjustments – 56,119 – 86,991 19,198 – 162,308
Re-classified as held for sale – – 1,467 – – – 1,467
Impairment losses 1,610 (320) – – – – 1,290
Depreciation expense (10) (22,060) (25,003) (30,782) (18,767) – (96,622)
Transfers and other (16) 125 (123) 14 – – –
Accumulated balance at 30 June 2014 (60) (13,042) (182,706) (1) (65,959) – (261,768)
Disposals – 113 6,509 50 – – 6,672
Re-classified as held for sale – – (1,467) – – – (1,467)
Depreciation expense (2) (22,720) (25,754) (35,529) (14,581) – (98,586)
Transfers and other – – – – 1,261 – 1,261
Accumulated balance at 30 June 2015 (62) (35,649) (203,418) (35,480) (79,279) – (353,888)
Carrying amount at 30 June 2014 423,182 393,270 187,360 903,974 330,344 77,526 2,315,656
Carrying amount at 30 June 2015 461,055 378,034 185,806 913,038 367,575 99,554 2,405,062
Electricity

C H R I S T C H U R C H C I T Y H O L D I N G S L I M I T E D I 2 0 1 5 A N N U A L R E P O R T
52
Notes to the financial statements FOR THE YEAR ENDED 30 JUNE 2015
KEY ASSETS & LIABILITIES contd.
Of the carrying amount of $2,409m as at 30 June 2015, $1,055m (2014: $1,010m) was attributable to Orion New Zealand Ltd and $930m (2014: $957m) to Christchurch International Airport Ltd – 82% in total (2014: 85%). The parent company had property, plant and equipment of $0.2m (2014: Nil).
Orion New Zealand Ltd
Electricity distribution network
The electricity distribution network was revalued to fair value of $904m as at 31 March 2014 by independent valuer Ernst & Young Transaction Advisory Services Limited (EY). Including capital work in progress, this resulted in a total network valuation of $939m.
In the absence of an active market for the network, EY calculated fair value using significant unobservable inputs (Level 3, as defined in NZ IFRS 13) and a discounted cash flow (DCF) methodology. EY based its cash flow forecasts on Orion’s cash flow forecasts, adjusted to remove the impacts of expansionary growth on forecast future revenues, operating expenditure and capital expenditure.
EY’s key valuation assumptions were that:
• network revenues will be consistent with Orion’s customised price-quality path (CPP) settings for the five years commencing 1 April 2014 and network revenues will return to the Commerce Commission’s default price-quality path (DPP) from 1 April 2019, with prices thereafter forecast to increase at CPI
• non-expansionary “infill” growth will be 0.3% per annum
• the appropriate DCF discount rate is 6.7% post-tax.
EY performed a sensitivity analysis on a number of variables as follows:
Change in Decrease Increase (m) (m)
Operating expenses (- or + 10%) 16 (16)
Discount rate (- or + 0.25%) 40 (37)
Regulatory post tax cost of capital (-0.7%)1 N/A (79)
Capital expenditure (- or + 5%) 24 (24)
EY reviewed the carrying value for the electricity network as at 31 March 2015, using a similar methodology to that described above, based on Orion’s updated financial forecasts, and updated DCF discount rate, and the Commerce Commission’s decision to reduce the regulatory cost of capital estimate to the 67th percentile estimate. EY concluded that there were no indicators that the carrying value for the electricity distribution network as at 31 March 2015 was materially different from fair value as at that date.
Land and non-substation buildings
Orion’s land and non-substation buildings were revalued to fair value as at 31 March 2014 by CBRE Limited. Land at a sample of substation sites was valued using sales comparisons and unit metre frontage methodologies (Level 2 as defined in NZ IFRS 13), and compared with their respective rateable values. The comparisons were then used to develop standard site multipliers, which were applied to rateable land values for approximately 2,200 substation sites. Fair values for approximately 35% of Orion’s land and non-substation buildings (by value) were calculated using significant unobservable inputs (Level 3, as defined in NZ IFRS 13). Land at the two largest substations was valued using DCF and/or sales comparison approaches, reflecting the highest and best use of each (Level 3).
Orion’s head office land and building was valued using a market rental assessment and a capitalization rate of 7.75% (Level 3). The valuer concluded that the fair values of the head office building and land were $10.4m and $3.6m respectively, thus confirming their carrying values.
The valuer reviewed the value of the above assets as at 31 March 2015, using a similar methodology, and concluded that there were no indicators that the carrying value as at 31 March 2015 was materially different to fair value.
Restrictions over title
There are no restrictions over the title of Orion’s property, plant and equipment, nor is any property, plant and equipment pledged as security for liabilities.
7. Property, plant & equipment (contd.)

C H R I S T C H U R C H C I T Y H O L D I N G S L I M I T E D I 2 0 1 5 A N N U A L R E P O R T
53
Christchurch International Airport Ltd
The company’s land, buildings, terminal facilities, car parking assets, and sealed surface and infrastructure assets are recorded at fair value and, in the absence of significant observable inputs, are classified as Level 3 within the fair value hierarchy as defined by NZ IFRS 13 – Fair Value Measurement. The methods of valuation applied by independent valuers are as follows:
Land
• Specialised assets: where there is no market based evidence of the sale of such land the value has been determined taking into account:
• its existing zoning and use as an airport • benchmark selling prices for land in the local commercial, industrial, service, residential and rural markets • adjustments to reflect the unique features of the land which includes its size, location, titles, easements and services • the overall land use plan for Christchurch Airport.
• Commercial portfolio: with valuations taking reference to the wider market for sales evidence of land zoned for similar permitted activities, with adjustments made for the size, location and physical characteristics of these assets.
Buildings
At market value based on the estimated amount for which a property would exchange on the date of valuation between a willing buyer and willing seller in an arm’s length transaction after proper marketing wherein the parties had each acted knowledgeably, prudently, and without compulsion, but with the explicit assumption that the existing use of the asset is ignored.
Where a building is a specialised asset then it is valued at optimised depreciated replacement cost (ODRC). ODRC measures the minimum cost of replacing or replicating the service potential embodied in the assets with modern equivalent assets in the most efficient way practicable, given the service requirements, the age and condition of the existing assets and replacement in the normal course of business.
Terminal facilities
Terminal facilities are a specialised asset and are valued at optimised depreciated replacement cost.
Car parking assets
Car parking assets are valued using a discounted cash flow valuation approach, using a forecast ten year discount period and an allowance for an appropriate terminal value reflecting an estimate of their residual estimated life. The approach to the allocation of the car park valuation is to assess the pro-rata share of an ODRC based valuation of the car parking assets, and then apportion the additional value over and above this to the underlying land value.
Sealed surfaces and infrastructure assets
The ODRC approach is utilised to value sealed surfaces and infrastructure assets. The optimisation process minimises the cost of replacing the services offered, given the age and condition of the existing assets and recognising the incremental process (brownfield) associated with airport development. Costs reflect the replacement of current assets with modern equivalents, an optimised construction sequence and adjustment to allow for the difficulties associated with a “brownfield” environment. Adjustments have been made to eliminate surplus assets, obsolescence and over design. The valuation methodology considers the asset inventory (description and quantity of assets), relevant optimisation, estimation of the current replacement cost and depreciation to reflect remaining life expectancy.
Revaluation
On 30 June 2014 car parking assets and commercial building assets were revalued by independent valuers Crighton Anderson Property and Infrastructure Ltd. Sealed surfaces, infrastructure assets and terminal and specialised buildings were valued by independent valuers Opus International Limited as at 30 June 2014.
The valuation methodologies used in the revaluation as at 30 June 2014 were consistent with those used in the last valuation. Land was last revalued on 30 June 2013.
The valuers performed a sensitivity analysis on a number of variables, as follows:
Category Change in Increase Decrease (m) (m)
Land Discount rate (– or + 5%) 14 (14)
Investment properties Cost estimate (– or + 5%) 12 (12)
Infrastructure/sealed surfaces Cost estimate (– or + 5%) 8 (8)
Buildings Cost estimate (– or + 5%) 2 (2)
Terminal Cost estimate (– or + 5%) 17 (17)
Car parking Discount rate (– or + 5%) 5 (5)

C H R I S T C H U R C H C I T Y H O L D I N G S L I M I T E D I 2 0 1 5 A N N U A L R E P O R T
54
Notes to the financial statements FOR THE YEAR ENDED 30 JUNE 2015
KEY ASSETS & LIABILITIES contd.
Lyttelton Port Company Ltd
Net carrying value at 30 June 2015 was $328m (2014: $249m). Lyttelton Port Company Ltd’s (LPC’s) assets are carried at 2006 valuation (or cost for subsequent additions) less accumulated depreciation and impairment charges. During the course of the 2014 year company management assessed that there was no change in the useful economic lives of items of property, plant and equipment, other than for a seawall with a carrying value of $9m which was transferred to land as part of the reclamation project, and hence its useful life has become indefinite (2014: Nil).
The LPC board considered an indicator of impairment for the group’s assets at 30 June 2015, following the takeover and de-listing of the company in 2014. As required by NZ IAS 36 Impairment of Assets, the LPC board undertook an impairment test and engaged an independent advisor. After completing this assessment, the LPC concluded that there was no impairment of the company’s assets as at 30 June 2015, which included $226m of cash and bank deposits, on the basis that the fair value of the company incorporating committed capital expenditure exceeded the carrying amount. Recent investments in property, plant and equipment were necessary to restore the resilience of the company’s assets and to protect the future income streams of the company. Capital investments will continue to be made considering the impact on operational resilience and investment return.
The company’s impairment assessment includes certain assumptions on coal handling volumes, for which the actual results may differ as a result of the voluntary administration of Solid Energy, as outline in Note 23. At the date of the approval of these financial statements, this assessment reflects the best available information and views of the company with respect to its future coal handling activities.
Enable Services Ltd, City Care Ltd, Red Bus Ltd and EcoCentral Ltd
The net carrying value of the property, plant and equipment of these companies at 30 June 2015 comprised less than 5% of total group assets. Assets of these companies are either independently revalued at regular intervals, or carried at cost less accumulated depreciation.
Accounting policy
Property, plant and equipment
Land, buildings, electricity distribution network, airport sealed surfaces, car parking building and infrastructure assets (except for investment properties – refer to Note 8, and for land and buildings owned by Lyttelton Port Company Ltd and EcoCentral Ltd) are shown at fair value, based on valuations by external independent valuers, less subsequent depreciation.
Airport sealed surfaces, car parking building, car parks, harbour structures and other infrastructure assets are aggregated and disclosed as specialised assets.
Valuations are performed with sufficient regularity to ensure that the fair value of the assets does not vary materially from their carrying value.
Any revaluation increase arising on the revaluation of these assets is credited to the asset revaluation reserve included in other comprehensive income, except to the extent that it reverses a revaluation decrease for the same asset previously recognised as an expense through profit or loss, in which case the increase is credited to profit or loss to the extent of the decrease previously charged. A decrease in carrying amount arising on the revaluation of these assets is charged as an expense through profit or loss to the extent that it exceeds the balance, if any, held in the asset revaluation reserve relating to a previous revaluation of that asset.
Any accumulated depreciation at the date of revaluation is eliminated against the gross carrying amount of the asset and the net amount is restated to the revalued amount of the asset.
Additions are recorded at historical cost less depreciation until the next revaluation. Historical cost includes expenditure that is directly attributable to the acquisition of the items. Cost may also include transfers from equity of any gains/losses on qualifying cash flow hedges of foreign currency purchases of property, plant and equipment.
All other property, plant and equipment is stated at historical cost less depreciation.
Subsequent costs are included in the asset’s carrying amount or recognised as a separate asset, as appropriate, only when it is probable that future economic benefits associated with the item will flow to the Group and the cost of the item can be measured reliably. All other repairs and maintenance are charged to profit or loss during the financial period in which they are incurred.
7. Property, plant & equipment (contd.)

C H R I S T C H U R C H C I T Y H O L D I N G S L I M I T E D I 2 0 1 5 A N N U A L R E P O R T
55
Land is not depreciated. Depreciation on other assets is calculated using the straight line method to allocate their cost or revalued amounts, net of their residual values, over their estimated useful lives.
Assets to be depreciated include:
Buildings 1-100 yrs Harbour structures 3-50 yrs Building fit-out/services 30-70 yrs Electricity distribution system 60 yrs Car park 50 yrs Airport infrastructure and roads 15-50 yrs Office/computer equipment 1-10 yrs Active telecommunications equip. 5 yrs Mobile plant incl. vehicles 2-30 yrs Vessels 5-25 yrs Buses 17-26 yrs Seawalls 100 yrs Sealed surfaces (other than roads) 9-100 yrs Container cranes 30 yrs
The assets’ residual values and useful lives are reviewed, and adjusted if appropriate, at each balance sheet date. Capital work in progress is not depreciated until commissioned. An asset’s carrying amount is written down immediately to its recoverable amount if the asset’s carrying amount is greater than its estimated recoverable amount.
Gains and losses on disposals are determined by comparing proceeds with carrying amount. These are recognised through profit or loss. When revalued assets are sold, any revaluation reserve relating to the particular asset is transferred to retained earnings.
Distinction between capital and revenue expenditure
Capital expenditure is defined as all expenditure incurred in the creation of a new asset and any expenditure that results in a significant restoration or increased service potential for existing assets. Constructed assets are included in property, plant and equipment as each becomes operational and available for use. Revenue expenditure is defined as expenditure that is incurred in the maintenance and operation of the property, plant and equipment of the Group.
Balance at beginning of financial year 193,175 178,188 – –
Transfer (to)/from property, plant & equipment 14,754 275 – –
Additional capitalised expenditure 31,261 5,489 – –
Disposal (2,184) – – –
Net gain/(loss) from fair value adjustments 10 18,086 9,223 – –
Balance at end of financial year 255,092 193,175 – –
All of the Group’s investment property is held by Christchurch International Airport Ltd. Included in the amount above is $26.8m (2014: $10.5m) relating to investment properties under construction, but sufficiently advanced to enable a fair value to be assessed by the independent valuer. These properties are carried at fair value on completion less estimated costs to complete.
Valuation of investment property
The valuation as at 30 June 2015 was completed by Crighton Anderson Property and Infrastructure Ltd, registered valuers. The basis of valuation is fair value, being the estimated amount for which an asset should exchange on the date of valuation between a willing buyer and a willing seller in an arm’s-length transaction after proper marketing wherein the parties had each acted knowledgeably, prudently and without compulsion.
The valuation methodologies used were a direct sales comparison or a direct capitalisation of rental income using market comparison of capitalisation rates, supported by a discounted cash flow approach. The valuation methodologies are consistent with the prior year.
Principal assumptions used in establishing the valuations were:
• Average rental yield rate 8.56% (2014: 9.49%)
• Average market capitalisation rate 7.77% (2014: 8.89%)
• Weighted average lease term 4.63 years (2014: 4.40 years).
Note Group 2015 Group 2014 Parent 2015 Parent 2014 $’000 $’000 $’000 $’000
8. Investment property

C H R I S T C H U R C H C I T Y H O L D I N G S L I M I T E D I 2 0 1 5 A N N U A L R E P O R T
56
Notes to the financial statements FOR THE YEAR ENDED 30 JUNE 2015
KEY ASSETS & LIABILITIES contd.
Accounting policy
Investment property
Land is held by the company for long term and strategic purposes and is not held for resale. Investment properties are land and buildings where the building is built to maximise the return on land and buildings as an “interim use”, are held for long term rental yield and are not occupied by the company. Investment property also includes property that is being constructed or developed for future use as investment property.
Properties leased to third parties under operating leases are generally classified as investment property unless:
• The occupants provide services that are integral to the operation of the Group’s business and/or these services could not be provided efficiently and effectively by the lessee in another location;
• The property is being held for future delivery of services;
Land where there are infrastructure services in place up to its boundary or there is a firm commitment to provide such infrastructure and the further development of that land is signalled within the next three years (being the current business planning cycle) is classified as investment property. Buildings that are held for a currently undetermined future use, or that are vacant but held to be leased out under one or more operating leases, are classified as investment properties.
The classification of properties is done at the lowest possible level. Thus, where part of a property is occupied by a party other than the Group, consideration is given to whether that portion of the building could be classified as an investment property. Classification as an investment property will be indicated if the section of the building could be separately sold or leased under a finance lease. If the section of the property occupied by a party other than the Group is unable to be sold or leased separately from the rest of the building, the building is assessed as a whole and will usually only be classified as investment property if the Group occupies an insignificant portion of the total building.
Investment property is carried at fair value, based on discounted cash flow projections, as determined annually by external valuers. Gains or losses arising from a change in fair value are recorded in the Statement of Financial Performance.
Fair value measurement on property under construction is only applied if the fair value is considered to be reliably measurable. If it is determined that the fair value of an investment property under construction is not reliably determinable but the company has an expectation that the fair value of the property will be reliably determinable when construction is complete, the investment property under construction will be measured at cost until either its fair value becomes reliably determinable or construction is completed (whichever is earlier).
8. Investment property (contd.)

C H R I S T C H U R C H C I T Y H O L D I N G S L I M I T E D I 2 0 1 5 A N N U A L R E P O R T
57
9. Borrowings & finance costs
Current Non-current Total Current Non-current Total 2015 2015 2015 2014 2014 2014 Note $’000 $’000 $’000 $’000 $’000 $’000
9(a) Group Unsecured:
Commercial paper 65,000 – 65,000 53,000 - 53,000
Bonds and floating rate notes 100,000 239,278 339,278 25,000 324,777 349,777
Loans from external parties 25,000 191,000 216,000 – 188,800 188,800
Loans from group entities 26(a)(iii) – 208,000 208,000 – 101,500 101,500
Finance lease liabilities 9(d) 2,020 13,635 15,655 1,486 15,612 17,098
192,020 651,913 843,933 79,486 630,689 710,175
Secured:
Finance lease liabilities – 8,600 8,600 – 18,690 18,690
– 8,600 8,600 – 18,690 18,690
Total group borrowings 192,020 660,513 852,533 79,486 649,379 728,865
9(b) Parent Unsecured:
Commercial paper 65,000 – 65,000 53,000 – 53,000
Bonds and floating rate notes 100,000 115,000 215,000 25,000 205,000 230,000
Loans from group entities 26(a)(iii) – 208,000 208,000 – 101,500 101,500
Total parent borrowings 165,000 323,000 488,000 78,000 306,500 384,500
Except as disclosed in Note 28, the carrying amount of the Group’s current and non-current borrowings approximates their fair value – ie. the amount at which these liabilities are expected to be settled for.
CCHL parent company
CCHL’s borrowings at 30 June 2015 comprised:
• Bonds and floating rate notes totalling $215m (2014: $230m) in six tranches ranging from $10m to $70m. These borrowings mature at various intervals until November 2019. Interest on floating rate bonds is based on bank bill rates plus the relevant issue margin, with a weighted average borrowing cost (before hedging) at balance date of 4.51% (2014: 4.35%). Bond coupon rates are at 6.87% (2014: 6.87%).
• Loans from Christchurch City Council of $208.0m (2014: $101.5m) - see Note 26(a)(iii).
• Commercial paper of $65m (2014: $53m). This is short term debt on a 90 day rollover period. The weighted average rate at balance date was 3.7% (2014: 3.6%);
• The company also has an undrawn $100m (2014: $150m) bank facility. This matures in December 2015.
• CCHL’s weighted average cost of borrowing (post-hedging) at balance date was 5.42% (2014: 5.68%).
The borrowings have been put in place under a $650m debt issuance programme. The borrowings are unsecured, but the loan documentation imposes certain covenants and restrictions on CCHL. CCHL has issued uncalled capital of $650m to support this programme (refer Note 24). The company has entered into derivative contracts to hedge its exposure to interest rate fluctuations (refer Note 20(f)).
CCHL has complied with the financial covenants of its borrowing facilities during the 2015 and 2014 reporting periods.
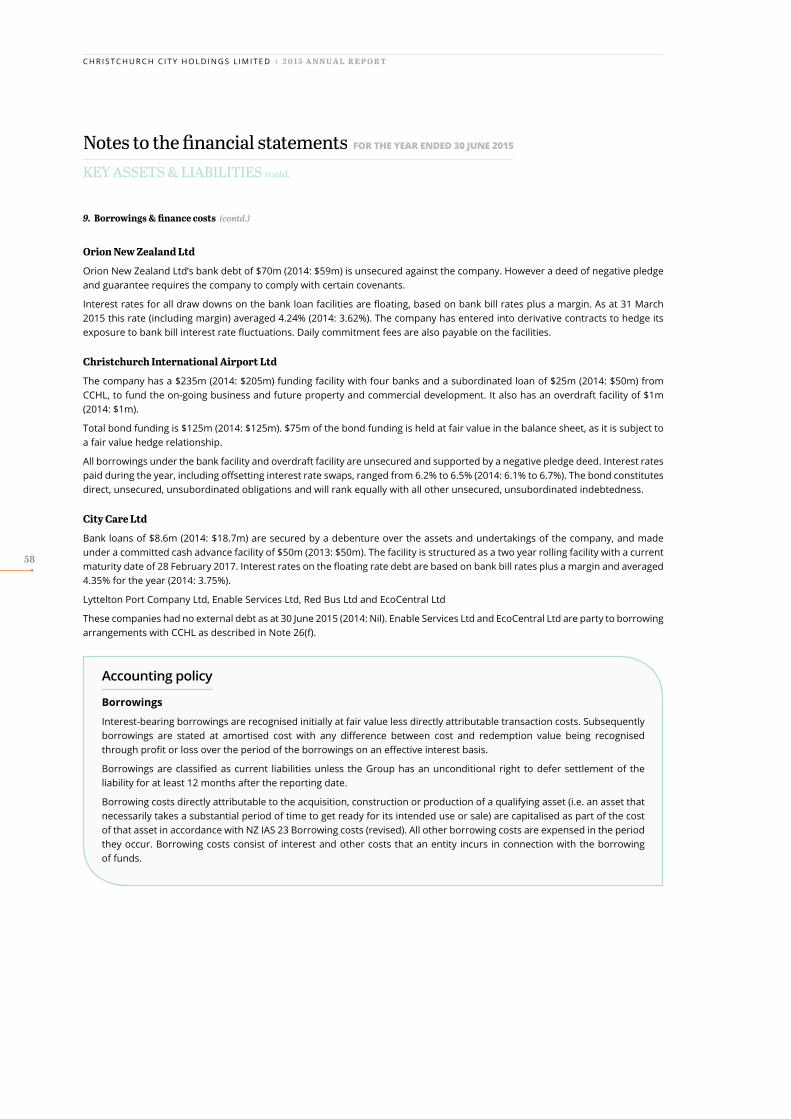
C H R I S T C H U R C H C I T Y H O L D I N G S L I M I T E D I 2 0 1 5 A N N U A L R E P O R T
58
Notes to the financial statements FOR THE YEAR ENDED 30 JUNE 2015
KEY ASSETS & LIABILITIES contd.
Orion New Zealand Ltd
Orion New Zealand Ltd’s bank debt of $70m (2014: $59m) is unsecured against the company. However a deed of negative pledge and guarantee requires the company to comply with certain covenants.
Interest rates for all draw downs on the bank loan facilities are floating, based on bank bill rates plus a margin. As at 31 March 2015 this rate (including margin) averaged 4.24% (2014: 3.62%). The company has entered into derivative contracts to hedge its exposure to bank bill interest rate fluctuations. Daily commitment fees are also payable on the facilities.
Christchurch International Airport Ltd
The company has a $235m (2014: $205m) funding facility with four banks and a subordinated loan of $25m (2014: $50m) from CCHL, to fund the on-going business and future property and commercial development. It also has an overdraft facility of $1m (2014: $1m).
Total bond funding is $125m (2014: $125m). $75m of the bond funding is held at fair value in the balance sheet, as it is subject to a fair value hedge relationship.
All borrowings under the bank facility and overdraft facility are unsecured and supported by a negative pledge deed. Interest rates paid during the year, including offsetting interest rate swaps, ranged from 6.2% to 6.5% (2014: 6.1% to 6.7%). The bond constitutes direct, unsecured, unsubordinated obligations and will rank equally with all other unsecured, unsubordinated indebtedness.
City Care Ltd
Bank loans of $8.6m (2014: $18.7m) are secured by a debenture over the assets and undertakings of the company, and made under a committed cash advance facility of $50m (2013: $50m). The facility is structured as a two year rolling facility with a current maturity date of 28 February 2017. Interest rates on the floating rate debt are based on bank bill rates plus a margin and averaged 4.35% for the year (2014: 3.75%).
Lyttelton Port Company Ltd, Enable Services Ltd, Red Bus Ltd and EcoCentral Ltd
These companies had no external debt as at 30 June 2015 (2014: Nil). Enable Services Ltd and EcoCentral Ltd are party to borrowing arrangements with CCHL as described in Note 26(f).
Accounting policy
Borrowings
Interest-bearing borrowings are recognised initially at fair value less directly attributable transaction costs. Subsequently borrowings are stated at amortised cost with any difference between cost and redemption value being recognised through profit or loss over the period of the borrowings on an effective interest basis.
Borrowings are classified as current liabilities unless the Group has an unconditional right to defer settlement of the liability for at least 12 months after the reporting date.
Borrowing costs directly attributable to the acquisition, construction or production of a qualifying asset (i.e. an asset that necessarily takes a substantial period of time to get ready for its intended use or sale) are capitalised as part of the cost of that asset in accordance with NZ IAS 23 Borrowing costs (revised). All other borrowing costs are expensed in the period they occur. Borrowing costs consist of interest and other costs that an entity incurs in connection with the borrowing of funds.
9. Borrowings & finance costs (contd.)

C H R I S T C H U R C H C I T Y H O L D I N G S L I M I T E D I 2 0 1 5 A N N U A L R E P O R T
59
9(c) Undrawn borrowing facilities
Floating rate – expiring within one year 120,000 40,000 100,000 –
Floating rate – expiring beyond one year 170,400 267,510 – 150,000
Total undrawn borrowing facilities 290,400 307,510 100,000 150,000
9(d) Finance lease liabilities
No later than one year 4,856 3,700 – –
Later than one year and not later than five years 8,455 8,786 – –
Later than five years 25,835 29,934 – –
Minimum lease payments 39,146 42,420 – –
Less future finance charges (23,491) (25,322) – –
Present value of minimum lease payments 15,655 17,098 – – Minimum future lease payments
No later than one year 2,020 1,486 – –
Later than one year and not later than five years 3,633 3,343 – –
Later than five years 10,002 12,269 – –
Total present value of minimum lease payments 15,655 17,098 – –
Represented by
Current portion 2,020 1,486 – –
Non-current portion 13,635 15,612 – –
15,655 17,098 – –
The finance lease liability relates to agreements between Orion and Transpower New Zealand Ltd of between eight and 35 years for Transpower to construct assets at its local grid exit points. Orion does not own the assets at the end of the lease term and there is no residual value or security provided.
Note Group 2015 Group 2014 Parent 2015 Parent 2014 $’000 $’000 $’000 $’000
Accounting policy
Finance lease liabilities
Finance leases, which transfer to the Group substantially all the risks and benefits incidental to ownership of the leased item, are capitalised at the inception of the lease at the fair value of the leased asset or, if lower, at the present value of the minimum lease payments. Lease payments are apportioned between the finance charges and reduction of the lease liability so as to achieve a constant rate of interest on the remaining balance of the liability. Finance charges are recognised as an expense in profit or loss.
Capitalised leased assets are depreciated over the shorter of the estimated useful life of the asset and the lease term if there is no reasonable certainty that the Group will obtain ownership by the end of the lease term.
Borrowings & finance costs (contd.)

C H R I S T C H U R C H C I T Y H O L D I N G S L I M I T E D I 2 0 1 5 A N N U A L R E P O R T
60
▲
▲
▲
9(e) Financing costs
Interest expense
Bank borrowings 16,294 20,253 – 77
Debt instruments 22,855 19,422 15,867 15,559
Related party debt 26(b) 9,656 3,052 9,656 3,052
Finance leases 1,684 1,772 – –
Other interest – 12 – 20
50,489 44,511 25,523 18,708
Interest capitalised
Property, plant & equipment – (799) – –
Note Group 2015 Group 2014 Parent 2015 Parent 2014 $’000 $’000 $’000 $’000
9. Borrowings & finance costs (contd.)
Notes to the financial statements FOR THE YEAR ENDED 30 JUNE 2015
KEY ASSETS & LIABILITIES contd.

C H R I S T C H U R C H C I T Y H O L D I N G S L I M I T E D I 2 0 1 5 A N N U A L R E P O R T
61
▲
▲
▲
▲
▲
▲
▲▲
Profit & Loss Information
Notes to the financial statements FOR THE YEAR ENDED 30 JUNE 2015
Sale of goods 36,512 26,185 – –
Rendering of services 655,408 640,807 184 2
Construction contract revenue 248,416 214,666 – –
Capital contributions 6,467 4,566 – –
Electricity transmission rental rebates 2,908 4,102 – –
Rental income from investment properties 14,985 13,566 – –
Other rental revenue 53,584 57,273 – –
Dividends from subsidiaries 26(b) – – 84,140 48,175
Insurance receipts (i) 29,000 357,732 – –
Gains on disposal of property, plant and equipment 4,892 3,306 – –
Gains on revaluation of investment property 8 18,086 9,223 – –
Ineffectiveness – cash flow hedges 48 51 48 8
Ineffectiveness – fair value hedges 172 414 – 414
Other 7,476 11,780 – 4
1,077,954 1,343,671 84,372 48,603(i) Insurance receipts
The insurance receipts arise from earthquake insurance claims settled by Orion New Zealand Ltd (2014: Lyttelton Port Company Ltd insurance claim settlement).
Note Group 2015 Group 2014 Parent 2015 Parent 2014 $’000 $’000 $’000 $’000
Accounting policy
Revenue
(i) Services rendered and goods sold – Revenue from services rendered is recognised through profit or loss in proportion to the stage of completion of the transaction at the balance sheet date. Revenue from the sale of goods is recognised through profit or loss when the significant risks and rewards of ownership have been transferred to the buyer.
(ii) Construction contracts – soon as the outcome of a construction contract can be estimated reliably, contract revenue and expenses are recognised through profit or loss in proportion to the stage of completion of the contact. The stage of completion is assessed by reference to surveys of work performed. An expected loss on a contract is recognised immediately through profit or loss.
(iii) Earthquake insurance proceeds – Earthquake insurance proceeds are recognised as revenues when they are received or when it is virtually certain that they will be received under the company’s insurance contracts and the amounts can be reliably measured or estimated. If insurance cash receipts relate partially to business interruption and partially to property, plant and equipment, the cash flows are allocated between cash flows from operating activities (for example for the business interruption portion of the claim) and cash flows from investing activities (for example for the property, plant and equipment portion of the claim).
(iv) Rental income – Rental income from investment property is recognised through profit or loss on a straight-line basis over the term of the lease. Contingent rental income is recognised as income in the periods in which it is earned. Lease incentives granted are recognised as an integral part of the total rental income.
(v) Dividend income – Dividend income is recognised when the shareholder’s right to receive payment is established.
10. Operating revenue

C H R I S T C H U R C H C I T Y H O L D I N G S L I M I T E D I 2 0 1 5 A N N U A L R E P O R T
62
Notes to the financial statements FOR THE YEAR ENDED 30 JUNE 2015
PROFIT & LOSS INFORMATION contd.
Personnel costs:
Salaries and wages 255,753 236,679 641 607
Defined contribution plan employer contributions 2,885 2,684 9 9
Defined benefit plan employer contributions 138 127 – –
Other 4,449 3,652 – –
263,225 243,142 650 616
Audit fees 11(b) 907 814 49 48
Consultants and legal fees 10,605 7,075 821 399
Directors’ fees 1,934 1,959 179 246
Donations 201 120 149 82
Net foreign exchange losses/(gains) (361) (152) – –
Provision expenses/(gains) 19(c) (711) 2,084 – –
Minimum lease payments under operating leases 9,104 8,268 58 –
Orion network maintenance and transmission expenses 98,236 89,841 – –
Raw materials and consumables used 57,150 55,592 – –
Repairs and maintenance 5,782 5,175 – –
Service contracts (including sub-contractors) 129,845 137,166 – –
Investment property direct operating expenses 2,420 4,119 – –
Other operating expenses 176,754 189,605 982 1,078
Losses on assets written off 1,000 1,488 – –
Ineffectiveness – cash flow hedges 13 – 13 –
Ineffectiveness – fair value hedges – 2,729 – –
Cash flow hedges – transfer from equity 218 – 218 –
Financial assets fair value change 751 (1,308) – –
757,073 747,717 3,119 2,469
11(a) Key management personnel compensationShort term benefits 658 720 658 720
Other benefits – – – –
658 720 658 720
Note Group 2015 Group 2014 Parent 2015 Parent 2014 $’000 $’000 $’000 $’000
11. Operating expenses

C H R I S T C H U R C H C I T Y H O L D I N G S L I M I T E D I 2 0 1 5 A N N U A L R E P O R T
63
11(b) Remuneration of auditors Audit New Zealand
Audit of the financial statements 711 638 49 48
Special audits required by regulators 89 93 – –
Assurance related 4 3 – –
804 734 49 48
Other auditor – KPMG
Audit of the financial statements 88 64 – –
Other non-audit services 15 16 – –
103 80 – –
Total 11 907 814 49 48
The auditor of Christchurch City Holdings Limited and the rest of the Group, excluding Lyttelton Port Company Ltd, is Audit New Zealand, on behalf of the Auditor-General. The auditor of Lyttelton Port Company Ltd is KPMG, on behalf of the Auditor-General.
Audit New Zealand
Other audit and assurance services principally comprised:
Orion New Zealand Limited
• annual assurance reviews of the company’s annual compliance statement in accordance with the Commerce Commission’s Electricity Distribution Services Default Price-Quality Path Determination 2010 (2015 and 2014)
• assurance reviews of the company’s information disclosures in accordance with the Electricity Distribution Information Disclosure Determination 2012 (2015 and 2014)
Christchurch International Airport Limited
• audit of the company’s disclosures pursuant to the Commerce Act (Specified Airport Services Information Disclosure) Determination 2010
• audit of the bond registry.
KPMG
Other non-audit related services provided to Lyttelton Port Company Limited included an assessment of City Depot revenue processes and controls.
Note Group 2015 Group 2014 Parent 2015 Parent 2014 $’000 $’000 $’000 $’000
11. Operating expenses (contd.)

C H R I S T C H U R C H C I T Y H O L D I N G S L I M I T E D I 2 0 1 5 A N N U A L R E P O R T
64
This note provides an analysis of the group’s income tax expense, shows what amounts are recognised directly in other comprehensive income, and how the tax expense is affected by non-assessable and non-deductible items.
12(a) Components of tax expenseCurrent tax expense/(income) 47,159 45,086 – –
Adjustments to current tax of prior years 1,313 (782) – –
Deferred tax expense/(income) (2,759) 7,900 – –
Impairment of deferred tax asset – (34) – –
Total tax expense/(income) 45,713 52,170 – –
12(b) Reconciliation of prima facie income taxProfit before tax 177,995 454,801 68,815 37,088
Tax at statutory rate of 28% 49,839 127,343 19,268 10,385
Non-deductible expenses 4,151 1,630 – –
Non-assessable income and deductible items (7,100) (80,194) (23,026) (10,743)
Deferred tax adjustment on buildings – 2,336 – –
Other (1,859) 1,152 – –
Tax loss not recognised as deferred tax asset – – 3,758 358
(Over)/under provision of income tax in previous year 682 (97) – –
Total tax expense/(income) 45,713 52,170 – –
The tax rate used in the above reconciliation is the corporate tax rate of 28% (2014: 28%) payable by New Zealand companies on taxable profits under New Zealand tax law.
Last year’s parent company losses brought forward of $10.4m were utilised within the Christchurch City Council group in the period. The current year’s tax loss of $13.4m (2014: $1.3m) will be transferred to other entities within the Christchurch City Council group and the group tax payable balance has been reduced accordingly.
12(c) Unrecognised tax losses
Tax losses 60 60 13,421 11,661
Tax effect 17 17 3,758 3,265
12(d) Imputation creditThe amount of imputation credits available for use in subsequent reporting periods by:
• the CCHL parent company is $24,201,000 (2014: $12,374,000).
• the CCHL Group is $61,432,000 (2014: $49,819,000).
No adjustments have been made for credits/debits associated with tax payable/receivable due to uncertainty regarding the utilisation of group losses.
Notes to the financial statements FOR THE YEAR ENDED 30 JUNE 2015
PROFIT & LOSS INFORMATION contd.
Note Group 2015 Group 2014 Parent 2015 Parent 2014 $’000 $’000 $’000 $’000
12. Income taxes

C H R I S T C H U R C H C I T Y H O L D I N G S L I M I T E D I 2 0 1 5 A N N U A L R E P O R T
65
12(e) Deferred tax balances: Deferred tax liabilities:
Cash flow hedges – – – – – – – –
Fair value hedges 56 367 669 1,092 (210) 82 – 964
Property, plant & equipment 266,597 18,009 44,001 328,607 (6,203) 33 – 322,437
Intangible assets 602 367 – 969 (482) – – 487
Insurance claim receivable 7,288 (7,288) – – – – – –
Other 10,004 18 – 10,022 8,721 – – 18,743
284,547 11,473 44,670 340,690 1,826 115 – 342,631
Deferred tax assets:
Cash flow hedges 5,863 (1) (3,932) 1,930 (81) 6,076 – 7,925
Fair value hedges – – – – – – – –
Provisions/employee entitlements 5,351 555 – 5,906 1,292 – – 7,198
Doubtful debts/impairment losses 175 (89) – 86 9 – – 95
Tax losses 51 785 – 836 2,450 – (705) 2,581
Other 381 26 – 407 915 – – 1,322
11,821 1,276 (3,932) 9,165 4,585 6,076 (705) 19,121
Net deferred tax
liability/(asset) 272,726 10,197 48,602 331,525 (2,759) (5,961) 705 323,510
Parent company
A deferred tax asset has not been recognised in the parent company for temporary differences of $10.97m (tax effect $3.07m) (2014: temporary differences of $0.12m (tax effect $0.03m)). These temporary differences have been recognised in the Group.
A deferred tax liability has not been recognised on taxable temporary differences relating to undistributed profits of subsidiaries and associates.
30 June 2014 30 June 2015 Other Other Opening comprehen. Closing comprehen. Subvention Closing balance Profit/loss income balance Profit/loss income receipt balance
Group $’000 $’000 $’000 $’000 $’000 $’000 $’000 $’000
12. Income taxes (contd.)
Accounting policy
Income tax
Income tax on the profit or loss for the year comprises current and deferred tax.
Current tax assets and liabilities are based on the current period’s taxable income, plus adjustments to income tax payable for prior periods. Current tax is calculated rates and laws that are enacted or substantively enacted by balance date.
Deferred tax is provided using the balance sheet liability method, providing for temporary differences between the carrying amounts of assets and liabilities for financial reporting purposes and the amounts used for taxation purposes. Differences relating to investments in subsidiaries are not recognised to the extent that they will probably not reverse in the foreseeable future.
Deferred tax is calculated at tax rates that are expected to apply in the period when the liability is settled or the asset is realised, using tax rates enacted or substantively enacted at the balance sheet date.
A deferred tax asset is recognised only to the extent that it is probable that future taxable profits will be available against which the asset can be utilised. Unrecognised deferred income tax assets are reassessed at each reporting date and are recognised to the extent that it has become probable that future taxable profit will allow the deferred tax asset to be recovered.

C H R I S T C H U R C H C I T Y H O L D I N G S L I M I T E D I 2 0 1 5 A N N U A L R E P O R T
66
▲
▲
▲
Notes to the financial statements FOR THE YEAR ENDED 30 JUNE 2015
PROFIT & LOSS INFORMATION contd.
Interest income
Bank deposits 13,453 5,680 515 283
Related party loans 2,260 1,590 11,680 8,792
Finance lease – 1 – –
Other 1,416 888 901 587
17,129 8,159 13,096 9,662
Note Group 2015 Group 2014 Parent 2015 Parent 2014 $’000 $’000 $’000 $’000
13. Finance income
Accounting policy
Finance income
Interest revenue comprises interest receivable on funds invested and on loans advanced. Interest revenue is recognised through profit or loss as it accrues, using the effective interest method.

C H R I S T C H U R C H C I T Y H O L D I N G S L I M I T E D I 2 0 1 5 A N N U A L R E P O R T
67
▲
▲
▲
▲
▲
▲
▲▲
Other Assets & Liabilities
Notes to the financial statements FOR THE YEAR ENDED 30 JUNE 2015
14(a) Current portionLoans to group entities 26(f) 14,487 – 18,487 25,000
Other loans and investments 136 66 – –
Interest rate swaps – 105 – –
Forward foreign exchange contracts 96 108 – –
Term deposits 93,441 93,635 – –
Other 2,897 3,542 – –
Total current other financial assets 111,057 97,456 18,487 25,000
14(b) Non-current portionLoans to group entities 14(c),26(f) 28,077 30,928 189,500 146,487
Other loans and investments 14(c) 30,959 24,862 25,719 19,401
Term deposits 40,000 – – –
Interest rate swaps 1,568 4,197 1,568 3,949
Total non-current other financial assets 100,604 59,987 216,787 169,837
Total other financial assets (current & non-current) 211,661 157,443 235,274 194,837
14(c) Other loans and investments
Loans to Enable Networks Ltd
Enable Services Ltd has advanced $28.1m to associated company Enable Networks Ltd in the form of Senior Notes (2014: $16.4m). These mature in 2021 or beyond. The average interest rate is 6.6% (2014: 6.0%).
Loan to Christchurch Engine Centre
On 29 June 2012, CCHL entered into a loan agreement with Christchurch Engine Centre to advance up to US$17m, effectively replacing the Council’s previous combined equity/debt investment in Jet Engine Facility Ltd. CCHL has entered into a cross currency interest rate swap to achieve a fixed interest rate on the US$ loan (Note 20).
Group 2015 Group 2014 Parent 2015 Parent 2014 Note $’000 $’000 $’000 $’000
14. Loans and other financial assets

C H R I S T C H U R C H C I T Y H O L D I N G S L I M I T E D I 2 0 1 5 A N N U A L R E P O R T
68
Notes to the financial statements FOR THE YEAR ENDED 30 JUNE 2015
OTHER ASSETS & LIABILITIES contd.
15. Debtors, inventory and other assets
Current Non-current Total Current Non-current Total 2015 2015 2015 2014 2014 2014 Note $’000 $’000 $’000 $’000 $’000 $’000
15(a) Group
Trade receivables 15(c) 113,893 – 113,893 63,981 – 63,981
Provision for impairment 15(c) (364) – (364) (369) – (369)
Chargeable work in progress 15(e) 72,583 – 72,583 72,929 – 72,929
Inventory – raw materials and maintenance items 15(f) 15,742 – 15,742 15,009 – 15,009
Inventory – work in progress – 879 879 – 575 575
Inventory – finished goods 15(f) 4,124 – 4,124 3,850 – 3,850
Inventory – allowance for impairment (459) – (459) (46) – (46)
Prepayments 7,971 7,429 15,400 8,108 10,659 18,767
Interest receivable 3,289 – 3,289 173 – 173
Non-current assets held for sale – – – 366 – 366
Construction contract receivables 1,596 3,854 5,450 1,425 2,989 4,414
Contract retentions 4,416 – 4,416 3,489 – 3,489
Other 4,099 – 4,099 2,389 4 2,393
226,890 12,162 239,052 171,304 14,227 185,531
15(b) Parent
Related party receivables 1,868 – 1,868 1,547 – 1,547
Prepayments 453 – 453 153 – 153
Other 243 – 243 216 4 220
2,564 – 2,564 1,916 4 1,920
Included in trade receivables are amounts due from the ultimate shareholder, Christchurch City Council, and from subsidiaries, as disclosed in Note 26.

C H R I S T C H U R C H C I T Y H O L D I N G S L I M I T E D I 2 0 1 5 A N N U A L R E P O R T
69
15(c) ParentGross receivables
Not past due 104,067 54,503 243 8
Past due 0-30 days 7,976 6,052 – –
Past due 31-60 days 728 2,068 – –
Past due more than 60 days 1,122 1,358 – –
15(a) 113,893 63,981 243 8
Impairment
Not past due – – – –
Past due 0-30 days – – – –
Past due 31-60 days – – – –
Past due more than 60 days (364) (369) – –
(364) (369) – –
Gross trade receivables 113,893 63,981 243 8
Individual impairment 15(d) (364) (369) – –
Collective impairment – – – –
Trade receivables (net) 113,529 63,612 243 8
15(d) Movements in provision for impairment of receivables
Balance at start of year 369 410 – –
Provisions made during year 167 58 – –
Provisions reversed during year (27) (78) – –
Receivables written off during year (145) (21) – –
Balance at end of year 15(c) 364 369 – –
15(e) Construction contractsConstruction contract work in progress is primarily held by Enable Services Ltd and City Care Ltd. It is determined on a percentage of completion basis.
For contracts in progress at balance date:
Contract costs incurred 483,450 323,382 – –
Progress billings 388,954 257,334 – –
Gross amounts due from customers 16,778 12,221 – –
Gross amounts due to customers 64 – – –
Retentions included in progress billings – 3,339 – –
15(f ) InventoryCertain inventories are subject to security interests created by retention of title clauses.
Group 2015 Group 2014 Parent 2015 Parent 2014 Note $’000 $’000 $’000 $’000
15. Debtors, inventory and other assets (contd.)

C H R I S T C H U R C H C I T Y H O L D I N G S L I M I T E D I 2 0 1 5 A N N U A L R E P O R T
70
Cash and cash equivalents denominated in:
New Zealand dollars 89,688 220,531 6,877 2,341
Foreign currency 123 1,390 – –
89,811 221,921 6,877 2,341
Cash at bank earns interest at floating rates based on daily bank deposit rates. Short term deposits are made for periods of between one day and three months, and earn interest at the respective short term deposit rates.
Notes to the financial statements FOR THE YEAR ENDED 30 JUNE 2015
OTHER ASSETS & LIABILITIES contd.
Accounting policy
Debtors and other receivablesTrade and other receivables are initially measured at fair value and subsequently measured at amortised cost using the effective interest method, less any provision for impairment.
Collectability of trade receivables is reviewed on an ongoing basis. Individual debts that are known to be uncollectible are written off when identified. An impairment provision is recognised when there is objective evidence that the Group will not be able to collect the receivable.
Construction work in progressConstruction work in progress is stated at cost plus profit recognised to date (see Revenue policy) less a provision for foreseeable losses and less progress billings. Cost includes all expenditure related directly to specific projects and an allocation of fixed and variable overheads incurred in the Group’s contract activities based on normal operating capacity.
PrepaymentsA prepayment is recognised where expenditure is incurred in the period and where the benefit of that expenditure will be recognised in future periods.
InventoriesInventories are stated at the lower of cost and net realisable value. Net realisable value is the estimated selling price in the ordinary course of business, less the estimated costs of completion and selling expenses. Cost is based on the first-in first-out principle and includes expenditure incurred in acquiring the inventories and bringing them to their existing location and condition.
Group 2015 Group 2014 Parent 2015 Parent 2014 Note $’000 $’000 $’000 $’000
16. Cash and cash equivalents
Accounting policy
Cash and cash equivalents
Cash and cash equivalents comprise cash balances and call deposits, and other short-term highly liquid investments with maturities of three months or less, and which are subject to an insignificant risk of changes in value.
15. Debtors, inventory and other assets (contd.)

C H R I S T C H U R C H C I T Y H O L D I N G S L I M I T E D I 2 0 1 5 A N N U A L R E P O R T
71
Easements & Software Goodwill consents and other Total $’000 $’000 $’000 $’000
17(a) Group
Gross carrying amount
Gross carrying amount at 1 July 2013 44,975 2,020 36,231 83,226
Additions – 621 4,746 5,367
Additions from internal developments – – 335 335
Disposals – – (120) (120)
Gross carrying amount at 30 June 2014 44,975 2,641 41,192 88,808
Additions 553 6,774 4,804 12,131
Additions from internal developments – – 308 308
Disposals – – (1,343) (1,343)
Gross carrying amount at 30 June 2015 45,528 9,415 44,961 99,904
Accumulated amortisation and impairment
Accumulated balance at 1 July 2013 (5,823) (923) (23,089) (29,835)
Amortisation expense – (44) (4,267) (4,311)
Disposals – – 120 120
Accumulated balance at 30 June 2014 (5,823) (967) (27,236) (34,026)
Amortisation expense – (58) (4,142) (4,200)
Impairment – – (3,474) (3,474)
Disposals – – 1,344 1,344
Accumulated balance at 30 June 2015 (5,823) (1,025) (33,508) (40,356)
Carrying amount
Carrying amount at 30 June 2014 39,152 1,674 13,956 54,782
Carrying amount at 30 June 2015 39,705 8,390 11,453 59,548
Included in intangible assets is work in progress of $1.3m (2014: $3.5m).
During the year, as the result of a contract dispute referred to in Note 22(b), Enable Services Ltd carried out a review of the recoverable amount of its intangible assets. The review led to the recognition of an impairment loss of $3.5m (2014: Nil) which has been recognised in the profit or loss.
The parent company has no intangible assets.
17. Intangible assets

C H R I S T C H U R C H C I T Y H O L D I N G S L I M I T E D I 2 0 1 5 A N N U A L R E P O R T
72
Notes to the financial statements FOR THE YEAR ENDED 30 JUNE 2015
Trade payables and accrued expenses 98,700 82,200 245 207
GST payable 6,036 4,248 14 –
Interest payable 3,688 3,143 3,140 2,180
Retentions 2,622 2,048 – –
Deposits held 169 164 – –
111,215 91,803 3,399 2,387
The carrying value of creditors and other payables approximates their fair value.
OTHER ASSETS & LIABILITIES contd.
Group 2015 Group 2014 Parent 2015 Parent 2014 Note $’000 $’000 $’000 $’000
18. Creditors and other payables
Accounting policy
Creditors and other payables
Trade and other payables are initially measured at fair value and subsequently measured at amortised cost using the effective interest method. They represent liabilities for goods and services provided to the Group prior to the end of the financial year that are unpaid. The amounts are usually paid within 30 days of recognition.
19(a) Group
Employee entitlements:
Accrued pay 6,184 – 6,184 4,979 – 4,979
Annual leave 19,414 – 19,414 18,606 – 18,606
Sick leave 195 – 195 193 – 193
Retirement and long service leave 1,848 1,714 3,562 1,261 1,420 2,681
Bonuses and other 3,888 478 4,366 3,266 462 3,728
31,529 2,192 33,721 28,305 1,882 30,187
SCIRT contract wash up and other provisions 1,198 – 1,198 884 1,200 2,084
Interest rate swaps 743 25,988 26,731 1,336 10,645 11,981
Deferred income 980 1,036 2,016 1,048 1,903 2,951
Income in advance 1,595 1,187 2,782 579 1,288 1,867
36,045 30,403 66,448 32,152 16,918 49,070
Current Non-current Total Current Non-current Total 2015 2015 2015 2014 2014 2014 $’000 $’000 $’000 $’000 $’000 $’000
19(b) Parent
Annual leave 59 – 59 46 – 46
Interest rate swaps 16 12,479 12,495 113 4,024 4,137
75 12,479 12,554 159 4,024 4,183
19. Provisions and other liabilities

C H R I S T C H U R C H C I T Y H O L D I N G S L I M I T E D I 2 0 1 5 A N N U A L R E P O R T
73
19(c) Movements in provisions
Opening balance 2,084 – – –
Additional provisions made 11 298 2,084 – –
Amounts used (175) – – –
Unused amounts reversed (1,009) – – –
Closing balance 1,198 2,084 – –
City Care Ltd is party to the SCIRT alliance agreement. The agreement contains provision for sharing contract gains and/or losses against budget on conclusion of the agreement, expected to conclude in 2016. In addition the life to date revenue earned from the SCIRT alliance is subject to audit by the SCIRT auditors. At balance date, the alliance contract position reflected a net gain (2014: net loss), and the City Care Ltd board has determined that to the extent of this gain, the provision is no longer required and hence has been released. The remaining provision relates to revenue still subject to ongoing audit by the SCIRT auditors.
Group 2015 Group 2014 Parent 2015 Parent 2014 Note $’000 $’000 $’000 $’000
Accounting policy
Provisions
A provision is recognised in the balance sheet when the Group has a present obligation as a result of a past event, and it is probable that an outflow of economic benefits, the amount of which can be reliably estimated, will be required to settle the obligation. If the effect is material, provisions are determined by discounting the expected future cash flows at an appropriate pre-tax rate.
Employee entitlements
Liabilities for annual leave and time off in lieu are accrued at the full amount owing at the pay period ending immediately prior to the balance sheet date.
Provisions in respect of employee benefits that are not expected be settled within 12 months, such as long service leave, are measured as the present value of the estimated future cash flows to be made by the Group in respect of services provided by employees up to reporting date taking into account years of service, years to entitlement and the likelihood of staff reaching the point of entitlement.
19. Provisions and other liabilities (contd.)

C H R I S T C H U R C H C I T Y H O L D I N G S L I M I T E D I 2 0 1 5 A N N U A L R E P O R T
74
▲
▲
▲
▲
▲▲
Areas of Judgement & Financial Risk
Notes to the financial statements FOR THE YEAR ENDED 30 JUNE 2015
20. Areas of judgement and financial risk
20(a) Critical judgements, estimates and assumptionsIn preparing the financial statements, management has made estimates and assumptions about the future that affect the reported amounts of assets and liabilities at balance date, and the reported amounts of revenue and expenses during the period. Actual results could differ from those estimates.
In applying the Group’s accounting policies, management has made the following judgements, estimates and assumptions that have had the most significant impact on the amounts recognised in these financial statements:
Parent
Valuation of investments in subsidiaries (Note 2)
CCHL values its investments in subsidiary companies at fair value. This has a material impact on the amounts recognised in these financial statements and involves a significant amount of judgement. Independent valuers are commissioned to perform these valuations on a periodic basis, at intervals sufficient to ensure that the fair value of these investments does not differ materially from their carrying value. In intervening years, valuations are reviewed to determine whether there are any factors present that would indicate the possibility of a significant value change. If such factors are present, a full valuation is performed and reflected in the financial statements.
Group
Valuation of property, plant and equipment (Note 7)
Management of most of the subsidiary companies use independent valuers to determine the fair value of certain assets. The valuation process requires the use of assumptions and estimates which are based on market conditions at the time. Any changes in market conditions subsequent to balance date will impact future valuations. A movement in the fair value of an asset is subsequently recorded within profit or loss or other comprehensive income, depending on the asset classification.
In addition to the above factors, the following areas requiring critical judgements, estimates and assumptions that are specific to individual companies within the Group are as follows:
Classification of investment property (Note 8)
The identification by Christchurch International Airport Ltd of which components of property, plant & equipment are to be reclassified to investment property involves the use of judgement. A key factor for this classification is whether the property is used for aircraft-related activities. The classification has implications as to whether revaluation gains and losses are recognised through profit or loss or through other comprehensive income.
Lyttelton Port Company Ltd carrying values and other (Note 7)
Lyttelton Port Company Ltd has identified areas of estimation uncertainty in relation to the carrying value of land, building and harbour structures; and the possible impairment of assets.
Enable Services Ltd asset impairment (Note 5)
Enable Services Ltd’s investment in Enable Networks Ltd (ENL) represents an investment in a start-up infrastructure company. The investment is recognised as an investment in an associate and as such is not revalued in the financial statements. The company is required to assess the value of the investment for impairment. Assessment of the value of ENL requires significant assumptions including levels of uptake, average rates of sales, operating cost levels, depreciation rates and financing costs.
Enable Services Ltd recovery of initial costs
Enable Services Ltd is contracted to build the UFB network for ENL over a build programme concluding by December 2019. A project of this nature has a number of up-front costs, including initial design, resourcing of staff, and investment in total project infrastructure. These costs are required to be recovered throughout the build programme. The company has exercised its judgement as to whether these costs will be recoverable through the life of the project.
Risk management
The group’s exposure to, and management of risks, is described in the following notes.

C H R I S T C H U R C H C I T Y H O L D I N G S L I M I T E D I 2 0 1 5 A N N U A L R E P O R T
75
20. Areas of judgement and financial risk (contd.)
20(b) Credit riskCredit risk refers to the risk that a counterparty will default on its contractual obligations resulting in financial loss to the Group. Financial instruments that potentially subject the Group to concentrations of credit risk are summarised below. The Group places its cash and short-term investments with high credit quality financial institutions and limits the amount of credit exposure to any one financial institution in accordance with the treasury policies of the respective companies. The Group does not hold any credit derivatives to offset its credit exposure.
Group 2015 Group 2014 Parent 2015 Parent 2014 $’000 $’000 $’000 $’000
Exposure to credit risk Cash and deposits 223,252 315,556 6,877 2,341 Debtors and other receivables 203,366 146,947 2,111 1,763 Loans 73,659 55,841 233,706 190,888 Derivative financial instrument assets 1,664 4,410 1,568 3,949
501,941 522,754 244,262 198,941
Counterparty credit ratings RatingCash and deposits AA 203,252 275,556 6,877 2,341 A 20,000 40,000 – –
223,252 315,556 6,877 2,341
Loans A 14,487 14,487 14,487 14,487 BBB – – 25,000 50,000 Lower than BBB or unrated 59,172 41,354 194,219 126,401
73,659 55,841 233,706 190,888
Derivative financial instrument assets AA 1,568 4,410 1,568 3,949
Trade receivables
Orion New Zealand Ltd has a concentration of credit risk with regard to its trade receivables, as it only has a small number of electricity retailer customers. Christchurch International Airport Ltd also has a concentration of credit risk on a small number of customers, with 86% (2014: 79%) of trade receivables due from 10 customers. Lyttelton Port Company Ltd’s exposure to credit risk is reflective of its customer base and hence is concentrated to the default risk of its customers’ industries. No more than 15% of its operating revenue results from transactions from any one customer. City Care Ltd also has a concentration of credit risk in respect of its transactions with Christchurch City Council with a 26% of its revenue derived from this source. Red Bus Ltd has a concentration of credit risk with Environment Canterbury, which provides 84% (2014: 85%) of the company’s revenue.
Notwithstanding some concentration of credit risk at subsidiary level, all of these major customers are considered to be of high credit quality, and on a Group-wide basis, it is not considered that there is a significant risk of losses arising. Geographically there is no significant credit risk concentration for the Group outside New Zealand
The Group manages its exposure to credit risk arising from trade receivables by performing credit evaluations on all significant customers, wherever practicable, and continuously monitors the outstanding credit exposure to individual customers. The Group does not generally require collateral security from its customers.
20(c) Liquidity riskLiquidity risk is the risk that the Group will encounter difficulty raising liquid funds to meet commitments as they fall due. Prudent liquidity risk management implies maintaining sufficient cash, the availability of funding through an adequate amount of committed credit facilities and the ability to close out market positions.
In meeting its liquidity requirements, CCHL manages its investments and borrowings in accordance with its written treasury policies, which include restrictions on the amount of debt maturing in any 12 month period and require sufficient approved financing facilities to cover a specified percentage over the anticipated peak debt over a rolling 12 month period. In general the Group generates sufficient cash flows from its operating activities to meet its obligations arising from its financial liabilities and has funding arrangements in place to cover potential shortfalls.
The Group’s and parent company’s exposure to liquidity risk based on undiscounted contractual cash flows is as follows:

C H R I S T C H U R C H C I T Y H O L D I N G S L I M I T E D I 2 0 1 5 A N N U A L R E P O R T
76
20(c) Liquidity risk (contd.) Balance Contractual Less than sheet cash flows 1 year 1-2 years 2-5 years 5 years + $’000 $’000 $’000 $’000 $’000 $’000
Group – 30 June 2015
Cash, cash equivalents and deposits 223,252 223,252 223,252 – – –
Debtors and other receivables 203,366 203,366 203,366 – – –
Loans and advances 73,659 100,197 18,400 2,949 17,863 60,985
Other assets 2,893 2,893 2,893 – – –
Creditors and other payables (111,215) (111,215) (111,215) – – –
Derivative financial instruments (25,067) (26,446) (6,072) (9,717) (7,867) (2,790)
Borrowings – external (628,878) (709,174) (215,549) (169,878) (269,059) (54,688)
Borrowings – related parties (208,000) (280,218) (10,424) (10,395) (53,696) (205,703)
Finance lease liabilities (15,655) (39,146) (4,856) (2,246) (6,209) (25,835)
(485,645) (636,491) 99,795 (189,287) (318,968) (228,031)
Group – 30 June 2014
Cash, cash equivalents and deposits 315,556 315,556 315,556 – – –
Debtors and other receivables 146,947 115,181 115,181 – – –
Loans and advances 55,841 80,878 3,260 17,880 15,861 43,877
Other assets 3,542 3,542 3,542 – – –
Creditors and other payables (91,803) (91,803) (91,803) – – –
Derivative financial instruments (7,571) (1,096) (4,879) (3,363) 1,644 5,502
Borrowings – external (610,267) (719,075) (107,290) (293,168) (153,081) (165,536)
Borrowings – related parties (101,500) (145,134) (5,531) (5,775) (17,317) (116,511)
Finance lease liabilities (17,098) (42,420) (3,700) (2,357) (6,429) (29,934)
(306,353) (484,371) 224,336 (286,783) (159,322) (262,602)
Parent – 30 June 2015
Cash, cash equivalents and deposits 6,877 6,877 6,877 – – –
Debtors and other receivables 2,111 2,111 2,111 – – –
Loans and advances – other 40,206 52,073 16,288 837 7,310 27,638
Loans and advances – subsidiaries 193,500 257,771 13,237 33,260 23,899 187,375
Creditors and other payables (3,399) (3,399) (3,399) – – –
Derivative financial instruments (10,927) (11,693) (1,992) (2,638) (4,254) (2,809)
Borrowings – external (280,000) (301,564) (174,961) (29,079) (97,524) –
Borrowings – related parties (208,000) (280,218) (10,424) (10,395) (53,696) (205,703)
(259,632) (278,042) (152,263) (8,015) (124,265) 6,501
Parent – 30 June 2014
Cash, cash equivalents and deposits 2,341 2,341 2,341 – – –
Debtors and other receivables 1,763 1,763 1,763 – – –
Loans and advances – other 33,888 49,856 1,835 16,455 6,911 24,655
Loans and advances – subsidiaries 157,000 239,803 36,168 17,791 51,815 134,029
Creditors and other payables (2,387) (2,387) (2,387) – – –
Derivative financial instruments (188) 7,838 (575) 173 3,959 4,281
Borrowings – external (283,000) (322,585) (91,445) (111,749) (88,599) (30,792)
Borrowings – related parties (101,500) (145,134) (5,531) (5,775) (17,317) (116,511)
(192,083) (168,505) (57,831) (83,105) (43,231) 15,662
Notes to the financial statements FOR THE YEAR ENDED 30 JUNE 2015
AREAS OF JUDGEMENT & FINANCIAL RISK contd.

C H R I S T C H U R C H C I T Y H O L D I N G S L I M I T E D I 2 0 1 5 A N N U A L R E P O R T
77
20(d) Interest rate riskThe Group and parent company are exposed to interest rate risk as they borrow funds at both fixed and floating interest rates. The risk is managed by maintaining an appropriate mix between fixed and floating rate borrowings, by the use of interest rate swaps, options and forward interest rate contracts (Note 20(f)).
At balance date the Group and parent company had a mix of financial assets and liabilities exposed to the re-pricing of interest rates as set out in the following tables. To the extent assets and liabilities exposed to variable interest rate risk are hedged, they are classified as fixed.
20. Areas of judgement and financial risk (contd.)
Carrying Re-prices value < 1 yr 1-2 yrs 2-5 yrs > 5 yrs $’000 $’000 $’000 $’000 $’000
Group – Interest rate re-pricing analysis
30 June 2015
Cash and deposits 223,527 183,527 40,000 – –
Loans and advances 73,659 21,940 – – 51,719
Borrowings (852,533) (464,255) (45,000) (149,499) (193,779)
(555,347) (258,788) (5,000) (149,499) (142,060)
30 June 2014
Cash and deposits 315,664 315,664 – – –
Loans and advances 55,841 10,690 14,250 – 30,901
Borrowings (728,865) (312,178) (152,410) (50,000) (214,277)
(357,360) 14,176 (138,160) (50,000) (183,376)
Parent – Interest rate re-pricing analysis
30 June 2015
Cash and deposits 6,877 6,877 – – –
Loans and advances 233,706 43,987 15,000 24,000 150,719
Borrowings (488,000) (294,000) – (50,000) (144,000)
(247,417) (243,136) 15,000 (26,000) 6,719
30 June 2014
Cash and deposits 2,341 2,341 – – –
Loans and advances 190,888 83,237 14,250 – 93,401
Borrowings (384,500) (140,000) (100,000) (50,000) (94,500)
(191,271) (54,422) (85,750) (50,000) (1,099)

C H R I S T C H U R C H C I T Y H O L D I N G S L I M I T E D I 2 0 1 5 A N N U A L R E P O R T
78
20(f ) Interest rate hedging activityThe Group uses interest rate swaps in the normal course of business to reduce its exposure to fluctuations in interest rates. The notional principal values and fair values of swaps held at balance date are summarised in the following table:
Group Parent
2015 2014 2015 2014 2015 2014 2015 2014
Notional principal Fair value Notional principal Fair value $’000 $’000 $’000 $’000 $’000 $’000 $’000 $’000
Floating for fixed contracts
Less than 1 year 100,000 100,000 (743) (1,035) 30,000 30,000 (16) (113)
1 to 2 years 182,000 160,000 (3,441) (409) 17,000 30,000 (142) (197)
2 to 5 years 314,000 259,000 (15,873) (7,329) 124,000 100,000 (7,467) (3,693)
More than 5 years 319,000 165,000 (1,594) 3,887 176,000 75,000 (39) 1,551
915,000 684,000 (21,651) (4,886) 347,000 235,000 (7,664) (2,452)
Fixed for floating contracts
Less than 1 year – – – (196) – – – –
2 to 5 years 75,000 – (249) – – – – –
More than 5 years 21,725 96,725 (3,263) (2,597) 21,725 21,725 (3,263) 2,264
96,725 96,725 (3,512) (2,793) 21,725 21,725 (3,263) 2,264)
20(g) Foreign exchange riskForeign currency risk is the risk that the value of the Group’s assets and liabilities or revenues and expenses will fluctuate due to changes in foreign exchange rates. The Group is exposed to foreign currency risk as a result of transactions that are denominated in a foreign currency - primarily Australian dollars, US dollars and Euros. The Group’s policy is to hedge any material foreign currency exposure, usually with forward exchange contracts.
The parent company is party to a US$17m loan agreement with Christchurch Engine Centre. The loan agreement is fully hedged with a cross currency interest rate swap, and CCHL has no exposure to foreign exchange fluctuations (2014: Nil).
The Group has assessed that a reasonably possible change in foreign exchange rates (a 10% variance either way) would not have a significant impact on profit or equity.
20(e) Interest rate sensitivityIn managing interest rate risks, the Group aims to reduce the impact of short term fluctuations on earnings. Over the longer term, however, changes in interest rates will affect reported profits. The following table summarises the estimated impact of a 1% movement in interest rates on the Group’s and parent company’s pre-tax profit and equity (excluding retained earnings), taking into account the effect of interest rate swaps.
Group Parent
2015 2014 2015 2014
Profit/ Profit/ Profit/ Profit/ loss Equity loss Equity loss Equity loss Equity $’000 $’000 $’000 $’000 $’000 $’000 $’000 $’000
100 basis point increase 1,530 9,641 (1,162) 6,712 (1,669) 9,641 119 5,398
100 basis point decrease (1,558) (10,638) 1,198 (7,164) 1,678 (10,638) (83) (5,847)
Notes to the financial statements FOR THE YEAR ENDED 30 JUNE 2015
AREAS OF JUDGEMENT & FINANCIAL RISK contd.

C H R I S T C H U R C H C I T Y H O L D I N G S L I M I T E D I 2 0 1 5 A N N U A L R E P O R T
79
Accounting policy
Derivative financial instrumentsThe Group uses derivative financial instruments to hedge its risks associated with interest rate and foreign exchange fluctuations, and does not hold or issue them for trading purposes. However, derivatives that do not qualify for hedge accounting are accounted for as trading instruments.
Derivative financial instruments are recognised initially and subsequently at fair value. Fair value is the estimated amount that the Group would receive or pay to terminate the swap at the balance sheet date, taking into account current interest rates and the current creditworthiness of the swap counterparties. The fair value of forward exchange contracts is their quoted market price at the balance sheet date, being the present value of the quoted forward price.
HedgingThe method of recognising movements in the fair value of derivatives depends on whether the derivative is designated as a hedging instrument, and if so, the nature of the item being hedged. The Group designates certain derivatives as either; fair value hedges (hedges of the fair value of recognised assets or liabilities or a firm commitment); or cash flow hedges (hedges of highly probable forecast transactions).
Fair value hedge
Changes in the fair value of derivatives that are designated and qualify as fair value hedges are recorded in the surplus or deficit together with any changes in the fair value of the hedged asset or liability.
Cash flow hedge
Changes in the fair value of derivatives that are designated and qualify as cash flow hedges are recorded in other comprehensive revenue and expense in the hedging reserve. When the derivative is no longer on effective hedge or is sold or cancelled the cumulative gain or loss recognised to date on the derivative is recognised in profit or loss.
When a forecast transaction is no longer expected to occur, the cumulative gain or loss that was reported in equity is immediately transferred to the surplus or deficit.
Derivatives that do not qualify for hedge accounting
Certain derivative instruments do not qualify for hedge accounting. Changes in the fair value of any derivative instrument that does not qualify for hedge accounting are recognised immediately through profit or loss.
Foreign currencyTransactions in foreign currencies are translated at the foreign exchange rate ruling on the day of the transaction.
Foreign currency monetary assets and liabilities at the balance date are translated to NZ dollars at the rate ruling at that date. Foreign exchange differences arising on translation are recognised through profit or loss, except when deferred in equity as qualifying cash flow hedges.
Non-monetary assets and liabilities that are measured in terms of historical cost in a foreign currency are translated using the exchange rate at the date of the transaction. Those that are stated at fair value are translated to NZ dollars at rates ruling at the dates the fair value was determined.
20(h) Commodity price and demand risk
EcoCentral Ltd’s operations can be significantly impacted by fluctuations in commodity prices and international demand for certain of its products. This risk is mitigated to an extent by tendering and entering into supply contracts. Any residual risk is not considered material to the Group.
20. Areas of judgement and financial risk (contd.)

C H R I S T C H U R C H C I T Y H O L D I N G S L I M I T E D I 2 0 1 5 A N N U A L R E P O R T
80
▲
▲
▲
▲
▲▲
Unrecognised Items
Notes to the financial statements FOR THE YEAR ENDED 30 JUNE 2015
21(a) Capital commitments
Ultra fast broadband network (i) 247,000 286,000 – – Property, plant & equipment 30,254 71,542 – – Electricity distribution network 26,047 10,939 – – Intangible assets _ 1,882 – –
303,301 370,363 – –
21(b) Non-cancellable operating leases as lessee
No later than one year 7,727 7,851 61 61 Later than one year and not later than five years 16,123 13,758 181 242 Later than five years 12,506 3,870 – –
36,356 25,479 242 303
Non-cancellable operating leases as lessor No later than one year 54,581 56,223 – – Later than one year and not later than five years 162,805 171,340 – – Later than five years 149,742 132,665 – –
367,128 360,228 – –
Capital commitments
(i) Ultra fast broadband network
Enable Services Ltd (ESL) has entered into agreements to build, operate and maintain a UFB network on behalf of Enable Networks Ltd, with completion by December 2019.
As at 30 June 2015 the estimated cost of the UFB network including connections, central office construction and other components of the network to December 2021 is $428m (2014: $403m). The total remaining after cash payments at balance date was $247m (2014: $286m) expected cost.
The CCHL parent company has committed the necessary funding to ESL to meet the costs of building the network prior to sale to Enable Networks Ltd, and its share of the funding obligations to Enable Networks Ltd.
Operating lease payables
The CCHL parent company entered into a lease in May 2014 to lease office premises at 77 Hereford Street, Christchurch for a minimum five year period.
Operating lease receivables
Of the total lease receivables of $367m, $324m (88%) are attributable to Christchurch International Airport Ltd (2014: $306m). The company has a number of property leases that generate rental income. The leases are for terms between 1 month and 38 years, and the majority of the lease agreements are renewable at the end of the lease period at market rates.
Lyttelton Port Company Ltd has non-cancellable operating lease receivables of $43m (2014: $47m). The Group leases a range of land, buildings and equipment to a number of customers. A number of leases include rights of renewal for further periods including ‘in perpetuity’.
Group 2015 Group 2014 Parent 2015 Parent 2014 Note $’000 $’000 $’000 $’000
21. Capital and operating lease commitments

C H R I S T C H U R C H C I T Y H O L D I N G S L I M I T E D I 2 0 1 5 A N N U A L R E P O R T
81
Accounting policy
Operating leasesThe determination of whether an arrangement is or contains a lease is based on the substance of the arrangement and requires an assessment of whether the fulfilment of the arrangement is dependent on the use of a specific asset or assets and the arrangement conveys a right to use the asset.
(i) As lessee
Operating lease payments are recognised as an expense in the statement of comprehensive income on a straight-line basis over the lease term. Operating lease incentives are recognised as a liability when received and subsequently reduced by allocating lease payments between rental expense and reduction of the liability.
(ii) As lessor
Leases in which the Group retains substantially all the risks and benefits of ownership of the leased asset are classified as operating leases. Initial direct costs incurred in negotiating an operating lease are added to the carrying amount of the leased asset and recognised as an expense over the lease term on the same basis as rental income.
21(b) Non-cancellable operating leases as lessee (contd.)
22(a) Quantifiable contingent liabilities
Performance bonds 49,375 52,432 40,000 42,500
Port noise mitigation 1,200 1,200 – –
50,575 53,632 40,000 42,500Contract performance bonds
The following contingent liabilities exist in respect of contract performance bonds:
• CCHL $40.0m (2014: $42.5m);
• City Care Ltd $8.0m (2014: $8.4m);
• Red Bus Ltd $0.9m (2014: $0.9m); and
• Orion New Zealand Ltd $0.5m (2014: $0.7m).
CCHL entered into a $50m performance bond with ANZ bank in June 2011 in support of Enable Services Ltd’s obligations under the UltraFast Broadband initiative. The amount of the bond decreases annually and terminates in 2022.
None of the above companies expect to have these contingent liabilities called upon by external parties and hence no provision has been made.
Enable Services Ltd
The Network Infrastructure Project Agreement signed between Enable Services Ltd (ESL), Enable Networks Ltd (ENL), Crown Fibre Holdings Ltd and CCHL provides that, if ESL fails to achieve any milestone to which liquidated damages (LDs) apply on or before the applicable milestone Date, ENL will be entitled to claim LDs applicable to that milestone. LDs are potentially payable to ENL but to date no demand for LDs payment has been made.
Orion New Zealand Ltd
Orion has a contingent liability related to the sale of its former head office site in the Christchurch CBD to the Crown in 2013. The amounts and timing of the resolution of this potential issue cannot be reliably estimated. Approximately $2.5m of the sale price is held in a solicitors’ trust account pending resolution of this issue.
Group 2015 Group 2014 Parent 2015 Parent 2014 Note $’000 $’000 $’000 $’000
22. Contingent liabilities and assets

C H R I S T C H U R C H C I T Y H O L D I N G S L I M I T E D I 2 0 1 5 A N N U A L R E P O R T
82
▲
▲
▲
National Provident Fund’s Defined Benefit Plan Contributors Scheme
Some members of the Group are participating employers in the National Provident Fund’s Defined Benefit Plan Contributors Scheme (the scheme) which is a multi-employer defined benefit superannuation scheme. In the unlikely event that the other participating employers ceased to participate in the scheme, the Group could be responsible for the entire deficit of the scheme. Similarly, if a number of employers ceased to participate in the scheme, the Group could be responsible for an increased share of the deficit. The Fund has advised that insufficient information is available to use defined benefit accounting.
22(a) Quantifiable contingent liabilities (contd.)
22(b) Contingent assets
Lyttelton Port Company Ltd
On 29 June 2015, Lyttelton Port Company Ltd filed a statement of claim against Aon Ltd in the High Court. The claim centres on Aon’s responsibilities in relation to LPC’s insurance policies during the Canterbury earthquakes. Aon files its Statement of Defence, which refutes LPC’s claims, on 4 August 2015. The LPC board is confident of its case, but is unable to estimate the company’s chance of success or the final amount which may be awarded.
Enable Services Ltd
Transfield Services Ltd has lodged a $22.5m performance bond with Enable Services Ltd under the Network Delivery Alliance agreement (2014: $22.5m).
As at 30 June 2015, Enable Services Ltd was in dispute with a key service provider on a range of issues relating to delivery of services specified in the contract. The company has taken legal advice and concluded that it has a strong case and that an inflow of economic benefits is likely, although the quantum remains uncertain.
The Group had no other material or significant contingent liabilities or assets as at 30 June 2015.
23. Events after the balance sheet date
On 13 August 2015 Solid Energy New Zealand Ltd entered voluntary administration. All invoices outstanding at year end were paid in July. If Solid Energy were to cease trading, it would have a significant impact on Lyttelton Port Company Ltd.
Other than for the above, the Group is unaware of any significant events between the preparation and authorisation of these financial statements on 16 September 2015.
Notes to the financial statements FOR THE YEAR ENDED 30 JUNE 2015
UNRECOGNISED ITEMS contd.

C H R I S T C H U R C H C I T Y H O L D I N G S L I M I T E D I 2 0 1 5 A N N U A L R E P O R T
83
▲
▲
▲
▲
▲
▲
▲▲
Fully paid ordinary shares 71,434 71,434 71,434 71,434
Partly paid redeemable preference shares 1 1 1 1
71,435 71,435 71,435 71,435
Dividends declared on fully paid ordinary shares 46,009 52,000 46,009 52,000
Cents per share 181 205 181 205
There were no movements in shares during the year. CCHL has on issue:
• 25,381,528 fully paid ordinary shares to Christchurch City Council, carrying one vote per share and the right to dividends.
• 650,139,000 (2014: 650,139,000) redeemable preference shares, paid to $1,390, to Christchurch City Council. No further calls have been made on these shares. Dividends are only payable to the extent that the shares are paid up. CCHL may elect to redeem the whole or any part of the shares. The shares do not carry any right to conversion into ordinary shares in CCHL.
Capital management
The Group’s capital includes share capital, reserves and retained earnings. The Group’s policy is to maintain a strong capital base so as to maintain public, shareholder, investor, creditor and market confidence and to sustain future development of the business. The impact of the level of capital on shareholders’ return is also recognised and the Group recognises the need to maintain a balance between the higher returns that might be possible with greater gearing and the advantages and security afforded by a sound capital position.
Management monitors capital through the gearing ratio (net debt: net debt + equity) and a strong credit rating (currently A+/A-1 (negative outlook) from Standard & Poor’s), although it is noted that the CCHL parent company’s rating is largely determined by the Council’s rating due to the close financial relationship between the two entities. The gearing ratio at balance date is disclosed in Note 30.
The parent company is not subject to any externally-imposed capital requirements. However, it has provided certain covenants to its key lenders by way of a negative pledge deed that it will not create any security interest over its assets, except under certain agreed circumstances. The deed also imposes financial covenants from its lenders relating to equity levels and interest cover.
25. Reserves
Revaluation reserve – property, plant and equipment
The revaluation reserve is used to record increments and decrements on the revaluation of non-current assets, as described in note 7.
Fair value through equity (or available-for-sale) financial assets
Changes in the fair value of investments, such as equities, classified as available-for-sale financial assets, are recognised in other comprehensive income, as described in Note 2, and accumulated in a separate reserve within equity.
Cash flow hedges
The hedging reserve is used to record gains or losses on a hedging instrument in a cash flow hedge that are recognised in other comprehensive income, as described in Note 20.
Other disclosures
Notes to the financial statements FOR THE YEAR ENDED 30 JUNE 2015
Group 2015 Group 2014 Parent 2015 Parent 2014 Note $’000 $’000 $’000 $’000
24. Share capital and dividends
Accounting policy
Dividends
Dividends are recognised as a liability in the period in which they are declared.

C H R I S T C H U R C H C I T Y H O L D I N G S L I M I T E D I 2 0 1 5 A N N U A L R E P O R T
84
Notes to the financial statements FOR THE YEAR ENDED 30 JUNE 2015
OTHER DISCLOSURES contd.
The parent entity in the group structure is CCHL, which is 100% owned by Christchurch City Council (CCC). The group structure is set out in Note 2. The Group undertakes transactions with CCC and its related parties, all of which are carried out on a commercial basis. No material transactions were entered into with related parties except as disclosed below.
26(a) Transactions between CCHL group entities and Christchurch City Council
26(a)(i) Routine transactions 2015 2014 $’000 $’000
Dividends paid/payable to CCC 46,009 52,000
Interest received from CCC 995 1,233
Interest paid to CCC 9,656 3,052
Services provided to CCC 102,304 110,505
Services provided by CCC (including rent and rates) 10,600 10,613
26(a)(ii) Subvention payments and loss offsets between CCHL group and CCC entities
Members of the CCC group, including the CCHL group of companies, are grouped for tax purposes. Some profit-making companies in the group reduce their tax liabilities by making subvention payments to, or offsetting their taxable profits with, entities within the group that generate tax losses, as summarised in the following table:
30 June 2015 30 June 2014
Paid by: Paid by: CIAL LPC CCL ECL CIAL ECL $’000 $’000 $’000 $’000 $’000 $’000
Subvention payments
Paid to:CCC 236 2,615 7,219 – 713 368 CCHL – – – – – – Enable Services Ltd 241 – – 464 – – Red Bus Ltd 462 – – – – – Vbase group – 5,852 – – – – Civic Building Ltd/Tuam Ltd 1,784 8 – – – –
2,723 8,475 7,219 464 713 368
Tax loss offsets: Losses provided by: Offset with: CCC – – 10,490 – 2,546 1,316 CCHL 606 6,725 8,073 – – – Enable Services Ltd 620 – – 1,193 – – Red Bus Ltd 1,187 – – – – – Vbase group – 15,049 – – – – Civic Building Ltd/Tuam Ltd 4,589 21 – – – -
7,002 21,795 18,563 1,193 2,546 1,316
CIAL = Christchurch International Airport Ltd CCL = City Care Ltd LPC = Lyttelton Port Company Ltd ECL = EcoCentral Ltd
The loss offsets in 2015 relate to the 2014 tax year (2014: relate to the 2013 tax year).
26. Related party disclosures

C H R I S T C H U R C H C I T Y H O L D I N G S L I M I T E D I 2 0 1 5 A N N U A L R E P O R T
85
26(a)(iii) Other transactions between CCHL group entities and CCC entities
Other transactions between members of the CCHL Group and CCC or its subsidiaries were as follows:
• The CCHL parent company has in the past made unsecured advances to CCC. The balance outstanding at 30 June 2015 was $14,487,000 (2014: $14,487,000). Interest is based on CCHL’s cost of borrowing plus a small margin. Repayment is due in June 2016.
• In the 2014 financial year, CCHL commenced borrowing from CCC to fund its core operations and the Enable UFB programme. At balance date these loans totalled $208.0m (2014: $101.5m) with $22.0m maturing in April 2020, $96.5m maturing in May 2021, $85.0m in April 2023 and $4.5m in April 2027. $144.0m of these loans are at fixed rate, based on LGFA borrowing rate plus Christchurch City Council margin, with the balance on floating rate. Weighted average borrowing cost at balance date was 5.09% (2014: 5.49%).
• EcoCentral Ltd made payments of $19,927,000 in relation to the disposal of waste (2014: $17,557,000), to Transwaste Canterbury Ltd, a company in which the ultimate shareholder, CCC, has a 38.9% shareholding.
26(a)(iv) Balances between CCHL group entities and CCC entities
At balance date, balances owing by CCC to members of the CCHL Group totalled $11,241,000 (2014: $10,496,000), including City Care Ltd balances of $8,466,000 (2014: $9,257,000). Balances owing by members of the Group to CCC totalled $469,000 (2014: $729,000).
Additionally, members of the CCHL group had the following balances at balance date with other entities owned or related to CCC:
• Owing to Vbase Ltd - $5,000 (2014: $7,000)
• Owing by Vbase Ltd - $87,000 (2014: $27,000)
26(b) Transactions between CCHL parent and subsidiaries
Note 2015 2014 $’000 $’000
Dividends, loans and interest
Dividends received from subsidiaries 10 84,140 48,175
Interest received from subsidiaries 10,685 7,560
Advances to Enable Services Ltd (64,500) (47,500)
Loan repayment from Red Bus Ltd – 5,000
Loan repayment from EcoCentral Ltd 3,000 2,000
The CCHL parent company completed a full takeover of Lyttelton Port Company Ltd during the year, acquiring a further 20,761,422 shares (2014: 128,342) for consideration of $86.2m (2014: $0.4m), taking its ownership interest to 100% (2014: 79.7%).
Shares of $3m in Enable Services Ltd were subscribed for in the 2015 financial year (2014: $6.5m).

C H R I S T C H U R C H C I T Y H O L D I N G S L I M I T E D I 2 0 1 5 A N N U A L R E P O R T
86
Notes to the financial statements FOR THE YEAR ENDED 30 JUNE 2015
OTHER DISCLOSURES contd.
26(c) Transactions of the CCHL Group with associates
During the year, Enable Services Ltd (ESL) sold UFB assets to its associate, Enable Networks Ltd (ENL), of $53.4m (2014: $43.9m), and received shares in ENL and cash as set out in Note 5. At 30 June 2015, ENL owed ESL $16.8m for asset purchases.
ESL received payment for stages from ENL by way of Senior Notes issued in its favour of $11.6m (2014: $16.4m). These notes mature subsequent to June 2021. $1.7m of interest was paid and payable in the current year (2014: $0.2m).
ESL also provides support services to ENL under a management services agreement and an operations and maintenance agreement and other minor contract on-charges. ESL charged $9.0m (2014: $7.8m) during the period for these services. At balance date $1.4m (2014: $1.3m) was outstanding, and is receivable under normal commercial terms.
ESL purchases UFB product from ENL in order to fulfil its remaining customer contracts on the original network that was subsequently sold to ENL. This is a transitional arrangement that will reduce as remaining ESL customer contracts expire. The total purchased from ENL for the year was $0.5m (2014: $1.1m) with no balance payable at year end.
During the year ESL transferred all Central Office land titles to ENL. These assets are paid for under the Network Infrastructure Project Agreement as a component of each premise passed. At 30 June 2015 ESL had recognised an amount receivable from ENL as a deferred purchase receivable of $5.4m (2014: $2.4m).
26(d) Transactions of the CCHL Group with associates
City Care Ltd made sales of $69.7m (2014: $91.3m) to its jointly-controlled operation, Stronger Christchurch Rebuild Team Joint Venture, and had an outstanding receivable balance of $0.29m at 30 June 2015 (2014: $2.5m).
26(e) Transactions between CCHL directors and members of the CCHL Group
There were no transactions between CCHL directors (and entities in which they have an interest) and members of the CCHL group, other than the payment of directors’ fees and the reimbursement of valid company-related expenses. Some minor transactions were entered into with companies in which some directors held directorships and with other related parties. These transactions were carried out on a commercial and arm’s length basis.
The Group paid directors’ fees totalling $1,933,562 (2014: $1,959,223). Key management personnel of the parent company did not purchase any goods and services from group companies during the period greater than $1,000 in total for any individual. All transactions were conducted on standard commercial terms.
Bill Dwyer, a director of CCHL, was a partner in Lane Neave Lawyers until 1 March 2015. In the 2015 year, up to 1 March, the CCHL parent company paid $3,627 to Lane Neave Lawyers, and the CCHL Group $127,658 for legal services, all on commercial terms (2014: $22,868 and $177,554 respectively).

C H R I S T C H U R C H C I T Y H O L D I N G S L I M I T E D I 2 0 1 5 A N N U A L R E P O R T
87
26(f ) Loans from CCHL parent company to related parties
Parent Parent Fixed or Interest 2015 2014 Maturity floating rate basis
$’000 $’000
Current
Christchurch City Council 14,487 – Jun 2016 Fixed CCHL bond, back to back
Christchurch International Airport Ltd – 25,000 Feb 2015 Floating 90 day bank bill rate + margin
EcoCentral Ltd 4,000 – Apr 2016 Floating 90 day bank bill rate + margin
18,487 25,000
Non-current
Christchurch City Council – 14,487 Jun 2016 Fixed CCHL bond, back to back
Enable Services Ltd 164,500 100,000 Mar 2023 Floating CCHL weighted av. cost + margin
Christchurch International Airport Ltd 25,000 25,000 Oct 2016 Floating 90 day bank bill rate + margin
EcoCentral Ltd – 7,000 Apr 2016 Floating 90 day bank bill rate + margin
189,500 146,487
Total 207,987 171,487
No provisions were made for doubtful debts relating to the amount of outstanding balances (2014: Nil), and no bad or doubtful debts expense was recognised in relation to related parties during the period.

C H R I S T C H U R C H C I T Y H O L D I N G S L I M I T E D I 2 0 1 5 A N N U A L R E P O R T
88
Notes to the financial statements FOR THE YEAR ENDED 30 JUNE 2015
OTHER DISCLOSURES contd.
Profit for the year 132,282 402,631 68,815 37,088
Add/(less) non-cash items
Depreciation, amortisation and impairment expense 106,271 99,643 11 –
(Gains)/losses in fair value of investment property 8 (18,086) (9,223) – –
(Gains)/losses in fair value of derivative
financial instruments 762 956 183 (422)
Share of associates’ losses 5 3,255 5,158 – –
Net foreign exchange (gains)/losses 11 (361) (152) – –
Deferred tax charged/(credited) to income 12(e) (2,759) 10,197 – –
Shares received as consideration for UFB build (16,421) (17,826) – –
Other 1,756 (2,121) – –
74,417 86,632 194 (422)
Add/(less) items classified as investing or
financing activities
(Gain)/loss on disposal of non-current assets (3,892) (1,822) – (4)
Movement in capital creditors (575) (14,790) – –
Insurance proceeds (18,124) (372,954) – –
Other 60 – – –
(22,531) (389,566) – (4)
Add/(less) movement in working capital items
Debtors, inventory and other current assets (55,952) 8,012 (648) (285)
Current tax assets – 404 – –
Non-current receivables, prepayments and other 2,065 (6,027) 4 (4)
Creditors and other liabilities 19,412 9,463 1,003 850
Provisions and other liabilities 4,486 3,926 13 4
Current tax liabilities (166) 19,057 – –
Non-current provisions and other liabilities (1,858) 115 – –
(32,013) 34,950 372 565
Net cash from operating activities 152,155 134,647 69,381 37,227
Group 2015 Group 2014 Parent 2015 Parent 2014 Note $’000 $’000 $’000 $’000
27. Reconciliation of profit to net cash operating flows
28. Classification of assets and liabilities
This note provides further information about the group’s financial instruments, including:
• An overview of all financial instruments held by the group, and their classification
• Disaggregated information for those instruments that the directors consider to be most significant in the context of the group’s operations
• Specific accounting policies where relevant
• Information about determining the fair value of the instruments, including judgements and estimation uncertainty involved.
The group’s exposure to various risks associated with the financial instruments is discussed in Note 20.
The group holds the following financial instruments.
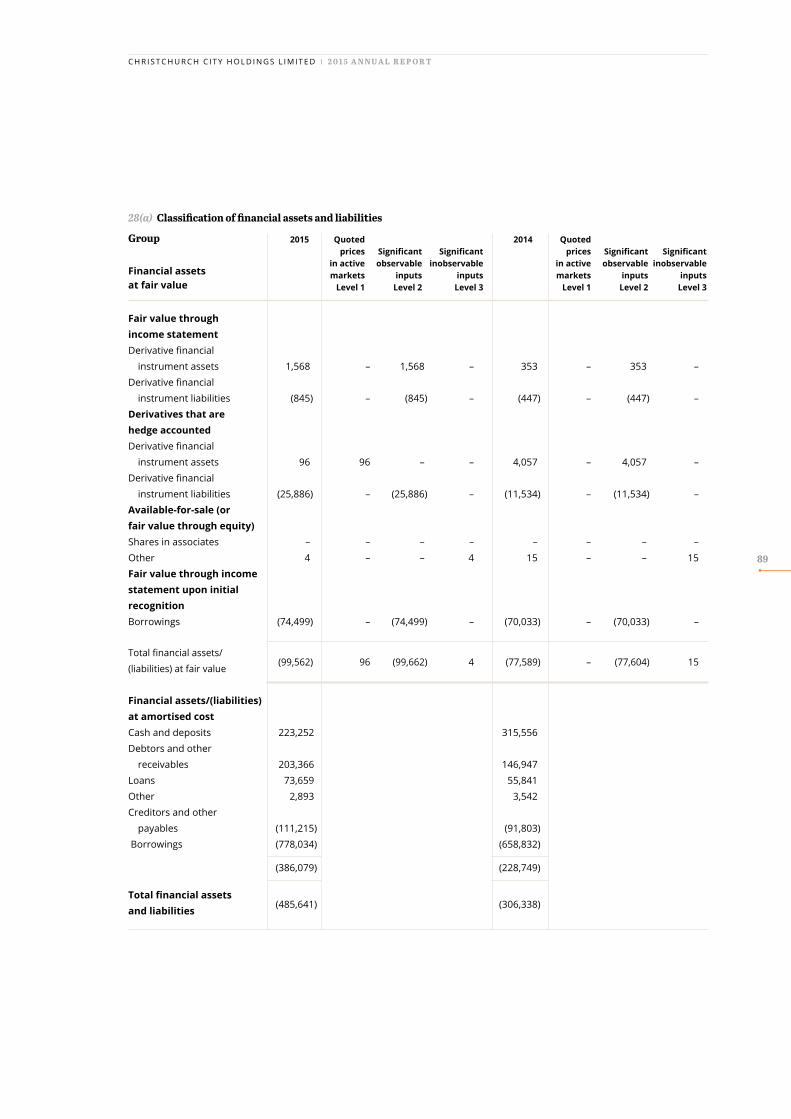
C H R I S T C H U R C H C I T Y H O L D I N G S L I M I T E D I 2 0 1 5 A N N U A L R E P O R T
89
28(a) Classification of financial assets and liabilities
2015 Quoted 2014 Quoted prices Significant Significant prices Significant Significant in active observable inobservable in active observable inobservable markets inputs inputs markets inputs inputs Level 1 Level 2 Level 3 Level 1 Level 2 Level 3
Fair value throughincome statementDerivative financial instrument assets 1,568 – 1,568 – 353 – 353 – Derivative financial instrument liabilities (845) – (845) – (447) – (447) – Derivatives that are hedge accounted Derivative financial instrument assets 96 96 – – 4,057 – 4,057 – Derivative financial instrument liabilities (25,886) – (25,886) – (11,534) – (11,534) – Available-for-sale (or fair value through equity) Shares in associates – – – – – – – – Other 4 – – 4 15 – – 15 Fair value through income statement upon initial recognitionBorrowings (74,499) – (74,499) – (70,033) – (70,033) –
Total financial assets/ (liabilities) at fair value
(99,562) 96 (99,662) 4 (77,589) – (77,604) 15
Financial assets/(liabilities) at amortised cost Cash and deposits 223,252 315,556 Debtors and other receivables 203,366 146,947 Loans 73,659 55,841 Other 2,893 3,542 Creditors and other payables (111,215) (91,803) Borrowings (778,034) (658,832)
(386,079) (228,749)
Total financial assets and liabilities
(485,641) (306,338)
Group
Financial assetsat fair value
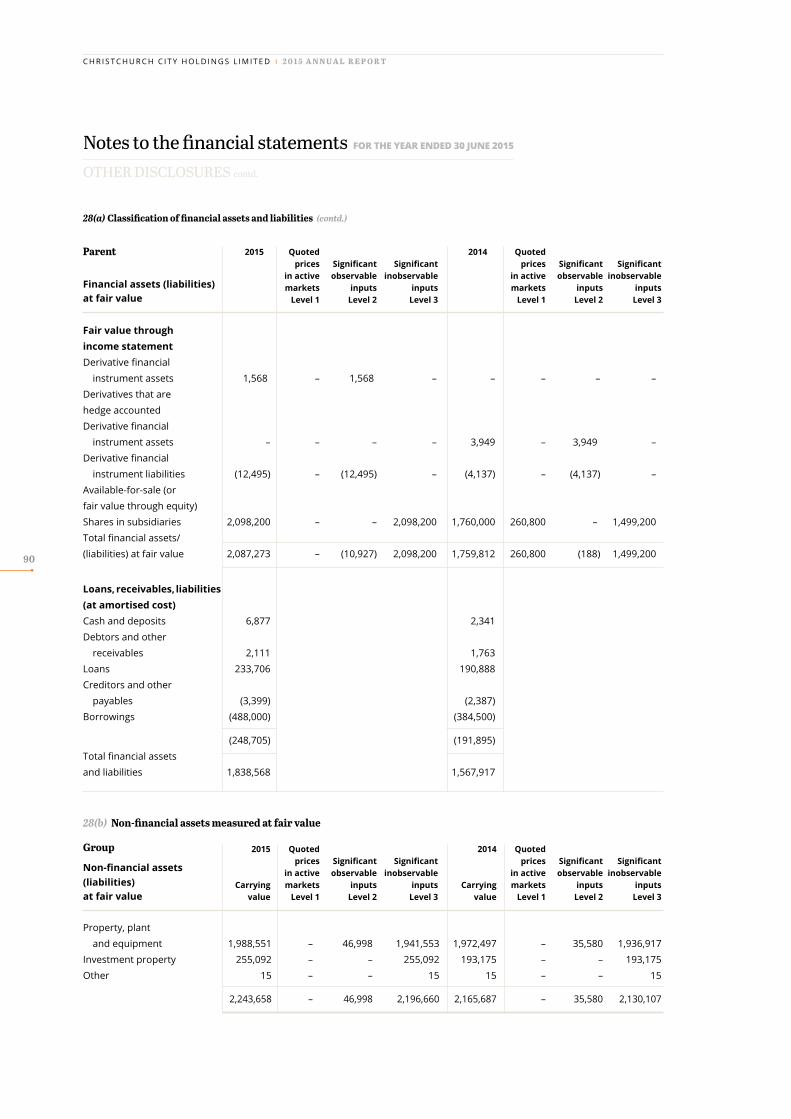
C H R I S T C H U R C H C I T Y H O L D I N G S L I M I T E D I 2 0 1 5 A N N U A L R E P O R T
90
2015 Quoted 2014 Quoted prices Significant Significant prices Significant Significant in active observable inobservable in active observable inobservable markets inputs inputs markets inputs inputs Level 1 Level 2 Level 3 Level 1 Level 2 Level 3
Fair value throughincome statement Derivative financial instrument assets 1,568 – 1,568 – – – – – Derivatives that are hedge accountedDerivative financial instrument assets – – – – 3,949 – 3,949 – Derivative financial instrument liabilities (12,495) – (12,495) – (4,137) – (4,137) – Available-for-sale (or fair value through equity) Shares in subsidiaries 2,098,200 – – 2,098,200 1,760,000 260,800 – 1,499,200 Total financial assets/ (liabilities) at fair value 2,087,273 – (10,927) 2,098,200 1,759,812 260,800 (188) 1,499,200
Loans, receivables, liabilities (at amortised cost)Cash and deposits 6,877 2,341 Debtors and other receivables 2,111 1,763 Loans 233,706 190,888 Creditors and other payables (3,399) (2,387) Borrowings (488,000) (384,500)
(248,705) (191,895) Total financial assets and liabilities 1,838,568 1,567,917
2015 Quoted 2014 Quoted prices Significant Significant prices Significant Significant in active observable inobservable in active observable inobservable Carrying markets inputs inputs Carrying markets inputs inputs value Level 1 Level 2 Level 3 value Level 1 Level 2 Level 3
Property, plant and equipment 1,988,551 – 46,998 1,941,553 1,972,497 – 35,580 1,936,917 Investment property 255,092 – – 255,092 193,175 – – 193,175 Other 15 – – 15 15 – – 15
2,243,658 – 46,998 2,196,660 2,165,687 – 35,580 2,130,107
Notes to the financial statements FOR THE YEAR ENDED 30 JUNE 2015
OTHER DISCLOSURES contd.
28(a) Classification of financial assets and liabilities (contd.)
Parent
Financial assets (liabilities)at fair value
28(b) Non-financial assets measured at fair value
Group
Non-financial assets(liabilities)at fair value

C H R I S T C H U R C H C I T Y H O L D I N G S L I M I T E D I 2 0 1 5 A N N U A L R E P O R T
91
2015 Investment 2014 Investment
Group Total P.P&E property Other Total P.P&E property Other
Analysis of movements in Level 3 assets Opening carrying value 2,130,107) 1,936,917) 193,175) 15 1,911,143) 1,732,940) 178,188) 15 Additions 126,632) 95,371) 31,261) – 106,259) 91,965) 14,294) – Disposals (8,827) (6,643) (2,184) – (17,020) (8,215) (8,805) – Transfer (to)/from investment property –) (14,754) 14,754) – –) (275) 275) – Fair value movements 18,822 736) 18,086 – 194,846) 185,623) 9,223) – Depreciation (70,074) (70,074) –) – (65,121) (65,121) –) -
Closing carrying value 2,196,660) 1,941,553) 255,092) 15 2,130,107) 1,936,917) 193,175 15 2015 2014
Parent Shares in subsidiaries
Analysis of movements in Level 3 assetOpening carrying value 1,499,200 1,403,500
Transfer from Level 1:Lyttelton Port Company Ltd 260,800 –
Shares acquired during the year:Lyttelton Port Company Ltd 82,008 6,500 Enable Services Ltd 3,000
Fair value movements:Orion New Zealand Ltd – 89,200 Christchurch International Airport Ltd 100,800 Lyttelton Port Company Ltd 115,692 – Enable Services Ltd 42,100 – City Care Ltd (23,400) – Red Bus Ltd 20,500 – EcoCentral Ltd (2,500) –
Closing carrying value 2,098,200 1,499,200
Fair value of assets and liabilities
The above tables classify the Group’s and parent company’s assets and liabilities in accordance with NZ IAS 39 as described in the accounting polices set out below.
The property, plant and equipment that is classified as Level 2 arises from the use by Orion’s valuer of significant observable inputs – sales comparisons and unit metre frontage methodologies – in determining the fair value of land at substation sites.
Fixed rate debt is recognised in the financial statements at amortised cost, except for $75m of debt held by Christchurch International Airport Ltd which is matched by an interest rate swap agreement in place with a notional amount of
$75m (2014: $75m) whereby the company receives a fixed rate of interest of 5.15% and pays interest at a variable rate on the notional amount. The swap is being used to hedge the exposure to changes in the fair value of its 5.15% $75m bond.
The CCHL parent company has total fixed rate debt held at amortised cost of $214.0m (2014: $164.5m). The fair value of this debt, determined by discounting cash flows from the instruments using a discount rate derived from relevant market inputs, at balance date was $232.4m (2014: $172.9m).
Transfer between categories
There were no transfers between Level 1 and Level 2 during the year.
The directors consider that the carrying amounts of all other financial assets and financial liabilities approximate their fair values, on the basis that settlement is due in the short term and expected to be at or very close to carrying value.
28(b) Non-financial assets measured at fair value (contd.)

C H R I S T C H U R C H C I T Y H O L D I N G S L I M I T E D I 2 0 1 5 A N N U A L R E P O R T
92
Accounting policy
Fair value is the price that would be received to sell an asset or paid to transfer a liability in an orderly transaction between market participants at the measurement date, based on the highest and best use of that asset.
All assets and liabilities for which fair value is measured or disclosed in the financial statements are categorised within the fair value hierarchy, described as follows:
• Level 1: The fair value of financial instruments traded in active markets (such as publicly traded derivatives, and trading and available-for-sale securities) is based on quoted market prices at the end of the reporting period.
• Level 2: The fair value of financial instruments that are not traded in an active market (for example, over-the-counter derivatives) is determined using valuation techniques which maximise the use of observable market data and rely as little as possible on entity-specific estimates. If all significant inputs required to fair value an instrument are observable, the instrument is included in level 2.
• Level 3: If one or more of the significant inputs is not based on observable market data, the instrument is included in level 3. This is the case for unlisted equity securities.
Specific valuation techniques used to value financial instruments are described in the relevant notes. External valuers are involved for valuation of significant assets, such as properties and investments held at fair value through equity. Selection criteria for valuers include market knowledge, reputation, independence and whether professional standards are maintained.
Classification of investments and financial assetsThe Group classifies its investments in the following categories in accordance with NZ IAS 39 Financial Instruments: Recognition and Measurement:
(a) Financial assets at fair value through profit or loss
A financial asset is classified at fair value through profit or loss if acquired principally for the purpose of selling in the short term with the intention of making a profit. Derivatives are also categorised as held for trading unless they are designated as effective hedging instruments. Gains or losses on financial assets held for trading are recognised in profit or loss.
(b) Loans and receivables
Loans and receivables are non-derivative financial assets with fixed or determinable payments that are not quoted in an active market. Such assets are carried at amortised cost using the effective interest rate method. Gains and losses are recognised in profit or loss when the loans and receivables are derecognised or impaired.
(c) Held-to-maturity investments
Held-to-maturity investments are non-derivative financial assets with fixed or determinable payments and fixed maturities that the Group has the positive intention and ability to hold to maturity.
(d) Fair value through equity assets
Fair value through equity assets are non-derivative financial assets, principally equity securities. NZ IAS 39 uses the terminology “available for sale” for this class of assets – however, the CCHL board considers that this is a misleading description given the nature of its business, and hence the term “fair value through equity” is used in these financial statements.
The Group’s fair value through equity assets principally the investments in the Group’s subsidiary and associated companies. Such assets are measured at fair value, as outlined in Note 2. The valuation changes are held in a revaluation reserve until the subsidiary is sold.
28. Classification of assets and liabilities (contd.)
Notes to the financial statements FOR THE YEAR ENDED 30 JUNE 2015
OTHER DISCLOSURES contd.

C H R I S T C H U R C H C I T Y H O L D I N G S L I M I T E D I 2 0 1 5 A N N U A L R E P O R T
93
Corporate informationChristchurch City Holdings Limited (‘CCHL’) is a wholly owned subsidiary of Christchurch City Council formed for the purpose of holding investments in subsidiary organisations. The company was incorporated on 12 May 1993 and commenced trading operations on 14 May 1993.
The financial statements of CCHL are for the year ended 30 June 2015. The financial statements were authorised for issue by the CCHL board of directors on 16 September 2015.
(i) Statement of complianceThe consolidated financial statements of the Group comply with New Zealand Equivalents to International Financial Reporting Standards (‘NZ IFRS’), and with International Financial Reporting Standards (IFRS).
(ii) Basis of preparation
The financial statements have been prepared in accordance with generally accepted accounting practice in New Zealand (NZ GAAP). For the purposes of complying with NZ GAAP the entity is a Tier 1 for-profit entity, and is reporting in accordance with Tier 1 for-profit accounting standards.
The accounting policies set out in these financial statements have been applied consistently to all periods presented in these financial statements.
The financial statements, in New Zealand dollars, are prepared on the basis of historical cost, except for the revaluation of certain non-current assets and financial instruments.
(ii) Basis of preparation continued
The financial statements are prepared exclusive of GST with the exception of receivables and payables that are shown inclusive of GST. Where GST is not recoverable as an input tax it is recognised as part of the related asset or expense.
(iii) Use of judgements and estimates
Information about judgements made in applying accounting policies that have the most significant impact on the amounts recognised in the financial statements, or information about assumptions and estimation uncertainties that have a significant risk of resulting in a material adjustment to the financial statements, is included in Note 20.
(iv) Impairment
The carrying amounts of the group’s assets, other than inventory, investment property and deferred tax assets, are reviewed at each balance date to determine whether there is any indication of impairment. If any such indication exists for an asset, the asset’s recoverable amount is estimated in order to determine the extent of the impairment loss (if any). Where the asset does not generate cash flows that are independent of other assets, the group estimates the recoverable amount of the cash-generating unit to which the asset belongs. A cash-generating unit is defined as the smallest identifiable group of assets that generates cash inflows that are largely independent of the cash inflows from other assets or groups of assets.
The recoverable amounts are the higher of fair value (less costs to sell) or value in use. In assessing value in use, the estimated future cash flows are discounted to their present value using a discount rate that reflects current market assessments of the time value of money and the risks specific to the asset for which the estimates of future cash flows have not been adjusted.
Goodwill is tested for impairment annually, and whenever there is an indication that it may be impaired. An impairment of goodwill is not subsequently reversed.
If a revalued asset is determined to be impaired, then the impairment is firstly applied against the revaluation reserve related to that asset, with any remaining impairment loss expensed in profit or loss. If the impairment loss is subsequently reversed, the reversal is firstly applied to profit or loss to the extent of previously expensed impairment losses relating to that asset, with any further increase taken to the revaluation reserve.
For assets which are not revalued, an impairment loss is expensed immediately in profit or loss. If an impairment loss is subsequently reversed, the carrying value of the asset is stated at not more than what its carrying value would have been had the earlier impairment not occurred.
When a decline in the fair value of a fair value through equity financial asset has been recognised directly in other comprehensive income and there is objective evidence that the asset is impaired, the cumulative loss that had been recognised directly in other comprehensive income is recognised through profit or loss even though the financial asset has not been derecognised. The amount of the cumulative loss that is recognised through profit or loss is the difference between the acquisition cost and current fair value, less any impairment loss on that financial asset previously recognised through profit or loss.
29. Statement of accounting policies

C H R I S T C H U R C H C I T Y H O L D I N G S L I M I T E D I 2 0 1 5 A N N U A L R E P O R T
94
▲
▲
▲
Notes to the financial statements FOR THE YEAR ENDED 30 JUNE 2015
OTHER DISCLOSURES contd.
Other accounting policiesAccounting policies in relation to the following items are shown in the relevant Note, as follows:
Note
Subsidiaries and consolidation 2
Joint ventures 2
Associated companies 5
Property, plant & equipment 7
Investment property 8
Borrowings and finance costs 9
Finance lease liabilities 9
Derivative financial instruments 20(f)
Foreign currency 20(g)
Revenue 10
Income taxes 12
Inventory 15
(v) New accounting standards and interpretations
No new accounting standards or interpretations that became effective for the period had a material impact on the Group.
Certain new standards, frameworks, amendments and interpretations have been published that have not been early adopted, and which are relevant to the Group are listed below. The financial statement impact of adoption of these standards has not yet been analysed but is not expected to be material.
NZ IFRS 9 (2010) Financial instruments – Effective for periods beginning on or after 1 January 2015.
The standard adds requirements related to the classification, measurement and de-recognition of financial assets and liabilities.
NZ IFRS 11 Joint arrangements – Effective for periods beginning on or after 1 January 2016.
The standard outlines the accounting by entities that jointly control an arrangement. Joint control involves the contractual agreed sharing of control and arrangements subject to joint control are classified as either a joint venture (representing a share of net assets and equity accounted) or a joint operation (representing rights to assets and obligations for liabilities, accounted for under proportional consolidation).
NZ IFRS 15 Revenue from contracts with customers – Effective for periods beginning on or after 1 January 2017.
This standard introduces principles for reporting cohesive and useful information to users of financial statements about the nature, amount, timing and uncertainty of revenue and cash flows arising from an entity’s contracts with customers.
29. Statement of accounting policies (contd.)
Prepayments 15
Debtors and other receivables 15
Cash and cash equivalents 16
Intangible assets 17
Goodwill 17
Creditors and other payables 18
Employee entitlements 18
Provisions 19
Share capital and dividends 24
Operating lease payments 21
Classification of assets and liabilities 28
Fair value 28(b)

C H R I S T C H U R C H C I T Y H O L D I N G S L I M I T E D I 2 0 1 5 A N N U A L R E P O R T
95
▲
▲
▲
▲
▲
▲
▲▲
The Statement of Intent (‘SoI’) issued by CCHL last year in respect of the 2014/15 financial year included a number of financial and non-financial performance measures. The following table compares the actual financial results for the year ended 30 June 2015 with the financial targets contained within the SoI:
Financial performance targets Group Group Parent Parent Actual Forecast Actual Forecast
Profit for the year ($’000) 132,282 79,400 68,815 47,500
Net debt/net debt plus equity (%) 24.6% 23.2% 20.7% 22.3%
Interest cover (times) 4.2 2.9 3.2 2.8
Dividends to Christchurch City Council ($m) N/A N/A 46,009 52,000
Return on average equity (%) 6.8% 4.4% N/A N/A
Group profit for the period and return on average equity
The Group’s profitability and return on average equity are higher than budgeted, primarily as a result of the Orion New Zealand Ltd insurance settlement which increased net profit by $24m, as well as below-budget expenditure. Additionally, Christchurch International Airport Ltd’s net profit was well ahead of target, largely reflecting a $18m gain on the revaluation of investment properties versus a budgeted $4m. Further information on the performance of the Group and the parent company is provided in the review section of this annual report.
Parent company dividends
CCHL declared a gross dividend of $52m, in line with budget but, in agreement with the Council, deducted $5.991m from the final dividend payment. This deduction was equivalent to the amount that CCHL would normally have received as a subvention payment from other members of the Group in return for making its tax losses available. CCHL elected to forego this subvention receipt to assist with Group tax planning.
Parent company profit for the period
The CCHL parent company’s profit for the period was higher than forecast, primarily as a result of special dividends received from Orion New Zealand Ltd (CCHL share $8.9m) and Lyttelton Port Company Ltd (CCHL share as part of takeover process $16.3m).
Performance statement
Notes to the financial statements FOR THE YEAR ENDED 30 JUNE 2015
Note 30.
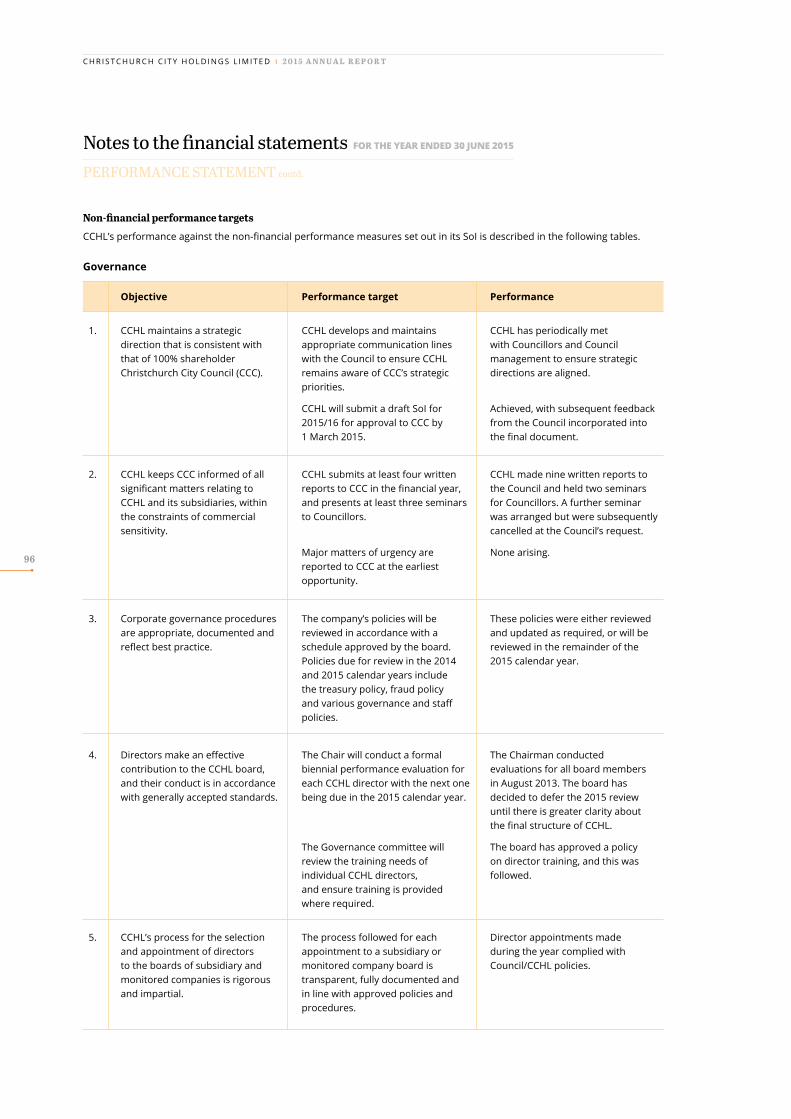
C H R I S T C H U R C H C I T Y H O L D I N G S L I M I T E D I 2 0 1 5 A N N U A L R E P O R T
96
Notes to the financial statements FOR THE YEAR ENDED 30 JUNE 2015
PERFORMANCE STATEMENT contd.
Non-financial performance targets
CCHL’s performance against the non-financial performance measures set out in its SoI is described in the following tables.
Objective Performance target Performance
1. CCHL maintains a strategicdirection that is consistent withthat of 100% shareholder Christchurch City Council (CCC).
CCHL develops and maintains appropriate communication lines with the Council to ensure CCHL remains aware of CCC’s strategic priorities.
CCHL will submit a draft SoI for 2015/16 for approval to CCC by1 March 2015.
CCHL has periodically met with Councillors and Council management to ensure strategic directions are aligned.
Achieved, with subsequent feedback from the Council incorporated into the final document.
2. CCHL keeps CCC informed of all significant matters relating toCCHL and its subsidiaries, withinthe constraints of commercial sensitivity.
CCHL submits at least four written reports to CCC in the financial year, and presents at least three seminars to Councillors.
Major matters of urgency are reported to CCC at the earliest opportunity.
CCHL made nine written reports to the Council and held two seminars for Councillors. A further seminar was arranged but were subsequently cancelled at the Council’s request.
None arising.
3. Corporate governance procedures are appropriate, documented and reflect best practice.
The company’s policies will be reviewed in accordance with a schedule approved by the board. Policies due for review in the 2014 and 2015 calendar years include the treasury policy, fraud policy and various governance and staff policies.
These policies were either reviewed and updated as required, or will be reviewed in the remainder of the 2015 calendar year.
4. Directors make an effective contribution to the CCHL board, and their conduct is in accordance with generally accepted standards.
The Chair will conduct a formalbiennial performance evaluation for each CCHL director with the next one being due in the 2015 calendar year.
The Governance committee willreview the training needs ofindividual CCHL directors,and ensure training is providedwhere required.
The Chairman conductedevaluations for all board membersin August 2013. The board has decided to defer the 2015 review until there is greater clarity about the final structure of CCHL.
The board has approved a policy on director training, and this was followed.
5. CCHL’s process for the selection and appointment of directors to the boards of subsidiary and monitored companies is rigorous and impartial.
The process followed for each appointment to a subsidiary or monitored company board is transparent, fully documented and in line with approved policies and procedures.
Director appointments madeduring the year complied with Council/CCHL policies.
Non-financial performance targets
CCHL’s performance against the non-financial performance measures set out in its SoI is described in the following tables.
Governance

C H R I S T C H U R C H C I T Y H O L D I N G S L I M I T E D I 2 0 1 5 A N N U A L R E P O R T
97
Objective Performance target Performance
6. Subsidiary and monitored companies complete, on a timely basis, Statements of Intent that meet best practice standards.
CCHL will engage with subsidiaryand monitored companies prior tothe 2015 SoI round regarding the structure and content of thegroup SoIs.
Subsidiary companies submit draft Statements of Intent for 2015/16to CCHL by 1 March 2015.
CCHL will review Statements of Intent and respond to the subsidiaries and make recommendations to CCC within six weeks of receipt.
CCHL wrote to all subsidiaries in December 2014 requesting them to consider certain matters in their draft SoIs. It is considered the SoIs adequately reflect these matters.
Achieved.(one entity one day late)
Achieved.
7. Subsidiary and monitored companies that are CCTOs comply with the Local Government Act’s requirements that their principal objectives be:• achieving the objectives of its
shareholders as set out in the SoI;
• being a good employer;• exhibiting a sense of social and
environmental responsibility; and
• conducting their affairs in accordance with sound business practice.
CCHL will review the companies’ performance in the context ofthese statutorily requiredobjectives.
The CCHL board satisfactorily completed this review for the 2014 annual reports. This year’s review will be performed on receipt of the published 2015 annual reportsfrom each subsidiary.
8. CCHL maintains contact with subsidiary and monitored company boards, and remains aware of their strategic and business issues.
CCHL will endeavour to strengthen ties throughout the wider Council group, so that there is improved understanding of each other’s key priorities and issues.
CCHL meets subsidiary and monitored company boards, or representatives thereof, on a formal basis at least two times in the 2015 financial year.
CCHL receives an appropriate level of reporting from subsidiary and monitored company boards.
Networking functions have been held at director and management level to foster intra-group relationships.
Achieved.
Achieved.

C H R I S T C H U R C H C I T Y H O L D I N G S L I M I T E D I 2 0 1 5 A N N U A L R E P O R T
98
4. Subsidiary and monitored companies set and attain environmental and social performance objectives that are compatible with their activities, commercial nature and other objectives.
CCHL will engage with subsidiaries and monitored companies regarding the progressive development and inclusion of relevant and appropriate social and environmental objectives and performance targets in their respective SoIs.
CCHL will perform an annual review of the performance of the subsidiaries and monitored companies against their stated objectives and assess and report on the success of group sustainability initiatives.
CCHL has actively encouraged subsidiaries to continue improving their environmental and social reporting. All SoIs now contain specific measurable targets, which will be reported against in the respective annual reports.
The CCHL board satisfactorily completed this review for the 2014 annual reports. This year’s review will be performed on receipt of the published 2015 annual reports from each subsidiary.
Notes to the financial statements FOR THE YEAR ENDED 30 JUNE 2015
PERFORMANCE STATEMENT contd.
Objective Performance target Performance
1. Subsidiary companies have suffi-cient (but not excessive) financial flexibility, whether through their own capital structures or through the availability of capital from CCHL, to undertake growth and investment initiatives.
CCHL will review the capital structure of each subsidiary company against external benchmarks on a rolling triennial basis.
The capital structure of the major subsidiaries was compared with external benchmarks, indicating average or below average gearing levels.
2. Subsidiary and monitored companies adopt strategies that are compatible with the strategic direction of CCHL and CCC.
CCHL will engage with subsidiary and monitored companies prior to the 2015 SoI round regarding key shareholder strategies and, subsequently, review their SoIs for compatibility with those strategies.
CCHL wrote to each subsidiary in December 2014 setting out the shareholder’s expectations in relation to a number of matters, including dividend levels, communication, and health and safety reporting. It is considered that the SoIs addressed these adequately.
3. Subsidiary and monitored companies adopt strategies that contribute to regional growth.
CCHL will encourage subsidiary and monitored companies to seek opportunities that are both commercially sound and are capable of enhancing regional growth, and actively engage them with regard to specific opportunities that may arise.
CCHL will monitor the ongoing impact of the earthquakes on its subsidiaries, and their progress in recovering and planning for the future.
CCHL will work closely with Enable Services as it undertakes the rollout of the network under the Government’s Ultra Fast Broadband initiative.
CCHL has encouraged subsidiaries to invest in opportunities where appropriate. The four infrastructure companies in particular have been investing extensively in growing/ strengthening their business.
CCHL has actively engaged with the subsidiaries regarding their earthquake recovery strategies.
CCHL has worked closely with Enable during the year on a range of strategic, governance, contractual and valuation matters.
Group strategic, financial and sustainability objectives

C H R I S T C H U R C H C I T Y H O L D I N G S L I M I T E D I 2 0 1 5 A N N U A L R E P O R T
99
Objective Performance target Performance
1. CCHL financial and distribution performance meets the shareholder’s expectations.
CCHL pays a dividend for the 2015 financial year that meets or exceeds budget, and achieves the other budgeted key performance measures set out on page 12.
Achieved – CCHL paid a budgeted ordinary dividend of $52.0m, less a deduction of $6.0m agreed with the Council in relation to subvention receipts voluntarily foregone by CCHL. Performance against other targets is described in Note 26.
2. CCHL’s capital structure is appropriate for the nature of its business.
CCHL will monitor the level and composition of its debt facilities to ensure it remains appropriate in the context of its funding commitments (in particular Enable Services Ltd).
Funding structures are reviewed on an ongoing basis. CCHL has secured further longer term funding from Christchurch City Council to assist with funding the Enable broadband rollout.
3. CCHL’s investments provide an appropriate return in relation to their business risk, and against external benchmarks.
CCHL will periodically review the performance of its major subsidiary companies and other investments against external benchmarks, and assess the value of the investment in the individual company in relation to its inherent business risk and community benefits.
The performance of the major infrastructure companies was benchmarked against their Australasian peers. Additionally, investment returns from the subsidiaries were compared with expected equity returns derived from independently assessed WACCs. The review noted that some companies continued to be affected by the aftermath of the earthquakes, and hence equity returns were lower than would normally be expected.
4. CCHL’s treasury management policies and practices are consistent with best practice.
CCHL’s treasury management policy will be reviewed in the 2014 calendar year.
The treasury policy was reviewed by management late in the 2014 calendar year, and approved by the board in 2015.
Parent company financial objectives

C H R I S T C H U R C H C I T Y H O L D I N G S L I M I T E D I 2 0 1 5 A N N U A L R E P O R T
100
Statutory Information
Ownership and principal activitiesThe company is owned 100% by Christchurch City Council. Its principal activity during the year was to operate as an investment company of the Council.
Directors’ interestsThe company maintains an interests register in which particulars of certain transactions and matters involving the directors are recorded. These are requirements under the Companies Act 1993. The following entries were recorded in the interests register as at 30 June 2015:
Bruce Irvine
Chairman – Heartland Bank LtdDirector – Godfrey Hirst Ltd; Godfrey Hirst Australia & subsidiariesDirector – House of Travel Holdings LtdDirector – PGG WrightsonDirector – MG Marketing Ltd subsidiariesDirector – Rakon LtdDirector – Scenic Circle Hotels LtdDirector – Skope Industries LtdTrustee – Christchurch Symphony Trust
Vicki Buck
Deputy Mayor, Christchurch City CouncilDirector – NZ Windfarms LtdDirector – Think Inc LtdTrustee – Scorpio Family Trust
Bill Dwyer
Trustee – Wavertree TrustDirector – Coconut Culture Ltd
Jamie Gough
Councillor, Christchurch City CouncilDirector – Gough Group and subsidiaries – Gough Corporation Holdings LtdChairman – Vbase LtdChairman – Civic Building LtdTrustee – Antony Gough Trust
Yani Johnanson
Councillor, Christchurch City CouncilHagley / Ferrymead Community board Trustee – Arts Centre Trust
Raf Manji
Councillor, Christchurch City CouncilDirector – Sustento LtdTrustee – Manji Family Trust
Andy Pearce
Chairman – Focus Genetics Management LtdChairman – Hawke’s Bay Regional Investment Company LtdDirector – Bank of New ZealandDirector & shareholder – Seon Pearce and Associates LtdShareholder – Migco Pharmaceuticals LtdChairman – Regional Committee, Canterbury Water Management StrategyDirector – Fauna Ltd
Sarah Smith
Director – Cashel Properties LtdDirector – Devon Chambers LtdDirector – EcoCentral LtdDirector – Sasco Holdings LtdTrustee – Warren Architects Education Charitable TrustTrustee – Ohinetahi Charitable TrustDirector – SLI Systems LtdDirector – Lion FoundationDirector - Wherescape Software LtdDirector – Ngai Tahu Tourism
The company has arranged directors’ liability insurance for all directors, and indemnified all directors and the CEO through a Deed of Indemnity executed on 22 November 2006.
Transactions between CCHL and entities with whom certain directors are associated are described in Note 26 to the financial statements. No loans were made to directors.
DirectorsThere were no changes of directors in the year.
Board and Committee AttendanceThe board and the two standing committees have a number of scheduled meetings each financial year. The following table is a summary of attendance for the company’s financial year ended 30 June 2015:
Number of meetings 11 2 Nil**
Bruce Irvine 11 * -Vicki Buck 11 * -Bill Dwyer 11 * -Jamie Gough 11 1 *Yani Johanson 10 * -Raf Manji 10 2 *Andy Pearce 11 2 *Sarah Smith 11 2 *
* Not a member of this committee** All Governance and Appointment Committee work in the 2015
financial year was undertaken by the full board.
Board Audit & risk Governance & meetings management appointments committee committee meetings meetings

C H R I S T C H U R C H C I T Y H O L D I N G S L I M I T E D I 2 0 1 5 A N N U A L R E P O R T
101
Remuneration of Directors
Remuneration and other benefits paid or due and payable to directors for services as a director during the year were as follows:
CCHL parent $
B Irvine 67,075 V Buck – W Dwyer 37,275J Gough – Y Johanson – R Manji – A Pearce 37,275S Smith 37,275
Orion New Zealand Ltd $
J Smith 74,000J Austin 42,000C Boyce 34,000N Crauford 26,000P Munro 52,000B Simpson 26,000G Vazey 59,000
Christchurch InternationalAirport Ltd $
D Mackenzie 83,510C Drayton 49,600G Gould 23,917A Lovatt 44,600J Murray 44,000 L Palomino Forbes 6,833 C Paulsen 54,145
Lyttelton Port Company Ltd $
T Burt 84,025R Carr 44,625L Crossen 46,500J Quinn 47,344K Smith 49,125 B Wood 46,125
Enable Services Ltd $
M Bowman 77,881C Birkett 41,722B Gamble 46,722W Luff 41,722O Scott 41,722C Walsh 44,222
City Care Ltd $
H Martyn 76,497M Devlin 43,464T King 12,799G Leech 23,181C Price 37,089J Rolfe 23,181M Todd 22,311
Red Bus Ltd $
P Kiesanowski 48,000T Keenan 36,000R Lineham -T Mountford 31,600P Rae 19,200
EcoCentral Ltd $
D Kerr 60,000P Anderson 30,000G Campbell 30,000S Smith 30,000
DonationsThe parent company made a donation of $149,100 to the Mayor’s Welfare Fund during the year (2014: $82,000). Donations of $52,000 (2014: $38,000) were made by subsidiaries.
DividendsThe company has paid or provided fully-imputed dividends of $46,009,400.
Use of Company InformationDuring the year the board received no notices from directors of the company requesting to use company information received in their capacity as directors which would not otherwise have been available to them.
Employee Remuneration
Details of remuneration ranges for employees of the Group and parent company are:
Salary bands Group Parent$’000 2015 2015
100-110 158 –110-120 99 –120-130 81 –130-140 52 –140-150 31 –150-160 26 –160-170 14 –170-180 9 –180-190 1 –190-200 14 –200-210 9 1 210-220 4 –220-230 5 –230-240 7 –240-250 2 –250-260 4 –260-270 1 –270-280 4 1 290-300 2 –300-310 3 –310-320 1 –330-340 2 –340-350 2 –370-380 1 –380-390 1 –420-430 1 –440-450 1 –460-470 1 –470-480 1 –570-580 1 –700-710 1 –760-780 2 –970-980 1 –
AuditorsThe Auditor-General is appointed as auditor under Section 14 of the Public Audit Act 2001 and Section 70 of the Local Government Act 2002. Audit New Zealand has been appointed to provide these services.
C H R I S T C H U R C H C I T Y H O L D I N G S L I M I T E D I 2 0 1 5 A N N U A L R E P O R T
102
Independent Auditor’s Report
To the readers of Christchurch City Holdings Limited and group’sfinancial statements and performance statement for the year ended 30 June 2015
The Auditor-General is the auditor of Christchurch City Holdings Limited (the company) and its New Zealand domiciled subsidiaries (collectively referred to as “the group”). The Auditor-General has appointed me, Julian Tan, using the staff and resources of Audit New Zealand, to carry out the audit of the financial statements and the performance statement of the company and group, on her behalf.
Opinion on the financial statements and the performance statement
We have audited:
• the financial statements of the company and group on pages 36 to 99, that comprise the statement of financial position as at 30 June 2015, the statement of comprehensive income, statement of changes in equity and statement of cash flows for the year ended on that date and the notes to the financial statements that include accounting policies and other explanatory information; and
• the performance statement of the company and group on pages 95 to 99.
In our opinion:
• the financial statements of the company and group:
• present fairly, in all material respects:
– the financial position as at 30 June 2015; and
– the financial performance and cash flows for the year then ended; and
• comply with generally accepted accounting practice in New Zealand and have been prepared in accordance with New Zealand equivalents to International Financial Reporting Standards.
• the performance statement of the company and group presents fairly, in all material respects, the achievements measured against the performance targets adopted for the year ended 30 June 2015.
Our audit was completed on 16 September 2015. This is the date at which our opinion is expressed.
The basis of our opinion is explained below. In addition, we outline the responsibilities of the Board of Directors and our responsibilities, and explain our independence.
Basis of opinion
We carried out our audit in accordance with the Auditor-General’s Auditing Standards, which incorporate the International Standards on Auditing (New Zealand). Those standards require that we comply with ethical requirements and plan and carry out our audit to obtain reasonable assurance about whether the financial statements and the performance statement are free from material misstatement.
Material misstatements are differences or omissions of amounts and disclosures that, in our judgement, are likely to influence readers’ overall understanding of the financial statements and the performance statement. If we had found material misstatements that were not corrected, we would have referred to them in our opinion.
An audit involves carrying out procedures to obtain audit evidence about the amounts and disclosures in the financial statements and in the performance statement. The procedures selected depend on our judgement, including our assessment of risks of material misstatement of the financial statements and the performance statement, whether due to fraud or error. In making those risk assessments, we consider internal control relevant to the preparation of the company and group’s financial statements and performance statement in order to design audit procedures that are appropriate in the circumstances but not for the purpose of expressing an opinion on the effectiveness of the parent and group’s internal control.
REPORT OF THE Auditor-General

C H R I S T C H U R C H C I T Y H O L D I N G S L I M I T E D I 2 0 1 5 A N N U A L R E P O R T
An audit also involves evaluating:
• the appropriateness of accounting policies used and whether they have been consistently applied;
• the reasonableness of the significant accounting estimates and judgements made by the Board of Directors;
• the adequacy of the disclosures in the financial statements and in the performance information; and
• the overall presentation of the financial statements and the performance information.
We did not examine every transaction, nor do we guarantee complete accuracy of the financial statements and the performance information. Also, we did not evaluate the security and controls over the electronic publication of the financial statements and the performance statement.
We believe we have obtained sufficient and appropriate audit evidence to provide a basis for our audit opinion.
Responsibilities of the Board of Directors
The Board of Directors is responsible for the preparation and fair presentation of financial statements for the company and group that comply with generally accepted accounting practice in New Zealand and New Zealand equivalents to International Financial Reporting Standards. The Board of Directors is also responsible for preparation of the performance statement for the company and group.
The Board of Directors’ responsibilities arise from the Local Government Act 2002.
The Board of Directors is responsible for such internal control as it determines is necessary to enable the preparation of financial statements and performance statement that are free from material misstatement, whether due to fraud or error. The Board of Directors is also responsible for the publication of the financial statements and the performance statement, whether in printed or electronic form.
Responsibilities of the Auditor
We are responsible for expressing an independent opinion on the financial statements and the performance statement and reporting that opinion to you based on our audit. Our responsibility arises from section 15 of the Public Audit Act 2001.
Independence
When carrying out the audit, we followed the independence requirements of the Auditor-General, which incorporate the independence requirements of the External Reporting Board.
In addition to the audit, we have carried out other audit and assurance engagements for subsidiary companies in compliance with regulatory requirements. These audit and assurance engagements, as described in note 11 on page 63, are compatible with those independence requirements.
Other than the audit and the other audit and assurance engagements, we have no relationship with or interests in the company or any of its subsidiaries.
Julian TanAudit New ZealandOn behalf of the Auditor-GeneralChristchurch, New Zealand
103
REPRORT OF THE Auditor-General

104
C H R I S T C H U R C H C I T Y H O L D I N G S L I M I T E D I 2 0 1 5 A N N U A L R E P O R T
2006 2007 2008 2009 2010 2011 2012 2013 2014 2015
$m $m $m $m $m $m $m $m $m $m
Financial performance and position
Total revenue 492 501 524 592 595 750 903 958 1,352 1,095
Profit for the period 79 99 91 79 55 77 97 71 403 132
Total assets 1,592 2,156 2,219 2,211 2,286 2,321 2,473 2,576 3,166 3,301
Shareholders’ equity 854 1,368 1,405 1,414 1,367 1,309 1,373 1,450 1,945 1,928
Payments to Christchurch City Council
Dividends paid 47 30 33 37 114 44 35 36 52 46
Ratios
Ratio of net debt tonet debt plus equity 35% 23% 23% 22% 27% 30% 33% 33% 18% 25%
Return on average equity 9.3% 8.9% 6.6% 5.6% 4.0% 5.9% 7.3% 5.0% 23.7% 6.8%
summary10 year

105
CCHL DIRECTORY & GROUP
This document is printed on an environmentally responsible paper, produced using FSC® certified 100% Post Consumer Recycled (PCF) pulp from Responsible Sources.Printed using environmentally certified soy based inks.
Registered Office77 Hereford StreetChristchurch
DirectorsB R Irvine (Chairman)V S BuckW J DwyerJ T GoughY JohansonR A ManjiA J PearceS L Smith
Management TeamR Lineham (Chief Executive)R Simmonds (Chief Financial Officer)N Halstead (Executive Officer)
BankersBank of New Zealand, ChristchurchWestpac Institutional Bank, AucklandANZ Bank, Wellington
AuditorsAudit New Zealand on behalf of theAuditor-GeneralChristchurch
DirectoryChristchurch City Holdings Limited77 Hereford Street. PO Box 73049, Christchurch 8154Telephone: (03) 941 8475Email: [email protected] Website: www.cchl.co.nz
Orion New Zealand Limited565 Wairakei Road. PO Box 13896 Christchurch 8141Telephone: (03) 363 9898Email: [email protected]: www.oriongroup.co.nz
Christchurch International Airport Limited4th floor, Car Park Building, Memorial AvenuePO Box 14001 Christchurch 8544Telephone: (03) 358 5029Website: www.christchurchairport.co.nz
Lyttelton Port Company Limited41 Chapmans Road, WoolstonPrivate Bag 501, Lyttelton 8841Telephone: (03) 328 8198Website: www.lpc.co.nz
Enable Services LtdEnable House, 2nd Floor, 106 Wrights Road, AddingtonPO Box 9228, Tower Junction, ChristchurchTelephone: (03) 363 2962Email: [email protected]: www.enablenetworks.co.nz
City Care Limited226 Antigua Street. PO Box 7669 ChristchurchTelephone: (03) 941 7200Website: www.citycare.co.nz
Red Bus Limited120 Ferry Road. PO Box 10 171, ChristchurchTelephone: (03) 379 4260Website: www.redbus.co.nz
EcoCentral LimitedLevel 1, Baigent Way, Middleton. PO Box 6320, ChristchurchTelephone: (03) 336 0080Email:[email protected]: www.ecocentral.co.nz
Group Contacts
C H R I S T C H U R C H C I T Y H O L D I N G S L I M I T E D I 2 0 1 5 A N N U A L R E P O R T

www.cchl.co.nzChristchurch City Holdingscc hl