Catecholamine-Induced T-Wave Lability in Congenital Long QT Syndrome: A Novel Phenomenon Associated...
11
Mayo Clin Proc. 2003;78:40-50 40 © 2003 Mayo Foundation for Medical Education and Research Original Article Catecholamine-Induced T-Wave Lability in Congenital Long QT Syndrome: A Novel Phenomenon Associated With Syncope and Cardiac Arrest JAN NEMEC, MD; JOSEPH B. HEJLIK, RN; WIN-KUANG SHEN, MD; AND MICHAEL J. ACKERMAN, MD, PHD From the Division of Cardiovascular Diseases and Internal Medicine (J.N., J.B.H., W.-K.S., M.J.A.), Division of Pediatric Cardiology (M.J.A.), and Department of Molecular Pharmacology and Experi- mental Therapeutics (M.J.A.), Mayo Clinic, Rochester, Minn. Dr Nemec is now with the Interní Klinika, V_eobecná Fakultní nemocnice University Karlovy, Praha, Czech Republic. This study was supported by a Mayo Foundation clinical research award to Drs Nemec, Ackerman, and Shen. Drs Nemec and Ackerman have a patent application pending for the T-wave lability index. Presented in part at the American College of Cardiology 2001 Young Investigator Award competition by Dr Ackerman in Orlando, Fla, March 19, 2001. Individual reprints of this article are not available. Address correspon- dence to Michael J. Ackerman, MD, PhD, Long QT Syndrome Clinic and Sudden Death Genomics Laboratory, Mayo Clinic, 200 First St SW, Rochester, MN 55905 (e-mail: [email protected]). • Objective: To determine the effects of phenylephrine and dobutamine on repolarization lability in patients with genotyped long QT syndrome (LQTS). • Patients and Methods: Between December 1998 and August 2000, 23 patients with genotyped LQTS (13 LQT1, 7 LQT2, and 3 LQT3) and 16 controls underwent electro- cardiographic stress testing at the Mayo Clinic in Roches- ter, Minn. Aperiodic repolarization lability was quantified from digitized electrocardiograms recorded during cat- echolamine stress testing with phenylephrine and dobu- tamine. T-wave lability was quantified as a root-mean- square of the differences between corresponding signal values of subsequent beats. The magnitude of aperiodic T- wave lability was quantified by using a newly derived T- wave lability index (TWLI). • Results: The TWLI was significantly greater in pa- tients with LQTS than in controls (0.0945–0.0517 vs 0.0445–0.0123; P<.003). Marked T-wave lability (TWLI ≥0.095) was detected in all 3 LQTS genotypes (10/23) but APD = action potential duration; QTc = corrected QT inter- val; DI = diastolic interval; EAD = early afterdepolarization; ECG = electrocardiogram; LQTS = long QT syndrome; OHCA = out-of-hospital cardiac arrest; TWA = T-wave alternans; TWLI = T-wave lability index; VPC = ventricular premature complex in no controls (P<.003). There was no correlation between the TWLI and the baseline corrected QT interval. All high-risk patients having either a history of out-of-hospital cardiac arrest or syncope had a TWLI of 0.095 or greater. • Conclusions: Beat-to-beat nonalternating T-wave la- bility occurs in LQT1, LQT2, and LQT3 patients during catecholamine provocation and is associated with a history of prior cardiac events. The quantification of this novel phenomenon may assist in identifying LQTS patients with increased risk of sudden cardiac death. Mayo Clin Proc. 2003;78:40-50 C ongenital long QT syndrome (LQTS) is an inherited disorder of cardiac ion channels that predisposes af- fected individuals to ventricular tachycardia and sudden cardiac death. 1,2 As a “pure global repolarization disease,” LQTS is also a powerful model for arrhythmogenesis associated with impaired repolarization in general. 3-5 More than 200 mutations have been identified in 3 genes encoding ion channel α-subunits ( KCNQ1/ KVLQT1 [LQT1], KCNH2/HERG [LQT2], SCN5A [LQT3]) 6-8 and in 2 genes encoding ion channel–modifying β-subunits (KCNE1/minK [LQT5] and KCNE2/MiRP1 [LQT6]), 9,10 providing the molecular-genetic substrate for approxi- mately 60% of families with LQTS. 11 Clinically, LQTS affects approximately 1 in 5000 persons. Affected indi- viduals often but certainly not always display QT prolon- gation (corrected QT interval [QTc] ≥460 milliseconds) on the resting 12-lead electrocardiogram (ECG). The dis- ease can remain asymptomatic for an entire lifetime or may be manifest by syncope, seizures, or sudden death due to polymorphic ventricular tachycardia of torsade de pointes. 2 For editorial comment, see page 18. Unfortunately, no single risk factor indicating whether a person is likely to remain asymptomatic (40% of those with LQTS) or present with sudden cardiac death (5%-10%) has emerged. 2 A history of out-of-hospital cardiac arrest (OHCA) suggests a high risk, and marked (>550 millisec- onds) QTc prolongation at rest may indicate the presence of a particularly arrhythmogenic substrate. 12-15 Macrovoltage T-wave alternans (TWA) may be an adverse prognostic factor in LQTS. 16-20 However, the prognostic value of TWA diminishes after correcting for QT duration. 21 Moreover, TWA is observed infrequently in patients with LQTS, al- For personal use. Mass reproduce only with permission from Mayo Clinic Proceedings.
-
Upload
independent -
Category
Documents
-
view
0 -
download
0
Transcript of Catecholamine-Induced T-Wave Lability in Congenital Long QT Syndrome: A Novel Phenomenon Associated...

Catecholamine-Induced T-Wave Lability in LQTS Mayo Clin Proc, January 2003, Vol 7840
Mayo Clin Proc. 2003;78:40-50 40 © 2003 Mayo Foundation for Medical Education and Research
Original Article
Catecholamine-Induced T-Wave Lability in Congenital Long QT Syndrome:A Novel Phenomenon Associated With Syncope and Cardiac Arrest
JAN NEMEC, MD; JOSEPH B. HEJLIK , RN; WIN-KUANG SHEN, MD; AND MICHAEL J. ACKERMAN , MD, PHD
From the Division of Cardiovascular Diseases and Internal Medicine(J.N., J.B.H., W.-K.S., M.J.A.), Division of Pediatric Cardiology(M.J.A.), and Department of Molecular Pharmacology and Experi-mental Therapeutics (M.J.A.), Mayo Clinic, Rochester, Minn. DrNemec is now with the Interní Klinika, V_eobecná Fakultnínemocnice University Karlovy, Praha, Czech Republic.
This study was supported by a Mayo Foundation clinical researchaward to Drs Nemec, Ackerman, and Shen.
Drs Nemec and Ackerman have a patent application pending for theT-wave lability index.
Presented in part at the American College of Cardiology 2001 YoungInvestigator Award competition by Dr Ackerman in Orlando, Fla,March 19, 2001.
Individual reprints of this article are not available. Address correspon-dence to Michael J. Ackerman, MD, PhD, Long QT Syndrome Clinicand Sudden Death Genomics Laboratory, Mayo Clinic, 200 First StSW, Rochester, MN 55905 (e-mail: [email protected]).
• Objective: To determine the effects of phenylephrineand dobutamine on repolarization lability in patients withgenotyped long QT syndrome (LQTS).
• Patients and Methods: Between December 1998 andAugust 2000, 23 patients with genotyped LQTS (13 LQT1,7 LQT2, and 3 LQT3) and 16 controls underwent electro-cardiographic stress testing at the Mayo Clinic in Roches-ter, Minn. Aperiodic repolarization lability was quantifiedfrom digitized electrocardiograms recorded during cat-echolamine stress testing with phenylephrine and dobu-tamine. T-wave lability was quantified as a root-mean-square of the differences between corresponding signalvalues of subsequent beats. The magnitude of aperiodic T-wave lability was quantified by using a newly derived T-wave lability index (TWLI).
• Results: The TWLI was significantly greater in pa-tients with LQTS than in controls (0.0945±0.0517 vs0.0445±0.0123; P<.003). Marked T-wave lability (TWLI≥0.095) was detected in all 3 LQTS genotypes (10/23) but
APD = action potential duration; QTc = corrected QT inter-val; DI = diastolic interval; EAD = early afterdepolarization;ECG = electrocardiogram; LQTS = long QT syndrome;OHCA = out-of-hospital cardiac arrest; TWA = T-wavealternans; TWLI = T-wave lability index; VPC = ventricularpremature complex
in no controls (P<.003). There was no correlation betweenthe TWLI and the baseline corrected QT interval. Allhigh-risk patients having either a history of out-of-hospitalcardiac arrest or syncope had a TWLI of 0.095 or greater.
• Conclusions: Beat-to-beat nonalternating T-wave la-bility occurs in LQT1, LQT2, and LQT3 patients duringcatecholamine provocation and is associated with a historyof prior cardiac events. The quantification of this novelphenomenon may assist in identifying LQTS patients withincreased risk of sudden cardiac death.
Mayo Clin Proc. 2003;78:40-50
Congenital long QT syndrome (LQTS) is an inheriteddisorder of cardiac ion channels that predisposes af-
fected individuals to ventricular tachycardia and suddencardiac death.1,2 As a “pure global repolarization disease,”LQTS is also a powerful model for arrhythmogenesisassociated with impaired repolarization in general.3-5
More than 200 mutations have been identified in 3 genesencoding ion channel α-subunits (KCNQ1/KVLQT1[LQT1], KCNH2/HERG [LQT2], SCN5A [LQT3])6-8 and
in 2 genes encoding ion channel–modifying β-subunits(KCNE1/minK [LQT5] and KCNE2/MiRP1 [LQT6]),9,10
providing the molecular-genetic substrate for approxi-mately 60% of families with LQTS.11 Clinically, LQTSaffects approximately 1 in 5000 persons. Affected indi-viduals often but certainly not always display QT prolon-gation (corrected QT interval [QTc] ≥460 milliseconds)on the resting 12-lead electrocardiogram (ECG). The dis-ease can remain asymptomatic for an entire lifetime ormay be manifest by syncope, seizures, or sudden deathdue to polymorphic ventricular tachycardia of torsade depointes.2
For editorial comment, see page 18.
Unfortunately, no single risk factor indicating whether aperson is likely to remain asymptomatic (40% of those withLQTS) or present with sudden cardiac death (5%-10%) hasemerged.2 A history of out-of-hospital cardiac arrest(OHCA) suggests a high risk, and marked (>550 millisec-onds) QTc prolongation at rest may indicate the presence ofa particularly arrhythmogenic substrate.12-15 MacrovoltageT-wave alternans (TWA) may be an adverse prognosticfactor in LQTS.16-20 However, the prognostic value of TWAdiminishes after correcting for QT duration.21 Moreover,TWA is observed infrequently in patients with LQTS, al-
For personal use. Mass reproduce only with permission from Mayo Clinic Proceedings.
Mayo Clin Proc, January 2003, Vol 78 Catecholamine-Induced T-Wave Lability in LQTS 41
though an ambulatory ECG may be more sensitive than astandard ECG.16,21 Exercise-induced µV-TWA was not sig-nificantly different between genotype carriers andnoncarriers in a study involving a large single kindred withLQT2.22 Recently, we showed that catecholamine-pro-voked µV-TWA occurred at lower heart rates in patientswith LQTS vs controls but failed to identify high-riskpatients.23
In contrast to µV-TWA and fluctuations in QT dura-tion,24-26 striking aperiodic beat-to-beat fluctuations of T-wave amplitude have rarely been reported for any condi-tion. Couderc et al27 observed beat-to-beat T-wave variabil-ity concerning both duration and amplitude in standardECGs of a single kindred with a cardiac sodium channeldefect (LQT3) and severe QT interval prolongation (QTc>600 milliseconds). With use of a complex mathematicaltechnique of wavelet transformation, greater beat-to-beatvariability of the repolarization segment on a resting ECGwas observed in the mutation carriers than in unaffectedfamily members.
Our initial motivation for catecholamine administrationwas to increase heart rate and provoke µV-TWA. Duringthe catecholamine challenge, we observed aperiodic T-wave lability in certain patients and attempted to quantifythis phenomenon in all study participants. We also soughtto determine whether the degree of T-wave lability corre-lated with clinical risk.
PATIENTS AND METHODSStudy Population
Between December 1998 and August 2000, 23 patients(15 females; mean ± SD age, 26.3±11.7 years) withgenotyped LQTS (13 LQT1 patients from 8 distinctkindreds, 7 LQT2 patients from 4 distinct kindreds, and 3LQT3 patients from a single kindred) were subjected to acatecholamine provocation protocol with continuous ECGmonitoring. The controls consisted of 16 healthy volun-teers of similar age and sex distribution (10 females; mean± SD age, 27.3±12.5 years). The study was approved by theMayo Foundation Institutional Review Board and con-ducted at the Mayo Clinic in Rochester, Minn. In the LQTSgroup, 3 patients had experienced confirmed OHCA. Threeadditional patients had both a personal history of syncopeand a family history of sudden death. The controls werefree of known cardiovascular disease, except one had mildhypertension. Most LQTS patients (20/23) were taking noβ-blocker medication when the catecholamine stress testwas conducted.
Phenylephrine and Dobutamine T-Wave Stress TestThe LQTS patients and controls were studied while
supine and were asked to perform metronomic breathing
during the ECG recording. A visual cue and an acoustic cuefor each inspiration and expiration were provided by acomputer. The respiratory rate was usually set at 12/minand adjusted for patient comfort. Electrocardiographic re-cordings were performed at baseline, after administrationof phenylephrine (2 µg/kg intravenously), and during in-creasing rates of intravenous dobutamine infusion (5, 10,20, and 30 µg · kg–1 · min–1). The interval between phenyl-ephrine administration and initiation of the dobutamineinfusion was 10 minutes. After the dose of dobutamine wasincreased, 5 minutes was allowed to achieve a new steadystate before recording. If a heart rate of 140 beats/min wasnot reached by the end of the dobutamine infusion, atropine(0.5-1.0 mg intravenously) was given. Finally, recovery-phase ECGs were recorded at 10 and 20 minutes afterdobutamine infusion was discontinued.
During each stage of the study, a 12-lead ECG wasrecorded (approximately 300 beats) while the study partici-pant was supine and performing metronomic breathing,and it was stored on a magneto-optical disk using an EPLab recording system (Quinton Electrophysiology Corp,Bothell, Wash) with a 1-kHz sampling frequency and 12-bit precision (2.5 µV resolution). In addition to a heart rategreater than 140 beats/min, criteria for protocol terminationincluded presence of macroscopic TWA, frequent ven-tricular premature complexes (VPCs) (>10/min), complexventricular ectopy or ventricular tachycardia, severe nau-sea, vasovagal symptoms, chest discomfort, or blood pres-sure level exceeding 220/140 mm Hg. Mild nausea duringdobutamine infusion was treated with ondansetron. Thisprotocol was devised primarily to study tachycardia-in-duced changes in repolarization and represents a modifica-tion of the dobutamine echocardiographic protocol usedroutinely at our institution.
Calculation of T-Wave Lability IndexCustom-written software for off-line analysis of T-wave
lability from the digitized ECG recordings was created inTurbo Pascal version 7.0 (Borland) by one of the investiga-tors (J.N.). In the unfiltered signal, R-wave peaks weredetected by an algorithm searching for minima of the sec-ond derivative of the signal (corresponding to a changefrom a positive to a negative signal slope). The R-wavepositions were then further refined by searching for themaximal signal amplitude in the vicinity of the tentative R-wave position (Figure 1, A). All automatically detected R-wave positions were manually checked and occasionallyedited by one of the investigators (J.N.).
A T-wave lability index (TWLI) was calculated for eachprotocol stage from the V
4 lead signal as follows. The
recordings were first low-pass filtered at a 20-Hz cutofffrequency with a digital 3-pole Butterworth filter. Baseline
For personal use. Mass reproduce only with permission from Mayo Clinic Proceedings.

Catecholamine-Induced T-Wave Lability in LQTS Mayo Clin Proc, January 2003, Vol 7842
Figure 1. Analytic derivation of the T-wave lability index(TWLI). For each protocol stage, at least 100 consecutive pairs ofbeats, excluding ectopic beats and sinus beats preceding or fol-lowing an ectopic beat, were aligned by the peak of the R waves(A). Beginning at 110 milliseconds after the peak of the R wave,the beat-to-beat lability at each isochronic point t
0 (A) was calcu-
lated by root-mean-square (RMS) of the differences (B); seeAppendix for more detail. C, Running summary of the lability asdetermined by RMS throughout the entire repolarization segment(dashed line) with the scale of 0.05 mV indicated on the right.This is superimposed on the signal-averaged QRST complex(solid line) for that particular protocol stage (note the different y-axis scale, 0.5 mV). The TWLI is derived by taking the magnitudeof maximum lability indicated by the vertical dashed arrow anddividing it by the absolute magnitude of the signal-averaged QRScomplex. In this example, the isochronic point hosting maximallability occurred just after the peak of the signal-averaged T wave.
fluctuation was reduced by cubic spline subtraction; thespline was interpolating fiducial points in the PR intervalthat preceded each R-wave peak by 50 milliseconds. Dur-ing a given study stage, the repolarization segment wasdefined as starting 110 milliseconds after the R-wave peakand ending 710 milliseconds after the R-wave peak (or at atime corresponding to the shortest RR interval betweensinus beats at this stage minus 200 milliseconds, whicheverwas shorter). For every time point throughout the repolar-ization segment, repolarization lability was calculated asroot-mean-square of differences between correspondingsignal values of all consecutive beat pairs (Figure 1, B).Importantly, pairs of QRST complexes that included aVPC, atrial premature complex, or sinus beat preceding orfollowing the VPC or atrial premature complex were ex-cluded. Therefore, each lability value throughout the repo-larization interval is a mean calculated from all eligiblebeat pairs (minimum of 100) from a given protocol stage.
The particular isochronic time point yielding the highestroot-mean-square value throughout the repolarization in-terval was recorded, indicating the most labile point of theT wave. To account for differences of body habitus, thisvalue was normalized to the absolute magnitude (maximalminus minimal voltage) of the signal-averaged QRS com-plex (Figure 1, C). We refer to this value (maximal labilityof ST-T segment normalized for QRS amplitude) as the T-wave lability index. A TWLI was derived during eachprotocol stage for each study participant. The maximumTWLI, irrespective of the stage at which it occurred, wascompared between patients with LQTS and controls. Theclinical risk category and genotype were determined by oneinvestigator (M.J.A.), and the lability analysis was per-formed independently by another investigator (J.N.). SeeAppendix for further mathematical computation of TWLI.
Statistical AnalysisAll continuous variables were expressed as mean ± SD.
The 2-sided Wilcoxon rank sum test was used to comparemaximal TWLI values between the LQTS patients andcontrols. The Fisher exact test was used to test indepen-dence of the TWLI with the clinical assignment of highrisk. Both the slope of the linear regression and the non-parametric Spearman rank correlation coefficient wereused to evaluate the relationship between the TWLI andbaseline QTc (calculated by Bazett formula) in the LQTSpatients. All calculated P values were 2-sided, and P<.05was considered statistically significant.
RESULTSThe mean values for the TWLI derived during each proto-col stage for patients with LQTS and controls are summa-rized in Table 1. Except for the protocol stage involving
A
B
C
For personal use. Mass reproduce only with permission from Mayo Clinic Proceedings.
Mayo Clin Proc, January 2003, Vol 78 Catecholamine-Induced T-Wave Lability in LQTS 43
Table 2. Clinical Data on Patients With Long QT Syndrome*
Stage of MaximalPatient No./ LQTS Personal Family maximal TWLIage (y)/sex genotype history history TWLI value QTc
1/18/F 1 Negative SUD P 0.0515 4292/36/F 1 Negative SUD R 0.0765 4353/14/M 1 OHCA Negative D10 0.1481 4424/27/F 1 Syncope SUD D10 0.1365 4455/36/F 1 Negative SUD D10 0.0435 4546/13/M 1 Negative SUD D10 0.2132 4557/36/F 1 Negative OHCA D30 0.0533 4588/37/F 1 Syncope SUD, OHCA B 0.0991 4599/32/M 1 Syncope OHCA D5 0.1445 470
10/18/F 1 Negative SUD P 0.0463 47911/19M 1 Negative SUD, OHCA B 0.0928 50112/54/F 1 Negative OHCA B 0.0372 52913/21/F 1 OHCA Negative R 0.1019 63814/28/M 2 Negative SUD D10 0.1567 46215/13/F 2 Negative Negative R 0.0543 46316/23/F 2 Negative OHCA D20 0.0458 48717/45/M 2 Negative OHCA D20 0.0450 48918/34/F 2 Negative Negative B 0.0476 48919/16/M 2 Negative OHCA D30 0.0397 51120/19/F 2 OHCA Negative P 0.1450 54721/14/M 3 Negative SUD P 0.1582 51622/12/F 3 Negative SUD P 0.1541 53023/39/F 3 Negative SUD D10 0.0891 600
*Patients with marked T-wave lability index (≥0.095) are in bold. B = baseline; D5 = dobutamineat 5 µg · kg–1 · min–1; D10 = dobutamine at 10 µg · kg–1 · min–1; D20 = dobutamine at 20 µg ·kg–1 · min–1; D30 = dobutamine at 30 µg · kg–1 · min–1; LQTS = long QT syndrome; OHCA = out-of-hospital cardiac arrest; P = phenylephrine; QTc = corrected QT interval; R = recovery; SUD =sudden unexplained death.
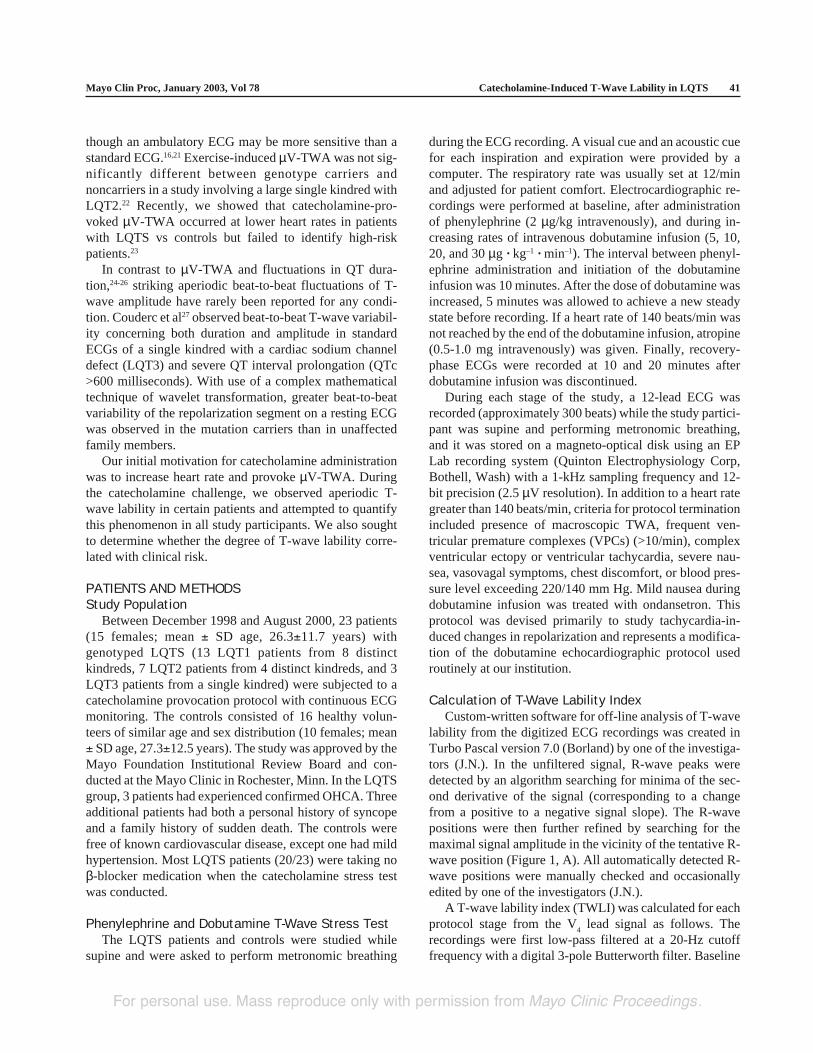
Table 1. Mean Values of T-Wave Lability for Individual Protocol Stages*
High-riskLQTS LQTS OHCA
Controls patients patients patients P value†
Baseline 0.034 0.062 0.072 0.077 .003Phenylephrine 0.035 0.067 0.079 0.094 .002Dobutamine infusion
(µg · kg–1 · min–1)5 0.034 0.066 0.084 0.052 .00610 0.034 0.076 0.086 0.073 .00220 0.032 0.047 0.055 ND‡ .0330 0.028 0.045 0.039 ND‡ .06
Atropine 0.022 0.048 0.049 ND‡ .04Recovery time (min)
10 0.021 0.034 0.040 0.028 .00620 0.019 0.043 0.049 0.051 .001
*Note that the T-wave lability is higher in patients with LQTS than in controls during anystudy stage. In all but one stage (D30), the difference is statistically significant. LQTS =long QT syndrome; ND = not done; OHCA = out-of-hospital cardiac arrest.
†Two-tailed t test; patients with LQTS vs controls.‡Protocol termination criteria reached prior to these stages.
infusion of dobutamine at 30 µg · kg–1 · min–1, the TWLIwas significantly greater in LQTS patients than in controls.The clinical characteristics of the LQTS patients and thevalues of baseline QTc and TWLI are summarized in Table2. It is readily apparent that the study stage hosting thegreatest degree of T-wave lability varies among patients.
For example, the 3 patients with a history of OHCA mani-fested marked aperiodic T-wave lability at different stages:patient 3, TWLI = 0.1481 during infusion of 10 µg ·kg–1 · min–1 of dobutamine; patient 13, TWLI = 0.1019 atrest; and patient 20, TWLI = 0.1450 during phenylephrineinfusion.
For personal use. Mass reproduce only with permission from Mayo Clinic Proceedings.
Catecholamine-Induced T-Wave Lability in LQTS Mayo Clin Proc, January 2003, Vol 7844
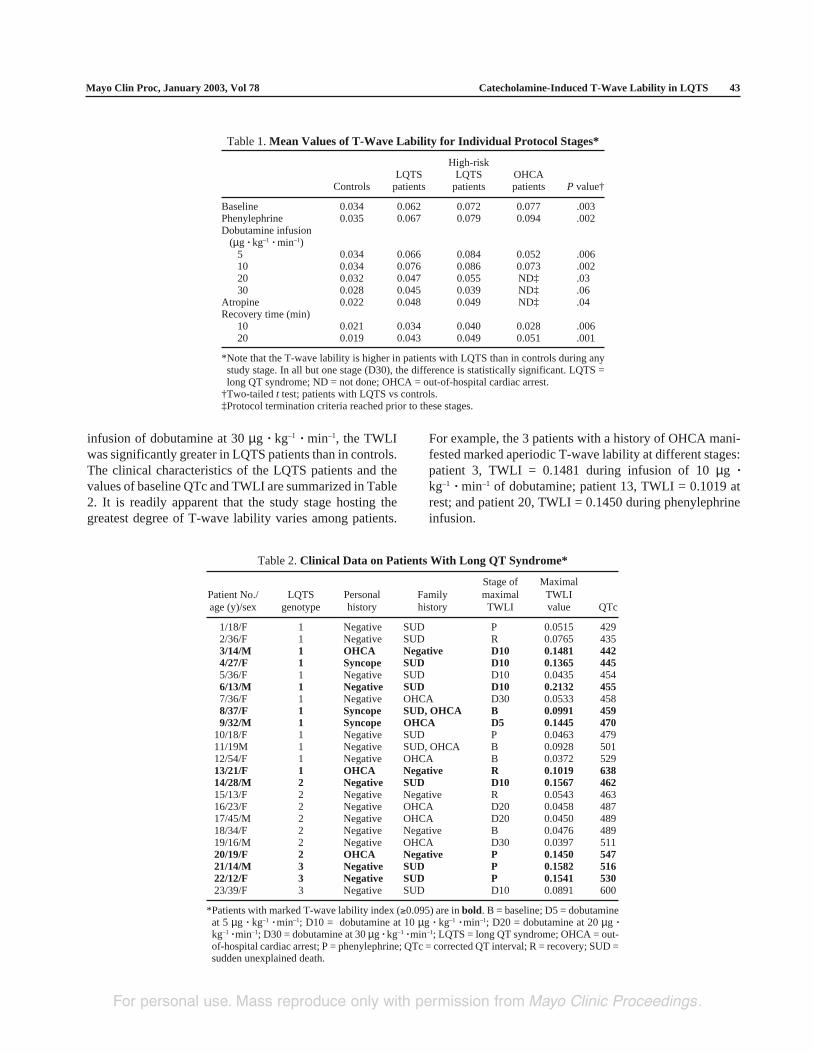
Figure 2. Summary of the T-wave lability index (TWLI) in 23 patients with long QTsyndrome (LQTS) and 16 controls. The study participants are distinguished on the x-axis by LQTS genotype or control. Each individual’s sex is indicated by squares (males)or circles (females). Open symbols denote a negative personal and family history(asymptomatic). Partially filled symbols indicate a family history (FHx) of at least 1sudden unexplained death (SUD). Filled symbols indicate a personal history of syncopeand a FHx of SUD. Finally, symbols with a slash identify patients who experienced out-of-hospital cardiac arrest (OHCA). TWLI in LQTS patients is significantly higher than incontrols (0.0945±0.0517 vs 0.0445±0.0123, respectively; P<.003).
Recognizing this individual variation and heterogeneityin response to catecholamines and the onset of greatestlability, the maximum TWLI, irrespective of the stage atwhich it occurred, was compared between patients withLQTS and controls. The maximum repolarization labilityduring catecholamine challenge, as expressed by TWLI,was significantly higher in LQTS patients (0.0945±0.0517)than in controls (0.0445±0.0123; P<.003; Figure 2).Marked T-wave lability (TWLI ≥0.095, more than 4 SDsgreater than the average TWLI derived from the controls)was present in 10 of 23 LQTS patients but in no controls(P<.003).
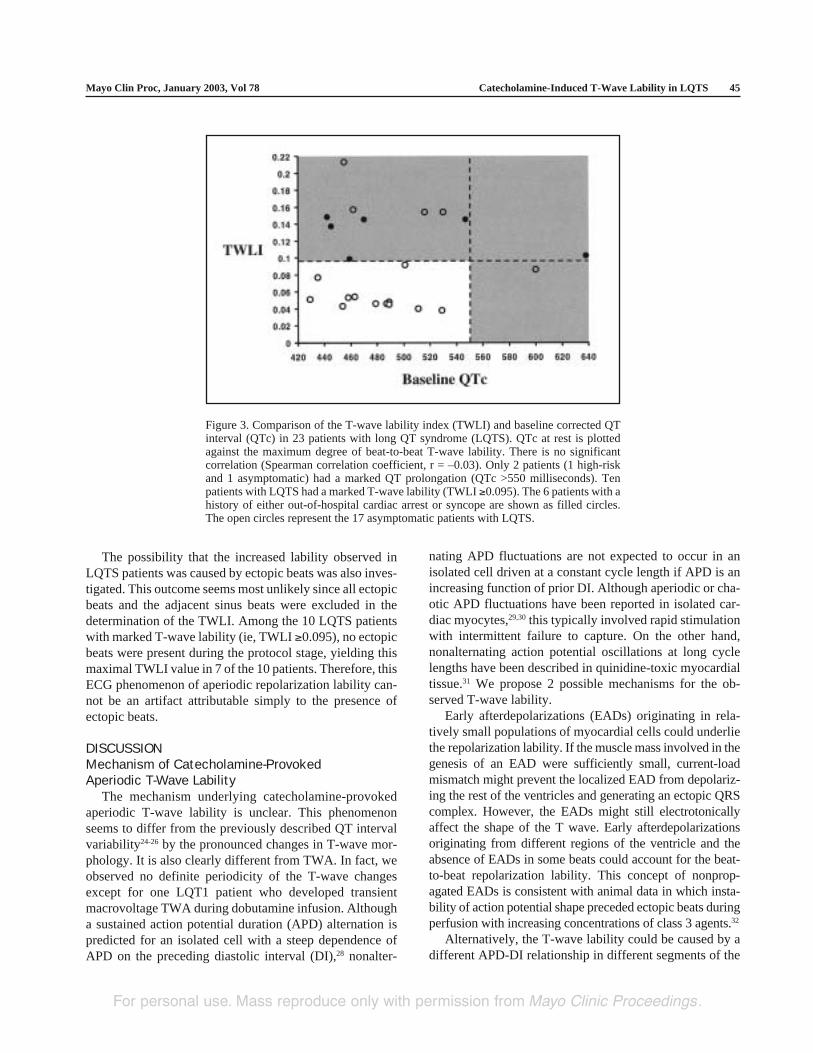
Moreover, marked T-wave lability was associated withprior cardiac events: 6 of 23 LQTS patients had a historyof either OHCA (3) or syncope (3). All 6 of these indi-viduals but only 4 of the remaining 17 LQTS patients hada TWLI of 0.095 or greater (Figure 2, P<.003 for inde-pendence of TWLI ≥0.095 and cardiac event history). Incontrast, only 1 of the 6 individuals with prior cardiacevents had a baseline QTc interval exceeding 550 milli-seconds (Figure 3). Thus, in this study, profound baselineQT prolongation (QTc >550 milliseconds) on a restingECG had a sensitivity of 16%. There was no correlationbetween TWLI and baseline QTc (linear regression lineslope, 1.78 × 10⁻⁵; P=.94; Spearman correlation coeffi-cient, –0.03; P=.91).
One LQT1 patient with history of OHCA developedpolymorphic ventricular tachycardia during dobutamineinfusion, requiring electrical cardioversion. Marked T-wave lability was present before ventricular tachycardiaonset (Figures 4-6). Pronounced T-wave lability (TWLI≥0.095) was detected in LQT2 and LQT3 patients as well(Figure 7).
We explored whether this phenomenon of aperiodicrepolarization lability resulted from a potential recordingartifact secondary to baseline fluctuation. First, as apparentfrom Figures 4 through 7, the baseline was stable afterspline subtraction, despite marked variability of the Twave, as evidenced by the minimal variations in the iso-electric segments of the QRS complex. Second, there is noreason to believe that the respiratory patterns during thestudy differed between the LQTS patients and controls.Indeed, the metronomic breathing rate that the study par-ticipants were asked to follow did not differ between thesegroups at the stage of maximum repolarization variability(11.27±1.28 vs 11.56±1.41 breaths/min; LQTS vs controls,P=.52). The baseline fluctuation as estimated by the SD ofthe fiducial points used for spline interpolation was alsosimilar (58.7±41.9 vs 84.4±65.2 µV; LQTS vs controls,P=.18). Therefore, higher repolarization lability in the pa-tients with LQTS cannot be explained by a different respi-ratory pattern.
For personal use. Mass reproduce only with permission from Mayo Clinic Proceedings.
Mayo Clin Proc, January 2003, Vol 78 Catecholamine-Induced T-Wave Lability in LQTS 45
Figure 3. Comparison of the T-wave lability index (TWLI) and baseline corrected QTinterval (QTc) in 23 patients with long QT syndrome (LQTS). QTc at rest is plottedagainst the maximum degree of beat-to-beat T-wave lability. There is no significantcorrelation (Spearman correlation coefficient, r = –0.03). Only 2 patients (1 high-riskand 1 asymptomatic) had a marked QT prolongation (QTc >550 milliseconds). Tenpatients with LQTS had a marked T-wave lability (TWLI ≥0.095). The 6 patients with ahistory of either out-of-hospital cardiac arrest or syncope are shown as filled circles.The open circles represent the 17 asymptomatic patients with LQTS.
The possibility that the increased lability observed inLQTS patients was caused by ectopic beats was also inves-tigated. This outcome seems most unlikely since all ectopicbeats and the adjacent sinus beats were excluded in thedetermination of the TWLI. Among the 10 LQTS patientswith marked T-wave lability (ie, TWLI ≥0.095), no ectopicbeats were present during the protocol stage, yielding thismaximal TWLI value in 7 of the 10 patients. Therefore, thisECG phenomenon of aperiodic repolarization lability can-not be an artifact attributable simply to the presence ofectopic beats.
DISCUSSIONMechanism of Catecholamine-ProvokedAperiodic T-Wave Lability
The mechanism underlying catecholamine-provokedaperiodic T-wave lability is unclear. This phenomenonseems to differ from the previously described QT intervalvariability24-26 by the pronounced changes in T-wave mor-phology. It is also clearly different from TWA. In fact, weobserved no definite periodicity of the T-wave changesexcept for one LQT1 patient who developed transientmacrovoltage TWA during dobutamine infusion. Althougha sustained action potential duration (APD) alternation ispredicted for an isolated cell with a steep dependence ofAPD on the preceding diastolic interval (DI),28 nonalter-
nating APD fluctuations are not expected to occur in anisolated cell driven at a constant cycle length if APD is anincreasing function of prior DI. Although aperiodic or cha-otic APD fluctuations have been reported in isolated car-diac myocytes,29,30 this typically involved rapid stimulationwith intermittent failure to capture. On the other hand,nonalternating action potential oscillations at long cyclelengths have been described in quinidine-toxic myocardialtissue.31 We propose 2 possible mechanisms for the ob-served T-wave lability.
Early afterdepolarizations (EADs) originating in rela-tively small populations of myocardial cells could underliethe repolarization lability. If the muscle mass involved in thegenesis of an EAD were sufficiently small, current-loadmismatch might prevent the localized EAD from depolariz-ing the rest of the ventricles and generating an ectopic QRScomplex. However, the EADs might still electrotonicallyaffect the shape of the T wave. Early afterdepolarizationsoriginating from different regions of the ventricle and theabsence of EADs in some beats could account for the beat-to-beat repolarization lability. This concept of nonprop-agated EADs is consistent with animal data in which insta-bility of action potential shape preceded ectopic beats duringperfusion with increasing concentrations of class 3 agents.32
Alternatively, the T-wave lability could be caused by adifferent APD-DI relationship in different segments of the
For personal use. Mass reproduce only with permission from Mayo Clinic Proceedings.

Catecholamine-Induced T-Wave Lability in LQTS Mayo Clin Proc, January 2003, Vol 7846
Figure 4. Relevant electrocardiographic tracings from lead V4 in a
14-year-old male adolescent with LQT1 (F339del-KVLQT1),prior out-of-hospital cardiac arrest, and ventricular tachycardiaduring the study. A, Sinus rhythm is present at baseline. The T-wave morphology is uniform. B, During infusion of dobutamineat 10 µg · kg–1 · min–1 (D10), pronounced T-wave notching devel-ops. It is accompanied by dramatic beat-to-beat changes of the Twave (arrows). Notice the absence of baseline fluctuation orchanges in QRS morphology. The T-wave changes do not exhibitan alternans pattern. No ectopic beat is present. C, During dobu-tamine infusion at 20 µg · kg–1 · min–1 (D20), frequent polymor-phic ventricular ectopic beats appear. Ventricular tachycardia isinitiated by a short-long-short sequence. There is a marked differ-ence between the T-wave morphology of the first and secondcomplex (arrows). Both are sinus beats. D, The rate of the poly-morphic VT accelerated. Loss of consciousness occurred withinapproximately 10 seconds. TdP = torsade de pointes. E, Sinusrhythm was restored by external cardioversion. The dobutamineinfusion was discontinued, and 5 mg of metoprolol was adminis-tered intravenously. The T-wave morphology is completely uni-form 10 minutes after cardioversion.
ventricle and by electrotonic interactions between thesesegments. In the canine LQTS model mentioned previ-ously, the prolongation of repolarization is markedly morepronounced in the lateral than in the septal area of the leftventricle.33 Both regional and transmural heterogeneity ofrepolarization occur across the ventricular wall. Temporalrepolarization patterns in electrically coupled ventricularsegments with different APD-DI relationships could be
much more complex than in an isolated cell and mightaccount for the dramatic nonalternans repolarization labil-ity observed in our study. Whether this phenomenon re-flects the heterogeneity of repolarization previously eluci-dated within localized M cells in in vitro preparations awaitsfurther investigation.34-36 Irrespective of whether the T-wavelability is caused by multifocal EADs or by high and chang-ing degrees of repolarization dispersion, an increased pro-pensity for ventricular arrhythmias might be expected.
Risk Stratification in LQTSAlthough β-blocker therapy is effective in patients with
LQTS,15,37 some die suddenly despite β-blockade or a com-bination of β-blockade and permanent pacemaker.15,38 Ifthese at-risk individuals could be identified prospectively,primary prevention with use of an implantable cardiover-ter-defibrillator might be lifesaving. The clinical criteriacurrently available for risk stratification are imperfect.2
Previously reported adverse prognostic factors include his-tory of OHCA or syncope, family history of at least 1sudden death, TWA, notched T waves, and marked QTprolongation.2,13-15,39 However, the positive and negativepredictive values of these risk factors are uncertain. In ourstudy, only 1 of the 6 high-risk patients displayed markedQT interval prolongation (QTc >550 milliseconds) on aresting ECG. None of the patients manifested TWA ornotched T waves at rest.
TWLI and Risk StratificationThe provocation by catecholamines of macrovoltage
aperiodic beat-to-beat T-wave lability in LQTS patients is anovel phenomenon. To the best of our knowledge, aperi-odic T-wave lability was mentioned briefly for the firsttime in 1994 by Zareba et al,40 but no attempt was made atthat time to quantify it. Later, Couderc et al27 quantifiedbeat-to-beat repolarization variability from brief (10 sec-onds) standard resting ECG recordings of a single LQT3kindred manifesting marked prolongation of the QT inter-val. These investigators used an analytic method involv-ing wavelet transformation based on second derivative ofthe gaussian function, which combines features of time-and frequency-domain analysis. They concluded that therepolarization variability was more pronounced in muta-tion carriers than in their unaffected relatives, but noattempt was made to relate this phenomenon to clinicalphenotype.
Our study showed that catecholamine provocation withphenylephrine and dobutamine can induce marked beat-to-beat lability of the repolarization segment in patients withmutations in all 3 common LQTS genes (KCNQ1/KVLQT1, KCNH2/HERG, and SCN5A) but not in the con-trols. It is known from a retrospective study of more than
For personal use. Mass reproduce only with permission from Mayo Clinic Proceedings.
Mayo Clin Proc, January 2003, Vol 78 Catecholamine-Induced T-Wave Lability in LQTS 47
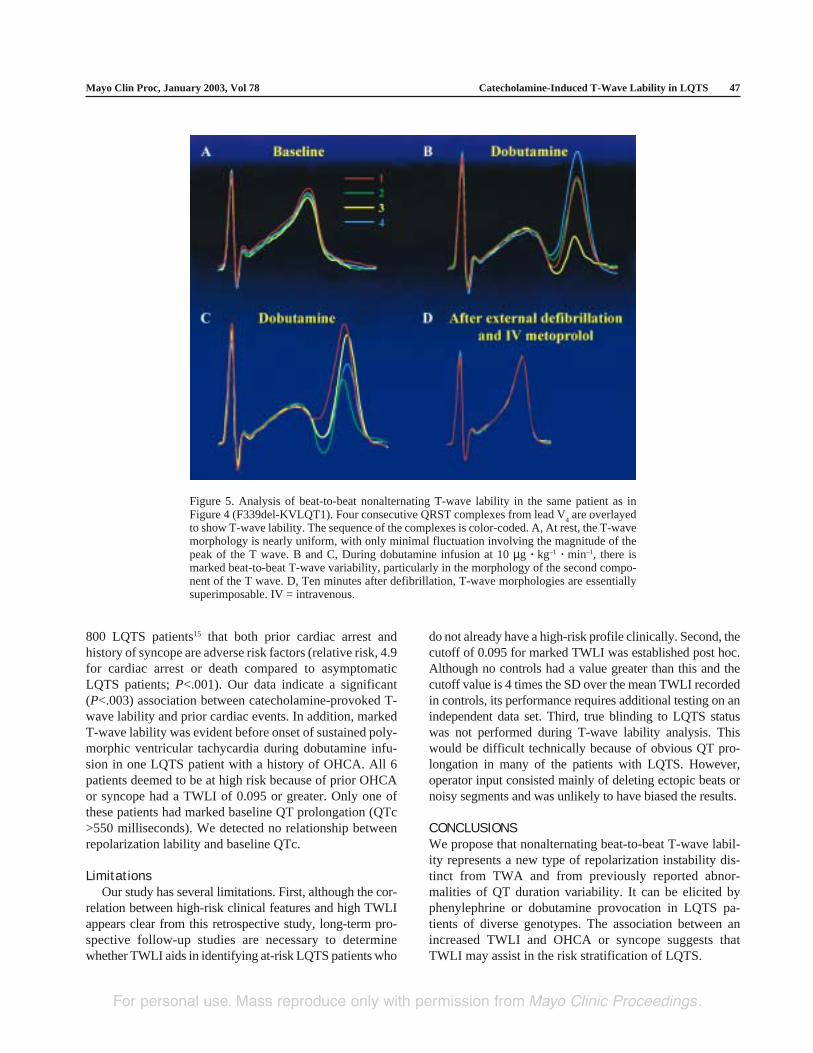
Figure 5. Analysis of beat-to-beat nonalternating T-wave lability in the same patient as inFigure 4 (F339del-KVLQT1). Four consecutive QRST complexes from lead V
4 are overlayed
to show T-wave lability. The sequence of the complexes is color-coded. A, At rest, the T-wavemorphology is nearly uniform, with only minimal fluctuation involving the magnitude of thepeak of the T wave. B and C, During dobutamine infusion at 10 µg · kg–1 · min–1, there ismarked beat-to-beat T-wave variability, particularly in the morphology of the second compo-nent of the T wave. D, Ten minutes after defibrillation, T-wave morphologies are essentiallysuperimposable. IV = intravenous.
800 LQTS patients15 that both prior cardiac arrest andhistory of syncope are adverse risk factors (relative risk, 4.9for cardiac arrest or death compared to asymptomaticLQTS patients; P<.001). Our data indicate a significant(P<.003) association between catecholamine-provoked T-wave lability and prior cardiac events. In addition, markedT-wave lability was evident before onset of sustained poly-morphic ventricular tachycardia during dobutamine infu-sion in one LQTS patient with a history of OHCA. All 6patients deemed to be at high risk because of prior OHCAor syncope had a TWLI of 0.095 or greater. Only one ofthese patients had marked baseline QT prolongation (QTc>550 milliseconds). We detected no relationship betweenrepolarization lability and baseline QTc.
LimitationsOur study has several limitations. First, although the cor-
relation between high-risk clinical features and high TWLIappears clear from this retrospective study, long-term pro-spective follow-up studies are necessary to determinewhether TWLI aids in identifying at-risk LQTS patients who
do not already have a high-risk profile clinically. Second, thecutoff of 0.095 for marked TWLI was established post hoc.Although no controls had a value greater than this and thecutoff value is 4 times the SD over the mean TWLI recordedin controls, its performance requires additional testing on anindependent data set. Third, true blinding to LQTS statuswas not performed during T-wave lability analysis. Thiswould be difficult technically because of obvious QT pro-longation in many of the patients with LQTS. However,operator input consisted mainly of deleting ectopic beats ornoisy segments and was unlikely to have biased the results.
CONCLUSIONSWe propose that nonalternating beat-to-beat T-wave labil-ity represents a new type of repolarization instability dis-tinct from TWA and from previously reported abnor-malities of QT duration variability. It can be elicited byphenylephrine or dobutamine provocation in LQTS pa-tients of diverse genotypes. The association between anincreased TWLI and OHCA or syncope suggests thatTWLI may assist in the risk stratification of LQTS.
For personal use. Mass reproduce only with permission from Mayo Clinic Proceedings.
Catecholamine-Induced T-Wave Lability in LQTS Mayo Clin Proc, January 2003, Vol 7848
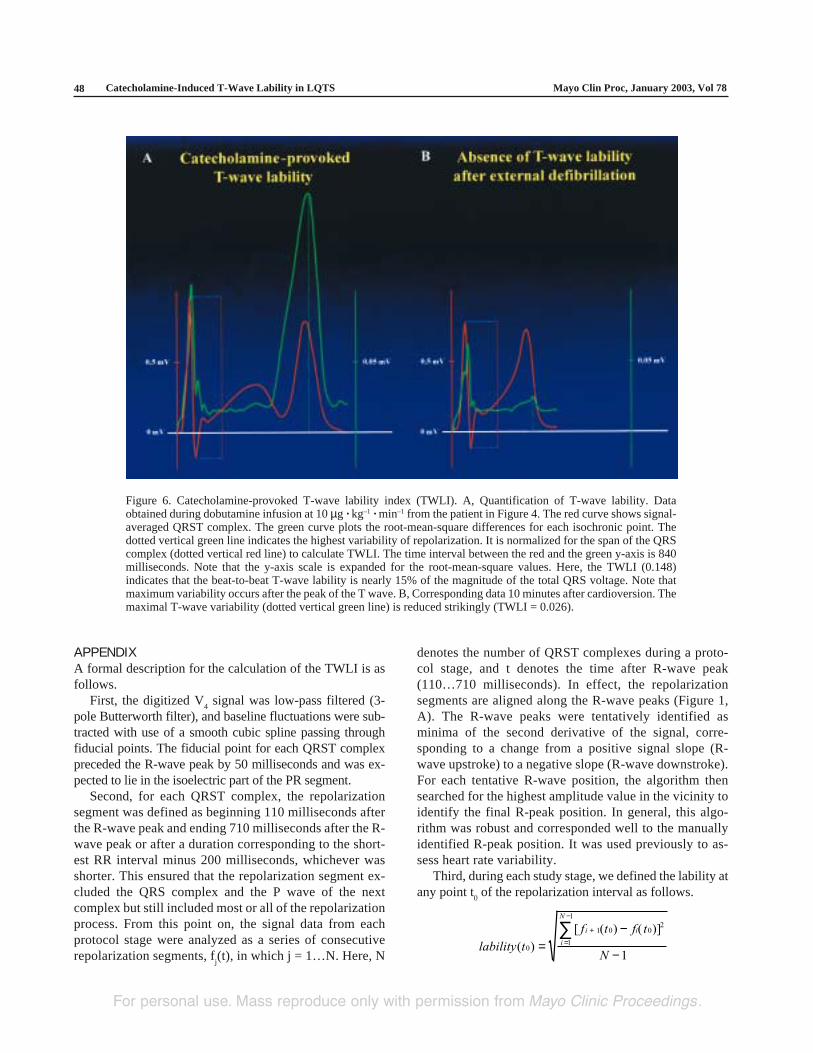
Figure 6. Catecholamine-provoked T-wave lability index (TWLI). A, Quantification of T-wave lability. Dataobtained during dobutamine infusion at 10 µg · kg–1 · min–1 from the patient in Figure 4. The red curve shows signal-averaged QRST complex. The green curve plots the root-mean-square differences for each isochronic point. Thedotted vertical green line indicates the highest variability of repolarization. It is normalized for the span of the QRScomplex (dotted vertical red line) to calculate TWLI. The time interval between the red and the green y-axis is 840milliseconds. Note that the y-axis scale is expanded for the root-mean-square values. Here, the TWLI (0.148)indicates that the beat-to-beat T-wave lability is nearly 15% of the magnitude of the total QRS voltage. Note thatmaximum variability occurs after the peak of the T wave. B, Corresponding data 10 minutes after cardioversion. Themaximal T-wave variability (dotted vertical green line) is reduced strikingly (TWLI = 0.026).
APPENDIXA formal description for the calculation of the TWLI is asfollows.
First, the digitized V4 signal was low-pass filtered (3-
pole Butterworth filter), and baseline fluctuations were sub-tracted with use of a smooth cubic spline passing throughfiducial points. The fiducial point for each QRST complexpreceded the R-wave peak by 50 milliseconds and was ex-pected to lie in the isoelectric part of the PR segment.
Second, for each QRST complex, the repolarizationsegment was defined as beginning 110 milliseconds afterthe R-wave peak and ending 710 milliseconds after the R-wave peak or after a duration corresponding to the short-est RR interval minus 200 milliseconds, whichever wasshorter. This ensured that the repolarization segment ex-cluded the QRS complex and the P wave of the nextcomplex but still included most or all of the repolarizationprocess. From this point on, the signal data from eachprotocol stage were analyzed as a series of consecutiverepolarization segments, f
j(t), in which j = 1…N. Here, N
denotes the number of QRST complexes during a proto-col stage, and t denotes the time after R-wave peak(110…710 milliseconds). In effect, the repolarizationsegments are aligned along the R-wave peaks (Figure 1,A). The R-wave peaks were tentatively identified asminima of the second derivative of the signal, corre-sponding to a change from a positive signal slope (R-wave upstroke) to a negative slope (R-wave downstroke).For each tentative R-wave position, the algorithm thensearched for the highest amplitude value in the vicinity toidentify the final R-peak position. In general, this algo-rithm was robust and corresponded well to the manuallyidentified R-peak position. It was used previously to as-sess heart rate variability.
Third, during each study stage, we defined the lability atany point t
0 of the repolarization interval as follows.
lability t
f t f t
N
i i
i
N
( )
[ ( ) ( )]
0
1 0 02
1
1
1=
−
−
+
=
−
∑
For personal use. Mass reproduce only with permission from Mayo Clinic Proceedings.
Mayo Clin Proc, January 2003, Vol 78 Catecholamine-Induced T-Wave Lability in LQTS 49
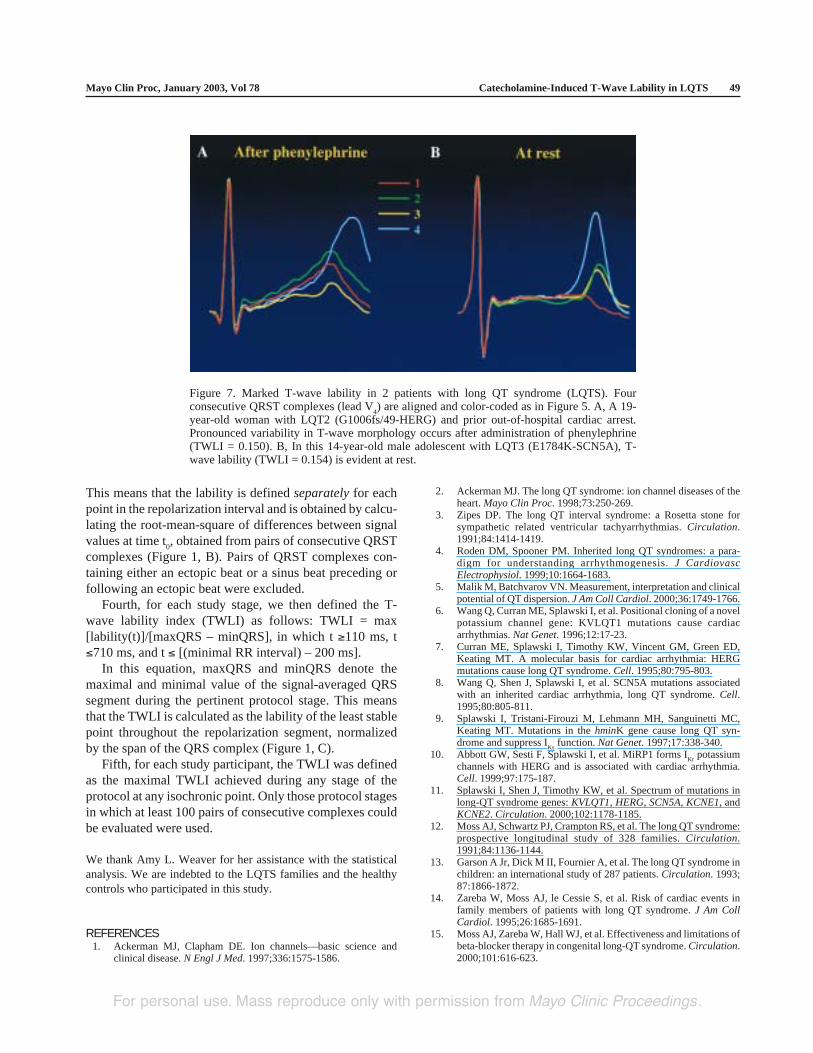
Figure 7. Marked T-wave lability in 2 patients with long QT syndrome (LQTS). Fourconsecutive QRST complexes (lead V
4) are aligned and color-coded as in Figure 5. A, A 19-
year-old woman with LQT2 (G1006fs/49-HERG) and prior out-of-hospital cardiac arrest.Pronounced variability in T-wave morphology occurs after administration of phenylephrine(TWLI = 0.150). B, In this 14-year-old male adolescent with LQT3 (E1784K-SCN5A), T-wave lability (TWLI = 0.154) is evident at rest.
REFERENCES1. Ackerman MJ, Clapham DE. Ion channels—basic science and
clinical disease. N Engl J Med. 1997;336:1575-1586.
This means that the lability is defined separately for eachpoint in the repolarization interval and is obtained by calcu-lating the root-mean-square of differences between signalvalues at time t
0, obtained from pairs of consecutive QRST
complexes (Figure 1, B). Pairs of QRST complexes con-taining either an ectopic beat or a sinus beat preceding orfollowing an ectopic beat were excluded.
Fourth, for each study stage, we then defined the T-wave lability index (TWLI) as follows: TWLI = max[lability(t)]/[maxQRS – minQRS], in which t ≥110 ms, t≤710 ms, and t ≤ [(minimal RR interval) – 200 ms].
In this equation, maxQRS and minQRS denote themaximal and minimal value of the signal-averaged QRSsegment during the pertinent protocol stage. This meansthat the TWLI is calculated as the lability of the least stablepoint throughout the repolarization segment, normalizedby the span of the QRS complex (Figure 1, C).
Fifth, for each study participant, the TWLI was definedas the maximal TWLI achieved during any stage of theprotocol at any isochronic point. Only those protocol stagesin which at least 100 pairs of consecutive complexes couldbe evaluated were used.
We thank Amy L. Weaver for her assistance with the statisticalanalysis. We are indebted to the LQTS families and the healthycontrols who participated in this study.
2. Ackerman MJ. The long QT syndrome: ion channel diseases of theheart. Mayo Clin Proc. 1998;73:250-269.
3. Zipes DP. The long QT interval syndrome: a Rosetta stone forsympathetic related ventricular tachyarrhythmias. Circulation.1991;84:1414-1419.
4. Roden DM, Spooner PM. Inherited long QT syndromes: a para-digm for understanding arrhythmogenesis. J CardiovascElectrophysiol. 1999;10:1664-1683.
5. Malik M, Batchvarov VN. Measurement, interpretation and clinicalpotential of QT dispersion. J Am Coll Cardiol. 2000;36:1749-1766.
6. Wang Q, Curran ME, Splawski I, et al. Positional cloning of a novelpotassium channel gene: KVLQT1 mutations cause cardiacarrhythmias. Nat Genet. 1996;12:17-23.
7. Curran ME, Splawski I, Timothy KW, Vincent GM, Green ED,Keating MT. A molecular basis for cardiac arrhythmia: HERGmutations cause long QT syndrome. Cell. 1995;80:795-803.
8. Wang Q, Shen J, Splawski I, et al. SCN5A mutations associatedwith an inherited cardiac arrhythmia, long QT syndrome. Cell.1995;80:805-811.
9. Splawski I, Tristani-Firouzi M, Lehmann MH, Sanguinetti MC,Keating MT. Mutations in the hminK gene cause long QT syn-drome and suppress I
Ks function. Nat Genet. 1997;17:338-340.
10. Abbott GW, Sesti F, Splawski I, et al. MiRP1 forms IKr
potassiumchannels with HERG and is associated with cardiac arrhythmia.Cell. 1999;97:175-187.
11. Splawski I, Shen J, Timothy KW, et al. Spectrum of mutations inlong-QT syndrome genes: KVLQT1, HERG, SCN5A, KCNE1, andKCNE2. Circulation. 2000;102:1178-1185.
12. Moss AJ, Schwartz PJ, Crampton RS, et al. The long QT syndrome:prospective longitudinal study of 328 families. Circulation.1991;84:1136-1144.
13. Garson A Jr, Dick M II, Fournier A, et al. The long QT syndrome inchildren: an international study of 287 patients. Circulation. 1993;87:1866-1872.
14. Zareba W, Moss AJ, le Cessie S, et al. Risk of cardiac events infamily members of patients with long QT syndrome. J Am CollCardiol. 1995;26:1685-1691.
15. Moss AJ, Zareba W, Hall WJ, et al. Effectiveness and limitations ofbeta-blocker therapy in congenital long-QT syndrome. Circulation.2000;101:616-623.
For personal use. Mass reproduce only with permission from Mayo Clinic Proceedings.

Catecholamine-Induced T-Wave Lability in LQTS Mayo Clin Proc, January 2003, Vol 7850
16. Cruz Filho FE, Maia IG, Fagundes ML, et al. Electrical behavior ofT-wave polarity alternans in patients with congenital long QTsyndrome. J Am Coll Cardiol. 2000;36:167-173.
17. Fujimoto Y, Morita H, Fukushima KK, Ohe T. Nicorandil abol-ished repolarisation alternans in a patient with idiopathic long QTsyndrome. Heart. 1999;82:e8.
18. Motoyasu M, Nishikawa H, Shimizu Y, et al. A case of congenitallong QT syndrome associated with T wave alternans [in Japanese].Kokyu To Junkan. 1992;40:195-198.
19. Schwartz PJ, Malliani A. Electrical alternation of the T-wave:clinical and experimental evidence of its relationship with thesympathetic nervous system and with the long Q-T syndrome. AmHeart J. 1975;89:45-50.
20. Shimizu W, Kamakura S, Arakaki Y, Kamiya T, Shimomura K. Twave alternans in idiopathic long-QT syndrome: insight from bodysurface mapping. Pacing Clin Electrophysiol. 1996;19:1130-1133.
21. Zareba W, Moss AJ, le Cessie S, Hall WJ. T wave alternans inidiopathic long QT syndrome. J Am Coll Cardiol. 1994;23:1541-1546.
22. Kaufman ES, Priori SG, Napolitano C, et al. Electrocardiographicprediction of abnormal genotype in congenital long QT syndrome:experience in 101 related family members. J Cardiovasc Electro-physiol. 2001;12:455-461.
23. Nemec J, Ackerman MJ, Tester DJ, Hejlik J, Shen WK. Catechol-amine-provoked microvoltage T wave alternans in genotyped longQT syndrome. Pacing Clin Electrophysiol. In press.
24. Atiga WL, Calkins H, Lawrence JH, Tomaselli GF, Smith JM,Berger RD. Beat-to-beat repolarization lability identifies patients atrisk for sudden cardiac death. J Cardiovasc Electrophysiol. 1998;9:899-908.
25. Atiga WL, Fananapazir L, McAreavey D, Calkins H, Berger RD.Temporal repolarization lability in hypertrophic cardiomyopathycaused by beta-myosin heavy-chain gene mutations. Circulation.2000;101:1237-1242.
26. Berger RD, Kasper EK, Baughman KL, Marban E, Calkins H,Tomaselli GF. Beat-to-beat QT interval variability: novel evidencefor repolarization lability in ischemic and nonischemic dilated car-diomyopathy. Circulation. 1997;96:1557-1565.
27. Couderc JP, Zareba W, Burattini L, Moss AJ. Beat-to-beat repolar-ization variability in LQTS patients with the SCN5A sodium chan-nel gene mutation. Pacing Clin Electrophysiol. 1999;22:1581-1592.
28. Nolasco JB, Dahlen RW. A graphic method for the study of alter-nation in cardiac action potentials. J Appl Physiol. 1968;25:191-196.
29. Chialvo DR, Jalife J. Non-linear dynamics of cardiac excitation andimpulse propagation. Nature. 1987;330:749-752.
30. Chialvo DR, Gilmour RF Jr, Jalife J. Low dimensional chaos incardiac tissue. Nature. 1990;343:653-657.
31. Karagueuzian HS, Khan SS, Hong K, et al. Action potentialalternans and irregular dynamics in quinidine-intoxicated ventricu-lar muscle cells: implications for ventricular proarrhythmia. Circu-lation. 1993;87:1661-1672.
32. Hondeghem LM, Carlsson L, Duker G. Instability and triangulationof the action potential predict serious proarrhythmia, but actionpotential duration prolongation is antiarrhythmic. Circulation.2001;103:2004-2013.
33. el-Sherif N, Caref EB, Yin H, Restivo M. The electrophysiologicalmechanism of ventricular arrhythmias in the long QT syndrome:tridimensional mapping of activation and recovery patterns. CircRes. 1996;79:474-492.
34. Shimizu W, Antzelevitch C. Cellular and ionic basis for T-wavealternans under long-QT conditions. Circulation. 1999;99:1499-1507.
35. Yan GX, Antzelevitch C. Cellular basis for the normal T wave andthe electrocardiographic manifestations of the long-QT syndrome.Circulation. 1998;98:1928-1936.
36. Antzelevitch C, Shimizu W, Yan GX, et al. The M cell: its con-tribution to the ECG and to normal and abnormal electrical func-tion of the heart. J Cardiovasc Electrophysiol. 1999;10:1124-1152.
37. Moss AJ. Management of patients with the hereditary long QTsyndrome. J Cardiovasc Electrophysiol. 1998;9:668-674.
38. Dorostkar PC, Eldar M, Belhassen B, Scheinman MM. Long-term follow-up of patients with long-QT syndrome treated withbeta-blockers and continuous pacing. Circulation. 1999;100:2431-2436.
39. Malfatto G, Beria G, Sala S, Bonazzi O, Schwartz PJ. Quantitativeanalysis of T wave abnormalities and their prognostic implicationsin the idiopathic long QT syndrome. J Am Coll Cardiol. 1994;23:296-301.
40. Zareba W, Badilini F, Moss AJ. Automatic detection of spatial anddynamic heterogeneity of repolarization. J Electrocardiol. 1994;27(suppl):66-72.
For personal use. Mass reproduce only with permission from Mayo Clinic Proceedings.