CASE REPORTS - Center for Social and Economic Research
316
EuroPACE Market Analysis No. 499 (2019) CASE REPORTS WARSAW BISHKEK KYIV TBILISI CHISINAU MINSK
-
Upload
khangminh22 -
Category
Documents
-
view
4 -
download
0
Transcript of CASE REPORTS - Center for Social and Economic Research
EuroPACE Market Analysis
No. 499 (2019)
CASE REPORTS
W A R S A W B I S H K E K K Y I V T B I L I S I C H I S I N A U M I N S K
“CASE Reports” is a continuation of “CASE Network Studies & Analyses” series.
Keywords: residential building stock, energy efficiency financing, domestic renewable energy supply, retrofit programmes and incentives
JEL codes: D14, H31, O13, O18, Q58, R20
Graphic Design: Katarzyna Godyń-Skoczylas │ grafo-mania
DTP: Campidoglio
ISBN: 978-83-7178-685-3Publisher: CASE – Center for Social and Economic Research al. Jana Pawła II 61, office 212, 01-031 Warsaw, Poland tel.: +48 22 206 29 00, fax: +48 22 206 29 01e-mail: [email protected]://www.case-research.eu
Warsaw, 2019
This report was produced under the EuroPACE project. The EuroPACE project received fund-ing from the European Union’s Horizon 2020 research and innovation programme under grant agreement N°785057. The sole responsibility for the content of this report lies with its authors and does not necessarily reflect the opinion of the European Union. Neither the EASME nor the European Commission are responsible for any use that may be made of the information contained therein.
AcknowledgementsThis Report was written by a team of experts from CASE (Center for Social and Economic Re-search, Warsaw), consisting of: Karolina Beaumont-Leszczynski, Dr. Michele Belloni, Dr. Pedro Afonso Fernandes, Prof. Francesco Figari, Maria Krell, Dr. Ramona Mara, Dr. Vlasis Oikonomou, Dr. Grzegorz Poniatowski, Dr. Izabela Styczyńska, Karolina Zubel.
3
Contents
Spis treściContents ..........................................................................................................................................3
Introduction ....................................................................................................................................4
EuroPACE Market Analysis: Austria (Author: Maria Krell) .....................................................................................................................7
EuroPACE Market Analysis: Belgium (Author: Karolina Beaumont-Leszczynski) ............................................................................ 51
EuroPACE Market Analysis: Italy (Authors: Dr. Michele Belloni, Prof. Francesco Figari) ....................................................... 97
EuroPACE Market Analysis: the Netherlands (Author: Dr. Vlasis Oikonomou).............................................................................................144
EuroPACE Market Analysis: Poland (Author: Karolina Zubel) ..........................................................................................................187
EuroPACE Market Analysis: Portugal (Author: Dr. Pedro Afonso Fernandes) .................................................................................230
EuroPACE Market Analysis: Romania (Author: Dr. Ramona Mara) ....................................................................................................273
4
EuroPACE is an innovative tool designed to make home renovation simple, affordable and reli-able for all Europeans by combining affordable financing with people-centric technical assis-tance. EuroPACE offers 100% up-front financing that can be repaid over a long term of up to 25 years. The innovation lies in the collection and repayment mechanism – financing is attached to the property and is repaid regularly with charges linked to a property. Homeowners are offered logistical and technical support throughout the process and access to trained and qualified con-tractors. Thus, EuroPACE overcomes the main barriers to home renovation – lack of financing, technical knowledge and complexity of the works. The concept of EuroPACE is inspired by the success of a financing model called Property Assessed Clean Energy (PACE), launched in Cali-fornia in 2008. In the United States (US), the PACE market reached over USD 6 billion in funded projects, including the retrofit of over 220,000 homes, which resulted in more than 50,000 new
Introduction
5
CASE Reports | No. 499 (2019)
local jobs and the creation of hundreds new companies. EuroPACE combines the best practices from the US PACE market with project partners’ substantial experience in improving energy ef-ficiency in European buildings. EuroPACE is a three-year project that intends to assess market readiness, deploy a pilot programme in Spain and scale across Europe to four leader cities.
A two-phase research (firstly – legal & fiscal readiness, and secondly – market demand) has been carried to assess the overall readiness for adaptation of this model across the European Union (EU). This document is the second phase of the EuroPACE readiness assessment developed to identify European countries most suited for EuroPACE implementation.1 It complements the legal and fiscal assessment by focusing on the “demand dimension” by analysing local needs for energy efficiency (EE) and renewable energy sources (RES) in residential building renovation of seven selected countries.
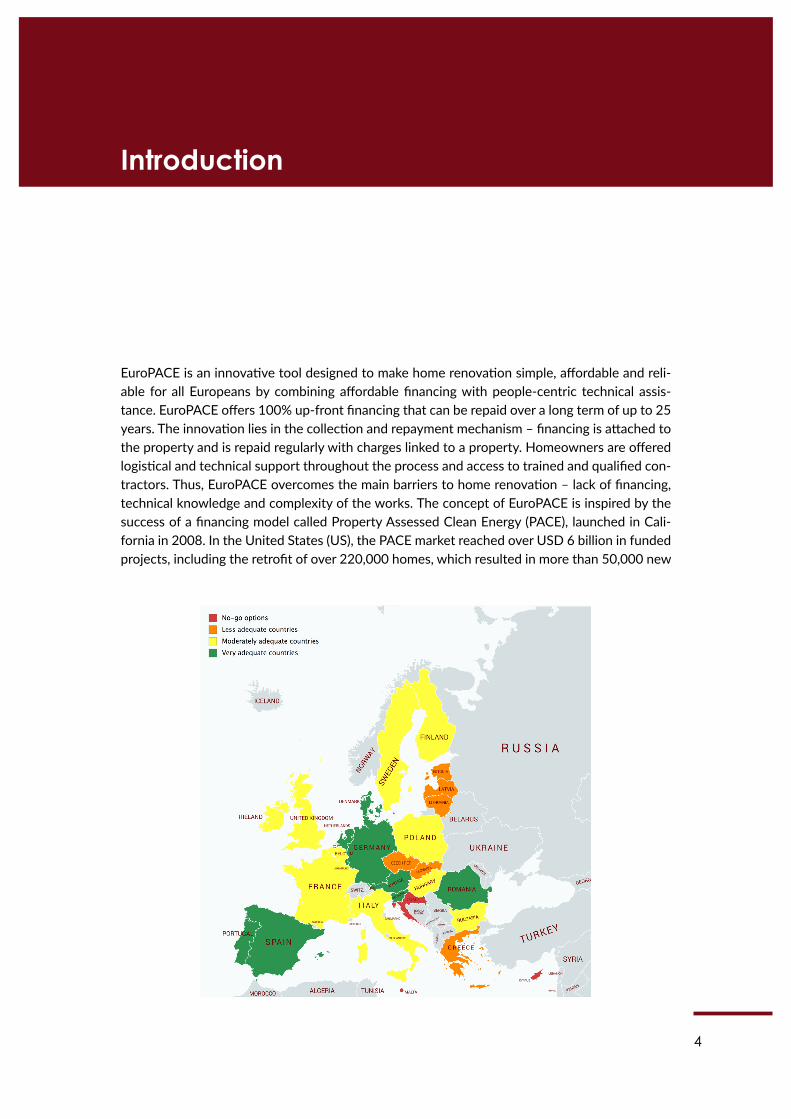
Based on the results of legal and fiscal analysis of the EU28 MS, in October 2018 the Steer-ing Committee Group of the EuroPACE Horizon2020 (H2020) project chose seven countries: Austria, Belgium, the Netherlands, Italy, Poland, Portugal, and Romania, for the second phase of evaluation. These countries were selected based on the scoring outlined in D2.1 and two additional considerations developed by the Steering Committee Group. First, a diverse geo-graphical distribution of the countries was an important element for the selection of these seven countries. Secondly, the knowledge and expertise of the Steering Committee Group about the national potential market opportunity was taken into consideration during the selection process.
While in Austria a similar mechanism has already been tested but was unsuccessful, the country still has been chosen for further analysis. In Belgium, despite being a federal state, there is a strong local and regional interest in new financial mechanisms designed to upscale residential retrofits across the country. In the Netherlands, asset-based financial instruments are currently being discussed at the national level, which opens a window of opportunity for EuroPACE to be tested in the country. As for Italy, although the property-taxation system is far from stable, potential synergies with successful programmes like Ecobonus or Sismabonus should be explored. In Poland, nearly 70% of the 6-million residential buildings need significant energy efficiency overhaul; these buildings contribute to some of the worst air quality across the EU leading to approximately 47 thousand premature deaths annually. Portugal, given its Medi-terranean climate, proves a great potential not only for EE, but also prosumer RES development, given that current incentives are far from sufficient. Romania has been chosen mainly because of its highest home-ownership rate across the EU and the most institutionalised property-related taxation, possibly setting a stable base for EuroPACE being collected alongside existing charges.
The map above demonstrates the country scoring (from green to red). The fact that some of the high-scoring countries were not selected for the second phase of this research does not mean that EuroPACE implementation in those countries is not feasible. EuroPACE is a flexible financing instrument and it can be adapted to fit a variety of local legal, political and market conditions. The EuroPACE consortium is open to further explore the potential for EuroPACE financing programmes in other countries on a case by case basis.
1 The first phase of the EuroPACE readiness assessment focused on the legal and fiscal analysis of the EU 28 can be found on www.europace2020.eu.
6
CASE Reports | No. 499 (2019)
The seven country-reports presented below examine the social and economic conditions of households, social preferences and environmental attitudes of homeowners, as well as level and type of energy used, retrofit programs and incentives that could integrate or blend with the EuroPACE. Energy policies, that might support the programme, have also been identified. The research method is similar to that used in first phase of the assessment: in-country experts with relevant knowledge of their territories were recruited to provide reliable and most up-to-date information. As in case of D2.1, concise SWOT analyses conclude each of the seven country chapters to facilitate further selection of leader cities and regions.
7
Author: Maria Krell
Contents
Acronyms .........................................................................................................................................9
Introduction ................................................................................................................................. 10
Chapter 1: Social and economic conditions of households .............................................. 111.1. Number of households and dwellings........................................................................11
1.2. Household size and structure ......................................................................................11
1.3. Distribution of households by degree of urbanisation ..........................................12
1.4. Income level and economic factors ............................................................................13
Chapter 2: Building characteristics and ownership ............................................................ 152.1. Type of buildings ............................................................................................................15
2.2. Residential buildings characteristics ..........................................................................16
2.2.1. Rented and owned private buildings .................................................................16
2.2.2. Ownership and type of administration .............................................................17
2.2.3. Distribution of the building stock by age .........................................................18
2.3. Constructed, renovated, and demolished buildings and dwellings .....................19
2.3.1. Construction and demolition ..............................................................................19
2.3.2. Renovation trends .................................................................................................20
Chapter 3: Energy consumption in private residential buildings and types of EE/RES investments .......................................................................................... 23
3.1. Detailed breakdown of energy consumption in buildings .....................................23
3.2. Breakdown in terms of energy use for residential buildings .................................24
3.2.1. Types of energy end-use ......................................................................................24
3.2.2. Types of energy ......................................................................................................25
3.3. Trends in energy consumption in residential buildings ..........................................26
3.4. Current level of energy performance of the existing building stock ...................26
EuroPACE Market Analysis: Austria
8
CASE Reports | No. 499 (2019)
3.5. Energy prices for households .......................................................................................28
3.6. Types of currently developed EE/RES investments ................................................29
3.7. Energy poverty ................................................................................................................31
Chapter 4: Barriers to develop the EE/RES potential in private buildings .................... 324.1. Lack of priority, split incentives in case of rental, limited information on EE/RES solutions ..............................................................................................................32
4.1.1. Structural obstacles: federal, provincial, and municipal competences ......32
4.1.2 Bureaucratic obstacles ..........................................................................................32
4.1.3 Financial barriers.....................................................................................................33
4.1.4 Split incentives ........................................................................................................33
4.1.5 Shortage of skilled workers ..................................................................................34
4.2 Social perception .............................................................................................................34
Chapter 5: Policies related to EE/RES in buildings ............................................................. 365.1. Transposition of the European Directive on Energy Performance in Buildings and other EU legislation related to EE/RES in buildings .........................36
5.2. Other legal developments in the area of energy performance in buildings and use of RES in buildings ............................................................................36
5.3. Economic incentives ......................................................................................................37
5.3.1. Demo project “Solar House” ...............................................................................37
5.4. Policies to support households in energy poverty situation .................................38
5.5. Other policy developments ..........................................................................................38
5.6. Initiatives at the local level to promote EE/RES in private buildings ..................39
5.6.1. Klima:aktiv ...............................................................................................................39
5.6.2. “Klimabündnis” (Climate Alliance) ......................................................................39
5.6.3. Climate and energy model regions ....................................................................40
Conclusions .................................................................................................................................. 41
References ................................................................................................................................... 43
9
CASE Reports | No. 499 (2019)
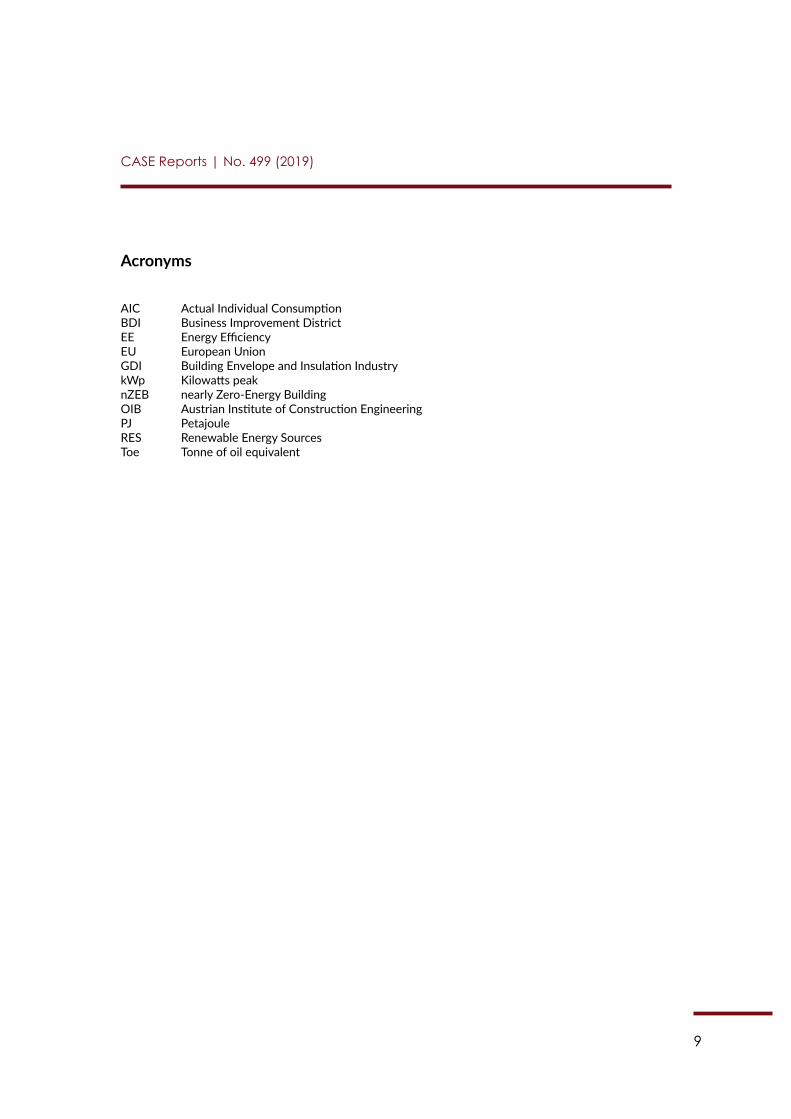
Acronyms
AIC Actual Individual ConsumptionBDI Business Improvement DistrictEE Energy EfficiencyEU European UnionGDI Building Envelope and Insulation IndustrykWp Kilowatts peaknZEB nearly Zero-Energy Building OIB Austrian Institute of Construction EngineeringPJ PetajouleRES Renewable Energy SourcesToe Tonne of oil equivalent
10
CASE Reports | No. 499 (2019)
Introduction
This study analyses the potential market uptake for EuroPACE – a home-based financing mecha-nism to be developed in Austria. In order to enable this assessment, the study presents an over-view of the characteristics of private residential buildings and households and policy measures regarding energy efficiency (EE), energy demand and renewable energy sources (RES) in the residential sector. It does so by considering the different factors of Austria’s building stock that can facilitate or hinder investments in EE.
The Austrian case is in many perspectives interesting: building stock, tenure status, and pol-icy measures vary between nine federal states, which makes an overall assessment sometimes difficult. The last register-based census conducted in 2011 counted 1.97 million residential buildings and more than 4.44 million dwellings in Austria. Between 2004 and 2014, the average annual renovation rate was 0.6%. The majority of buildings are older than 30 years and many of today’s dwellings were constructed between 1970 and 1990. These buildings are more energy consuming than newer ones and thus offer high energy savings potential.
An analysis of the social and economic conditions of households along with the various char-acteristics of the building stock shows that Austrian households are among the more prosperous within the European Union (EU), but that they also spend a substantial part of their total housing costs on energy – on average 25%. Around 45% of the Austrian population are tenants, which means that only around half of the population lives in a dwelling they or their family owns. In 2017, 48% of main residences in Austria were occupied by the owner (out of which 37% were houses and 11% apartments). Improved thermal insulation standards and heating systems lead to a reduction of energy consumption per dwelling; however, owners of buildings are usually more interested than tenants in pursuing retrofits. At the same time, thus far, even ambitious improvements have been partly offset by other developments, such as the overall increase in average living space in homes, a preference for higher room temperatures, and an increase in the total number of dwellings available.1
Indeed, a wide range of economic incentives exist to support investments to improve the en-ergy performance of private residential buildings. The federal government has ambitious goals regarding environment protection, EE, and RES, as outlined in their ‘#mission2030’. The newly developed roadmap by the Austrian government aims to push EE and environment protection forward. The still ongoing and well-known renovation drive of the Austrian government, a sub-sidy promoting the renovation of buildings launched in 2009, mirrors that priority.
Nevertheless, there are still obstacles that slow down or even hinder investments. These bar-riers include a lack of skilled workers in the construction sector, bureaucratic obstacles, financial barriers, and the difficulty for a landlord to increase rent after renovation measures. This paper will assess whether and to what extent these barriers would affect EuroPACE. Given Austria’s regional particularities, much of the data used in this study relies on Eurostat, which provides a broad range of data, and the Austrian Federal Statistical Agency, Statistik Austria.
1 Reinhard Jellinek. 2018. “Energy Efficiency Trends and Policies in Austria.” Austrian Energy Agency, p. 6 and 21. Ac-cessed 4 March 2019. http://www.odyssee-mure.eu/publications/national-reports/energy-efficiency-austria.pdf
11
CASE Reports | No. 499 (2019)
Chapter 1: Social and economic conditions of households
1.1. Number of households and dwellings
With a population of 8.8 million and an area of 83,882 km2, Austria is classified as one of the smaller countries of the EU.2 However, the country shows an upward trend in population growth, which is predicted to continue. While the total number of households is 3.89 million (2017), the latest forecast released by Statistik Austria suggests a population of 9 million inhabitants in 2022 and expects the number of private households to grow to 4.1 million by 2025.3
In 2011, the last register-based census counted 1.97 million residential buildings and a total of 4,441,408 dwellings in Austria. Of the dwellings, 796,450 were serving secondary or seasonal purposes or had no residence registration recorded for them.4 The next register-based census is planned in 2021.5
1.2. Household size and structure
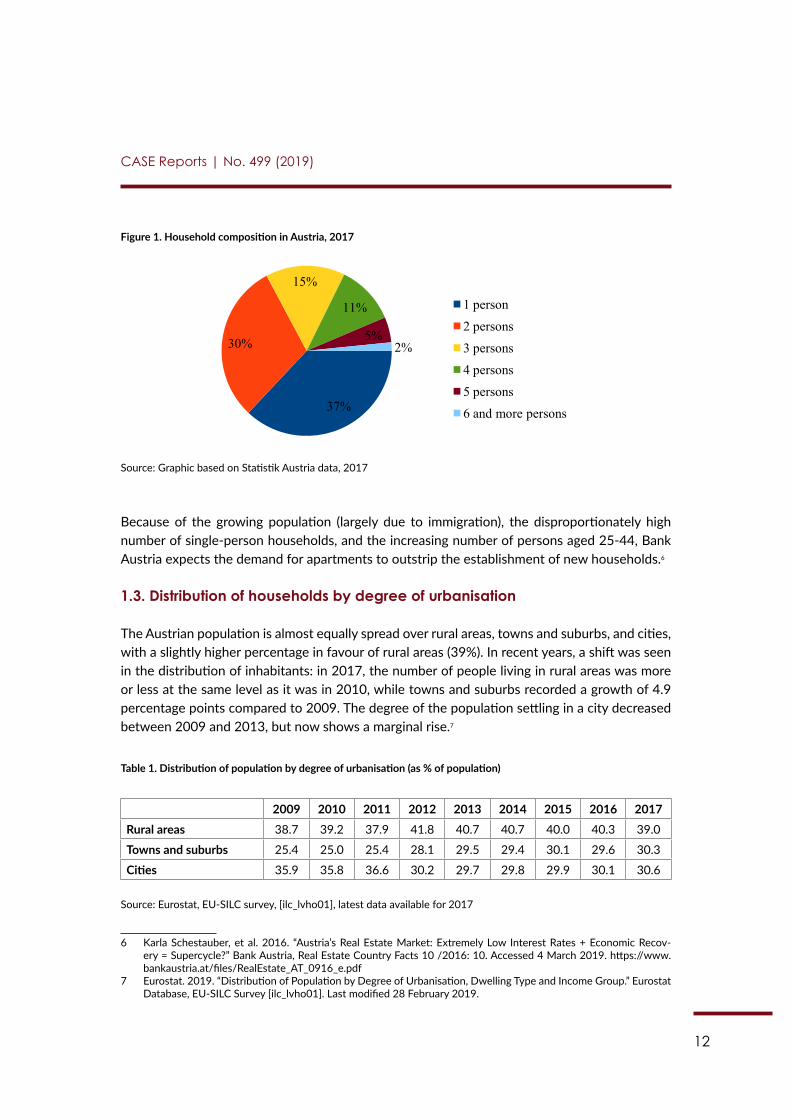
The average Austrian household size is 2.22 persons. With regard to the past 10 years, the trend clearly points towards smaller households – that is, one- or two-person households. In 2017, one- and two-person households accounted for almost 70% of households in Austria. Figure 1 shows the current household composition.
2 Statistik Austria. 2019. “Bevölkerung zu Jahresbeginn seit 1952 nach Bundesland.” Last modified 12 February 2019. Accessed 4 March. https://www.statistik.at/web_de/statistiken/menschen_und_gesellschaft/bevoelker-ung/bevoelkerungsstand_und_veraenderung/bevoelkerung_zu_jahres-_quartalsanfang/031770.html; Eva Huber-Bachmann. 2019. “Österreich: Zahlen, Daten, Fakten.” Vienna: Statistik Austria, p. 9. Available under https://www.statistik.at/web_de/services/oesterreich_zahlen_daten_fakten/index.html
3 Statistik Austria. 2018. “Vorausberechnete Bevölkerungsstruktur für Österreich 2017-2100 laut Hauptszenario.” Last modified 22 November 2018. Accessed 4 March 2019. https://www.statistik.at/web_de/statistiken/men-schen_und_gesellschaft/bevoelkerung/demographische_prognosen/bevoelkerungsprognosen/027308.html; Statistik Austria. 2018a. “Ein- und Mehrpersonenhaushalte 2011 bis 2080.” Last modified 19 December 2018. Accessed 4 March 2019.
4 Statistik Austria. 2014. “Dwellings.” Last modified 24 October 2014. Accessed 4 March 2019. http://www.statistik.at/web_en/statistics/PeopleSociety/housing/stock_of_buildings_and_dwellings/dwellings/index.html
5 Gabriela Petrovic. 2017. “Entwurf eines Sozialversicherungs-Zuordnungsgesetzes: Zu GZ. BMASK-21119/0002-II/A/1/2017. Stellungnahme der Bundesanstalt Statistik Österreich.” Statistik Austria, Press Release, p. 3. Accessed 4 March 2019. https://www.parlament.gv.at/PAKT/VHG/XXV/SNME/SNME_09643/imfname_623714.pdf
12
CASE Reports | No. 499 (2019)
Figure 1. Household composition in Austria, 2017
10
Figure 1. Household composition in Austria, 2017
Source: Graphic based on Statistik Austria data, 2017
Because of the growing population (largely due to immigration), the disproportionately high number of single-person households, and the increasing number of persons aged 25-44, Bank Austria expects the demand for apartments to outstrip the establishment of new households.7
1.3. Distribution of households by degree of urbanisation
The Austrian population is almost equally spread over rural areas, towns and suburbs, and cities, with a slightly higher percentage in favour of rural areas (39%). In recent years, a shift was seen in the distribution of inhabitants: in 2017, the number of people living in rural areas was more or less at the same level as it was in 2010, while towns and suburbs recorded a growth of 4.9 percentage points compared to 2009. The degree of the population settling in a city decreased between 2009 and 2013, but now shows a marginal rise.8
Table 1. Distribution of population by degree of urbanisation (as % of population)
2009 2010 2011 2012 2013 2014 2015 2016 2017
Rural areas 38.7 39.2 37.9 41.8 40.7 40.7 40.0 40.3 39.0
Towns and suburbs 25.4 25.0 25.4 28.1 29.5 29.4 30.1 29.6 30.3
Cities 35.9 35.8 36.6 30.2 29.7 29.8 29.9 30.1 30.6
Source: Eurostat, EU-SILC survey, [ilc_lvho01], latest data available for 2017
1.4. Income level and economic factors
Austrian private households have a median disposable income of EUR 36,554 a year.9 The net equivalised household income, a measure used to allow comparisons between households of different sizes and 7 Karla Schestauber, et al. 2016. “Austria’s Real Estate Market: Extremely Low Interest Rates + Economic Recovery = Supercycle?” Bank Austria, Real Estate Country Facts 10 /2016: 10. Accessed 4 March 2019. https://www.bankaustria.at/files/RealEstate_AT_0916_e.pdf 8 Eurostat. 2019. “Distribution of Population by Degree of Urbanisation, Dwelling Type and Income Group.” Eurostat Database, EU-SILC Survey [ilc_lvho01]. Last modified 28 February 2019. 9 Statistik Austria. 2018b. “Household Income.” Last modified 9 July 2018. Accessed 4 March 2019. https://www.statistik.at/web_en/statistics/PeopleSociety/social_statistics/household_income/index.html
37%
30%
15%
11%
5% 2%
1 person
2 persons 3 persons
4 persons
5 persons 6 and more persons
Source: Graphic based on Statistik Austria data, 2017
Because of the growing population (largely due to immigration), the disproportionately high number of single-person households, and the increasing number of persons aged 25-44, Bank Austria expects the demand for apartments to outstrip the establishment of new households.6
1.3. Distribution of households by degree of urbanisation
The Austrian population is almost equally spread over rural areas, towns and suburbs, and cities, with a slightly higher percentage in favour of rural areas (39%). In recent years, a shift was seen in the distribution of inhabitants: in 2017, the number of people living in rural areas was more or less at the same level as it was in 2010, while towns and suburbs recorded a growth of 4.9 percentage points compared to 2009. The degree of the population settling in a city decreased between 2009 and 2013, but now shows a marginal rise.7
Table 1. Distribution of population by degree of urbanisation (as % of population)
2009 2010 2011 2012 2013 2014 2015 2016 2017Rural areas 38.7 39.2 37.9 41.8 40.7 40.7 40.0 40.3 39.0
Towns and suburbs 25.4 25.0 25.4 28.1 29.5 29.4 30.1 29.6 30.3
Cities 35.9 35.8 36.6 30.2 29.7 29.8 29.9 30.1 30.6
Source: Eurostat, EU-SILC survey, [ilc_lvho01], latest data available for 2017
6 Karla Schestauber, et al. 2016. “Austria’s Real Estate Market: Extremely Low Interest Rates + Economic Recov-ery = Supercycle?” Bank Austria, Real Estate Country Facts 10 /2016: 10. Accessed 4 March 2019. https://www.bankaustria.at/files/RealEstate_AT_0916_e.pdf
7 Eurostat. 2019. “Distribution of Population by Degree of Urbanisation, Dwelling Type and Income Group.” Eurostat Database, EU-SILC Survey [ilc_lvho01]. Last modified 28 February 2019.
13
CASE Reports | No. 499 (2019)
1.4. Income level and economic factors
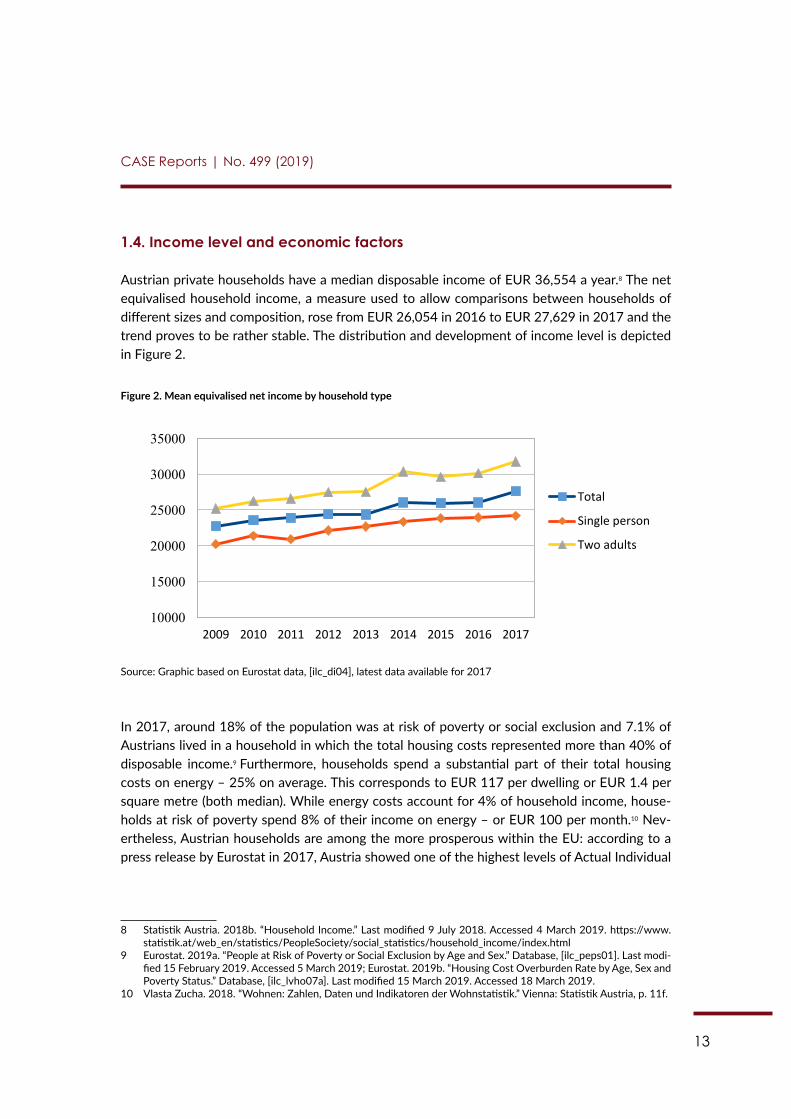
Austrian private households have a median disposable income of EUR 36,554 a year.8 The net equivalised household income, a measure used to allow comparisons between households of different sizes and composition, rose from EUR 26,054 in 2016 to EUR 27,629 in 2017 and the trend proves to be rather stable. The distribution and development of income level is depicted in Figure 2.
Figure 2. Mean equivalised net income by household type
11
composition, rose from EUR 26,054 in 2016 to EUR 27,629 in 2017 and the trend proves to be rather stable. The distribution and development of income level is depicted in Figure 2.
Figure 2. Mean equivalised net income by household type
Source: Graphic based on Eurostat data, [ilc_di04], latest data available for 2017
In 2017, around 18% of the population was at risk of poverty or social exclusion and 7.1% of Austrians lived in a household in which the total housing costs represented more than 40% of disposable income.10
Furthermore, households spend a substantial part of their total housing costs on energy – 25% on average. This corresponds to EUR 117 per dwelling or EUR 1.4 per square metre (both median). While energy costs account for 4% of household income, households at risk of poverty spend 8% of their income on energy – or EUR 100 per month.11 Nevertheless, Austrian households are among the more prosperous within the EU: according to a press release by Eurostat in 2017, Austria showed one of the highest levels of Actual Individual Consumption (AIC)12 per capita within the EU, with only Luxembourg and Germany higher on the list.13 Thus, many Austrians should not find it burdensome to invest more in their household.
It can be concluded that because of the growing population and a disproportionately high number of single-person households (which is estimated to increase even more), the demand for new dwellings will become more pressing. As a side effect, the shortage of skilled construction workers in Austria (see Chapter 4) might become more acute and hinder renovation activities. On the other hand, given that Austrian households are among the most prosperous within the EU, they are in a position to invest in EE
10 Eurostat. 2019a. “People at Risk of Poverty or Social Exclusion by Age and Sex.” Database, [ilc_peps01]. Last modified 15 February 2019. Accessed 5 March 2019; Eurostat. 2019b. “Housing Cost Overburden Rate by Age, Sex and Poverty Status.” Database, [ilc_lvho07a]. Last modified 15 March 2019. Accessed 18 March 2019. 11 Vlasta Zucha. 2018. “Wohnen: Zahlen, Daten und Indikatoren der Wohnstatistik.” Vienna: Statistik Austria, p. 11f. 12 The AIC is a measure of the material welfare of households. It refers to all services and goods consumed by households. 13 Renata Palen. 2018. “Consumption per Capita in Purchasing Power Standards in 2017.” Eurostat Press Office, Press Release 192/2018. Accessed 4 March 2019. https://ec.europa.eu/eurostat/documents/2995521/9447627/2-13122018-AP-EN.pdf/5975f52d-b92b-448d-8c5c-0532a4d50430
2009 2010 2011 2012 2013 2014 2015 2016 2017 10000
15000
20000
25000
30000
35000
Total
Single person
Two adults
Source: Graphic based on Eurostat data, [ilc_di04], latest data available for 2017
In 2017, around 18% of the population was at risk of poverty or social exclusion and 7.1% of Austrians lived in a household in which the total housing costs represented more than 40% of disposable income.9 Furthermore, households spend a substantial part of their total housing costs on energy – 25% on average. This corresponds to EUR 117 per dwelling or EUR 1.4 per square metre (both median). While energy costs account for 4% of household income, house-holds at risk of poverty spend 8% of their income on energy – or EUR 100 per month.10 Nev-ertheless, Austrian households are among the more prosperous within the EU: according to a press release by Eurostat in 2017, Austria showed one of the highest levels of Actual Individual
8 Statistik Austria. 2018b. “Household Income.” Last modified 9 July 2018. Accessed 4 March 2019. https://www.statistik.at/web_en/statistics/PeopleSociety/social_statistics/household_income/index.html
9 Eurostat. 2019a. “People at Risk of Poverty or Social Exclusion by Age and Sex.” Database, [ilc_peps01]. Last modi-fied 15 February 2019. Accessed 5 March 2019; Eurostat. 2019b. “Housing Cost Overburden Rate by Age, Sex and Poverty Status.” Database, [ilc_lvho07a]. Last modified 15 March 2019. Accessed 18 March 2019.
10 Vlasta Zucha. 2018. “Wohnen: Zahlen, Daten und Indikatoren der Wohnstatistik.” Vienna: Statistik Austria, p. 11f.
14
CASE Reports | No. 499 (2019)
Consumption (AIC)11 per capita within the EU, with only Luxembourg and Germany higher on the list.12 Thus, many Austrians should not find it burdensome to invest more in their household.
It can be concluded that because of the growing population and a disproportionately high number of single-person households (which is estimated to increase even more), the demand for new dwellings will become more pressing. As a side effect, the shortage of skilled construction workers in Austria (see Chapter 4) might become more acute and hinder renovation activities. On the other hand, given that Austrian households are among the most prosperous within the EU, they are in a position to invest in EE measures.13 This fact opens up possibilities for Euro-PACE along with additional training for construction workers.
11 The AIC is a measure of the material welfare of households. It refers to all services and goods consumed by house-holds.
12 Renata Palen. 2018. “Consumption per Capita in Purchasing Power Standards in 2017.” Eurostat Press Office, Press Release 192/2018. Accessed 4 March 2019. https://ec.europa.eu/eurostat/documents/2995521/9447627/2-13122018-AP-EN.pdf/5975f52d-b92b-448d-8c5c-0532a4d50430
13 Ute Wöhrmann. 2016. “Österreichs Haushalte überdurchschnittlich wohlhabend.” Statista. Accessed 4 March 2019. https://de.statista.com/infografik/7216/tatsaechlicher-individualverbrauch--tiv--in-oesterreich/ and OÖ-Nachrichten. 2017. “Österreichs Haushalte am drittwohlhabendsten.” OÖNachrichten, 14 December 2017. Accessed 4 March 2019. https://www.nachrichten.at/nachrichten/wirtschaft/OEsterreichs-Haushalte-am-drittwohlhabendsten;art15,2761892
15
CASE Reports | No. 499 (2019)
Chapter 2: Building characteristics and ownership
2.1. Type of buildings
As already mentioned, the last census in 2011 counted 1.97 million residential buildings and more than 4.44 million dwellings in Austria. The numbers show an increase in residential build-ing stock (+12.1%) as well as in the number of dwellings (+15%) compared to 2001 census.14
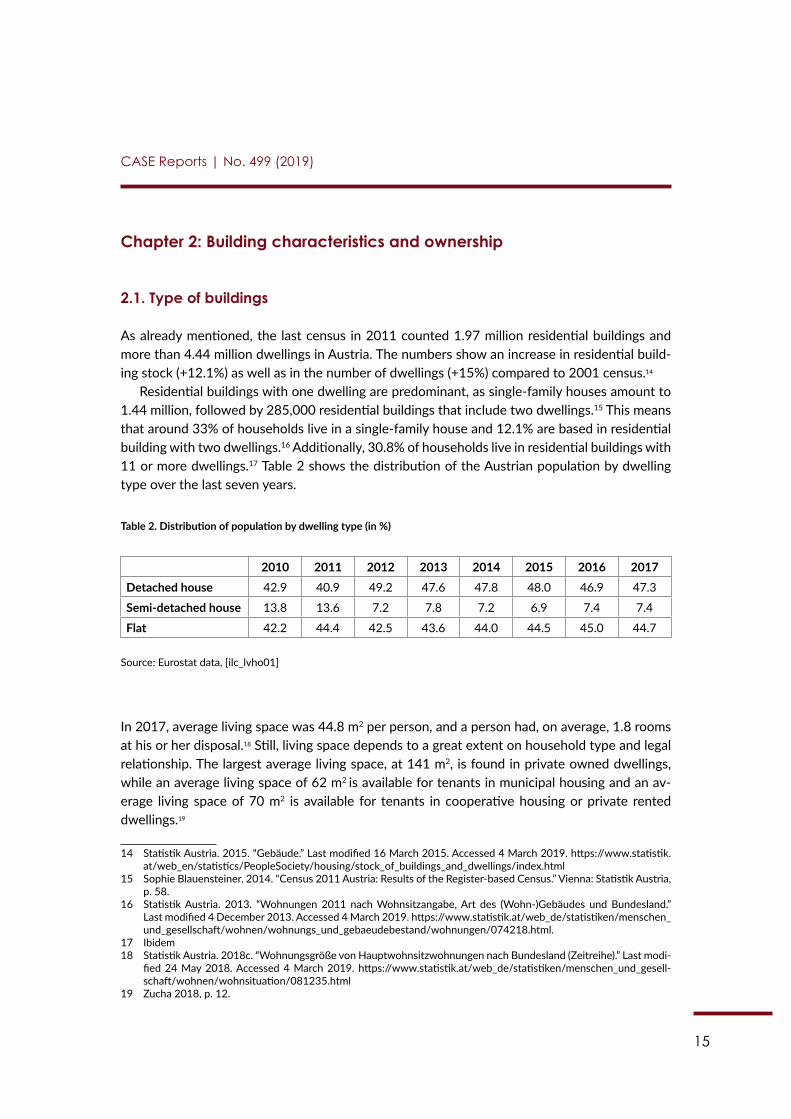
Residential buildings with one dwelling are predominant, as single-family houses amount to 1.44 million, followed by 285,000 residential buildings that include two dwellings.15 This means that around 33% of households live in a single-family house and 12.1% are based in residential building with two dwellings.16 Additionally, 30.8% of households live in residential buildings with 11 or more dwellings.17 Table 2 shows the distribution of the Austrian population by dwelling type over the last seven years.
Table 2. Distribution of population by dwelling type (in %)
2010 2011 2012 2013 2014 2015 2016 2017Detached house 42.9 40.9 49.2 47.6 47.8 48.0 46.9 47.3
Semi-detached house 13.8 13.6 7.2 7.8 7.2 6.9 7.4 7.4
Flat 42.2 44.4 42.5 43.6 44.0 44.5 45.0 44.7
Source: Eurostat data, [ilc_lvho01]
In 2017, average living space was 44.8 m2 per person, and a person had, on average, 1.8 rooms at his or her disposal.18 Still, living space depends to a great extent on household type and legal relationship. The largest average living space, at 141 m2, is found in private owned dwellings, while an average living space of 62 m2 is available for tenants in municipal housing and an av-erage living space of 70 m2 is available for tenants in cooperative housing or private rented dwellings.19
14 Statistik Austria. 2015. “Gebäude.” Last modified 16 March 2015. Accessed 4 March 2019. https://www.statistik.at/web_en/statistics/PeopleSociety/housing/stock_of_buildings_and_dwellings/index.html
15 Sophie Blauensteiner. 2014. “Census 2011 Austria: Results of the Register-based Census.” Vienna: Statistik Austria, p. 58.
16 Statistik Austria. 2013. “Wohnungen 2011 nach Wohnsitzangabe, Art des (Wohn-)Gebäudes und Bundesland.” Last modified 4 December 2013. Accessed 4 March 2019. https://www.statistik.at/web_de/statistiken/menschen_und_gesellschaft/wohnen/wohnungs_und_gebaeudebestand/wohnungen/074218.html.
17 Ibidem18 Statistik Austria. 2018c. “Wohnungsgröße von Hauptwohnsitzwohnungen nach Bundesland (Zeitreihe).” Last modi-
fied 24 May 2018. Accessed 4 March 2019. https://www.statistik.at/web_de/statistiken/menschen_und_gesell-schaft/wohnen/wohnsituation/081235.html
19 Zucha 2018, p. 12.
16
CASE Reports | No. 499 (2019)
Another interesting result of the 2011 census was that in all federal provinces the number of apartment buildings has increased to a much higher extent than the number of single- or double-family houses compared to 2001 – with Vienna as the only exception.20 This is mainly caused by growing property prices and an increasing demand for housing in densely populated central regions.21
2.2. Residential buildings characteristics
2.2.1. Rented and owned private buildings
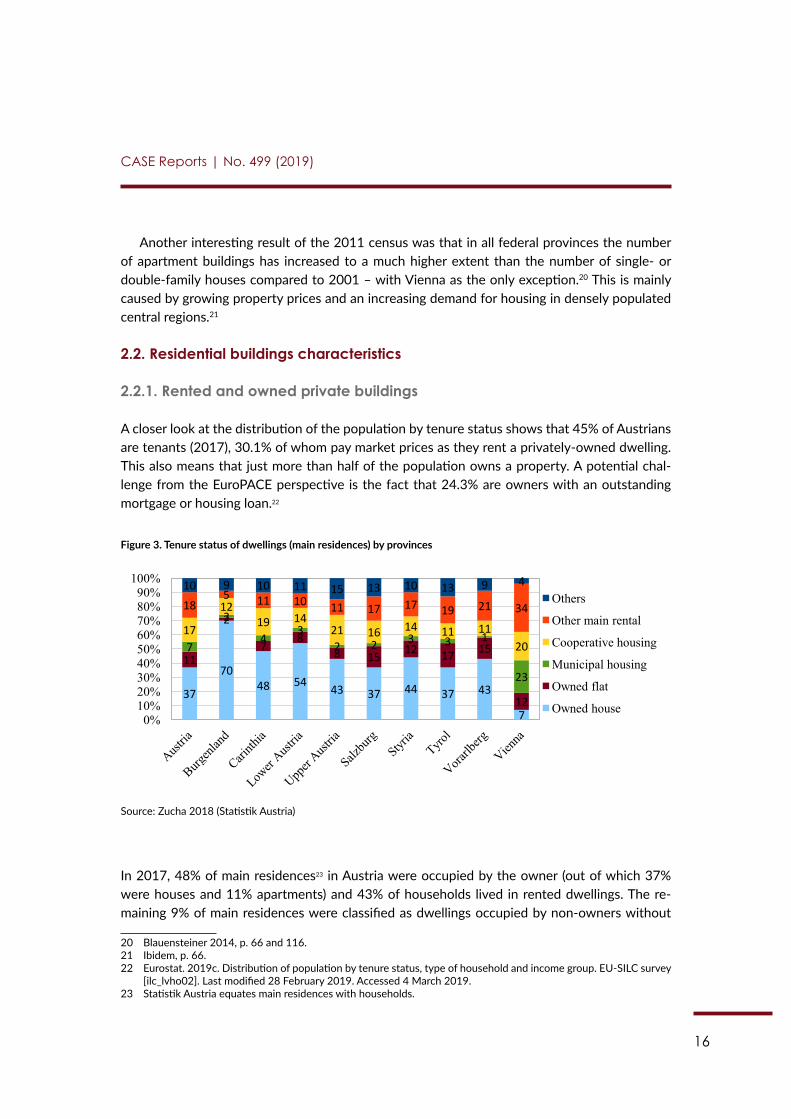
A closer look at the distribution of the population by tenure status shows that 45% of Austrians are tenants (2017), 30.1% of whom pay market prices as they rent a privately-owned dwelling. This also means that just more than half of the population owns a property. A potential chal-lenge from the EuroPACE perspective is the fact that 24.3% are owners with an outstanding mortgage or housing loan.22
Figure 3. Tenure status of dwellings (main residences) by provinces
13
compared to 2001 – with Vienna as the only exception.21 This is mainly caused by growing property prices and an increasing demand for housing in densely populated central regions.22
2.2. Residential buildings characteristics
2.2.1. Rented and owned private buildings
A closer look at the distribution of the population by tenure status shows that 45% of Austrians are tenants (2017), 30.1% of whom pay market prices as they rent a privately-owned dwelling. This also means that just more than half of the population owns a property. A potential challenge from the EuroPACE perspective is the fact that 24.3% are owners with an outstanding mortgage or housing loan.23
Figure 3. Tenure status of dwellings (main residences) by provinces
Source: Zucha 2018 (Statistik Austria) In 2017, 48% of main residences24 in Austria were occupied by the owner (out of which 37% were houses and 11% apartments) and 43% of households lived in rented dwellings. The remaining 9% of main residences were classified as dwellings occupied by non-owners without the obligation to pay rent (e.g. official lodgings).25 As Figure 3 shows, there are considerable differences between the federal provinces regarding the tenure status of dwellings. For instance, in Vienna, the share of households living in their own house is marginal, while in Burgenland, the majority of households lives in their own house.26 To clarify the owner-tenant relationship, one has to take a closer look at the different forms of housing. Cooperative dwellings are built by a limited profit housing association and rented (or sometimes sold) to their members. Therefore, a potential tenant or buyer has to be member of the association to rent or buy cooperative housing. Limited housing associations pass a part of the land and construction costs to
21 Blauensteiner 2014, p. 66 and 116. 22 Ibidem, p. 66. 23 Eurostat. 2019c. Distribution of population by tenure status, type of household and income group. EU-SILC survey [ilc_lvho02]. Last modified 28 February 2019. Accessed 4 March 2019. 24 Statistik Austria equates main residences with households. 25 Zucha 2018, p. 21. 26 Ibidem, p. 22.
37
70 48 54 43 37 44 37 43
7
11
2
7 8
8 15 12 17 15
12
7
2
4 3
2 2 3 3 1
23
17
12 19 14
21 16 14 11 11 20
18 5 11 10 11 17 17 19 21 34
10 9 10 11 15 13 10 13 9 4
0% 10% 20% 30% 40% 50% 60% 70% 80% 90%
100% Others
Other main rental
Cooperative housing
Municipal housing
Owned flat
Owned house
Source: Zucha 2018 (Statistik Austria)
In 2017, 48% of main residences23 in Austria were occupied by the owner (out of which 37% were houses and 11% apartments) and 43% of households lived in rented dwellings. The re-maining 9% of main residences were classified as dwellings occupied by non-owners without
20 Blauensteiner 2014, p. 66 and 116.21 Ibidem, p. 66.22 Eurostat. 2019c. Distribution of population by tenure status, type of household and income group. EU-SILC survey
[ilc_lvho02]. Last modified 28 February 2019. Accessed 4 March 2019.23 Statistik Austria equates main residences with households.
17
CASE Reports | No. 499 (2019)
the obligation to pay rent (e.g. official lodgings).24 As Figure 3 shows, there are considerable dif-ferences between the federal provinces regarding the tenure status of dwellings. For instance, in Vienna, the share of households living in their own house is marginal, while in Burgenland, the majority of households lives in their own house.25 To clarify the owner-tenant relationship, one has to take a closer look at the different forms of housing. Cooperative dwellings are built by a limited profit housing association and rented (or sometimes sold) to their members. Therefore, a potential tenant or buyer has to be member of the association to rent or buy cooperative hous-ing. Limited housing associations pass a part of the land and construction costs to tenants in the form of a financial contribution (Finanzierungsbeitrag), which is paid back to the tenant after the termination of the rental agreement with an annual depreciation of 1%.26 Furthermore, eligible candidates have to fulfil different requirements depending on the federal province. Such criteria could regard age, citizenship, and income.27 Similar criteria apply to municipal housing – dwell-ings built and provided by cities and municipalities.28 Municipal housing is part of social housing policy – that is, dwellings in this category are rented to deprived persons. Due to the low rent and high security – contracts are usually not limited in time29 – long waiting lists exist in many cities and communities.30 Both cooperative and municipal housing are subsidised and thus are cheaper dwellings.
2.2.2. Ownership and type of administration
Several types of groups can claim ownership of Austria’s residential building stock: private and legal persons, public bodies, and limited profit housing associations. Legal persons are under-stood as companies or associations, while public bodies include – as defined by Statistik Austria – the federal state and provinces, municipalities, and other public corporations like chambers or recognised religious communities.31 Table 3 shows the ownership of the various buildings in 2011.
24 Zucha 2018, p. 21.25 Ibidem, p. 22.26 Federal Ministry of Digitalization and Business Location. 2019. “Genossenschaftswohnungen.” Website of the
Federal Ministry of Digitalization and Business Location. Accessed 4 March 2019. https://www.help.gv.at/Portal.Node/hlpd/public/content/21/Seite.210250.html#Kosten; Arbeiterkammer Wien. 2016. “Genossenschaftswoh-nungen: Reduzierte Mieten, gemeinnützige Bauträger.” Website Arbeiterkammer Wien. Accessed 4 March 2019. https://wien.arbeiterkammer.at/beratung/Wohnen/jungeswohnen/Genossenschaftswohnungen.html
27 Federal Ministry of Digitalization and Business Location 2019. 28 Federal Ministry of Digitalization and Business Location. 2019a. “Gemeindewohnungen.” Website. Accessed 4
March 2019. https://www.help.gv.at/Portal.Node/hlpd/public/content/21/Seite.210240.html 29 Zucha 2018, p. 36.30 Der Standard. 2016. “Wiener Wohn-Ticket: Zuzügler müssen länger warten.” Der Standard, 14 July 2016. Accessed
4 March 2019. https://derstandard.at/2000041084033/Wiener-Wohn-Ticket-Zuzuegler-muessen-laenger-warten 31 Statistik Austria. 2013a. “Gebäude 2011 nach überwiegender Gebäudeeigenschaft, Eigentümertyp und
Bundesland.” Last modified 4 December 2013. Accessed 4 March 2019. https://www.statistik.at/web_de/statis-tiken/menschen_und_gesellschaft/wohnen/wohnungs_und_gebaeudebestand/Gebaeude/074174.html
18
CASE Reports | No. 499 (2019)
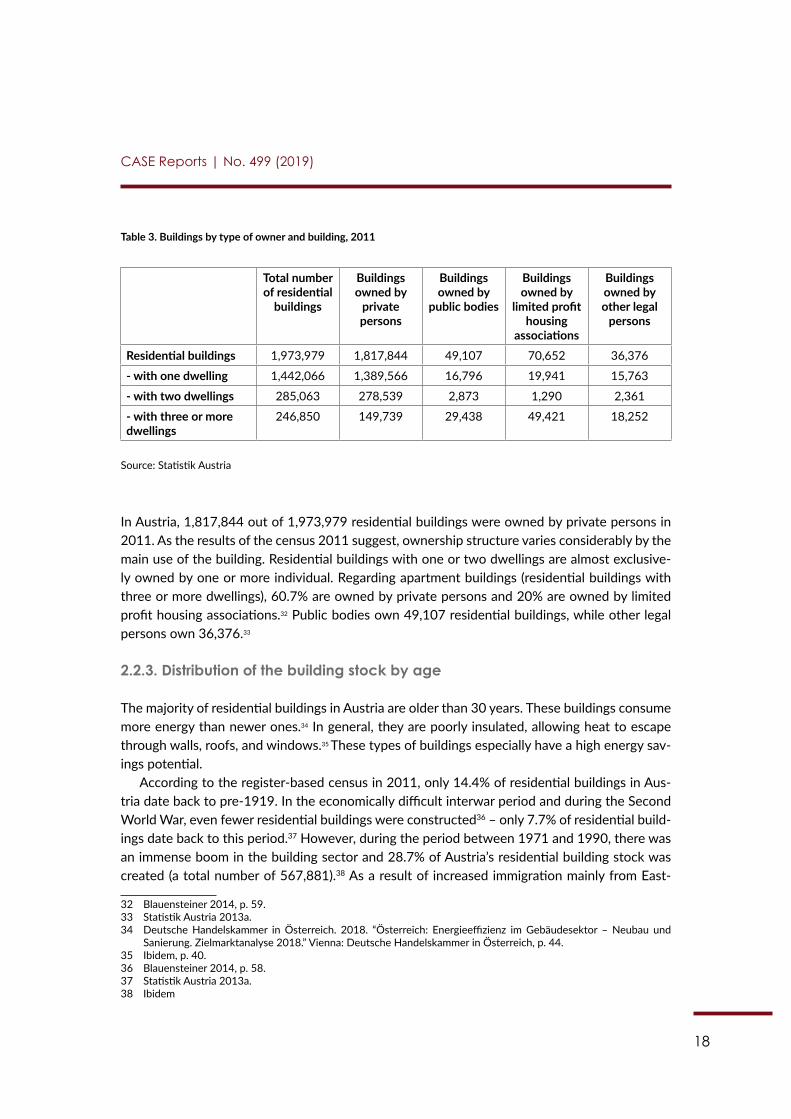
Table 3. Buildings by type of owner and building, 2011
Total number of residential
buildings
Buildings owned by
private persons
Buildings owned by
public bodies
Buildings owned by
limited profit housing
associations
Buildings owned by other legal
persons
Residential buildings 1,973,979 1,817,844 49,107 70,652 36,376
- with one dwelling 1,442,066 1,389,566 16,796 19,941 15,763
- with two dwellings 285,063 278,539 2,873 1,290 2,361
- with three or more dwellings
246,850 149,739 29,438 49,421 18,252
Source: Statistik Austria
In Austria, 1,817,844 out of 1,973,979 residential buildings were owned by private persons in 2011. As the results of the census 2011 suggest, ownership structure varies considerably by the main use of the building. Residential buildings with one or two dwellings are almost exclusive-ly owned by one or more individual. Regarding apartment buildings (residential buildings with three or more dwellings), 60.7% are owned by private persons and 20% are owned by limited profit housing associations.32 Public bodies own 49,107 residential buildings, while other legal persons own 36,376.33
2.2.3. Distribution of the building stock by age
The majority of residential buildings in Austria are older than 30 years. These buildings consume more energy than newer ones.34 In general, they are poorly insulated, allowing heat to escape through walls, roofs, and windows.35 These types of buildings especially have a high energy sav-ings potential.
According to the register-based census in 2011, only 14.4% of residential buildings in Aus-tria date back to pre-1919. In the economically difficult interwar period and during the Second World War, even fewer residential buildings were constructed36 – only 7.7% of residential build-ings date back to this period.37 However, during the period between 1971 and 1990, there was an immense boom in the building sector and 28.7% of Austria’s residential building stock was created (a total number of 567,881).38 As a result of increased immigration mainly from East-
32 Blauensteiner 2014, p. 59.33 Statistik Austria 2013a. 34 Deutsche Handelskammer in Österreich. 2018. “Österreich: Energieeffizienz im Gebäudesektor – Neubau und
Sanierung. Zielmarktanalyse 2018.” Vienna: Deutsche Handelskammer in Österreich, p. 44.35 Ibidem, p. 40.36 Blauensteiner 2014, p. 58.37 Statistik Austria 2013a.38 Ibidem
19
CASE Reports | No. 499 (2019)
ern Europe, construction activity in the mid-1990s remained intense with 24.9% of residential buildings having been constructed post-1990.39
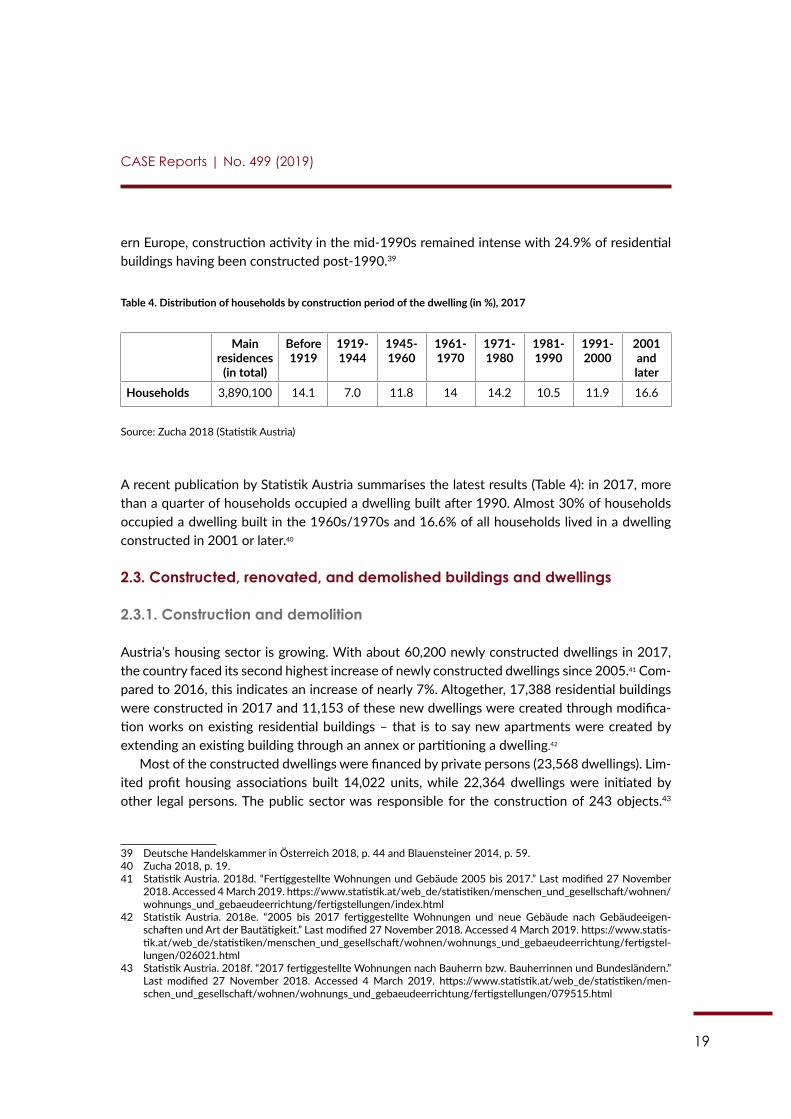
Table 4. Distribution of households by construction period of the dwelling (in %), 2017
Main residences
(in total)
Before 1919
1919- 1944
1945- 1960
1961- 1970
1971-1980
1981-1990
1991- 2000
2001 and later
Households 3,890,100 14.1 7.0 11.8 14 14.2 10.5 11.9 16.6
Source: Zucha 2018 (Statistik Austria)
A recent publication by Statistik Austria summarises the latest results (Table 4): in 2017, more than a quarter of households occupied a dwelling built after 1990. Almost 30% of households occupied a dwelling built in the 1960s/1970s and 16.6% of all households lived in a dwelling constructed in 2001 or later.40
2.3. Constructed, renovated, and demolished buildings and dwellings
2.3.1. Construction and demolition
Austria’s housing sector is growing. With about 60,200 newly constructed dwellings in 2017, the country faced its second highest increase of newly constructed dwellings since 2005.41 Com-pared to 2016, this indicates an increase of nearly 7%. Altogether, 17,388 residential buildings were constructed in 2017 and 11,153 of these new dwellings were created through modifica-tion works on existing residential buildings – that is to say new apartments were created by extending an existing building through an annex or partitioning a dwelling.42
Most of the constructed dwellings were financed by private persons (23,568 dwellings). Lim-ited profit housing associations built 14,022 units, while 22,364 dwellings were initiated by other legal persons. The public sector was responsible for the construction of 243 objects.43
39 Deutsche Handelskammer in Österreich 2018, p. 44 and Blauensteiner 2014, p. 59.40 Zucha 2018, p. 19.41 Statistik Austria. 2018d. “Fertiggestellte Wohnungen und Gebäude 2005 bis 2017.” Last modified 27 November
2018. Accessed 4 March 2019. https://www.statistik.at/web_de/statistiken/menschen_und_gesellschaft/wohnen/wohnungs_und_gebaeudeerrichtung/fertigstellungen/index.html
42 Statistik Austria. 2018e. “2005 bis 2017 fertiggestellte Wohnungen und neue Gebäude nach Gebäudeeigen-schaften und Art der Bautätigkeit.” Last modified 27 November 2018. Accessed 4 March 2019. https://www.statis-tik.at/web_de/statistiken/menschen_und_gesellschaft/wohnen/wohnungs_und_gebaeudeerrichtung/fertigstel-lungen/026021.html
43 Statistik Austria. 2018f. “2017 fertiggestellte Wohnungen nach Bauherrn bzw. Bauherrinnen und Bundesländern.” Last modified 27 November 2018. Accessed 4 March 2019. https://www.statistik.at/web_de/statistiken/men-schen_und_gesellschaft/wohnen/wohnungs_und_gebaeudeerrichtung/fertigstellungen/079515.html
20
CASE Reports | No. 499 (2019)
Overall, according to Statistik Austria, 6.8 dwellings per 1,000 inhabitants were constructed in 2017.44
2.3.2. Renovation trends
On the other hand, an increasing trend can be observed in the household renovation spending. Between 2010 and 2015, spending on dwelling renovation has climbed by 9.7% – from EUR 2.3 to 2.6 billion. However, considering household renovation spending as a share of disposable income, it decreased slightly from 1.26% (2010) to 1.25% (2015), while still remaining above the EU-average (0.8%).45 One reason for the increase in renovation spending could be the renovation drive of the Austrian government, which was launched in 2009. Within this framework, renova-tion measures aiming at the improvement of EE in private residential buildings were subsidised.
In general, there is not a lot of reliable data on the renovation rate of residential buildings or the energy performance of the building stock.46 This makes it difficult to evaluate building activ-ity or to compare developments between federal provinces. The lack of data also hampers the creation of adequate strategies and policy measures.
The Austrian environmental organisation Global 2000 points out that the only data which allows conclusions to be drawn concerning renovation activity often results from the use of buildings subsidies.47 According to the organisation, in 2016 renovation was, with an average rate of 0.4%, at an all-time low in Austria – but again, it is important to bear in mind that their estimations are built only on claimed subsidies for building renovation.48 Upper Austria (0.8%), Tyrol (0.6%), and Carinthia (0.5%) had the highest renovation rates in 2016,49 while Burgenland (0.1%) and Salzburg (0.2%) were at the bottom of the ranking.50 The situation in terms of data availability is slightly better for the province of Upper Austria. In a report regarding the construc-tion of buildings in the province, the authors of the study list the number of thermal renovations for 2017: 7,634 dwellings were renovated compared to 9,188 in 2016 and 11,717 in 2015. The authors explain the decreasing trend in renovation with a shortage of skilled workers – which makes it not only difficult to pursue renovations but also leads to an increase in prices. Further-more, due to relatively low energy prices, owners do not feel much pressure to invest in renova-tion measures.51
44 Not included are modification works in Vienna, see Statistik Austria 2018e.45 European Commission. 2018. “European Construction Sector Observatory: Country. Country Profile Austria.” Ref.
Ares(2018)3388314, 26 June 2018, p. 17.46 Raphael Bointner, Lukas Kranzl, and Agne Toleikyte. 2016. “Zebra2020: Niedrigstenergiegebäude Strategien 2020.”
ZEBRA2020 – Bericht, 15 September 2016, p. 49 and Thomas Steffl. 2018. “Global 2000: Wohnbaucheck 2018.” Global 2000, p. 27 and 40. Accessed 4 March 2019. https://www.global2000.at/sites/global/files/Report-Wohn-baucheck-2018.pdf
47 Steffl 2018, p. 40.48 Ibidem, p. 40.49 Ibidem, p. 34. 50 Ibidem, p. 26. 51 Irene Simade. 2017. “Wohnbaubericht 2017: Leistungen, Finanzierung, Ziele.” Landesregierung Oberösterreich,
Wohnbauförderung, p. 25. Accessed 4 March 2019. https://www.land-oberoesterreich.gv.at/files/publikationen/Wo_Wohnbaubericht.pdf
21
CASE Reports | No. 499 (2019)
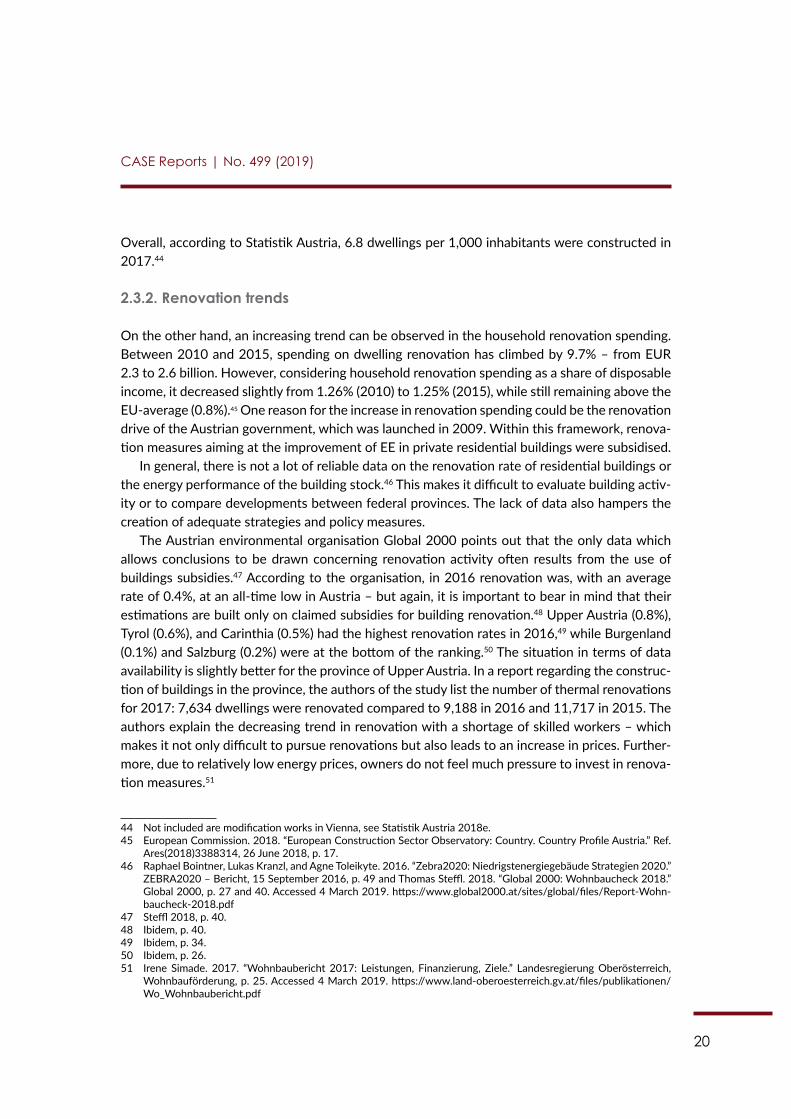
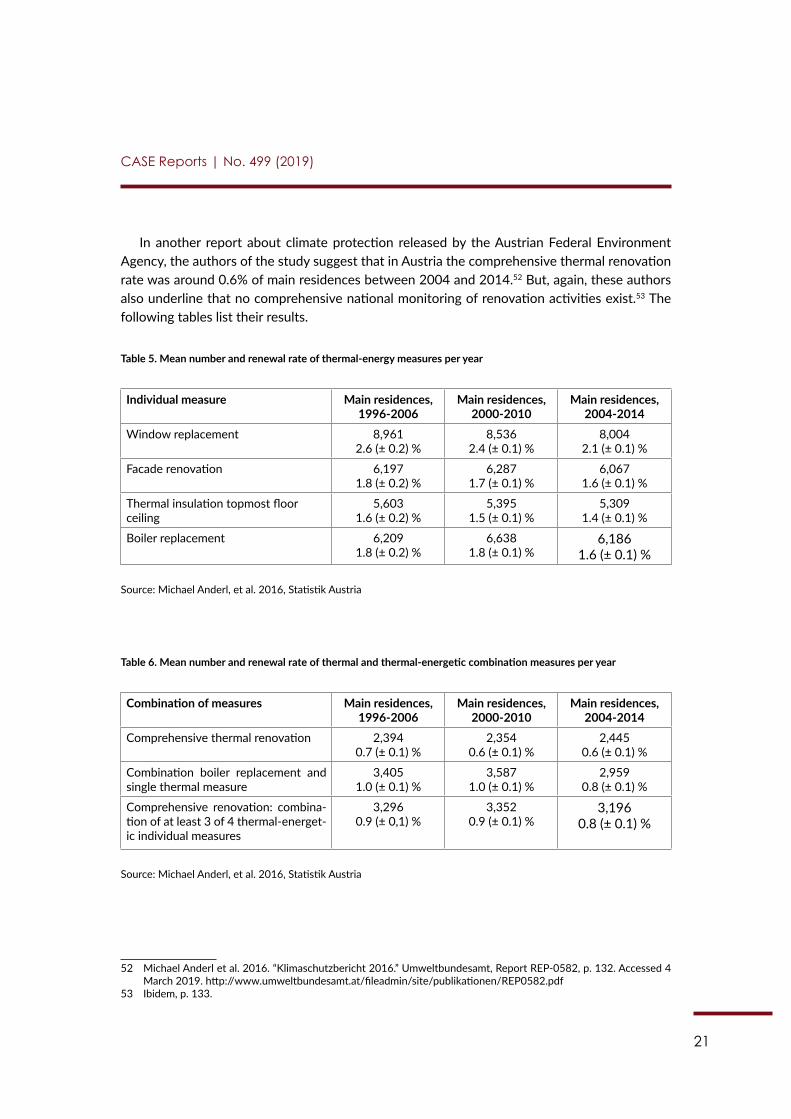
In another report about climate protection released by the Austrian Federal Environment Agency, the authors of the study suggest that in Austria the comprehensive thermal renovation rate was around 0.6% of main residences between 2004 and 2014.52 But, again, these authors also underline that no comprehensive national monitoring of renovation activities exist.53 The following tables list their results.
Table 5. Mean number and renewal rate of thermal-energy measures per year
Individual measure Main residences, 1996-2006
Main residences, 2000-2010
Main residences, 2004-2014
Window replacement 8,961 2.6 (± 0.2) %
8,5362.4 (± 0.1) %
8,0042.1 (± 0.1) %
Facade renovation 6,197 1.8 (± 0.2) %
6,2871.7 (± 0.1) %
6,0671.6 (± 0.1) %
Thermal insulation topmost floor ceiling
5,603 1.6 (± 0.2) %
5,3951.5 (± 0.1) %
5,3091.4 (± 0.1) %
Boiler replacement 6,209 1.8 (± 0.2) %
6,6381.8 (± 0.1) %
6,1861.6 (± 0.1) %
Source: Michael Anderl, et al. 2016, Statistik Austria
Table 6. Mean number and renewal rate of thermal and thermal-energetic combination measures per year
Combination of measures Main residences, 1996-2006
Main residences, 2000-2010
Main residences, 2004-2014
Comprehensive thermal renovation 2,3940.7 (± 0.1) %
2,3540.6 (± 0.1) %
2,4450.6 (± 0.1) %
Combination boiler replacement and single thermal measure
3,4051.0 (± 0.1) %
3,5871.0 (± 0.1) %
2,9590.8 (± 0.1) %
Comprehensive renovation: combina-tion of at least 3 of 4 thermal-energet-ic individual measures
3,2960.9 (± 0,1) %
3,3520.9 (± 0.1) %
3,1960.8 (± 0.1) %
Source: Michael Anderl, et al. 2016, Statistik Austria
52 Michael Anderl et al. 2016. “Klimaschutzbericht 2016.” Umweltbundesamt, Report REP-0582, p. 132. Accessed 4 March 2019. http://www.umweltbundesamt.at/fileadmin/site/publikationen/REP0582.pdf
53 Ibidem, p. 133.
22
CASE Reports | No. 499 (2019)
One should keep in mind that renovation rates are closely connected to renovation prices. Global 2000 calculates these costs with the help of a model case.54 Their results suggest the fol-lowing: a comprehensive thermal renovation (insulation of the outer wall, top floor ceiling, and basement ceiling; new windows; and a new heating system – pellet heating) costs EUR 56,000, but subsidies for these measures can amount to EUR 20,000. For a renovation (insulation of the outer wall and top floor ceiling, sealing of windows instead of replacing them, and no exchange of the heating system), the environmental organisation indicates EUR 25,000, with possible sub-sidies amounting to EUR 9,000. Version 3, window replacement, costs 20,000 EUR, according to Global 2000. Finally, house owners who only want to insulate the top floor ceiling pay EUR 3,000.55
In another model calculation released by GDI (Building Envelope and Insulation Industry, Gebäudehülle + Dämmstoff Industrie) and based on results of the Vienna University of Technology (TU Wien), a comprehensive thermal renovation with the exchange of the heating system costs up to EUR 512 per m2, and without exchange of the heating system, up to EUR 437/m2.56 This price is much higher than in most EU countries according to Zebra2020 data tool.
In summary, there is still a great potential for measures directed towards EE in the Austrian residential sector. The majority of dwellings in Austria are older than 30 years, which suggests there exists a high potential for energy savings given that retrofitting is preferred instead of the construction of new buildings. At the same time, prices for renovations are high when compared to other EU Member States. However, a bigger problem may be ownership structure: only 48% of main residences in Austria are occupied by the owner (out of which 37% are houses and 11% are apartments), while 43% of households live in rented dwellings. As EuroPACE is addressed mainly to homeowners, the target group might be rather limited, especially compared to other countries where homeowners constitute 80% or more of the population. Finally, insufficient data on renovation rates and energy performance makes any estimation or strategy develop-ment difficult.
54 According to the organisation, the costs are calculated with the aid of an average Austrian house: that is, an un-renovated single-family, two-storied house with a floor area of 150 m2 and oil heating, occupied by 4 persons and dated back to the 1970s. See Global 2000. “Thermische Sanierung.” Website. Accessed 6 March 2019. https://www.global2000.at/thermische-sanierung
55 Ibidem56 GDI 2050. 2016. “Kurzfassung TU-Studie: Thermisch-energetische Sanierung und Modernisierung in Öster-
reich.” Accessed 5 March 2019. https://webcache.googleusercontent.com/search?q=cache:3pi33Hg1O6AJ:https://gdi2050.at/de/downloads.html%3Ffile%3Dfiles/gdi/download/TU-Studie_Gebaeudesanierung_Oesterreich_Kurzfassung.pdf+&cd=1&hl=pl&ct=clnk&gl=pl
23
CASE Reports | No. 499 (2019)
Chapter 3: Energy consumption in private residential buildings and types of EE/RES investments
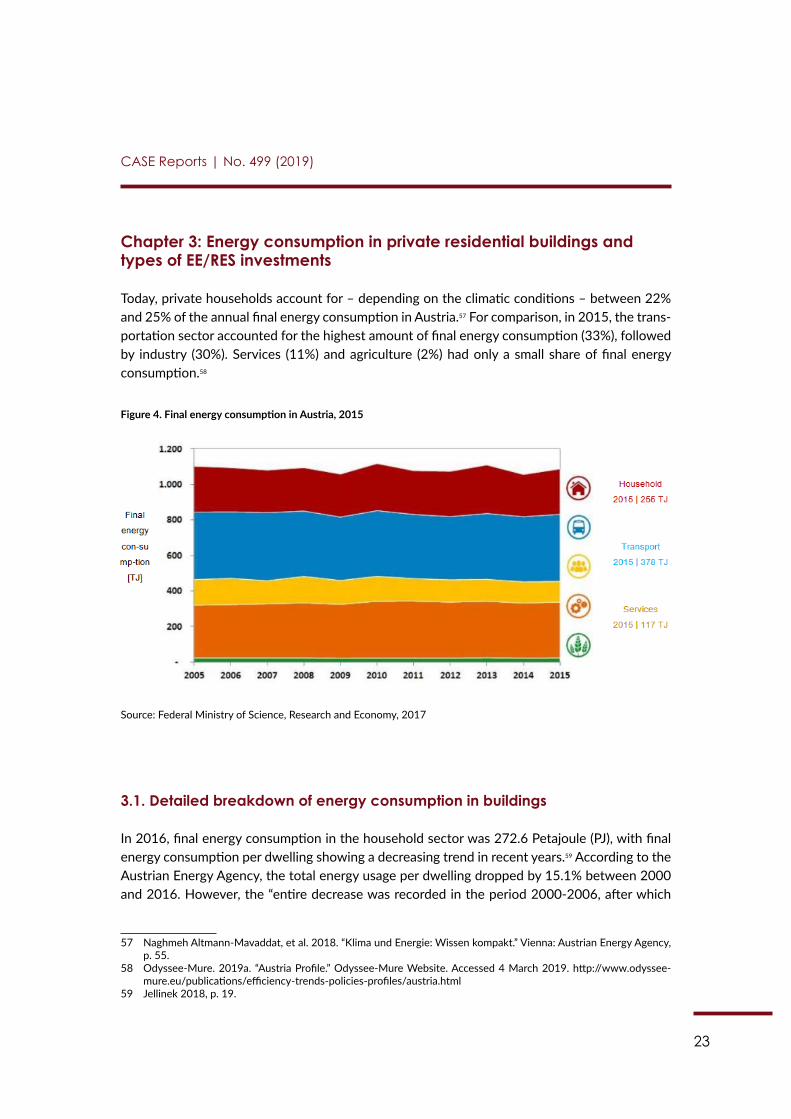
Today, private households account for – depending on the climatic conditions – between 22% and 25% of the annual final energy consumption in Austria.57 For comparison, in 2015, the trans-portation sector accounted for the highest amount of final energy consumption (33%), followed by industry (30%). Services (11%) and agriculture (2%) had only a small share of final energy consumption.58
Figure 4. Final energy consumption in Austria, 2015
Source: Federal Ministry of Science, Research and Economy, 2017
3.1. Detailed breakdown of energy consumption in buildings
In 2016, final energy consumption in the household sector was 272.6 Petajoule (PJ), with final energy consumption per dwelling showing a decreasing trend in recent years.59 According to the Austrian Energy Agency, the total energy usage per dwelling dropped by 15.1% between 2000 and 2016. However, the “entire decrease was recorded in the period 2000-2006, after which
57 Naghmeh Altmann-Mavaddat, et al. 2018. “Klima und Energie: Wissen kompakt.” Vienna: Austrian Energy Agency, p. 55.
58 Odyssee-Mure. 2019a. “Austria Profile.” Odyssee-Mure Website. Accessed 4 March 2019. http://www.odyssee-mure.eu/publications/efficiency-trends-policies-profiles/austria.html
59 Jellinek 2018, p. 19.
24
CASE Reports | No. 499 (2019)
consumption fluctuated but overall rose again until 2016”.60 Between 2000 and 2016, overall EE expressed through the ODEX indicator61 improved by 20%. Most of the improvements were achieved by households, which saw efficiency increased by 32%, compared to the EU average of 26.5% (between 2000 and 2015).62 The main drivers for the energy savings in the residential sector were related to improved thermal insulation standards and more efficient heating sys-tems, although changes in heating behaviour also accounted for a small amount of the savings.63
3.2. Breakdown in terms of energy use for residential buildings
3.2.1. Types of energy end-use
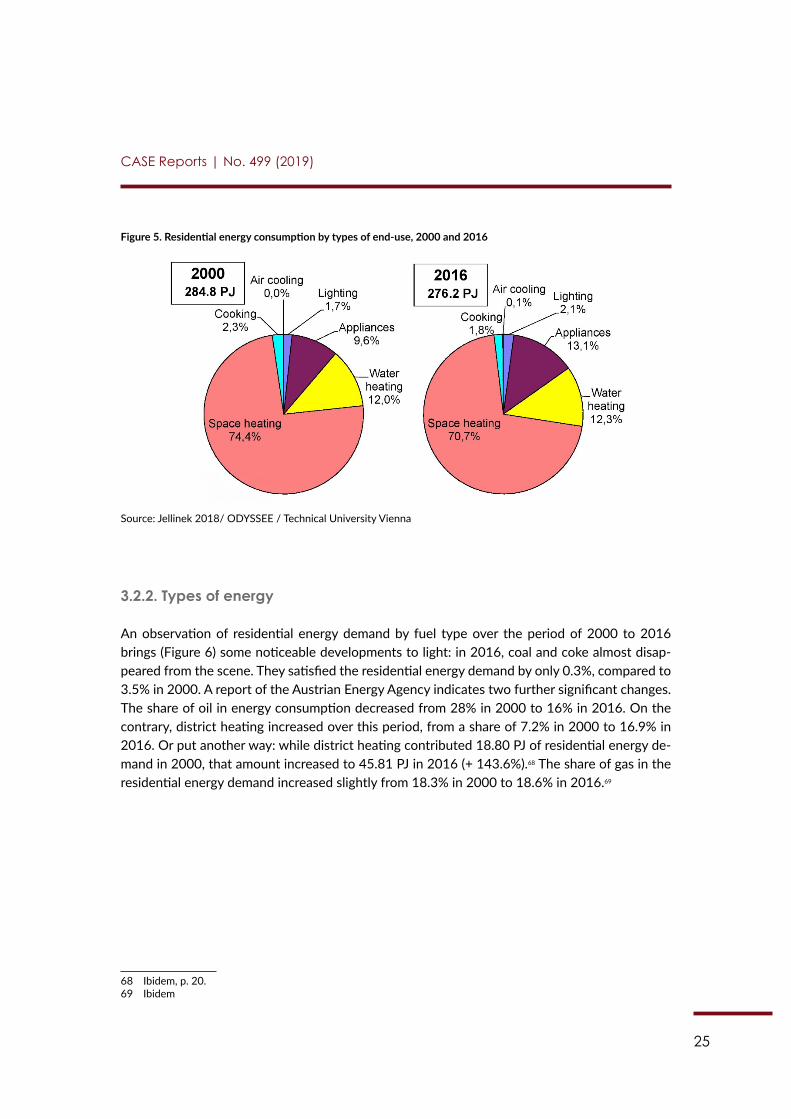
Figure 5 shows the development of and changes in residential energy consumption by types of end-use in 2000 and 2016. With a share of 70.7%, space heating (climate corrected) was still the dominant end-use in 2016, although its share decreased by 3.4 percentage points (2000: 74.4%). Better insulation led to energy savings, but according to the Austrian Energy Agency the “effect is weakened by more dwellings, larger surface areas and higher room temperatures.”64
While there were no major changes in the share of lighting, cooking, and water heating, the statistics show an increase in the end-use of electric appliances from 9.6% to 13.1%.65 Accord-ing to the Austrian Energy Agency, the growing rate of “electrical household appliances (dish-washers: +73%, dryers: +190%, between 2000 and 2016) exceeds the effect of more efficient appliances by far”.66 The share of air cooling in energy consumption – at 0.1% in 2016 – is still negligible.67
60 Ibidem, p. 22. 61 ODEX is an index to “measure the energy efficiency progress by main sector (industry, transport, households) and
for the whole economy”. According to a definition by the Odyssee-Mure project, which uses the index to measure the energy efficiency progress, ODEX is constructed the following way: “For each sector, the index is calculated as a weighted average of sub-sectoral indices of energy efficiency progress; sub-sectors being industrial or service sector branches or end-uses for households or transport modes. (…) For households, the evaluation is carried out at the level of 3 end-uses (heating, water heating, cooking) and 5 large appliances (refrigerators, freezers, washing ma-chines, dishwashers and TVs).” For more information see Odyssee-Mure. 2019b. “Definition of ODEX indicators in ODYSSEE Data Base.” Accessed 4 March 2019. http://www.odyssee-mure.eu/publications/other/odex-indicators-database-definition.pdf
62 Bruno Lapillonne et al. 2018. “Regional training on indicators Odyssee-Mure: Energy Efficiency Trends by Sector. ODEX.” May 2018. Accessed March 5, 2019. Available under http://www.odyssee-mure.eu/events/workshops/training-vienna/odex-odyssee-april-2018.pdf
63 Jellinek 2018, p. 21f. 64 Ibidem, p. 21.65 Ibidem66 Ibidem, p. 21 and 6.67 Ibidem, p. 21.
25
CASE Reports | No. 499 (2019)
Figure 5. Residential energy consumption by types of end-use, 2000 and 2016
Source: Jellinek 2018/ ODYSSEE / Technical University Vienna
3.2.2. Types of energy
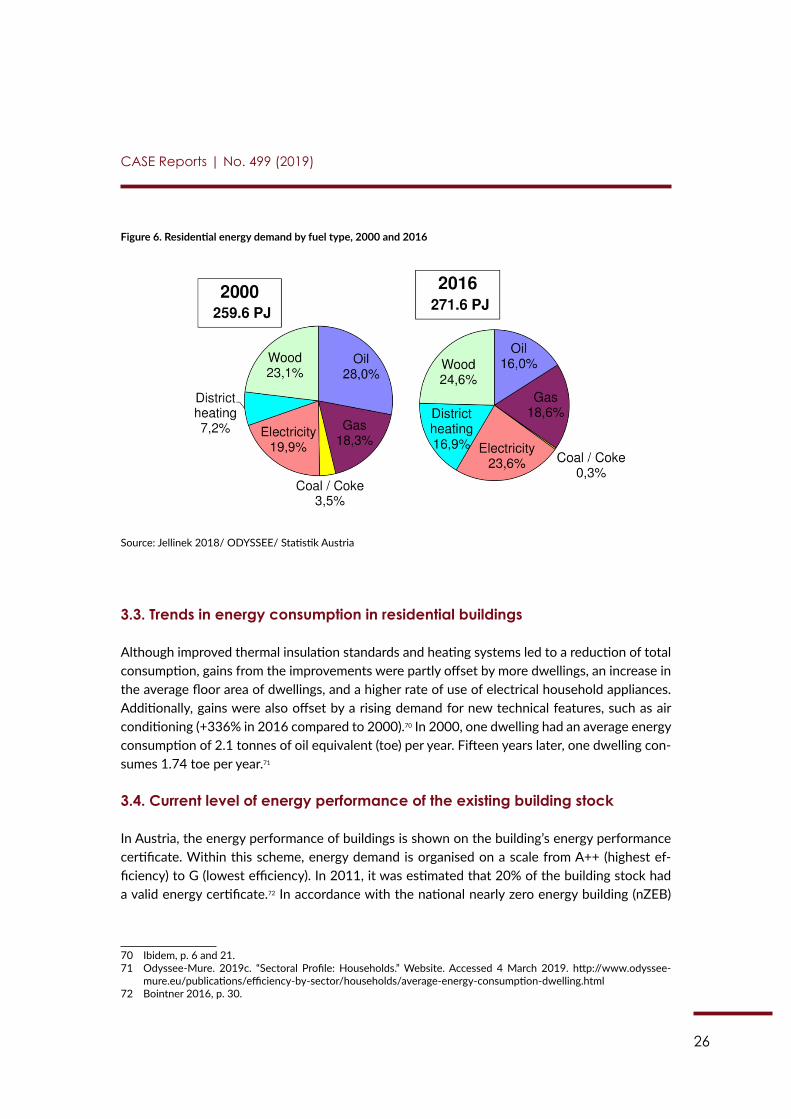
An observation of residential energy demand by fuel type over the period of 2000 to 2016 brings (Figure 6) some noticeable developments to light: in 2016, coal and coke almost disap-peared from the scene. They satisfied the residential energy demand by only 0.3%, compared to 3.5% in 2000. A report of the Austrian Energy Agency indicates two further significant changes. The share of oil in energy consumption decreased from 28% in 2000 to 16% in 2016. On the contrary, district heating increased over this period, from a share of 7.2% in 2000 to 16.9% in 2016. Or put another way: while district heating contributed 18.80 PJ of residential energy de-mand in 2000, that amount increased to 45.81 PJ in 2016 (+ 143.6%).68 The share of gas in the residential energy demand increased slightly from 18.3% in 2000 to 18.6% in 2016.69
68 Ibidem, p. 20.69 Ibidem
26
CASE Reports | No. 499 (2019)
Figure 6. Residential energy demand by fuel type, 2000 and 2016
Source: Jellinek 2018/ ODYSSEE/ Statistik Austria
3.3. Trends in energy consumption in residential buildings
Although improved thermal insulation standards and heating systems led to a reduction of total consumption, gains from the improvements were partly offset by more dwellings, an increase in the average floor area of dwellings, and a higher rate of use of electrical household appliances. Additionally, gains were also offset by a rising demand for new technical features, such as air conditioning (+336% in 2016 compared to 2000).70 In 2000, one dwelling had an average energy consumption of 2.1 tonnes of oil equivalent (toe) per year. Fifteen years later, one dwelling con-sumes 1.74 toe per year.71
3.4. Current level of energy performance of the existing building stock
In Austria, the energy performance of buildings is shown on the building’s energy performance certificate. Within this scheme, energy demand is organised on a scale from A++ (highest ef-ficiency) to G (lowest efficiency). In 2011, it was estimated that 20% of the building stock had a valid energy certificate.72 In accordance with the national nearly zero energy building (nZEB)
70 Ibidem, p. 6 and 21. 71 Odyssee-Mure. 2019c. “Sectoral Profile: Households.” Website. Accessed 4 March 2019. http://www.odyssee-
mure.eu/publications/efficiency-by-sector/households/average-energy-consumption-dwelling.html 72 Bointner 2016, p. 30.
27
CASE Reports | No. 499 (2019)
plan, from 1 January 2016 onwards the annual maximum primary energy demand was reduced to 180 kWh/m² for new residential and 220 kWh/m² for residential renovation.73
One major problem in the Austrian case is the lack of reliable data (see also section above): according to the Zebra2020 data tool – a tool that shows different indicators of the building stock, like renovation and construction activities – there is no data available on the distribution of energy performance certificates regarding the existing or newly constructed residential build-ings “because the regions (having their own databases in most cases) do not provide data. None of these databases are publicly available and the quality of the entries is assumed to be poor.”74
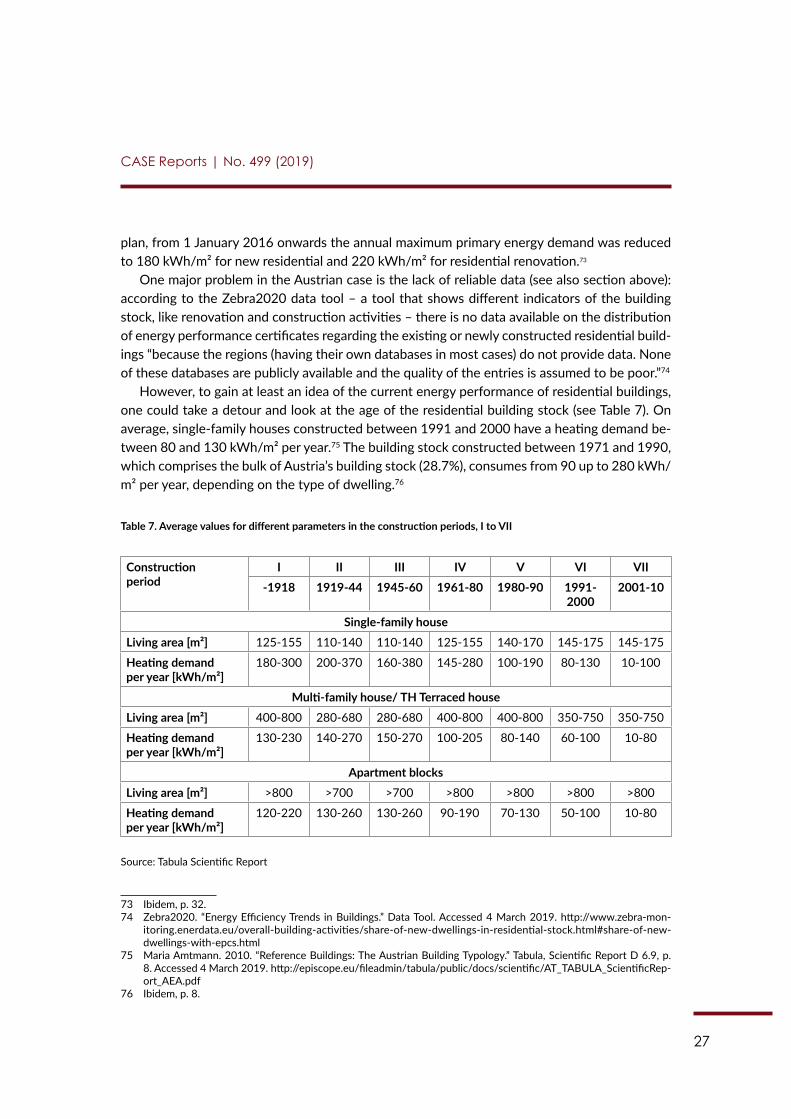
However, to gain at least an idea of the current energy performance of residential buildings, one could take a detour and look at the age of the residential building stock (see Table 7). On average, single-family houses constructed between 1991 and 2000 have a heating demand be-tween 80 and 130 kWh/m² per year.75 The building stock constructed between 1971 and 1990, which comprises the bulk of Austria’s building stock (28.7%), consumes from 90 up to 280 kWh/m² per year, depending on the type of dwelling.76
Table 7. Average values for different parameters in the construction periods, I to VII
Constructionperiod
I II III IV V VI VII-1918 1919-44 1945-60 1961-80 1980-90 1991-
20002001-10
Single-family houseLiving area [m²] 125-155 110-140 110-140 125-155 140-170 145-175 145-175
Heating demand per year [kWh/m²]
180-300 200-370 160-380 145-280 100-190 80-130 10-100
Multi-family house/ TH Terraced houseLiving area [m²] 400-800 280-680 280-680 400-800 400-800 350-750 350-750
Heating demand per year [kWh/m²]
130-230 140-270 150-270 100-205 80-140 60-100 10-80
Apartment blocksLiving area [m²] >800 >700 >700 >800 >800 >800 >800
Heating demand per year [kWh/m²]
120-220 130-260 130-260 90-190 70-130 50-100 10-80
Source: Tabula Scientific Report
73 Ibidem, p. 32.74 Zebra2020. “Energy Efficiency Trends in Buildings.” Data Tool. Accessed 4 March 2019. http://www.zebra-mon-
itoring.enerdata.eu/overall-building-activities/share-of-new-dwellings-in-residential-stock.html#share-of-new-dwellings-with-epcs.html
75 Maria Amtmann. 2010. “Reference Buildings: The Austrian Building Typology.” Tabula, Scientific Report D 6.9, p. 8. Accessed 4 March 2019. http://episcope.eu/fileadmin/tabula/public/docs/scientific/AT_TABULA_ScientificRep-ort_AEA.pdf
76 Ibidem, p. 8.
28
CASE Reports | No. 499 (2019)
3.5. Energy prices for households
A quarter of private households in Austria spend a substantial part of their income – around 25% – on housing.77 In 2017, the average rent including running costs per dwelling was EUR 506.78 The median energy prices were EUR 117 per month.79 The amount a household must pay on housing depends on different factors: as the study published by Statistik Austria suggests, people living in their own house have the highest energy bills (around EUR 172 per month) due to the fact that attached and semi-attached houses have higher energy consumption and more floor space than apartments. Other factors determining the amount of energy costs a household must pay include, for example, the type and age of the building, the household size, and the type of heating system.80
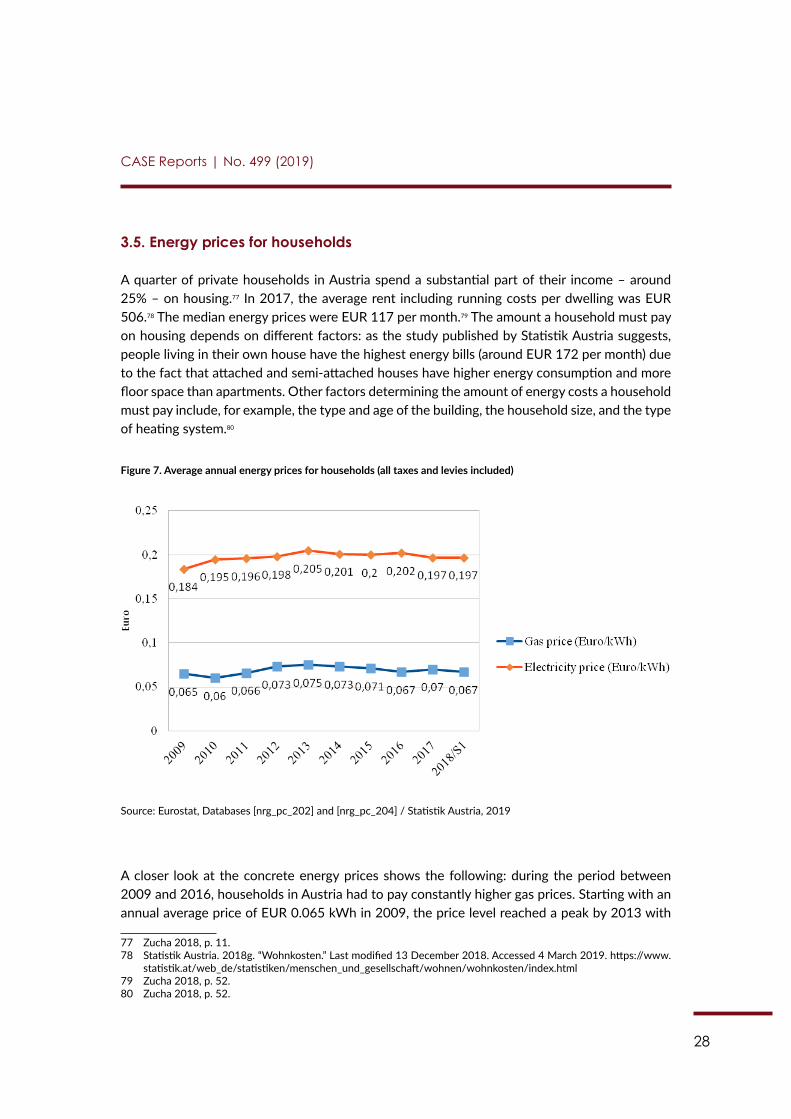
Figure 7. Average annual energy prices for households (all taxes and levies included)
Source: Eurostat, Databases [nrg_pc_202] and [nrg_pc_204] / Statistik Austria, 2019
A closer look at the concrete energy prices shows the following: during the period between 2009 and 2016, households in Austria had to pay constantly higher gas prices. Starting with an annual average price of EUR 0.065 kWh in 2009, the price level reached a peak by 2013 with
77 Zucha 2018, p. 11.78 Statistik Austria. 2018g. “Wohnkosten.” Last modified 13 December 2018. Accessed 4 March 2019. https://www.
statistik.at/web_de/statistiken/menschen_und_gesellschaft/wohnen/wohnkosten/index.html79 Zucha 2018, p. 52.80 Zucha 2018, p. 52.
29
CASE Reports | No. 499 (2019)
EUR 0.075 kWh, then started to decrease and reached in the first half of 2018 the level of EUR 0.067 kWh.81
As is shown in Figure 7, prices for electricity vary between the highest level in 2013 and the lowest in 2009. In the first half of 2018, household consumers had to pay EUR 0.197 kWh for electricity – an amount which is just below the average of the EU28.82
3.6. Types of currently developed EE/RES investments
In Austria, different forms of investments exist to improve EE and to promote the use of RES. The government, federal provinces, and municipalities prefer a mix of policy measures and eco-nomic incentives to push their national climate and environmental goals. In this strategy, grants for deep renovation supplement subsidies for investments in energy efficient equipment (see also Chapter 5). Nevertheless, the still ongoing renovation drive of the Austrian government (“Sanierungsoffensive”), a subsidy promoting the renovation of buildings, which was launched in 2009, mirrors the priority set by the federal government. Within this framework, the Austrian government offered one-off, non-repayable grants for the renovation of residential buildings which are more than 20 years old.83 The subsidy paid for thermal renovations in private housing amounts to 30% of the costs eligible for subsidy, up to EUR 8,000 for the thermal renovations for detached houses and up to EUR 3,000 per apartment in multi-storey residential buildings.84 Although it has not been confirmed by the relevant stakeholders, the subsidy could easily be blended with other mechanisms, such as EuroPACE. The insulation of top floor ceilings, external walls, and the replacement of windows, doors, and heating systems are all eligible for subsi-dies.85 Between 1993 and 2017, 114,519 projects were subsidised by EUR 538,545,384.86
According to the Austrian Energy Agency, around 10,400 renovation projects were subsi-dised in 2016, and the average subsidy amount was EUR 3,450 per project.87 The government provided funding of EUR 43.5 million – of which EUR 33.5 million was available for private
81 Eurostat. 2019. “Gas prices for household consumers.” Database [nrg_pc_202]. Last modified 21 December 2018. Accessed 4 March and Statistik Austria. 2019b. “Preise, Steuern.” Last modified 15 February 2019. Accessed 5 March. https://www.statistik.at/web_de/statistiken/energie_umwelt_innovation_mobilitaet/energie_und_umwelt/energie/preise_steuern/index.html
82 Eurostat. 2018a. “Electricity price statistics.” Accessed 4 March 2019. https://ec.europa.eu/eurostat/statistics-ex-plained/index.php?title=Electricity_price_statistics; Statistik Austria 2019b.
83 Federal Ministry of Science, Research and Economy. 2017. “NEEAP 2017: Second National Energy Efficiency Ac-tion Plan of the Republic of Austria 2017 in Accordance with the Energy Efficiency Directive 2012/27/EU.” Mea-sures implementing the EED, p. 18. Accessed 4 March 2019.
84 Ibidem, p. 18.85 The renovation of buildings used for business purposes is supported, too. The payment depends on the decrease
in heat energy demand and quality of renovation, but also amounts up to 30 % of the costs eligible for subsidy, see Ibidem, p. 18.
86 Selma Herco. 2017. “Zahlen und Fakten: Umweltinvestitionen des Bundes 2017. “Vienna: Federal Ministry of Sus-tainability and Tourism, p. 5.
87 Federal Ministry of Science, Research and Economy 2017, p. 18.
30
CASE Reports | No. 499 (2019)
dwellings. In 2018, the Austrian government provided EUR 42.6 million.88 The renovation drive is expected to save 3,972 PJ in the period from 2014 to 2020.89
The significance of renovations within the national climate and energy strategy is further shown by “#mission2030”. The newly developed roadmap by the Austrian government aims to push EE and environment protection forward.90 Within this plan, the building stock – seen as a sector with a high potential for energy savings – plays a key role in achieving the climate and energy policy objectives.91 Apart from renovations, the strategy envisages the improvement of thermal standards in newly constructed buildings as well. At the same time, the renovation rate should be increased from today’s rate of less than 1% to an average rate of 2% between 2020 and 2030.92 Concrete measures listed in the paper are: “funding for the thermal renovation of residential buildings from housing grant funds based on joint minimum requirements”, “simpli-fied application procedures for funding and incentive schemes”, and “amendments to housing law to simplify renovation measures (Condominium Act, Tenancy Act)”, among others.93
Furthermore, the switch from fossil fuel-fired central heating to systems relying on RES should be achieved through a mix of instruments, including funding instruments, changes to le-gal frameworks and information campaigns.94 In Austria, fossil fuel-fired heating systems are still widespread (there are approximately 700,000 systems in use which are on average more than 20 years old).95 Today, the incentive “Raus aus dem Öl” (Get out of oil) addresses this problem with a EUR 5,000 bonus for the replacement of fossil heating systems with wood-fired central heating, heating pumps or local/district heating.96 The #mission2030 framework indicates that the federal government pursues its strategy while focusing on economic incentives to boost investments in renovations. Meanwhile, the renovation drive is well accepted. This is underlined by the following fact: in 2015, applications for subsidies opened on 2 March and were already fully exhausted by 3 August. The same year, 16,449 projects with a value of EUR 60 million were approved.97 This also offers an opportunity for blending with EuroPACE.
88 WKO. 2018. “Neuauflage der Gebäudesanierung startet: Betriebe und Haushalte profitieren.” WKO 18 June 2018. Accessed 4 March 2019. https://news.wko.at/news/oesterreich/Neuauflage-der-Gebaeudesanierung-startet---Betriebe-und-H.html
89 Federal Ministry of Science, Research and Economy 2017, p. 18. 90 Federal Ministry for Sustainability and Tourism. 2018. “#mission 2030. Austrian Climate and Energy Strategy.”
September 2018, p. 7. Accessed 4 March 2019. https://mission2030.info/wp-content/uploads/2018/10/Klima-Energiestrategie_en.pdf
91 Ibidem, p. 21. 92 Ibidem, p. 43.93 Ibidem, p. 67. 94 Ibidem, p. 69.95 Ibidem, p. 43.96 Kommunalkredit Public Consulting. 2019. “Raus aus dem Öl und thermische Gebäudesanierung.” Website Fed-
eral Ministry of Sustainability and Tourism. Accessed 4 March 2019. https://www.umweltfoerderung.at/index.php?id=618
97 Kommunalkredit Public Consulting. 2016. “Umweltinvestitionen des Bundes.” Federal Ministry of Agriculture, For-estry, Environment and Water Management, p. 50f. Accessed 4 March 2019. Umweltförderungen des Bundes 2015 – BMNT.
31
CASE Reports | No. 499 (2019)
3.7. Energy poverty
According to a press release by Statistik Austria, around 117,000 households (3.1%) experi-enced energy poverty in 2017. Households living in residential buildings constructed until 1960 are particularly affected (5%), as opposed to only 1.1% of households settled in buildings con-structed in 1991 or later. According to Statistik Austria, households experiencing energy poverty are also those at risk of poverty overall and are those that have an outstanding energy consump-tion.98 The outstanding energy consumption is due to the fact that the concerned households more often live in older and therefore poorly insulated buildings and in buildings with old (yet initially cheaper, which is not reflected in their energy bills) heating systems.99 There are also other factors that indicate energy poverty: the share of households having arrears on utility bills decreased from 4.2% in 2016 to 3.6% in 2017.100 Compared to other EU countries, this is still on a low level.101
However, while households with arrears on utility bills decreased, the share of the popula-tion living in a dwelling with a leaking roof, damp walls, floors, or foundation, or rot in window frames or floors increased from 11.2% in 2016 to 11.9% one year later.102 In 2016, 2.4% of Aus-trians were not able to keep their home adequately warm due to financial reasons.103
To conclude, energy consumption is increasing across all sectors. Nevertheless, final energy consumption per dwelling decreased over time due to improved thermal insulation standards and heating systems. It is very difficult to draw conclusions about the current level of energy performance of the existing building stock as data is rare. As most of the buildings are older than 30 years, one can estimate that their heating demand is rather high and therefore many residen-tial buildings need substantial renovations. Furthermore, statistics show that households expe-riencing energy poverty more often live in older and therefore less energy efficient buildings. Although energy poor people (when compared to other EU countries) are by far a minority, this is still is a problem as the tenure status of these kinds of households is often “tenants” – thus, they are unlikely to have an interest to invest in energy efficiency measures.
98 Statistik Austria. 2017. “Haushaltsenergie und Einkommen – mit Fokus Energiearmut.” Presentation Press Confer-ence, 2 February 2017.
99 Zucha 2018, p. 29; Statistik Austria 2017.100 Eurostat. 2019a. “Arrears on Utility Bills.” EU-SILC survey [ilc_mdes07]. Last modified 28 February 2019. Accessed
4 March. 101 European Commission. 2019. “Arrears on Utility Bills.” Website EU Energy Poverty Observation. Accessed 4 March
2019. https://www.energypoverty.eu/indicator?primaryId=1462 102 Eurostat. 2019d. “Total population living in a dwelling with a leaking roof, damp walls, floors or foundation, or rot in
window frames of floor.” EU-SILC survey [ilc_mdho01]. Last modified 28 February 2019. Accessed 4 March 2019.103 European Commission. 2019. “Inability to keep home adequately warm.” Website EU Energy Poverty Observation.
Accessed 4 March 2019. https://www.energypoverty.eu/indicator?primaryId=1462&type=bar&from=2016&to=2016&countries=AT,BE,BG,CH,CY,CZ,DE,DK,EE,EL,ES,EU,FI,FR,HU,HR,IE,IS,IT,LT,LU,LV,MT,NL,NO,PL,PT,RO,RS,SE,SI,SK,UK&disaggregation=none
32
CASE Reports | No. 499 (2019)
Chapter 4: Barriers to develop the EE/RES potential in private buildings
4.1. Lack of priority, split incentives in case of rental, limited information on EE/RES solutions
The Austrian government actively supports projects on the improvement of EE and sets norms and standards (see Chapter 5). Despite the wide range of subsidies and grants, the implementa-tion of measures promoting RES and EE is inhibited by several factors. These barriers include, predominately, the complex competence structure of the Austrian Republic, bureaucratic ob-stacles, financial barriers, and split incentives.
4.1.1. Structural obstacles: federal, provincial, and municipal competences
Austria’s federal provinces are relatively autonomous. This is why strategies to improve EE are embedded at a federal as well as provincial level. Subsidies on federal, provincial, and municipal levels are thus intertwined, consisting of various, but complicated and bureaucratic, subsidies. The set of support structures is therefore complex and difficult to understand.104 Meanwhile, the federal government, in its “#mission2030” paper, came to the conclusion that the “division of tasks between the Federal Government and regional and local authorities is complex and, in part out of date.”105 The paper proposes a reallocation of responsibilities to “create clear structures for regulation and responsibility” and streamlined structures in the energy sector.106 The lack of reliable data on the energy performance of the existing residential building stock or on the reno-vation rate might be the result of the overlapping competence structures. As mentioned above, the federal provinces have their own databases which are not publicly available. As no national database exists, an overall evaluation of developments and incentives is nearly impossible.
4.1.2 Bureaucratic obstacles
The somewhat excessive Austrian bureaucracy is, for many investors, a thorn in their side.107 Ac-cording to a report by the German Chamber of Commerce in Austria (Deutsche Handelskammer in Österreich, AHK), investments in the building sector are often slowed down by a somewhat opaque information policy and a high-level bureaucracy. In addition, obligations like certificates for renovations, energy efficient acquaintances, and other investments further hinder the de-
104 Deutsche Handelskammer in Österreich 2018, p. 75.105 Federal Ministry for Sustainability and Tourism 2018, p. 46, see also p. 30f.106 Ibidem, p. 46.107 Ralf Hirschberger. 2017. “Bürokratie blockiert Milliarden-Investitionen. Kurier 18 August 2017. Accessed 4 March
2019. https://kurier.at/politik/inland/wahl/plan-k/buerokratie-blockiert-milliarden-investitionen/281.137.214 and Jeannine Binder. 2018. “Österreichs Baustellen in der Bürokratie.” Die Presse, 4 April 2018. Accessed 4 March 2019. https://diepresse.com/home/wirtschaft/economist/5399658/Systemfehler_Buerokratie_Oesterreichs-Baustellen-in-der-Buerokratie
33
CASE Reports | No. 499 (2019)
velopment of RES and EE in private residential buildings.108 Increasing bureaucracy and too high standards – for example, for heat pumps – are perceived by potential investors as barriers and may deter investment from households.109 Most likely, this would be no different for EuroPACE.
4.1.3 Financial barriers
One of the main barriers for renovations or measures that increase EE are economic consid-erations. Especially, the question of whether the investments will be profitable can slow down or prevent actions in this direction. Furthermore, it is often difficult to estimate when the in-vestment pays off. In a survey, Austrian estate agents were asked about the main obstacles for the improvement of EE in their opinion and given experience. They listed financial aspects (additional expenses for owners), low social awareness, additional bureaucratic burdens, and improper energy performance certificates as important reasons hindering investments.110 At the same time, the up-front financing and long pay-back period that EuroPACE offers provides a solution, or at least an easing of this barrier.
4.1.4 Split incentives
Much has been written about the issue of split incentives between landlords and tenants to in-vest in EE measures in buildings. However, in the case of Austria, it is an extremely valid barrier as 45% of the population are tenants. In bigger cities like Vienna, the share of tenants is even higher (78% of main residences). This amount, when compared to other EU countries such as Romania or Croatia, is very high. The low rate of ownership is a serious barrier to the success of EuroPACE, which is focused on privately owned households. Furthermore, even though tenants pay energy prices that are linked to the energy performance and heating system of the build-ing, their incentives to make investments in that area are typically lower. On the other hand, owners do not necessarily have to be interested in investments either. Improvements in energy efficiency –and therefore a decrease in energy costs – do not affect the owner in the first place. Furthermore, it is not easy for a landlord to increase the rent to reflect the cost of EE measures. Austrian tenancy law provides no special provisions regarding energy renovations.111 Instead, such measures in residential buildings may fall under both the general maintenance obligation of the landlord and the obligation to make certain useful improvements. If the measure concerns a modernisation that falls under one of these two obligations, the landlord is entitled to impose the modernisation costs on the tenant by increasing the rent.112 However, the landlord may only allocate that part of the cost that is not covered by state subsidies, rent reserves of the past ten
108 Deutsche Handelskammer in Österreich 2018, p. 75. 109 i-Magazin. 2017. “Bürokratie lässt Steuerungseffekt verpuffen!” 11 July. Accessed 4 March 2019. https://www.i-
magazin.com/buerokratie-laesst-politischen-steuerungseffekt-verpuffen/ 110 Bointner 2016, p. 27.111 J. Fournier et al. 2016. “Energetische Sanierung an Wertmehrende Verbesserungen im Mietrecht.” E-AvisIS-
DC2017-13, p. 3. 13 December 2016. Accessed 4 March 2019. https://www.isdc.ch/media/1485/e-2017-13-16-017-sanierung.pdf
112 Ibidem, p. 3.
34
CASE Reports | No. 499 (2019)
years, or the expected main rent. For this type of rent increase, a complex legal process is pos-sible.113 In general, the landlord only may increase the rent based on a decision by an arbitration board or a court.114
4.1.5 Shortage of skilled workers
Austria is facing a shortage of skilled workers in the construction sector.115 In 2017, revenue in-creased and order books were full, but the number of employees in the construction sector de-creased to 342,000 persons (-2,4%) compared to 2016. At the same time, the number of vacant positions in the sector increased by 52.9% to a total of 3,781.116 Many professional groups be-longing to the construction sector are listed on the actual list of shortage occupations released by the Ministry for Social Affairs.117 There is, among others, a shortage of carpenters, roofers, electricians, locksmiths, tilers, and technicians – typically experts relevant for EuroPACE-related works.118 As a result, renovation activities suffer and – in contrast to new construction – in some regions even stagnate (far less than 1%).119 This is because the scarce resources of workers are often assigned to new construction.120
4.2 Social perception
According to a Eurobarometer survey conducted in Austria in March 2017, climate change is, for more than two-thirds of respondents, a “very serious” problem at the moment.121 Although below the EU average (Austria 68%, EU average 74%), there is by far a large share of the popula-tion for which climate change mitigation is crucial. For 16%, it is even the most serious problem in the world (EU average 12%).122 Furthermore, 89% of respondents consider it also important that the government provides support in favour of EE by 2030.123 60% say they have taken ac-tion to fight climate change in the past six months, 15% did so by insulating their homes, 8% installed equipment in their homes to control and reduce energy consumption, 10% installed solar panels in their home, and 4% bought a low-energy house.124
113 Ibidem, p. 3.114 Ibidem, p. 3. 115 Erste Bank and österreichische Sparkassen. 2018. “Trotz Fachlräftemangel: Die Baubranche boomt”. Newsroom
Sparkasse, 13 February 2018. Accessed 4 March 2019. https://newsroom.sparkasse.at/2018/02/13/trotz-fach-kraeftemangel-die-baubranche-boomt/62317
116 Ibidem117 Ministry for Social Affairs. 2019. “Mangelberufliste” 2019. Accessed 4 March 2019. https://www.migration.gv.at/
fileadmin/user_upload/Liste_der_Mangelberufe_2019.pdf118 Ibidem119 Erste Bank and österreichischen Sparkassen 2018.120 Ibidem121 European Commission. 2017. “Austria: Country Highlights.” Special Eurobarometer: Climate Change. Accessed 4
March 2019. https://ec.europa.eu/clima/sites/clima/files/support/docs/at_climate_2017_en.pdf 122 Ibidem123 Ibidem 124 Ibidem
35
CASE Reports | No. 499 (2019)
Two more surveys point in similar directions: the results of the first, released by the Gallup Institute, show that 60% of Austrians are interested in the topics of energy, gas, and heating, among others. When asked about heating, the majority (45%) ranked the sentence “In the fu-ture I want to have the most energy efficient heating” with the highest priority, whereas 17% considered it as least important. Only 29% gave the sentence “In the future I want to have the cheapest heating” first priority, while 41% classified it as priority 3.125
In addition, the annual opinion survey of Austrian households indicates a high acceptance of renewables within the population. According to the results, 80% of Austrian households con-sider a heating supply using RES to be important.126 Heating systems based on RES are often perceived as more economic than those using fossil energy. Environment and climate protection represent the biggest advantages of renewable energy technologies for 86% of respondents.127 They indicated also that a lack of available financial possibilities is one of the main barriers to introducing a heating system based on RES.128 A closer look at what actually drove people to invest in EE measures is provided by another survey. Households which initiated such measures by 2015/2016 were asked about their main motives to do so. Most of the respondents an-swered that the wish to increase housing comfort, to contribute to environment protection, and to lower energy costs were strong motives behind the decision to invest in renovation. The latter was important especially for households with a lower income, while respondents with a higher education underlined the wish for modern technology such as those offered under EuroPACE financing.129
It can thus be concluded that while many barriers related to home renovation exist, with regards to social perceptions, any measure to support investments in EE should fall on fruitful soil. A notable part of the Austrian population is generally favourable to EE and RES. They also consider climate change and environment protection important issues. At the same time, one cannot forget that Austria faces a shortage of skilled workers in the construction sector which hinders renovation activities. However, EuroPACE offers training programmes for skilled and unskilled labour forces and therefor might fill in the gap. Nevertheless, barriers like economic considerations and a high effort to overcome bureaucratic barriers might discourage interest-ed households and thus, as already mentioned, up-front financing mechanisms are very much needed.
125 Österreichs Energie/Gallup. “Marktforschung 2018.” Accessed 4 March 2019. https://oesterreichsenergie.at/dat-en-grafiken/download-grafiken/marktforschung.html
126 Wien Energie, Deloitte Österreich and Wirtschaftsuniversität Wien. 2016. “Erneuerbare Energien in Österreich. Das jährliche Stimmungsbarometer österreichischer Haushalte zu Erneuerbaren Energien.” Stimmungsbarometer December 2016, p. 4. Accessed 4 March 2019. https://www.wu.ac.at/fileadmin/wu/h/press/Presse_2016/Er-neuerbare_Energien_in_Oesterreich_2016_FINAL.pdf
127 Ibidem, p. 7.128 Ibidem, p. 6. 129 Sebastian Seebauer. 2017. “Umsetzung von Gebäudesanierung in Österreich.” Joanneum Research. Accessed 5
March 2019. https://catch.joanneum.at/wp-content/uploads/2015/12/CATCHFactsheet_Sanscheck.pdf
36
CASE Reports | No. 499 (2019)
Chapter 5: Policies related to EE/RES in buildings
Energy-related topics are on the agenda of the ruling ÖVP/ FPÖ coalition and therefore explic-itly addressed in government policies. The government declared the opt out of fossil energy and 100% electricity from RES until 2030 as one of its main goals. Furthermore, it aims at increasing EE in the construction sector, providing subsidies for photovoltaic systems, and the exchange of oil heating systems with heating systems based on RES as well as replacement initiatives for old boilers.130
5.1. Transposition of the European Directive on Energy Performance in Buildings and other EU legislation related to EE/RES in buildings
With the Federal Energy Efficiency Act (Bundes-Energieeffizienzgesetz), in 2014, Austria imple-mented the Energy Efficiency Directive 2012/27/EU. To reach the target of 1050 (PJ) by 2020 – corresponding to final energy savings of 310 PJ by the same year, several measures are men-tioned. Strategic measures like corporate environmental protection subsidy schemes, energy taxes, renovation activities/vouchers, and housing and energy subsidies are planned to save up to 151 PJ until 2020.131
The European Directive on the Energy Performance of Buildings is implemented by the Ener-gy Performance Certificate Law (Energieausweisvorlagegesetz – EAVG). For every building trans-action, an energy performance certificate (Energieausweis) has to be provided. The certificate contains all the important information about the thermal quality, energy consumption, and heat-ing demand of the building.132 Since 2009, the certificate must be presented at every sale, rental, newly constructed, or renovated building; since 2012, information on the energy consumption of a building also has to be declared in every sale or rental advertisement.133
5.2. Other legal developments in the area of energy performance in buildings and use of RES in buildings
To meet the requirements of the EU – that RES should account for 34% of energy consump-tion by the year 2020 – the Austrian government developed several measures and strategies to improve energy performance and the use of RES in residential buildings.134 The Green Elec-tricity Act introduced in 2012 aims at improving climate and energy protection while reducing dependence on nuclear energy through the promotion of green energy.135 A feed-in tariff of EUR 0.0791 per kWh is granted for photovoltaic systems put on the roof of or beside a building if the
130 Deutsche Handelskammer in Österreich 2018, p. 8. 131 Federal Ministry of Science, Research and Economy 2017, p. 3f.132 Deutsche Handelskammer in Österreich 2018, p. 57.133 Ibidem, p. 57.134 Deutsche Handelskammer in Österreich 2018, p. 27.135 BIS. 2019. “Bundesrecht konsolidiert: Gesamte Rechtsvorschrift für Ökostromgesetz 2012.” Website. Accessed
4 March 2019. https://www.ris.bka.gv.at/GeltendeFassung.wxe?Abfrage=Bundesnormen&Gesetzesnummer= 20007386

37
CASE Reports | No. 499 (2019)
contract was signed in 2018. For contracts signed in 2019, the subsidy dropped by EUR 0.0024 to EUR 0.0767 per kWh.136 Furthermore, subsidies of 30% of investment costs up to a maximum of EUR 250 per kWp (kilowatts peak) are granted in 2018/2019.137
5.3. Economic incentives
In Austria, a wide range of economic incentives are in place to promote EE. The extent, payment, addressee, and duration of the funding depends not only on the federal government but also on each of the nine federal provinces. Additional subsidies for thermal renovation apart from the federal government’s incentives exist in all federal provinces; some subsidise in particular reno-vations to klima:aktiv standards, like Tyrol or Carinthia.138 Beyond that, Vienna, for instance, sub-sidises solar panels, heat pumps, and the exchange of heating systems, whereas Salzburg stands out with its heating drive 2020 that aims at the exchange of oil-fired boilers.139 In the context of the Styrian provincial environmental fund, a number of subsidy programmes are administered. They aim at the promotion of biomass heating systems, solar thermal systems, photovoltaic sys-tems, heat pumps, pump changeover, and the switching of heating.140 The Austrian environmen-tal organisation Global 2000 concludes in its report “Wohnbaucheck” that the province’s housing subsidy programmes (Wohnbauförderprogramme) – under which the above mentioned subsidies for renovation and the exchange of boilers, among others fall – have only a limited range.141 Ac-cording to the authors, the subsidies for thermal renovations might not be high enough. They advocate a comprehensive evaluation of measures and outcomes to determine the right level, opening the window of opportunity for new schemes at the same time.142
5.3.1. Demo project “Solar House”
This funding is directed to innovative solar thermal systems which reach a solar coverage of at least 70% of a building’s heat demand. It is directed towards one- and two-family private residential buildings and includes new buildings, existing buildings, and renovation projects.143 The funding aims at reducing carbon emissions and, furthermore, is supposed to function as an
136 Bundesgesetzblatt. 2017. “Ökostrom-Einspeisetarifverordnung2018.” ÖSET-VO2018. 22 December 2017. Ac-cessed 4 March 2019. https://www.e-control.at/documents/20903/388512/BGBLA_2017_II_408.pdf/077e79d8-a345-858b-5e78-96905bff9b95
137 Ibidem138 Energy Agency. “Wegweiser.” Website Energy Agency. Accessed 4 March 2019. https://www.energ-
yagency.at/index.php?tx_aeafoerderungen_pi1%5BshowWerberUid%5D=0&tx_aeafoerderungen_pi1%5BshowCatUid%5D=32&tx_aeafoerderungen_pi1%5BshowRegionUid%5D=0&id=147&searchCall=1&x=76&y=20
139 Ibidem 140 Federal Ministry of Science, Research and Economy, p. 43.141 Steffl 2018, p. 37 and 45f. 142 Ibidem, p. 37 and 45f. 143 Kommunalkredit Public Consulting. 2019a. “Privatpersonen. Förderungen.” Accessed 4 March 2019. https://www.
umweltfoerderung.at/privatpersonen/demoprojekte-solarhaus-foerderung-fuer-privatpersonen-klima-und-ener-giefonds.html
38
CASE Reports | No. 499 (2019)
initiator for more solar houses.144 One condition for receiving funding is that there is no addi-tional gas or oil heating.145 Extraordinary projects receive a higher grant and are incorporated in a research programme.146 This academic mentoring serves to speed up the technological develop-ment and to improve existing concepts.147 The funding rate depends on the heating demand but it never covers 100% of costs needed.
5.4. Policies to support households in energy poverty situation
As mentioned previously, in 2017, 3.1% of households in Austria experienced energy poverty. The Austrian government developed several policies to support affected households using dif-ferent approaches. One approach is connected to household appliances. The “Electricity Help Fund” (VERBUND-Stromhilfefonds) or the pilot project “Efficient Refrigerators for Mobilpass Owners” provides households “with energy audits to improve EE, as well as support with the replacement of household appliances”.148 Other measures aim to inform households through energy audits and awareness raising. An example would be energy consultations for low income households or the website on energy poverty (Fuelpoverty.at).149 Also, “Social Energy Without Borders” aims to improve “coordination in the energy poverty field between professionals and to provide households with energy advice”.150 A different approach is the heating allowance (Heiz-kostenzuschuss). With this form of bill support, some Austrian regions help households by giving them a heating allowance during the winter period. The requirements for that differ between regions.151
5.5. Other policy developments
In Austria, each of the nine federal provinces has its own building directives and laws. And it is not only for companies in the construction sector that the different regulations across states are an obstacle.152 To overcome this administrative burden and to harmonise technical require-ments, the Austrian Institute of Construction Engineering (OIB) provides six guidelines on tech-nical regulations which have already been declared as binding by all federal provinces in their
144 Ibidem; Klima- und Energiefonds. 2018. “Leitfaden. Demoprojekte Solarhaus.” Jahresprogramm May 2018, p. 4. Accessed 5 March 2019. https://www.umweltfoerderung.at/fileadmin/user_upload/media/umweltfoerderung/Dokumente_Private/Solarhaus/KLIEN_Leitfaden_Solarhaus.pdf
145 Kommunalkredit Public Consulting 2019a.146 Klima- und Energiefonds 2018, p. 12.147 Federal Ministry for Sustainability and Tourism. 2018. “Klima- und Energiefonds: 3,3 Mio. Euro für Sonnenen-
ergie.” Accessed 5 March 2019. https://www.bmnt.gv.at/service/presse/energie/2018/Klima--und-Energiefonds--3-3-Mio.-Euro-f-r-Sonnenenergie.html
148 European Commission. 2019. “Policies & Measures.” Website EU Energy Poverty Observation. Accessed 4 March 2019. https://www.energypoverty.eu/policies-measures?sort_by=search_api_aggregation_1&field_date_year=&field_date_year_1=&search_api_views_fulltext=&field_highlighted=All
149 Ibidem150 Ibidem151 Ibidem 152 European Commission. 2018, p. 16.
39
CASE Reports | No. 499 (2019)
building codes.153 Interesting for questions regarding EE is the OIB Guideline 6 which defines the maximum value of heating demand, of hot water, cooling, and indoor air for newly constructed or renovated buildings. The guideline serves also as the basis for the energy performance cer-tificate.154 The regulatory environment is also shaped by Austrian standards: renovated and new buildings must comply with ÖNORMen standards. The ÖNORMen are in line with European Di-rectives and International Conventions.155 ÖNORMen H 5056 to H 5059 regulate for instance the level of energy demand for heating, indoor air, cooling, and lighting.156
5.6. Initiatives at the local level to promote EE/RES in private buildings
5.6.1. Klima:aktiv
One of the best-known climate protection initiatives in Austria is klima:aktiv. Launched in 2004 by the Federal Ministry of Sustainability and Tourism, the initiative is embedded in the Austrian federal climate strategy and contributes to this goal through strong information and awareness-raising programmes.157 Klima:aktiv focuses on four different areas: building and renovation, en-ergy savings, RES, and mobility. According to their own statement, the distribution of “green skills” to important multipliers plays a key role.158
Klima:aktiv runs many projects in the areas of EE, RES, and environment protection and provides a wide range of information about energy savings. The established klima:aktiv building standard is one of the best-known evaluation systems when it comes to the sustainability of buildings.159 Criteria for declaration as a klima:aktiv building are a low energy demand (one-third less heating demand than normal buildings); more thermal comfort thanks to better insulation; high room air quality and low-emission construction materials; and high quality in implementa-tion and profitability, which means that it could be considered potential competition for Euro-PACE.160
5.6.2. “Klimabündnis” (Climate Alliance)
The “Klimabündnis” (Climate Alliance) is Austria’s biggest local climate protection network. The network supports kindergartens, schools, municipalities, and companies through the work of
153 Ibidem, p. 16 and Deutsche Handelskammer in Österreich 2018, p. 56. 154 Deutsche Handelskammer in Österreich 2018, p. 56. Austrian Institute for Building Technology. 2015. “OIB Richtli-
nien” OIB-Richtlinie 6. Accessed 3 March 2019. https://www.oib.or.at/sites/default/files/richtlinie_6_26.03.15.pdf 155 European Commission 2018, p. 16.156 Deutsche Handelskammer in Österreich 2018, p. 56.157 Odyssee-Mure. 2019a. 158 Klimaaktiv. 2019a. “Über klimaaktiv.” Federal Ministry for Sustainability and Tourism. Website. Accessed 5 March
2019. https://www.klimaaktiv.at/ueber-uns/ueber_klimaaktiv.html 159 Klimaaktiv 2019b. “Der Gebäudestandard.” Federal Ministry for Sustainability and Tourism. Website. Accessed 5
March 2019. https://www.klimaaktiv.at/bauen-sanieren/gebaeudedeklaration/gebaeudestandard.html 160 Klimaaktiv. 2019c. “Wohngebäude.” Federal Ministry for Sustainability and Tourism. Website. Accessed 5 March
2019. https://www.klimaaktiv.at/bauen-sanieren/wohngebaeude.html
40
CASE Reports | No. 499 (2019)
eight regional offices.161 The alliance focuses on information campaigns, networking, awareness raising, trainings, and the execution of projects and campaigns together with local partners. Thus far, 982 Austrian municipalities have joined the Klimabündnis.162 A “Good-Practice-Database” shows more than 100 projects implemented or in the stage of implementation.163 Projects on EE and renovations in the residential sector can be found in the database. For example, the mu-nicipality of Wiener Neudorf subsidised a residential building’s renovation, improving its energy performance from D to A,164 while the municipality of Laxenburg granted subsidies for thermal renovations, retrospective insulations, photovoltaic systems, and heating pumps.165
5.6.3. Climate and energy model regions
The objective of independence from expensive oil imports and green energy for Austria led to creation of the Climate and Energy Model Regions (Klima- und Energie-Modellregionen), a pro-gramme launched by the Austrian Climate and Energy Funds. With this long-term model, regions want to achieve the opt out of fossil energy.166 They execute projects in the fields of EE, RES, and awareness raising. To become a Climate and Energy Model Region, interested parties must apply, create a concept note, and – if accepted – implement their project within 2-3 years.167 Eligible applicants have a maximum population of 60,000 inhabitants and include several mu-nicipalities.168 Some of the projects focus on EE measures aimed at the residential building stock, such as the model region Traunviertler Alpenvorland169 or Baden.170 Climate and Energy Model Regions could therefore promote EuroPACE and integrate it into their concept.
In summary, much has been done thus far to support EE in the residential building sector. Economic incentives are the main instrument to push renovations forward. Nevertheless, the marginal renovation rates suggest that funding is not necessarily the deciding factor whether or not to invest in EE measures. What stands out in the Austrian case are the wide awareness-rais-ing campaigns conducted by different actors on a lower level. This is an advantage in promoting EE measures and in influencing their social perception. EuroPACE can rely on existing structures and thus has a wide network to spread information about the on-tax financing scheme. This might be the biggest window of opportunity for EuroPACE.
161 Klimabündnis Österreich. “Über uns – das Klimabündnis.” Website. Last Accessed 4 March 2019. https://www.klimabuendnis.at/ueber-uns/kb-ueber-uns
162 Klimabündnis Österreich. “Klimabündnis-Gemeinden.” Website. Last Accessed 4 March 2019. https://www.klim-abuendnis.at/gemeinden/klimabuendnis-gemeinden
163 Klimabündnis Österreich. “Good-Practice-Datenbank.” Website. Accessed 4 March 2019. https://www.klim-abuendnis.at/best-practice-datenbank/best-practice-datenbank-uebersicht
164 Ibidem165 Ibidem166 Klima- und Energiefonds. 2019. “95 Klima- und Energie-Modellregionen (KEM) in 819 Gemeinden setzen Kli-
maschutzprojekte um.” Website. Accessed 5 March 2019. https://www.klimaundenergiemodellregionen.at/ 167 Klima- und Energiefonds. 2019a. “Klima- und Energie-Modellregion werden.” Website. Accessed 5 March 2019.
https://www.klimaundenergiemodellregionen.at/werden-auch-sie-klima-und-energie-modellregion/ 168 Ibidem169 Klima- und Energiefonds. 2019b. “Traunviertler Alpenvorland.” Website. Accessed 5 March 2019. https://www.
klimaundenergiemodellregionen.at/ausgewaehlte-projekte/best-practice-projekte/showbpp/75 170 Klima- und Energiefonds. 2019c. “Baden: Förderungen Dämmen.” Website. Accessed 5 March 2019. https://www.
klimaundenergiemodellregionen.at/ausgewaehlte-projekte/best-practice-projekte/showbpp/31
41
CASE Reports | No. 499 (2019)
Conclusions
In general, the basic conditions for the introduction of an on-tax financing scheme are fulfilled in Austria. Nevertheless, EuroPACE could also face significant obstacles. The following conclu-sions can be drawn from the previous analysis, literature review, and observation of crucial data:
1. First, the Austrian population is generally favourable to EE and RES. The majority consi-der climate change and environment protection as very important issues. Thus, measures supporting investments in EE should fall on fruitful soil. And these measures are in fact needed, given the poor energy performance of a large percentage of Austria’s residential dwellings. Furthermore, there are financial possibilities to invest in renovation, as Au-strian households are among the most prosperous in the EU.
2. What stands out in Austria is the wide and well-organised network on a lower level (bot-tom-up initiatives) that provides information about EE measures and works on awareness raising. This is clearly an advantage in promoting the innovative home-based financing mechanism. EuroPACE can rely on existing structures and thus has a wide network to dis-seminate information about the new possibilities coming along with it. The high activity on local level is a big window of opportunity for EuroPACE – a programme that ultimately puts municipalities in the centre of the whole scheme.
3. Energy-related topics are on the agenda of the ruling ÖVP/ FPÖ coalition. The federal government has ambitious goals regarding environment protection, EE, and RES. To push the national climate strategy forward, a wide range of economic incentives exist on a national and provincial level. The sheer number of different subsidies can be seen as an indicator for the priority of the topic. Therefore, an on-tax financing scheme like Euro-PACE could complement the present strategy. But at the same time, this could also be a barrier to the success of EuroPACE. Obviously, competition between the different finan-cing schemes is high, and subsidies like the federal renovation drive are well-known and well-accepted. Between 2010 and 2015, spending on dwelling renovation has climbed by 9.7% – from EUR 2.3 to 2.6 billion. This could be an indicator for a positive impact of the renovation drive on energy savings measures. Nevertheless, the still low renovation rate also suggests that subsidies and other financial incentives are not necessarily the decisive reason to invest in EE. A previously-mentioned survey came to the conclusion that the wish to increase housing comfort, to contribute to environment protection, as well as to lower energy costs were the strong motivations behind decisions to invest in renovation.
4. Despite the mentioned subsidies, renovation costs vary between EUR 25,000 and EUR 56,000 or EUR 512/m2 for a comprehensive thermal renovation. This amount when com-pared to other countries (i.e. Poland) is still very high. Upfront financing for such amounts that can be repaid over a long time period (EuroPACE provides approximately 25 years for repayment) would be thus welcomed by those interested in improving their living conditions.
5. What might be the biggest issue though is the fact that in 2017 only every second main residence in Austria was occupied by the owner (48%, out of which 37% are houses and 11% apartments). As EuroPACE is addressed mainly to homeowners, given the size of the
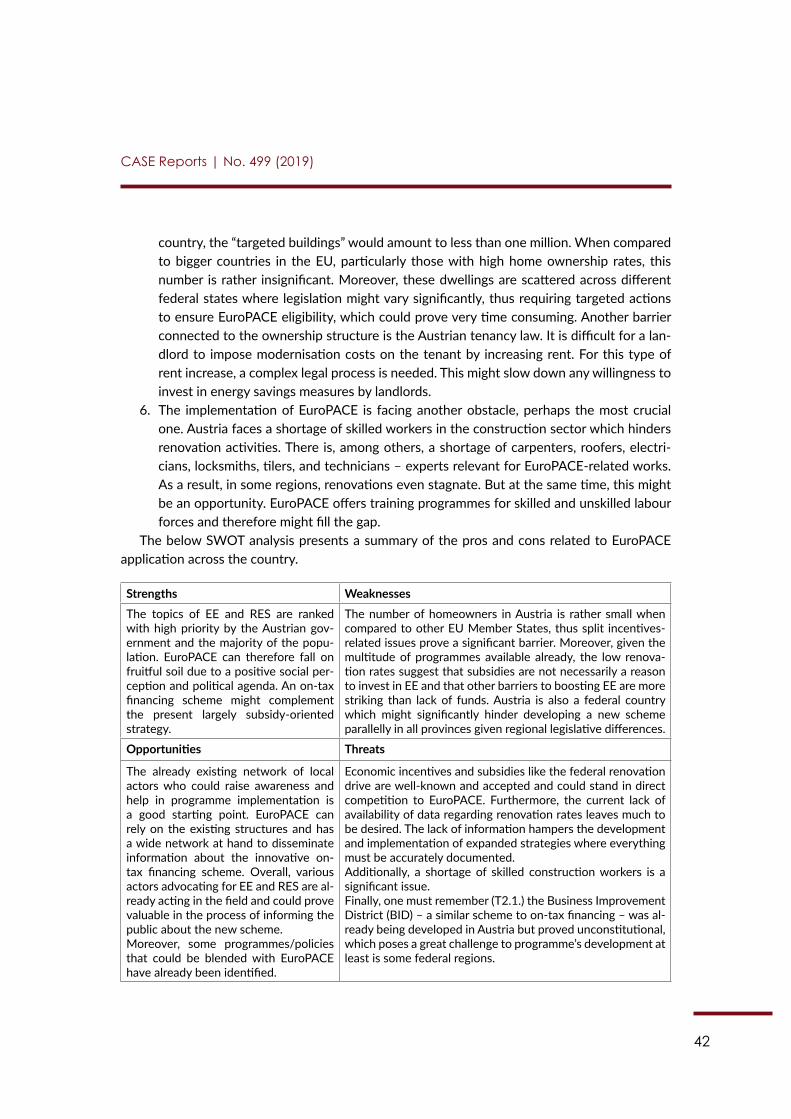
42
CASE Reports | No. 499 (2019)
country, the “targeted buildings” would amount to less than one million. When compared to bigger countries in the EU, particularly those with high home ownership rates, this number is rather insignificant. Moreover, these dwellings are scattered across different federal states where legislation might vary significantly, thus requiring targeted actions to ensure EuroPACE eligibility, which could prove very time consuming. Another barrier connected to the ownership structure is the Austrian tenancy law. It is difficult for a lan-dlord to impose modernisation costs on the tenant by increasing rent. For this type of rent increase, a complex legal process is needed. This might slow down any willingness to invest in energy savings measures by landlords.
6. The implementation of EuroPACE is facing another obstacle, perhaps the most crucial one. Austria faces a shortage of skilled workers in the construction sector which hinders renovation activities. There is, among others, a shortage of carpenters, roofers, electri-cians, locksmiths, tilers, and technicians – experts relevant for EuroPACE-related works. As a result, in some regions, renovations even stagnate. But at the same time, this might be an opportunity. EuroPACE offers training programmes for skilled and unskilled labour forces and therefore might fill the gap.
The below SWOT analysis presents a summary of the pros and cons related to EuroPACE application across the country.
Strengths WeaknessesThe topics of EE and RES are ranked with high priority by the Austrian gov-ernment and the majority of the popu-lation. EuroPACE can therefore fall on fruitful soil due to a positive social per-ception and political agenda. An on-tax financing scheme might complement the present largely subsidy-oriented strategy.
The number of homeowners in Austria is rather small when compared to other EU Member States, thus split incentives-related issues prove a significant barrier. Moreover, given the multitude of programmes available already, the low renova-tion rates suggest that subsidies are not necessarily a reason to invest in EE and that other barriers to boosting EE are more striking than lack of funds. Austria is also a federal country which might significantly hinder developing a new scheme parallelly in all provinces given regional legislative differences.
Opportunities Threats
The already existing network of local actors who could raise awareness and help in programme implementation is a good starting point. EuroPACE can rely on the existing structures and has a wide network at hand to disseminate information about the innovative on-tax financing scheme. Overall, various actors advocating for EE and RES are al-ready acting in the field and could prove valuable in the process of informing the public about the new scheme.Moreover, some programmes/policies that could be blended with EuroPACE have already been identified.
Economic incentives and subsidies like the federal renovation drive are well-known and accepted and could stand in direct competition to EuroPACE. Furthermore, the current lack of availability of data regarding renovation rates leaves much to be desired. The lack of information hampers the development and implementation of expanded strategies where everything must be accurately documented. Additionally, a shortage of skilled construction workers is a significant issue.Finally, one must remember (T2.1.) the Business Improvement District (BID) – a similar scheme to on-tax financing – was al-ready being developed in Austria but proved unconstitutional, which poses a great challenge to programme’s development at least is some federal regions.
43
CASE Reports | No. 499 (2019)
References
Altmann-Mavaddat, Naghmeh et al. 2018. “Klima und Energie: Wissen kompakt.” Vienna: Aus-trian Energy Agency.
Amtmann, Maria. 2010. “Reference Buildings: The Austrian Building Typology.” Tabula, Scientific Report D 6.9. Accessed 4 March 2019. http://episcope.eu/fileadmin/tabula/public/docs/scien-tific/AT_TABULA_ScientificReport_AEA.pdf.
Anderl, Michael et al. 2016. “Klimaschutzbericht 2016.” Umweltbundesamt, Report REP-0582, p. 132. Accessed 4 March 2019. http://www.umweltbundesamt.at/fileadmin/site/publika-tionen/REP0582.pdf.
Arbeiterkammer Wien. 2016. “Genossenschaftswohnungen: Reduzierte Mieten, gemeinnützige Bauträger.” Website Arbeiterkammer Wien. Accessed 4 March 2019.
Blauensteiner, Sophie. 2014. “Census 2011 Austria: Results of the Register-based Census.” Vi-enna: Statistik Austria.
Binder, Jeannine. 2018. “Österreichs Baustellen in der Bürokratie.” Die Presse, 4 April 2018. Ac-cessed 4 March 2019. https://diepresse.com/home/wirtschaft/economist/5399658/System-fehler_Buerokratie_Oesterreichs-Baustellen-in-der-Buerokratie.
BIS. 2019. “Bundesrecht konsolidiert: Gesamte Rechtsvorschrift für Ökostromgesetz 2012.” Website. Accessed 4 March 2019.
https://www.ris.bka.gv.at/GeltendeFassung.wxe?Abfrage=Bundesnormen&Gesetzesnummer=20007386.
Bointner, Raphael, Kranzl, Lukas and Toleikyte, Agne. 2016. “Zebra2020: Niedrigstenergiege-bäude Strategien 2020.” ZEBRA2020 – Bericht, 15 September 2016.
Der Standard. 2016. “Wiener Wohn-Ticket: Zuzügler müssen länger warten.” Der Standard, 14 July 2016. Accessed 4 March 2019. https://derstandard.at/2000041084033/Wiener-Wohn-Ticket-Zuzuegler-muessen-laenger-warten.
Deutsche Handelskammer in Österreich. 2018. “Österreich: Energieeffizienz im Gebäudesektor – Neubau und Sanierung. Zielmarktanalyse 2018.” Vienna: Deutsche Handelskammer in Öster-reich.
44
CASE Reports | No. 499 (2019)
Energy Agency. “Wegweiser.” Website Energy Agency. Accessed 4 March 2018. https://www.energyagency.at/index.php?tx_aeafoerderungen_pi1%5BshowWerberUid%5D=0&tx_aeafoer-derungen_pi1%5BshowCatUid%5D=32&tx_aeafoerderungen_pi1%5BshowRegionUid%5D=0&id=147&searchCall=1&x=76&y=20.
European Commission. 2017. “Austria: Country Highlights.” Special Eurobarometer: Climate Change. Accessed 4 March 2019. https://ec.europa.eu/clima/sites/clima/files/support/docs/at_climate_2017_en.pdf.
European Commission. 2019. “Policies & Measures.” Website EU Energy Poverty Observation. Accessed 4 March 2019. https://www.energypoverty.eu/policies-measures?sort_by=search_api_aggregation_1&field_date_year=&field_date_year_1=&search_api_views_fulltext=&field_highlighted=All.
European Commission. 2018. “European Construction Sector Observatory: Country. Country Profile Austria.” Ref. Ares(2018)3388314, 26 June 2018.
European Commission. 2019. “Arrears on Utility Bills.” Website EU Energy Poverty Observation. Accessed 4 March 2019. https://www.energypoverty.eu/indicator?primaryId=1462.
Eurostat. 2018. “Gas prices for household consumers.” Database [nrg_pc_202]. Last modified 21 December 2018. Accessed 4 March 2019.
Eurostat. 2018a. “Electricity price statistics.” Accessed 4 March 2019. https://ec.europa.eu/eu-rostat/statistics-explained/index.php?title=Electricity_price_statistics.
Eurostat. 2019. “Distribution of Population by Degree of Urbanisation, Dwelling Type and In-come Group.” Eurostat Database, EU-SILC Survey [ilc_lvho01]. Last modified 28 February 2019. Accessed 5 March 2019.
Eurostat. 2019a. “People at risk of poverty or social exclusion by age and sex.” Database,[ilc_peps01]. Last modified 15 February 2019. Accessed 5 March 2019.
Eurostat. 2019b. “Housing Cost Overburden Rate by Age, Sex and Poverty Status.” Database, [ilc_lvho07a]. Last modified 15 March 2019. Accessed 18 March 2019.
Eurostat. 2019c. “Distribution of population by tenure status, type of household and income group.” EU-SILC survey [ilc_lvho02]. Last modified 28 February 2019. Accessed 4 March 2019.
45
CASE Reports | No. 499 (2019)
Eurostat. 2019d. “Total population living in a dwelling with a leaking roof, damp walls, floors or foundation, or rot in window frames of floor.” EU-SILC survey [ilc_mdho01]. Last modified 28 February 2019. Accessed 4 March 2019.
Erste Bank and österreichischen Sparkassen. 2018. “Trotz Fachlräftemangel: Die Baubranche boomt”. Newsroom Sparkasse, 13 February 2018. Accessed 4 March 2019. https://newsroom.sparkasse.at/2018/02/13/trotz-fachkraeftemangel-die-baubranche-boomt/62317.
Federal Ministry of Digitalization and Business Location. 2019. “Genossenschaftswohnungen.” Website of the Federal Ministry of Digitalization and Business Location. Accessed 4 March 2019. https://www.help.gv.at/Portal.Node/hlpd/public/content/21/Seite.210250.html#Kosten.
Federal Ministry of Science, Research and Economy. 2017. “NEEAP 2017: Second National Energy Efficiency Action Plan of the Republic of Austria 2017 in Accordance with the Energy Efficiency Directive 2012/27/EU.” Measures implementing the EED. Accessed 4 March 2019. https://ec.europa.eu/energy/sites/ener/files/documents/at_neeap_2017_en.pdf.
Federal Ministry for Sustainability and Tourism. 2018. “#mission 2023. Austrian Climate and Energy Strategy.” September 2018. Accessed 4 March 2019. https://mission2030.info/wp-con-tent/uploads/2018/10/Klima-Energiestrategie_en.pdf.
Federal Ministry for Sustainability and Tourism. 2018. “Klima- und Energiefonds: 3,3 Mio. Euro für Sonnenenergie.” Accessed 5 March 2019. https://www.bmnt.gv.at/service/presse/ener-gie/2018/Klima--und-Energiefonds--3-3-Mio.-Euro-f-r-Sonnenenergie.html.
Fournier, J. et al. 2016. “Energetische Sanierung an Wertmehrende Verbesserungen im Miet-recht.” E-AvisISDC2017-13, 13 December 2016. Accessed 4 March 2019. https://www.isdc.ch/media/1485/e-2017-13-16-017-sanierung.pdf.
GDI 2050. 2016. “Thermisch-energetische Sanierung und Modernisierung in Österreich.” Ac-cessed March 5, 2019. https://webcache.googleusercontent.com/search?q=cache:3pi33Hg1O6AJ:https://gdi2050.at/de/downloads.html%3Ffile%3Dfiles/gdi/download/TU-Studie_Ge-baeudesanierung_Oesterreich_Kurzfassung.pdf+&cd=1&hl=pl&ct=clnk&gl=pl.
Global 2000. “Thermische Sanierung.” Website. Accessed 6 March 2019. https://www.glob-al2000.at/thermische-sanierung.
Herco, Selma. 2017. “Zahlen und Fakten: Umweltinvestitionen des Bundes 2017.” Vienna: Federal Ministry of Sustainability and Tourism.
46
CASE Reports | No. 499 (2019)
Hirschberger, Ralf. 2017. “Bürokratie blockiert Milliarden-Investitionen. Kurier 18 August 2017. Accessed 4 March 2019. https://kurier.at/politik/inland/wahl/plan-k/buerokratie-blockiert-mil-liarden-investitionen/281.137.214.
i-Magazin. 2017. “Bürokratie lässt Steuerungseffekt verpuffen!” 11 July. Accessed 4 March 2019. https://www.i-magazin.com/buerokratie-laesst-politischen-steuerungseffekt-verpuffen/.
Lapillonne, Bruno et al. 2018. “Regional training on indicators Odyssee-Mure: Energy Efficiency Trends by Sector. ODEX.” May 2018. Accessed March 5, 2019. Available under http://www.odyssee-mure.eu/events/workshops/training-vienna/odex-odyssee-april-2018.pdf.
Jellinek, Reinhard. 2018. “Energy Efficiency Trends and Policies in Austria.” Austrian Energy Agency. Accessed 4 March 2019. http://www.odyssee-mure.eu/publications/national-reports/energy-efficiency-austria.pdf.
Klima- und Energiefonds. 2018. “Leitfaden. Demoprojekte Solarhaus.” Jahresprogramm May 2018. Accessed 5 March 2019. https://www.umweltfoerderung.at/fileadmin/user_upload/me-dia/umweltfoerderung/Dokumente_Private/Solarhaus/KLIEN_Leitfaden_Solarhaus.pdf.
Klima- und Energiefonds. 2019. “95 Klima- und Energie-Modellregionen (KEM) in 819 Gemein-den setzen Klimaschutzprojekte um.” Website. Accessed 5 March 2019. https://www.klimaun-denergiemodellregionen.at/.
Klima- und Energiefonds. 2019a. “Klima- und Energie-Modellregion werden.” Website. Accessed 5 March 2019. https://www.klimaundenergiemodellregionen.at/werden-auch-sie-klima-und-energie-modellregion/.
Klima- und Energiefonds. 2019b. “Traunviertler Alpenvorland.” Website. Accessed 5 March 2019.
https://www.klimaundenergiemodellregionen.at/ausgewaehlte-projekte/best-practice-projek-te/showbpp/75.
Klima- und Energiefonds. 2019c. “Baden: Förderungen Dämmen.” Website. Accessed 5 March 2019. https://www.klimaundenergiemodellregionen.at/ausgewaehlte-projekte/best-practice-projekte/showbpp/31.
Klimaaktiv. 2019a. “Über klimaaktiv.” Federal Ministry for Sustainability and Tourism. Website. Accessed 5 March 019. https://www.klimaaktiv.at/ueber-uns/ueber_klimaaktiv.html.
https://www.klimaundenergiemodellregionen.at/ausgewaehlte-projekte/best-practice-projekte/showbpp/75
https://www.klimaundenergiemodellregionen.at/ausgewaehlte-projekte/best-practice-projekte/showbpp/75
https://www.klimaundenergiemodellregionen.at/ausgewaehlte-projekte/best-practice-projekte/showbpp/31
47
CASE Reports | No. 499 (2019)
Klimaaktiv 2019b. “Der Gebäudestandard.” Federal Ministry for Sustainability and Tourism. Website. Accessed 5 March 2019. https://www.klimaaktiv.at/bauen-sanieren/gebaeudedekla-ration/gebaeudestandard.html.
Klimaaktiv. 2019c. “Wohngebäude.” Federal Ministry for Sustainability and Tourism. Website. Accessed 5 March 2019 https://www.klimaaktiv.at/bauen-sanieren/wohngebaeude.html.
Kommunalkredit Public Consulting. 2016. “Umweltinvestitionen des Bundes.” Federal Ministry of Agriculture, Forestry, Environment and Water Management. Accessed 4 March 2019. Um-weltförderungen des Bundes 2015 – BMNT.
Kommunalkredit Public Consulting. 2019. “Raus aus dem Öl und thermische Gebäudesanier-ung.” Website Federal Ministry of Sustainability and Tourism. Accessed 4 March 2019. https://www.umweltfoerderung.at/index.php?id=618.
Kommunalkredit Public Consulting. 2019a. “Privatpersonen. Förderungen.” Accessed 4 March 2019. https://www.umweltfoerderung.at/privatpersonen/demoprojekte-solarhaus-foerderung-fuer-privatpersonen-klima-und-energiefonds.html.
Ministry for Social Affairs. 2019. “Mangelberufliste 2019. Accessed 4 March 2019. https://www.migration.gv.at/fileadmin/user_upload/Liste_der_Mangelberufe_2019.pdf.
Odyssee-Mure. 2019a. “Austria Profile.” Odyssee-Mure Website. Accessed 4 March 2019. http://www.odyssee-mure.eu/publications/efficiency-trends-policies-profiles/austria.html.
Odyssee-Mure. 2019b. “Definition of ODEX indicators in ODYSSEE Data Base.” Accessed 4 March 2019. http://www.odyssee-mure.eu/publications/other/odex-indicators-database-defi-nition.pdf.
Odyssee-Mure. 2019c. “Sectoral Profile: Households.” Website. Accessed 4 March 2019. http://www.odyssee-mure.eu/publications/efficiency-by-sector/households/average-energy-con-sumption-dwelling.html.
OÖNachrichten. 2017. “Österreichs Haushalte am drittwohlhabendsten.” OÖNachrichten, 14 December 2017. Accessed 4 March 2019. https://www.nachrichten.at/nachrichten/wirtschaft/OEsterreichs-Haushalte-am-drittwohlhabendsten;art15,2761892.
Österreichs Energie/Gallup. “Marktforschung 2018.” Accessed 4 March 2019. https://oester-reichsenergie.at/daten-grafiken/download-grafiken/marktforschung.html.
48
CASE Reports | No. 499 (2019)
Palen, Renata. 2018. “Consumption per Capita in Purchasing Power Standards in 2017.” Euro-stat Press Office, Press Release 192/2018. Accessed 4 March 2019. https://ec.europa.eu/eu-rostat/documents/2995521/9447627/2-13122018-AP-EN.pdf/5975f52d-b92b-448d-8c5c-0532a4d50430.
Petrovic, Gabriela. 2017. “Entwurf eines Sozialversicherungs-Zuordnungsgesetzes: Zu GZ. BMASK-21119/0002-II/A/1/2017. Stellungnahme der Bundesanstalt Statistik Österreich.” Statistik Austria, Press Release, p. 3. Accessed 4 March 2019. https://www.parlament.gv.at/PAKT/VHG/XXV/SNME/SNME_09643/imfname_623714.pdf.
Schestauber, Karla et al. 2016. “Austria’s Real Estate Market: Extremely Low Interest Rates + Economic Recovery = Supercycle?” Bank Austria, Real Estate Country Facts 10 /2016. Accessed 4 March 2019.
Seebauer, Sebastian. 2017. “Umsetzung von Gebäudesanierung in Österreich.” Joanneum Re-search. Accessed 5 March 2019. https://catch.joanneum.at/wp-content/uploads/2015/12/CATCHFactsheet_Sanscheck.pdf.
Simade, Irene. 2017. “Wohnbaubericht 2017: Leistungen, Finanzierung, Ziele.” Landesregierung Oberösterreich, Wohnbauförderung. Accessed 4 March 2019. https://www.land-oberoester-reich.gv.at/files/publikationen/Wo_Wohnbaubericht.pdf.
Statistik Austria. 2013. “Wohnungen 2011 nach Wohnsitzangabe, Art des (Wohn-)Gebäudes und Bundesland.” Last modified 4 December 2013. Accessed 4 March 2019. https://www.statis-tik.at/web_de/statistiken/menschen_und_gesellschaft/wohnen/wohnungs_und_gebaeudebes-tand/wohnungen/074218.html.
Statistik Austria. 2013a. “Gebäude 2011 nach überwiegender Gebäudeeigenschaft, Eigentümer-typ und Bundesland.” Last modified 4 December 2013. Accessed 4 March 2019. https://www.statistik.at/web_de/statistiken/menschen_und_gesellschaft/wohnen/wohnungs_und_ge-baeudebestand/Gebaeude/074174.html.
Statistik Austria. 2014. “Dwellings.” Last modified 24 October 2014. Accessed 4 March 2019. http://www.statistik.at/web_en/statistics/PeopleSociety/housing/stock_of_buildings_and_dwellings/dwellings/index.html.
Statistik Austria. 2015. “Gebäude.” Last modified 16 March 2015. Accessed 4 March 2019. https://www.statistik.at/web_en/statistics/PeopleSociety/housing/stock_of_buildings_and_dwellings/index.html.
49
CASE Reports | No. 499 (2019)
Statistik Austria. 2017. “Haushaltsenergie und Einkommen – mit Fokus Energiearmut.” Presen-tation Press Conference, 2 February 2017.
Statistik Austria. 2018. “Vorausberechnete Bevölkerungsstruktur für Österreich 2017-2100 laut Hauptszenario.” Last modified 22 November 2018. Accessed 4 March 2019. https://www.statis-tik.at/web_de/statistiken/menschen_und_gesellschaft/bevoelkerung/demographische_prog-nosen/bevoelkerungsprognosen/027308.html.
Statistik Austria. 2018a. “Ein- und Mehrpersonenhaushalte 2011 bis 2080.” Last modified 19 December 2018. Accessed 4 March 2019. https://www.statistik.at/web_de/statistiken/menschen_und_gesellschaft/bevoelkerung/demographische_prognosen/haushaltsprog-nosen/023526.html.
Statistik Austria. 2018b. “Household Income.” Last modified 9 July 2018. Accessed 4 March 2019. https://www.statistik.at/web_en/statistics/PeopleSociety/social_statistics/household_income/index.html.
Statistik Austria. 2018c. “Wohnungsgröße von Hauptwohnsitzwohnungen nach Bundesland (Zeitreihe).” Last modified 24 May 2018. Accessed 4 March 2019.
Statistik Austria. 2018d. “Fertiggestellte Wohnungen und Gebäude 2005 bis 2017.” Last modi-fied 27 November 2018. Accessed 4 March 2019. https://www.statistik.at/web_de/statistiken/menschen_und_gesellschaft/wohnen/wohnungs_und_gebaeudeerrichtung/fertigstellungen/index.html.
Statistik Austria. 2018e. “2005 bis 2017 fertiggestellte Wohnungen und neue Gebäude nach Gebäudeeigenschaften und Art der Bautätigkeit.” Last modified 27 November 2018. Accessed 4 March 2019. https://www.statistik.at/web_de/statistiken/menschen_und_gesellschaft/wohnen/wohnungs_und_gebaeudeerrichtung/fertigstellungen/026021.html.
Statistik Austria. 2018f. “2017 fertiggestellte Wohnungen nach Bauherrn bzw. Bauherrinnen und Bundesländern.” Last modified 27 November 2018. Accessed 4 March 2019. https://www.statistik.at/web_de/statistiken/menschen_und_gesellschaft/wohnen/wohnungs_und_gebaeu-deerrichtung/fertigstellungen/079515.html.
Statistik Austria. 2018g. “Wohnkosten.” Last modified 13 December 2018. Accessed 4 March 2019. https://www.statistik.at/web_de/statistiken/menschen_und_gesellschaft/wohnen/wohnkosten/index.html.
Statistik Austria. 2019. “Bevölkerung zu Jahresbeginn seit 1952 nach Bundesland.” Last modified 12 February 2019. Accessed 4 March 2019. https://www.statistik.at/web_de/statistiken/men-
50
CASE Reports | No. 499 (2019)
schen_und_gesellschaft/bevoelkerung/bevoelkerungsstand_und_veraenderung/bevoelkerung_zu_jahres-_quartalsanfang/031770.html.
Statistik Austria. 2019a. “Energieeinsatz der Haushalte.” Last modified 31 January 2019. Ac-cessed 4 March 2019. https://www.statistik.at/web_de/statistiken/energie_umwelt_innova-tion_mobilitaet/energie_und_umwelt/energie/energieeinsatz_der_haushalte/index.html.
Statistik Austria. 2019b. “Preise, Steuern.” Last modified 15 February 2019. Accessed 5 March. https://www.statistik.at/web_de/statistiken/energie_umwelt_innovation_mobilitaet/energie_und_umwelt/energie/preise_steuern/index.html.
Steffl, Thomas. 2018. “Global 2000: Wohnbaucheck 2018.” Global 2000, p. 40. Accessed 4 March 2019. https://www.global2000.at/sites/global/files/Report-Wohnbaucheck-2018.pdf.
Wien Energie, Deloitte Österreich and Wirtschaftsuniversität Wien. 2016. “Erneuerbare En-ergien in Österreich. Das jährliche Stimmungsbarometer österreichischer Haushalte zu Er-neuerbaren Energien.” Stimmungsbarometer December 2016, p. 4. Accessed 4 March 2019. https://www.wu.ac.at/fileadmin/wu/h/press/Presse_2016/Erneuerbare_Energien_in_Oester-reich_2016_FINAL.pdf.
WKO. 2018. “Neuauflage der Gebäudesanierung startet: Betriebe und Haushalte profitieren.” WKO 18 June 2018. Accessed 4 March 2019. https://news.wko.at/news/oesterreich/Neuau-flage-der-Gebaeudesanierung-startet---Betriebe-und-H.html.
Zebra2020. “Energy Efficiency Trends in Buildings.” Data Tool. Accessed 4 March 2019. http://www.zebra-monitoring.enerdata.eu/overall-building-activities/share-of-new-dwellings-in-resi-dential-stock.html#share-of-new-dwellings-with-epcs.html.
Zucha, Vlasta. 2018. “Wohnen: Zahlen, Daten und Indikatoren der Wohnstatistik.” Vienna: Statistik Austria.
51
Author: Karolina Beaumont-Leszczynski
Contents
Acronyms ...................................................................................................................................... 52
Introduction ................................................................................................................................. 53
Chapter 1: Social and economic conditions of households .............................................. 541.1. Number of households and household composition ..............................................54
1.2. Income level distribution for households and living conditions ..........................54
1.2.1. Household income ................................................................................................54
1.2.2. Household living conditions ................................................................................57
1.2.3. Household expenditures on housing ................................................................57
1.3. Distribution of people by degree of urbanisation ..................................................59
Chapter 2: Characteristics of the building stock ................................................................. 612.1. Number and type of residential dwellings ................................................................61
2.2. Changes in the housing stock ......................................................................................62
2.3. Proportion of rented and owned residential dwellings ..........................................64
2.4. Building stock by age and type ....................................................................................64
2.5. Building stock by size.....................................................................................................65
2.6. Renovation and policy objectives ...............................................................................66
2.6.1. Renovation costs and affordability ....................................................................66
2.6.2. Policy objectives ....................................................................................................68
Chapter 3: Energy consumption in private residential buildings and type of energy efficiency investments ........................................................................... 69
3.1. Energy prices ...................................................................................................................69
3.2. Energy costs .....................................................................................................................70
3.3. Energy poverty ................................................................................................................71
3.4. Level of energy performance and energy labels ......................................................72
EuroPACE Market Analysis: Belgium
52
CASE Reports | No. 499 (2019)
3.5. Energy consumption by source ...................................................................................73
3.6. Breakdown of energy consumption by end-use ......................................................74
3.7. Energy use by size and age ...........................................................................................74
3.8. Energy efficiency and renewable energy instruments ...........................................75
Chapter 4: Barriers to develop energy efficiency potential in private buildings ......... 76
Chapter 5: Policies related to energy efficiency and RES in residential buildings ....... 795.1. Energy performance of buildings directive (EPBD) in Belgium ............................79
5.2. Financing schemes in the building sector .................................................................79
5.2.1. Brussels-Capital Region .......................................................................................79
5.2.2. Walloon Region ......................................................................................................81
5.2.3. Flemish Region .......................................................................................................81
5.3. Policies for energy poverty ...........................................................................................83
5.4. Other policies and support options for buildings ....................................................83
Conclusions ................................................................................................................................. 85
References .................................................................................................................................... 87
Annex ............................................................................................................................................ 93
Acronyms
EC European CommissionEPBD Energy Performance Buildings DirectiveEPC Energy Performance CertificateEU European UnionMS Member StateOECD The Organisation for Economic Co-operation and Developmentpp percentage pointRES Renewable Energy SourcesSWOT Strengths, Weaknesses, Opportunities, and Threats (table)TWh Terawatt-hourUN United Nations
53
CASE Reports | No. 499 (2019)
Introduction
This paper presents the overall status, characteristics, and policy framework of the housing sector and the initiatives towards energy efficiency in residential buildings in Belgium in order to assess the market demand for EuroPACE – an on-tax financing scheme for home retrofits. In fact, there are over 5 million residential buildings in Belgium. In 2015, the construction of new buildings represented 44% of the building stock, while renovated buildings accounted for 56%. Moreover, there is a high degree of transformation of old buildings – office buildings or com-mercial buildings – into residential dwellings. What is also important is that Belgium is a largely urbanised country, with over 83% of the population living in urban areas. Furthermore, 62% of the building stock was built before 1970, and only 41% of dwellings have wall insulation, 36% have fully double-glazed windows, and 58% have roof insulation. These poor insulation figures show that the need for the renovation of the building stock is high. What is more, energy prices are among the highest in the EU and 20% of Belgians are experiencing energy poverty. About 22% of the total energy consumption of the country comes from buildings.
To push this renovation further, Belgium must overcome a few barriers – notably financial and technical – before achieving energy efficiency in residential buildings. Barriers related to lack of interest from the authorities are not as significant, as the country and its three regions (the Flemish Region – or Flanders, the Brussels-Capital Region, and the Walloon Region – or Wallonia), which are responsible for the development and implementation of housing and en-ergy efficiency policies, seem committed to implement initiatives for energy efficiency adapted to local conditions and challenges. For instance, financial support measures such as green cer-tificates, housing bonuses, and renovation premiums aim at boosting energy efficiency in exist-ing buildings.
In order to achieve its main objective, this paper analyses the residential building stock (age, size, quality, value, ownership, amount, as well as practical details relative to housing), the char-acteristics of its users (household composition, income level, and division between urban/rural areas, among others), the characteristics of its energy spending and production (energy price, sources, building energy levels, and energy poverty, among others), as well as the different initia-tives and policies implemented at the national and regional level to reduce energy consumption and encourage owners to invest in more energy efficient options when buying or renovating their dwelling. The conclusion of the paper presents a brief Strengths, Weaknesses, Opportuni-ties, and Threats (SWOT) analysis of the housing sector in order to evaluate the feasibility of an on-tax financing scheme such as the one proposed by EuroPACE.
54
CASE Reports | No. 499 (2019)
Chapter 1: Social and economic conditions of households
On the 1st of January 2018, there were 11,376,070 residents in Belgium. This shows an increase by 53,982 persons compared to the previous year, or a 0.5% yearly increase, which is in line with the growth registered in preceding years (Statbel, 2018b). Figures show that the region of Brus-sels-Capital is the most populated with almost 7.5 million inhabitants, while there are less than 500,000 inhabitants in all others except Antwerp (Graph 2 in the annex presents the Belgian population by region). Forecasts estimate the Belgian population to reach 12.4 million people in 2040. The population’s stable and dynamic growth, especially observed in the Brussels-Capital Region and Antwerp, increases the number of households and the demand for housing, which indicates the necessity to adapt the housing possibilities and opens a window of opportunity for new schemes aimed at improving living conditions and decreasing energy bills. The number of households in Belgium grew by 1.5% between 2010 and 2016. However, given the ageing of the population and the increase of single- and two-person households, the average household size decreases. Nevertheless, it is foreseen that the number of households will increase from 4.8 million in 2016 to 5.5 million in 2040 (ING, 2018).
Overall, the Belgian real estate market is relatively stable, since it was unaffected by the economic crisis. House prices experience steady growth, access to mortgage credit is easy, and household indebtedness is rather low.
1.1. Number of households and household composition
On the 1st of January 2018, there were 4,911,973 private households in Belgium, of which 30.9% were one-person households, 48.3% were households with 2-3 members, 18.7% were house-holds with 4-5 members, and 2.1% were households with 6 members (UN, 2018). The high-est number of one-person households are found in the Brussels-Capital Region with 547,679 households, or 46% of all households. 2,792,444 private households, of which 32% are one-per-son households, are found in the Flemish Region, and 1,571,850 private households are found in the Walloon Region, of which 36% are one-person households (Statbel, 2019b).
1.2. Income level distribution for households and living conditions
1.2.1. Household income
At a national level, the average household net-adjusted disposable income per capita is EUR 26,500 per capita per year (OECD, 2019). We observe differences at a regional level, which are shown in Graph 1 below.
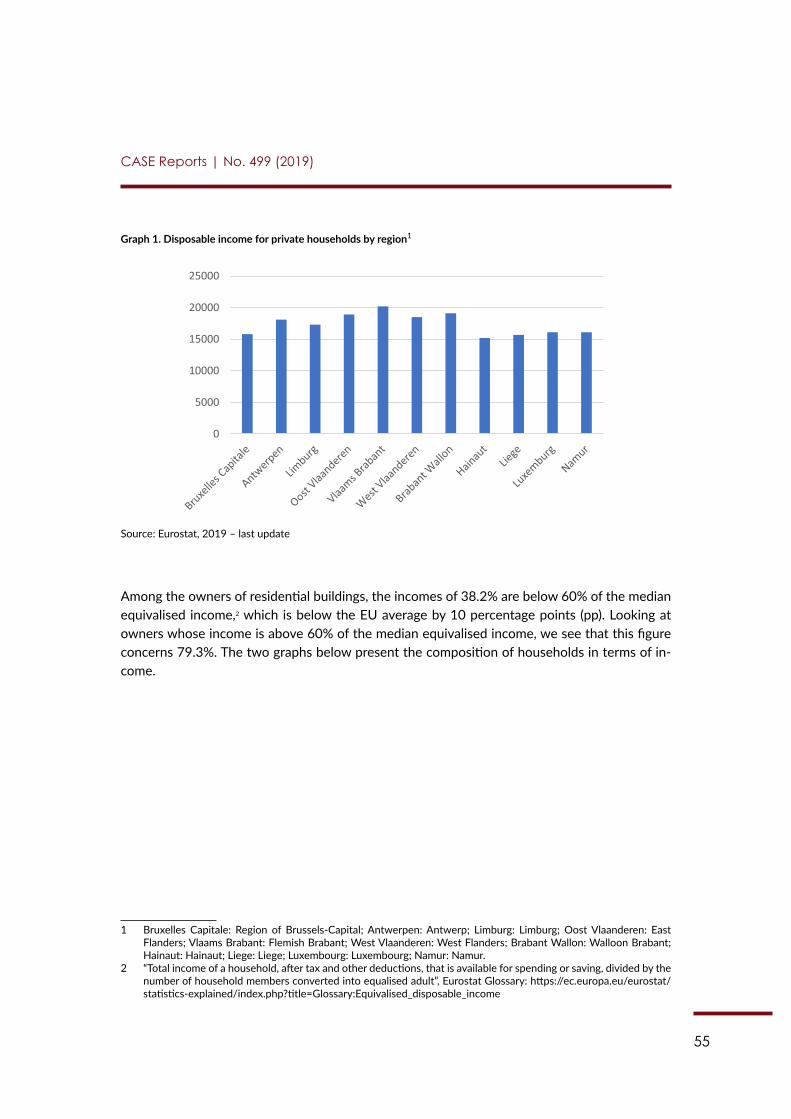
55
CASE Reports | No. 499 (2019)
Graph 1. Disposable income for private households by region1
47
possibilities and opens a window of opportunity for new schemes aimed at improving living conditions and decreasing energy bills. The number of households in Belgium grew by 1.5% between 2010 and 2016. However, given the ageing of the population and the increase of single- and two-person households, the average household size decreases. Nevertheless, it is foreseen that the number of households will increase from 4.8 million in 2016 to 5.5 million in 2040 (ING, 2018).
Overall, the Belgian real estate market is relatively stable, since it was unaffected by the economic crisis. House prices experience steady growth, access to mortgage credit is easy, and household indebtedness is rather low.
1.1 Number of households and household composition
On the 1st of January 2018, there were 4,911,973 private households in Belgium, of which 30.9% were one-person households, 48.3% were households with 2-3 members, 18.7% were households with 4-5 members, and 2.1% were households with 6 members (UN, 2018). The highest number of one-person households are found in the Brussels-Capital Region with 547,679 households, or 46% of all households. 2,792,444 private households, of which 32% are one-person households, are found in the Flemish Region, and 1,571,850 private households are found in the Walloon Region, of which 36% are one-person households (Statbel, 2019b).
1.2 Income level distribution for households and living conditions
1.2.1 Household income
At a national level, the average household net-adjusted disposable income per capita is EUR 26,500 per capita per year (OECD, 2019). We observe differences at a regional level, which are shown in Graph 1 below.
Graph 1. Disposable income for private households by region172
172 Bruxelles Capitale: Region of Brussels-Capital; Antwerpen: Antwerp; Limburg: Limburg; Oost Vlaanderen: East Flanders; Vlaams Brabant: Flemish Brabant; West Vlaanderen: West Flanders; Brabant Wallon: Walloon Brabant; Hainaut: Hainaut; Liege: Liege; Luxembourg: Luxembourg; Namur: Namur.
0
5000
10000
15000
20000
25000
Source: Eurostat, 2019 – last update
Among the owners of residential buildings, the incomes of 38.2% are below 60% of the median equivalised income,2 which is below the EU average by 10 percentage points (pp). Looking at owners whose income is above 60% of the median equivalised income, we see that this figure concerns 79.3%. The two graphs below present the composition of households in terms of in-come.
1 Bruxelles Capitale: Region of Brussels-Capital; Antwerpen: Antwerp; Limburg: Limburg; Oost Vlaanderen: East Flanders; Vlaams Brabant: Flemish Brabant; West Vlaanderen: West Flanders; Brabant Wallon: Walloon Brabant; Hainaut: Hainaut; Liege: Liege; Luxembourg: Luxembourg; Namur: Namur.
2 “Total income of a household, after tax and other deductions, that is available for spending or saving, divided by the number of household members converted into equalised adult”, Eurostat Glossary: https://ec.europa.eu/eurostat/statistics-explained/index.php?title=Glossary:Equivalised_disposable_income
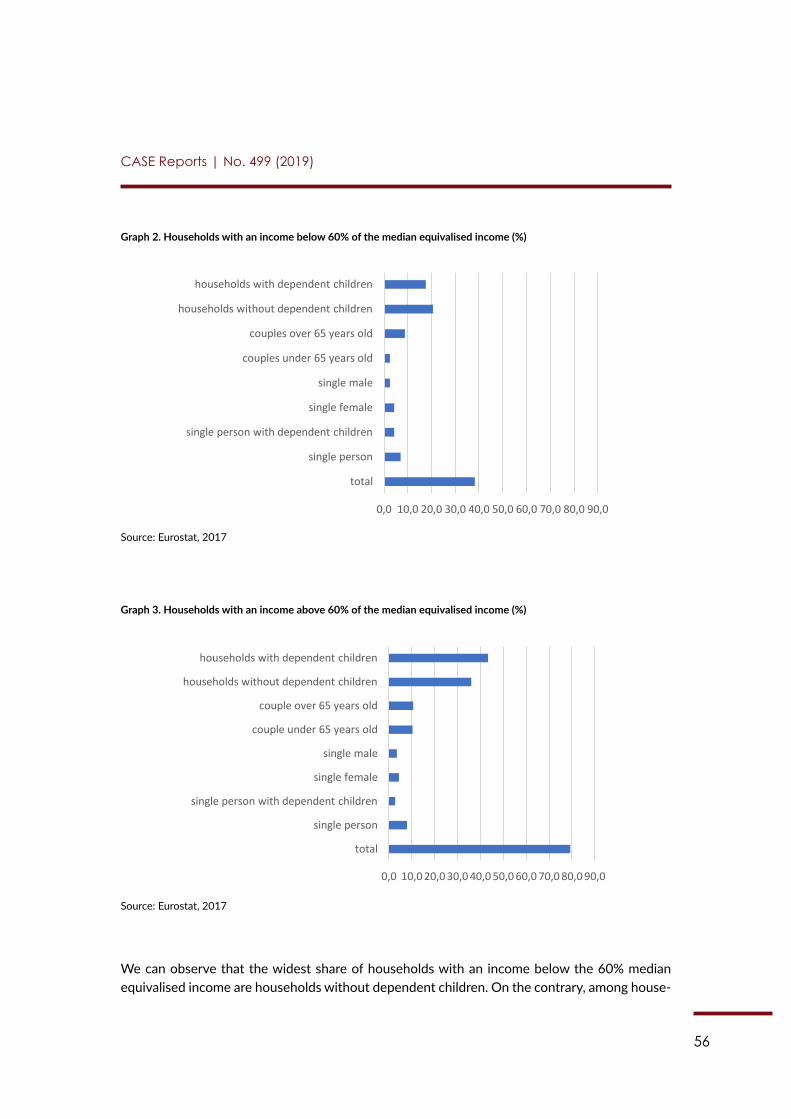
56
CASE Reports | No. 499 (2019)
Graph 2. Households with an income below 60% of the median equivalised income (%)
48
Source: Eurostat, 2019 – last update
Among the owners of residential buildings, the incomes of 38.2% are below 60% of the median equivalised income,173 which is below the EU average by 10 percentage points (pp). Looking at owners whose income is above 60% of the median equivalised income, we see that this figure concerns 79.3%. The two graphs below present the composition of households in terms of income.
Graph 2. Households with an income below 60% of the median equivalised income (%)
Source: Eurostat, 2017
Graph 3. Households with an income above 60% of the median equivalised income (%)
Source: Eurostat, 2017
We can observe that the widest share of households with an income below the 60% median equivalised income are households without dependent children. On the contrary, among households with an income
173 “Total income of a household, after tax and other deductions, that is available for spending or saving, divided by the number of household members converted into equalised adult”, Eurostat Glossary: https://ec.europa.eu/eurostat/statistics-explained/index.php?title=Glossary:Equivalised_disposable_income
0,0 10,0 20,0 30,0 40,0 50,0 60,0 70,0 80,0 90,0
total
single person
single person with dependent children
single female
single male
couples under 65 years old
couples over 65 years old
households without dependent children
households with dependent children
0,0 10,0 20,0 30,0 40,0 50,0 60,0 70,0 80,0 90,0
total
single person
single person with dependent children
single female
single male
couple under 65 years old
couple over 65 years old
households without dependent children
households with dependent children
Source: Eurostat, 2017
Graph 3. Households with an income above 60% of the median equivalised income (%)
48
Source: Eurostat, 2019 – last update
Among the owners of residential buildings, the incomes of 38.2% are below 60% of the median equivalised income,173 which is below the EU average by 10 percentage points (pp). Looking at owners whose income is above 60% of the median equivalised income, we see that this figure concerns 79.3%. The two graphs below present the composition of households in terms of income.
Graph 2. Households with an income below 60% of the median equivalised income (%)
Source: Eurostat, 2017
Graph 3. Households with an income above 60% of the median equivalised income (%)
Source: Eurostat, 2017
We can observe that the widest share of households with an income below the 60% median equivalised income are households without dependent children. On the contrary, among households with an income
173 “Total income of a household, after tax and other deductions, that is available for spending or saving, divided by the number of household members converted into equalised adult”, Eurostat Glossary: https://ec.europa.eu/eurostat/statistics-explained/index.php?title=Glossary:Equivalised_disposable_income
0,0 10,0 20,0 30,0 40,0 50,0 60,0 70,0 80,0 90,0
total
single person
single person with dependent children
single female
single male
couples under 65 years old
couples over 65 years old
households without dependent children
households with dependent children
0,0 10,0 20,0 30,0 40,0 50,0 60,0 70,0 80,0 90,0
total
single person
single person with dependent children
single female
single male
couple under 65 years old
couple over 65 years old
households without dependent children
households with dependent children
Source: Eurostat, 2017
We can observe that the widest share of households with an income below the 60% median equivalised income are households without dependent children. On the contrary, among house-
57
CASE Reports | No. 499 (2019)
holds with an income above 60% of the median equivalised income, the largest share corre-sponds to households with dependent children. This is a good indicator for a programme target-ing energy efficiency as households with dependent children are usually more likely to invest in improving the comfort of living for their children. We also observe that there are more single women owners than single men whose income is below 60% of the median equivalised income, while there are also more single women than single men in the other category. Lastly, it is impor-tant to keep in mind that as much as 20.3% of Belgians are at risk of poverty and social exclusion (Eurostat, 2017), especially single-parent households (Observatoire Belge des Inégalités, 2017). Graph 1 in the annex provides more details about the salaries earned by the Belgian population.
1.2.2. Household living conditions
In Belgium, the average household consists of 2.2 rooms per person (above the OECD average), despite an overall shrinking of dwelling size (OECD, 2019).
At the same time, because of an old building stock, 25.9% of Belgians experience housing deprivation: 18.5% of people live in a dwelling with a leaking roof, damp walls, floors, or foun-dation, or rot in window frames. Furthermore, 0.4% of Belgians live in a dwelling with neither a bath nor a shower, 1.1% in a dwelling with no toilet, and 5.9% in a dwelling that is too dark (Eurostat, 2017)). This means that over a quarter of Belgians are in need of renovation for their dwelling, not only to acquire energy efficiency, but to have their basic housing needs covered. The health of these people is at risk because of these poor living conditions that have both a short- and long-term impact. The implementation of EuroPACE among these households would be a solution to this situation, since it could support the renovation of the dwellings that require it. It would not only improve their quality of life, but it would also improve the energy efficiency of a large share of the building stock.
1.2.3. Household expenditures on housing
In 2016, the average Belgian household spent EUR 34,167 on living costs, with 36.3% of their budget spent on housing (Statbel, 2017a). The graphs below provide more details about house-hold expenditures in Belgium.
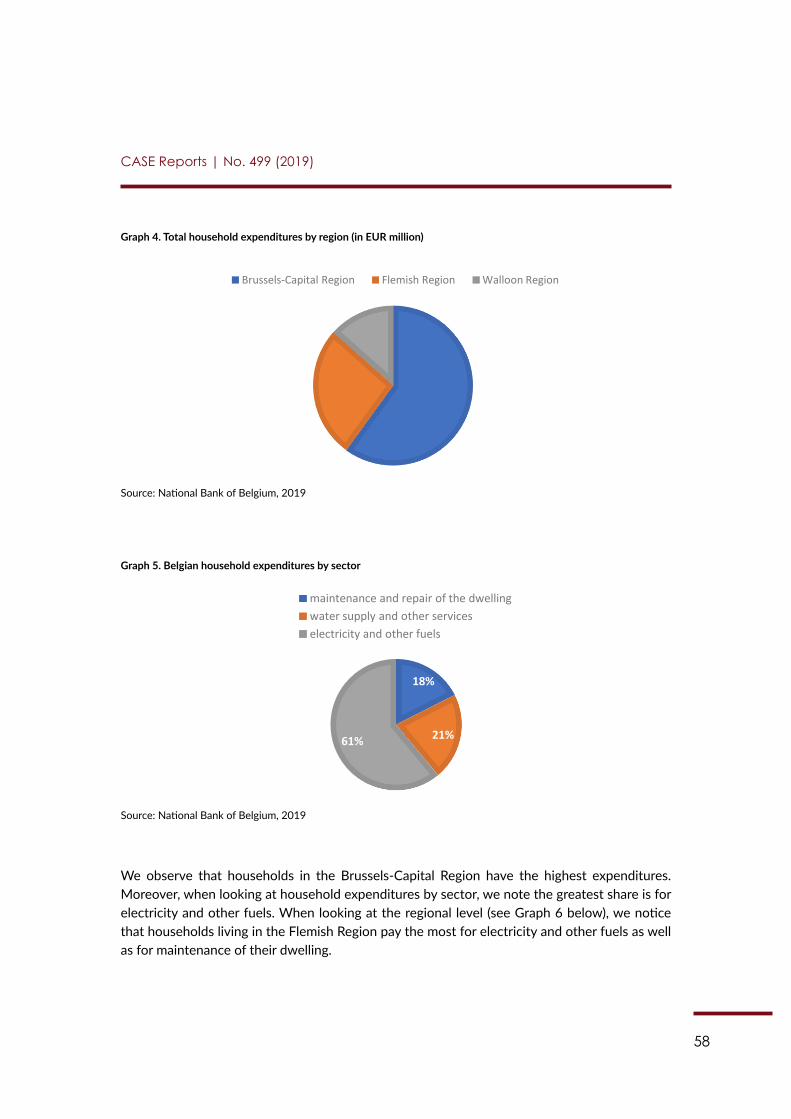
58
CASE Reports | No. 499 (2019)
Graph 4. Total household expenditures by region (in EUR million)
49
above 60% of the median equivalised income, the largest share corresponds to households with dependent children. This is a good indicator for a programme targeting energy efficiency as households with dependent children are usually more likely to invest in improving the comfort of living for their children. We also observe that there are more single women owners than single men whose income is below 60% of the median equivalised income, while there are also more single women than single men in the other category. Lastly, it is important to keep in mind that as much as 20.3% of Belgians are at risk of poverty and social exclusion (Eurostat, 2017), especially single-parent households (Observatoire Belge des Inégalités, 2017). Graph 1 in the annex provides more details about the salaries earned by the Belgian population.
1.2.2. Household living conditions
In Belgium, the average household consists of 2.2 rooms per person (above the OECD average), despite an overall shrinking of dwelling size (OECD, 2019).
At the same time, because of an old building stock, 25.9% of Belgians experience housing deprivation: 18.5% of people live in a dwelling with a leaking roof, damp walls, floors, or foundation, or rot in window frames. Furthermore, 0.4% of Belgians live in a dwelling with neither a bath nor a shower, 1.1% in a dwelling with no toilet, and 5.9% in a dwelling that is too dark (Eurostat, 2017)). This means that over a quarter of Belgians are in need of renovation for their dwelling, not only to acquire energy efficiency, but to have their basic housing needs covered. The health of these people is at risk because of these poor living conditions that have both a short- and long-term impact. The implementation of EuroPACE among these households would be a solution to this situation, since it could support the renovation of the dwellings that require it. It would not only improve their quality of life, but it would also improve the energy efficiency of a large share of the building stock. 1.2.3. Household expenditures on housing
In 2016, the average Belgian household spent EUR 34,167 on living costs, with 36.3% of their budget spent on housing (Statbel, 2017a). The graphs below provide more details about household expenditures in Belgium.
Graph 4. Total household expenditures by region (in EUR million)
Source: National Bank of Belgium, 2019
Brussels-Capital Region Flemish Region Walloon Region
Source: National Bank of Belgium, 2019
Graph 5. Belgian household expenditures by sector
50
Graph 5. Belgian household expenditures by sector
Source: National Bank of Belgium, 2019
We observe that households in the Brussels-Capital Region have the highest expenditures. Moreover, when looking at household expenditures by sector, we note the greatest share is for electricity and other fuels. When looking at the regional level (see Graph 6 below), we notice that households living in the Flemish Region pay the most for electricity and other fuels as well as for maintenance of their dwelling.
Graph 6. Household expenditures for maintenance and fuels by region (in EUR million)
Source: National Bank of Belgium, 2019
Moreover, when looking at the housing costs overburden rate,174 we observe a rate of 9.1% in Belgium, with a rate of 34.4% for households earning below 60% of the median equivalised income. It is important to notice the wide gap between the housing costs overburden rate in urban areas and in rural areas, with a 14.7% rate in cities and 6.5% rate in rural areas. Lastly, the costs overburden rate is the highest among single persons (24.4%).
As far as the costs of renovation are concerned, it appears that with an amount of EUR 12,700, average renovation costs correspond to about 48% of the yearly average income per capita (see Chapter 2). However, when simulating an average household, we see that they amount to about 17% of the yearly disposable income for a household of four people – that is, two adults in full-time work and two children, earning in total EUR 6,190 per month (50% of the Belgian population earns more than EUR 3,095 per
174 Households where housing costs are above 40% of the disposable income.
18%
21% 61%
maintenance and repair of the dwelling water supply and other services electricity and other fuels
0 1000 2000 3000 4000 5000 6000
Brussels-Capital Region
Flemish Region
Walloon Region
Electricity, gas and other fuels Maintenance and repair of the dwelling
Source: National Bank of Belgium, 2019
We observe that households in the Brussels-Capital Region have the highest expenditures. Moreover, when looking at household expenditures by sector, we note the greatest share is for electricity and other fuels. When looking at the regional level (see Graph 6 below), we notice that households living in the Flemish Region pay the most for electricity and other fuels as well as for maintenance of their dwelling.
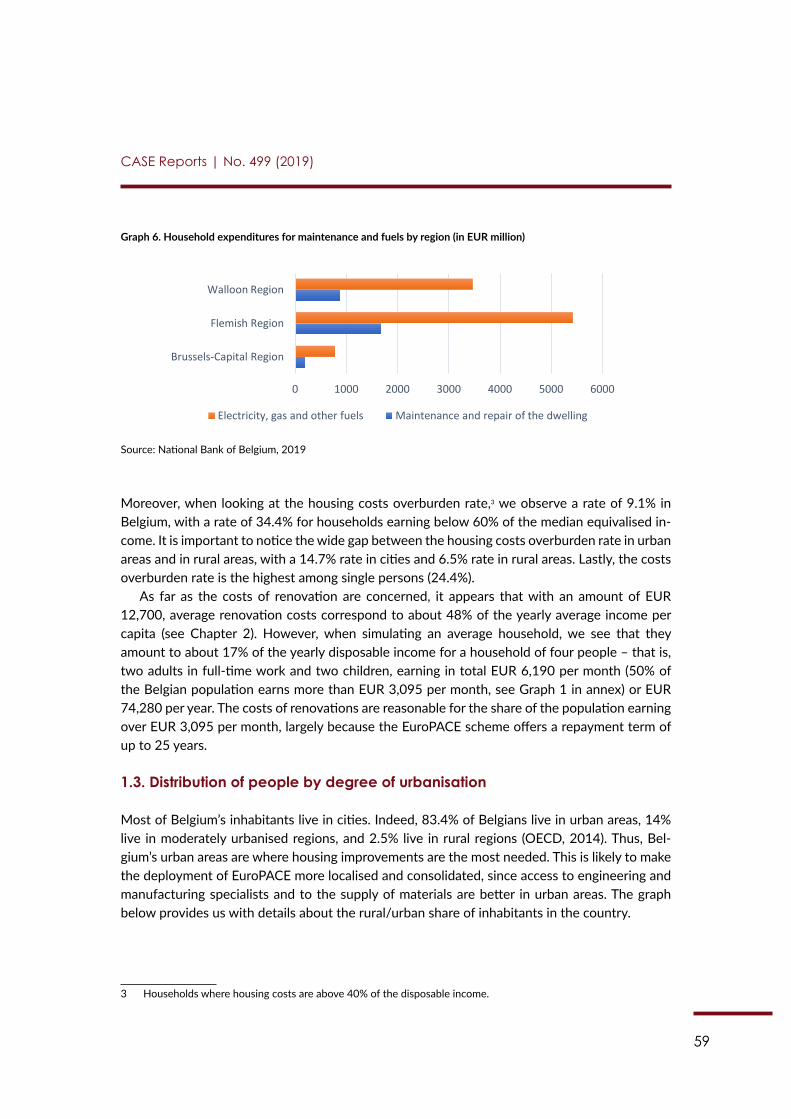
59
CASE Reports | No. 499 (2019)
Graph 6. Household expenditures for maintenance and fuels by region (in EUR million)
50
Graph 5. Belgian household expenditures by sector
Source: National Bank of Belgium, 2019
We observe that households in the Brussels-Capital Region have the highest expenditures. Moreover, when looking at household expenditures by sector, we note the greatest share is for electricity and other fuels. When looking at the regional level (see Graph 6 below), we notice that households living in the Flemish Region pay the most for electricity and other fuels as well as for maintenance of their dwelling.
Graph 6. Household expenditures for maintenance and fuels by region (in EUR million)
Source: National Bank of Belgium, 2019
Moreover, when looking at the housing costs overburden rate,174 we observe a rate of 9.1% in Belgium, with a rate of 34.4% for households earning below 60% of the median equivalised income. It is important to notice the wide gap between the housing costs overburden rate in urban areas and in rural areas, with a 14.7% rate in cities and 6.5% rate in rural areas. Lastly, the costs overburden rate is the highest among single persons (24.4%).
As far as the costs of renovation are concerned, it appears that with an amount of EUR 12,700, average renovation costs correspond to about 48% of the yearly average income per capita (see Chapter 2). However, when simulating an average household, we see that they amount to about 17% of the yearly disposable income for a household of four people – that is, two adults in full-time work and two children, earning in total EUR 6,190 per month (50% of the Belgian population earns more than EUR 3,095 per
174 Households where housing costs are above 40% of the disposable income.
18%
21% 61%
maintenance and repair of the dwelling water supply and other services electricity and other fuels
0 1000 2000 3000 4000 5000 6000
Brussels-Capital Region
Flemish Region
Walloon Region
Electricity, gas and other fuels Maintenance and repair of the dwelling
Source: National Bank of Belgium, 2019
Moreover, when looking at the housing costs overburden rate,3 we observe a rate of 9.1% in Belgium, with a rate of 34.4% for households earning below 60% of the median equivalised in-come. It is important to notice the wide gap between the housing costs overburden rate in urban areas and in rural areas, with a 14.7% rate in cities and 6.5% rate in rural areas. Lastly, the costs overburden rate is the highest among single persons (24.4%).
As far as the costs of renovation are concerned, it appears that with an amount of EUR 12,700, average renovation costs correspond to about 48% of the yearly average income per capita (see Chapter 2). However, when simulating an average household, we see that they amount to about 17% of the yearly disposable income for a household of four people – that is, two adults in full-time work and two children, earning in total EUR 6,190 per month (50% of the Belgian population earns more than EUR 3,095 per month, see Graph 1 in annex) or EUR 74,280 per year. The costs of renovations are reasonable for the share of the population earning over EUR 3,095 per month, largely because the EuroPACE scheme offers a repayment term of up to 25 years.
1.3. Distribution of people by degree of urbanisation
Most of Belgium’s inhabitants live in cities. Indeed, 83.4% of Belgians live in urban areas, 14% live in moderately urbanised regions, and 2.5% live in rural regions (OECD, 2014). Thus, Bel-gium’s urban areas are where housing improvements are the most needed. This is likely to make the deployment of EuroPACE more localised and consolidated, since access to engineering and manufacturing specialists and to the supply of materials are better in urban areas. The graph below provides us with details about the rural/urban share of inhabitants in the country.
3 Households where housing costs are above 40% of the disposable income.
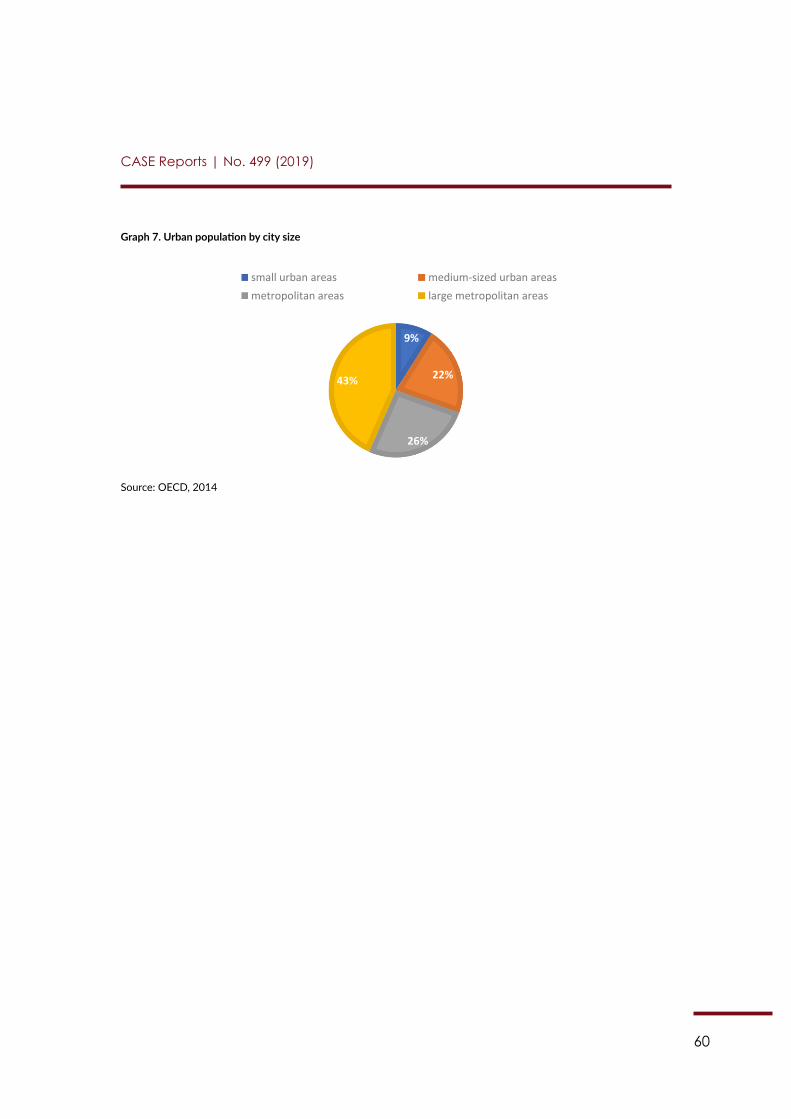
60
CASE Reports | No. 499 (2019)
Graph 7. Urban population by city size
51
month, see Graph 1 in annex) or EUR 74,280 per year. The costs of renovations are reasonable for the share of the population earning over EUR 3,095 per month, largely because the EuroPACE scheme offers a repayment term of up to 25 years.
1.3 Distribution of people by degree of urbanisation
Most of Belgium’s inhabitants live in cities. Indeed, 83.4% of Belgians live in urban areas, 14% live in moderately urbanised regions, and 2.5% live in rural regions (OECD, 2014). Thus, Belgium’s urban areas are where housing improvements are the most needed. This is likely to make the deployment of EuroPACE more localised and consolidated, since access to engineering and manufacturing specialists and to the supply of materials are better in urban areas. The graph below provides us with details about the rural/urban share of inhabitants in the country.
Graph 7. Urban population by city size
Source: OECD, 2014
Chapter 2: Characteristics of the building stock Overall, the Belgian real estate market is relatively stable, as it was unaffected by the economic crisis. House prices experience steady growth, access to mortgage credit is easy, and household indebtedness is low. 2.1 Number and type of residential dwellings
There are 5,153,019 residential buildings in Belgium, of which 3,749,752 are houses (terraced, detached, and semi-detached) and 1,403,267 are blocks of apartments. The table below provides detailed information about the number and type of buildings and dwellings by region.
Table 1. Number and type of buildings and dwellings by type and by region
Terraced house Semi-detached house Detached house Apartments
Number of buildings
Flemish Region 650,421 582,778 895,837 127,983
Brussels-Capital 106,601 15,541 5,793 35,608
Walloon Region 418,591 368,291 506,011 40,344
Total Belgium 1,175,613 966,610 1,407,641 203,935
Number of Flemish Region 695,272 588,648 901,692 820,989
9%
22%
26%
43%
small urban areas medium-sized urban areas metropolitan areas large metropolitan areas
Source: OECD, 2014
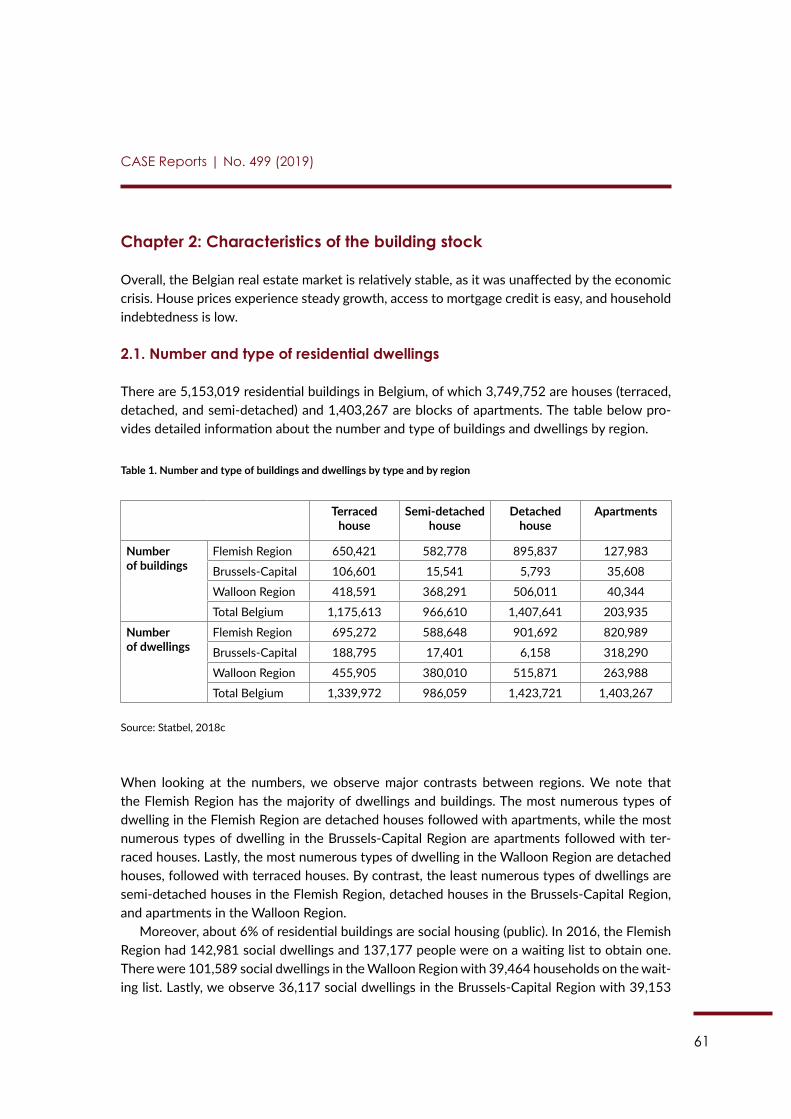
61
CASE Reports | No. 499 (2019)
Chapter 2: Characteristics of the building stock
Overall, the Belgian real estate market is relatively stable, as it was unaffected by the economic crisis. House prices experience steady growth, access to mortgage credit is easy, and household indebtedness is low.
2.1. Number and type of residential dwellings
There are 5,153,019 residential buildings in Belgium, of which 3,749,752 are houses (terraced, detached, and semi-detached) and 1,403,267 are blocks of apartments. The table below pro-vides detailed information about the number and type of buildings and dwellings by region.
Table 1. Number and type of buildings and dwellings by type and by region
Terraced house
Semi-detached house
Detached house
Apartments
Number of buildings
Flemish Region 650,421 582,778 895,837 127,983
Brussels-Capital 106,601 15,541 5,793 35,608
Walloon Region 418,591 368,291 506,011 40,344
Total Belgium 1,175,613 966,610 1,407,641 203,935
Number of dwellings
Flemish Region 695,272 588,648 901,692 820,989
Brussels-Capital 188,795 17,401 6,158 318,290
Walloon Region 455,905 380,010 515,871 263,988
Total Belgium 1,339,972 986,059 1,423,721 1,403,267
Source: Statbel, 2018c
When looking at the numbers, we observe major contrasts between regions. We note that the Flemish Region has the majority of dwellings and buildings. The most numerous types of dwelling in the Flemish Region are detached houses followed with apartments, while the most numerous types of dwelling in the Brussels-Capital Region are apartments followed with ter-raced houses. Lastly, the most numerous types of dwelling in the Walloon Region are detached houses, followed with terraced houses. By contrast, the least numerous types of dwellings are semi-detached houses in the Flemish Region, detached houses in the Brussels-Capital Region, and apartments in the Walloon Region.
Moreover, about 6% of residential buildings are social housing (public). In 2016, the Flemish Region had 142,981 social dwellings and 137,177 people were on a waiting list to obtain one. There were 101,589 social dwellings in the Walloon Region with 39,464 households on the wait-ing list. Lastly, we observe 36,117 social dwellings in the Brussels-Capital Region with 39,153
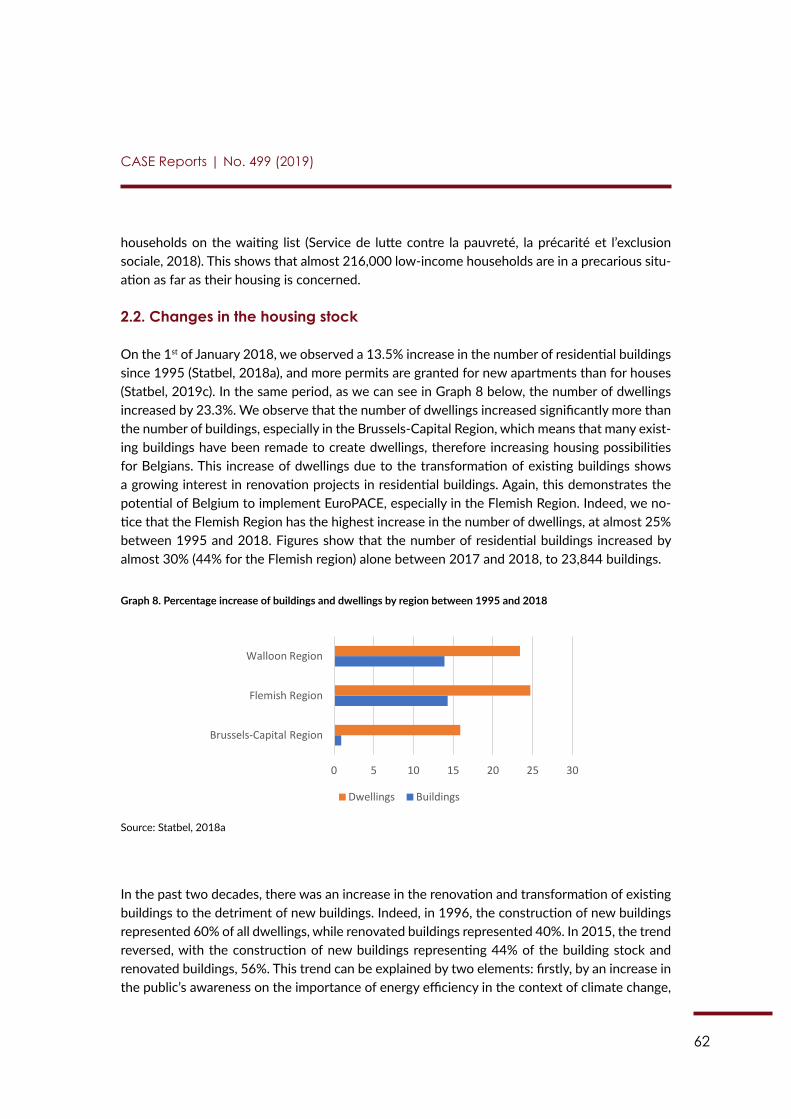
62
CASE Reports | No. 499 (2019)
households on the waiting list (Service de lutte contre la pauvreté, la précarité et l’exclusion sociale, 2018). This shows that almost 216,000 low-income households are in a precarious situ-ation as far as their housing is concerned.
2.2. Changes in the housing stock
On the 1st of January 2018, we observed a 13.5% increase in the number of residential buildings since 1995 (Statbel, 2018a), and more permits are granted for new apartments than for houses (Statbel, 2019c). In the same period, as we can see in Graph 8 below, the number of dwellings increased by 23.3%. We observe that the number of dwellings increased significantly more than the number of buildings, especially in the Brussels-Capital Region, which means that many exist-ing buildings have been remade to create dwellings, therefore increasing housing possibilities for Belgians. This increase of dwellings due to the transformation of existing buildings shows a growing interest in renovation projects in residential buildings. Again, this demonstrates the potential of Belgium to implement EuroPACE, especially in the Flemish Region. Indeed, we no-tice that the Flemish Region has the highest increase in the number of dwellings, at almost 25% between 1995 and 2018. Figures show that the number of residential buildings increased by almost 30% (44% for the Flemish region) alone between 2017 and 2018, to 23,844 buildings.
Graph 8. Percentage increase of buildings and dwellings by region between 1995 and 2018
53
Source: Statbel, 2018a
In the past two decades, there was an increase in the renovation and transformation of existing buildings to the detriment of new buildings. Indeed, in 1996, the construction of new buildings represented 60% of all dwellings, while renovated buildings represented 40%. In 2015, the trend reversed, with the construction of new buildings representing 44% of the building stock and renovated buildings, 56%. This trend can be explained by two elements: firstly, by an increase in the public’s awareness on the importance of energy efficiency in the context of climate change, and secondly – and most importantly –by the fact that in recent years, given that the construction of new buildings in urban areas is slower because of a lack of space, many initiatives have been taken by real estate investors and private companies to transform existing industrial, commercial, or office buildings into residential buildings. The aim of these initiatives is to create new dwellings, which goes in tandem with the needs of a growing population, makes use of unoccupied but viable buildings, and creates dwellings in unconventional buildings such as factories. The transformation of existing empty non-residential buildings into residential dwellings benefits from strong social and financial support from local authorities especially in areas where the buildings’ occupation rate is low (highest proportion observed in Brussels and Antwerp), which attracts real estate investors and therefore develops the building stock and increases the occupation rate.
For example, in the Brussels-Capital Region, 644,235 m² of dwellings were created from the transformation of industrial buildings between 1997 and 2011, and 639,170 m² of dwellings were created after the transformation of office buildings between 2000 and 2015. In Antwerp, the amount of m² of residential dwellings created from this transformation is 199,500 (between 2007 and 2017). As far as office buildings are concerned, between 2000 and 2015, 956,428 m² of old office buildings in the Brussels-Capital Region have been transformed, among which 639,170 m² were transformed into residential dwellings (including student housing and retirement homes). In Antwerp, between 2007 and 2017, 344,000 m² of office buildings were transformed into 199,500 m² of residential dwellings (ING, 2018). Office buildings offer the best potential for transformation into residential buildings, as changes in the way of working, implying telework, remote work, and the use of co-working spaces, will lead to a decrease in the use of such buildings (ING, 2018).
The transformation of existing non-residential buildings into residential buildings is an opportunity for the EuroPACE scheme, as the costs of eco-friendly renovation can be integrated into an on-tax financing scheme.
0 5 10 15 20 25 30
Brussels-Capital Region
Flemish Region
Walloon Region
Dwellings Buildings
Source: Statbel, 2018a
In the past two decades, there was an increase in the renovation and transformation of existing buildings to the detriment of new buildings. Indeed, in 1996, the construction of new buildings represented 60% of all dwellings, while renovated buildings represented 40%. In 2015, the trend reversed, with the construction of new buildings representing 44% of the building stock and renovated buildings, 56%. This trend can be explained by two elements: firstly, by an increase in the public’s awareness on the importance of energy efficiency in the context of climate change,
63
CASE Reports | No. 499 (2019)
and secondly – and most importantly –by the fact that in recent years, given that the construc-tion of new buildings in urban areas is slower because of a lack of space, many initiatives have been taken by real estate investors and private companies to transform existing industrial, com-mercial, or office buildings into residential buildings. The aim of these initiatives is to create new dwellings, which goes in tandem with the needs of a growing population, makes use of unoccupied but viable buildings, and creates dwellings in unconventional buildings such as fac-tories. The transformation of existing empty non-residential buildings into residential dwellings benefits from strong social and financial support from local authorities especially in areas where the buildings’ occupation rate is low (highest proportion observed in Brussels and Antwerp), which attracts real estate investors and therefore develops the building stock and increases the occupation rate.
For example, in the Brussels-Capital Region, 644,235 m² of dwellings were created from the transformation of industrial buildings between 1997 and 2011, and 639,170 m² of dwellings were created after the transformation of office buildings between 2000 and 2015. In Antwerp, the amount of m² of residential dwellings created from this transformation is 199,500 (between 2007 and 2017). As far as office buildings are concerned, between 2000 and 2015, 956,428 m² of old office buildings in the Brussels-Capital Region have been transformed, among which 639,170 m² were transformed into residential dwellings (including student housing and retire-ment homes). In Antwerp, between 2007 and 2017, 344,000 m² of office buildings were trans-formed into 199,500 m² of residential dwellings (ING, 2018). Office buildings offer the best po-tential for transformation into residential buildings, as changes in the way of working, implying telework, remote work, and the use of co-working spaces, will lead to a decrease in the use of such buildings (ING, 2018).
The transformation of existing non-residential buildings into residential buildings is an op-portunity for the EuroPACE scheme, as the costs of eco-friendly renovation can be integrated into an on-tax financing scheme.
Overall, when looking at socio-economic phenomena, we observe that there will be a need for more dwellings and/or buildings in the future because of a growing population, as well as be-cause of the phenomenon of decohabitation.4 Indeed, with the increase in divorce numbers, the number of needed dwellings is also increasing. Both the phenomena of ageing residential build-ings as well as increase in the need for dwellings by the population due to population growth and changes in household structure indicate significant needs in the building sector in Belgium. Although currently the number of dwellings is 10% higher than the number of households, it is estimated that an additional 470,000 dwellings will be needed by 2030. This means that more people will need to pursue the renovation of existing buildings, which makes the need for the implementation of EuroPACE even more promising in the future.
5% of the building stock is in such a poor shape that it does not allow for renovation, and only requires demolition. This correspond to about 200,000 buildings in the country (CSTC, 2018). Currently, 4,000 to 5,000 dwellings are demolished per year, but this number will need to be
4 Decohabitation: phenomenon in which people living together cease of sharing the same home, because of separa-tion or professional transfer.
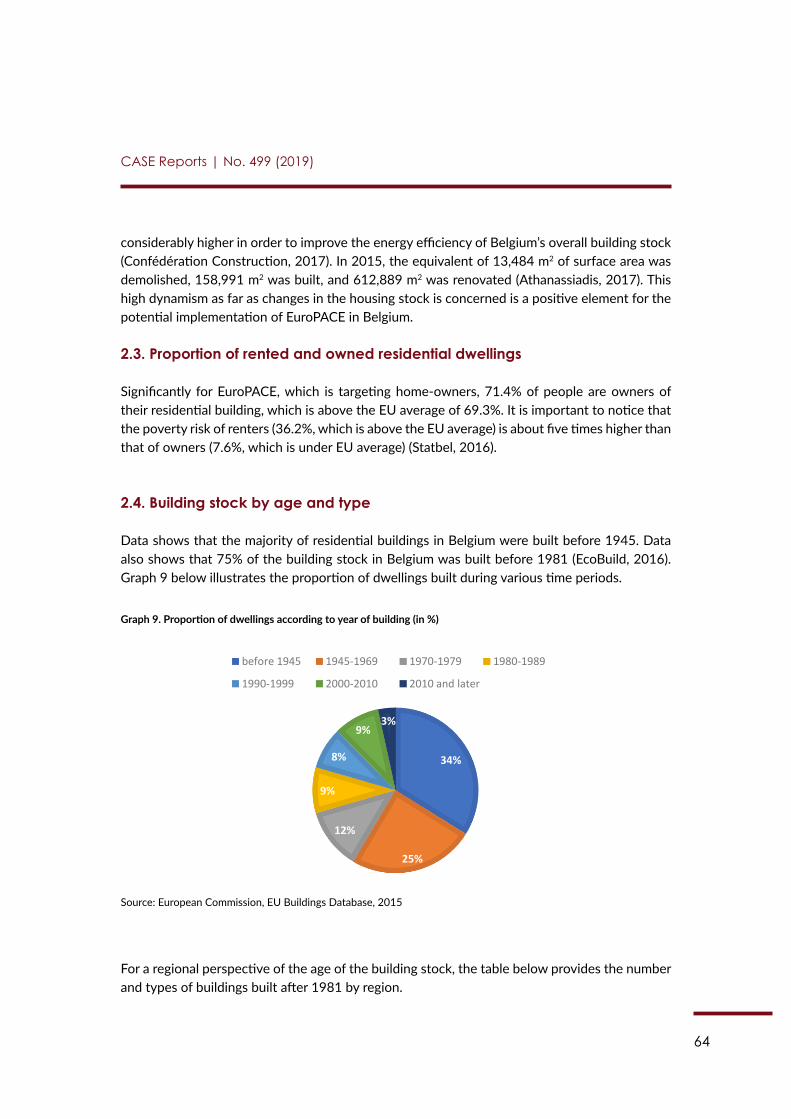
64
CASE Reports | No. 499 (2019)
considerably higher in order to improve the energy efficiency of Belgium’s overall building stock (Confédération Construction, 2017). In 2015, the equivalent of 13,484 m2 of surface area was demolished, 158,991 m2 was built, and 612,889 m2 was renovated (Athanassiadis, 2017). This high dynamism as far as changes in the housing stock is concerned is a positive element for the potential implementation of EuroPACE in Belgium.
2.3. Proportion of rented and owned residential dwellings
Significantly for EuroPACE, which is targeting home-owners, 71.4% of people are owners of their residential building, which is above the EU average of 69.3%. It is important to notice that the poverty risk of renters (36.2%, which is above the EU average) is about five times higher than that of owners (7.6%, which is under EU average) (Statbel, 2016).
2.4. Building stock by age and type
Data shows that the majority of residential buildings in Belgium were built before 1945. Data also shows that 75% of the building stock in Belgium was built before 1981 (EcoBuild, 2016). Graph 9 below illustrates the proportion of dwellings built during various time periods.
Graph 9. Proportion of dwellings according to year of building (in %)
55
Source: European Commission, EU Buildings Database, 2015
For a regional perspective of the age of the building stock, the table below provides the number and types of buildings built after 1981 by region.
34%
25%
12%
9%
8%
9% 3%
before 1945 1945-1969 1970-1979 1980-1989
1990-1999 2000-2010 2010 and later
Source: European Commission, EU Buildings Database, 2015
For a regional perspective of the age of the building stock, the table below provides the number and types of buildings built after 1981 by region.
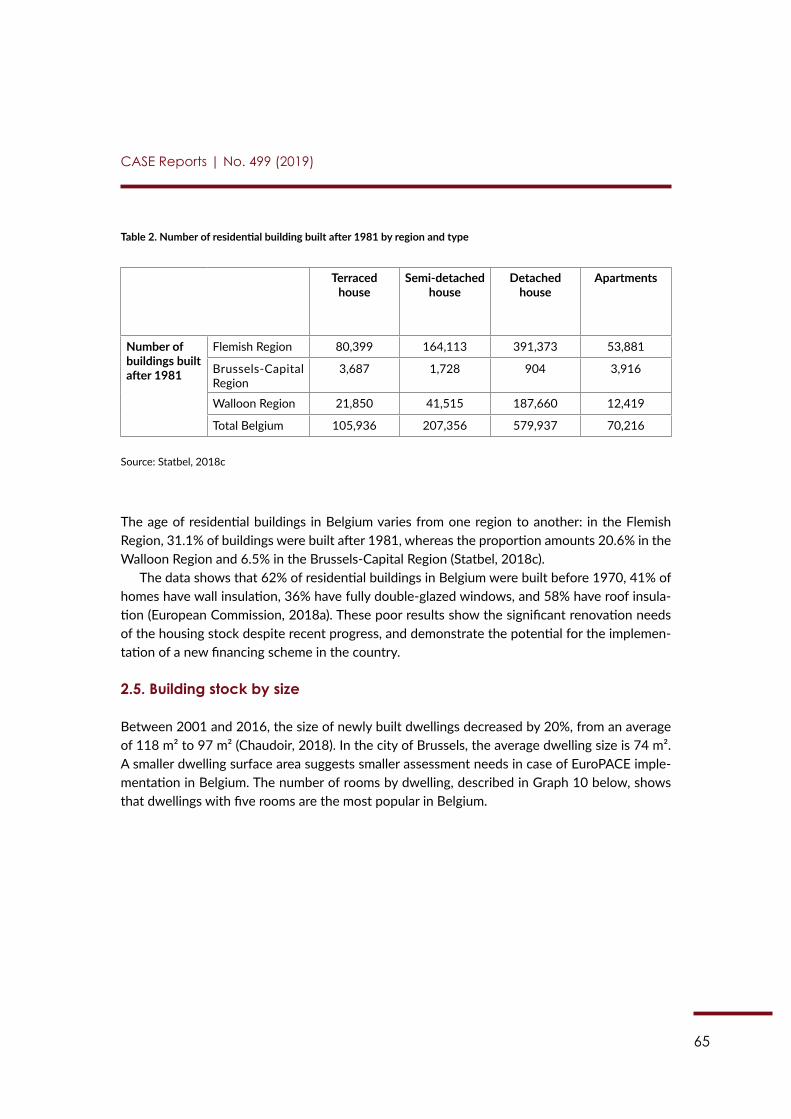
65
CASE Reports | No. 499 (2019)
Table 2. Number of residential building built after 1981 by region and type
Terraced house
Semi-detached house
Detached house
Apartments
Number of buildings built after 1981
Flemish Region 80,399 164,113 391,373 53,881
Brussels-Capital Region
3,687 1,728 904 3,916
Walloon Region 21,850 41,515 187,660 12,419
Total Belgium 105,936 207,356 579,937 70,216
Source: Statbel, 2018c
The age of residential buildings in Belgium varies from one region to another: in the Flemish Region, 31.1% of buildings were built after 1981, whereas the proportion amounts 20.6% in the Walloon Region and 6.5% in the Brussels-Capital Region (Statbel, 2018c).
The data shows that 62% of residential buildings in Belgium were built before 1970, 41% of homes have wall insulation, 36% have fully double-glazed windows, and 58% have roof insula-tion (European Commission, 2018a). These poor results show the significant renovation needs of the housing stock despite recent progress, and demonstrate the potential for the implemen-tation of a new financing scheme in the country.
2.5. Building stock by size
Between 2001 and 2016, the size of newly built dwellings decreased by 20%, from an average of 118 m² to 97 m² (Chaudoir, 2018). In the city of Brussels, the average dwelling size is 74 m². A smaller dwelling surface area suggests smaller assessment needs in case of EuroPACE imple-mentation in Belgium. The number of rooms by dwelling, described in Graph 10 below, shows that dwellings with five rooms are the most popular in Belgium.
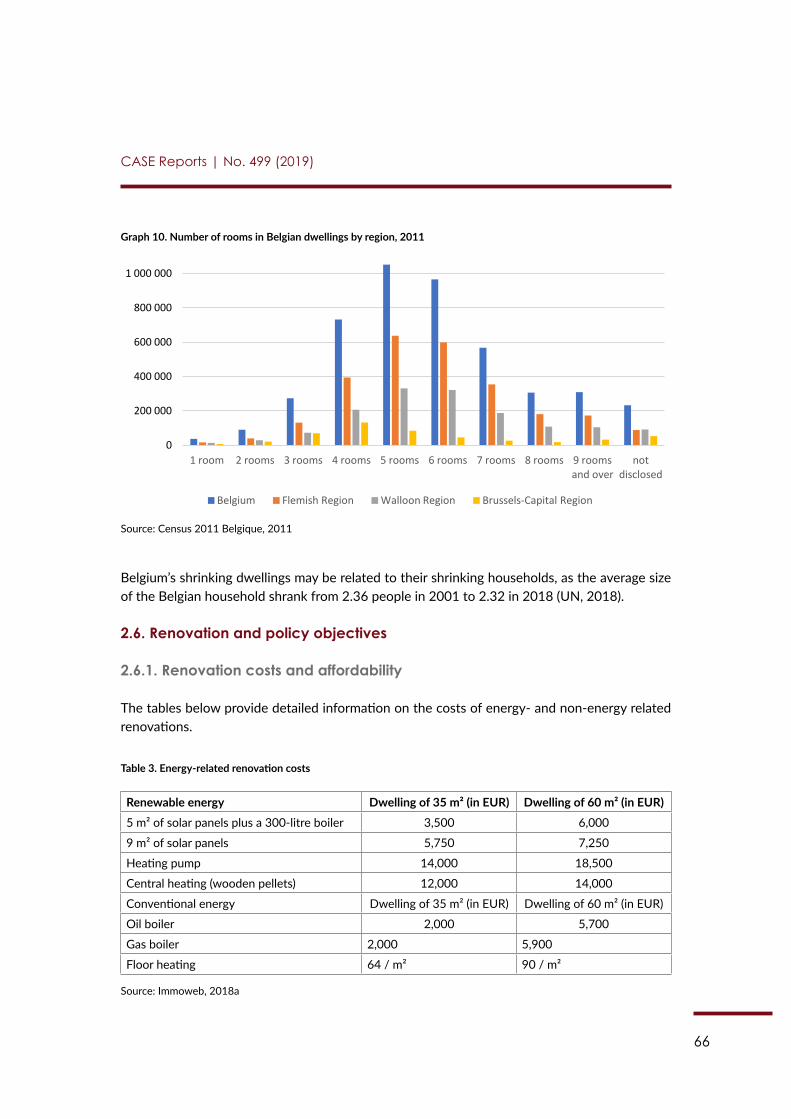
66
CASE Reports | No. 499 (2019)
Graph 10. Number of rooms in Belgian dwellings by region, 2011
56
Table 2. Number of residential building built after 1981 by region and type
Terraced house Semi-detached
house Detached
house Apartments
Number of buildings built after
1981
Flemish Region 80,399 164,113 391,373 53,881
Brussels-Capital Region 3,687 1,728 904 3,916
Walloon Region 21,850 41,515 187,660 12,419
Total Belgium 105,936 207,356 579,937 70,216
Source: Statbel, 2018c
The age of residential buildings in Belgium varies from one region to another: in the Flemish Region, 31.1% of buildings were built after 1981, whereas the proportion amounts 20.6% in the Walloon Region and 6.5% in the Brussels-Capital Region (Statbel, 2018c).
The data shows that 62% of residential buildings in Belgium were built before 1970, 41% of homes have wall insulation, 36% have fully double-glazed windows, and 58% have roof insulation (European Commission, 2018a). These poor results show the significant renovation needs of the housing stock despite recent progress, and demonstrate the potential for the implementation of a new financing scheme in the country.
2.5 Building stock by size
Between 2001 and 2016, the size of newly built dwellings decreased by 20%, from an average of 118 m² to 97 m² (Chaudoir, 2018). In the city of Brussels, the average dwelling size is 74 m². A smaller dwelling surface area suggests smaller assessment needs in case of EuroPACE implementation in Belgium. The number of rooms by dwelling, described in Graph 10 below, shows that dwellings with five rooms are the most popular in Belgium.
Graph 10. Number of rooms in Belgian dwellings by region, 2011
Source: Census 2011 Belgique, 2011
0
200 000
400 000
600 000
800 000
1 000 000
1 room 2 rooms 3 rooms 4 rooms 5 rooms 6 rooms 7 rooms 8 rooms 9 rooms and over
not disclosed
Belgium Flemish Region Walloon Region Brussels-Capital Region
Source: Census 2011 Belgique, 2011
Belgium’s shrinking dwellings may be related to their shrinking households, as the average size of the Belgian household shrank from 2.36 people in 2001 to 2.32 in 2018 (UN, 2018).
2.6. Renovation and policy objectives
2.6.1. Renovation costs and affordability
The tables below provide detailed information on the costs of energy- and non-energy related renovations.
Table 3. Energy-related renovation costs
Renewable energy Dwelling of 35 m² (in EUR) Dwelling of 60 m² (in EUR)5 m² of solar panels plus a 300-litre boiler 3,500 6,000
9 m² of solar panels 5,750 7,250
Heating pump 14,000 18,500
Central heating (wooden pellets) 12,000 14,000
Conventional energy Dwelling of 35 m² (in EUR) Dwelling of 60 m² (in EUR)
Oil boiler 2,000 5,700
Gas boiler 2,000 5,900
Floor heating 64 / m² 90 / m²
Source: Immoweb, 2018a
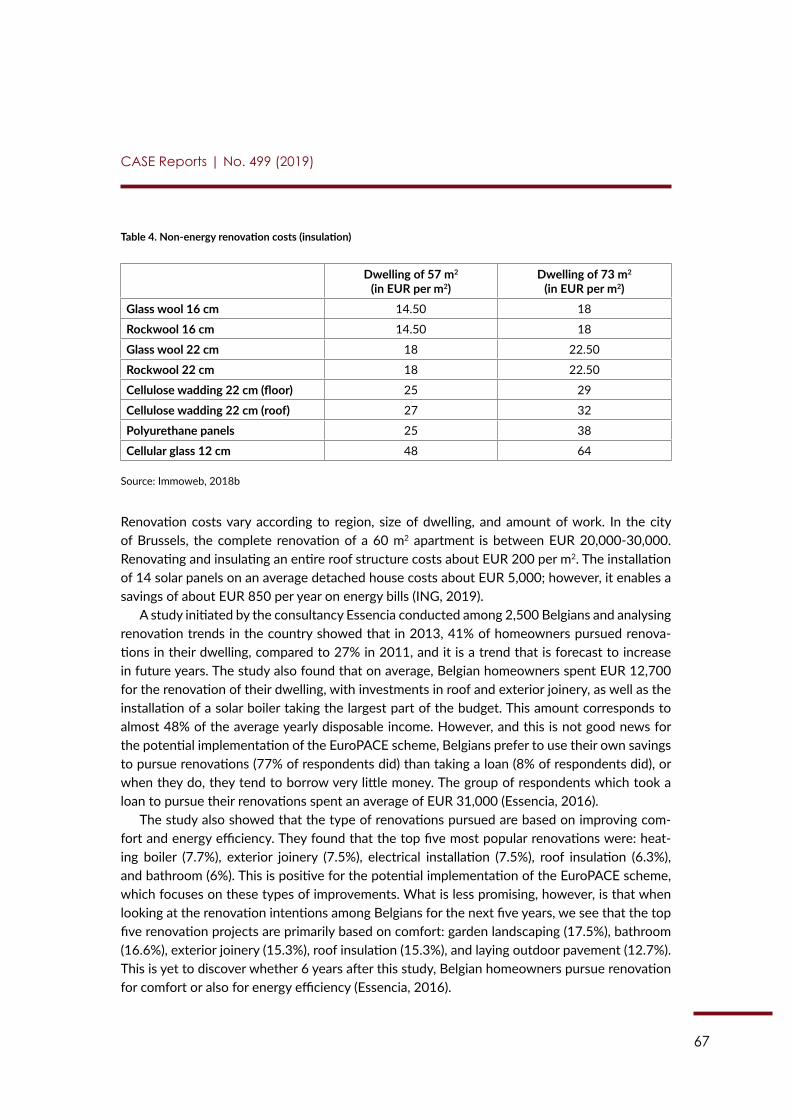
67
CASE Reports | No. 499 (2019)
Table 4. Non-energy renovation costs (insulation)
Dwelling of 57 m2 (in EUR per m2)
Dwelling of 73 m2 (in EUR per m2)
Glass wool 16 cm 14.50 18
Rockwool 16 cm 14.50 18
Glass wool 22 cm 18 22.50
Rockwool 22 cm 18 22.50
Cellulose wadding 22 cm (floor) 25 29
Cellulose wadding 22 cm (roof) 27 32
Polyurethane panels 25 38
Cellular glass 12 cm 48 64
Source: Immoweb, 2018b
Renovation costs vary according to region, size of dwelling, and amount of work. In the city of Brussels, the complete renovation of a 60 m2 apartment is between EUR 20,000-30,000. Renovating and insulating an entire roof structure costs about EUR 200 per m2. The installation of 14 solar panels on an average detached house costs about EUR 5,000; however, it enables a savings of about EUR 850 per year on energy bills (ING, 2019).
A study initiated by the consultancy Essencia conducted among 2,500 Belgians and analysing renovation trends in the country showed that in 2013, 41% of homeowners pursued renova-tions in their dwelling, compared to 27% in 2011, and it is a trend that is forecast to increase in future years. The study also found that on average, Belgian homeowners spent EUR 12,700 for the renovation of their dwelling, with investments in roof and exterior joinery, as well as the installation of a solar boiler taking the largest part of the budget. This amount corresponds to almost 48% of the average yearly disposable income. However, and this is not good news for the potential implementation of the EuroPACE scheme, Belgians prefer to use their own savings to pursue renovations (77% of respondents did) than taking a loan (8% of respondents did), or when they do, they tend to borrow very little money. The group of respondents which took a loan to pursue their renovations spent an average of EUR 31,000 (Essencia, 2016).
The study also showed that the type of renovations pursued are based on improving com-fort and energy efficiency. They found that the top five most popular renovations were: heat-ing boiler (7.7%), exterior joinery (7.5%), electrical installation (7.5%), roof insulation (6.3%), and bathroom (6%). This is positive for the potential implementation of the EuroPACE scheme, which focuses on these types of improvements. What is less promising, however, is that when looking at the renovation intentions among Belgians for the next five years, we see that the top five renovation projects are primarily based on comfort: garden landscaping (17.5%), bathroom (16.6%), exterior joinery (15.3%), roof insulation (15.3%), and laying outdoor pavement (12.7%). This is yet to discover whether 6 years after this study, Belgian homeowners pursue renovation for comfort or also for energy efficiency (Essencia, 2016).
68
CASE Reports | No. 499 (2019)
2.6.2. Policy objectives
When looking at the different policy measures implemented in Belgium to develop and encour-age renovation initiatives targeting energy efficiency (presented in Chapter 5), we observe that the majority are of a financial or fiscal nature, followed by measures geared towards information and awareness raising campaigns. The significant amount of financial measures in all three Bel-gian regions – namely, tax reductions and premiums – is very positive for EuroPACE, as they can enable the implementation of EuroPACE by blending it with an existing measure. Over the past decades, many measures have been implemented to improve the energy efficiency of buildings. The Brussels-Capital Region is the leader at the national level, with stringent requirements for the energy efficiency of new buildings (close to those for “passive houses”, as discussed earlier in this report). However, the requirements are less strict for renovation, even though over the past few years renovation initiatives have been increasingly focused on energy efficiency.
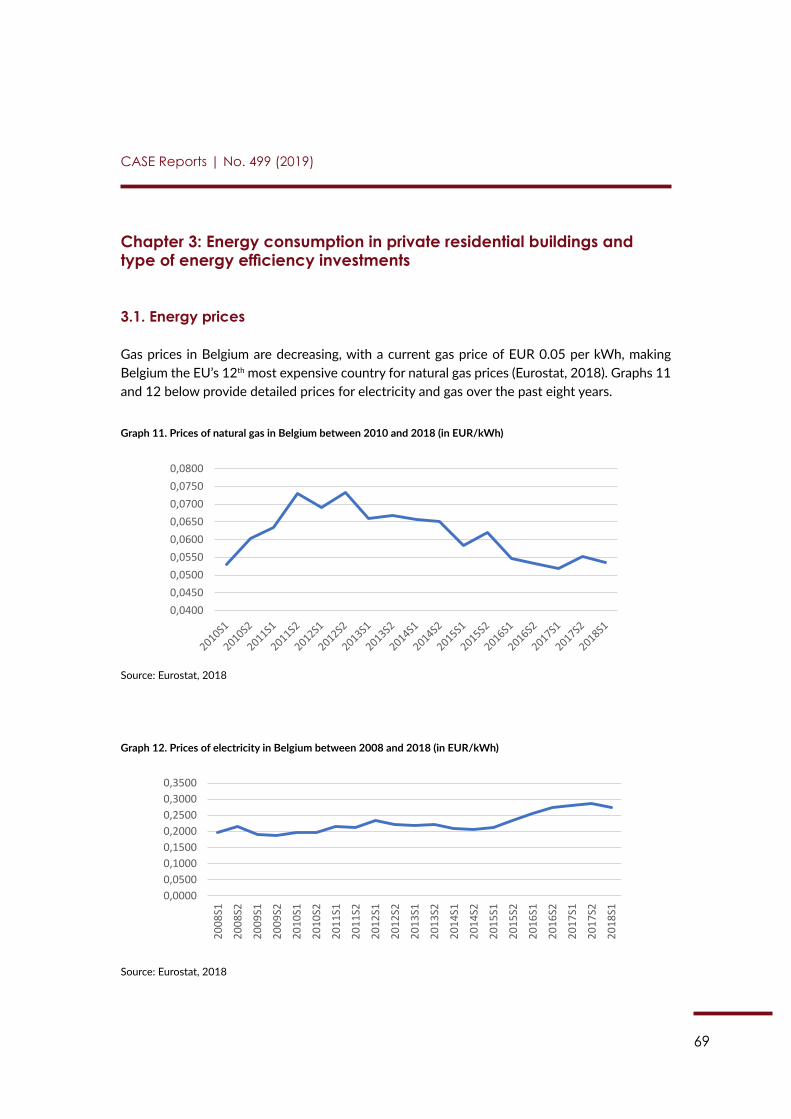
69
CASE Reports | No. 499 (2019)
Chapter 3: Energy consumption in private residential buildings and type of energy efficiency investments
3.1. Energy prices
Gas prices in Belgium are decreasing, with a current gas price of EUR 0.05 per kWh, making Belgium the EU’s 12th most expensive country for natural gas prices (Eurostat, 2018). Graphs 11 and 12 below provide detailed prices for electricity and gas over the past eight years.
Graph 11. Prices of natural gas in Belgium between 2010 and 2018 (in EUR/kWh)
59
Graph 11. Prices of natural gas in Belgium between 2010 and 2018 (in EUR/kWh)
Source: Eurostat, 2018
Graph 12. Prices of electricity in Belgium between 2008 and 2018 (in EUR/kWh)
Source: Eurostat, 2018
When looking at these two graphs, we can notice that since 2012, the price of natural gas is slightly decreasing while since 2014, the price of electricity is rising, with prices being between EUR 90 and 100 more expensive at the end of 2018 than in the same period the year before (RTBF, 2018).
3.2 Energy costs
Approximately 4.8% (4.8% in the Flemish Region, 4.1% in the Brussels-Capital Region, and 5.7% in the Walloon Region) of all Belgian household expenses are dedicated to electricity, gas, and other fuels (Statbel, 2016). Furthermore, 22.7% of all electricity in Belgium is consumed by households. In 2014, 7,709 kWh were used, on average, per inhabitant in the country (CallMePower, 2018). For dwellings where all appliances are electric (water, cooking, heating), the average cost of energy for Belgian households living in a dwelling of 70 m² is about EUR 770 per year, while in dwellings with only basic electricity (lighting and household appliances), this cost amounts EUR 122 per year. In dwellings where everything (water, cooking, and heating) is powered by gas, energy consumption is twice lower, and, with gas being cheaper than electricity, energy costs in dwellings where the main source of power is gas are lower. The table below gives more details about the costs and consumption of energy per household
0,0400 0,0450 0,0500 0,0550 0,0600 0,0650 0,0700 0,0750 0,0800
0,0000 0,0500 0,1000 0,1500 0,2000 0,2500 0,3000 0,3500
2008
S1
2008
S2
2009
S1
2009
S2
2010
S1
2010
S2
2011
S1
2011
S2
2012
S1
2012
S2
2013
S1
2013
S2
2014
S1
2014
S2
2015
S1
2015
S2
2016
S1
2016
S2
2017
S1
2017
S2
2018
S1
Source: Eurostat, 2018
Graph 12. Prices of electricity in Belgium between 2008 and 2018 (in EUR/kWh)
59
Graph 11. Prices of natural gas in Belgium between 2010 and 2018 (in EUR/kWh)
Source: Eurostat, 2018
Graph 12. Prices of electricity in Belgium between 2008 and 2018 (in EUR/kWh)
Source: Eurostat, 2018
When looking at these two graphs, we can notice that since 2012, the price of natural gas is slightly decreasing while since 2014, the price of electricity is rising, with prices being between EUR 90 and 100 more expensive at the end of 2018 than in the same period the year before (RTBF, 2018).
3.2 Energy costs
Approximately 4.8% (4.8% in the Flemish Region, 4.1% in the Brussels-Capital Region, and 5.7% in the Walloon Region) of all Belgian household expenses are dedicated to electricity, gas, and other fuels (Statbel, 2016). Furthermore, 22.7% of all electricity in Belgium is consumed by households. In 2014, 7,709 kWh were used, on average, per inhabitant in the country (CallMePower, 2018). For dwellings where all appliances are electric (water, cooking, heating), the average cost of energy for Belgian households living in a dwelling of 70 m² is about EUR 770 per year, while in dwellings with only basic electricity (lighting and household appliances), this cost amounts EUR 122 per year. In dwellings where everything (water, cooking, and heating) is powered by gas, energy consumption is twice lower, and, with gas being cheaper than electricity, energy costs in dwellings where the main source of power is gas are lower. The table below gives more details about the costs and consumption of energy per household
0,0400 0,0450 0,0500 0,0550 0,0600 0,0650 0,0700 0,0750 0,0800
0,0000 0,0500 0,1000 0,1500 0,2000 0,2500 0,3000 0,3500
2008
S1
2008
S2
2009
S1
2009
S2
2010
S1
2010
S2
2011
S1
2011
S2
2012
S1
2012
S2
2013
S1
2013
S2
2014
S1
2014
S2
2015
S1
2015
S2
2016
S1
2016
S2
2017
S1
2017
S2
2018
S1
Source: Eurostat, 2018
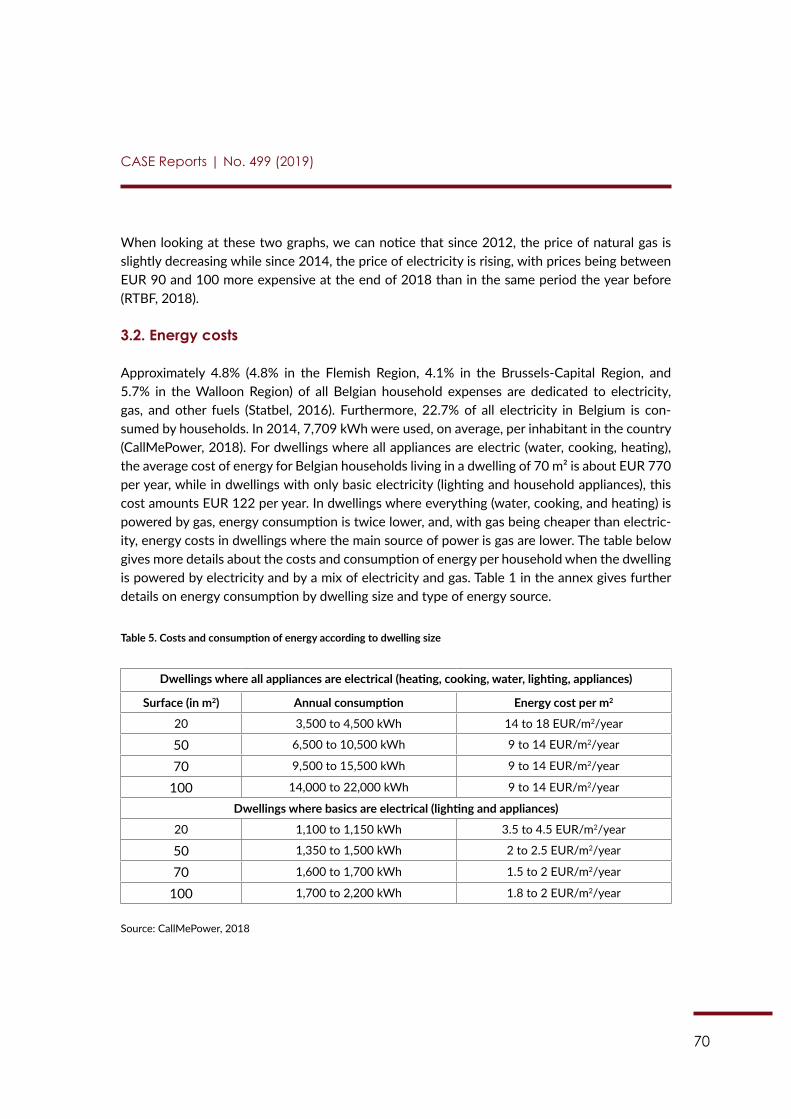
70
CASE Reports | No. 499 (2019)
When looking at these two graphs, we can notice that since 2012, the price of natural gas is slightly decreasing while since 2014, the price of electricity is rising, with prices being between EUR 90 and 100 more expensive at the end of 2018 than in the same period the year before (RTBF, 2018).
3.2. Energy costs
Approximately 4.8% (4.8% in the Flemish Region, 4.1% in the Brussels-Capital Region, and 5.7% in the Walloon Region) of all Belgian household expenses are dedicated to electricity, gas, and other fuels (Statbel, 2016). Furthermore, 22.7% of all electricity in Belgium is con-sumed by households. In 2014, 7,709 kWh were used, on average, per inhabitant in the country (CallMePower, 2018). For dwellings where all appliances are electric (water, cooking, heating), the average cost of energy for Belgian households living in a dwelling of 70 m² is about EUR 770 per year, while in dwellings with only basic electricity (lighting and household appliances), this cost amounts EUR 122 per year. In dwellings where everything (water, cooking, and heating) is powered by gas, energy consumption is twice lower, and, with gas being cheaper than electric-ity, energy costs in dwellings where the main source of power is gas are lower. The table below gives more details about the costs and consumption of energy per household when the dwelling is powered by electricity and by a mix of electricity and gas. Table 1 in the annex gives further details on energy consumption by dwelling size and type of energy source.
Table 5. Costs and consumption of energy according to dwelling size
Dwellings where all appliances are electrical (heating, cooking, water, lighting, appliances)
Surface (in m2) Annual consumption Energy cost per m2
20 3,500 to 4,500 kWh 14 to 18 EUR/m2/year
50 6,500 to 10,500 kWh 9 to 14 EUR/m2/year
70 9,500 to 15,500 kWh 9 to 14 EUR/m2/year
100 14,000 to 22,000 kWh 9 to 14 EUR/m2/year
Dwellings where basics are electrical (lighting and appliances)
20 1,100 to 1,150 kWh 3.5 to 4.5 EUR/m2/year
50 1,350 to 1,500 kWh 2 to 2.5 EUR/m2/year
70 1,600 to 1,700 kWh 1.5 to 2 EUR/m2/year
100 1,700 to 2,200 kWh 1.8 to 2 EUR/m2/year
Source: CallMePower, 2018
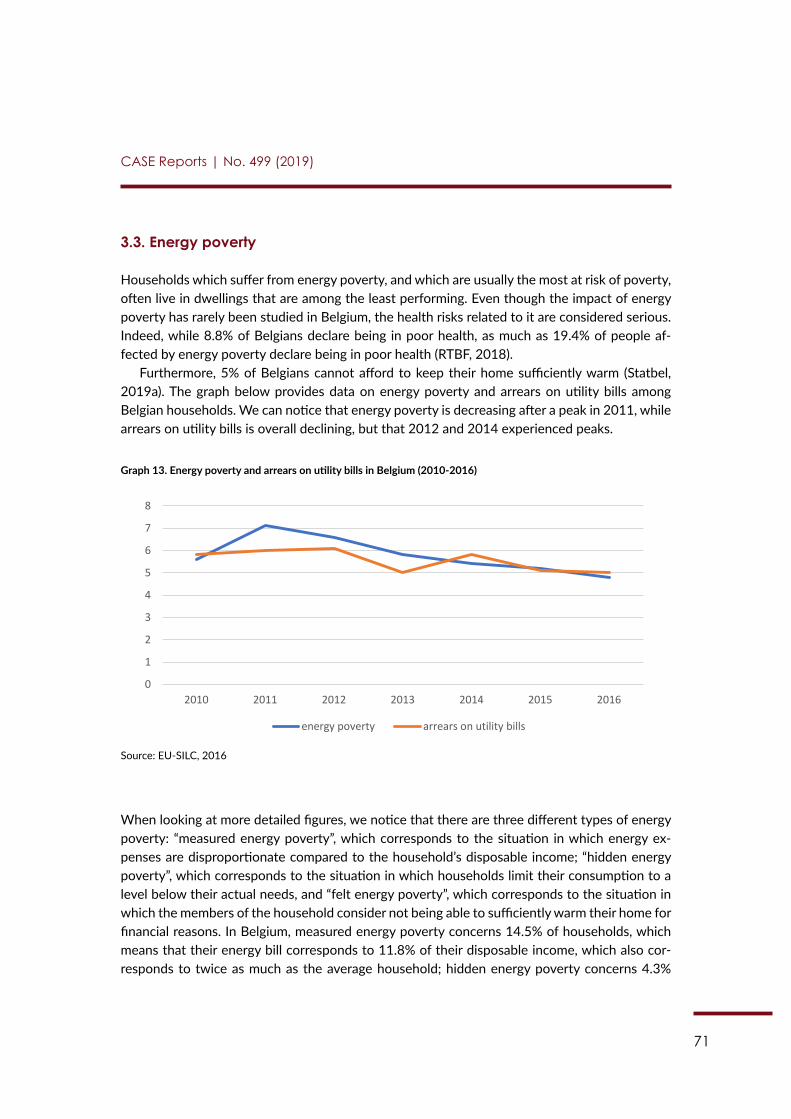
71
CASE Reports | No. 499 (2019)
3.3. Energy poverty
Households which suffer from energy poverty, and which are usually the most at risk of poverty, often live in dwellings that are among the least performing. Even though the impact of energy poverty has rarely been studied in Belgium, the health risks related to it are considered serious. Indeed, while 8.8% of Belgians declare being in poor health, as much as 19.4% of people af-fected by energy poverty declare being in poor health (RTBF, 2018).
Furthermore, 5% of Belgians cannot afford to keep their home sufficiently warm (Statbel, 2019a). The graph below provides data on energy poverty and arrears on utility bills among Belgian households. We can notice that energy poverty is decreasing after a peak in 2011, while arrears on utility bills is overall declining, but that 2012 and 2014 experienced peaks.
Graph 13. Energy poverty and arrears on utility bills in Belgium (2010-2016)
61
Graph 13. Energy poverty and arrears on utility bills in Belgium (2010-2016)
Source: EU-SILC, 2016
When looking at more detailed figures, we notice that there are three different types of energy poverty: “measured energy poverty”, which corresponds to the situation in which energy expenses are disproportionate compared to the household’s disposable income; “hidden energy poverty”, which corresponds to the situation in which households limit their consumption to a level below their actual needs, and “felt energy poverty”, which corresponds to the situation in which the members of the household consider not being able to sufficiently warm their home for financial reasons. In Belgium, measured energy poverty concerns 14.5% of households, which means that their energy bill corresponds to 11.8% of their disposable income, which also corresponds to twice as much as the average household; hidden energy poverty concerns 4.3% of households and felt energy poverty concerns 4.9%. In total, 21% of Belgian households are more or less affected by energy poverty (Fondation Roi Baudouin, 2017).
Like in many other countries, renters are more affected by energy poverty than owners in Belgium, as their capacity to improve their dwelling is limited. In Belgium, isolated people, women aged 65 and over, as well as women who are single parents are also more affected by energy poverty (Fondation Roi Baudouin, 2017). When looking at regional differences, we observe that energy poverty is more significant in the Walloon region, where 20.4% of households are in a situation of measured energy poverty, compared to 11.4% in the Flemish Region and 13.4% in the Brussels-Capital Region (RTBF, 2018).
3.4 Level of energy performance and energy labels
The first regulations regarding requirements for building insulation and energy efficiency were issued in 1985 in the Walloon Region and 2006 in the Flemish Region, but the certification for the energy efficiency of existing residential buildings known as EPC rating was implemented in 2010 and concerns all dwellings – for rent or for sale. The certificate stating the EPC rating is delivered by a qualified expert and its legal framework, even though it varies by region, makes it reliable. It seems that the EPC rating in Belgium has a larger impact in smaller urban areas than in capital cities (Marmolejo-Duarte &Chen, 2019). In 2015, the region of Brussels-Capital established requirements in terms of energy efficiency
0
1
2
3
4
5
6
7
8
2010 2011 2012 2013 2014 2015 2016
energy poverty arrears on utility bills
Source: EU-SILC, 2016
When looking at more detailed figures, we notice that there are three different types of energy poverty: “measured energy poverty”, which corresponds to the situation in which energy ex-penses are disproportionate compared to the household’s disposable income; “hidden energy poverty”, which corresponds to the situation in which households limit their consumption to a level below their actual needs, and “felt energy poverty”, which corresponds to the situation in which the members of the household consider not being able to sufficiently warm their home for financial reasons. In Belgium, measured energy poverty concerns 14.5% of households, which means that their energy bill corresponds to 11.8% of their disposable income, which also cor-responds to twice as much as the average household; hidden energy poverty concerns 4.3%
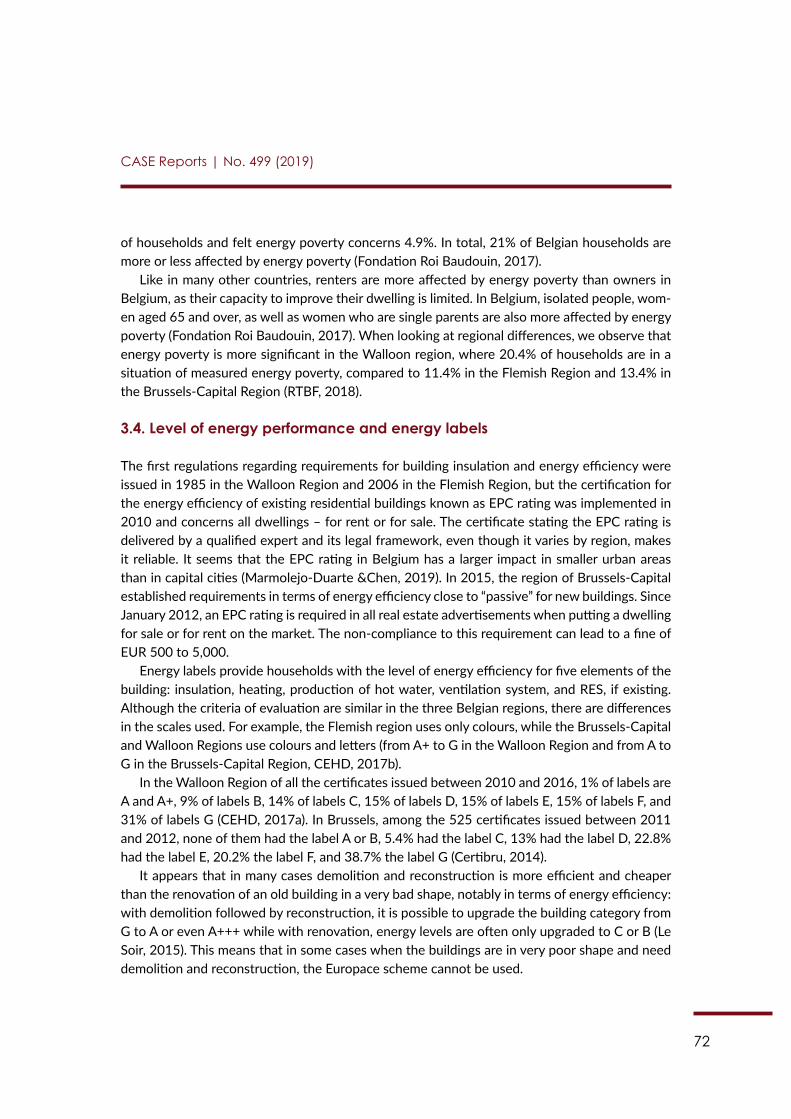
72
CASE Reports | No. 499 (2019)
of households and felt energy poverty concerns 4.9%. In total, 21% of Belgian households are more or less affected by energy poverty (Fondation Roi Baudouin, 2017).
Like in many other countries, renters are more affected by energy poverty than owners in Belgium, as their capacity to improve their dwelling is limited. In Belgium, isolated people, wom-en aged 65 and over, as well as women who are single parents are also more affected by energy poverty (Fondation Roi Baudouin, 2017). When looking at regional differences, we observe that energy poverty is more significant in the Walloon region, where 20.4% of households are in a situation of measured energy poverty, compared to 11.4% in the Flemish Region and 13.4% in the Brussels-Capital Region (RTBF, 2018).
3.4. Level of energy performance and energy labels
The first regulations regarding requirements for building insulation and energy efficiency were issued in 1985 in the Walloon Region and 2006 in the Flemish Region, but the certification for the energy efficiency of existing residential buildings known as EPC rating was implemented in 2010 and concerns all dwellings – for rent or for sale. The certificate stating the EPC rating is delivered by a qualified expert and its legal framework, even though it varies by region, makes it reliable. It seems that the EPC rating in Belgium has a larger impact in smaller urban areas than in capital cities (Marmolejo-Duarte &Chen, 2019). In 2015, the region of Brussels-Capital established requirements in terms of energy efficiency close to “passive” for new buildings. Since January 2012, an EPC rating is required in all real estate advertisements when putting a dwelling for sale or for rent on the market. The non-compliance to this requirement can lead to a fine of EUR 500 to 5,000.
Energy labels provide households with the level of energy efficiency for five elements of the building: insulation, heating, production of hot water, ventilation system, and RES, if existing. Although the criteria of evaluation are similar in the three Belgian regions, there are differences in the scales used. For example, the Flemish region uses only colours, while the Brussels-Capital and Walloon Regions use colours and letters (from A+ to G in the Walloon Region and from A to G in the Brussels-Capital Region, CEHD, 2017b).
In the Walloon Region of all the certificates issued between 2010 and 2016, 1% of labels are A and A+, 9% of labels B, 14% of labels C, 15% of labels D, 15% of labels E, 15% of labels F, and 31% of labels G (CEHD, 2017a). In Brussels, among the 525 certificates issued between 2011 and 2012, none of them had the label A or B, 5.4% had the label C, 13% had the label D, 22.8% had the label E, 20.2% the label F, and 38.7% the label G (Certibru, 2014).
It appears that in many cases demolition and reconstruction is more efficient and cheaper than the renovation of an old building in a very bad shape, notably in terms of energy efficiency: with demolition followed by reconstruction, it is possible to upgrade the building category from G to A or even A+++ while with renovation, energy levels are often only upgraded to C or B (Le Soir, 2015). This means that in some cases when the buildings are in very poor shape and need demolition and reconstruction, the Europace scheme cannot be used.
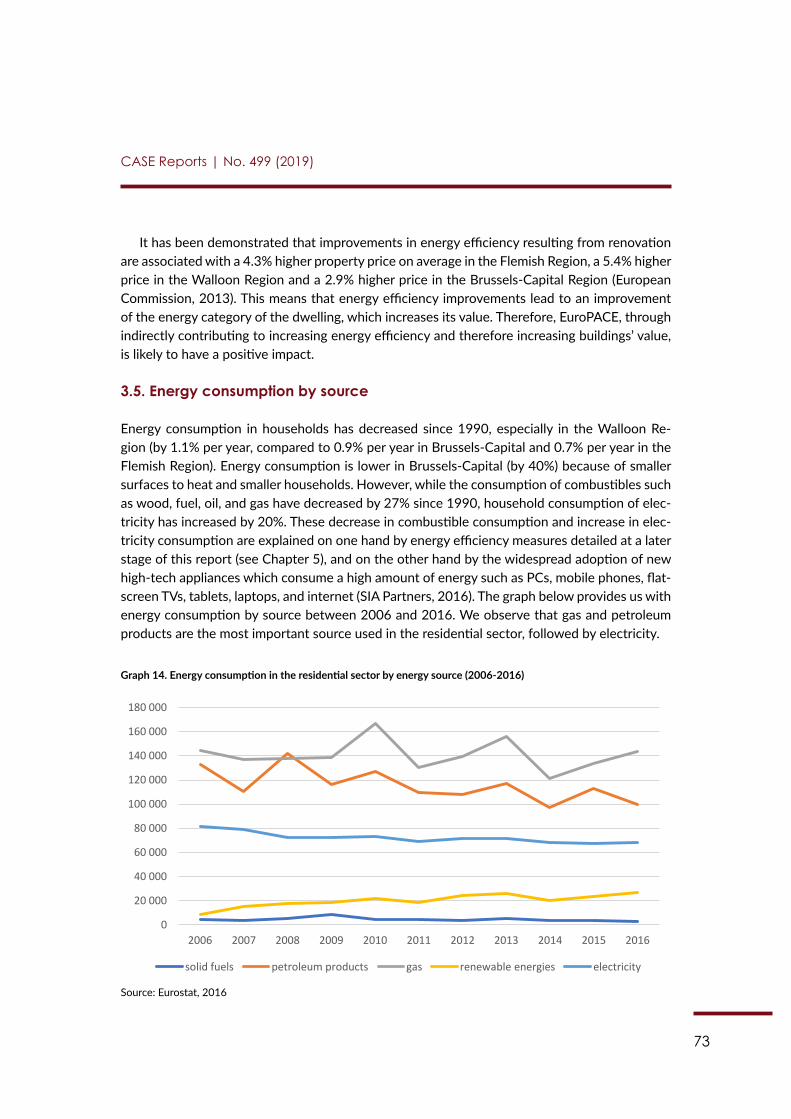
73
CASE Reports | No. 499 (2019)
It has been demonstrated that improvements in energy efficiency resulting from renovation are associated with a 4.3% higher property price on average in the Flemish Region, a 5.4% higher price in the Walloon Region and a 2.9% higher price in the Brussels-Capital Region (European Commission, 2013). This means that energy efficiency improvements lead to an improvement of the energy category of the dwelling, which increases its value. Therefore, EuroPACE, through indirectly contributing to increasing energy efficiency and therefore increasing buildings’ value, is likely to have a positive impact.
3.5. Energy consumption by source
Energy consumption in households has decreased since 1990, especially in the Walloon Re-gion (by 1.1% per year, compared to 0.9% per year in Brussels-Capital and 0.7% per year in the Flemish Region). Energy consumption is lower in Brussels-Capital (by 40%) because of smaller surfaces to heat and smaller households. However, while the consumption of combustibles such as wood, fuel, oil, and gas have decreased by 27% since 1990, household consumption of elec-tricity has increased by 20%. These decrease in combustible consumption and increase in elec-tricity consumption are explained on one hand by energy efficiency measures detailed at a later stage of this report (see Chapter 5), and on the other hand by the widespread adoption of new high-tech appliances which consume a high amount of energy such as PCs, mobile phones, flat-screen TVs, tablets, laptops, and internet (SIA Partners, 2016). The graph below provides us with energy consumption by source between 2006 and 2016. We observe that gas and petroleum products are the most important source used in the residential sector, followed by electricity.
Graph 14. Energy consumption in the residential sector by energy source (2006-2016)
63
Graph 14. Energy consumption in the residential sector by energy source (2006-2016)
Source: Eurostat, 2016
About 22% of the total consumption of electricity in Belgium comes from residential buildings, which is under the EU average (Odyssee-Mure, 2015). Table 1 in the annex provides more information on the energy consumption of Belgian households according to the size of the dwelling.
3.6 Breakdown of energy consumption by end-use
The graph below shows the breakdown of energy consumption by end-use in Belgium. We observe that space heating is responsible for three-quarters of all energy consumption in residential buildings. Therefore, it seems that reinforcing insulation in order to limit heat loss would be crucial for the conditions of the EuroPACE scheme.
Graph 15. Energy consumption by end-use
0
20 000
40 000
60 000
80 000
100 000
120 000
140 000
160 000
180 000
2006 2007 2008 2009 2010 2011 2012 2013 2014 2015 2016
solid fuels petroleum products gas renewable energies electricity
space heating lighting and appliances water heating cooking
Source: Eurostat, 2016
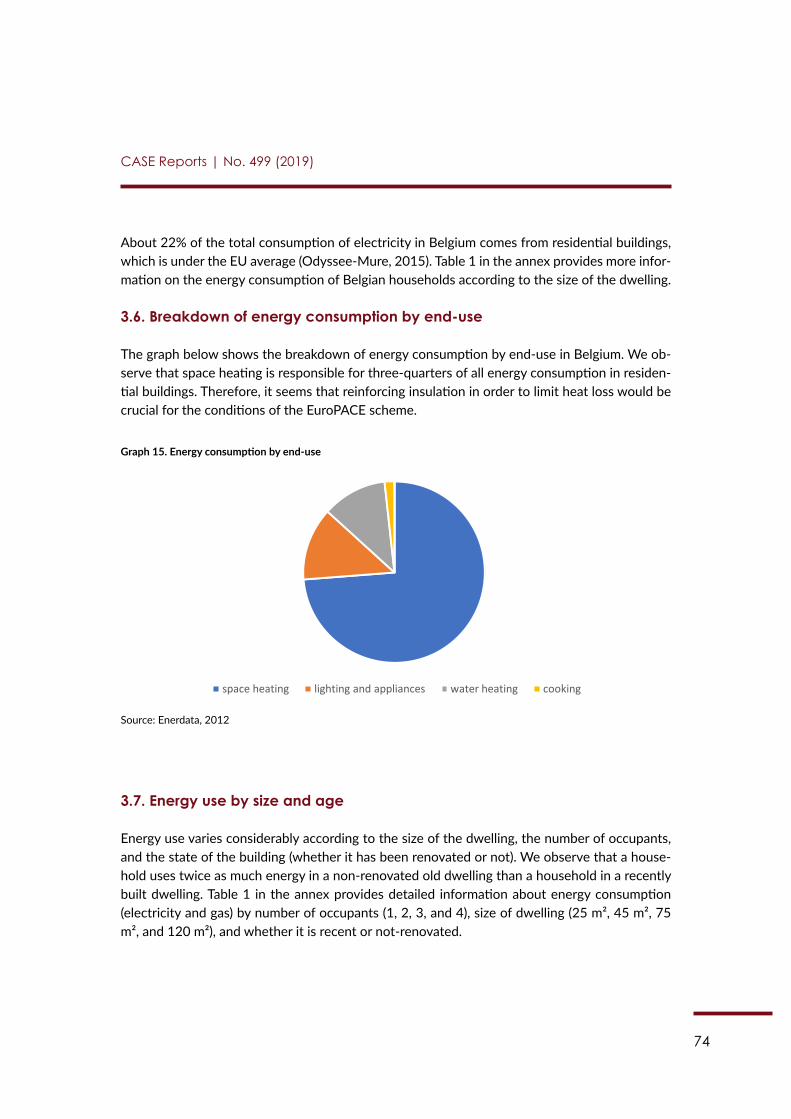
74
CASE Reports | No. 499 (2019)
About 22% of the total consumption of electricity in Belgium comes from residential buildings, which is under the EU average (Odyssee-Mure, 2015). Table 1 in the annex provides more infor-mation on the energy consumption of Belgian households according to the size of the dwelling.
3.6. Breakdown of energy consumption by end-use
The graph below shows the breakdown of energy consumption by end-use in Belgium. We ob-serve that space heating is responsible for three-quarters of all energy consumption in residen-tial buildings. Therefore, it seems that reinforcing insulation in order to limit heat loss would be crucial for the conditions of the EuroPACE scheme.
Graph 15. Energy consumption by end-use
63
Graph 14. Energy consumption in the residential sector by energy source (2006-2016)
Source: Eurostat, 2016
About 22% of the total consumption of electricity in Belgium comes from residential buildings, which is under the EU average (Odyssee-Mure, 2015). Table 1 in the annex provides more information on the energy consumption of Belgian households according to the size of the dwelling.
3.6 Breakdown of energy consumption by end-use
The graph below shows the breakdown of energy consumption by end-use in Belgium. We observe that space heating is responsible for three-quarters of all energy consumption in residential buildings. Therefore, it seems that reinforcing insulation in order to limit heat loss would be crucial for the conditions of the EuroPACE scheme.
Graph 15. Energy consumption by end-use
0
20 000
40 000
60 000
80 000
100 000
120 000
140 000
160 000
180 000
2006 2007 2008 2009 2010 2011 2012 2013 2014 2015 2016
solid fuels petroleum products gas renewable energies electricity
space heating lighting and appliances water heating cooking
Source: Enerdata, 2012
3.7. Energy use by size and age
Energy use varies considerably according to the size of the dwelling, the number of occupants, and the state of the building (whether it has been renovated or not). We observe that a house-hold uses twice as much energy in a non-renovated old dwelling than a household in a recently built dwelling. Table 1 in the annex provides detailed information about energy consumption (electricity and gas) by number of occupants (1, 2, 3, and 4), size of dwelling (25 m², 45 m², 75 m², and 120 m²), and whether it is recent or not-renovated.
75
CASE Reports | No. 499 (2019)
3.8. Energy efficiency and renewable energy instruments
To make buildings more energy efficient and reduce the consumption of energy from 140 kWh per m² per year to a level between 60 and 100 kWh per m² per year, the renovation of about five million existing buildings will be required in the next 35 years, which corresponds to an average of 143,000 dwellings per year.
Belgium’s energy efficiency progress according to EU requirements is a little below 1.5% a year, which places the country above the EU average and in 14th position overall (Odyssee-Mure, 2015). Moreover, when looking at household consumption, we see that it has been re-duced by 24.2% between 2005 and 2016, which is one of the most important reductions com-pared to other EU MS (European Environment Agency, 2018). This consumption decrease is due to strong awareness of climate challenges among the population, as well as regional policies encouraging renovation through financial support.
Between 60% and 70% of CO2 emissions in the city of Brussels are due to the heating of residential buildings (EcoBuild, 2016). Nevertheless, as mentioned above, the energy consump-tion of households decreased since 1990, which shows that the initiatives taken in previous years to lower consumption, to boost the consumption of RES, and to improve energy efficiency through the renovation of buildings had a positive impact. These trends also suggest growing opportunities for the potential implementation of EuroPACE in Belgium, since renovation and energy efficiency initiatives are foreseen to increase in the next years.
As far as the objects of renovation are concerned, it appears that the reduction of energy consumption will be obtained mainly after the insulation of roofs, which contributes to reduced energy consumption by 30% (Confederation Construction, 2017). This fact is very positive as far as the potential implementation of the EuroPACE scheme is concerned. Roof insulation is the most popular enterprise undertaken by Flemish homeowners (37%), followed by window replacements (33%), condensing boilers (19%), and wall insulation (11%) (European Commis-sion, 2018b). Between 2006 and 2016, about 500,000 roof insulation premiums have been awarded to Flemish households (European Commission, 2018b). When looking at the trends analysed in Chapter 2, we see that at the national level, Belgians are more concerned about comfort than energy efficiency, unlike in previous years. The specific focus on energy efficiency from the Flemish Region suggests a better opportunity for the successful implementation of the EuroPACE scheme.
RES in Belgium consisted mainly of the production of biomass until 2011, when the exploi-tation of other sources such as solar energy and wind energy (offshore and onshore) increased from 8 TWh (Terawatt-hour) in 2011 to 13.5 TWh in 2015 (Energy Transition, 2016) Despite the relatively low investment from private households in RES, we can observe an increase, which is also positive for the scheme presented in this report.
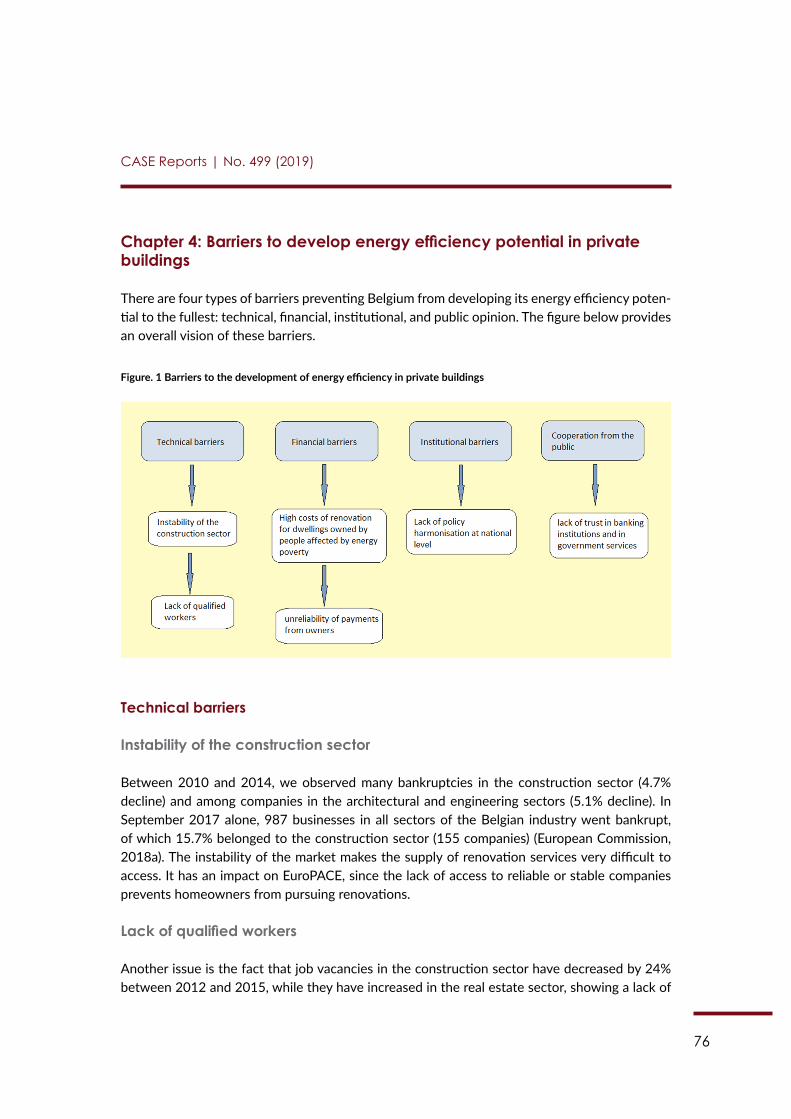
76
CASE Reports | No. 499 (2019)
Chapter 4: Barriers to develop energy efficiency potential in private buildings
There are four types of barriers preventing Belgium from developing its energy efficiency poten-tial to the fullest: technical, financial, institutional, and public opinion. The figure below provides an overall vision of these barriers.
Figure. 1 Barriers to the development of energy efficiency in private buildings
Technical barriers
Instability of the construction sector
Between 2010 and 2014, we observed many bankruptcies in the construction sector (4.7% decline) and among companies in the architectural and engineering sectors (5.1% decline). In September 2017 alone, 987 businesses in all sectors of the Belgian industry went bankrupt, of which 15.7% belonged to the construction sector (155 companies) (European Commission, 2018a). The instability of the market makes the supply of renovation services very difficult to access. It has an impact on EuroPACE, since the lack of access to reliable or stable companies prevents homeowners from pursuing renovations.
Lack of qualified workers
Another issue is the fact that job vacancies in the construction sector have decreased by 24% between 2012 and 2015, while they have increased in the real estate sector, showing a lack of
77
CASE Reports | No. 499 (2019)
balance among professionals in the housing sector. Since the number of students in engineer-ing and architecture increased and that of students in manufacturing and processing decreased between 2010 and 2015, we can also expect issues related to potential unemployment and labour shortages in the manufacturing branch of the construction sector in the future (European Commission, 2018a).
These shortages can already be observed among painters, plumbers, carpenters, electricians, and tile and bricklayers, among others, as Belgium experiences a lack of 20,000 construction workers annually. These shortages have a negative impact on the potential implementation of EuroPACE since the lack of access to a qualified and available workforce leads to delays in renovation projects and, similar to the previously described point, prevents homeowners from pursuing renovations.
Financial barriers
Unreliability of payments
The European Payment Report 2017 states that the efficiency of Belgium’s payment practices is below the EU average in terms of stability. Indeed, in B2B transactions, Belgians take about ten days to pay after receiving a bill, and in the public sector, 20 days. 2.6% of yearly revenues had to be written off in 2017, which is among the highest rates in the EU. Belgium is ranked in “below average” in terms of payment risk, which means that the country experiences limited payment stability and some risk. Lastly, 65% of business report that late payments are due to the admin-istrative inefficiency of their customers and point out a high rate of intentional late payments (Intrum Justitia, 2017). ). This fact is a threat to the potential implementation of EuroPACE in Belgium, since it can deter investors from outside the country from investing there.
Costs of renovation
Another obstacle to developing the energy efficiency potential in residential buildings, which can also be considered as the most important, is the cost of renovations, especially in older buildings which require advanced changes in terms of insulation (roof and wall), doubling of windows, or the elimination of humidity and mould. Given that 25% of the population lives in a dwelling requiring renovation and 21% of people are in a situation of energy poverty, and that both cohorts are often the same households, it appears that almost one-quarter of the popula-tion is not financially able to pursue energy efficiency projects or even the simplest renovation of their dwelling. However, this barrier is addressed by the financial solutions offered by premi-ums at the regional level. In situations where these governmental solutions could be combined with an on-tax financing scheme with a repayment period of up to 25 years, such as that offered by EuroPACE, and a small upfront payment that would not weigh too heavily on their budget, the households in a situation of energy poverty would be better supported in the renovation of
78
CASE Reports | No. 499 (2019)
their dwelling. This would have a positive impact on both their health, their well-being, and their comfort.
Institutional barrier
Lack of policy harmonisation at the national level
As policies related to energy efficiency are the responsibility of the regions, and there are no policies at the national level, there are many differences in the regulation, implementation, and eligibility of financial support programmes between the regions. Even though we can observe some differences, every region sets its own goals as far as energy efficiency standards are con-cerned, which makes it difficult for observers to evaluate the progress of this issue at the na-tional level. Moreover, these differences may cause inequalities between the inhabitants of each region, which can generate not only criticism from the public, but also contributes to creating competition and increasing animosity between the regions, which are already issues in Belgium. However, this barrier does not prevent the implementation of EuroPACE, as EuroPACE can be implemented at the regional level, ideally in Flanders (see Conclusion).
Cooperation from the public
Trust in banking services and government
Research shows that Belgium has a medium to low level of trust in financial and banking ser-vices (Jarvinen, 2014), which explains why the share of homeowners who took a loan in order to pursue the renovation of their dwelling was only 7% (Essencia, 2016). This can be considered as a barrier to achieving energy efficiency in residential buildings. Indeed, a lower level of trust in banks could lead to a decreased desire to invest in renovation when the household’s savings are too low considering the renovation costs. As far as trust in regional and national govern-ments is concerned, we can observe that in the Brussels-Capital and Walloon Regions, almost 70% of the population does not really trust governmental institutions, and 46% does not trust governmental institutions at all (La Libre, 2017). This is not positive for EuroPACE, because it is collaborating with local governments to provide on-tax financing schemes on energy efficiency, and a negative opinion from the public would hamper the success of the programme.

79
CASE Reports | No. 499 (2019)
Chapter 5: Policies related to energy efficiency and RES in residential buildings
5.1. Energy performance of buildings directive (EPBD) in Belgium
After 18 months of legislative procedure, the revised energy performance of buildings directive (EPBD) issued in July 2018 is in the process of being implemented in Belgium (February 2019). It remains the basis for determining energy efficiency, its method, and its regulation as it has an impact on the regulation of energy efficiency in new construction and major renovations. In Belgium, the EPBD is implemented at the regional level. Regulation is managed by the EPC platform, which is an entity formed after collaboration between the three regions (Agoria, 2018).
Belgium is one of three Member States – along with France and Germany – advancing plans towards the implementation of the EPBD through the delivery of successful pilot projects, no-tably focused on providing practical, tailored, and independent advice to building owners (Eu-roACE, 2018).
The EPBD requires all new buildings to be near zero energy by 2020 and encourages the renovation of the building stock in order to reduce energy consumption and therefore achieve better energy efficiency.
5.2. Financing schemes in the building sector
With energy efficiency becoming the responsibility of regional governments, national financing schemes were modified, and notably the regulation concerning tax credits destined to all reno-vation initiatives made by households with the aim to reduce their energy consumption: the tax reform of 2012 abolished those tax credits with the exception of roof insulation.
Energy policy is primarily implemented at the regional level; however, there is one measure being implemented on a national scale: reduced VAT for the renovation of old buildings. In 2000, this measure reduced VAT from 21% to 6% for dwellings more than five years old, for which their owner pursued renovation or important maintenance. The measure changed in 2016 and now targets private dwellings which are more than 10 years old (Odyssee-Mure, 2018c).
5.2.1. Brussels-Capital Region
There are four premiums offered by the Brussels-Capital Region for the improvement of energy efficiency:
The Brussels Green Loan
This loan concerns all construction works aiming at improving the insulation of the roof, walls, or ground, as well as the installation of high insulated windows, the installation of mechanically-
80
CASE Reports | No. 499 (2019)
controlled ventilation, and the installation of a condensing gas boiler, thermal regulation, or a gas convector. This loan (0% interest, limited to EUR 20,000) is available to households where the income is below EUR 30,000 for a single person, or EUR 60,000 for couples. This loan may be a candidate for blending with other financial schemes.
Energy Efficiency Credit
This credit concerns all renovation initiatives aiming at improving insulation, ventilation, heating, and RES. It is reserved for owners of dwellings aged more than five years. It is a mortgage loan of 0-2% interest and is limited to EUR 25,000.
Premium for Renovation 2016
To qualify for this premium, which can be compared to a subsidy, renovations must focus on improving the energy efficiency of the building (audit, evaluation, insulation, ventilation, hot air generator, condensing boiler, gas air heater, efficient gas convector, heat pump, or solar water heater). The premium is geared towards the renovation of building over 10 years old.
However, in 2018, this premium was modified and now specifies a building age of more than 30 years old. Additionally, the maximum which can be obtained is EUR 35,000 plus an additional EUR 5,000 per room when the dwelling has more than three rooms (Logement Bruxelles, 2019). The existence of these premiums is important for EuroPACE as it suggests the possibility for integrating the EuroPACE scheme into an existing premium.
HomeGrade
HomeGrade is an instrument put in place by the Brussels-Capital Region to inform citizens on energy efficiency and the rational use of energy. Its role is mainly to provide effective support to households when acquiring a dwelling (renting, selling, occupation, construction, renovation). It offers, among others, information and advice, as well as technical, administrative, and financial support for households (Odyssee-Mure, 2018a). It is thus rather a complementary action boost-ing EuroPACE, if developed.
As from the 1st of January 2019, a new premium on gas heating has been implemented in the Brussels-Capital Region, offering EUR 100 to households investing in the professional review of their dwelling’s gas heating system. Moreover, the amount of the premium for roof insulation was doubled compared with 2017, and the premia for external wall insulation as well as for the replacement of the boiler have been increased. The new measures also include a premium for building extensions and a simplification of administrative procedures. On average, the premia offered in the Brussels-Capital Region reimburse 20% of costs aiming at energy efficiency for residential buildings, up until 12 months after having received the construction bill. Payment can be expected within eight weeks (Bruxelles Environnement, 2019).
81
CASE Reports | No. 499 (2019)
5.2.2. Walloon Region
Energy efficiency and building renovation policies in the Walloon Region are defined under the fourth axis of the Walloon government’s strategic economic restructuring plan, the “Marshall Plan 4.0”. Out of the total budget of EUR 2.9 billion, Axis 4 on the support of efficiency, energy transition, and the circular economy has a budget of EUR 1.1 billion. The Walloon Region offers the following support in the context of energy efficiency:
Green Certificates
Green certificates have been implemented to support households that choose RES to produce the energy of their dwelling (Wallonie Energie SPW, 2019a).
Energy Premium
The Energy Premium was implemented in January 2019. It provides financial support to house-holds with income under EUR 97,000 per year and that wish to pursue energy efficient renova-tion and improvements, notably roof insulation, wall insulation, and ground insulation. Elements using RES’’’’ such as a solar water heater, a heating pump, or a biomass boiler must be used. The building must be over 20 years old and other conditions, notably the occupation of the build-ing, must be respected. The amount of subsidy varies according to the type of renovation and whether it is made by the owner or by a contractor. For example, roof insulation renovation made by the owner is subsidised at an amount of EUR 6 per m2 for surfaces up to a maximum of 150 m2. Wall and ground insulation renovation can only be pursued by a contractor. A heating pump for hot water is subsidised at EUR 750 and a solar boiler at EUR 1,500. Another amount is provided according to the household’s income (Wallonie Energie SPW, 2019b).
In 2017, the Walloon government adopted the “Walloon Strategy for the 2050 energy reno-vation of buildings”, aiming at renovating more than one million dwellings in Wallonia by 2050.
5.2.3. Flemish Region
Similar to the Walloon government, in 2015, the Flemish government launched, in cooperation with the construction sector, the “Renovation Pact 2050” aiming at improving buildings’ energy efficiency so as to make every dwelling in Flanders energy efficient by 2050. The Flemish gov-ernment proposes the following financial support schemes:
Reduction in property tax and gift tax for energy-efficient residential buildings
This measure, established in 2009, grants a 10-year reduction in property tax for new buildings which have improved their energy efficiency (Odyssee-Mure, 2018b). After 10 years, property
82
CASE Reports | No. 499 (2019)
taxes return to their initial form (as they would in the case of EuroPACE after the pay-back pe-riod), which provides a great background for other property tax-related incentives.
Woonbonus
The Woonbonus or Housing Bonus is a tax reduction of 40% implemented in 2005 and ad-dressed to principal residences as well as secondary homes. For mortgages contracted after January 2016, the Housing Bonus (addressed to the principal residence) has been merged with two other tax reductions (tax reduction for long-term savings, addressed to the secondary home and tax reduction for ordinary interest, also addressed to secondary homes) to create the Inte-grated Housing Bonus. This Bonus is addressed to mortgages taken for a duration of over 10 years (Vlaanderen is Wonen, 2019). It is difficult to assess how it could interact with EuroPACE.
Flemish Renovation Loan
This is a loan with 0% interest designed to be used for the renovation of a residential building (primary residence) with the aim to improve its energy efficiency. It is intended for a priority target group consisting, from February 2019, of households with an annual gross family income of less than EUR 18,363.39, increased by EUR 3,399.56 per family member who is not the ap-plicant; people in a situation of energy poverty; families with a joint taxable income that is less than EUR 30,640 a year; and owners who rent the dwelling through a social rental office. The loan concerns renovation and improvements such as roof, the insulation of walls or floors, high insulation windows, ventilation systems, efficient heating systems (heat pump, among others), solar panels, solar water heater, energy efficient home appliances, and energy audits. The reno-vations must be conducted by a contractor (Vlaanderen, 2019). Given its target groups, the loan is intended for only those usually considered energy poor.
The Flemish Region also provides financial support for renters, granting subsidies to low-income families moving from a non-energy efficient dwelling to a higher energy level dwelling. The grant is a monthly subsidy amounting one-third of the rent as well as additional premia. One month’s rent is added for low-income families who have been on a waiting list for social housing for more than four years (European Commission, 2018b).
A 2015 survey conducted by Energy Efficiency Watch showed that Belgium was ranked 13th out of 28 countries in terms of positive policy progress in the context of energy efficiency com-pared to three years before. This medium progress was evaluated as higher than the 2012 sur-vey. Additionally, 77% of the interviewed experts believe that Belgian energy efficiency policies have relatively little ambition, notably due to financial challenges.
As far as the specific policies are concerned, policies regarding energy efficiency require-ments for new buildings were rated as 96% effective and those for renovated buildings as 87% effective. However, policies regarding energy taxation were assessed as “not effective at all” by the interviewed experts. Despite that, policies regarding funding support for the renovation of
83
CASE Reports | No. 499 (2019)
residential buildings was positively assessed, but the renovation rate remained too low (Energy Efficiency Watch, 2015).
The moderate progress of energy efficiency policies in the context of residential buildings is satisfactory in terms of requirements regarding the potential implementation of EuroPACE. Moreover, an on-tax financing scheme like the one at stake could perfectly complete the already varied policies offered by the Belgian regions.
5.3. Policies for energy poverty
Being a federal state, in Belgium, social policy is conducted at the national level, while energy policy is conducted at the regional level. Energy poverty is at the crossroads of social and energy policy; therefore, both the regions and the federal government are competent to implement measures in this context (Bartlaux et al., 2011). However, Belgian law does not define energy poverty. The phenomenon is only studied and monitored by the King Baudouin Foundation, through its Belgian Platform against Energy Poverty, and in the Walloon Region by the Associa-tion RWADE (Reseau Wallon Pour L’ Acces Durable A L’ Energie). The only measure put in place for households affected by energy poverty is financial support for residential building renova-tion. It is expected that the household should be proactive; however, it has been observed by RWADE that service providers should also be more tolerant towards households in need, for instance by banning energy cuts in cases of payments arrears (Fondation Roi Baudouin, 2017).
5.4. Other policies and support options for buildings
Training and information on rational use of energy (Walloon Region)
This initiative aims at promoting the rational use of energy through professional training and sharing of information with professionals and policy makers through information points called the Energy House and located in different areas of the Walloon Region. In this context, the ini-tiative has organised promotional events, introduced an audit network aimed at raising aware-ness on energy waste in the public and private sector, and granted subsidies for energy audits (Odyssee-Mure, 2018d). Although the concrete outcomes of these campaigns have not, to our best knowledge, been evaluated, 24% of Belgians place climate change as the most important problem facing the world (EU average: 20%); 32% have insulated their homes to reduce energy consumption (EU average: 18%), and 6% have bought a low-energy or “passive house” (EU aver-age: 3%) (European Commission, 2013).
Flux50 (Flanders)
Flux50 is a cluster organisation for energy which facilitates collaboration between energy sup-pliers, IT companies, and construction companies, with the aim to increase the competitiveness
84
CASE Reports | No. 499 (2019)
of Flanders’ smart energy industry. It provides project support, networking opportunities, and a platform for knowledge sharing (Flanders Investment and Trade, 2019).
Smart (Grid Flanders)
Smart Grids Flanders is a knowledge platform which unites businesses, universities, and re-search institutions to enable smart grids.
EnergyVille
EnergyVille is a centre of expertise for sustainable energy, intelligent energy systems, and ener-gy-efficient buildings.
INNOBAT
INNOBAT is a project aimed at pursuing research on the innovation potential of the building sector, particularly with regard to acoustics or the use of composite materials and glass.
OPTICOST
Opticost is a project which establishes a methodology and practical solutions to reduce the cost of new constructions.
EcoBuild (Brussels)
EcoBuild is a cluster for sustainable construction and renovation, which focuses particularly on energy efficiency and the circular economy.
Greenbiz Brussels-Capital
Greenbiz is a business incubator in the sectors of eco-construction, RES, and eco-products.
85
CASE Reports | No. 499 (2019)
Conclusions
In the Belgian housing market, there is a large proportion of homeowners (over 70%) and trends of the housing stock go more towards renovation than the construction of new buildings. The size of dwellings is decreasing and so is the size of households (2.3 people per household), de-spite the overall growth of the population. Belgians mainly lives in urban areas (over 80%) and earns a yearly disposable income above the EU average.
The building stock is ageing, with 62% of buildings built before 1970, and there is a need to renovate over 140,000 buildings per year over the next 10 years to reach the EU’s and Bel-gium’s 2030 energy efficiency targets. Indeed, 20% of households experience energy poverty and over 30% have a dwelling which is in high need of renovation. As far as energy consumption is concerned, Belgium is among the EU Member States with the highest energy prices and high-est energy consumption in residential buildings. Over one-third of household expenditures are dedicated to housing costs. All these factors suggest a great potential for additional schemes targeting energy efficiency, like EuroPACE.
On a different note, Belgium is a federal state with three regions each with their own govern-ment. The characteristics of the building stock and household composition vary by region, as does the classification of buildings into energy categories. Furthermore, the amount and con-ditions for the attribution of energy premiums and subsidies also vary by region, which could hinder the development of a single model of EuroPACE for each of the three regions at the same time.
Moreover, when drawing conclusions, it is necessary to note that Belgium implements many policies and initiatives for the energy efficiency of residential buildings at the regional level. The reasons for this are public engagement and the interest of Belgians in environmental issues, the commitment to 2030 and 2050 EU targets, as well as the needs of the ageing and inef-ficient building stock. Indeed, a strong majority of residential buildings were built before 1970, and one-quarter of them are in high need for renovation. The main obstacles towards initiating these renovations are finances or access to finance and the trust of Belgians towards banks and government.
Given the arguments mentioned above, we find that a national implementation of the Eu-roPACE scheme would not be optimal because of the high level of heterogeneity between the regions as far as income, types of dwellings, and age of the building stock are concerned. In ad-dition, because of Belgium’s federal system, each region has their own policies and autonomous methods of implementation, even though the policies related to energy efficiency in residential buildings seem similar when looking at the three regions. Hence, a regional implementation of EuroPACE is suggested.
Of the three Belgian regions, we observe that Flanders is the one which has the most poten-tial for success concerning the implementation of the EuroPACE scheme, both given the needs and possibilities to handle the financial burdens coming along with energy efficiency invest-ments. This is because Flanders is the region where households have higher average incomes, the region where households pay the most for the maintenance of their dwelling, the region
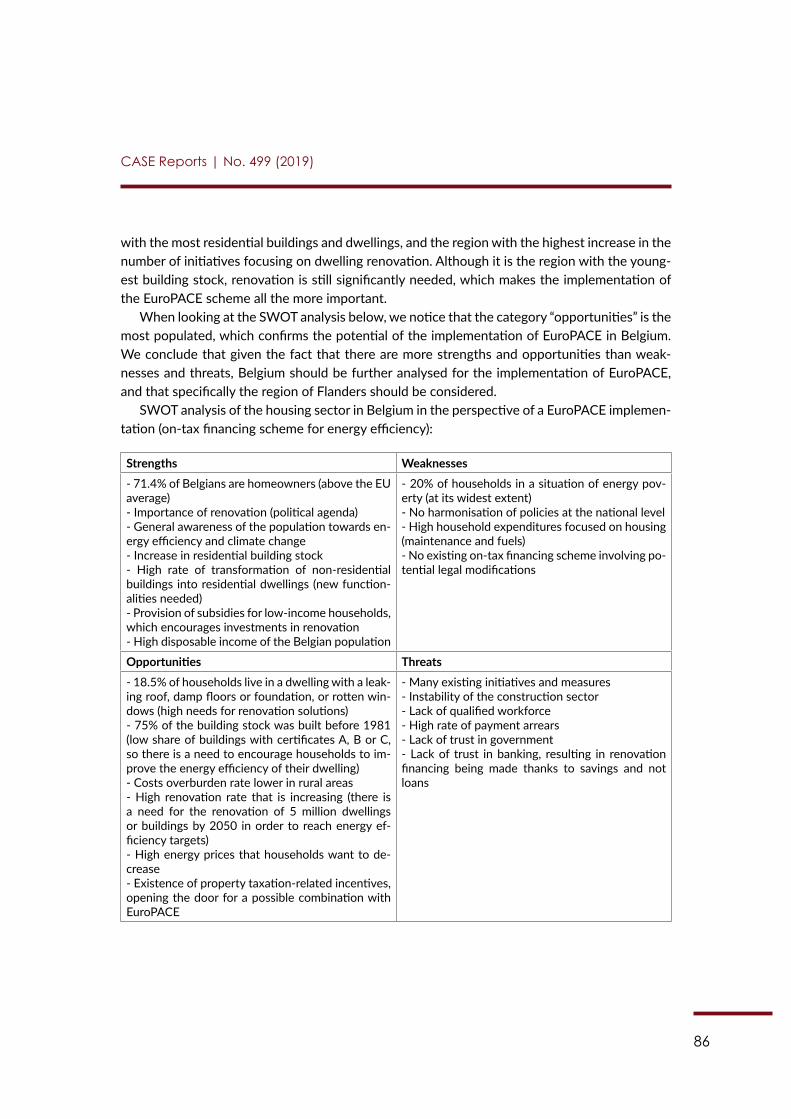
86
CASE Reports | No. 499 (2019)
with the most residential buildings and dwellings, and the region with the highest increase in the number of initiatives focusing on dwelling renovation. Although it is the region with the young-est building stock, renovation is still significantly needed, which makes the implementation of the EuroPACE scheme all the more important.
When looking at the SWOT analysis below, we notice that the category “opportunities” is the most populated, which confirms the potential of the implementation of EuroPACE in Belgium. We conclude that given the fact that there are more strengths and opportunities than weak-nesses and threats, Belgium should be further analysed for the implementation of EuroPACE, and that specifically the region of Flanders should be considered.
SWOT analysis of the housing sector in Belgium in the perspective of a EuroPACE implemen-tation (on-tax financing scheme for energy efficiency):
Strengths Weaknesses - 71.4% of Belgians are homeowners (above the EU average)- Importance of renovation (political agenda)- General awareness of the population towards en-ergy efficiency and climate change- Increase in residential building stock- High rate of transformation of non-residential buildings into residential dwellings (new function-alities needed)- Provision of subsidies for low-income households, which encourages investments in renovation- High disposable income of the Belgian population
- 20% of households in a situation of energy pov-erty (at its widest extent)- No harmonisation of policies at the national level- High household expenditures focused on housing (maintenance and fuels)- No existing on-tax financing scheme involving po-tential legal modifications
Opportunities Threats- 18.5% of households live in a dwelling with a leak-ing roof, damp floors or foundation, or rotten win-dows (high needs for renovation solutions)- 75% of the building stock was built before 1981 (low share of buildings with certificates A, B or C, so there is a need to encourage households to im-prove the energy efficiency of their dwelling) - Costs overburden rate lower in rural areas- High renovation rate that is increasing (there is a need for the renovation of 5 million dwellings or buildings by 2050 in order to reach energy ef-ficiency targets)- High energy prices that households want to de-crease- Existence of property taxation-related incentives, opening the door for a possible combination with EuroPACE
- Many existing initiatives and measures - Instability of the construction sector - Lack of qualified workforce- High rate of payment arrears- Lack of trust in government- Lack of trust in banking, resulting in renovation financing being made thanks to savings and not loans
87
CASE Reports | No. 499 (2019)
References
Agoria (2018), “EPBD Directive revision: an overview of the most important changes”, 6/09/2018, available at: https://www.agoria.be/en/EPBD-Directive-revision-an-overview-of-the-most-important-changes
Athanassiadis, A. (2017), “Economie Circulaire dans le secteur de la Construction à Bruxelles: Etats des lieux, enjeux et modèle à venir”, Technical Report, Universite Libre de Bruxelles, avail-able at: https://www.researchgate.net/publication/321156948_Economie_Circulaire_dans_le_secteur_de_la_Construction_a_Bruxelles_Etats_des_lieux_enjeux_et_modele_a_venir
Bartlaux et al. (2011), “Policies affecting energy poverty in Belgium: paradoxes between so-cial and climate policies”, conference paper available at: https://www.researchgate.net/publica-tion/268267098_Policies_affecting_energy_poverty_in_Belgium_paradoxes_between_social_and_climate_policies
Bruxelles Environnement (2019), “Les primes énergie en 2019”, available at: https://envi-ronnement.brussels/thematiques/energie/primes-et-incitants/les-primes-energie-en-2019
CallMePower (2018), “Quelle est la consummation moyenne d´électricité en Belgique?”, avail-able at: https://callmepower.be/fr/faq/consommation-moyenne-electricite
CEHD (2017a), “Analyse de la base de données des certificats PEB en Wallonie”, available at: https://energie.wallonie.be/servlet/Repository/cehd-cassilde-2017-rapport-peb.pdf?ID=47815
CEHD (2017b), “Chiffres Clés du logement en Wallonie”, Centre d´Études en Habitat Durable, available at: http://www.cehd.be/media/1160/2018_05_03_chiffrescles2017_final.pdf
Census 2011 Belgique (2011), available at: http://census2011.fgov.be/download/statsect_fr.html
Certibru (2014), Statistiques sur la certification en performance énergétique des batiments á Bruxelles, available at: https://www.certibru.com/certificat-peb-residentiel-maison-apparte-ment-bruxelles/statistique-certificat-peb
Chaudoir, R. (2018), “Taille des Logements en Chute Libre”, Logic-Immo, available at: https://www.logic-immo.be/fr/nouvelles-immo/taille-des-logements-en-chute-libre-31563.html
Confédération Construction (2017), “Rapport Annuel 2015-2016 – Tendances et défis”, avail-able at: https://www.confederationconstruction.be/Portals/0/documenten/Jaarverslag/2016/tendances%20et%20d%C3%A9fis.pdf
88
CASE Reports | No. 499 (2019)
CSTC (2018), “La rénovation énergétique: un défi et une opportunité”, available at: https://www.cstc.be/homepage/index.cfm?cat=publications&sub=bbri-contact&pag=Contact49&art=731
EcoBuild Bruxelles (2016), “La construction et la renovation durables pour tous”, available at: https://www.ecobuild.brussels/sites/default/files/PDFs/ecobuild_brochure_fr_bd.pdf
Enerdata (2015), “Energy Efficiency Trends for households in the EU”, data from 2012
Energy Transition (2016), “Renewable energy in Belgium”, Energy transition – the Global En-ergiewende, available at: https://energytransition.org/2016/10/renewable-energy-in-belgium/
Energy Efficiency Watch (2015), “Progress in energy efficiency policies in the EU Member States – the experts perspective”, available at: http://www.energy-efficiency-watch.org/fileadmin/eew_documents/EEW3/Survey_Summary_EEW3/EEW3-Survey-Report-fin.pdf
Essencia (2016), “Belgians spend an average of 12,700 EUR on renovations – The renovation market in Belgium”, 31/01/2016, available at: http://essencia.be/en/news/belgians-spend-an-average-of-12700-eur-on-renovations
EuroACE (2018), “A Guide to the Implementation of the Amended Energy Performance of Build-ings Directive (EPBD) 201”, available at: https://euroace.org/wp-content/uploads/2018/07/EPBD_2018_Ver_1.1_Guidance_EuroACE.pdf
European Commission (2013), “Energy performance certificates in buildings and their impact on transaction prices and rents in selected EU countries”, DG Energy, Final Report, available at: https://ec.europa.eu/energy/sites/ener/files/documents/20130619-energy_performance_cer-tificates_in_buildings.pdf
European Commission (2015), “EU Buildings Database”, available at: https://ec.europa.eu/en-ergy/en/eu-buildings-database
European Commission (2018a), “European Construction Sector Observatory: Country profile – Belgium”
European Commission (2018b), “European Construction Sector Observatory”, policy measure fact sheet – Belgium. Energy Renovation Programme 2020, Thematic Objectives 1&3, February 2018
Eurostat (2016), “Disposable income of private households by NUTS 2 regions” (data from 2014), available at: https://ec.europa.eu/eurostat/tgm/table.do?tab=table&init=1&language=en&pcode=tgs00026&plugin=1
89
CASE Reports | No. 499 (2019)
Eurostat (2018), “Natural gas price statistics”, available at: https://ec.europa.eu/eurostat/statis-tics-explained/index.php/Natural_gas_price_statistics
Eurostat (2018), “Gas prices for household consumers”, available at: http://appsso.eurostat.ec.europa.eu/nui/show.do?dataset=nrg_pc_202&lang=en
Eurostat (2018), “Energy consumption in households”, available at: https://ec.europa.eu/euro-stat/statistics-explained/index.php?title=Energy_consumption_in_households
Eurostat (2017), “Income & Living Conditions”, main tables, “Share of total population consid-ering their dwelling as too dark – EU-SILC survey”, available at: https://ec.europa.eu/eurostat/web/income-and-living-conditions/data/main-tables
Eurostat (2017), “Income & Living Conditions”, main tables, “Share of total population living in a dwelling with a leaking roof, damp walls, floors or foundation, or rot in window frames of floor – EU-SILC survey”, available at: https://ec.europa.eu/eurostat/web/income-and-living-conditions/data/main-tables
Flanders Investment and Trade (2019), “Invest in Flanders”, available at: https://www.flandersin-vestmentandtrade.com/invest/en/sectors/energy
Fondation Roi Baudouin (2017), “Baromètre de la précarité énergétique (2009-2015), available at: https://www.kbs-frb.be/fr/Activities/Publications/2017/20170313NT1
Immoweb (2018a), “Prix des sanitaires, du chauffage et de l’électricité”, available at: https://www.immoweb.be/fr/a-vendre/article/prix-des-sanitaires-du-chauffage-et-de-l-%C3%A9lectricit%C3%A9.htm?mycurrent_section=buy&artid=4072
Immoweb (2018b), “Prix pour la toiture”, available at: https://www.immoweb.be/fr/a-vendre/article/prix-pour-la-toiture.htm?mycurrent_section=buy&artid=4042
ING (2018), “Plus de logements en Belgique grâce à la reconversion”, available at: https://www.ing.be/Assets/nuid/documents/20181015_Etude_Reconversie_FR.pdf
ING (2019), “Renovating your house: how to save energy and money”, available at: https://www.ing.be/en/retail/my-life/housing/ecological-renovation
Intrum Justitia (2017), “European Payment Report 2017”, available at: https://www.intrum.com/media/2634/epr2017.pdf
https://www.immoweb.be/fr/a-vendre/article/prix-pour-la-toiture.htm?mycurrent_section=buy&artid=4042
90
CASE Reports | No. 499 (2019)
Jarvinen, R. A. (2014), “Consumer trust in banking relationships in Europe”, International Jour-nal of Bank Marketing: 32(6): 551-566, available at: http://dx.doi.org/10.1108/IJBM-08-2013-0086
La Libre (2017), “Plus de 60% des Wallons et Bruxellois n’ont pas confiance en leurs gouverne-ments”, published 5/01/2017, available at: https://www.lalibre.be/actu/politique-belge/plus-de-60-des-wallons-et-bruxellois-n-ont-pas-confiance-en-leurs-gouvernements-586e27e1cd-70717f88e8abee
Le Soir (2015), “La démolition-reconstruction gagne du terrain par rapport à la renovation”, published 15/12/2015, available at: https://www.lesoir.be/art/1067657/article/economie/immo/2015-12-11/demolition-reconstruction-gagne-du-terrain-par-rapport-renovation
Logement Bruxelles (2019), ”Prime á la rénovation de l´habitat”, available at: https://logement.brussels/primes-et-aides/primes-a-la-renovationMarmolejo-Duarte, C. & Ai Chen (2019), “The Uneven Price Impact of Energy Efficiency Ratings on Housing Segments. Implications for Public Policy and Private Markets”, MDPI Sustainability 2019, 11, 372, available at: https://www.mdpi.com/2071-1050/11/2/372/pdf
National Bank of Belgium (2019), “Household income accounts per region”, available at: https://stat.nbb.be/Index.aspx?DataSetCode=REGHHINC2#
Observatoire Belge des Inégalités (2017), “Pauvreté en Wallonie: Risque accru pour les familles monoparentales”, available at: http://inegalites.be/Pauvrete-en-Wallonie-risque-accru?lang=fr
Odyssee-Mure (2015), “Synthesis: Energy Efficiency Trends and Policies in the EU – An analysis based on the ODYSSEE and MURE databases”
Odyssee-Mure (2018a), “Brussels – Assist households proactively with regard to energy and eco-construction to improve the quality and energy comfort of their residence”, available at: http://www.measures-odyssee-mure.eu/public/mure_pdf/household/BEL23.PDF
Odyssee-Mure (2018b), “Flanders – Reduction in property tax and gift tax for energy-efficient residential buildings”, available at: http://www.measures-odyssee-mure.eu/public/mure_pdf/household/BEL24.PDF
Odyssee-Mure (2018c), “Reduced VAT for renovation of old buildings”, available at: http://www.measures-odyssee-mure.eu/public/mure_pdf/household/BEL13.PDF
91
CASE Reports | No. 499 (2019)
Odyssee-Mure (2018d), “Wallonia – Training and information on rational use of energy (house-hold sector)”, available at: http://www.measures-odyssee-mure.eu/public/mure_pdf/house-hold/BEL34.PDF
OECD (2014), “Urban population by city size”, available at: https://data.oecd.org/popregion/urban-population-by-city-size.htm
OECD (2019), “Housing”, Better Life Index, accessible at: http://www.oecdbetterlifeindex.org/topics/housing/
RTBF (2018), “Le prix de l´électricité continue d´augmenter: de 90 a 100 Euros en un an”, Belga 19/09/2018, available at: https://www.rtbf.be/info/societe/detail_le-prix-de-l-electricite-con-tinue-d-augmenter?id=10022793
Service de Lutte contre la Pauvreté, la précarité et l´exclusion sociale (2018), ”Des Faits et de Chiffres”, available at: http://www.luttepauvrete.be/chiffres_logements_sociaux.htm
SIA Partners (2016), “Energy premiums in Belgium: an analysis of the regional subsidy poli-cies and their impact on energy consumption savings”, available at: http://energy.sia-partners.com/20160801/energy-premiums-belgium-analysis-regional-subsidy-policies-and-their-im-pact-energy
Social Energie (2016), “Comparer aux consommations de reference”, available at: http://www.socialenergie.be/fr/consommation/consommations-de-reference/comparer-aux-consomma-tions-de-reference/
Statbel (2017a), “Household budget survey (HBS)”, available at: https://statbel.fgov.be/en/themes/households/household-budget-survey-hbs
Statbel (2017b), “Les salaires Belges á la loupe”, available at: https://statbel.fgov.be/fr/nouvelles/les-salaires-belges-la-loupe
Statbel (2018a), “Chiffres Cles – Appercu statistique de la Belgique”, available at: https://statbel.fgov.be/sites/default/files/files/documents/FR_kerncijfers_2018_web1a.pdf
Statbel (2018b), “On 1st January 2018, Belgium had 11,376,070 inhabitants”, available at: https://statbel.fgov.be/en/news/1st-january-2018-belgium-had-11376070-inhabitants
Statbel (2018c), “Parc des batiments”, available at: https://statbel.fgov.be/fr/themes/construc-tion-logement/parc-des-batiments#panel-12
92
CASE Reports | No. 499 (2019)
Statbel (2019a), “Material deprivation”, available at: https://statbel.fgov.be/en/themes/house-holds/poverty-and-living-conditions/material-deprivation
Statbel (2019b), “Structure of the Population”, available at: https://statbel.fgov.be/en/themes/population/structure-population
Statbel (2019c), “Building Permits”, available at: https://statbel.fgov.be/en/themes/housing/building-permits
UN (2018), “Household, Size and Composition Belgium”, available at: https://population.un.org/Household/index.html#/countries/56
Vlaanderen (2019), ”Energielening”, available at: https://www.vlaanderen.be/nl/bouwen-wonen-en-energie/lenen/energielening
Vlaanderen is Wonen (2019), ”De Vlaamse renovatiepremie”, available at: https://www.wonenv-laanderen.be/premies/de-vlaamse-renovatiepremie
Wallonie Energie SPW (2019a), ”Certificats verts”, available at: https://energie.wallonie.be/fr/certificats-verts.html?IDC=8745
Wallonie Energie SPW (2019b), “Primes Energie”, available at: https://energie.wallonie.be/fr/primes-energie-depuis-le-1er-mars-2018.html?IDC=8793
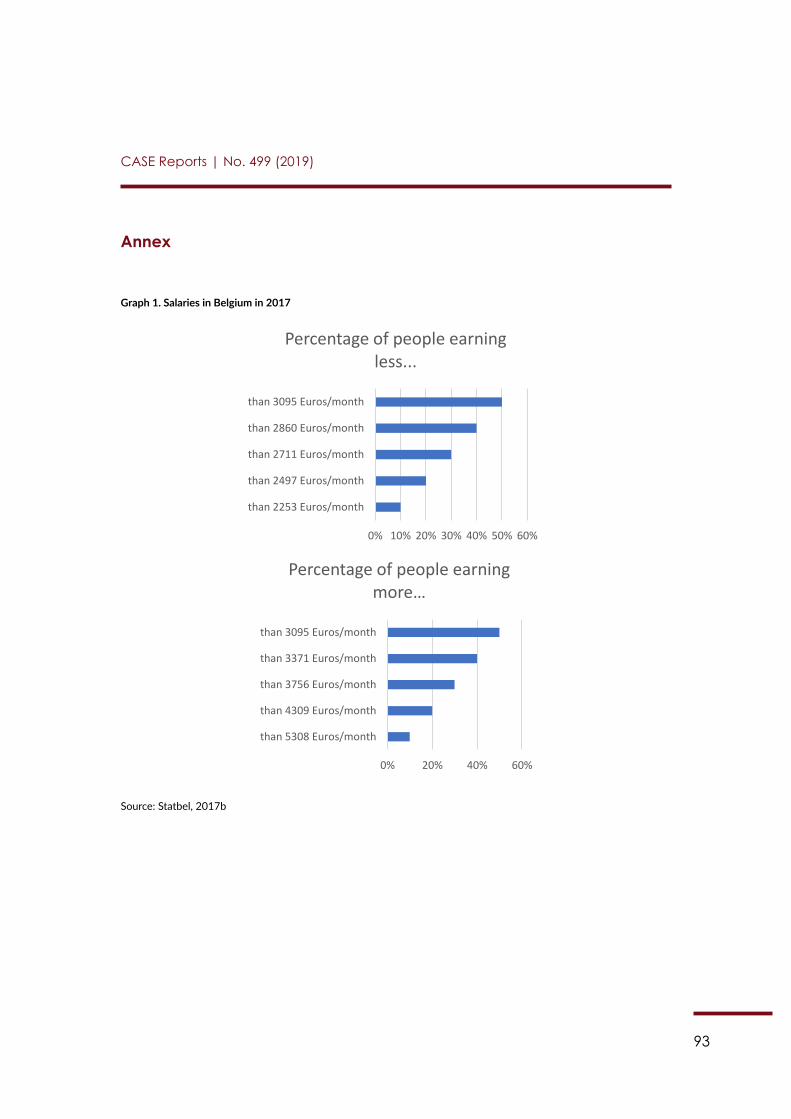
93
CASE Reports | No. 499 (2019)
Annex
Graph 1. Salaries in Belgium in 2017
80
Annex
Graph 1. Salaries in Belgium in 2017
Source: Statbel, 2017b
Graph 2. Belgian population by region176
176 Bruxelles Capitale: Region of Brussels-Capital; Antwerpen: Antwerp; Limburg: Limburg; Oost Vlaanderen: East Flanders; Vlaams Brabant: Flemish Brabant; West Vlaanderen: West Flanders; Brabant Wallon: Walloon Brabant; Hainaut: Hainaut; Liege: Liege; Luxembourg: Luxembourg; Namur: Namur.
0 500000
1000000 1500000 2000000 2500000 3000000 3500000 4000000 4500000 5000000 5500000 6000000 6500000 7000000 7500000 8000000
0% 20% 40% 60%
than 5308 Euros/month
than 4309 Euros/month
than 3756 Euros/month
than 3371 Euros/month
than 3095 Euros/month
Percentage of people earning more…
0% 10% 20% 30% 40% 50% 60%
than 2253 Euros/month
than 2497 Euros/month
than 2711 Euros/month
than 2860 Euros/month
than 3095 Euros/month
Percentage of people earning less...
Source: Statbel, 2017b
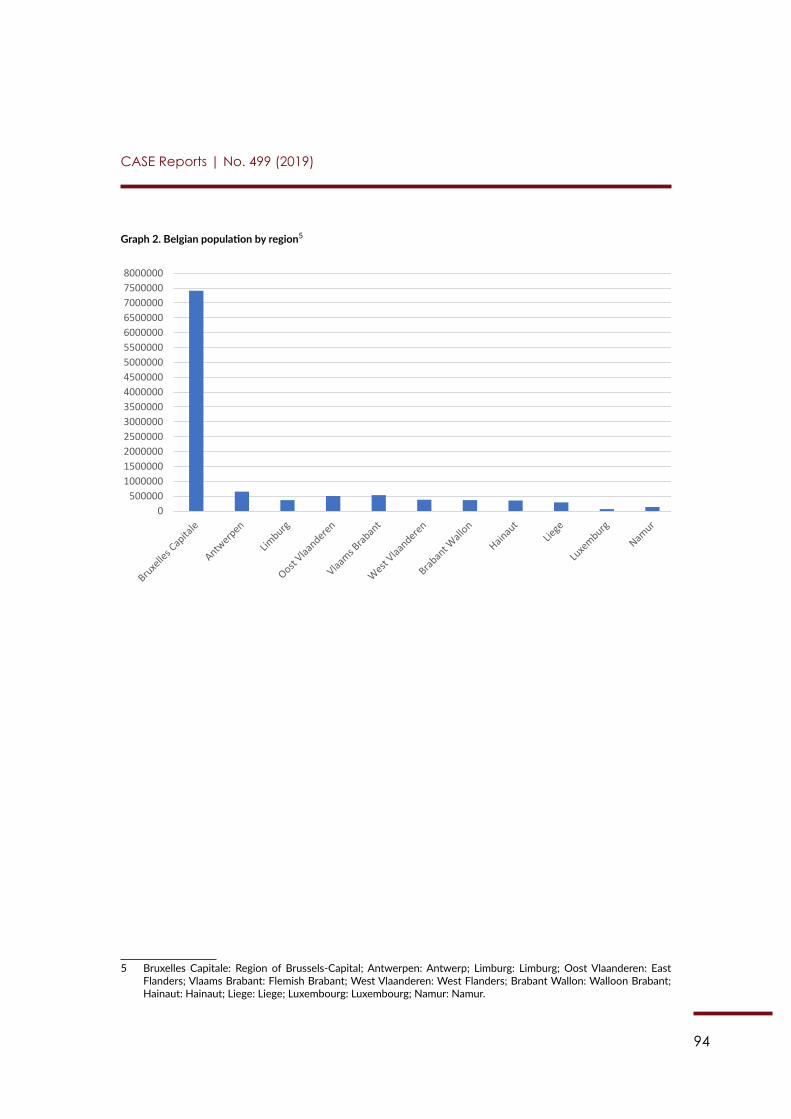
94
CASE Reports | No. 499 (2019)
Graph 2. Belgian population by region5
80
Annex
Graph 1. Salaries in Belgium in 2017
Source: Statbel, 2017b
Graph 2. Belgian population by region176
176 Bruxelles Capitale: Region of Brussels-Capital; Antwerpen: Antwerp; Limburg: Limburg; Oost Vlaanderen: East Flanders; Vlaams Brabant: Flemish Brabant; West Vlaanderen: West Flanders; Brabant Wallon: Walloon Brabant; Hainaut: Hainaut; Liege: Liege; Luxembourg: Luxembourg; Namur: Namur.
0 500000
1000000 1500000 2000000 2500000 3000000 3500000 4000000 4500000 5000000 5500000 6000000 6500000 7000000 7500000 8000000
0% 20% 40% 60%
than 5308 Euros/month
than 4309 Euros/month
than 3756 Euros/month
than 3371 Euros/month
than 3095 Euros/month
Percentage of people earning more…
0% 10% 20% 30% 40% 50% 60%
than 2253 Euros/month
than 2497 Euros/month
than 2711 Euros/month
than 2860 Euros/month
than 3095 Euros/month
Percentage of people earning less...
5 Bruxelles Capitale: Region of Brussels-Capital; Antwerpen: Antwerp; Limburg: Limburg; Oost Vlaanderen: East Flanders; Vlaams Brabant: Flemish Brabant; West Vlaanderen: West Flanders; Brabant Wallon: Walloon Brabant; Hainaut: Hainaut; Liege: Liege; Luxembourg: Luxembourg; Namur: Namur.
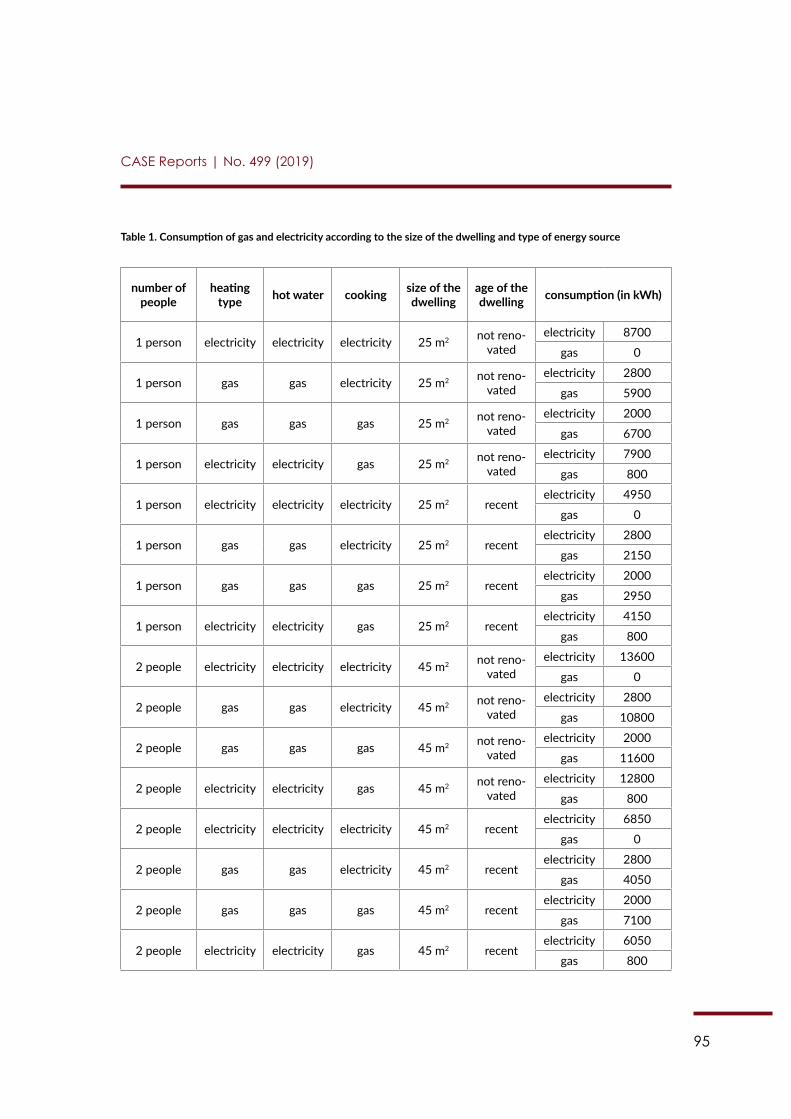
95
CASE Reports | No. 499 (2019)
Table 1. Consumption of gas and electricity according to the size of the dwelling and type of energy source
number of people
heating type hot water cooking size of the
dwellingage of the dwelling consumption (in kWh)
1 person electricity electricity electricity 25 m2 not reno-vated
electricity 8700
gas 0
1 person gas gas electricity 25 m2 not reno-vated
electricity 2800
gas 5900
1 person gas gas gas 25 m2 not reno-vated
electricity 2000
gas 6700
1 person electricity electricity gas 25 m2 not reno-vated
electricity 7900
gas 800
1 person electricity electricity electricity 25 m2 recentelectricity 4950
gas 0
1 person gas gas electricity 25 m2 recentelectricity 2800
gas 2150
1 person gas gas gas 25 m2 recentelectricity 2000
gas 2950
1 person electricity electricity gas 25 m2 recentelectricity 4150
gas 800
2 people electricity electricity electricity 45 m2 not reno-vated
electricity 13600
gas 0
2 people gas gas electricity 45 m2 not reno-vated
electricity 2800
gas 10800
2 people gas gas gas 45 m2 not reno-vated
electricity 2000
gas 11600
2 people electricity electricity gas 45 m2 not reno-vated
electricity 12800
gas 800
2 people electricity electricity electricity 45 m2 recentelectricity 6850
gas 0
2 people gas gas electricity 45 m2 recentelectricity 2800
gas 4050
2 people gas gas gas 45 m2 recentelectricity 2000
gas 7100
2 people electricity electricity gas 45 m2 recentelectricity 6050
gas 800
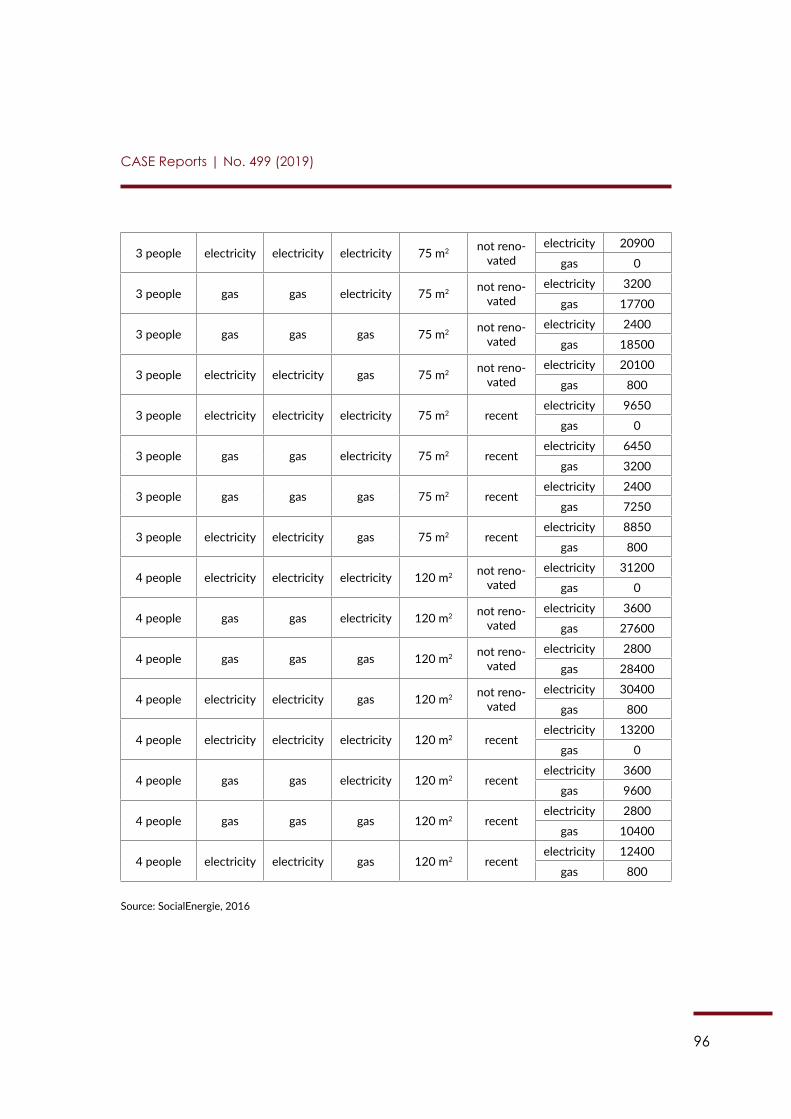
96
CASE Reports | No. 499 (2019)
3 people electricity electricity electricity 75 m2 not reno-vated
electricity 20900
gas 0
3 people gas gas electricity 75 m2 not reno-vated
electricity 3200
gas 17700
3 people gas gas gas 75 m2 not reno-vated
electricity 2400
gas 18500
3 people electricity electricity gas 75 m2 not reno-vated
electricity 20100
gas 800
3 people electricity electricity electricity 75 m2 recentelectricity 9650
gas 0
3 people gas gas electricity 75 m2 recentelectricity 6450
gas 3200
3 people gas gas gas 75 m2 recentelectricity 2400
gas 7250
3 people electricity electricity gas 75 m2 recentelectricity 8850
gas 800
4 people electricity electricity electricity 120 m2 not reno-vated
electricity 31200
gas 0
4 people gas gas electricity 120 m2 not reno-vated
electricity 3600
gas 27600
4 people gas gas gas 120 m2 not reno-vated
electricity 2800
gas 28400
4 people electricity electricity gas 120 m2 not reno-vated
electricity 30400
gas 800
4 people electricity electricity electricity 120 m2 recentelectricity 13200
gas 0
4 people gas gas electricity 120 m2 recentelectricity 3600
gas 9600
4 people gas gas gas 120 m2 recentelectricity 2800
gas 10400
4 people electricity electricity gas 120 m2 recentelectricity 12400
gas 800
Source: SocialEnergie, 2016
97
Authors: Dr. Michele Belloni, Prof. Francesco Figari
Contents
Acronyms ...................................................................................................................................... 98
Introduction ................................................................................................................................. 99
Chapter 1: Social and economic conditions of households ............................................1011.1. Population trends .........................................................................................................101
1.2. Number of households ................................................................................................102
1.3. Distribution of people by degree of urbanisation .................................................103
1.4. Household composition ..............................................................................................103
1.5. Income level and distribution ....................................................................................104
Chapter 2: Characteristics of the building stock ...............................................................1062.1. Ownership ......................................................................................................................106
2.2. Household overcrowding rate ...................................................................................108
2.3. Population distribution by dwelling type ................................................................108
2.4. Distribution of the building stock by age ................................................................109
2.5. Policy objectives in terms of building renovation .................................................111
Chapter 3: Energy consumption in private residential buildings and types of EE/RES investments ........................................................................................113
3.1. Energy consumption of the residential building stock .........................................113
3.2. Residential energy consumption per capita ...........................................................115
3.3. Energy consumption by source .................................................................................117
3.4. Energy consumption by type of end use .................................................................118
3.5. Energy classes of buildings .........................................................................................118
3.6. Energy prices for households .....................................................................................122
3.7. Type of EE/RES investments currently developed................................................122
3.8. Energy poverty: households in this situation ........................................................125
EuroPACE Market Analysis: Italy
98
CASE Reports | No. 499 (2019)
Chapter 4: Barriers to the development of EE/RES potential in private buildings ...................................................................................................................128
4.1. Institutional barriers ....................................................................................................128
4.2. Lack of market push of EE investment ....................................................................130
4.3. Social perception .........................................................................................................131
Chapter 5: Policies related to EE/RES in residential buildings .......................................1335.1. Transposition of the European Directive on Energy Performance in Buildings and other EU legislation related to EE/RES in buildings .......................133
5.2. Other legal developments in the area of energy performance in buildings and use of RES in buildings ..........................................................................133
5.3. Economic incentives ....................................................................................................134
5.4. Policies to support households in situations of energy poverty .......................135
5.5. Other policy developments ........................................................................................135
5.6. Initiatives at the local level to promote EE/RES in private buildings ................136
5.7. Bottom-up initiatives ...................................................................................................136
Conclusions ................................................................................................................................139
References ..................................................................................................................................141
Acronyms
EC European CommissionEE Energy EfficiencyEU European UnionGWh Gigawatt hoursISTAT Italian National Institute of Statistics MS Member StateMt CO2 eq Million Tonnes of CO2-EquivalentMtoe Million Tonnes of Oil EquivalentnZEB nearly Zero-Energy Buildings pp Percentage PointPPS Purchasing Power StandardRES Renewable Energy SourcesSWOT Strengths, Weaknesses, Opportunities, and Threats (table)
99
CASE Reports | No. 499 (2019)
Introduction
Using the most up-to-date national and European data available, this report presents evidence on selected items useful for assessing the market demand in Italy for the development of Euro-PACE – a home-based financing mechanism related to energy efficiency (EE) and renewable en-ergy sources (RES) in private residential buildings. In order to achieve this objective, the authors structured this report as follows.
Chapter 1 sets the socio-economic scene, providing an up-to-date snapshot of Italian demo-graphics, which is characterised by increasing age; households with fewer individuals than in the past; changes in living location, with larger shares of the population moving away from the main cities; and a poverty rate higher than in the euro area, among others.
Chapter 2 depicts the main characteristics of the building stock and ownership from the EuroPACE perspective, highlighting the predominance of the Italian population (around 73% of individuals) living in their own houses, with a clear income-related gradient. What results from this chapter is that single unit homes and multi-family buildings comprise almost equal shares of the building stock and can be considered relatively old. Moreover, importantly for EuroPACE, almost 45% of the building stock was built before 1960 and requires increasing renovation and maintenance works.
Along these lines, Chapter 3 reports the latest estimates related to energy consumption in private residential buildings, which show that Italy is in line with 2015 European Union (EU) estimates, although other countries have performed much better in energy consumption reduc-tion in recent decades, particularly when noting that Italy is favoured by a mild climate. The lat-est trends in residential energy consumption involve a large reduction in the use of petroleum products and an increase in RES. However, the major difference of Italy with respect to other European countries remains its heavy use of gas in place of electricity. In terms of energy prices, although they have declined over time, Italy remains one of the EU countries with the highest electricity prices. Against this background, to achieve the final end-use energy savings target, two interventions directed at households have been implemented in recent years: a tax deduc-tion scheme, namely, Ecobonus, and the Thermal Account. Although there is a lack of consensus on the measurement of energy poverty, Italy is below the EU average in terms of utility bills in arrears and above the EU average in inability to keep the home sufficiently warm and “hidden energy poverty”, particularly since 2010, probably due to economic difficulties associated with the recession. Lowering energy demand could therefore be an important factor in engaging citi-zens in home retrofits and other EE investments.
Chapter 4 also reviews other barriers in the development of the EE/RES potential in private buildings, providing details on awareness campaigns developed in the public and private sectors in recent years, which are quite peculiar for Italy. Communication obstacles and heterogeneity in social perceptions are revealed, as well as targets to be reached and funding opportunities (i.e. National Fund for Energy Efficiency).
Finally, Chapter 5 illustrates the main policies related to EE/RES in buildings, including the economic incentives channelled through tax relief and economic bonuses on gas and electricity
100
CASE Reports | No. 499 (2019)
bills, as well as more recent initiatives related to the Global Covenant of Mayors for Climate and Energy. It also assesses if these would be significant competition for EuroPACE or perhaps they could become a blending tool.
Concise concluding remarks follow.
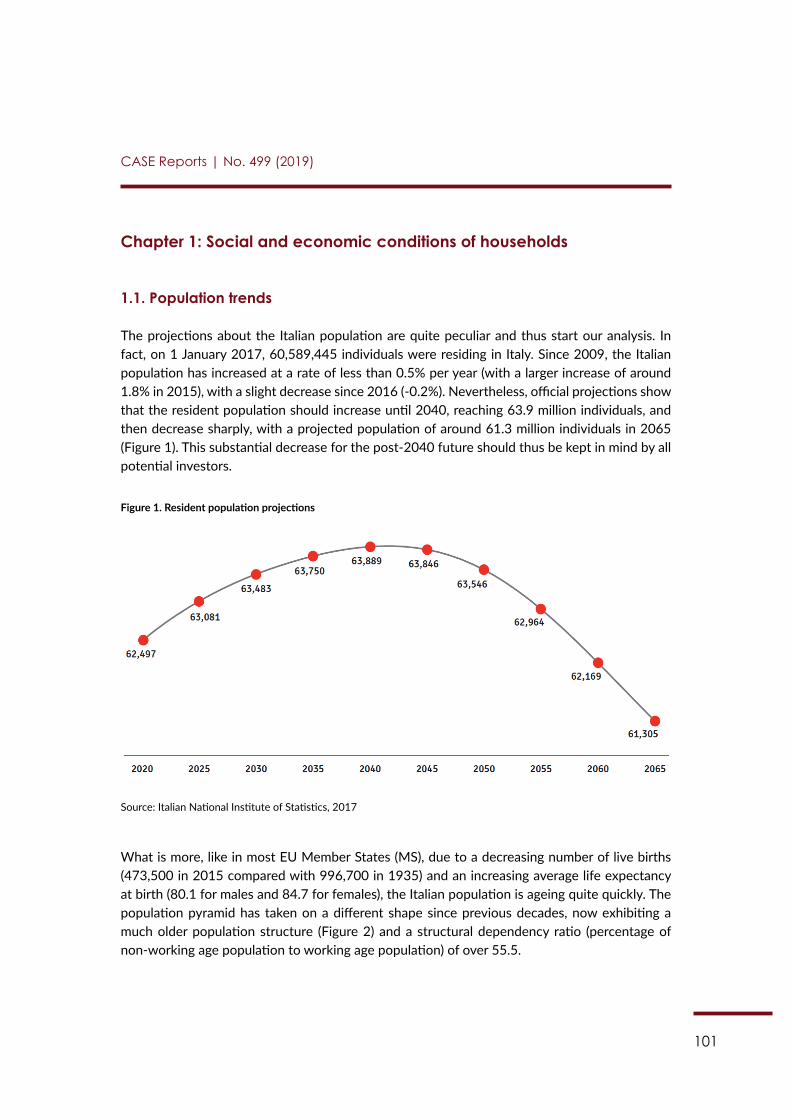
101
CASE Reports | No. 499 (2019)
Chapter 1: Social and economic conditions of households
1.1. Population trends
The projections about the Italian population are quite peculiar and thus start our analysis. In fact, on 1 January 2017, 60,589,445 individuals were residing in Italy. Since 2009, the Italian population has increased at a rate of less than 0.5% per year (with a larger increase of around 1.8% in 2015), with a slight decrease since 2016 (-0.2%). Nevertheless, official projections show that the resident population should increase until 2040, reaching 63.9 million individuals, and then decrease sharply, with a projected population of around 61.3 million individuals in 2065 (Figure 1). This substantial decrease for the post-2040 future should thus be kept in mind by all potential investors.
Figure 1. Resident population projections
87
Chapter 1: Social and economic conditions of households 1.1. Population trends
The projections about the Italian population are quite peculiar and thus start our analysis. In fact, on 1 January 2017, 60,589,445 individuals were residing in Italy. Since 2009, the Italian population has increased at a rate of less than 0.5% per year (with a larger increase of around 1.8% in 2015), with a slight decrease since 2016 (-0.2%). Nevertheless, official projections show that the resident population should increase until 2040, reaching 63.9 million individuals, and then decrease sharply, with a projected population of around 61.3 million individuals in 2065 (Figure 1). This substantial decrease for the post-2040 future should thus be kept in mind by all potential investors.
Figure 1. Resident population projections
Source: Italian National Institute of Statistics, 2017
What is more, like in most EU Member States (MS), due to a decreasing number of live births (473,500 in 2015 compared with 996,700 in 1935) and an increasing average life expectancy at birth (80.1 for males and 84.7 for females), the Italian population is ageing quite quickly. The population pyramid has taken on a different shape since previous decades, now exhibiting a much older population structure (Figure 2) and a structural dependency ratio (percentage of non-working age population to working age population) of over 55.5.
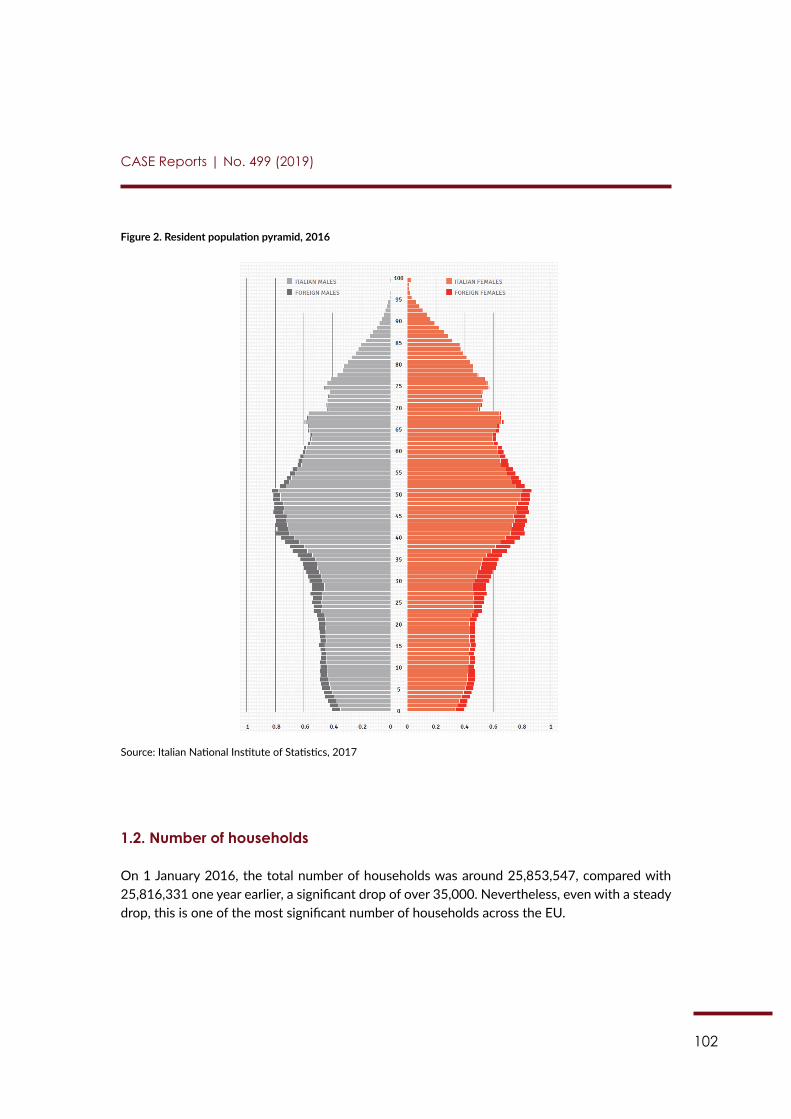
102
CASE Reports | No. 499 (2019)
Figure 2. Resident population pyramid, 2016
88
Figure 2. Resident population pyramid, 2016
Source: Italian National Institute of Statistics, 2017
1.2. Number of households
On 1 January 2016, the total number of households was around 25,853,547, compared with 25,816,331 one year earlier, a significant drop of over 35,000. Nevertheless, even with a steady drop, this is one of the most significant number of households across the EU.
1.3. Distribution of people by degree of urbanisation
One of the most unusual and interesting changes in household living conditions in Italy involves living location (Table 1). In the last 10 years, almost 10% of the population has moved away from cities (with 34.1% living in cities in 2017 compared to 43.9% in 2008) to rural areas (with 24.7% living in rural areas in 2017 compared to 16.7% in 2008), with a rather stable share of the population (around 40%) living in towns and suburbs.
Table 1. Population distribution by degree of urbanisation 2008 2009 2010 2011 2012 2013 2014 2015 2016 2017
Cities 43.9 43.7 43.6 43.3 43.1 44.1 43.4 33.8 34.5 34.1
Towns and suburbs 39.4 40.1 39.9 40.8 41.2 40.5 41.1 47.3 41.0 41.2
Rural areas 16.7 16.2 16.4 15.9 15.7 15.4 15.5 18.9 24.5 24.7
Source: Italian National Institute of Statistics, 2017
1.2. Number of households
On 1 January 2016, the total number of households was around 25,853,547, compared with 25,816,331 one year earlier, a significant drop of over 35,000. Nevertheless, even with a steady drop, this is one of the most significant number of households across the EU.
103
CASE Reports | No. 499 (2019)
1.3. Distribution of people by degree of urbanisation
One of the most unusual and interesting changes in household living conditions in Italy involves living location (Table 1). In the last 10 years, almost 10% of the population has moved away from cities (with 34.1% living in cities in 2017 compared to 43.9% in 2008) to rural areas (with 24.7% living in rural areas in 2017 compared to 16.7% in 2008), with a rather stable share of the popu-lation (around 40%) living in towns and suburbs.
Table 1. Population distribution by degree of urbanisation
2008 2009 2010 2011 2012 2013 2014 2015 2016 2017Cities 43.9 43.7 43.6 43.3 43.1 44.1 43.4 33.8 34.5 34.1
Towns and suburbs 39.4 40.1 39.9 40.8 41.2 40.5 41.1 47.3 41.0 41.2
Rural areas 16.7 16.2 16.4 15.9 15.7 15.4 15.5 18.9 24.5 24.7
Source: EU Statistics on Income and Living Conditions (EU-SILC), Eurostat
1.4. Household composition
In terms of household composition, around 32% of all households are composed of one person and 28% are composed of two persons, the latter figures slightly increasing over the past de-cade. Three-person households constitute around 19% of the total and four-person households 15.7%, less than in the past (Table 2).
Table 2. Household distribution by size
2008 2009 2010 2011 2012 2013 2014 2015 2016 20171 person 29.3 29.8 30.3 30.3 31.6 32.5 32.9 32.1 32.4 32.3
2 persons 27.0 27.0 26.8 27.7 27.1 26.4 26.5 27.1 27.5 28.0
3 persons 20.7 20.5 20.3 20.2 20.0 19.5 19.6 19.6 19.6 19.4
4 persons 17.5 17.2 17.3 16.9 16.3 16.6 16.0 16.2 15.8 15.7
5 persons 4.5 4.5 4.2 3.9 3.8 3.9 3.9 4.1 3.8 3.6
6 persons 1.0 1.0 1.1 1.0 1.2 1.1 1.1 0.9 0.9 1.0
Source: EU-SILC, Eurostat
104
CASE Reports | No. 499 (2019)
1.5. Income level and distribution
According to the Italian National Institute of Statistics (ISTAT), “in 2016 the average household net income (excluding imputed rents) was EUR 30,595, about EUR 2,550 per month (showing an increase of +2.0% at current prices and +2.1% at constant prices compared to 2015)”.1 However, while the gross household adjusted disposable income per capita (EU28 = 100, based on data in Purchasing Power Standard (PPS)) was almost equal to the EU average that year,2 in 2017, Italy also featured a poverty rate (defined as the share of individuals living on an equivalised income below 60% of the median) of around 20%, above the average rate for the euro area. This is relevant given that the share of the poverty rate has been increasing over the past 10 years (for further information on energy poverty see Section 3.8.). Nevertheless, the gross household investment rate in 2016 (%, ratio of gross fixed capital formation to gross disposable income) in Italy was around 7.7% – almost the same as the EU average,3 and in the first quarter of 2017 amounted to 8.5% proving a short, but positive trend in this respect. At the same time, “monthly households’ spending is estimated by ISTAT circa EUR 2,400 in 2016 (+2.2% vs 2013) of which circa EUR 600 per month is the average spending for house (rents or equivalent)”.4 Individuals at risk of poverty (Table 3) live predominantly in households with two adults and two children (17%), households with two adults (14%), households with a single person (17%), and house-holds composed of three or more adults with or without children (24%). It can thus be concluded that high household savings and still relatively low private debt are key elements of the Italian residential building stock. In fact, “households wealth in Italy was estimated by Banca d’Italia in 2015 equal to circa EUR 8,800 billion, of which EUR 1.2 billion in cash and cash equivalents”.5 These macro-data seem to support the idea that the share of the Italian population not living on an equivalised income below 60% of the median (therefore above that threshold), might be in the position to undertake investments in their households.
1 For more information see: https://www.istat.it/en/archivio/224687 2 For more information see Eurostat statistics on Households – statistics on disposable income, saving and invest-
ment, available online: https://ec.europa.eu/eurostat/statistics-explained/index.php/Households_-_statistics_on_disposable_income,_saving_and_investment#Household_saving_rate
3 Ibidem4 For more information see: https://www.ey.com/Publication/vwLUAssets/EY_Residential_development_in_
Italy/$FILE/EY%20residential%20development%20in%20Italy.pdf p. 3.5 Ibidem
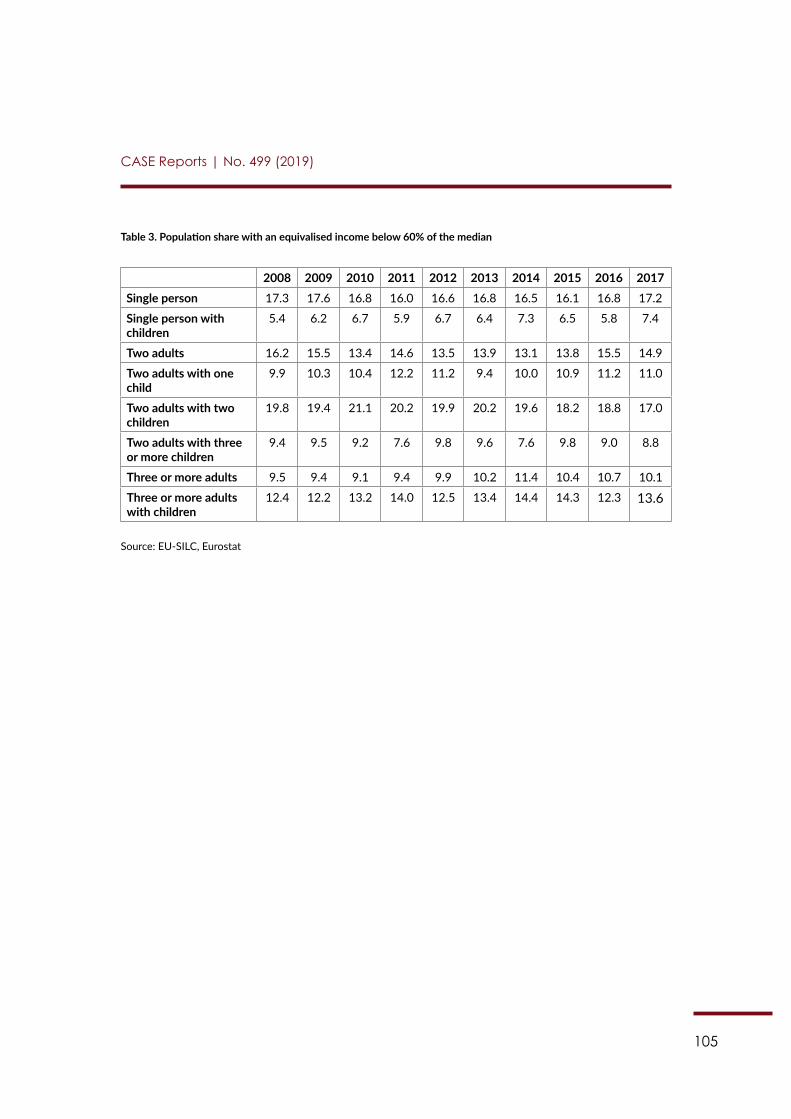
105
CASE Reports | No. 499 (2019)
Table 3. Population share with an equivalised income below 60% of the median
2008 2009 2010 2011 2012 2013 2014 2015 2016 2017Single person 17.3 17.6 16.8 16.0 16.6 16.8 16.5 16.1 16.8 17.2
Single person with children
5.4 6.2 6.7 5.9 6.7 6.4 7.3 6.5 5.8 7.4
Two adults 16.2 15.5 13.4 14.6 13.5 13.9 13.1 13.8 15.5 14.9
Two adults with one child
9.9 10.3 10.4 12.2 11.2 9.4 10.0 10.9 11.2 11.0
Two adults with two children
19.8 19.4 21.1 20.2 19.9 20.2 19.6 18.2 18.8 17.0
Two adults with three or more children
9.4 9.5 9.2 7.6 9.8 9.6 7.6 9.8 9.0 8.8
Three or more adults 9.5 9.4 9.1 9.4 9.9 10.2 11.4 10.4 10.7 10.1
Three or more adults with children
12.4 12.2 13.2 14.0 12.5 13.4 14.4 14.3 12.3 13.6
Source: EU-SILC, Eurostat
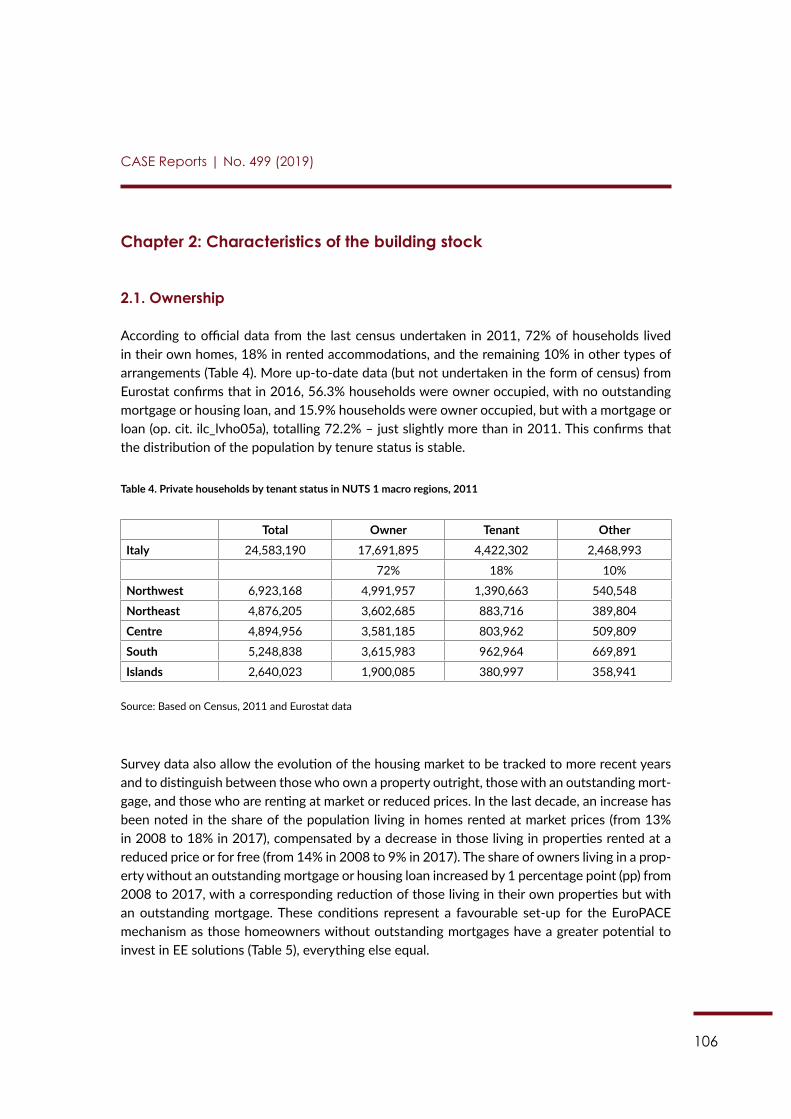
106
CASE Reports | No. 499 (2019)
Chapter 2: Characteristics of the building stock
2.1. Ownership
According to official data from the last census undertaken in 2011, 72% of households lived in their own homes, 18% in rented accommodations, and the remaining 10% in other types of arrangements (Table 4). More up-to-date data (but not undertaken in the form of census) from Eurostat confirms that in 2016, 56.3% households were owner occupied, with no outstanding mortgage or housing loan, and 15.9% households were owner occupied, but with a mortgage or loan (op. cit. ilc_lvho05a), totalling 72.2% – just slightly more than in 2011. This confirms that the distribution of the population by tenure status is stable.
Table 4. Private households by tenant status in NUTS 1 macro regions, 2011
Total Owner Tenant OtherItaly 24,583,190 17,691,895 4,422,302 2,468,993
72% 18% 10%
Northwest 6,923,168 4,991,957 1,390,663 540,548
Northeast 4,876,205 3,602,685 883,716 389,804
Centre 4,894,956 3,581,185 803,962 509,809
South 5,248,838 3,615,983 962,964 669,891
Islands 2,640,023 1,900,085 380,997 358,941
Source: Based on Census, 2011 and Eurostat data
Survey data also allow the evolution of the housing market to be tracked to more recent years and to distinguish between those who own a property outright, those with an outstanding mort-gage, and those who are renting at market or reduced prices. In the last decade, an increase has been noted in the share of the population living in homes rented at market prices (from 13% in 2008 to 18% in 2017), compensated by a decrease in those living in properties rented at a reduced price or for free (from 14% in 2008 to 9% in 2017). The share of owners living in a prop-erty without an outstanding mortgage or housing loan increased by 1 percentage point (pp) from 2008 to 2017, with a corresponding reduction of those living in their own properties but with an outstanding mortgage. These conditions represent a favourable set-up for the EuroPACE mechanism as those homeowners without outstanding mortgages have a greater potential to invest in EE solutions (Table 5), everything else equal.
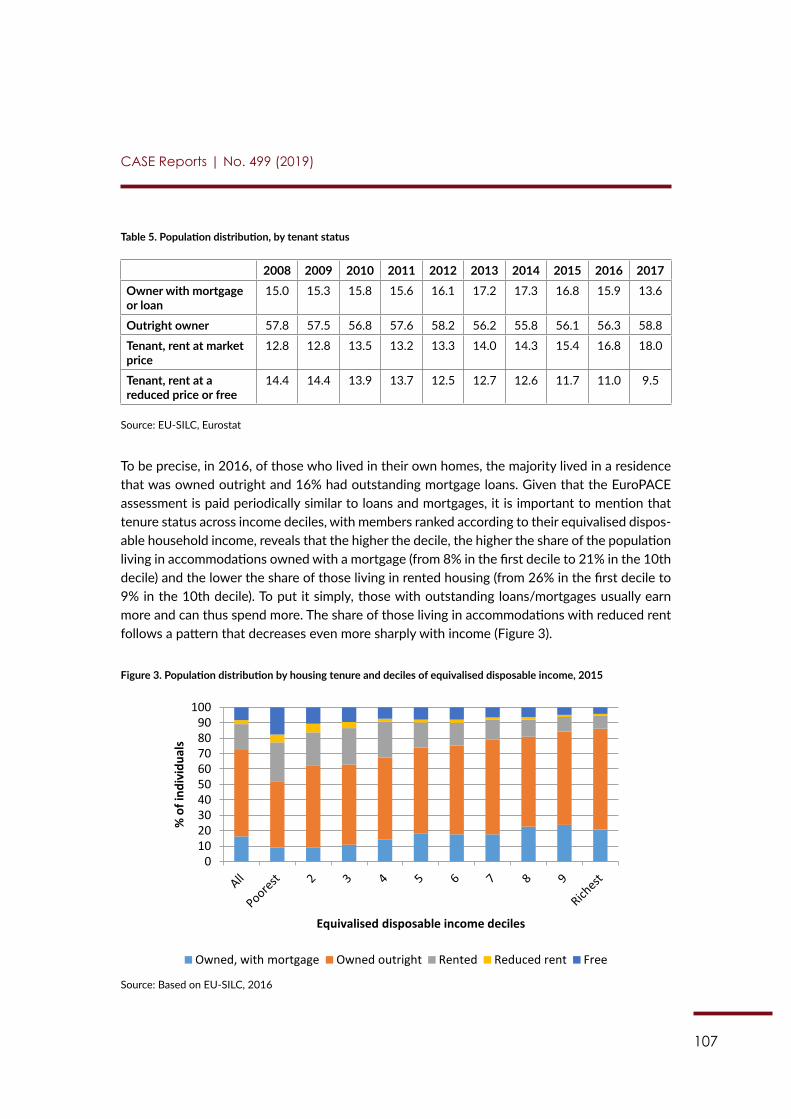
107
CASE Reports | No. 499 (2019)
Table 5. Population distribution, by tenant status
2008 2009 2010 2011 2012 2013 2014 2015 2016 2017Owner with mortgage or loan
15.0 15.3 15.8 15.6 16.1 17.2 17.3 16.8 15.9 13.6
Outright owner 57.8 57.5 56.8 57.6 58.2 56.2 55.8 56.1 56.3 58.8
Tenant, rent at market price
12.8 12.8 13.5 13.2 13.3 14.0 14.3 15.4 16.8 18.0
Tenant, rent at a reduced price or free
14.4 14.4 13.9 13.7 12.5 12.7 12.6 11.7 11.0 9.5
Source: EU-SILC, Eurostat
To be precise, in 2016, of those who lived in their own homes, the majority lived in a residence that was owned outright and 16% had outstanding mortgage loans. Given that the EuroPACE assessment is paid periodically similar to loans and mortgages, it is important to mention that tenure status across income deciles, with members ranked according to their equivalised dispos-able household income, reveals that the higher the decile, the higher the share of the population living in accommodations owned with a mortgage (from 8% in the first decile to 21% in the 10th decile) and the lower the share of those living in rented housing (from 26% in the first decile to 9% in the 10th decile). To put it simply, those with outstanding loans/mortgages usually earn more and can thus spend more. The share of those living in accommodations with reduced rent follows a pattern that decreases even more sharply with income (Figure 3).
Figure 3. Population distribution by housing tenure and deciles of equivalised disposable income, 2015
91
favourable set-up for the EuroPACE mechanism as those homeowners without outstanding mortgages have a greater potential to invest in EE solutions (Table 5), everything else equal.
Table 5. Population distribution, by tenant status 2008 2009 2010 2011 2012 2013 2014 2015 2016 2017
Owner with mortgage or loan 15.0 15.3 15.8 15.6 16.1 17.2 17.3 16.8 15.9 13.6
Outright owner 57.8 57.5 56.8 57.6 58.2 56.2 55.8 56.1 56.3 58.8
Tenant, rent at market price 12.8 12.8 13.5 13.2 13.3 14.0 14.3 15.4 16.8 18.0
Tenant, rent at a reduced price or free 14.4 14.4 13.9 13.7 12.5 12.7 12.6 11.7 11.0 9.5
Source: EU-SILC, Eurostat
To be precise, in 2016, of those who lived in their own homes, the majority lived in a residence that was owned outright and 16% had outstanding mortgage loans. Given that the EuroPACE assessment is paid periodically similar to loans and mortgages, it is important to mention that tenure status across income deciles, with members ranked according to their equivalised disposable household income, reveals that the higher the decile, the higher the share of the population living in accommodations owned with a mortgage (from 8% in the first decile to 21% in the 10th decile) and the lower the share of those living in rented housing (from 26% in the first decile to 9% in the 10th decile). To put it simply, those with outstanding loans/mortgages usually earn more and can thus spend more. The share of those living in accommodations with reduced rent follows a pattern that decreases even more sharply with income (Figure 3).
Figure 3. Population distribution by housing tenure and deciles of equivalised disposable income, 2015
Source: Based on EU-SILC, 2016
2.2. Household overcrowding rate
According to the 2001 census,182 around 76% of households lived in dwellings with three to five rooms. Compared to the data from 1991, the share of households in small dwellings (one or two rooms) has been increasing slightly while the share of households in large dwellings has been decreasing (Table 6).
182 The 2011 Census did not provide this information in such detail.
0 10 20 30 40 50 60 70 80 90
100
% o
f ind
ivid
uals
Equivalised disposable income deciles
Owned, with mortgage Owned outright Rented Reduced rent Free
Source: Based on EU-SILC, 2016

108
CASE Reports | No. 499 (2019)
2.2. Household overcrowding rate
According to the 2001 census,6 around 76% of households lived in dwellings with three to five rooms. Compared to the data from 1991, the share of households in small dwellings (one or two rooms) has been increasing slightly while the share of households in large dwellings has been decreasing (Table 6).
Table 6. Occupied conventional dwellings by number of rooms
1991 2001Total 19,735,913 21,653,288
1 room 218,687 1.11% 340,718 1.57%
2 rooms 1,465,301 7.42% 1,909,328 8.82%
3 rooms 3,833,997 19.43% 4,397,100 20.31%
4 rooms 6,605,764 33.47% 7,062,331 32.62%
5 rooms 4,594,754 23.28% 4,906,883 22.66%
6 rooms 1,688,708 8.56% 1,719,145 7.94%
7 rooms 696,995 3.53% 689,813 3.19%
8 rooms 295,215 1.50% 308,176 1.42%
9 rooms or more 336,492 1.70% 319,794 1.48%
Source: Census, Eurostat
2.3. Population distribution by dwelling type
The Italian population is almost equally divided among the main types of dwellings. In 2017, 47% of individuals lived in houses (detached or semi-detached) and 52% lived in multi-family buildings, with an equal share of condominiums with fewer or more than 10 dwellings each (Table 7).
Table 7. Population distribution by dwelling type
2008 2009 2010 2011 2012 2013 2014 2015 2016 2017House 40.2 44.3 45.2 51.6 48.4 49.6 48.9 47.2 47.3 47.4
Detached house 22.1 25.2 25.8 24.6 22.2 21.2 21.2 21.3 22.5 23.0
Semi-detached house 18.1 19.0 19.4 27.0 26.3 28.4 27.6 25.9 24.8 24.4
6 The 2011 Census did not provide this information in such detail.
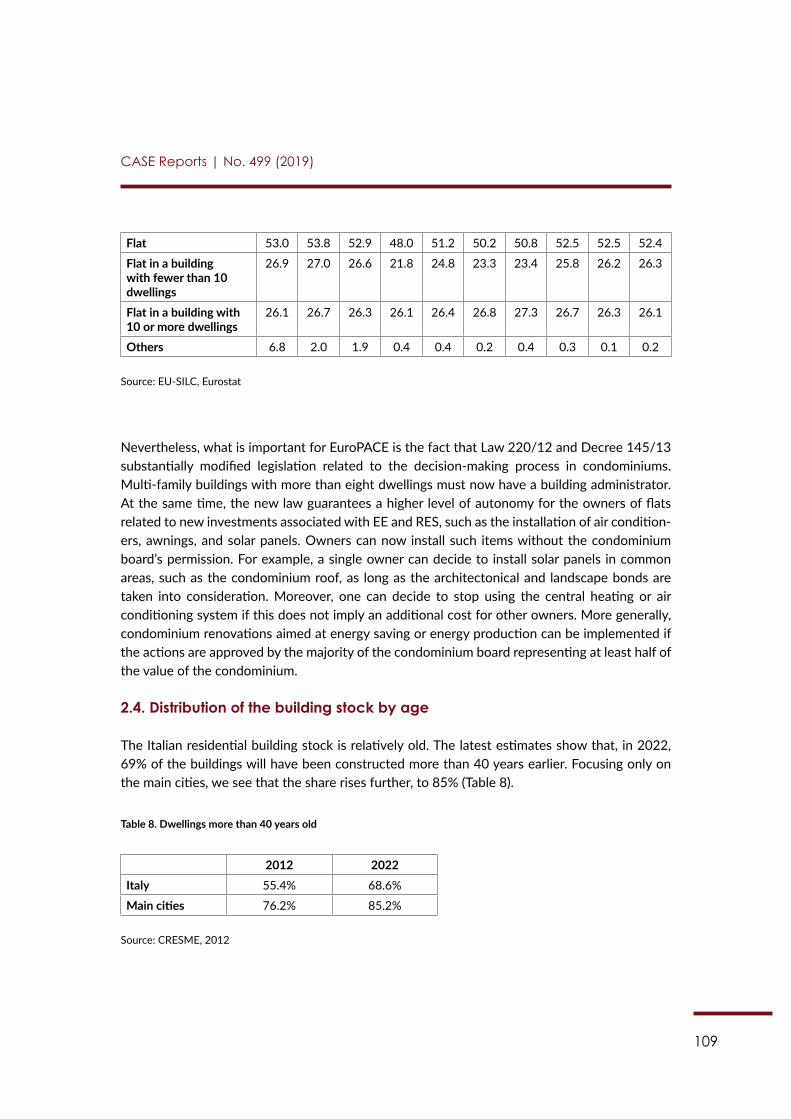
109
CASE Reports | No. 499 (2019)
Flat 53.0 53.8 52.9 48.0 51.2 50.2 50.8 52.5 52.5 52.4
Flat in a building with fewer than 10 dwellings
26.9 27.0 26.6 21.8 24.8 23.3 23.4 25.8 26.2 26.3
Flat in a building with 10 or more dwellings
26.1 26.7 26.3 26.1 26.4 26.8 27.3 26.7 26.3 26.1
Others 6.8 2.0 1.9 0.4 0.4 0.2 0.4 0.3 0.1 0.2
Source: EU-SILC, Eurostat
Nevertheless, what is important for EuroPACE is the fact that Law 220/12 and Decree 145/13 substantially modified legislation related to the decision-making process in condominiums. Multi-family buildings with more than eight dwellings must now have a building administrator. At the same time, the new law guarantees a higher level of autonomy for the owners of flats related to new investments associated with EE and RES, such as the installation of air condition-ers, awnings, and solar panels. Owners can now install such items without the condominium board’s permission. For example, a single owner can decide to install solar panels in common areas, such as the condominium roof, as long as the architectonical and landscape bonds are taken into consideration. Moreover, one can decide to stop using the central heating or air conditioning system if this does not imply an additional cost for other owners. More generally, condominium renovations aimed at energy saving or energy production can be implemented if the actions are approved by the majority of the condominium board representing at least half of the value of the condominium.
2.4. Distribution of the building stock by age
The Italian residential building stock is relatively old. The latest estimates show that, in 2022, 69% of the buildings will have been constructed more than 40 years earlier. Focusing only on the main cities, we see that the share rises further, to 85% (Table 8).
Table 8. Dwellings more than 40 years old
2012 2022Italy 55.4% 68.6%
Main cities 76.2% 85.2%
Source: CRESME, 2012
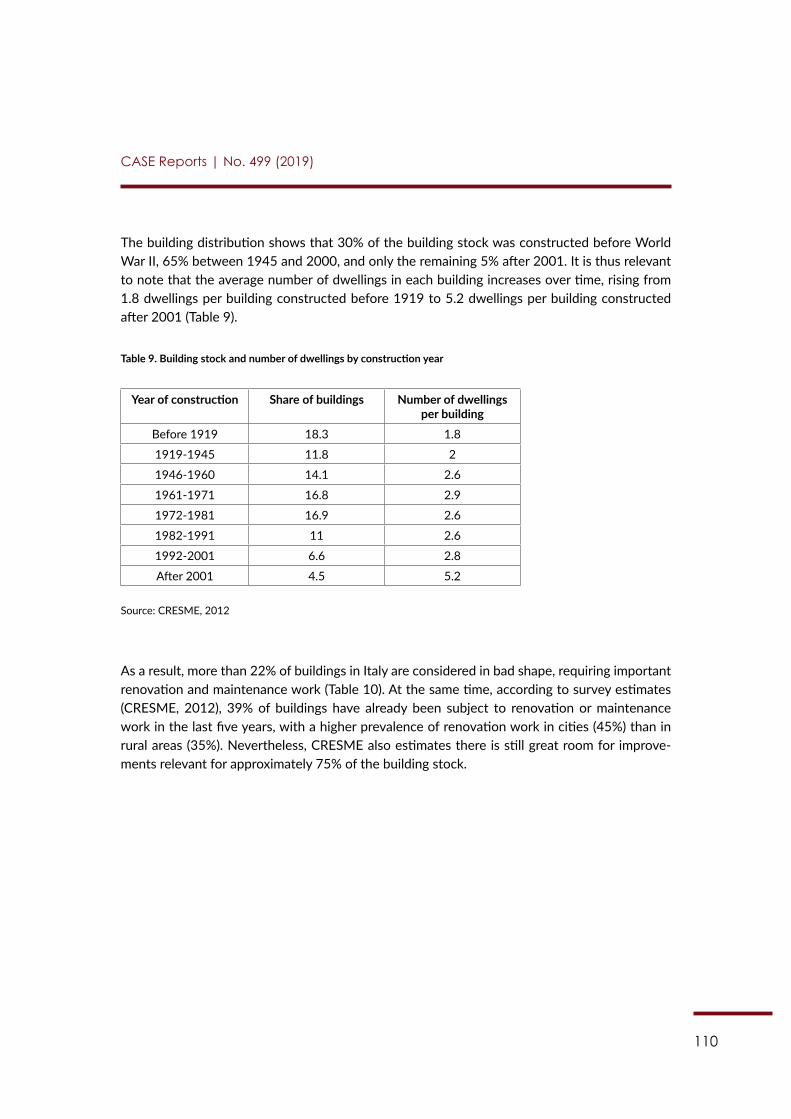
110
CASE Reports | No. 499 (2019)
The building distribution shows that 30% of the building stock was constructed before World War II, 65% between 1945 and 2000, and only the remaining 5% after 2001. It is thus relevant to note that the average number of dwellings in each building increases over time, rising from 1.8 dwellings per building constructed before 1919 to 5.2 dwellings per building constructed after 2001 (Table 9).
Table 9. Building stock and number of dwellings by construction year
Year of construction Share of buildings Number of dwellings per building
Before 1919 18.3 1.8
1919-1945 11.8 2
1946-1960 14.1 2.6
1961-1971 16.8 2.9
1972-1981 16.9 2.6
1982-1991 11 2.6
1992-2001 6.6 2.8
After 2001 4.5 5.2
Source: CRESME, 2012
As a result, more than 22% of buildings in Italy are considered in bad shape, requiring important renovation and maintenance work (Table 10). At the same time, according to survey estimates (CRESME, 2012), 39% of buildings have already been subject to renovation or maintenance work in the last five years, with a higher prevalence of renovation work in cities (45%) than in rural areas (35%). Nevertheless, CRESME also estimates there is still great room for improve-ments relevant for approximately 75% of the building stock.
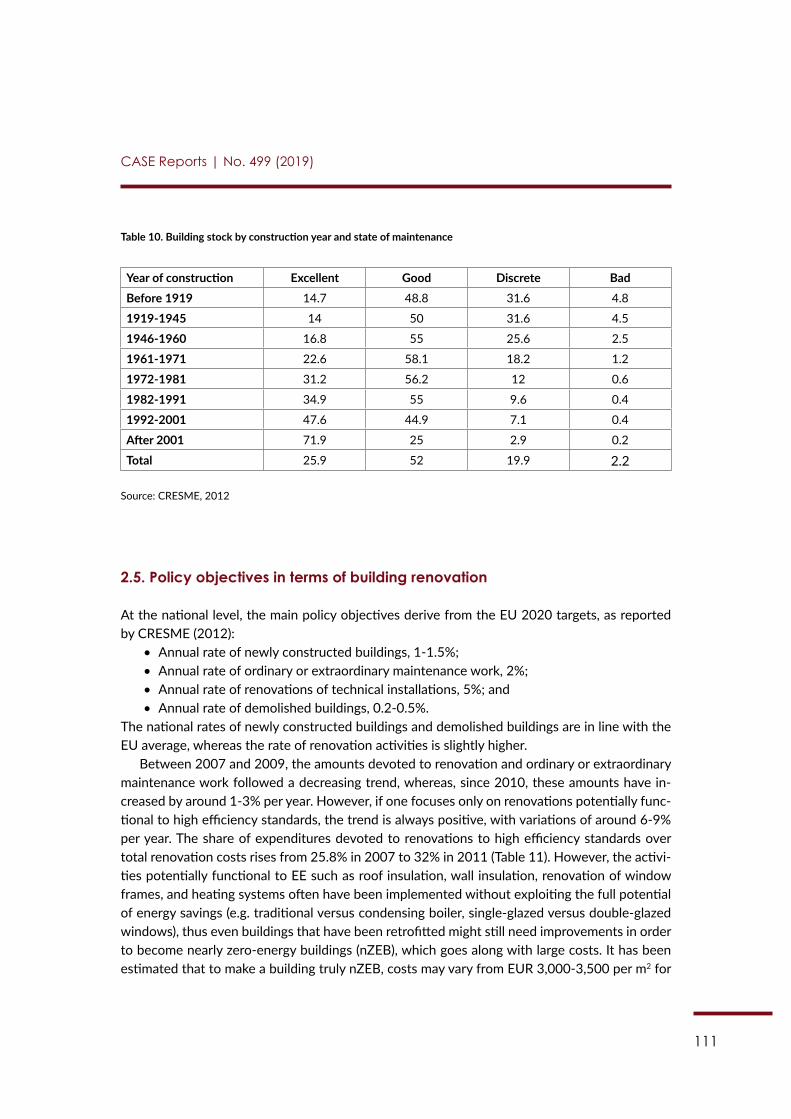
111
CASE Reports | No. 499 (2019)
Table 10. Building stock by construction year and state of maintenance
Year of construction Excellent Good Discrete BadBefore 1919 14.7 48.8 31.6 4.8
1919-1945 14 50 31.6 4.5
1946-1960 16.8 55 25.6 2.5
1961-1971 22.6 58.1 18.2 1.2
1972-1981 31.2 56.2 12 0.6
1982-1991 34.9 55 9.6 0.4
1992-2001 47.6 44.9 7.1 0.4
After 2001 71.9 25 2.9 0.2
Total 25.9 52 19.9 2.2
Source: CRESME, 2012
2.5. Policy objectives in terms of building renovation
At the national level, the main policy objectives derive from the EU 2020 targets, as reported by CRESME (2012):
• Annual rate of newly constructed buildings, 1-1.5%;• Annual rate of ordinary or extraordinary maintenance work, 2%;• Annual rate of renovations of technical installations, 5%; and• Annual rate of demolished buildings, 0.2-0.5%.
The national rates of newly constructed buildings and demolished buildings are in line with the EU average, whereas the rate of renovation activities is slightly higher.
Between 2007 and 2009, the amounts devoted to renovation and ordinary or extraordinary maintenance work followed a decreasing trend, whereas, since 2010, these amounts have in-creased by around 1-3% per year. However, if one focuses only on renovations potentially func-tional to high efficiency standards, the trend is always positive, with variations of around 6-9% per year. The share of expenditures devoted to renovations to high efficiency standards over total renovation costs rises from 25.8% in 2007 to 32% in 2011 (Table 11). However, the activi-ties potentially functional to EE such as roof insulation, wall insulation, renovation of window frames, and heating systems often have been implemented without exploiting the full potential of energy savings (e.g. traditional versus condensing boiler, single-glazed versus double-glazed windows), thus even buildings that have been retrofitted might still need improvements in order to become nearly zero-energy buildings (nZEB), which goes along with large costs. It has been estimated that to make a building truly nZEB, costs may vary from EUR 3,000-3,500 per m2 for
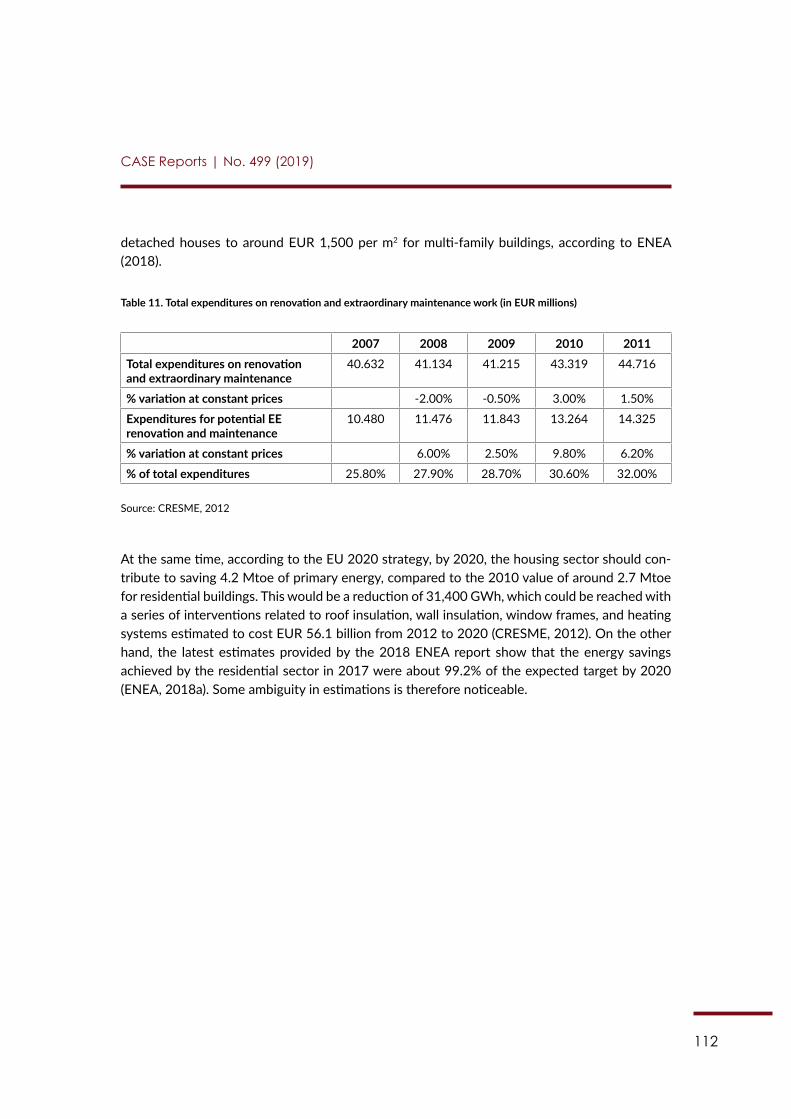
112
CASE Reports | No. 499 (2019)
detached houses to around EUR 1,500 per m2 for multi-family buildings, according to ENEA (2018).
Table 11. Total expenditures on renovation and extraordinary maintenance work (in EUR millions)
2007 2008 2009 2010 2011Total expenditures on renovation and extraordinary maintenance
40.632 41.134 41.215 43.319 44.716
% variation at constant prices -2.00% -0.50% 3.00% 1.50%
Expenditures for potential EE renovation and maintenance
10.480 11.476 11.843 13.264 14.325
% variation at constant prices 6.00% 2.50% 9.80% 6.20%
% of total expenditures 25.80% 27.90% 28.70% 30.60% 32.00%
Source: CRESME, 2012
At the same time, according to the EU 2020 strategy, by 2020, the housing sector should con-tribute to saving 4.2 Mtoe of primary energy, compared to the 2010 value of around 2.7 Mtoe for residential buildings. This would be a reduction of 31,400 GWh, which could be reached with a series of interventions related to roof insulation, wall insulation, window frames, and heating systems estimated to cost EUR 56.1 billion from 2012 to 2020 (CRESME, 2012). On the other hand, the latest estimates provided by the 2018 ENEA report show that the energy savings achieved by the residential sector in 2017 were about 99.2% of the expected target by 2020 (ENEA, 2018a). Some ambiguity in estimations is therefore noticeable.
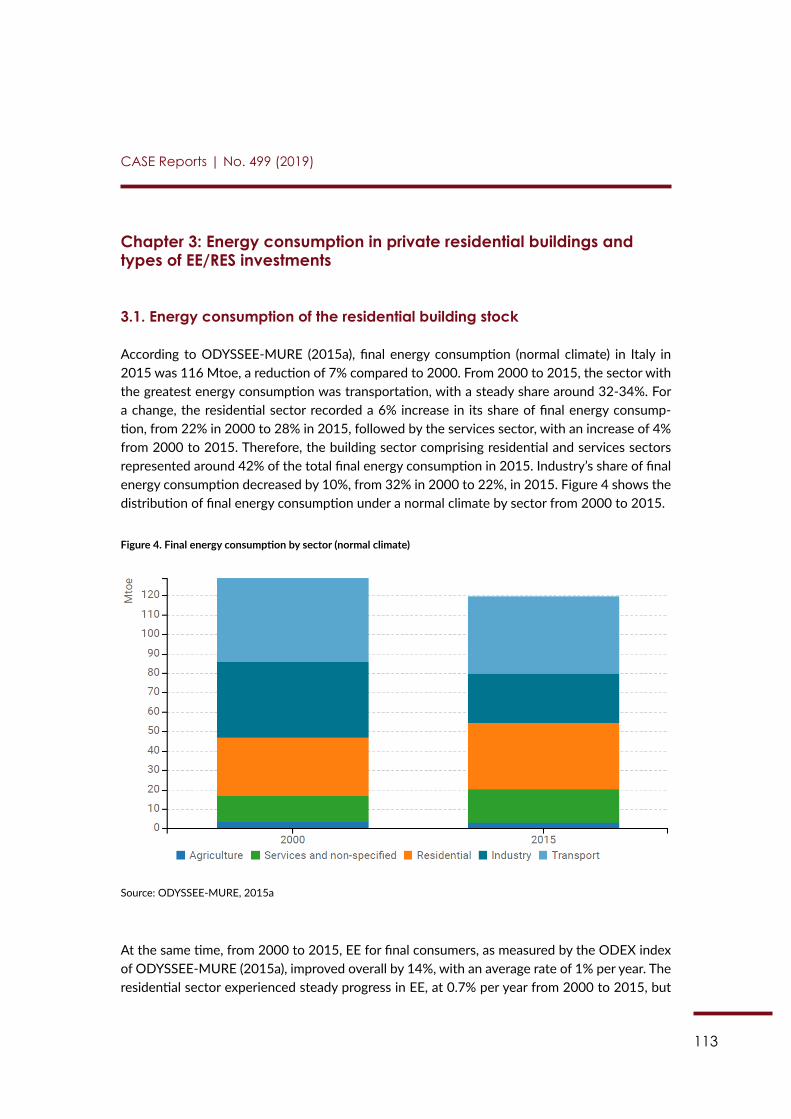
113
CASE Reports | No. 499 (2019)
Chapter 3: Energy consumption in private residential buildings and types of EE/RES investments
3.1. Energy consumption of the residential building stock
According to ODYSSEE-MURE (2015a), final energy consumption (normal climate) in Italy in 2015 was 116 Mtoe, a reduction of 7% compared to 2000. From 2000 to 2015, the sector with the greatest energy consumption was transportation, with a steady share around 32-34%. For a change, the residential sector recorded a 6% increase in its share of final energy consump-tion, from 22% in 2000 to 28% in 2015, followed by the services sector, with an increase of 4% from 2000 to 2015. Therefore, the building sector comprising residential and services sectors represented around 42% of the total final energy consumption in 2015. Industry’s share of final energy consumption decreased by 10%, from 32% in 2000 to 22%, in 2015. Figure 4 shows the distribution of final energy consumption under a normal climate by sector from 2000 to 2015.
Figure 4. Final energy consumption by sector (normal climate)
95
Chapter 3: Energy consumption in private residential buildings and types of EE/RES investments
3.1. Energy consumption of the residential building stock
According to ODYSSEE-MURE (2015a), final energy consumption (normal climate) in Italy in 2015 was 116 Mtoe, a reduction of 7% compared to 2000. From 2000 to 2015, the sector with the greatest energy consumption was transportation, with a steady share around 32-34%. For a change, the residential sector recorded a 6% increase in its share of final energy consumption, from 22% in 2000 to 28% in 2015, followed by the services sector, with an increase of 4% from 2000 to 2015. Therefore, the building sector comprising residential and services sectors represented around 42% of the total final energy consumption in 2015. Industry’s share of final energy consumption decreased by 10%, from 32% in 2000 to 22%, in 2015. Figure 4 shows the distribution of final energy consumption under a normal climate by sector from 2000 to 2015.
Figure 4. Final energy consumption by sector (normal climate)
Source: ODYSSEE-MURE, 2015a
At the same time, from 2000 to 2015, EE for final consumers, as measured by the ODEX index of ODYSSEE-MURE (2015a), improved overall by 14%, with an average rate of 1% per year. The residential sector experienced steady progress in EE, at 0.7% per year from 2000 to 2015, but less than in the 1990s, due to changes in lifestyle and dwelling comfort. Figure 5 shows the technical EE index (ODEX) over the period 2000-2015.
Source: ODYSSEE-MURE, 2015a
At the same time, from 2000 to 2015, EE for final consumers, as measured by the ODEX index of ODYSSEE-MURE (2015a), improved overall by 14%, with an average rate of 1% per year. The residential sector experienced steady progress in EE, at 0.7% per year from 2000 to 2015, but
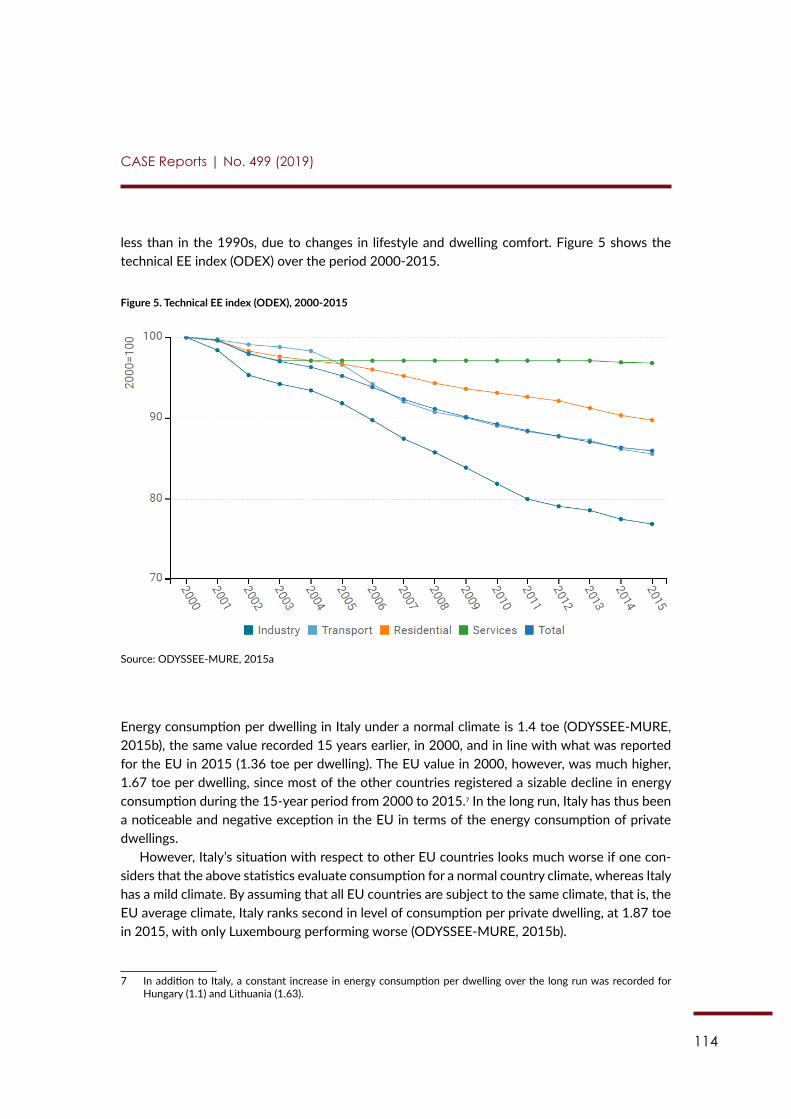
114
CASE Reports | No. 499 (2019)
less than in the 1990s, due to changes in lifestyle and dwelling comfort. Figure 5 shows the technical EE index (ODEX) over the period 2000-2015.
Figure 5. Technical EE index (ODEX), 2000-2015
96
Figure 5. Technical EE index (ODEX), 2000-2015
Source: ODYSSEE-MURE, 2015a
Energy consumption per dwelling in Italy under a normal climate is 1.4 toe (ODYSSEE-MURE, 2015b), the same value recorded 15 years earlier, in 2000, and in line with what was reported for the EU in 2015 (1.36 toe per dwelling). The EU value in 2000, however, was much higher, 1.67 toe per dwelling, since most of the other countries registered a sizable decline in energy consumption during the 15-year period from 2000 to 2015.183 In the long run, Italy has thus been a noticeable and negative exception in the EU in terms of the energy consumption of private dwellings.
However, Italy’s situation with respect to other EU countries looks much worse if one considers that the above statistics evaluate consumption for a normal country climate, whereas Italy has a mild climate. By assuming that all EU countries are subject to the same climate, that is, the EU average climate, Italy ranks second in level of consumption per private dwelling, at 1.87 toe in 2015, with only Luxembourg performing worse (ODYSSEE-MURE, 2015b).
To be more precise, the long-run trends outlined above can be split into two periods, over which Italy has performed in very different ways: 2000-2008 and 2008-2015. Whereas the former period is characterised by an increase in energy consumption, in the second period, Italy performs somewhat better, reporting a reduction in consumption of 1.15% per year. According to the EU (Joint Research Centre, or JRC, 2018), residential electricity consumption in Italy was 61,112 GWh in 2000, 67,220 GWh in 2007, and 66,187 GWh in 2015. The corresponding rates of change are equal to +8.3% for 2000-2015, +9.99% for 2000-2007, and -1.54% for 2007-2015. It must be outlined already at this stage that two important EE policy measures (Ecobonus and White Certificates – see later) were introduced in 2007 and 2005 respectively.
183 In addition to Italy, a constant increase in energy consumption per dwelling over the long run was recorded for Hungary (1.1) and Lithuania (1.63).
Source: ODYSSEE-MURE, 2015a
Energy consumption per dwelling in Italy under a normal climate is 1.4 toe (ODYSSEE-MURE, 2015b), the same value recorded 15 years earlier, in 2000, and in line with what was reported for the EU in 2015 (1.36 toe per dwelling). The EU value in 2000, however, was much higher, 1.67 toe per dwelling, since most of the other countries registered a sizable decline in energy consumption during the 15-year period from 2000 to 2015.7 In the long run, Italy has thus been a noticeable and negative exception in the EU in terms of the energy consumption of private dwellings.
However, Italy’s situation with respect to other EU countries looks much worse if one con-siders that the above statistics evaluate consumption for a normal country climate, whereas Italy has a mild climate. By assuming that all EU countries are subject to the same climate, that is, the EU average climate, Italy ranks second in level of consumption per private dwelling, at 1.87 toe in 2015, with only Luxembourg performing worse (ODYSSEE-MURE, 2015b).
7 In addition to Italy, a constant increase in energy consumption per dwelling over the long run was recorded for Hungary (1.1) and Lithuania (1.63).
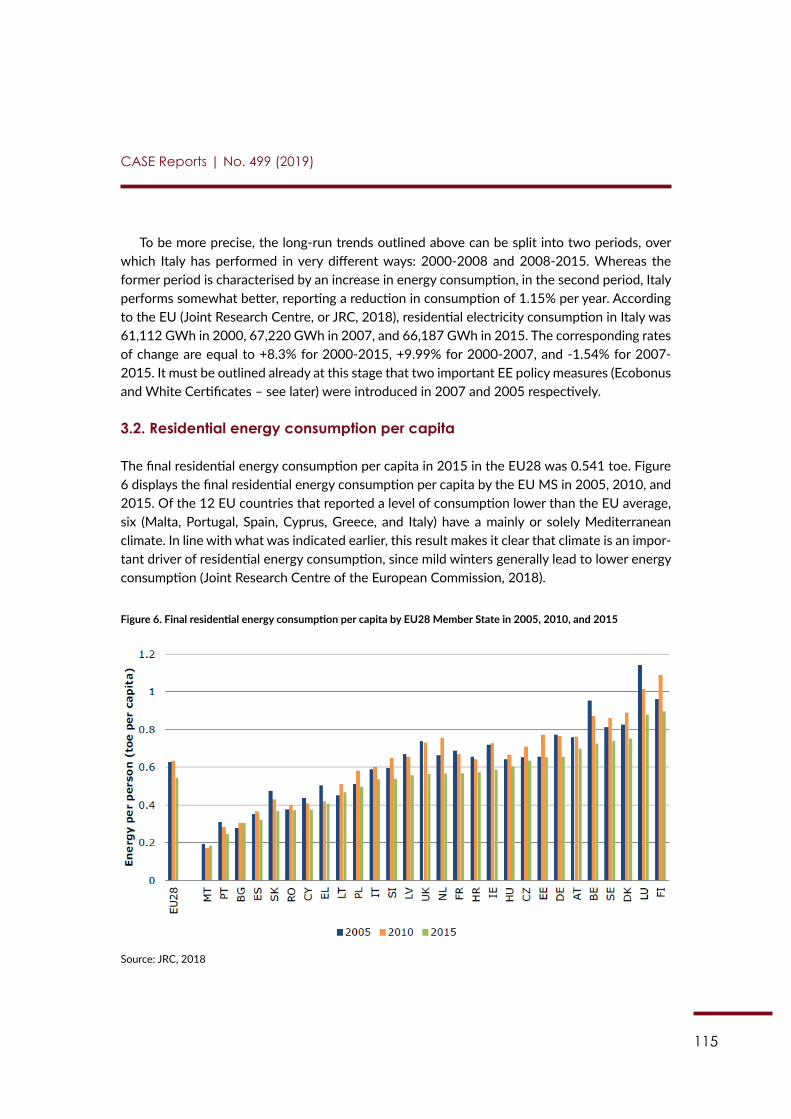
115
CASE Reports | No. 499 (2019)
To be more precise, the long-run trends outlined above can be split into two periods, over which Italy has performed in very different ways: 2000-2008 and 2008-2015. Whereas the former period is characterised by an increase in energy consumption, in the second period, Italy performs somewhat better, reporting a reduction in consumption of 1.15% per year. According to the EU (Joint Research Centre, or JRC, 2018), residential electricity consumption in Italy was 61,112 GWh in 2000, 67,220 GWh in 2007, and 66,187 GWh in 2015. The corresponding rates of change are equal to +8.3% for 2000-2015, +9.99% for 2000-2007, and -1.54% for 2007-2015. It must be outlined already at this stage that two important EE policy measures (Ecobonus and White Certificates – see later) were introduced in 2007 and 2005 respectively.
3.2. Residential energy consumption per capita
The final residential energy consumption per capita in 2015 in the EU28 was 0.541 toe. Figure 6 displays the final residential energy consumption per capita by the EU MS in 2005, 2010, and 2015. Of the 12 EU countries that reported a level of consumption lower than the EU average, six (Malta, Portugal, Spain, Cyprus, Greece, and Italy) have a mainly or solely Mediterranean climate. In line with what was indicated earlier, this result makes it clear that climate is an impor-tant driver of residential energy consumption, since mild winters generally lead to lower energy consumption (Joint Research Centre of the European Commission, 2018).
Figure 6. Final residential energy consumption per capita by EU28 Member State in 2005, 2010, and 2015
97
3.2. Residential energy consumption per capita
The final residential energy consumption per capita in 2015 in the EU28 was 0.541 toe. Figure 6 displays the final residential energy consumption per capita by the EU MS in 2005, 2010, and 2015. Of the 12 EU countries that reported a level of consumption lower than the EU average, six (Malta, Portugal, Spain, Cyprus, Greece, and Italy) have a mainly or solely Mediterranean climate. In line with what was indicated earlier, this result makes it clear that climate is an important driver of residential energy consumption, since mild winters generally lead to lower energy consumption (Joint Research Centre of the European Commission, 2018).
Figure 6. Final residential energy consumption per capita by EU28 Member State in 2005, 2010, and 2015
Source: JRC, 2018
Economic development as measured by the gross domestic product per capita is also typically associated with an increase in energy consumption. However, the correlation between economic growth and energy consumption is low (see Figure 41 of JRC, 2018) for the residential sector, because an increase in wealth can drive households to more efficient energy use through more efficient equipment and better insulated buildings. This result crucially depends on the distribution of wealth: if wealth is concentrated in the hands of few households, there is no increase in the purchasing power of most households and no positive impact on EE.
To review, the outlined description of the trends in residential energy consumption in the period 2000-2015 reveals an increase both in absolute and relative (with respect to other sectors) terms; this was coupled by a counteracting increase in EE. Moreover, the consumption level per dwelling remained constant. This evidence is consistent with what was reported by ODYSSEE-MURE (2015b). Figure 7 (ODYSSEE-MURE, 2015b) reports the levels of consumption in households in 2000 and 2015 and explains the increase of 5 Mtoe by mainly two factors – more dwellings (+4.4 Mtoe) and greater comfort (+5.7 Mtoe), as defined by the number of appliances per dwelling – while energy savings counterbalanced these effects with a decrease in consumption of 3.7 Mtoe. Two important determinants of residential energy consumption are also household size, because many energy-using appliances in the house are
Source: JRC, 2018
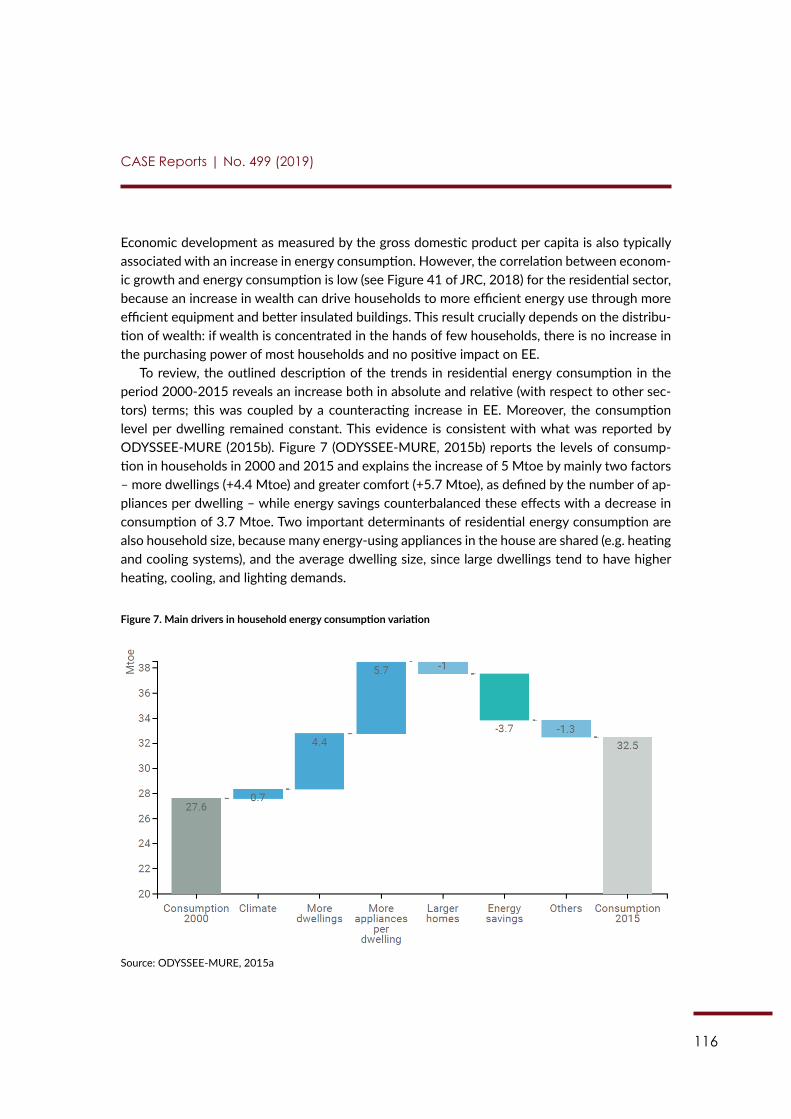
116
CASE Reports | No. 499 (2019)
Economic development as measured by the gross domestic product per capita is also typically associated with an increase in energy consumption. However, the correlation between econom-ic growth and energy consumption is low (see Figure 41 of JRC, 2018) for the residential sector, because an increase in wealth can drive households to more efficient energy use through more efficient equipment and better insulated buildings. This result crucially depends on the distribu-tion of wealth: if wealth is concentrated in the hands of few households, there is no increase in the purchasing power of most households and no positive impact on EE.
To review, the outlined description of the trends in residential energy consumption in the period 2000-2015 reveals an increase both in absolute and relative (with respect to other sec-tors) terms; this was coupled by a counteracting increase in EE. Moreover, the consumption level per dwelling remained constant. This evidence is consistent with what was reported by ODYSSEE-MURE (2015b). Figure 7 (ODYSSEE-MURE, 2015b) reports the levels of consump-tion in households in 2000 and 2015 and explains the increase of 5 Mtoe by mainly two factors – more dwellings (+4.4 Mtoe) and greater comfort (+5.7 Mtoe), as defined by the number of ap-pliances per dwelling – while energy savings counterbalanced these effects with a decrease in consumption of 3.7 Mtoe. Two important determinants of residential energy consumption are also household size, because many energy-using appliances in the house are shared (e.g. heating and cooling systems), and the average dwelling size, since large dwellings tend to have higher heating, cooling, and lighting demands.
Figure 7. Main drivers in household energy consumption variation
98
shared (e.g. heating and cooling systems), and the average dwelling size, since large dwellings tend to have higher heating, cooling, and lighting demands.
Figure 7. Main drivers in household energy consumption variation
Source: ODYSSEE-MURE, 2015a
3.3. Energy consumption by source
The final energy residential consumption levels and trends reported above can be broken down by fuel type. Eurostat (2016b) presents the time series of final residential energy consumption by fuel as a quota of total consumption per year, distinguishing six types of fuel: solid fuels, total petroleum fuels, gas, electrical energy, derived heat, and RES.184 Figure 8 reports the corresponding quotas for Italy from 1990 to 2016. In the most recent year, 2016, the percentages were 0% solid fuels, 7.1% total petroleum products, 53.1% gas, 17.2% electrical energy, 2.9% derived heat, and 19.6% RES. The corresponding values for Europe were, respectively, 3.3%, 11.6%, 36.9%, 24.4%, 7.8%, and 15.9% (not plotted here). Therefore, the major differences with respect to the EU28 members are Italy’s heavy use of gas in place of electricity and a higher percentage of RES. If one compares these data with those of 2006, that is, 10 years earlier, one notes a reduction of 51% (or an absolute reduction of 7.4 pp) in Italy’s use of total petroleum products, an increase of more than six times in derived heat, and an increase of 34% in RES (+5 pp). The shares of other types of energy remained stable. The long-run trend (1990 onward) shows a strong reduction in the relative use of total petroleum products, from 35% to 7%, replaced by an increase of RES, from 2% to 20%. The relative use of gas and electricity has been rather constant.
184 The indicator was chosen as a proxy for indicators in the key area of “improving buildings” of the resource efficiency initiative. This area focuses on the energy spent in households for heating and how the amelioration of buildings can contribute to energy-saving plans.
Source: ODYSSEE-MURE, 2015a
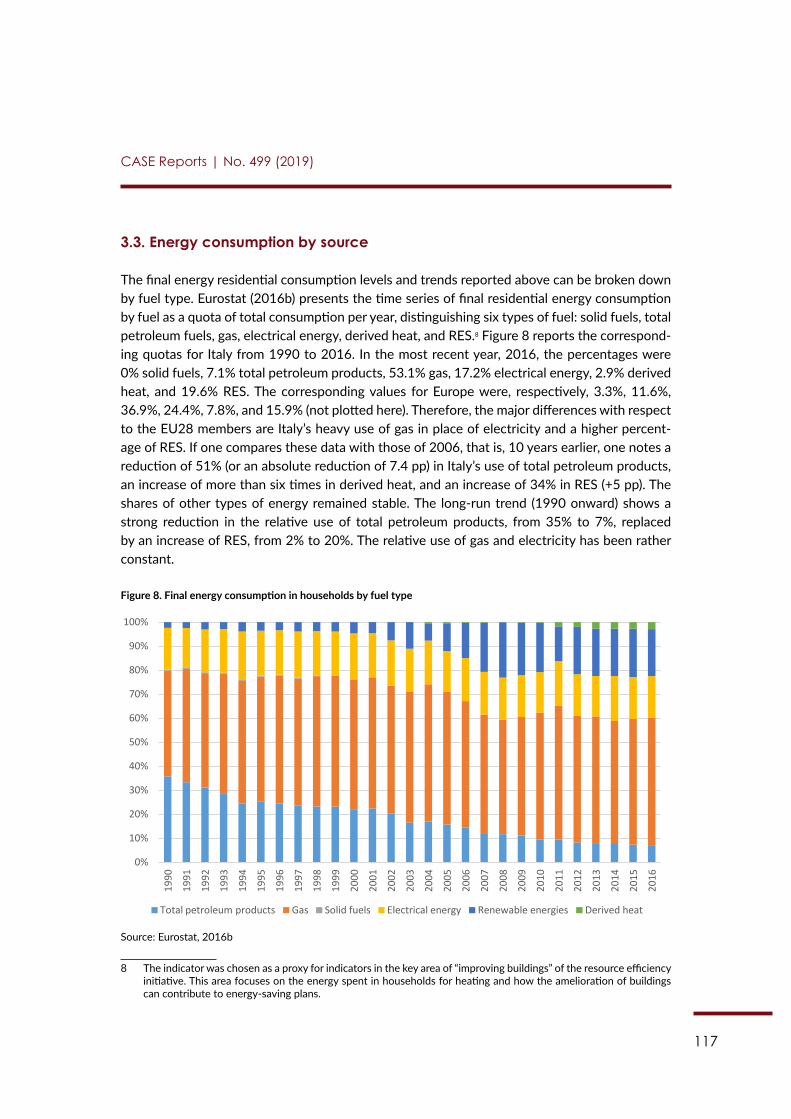
117
CASE Reports | No. 499 (2019)
3.3. Energy consumption by source
The final energy residential consumption levels and trends reported above can be broken down by fuel type. Eurostat (2016b) presents the time series of final residential energy consumption by fuel as a quota of total consumption per year, distinguishing six types of fuel: solid fuels, total petroleum fuels, gas, electrical energy, derived heat, and RES.8 Figure 8 reports the correspond-ing quotas for Italy from 1990 to 2016. In the most recent year, 2016, the percentages were 0% solid fuels, 7.1% total petroleum products, 53.1% gas, 17.2% electrical energy, 2.9% derived heat, and 19.6% RES. The corresponding values for Europe were, respectively, 3.3%, 11.6%, 36.9%, 24.4%, 7.8%, and 15.9% (not plotted here). Therefore, the major differences with respect to the EU28 members are Italy’s heavy use of gas in place of electricity and a higher percent-age of RES. If one compares these data with those of 2006, that is, 10 years earlier, one notes a reduction of 51% (or an absolute reduction of 7.4 pp) in Italy’s use of total petroleum products, an increase of more than six times in derived heat, and an increase of 34% in RES (+5 pp). The shares of other types of energy remained stable. The long-run trend (1990 onward) shows a strong reduction in the relative use of total petroleum products, from 35% to 7%, replaced by an increase of RES, from 2% to 20%. The relative use of gas and electricity has been rather constant.
Figure 8. Final energy consumption in households by fuel type
99
Figure 8. Final energy consumption in households by fuel type
Source: Eurostat, 2016b
3.4. Energy consumption by type of end use
We further report the share of final energy consumption in the residential sector by type of end use (Eurostat, 2016b). Space heating represents 67.7% of total consumption, by far the most important type of end-use consumption.185 The other types of energy end use are water heating, 12%; electrical appliances, 11%; cooking, 6%; and air conditioning, 3% (its share has more than doubled since 2000). In 2016, the shares were in line with those of the EU28.
From 2000 to 2015, energy consumption grew by 18%, at +1.1% per year, with an increasing trend in certain end uses: +1.4% per year for space heating, +1.3% per year for cooking, and +8.3% per year for air cooling. Energy consumption for water heating and electrical appliances remained rather stable (-0.1% per year). The percentage distributions of end-use consumption remained practically constant over the last 10 years (ODYSSEE-MURE, 2015a).
Considering the primary role of energy consumption for space heating, we report the 2016 distribution of this type of end use in the residential sector in terms of share of fuels (Eurostat, 2016b, Table 4). Space heating uses primarily gas (60%), followed by renewables and waste (26.9%), oil and petroleum products (8.2%), derived heat (3.8%), and electricity (0.4%). At the EU28 level, these shares are quite different: heating needs are satisfied by a much lower quota of gas (43.4%), compensated by higher quotas of electricity, derived heat, solid fuel, and oil (5.6%, 9.2%, 4.8%, and 14.8%, respectively).
185 This casts doubts on the evaluation of the energy consumption in Italy at the EU-average climate, unless the shares of end-use types of consumption are not dramatically affected by climate (e.g. northern countries not only need more heating but also more lighting).
0%
10%
20%
30%
40%
50%
60%
70%
80%
90%
100%
1990
1991
1992
1993
1994
1995
1996
1997
1998
1999
2000
2001
2002
2003
2004
2005
2006
2007
2008
2009
2010
2011
2012
2013
2014
2015
2016
Total petroleum products Gas Solid fuels Electrical energy Renewable energies Derived heat
Source: Eurostat, 2016b
8 The indicator was chosen as a proxy for indicators in the key area of “improving buildings” of the resource efficiency initiative. This area focuses on the energy spent in households for heating and how the amelioration of buildings can contribute to energy-saving plans.
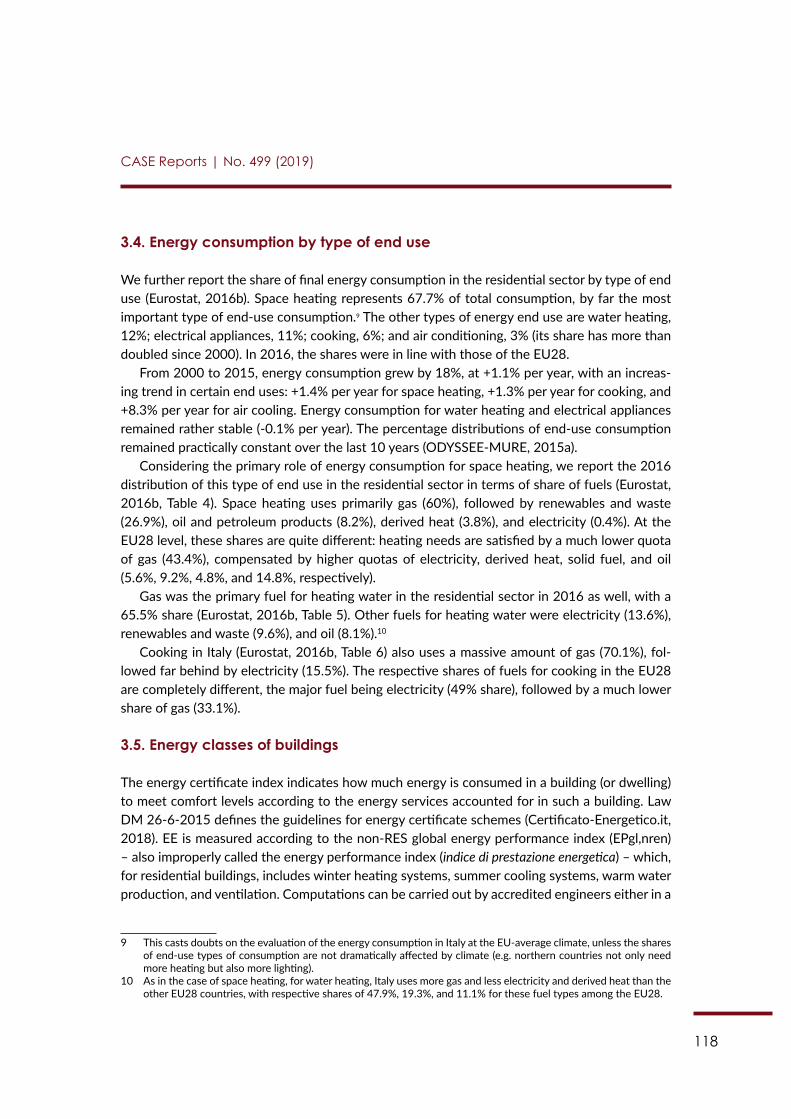
118
CASE Reports | No. 499 (2019)
3.4. Energy consumption by type of end use
We further report the share of final energy consumption in the residential sector by type of end use (Eurostat, 2016b). Space heating represents 67.7% of total consumption, by far the most important type of end-use consumption.9 The other types of energy end use are water heating, 12%; electrical appliances, 11%; cooking, 6%; and air conditioning, 3% (its share has more than doubled since 2000). In 2016, the shares were in line with those of the EU28.
From 2000 to 2015, energy consumption grew by 18%, at +1.1% per year, with an increas-ing trend in certain end uses: +1.4% per year for space heating, +1.3% per year for cooking, and +8.3% per year for air cooling. Energy consumption for water heating and electrical appliances remained rather stable (-0.1% per year). The percentage distributions of end-use consumption remained practically constant over the last 10 years (ODYSSEE-MURE, 2015a).
Considering the primary role of energy consumption for space heating, we report the 2016 distribution of this type of end use in the residential sector in terms of share of fuels (Eurostat, 2016b, Table 4). Space heating uses primarily gas (60%), followed by renewables and waste (26.9%), oil and petroleum products (8.2%), derived heat (3.8%), and electricity (0.4%). At the EU28 level, these shares are quite different: heating needs are satisfied by a much lower quota of gas (43.4%), compensated by higher quotas of electricity, derived heat, solid fuel, and oil (5.6%, 9.2%, 4.8%, and 14.8%, respectively).
Gas was the primary fuel for heating water in the residential sector in 2016 as well, with a 65.5% share (Eurostat, 2016b, Table 5). Other fuels for heating water were electricity (13.6%), renewables and waste (9.6%), and oil (8.1%).10
Cooking in Italy (Eurostat, 2016b, Table 6) also uses a massive amount of gas (70.1%), fol-lowed far behind by electricity (15.5%). The respective shares of fuels for cooking in the EU28 are completely different, the major fuel being electricity (49% share), followed by a much lower share of gas (33.1%).
3.5. Energy classes of buildings
The energy certificate index indicates how much energy is consumed in a building (or dwelling) to meet comfort levels according to the energy services accounted for in such a building. Law DM 26-6-2015 defines the guidelines for energy certificate schemes (Certificato-Energetico.it, 2018). EE is measured according to the non-RES global energy performance index (EPgl,nren) – also improperly called the energy performance index (indice di prestazione energetica) – which, for residential buildings, includes winter heating systems, summer cooling systems, warm water production, and ventilation. Computations can be carried out by accredited engineers either in a
9 This casts doubts on the evaluation of the energy consumption in Italy at the EU-average climate, unless the shares of end-use types of consumption are not dramatically affected by climate (e.g. northern countries not only need more heating but also more lighting).
10 As in the case of space heating, for water heating, Italy uses more gas and less electricity and derived heat than the other EU28 countries, with respective shares of 47.9%, 19.3%, and 11.1% for these fuel types among the EU28.
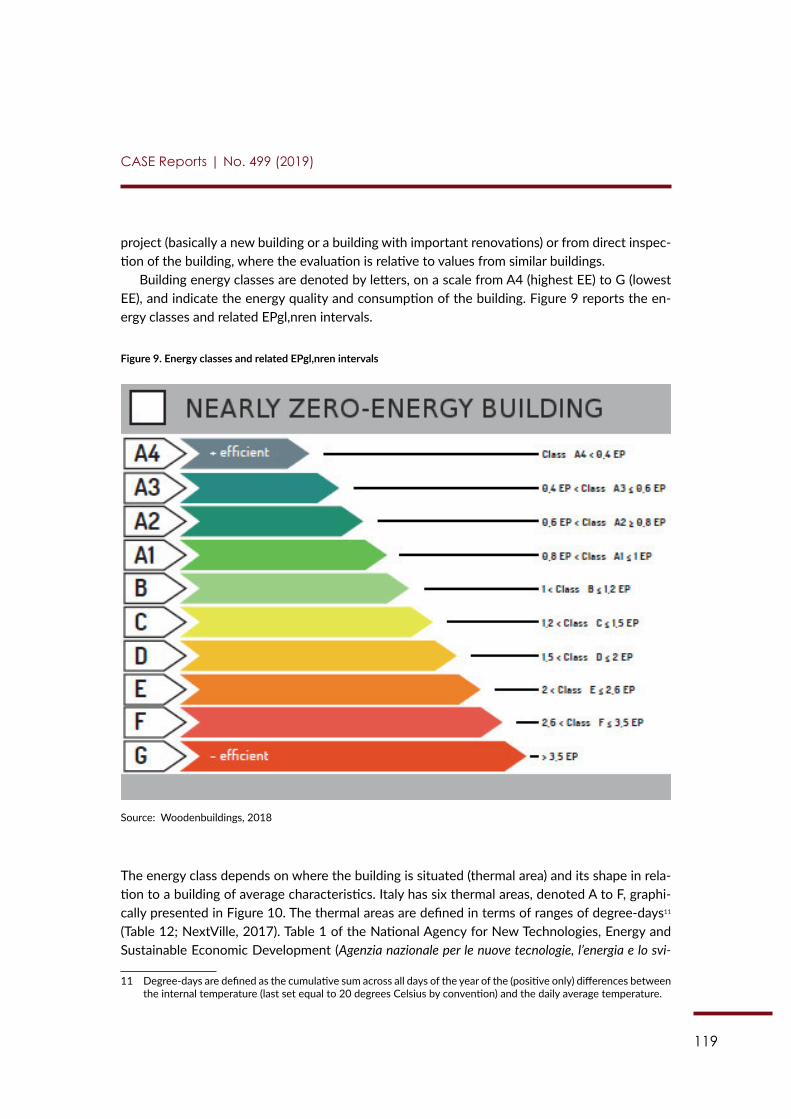
119
CASE Reports | No. 499 (2019)
project (basically a new building or a building with important renovations) or from direct inspec-tion of the building, where the evaluation is relative to values from similar buildings.
Building energy classes are denoted by letters, on a scale from A4 (highest EE) to G (lowest EE), and indicate the energy quality and consumption of the building. Figure 9 reports the en-ergy classes and related EPgl,nren intervals.
Figure 9. Energy classes and related EPgl,nren intervals
Source: Woodenbuildings, 2018
The energy class depends on where the building is situated (thermal area) and its shape in rela-tion to a building of average characteristics. Italy has six thermal areas, denoted A to F, graphi-cally presented in Figure 10. The thermal areas are defined in terms of ranges of degree-days11 (Table 12; NextVille, 2017). Table 1 of the National Agency for New Technologies, Energy and Sustainable Economic Development (Agenzia nazionale per le nuove tecnologie, l’energia e lo svi-
11 Degree-days are defined as the cumulative sum across all days of the year of the (positive only) differences between the internal temperature (last set equal to 20 degrees Celsius by convention) and the daily average temperature.
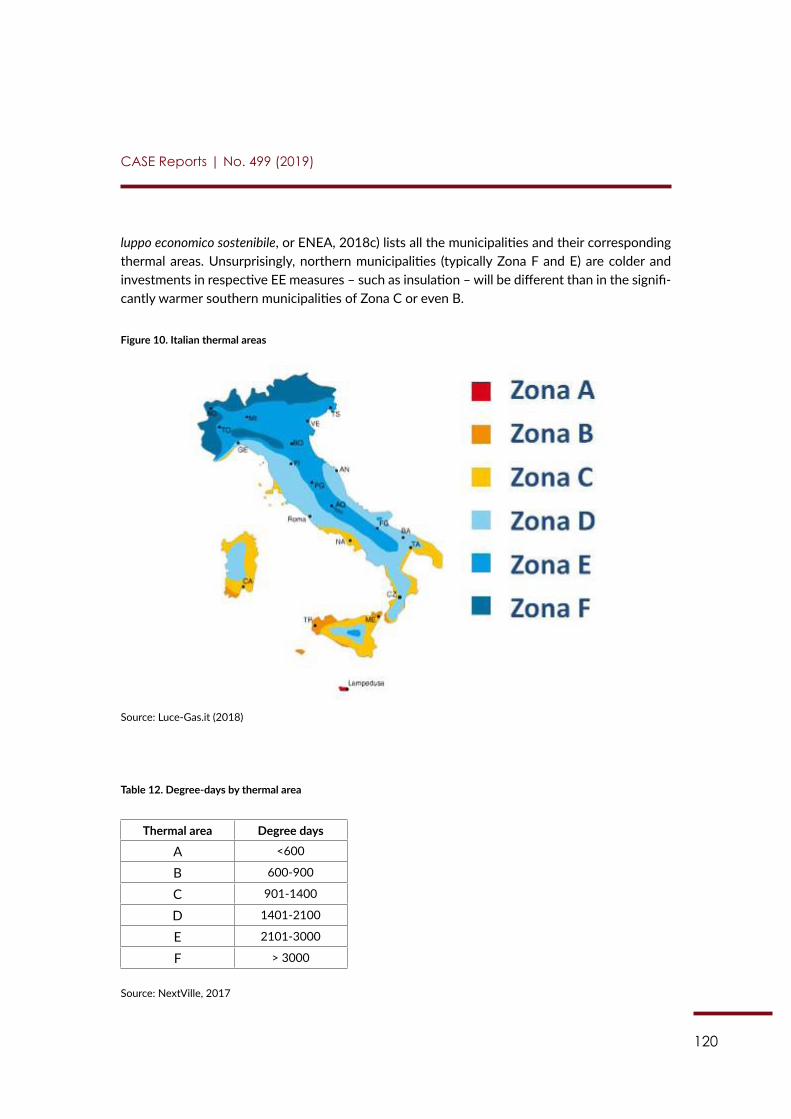
120
CASE Reports | No. 499 (2019)
luppo economico sostenibile, or ENEA, 2018c) lists all the municipalities and their corresponding thermal areas. Unsurprisingly, northern municipalities (typically Zona F and E) are colder and investments in respective EE measures – such as insulation – will be different than in the signifi-cantly warmer southern municipalities of Zona C or even B.
Figure 10. Italian thermal areas
Source: Luce-Gas.it (2018)
Table 12. Degree-days by thermal area
Thermal area Degree days
A <600
B 600-900
C 901-1400
D 1401-2100
E 2101-3000
F > 3000
Source: NextVille, 2017
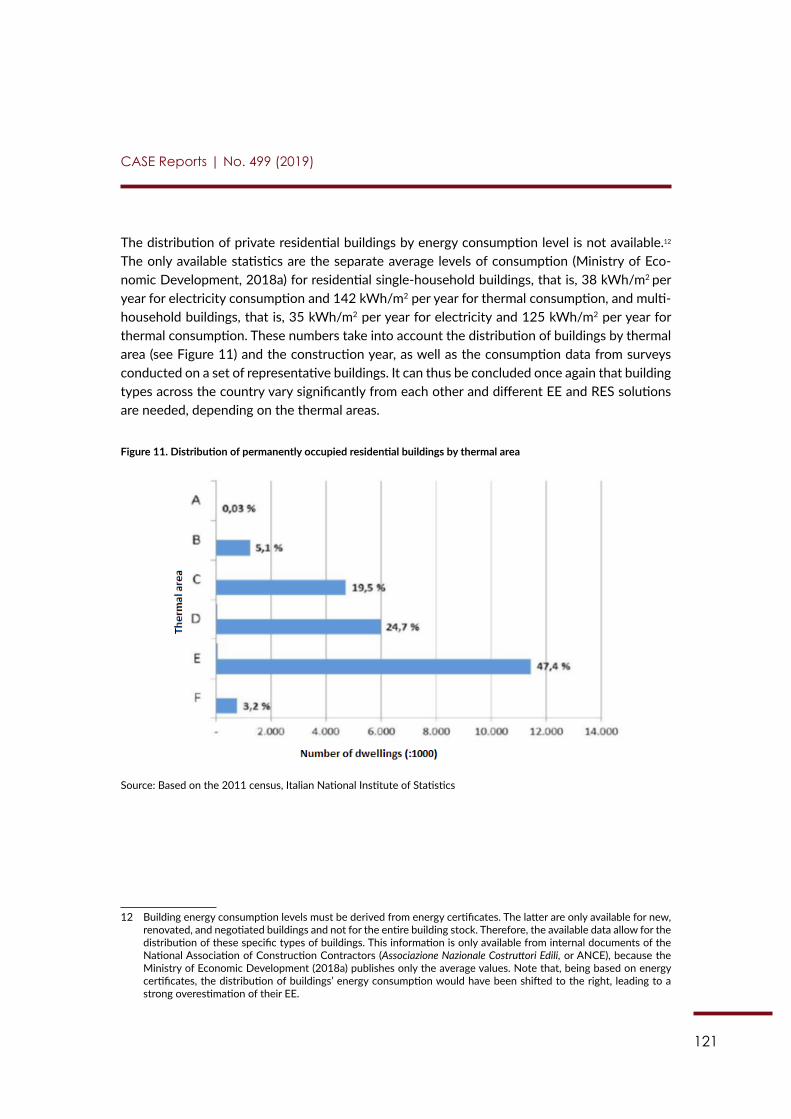
121
CASE Reports | No. 499 (2019)
The distribution of private residential buildings by energy consumption level is not available.12 The only available statistics are the separate average levels of consumption (Ministry of Eco-nomic Development, 2018a) for residential single-household buildings, that is, 38 kWh/m2 per year for electricity consumption and 142 kWh/m2 per year for thermal consumption, and multi-household buildings, that is, 35 kWh/m2 per year for electricity and 125 kWh/m2 per year for thermal consumption. These numbers take into account the distribution of buildings by thermal area (see Figure 11) and the construction year, as well as the consumption data from surveys conducted on a set of representative buildings. It can thus be concluded once again that building types across the country vary significantly from each other and different EE and RES solutions are needed, depending on the thermal areas.
Figure 11. Distribution of permanently occupied residential buildings by thermal area
Source: Based on the 2011 census, Italian National Institute of Statistics
12 Building energy consumption levels must be derived from energy certificates. The latter are only available for new, renovated, and negotiated buildings and not for the entire building stock. Therefore, the available data allow for the distribution of these specific types of buildings. This information is only available from internal documents of the National Association of Construction Contractors (Associazione Nazionale Costruttori Edili, or ANCE), because the Ministry of Economic Development (2018a) publishes only the average values. Note that, being based on energy certificates, the distribution of buildings’ energy consumption would have been shifted to the right, leading to a strong overestimation of their EE.
122
CASE Reports | No. 499 (2019)
3.6. Energy prices for households
Eurostat (2018b) provides an overview of average electricity prices in EUR per kilowatt-hour (EUR/kWh) for the last three years (2016 through 2018), where the first semester of each year is considered to avoid a seasonal effect. Data from Eurostat on household consumers are gross of taxes, levies, and value added tax (VAT) and refer to medium-sized consumers, defined as having an annual consumption of 2,500-5,000 kWh. Eurostat shows that the price of electricity in Italy declined from 0.2342 EUR/kWh in 2016 to 0.2132 EUR/kWh in 2017 and to 0.2067 EUR/kWh in 2018. However, these prices still remained higher than in the rest of the EU28. Excluding the VAT and other recoverable taxes and levies, a declining trend is still noted, with 0.2129 EUR/kWh in 2016, 0.1934 EUR/kWh in 2017, and 0.1873 EUR/kWh in 2018. If we exclude taxes and levies from the price, they shrink further to 0.1376 EUR/kWh, 0.1322 EUR/kWh, and 0.1285 EUR/kWh, respectively. In the first semester of 2018, Italy was among the EU countries with the highest electricity prices. This is because of the high level of taxation, which, in the first semester of 2018, was about 37.8% of the total gross price of electricity. However, a similar taxation share applies to the EU28 as a whole.
A simple way to understand and compare the prices of electricity is to measure how much one pays to power a light bulb. Eurostat (2017) reports the price for lighting a 10W light bulb for three hours a day. In Europe, the annual cost of powering such a light bulb is equal to EUR 2.04, which is fairly high; Italy is among only seven countries paying more than the EU average, EUR 2.14, with taxes accounting for 38% of the total cost.
As for household gas prices, in the first half on 2018, these were closer to the EU average: EUR 0.07 per kWh (with an EU average of EUR 0.06 per kWh).13
3.7. Type of EE/RES investments currently developed14
The Fourth National Energy Efficiency Action Plan, submitted in 2017, established the final end-use energy-saving target of 15.5 Mtoe, to be reached in 2020. In response, the Ministry of Eco-nomic Development introduced a set of incentives to improve EE, directed to either households, firms, or public administration.15,16 The two most relevant household-directed interventions are 1) a tax deduction scheme called Bonus Casa, which encompasses Ecobonus, Sismabonus, a renovation bonus, and a furniture and electrical appliance bonus, and 2) the Thermal Account (Conto Termico 2.0) scheme.
13 For more information see: https://ec.europa.eu/eurostat/statistics-explained/index.php/Natural_gas_price_statis-tics
14 This section presents the most recent insights on trends in EE and RES investments. Further and more general policy objectives are covered in Chapter 5.
15 Electricity or natural gas distributors with more than 50,000 customers must show energy savings either directly, through projects providing EE, or indirectly, by buying “White Certificates”. These White Certificates, or EE bonds, are negotiable bonds that certify the energy savings obtained in the final use of energy.
16 A summary of these policies is available at http://www.measures-odyssee-mure.eu/topics-energy-efficiency-poli-cy.asp.
123
CASE Reports | No. 499 (2019)
Law 145/2018 renewed the pre-existing Ecobonus (ENEA, 2018b), which allows tax de-ductions for both a) expenses through 31 December 2019 for renovations concerning single dwellings/properties and b) expenses through 31 December 2021 for improvements concerning common parts of buildings.
For single dwellings, the deductions depend on the type of intervention, with the aim of linking the economic incentive as strongly as possible to energy savings. Details on the types of interventions that benefit of this scheme are reported below. For interventions on common parts of condominium buildings, a 70% deduction rate has been confirmed in the case of inter-ventions that involve at least 25% of the building envelope and a deduction of 75% has been established for interventions improving winter and summer energy performance. More details on fiscal deductions concerning common parts of condominium buildings are reported below.
Thermal Account 2.0 (Law 16 February 2016) is a financing mechanism to which private citizens can subscribe with the aim of sustaining improvements in EE through the production of thermal energy from RES and highly efficient systems (in addition to firms and public admin-istration, which should aim at improving the EE of existing buildings). The total fund amounts to EUR 900 million yearly, 700 of which is dedicated to projects from private citizens and firms while the residual is allocated to the public administration. Access to financing mechanisms can be requested to the Energy Service Manager (Gestore Servizi Energetici s.p.a., ESM) either directly or indirectly by means of an energy service company (ESCO). There are two types of projects addressed to the private sector: a) the replacement of existing heating systems with RES gen-erators (e.g. heat pumps; biomass boilers and stoves; or heat pump hybrid systems) and b) the installation of solar thermal systems also combined with solar cooling systems. The amount of the incentive and the maximum incentive which can be requested depend on the specific type of intervention. Funding should be requested through the online portal (PortalTermico) within 60 days from the conclusion of the intervention. Since the start of Thermal Account 2.0, there have been 181,000 requests (81% are already accepted), for a total of 119 EUR million, with 43% from the private sector. Although it is a successful initiative, the budget is rather limited leaving space for potential synergies with the EuroPACE mechanism. The most up-to-date numbers of interventions by type and by beneficiary are reported in detail in the ESM website (see Gestore Servizi Energetici, 2019).
Concerning RES,17 from 1 January 2018, thermal energy installations in new or renovated buildings must satisfy criteria of a RES share of 50% of warm water consumption and a share of 50% the sum of warm water, heating, and cooling consumption. These requirements are not considered satisfied if the new installations only produce electricity that, in turn, is used for warm water, heating, and cooling consumption. For construction permits requested before the end of 2017, the share of thermal energy consumption covered by RES must be at least 35%.
The above-mentioned requirements do not apply if the building is linked to district heating (teleriscaldamento; see Iren, 2018). District heating is a system that transports heat, through a
17 Law 28/2011 defines RE as energy derived from non-fossil sources, namely, wind, including small wind systems, solar and photovoltaic systems, air thermal systems, hydrothermal systems, biomass, geothermal systems, oceans, dump gas, and gas from purification plants.
124
CASE Reports | No. 499 (2019)
network of tubes of lukewarm water, from power stations or industrial plants to urban environ-ments such as houses and buildings, to be used either directly or indirectly after being warmed up by local boilers or co-generators. This type of house heating system drastically reduces CO2 emissions.
There exist a variety of small wind systems that households can install for the home. If the system’s power is between 20 kW and 200 kW, the household can benefit from two incentive systems. The first, the “omni-comprehensive tariff”, guarantees to the energy producer a revenue of EUR 0.30 for each kWh imputed into the network for 15 years. At the end of this period, the producer can either opt for the free market or ask the distributor for a “dedicated withdrawal”, characterised by favourable tariffs. The second incentive system is an exchange mechanism ac-cording to which the amount to pay the distributor equals the difference between the electricity consumed and that produced. The balance is computed quarterly: if it is negative it is charged on the electricity bill, if positive it gives a credit for future bills. The omni-comprehensive tariff is relatively more convenient than the exchange mechanism for high levels of energy production.
In order to be established, this “feed-in tariff” scheme requires a credible party (in this case the government) that commits to buy the energy output under certain conditions at a fixed price (0.30EUR/kWh) for a certain period (15 years). To finance that, the government uses its own resources or can issue bonds that are linked to the programme. An opportunity for EuroPACE could lay in the fact that these types of schemes insure the viability of the investments but do not provide the initial capital. Therefore, a blending with EuroPACE could boost both instruments.
In 2017, 8.7% of total national electricity was derived from photovoltaic panels (REN21, 2018). The report shows that Italy is among the top five countries for cumulative capacity after China, the US, Japan, and Germany. It is in the fourth position for per capita cumulative capacity. With respect to 2016, the new capacity increased by 29%, reaching a value of 98 GW. As we will see later, the Ecobonus approved by Law 205/2017 (as well as the previous Ecobonus) allows for a deduction of 65% of the cost of thermal solar collectors and 50% in the case of solar photo-voltaic panels. Moreover, the total of all dwelling renovations qualifies for a fiscal bonus. Among the renovations eligible for a fiscal rebate are those providing an improvement of EE by means of the installation of photovoltaic/thermal solar systems. What is more, some banks (like Unicredit) are already gearing up to launch green loans that can be coupled with the Ecobonus. EuroPACE could do this in a more effective way, considering that the loan would not be an unsecure one.
When it comes to Ecobonus, about 1.5 million actions concerning 65% fiscal deductions were implemented in 2014-2017, of which 420,000 were in 2017 (ENEA, 2018a,b). That year, more than half of the interventions concerned changes in windows and shutters, 20% replacements of space heating systems, and the same percentage concerned solar shading interventions. In-vestments show an increasing trend: over 3.3 million projects have been carried out since the starting year 2007, with energy savings of 1.31 Mtoe per year. The Ecobonus represents thus the big success story of the Italian policy in EE and RES. Originating 1.5 million actions in three years is a massive result, but also indicates that this mechanism could be boosted and amplified in scope with EuroPACE. Table 13 shows the details of the energy savings by type of interven-tion, revealing an increasing trend, with savings of 0.112 Mtoe per year in 2017 (ENEA, 2018a).
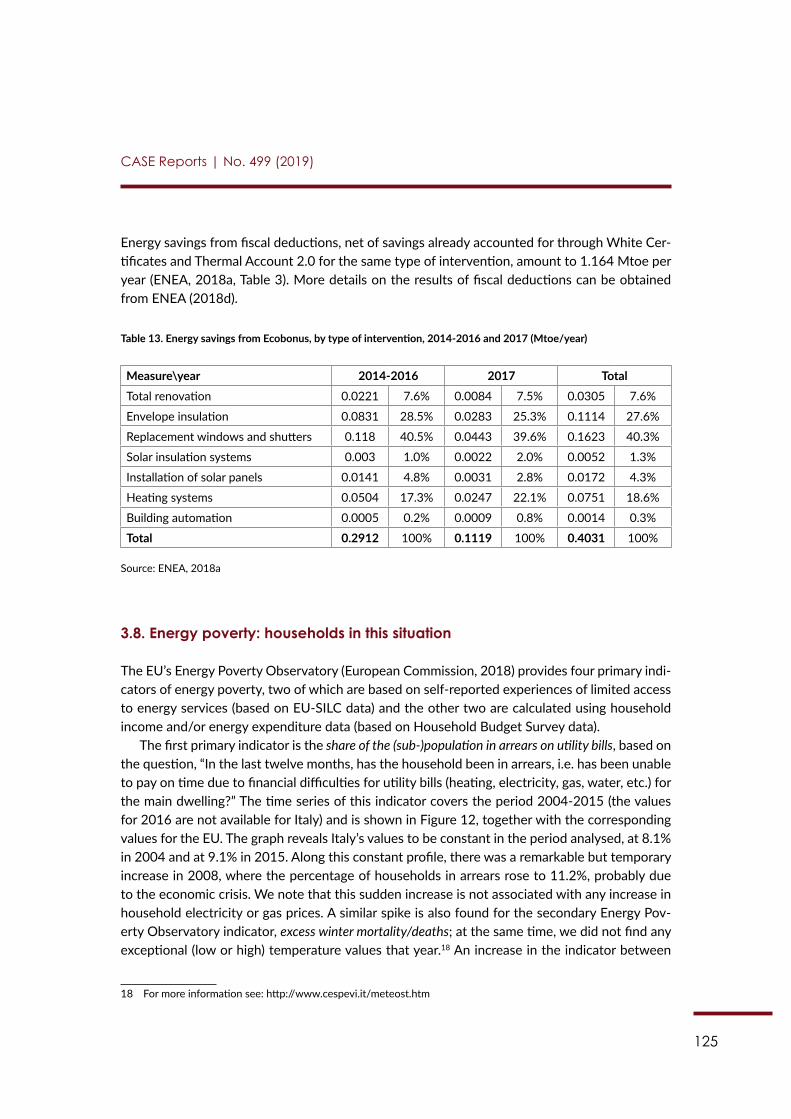
125
CASE Reports | No. 499 (2019)
Energy savings from fiscal deductions, net of savings already accounted for through White Cer-tificates and Thermal Account 2.0 for the same type of intervention, amount to 1.164 Mtoe per year (ENEA, 2018a, Table 3). More details on the results of fiscal deductions can be obtained from ENEA (2018d).
Table 13. Energy savings from Ecobonus, by type of intervention, 2014-2016 and 2017 (Mtoe/year)
Measure\year 2014-2016 2017 TotalTotal renovation 0.0221 7.6% 0.0084 7.5% 0.0305 7.6%
Envelope insulation 0.0831 28.5% 0.0283 25.3% 0.1114 27.6%
Replacement windows and shutters 0.118 40.5% 0.0443 39.6% 0.1623 40.3%
Solar insulation systems 0.003 1.0% 0.0022 2.0% 0.0052 1.3%
Installation of solar panels 0.0141 4.8% 0.0031 2.8% 0.0172 4.3%
Heating systems 0.0504 17.3% 0.0247 22.1% 0.0751 18.6%
Building automation 0.0005 0.2% 0.0009 0.8% 0.0014 0.3%
Total 0.2912 100% 0.1119 100% 0.4031 100%
Source: ENEA, 2018a
3.8. Energy poverty: households in this situation
The EU’s Energy Poverty Observatory (European Commission, 2018) provides four primary indi-cators of energy poverty, two of which are based on self-reported experiences of limited access to energy services (based on EU-SILC data) and the other two are calculated using household income and/or energy expenditure data (based on Household Budget Survey data).
The first primary indicator is the share of the (sub-)population in arrears on utility bills, based on the question, “In the last twelve months, has the household been in arrears, i.e. has been unable to pay on time due to financial difficulties for utility bills (heating, electricity, gas, water, etc.) for the main dwelling?” The time series of this indicator covers the period 2004-2015 (the values for 2016 are not available for Italy) and is shown in Figure 12, together with the corresponding values for the EU. The graph reveals Italy’s values to be constant in the period analysed, at 8.1% in 2004 and at 9.1% in 2015. Along this constant profile, there was a remarkable but temporary increase in 2008, where the percentage of households in arrears rose to 11.2%, probably due to the economic crisis. We note that this sudden increase is not associated with any increase in household electricity or gas prices. A similar spike is also found for the secondary Energy Pov-erty Observatory indicator, excess winter mortality/deaths; at the same time, we did not find any exceptional (low or high) temperature values that year.18 An increase in the indicator between
18 For more information see: http://www.cespevi.it/meteost.htm
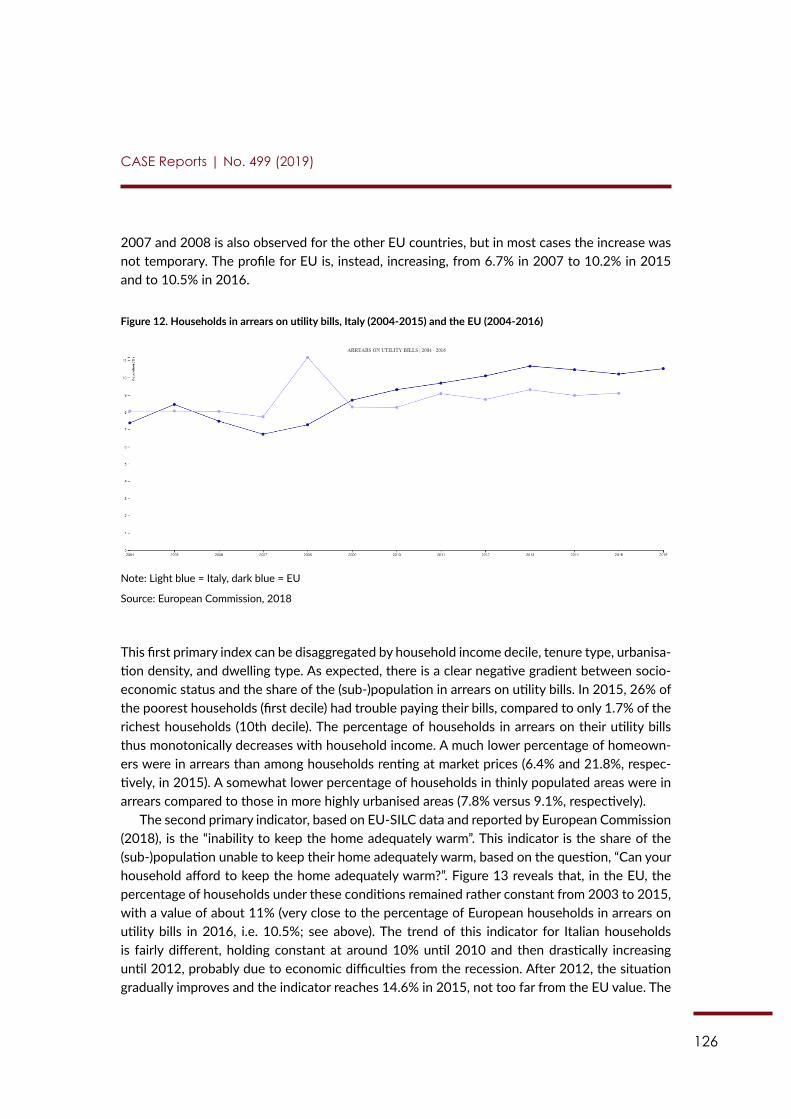
126
CASE Reports | No. 499 (2019)
2007 and 2008 is also observed for the other EU countries, but in most cases the increase was not temporary. The profile for EU is, instead, increasing, from 6.7% in 2007 to 10.2% in 2015 and to 10.5% in 2016.
Figure 12. Households in arrears on utility bills, Italy (2004-2015) and the EU (2004-2016)
Note: Light blue = Italy, dark blue = EU
Source: European Commission, 2018
This first primary index can be disaggregated by household income decile, tenure type, urbanisa-tion density, and dwelling type. As expected, there is a clear negative gradient between socio-economic status and the share of the (sub-)population in arrears on utility bills. In 2015, 26% of the poorest households (first decile) had trouble paying their bills, compared to only 1.7% of the richest households (10th decile). The percentage of households in arrears on their utility bills thus monotonically decreases with household income. A much lower percentage of homeown-ers were in arrears than among households renting at market prices (6.4% and 21.8%, respec-tively, in 2015). A somewhat lower percentage of households in thinly populated areas were in arrears compared to those in more highly urbanised areas (7.8% versus 9.1%, respectively).
The second primary indicator, based on EU-SILC data and reported by European Commission (2018), is the “inability to keep the home adequately warm”. This indicator is the share of the (sub-)population unable to keep their home adequately warm, based on the question, “Can your household afford to keep the home adequately warm?”. Figure 13 reveals that, in the EU, the percentage of households under these conditions remained rather constant from 2003 to 2015, with a value of about 11% (very close to the percentage of European households in arrears on utility bills in 2016, i.e. 10.5%; see above). The trend of this indicator for Italian households is fairly different, holding constant at around 10% until 2010 and then drastically increasing until 2012, probably due to economic difficulties from the recession. After 2012, the situation gradually improves and the indicator reaches 14.6% in 2015, not too far from the EU value. The
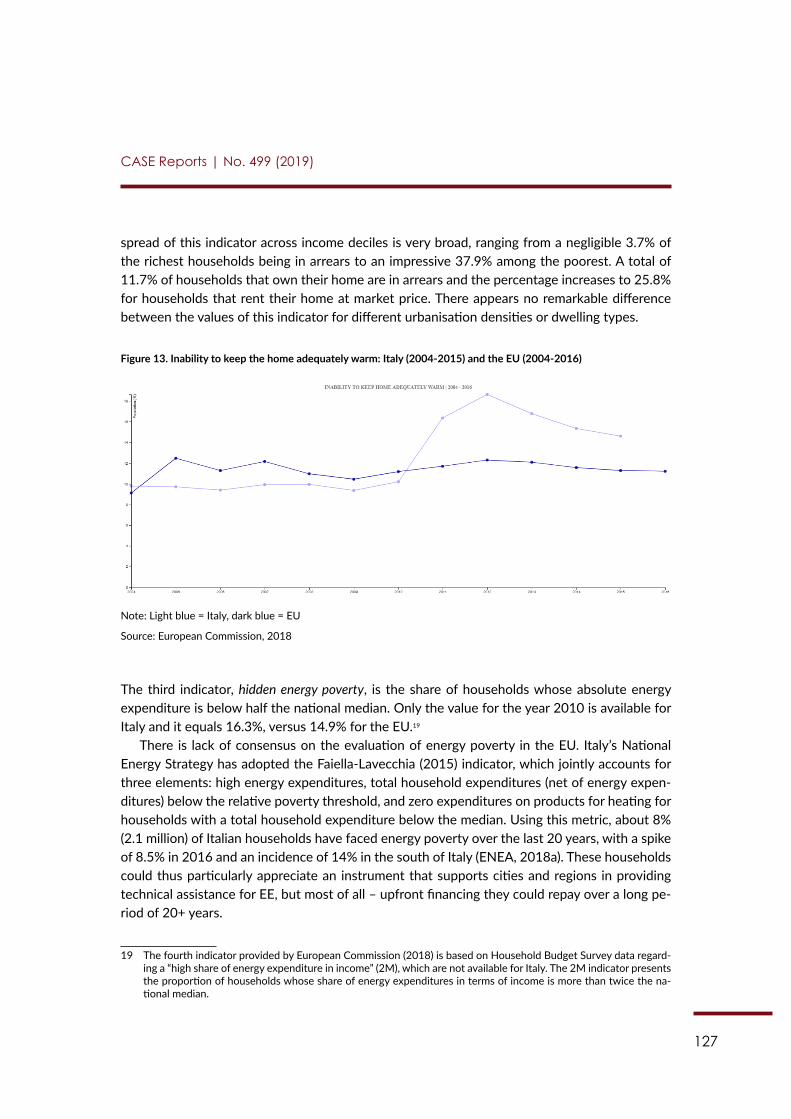
127
CASE Reports | No. 499 (2019)
spread of this indicator across income deciles is very broad, ranging from a negligible 3.7% of the richest households being in arrears to an impressive 37.9% among the poorest. A total of 11.7% of households that own their home are in arrears and the percentage increases to 25.8% for households that rent their home at market price. There appears no remarkable difference between the values of this indicator for different urbanisation densities or dwelling types.
Figure 13. Inability to keep the home adequately warm: Italy (2004-2015) and the EU (2004-2016)
Note: Light blue = Italy, dark blue = EU
Source: European Commission, 2018
The third indicator, hidden energy poverty, is the share of households whose absolute energy expenditure is below half the national median. Only the value for the year 2010 is available for Italy and it equals 16.3%, versus 14.9% for the EU.19
There is lack of consensus on the evaluation of energy poverty in the EU. Italy’s National Energy Strategy has adopted the Faiella-Lavecchia (2015) indicator, which jointly accounts for three elements: high energy expenditures, total household expenditures (net of energy expen-ditures) below the relative poverty threshold, and zero expenditures on products for heating for households with a total household expenditure below the median. Using this metric, about 8% (2.1 million) of Italian households have faced energy poverty over the last 20 years, with a spike of 8.5% in 2016 and an incidence of 14% in the south of Italy (ENEA, 2018a). These households could thus particularly appreciate an instrument that supports cities and regions in providing technical assistance for EE, but most of all – upfront financing they could repay over a long pe-riod of 20+ years.
19 The fourth indicator provided by European Commission (2018) is based on Household Budget Survey data regard-ing a “high share of energy expenditure in income” (2M), which are not available for Italy. The 2M indicator presents the proportion of households whose share of energy expenditures in terms of income is more than twice the na-tional median.
128
CASE Reports | No. 499 (2019)
Chapter 4: Barriers to the development of EE/RES potential in private buildings
4.1. Institutional barriers
Much has already been written about financial barriers or the split incentive issue. While in terms of overcoming financial barriers, great progress has been made (as confirmed in following Chapter 5), institutional barriers in the Italian market are still quite peculiar as they are strictly related to other typical barriers in developing EE or RES elsewhere, predominantly to lack of awareness both in institutions itself and in the knowledge they share with citizens. Thus far, public policies to raise awareness about energy savings and EE have been based mainly on incentives of a financial nature, which is good motivation to achieve the set of objectives; how-ever, when these incentives end, both the motivation of consumers and the persistence of the message are drastically reduced (De Groot and Steg, 2007; van der Linden et al., 2015). In recent years, such evidence has pushed Italian policymakers to experiment with policies that focus on an approach that combines economic incentives with environmental motivations and that lever-ages a sense of community (ENEA, 2018a).
In many cases, the message has been negative and extremely pessimistic, and, in most cases, the identified target considered the impact related to the nonrational use of energy a non-urgent and psychologically distant risk. The message, therefore, must be carefully selected and kept as simple as possible. Keywords to use are entertain, involve, integrate, and educate (COP-mas, 2015). Once basic awareness is achieved, the second step is to provide targeted informa-tion on potential EE measures. It is therefore essential to understand and study the selected target. In addition to the social component, policy guidelines, lessons learned, and examples focusing on key psychological principles should be encouraged, which can guide the design and implementation of effective information and training measures for EE and related environmental impacts. For EuroPACE, this could mean enhanced education on significantly lowered energy bills thanks to EE and RES investments.
This would be in accordance with the three-year Information and Training Programme (ITP), foreseen by Legislative Decree 102/2014, representing an optimal tool to accelerate the behav-ioural changes necessary to reach the programmed EE objectives. In designing and implement-ing the second year of the three-year ITP, the following communication obstacles have been identified: 1) distance from the problem, 2) catastrophes (these types of messages are effective in the short run but unsustainable in the long run), 3) cognitive dissonance (which occurs when the attraction of end users to the comforts of everyday life conflicts with beliefs on a given topic, e.g. climate change), 4) denial of the problem (defence mechanisms, e.g. rejecting the existence of environmental problems or climate change), and 5) identity and convictions (people search for information that aligns with their own beliefs).
In the second year of the three-year ITP, the best means to implement an effective strat-egy of communication on EE are characterised by four macro projects specific to single targets
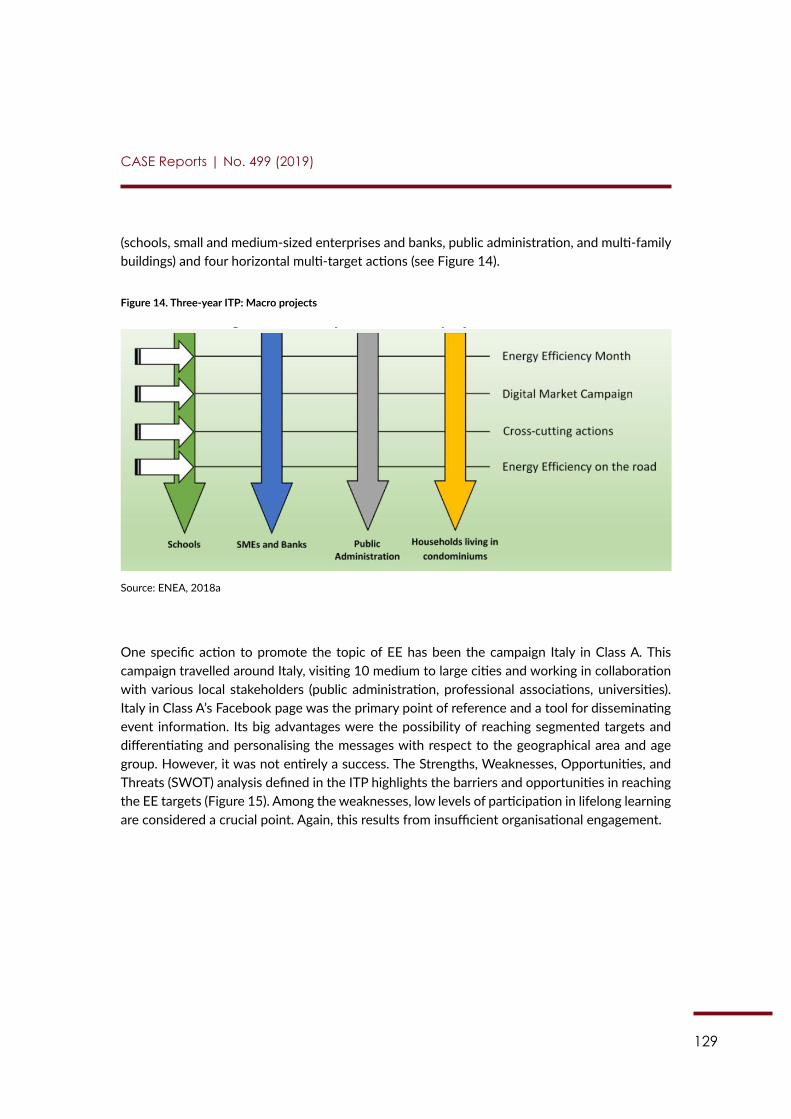
129
CASE Reports | No. 499 (2019)
(schools, small and medium-sized enterprises and banks, public administration, and multi-family buildings) and four horizontal multi-target actions (see Figure 14).
Figure 14. Three-year ITP: Macro projects
108
2007; van der Linden et al., 2015). In recent years, such evidence has pushed Italian policymakers to experiment with policies that focus on an approach that combines economic incentives with environmental motivations and that leverages a sense of community (ENEA, 2018a).
In many cases, the message has been negative and extremely pessimistic, and, in most cases, the identified target considered the impact related to the nonrational use of energy a non-urgent and psychologically distant risk. The message, therefore, must be carefully selected and kept as simple as possible. Keywords to use are entertain, involve, integrate, and educate (COPmas, 2015). Once basic awareness is achieved, the second step is to provide targeted information on potential EE measures. It is therefore essential to understand and study the selected target. In addition to the social component, policy guidelines, lessons learned, and examples focusing on key psychological principles should be encouraged, which can guide the design and implementation of effective information and training measures for EE and related environmental impacts. For EuroPACE, this could mean enhanced education on significantly lowered energy bills thanks to EE and RES investments.
This would be in accordance with the three-year Information and Training Programme (ITP), foreseen by Legislative Decree 102/2014, representing an optimal tool to accelerate the behavioural changes necessary to reach the programmed EE objectives. In designing and implementing the second year of the three-year ITP, the following communication obstacles have been identified: 1) distance from the problem, 2) catastrophes (these types of messages are effective in the short run but unsustainable in the long run), 3) cognitive dissonance (which occurs when the attraction of end users to the comforts of everyday life conflicts with beliefs on a given topic, e.g. climate change), 4) denial of the problem (defence mechanisms, e.g. rejecting the existence of environmental problems or climate change), and 5) identity and convictions (people search for information that aligns with their own beliefs).
In the second year of the three-year ITP, the best means to implement an effective strategy of communication on EE are characterised by four macro projects specific to single targets (schools, small and medium-sized enterprises and banks, public administration, and multi-family buildings) and four horizontal multi-target actions (see Figure 14).
Figure 14. Three-year ITP: Macro projects
Source: ENEA, 2018a
One specific action to promote the topic of EE has been the campaign Italy in Class A. This campaign travelled around Italy, visiting 10 medium to large cities and working in collaboration with various local stakeholders (public administration, professional associations, universities). Italy in Class A’s Facebook page was the primary point of reference and a tool for disseminating event information. Its big advantages were the possibility of reaching segmented targets and differentiating and personalising the
Source: ENEA, 2018a
One specific action to promote the topic of EE has been the campaign Italy in Class A. This campaign travelled around Italy, visiting 10 medium to large cities and working in collaboration with various local stakeholders (public administration, professional associations, universities). Italy in Class A’s Facebook page was the primary point of reference and a tool for disseminating event information. Its big advantages were the possibility of reaching segmented targets and differentiating and personalising the messages with respect to the geographical area and age group. However, it was not entirely a success. The Strengths, Weaknesses, Opportunities, and Threats (SWOT) analysis defined in the ITP highlights the barriers and opportunities in reaching the EE targets (Figure 15). Among the weaknesses, low levels of participation in lifelong learning are considered a crucial point. Again, this results from insufficient organisational engagement.
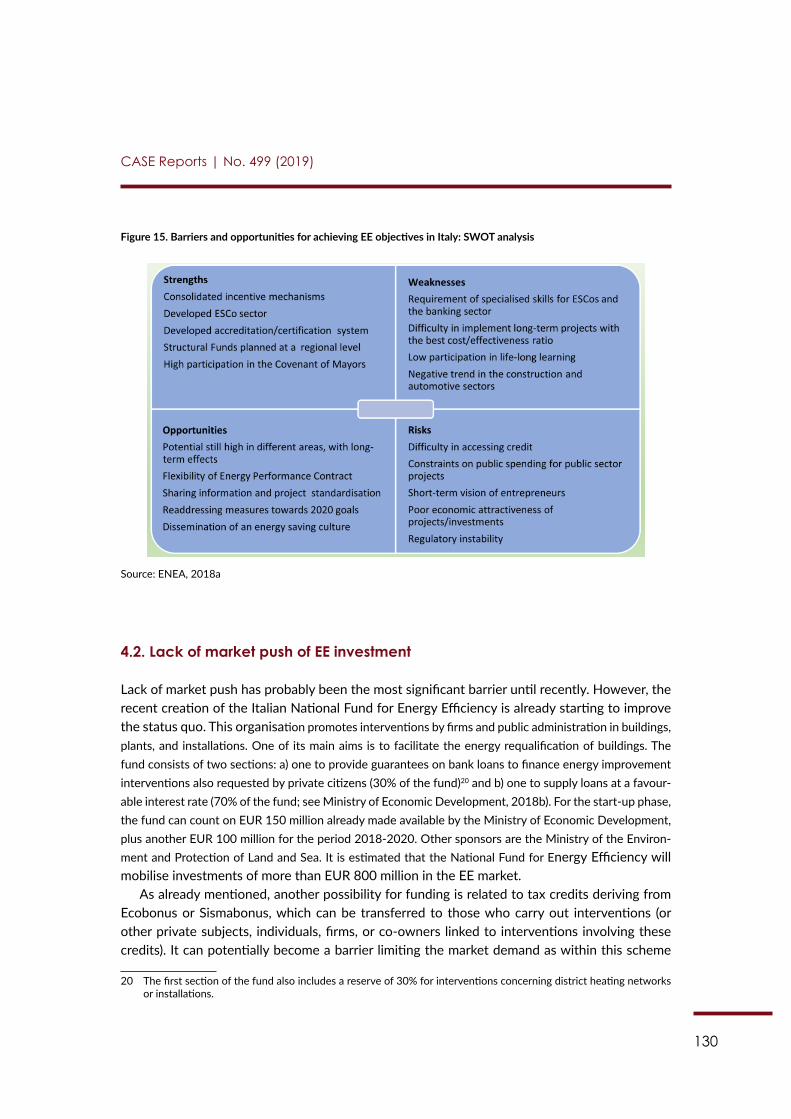
130
CASE Reports | No. 499 (2019)
Figure 15. Barriers and opportunities for achieving EE objectives in Italy: SWOT analysis
109
messages with respect to the geographical area and age group. However, it was not entirely a success. The Strengths, Weaknesses, Opportunities, and Threats (SWOT) analysis defined in the ITP highlights the barriers and opportunities in reaching the EE targets (Figure 15). Among the weaknesses, low levels of participation in lifelong learning are considered a crucial point. Again, this results from insufficient organisational engagement.
Figure 15. Barriers and opportunities for achieving EE objectives in Italy: SWOT analysis
Source: ENEA, 2018a
4.2. Lack of market push of EE investment
Lack of market push has probably been the most significant barrier until recently. However, the recent creation of the Italian National Fund for Energy Efficiency is already starting to improve the status quo. This organisation promotes interventions by firms and public administration in buildings, plants, and installations. One of its main aims is to facilitate the energy requalification of buildings. The fund consists of two sections: a) one to provide guarantees on bank loans to finance energy improvement interventions also requested by private citizens (30% of the fund)196 and b) one to supply loans at a favourable interest rate (70% of the fund; see Ministry of Economic Development, 2018b). For the start-up phase, the fund can count on EUR 150 million already made available by the Ministry of Economic Development, plus another EUR 100 million for the period 2018-2020. Other sponsors are the Ministry of the Environment and Protection of Land and Sea. It is estimated that the National Fund for Energy Efficiency will mobilise investments of more than EUR 800 million in the EE market.
As already mentioned, another possibility for funding is related to tax credits deriving from Ecobonus or Sismabonus, which can be transferred to those who carry out interventions (or other private subjects, individuals, firms, or co-owners linked to interventions involving these credits). It can potentially become a barrier limiting the market demand as within this scheme individuals obtain an immediate discount (e.g. of 65%) on the price they would otherwise have paid for the intervention. Therefore, this scheme facilitates EE interventions for subjects with insufficient funds, but it also “spoils” the residents. Second, it provides tax credit benefits to those who do not pay taxes. What is more, individuals who do not pay
196 The first section of the fund also includes a reserve of 30% for interventions concerning district heating networks or installations.
Source: ENEA, 2018a
4.2. Lack of market push of EE investment
Lack of market push has probably been the most significant barrier until recently. However, the recent creation of the Italian National Fund for Energy Efficiency is already starting to improve the status quo. This organisation promotes interventions by firms and public administration in buildings, plants, and installations. One of its main aims is to facilitate the energy requalification of buildings. The fund consists of two sections: a) one to provide guarantees on bank loans to finance energy improvement interventions also requested by private citizens (30% of the fund)20 and b) one to supply loans at a favour-able interest rate (70% of the fund; see Ministry of Economic Development, 2018b). For the start-up phase, the fund can count on EUR 150 million already made available by the Ministry of Economic Development, plus another EUR 100 million for the period 2018-2020. Other sponsors are the Ministry of the Environ-ment and Protection of Land and Sea. It is estimated that the National Fund for Energy Efficiency will mobilise investments of more than EUR 800 million in the EE market.
As already mentioned, another possibility for funding is related to tax credits deriving from Ecobonus or Sismabonus, which can be transferred to those who carry out interventions (or other private subjects, individuals, firms, or co-owners linked to interventions involving these credits). It can potentially become a barrier limiting the market demand as within this scheme
20 The first section of the fund also includes a reserve of 30% for interventions concerning district heating networks or installations.
131
CASE Reports | No. 499 (2019)
individuals obtain an immediate discount (e.g. of 65%) on the price they would otherwise have paid for the intervention. Therefore, this scheme facilitates EE interventions for subjects with insufficient funds, but it also “spoils” the residents. Second, it provides tax credit benefits to those who do not pay taxes. What is more, individuals who do not pay income taxes – and thus cannot benefit from the credit – are also allowed to transfer their credits to banks or financial institutions.21 However, all these are very time-consuming given their administrative essence and bureaucracy is a typically known barrier in Italy. Initiatives based on a one-stop-shop model like EuroPACE should work with local and national authorities to simplify these time-consuming barriers.
4.3. Social perception
Future Electricity (Elettricità Futura), the Italian association of electrical firms, and Safe, an in-dependent organisation in the energy and environmental sectors, recently conducted the sur-vey “Portrait of the electric energy consumer: A survey between knowledge and perceptions” (Greenreport.it, 2018). The survey addresses three main topics: the electricity sector (climate change, energy transition, EE), an open market for energy (benefits, relationships between client and supplier), and electricity bills.
The first part of the survey reveals that the electric energy consumer is very worried about climate change, especially if the consumer is middle-aged (45-64 years old). Half of those who declared to be worried, however, do not know the causes of climate change. Among younger consumers, the percentage of those informed on the causes of climate change is higher (61%). The energy transition theme is less known, however, with less than 5% of participants answer-ing correctly. Generally, interest in energy-related themes increases with educational level, while complete lack of interest regarding energy savings is more prevalent among older con-sumers (7 pp above the sample mean) and among those with low levels of education (+11 pp). These people can be thus less willing to pursue investments improving the status quo. What is more, concerning EE as such, 40% of those interviewed did not consider their efforts for more sustainable energy consumption to be sufficient. A perceived increase in the cost of energy is the main motivation for better energy behaviour for 20% of individuals (mostly older and more educated individuals). Knowledge of technologies to reduce building emissions also decreases with participant age; however, more than half of the participants, regardless of age, recognised the importance of modern boilers to achieve this goal.
Among the questions included in the second section of the survey, about half of the partici-pants did not know the meaning of the term open market. Younger participants recognised the value of better targeting contracts, whereas the oldest thought that the major advantage was economic. A total of 36% of participants did not want to change suppliers due to lack of trust or fear of bureaucracy. The ideal supplier should provide the customer with more information on
21 Technical details can be found in Law (circolare) n. 11/E 2018.
132
CASE Reports | No. 499 (2019)
energy savings (28%) and innovative services (17%), while 41% of participants were not inter-ested in any type of further services.
The last section of questions, related to the price of electricity, shows that most individuals (60%) did not know how much a kilowatt-hour costs. Interestingly, this lack of knowledge was spread over all educational levels. The factors determining the electricity bill were also largely unknown. Only one consumer out of four stated they checked their bill regularly, but they did not remember the amount of the annual bill.
Furthermore, the 2017 CRESME Symbola report mainly focuses on building renovations, placing particular emphasis on the increase in value of the renovated building, seismic risk, and the role of fiscal deductions. On behalf of Symbola, IPSOS Public Affairs ran a parallel survey to measure Italians’ knowledge concerning Ecobonus and Sismabonus, as well as the importance of EE. The IPSOS survey shows that Ecobonus was known by 76% of the participants, 15% of whom declared having benefited from it. This proves once more that the Ecobonus was and is a successful energy policy intervention which could boost the application of EuroPACE. Sisma-bonus was much less well known: 46% had never heard of it. A total of 43% thought that EE in buildings is very important and an additional 41% said it is important.
The survey not only covers the barriers but also the in-country strengths. Overall, more than 80% of Italians find the energy features of buildings to be important. More than 70% stated they would spend more on their buildings in order to consume less energy (with 28% stating definitely yes and 45% probably yes) or to make it safer against seismic risk.
133
CASE Reports | No. 499 (2019)
Chapter 5: Policies related to EE/RES in residential buildings
5.1. Transposition of the European Directive on Energy Performance in Buildings and other EU legislation related to EE/RES in buildings
The Directive on Energy Performance in Buildings 2002/91/CE and Directive 2010/31/UE (recasting the first directive) introduced principles related to the improvement of the EE of buildings. The Italian application of these principles has led to the identification of minimum EE requirements corresponding to optimal costs for new and renovated buildings (Ministry of Economic Development, 2018c). These rules became law with the decree of 26 June 2015 by the Ministry of Economic Development.
The process involves the following steps: a) the characterisation of representative build-ings, b) the computation of EE and global costs, c) analysis of the EE measures, d) cost analysis, e) identification of the optimal EE level as a function of costs, f) sensitivity analysis, and g) com-parison with 2013 results.
Point a) considers three types of residential buildings, distinguished by construction year and thermal area, for a total of 18 cases. There are 17 EE measures which are combined in packages or variants to obtain the best results. They are categorised into three big groups, involving:22
1) opaque and transparent building envelope;2) heating, cooling, domestic hot water production, ventilation, and lighting installations;3) renewable energy installations.The 17 measures are listed in Tables 7 (Energy efficiency measures of envelope), 8 (Energy
efficiency measures for heating, cooling, ventilation, domestic hot water, and lighting installa-tions), and 9 (Energy efficiency measures relating to renewable energy installations). Each of them is assigned a value between 1 and 5, with 5 indicating the measure providing the greatest improvement. Computation of the energy needs for each of the representative buildings is car-ried out (under quasi-stationary conditions) using the methods cited in the technical publication UNI/TS 11300.23 The 2013 Italian report on cost-optimal EE measures is available from the Min-istry of Economic Development (2013).
5.2. Other legal developments in the area of energy performance in buildings and use of RES in buildings
The National Energy Strategy (NES) published in 2016 confirms the importance of EE in Italian energy transition by underlining the importance of achieving previously set ambitious climate targets. Additionally, on 31 December 2018, the Ministry of Economic Development together with the Ministry of the Environment and Protection of Land and Sea published the Energy and
22 See Section 4 in: https://ec.europa.eu/energy/sites/ener/files/documents/it_2018_cost-optimal_en_version.pdf 23 The description of the model for calculating energy performance is provided in Section 5 of the document reported
in the previous footnote.
134
CASE Reports | No. 499 (2019)
Climate Plan (Proposta di piano nazionale integrato per l’energia e il clima, henceforth PNIEC) for 2030. This document was delivered to Brussels for approval by the EU by the end of 2019.24 It is worth mentioning that, for the first time, PNIEC includes a strategic environmental assessment (Valutazione Ambientale Strategica).
The first chapter of PNIEC is dedicated to RES policy, EE, and emissions. PNIEC has set the share of final gross consumption to be covered by RES at 30%, a target to be reached by 2030 (55.4% of which is to be in the electric sector, 33% in the thermal sector, through civil uses of heating and cooling, and 21.6% in the transportation sector). In particular, the level of final gross energy consumption is expected to be 111 Mtoe, of which about 33 Mtoe will be from RES. The thermal sector plays a crucial role in reaching the objectives of RES. Consumption from RES is forecasted to surpass 14.7 Mtoe in the heating and cooling sectors, mostly based on energy provided by heat pumps.
Concerning EE, the proposal incorporates a reduction in primary energy consumption of 43% (i.e. 39.7% of final energy) with respect to the PRIMES 2007 scenario (European Commis-sion, 2008). The absolute level of energy consumption in 2030 is estimated to be 132 Mtoe in primary energy and 103.8 Mtoe in final energy. PNIEC therefore intends active policy measures to be used to promote a reduction in final consumption equal to 9.3 Mtoe per year until 2030, mostly in sectors not covered by the EU Emissions Trading System. Among the latter, the resi-dential sector is expected to contribute the most, with an average reduction of 3.3 Mtoe per year. This is in a fact a realistic scenario.
Regarding emissions, the document expects a reduction in greenhouse gas emissions of 33% (or a reduction of 34.6%, considering all the policy measures included in PNIEC) by 2030 for all sectors not covered by the Emissions Trading System. The residential sector plays an important role in the reduction of emissions. The expected reduction between 2005 and 2030 is 35 Mt CO2 eq and reflects the acceleration in the rate of efficiency improvement of existing build-ings, reinforced by a greater share of deep renovations and the application of highly performing technologies.
5.3. Economic incentives
The previously mentioned and well-known tax deduction scheme Ecobonus provides a deduc-tion of 50% (5% per year for 10 years) for the following energy improving interventions: door and window replacements, windows fixtures, solar insulation systems, solar photovoltaic panels, and installations of biomass boilers and class A condensing boilers. A deduction of 65% (i.e. 6.5% for 10 years) is provided in the case of interventions involving the total renovation of a dwelling or the replacement of heating and air conditioning systems, namely, the installation of (class A) condensing boilers plus advanced thermoregulation systems, condensing heating air condition-
24 PNIEC is a compulsory document that each EU Member State must prepare and represents one of the key instru-ments required by the EU Clean Energy for All Europeans package. This last document includes policies and na-tional measures finalised to reach the EU 2030 target, in line with the five dimensions of the Energy Union. Every two years, each EU Member State must report the improvements achieved in line with the EU approved version of PNIEC.
135
CASE Reports | No. 499 (2019)
ers, heat pumps, heat pump water heaters, envelope insulation, solar collectors, hybrid genera-tors, building automation systems, and microcogenerators.25
For interventions concerning common parts of buildings, the following deductions are ap-plied: 70% for the insulation of more than 25% of the envelope surface and 75% for the insu-lation of more than 25% of the envelope surface plus improvement of the average quality of the envelope. These types of interventions are capped at EUR 40,000 times the number of dwellings in the building. In the case of the insulation of more than 25% of the envelope surface realised in seismic areas (zones denoted as seismic class 1, 2, or 3) leading to a reduction in seismic risk by one class, the deduction is set at 80% (Sismabonus). For a reduction in seismic risk by more than one class, the deduction is raised to 85%. The maximum deductible sum for Sismabonus interventions is equal to EUR 136,000 times the number of dwellings in the build-ing. Sismabonus deductions are set between 70% and 80% for houses. These are however far less-known than the Ecobonus scheme.
5.4. Policies to support households in situations of energy poverty
Two specific policies to help poorer households are “bonus gas” and “bonus electricity”. The for-mer is a gas bill reduction for low-income or large households. Bonus gas works only for natural gas distributed through networks (i.e. excluding tanks or liquid propane) and only for primary residences. The electricity bill bonus is provided to households in need, regardless of income, in the case electricity consumption due to an illness requiring life-saving medical instruments with high electricity consumption. The instrument is assessed positively as it answers the needs of those most in need. Moreover, a recent decree has established that the beneficiaries of the newly introduced Reddito di Cittadinanza, or citizen’s basic income, will also receive gas and elec-tricity bonuses.
5.5. Other policy developments
Legislative decree 102/2014 and the subsequent law 141/2016 established the compulsory installation of thermostatic valves on every radiator in apartments in buildings with centralised heating. These valves allow for different temperatures in each room, increasing overall comfort in the home. Savings come from the fact that the central boiler does not always need to work at maximum power, because users adapt heating usage to their personal needs. Therefore, the first type of savings is at the condominium level. Moreover, there is great heterogeneity in sav-ings among users, depending on their energy use. This situation creates incentives for efficient consumption. It also creates positive spillover effects inducing interventions on apartments to make them more energy efficient.
Since 26 September 2015, in adherence with the eco-design requirements of Directive 2005/32/CE, condensing boilers can no longer be built. This responsibility, up to now, has been
25 These systems simultaneously produce electrical and thermal energy right at the user site, without waste and while using the clean energy of gas (natural gas or liquefied petroleum gas).
136
CASE Reports | No. 499 (2019)
borne by boiler builders. Consumers can still buy standard boilers, but they must check that the boiler building date is before 26 September 2015.
5.6. Initiatives at the local level to promote EE/RES in private buildings
An important initiative at the local level is the “Informambiente”, an office offering individuals information on the environment at the municipal level. This initiative also involves the Covenant of Mayors, which envisages action plans, monitoring, and good practices for climate and energy. In Italy, of a total of about 8,000 municipalities, 3,184 adhere to the Covenant of Mayors.26 Most likely, these municipalities could quickly become interested in EuroPACE development as they are already in a position to pursue technical assistance programmes.
5.7. Bottom-up initiatives
The ANCE-Deloitte online platform to facilitate tax credit transfers is a bottom-up initiative. It aims to simplify the complex bureaucratic mechanisms that can hamper tax credit transfers and discourage potentially interested citizens. The platform works for both Ecobonus and Sis-mabonus and can be accessed by ANCE firms, as well as the administrators of condominiums and professionals (i.e. those who carried out the intervention and who can benefit from the tax credit transfer). The ANCE-Deloitte tax credit transfer proceeds in five steps: 1) one of the three subjects mentioned identifies a condominium for which an intervention is proposed, with pay-ment of the non-incentivised quota only; 2) the intervention is uploaded to the online platform; 3) a preliminary contract between the ANCE firm and the investor is signed to plan the joint intervention and the subsequent tax credit transfer (note that, by law, it is not possible to trans-fer a tax credit more than twice); 4) the tax credit is transferred to ANCE; and 5) a final contract between the ANCE firm and the investor is signed to transfer the Deloitte-certified tax credit to the latter and to implement a contextual bank transfer in favour of the ANCE firm. The ANCE-Deloitte tax credit transfer mechanism in the case of Ecobonus 75% is provided in Figure 16 as an example. Other examples and further explanations concerning both Ecobonus and Sismabo-nus can be found in Deloitte-ANCE (2018). It is difficult to assess whether the transfer scheme could somehow be applicable to EuroPACE.
26 For more details see: https://www.pattodeisindaci.eu/it/
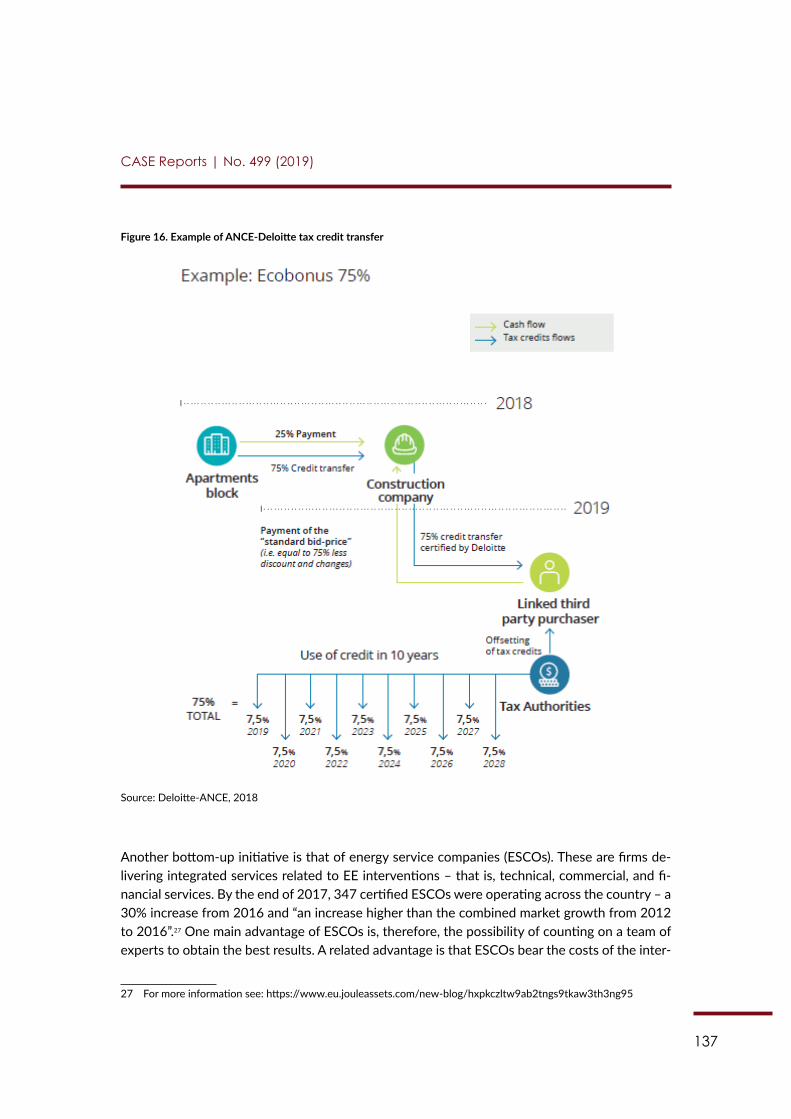
137
CASE Reports | No. 499 (2019)
Figure 16. Example of ANCE-Deloitte tax credit transfer
114
intervention is uploaded to the online platform; 3) a preliminary contract between the ANCE firm and the investor is signed to plan the joint intervention and the subsequent tax credit transfer (note that, by law, it is not possible to transfer a tax credit more than twice); 4) the tax credit is transferred to ANCE; and 5) a final contract between the ANCE firm and the investor is signed to transfer the Deloitte-certified tax credit to the latter and to implement a contextual bank transfer in favour of the ANCE firm. The ANCE-Deloitte tax credit transfer mechanism in the case of Ecobonus 75% is provided in Figure 16 as an example. Other examples and further explanations concerning both Ecobonus and Sismabonus can be found in Deloitte-ANCE (2018). It is difficult to assess whether the transfer scheme could somehow be applicable to EuroPACE.
Figure 16. Example of ANCE-Deloitte tax credit transfer
Source: Deloitte-ANCE, 2018
Another bottom-up initiative is that of energy service companies (ESCOs). These are firms delivering integrated services related to EE interventions – that is, technical, commercial, and financial services. By the end of 2017, 347 certified ESCOs were operating across the country – a 30% increase from 2016 and “an increase higher than the combined market growth from 2012 to 2016”.203 One main advantage of ESCOs is, therefore, the possibility of counting on a team of experts to obtain the best results. A related advantage is that ESCOs bear the costs of the intervention and guarantee the results by taking up the risk of a lack of energy savings. Subscribers to ESCO services sign a supply contract that itemises the ESCO profits. It is difficult to assess whether the success of ESCOs might limit potential interest in the
203 For more information see: https://www.eu.jouleassets.com/new-blog/hxpkczltw9ab2tngs9tkaw3th3ng95
Source: Deloitte-ANCE, 2018
Another bottom-up initiative is that of energy service companies (ESCOs). These are firms de-livering integrated services related to EE interventions – that is, technical, commercial, and fi-nancial services. By the end of 2017, 347 certified ESCOs were operating across the country – a 30% increase from 2016 and “an increase higher than the combined market growth from 2012 to 2016”.27 One main advantage of ESCOs is, therefore, the possibility of counting on a team of experts to obtain the best results. A related advantage is that ESCOs bear the costs of the inter-
27 For more information see: https://www.eu.jouleassets.com/new-blog/hxpkczltw9ab2tngs9tkaw3th3ng95
138
CASE Reports | No. 499 (2019)
vention and guarantee the results by taking up the risk of a lack of energy savings. Subscribers to ESCO services sign a supply contract that itemises the ESCO profits. It is difficult to assess whether the success of ESCOs might limit potential interest in the EuroPACE mechanism or, by contrast, ESCO companies are the perfect partners of EuroPACE programmes given the exis-tence of a professional and reliable network of companies.
139
CASE Reports | No. 499 (2019)
Conclusions
The aim of this report was to assess the market potential for the development of a home-based financing mechanism for private home retrofits in Italy. The literature review on the topic, the analysis of relevant statistics, as well as policies and frameworks supporting EE and RES in Italy, lead us to six crucial conclusions:
1. The relatively high home ownership rate for a country as big as Italy (roughly 72%) and optimistic scenarios concerning the socio-economic conditions of households confirmed mainly by increasing household investments which can be correlated with potential eli-gibility to pay a EuroPACE assessment are important factors in determining that there is market potential for EuroPACE in Italy. These are additionally enhanced by the fact that 80% of Italians find the energy features of buildings to be important.
2. Together with the ageing process of the housing building stock, the overall energy con-sumption in households is growing and so are the households’ energy prices. We can therefore estimate that people will be willing to lower these if the right instruments are in place. The administrative obstacles should be at the same time limited. As energy con-sumption is related with increasing the comfort of living (more light, higher temperatures in winter, and lower temperatures in summer thanks to air conditioning), one might esti-mate that increasing overall living conditions will also be welcomed by Italian citizens.
3. The biggest barriers are not related to insufficient financing, but simply to the inability of institutions to “sell” EE and RES as something complex yet desirable. Bureaucracy and the already mentioned administrative obstacles are typically the most visible outcomes.
4. The right legislation concerning EE and RES is already in place, which undoubtedly secu-res an appropriate legal framework for developing new financial models targeting home retrofits. Additionally, the NES strengthens EE endeavours “by facilitating the measures that have the best cost-effectiveness ratio in order to achieve 30% energy savings by 2030 compared to the expected consumption at that date”.
5. However, as rightly indicated by Joule Assets, “the data presented in the 2018 Italian Energy Efficiency Report show that major strides in the Italian energy efficiency market have been made in [the] past year, building on what was already one of the most robust EE markets in Europe. Rapid ESCO growth and an increasingly central role in the market for small and medium project developers has increased competition, leading to greater market stability”.28 Although according to the authors this implies that “demand for third party finance is ever-present and will continue to grow; increased flow of equity capital and project finance will effectively make Italy a European leader in EE across both the private and public sectors”29, the further strong success of ESCOs might in fact impede development of other private financing instruments such as EuroPACE. Given the market needs, of course this does not mean that there will be no space left for other one-stop--shop platforms. However, this space might be limited if ESCOs continue to grow so ra-
28 For more information see: https://www.eu.jouleassets.com/new-blog/hxpkczltw9ab2tngs9tkaw3th3ng95 29 Ibidem
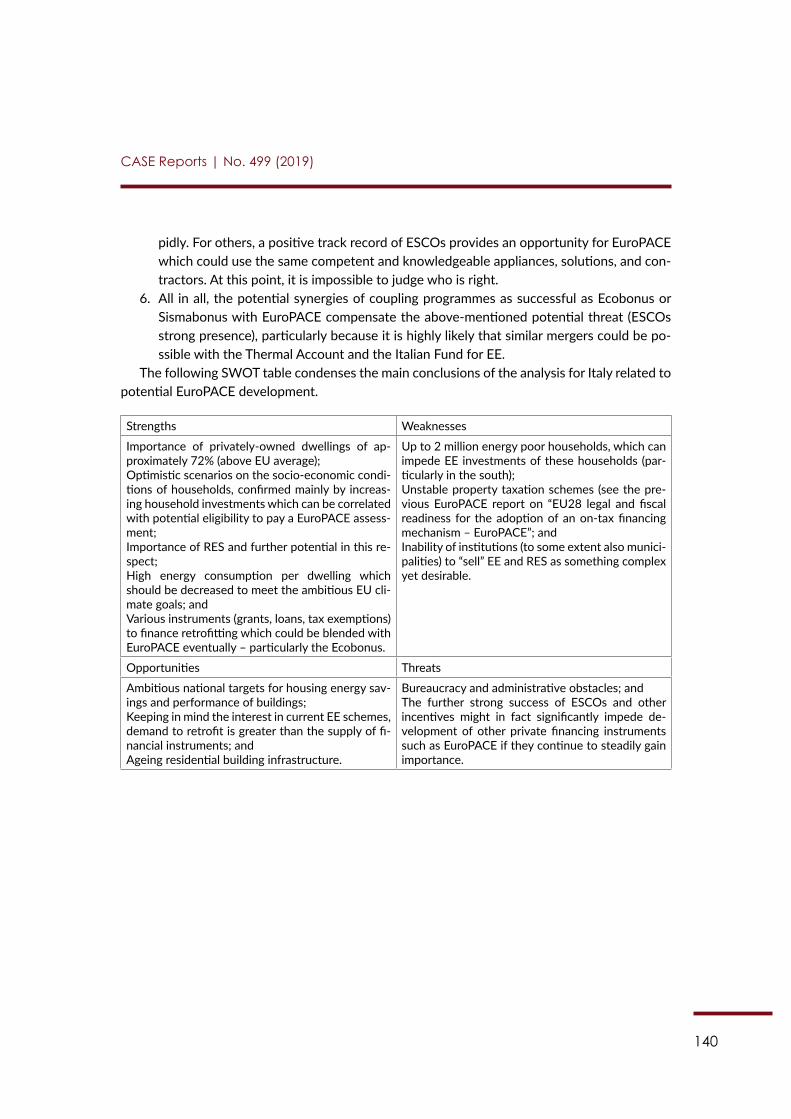
140
CASE Reports | No. 499 (2019)
pidly. For others, a positive track record of ESCOs provides an opportunity for EuroPACE which could use the same competent and knowledgeable appliances, solutions, and con-tractors. At this point, it is impossible to judge who is right.
6. All in all, the potential synergies of coupling programmes as successful as Ecobonus or Sismabonus with EuroPACE compensate the above-mentioned potential threat (ESCOs strong presence), particularly because it is highly likely that similar mergers could be po-ssible with the Thermal Account and the Italian Fund for EE.
The following SWOT table condenses the main conclusions of the analysis for Italy related to potential EuroPACE development.
Strengths Weaknesses
Importance of privately-owned dwellings of ap-proximately 72% (above EU average);Optimistic scenarios on the socio-economic condi-tions of households, confirmed mainly by increas-ing household investments which can be correlated with potential eligibility to pay a EuroPACE assess-ment;Importance of RES and further potential in this re-spect;High energy consumption per dwelling which should be decreased to meet the ambitious EU cli-mate goals; andVarious instruments (grants, loans, tax exemptions) to finance retrofitting which could be blended with EuroPACE eventually – particularly the Ecobonus.
Up to 2 million energy poor households, which can impede EE investments of these households (par-ticularly in the south);Unstable property taxation schemes (see the pre-vious EuroPACE report on “EU28 legal and fiscal readiness for the adoption of an on-tax financing mechanism – EuroPACE”; andInability of institutions (to some extent also munici-palities) to “sell” EE and RES as something complex yet desirable.
Opportunities Threats
Ambitious national targets for housing energy sav-ings and performance of buildings;Keeping in mind the interest in current EE schemes, demand to retrofit is greater than the supply of fi-nancial instruments; andAgeing residential building infrastructure.
Bureaucracy and administrative obstacles; andThe further strong success of ESCOs and other incentives might in fact significantly impede de-velopment of other private financing instruments such as EuroPACE if they continue to steadily gain importance.
141
CASE Reports | No. 499 (2019)
References
Certificato-Energetico.it (2018), The 1° company for APE certifications in Italy, Retrieved from https://www.certificato-energetico.it/en/
COPmas (2015), Eco action games – 12 issues of importance to the Paris COP21 discussions. A COPmas annual 2015.
CRESME (2012), Città, mercato e rigenerazione 2012. Analisi di contesto per una nuova politica urbana. Research promoted by CNAPPC and ANCE, Milan.
CRESME (2017), Una nuova edilizia contro la crisi, I quaderni di Symbola. Retrieved from http://www.cresme.it/doc/rapporti/rapporto-cresme-symbola-2017.pdf
De Groot, J. and L. Steg (2007), Value Orientations to Explain Beliefs Related to Environmental Significant Behavior: How to Measure Egoistic, Altruistic, and Biospheric Value Orientations, Environment and behaviour, Sage.
Deloitte-ANCE (2018), The new solution dedicated to the acquisition of Sismabonus and Eco-bonus Tax credits.
ENEA – National Agency for New Technologies, Energy and Sustainable Economic Development (2018a), Energy efficiency annual report: Analysis and Results of Energy Efficiency Policies in Italy – 2018 Executive summary. Retrieved from http://www.enea.it/it/seguici/pubblicazioni/pdf-volumi/2018/raee-2018-executivesummary-en.pdf/view
ENEA – National Agency for New Technologies, Energy and Sustainable Economic Development (2018b), 65% fiscal deductions for energy renovation of existing buildings – Annual report ex-ecutive summary 2018. Retrieved from http://www.enea.it/it/seguici/pubblicazioni/pdf-volu-mi/2018/detrazioni-2018-executivesummary-en.pdf
ENEA – National Agency for New Technologies, Energy and Sustainable Economic Development (2018c), Degree days detailed table. Retrieved from http://efficienzaenergetica.acs.enea.it/doc/dpr412-93_allA_tabellagradigiorno.pdf
ENEA – National Agency for New Technologies, Energy and Sustainable Economic Development (2018d), Rapporto Annuale Efficienza Energetica 2018.
European Commission (2008), European energy and transport: Trends To 2030 – Update 2007. Directorate-General for Energy and Transport.
142
CASE Reports | No. 499 (2019)
European Commission (2018), EU Energy Poverty Observatory. Retrieved from https://www.energypoverty.eu
Eurostat (2016a), Final energy consumption in households by fuel, %. Retrieved from: https://ec.europa.eu/eurostat/tgm/table.do?tab=table&plugin=1&language=en&pcode=t2020_rk210
Eurostat (2016b), Statistics explained: Energy consumption in households: Share of final energy consumption in the residential sector by type of end-use. Retrieved from: https://ec.europa.eu/eurostat/statistics-explained/index.php?title=Energy_ consumption_in_households
Eurostat (2017), Energy prices in the EU, 2017. Retrieved from https://ec.europa.eu/eurostat/news/themes-in-the-spotlight/energy-prices-2017
Eurostat (2018a), Average household size – EU-SILC survey – Last update: 14-12-2018. Re-trieved from http://appsso.eurostat.ec.europa.eu/nui/show.do?dataset=ilc_lvph01&lang=en
Eurostat (2018b), Statistics explained: Electricity price statistics. Retrieved from https://ec.europa.eu/eurostat/statistics-explained/index.php/Electricity_price_statistics#Electricity_prices_for_household_consumers and http://appsso.eurostat.ec.europa.eu/nui/show.do?dataset=nrg_pc_204&lang=en
Faiella, I., and Lavecchia, L. (2015), La povertà energetica in Italia [Energy poverty in Italy]. Po-litica Economica, 31, 1, 27-76.
Gestore Servizi Energetici (2019), Contatore Conto Termico. Retrieved from https://www.gse.it/contatore-conto-termico
Greenreport.it (2018), Ritratto del consumatore italiano di energia elettrica. Retrieved from http://www.greenreport.it/news/energia/ritratto-del-consumatore-italiano-di-energia-elettrica/
Iren (2018), Retrieved from https://www.gruppoiren.it/home
Italian National Institute of Statistics (2017), Italy in figures 2016, ISTAT, Rome.
Joint Research Centre of the European Commission (2018), Energy Consumption and Energy Efficiency Trends in the EU-28: 2000-2015. Efficiency Trends of Energy related Products and Energy Consumption in the EU-28. Ispra, Italy.
Luce-Gas.it (2018), Zone Climatiche d’Italia: riscaldamento e bolletta Gas, Retrieved from https://luce-gas.it/informazioni-pratiche/termini-tecnici/zone-climatiche-italia
143
CASE Reports | No. 499 (2019)
Ministry of Economic Development (2013), Applicazione della metodologia di calcolo dei livelli ottimali in funzione dei costi per i requisiti minimi di prestazione energetica (Directive 2010/31/ue article 5). Retrieved from https://ec.europa.eu/energy/en/content/eu-countries-2013-cost-optimal-reports-part-2
Ministry of Economic Development (2018a), Proposta di Piano Nazionale Integrato per l’Energia e il Clima. Retrieved from https://www.mise.gov.it/images/stories/documenti/Proposta_di_Piano_ Nazionale_Integrato_per_Energia_e_il_Clima_Italiano.pdf
Ministry of Economic Development (2018b), Detrazioni fiscali – Efficienza energetica (Ecobo-nus). Retrieved from https://www.mise.gov.it/index.php/it/incentivi/energia/detrazioni-fiscali
Ministry of Economic Development (2018c), Update of the application in Italy of the method for calculating cost-optimal levels for minimum energy performance requirements (Directive 2010/31/eu article 5). Retrieved from https://ec.europa.eu/energy/sites/ener/files/documents/it_2018_cost-optimal_en_version.pdf
Ministry of Economic Development and Ministry of the Environment and Protection of Land and Sea, Proposta di piano nazionale integrato per l’energia e il clima (2018), Retrieved from https://www. mise.gov.it/images/stories/documenti/Proposta_di_Piano_Nazionale_Integrato_per_Energia_e_il_Clima_Italiano.pdf
NextVille (2017), Energie Rinnovabili ed Efficienza Energetica. Retrieved from http://www.next-ville.it/ temi-utili/3
ODYSSEE-MURE (2015a), Italy – Energy profile, energy efficiency trends and policies. Retrieved from http://www.ODYSSEE-MURE.eu/publications/efficiency-trends-policies-profiles/italy.html
ODYSSEE-MURE (2015b), Sectoral profile – households. Retrieved from http://www.ODYSSEE-MURE.eu/publications/efficiency-by-sector/households/average-energy-consumption-dwell-ing.html
REN21 (2018), Renewables 2018 Global Status Report, Retrieved from http://www.ren21.net/gsr-2018/
van der Linden L., A. A. Leiserowitz, G.D. Feinberg, E.W. Maibach (2015), The Scientific Consen-sus on Climate Change as a Gateway Belief: Experimental Evidence, PLOSONE
Woodenbuildings (2018), New energy efficiency classes according to DM 26 June 2015 (classes A1, A2, A3, A4) Retrieved from http://www.woodenbuildings.it/en/know-how-2/
144
Author: Dr. Vlasis Oikonomou
Contents
Acronyms ....................................................................................................................................145
Introduction ...............................................................................................................................146
Chapter 1: Social and economic conditions of households ............................................1471.1. Number of households and household composition ............................................147
1.2. Distribution of people by degree of urbanisation ................................................147
1.3. Income level and distribution ....................................................................................148
Chapter 2: Characteristics of the building stock ...............................................................1502.1. Total number of residential dwellings ......................................................................150
2.2. Changes in the housing stock ....................................................................................150
2.3. Ownership ......................................................................................................................151
2.4. The building stock by age, type and ownership ....................................................151
2.5. The building stock by size ..........................................................................................153
2.6. Renovation and policy objectives .............................................................................154
Chapter 3: Energy consumption in private residential buildings and type of EE/RES investments.........................................................................155
3.1. Energy prices .................................................................................................................155
3.2. Energy costs ...................................................................................................................156
3.3. Energy poverty ..............................................................................................................156
3.4. Energy labels ..................................................................................................................157
3.5. Energy consumption by source .................................................................................159
3.6. Break down of energy consumption by end-use ...................................................162
3.7. Energy use by size and age .........................................................................................162
3.8. Energy efficiency and renewable energy investments .........................................162
EuroPACE Market Analysis: the Netherlands
145
CASE Reports | No. 499 (2019)
Chapter 4: Barriers to develop the EE/RES potential in private buildings ..................164
Chapter 5: Policies related to EE/RES in buildings ...........................................................1695.1. EPBD in the Netherlands ............................................................................................169
5.1.1. Energy performance requirements: existing buildings ...............................169
5.1.2. Energy performance requirements: new buildings ......................................170
5.2. Climate Agreement (Klimaat Akkoord) ....................................................................171
5.3. Financing schemes in the residential sector ...........................................................173
5.4. Policies for energy poverty in the residential sector ............................................174
5.5. Other policy and support options for residential buildings ................................176
Conclusions ................................................................................................................................179
References ..................................................................................................................................181
Annex ..........................................................................................................................................184
Acronyms
EE Energy EfficiencyEED Energy Efficiency DirectiveEPBD Energy Performance Buildings DirectiveEPC Energy Performance CertificateEU European UnionGHG Greenhouse GasGJ GigajouleHEP Hidden Energy PovertyLHV Lower Heating Value MS Member StatesnZEB nearly Zero-Energy BuildingsPJ PetajoulePPS Purchasing Power StandardsPV Photovoltaics RVO Netherlands Enterprise Agency
146
CASE Reports | No. 499 (2019)
Introduction
This paper presents the overall status and policy framework on energy efficiency (EE) in the resi-dential built environment in the Netherlands to assess applicability in terms of market potential for EuroPACE – an on-tax and asset-based mechanism targeting precisely EE and renewable energy sources (RES) in the residential sector, where the total number of buildings is about 10 million (for all types of uses) and the average renovation rate is 1% (while the demolition rate is 0.25%). These renovation and reconstruction trends are important parameters and opportuni-ties at the same time for adopting EE measures in the building stock. It is estimated that major renovations (defined typically when more than 25% of the building envelope is renovated) will reduce a building’s final energy demand for heating by 50-80% and can take place in all types of buildings (likewise new constructions).
Through an analysis of building stock characteristics (age, ownership, and others) and aver-age income level, it is evident that the Netherlands is medium to high urbanised, with mainly privately-owned properties and with the majority of the building stock dating to the 1960s and 70s. Furthermore, about 900,000 households spend a relatively large share of their income on energy costs and, therefore, are vulnerable to the upcoming changes of the energy transition.
The overall target in the Netherlands is a fossil free (CO2 neutral) built environment by 2050, which would require the retrofitting of approximately 200,000 dwellings per year. Although no up-to-date statistics are available for all retrofitted buildings, according to the Energiesprong Foundation website live calculator, only 5,000 buildings have been retrofitted under this par-ticular programme out of the 111,000 initially planned. Clearly, there are still several barriers in the Dutch building market that need to be overcome in order to achieve the renovation capacity and subsequently the EE and climate targets from the building sector. These barriers include lack of leadership, split incentives, lack of information / knowledge, technical barriers, economic barriers, and institutional barriers.
The policy area for the building sector in the Netherlands has been under constant change in recent years and is significant in terms of the targets pursued and the funding provided. For existing buildings, in order to comply with the Energy Performance Buildings Directive (EPBD), major renovations require a building permit, which guarantees the minimum requirements for building components, for example, a minimum R-value of the walls, roof, and floor and a mini-mum U-value of the windows and doors. Furthermore, Energy Performance Certificates (EPCs) have been in place since 2008 and more than 3.5 million EPCs have been registered, with a growing trend towards higher labels. For new buildings, energy performance requirements in the Netherlands are updated regularly with a shift towards nearly zero-energy buildings (nZEB), in application of the EU Directives. The main requirement for the energy performance of new buildings is the energy performance coefficient, which sets minimum energy performance re-quirements, in line with the EU Directives. Next to these mandatory schemes and labels, there are several subsidy and grants schemes in the Netherlands related to the renovation of build-ings, with different target groups and financing terms.
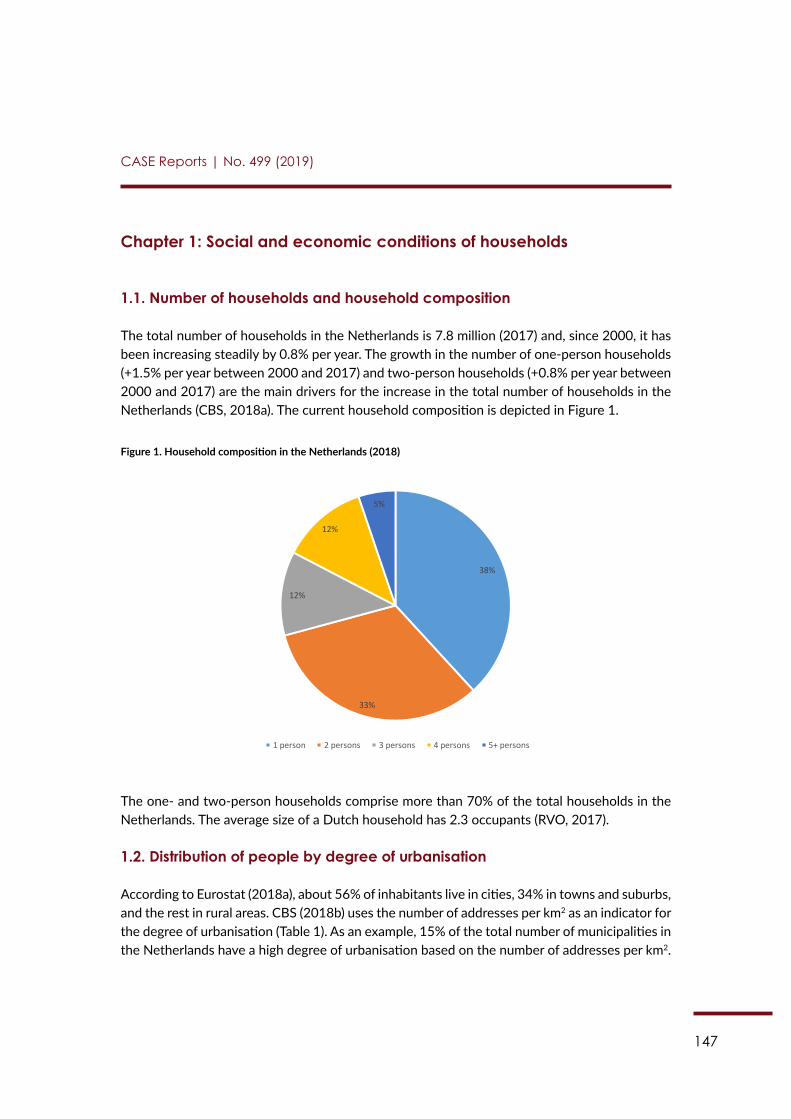
147
CASE Reports | No. 499 (2019)
Chapter 1: Social and economic conditions of households
1.1. Number of households and household composition
The total number of households in the Netherlands is 7.8 million (2017) and, since 2000, it has been increasing steadily by 0.8% per year. The growth in the number of one-person households (+1.5% per year between 2000 and 2017) and two-person households (+0.8% per year between 2000 and 2017) are the main drivers for the increase in the total number of households in the Netherlands (CBS, 2018a). The current household composition is depicted in Figure 1.
Figure 1. Household composition in the Netherlands (2018)
123
the main drivers for the increase in the total number of households in the Netherlands (CBS, 2018a). The current household composition is depicted in Figure 1.
Figure 1. Household composition in the Netherlands (2018)
The one- and two-person households comprise more than 70% of the total households in the Netherlands. The average size of a Dutch household has 2.3 occupants (RVO, 2017).
1.2. Distribution of people by degree of urbanisation According to Eurostat (2018a), about 56% of inhabitants live in cities, 34% in towns and suburbs, and the rest in rural areas. CBS (2018b) uses the number of addresses per km2 as an indicator for the degree of urbanisation (Table 1). As an example, 15% of the total number of municipalities in the Netherlands have a high degree of urbanisation based on the number of addresses per km2.
Table 1. Distribution of the municipalities by degree of urbanisation in 2013 (CBS, 2018b) Degree of urbanisation No. of addresses / km2 % of the total municipalities
very low urbanisation -500 addresses / km2 25% low urbanisation 500 - 1000 addresses / km2 36% moderate urbanisation 1000 - 1500 addresses / km2 20% very high urbanisation 1500 - 2500 addresses / km2 3%
high urbanisation 2500+ addresses / km2 15%
The 22 largest urban agglomerations in early 2011 had a population of 6.5 million, almost 40% of the Dutch population. When adding up the surrounding towns, more than 9 million people inhabit the 22 largest urban districts (2013).
1.3. Income level and distribution The average disposable income level in the Netherlands was EUR 41,000 in 2015 (median income is EUR 34,000). The income category EUR 20,000-30,000 is the most important with 1.7 million households. Table 2 shows further details of the average and median disposable income level of various income categories.
38%
33%
12%
12%
5%
1 person 2 persons 3 persons 4 persons 5+ persons
The one- and two-person households comprise more than 70% of the total households in the Netherlands. The average size of a Dutch household has 2.3 occupants (RVO, 2017).
1.2. Distribution of people by degree of urbanisation
According to Eurostat (2018a), about 56% of inhabitants live in cities, 34% in towns and suburbs, and the rest in rural areas. CBS (2018b) uses the number of addresses per km2 as an indicator for the degree of urbanisation (Table 1). As an example, 15% of the total number of municipalities in the Netherlands have a high degree of urbanisation based on the number of addresses per km2.
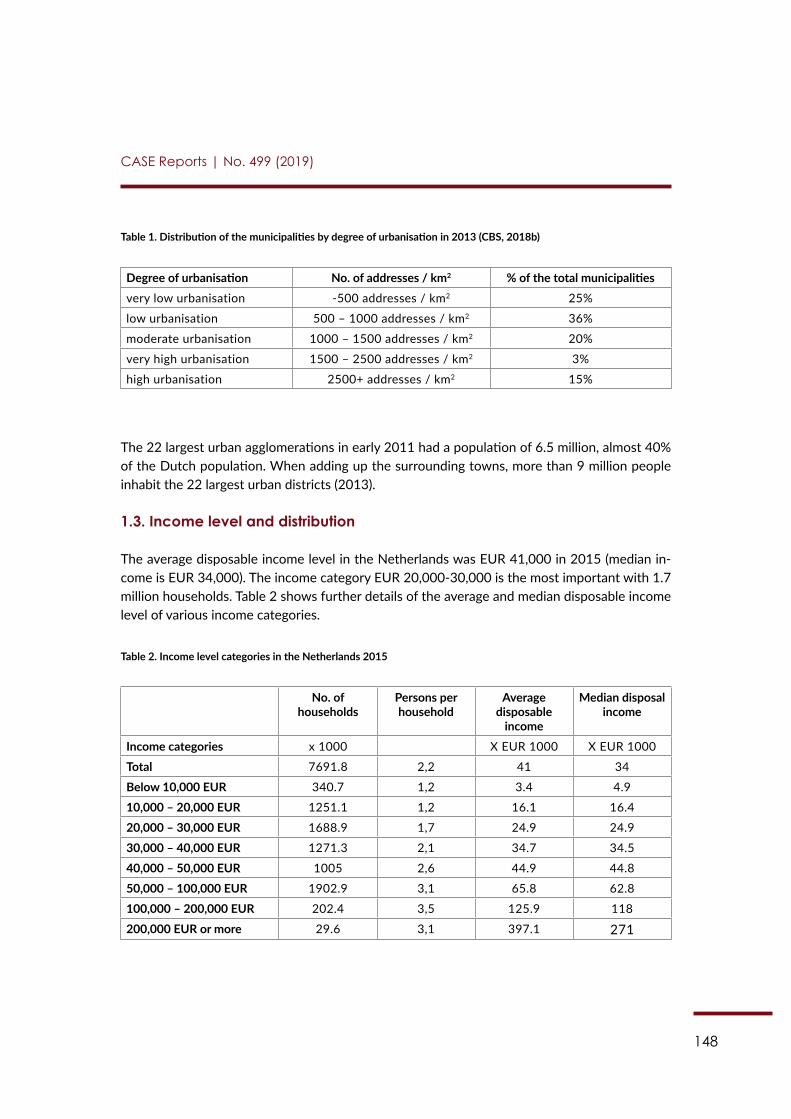
148
CASE Reports | No. 499 (2019)
Table 1. Distribution of the municipalities by degree of urbanisation in 2013 (CBS, 2018b)
Degree of urbanisation No. of addresses / km2 % of the total municipalitiesvery low urbanisation -500 addresses / km2 25%
low urbanisation 500 – 1000 addresses / km2 36%
moderate urbanisation 1000 – 1500 addresses / km2 20%
very high urbanisation 1500 – 2500 addresses / km2 3%
high urbanisation 2500+ addresses / km2 15%
The 22 largest urban agglomerations in early 2011 had a population of 6.5 million, almost 40% of the Dutch population. When adding up the surrounding towns, more than 9 million people inhabit the 22 largest urban districts (2013).
1.3. Income level and distribution
The average disposable income level in the Netherlands was EUR 41,000 in 2015 (median in-come is EUR 34,000). The income category EUR 20,000-30,000 is the most important with 1.7 million households. Table 2 shows further details of the average and median disposable income level of various income categories.
Table 2. Income level categories in the Netherlands 2015
No. of households
Persons per household
Average disposable
income
Median disposal income
Income categories x 1000 X EUR 1000 X EUR 1000
Total 7691.8 2,2 41 34
Below 10,000 EUR 340.7 1,2 3.4 4.9
10,000 – 20,000 EUR 1251.1 1,2 16.1 16.4
20,000 – 30,000 EUR 1688.9 1,7 24.9 24.9
30,000 – 40,000 EUR 1271.3 2,1 34.7 34.5
40,000 – 50,000 EUR 1005 2,6 44.9 44.8
50,000 – 100,000 EUR 1902.9 3,1 65.8 62.8
100,000 – 200,000 EUR 202.4 3,5 125.9 118
200,000 EUR or more 29.6 3,1 397.1 271
149
CASE Reports | No. 499 (2019)
The average disposable income of private house owners was EUR 45,400 in 2015 (2009: EUR 48,200), whereas the average disposable income of tenants was EUR 23,400 in 2015 (2009: EUR 25,800) (MINBZK, 2016a). The gross household adjusted disposable income per capita in 2016 in Purchasing Power Standards (PPS) was slightly higher (108) than the EU28 average (100) and severe housing deprivation is one of the lowest across the EU, according to Eurostat.1 Furthermore, the country “ranks top in work-life balance and above the average in income and wealth, jobs and earnings, housing, education and skills, subjective well-being, social connec-tions, environmental quality, personal safety, civic engagement, and health status”, according to the OECD Better Life Index.2 Moreover, private owners spend 27% of their net income on total housing costs (net mortgage, energy, local taxes) (see Woon, 2015). In 2016, this enabled Dutch households to make savings (around 14% and 6th place in the EU3,4) and keep their household investment rate the second highest across the EU (11.3%).5 With this number in mind, we can deduct that the average Dutch homeowner will be able and willing to invest in EE solutions, such as that provided under the EuroPACE initiative. Table 5 in the annex provides more detailed information on household composition, building characteristics, and energy use by income level in 2015 (PBL, 2018). The inequality of income distribution defined by the income quintile share ratio amounts to 4.0 in the Netherlands in 2017. The ratio of total income6 received by the 20% of the population with the highest income (top quintile) is compared to that received by the 20% of the population with the lowest income (lowest quintile) (Eurostat, 2018b).
1 For more information see: https://ec.europa.eu/eurostat/statistics-explained/index.php?title=File:Gross_house-hold_adjusted_disposable_income_per_capita,_2016_(EU-28_%3D_100,_based_on_data_in_PPS)_SecAcc18.png
2 For more information see: http://www.oecdbetterlifeindex.org/countries/netherlands/ 3 Note that data for Greece, Croatia, Hungary, Malta, Romania, and the United Kingdom are not available.4 For more information, see: https://ec.europa.eu/eurostat/web/products-eurostat-news/-/DDN-20180427-
1?inheritRedirect=true 5 Ibidem6 Based on the equivalent disposal income, which is the total income of a household, after tax and other deductions,
that is available for spending or saving, divided by the number of household members converted into equalised adults.
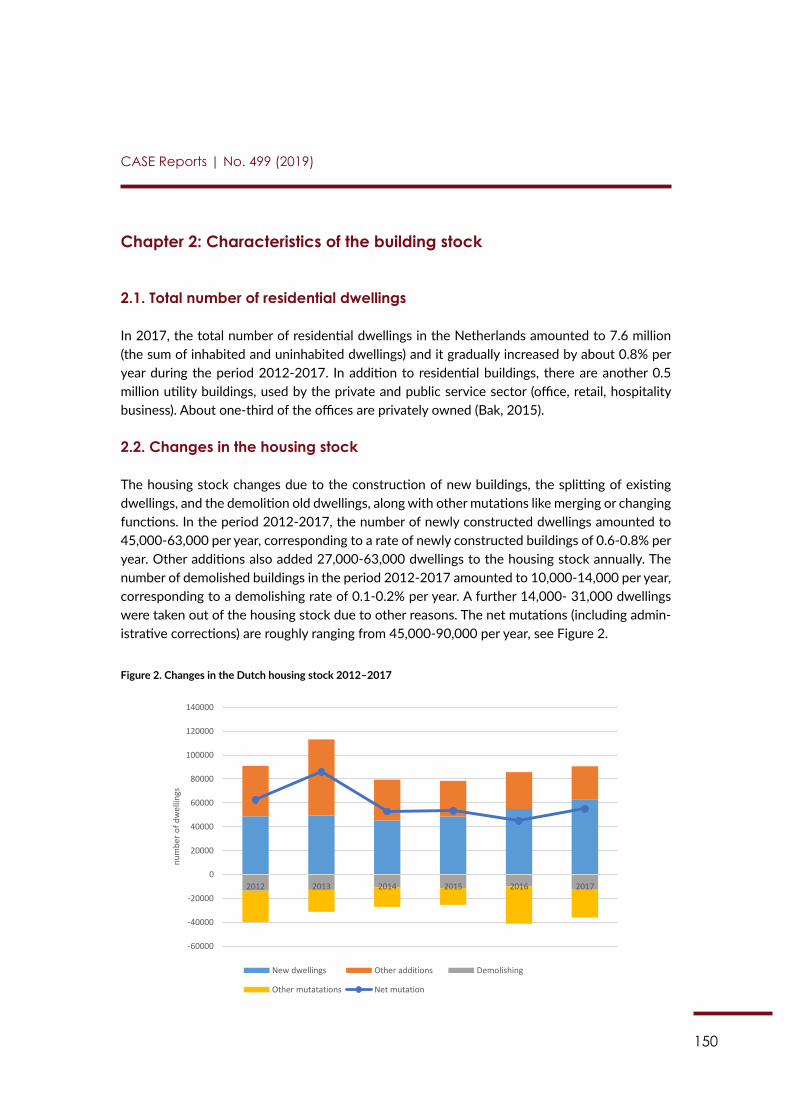
150
CASE Reports | No. 499 (2019)
Chapter 2: Characteristics of the building stock
2.1. Total number of residential dwellings
In 2017, the total number of residential dwellings in the Netherlands amounted to 7.6 million (the sum of inhabited and uninhabited dwellings) and it gradually increased by about 0.8% per year during the period 2012-2017. In addition to residential buildings, there are another 0.5 million utility buildings, used by the private and public service sector (office, retail, hospitality business). About one-third of the offices are privately owned (Bak, 2015).
2.2. Changes in the housing stock
The housing stock changes due to the construction of new buildings, the splitting of existing dwellings, and the demolition old dwellings, along with other mutations like merging or changing functions. In the period 2012-2017, the number of newly constructed dwellings amounted to 45,000-63,000 per year, corresponding to a rate of newly constructed buildings of 0.6-0.8% per year. Other additions also added 27,000-63,000 dwellings to the housing stock annually. The number of demolished buildings in the period 2012-2017 amounted to 10,000-14,000 per year, corresponding to a demolishing rate of 0.1-0.2% per year. A further 14,000- 31,000 dwellings were taken out of the housing stock due to other reasons. The net mutations (including admin-istrative corrections) are roughly ranging from 45,000-90,000 per year, see Figure 2.
Figure 2. Changes in the Dutch housing stock 2012–2017
125
2012-2017. In addition to residential buildings, there are another 0.5 million utility buildings, used by the private and public service sector (office, retail, hospitality business). About one-third of the offices are privately owned (Bak, 2015).
2.2. Changes in the housing stock The housing stock changes due to the construction of new buildings, the splitting of existing dwellings, and the demolition old dwellings, along with other mutations like merging or changing functions. In the period 2012-2017, the number of newly constructed dwellings amounted to 45,000-63,000 per year, corresponding to a rate of newly constructed buildings of 0.6-0.8% per year. Other additions also added 27,000-63,000 dwellings to the housing stock annually. The number of demolished buildings in the period 2012-2017 amounted to 10,000-14,000 per year, corresponding to a demolishing rate of 0.1-0.2% per year. A further 14,000- 31,000 dwellings were taken out of the housing stock due to other reasons. The net mutations (including administrative corrections) are roughly ranging from 45,000-90,000 per year, see Figure 2.
Figure 2. Changes in the Dutch housing stock 2012 - 2017
The annual share of nZEB in the newly constructed residential buildings was 0.2% in 2014, equivalent to approximately 900 buildings (Zebra2020, 2018). Due to the fact that the housing stock has an old average age, renovation can reduce Dutch energy use while increasing the quality of housing and health.
2.3. Ownership More than half (57%) of the dwellings in the Netherlands are privately owned (2017), corresponding to roughly 4.2 million properties. The rest of the market (43%) is rental property (private or social rental). The rental properties are either owned by a social housing association (30%) or other private owners (13%) (see Figure 3). It is important to recognise that social housing associations in the Netherlands (Woning corporaties) are, in the end, also private non-profit organisations with a legal task to give priority to housing households with lower incomes.
-60000
-40000
-20000
0
20000
40000
60000
80000
100000
120000
140000
2012 2013 2014 2015 2016 2017
num
ber o
f dw
ellin
gs
New dwellings Other additions Demolishing
Other mutatations Net mutation
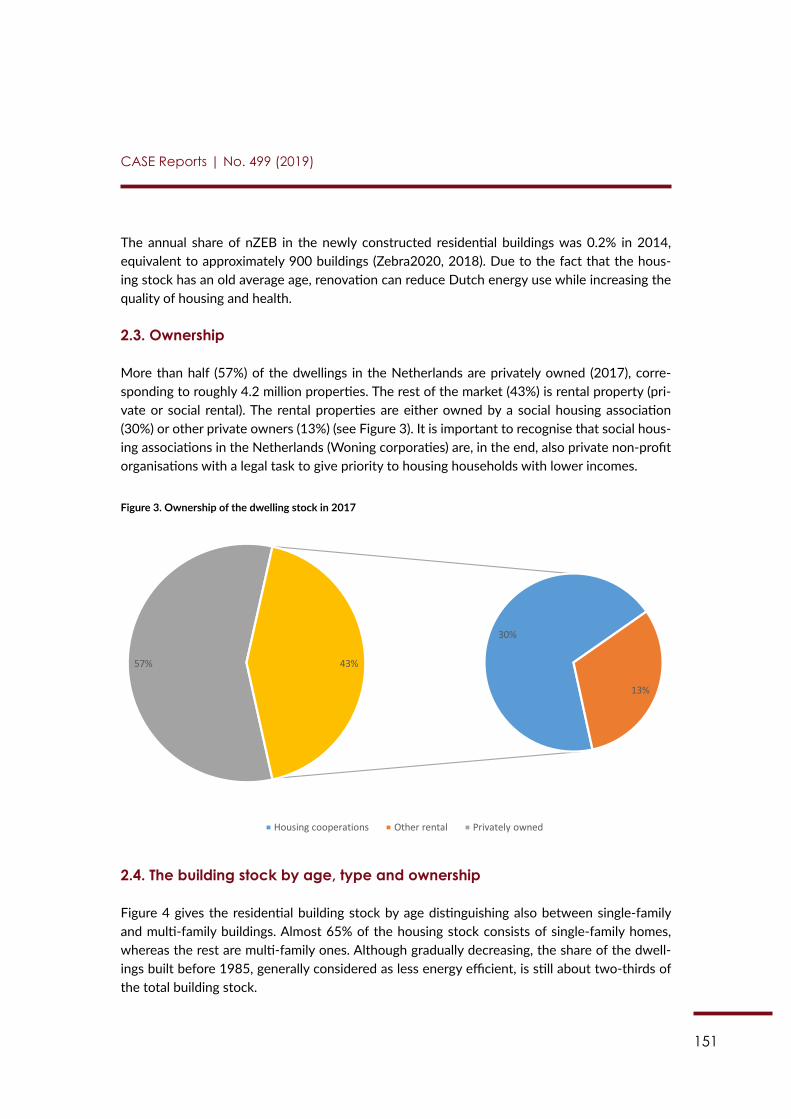
151
CASE Reports | No. 499 (2019)
The annual share of nZEB in the newly constructed residential buildings was 0.2% in 2014, equivalent to approximately 900 buildings (Zebra2020, 2018). Due to the fact that the hous-ing stock has an old average age, renovation can reduce Dutch energy use while increasing the quality of housing and health.
2.3. Ownership
More than half (57%) of the dwellings in the Netherlands are privately owned (2017), corre-sponding to roughly 4.2 million properties. The rest of the market (43%) is rental property (pri-vate or social rental). The rental properties are either owned by a social housing association (30%) or other private owners (13%) (see Figure 3). It is important to recognise that social hous-ing associations in the Netherlands (Woning corporaties) are, in the end, also private non-profit organisations with a legal task to give priority to housing households with lower incomes.
Figure 3. Ownership of the dwelling stock in 2017
126
Figure 3. Ownership of the dwelling stock in 2017
2.4. The building stock by age, type and ownership Figure 4 gives the residential building stock by age distinguishing also between single-family and multi-family buildings. Almost 65% of the housing stock consists of single-family homes, whereas the rest are multi-family ones. Although gradually decreasing, the share of the dwellings built before 1985, generally considered as less energy efficient, is still about two-thirds of the total building stock.
Figure 4. Building stock by age
Figure 21 in the annex provides further details on the ownership and age of the building stock. According to Woon (2015), the private ownership of dwellings increased from 48 to 59% in the period 1994-2015. Figure 5 and Figure 6 show further insights into the ownership of multi-family and single-family houses. Importantly for EuroPACE, the single-family houses are predominantly privately owned, whereas multi-family houses are for the most part owned by social housing associations (Woon, 2015).
Figure 5. Multi family ownership Figure 6. Single family ownership
30%
13%
57% 43%
Housing cooperations Other rental Privately owned
0
200000
400000
600000
800000
1000000
1200000
1400000
1000 - 1850
1850 - 1905
1905 - 1925
1925 - 1945
1945 - 1955
1955 - 1965
1965 - 1975
1975 - 1985
1985 - 1995
1995 - 2005
2005 - 2015
2015 >
single-family home multi-family home
2.4. The building stock by age, type and ownership
Figure 4 gives the residential building stock by age distinguishing also between single-family and multi-family buildings. Almost 65% of the housing stock consists of single-family homes, whereas the rest are multi-family ones. Although gradually decreasing, the share of the dwell-ings built before 1985, generally considered as less energy efficient, is still about two-thirds of the total building stock.
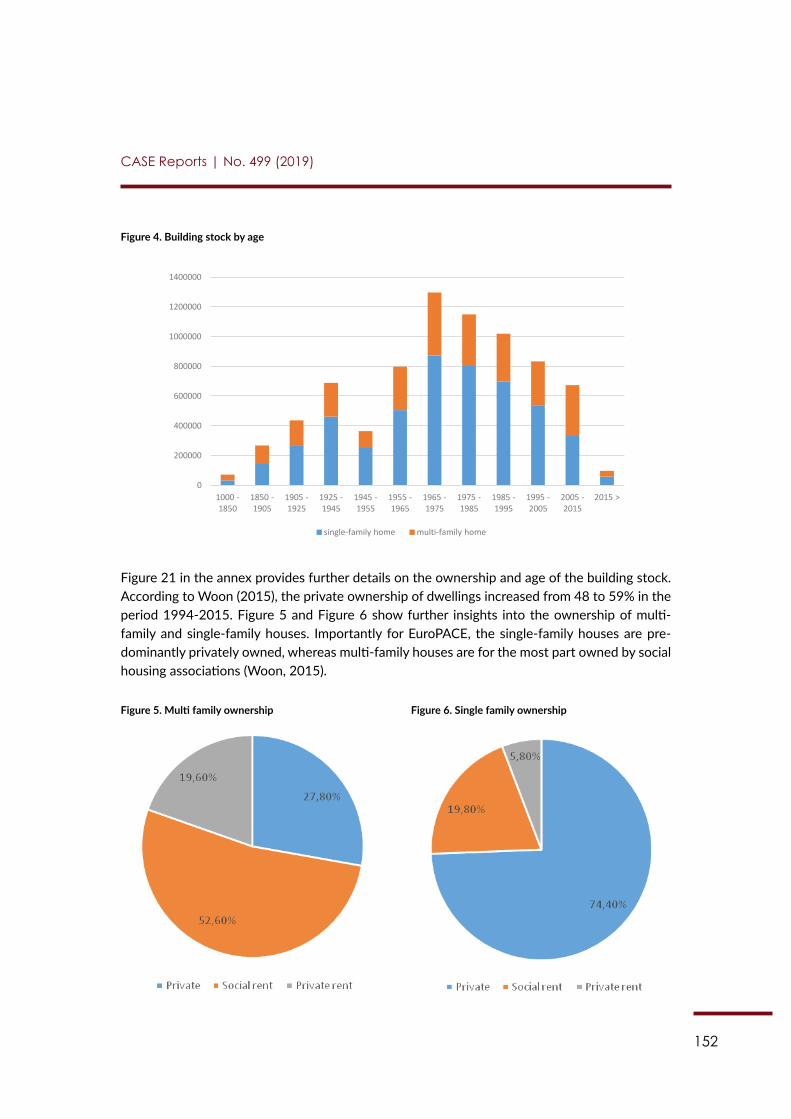
152
CASE Reports | No. 499 (2019)
Figure 4. Building stock by age
126
Figure 3. Ownership of the dwelling stock in 2017
2.4. The building stock by age, type and ownership Figure 4 gives the residential building stock by age distinguishing also between single-family and multi-family buildings. Almost 65% of the housing stock consists of single-family homes, whereas the rest are multi-family ones. Although gradually decreasing, the share of the dwellings built before 1985, generally considered as less energy efficient, is still about two-thirds of the total building stock.
Figure 4. Building stock by age
Figure 21 in the annex provides further details on the ownership and age of the building stock. According to Woon (2015), the private ownership of dwellings increased from 48 to 59% in the period 1994-2015. Figure 5 and Figure 6 show further insights into the ownership of multi-family and single-family houses. Importantly for EuroPACE, the single-family houses are predominantly privately owned, whereas multi-family houses are for the most part owned by social housing associations (Woon, 2015).
Figure 5. Multi family ownership Figure 6. Single family ownership
30%
13%
57% 43%
Housing cooperations Other rental Privately owned
0
200000
400000
600000
800000
1000000
1200000
1400000
1000 - 1850
1850 - 1905
1905 - 1925
1925 - 1945
1945 - 1955
1955 - 1965
1965 - 1975
1975 - 1985
1985 - 1995
1995 - 2005
2005 - 2015
2015 >
single-family home multi-family home
Figure 21 in the annex provides further details on the ownership and age of the building stock. According to Woon (2015), the private ownership of dwellings increased from 48 to 59% in the period 1994-2015. Figure 5 and Figure 6 show further insights into the ownership of multi-family and single-family houses. Importantly for EuroPACE, the single-family houses are pre-dominantly privately owned, whereas multi-family houses are for the most part owned by social housing associations (Woon, 2015).
Figure 5. Multi family ownership Figure 6. Single family ownership
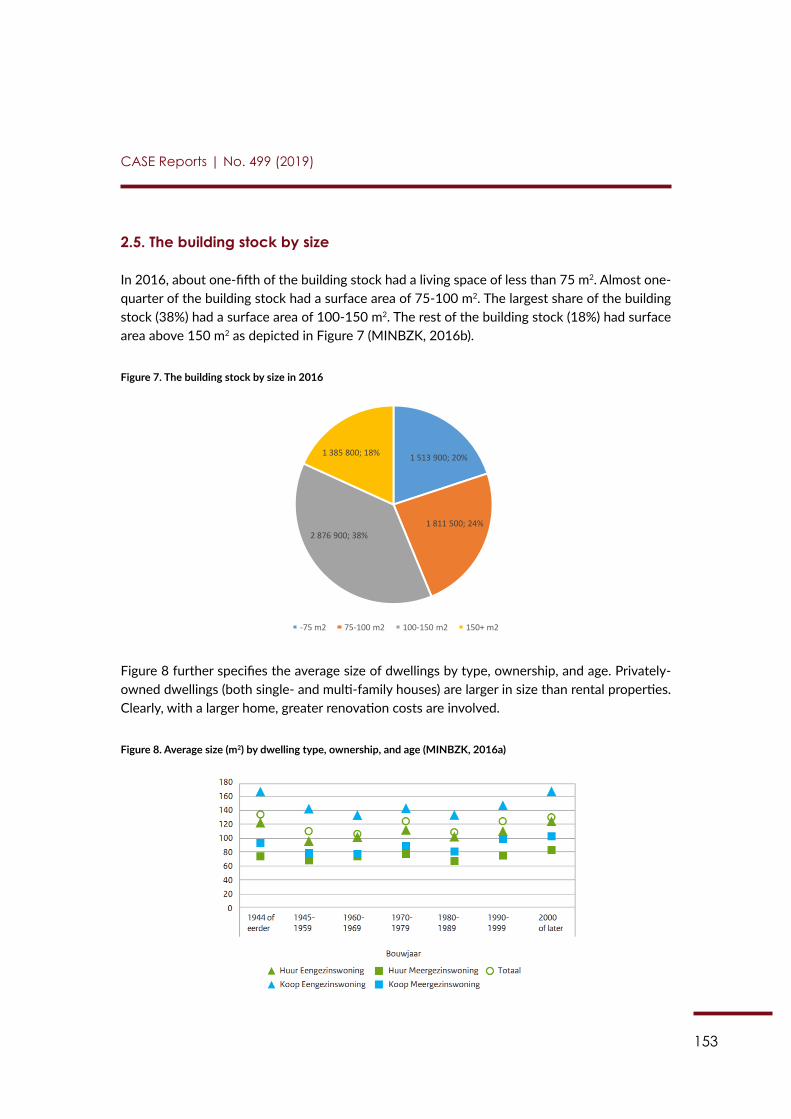
153
CASE Reports | No. 499 (2019)
2.5. The building stock by size
In 2016, about one-fifth of the building stock had a living space of less than 75 m2. Almost one-quarter of the building stock had a surface area of 75-100 m2. The largest share of the building stock (38%) had a surface area of 100-150 m2. The rest of the building stock (18%) had surface area above 150 m2 as depicted in Figure 7 (MINBZK, 2016b).
Figure 7. The building stock by size in 2016
127
2.5. The building stock by size In 2016, about one-fifth of the building stock had a living space of less than 75 m2. Almost one-quarter of the building stock had a surface area of 75-100 m2. The largest share of the building stock (38%) had a surface area of 100-150 m2. The rest of the building stock (18%) had surface area above 150 m2 as depicted in Figure 7 (MINBZK, 2016b).
Figure 7. The building stock by size in 2016
Figure 8 further specifies the average size of dwellings by type, ownership, and age. Privately-owned dwellings (both single- and multi-family houses) are larger in size than rental properties. Clearly, with a larger home, greater renovation costs are involved.
27,80%
52,60%
19,60%
Private Social rent Private rent
74,40%
19,80%
5,80%
Private Social rent Private rent
1 513 900; 20%
1 811 500; 24% 2 876 900; 38%
1 385 800; 18%
-75 m2 75-100 m2 100-150 m2 150+ m2
Figure 8 further specifies the average size of dwellings by type, ownership, and age. Privately-owned dwellings (both single- and multi-family houses) are larger in size than rental properties. Clearly, with a larger home, greater renovation costs are involved.
Figure 8. Average size (m2) by dwelling type, ownership, and age (MINBZK, 2016a)
128
Figure 8. Average size (m2) by dwelling type, ownership, and age (MINBZK, 2016a)
Note: Huur Eengezinswoning = Rental single-family home; Huur Meergezinswoning = Rental multi-family home; Koop Eengezinswoning = Private single-family home; Koop Meergezinswoning = Private multi family home; Totaal = Total.
2.6. Renovation and policy objectives In 2013, the innovation programme Energy Leap programme introduced the ‘Stroomversnelling’, a deal between Dutch building contractors and social housing associations. The ‘Stroomversnelling’ aims at refurbishing 111,000 existing homes (rental properties) to nZEBs in the year 2020. Later on, a similar programme was introduced for private homeowners. The results of the programme are however far behind schedule. In the period 2012-2016, about 3,150 nZEB were built, including two-thirds refurbished rental properties and one-third newly constructed homes (RVO, 2017). The annual share of residential buildings undergoing major renovation in the Netherlands was 1.1% in 2014 (Zebra2020, 2018). According to Zebra2020 (2018), major renovations will reduce the building’s final energy demand for heating by 50 to 80%, so not necessarily nZEBs. When it comes to costs of retrofit in these existing buildings, according to the Energiesprong (Energy Leap) policy measure fact sheet (2017): “the first completed Dutch net zero energy retrofit prototypes were piloted on terrace houses. (…) the cost of the first pilot in 2010 was approximately EUR 130,000 per unit.” However, the ambitious plans are to lower the cost “to about EUR 40,000 per unit for a terraced house”.212 Renovations can take place in all types of buildings (likewise new constructions). However, the most desired major renovations are still rare and constitute only around 1%, as Zebra2020 presents. Still, according to the simulations, “using the dynamic building stock model developed by Sartori et al., 2015, the renovation rate is quite stable for all cycles – the 40-year renovation cycle rate, that is commonly assumed to represent major or deep renovations, is stable at 1% and is expected to increase to 1.2%. The empirical results show rates at around 1% for the recent years as well. These results are nowhere close to the expected 2-3% used in legislations”.213
212 For more information see: Ref. Ares(2018)3389007 - 26/06/2018 213 Filippidou, Faidra et al. Energy renovation rates in the Netherlands – comparing long and short-term prediction methods. A+BE | Architecture and the Built Environment, [S.l.], n. 14, p. 167-194, Dec. 2018. ISSN 2214-7233. Available at: https://journals.open.tudelft.nl/index.php/abe/article/view/3553. Date accessed: 9 February 2019, p. 191.
154
CASE Reports | No. 499 (2019)
Note: Huur Eengezinswoning = Rental single-family home; Huur Meergezinswoning = Rental multi-family home; Koop Eengezinswoning = Private single-family home; Koop Meergezinswon-ing = Private multi family home; Totaal = Total.
2.6. Renovation and policy objectives
In 2013, the innovation programme Energy Leap programme introduced the ‘Stroomversnelling’, a deal between Dutch building contractors and social housing associations. The ‘Stroomver-snelling’ aims at refurbishing 111,000 existing homes (rental properties) to nZEBs in the year 2020. Later on, a similar programme was introduced for private homeowners. The results of the programme are however far behind schedule. In the period 2012-2016, about 3,150 nZEB were built, including two-thirds refurbished rental properties and one-third newly constructed homes (RVO, 2017). The annual share of residential buildings undergoing major renovation in the Neth-erlands was 1.1% in 2014 (Zebra2020, 2018). According to Zebra2020 (2018), major renova-tions will reduce the building’s final energy demand for heating by 50 to 80%, so not necessarily nZEBs. When it comes to costs of retrofit in these existing buildings, according to the Ener-giesprong (Energy Leap) policy measure fact sheet (2017): “the first completed Dutch net zero energy retrofit prototypes were piloted on terrace houses. (…) the cost of the first pilot in 2010 was approximately EUR 130,000 per unit.” However, the ambitious plans are to lower the cost “to about EUR 40,000 per unit for a terraced house”.7 Renovations can take place in all types of buildings (likewise new constructions). However, the most desired major renovations are still rare and constitute only around 1%, as Zebra2020 presents. Still, according to the simulations, “using the dynamic building stock model developed by Sartori et al., 2015, the renovation rate is quite stable for all cycles – the 40-year renovation cycle rate, that is commonly assumed to represent major or deep renovations, is stable at 1% and is expected to increase to 1.2%. The empirical results show rates at around 1% for the recent years as well. These results are nowhere close to the expected 2-3% used in legislations”.8
7 For more information see: Ref. Ares(2018)3389007 – 26/06/20188 Filippidou, Faidra et al. Energy renovation rates in the Netherlands – comparing long and short-term prediction
methods. A+BE | Architecture and the Built Environment, [S.l.], n. 14, p. 167-194, Dec. 2018. ISSN 2214-7233. Available at: https://journals.open.tudelft.nl/index.php/abe/article/view/3553. Date accessed: 9 February 2019, p. 191.
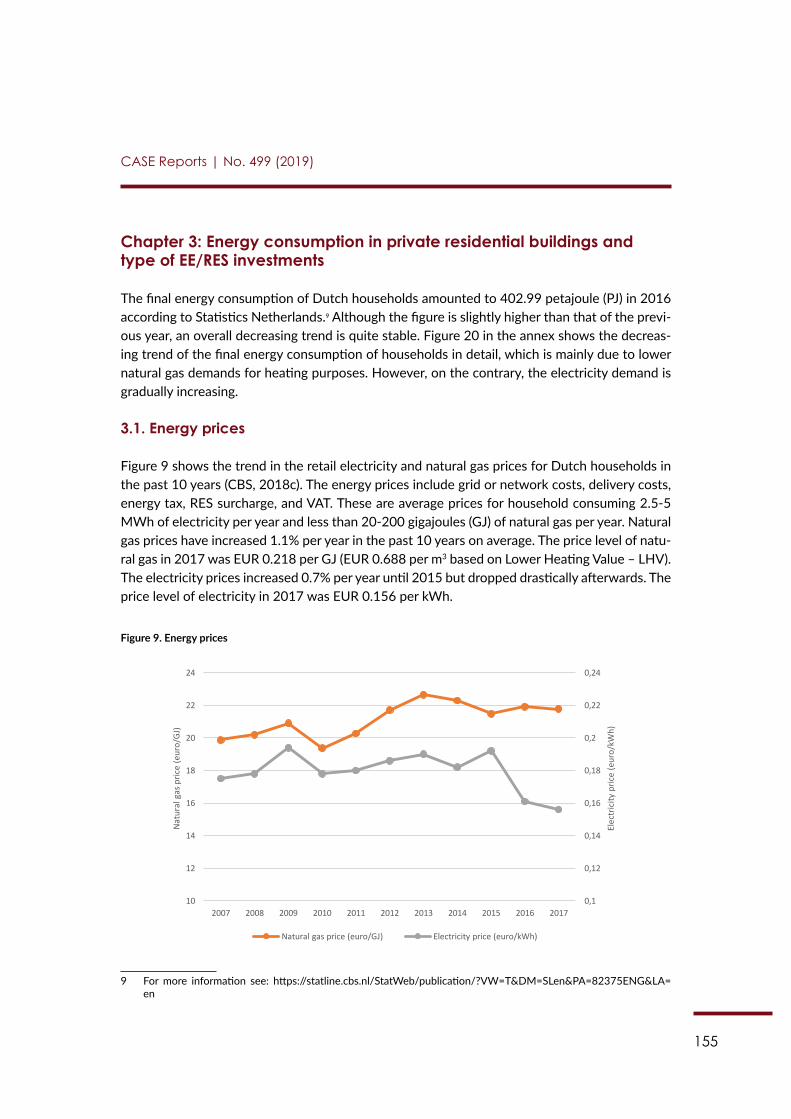
155
CASE Reports | No. 499 (2019)
Chapter 3: Energy consumption in private residential buildings and type of EE/RES investments
The final energy consumption of Dutch households amounted to 402.99 petajoule (PJ) in 2016 according to Statistics Netherlands.9 Although the figure is slightly higher than that of the previ-ous year, an overall decreasing trend is quite stable. Figure 20 in the annex shows the decreas-ing trend of the final energy consumption of households in detail, which is mainly due to lower natural gas demands for heating purposes. However, on the contrary, the electricity demand is gradually increasing.
3.1. Energy prices
Figure 9 shows the trend in the retail electricity and natural gas prices for Dutch households in the past 10 years (CBS, 2018c). The energy prices include grid or network costs, delivery costs, energy tax, RES surcharge, and VAT. These are average prices for household consuming 2.5-5 MWh of electricity per year and less than 20-200 gigajoules (GJ) of natural gas per year. Natural gas prices have increased 1.1% per year in the past 10 years on average. The price level of natu-ral gas in 2017 was EUR 0.218 per GJ (EUR 0.688 per m3 based on Lower Heating Value – LHV). The electricity prices increased 0.7% per year until 2015 but dropped drastically afterwards. The price level of electricity in 2017 was EUR 0.156 per kWh.
Figure 9. Energy prices
129
Chapter 3: Energy consumption in private residential buildings and type of EE/RES investments The final energy consumption of Dutch households amounted to 402.99 petajoule (PJ) in 2016 according to Statistics Netherlands.214 Although the figure is slightly higher than that of the previous year, an overall decreasing trend is quite stable. Figure 20 in the annex shows the decreasing trend of the final energy consumption of households in detail, which is mainly due to lower natural gas demands for heating purposes. However, on the contrary, the electricity demand is gradually increasing.
3.1. Energy prices Figure 9 shows the trend in the retail electricity and natural gas prices for Dutch households in the past 10 years (CBS, 2018c). The energy prices include grid or network costs, delivery costs, energy tax, RES surcharge, and VAT. These are average prices for household consuming 2.5-5 MWh of electricity per year and less than 20-200 gigajoules (GJ) of natural gas per year. Natural gas prices have increased 1.1% per year in the past 10 years on average. The price level of natural gas in 2017 was EUR 0.218 per GJ (EUR 0.688 per m3 based on Lower Heating Value - LHV). The electricity prices increased 0.7% per year until 2015 but dropped drastically afterwards. The price level of electricity in 2017 was EUR 0.156 per kWh.
Figure 9. Energy prices
3.2. Energy costs The total annual average energy costs for Dutch households were EUR 1,451 in 2016, based on an average electricity use of 2,803 kWh per year and 1,264 m3 of natural gas. When corrected for inflation, energy costs in 2016 remained more or less equal to the total energy costs in 2000 but peaked in between.
214 For more information see: https://statline.cbs.nl/StatWeb/publication/?VW=T&DM=SLen&PA=82375ENG&LA=en
0,1
0,12
0,14
0,16
0,18
0,2
0,22
0,24
10
12
14
16
18
20
22
24
2007 2008 2009 2010 2011 2012 2013 2014 2015 2016 2017
Elec
tric
ity p
rice
(eur
o/kW
h)
Nat
ural
gas
pric
e (e
uro/
GJ)
Natural gas price (euro/GJ) Electricity price (euro/kWh)
9 For more information see: https://statline.cbs.nl/StatWeb/publication/?VW=T&DM=SLen&PA=82375ENG&LA=en
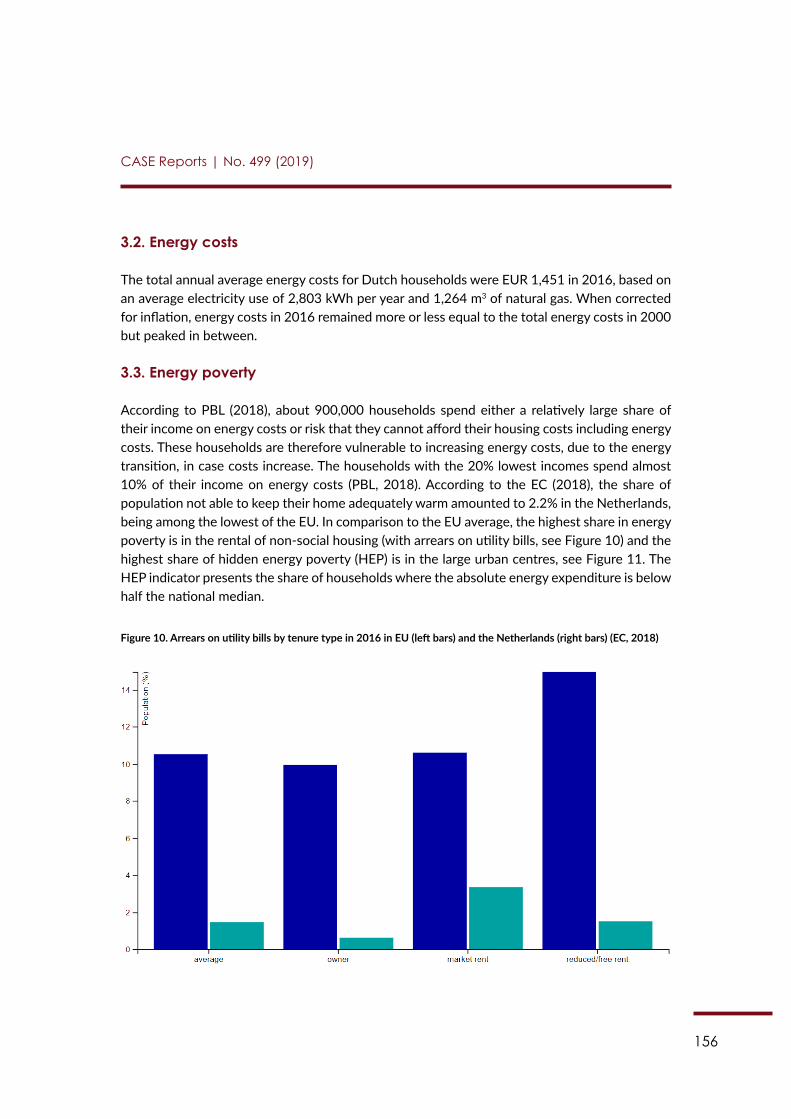
156
CASE Reports | No. 499 (2019)
3.2. Energy costs
The total annual average energy costs for Dutch households were EUR 1,451 in 2016, based on an average electricity use of 2,803 kWh per year and 1,264 m3 of natural gas. When corrected for inflation, energy costs in 2016 remained more or less equal to the total energy costs in 2000 but peaked in between.
3.3. Energy poverty
According to PBL (2018), about 900,000 households spend either a relatively large share of their income on energy costs or risk that they cannot afford their housing costs including energy costs. These households are therefore vulnerable to increasing energy costs, due to the energy transition, in case costs increase. The households with the 20% lowest incomes spend almost 10% of their income on energy costs (PBL, 2018). According to the EC (2018), the share of population not able to keep their home adequately warm amounted to 2.2% in the Netherlands, being among the lowest of the EU. In comparison to the EU average, the highest share in energy poverty is in the rental of non-social housing (with arrears on utility bills, see Figure 10) and the highest share of hidden energy poverty (HEP) is in the large urban centres, see Figure 11. The HEP indicator presents the share of households where the absolute energy expenditure is below half the national median.
Figure 10. Arrears on utility bills by tenure type in 2016 in EU (left bars) and the Netherlands (right bars) (EC, 2018)
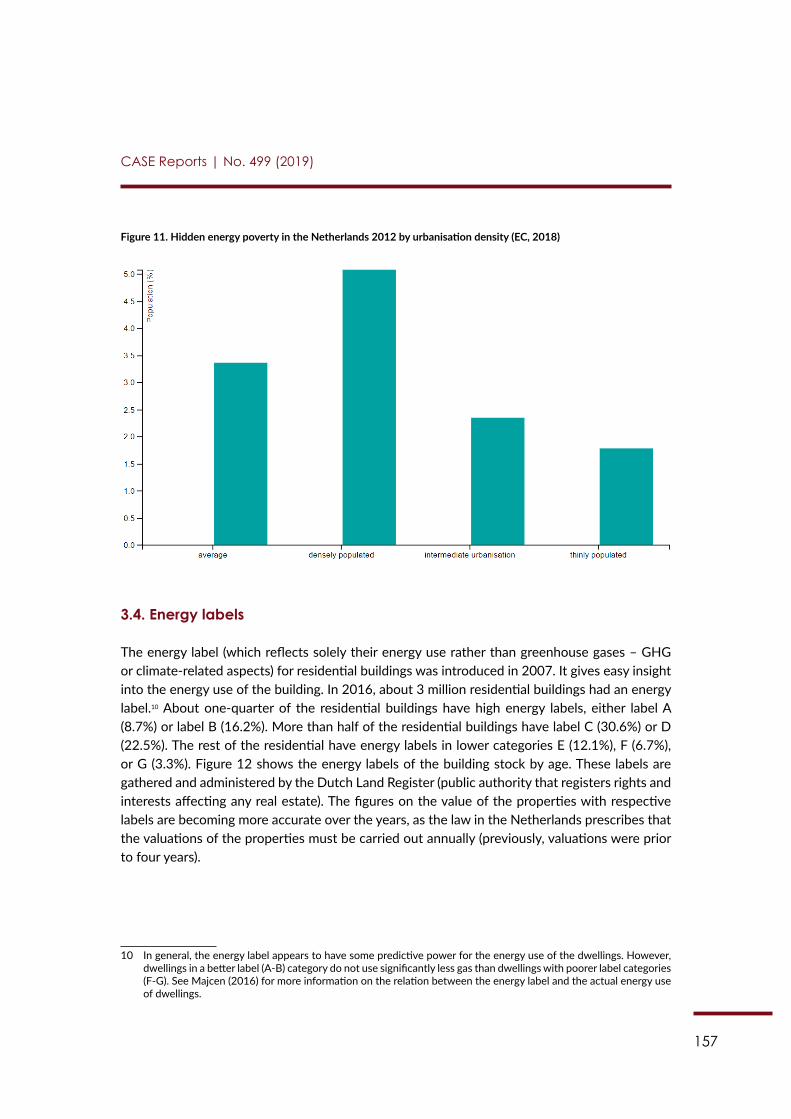
157
CASE Reports | No. 499 (2019)
Figure 11. Hidden energy poverty in the Netherlands 2012 by urbanisation density (EC, 2018)
3.4. Energy labels
The energy label (which reflects solely their energy use rather than greenhouse gases – GHG or climate-related aspects) for residential buildings was introduced in 2007. It gives easy insight into the energy use of the building. In 2016, about 3 million residential buildings had an energy label.10 About one-quarter of the residential buildings have high energy labels, either label A (8.7%) or label B (16.2%). More than half of the residential buildings have label C (30.6%) or D (22.5%). The rest of the residential have energy labels in lower categories E (12.1%), F (6.7%), or G (3.3%). Figure 12 shows the energy labels of the building stock by age. These labels are gathered and administered by the Dutch Land Register (public authority that registers rights and interests affecting any real estate). The figures on the value of the properties with respective labels are becoming more accurate over the years, as the law in the Netherlands prescribes that the valuations of the properties must be carried out annually (previously, valuations were prior to four years).
10 In general, the energy label appears to have some predictive power for the energy use of the dwellings. However, dwellings in a better label (A-B) category do not use significantly less gas than dwellings with poorer label categories (F-G). See Majcen (2016) for more information on the relation between the energy label and the actual energy use of dwellings.
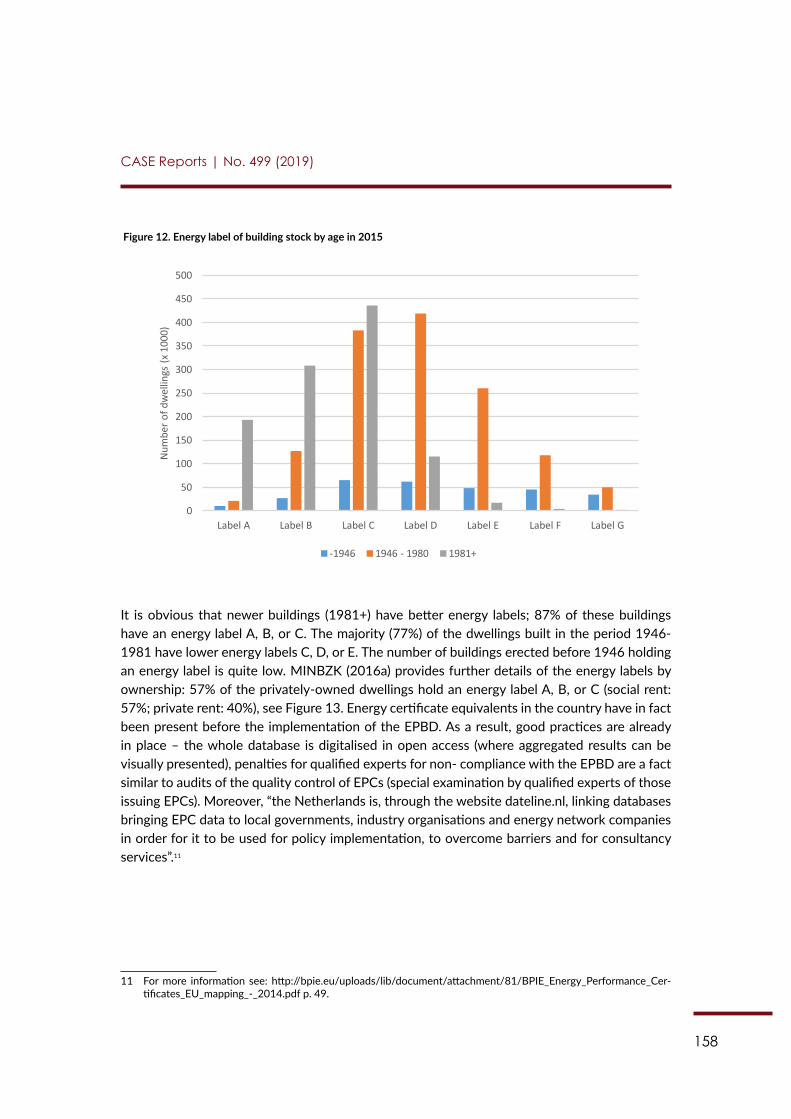
158
CASE Reports | No. 499 (2019)
Figure 12. Energy label of building stock by age in 2015
132
Figure 12. Energy label of building stock by age in 2015
It is obvious that newer buildings (1981+) have better energy labels; 87% of these buildings have an energy label A, B, or C. The majority (77%) of the dwellings built in the period 1946-1981 have lower energy labels C, D, or E. The number of buildings erected before 1946 holding an energy label is quite low. MINBZK (2016a) provides further details of the energy labels by ownership: 57% of the privately-owned dwellings hold an energy label A, B, or C (social rent: 57%; private rent: 40%), see Figure 13. Energy certificate equivalents in the country have in fact been present before the implementation of the EPBD. As a result, good practices are already in place – the whole database is digitalised in open access (where aggregated results can be visually presented), penalties for qualified experts for non- compliance with the EPBD are a fact similar to audits of the quality control of EPCs (special examination by qualified experts of those issuing EPCs). Moreover, “the Netherlands is, through the website dateline.nl, linking databases bringing EPC data to local governments, industry organisations and energy network companies in order for it to be used for policy implementation, to overcome barriers and for consultancy services”.216
216 For more information see: http://bpie.eu/uploads/lib/document/attachment/81/BPIE_Energy_Performance_Certificates_EU_mapping_-_2014.pdf p. 49.
0
50
100
150
200
250
300
350
400
450
500
Label A Label B Label C Label D Label E Label F Label G
Num
ber o
f dw
ellin
gs (x
100
0)
-1946 1946 - 1980 1981+
It is obvious that newer buildings (1981+) have better energy labels; 87% of these buildings have an energy label A, B, or C. The majority (77%) of the dwellings built in the period 1946-1981 have lower energy labels C, D, or E. The number of buildings erected before 1946 holding an energy label is quite low. MINBZK (2016a) provides further details of the energy labels by ownership: 57% of the privately-owned dwellings hold an energy label A, B, or C (social rent: 57%; private rent: 40%), see Figure 13. Energy certificate equivalents in the country have in fact been present before the implementation of the EPBD. As a result, good practices are already in place – the whole database is digitalised in open access (where aggregated results can be visually presented), penalties for qualified experts for non- compliance with the EPBD are a fact similar to audits of the quality control of EPCs (special examination by qualified experts of those issuing EPCs). Moreover, “the Netherlands is, through the website dateline.nl, linking databases bringing EPC data to local governments, industry organisations and energy network companies in order for it to be used for policy implementation, to overcome barriers and for consultancy services”.11
11 For more information see: http://bpie.eu/uploads/lib/document/attachment/81/BPIE_Energy_Performance_Cer-tificates_EU_mapping_-_2014.pdf p. 49.
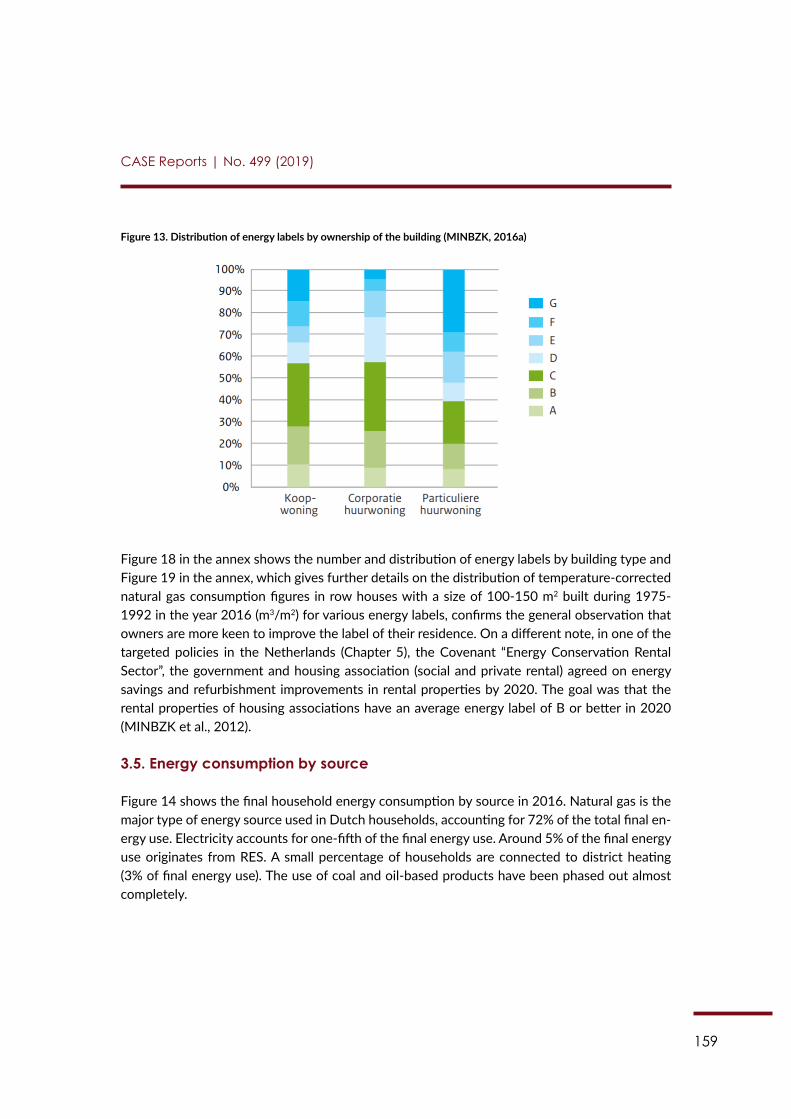
159
CASE Reports | No. 499 (2019)
Figure 13. Distribution of energy labels by ownership of the building (MINBZK, 2016a)
Figure 18 in the annex shows the number and distribution of energy labels by building type and Figure 19 in the annex, which gives further details on the distribution of temperature-corrected natural gas consumption figures in row houses with a size of 100-150 m2 built during 1975-1992 in the year 2016 (m3/m2) for various energy labels, confirms the general observation that owners are more keen to improve the label of their residence. On a different note, in one of the targeted policies in the Netherlands (Chapter 5), the Covenant “Energy Conservation Rental Sector”, the government and housing association (social and private rental) agreed on energy savings and refurbishment improvements in rental properties by 2020. The goal was that the rental properties of housing associations have an average energy label of B or better in 2020 (MINBZK et al., 2012).
3.5. Energy consumption by source
Figure 14 shows the final household energy consumption by source in 2016. Natural gas is the major type of energy source used in Dutch households, accounting for 72% of the total final en-ergy use. Electricity accounts for one-fifth of the final energy use. Around 5% of the final energy use originates from RES. A small percentage of households are connected to district heating (3% of final energy use). The use of coal and oil-based products have been phased out almost completely.
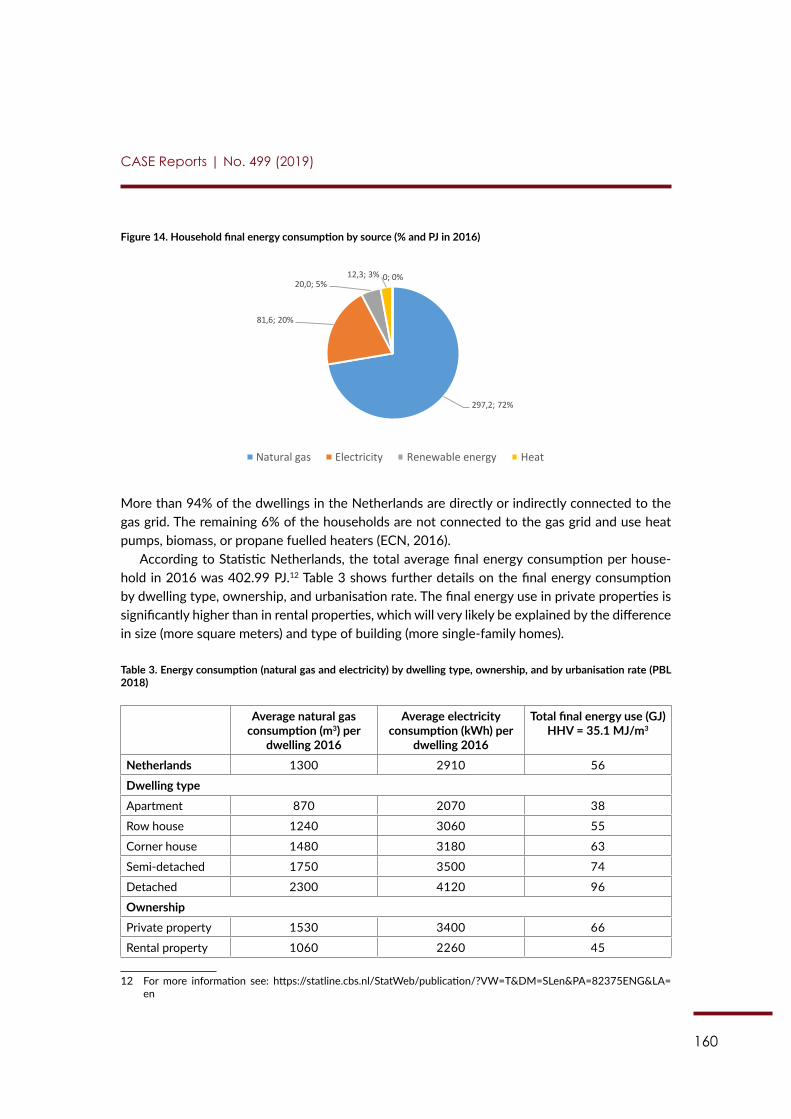
160
CASE Reports | No. 499 (2019)
Figure 14. Household final energy consumption by source (% and PJ in 2016)
134
Figure 14. Household final energy consumption by source (% and PJ in 2016)
More than 94% of the dwellings in the Netherlands are directly or indirectly connected to the gas grid. The remaining 6% of the households are not connected to the gas grid and use heat pumps, biomass, or propane fuelled heaters (ECN, 2016).
According to Statistic Netherlands, the total average final energy consumption per household in 2016 was 402.99 PJ.217 Table 3 shows further details on the final energy consumption by dwelling type, ownership, and urbanisation rate. The final energy use in private properties is significantly higher than in rental properties, which will very likely be explained by the difference in size (more square meters) and type of building (more single-family homes).
Table 3. Energy consumption (natural gas and electricity) by dwelling type, ownership, and by urbanisation rate (PBL 2018)
Average natural gas consumption (m3) per dwelling 2016
Average electricity consumption (kWh) per dwelling 2016
Total final energy use (GJ) HHV = 35.1 MJ/m3
Netherlands 1300 2910 56 Dwelling type Apartment 870 2070 38 Row house 1240 3060 55 Corner house 1480 3180 63 Semi-detached 1750 3500 74 Detached 2300 4120 96 Ownership Private property 1530 3400 66 Rental property 1060 2260 45 Degree of urbanisation Very low urbanisation 1717 3228 72 Low urbanisation 1612 3250 68 Moderate urbanisation 1441 3160 62 High urbanisation 1252 2925 54 Very high urbanisation 1125 2579 49
In non-residential buildings, swimming pools and supermarkets are the largest energy users in the Netherlands.
217 For more information see: https://statline.cbs.nl/StatWeb/publication/?VW=T&DM=SLen&PA=82375ENG&LA=en
297,2; 72%
81,6; 20%
20,0; 5% 12,3; 3% 0; 0%
Natural gas Electricity Renewable energy Heat
More than 94% of the dwellings in the Netherlands are directly or indirectly connected to the gas grid. The remaining 6% of the households are not connected to the gas grid and use heat pumps, biomass, or propane fuelled heaters (ECN, 2016).
According to Statistic Netherlands, the total average final energy consumption per house-hold in 2016 was 402.99 PJ.12 Table 3 shows further details on the final energy consumption by dwelling type, ownership, and urbanisation rate. The final energy use in private properties is significantly higher than in rental properties, which will very likely be explained by the difference in size (more square meters) and type of building (more single-family homes).
Table 3. Energy consumption (natural gas and electricity) by dwelling type, ownership, and by urbanisation rate (PBL 2018)
Average natural gas consumption (m3) per
dwelling 2016
Average electricity consumption (kWh) per
dwelling 2016
Total final energy use (GJ)HHV = 35.1 MJ/m3
Netherlands 1300 2910 56
Dwelling typeApartment 870 2070 38
Row house 1240 3060 55
Corner house 1480 3180 63
Semi-detached 1750 3500 74
Detached 2300 4120 96
OwnershipPrivate property 1530 3400 66
Rental property 1060 2260 45
12 For more information see: https://statline.cbs.nl/StatWeb/publication/?VW=T&DM=SLen&PA=82375ENG&LA=en
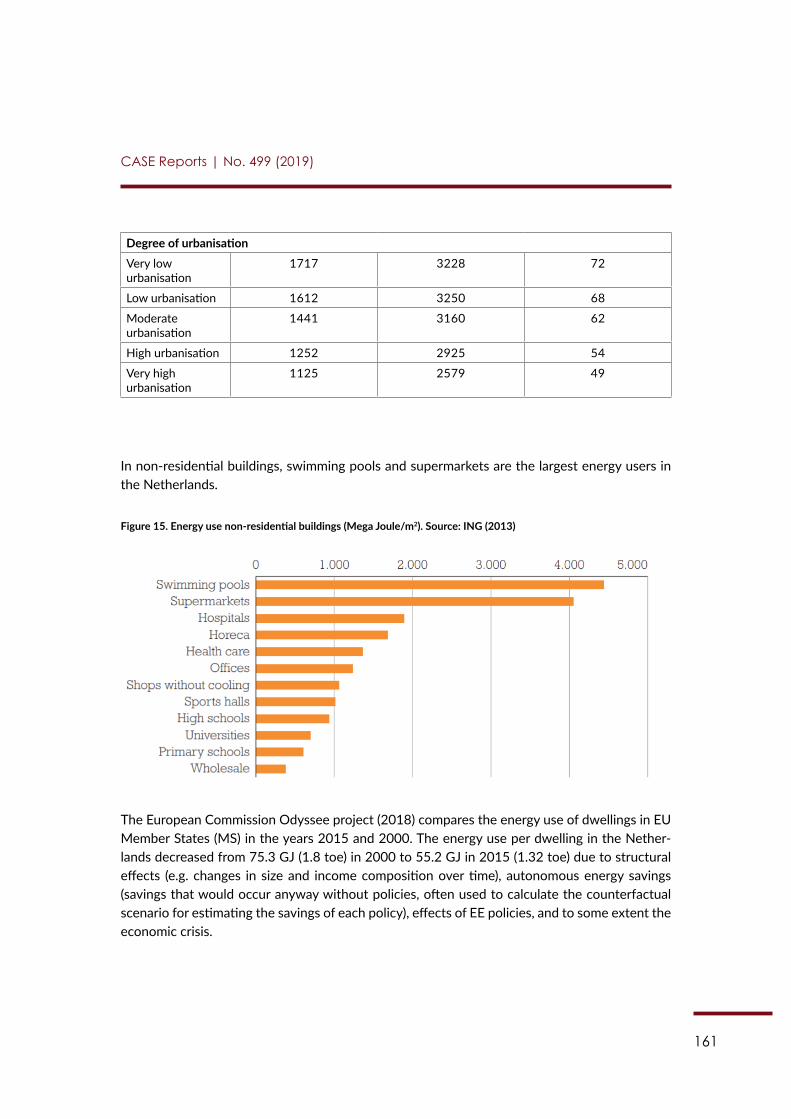
161
CASE Reports | No. 499 (2019)
Degree of urbanisationVery low urbanisation
1717 3228 72
Low urbanisation 1612 3250 68
Moderate urbanisation
1441 3160 62
High urbanisation 1252 2925 54
Very high urbanisation
1125 2579 49
In non-residential buildings, swimming pools and supermarkets are the largest energy users in the Netherlands.
Figure 15. Energy use non-residential buildings (Mega Joule/m2). Source: ING (2013)
The European Commission Odyssee project (2018) compares the energy use of dwellings in EU Member States (MS) in the years 2015 and 2000. The energy use per dwelling in the Nether-lands decreased from 75.3 GJ (1.8 toe) in 2000 to 55.2 GJ in 2015 (1.32 toe) due to structural effects (e.g. changes in size and income composition over time), autonomous energy savings (savings that would occur anyway without policies, often used to calculate the counterfactual scenario for estimating the savings of each policy), effects of EE policies, and to some extent the economic crisis.
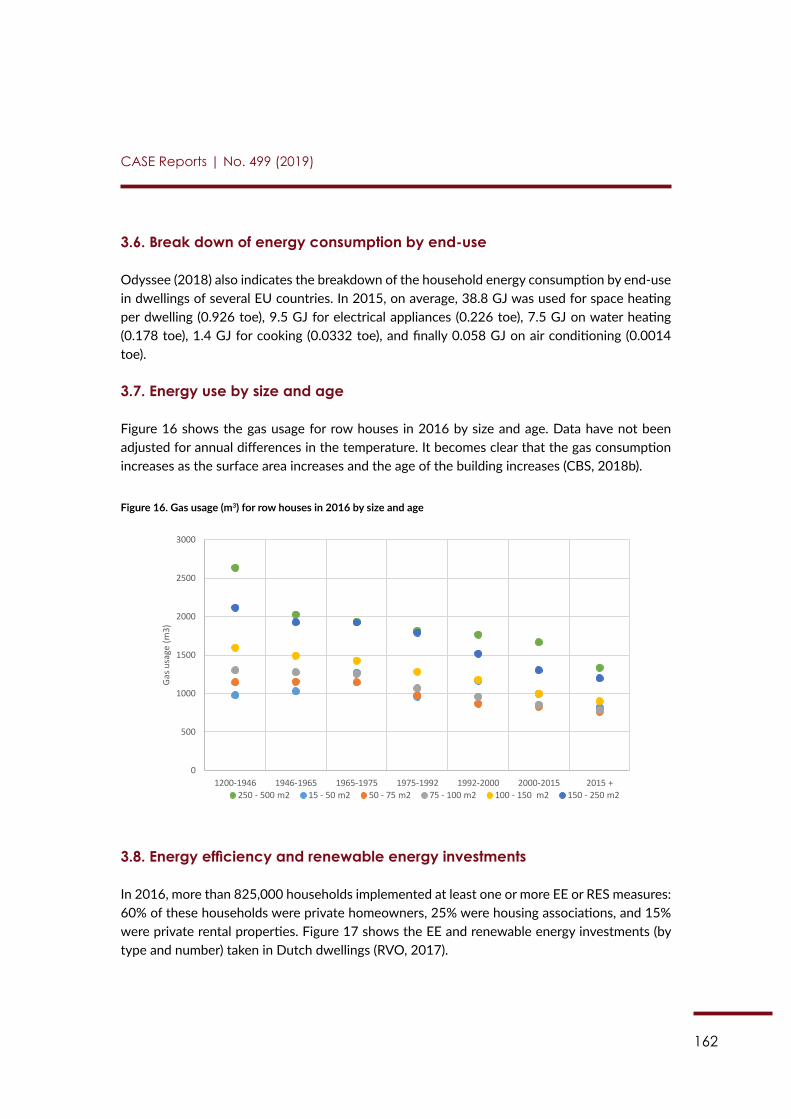
162
CASE Reports | No. 499 (2019)
3.6. Break down of energy consumption by end-use
Odyssee (2018) also indicates the breakdown of the household energy consumption by end-use in dwellings of several EU countries. In 2015, on average, 38.8 GJ was used for space heating per dwelling (0.926 toe), 9.5 GJ for electrical appliances (0.226 toe), 7.5 GJ on water heating (0.178 toe), 1.4 GJ for cooking (0.0332 toe), and finally 0.058 GJ on air conditioning (0.0014 toe).
3.7. Energy use by size and age
Figure 16 shows the gas usage for row houses in 2016 by size and age. Data have not been adjusted for annual differences in the temperature. It becomes clear that the gas consumption increases as the surface area increases and the age of the building increases (CBS, 2018b).
Figure 16. Gas usage (m3) for row houses in 2016 by size and age
136
Figure 16. Gas usage (m3) for row houses in 2016 by size and age
3.8. Energy efficiency and renewable energy investments In 2016, more than 825,000 households implemented at least one or more EE or RES measures: 60% of these households were private homeowners, 25% were housing associations, and 15% were private rental properties. Figure 17 shows the EE and renewable energy investments (by type and number) taken in Dutch dwellings (RVO, 2017).
Figure 17. Energy efficiency and renewable energy investments in Dutch dwellings 2016 (RVO, 2017)
The total number of measures taken in 2016 was 1.4 million, of which high energy efficiency (HR) boilers were the most popular EE investments.218 Due to this high replacement rate, 85% of the dwellings connected to the gas grid have an HR boiler.
218 i.e. “The Kabola HR series consists of reliable oil-fired boilers that provide 10, 14, and 20kW. The HR series is available as a boiler, with central heating boiler control, and as a combi boiler. Because of its whisper-quiet, fully automatic operation, this boiler can be used for many purposes” according to the producer: http://kabolaheaters.nl/en/category/hr-serie-boiler-en/
0
50000
100000
150000
200000
250000
300000
350000
0
500
1000
1500
2000
2500
3000
1200-1946 1946-1965 1965-1975 1975-1992 1992-2000 2000-2015 2015 +
Gas
usa
ge (m
3)
250 - 500 m2 15 - 50 m2 50 - 75 m2 75 - 100 m2 100 - 150 m2 150 - 250 m2
3.8. Energy efficiency and renewable energy investments
In 2016, more than 825,000 households implemented at least one or more EE or RES measures: 60% of these households were private homeowners, 25% were housing associations, and 15% were private rental properties. Figure 17 shows the EE and renewable energy investments (by type and number) taken in Dutch dwellings (RVO, 2017).
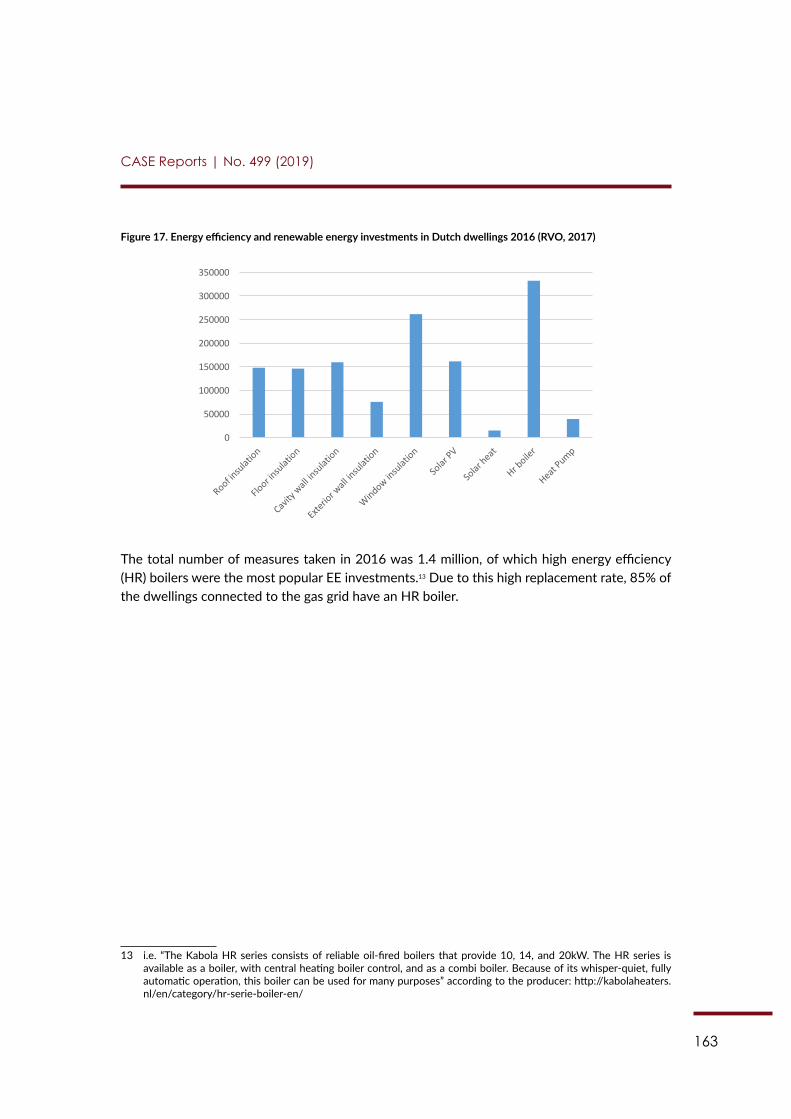
163
CASE Reports | No. 499 (2019)
Figure 17. Energy efficiency and renewable energy investments in Dutch dwellings 2016 (RVO, 2017)
136
Figure 16. Gas usage (m3) for row houses in 2016 by size and age
3.8. Energy efficiency and renewable energy investments In 2016, more than 825,000 households implemented at least one or more EE or RES measures: 60% of these households were private homeowners, 25% were housing associations, and 15% were private rental properties. Figure 17 shows the EE and renewable energy investments (by type and number) taken in Dutch dwellings (RVO, 2017).
Figure 17. Energy efficiency and renewable energy investments in Dutch dwellings 2016 (RVO, 2017)
The total number of measures taken in 2016 was 1.4 million, of which high energy efficiency (HR) boilers were the most popular EE investments.218 Due to this high replacement rate, 85% of the dwellings connected to the gas grid have an HR boiler.
218 i.e. “The Kabola HR series consists of reliable oil-fired boilers that provide 10, 14, and 20kW. The HR series is available as a boiler, with central heating boiler control, and as a combi boiler. Because of its whisper-quiet, fully automatic operation, this boiler can be used for many purposes” according to the producer: http://kabolaheaters.nl/en/category/hr-serie-boiler-en/
0
50000
100000
150000
200000
250000
300000
350000
0
500
1000
1500
2000
2500
3000
1200-1946 1946-1965 1965-1975 1975-1992 1992-2000 2000-2015 2015 +
Gas
usa
ge (m
3)
250 - 500 m2 15 - 50 m2 50 - 75 m2 75 - 100 m2 100 - 150 m2 150 - 250 m2
The total number of measures taken in 2016 was 1.4 million, of which high energy efficiency (HR) boilers were the most popular EE investments.13 Due to this high replacement rate, 85% of the dwellings connected to the gas grid have an HR boiler.
13 i.e. “The Kabola HR series consists of reliable oil-fired boilers that provide 10, 14, and 20kW. The HR series is available as a boiler, with central heating boiler control, and as a combi boiler. Because of its whisper-quiet, fully automatic operation, this boiler can be used for many purposes” according to the producer: http://kabolaheaters.nl/en/category/hr-serie-boiler-en/
164
CASE Reports | No. 499 (2019)
Chapter 4: Barriers to develop the EE/RES potential in private buildings
Primarily, the overall target in the Netherlands is a fossil free (CO2 neutral) built environment by 2050, which would require the retrofitting of approximately 200,000 dwellings per year. Nev-ertheless, there are still several barriers in the Dutch building market that need to be overcome in order to achieve the renovation target and subsequently the EE and climate targets from the building sector. These barriers include primarily capacity (signifying that given the ambi-tious plans, there is a lack of qualified contractors to cover this demand); economic, financial, and technical barriers; lack of leadership; split incentives; lack of information / knowledge; and institutional barriers.
Economic/financial
One of the biggest economic and financial barriers to undertaking EE renovations in the built environment are that the investment requirements for refurbishing private properties do not often fulfil the acceptable profitability level criteria of typical financing institutions; hence, the investment risk even for “safe” investments is perceived as high (also due to the fact that banks and financing institutions do not take into account energy costs in their risk assessments). The incoming cash flows from such investments, as a result of energy savings, and the risk premium must be clearly demonstrated thus to the investors under EuroPACE.
Technical
The more innovative and potentially more energy saving technologies in the built environment in some cases might thus far have a low penetration rate in the market (where the energy savings are hence not widely demonstrated yet), as well as in large construction companies that tend to operate with their existing structures, processes, and materials. This could be a negative factor for EuroPACE as it can increase the cost of the process implementation at least in the short run.
Furthermore, as shown in Section 2, the age of many of the private buildings is also a negative factor. A large number of the buildings in main cities (such as Amsterdam, Utrecht and others) are heritage protected, which is an extra barrier to implementing interventions in the building envelope. Most importantly, the old age of these buildings makes them the least energy efficient of the building stock. Qualified contractors, who can also undertake the bureaucratic processes that surround permission to have the building work done, can make own requests for building permits, and also execute building plans and blueprints, are therefore needed to overcome this barrier. The costs for EuroPACE in this case could thus increase due to the building permit pro-cess. In order to facilitate this step, the Dutch government has developed the “all-in-one permit for physical aspects”,14 which can also be linked directly to a subsidy scheme request (shown in Chapter 5), and additional information on which elements in the refurbishment of each property
14 For more information see: https://business.gov.nl/regulation/applying-for-all-in-one-permit-physical-aspects/

165
CASE Reports | No. 499 (2019)
require permits are provided through an online tool “Verbouwkompas.nl”. Through this tool, the technical requirements in terms of 10 key renovation interventions are present, which deter-mine the requirements for a building permit (for instance, in energy supply interventions like heat pumps or rooftop photovoltaics (PVs), an agreement with the homeowners association is required – often the latter acts as an aggregator for bundling individual projects to make them financially attractive).
Lack of information and knowledge
Another important barrier is the information gap on EE in households. From a household study carried out in Utrecht (UU, 2010; PBL, 2017), the barriers documented as having the greatest influence in the investment uptake were the uncertainty on the costs and benefits of the en-ergy saving options, the split incentive in the case of rental properties, and the perception that energy costs are not an important item in overall family costs. As Lanting (2010) stated, in the Netherlands, there is a steady demand for better use of communication methods to overcome professional barriers that exist in the building sector. This needs to reflect the fact that knowl-edge is not transferred efficiently among relevant stakeholders in EE and renovation companies and stakeholders related to the building sector. The engagement of municipalities in this debate could help in accelerating the public debate and increasing awareness.
Lack of leadership
Several studies (such as Climate KIC, 2016) demonstrated that stakeholders in the Netherlands related to the built environment (from housing associations to construction companies and ten-ants) are not yet in the position to lead the promotion of EE-oriented actions accordingly. This is also one of the outcomes of the Climate Agreement (Section 5), which tries to create a collective effort in undertaking the required investments. Nevertheless, there are already new pilot proj-ects and increasing experience with energy neutral approaches in the building market, primarily from small or new building contractors with the assistance of local energy entities created by municipal governments – this signifies that the engines behind this transition at this stage are the smaller players. Still, Zero Energy, Fossil Free, Carbon Neutral, or “Nul-op-de-Meter” (“Net zero energy”) can be considered as new concepts in the market and the Climate Agreement sets the basis for a better understanding and the adoption of the best practices. Despite these new concepts and the ambitious plans, as mentioned above, there is a relative shortage of skilled contractors to cover the growing demand (i.e. renovation companies). The presence of such companies can also overcome the licensing issues (as they often undertake the entire process of applying and executing building permits).
166
CASE Reports | No. 499 (2019)
Split incentives
Next to the scientific approaches in the tenant – landlord problem on EE, in practical terms, the standard split incentive problem in EE uptake in buildings is a dominant factor in the Dutch housing market, particularly for mechanisms such as EuroPACE which is focused on privately-owned households. As Flaubinger (2015) indicates, most residents in cities are tenants and the ownership of property is relatively low. As in most cases like this, tenants lack an incentive to invest in “hard” measures with a higher energy saving potential (such as insulation) involving substantial investments, while they are more accustomed to “softer” measures usually typical for light renovation. There are two issues in this regard that aggravate the problem: a) the tenure contracts in the cities due to the high demand is normally short- to medium-term, reducing the tenants’ and owners’ interest and b) there is a ceiling in the rental price (as in the case of Amster-dam, for instance), calculated based on the property condition, size, location, level of comfort, and energy label. Still, due to high demand and competitive prices, the ceiling is often reached with a relatively weak energy performance label. When considering the ownership chain, the main owners are housing associations (about 75% of the rental stock) that cannot transfer the costs due to insulation investments to tenants; hence, their motivation is also low.
Institutional
Finally, there are also institutional barriers, like a lack of cooperation between the tenants or homeowners and the financing or implementing bodies, and the problem that energy savings is not a core activity or product in the activities of financing bodies.
Likewise (UU, 2010), the majority of respondents owning an apartment/home replied that the main reasons for not undertaking EE renovations is that the costs are too high, they consider their houses as not high energy consuming, and they are not aware of the realistic options that can be appropriate for them. Furthermore, in terms of perceptions on EE uptake, homeowners consider that the main reasons for undertaking such actions are lower energy bills, extra comfort indoors, and care for the climate and environment, while from the perspective of professionals in EE, they consider that consumers undertake investments due to lowering energy bills and due to possible subsidies. What is striking is that consumers do not yet see the price effect in their building/apartment in the future as a reason for investing in EE, contrary to what professionals tend to believe. Such discrepancies in opinions and perceptions are presented in Table 4.
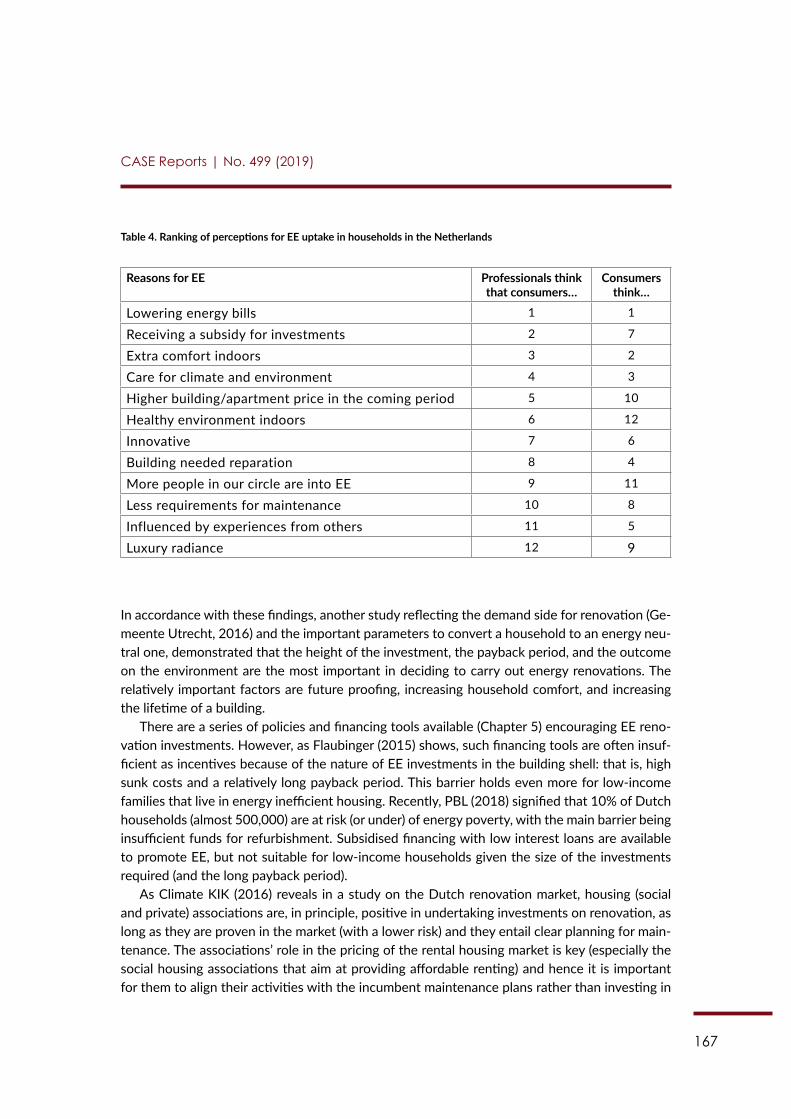
167
CASE Reports | No. 499 (2019)
Table 4. Ranking of perceptions for EE uptake in households in the Netherlands
Reasons for EE Professionals think that consumers…
Consumers think…
Lowering energy bills 1 1
Receiving a subsidy for investments 2 7
Extra comfort indoors 3 2
Care for climate and environment 4 3
Higher building/apartment price in the coming period 5 10
Healthy environment indoors 6 12
Innovative 7 6
Building needed reparation 8 4
More people in our circle are into EE 9 11
Less requirements for maintenance 10 8
Influenced by experiences from others 11 5
Luxury radiance 12 9
In accordance with these findings, another study reflecting the demand side for renovation (Ge-meente Utrecht, 2016) and the important parameters to convert a household to an energy neu-tral one, demonstrated that the height of the investment, the payback period, and the outcome on the environment are the most important in deciding to carry out energy renovations. The relatively important factors are future proofing, increasing household comfort, and increasing the lifetime of a building.
There are a series of policies and financing tools available (Chapter 5) encouraging EE reno-vation investments. However, as Flaubinger (2015) shows, such financing tools are often insuf-ficient as incentives because of the nature of EE investments in the building shell: that is, high sunk costs and a relatively long payback period. This barrier holds even more for low-income families that live in energy inefficient housing. Recently, PBL (2018) signified that 10% of Dutch households (almost 500,000) are at risk (or under) of energy poverty, with the main barrier being insufficient funds for refurbishment. Subsidised financing with low interest loans are available to promote EE, but not suitable for low-income households given the size of the investments required (and the long payback period).
As Climate KIK (2016) reveals in a study on the Dutch renovation market, housing (social and private) associations are, in principle, positive in undertaking investments on renovation, as long as they are proven in the market (with a lower risk) and they entail clear planning for main-tenance. The associations’ role in the pricing of the rental housing market is key (especially the social housing associations that aim at providing affordable renting) and hence it is important for them to align their activities with the incumbent maintenance plans rather than investing in
168
CASE Reports | No. 499 (2019)
new “unexplored” areas (following also the entire sectors’ risk averse attitude). The next actor in the market chain, the largest building contractors, are aware of these renovation practices but tend to minimise risks in both production and processes and their upscaling, not being able thus to steer the deep retrofit in the housing market. In the lower end of the chain, the smaller build-ing contractors are more eager to explore possibilities with different suppliers and undertake innovative projects. They can take away inefficiencies at the building site and can agree on more innovative projects with the building residents (as end users). Still, both large and small-medium contractors require support from local governments and provinces, which have concrete urban plans but are often lacking capacity and competences.
Based on the same study, innovative EU or national funds are not easily accessible or in-teresting for companies in the building sector due to the conditions for applying (including the submission, timing, and upfront investments required as well as the uncertain percentage of suc-cess). The construction plans for buildings are sold to end users priced on working hours, tech-niques, and materials, thus this means of organisation does not enable innovation. Construction companies and project developers bid on the end price, and hence optimise low costs in the value chain and compete on the project basis, rather than the product basis (i.e. contractors aim at offering a low aggregated cost on labour, capacity, and materials, rather than providing inno-vative energy performance solutions for the end-clients). This lock in effect of the construction sector is a standard one, which applies to most energy savings market actors in general. Never-theless, there is growing support and a steady legislative framework that determines the future trajectories of building construction and renovation (such as the regional authorities determin-ing the local energy plans and the planning for phasing out natural gas from the households).
From another survey carried out in the Energy Efficiency Watch 3 (EEWS) project15 on the EPBD in the Netherlands, there is no consensus on whether the incumbent policies and regula-tory framework are sufficient to capture the EPBD obligations and nZEBs. As shown in Chapter 5, EE requirements for new buildings (next to product energy labelling) are considered as the most effective, while programmes for local energy – urban planning and EE requirements for renovated buildings – were found partly effective in the Dutch context. In contrast, the worst score in the survey was attributed to the energy certification of buildings (among the lowest ratings of all MS). A common perception is that the education and training of professionals in the building sector is required in order to integrate the EE aspects of planning in the overall construction concept. As a whole, in the EEW3 study, experts in the building sector consider that the overall ambition of incumbent EE policies is still relatively low. The recent Climate Agreement (see Chapter 5) has led to a mutual understanding among policymakers, institutional representatives, and interest groups. It is also seen as positive that a monitoring system was set up that provides regular reports on progress. Still, what remains to be seen is the promotion and implementation of the measures at a higher speed in order to provide the correct signals in the market and overcome the established barriers (such as the aforementioned landlord-tenant dilemma).
15 For more information see: http://www.energy-efficiency-watch.org/
169
CASE Reports | No. 499 (2019)
Chapter 5: Policies related to EE/RES in buildings
5.1. EPBD in the Netherlands
Policies in the Netherlands for the building sector have been under constant change in recent years and are significant in terms of the targets pursued and the funding provided. A short analy-sis on the implementation of the Energy Performance of Buildings Directive (EPBD) is presented below and is based on the reports of the Concerted Action on EPBD.16
5.1.1. Energy performance requirements: existing buildings
Major renovations (defined when more than 25% of the building envelope is renovated) in the existing building stock must possess a building permit, which guarantees minimum requirements for building components, for example, the R-value of the walls, roof, and floor and the U-value of windows and doors. In the former regulations under the Energy Agreement (2013) in the Netherlands, which was a covenant with all market parties, the starting point was the building owners (in the form of citizens, companies, and social and private housing associations) have self-interest in investing in renovation and all forms of support must be directed towards them. Following the Energy Agreement, a new package of supporting measures (under the National Energy Exploration in 2015) was adopted in 2016, of which, for instance, the label C obligation for the tertiary sector (such as offices) is the most important for energy savings in the built en-vironment. A number of measures to stimulate EE in the built environment are foreseen in the near future. The focus is on the application of alternative high-efficiency systems during major renovations. Extra attention will be given to enlarge the economic value of the Energy Perfor-mance Certificates during the selling and buying process of houses and buildings. The subse-quent legislation was, in 2016, under the Energy Agenda, which also sets the energy targets for 2050 and is where the renovation strategy in the long run is analysed.
Although applicable to all EU countries, cost optimality is very important in the Netherlands. From the perspective of the cost-optimal methodology of the EPBD (Peek et al., 2018), an analysis of the efficiency of energy saving measures at the building level sets the baseline, which is assessed for each building type with the cost-optimal level and compared with the national requirements for existing buildings. To facilitate this process, the cost-optimal level of each mea-sure is prescribed in order to enable a comparison with the component requirements. In more detail, the standard calculation period from the cost-optimal methodology is 30 years for resi-dential and public buildings and 20 years for commercial and non-residential ones. The costs in-cluded in the calculation are investment, maintenance, reinvestments, and demolishing, effects on energy costs and any other residual value, and costs of CO2 emissions. The cost-optimal level is defined as the situation in which the net present costs reach a minimum level over the calcula-
16 For more information see: https://www.epbd-ca.eu/
170
CASE Reports | No. 499 (2019)
tion period. A cost-optimal level only applies if the total net present costs are less than zero. In this case, the measure is cost-effective and pays for itself on the basis of the assumptions made. In the financial calculation, the investment in a cost-optimal energy-saving measure therefore pays for itself by means of savings on energy costs. As the macroeconomic calculation also takes the costs of CO2 emissions into account, the investment in an energy-saving measure will pay for itself more quickly in this case. After all, savings are also made in relation to the costs of CO2 emissions in addition to the energy costs saved.
In terms of policies for existing buildings, Energy Performance Certificates have been in place since 2008 and more than 3.5 million EPCs (> 50% total building stock; residential, commercial, and public buildings) have been registered under this legislation17 (with the majority being in the rental sector, around 67% in 2017). More than half of the EPCs are at an acceptable value (for instance, 29% follow labels A, B and 31% label C), where, according to ING,18 an interesting market reaction is that buildings with an A or B label are sold at a higher speed and can gener-ate an extra income of EUR 6,000 (related to those with a C or D label), while those with an F label generate EUR 12,000 less value. The increase in the adoption of EPCs in the transaction is almost eightfold, as in 2017, 88% of sold properties had an EPC in comparison to less than 10% in 2014. Experience has demonstrated that the new simplified label has been endorsed by homeowners (in contrast to the previous one which was mainly technical and expensive). The advice associated with the new label has raised awareness among homeowners on EE and has triggered updates in the buildings in order for them to upgrade their label. Likewise, financing institutions have started realising the value of the label and some impacts on mortgage offers are documented.
5.1.2. Energy performance requirements: new buildings
For new buildings, energy performance requirements in the Netherlands are updated regularly with a shift towards nZEB. The change towards more demanding requirements took place as a result of “tightening studies”. These studies included an analysis of the market penetration of EE measures, RES applications, and energy-efficient heating and cooling generators.
Based on the Dutch Housing Act, for new buildings, a distinction is made between the en-ergy performance requirements for each type of use and safety-net requirements (generic re-quirements) for the insulation of the building envelope (Peek et al., 2018).
The main requirement for the energy performance of new buildings is the energy perfor-mance coefficient (in Dutch, the “energieprestatiecoefficient’), setting the minimum energy per-formance (MEP) for new buildings. The calculation of the energy performance coefficient is mandatory for all new buildings and for large renovations in houses and offices. The energy performance coefficient was tightened in 2015 as an intermediate step to reach the nZEB level.
17 For more information see: https://www.rvo.nl/onderwerpen/duurzaam-ondernemen/gebouwen/wetten-en-re-gels-gebouwen/bestaande-bouw/energielabel-woningen
18 For more information see: https://www.ing.nl/media/EBZ_ING-Saving_Energy_in_the_Netherlands-May_2013_tcm162-33115.pdf
171
CASE Reports | No. 499 (2019)
The next step will be to specify the demands on primary energy consumption and the share of RES up to the nZEB level.
No requirements exist in the Netherlands for separate EE measures for technical building systems. Instead, the total building has to reach a level of efficiency indicated by the energy performance coefficient. This way, builders and developers are given the freedom to choose the most cost-efficient solution in regard to the envelope and the technical building system of that particular building.
The Dutch government supports programmes from intermediary organisations, such as “NEPROM” (an organisation of project developers) and “Bouwend Nederland” (an organisation of builders), aimed at preparing the market players for the increased demands to reach the nZEB level for new buildings. RVO maintains a database with examples of nZEBs already constructed.
5.2. Climate Agreement (Klimaat Akkoord)
The current framework policy Netherlands in the years to come in is the “Climate Agreement” (Klimaatakkoord19), which prescribes a series of actions on EE and climate change. The most relevant for the performance of buildings are the following:
Mandatory insulation and demand for heating
The real estate market will steer the insulation process in the buildings, as financial incentives will be present for insulating the building in each purchase/selling. In case this process is not adopted by the market, suggesting a great chance for development of EuroPACE, insulation will be mandatory as of 2030. Furthermore, there will be a norm (calculated on kWh/m2) for the maximum allowed heating demand in buildings (as of 2021).
Financing linked to buildings
Importantly for EuroPACE, the government is currently considering enabling financing means to be linked to and depend on building conditions. The loan thus would not be attached to a person but to the building itself and the main point for such loans is that the monthly instalments should not be higher than the realised energy savings financed by these loans. This type of finance can remove the risk that homeowners face in investing in their properties, since the market value is volatile, and the energy component is only one of the parameters (often minor still) that can determine the value of the property. The building-attached loan for financing energy saving investments decouples the payback with the market value of the property. Through this type of loan, the property owner is not responsible for the entire payback of the loan, while the next owner of this property will carry over the payment of the remaining amount and the bank will check his/her credibility in paying the remaining instalments. At this stage, there is still an open
19 For more information see: http://www.klimaatakkoord.nl
172
CASE Reports | No. 499 (2019)
debate at both the policy and market levels of how these building related loan schemes will be operationalised, through overcoming legal and financial hurdles. The main issues highlighted in these private financing schemes are the split incentive, the trust in carrying out the payments to cover the loan, and the enforcement aspects in case the loan is not being repaid. Some op-tions indicatively mentioned focus on payment through a specific municipal tax. In this case, the homeowner would pay the monthly instalments of the building-attached loan through a tax raised by the municipality and the amounts collected would be attributed to the financing in-stitution. This tax can also be linked to the real estate tax that they raise and administer in their jurisdictions (next to a series of other such taxes like the waste collection levy, the sewage levy, the water board tax, and the water purification levy). The municipalities are allowed to decide on the level of the taxes (with some ceilings imposed) but cannot introduce a new tax as such. An alternative to that (in order to reduce the risk of the individual municipalities raising new taxes and being challenged by the next homeowner) could be the creation of a provincial guarantee fund that determines the role of the municipality (which can also be more active in undertaking the financing or setting the requirements for energy saving technologies). These considerations are particularly important for EuroPACE – financing linked to the building and repaid exactly together with the property tax.
Almost 100,000 households disconnected from the gas grid by 2022
This target translates to 50,000 of these households connecting to heat networks, with the other half connecting to hybrid or collective heat pumps. After 2021, the rate of disconnection from the gas grid must increase to 200,000 households per year. The role of the housing asso-ciations as aggregators in reaching this target is very important. Furthermore, the agreements on the transition for each neighbourhood will be discussed with the housing associations and municipalities in order to best address the needs.
Prohibition of natural gas connection for new buildings
As of July 2018, all new buildings must not be connected to the gas grid; hence, project develop-ers and construction companies must plan their building projects for alternative networks. This is an important factor for potential construction companies carrying out refurbishment under EuroPACE.
Scaling up geothermal and aqua-thermal capacity
The planned market incentives will scale up the offer of geothermal and aqua-thermal energy in the buildings from 3 PJ to 50 PJ (also including the capacity from water companies).
173
CASE Reports | No. 499 (2019)
5.3. Financing schemes in the residential sector
There are several subsidy and grants schemes in the Netherlands related to the renovation of residential buildings, with different target groups and financing terms, as explained below.
Incentive scheme for the energy performance of social housing20
This measure provides financing to social housing associations to improve the energy perfor-mance of social housing. As a rule, the total housing service costs (such as rent, services, and energy costs charged) cannot be increased due to the renovation of the building. Furthermore, it refers purely to the residential sector (meaning the residential buildings that are converted to non-residential ones – such as offices – are excluded) and the norm of the rental price (below the market price) must be maintained during the investment period. One of the parameters de-termining the size of the financial support is the Energy Index of each building, which, after the investment takes place, must be able to demonstrate the energy performance has improved and the new Energy Index must be higher.
Energy investments allowance (EIA)21
The Energy Investments Allowance scheme enables all companies (including construction com-panies that carry out refurbishment or construction in private residential buildings) that invest in EE to pay less income and company tax (about 13.5% tax advantage). The technologies that are eligible to be financed under this scheme are prescribed in an updated list of measures – the “Energy List” (2018).22 On average, companies that make use of this instrument can deduct 54.5% of the investment costs from the fiscal profits, on top of the usual depreciation.
Environmental investment rebate (MIA) and Arbitrary depreciation of environmental investments (VAMIL)23
These two different financing schemes enable all companies (including construction companies that carry out refurbishment or construction to private residential buildings) to invest in envi-ronmentally friendly products or company resources with a tax advantage to bring innovative environmentally friendly products into the market more quickly. Through the MIA, a company can deduct up to 36% of the investment costs of an environmentally friendly investment on top of the regular tax deductions for investments, and with the VAMIL, the company can also write off these investment costs, thus providing more liquidity. The eligible technologies that can be
20 For more information see: https://www.energypoverty.eu/measure-policy/incentive-scheme-improve-energy-per-formance-social-housing
21 For more information see: https://www.rvo.nl/subsidies-regelingen/energie-investeringsaftrek-eia22 For more information see: https://www.rvo.nl/subsidies-regelingen/energie-investeringsaftrek-eia/energielijst/en-
ergielijst-2018 23 For more information see: https://www.rvo.nl/subsidies-regelingen/mia-en-vamil
174
CASE Reports | No. 499 (2019)
financed under both schemes are prescribed in the updated Environment List.24 This includes 270 technologies of which a large share refer to sustainable buildings and renovation.
Subsidy for energy savings in own household25
This subsidy scheme refers to homeowner associations (“Vereniging van Eigenaren”) that are in-terested in undertaking energy saving investments in their proprieties. Based on this, an associa-tion can apply for this subsidy (once per association) for a variety of measures, namely: energy advice through a certified energy performance advisor and energy advice with energy process guidance. In addition, associations can apply for the direct funding of energy saving measures, coupled with additional measures, if each application refers to one building. Furthermore, this energy advice can be coupled to the building maintenance plans of the associations and the maximum amount per apartment is EUR 20,000.
Incentive regulation for energy performance in the rental sector (STEP)26
This incentive scheme refers to housing associations that rent houses where the rent is below the liberalisation limit and aims at improving the energy performance of the existing rental prop-erties. The total amount of the scheme is a EUR 395 million subsidy.
5.4. Policies for energy poverty in the residential sector
In order to combat the increase in energy poverty, the Netherlands has set a series of actions, as described below.
Disconnection protection for households27
This measure provides a safety net and additional safeguards against disconnection for vulner-able households (small and medium electricity and gas use) and prohibits the disconnection of all households during the winter (1 October – 1 April). A household consumer is considered vul-nerable if the termination of the transport or the supply of electricity or gas would result in very serious health risks to the consumer or a member of the same household.
24 For more information see: https://www.rvo.nl/sites/default/files/2017/12/Milieulijst%202018.pdf 25 For more information see: https://www.rvo.nl/subsidies-regelingen/subsidie-energiebesparing-eigen-huis26 For more information see: https://www.rvo.nl/subsidies-regelingen/stimuleringsregeling-energieprestatie-huur-
sector-step27 For more information see: https://wetten.overheid.nl/BWBR0030164/2018-05-01
175
CASE Reports | No. 499 (2019)
Electricity tax reduction for basic needs28
This measure provides a tax reduction of a fixed amount (around EUR 300), which is meant to cover the basic electricity needs for low-income households. In the 2019 tax planning, the tax for natural gas will be higher than that of electricity, with the aim to steer householders to elec-trical heating options (such as heat pumps, for instance).
Energy Bank29
This measure aims to assist households by providing short-term financial support for energy bills as well as energy advice through a voluntary advisor. Furthermore, some small materials to improve EE are provided.
Energy Box30
This measure aims to assist households by providing energy advice through a voluntary advisor. Furthermore, some small materials to improve EE are provided (e.g. a timer for use in the show-er). This campaign is also called “Join and Save Smart Energy” (Doe mee en bespaar slim energie).
Energy Leap (EnergieSprong)31
This is an innovative scheme with the aim to implement zero-energy buildings. One part was focused on social housing, aiming to fund investments in retrofit through bill savings, ensuring no net additional cost to tenants.
Despite the importance of these policies and the transposition of the EPBD regulations, according to the market and policymaker surveys (for instance, the EEW3 project), progress is still considered slow. The main hurdle was the implementation of the EPBD and the often-poor quality of the EPCs, where the Netherlands scores quite low in terms of the efficiency of these EPCs, despite efforts to establish a clear link between the performance of a building and the rent ceiling price. Financing tools have shifted to more tailored directions (from VAT rebates for building renovation to subsidies in the social rental sector and the ‘Energiesprong’, which aims at large-scale deep refurbishment), and there is general belief that the Netherlands is somewhat on track with nZEBs. Still, the Energiesprong should be maintained and expanded, while the ac-curacy of the EPCs improved.
28 For more information see: https://www.energypoverty.eu/measure-policy/electricity-tax-reduction-basic-needs29 For more information see: https://www.energiebanknederland.nl/30 For more information see: https://www.energiebox.org/31 For more information see: https://www.energypoverty.eu/measure-policy/energy-leap
176
CASE Reports | No. 499 (2019)
5.5. Other policy and support options for residential buildings
Energy savings calculator32
This tool is provided by the RVO to all professional bodies (housing associations, installers, real estate agents, financial and mortgage institutions, and municipalities) related to the built en-vironment with the aim to enhance decision-making processes for investments by providing valuable information on energy savings potentials. The calculator can also generate various sce-narios for buildings, from energy labels to energy neutral ones, demonstrating the cost of mea-sures, alternative options in technologies, and their delivery in energy savings. Furthermore, in some conditions, home purchasers that obtain mortgages and have made use of the results of the calculator can finance their energy savings measures. They can receive an amount of 106% of the value of the house (instead of 100% with the standard mortgages).
Environmental performance of buildings (MPG)33
The environmental performance of buildings is a measure of the sustainability of buildings and is obligatory for the application of environmental permits. It indicates the environmental im-pacts of the materials used in the building (related also to design, construction, and renovation); hence, the lower the value the more sustainable the materials. The obligatory use of the MPG refers to new houses and new office buildings that are larger than 100m2.
Based on the value of the MPG, the environmental tax related to materials is calculated. The MPG of the building is increasingly important as a measure of sustainability. An important point though is that measures that are increasing the guarantee of energy performance in a build-ing (such as thicker insulation or solar cells, the production of which increases the MPG) can be unfavourable for the MPG. Still, over the entire lifetime of such a measure (such as a solar cell), the energy that is generated is enough to compensate for the environmental impact of its production.
The environmental tax on the construction materials for each building varies based on the Life Cycle Analysis of each material. However, many materials must also be replaced or require maintenance (depending on the lifetime of each material), and this is taken into account as a parameter in the MPG.
32 For more information see: https://www.rvo.nl/onderwerpen/duurzaam-ondernemen/gebouwen/energiebespar-ingsverkenner
33 For more information see: https://www.rvo.nl/onderwerpen/duurzaam-ondernemen/gebouwen/wetten-en-re-gels-gebouwen/nieuwbouw/milieuprestatie-gebouwen
177
CASE Reports | No. 499 (2019)
Energy performance in buildings (BENG or NZEB)34
As of January 2020, all new residential and non-residential buildings must comply with nZEB requirements in order to acquire a construction permit. The nZEB requirements are reflected in three indicators:
Annual maximum energy needs in kWh per m2 of useful surface – energy use refers mainly to heating and cooling.
Annual maximum primary fossil fuel energy use in kWh per m2 of useful surface – energy use for this indicator is the sum of primary use for heating, cooling, hot water, and ventilation.
Minimum share of RES use – as a percentage of the energy from renewables to the total energy use (from both renewable and fossil fuel primary energy).
Currently (2018), the testing of the cost-optimal method to determine the requirements is ongoing, and, in 2019, after a consultation process, the final requirements will be published. For public buildings, as exemplary ones under the EPBD, as of 2019, all new constructions for government buildings must be nZEB. From the preliminary techniques that were offered for consultation, the construction sector appealed for extra techniques to meet the BENG require-ments. Especially for buildings higher than five floors, hospitals, and multilayer complexes with relatively small dwellings (studios), further possibilities can be useful to achieve the goals.
Regulation for reducing landlord levy for sustainability35
The regulation for reducing the levy for sustainability is a credit tax scheme applicable to land-lords with more than 50 homes when they invest in sustainable energy measures. It also targets the investments that follow the Climate Agreement (see above), for instance, for disconnecting houses from the natural gas grid and shifting to other sources. Likewise, the levy can be reduced when investments in the energy performance of the buildings takes place (with a comparison of the situation before and after the renovation). The main obligations for this levy reduction are to rent the properties with a rent below the liberalisation limit, to possess an Energy Index with at most 1.40 and an energy performance indicator class B or higher, and to carry out a minimum investment per property materialised within a period of three years.
34 For more information see: https://www.rvo.nl/onderwerpen/duurzaam-ondernemen/gebouwen/wetten-en-re-gels-gebouwen/nieuwbouw/energieprestatie-beng
35 For more information see: https://www.rvo.nl/subsidies-regelingen/regeling-vermindering-verhuurderheffing/regeling-vermindering-verhuurderheffing-verduurzaming
178
CASE Reports | No. 499 (2019)
Subsidies for RES
Other related policies refer to subsidies (ISDE) for biomass stoves, pellet heating,36,37 heat pumps,38 and solar boilers.39 The subsidies for the promotion of solar PV have recently ended, but a new feed-in subsidy or net-metering policy is on its way. Typical subsidy rates are as follows:
• At least EUR 2,500 for a 40-kW biomass stove. An extra EUR 110 will be paid for each additional kW.
• EUR 50 per kW of power for a pellet stove, with a minimum of EUR 500.• EUR 1,000 – EUR 2,500 (indicative) for heat pumps; the amount of the subsidy for de-
pends on the type of device and energy performance. • EUR 500 (indicative per appliance) for solar water heaters; the amount depends on the
annual yield.
Local initiatives
Furthermore, as indicated in the Energy Agenda “Realisation of the energy transition will largely take place at regional and local level. The task is to provide scope to municipal and provincial au-thorities and regional and local civil society organisations, and simultaneously at central govern-ment level – through financial, substantive and spatial framework creation – to aim for solutions that are better or more efficient on a supra-regional or national scale.” In the Climate Agree-ment, likewise, the role of the regional and local governments is strengthened in order to allow them to undertake climate actions in various sectors (with buildings being at the forefront). This indicates a good opportunity for EuroPACE, as the scheme aims at putting municipalities in the centre of whole programme – the municipalities are responsible for securing money from investors, collecting the funds afterwards from citizens, and being the first point of contact for construction companies among others – all in accordance with the one-stop-shop concept pro-moted by the EU.
36 For more information see: https://www.rvo.nl/node/25522137 For more information see: https://www.rvo.nl/node/25521938 For more information see: https://www.rvo.nl/subsidies-regelingen/investeringssubsidie-duurzame-energie-isde/
voor-welke-apparaten-geldt-de-isde-1/warmtepompen39 For more information see: https://www.rvo.nl/subsidies-regelingen/investeringssubsidie-duurzame-energie-isde/
voor-welke-apparaten-geldt-de-isde-1/zonneboilers
179
CASE Reports | No. 499 (2019)
Conclusions
In the period 2012-2017, the number of newly constructed dwellings amounted to 45,000-63,000 per year, corresponding to a rate of newly constructed and typically more energy effi-cient buildings of 0.6-0.8% per year. However, given households’ energy consumption rates and unsatisfactory progress when it comes to home renovations (an equivalent major renovation rate of around 1%), there is still room for improvement in boosting the EE of the residential building stock.
More than half (57%) of the dwellings in the Netherlands are privately owned (2017), cor-responding to roughly 4.2 million properties. Although the percentage of home ownership is below the EU average, given the types of residential buildings across the country, which rarely include multi-family buildings, it still provides an attractive number for potential investors. At the same time, Dutch citizens save significant amounts of their salaries, are the second most eager nation to invest in their households, and are far from “being spoiled” by pure grants for such purposes. These two factors clearly indicate that the Netherlands would be a good fit for the EuroPACE mechanism. The main reason for this positive assessment towards developing EuroPACE in the Netherlands is related to the fact that the policy framework already supports the energy performance of buildings and other EE policies. Furthermore, the government has set a long-term plan for a fossil free (CO2 neutral) built environment by 2050, which would require the retrofitting of approximately 200,000 dwellings per year – an ambitious target that most likely cannot be achieved with public sources alone given the relatively high costs of residential retrofits (approximately EUR 130,000 per terrace house). The existing incentives are various and as a result could be either blended or complementary to those offered within the EuroPACE scheme. Furthermore, the residential sector in the Netherlands is well aware of climate targets, EE, and the importance of reducing energy costs; therefore, the foreground addressing the de-mand is existing.
Nevertheless, the standard barriers to undertaking energy saving investments exist, such as the lack of leadership from market representatives, split incentives, and uncertainty of the costs and benefits of more innovative technologies. There are also institutional barriers, like a lack of cooperation between tenants or homeowners and financing bodies and the problem that energy savings is not a core activity or product in the activities of financing bodies. Fortunately, the recently adopted Climate Agreement has led to a mutual understanding among policymakers, institutional representatives, and interest groups. The role of municipalities (which is by default increased in the EuroPACE scheme) is of particular importance here. It is also seen as positive that a monitoring system was set up that provides regular reports on progress. It could also be used if the on-tax financing scheme, which is in fact currently considered by the government, is ever developed across the country.
Still, what remains to be seen in the Dutch market is the promotion and implementation of the major renovation measures at a higher speed in order to provide the correct signals in the market, meet the ambitious targets – namely from the EPBD, and overcome the established barriers. An important element for the potential application of EuroPACE is the increased role of
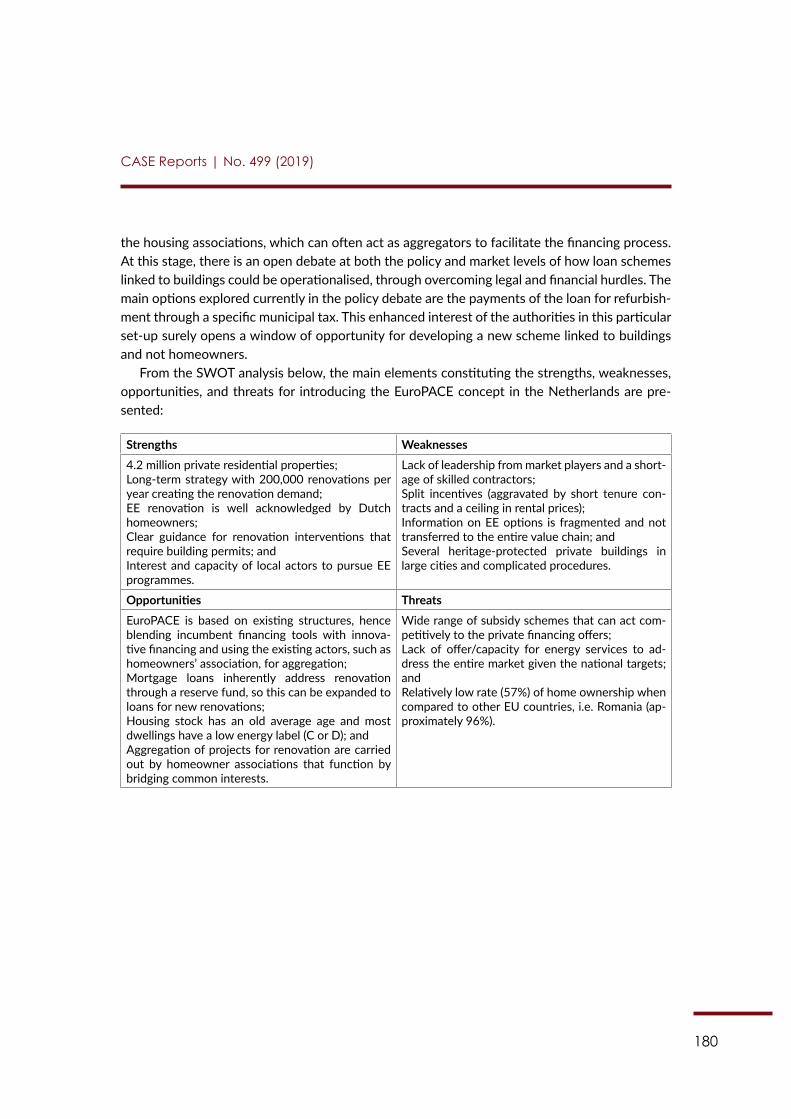
180
CASE Reports | No. 499 (2019)
the housing associations, which can often act as aggregators to facilitate the financing process. At this stage, there is an open debate at both the policy and market levels of how loan schemes linked to buildings could be operationalised, through overcoming legal and financial hurdles. The main options explored currently in the policy debate are the payments of the loan for refurbish-ment through a specific municipal tax. This enhanced interest of the authorities in this particular set-up surely opens a window of opportunity for developing a new scheme linked to buildings and not homeowners.
From the SWOT analysis below, the main elements constituting the strengths, weaknesses, opportunities, and threats for introducing the EuroPACE concept in the Netherlands are pre-sented:
Strengths Weaknesses4.2 million private residential properties;Long-term strategy with 200,000 renovations per year creating the renovation demand;EE renovation is well acknowledged by Dutch homeowners;Clear guidance for renovation interventions that require building permits; andInterest and capacity of local actors to pursue EE programmes.
Lack of leadership from market players and a short-age of skilled contractors; Split incentives (aggravated by short tenure con-tracts and a ceiling in rental prices);Information on EE options is fragmented and not transferred to the entire value chain; andSeveral heritage-protected private buildings in large cities and complicated procedures.
Opportunities ThreatsEuroPACE is based on existing structures, hence blending incumbent financing tools with innova-tive financing and using the existing actors, such as homeowners’ association, for aggregation;Mortgage loans inherently address renovation through a reserve fund, so this can be expanded to loans for new renovations;Housing stock has an old average age and most dwellings have a low energy label (C or D); andAggregation of projects for renovation are carried out by homeowner associations that function by bridging common interests.
Wide range of subsidy schemes that can act com-petitively to the private financing offers;Lack of offer/capacity for energy services to ad-dress the entire market given the national targets; andRelatively low rate (57%) of home ownership when compared to other EU countries, i.e. Romania (ap-proximately 96%).
181
CASE Reports | No. 499 (2019)
References
Bak (2015), Kantoren in cijfers 2015 Statistiek van de Nederlandse kantorenmarkt. NVM. Nieu-wegein.
CBS (2018a), Huishoudens; samenstelling, grootte, regio. Centraal Bureau voor de Statistiek. Accessed in December 2018 via http://statline.cbs.nl/StatWeb/publication/?VW=T&DM=SLNL&PA=71486ned&LA=NL.
CBS (2018b), Energieverbruik van particuliere huishoudens. Centraal Bureau voor de Statistiek. Accessed in December 2018 via https://www.cbs.nl/nl-nl/achtergrond/2018/14/energiever-bruik-van-particuliere-huishoudens.
CBS (2018c), Aardgas en elektriciteit, gemiddelde prijzen van eindverbruikers. Accessed in December 2018 via https://opendata.cbs.nl/statline/#/CBS/nl/dataset/81309NED/table?ts=1550138411254.
Climate KIC (2016), Drivers and barriers for large scale retrofitting in the Netherlands – and the role of Climate KiC.
EC (2018), EU Energy Poverty Observatory. Accessed in December 2018 via https://www.ener-gypoverty.eu/indicator?primaryId=1461.
ECN (2016), Energietrends 2016. Publicatienummer ECN ECN-O--16-031. Petten: Ener-gieonderzoek Centrum Nederland.
ECN (2017), Rapportage Energiearmoede Effectieve interventies om energie efficiëntie te ver-groten en energiearmoede te verlagen. Petten: Energieonderzoek Centrum Nederland.
Energy Efficiency Watch 3 (2014), Energy efficiency policies in Europe – Country Report the Netherlands.
Eurostat (2018a), Distribution of population by tenure status, type of household and income group – EU-SILC survey. Accessed in December 2018 via http://appsso.eurostat.ec.europa.eu/nui/show.do?dataset=ilc_lvho02&lang=en.
Eurostat (2018b), Inequality of income distribution. Eurostat Code: tespm151. Accessed in De-cember 2018 via https://ec.europa.eu/eurostat/tgm/table.do?tab=table&init=1&language=en&pcode=tespm151&plugin=1
182
CASE Reports | No. 499 (2019)
Filippidou, Faidra et al (2018), Energy renovation rates in the Netherlands – comparing long and short- term prediction methods. A+BE | Architecture and the Built Environment, [S.l.], n. 14, p. 167-194, Dec. 2018. ISSN 2214-7233. Available at: <https://journals.open.tudelft.nl/index.php/abe/article/view/3553>. Date accessed: 9 February 2019.
Flaubinger, F. (2015), A bottom up analysis of household energy consumption in Amsterdam. Amsterdam University Thesis.
Gemeente Utrecht (2016), Utrechtse Energieagenda’s.
ING (2013), Saving Energy in the Netherlands – New EU Directive takes on energy efficiency.
Lanting, R. (2010), Sustainable Construction in the Netherlands, TNO – Building and Construc-tion Research.
Majcen, D. (2016), Predicting energy consumption and savings in the housing stock A perfor-mance gap analysis in the Netherlands. PhD thesis, TU Delft.
MINBZK (2016a), Wonen in beweging. De resultaten van het WoonOnderzoek Nederland 2015.
MINBZK (2016b), Cijfers over bouwen en wonen 2016. Het ministerie van Binnenlandse Zaken en Koninkrijksrelaties Turfmarkt 147, 2511 dp Den Haag.
MINBZK, Woonbond, Aedes, Vastgoed Belang (2012), Convenant energiebesparing huursector.
Odyssee (2018), Sectoral profile – household. Accessed in December 2018 via http://www.od-yssee-mure.eu/publications/efficiency-by-sector/households/average-energy-consumption-dwelling.html.
PBL (2017), Beleidsruimte energietransitie gebouwde omgeving van gemeenten. Planbureau voor de Leefomgeving.
PBL (2018), Meten met twee maten. Een studie naar de betaalbaarheid van de energierekening van huishoudens. Planburea voor de leefomgeving.
Peek, T., Peppelman, M., Huurman, W. (2018), Report on Cost optimality Study, ARCADIS.
RVO (2017), Monitor Energiebesparing Gebouwde Omgeving 2016. Rijksdienst voor Onderne-mend Nederland. Utrecht. https://www.rvo.nl/sites/default/files/2018/03/Monitor-Energiebe-sparing-Gebouwde-Omgeving-2016.pdf.
183
CASE Reports | No. 499 (2019)
Schoots, K., Hekkenberg, M., Hammingh, P. (2017), Nationale Energieverkenning 2017. ECN-O--17-018. Petten: Energieonderzoek Centrum Nederland.
UU et al. (2010), Potentieel voor besparing en efficiency van energiegebruik in Nederland (BEEN).
Van Eck (2016), EPBD Implementation in the Netherlands – Status in December 2016. Con-certed Action Energy Performance of Buildings.
Woon (2015), WoonOnderzoek Nederland. See www.woononderzoek.nl.
Zebra2020 (2018), Equivalent major renovation rate, Zebra2020 datatool. Accessed in Decem-ber 2018 via http://www.zebra-monitoring.enerdata.eu/overall-building-activities/equivalent-major-renovation-rate.html#equivalent-major-renovation-rate.html.
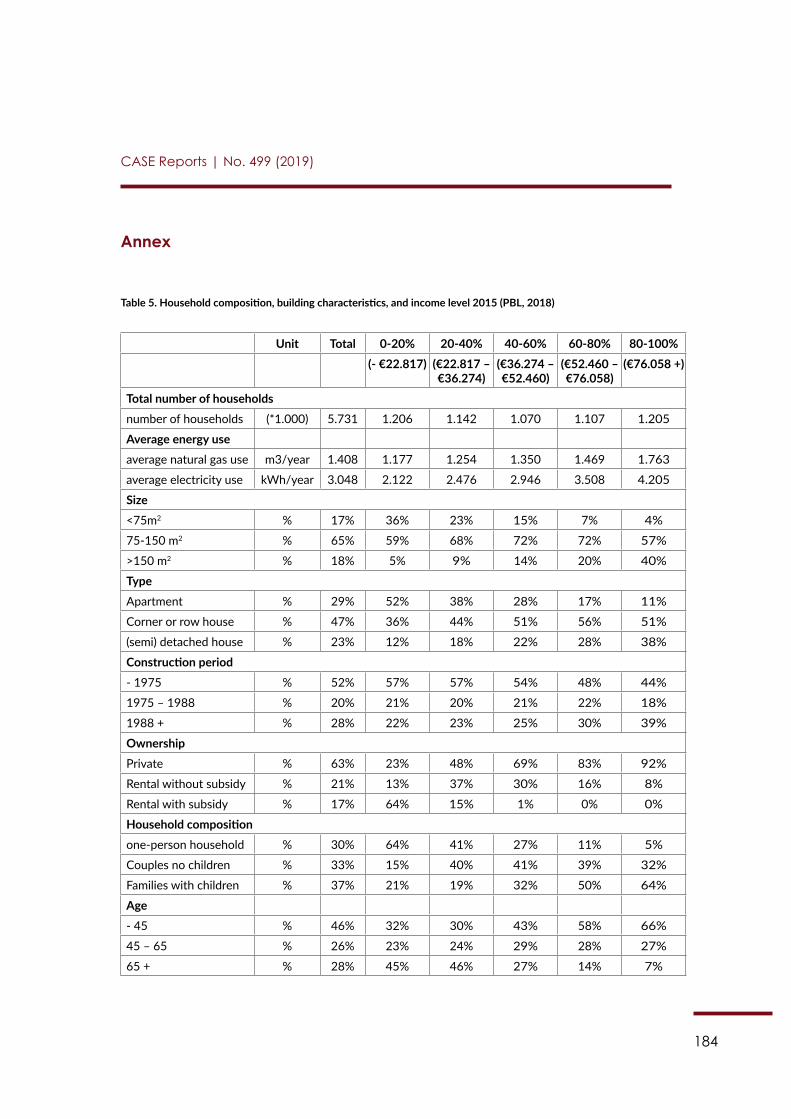
184
CASE Reports | No. 499 (2019)
Annex
Table 5. Household composition, building characteristics, and income level 2015 (PBL, 2018)
Unit Total 0-20% 20-40% 40-60% 60-80% 80-100% (- €22.817) (€22.817 –
€36.274)(€36.274 – €52.460)
(€52.460 – €76.058)
(€76.058 +)
Total number of householdsnumber of households (*1.000) 5.731 1.206 1.142 1.070 1.107 1.205
Average energy use
average natural gas use m3/year 1.408 1.177 1.254 1.350 1.469 1.763
average electricity use kWh/year 3.048 2.122 2.476 2.946 3.508 4.205
Size<75m2 % 17% 36% 23% 15% 7% 4%
75-150 m2 % 65% 59% 68% 72% 72% 57%
>150 m2 % 18% 5% 9% 14% 20% 40%
TypeApartment % 29% 52% 38% 28% 17% 11%
Corner or row house % 47% 36% 44% 51% 56% 51%
(semi) detached house % 23% 12% 18% 22% 28% 38%
Construction period- 1975 % 52% 57% 57% 54% 48% 44%
1975 – 1988 % 20% 21% 20% 21% 22% 18%
1988 + % 28% 22% 23% 25% 30% 39%
OwnershipPrivate % 63% 23% 48% 69% 83% 92%
Rental without subsidy % 21% 13% 37% 30% 16% 8%
Rental with subsidy % 17% 64% 15% 1% 0% 0%
Household compositionone-person household % 30% 64% 41% 27% 11% 5%
Couples no children % 33% 15% 40% 41% 39% 32%
Families with children % 37% 21% 19% 32% 50% 64%
Age
- 45 % 46% 32% 30% 43% 58% 66%
45 – 65 % 26% 23% 24% 29% 28% 27%
65 + % 28% 45% 46% 27% 14% 7%
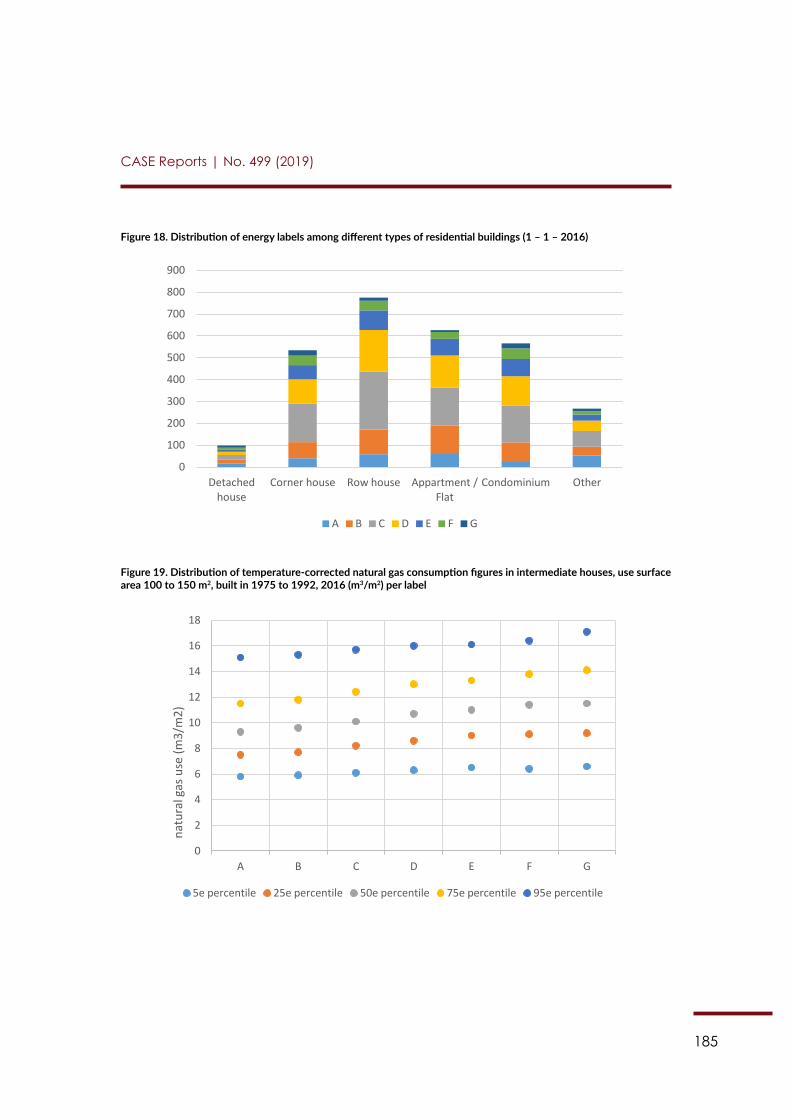
185
CASE Reports | No. 499 (2019)
Figure 18. Distribution of energy labels among different types of residential buildings (1 – 1 – 2016)
154
Figure 18. Distribution of energy labels among different types of residential buildings (1 – 1 – 2016)
Figure 19. Distribution of temperature-corrected natural gas consumption figures in intermediate houses, use surface area 100 to 150 m2, built in 1975 to 1992, 2016 (m3/m2) per label
0
100
200
300
400
500
600
700
800
900
Detached house
Corner house Row house Appartment / Flat
Condominium Other
A B C D E F G
0
2
4
6
8
10
12
14
16
18
A B C D E F G
natu
ral g
as u
se (m
3/m
2)
5e percentile 25e percentile 50e percentile 75e percentile 95e percentile
Figure 19. Distribution of temperature-corrected natural gas consumption figures in intermediate houses, use surface area 100 to 150 m2, built in 1975 to 1992, 2016 (m3/m2) per label
154
Figure 18. Distribution of energy labels among different types of residential buildings (1 – 1 – 2016)
Figure 19. Distribution of temperature-corrected natural gas consumption figures in intermediate houses, use surface area 100 to 150 m2, built in 1975 to 1992, 2016 (m3/m2) per label
0
100
200
300
400
500
600
700
800
900
Detached house
Corner house Row house Appartment / Flat
Condominium Other
A B C D E F G
0
2
4
6
8
10
12
14
16
18
A B C D E F G
natu
ral g
as u
se (m
3/m
2)
5e percentile 25e percentile 50e percentile 75e percentile 95e percentile
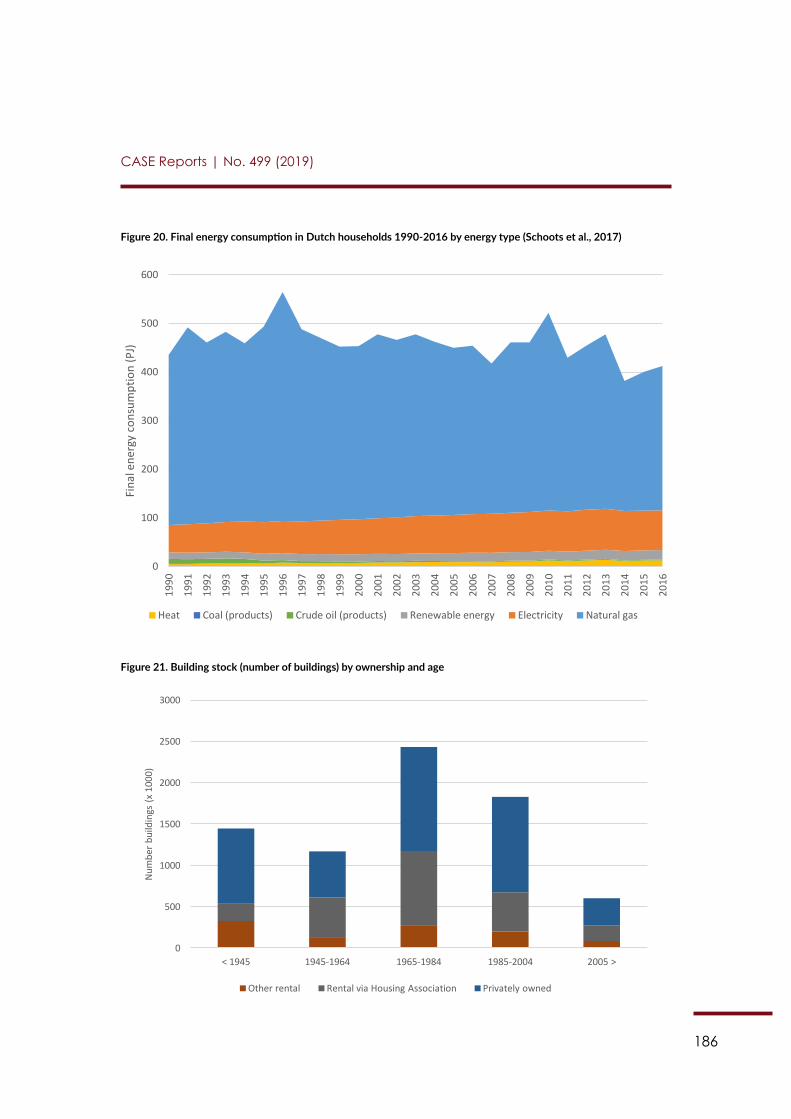
186
CASE Reports | No. 499 (2019)
Figure 20. Final energy consumption in Dutch households 1990-2016 by energy type (Schoots et al., 2017)
155
Figure 20. Final energy consumption in Dutch households 1990-2016 by energy type (Schoots et al., 2017)
Figure 21. Building stock (number of buildings) by ownership and age
0
100
200
300
400
500
600
1990
1991
1992
1993
1994
1995
1996
1997
1998
1999
2000
2001
2002
2003
2004
2005
2006
2007
2008
2009
2010
2011
2012
2013
2014
2015
2016
Fina
l ene
rgy
cons
umpt
ion
(PJ)
Heat Coal (products) Crude oil (products) Renewable energy Electricity Natural gas
0
500
1000
1500
2000
2500
3000
< 1945 1945-1964 1965-1984 1985-2004 2005 >
Num
ber b
uild
ings
(x 1
000)
Other rental Rental via Housing Association Privately owned
Figure 21. Building stock (number of buildings) by ownership and age
155
Figure 20. Final energy consumption in Dutch households 1990-2016 by energy type (Schoots et al., 2017)
Figure 21. Building stock (number of buildings) by ownership and age
0
100
200
300
400
500
600
1990
1991
1992
1993
1994
1995
1996
1997
1998
1999
2000
2001
2002
2003
2004
2005
2006
2007
2008
2009
2010
2011
2012
2013
2014
2015
2016
Fina
l ene
rgy
cons
umpt
ion
(PJ)
Heat Coal (products) Crude oil (products) Renewable energy Electricity Natural gas
0
500
1000
1500
2000
2500
3000
< 1945 1945-1964 1965-1984 1985-2004 2005 >
Num
ber b
uild
ings
(x 1
000)
Other rental Rental via Housing Association Privately owned
187
Author: Karolina Zubel
Contents
Acronyms ....................................................................................................................................189
Introduction ...............................................................................................................................190
Chapter 1: Social and economic conditions of households ............................................1921.1. Number of residential buildings and household composition ............................192
1.2. Distribution of population and type of building by degree of urbanisation ..................................................................................................193
1.3. Income level and distribution ....................................................................................195
1.4. The problem of air pollution .......................................................................................196
Chapter 2: Characteristics of the building stock ...............................................................1982.1. Total number of dwellings ...........................................................................................198
2.2. Age structure and housing stock energy demand .................................................198
2.3. Changes in the housing stock ....................................................................................199
2.4. Ownership ......................................................................................................................200
2.5. The building stock by size ..........................................................................................202
Chapter 3: Energy consumption in private residential buildings and type of EE/RES investments ..........................................................................................203
3.1. Energy prices .................................................................................................................203
3.2. Energy costs ...................................................................................................................203
3.3. Energy poverty ..............................................................................................................203
3.4. Energy consumption by source .................................................................................204
3.5. Break down of energy consumption by type of end-use ....................................205
3.6. Energy Performance Certificates requirements ....................................................205
3.7. EE and RES investments trends ................................................................................206
EuroPACE Market Analysis: Poland
188
CASE Reports | No. 499 (2019)
Chapter 4: Barriers to develop the EE/RES potential in private buildings ..................2084.1. High transaction costs .................................................................................................210
4.2. Lack of information ......................................................................................................210
4.3. Lack of know-how ........................................................................................................211
4.4. Financial ..........................................................................................................................211
4.5. Political and legal ..........................................................................................................211
4.6. Cultural and perception-related ................................................................................212
4.7. Organisational ...............................................................................................................212
4.8. Technology-related .......................................................................................................212
Chapter 5: Policies related to energy efficiency and renewable energy in buildings .................................................................................................................................214
5.1. Energy Performance of Buildings Directive framework ......................................214
5.2. “Clean Air” priority programme .................................................................................215
5.3. Financing schemes for modernisation of the residential sector ........................216
5.4. A nationwide advisory support system in the field of EE and RES ...................221
5.5. Local initiatives ..............................................................................................................222
5.6. Bottom-up initiatives ...................................................................................................223
Conclusions ................................................................................................................................224
References ..................................................................................................................................226
Annex ..........................................................................................................................................229
189
CASE Reports | No. 499 (2019)
Acronyms
BGK Bank Gospodarstwa KrajowegoBOŚ Environmental Protection Bank (Bank Ochrony Środowiska S.A.)BREEAM Building Research Establishment Environmental Assessment MethodCoM Covenant of MayorsEE Energy EfficiencyEEA European Environment AgencyEC European CommissionEP European ParliamentEPC Energy Performance CertificateEPBD Energy Performance Buildings DirectiveEU European UnionGUS Statistics Poland (Główny Urząd Statystyczny)IBS Institute for Structural Research (Instytut Badań Strukturalnych)MFF Multiannual Financial FrameworkMIiR Ministry of Investment and Economic Development (Ministerstwo Inwestycji i Rozwoju)MS Member State(s)NAPE Narodowa Agencja Poszanowania EnergiiNFOŚiGW National Fund for Environmental Protection and Water Management (Narodowy Fundusz
Ochrony Środowiska i Gospodarki Wodnej) NIK Supreme Audit Office (Najwyższa Izba Kontroli)nZEB nearly Zero-Energy BuildingLEED Leadership in Energy and Environmental DesignLPG Liquefied Petroleum GasLRAs Local and Regional AuthoritiesPACE Property Assessed Clean EnergyPPS Purchasing Power StandardsRES Renewable Energy SourcesSWOT Strengths, Weaknesses, Opportunities, Threats (table)US United StatesWFOŚiGW(s) Voivodship Fund(s) for Environmental Protection and Water Management (Wojewódzki Fun-
dusz Ochrony Środowiska i Gospodarki Wodnej)WHO World Health Organization
190
CASE Reports | No. 499 (2019)
Introduction
As the aim of this paper is to assess the market potential for the development of EuroPACE – a home-based financing instrument for home retrofits in Poland, this report focuses on the overall status and policy framework of energy efficiency (EE) and renewable energy sources (RES) in private residential buildings using the most up-to-date national and European data available. In order to achieve its main objective, the report has been structured as follows.
Chapter 1 presents the social and economic conditions of the 13.6 million Polish households,1 namely, their dimension, composition, and income level. Savings habits are also examined in order to assess the capacity of Poles to repay a potential EuroPACE assessment linked to their properties. The topic of air quality is also discussed, as it is currently considered one of the big-gest socio-economic issues across the country.
Chapter 2 describes the main characteristics of Poland’s current building stock as well as building ownership from the EuroPACE perspective, highlighting the predominance of Poles (around 84.2% of the population) who live in their own house, with a clear income-related gradi-ent. What results from this chapter is that up to 70% of single-family houses are in urgent need of retrofits. The increasing construction rates of buildings which are typically more “energy sav-ing” are only partially improving the efficiency of the residential building stock, as it is estimated that almost 60% of Polish residential buildings are older than 40 years and were built before any binding EE norms were introduced.
Along these lines, Chapter 3 reports the latest estimates related to energy consumption in private residential buildings. It analyses energy consumption in private residential buildings, namely: energy prices and costs, energy poverty indicators, and energy consumption by source and end-use. Clearly, household energy consumption, measured by percentage of relevant en-ergy sources, differs significantly from other European Union (EU) countries, given the high rates of coal consumption, which need to be limited if Poland wants to meet international and EU-agreed targets on climate change and decarbonisation and improve air quality in the urban environment. Energy Performance Certificates (EPCs) as well as general trends in EE and RES investments are also covered together with estimations on costs of retrofits.
Chapter 4 reviews barriers to the development of the EE/RES potential in private buildings. These include, among others, the low priority of EE in the residential sector, financial and ad-ministrative obstacles, and a lack of awareness of available incentives. Properly planned, com-prehensive thermal modernisation has to overcome these barriers. At the same time, it has to respond to the needs of investors who pay attention to entirely different criteria than the government introducing incentives financed from public sources, when deciding on renovation. It becomes an obvious conclusion of this chapter that a complex platform for substantial renova-tions should be introduced.
Finally, Chapter 5 lays out the main policies related to EE/RES in buildings, which are recently gaining importance as they are linked with actions improving air quality – so often mentioned by
1 Data from the 2011 official census.
191
CASE Reports | No. 499 (2019)
citizens and the media. As a result, actions boosting EE and RES have become an important as-pect of the political agenda, perhaps even a priority under the “Clean Air” programme launched by the government in September 2018. In fact, there are multiple other programmes and incen-tives worth mentioning. A selection of programmes is presented in order to assess if they would be significant competition for EuroPACE, or if perhaps they could be blended with EuroPACE financing to enhance the impact of this innovative financial instrument.
Concise concluding remarks are given at the end of the report. Additionally, a strengths, weaknesses, opportunities, and threats (SWOT) table presents the key characteristics of the Polish housing sector relevant to determining the feasibility of implementing a home-based fi-nancing scheme – such as that proposed by EuroPACE – in Poland.
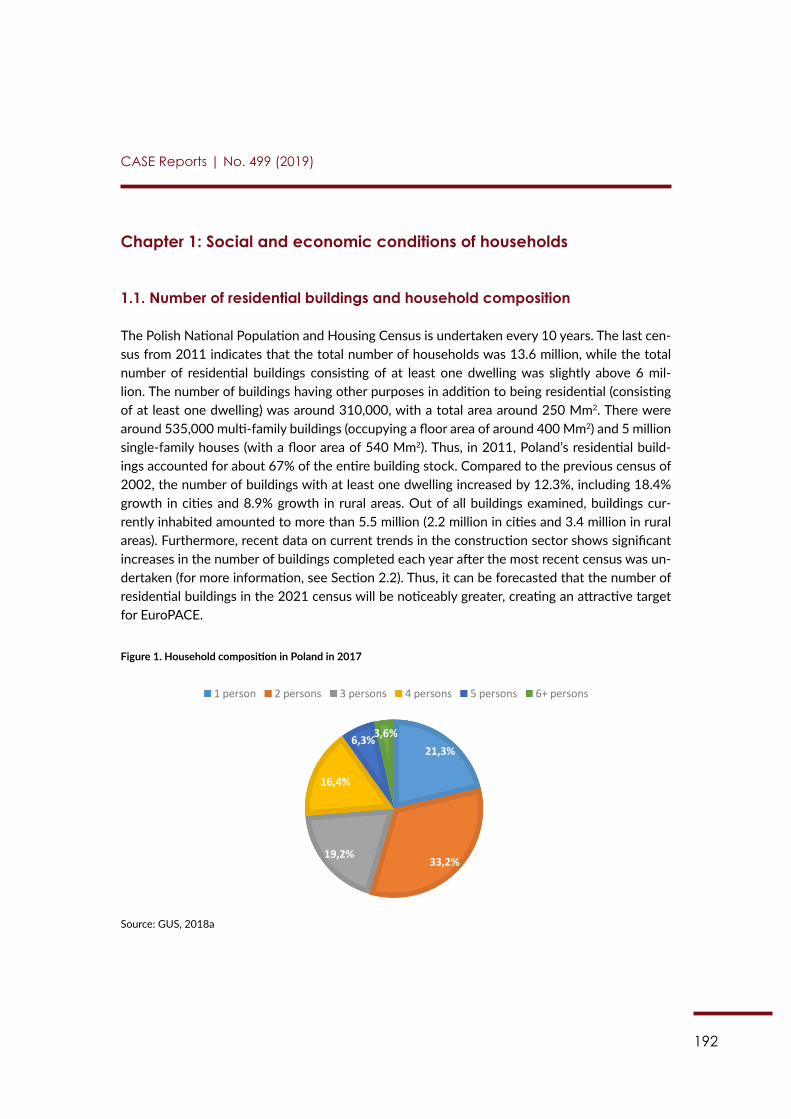
192
CASE Reports | No. 499 (2019)
Chapter 1: Social and economic conditions of households
1.1. Number of residential buildings and household composition
The Polish National Population and Housing Census is undertaken every 10 years. The last cen-sus from 2011 indicates that the total number of households was 13.6 million, while the total number of residential buildings consisting of at least one dwelling was slightly above 6 mil-lion. The number of buildings having other purposes in addition to being residential (consisting of at least one dwelling) was around 310,000, with a total area around 250 Mm2. There were around 535,000 multi-family buildings (occupying a floor area of around 400 Mm2) and 5 million single-family houses (with a floor area of 540 Mm2). Thus, in 2011, Poland’s residential build-ings accounted for about 67% of the entire building stock. Compared to the previous census of 2002, the number of buildings with at least one dwelling increased by 12.3%, including 18.4% growth in cities and 8.9% growth in rural areas. Out of all buildings examined, buildings cur-rently inhabited amounted to more than 5.5 million (2.2 million in cities and 3.4 million in rural areas). Furthermore, recent data on current trends in the construction sector shows significant increases in the number of buildings completed each year after the most recent census was un-dertaken (for more information, see Section 2.2). Thus, it can be forecasted that the number of residential buildings in the 2021 census will be noticeably greater, creating an attractive target for EuroPACE.
Figure 1. Household composition in Poland in 2017
160
perhaps they could be blended with EuroPACE financing to enhance the impact of this innovative financial instrument.
Concise concluding remarks are given at the end of the report. Additionally, a strengths, weaknesses, opportunities, and threats (SWOT) table presents the key characteristics of the Polish housing sector relevant to determining the feasibility of implementing a home-based financing scheme – such as that proposed by EuroPACE – in Poland.
Chapter 1: Social and economic conditions of households 1.1. Number of residential buildings and household composition The Polish National Population and Housing Census is undertaken every 10 years. The last census from 2011 indicates that the total number of households was 13.6 million, while the total number of residential buildings consisting of at least one dwelling was slightly above 6 million. The number of buildings having other purposes in addition to being residential (consisting of at least one dwelling) was around 310,000, with a total area around 250 Mm2. There were around 535,000 multi-family buildings (occupying a floor area of around 400 Mm2) and 5 million single-family houses (with a floor area of 540 Mm2). Thus, in 2011, Poland’s residential buildings accounted for about 67% of the entire building stock. Compared to the previous census of 2002, the number of buildings with at least one dwelling increased by 12.3%, including 18.4% growth in cities and 8.9% growth in rural areas. Out of all buildings examined, buildings currently inhabited amounted to more than 5.5 million (2.2 million in cities and 3.4 million in rural areas). Furthermore, recent data on current trends in the construction sector shows significant increases in the number of buildings completed each year after the most recent census was undertaken (for more information, see Section 2.2). Thus, it can be forecasted that the number of residential buildings in the 2021 census will be noticeably greater, creating an attractive target for EuroPACE.
Figure 1. Household composition in Poland in 2017
Source: GUS, 2018a
Concerning household composition, according to the more recent “Poland in figures 2018” study published by the Statistics Poland (Główny Urząd Statystyczny - GUS), one and two-person households account for more than 54% of the total number of households, and the average Polish household has 2.66 occupants (GUS, 2018a). In 2017, 37.4% of households were households with children (Eurostat
21,3%
33,2% 19,2%
16,4%
6,3% 3,6%
1 person 2 persons 3 persons 4 persons 5 persons 6+ persons
Source: GUS, 2018a
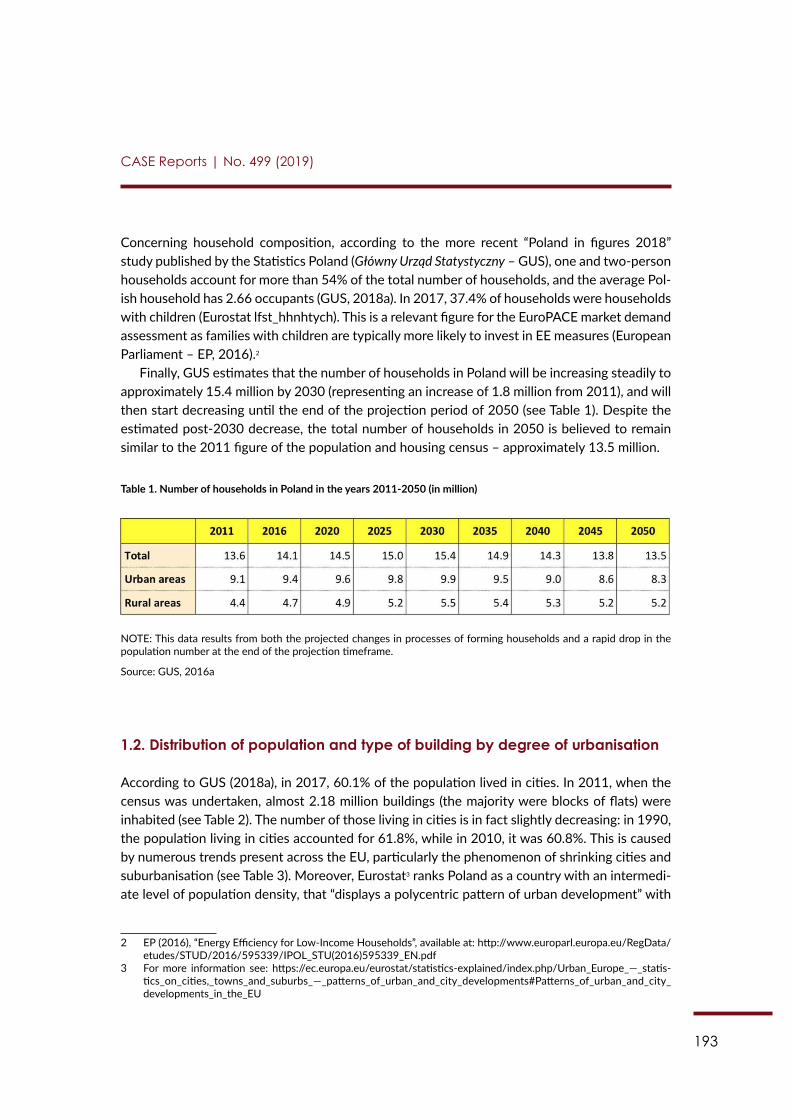
193
CASE Reports | No. 499 (2019)
Concerning household composition, according to the more recent “Poland in figures 2018” study published by the Statistics Poland (Główny Urząd Statystyczny – GUS), one and two-person households account for more than 54% of the total number of households, and the average Pol-ish household has 2.66 occupants (GUS, 2018a). In 2017, 37.4% of households were households with children (Eurostat lfst_hhnhtych). This is a relevant figure for the EuroPACE market demand assessment as families with children are typically more likely to invest in EE measures (European Parliament – EP, 2016).2
Finally, GUS estimates that the number of households in Poland will be increasing steadily to approximately 15.4 million by 2030 (representing an increase of 1.8 million from 2011), and will then start decreasing until the end of the projection period of 2050 (see Table 1). Despite the estimated post-2030 decrease, the total number of households in 2050 is believed to remain similar to the 2011 figure of the population and housing census – approximately 13.5 million.
Table 1. Number of households in Poland in the years 2011-2050 (in million)
161
lfst_hhnhtych). This is a relevant figure for the EuroPACE market demand assessment as families with children are typically more likely to invest in EE measures (European Parliament - EP, 2016).246
Finally, GUS estimates that the number of households in Poland will be increasing steadily to approximately 15.4 million by 2030 (representing an increase of 1.8 million from 2011), and will then start decreasing until the end of the projection period of 2050 (see Table 1). Despite the estimated post-2030 decrease, the total number of households in 2050 is believed to remain similar to the 2011 figure of the population and housing census – approximately 13.5 million.
Table 1. Number of households in Poland in the years 2011-2050 (in million)
NOTE: This data results from both the projected changes in processes of forming households and a rapid drop in the population
number at the end of the projection timeframe.
Source: GUS, 2016a
1.2. Distribution of population and type of building by degree of urbanisation According to GUS (2018a), in 2017, 60.1% of the population lived in cities. In 2011, when the census was undertaken, almost 2.18 million buildings (the majority were blocks of flats) were inhabited (see Table 2). The number of those living in cities is in fact slightly decreasing: in 1990, the population living in cities accounted for 61.8%, while in 2010, it was 60.8%. This is caused by numerous trends present across the EU, particularly the phenomenon of shrinking cities and suburbanisation (see Table 3). Moreover, Eurostat247 ranks Poland as a country with an intermediate level of population density, that “displays a polycentric pattern of urban development” with “a relatively high number of medium-sized cities spread across its territory” as confirmed by tables 2 and 3 below.
Table 2. Breakdown of Polish residential building stock in 2011
Total
Including
Inhabited
of which
Uninhabited Residential
of which Collective accommodation
Non-residential Single-family
Multi-family
Total thousands 6,047.1 5,567.6 5,542.6 5,007.5 535.1 3.3 21.0 479.5
246 EP (2016), “Energy Efficiency for Low-Income Households”, available at: http://www.europarl.europa.eu/RegData/etudes/STUD/2016/595339/IPOL_STU(2016)595339_EN.pdf 247 For more information see: https://ec.europa.eu/eurostat/statistics-explained/index.php/Urban_Europe_—_statistics_on_cities,_towns_and_suburbs_—_patterns_of_urban_and_city_developments#Patterns_of_urban_and_city_developments_in_the_EU
NOTE: This data results from both the projected changes in processes of forming households and a rapid drop in the population number at the end of the projection timeframe.
Source: GUS, 2016a
1.2. Distribution of population and type of building by degree of urbanisation
According to GUS (2018a), in 2017, 60.1% of the population lived in cities. In 2011, when the census was undertaken, almost 2.18 million buildings (the majority were blocks of flats) were inhabited (see Table 2). The number of those living in cities is in fact slightly decreasing: in 1990, the population living in cities accounted for 61.8%, while in 2010, it was 60.8%. This is caused by numerous trends present across the EU, particularly the phenomenon of shrinking cities and suburbanisation (see Table 3). Moreover, Eurostat3 ranks Poland as a country with an intermedi-ate level of population density, that “displays a polycentric pattern of urban development” with
2 EP (2016), “Energy Efficiency for Low-Income Households”, available at: http://www.europarl.europa.eu/RegData/etudes/STUD/2016/595339/IPOL_STU(2016)595339_EN.pdf
3 For more information see: https://ec.europa.eu/eurostat/statistics-explained/index.php/Urban_Europe_—_statis-tics_on_cities,_towns_and_suburbs_—_patterns_of_urban_and_city_developments#Patterns_of_urban_and_city_developments_in_the_EU
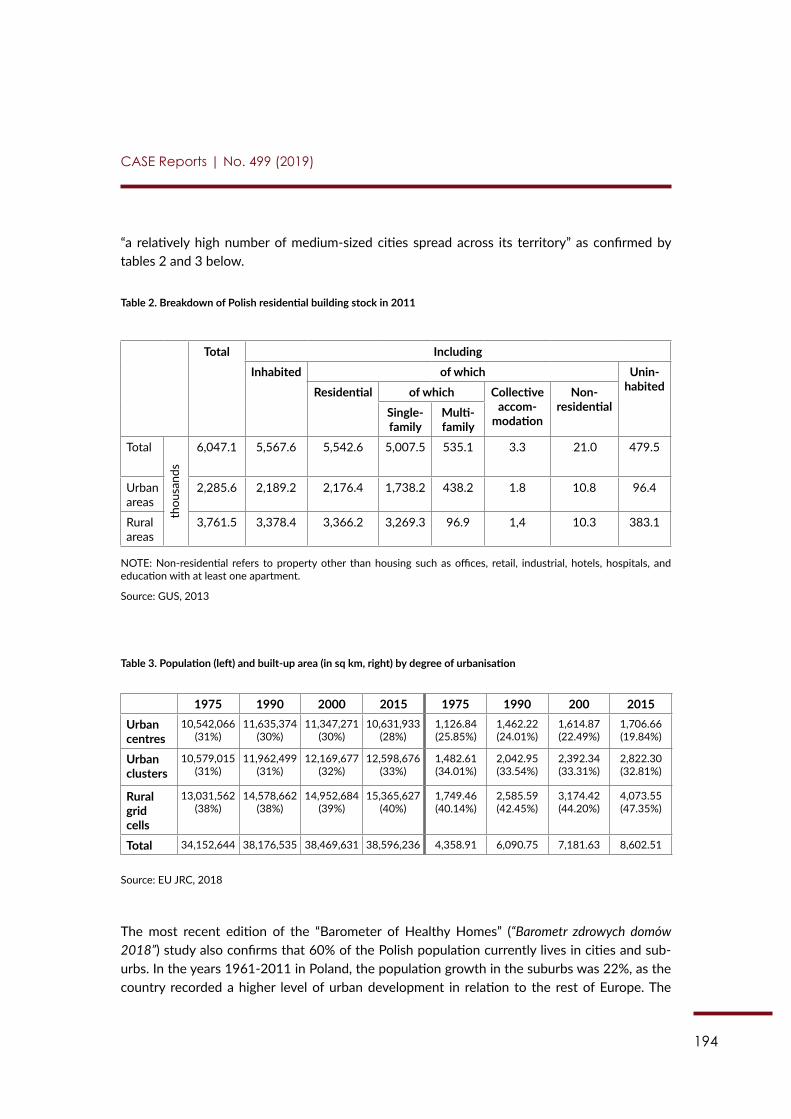
194
CASE Reports | No. 499 (2019)
“a relatively high number of medium-sized cities spread across its territory” as confirmed by tables 2 and 3 below.
Table 2. Breakdown of Polish residential building stock in 2011
Total IncludingInhabited of which Unin-
habitedResidential of which Collective accom-
modation
Non-residentialSingle-
familyMulti-family
Total
thou
sand
s
6,047.1 5,567.6 5,542.6 5,007.5 535.1 3.3 21.0 479.5
Urban areas
2,285.6 2,189.2 2,176.4 1,738.2 438.2 1.8 10.8 96.4
Rural areas
3,761.5 3,378.4 3,366.2 3,269.3 96.9 1,4 10.3 383.1
NOTE: Non-residential refers to property other than housing such as offices, retail, industrial, hotels, hospitals, and education with at least one apartment.
Source: GUS, 2013
Table 3. Population (left) and built-up area (in sq km, right) by degree of urbanisation
1975 1990 2000 2015 1975 1990 200 2015Urban centres
10,542,066 (31%)
11,635,374 (30%)
11,347,271 (30%)
10,631,933 (28%)
1,126.84 (25.85%)
1,462.22 (24.01%)
1,614.87 (22.49%)
1,706.66 (19.84%)
Urban clusters
10,579,015 (31%)
11,962,499 (31%)
12,169,677 (32%)
12,598,676 (33%)
1,482.61 (34.01%)
2,042.95 (33.54%)
2,392.34 (33.31%)
2,822.30 (32.81%)
Rural grid cells
13,031,562 (38%)
14,578,662 (38%)
14,952,684 (39%)
15,365,627 (40%)
1,749.46 (40.14%)
2,585.59 (42.45%)
3,174.42 (44.20%)
4,073.55 (47.35%)
Total 34,152,644 38,176,535 38,469,631 38,596,236 4,358.91 6,090.75 7,181.63 8,602.51
Source: EU JRC, 2018
The most recent edition of the “Barometer of Healthy Homes” (“Barometr zdrowych domów 2018”) study also confirms that 60% of the Polish population currently lives in cities and sub-urbs. In the years 1961-2011 in Poland, the population growth in the suburbs was 22%, as the country recorded a higher level of urban development in relation to the rest of Europe. The
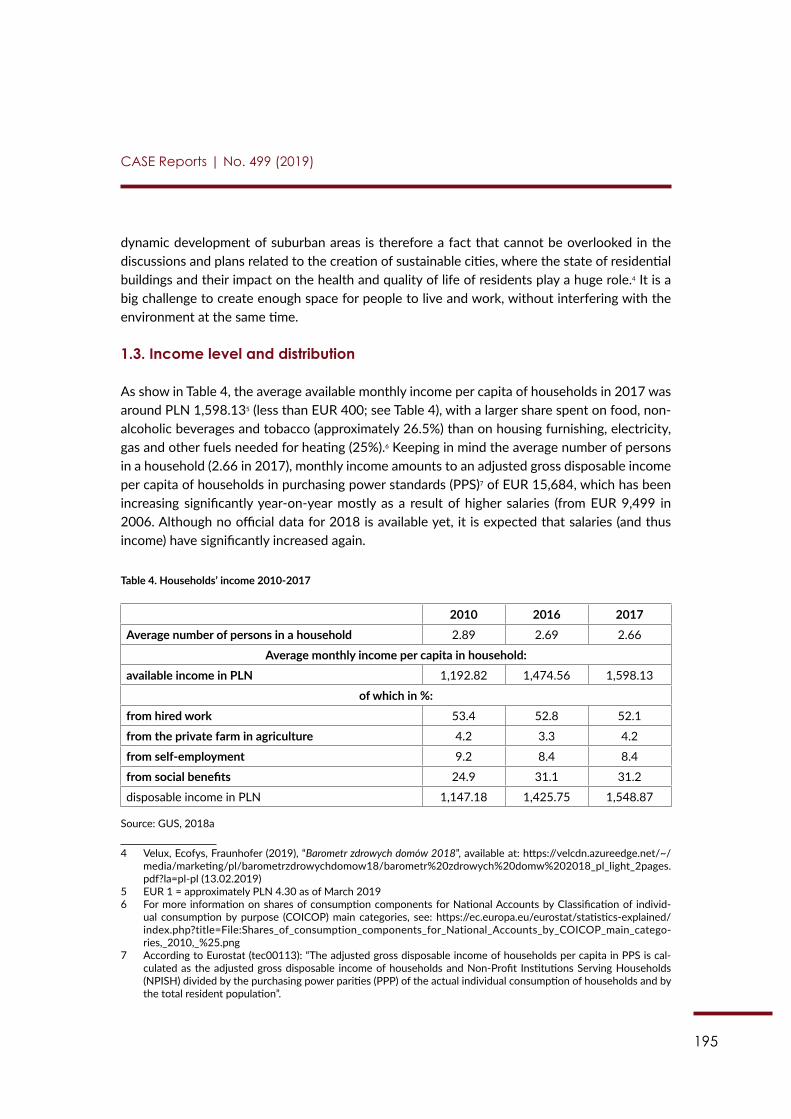
195
CASE Reports | No. 499 (2019)
dynamic development of suburban areas is therefore a fact that cannot be overlooked in the discussions and plans related to the creation of sustainable cities, where the state of residential buildings and their impact on the health and quality of life of residents play a huge role.4 It is a big challenge to create enough space for people to live and work, without interfering with the environment at the same time.
1.3. Income level and distribution
As show in Table 4, the average available monthly income per capita of households in 2017 was around PLN 1,598.135 (less than EUR 400; see Table 4), with a larger share spent on food, non-alcoholic beverages and tobacco (approximately 26.5%) than on housing furnishing, electricity, gas and other fuels needed for heating (25%).6 Keeping in mind the average number of persons in a household (2.66 in 2017), monthly income amounts to an adjusted gross disposable income per capita of households in purchasing power standards (PPS)7 of EUR 15,684, which has been increasing significantly year-on-year mostly as a result of higher salaries (from EUR 9,499 in 2006. Although no official data for 2018 is available yet, it is expected that salaries (and thus income) have significantly increased again.
Table 4. Households’ income 2010-2017
2010 2016 2017 Average number of persons in a household 2.89 2.69 2.66
Average monthly income per capita in household: available income in PLN 1,192.82 1,474.56 1,598.13
of which in %: from hired work 53.4 52.8 52.1
from the private farm in agriculture 4.2 3.3 4.2
from self-employment 9.2 8.4 8.4
from social benefits 24.9 31.1 31.2
disposable income in PLN 1,147.18 1,425.75 1,548.87
Source: GUS, 2018a
4 Velux, Ecofys, Fraunhofer (2019), “Barometr zdrowych domów 2018”, available at: https://velcdn.azureedge.net/~/media/marketing/pl/barometrzdrowychdomow18/barometr%20zdrowych%20domw%202018_pl_light_2pages.pdf?la=pl-pl (13.02.2019)
5 EUR 1 = approximately PLN 4.30 as of March 20196 For more information on shares of consumption components for National Accounts by Classification of individ-
ual consumption by purpose (COICOP) main categories, see: https://ec.europa.eu/eurostat/statistics-explained/index.php?title=File:Shares_of_consumption_components_for_National_Accounts_by_COICOP_main_catego-ries,_2010,_%25.png
7 According to Eurostat (tec00113): “The adjusted gross disposable income of households per capita in PPS is cal-culated as the adjusted gross disposable income of households and Non-Profit Institutions Serving Households (NPISH) divided by the purchasing power parities (PPP) of the actual individual consumption of households and by the total resident population”.
196
CASE Reports | No. 499 (2019)
Nevertheless, when compared to other Member States (MS), in 2014, the proportion of low wage earners in Poland was one of the highest (accounting for 23.6% of the working population).8 This is a main contributing factor to Poland having one of the smallest household saving rates in the EU. According to Eurostat, the savings rates for households in Poland in 2016 was 4.4% (as a percentage of gross disposable income), while a rate of 19.4% was recorded for Luxembourg and the EU average was 10.6%.9
However, the real change in median equivalised net income in national currency terms is very striking, showing approximately 6.2% growth annually. This also confirms the fast and stable growth of average monthly incomes in Poland. While the EU28 average real disposable income of households (% change compared to previous year) in 2016 was 1.9%, the rate for Poland was around 5.7%.10 If salaries continue to grow at such a fast and stable pace, it is very likely that schemes like EuroPACE will be welcomed.
1.4. The problem of air pollution
Households that are less well-off (or even energy poor – see Section 3.4.) oftentimes cannot afford more expensive climate-friendly heating systems and use older coal-fired boilers, which leads to more emissions. Moreover, given the ageing infrastructure, the low energy performance of existing buildings (particularly single-family houses, as multiple studies confirm11), the use of polluting fuels such as coal, and the low level of investments in EE and RES, Poland has some of the worst air quality in Europe and is home to 33 out of the 50 most polluted cities on the continent, according to the World Health Organization (WHO) (see Figure 2). Since 2014, the Supreme Audit Office (Najwyższa Izba Kontroli – NIK) has been publishing reports showing that the largest share of emissions is not coming from factories, but from private households. Over-all, because of air pollution, and in particular the increased concentration of particulate matters (PM), 47,300 premature deaths occur every year.12 Accordingly, poor air quality is nowadays con-sidered a socio-economic problem. The media increasingly focus on this topic and emphasise that this trend is caused primarily by the low-emission combustion of outdated boilers that are usually found in single-family houses, of which there are more than 5 million across the country, and particularly in the southern parts of Poland. People are becoming more aware of air quality and push politicians for more holistic actions to improve it (see Chapter 5).
8 For more information see: https://ec.europa.eu/eurostat/statistics-explained/index.php?title=Earnings_statistics#General_overview
9 For more information see: https://ec.europa.eu/eurostat/web/products-eurostat-news/-/WDN-20180830-1 10 For more information see: https://ec.europa.eu/eurostat/cache/digpub/european_economy/bloc-2a.html?lang=en 11 See for example report on “Technical condition of single-family houses in Poland. Renovation needs” available here:
http://www.iee.org.pl/index.php?a=text&b=32 12 For more information see: https://www.nik.gov.pl/plik/id,7764,vp,9732.pdf, as well as WHO and European Envi-
ronment Agency (EEA) data on the topic.
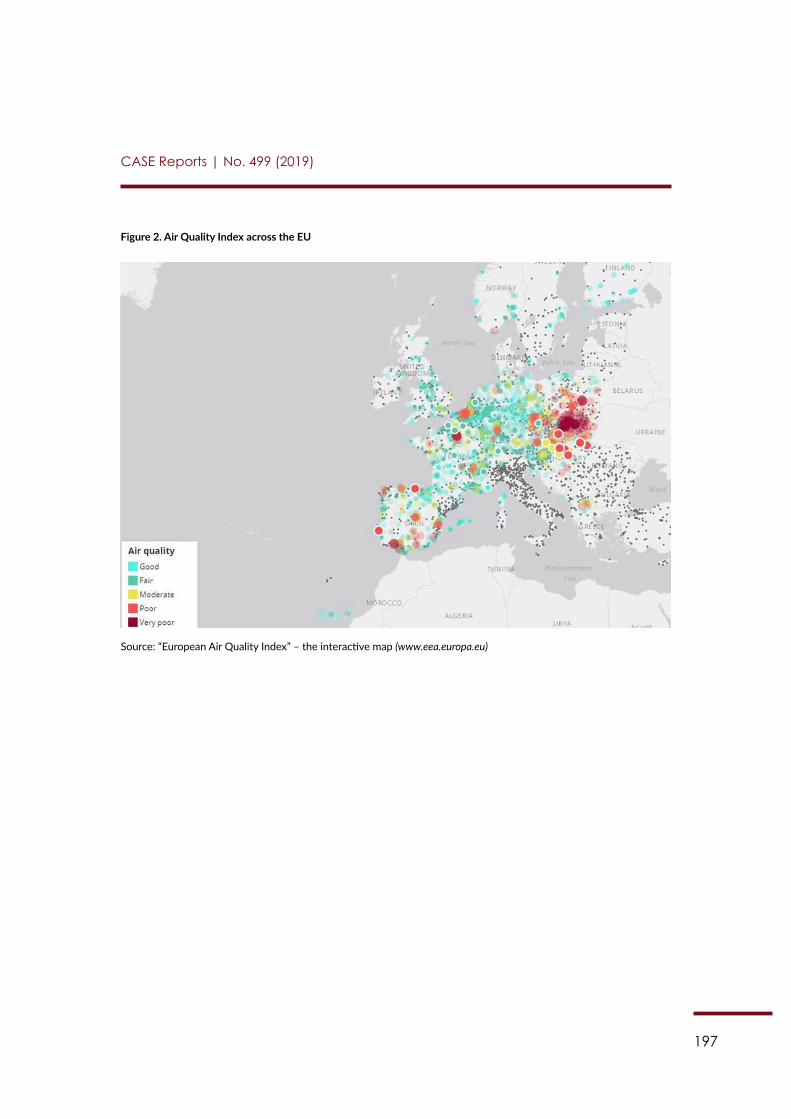
197
CASE Reports | No. 499 (2019)
Figure 2. Air Quality Index across the EU
164
1.4. The problem of air pollution Households that are less well-off (or even energy poor – see Section 3.4.) oftentimes cannot afford more expensive climate-friendly heating systems and use older coal-fired boilers, which leads to more emissions. Moreover, given the ageing infrastructure, the low energy performance of existing buildings (particularly single-family houses, as multiple studies confirm255), the use of polluting fuels such as coal, and the low level of investments in EE and RES, Poland has some of the worst air quality in Europe and is home to 33 out of the 50 most polluted cities on the continent, according to the World Health Organization (WHO) (see Figure 2). Since 2014, the Supreme Audit Office (Najwyższa Izba Kontroli - NIK) has been publishing reports showing that the largest share of emissions is not coming from factories, but from private households. Overall, because of air pollution, and in particular the increased concentration of particulate matters (PM), 47,300 premature deaths occur every year.256 Accordingly, poor air quality is nowadays considered a socio-economic problem. The media increasingly focus on this topic and emphasise that this trend is caused primarily by the low-emission combustion of outdated boilers that are usually found in single-family houses, of which there are more than 5 million across the country, and particularly in the southern parts of Poland. People are becoming more aware of air quality and push politicians for more holistic actions to improve it (see Chapter 5).
Figure 2. Air Quality Index across the EU
Source: “European Air Quality Index” - the interactive map (www.eea.europa.eu)
Chapter 2: Characteristics of the building stock 2.1. Total number of dwellings Apart from the already mentioned approximately 6 million residential buildings (2011), more recent statistics are available for single dwellings. According to the newest GUS publication “Housing economy” (September 2018), as of the end of 2017: “dwelling stock in Poland amounted to 14.4 mln (…) with the
255 See for example report on “Technical condition of single-family houses in Poland. Renovation needs” available here: http://www.iee.org.pl/index.php?a=text&b=32 256 For more information see: https://www.nik.gov.pl/plik/id,7764,vp,9732.pdf, as well as WHO and European Environment Agency (EEA) data on the topic.
Source: “European Air Quality Index” – the interactive map (www.eea.europa.eu)

198
CASE Reports | No. 499 (2019)
Chapter 2: Characteristics of the building stock
2.1. Total number of dwellings
Apart from the already mentioned approximately 6 million residential buildings (2011), more recent statistics are available for single dwellings. According to the newest GUS publication “Housing economy” (September 2018), as of the end of 2017: “dwelling stock in Poland amount-ed to 14.4 mln (…) with the total useful floor area of 1 068.6 mln m2, with 55.2 mln rooms. Com-pared to the year before, there were 167.8 thousand more dwellings (an increase of 1.2%) with the total useful floor area of 15 305.7 thousand m2 (an increase of 1.5%) and 647.3 thousand rooms (an increase of 1.2%)”.13 It is worth noticing that these statistics are in line with 2016 GUS projections presented in Table 1.
2.2. Age structure and housing stock energy demand
Table 5 presents the residential building stock by age and energy demand. Clearly, the vast majority of buildings have a very high demand for final energy (for more information, see Chapter 3). Al-though more than 23% of the building stock consists of buildings built before 1944, buildings built between 1945 and 1970 account for more than 25% of the total. These buildings, usually “blocks of flats” quite specific for Central and Eastern Europe, have a high energy consumption (more than 3.71 million dwellings), and, as a result, are interesting from the perspective of EuroPACE.
Table 5. Building stock by age and energy demand, 2010
Year of construction
Buildings Dwellings Primary energy*
Final (delivered) energy
thousands % million % kWh/(m2a) kWh/(m2a) before 1918 413.30 7.71 1.21 9.01 > 350 > 300
1918–1944 828.20 15.44 1.54 11.46 300–350 260–300
1945–1970 1367.50 25.50 3.71 27.62 250–300 220–260
1971–1978 676.50 12.61 2.16 16.08 210–250 90–220
1979–1988 763.50 14.24 2.20 16.38 160–210 140–190
1989–2002 698.40 13.02 1.52 11.31 140–180 125–160
2003–2010 616.02 11.48 1.09 8.14 100–150 90–120
All 5,363.42 100.0 13.43 100.0
* The primary energy indicator concerns the index of non-renewable energy in the purpose of heating, ventilation and domestic hot water. The final energy indicator concerns the energy of the demand on the heating and ventilation and domestic hot water.Source: Mankowski S., Szczechowiak E. (2012), Strategic research project entitled “Integrated system for reducing operating energy consumption in buildings” Research Task No. 2 Volume I, Part A: Conditions of transformations in construction.
13 GUS (2018b), “Housing economy in Poland in 2017”, available at: https://stat.gov.pl/en/topics/municipal-infra-structure/municipal-infrastructure/housing-economy-in-2017,5,14.html (5.02.2019)
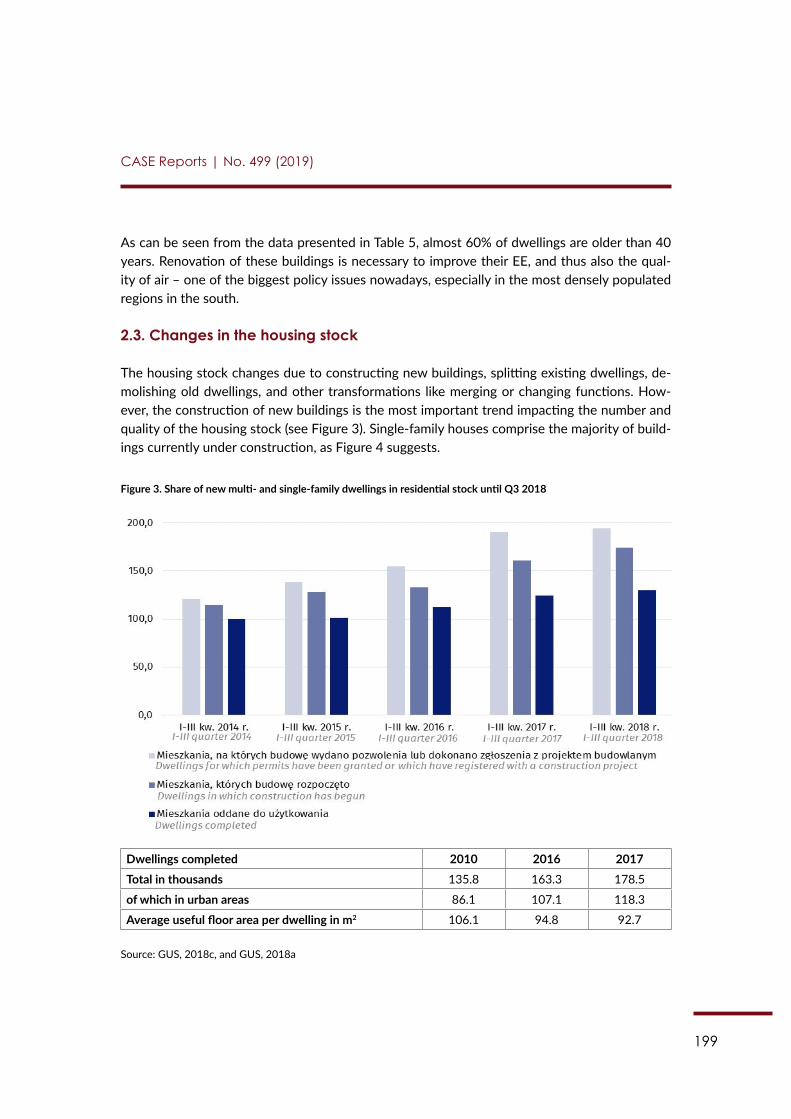
199
CASE Reports | No. 499 (2019)
As can be seen from the data presented in Table 5, almost 60% of dwellings are older than 40 years. Renovation of these buildings is necessary to improve their EE, and thus also the qual-ity of air – one of the biggest policy issues nowadays, especially in the most densely populated regions in the south.
2.3. Changes in the housing stock
The housing stock changes due to constructing new buildings, splitting existing dwellings, de-molishing old dwellings, and other transformations like merging or changing functions. How-ever, the construction of new buildings is the most important trend impacting the number and quality of the housing stock (see Figure 3). Single-family houses comprise the majority of build-ings currently under construction, as Figure 4 suggests.
Figure 3. Share of new multi- and single-family dwellings in residential stock until Q3 2018
166
Figure 3). Single-family houses comprise the majority of buildings currently under construction, as Figure 4 suggests.
Figure 3. Share of new multi- and single-family dwellings in residential stock until Q3 2018
Dwellings completed 2010 2016 2017
Total in thousands 135.8 163.3 178.5 of which in urban areas 86.1 107.1 118.3
Average useful floor area per dwelling in m2 106.1 94.8 92.7
Source: GUS, 2018c, and GUS, 2018a
Figure 4. Recent housing construction (in thousands)
Source: ZEBRA2020, interactive tool available at: https://zebra2020.eu/
Thanks to increasing construction, the share of residential buildings built before 1989, typically considered less energy efficient (as suggested by Table 5), is declining. The decrease in the stock of residential buildings built before 1989 results mainly from the replacement of old houses with new homes built to a higher standard. In recent years, a large part of the old building stock was demolished or destroyed, while others were reclassified for non-residential purposes.
Dwellings completed 2010 2016 2017 Total in thousands 135.8 163.3 178.5
of which in urban areas 86.1 107.1 118.3
Average useful floor area per dwelling in m2 106.1 94.8 92.7
Source: GUS, 2018c, and GUS, 2018a
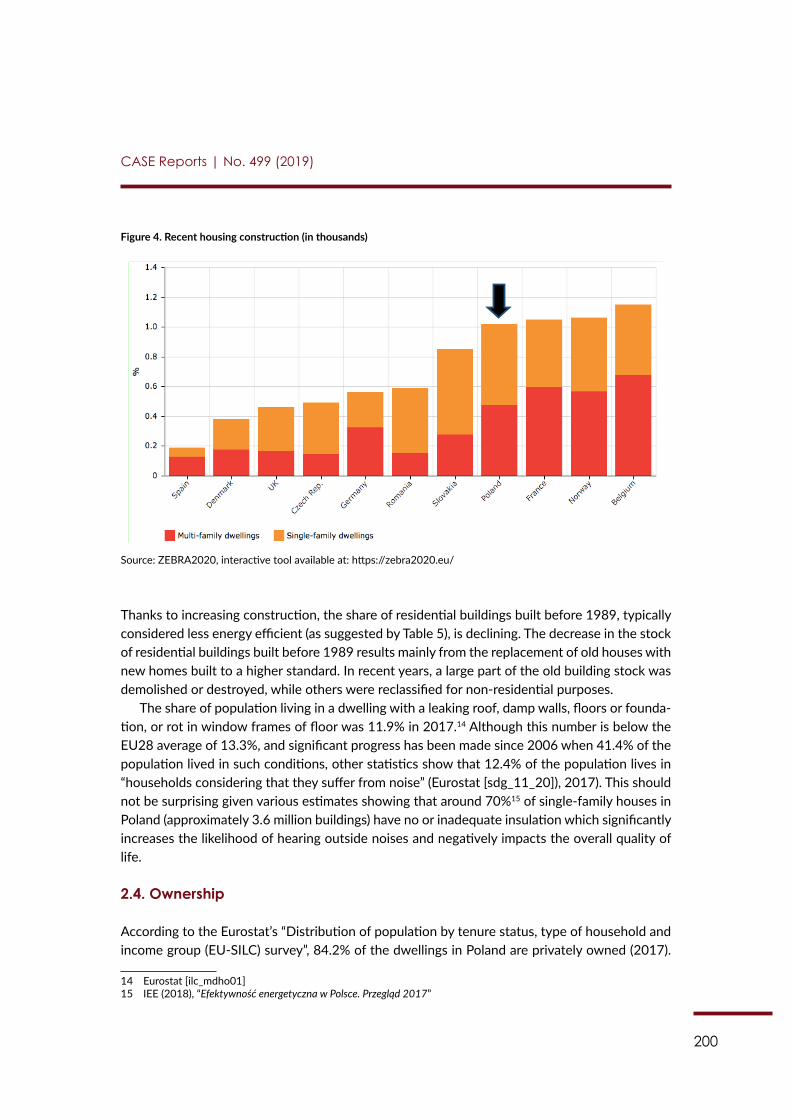
200
CASE Reports | No. 499 (2019)
Figure 4. Recent housing construction (in thousands)
166
Figure 3). Single-family houses comprise the majority of buildings currently under construction, as Figure 4 suggests.
Figure 3. Share of new multi- and single-family dwellings in residential stock until Q3 2018
Dwellings completed 2010 2016 2017
Total in thousands 135.8 163.3 178.5 of which in urban areas 86.1 107.1 118.3
Average useful floor area per dwelling in m2 106.1 94.8 92.7
Source: GUS, 2018c, and GUS, 2018a
Figure 4. Recent housing construction (in thousands)
Source: ZEBRA2020, interactive tool available at: https://zebra2020.eu/
Thanks to increasing construction, the share of residential buildings built before 1989, typically considered less energy efficient (as suggested by Table 5), is declining. The decrease in the stock of residential buildings built before 1989 results mainly from the replacement of old houses with new homes built to a higher standard. In recent years, a large part of the old building stock was demolished or destroyed, while others were reclassified for non-residential purposes.
The share of population living in a dwelling with a leaking roof, damp walls, floors or founda-tion, or rot in window frames of floor was 11.9% in 2017.14 Although this number is below the EU28 average of 13.3%, and significant progress has been made since 2006 when 41.4% of the population lived in such conditions, other statistics show that 12.4% of the population lives in “households considering that they suffer from noise” (Eurostat [sdg_11_20]), 2017). This should not be surprising given various estimates showing that around 70%15 of single-family houses in Poland (approximately 3.6 million buildings) have no or inadequate insulation which significantly increases the likelihood of hearing outside noises and negatively impacts the overall quality of life.
2.4. Ownership
According to the Eurostat’s “Distribution of population by tenure status, type of household and income group (EU-SILC) survey”, 84.2% of the dwellings in Poland are privately owned (2017).
14 Eurostat [ilc_mdho01]15 IEE (2018), “Efektywność energetyczna w Polsce. Przegląd 2017”
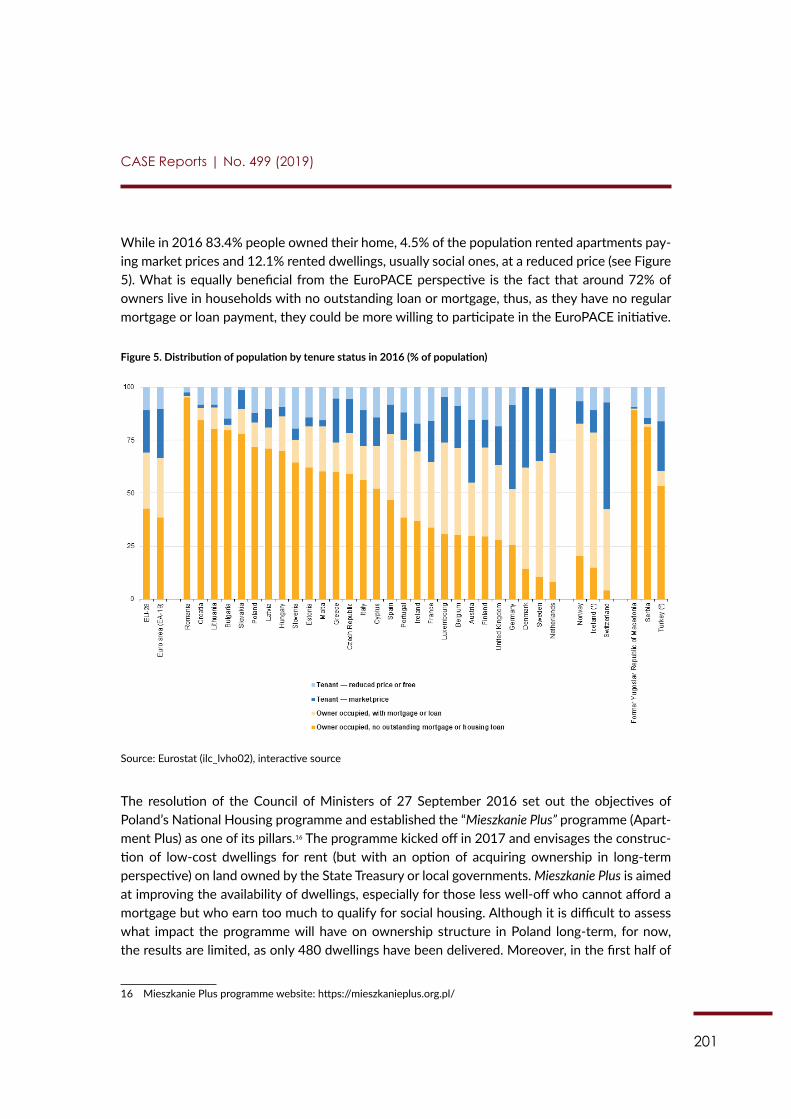
201
CASE Reports | No. 499 (2019)
While in 2016 83.4% people owned their home, 4.5% of the population rented apartments pay-ing market prices and 12.1% rented dwellings, usually social ones, at a reduced price (see Figure 5). What is equally beneficial from the EuroPACE perspective is the fact that around 72% of owners live in households with no outstanding loan or mortgage, thus, as they have no regular mortgage or loan payment, they could be more willing to participate in the EuroPACE initiative.
Figure 5. Distribution of population by tenure status in 2016 (% of population)
Source: Eurostat (ilc_lvho02), interactive source
The resolution of the Council of Ministers of 27 September 2016 set out the objectives of Poland’s National Housing programme and established the “Mieszkanie Plus” programme (Apart-ment Plus) as one of its pillars.16 The programme kicked off in 2017 and envisages the construc-tion of low-cost dwellings for rent (but with an option of acquiring ownership in long-term perspective) on land owned by the State Treasury or local governments. Mieszkanie Plus is aimed at improving the availability of dwellings, especially for those less well-off who cannot afford a mortgage but who earn too much to qualify for social housing. Although it is difficult to assess what impact the programme will have on ownership structure in Poland long-term, for now, the results are limited, as only 480 dwellings have been delivered. Moreover, in the first half of
16 Mieszkanie Plus programme website: https://mieszkanieplus.org.pl/
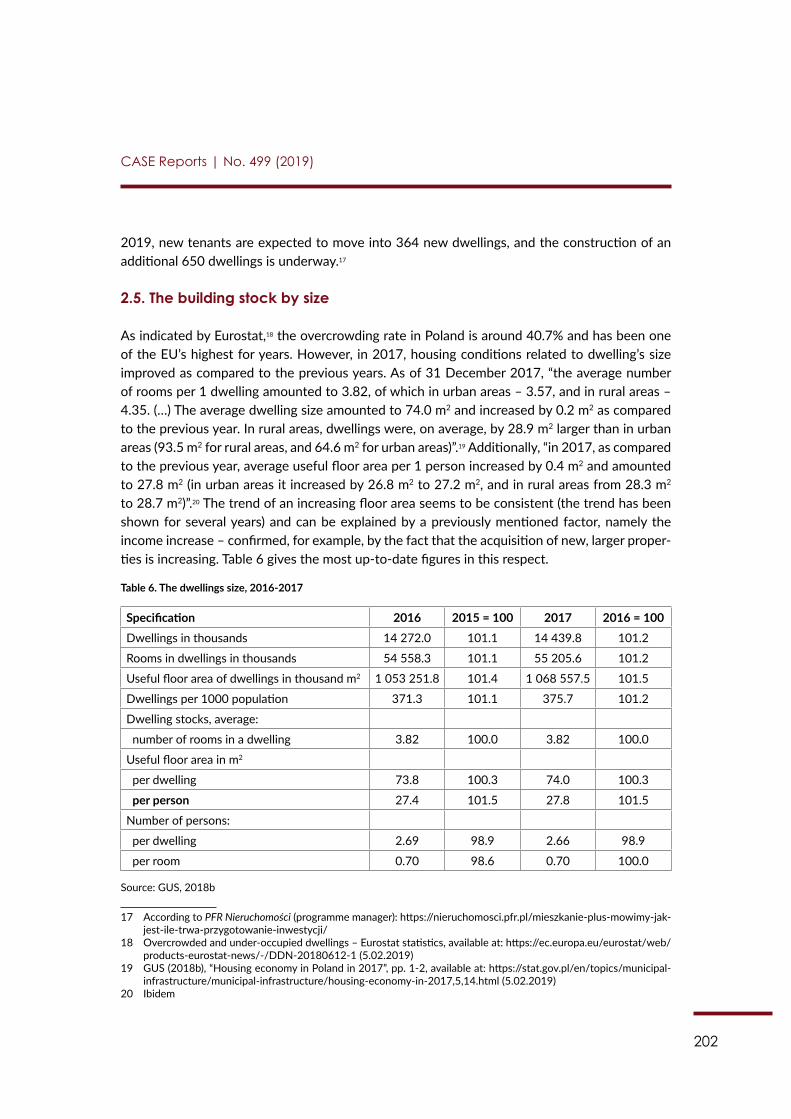
202
CASE Reports | No. 499 (2019)
2019, new tenants are expected to move into 364 new dwellings, and the construction of an additional 650 dwellings is underway.17
2.5. The building stock by size
As indicated by Eurostat,18 the overcrowding rate in Poland is around 40.7% and has been one of the EU’s highest for years. However, in 2017, housing conditions related to dwelling’s size improved as compared to the previous years. As of 31 December 2017, “the average number of rooms per 1 dwelling amounted to 3.82, of which in urban areas – 3.57, and in rural areas – 4.35. (…) The average dwelling size amounted to 74.0 m2 and increased by 0.2 m2 as compared to the previous year. In rural areas, dwellings were, on average, by 28.9 m2 larger than in urban areas (93.5 m2 for rural areas, and 64.6 m2 for urban areas)”.19 Additionally, “in 2017, as compared to the previous year, average useful floor area per 1 person increased by 0.4 m2 and amounted to 27.8 m2 (in urban areas it increased by 26.8 m2 to 27.2 m2, and in rural areas from 28.3 m2 to 28.7 m2)”.20 The trend of an increasing floor area seems to be consistent (the trend has been shown for several years) and can be explained by a previously mentioned factor, namely the income increase – confirmed, for example, by the fact that the acquisition of new, larger proper-ties is increasing. Table 6 gives the most up-to-date figures in this respect.
Table 6. The dwellings size, 2016-2017
Specification 2016 2015 = 100 2017 2016 = 100Dwellings in thousands 14 272.0 101.1 14 439.8 101.2
Rooms in dwellings in thousands 54 558.3 101.1 55 205.6 101.2
Useful floor area of dwellings in thousand m2 1 053 251.8 101.4 1 068 557.5 101.5
Dwellings per 1000 population 371.3 101.1 375.7 101.2
Dwelling stocks, average:
number of rooms in a dwelling 3.82 100.0 3.82 100.0
Useful floor area in m2
per dwelling 73.8 100.3 74.0 100.3
per person 27.4 101.5 27.8 101.5
Number of persons:
per dwelling 2.69 98.9 2.66 98.9
per room 0.70 98.6 0.70 100.0
Source: GUS, 2018b
17 According to PFR Nieruchomości (programme manager): https://nieruchomosci.pfr.pl/mieszkanie-plus-mowimy-jak-jest-ile-trwa-przygotowanie-inwestycji/
18 Overcrowded and under-occupied dwellings – Eurostat statistics, available at: https://ec.europa.eu/eurostat/web/products-eurostat-news/-/DDN-20180612-1 (5.02.2019)
19 GUS (2018b), “Housing economy in Poland in 2017”, pp. 1-2, available at: https://stat.gov.pl/en/topics/municipal-infrastructure/municipal-infrastructure/housing-economy-in-2017,5,14.html (5.02.2019)
20 Ibidem
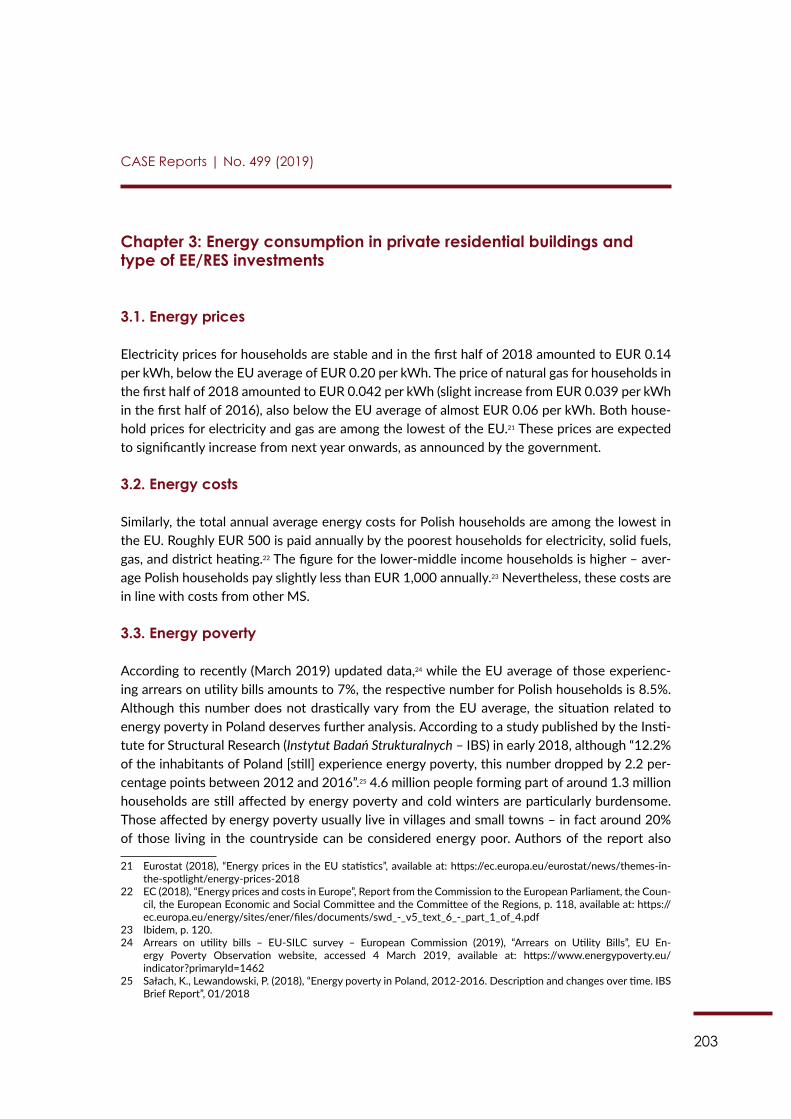
203
CASE Reports | No. 499 (2019)
Chapter 3: Energy consumption in private residential buildings and type of EE/RES investments
3.1. Energy prices
Electricity prices for households are stable and in the first half of 2018 amounted to EUR 0.14 per kWh, below the EU average of EUR 0.20 per kWh. The price of natural gas for households in the first half of 2018 amounted to EUR 0.042 per kWh (slight increase from EUR 0.039 per kWh in the first half of 2016), also below the EU average of almost EUR 0.06 per kWh. Both house-hold prices for electricity and gas are among the lowest of the EU.21 These prices are expected to significantly increase from next year onwards, as announced by the government.
3.2. Energy costs
Similarly, the total annual average energy costs for Polish households are among the lowest in the EU. Roughly EUR 500 is paid annually by the poorest households for electricity, solid fuels, gas, and district heating.22 The figure for the lower-middle income households is higher – aver-age Polish households pay slightly less than EUR 1,000 annually.23 Nevertheless, these costs are in line with costs from other MS.
3.3. Energy poverty
According to recently (March 2019) updated data,24 while the EU average of those experienc-ing arrears on utility bills amounts to 7%, the respective number for Polish households is 8.5%. Although this number does not drastically vary from the EU average, the situation related to energy poverty in Poland deserves further analysis. According to a study published by the Insti-tute for Structural Research (Instytut Badań Strukturalnych – IBS) in early 2018, although “12.2% of the inhabitants of Poland [still] experience energy poverty, this number dropped by 2.2 per-centage points between 2012 and 2016”.25 4.6 million people forming part of around 1.3 million households are still affected by energy poverty and cold winters are particularly burdensome. Those affected by energy poverty usually live in villages and small towns – in fact around 20% of those living in the countryside can be considered energy poor. Authors of the report also
21 Eurostat (2018), “Energy prices in the EU statistics”, available at: https://ec.europa.eu/eurostat/news/themes-in-the-spotlight/energy-prices-2018
22 EC (2018), “Energy prices and costs in Europe”, Report from the Commission to the European Parliament, the Coun-cil, the European Economic and Social Committee and the Committee of the Regions, p. 118, available at: https://ec.europa.eu/energy/sites/ener/files/documents/swd_-_v5_text_6_-_part_1_of_4.pdf
23 Ibidem, p. 120.24 Arrears on utility bills – EU-SILC survey – European Commission (2019), “Arrears on Utility Bills”, EU En-
ergy Poverty Observation website, accessed 4 March 2019, available at: https://www.energypoverty.eu/indicator?primaryId=1462
25 Sałach, K., Lewandowski, P. (2018), “Energy poverty in Poland, 2012-2016. Description and changes over time. IBS Brief Report”, 01/2018
204
CASE Reports | No. 499 (2019)
estimate that around “80% of the energy poor live in detached houses, and 25% are old-age and disability pensioners”.26 They also mentioned a positive correlation between the lower per-centage of the energy poor population and an increase in households’ incomes resulting mainly from the “Family 500+” social programme. Moreover, thermal renovation is considered the most expensive, but the most effective tool to help those in need by the experts cited in the report. That is because, as they also rightly noticed, “the percentage of energy poor people who were not income poor practically has not changed and amounts to about 5.6% of the population of Poland”, thus energy poverty should not be linked to income poverty but rather a separate di-mension of deprivation where more incentives (i.e. technical assistance) than social programmes that increase income are needed. In this regard, the Task Force for Reducing Energy Poverty in Poland (Zespół do spraw ograniczenia ubóstwa energetycznego w Polsce) was created in 2017. However, its activity has been rather marginal thus far as will be further discussed in Chapter 5.27
3.4. Energy consumption by source
The energy consumption of the residential sector accounted for 29.6% of the total final energy consumption in 2016, according to the most recent Eurostat statistics (energy balance sheets). This figure is higher than the EU28 average of 25.6% for the same year.
Figure 6 shows the final household energy consumption by source in 2016. Coal was a major part of energy used by Polish households, accounting for 32.5% of the final energy use. That year, district heating accounted for almost one-fifth of the final energy use (19.7%). Around 17.6% of the final energy consumption is natural gas, 13.5% fuel wood, and around 12.6% elec-tricity. A small percentage corresponds to LPG and fuel oil – 2.6% and 0.4% respectively. Other energy sources were responsible only for 1.2% of the final consumption. Clearly, households’ energy consumption, measured by percentage of relevant energy sources, differs significantly from other EU countries, given the high percentage of coal consumption.
26 Ibidem27 For more information see: https://www.gov.pl/web/energia/o-ministerstwie-zespoly-rady-komisje-komitety-ze-
spol-do-spraw-ograniczenia-ubostwa-energetycznego-w-polsce
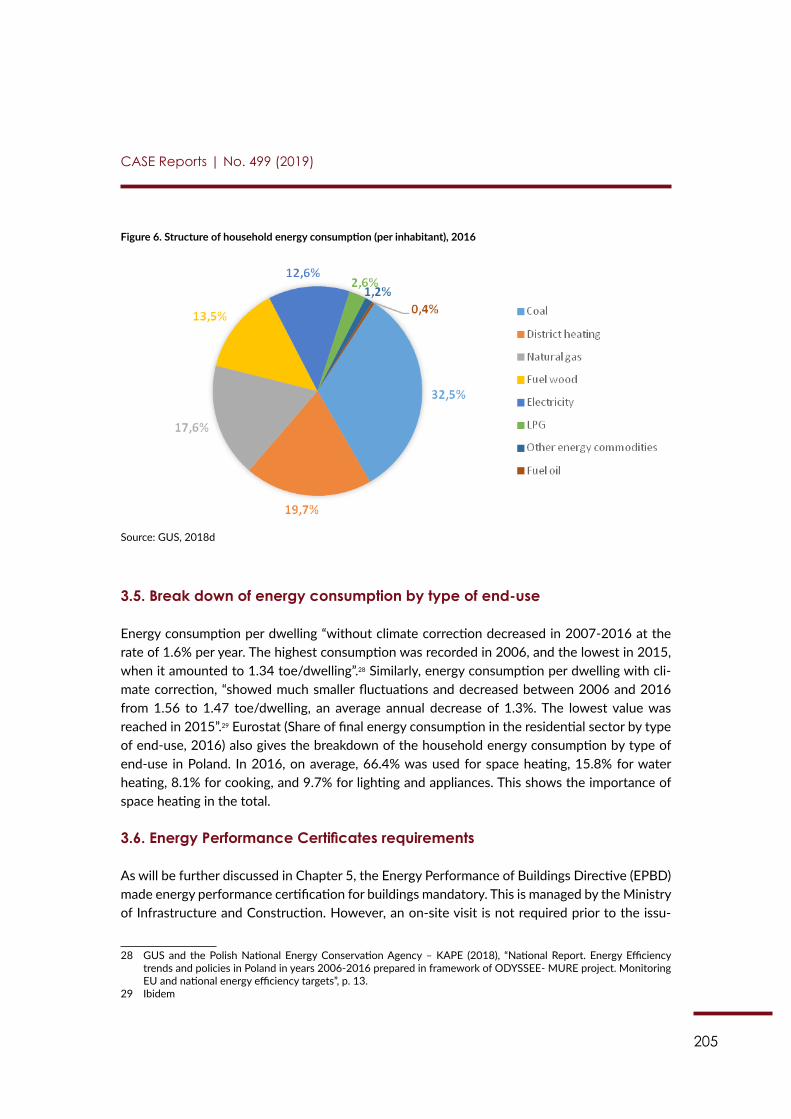
205
CASE Reports | No. 499 (2019)
Figure 6. Structure of household energy consumption (per inhabitant), 2016
Source: GUS, 2018d
3.5. Break down of energy consumption by type of end-use
Energy consumption per dwelling “without climate correction decreased in 2007-2016 at the rate of 1.6% per year. The highest consumption was recorded in 2006, and the lowest in 2015, when it amounted to 1.34 toe/dwelling”.28 Similarly, energy consumption per dwelling with cli-mate correction, “showed much smaller fluctuations and decreased between 2006 and 2016 from 1.56 to 1.47 toe/dwelling, an average annual decrease of 1.3%. The lowest value was reached in 2015”.29 Eurostat (Share of final energy consumption in the residential sector by type of end-use, 2016) also gives the breakdown of the household energy consumption by type of end-use in Poland. In 2016, on average, 66.4% was used for space heating, 15.8% for water heating, 8.1% for cooking, and 9.7% for lighting and appliances. This shows the importance of space heating in the total.
3.6. Energy Performance Certificates requirements
As will be further discussed in Chapter 5, the Energy Performance of Buildings Directive (EPBD) made energy performance certification for buildings mandatory. This is managed by the Ministry of Infrastructure and Construction. However, an on-site visit is not required prior to the issu-
28 GUS and the Polish National Energy Conservation Agency – KAPE (2018), “National Report. Energy Efficiency trends and policies in Poland in years 2006-2016 prepared in framework of ODYSSEE- MURE project. Monitoring EU and national energy efficiency targets”, p. 13.
29 Ibidem
206
CASE Reports | No. 499 (2019)
ance of an energy performance certificate (EPC) for existing buildings, as official data on energy performance (e.g. full project documentation) is considered sufficient. Moreover, “the price of EPCs can be as low as EUR 15 in Poland, a fact which raises questions on the quality of those certificates and on the ability to produce good EPCs without properly regulating the conditions of their preparation, i.e. by requiring the physical presence of a qualified expert”.30 By implica-tion, the confidence in existing energy advice tools such as EPCs is very low – only 11% of Poles express some kind of trust towards this mechanism.31
The Act on the Energy Performance of Buildings introduced a central register of the energy performance of buildings where all relevant data is available.32 With five different databases, the register works in accordance with EU regulations, as EPCs must be provided along with each building sold or rented. If the owner has not transferred the EPC, the future resident is allowed to ask the owner to fulfil his obligations by requesting the EPC at his expense. The General Of-fice of Building Control33 estimated that “in the period between 1 January 2009 and 8 March 2015, a total of 541,193 new buildings were completed and handed over to occupants, each of had an EPC. (…) Moreover, in the same period, there were 26,114 multi-family buildings built. This number represents an additional several hundred thousand EPCs for the associated indi-vidual houses.”34 Thus, it can be estimated the in early 2017, around 100,000 additional EPCs had been issued. In its current form, the system does not include any functionality counting the number of EPCs, which raises another serious problem related to transparency.
3.7. EE and RES investments trends
According to Odyssee-Mure database, in 2015, only 2.4% households possessed solar heaters and 0.4% of dwellings had a renewable heat pump, which ranks Poland as the 8th worst country in the EU in terms of using RES (from the “Households – level & trend” ranking covering resi-dential investments in EE and RES). The EE investments cannot be considered more advanced either, despite the fact that 71% of Poles completed some sort of renovation in the past five years.35 In fact the Buildings Performance Institute Europe (BPIE) estimates that “renovating 50% of the existing building stock in the next 20 years would require around EUR 5.3 billion of total annual investment per year, raising the current renovation rate of less than 1% of floor area p.a. to 2.5% p.a.”36 – a tremendous sum which most likely could not be covered with the public sources only.
30 BPIE (2014), “Energy performance certificates across the EU. Mapping of national approaches”, p. 24.31 BPIE (2018a), “Understanding potential user needs. A survey analysis of the markets for Individual Building Renova-
tion Roadmaps in Bulgaria, Poland and Portugal”, p. 14.32 The central register is available via: https://rejestrcheb.miir.gov.pl/wykazy 33 For more information see: https://www.gunb.gov.pl/o-gunb 34 CA EPBD (2018), “EPBD implementation in Poland”, p. 13, available at: https://www.epbd-ca.eu/wp-content/up-
loads/2018/08/CA-EPBD-IV-Poland-2018.pdf35 BPIE (2018a), op.cit., p. 13.36 BPIE (2018b), “Financing renovation of buildings in Poland. An overview of public funding allocation for the renova-
tion of buildings in Poland”, p. 2.
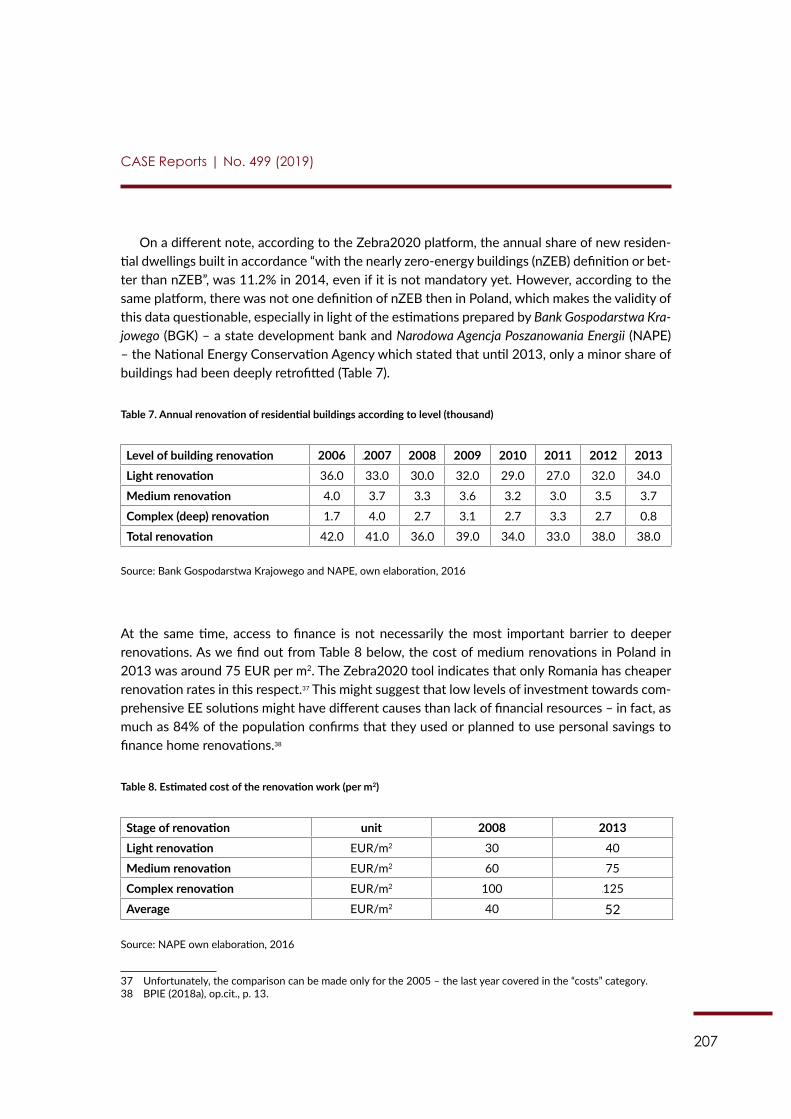
207
CASE Reports | No. 499 (2019)
On a different note, according to the Zebra2020 platform, the annual share of new residen-tial dwellings built in accordance “with the nearly zero-energy buildings (nZEB) definition or bet-ter than nZEB”, was 11.2% in 2014, even if it is not mandatory yet. However, according to the same platform, there was not one definition of nZEB then in Poland, which makes the validity of this data questionable, especially in light of the estimations prepared by Bank Gospodarstwa Kra-jowego (BGK) – a state development bank and Narodowa Agencja Poszanowania Energii (NAPE) – the National Energy Conservation Agency which stated that until 2013, only a minor share of buildings had been deeply retrofitted (Table 7).
Table 7. Annual renovation of residential buildings according to level (thousand)
Level of building renovation 2006 2007 2008 2009 2010 2011 2012 2013 Light renovation 36.0 33.0 30.0 32.0 29.0 27.0 32.0 34.0
Medium renovation 4.0 3.7 3.3 3.6 3.2 3.0 3.5 3.7
Complex (deep) renovation 1.7 4.0 2.7 3.1 2.7 3.3 2.7 0.8
Total renovation 42.0 41.0 36.0 39.0 34.0 33.0 38.0 38.0
Source: Bank Gospodarstwa Krajowego and NAPE, own elaboration, 2016
At the same time, access to finance is not necessarily the most important barrier to deeper renovations. As we find out from Table 8 below, the cost of medium renovations in Poland in 2013 was around 75 EUR per m2. The Zebra2020 tool indicates that only Romania has cheaper renovation rates in this respect.37 This might suggest that low levels of investment towards com-prehensive EE solutions might have different causes than lack of financial resources – in fact, as much as 84% of the population confirms that they used or planned to use personal savings to finance home renovations.38
Table 8. Estimated cost of the renovation work (per m2)
Stage of renovation unit 2008 2013 Light renovation EUR/m2 30 40
Medium renovation EUR/m2 60 75
Complex renovation EUR/m2 100 125
Average EUR/m2 40 52
Source: NAPE own elaboration, 2016
37 Unfortunately, the comparison can be made only for the 2005 – the last year covered in the “costs” category.38 BPIE (2018a), op.cit., p. 13.
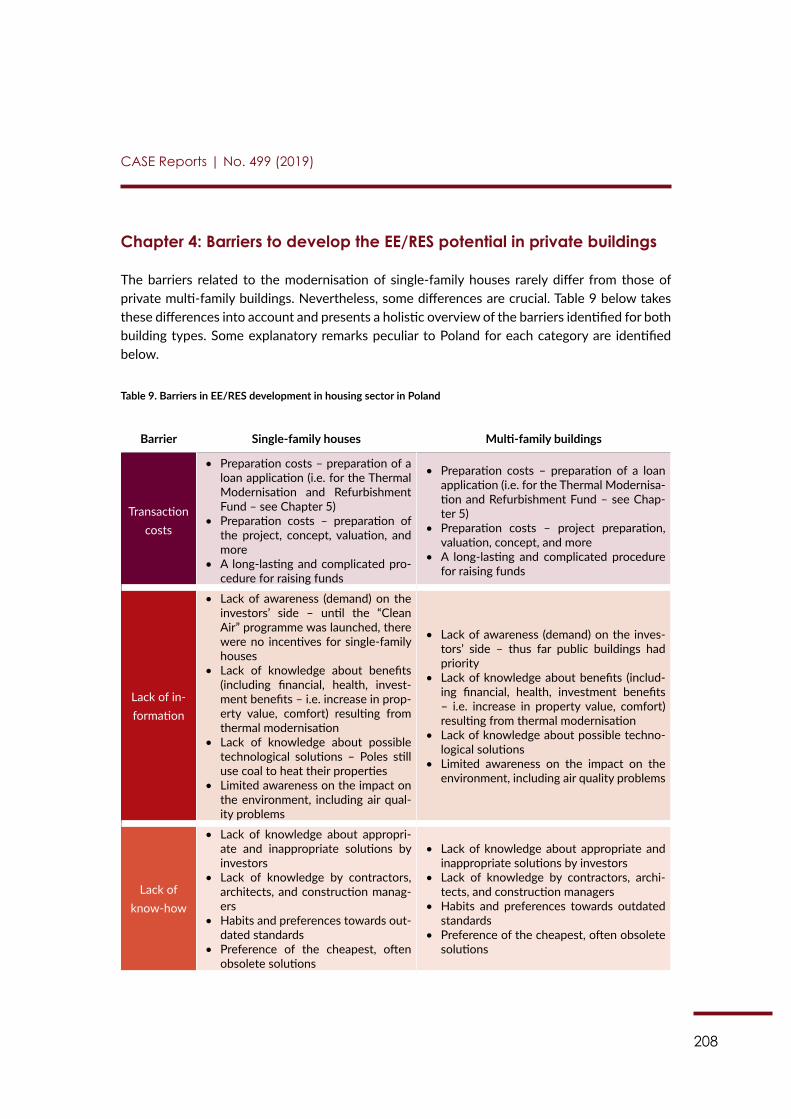
208
CASE Reports | No. 499 (2019)
Chapter 4: Barriers to develop the EE/RES potential in private buildings
The barriers related to the modernisation of single-family houses rarely differ from those of private multi-family buildings. Nevertheless, some differences are crucial. Table 9 below takes these differences into account and presents a holistic overview of the barriers identified for both building types. Some explanatory remarks peculiar to Poland for each category are identified below.
Table 9. Barriers in EE/RES development in housing sector in Poland
Barrier Single-family houses Multi-family buildings
Transaction costs
• Preparation costs – preparation of a loan application (i.e. for the Thermal Modernisation and Refurbishment Fund – see Chapter 5)
• Preparation costs – preparation of the project, concept, valuation, and more
• A long-lasting and complicated pro-cedure for raising funds
• Preparation costs – preparation of a loan application (i.e. for the Thermal Modernisa-tion and Refurbishment Fund – see Chap-ter 5)
• Preparation costs – project preparation, valuation, concept, and more
• A long-lasting and complicated procedure for raising funds
Lack of in-formation
• Lack of awareness (demand) on the investors’ side – until the “Clean Air” programme was launched, there were no incentives for single-family houses
• Lack of knowledge about benefits (including financial, health, invest-ment benefits – i.e. increase in prop-erty value, comfort) resulting from thermal modernisation
• Lack of knowledge about possible technological solutions – Poles still use coal to heat their properties
• Limited awareness on the impact on the environment, including air qual-ity problems
• Lack of awareness (demand) on the inves-tors’ side – thus far public buildings had priority
• Lack of knowledge about benefits (includ-ing financial, health, investment benefits – i.e. increase in property value, comfort) resulting from thermal modernisation
• Lack of knowledge about possible techno-logical solutions
• Limited awareness on the impact on the environment, including air quality problems
Lack of know-how
• Lack of knowledge about appropri-ate and inappropriate solutions by investors
• Lack of knowledge by contractors, architects, and construction manag-ers
• Habits and preferences towards out-dated standards
• Preference of the cheapest, often obsolete solutions
• Lack of knowledge about appropriate and inappropriate solutions by investors
• Lack of knowledge by contractors, archi-tects, and construction managers
• Habits and preferences towards outdated standards
• Preference of the cheapest, often obsolete solutions
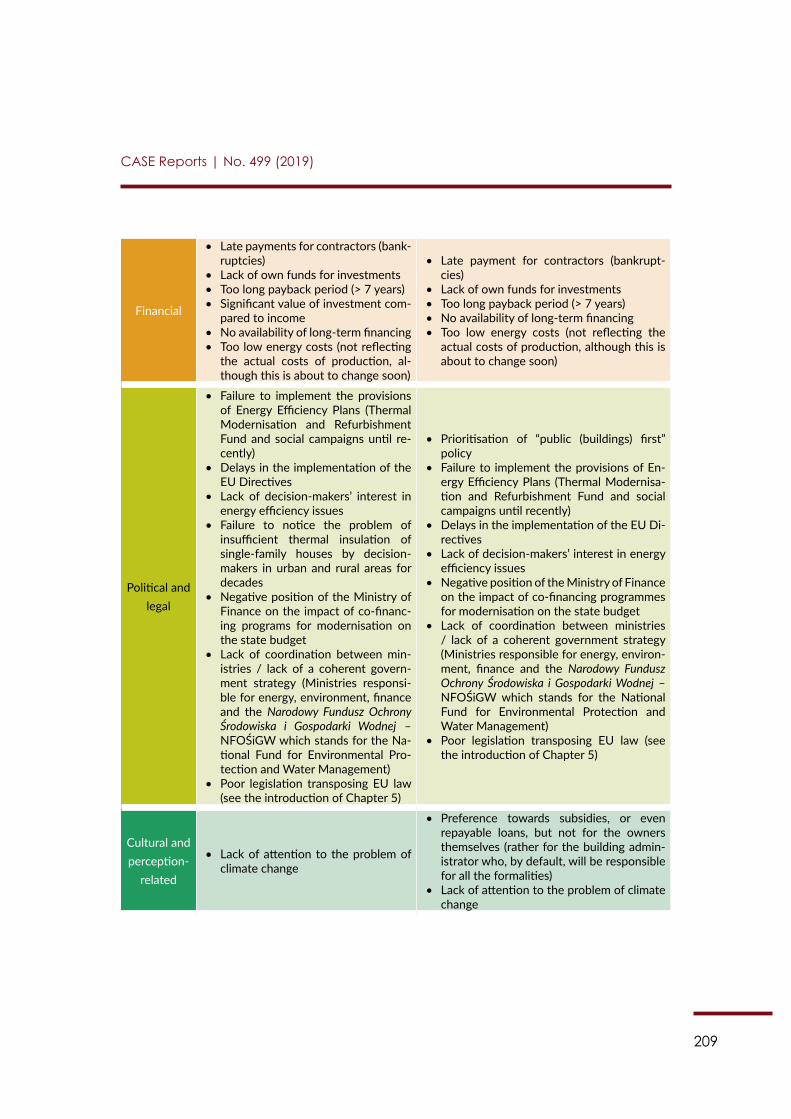
209
CASE Reports | No. 499 (2019)
Financial
• Late payments for contractors (bank-ruptcies)
• Lack of own funds for investments• Too long payback period (> 7 years)• Significant value of investment com-
pared to income• No availability of long-term financing• Too low energy costs (not reflecting
the actual costs of production, al-though this is about to change soon)
• Late payment for contractors (bankrupt-cies)
• Lack of own funds for investments• Too long payback period (> 7 years)• No availability of long-term financing• Too low energy costs (not reflecting the
actual costs of production, although this is about to change soon)
Political and legal
• Failure to implement the provisions of Energy Efficiency Plans (Thermal Modernisation and Refurbishment Fund and social campaigns until re-cently)
• Delays in the implementation of the EU Directives
• Lack of decision-makers’ interest in energy efficiency issues
• Failure to notice the problem of insufficient thermal insulation of single-family houses by decision-makers in urban and rural areas for decades
• Negative position of the Ministry of Finance on the impact of co-financ-ing programs for modernisation on the state budget
• Lack of coordination between min-istries / lack of a coherent govern-ment strategy (Ministries responsi-ble for energy, environment, finance and the Narodowy Fundusz Ochrony Środowiska i Gospodarki Wodnej – NFOŚiGW which stands for the Na-tional Fund for Environmental Pro-tection and Water Management)
• Poor legislation transposing EU law (see the introduction of Chapter 5)
• Prioritisation of “public (buildings) first” policy
• Failure to implement the provisions of En-ergy Efficiency Plans (Thermal Modernisa-tion and Refurbishment Fund and social campaigns until recently)
• Delays in the implementation of the EU Di-rectives
• Lack of decision-makers’ interest in energy efficiency issues
• Negative position of the Ministry of Finance on the impact of co-financing programmes for modernisation on the state budget
• Lack of coordination between ministries / lack of a coherent government strategy (Ministries responsible for energy, environ-ment, finance and the Narodowy Fundusz Ochrony Środowiska i Gospodarki Wodnej – NFOŚiGW which stands for the National Fund for Environmental Protection and Water Management)
• Poor legislation transposing EU law (see the introduction of Chapter 5)
Cultural and perception-
related
• Lack of attention to the problem of climate change
• Preference towards subsidies, or even repayable loans, but not for the owners themselves (rather for the building admin-istrator who, by default, will be responsible for all the formalities)
• Lack of attention to the problem of climate change
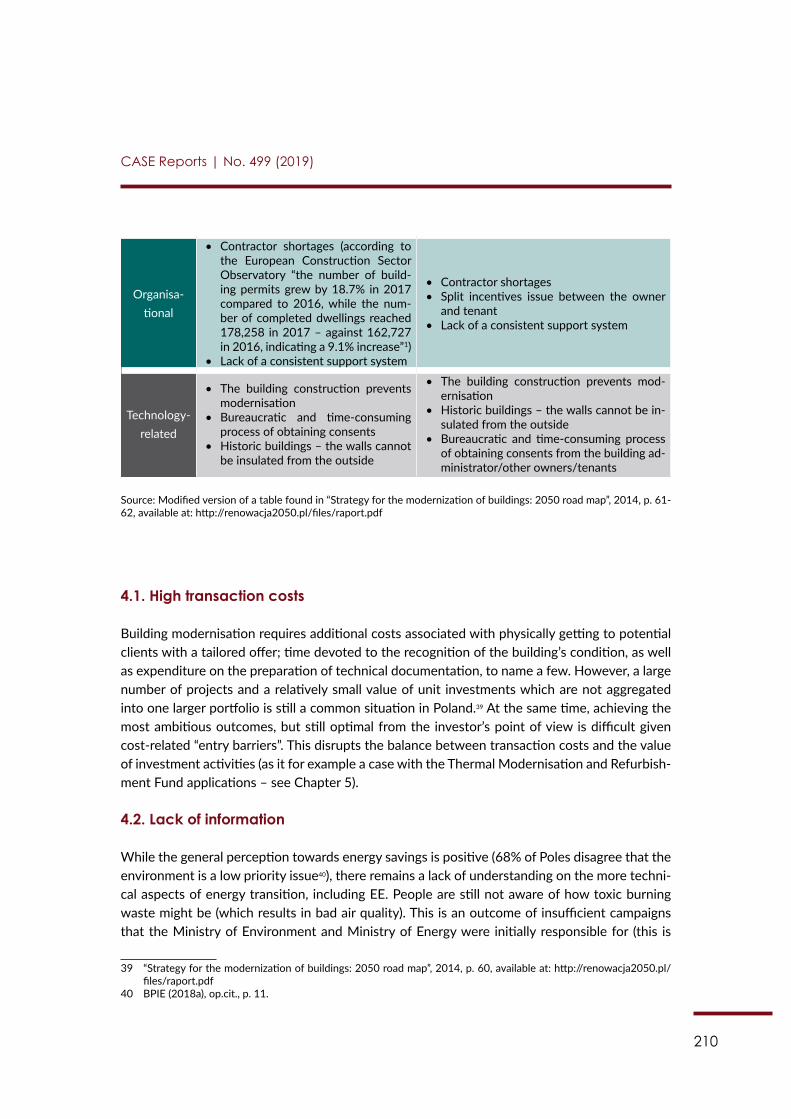
210
CASE Reports | No. 499 (2019)
Organisa-tional
• Contractor shortages (according to the European Construction Sector Observatory “the number of build-ing permits grew by 18.7% in 2017 compared to 2016, while the num-ber of completed dwellings reached 178,258 in 2017 – against 162,727 in 2016, indicating a 9.1% increase”1)
• Lack of a consistent support system
• Contractor shortages• Split incentives issue between the owner
and tenant • Lack of a consistent support system
Technology-related
• The building construction prevents modernisation
• Bureaucratic and time-consuming process of obtaining consents
• Historic buildings – the walls cannot be insulated from the outside
• The building construction prevents mod-ernisation
• Historic buildings – the walls cannot be in-sulated from the outside
• Bureaucratic and time-consuming process of obtaining consents from the building ad-ministrator/other owners/tenants
Source: Modified version of a table found in “Strategy for the modernization of buildings: 2050 road map”, 2014, p. 61-62, available at: http://renowacja2050.pl/files/raport.pdf
4.1. High transaction costs
Building modernisation requires additional costs associated with physically getting to potential clients with a tailored offer; time devoted to the recognition of the building’s condition, as well as expenditure on the preparation of technical documentation, to name a few. However, a large number of projects and a relatively small value of unit investments which are not aggregated into one larger portfolio is still a common situation in Poland.39 At the same time, achieving the most ambitious outcomes, but still optimal from the investor’s point of view is difficult given cost-related “entry barriers”. This disrupts the balance between transaction costs and the value of investment activities (as it for example a case with the Thermal Modernisation and Refurbish-ment Fund applications – see Chapter 5).
4.2. Lack of information
While the general perception towards energy savings is positive (68% of Poles disagree that the environment is a low priority issue40), there remains a lack of understanding on the more techni-cal aspects of energy transition, including EE. People are still not aware of how toxic burning waste might be (which results in bad air quality). This is an outcome of insufficient campaigns that the Ministry of Environment and Ministry of Energy were initially responsible for (this is
39 “Strategy for the modernization of buildings: 2050 road map”, 2014, p. 60, available at: http://renowacja2050.pl/files/raport.pdf
40 BPIE (2018a), op.cit., p. 11.
211
CASE Reports | No. 499 (2019)
slowly starting to change as depicted in Chapter 5 – i.e. the introduction of the EPBD definitely raised awareness on the topic). In fact, 23% of homeowners who had not renovated their prop-erties stated that the main reason for them not pursuing retrofits is that their home is “already energy efficient”.41 This is a rather alarming number which can be solved once energy advisors are more accessible.
4.3. Lack of know-how
This obstacle translates directly into errors in projects and the selection and implementation of equipment, appliances, and solutions, and as a result negatively impacts the certification of the retrofitted (but also newly-built) buildings. Lack of knowledge among contractors leads to design errors in the implementation of solutions for the insulation of external partitions, heat-ing installations, and mechanical ventilation installations with heat recovery. This then leads to creation of thermal bridges and large heat losses.42 In Poland, lack of know-how has been dis-cussed primarily in relation to photovoltaics and solar systems. Various companies, mostly those that operate in the “grey zone”, offer very cheap workmanship, however, with a very low level of expertise and without any guarantees regarding the quality of the works performed. This means that not only the EPC assessment will be weaker than initially expected, but also, in a pessimistic scenario, might require additional works to be contracted.
4.4. Financial
Financial constraints can be divided into separate categories. Nevertheless, it is the actual lack of availability of long-term, easily available financing that makes it impossible to carry out com-prehensive renovation activities that would lead to the rapid achievement of significant energy savings. In Poland, especially in single-family buildings, due to the lack of funds, ad hoc renova-tion works are undertaken by home-owners themselves in order to save money. Unsurprisingly, these works are not performed using the most appropriate solutions, and their scope is not usually optimised from the technical and economic point of view. In addition to that, late pay-ments to contractors lead to bankruptcies and significantly limit renovations, as the European Construction Sector Observatory rightly notices in its country factsheet for Poland.
4.5. Political and legal
Before the “Clean Air” programme was launched (see Chapter 5), out of all funds received in the 2014-2020 multi-annual financial perspective (MFF), particularly from Cohesion Policy Funds, Poland committed to spending more than EUR 5 per m2 on the EE of public buildings and EUR 2 per m2 for residential multi-family buildings, while no funds were allocated to single-family
41 Ibidem42 “Strategy for the modernization of buildings: 2050 road map”, 2014, p. 60, available at: http://renowacja2050.pl/
files/raport.pdf
212
CASE Reports | No. 499 (2019)
houses, despite comprising a 45% share of the total building floor area. Furthermore, the aver-age cost of renovation of public buildings (per building) is estimated to be significantly higher than that of residential buildings (“the average cost, per building, of deep renovation of public buildings is around 4 times higher than those for the renovation of multi-family buildings and over 23 times higher than in case of single- family buildings”, according to BPIE43) given their larger area and the additional solutions needed (i.e. facilities for people with disabilities). This policy was favoured until last year primarily because it did not require as many administrative burdens as single- and multi-family buildings renovations do. In effect, no significant incentives for residential retrofits were in place.
4.6. Cultural and perception-related
Although no official sources have been found to prove this hypothesis,44 there is a general per-ception that Poles are accustomed to grants and subsidies, and even if they can afford pursuing renovations only from savings, they still prefer to wait for some kind of governmental support. The currently offered incentives under the “Clean Air” priority programme (see Chapter 5) might deepen this habit.
4.7. Organisational
Contractor shortages (according to the European Construction Sector Observatory “the number of building permits grew by 18.7% in 2017 compared to 2016, while the number of completed dwellings reached 178,258 in 2017 – against 162,727 in 2016, indicating a 9.1% increase” as in-dicated in the Table 9 above) are the biggest threat for the Polish construction sector at the mo-ment, which presents one of the highest shares of bottleneck vacancies in the Polish economy. The European Construction Sector Observatory notes that employers find it particularly bur-densome to fill vacancies for bricklayers and plasterers. Moreover, split incentive issues make it can be difficult to agree on energy saving investments in rented and multi-family residential buildings where property owners have to either approve a decision or make a financial contribu-tion, as it is usually a case in Poland. However, given the high home-ownership rates in Poland, this barrier is still far less burdensome than in other EU MS.
4.8. Technology-related
When planning a renovation in Poland, one has to remember that some works require informing relevant authorities about them, as well as obtaining consent from the cooperative or housing community (in multi-family buildings), especially if the works planned interfere with the com-mon parts of the building. Minor works can usually be carried out without any notifications and
43 BPIE (2018b), op.cit., p. 18. 44 The survey undertaken as a part of “Efektywność energetyczna w Polsce. Przegląd 2017” commercial study, confirms
this hypothesis.
213
CASE Reports | No. 499 (2019)
permits, although also in this case it is worth checking the rules with the administrator (in multi-family buildings)/municipality. The situation requires some further consents when one aims to retrofit a monument building or a building located in the area under the supervision of the con-servator. Obtaining special arrangements in this case can be an exceptionally time-consuming bureaucratic process.
In summary, properly planned modernisation has to overcome these barriers, at the same time responding to the needs of investors, who pay attention to completely different criteria when deciding on renovation than in case of government which oftentimes offers non-repayable subsidies. A comprehensive one-stop-shop modernisation platform financed, at least partially, from private sources, could significantly limit a range of a majority of the barriers identified.
214
CASE Reports | No. 499 (2019)
Chapter 5: Policies related to energy efficiency and renewable energy in buildings
5.1. Energy Performance of Buildings Directive framework
The Polish standard of the energy audit of buildings, published in 1999, is to a large extent a benchmark for institutions providing EE financing for the residential sector. Nevertheless, poli-cies for the building sector have been under constant change in recent years, reflecting changes in the EU’s legislation. On 22 June 2015, the national plan for increasing the share of buildings with low energy consumption was adopted stating that “by 31 December 2018, all new build-ings occupied by public authorities or owned by the government should be nZEB; by 31 Decem-ber 2020, all new buildings should be nZEB”.45 The document defined the targets and the exact elements of nZEB relevant for all interested stakeholders (investors, contractors, architects, and others), including a timetable of achieving them in accordance with Article 9 §3 of the EPBD.46 Apart from policy solutions aimed at increasing EE, strong attention has been paid to actions promoting the use of RES in buildings as well as possible financing schemes.
Furthermore, in order to be fully in line with the recently amended EPBD, a draft of the 2030 Plan for Energy and Climate is under consultation (17 February 2019).47 The draft lacks, inter alia, the inclusion of support mechanisms for the construction sector to implement nZEBs, as well as actions for substantially limiting the use of fossil fuels (predominately coal) in buildings by 2050, as established in the revised EPBD.
A short analysis on the implementation of the EPBD in relation to existing and new buildings is presented below. It is largely based on the reports of the Concerted Action on EPBD.48
5.1.1. Energy performance requirements: existing buildings
In the national plan, from 2015, a strong emphasis is paid not only to outlining a “comprehensive approach to EE” and increasing the share of RES in case of a building renovation (in accordance with Article 9, §3 of the EPBD), but also to infrastructural needs. For example: “with regard to certain elements of heating, domestic hot water and cooling systems, one of the key areas covered by the regulation is the limitation of heat loss from pipes, which has to be kept below a reasonable maximum level”.49
45 For more information see: http://prawo.sejm.gov.pl/isap.nsf/download.xsp/WMP20150000614/O/M20150614.pdf
46 For more information see: https://eur-lex.europa.eu/legal-content/EN/TXT/?toc=OJ%3AL%3A2018%3A156%3ATOC&uri=uriserv%3AOJ.L_.2018.156.01.0075.01.ENG
47 For more information see: https://www.gov.pl/web/energia/projekt-krajowego-planu-na-rzecz-energii-i-klimatu-na-lata-2021-2030
48 For more information see: https://www.epbd-ca.eu/49 CA EPBD, op.cit., p. 9.
215
CASE Reports | No. 499 (2019)
Apart from securing enough funds for effective modernisations from national (Thermal Mod-ernisation and Refurbishment Fund50) and European (The Operational Programme Infrastructure and Environment 2014-2020 from the European Regional Development Fund and the Cohesion Funds51) sources, there is a great focus on information campaigns promoting EE in buildings. A comprehensive “Guide to Improve the Energy Performance of Buildings” published in June 2016 and updated in January 201852 by the Ministry of Investment and Economic Development (MIiR) presents multiple examples and best practices on improving energy performance of buildings in a reader-friendly form of transparent case studies on which, for example, a EuroPACE bulletin could be based.
5.1.2. Energy performance requirements: new buildings
The energy performance requirements for new buildings came into force on 1 January 2014 and covered “obligatory minimum requirements” for all public authorities’ buildings constructed from 1 January 2019 onwards, and from 1 January 2021 for all buildings. These are obligatory minimum requirements to all materials used in the building.
5.2. “Clean Air” priority programme
On 11 September 2018, the governmental priority programme, named “Clean Air”, began. Apart from awareness-raising campaigns related to sources of bad air quality, there is a strong empha-sis on improving EE and increasing the share of RES in the final consumption of single-family buildings, as well as by providing financial incentives. The programme enables natural persons, i.e. owners and co-owners of single-family houses and persons who plan to build them, to re-ceive co-financing (subsidies and/or loans depending on the income) for the thermal modernisa-tion of buildings in order to reduce polluting emissions. The catalogue of activities is not a closed list and will be complemented depending on emerging needs. Amendments will be possible mainly because the project activities will last for 12 years (2018-2029).53 Financial incentives and public awareness campaigns will be ineffective without the right legislation in place. In this context, the government is currently focusing on setting emission standards for solid fuel boil-ers.54 The second type of support is strictly financial (see Section 5.3. below), whereas the last component of the programme focuses on raising awareness. This complementary action is cru-cial given the limited knowledge of a large part of the Polish population on the negative impacts of smog, as well as the ways in which air quality can be improved.55 Overall, the “Clear Air” prior-ity programme provides a framework for all other actions and initiatives targeting EE and RES.
50 For more information see: https://www.bgk.pl/osoby-fizyczne/fundusz-termomodernizacji-i-remontow/ 51 For more information see: https://www.funduszeeuropejskie.gov.pl/en/site/learn-more-about-european-funds/
look-through-the-documents/operational-programme-infrastructure-and-environment-20142020/ 52 For more information on MIiR guidelines see: https://www.miir.gov.pl/media/51735/poradnik_12_2017_MIB.pdf 53 Applications can be submitted within first 10 years though.54 Loosely translated from the Ministry of Entrepreneurship and Technology website: https://www.mpit.gov.pl/st-
rony/zadania/czyste-powietrze/ 55 For more detailed information see: http://www.nfosigw.gov.pl/gfx/nfosigw/userfiles/files/czyste_powietrze/1_
216
CASE Reports | No. 499 (2019)
5.3. Financing schemes for modernisation of the residential sector
Numerous financing schemes for improving EE in existing buildings are available today. What is peculiar is the fact that successful programmes have been closed, although initially were prom-ised to last until post-2020 (i.e. the well-known and well-assessed “Ryś”), and replaced with new ones, indeed typically far larger in scale. Therefore, the overview presented below focuses predominantly on those where the call for applications is still open. At the same time, given that they are new, an impact assessment is impossible; thus, only a partial summation will be pro-vided. Moreover, given the multitude of EE and RES supporting schemes at the local level, only those most relevant for EuroPACE will be presented.
5.3.1. Incentives related to the “Clean Air” programme
“Clean Air” co-finances the replacement of old-generation heating systems using solid fuels with new generation solid fuel boilers (meeting the programme’s requirements), electric heating systems, condensing gas boilers, and heat pumps. Furthermore, the insulation of the internal and external parts of the building and the replacement of external joinery can be co-financed as well. The intensity of grant support depends on the household’s monthly income per person. While the minimum value of eligible costs is PLN 7,000, the maximum eligible costs from which the subsidy can be calculated is capped at PLN 53,000 (see Annex: Table 1). Furthermore, the programme provides loans for solar collectors and photovoltaic installations.56 Loans have a du-ration of up to 15 years with a preferential interest rate, currently at the level of 2.4%. It is pos-sible to apply for a loan without applying for a subsidy.
The programme’s budget amounts to PLN 103 billion, of which PLN 63.3 billion will be allo-cated for subsidies, and PLN 39.7 billion for loans. The framework is managed and administered by NFOŚiGW and its local branches – the Voivodship Funds for Environmental Protection and Water Management (Wojewódzki Fundusz Ochrony Środowiska i Gospodarki Wodnej – WFOŚiGW). The latter are not always capable of managing such multi-stakeholder programmes as under the “Clean Air” every citizen interested in the programme applies directly to the fund’s local (voivod-ship level) branch. The application itself is a long administrative form, available also online. Most likely this bureaucratic red tape is a reason for a limited success of the programme: between September 2018 and February 2019, out of 25,742 applications submitted, only 147 contracts under “Clean Air” were signed, according to a response received by the Polish Smog Alarm (Pol-ski Alarm Smogowy) from the NFOŚiGW.57 In practice, in terms of contracts signed, less than 0.5% of the initially set annual target was implemented in the first five months: the initial plan estimated approximately 4 million contracts signed within ten years (about 400,000 per year). Nevertheless, the biggest issue thus far is related to the fact that all costs related to moderni-
program_priorytetowy_czyste_powietrze_2019-01-15__003.pdf 56 For more information see: http://www.nfosigw.gov.pl/czyste-powietrze/o-programie-czyste-powietrze-/ 57 For more information see: https://polskialarmsmogowy.pl/polski-alarm-smogowy/aktualnosci/szczegoly,fikcyjny-
program-czyste-powietrze---pas-zapytal-o-realizacje-rzadowego-planu,640.html
217
CASE Reports | No. 499 (2019)
sation need to be paid upfront by the home owners. The subsidy is provided only after some phases of work are implemented and documented. As a result, there is a chance that for light and medium renovations, financial support will be given only for or even after the final stage of works. The current rules of the programme make it impossible for those less well-off to benefit from the programme’s incentives, which leaves enough room for other programmes providing upfront financing. Moreover, although this information has not been confirmed by the Ministry of Finance yet, financial incentives under the “Clean Air” programme given the possibility to change the programme’s priorities throughout its realisation, could be blended with some in-novative financial schemes in the future.
5.3.2. “Stop Smog” programme
This programme, in turn, focuses primarily on energy poor households. It entered into force on 20 December 2018. What distinguishes “Stop Smog” from “Clean Air” is the fact that the former is a type of social assistance programme for selected groups. This programme is mainly for low-income residents in the most polluted cities and in cities with less than 100,000 habi-tants (where, as already stated, energy poverty is more common). The programme will therefore be implemented in close cooperation with municipalities. The pilot will initially cost the state budget PLN 883.2 million in the years 2019-2024, which will be forwarded to the Thermal Modernisation and Refurbishment Fund, run by BGK. The majority of this amount – around PLN 700 million – will be financed from the recently introduced recycling fee incurred by retailers for providing plastic bags to customers. First, support will be directed to the energy poor in 33 towns from the WHO list of the 50 most polluted European cities (100% subsidies). Then, in the case of towns with less than 100,000 residents, subsidies can be given up to 70% depending on household income level (with an own contribution of 30% of costs), while for larger cities – subsidies covering around 30% of total costs have been promised. The remaining part will be financed from the state budget. Overall, co-financing will be covered by “low-emission ventures” – the exchange of high-emission heating sources for devices that meet emission standards or connection to district heating or a gas network with simultaneous thermal modernisation of the building. As is the case for the priority programme, “Stop Smog” sets the maximum average cost of implementing a low-emission project in single-family building at PLN 53,000. Funds from the Thermal Modernisation and Refurbishment Fund for the implementation of projects will be directly forwarded to the municipalities responsible for signing agreements with residents interested in undertaking low-emission projects. In order to apply for the funds available under “Stop Smog”, the municipality will have to submit an application in accordance with the targets set under the obligatory municipal low-emission plan prepared beforehand. With low-emission plans in place, these municipalities could be more eager to push for additional EE and RES in-vestments, possibly even considering developing a EuroPACE programme and at least for those citizens not meeting the income cap criteria.58
58 For more information see: https://www.malopolska.pl/aktualnosci/srodowisko/malopolska-w-trosce-o-czyste-powietrze-stop-smog
218
CASE Reports | No. 499 (2019)
“Stop Smog” is the first holistic program targeting the energy poor. Before it was launched, only an energy bill supplement was provided by the government for those in need. The lump sum allowances of: a) PLN 11.22 per month for a household consisting of a single person; b) PLN 15.58 per month for a household consisting of two to four people; and c) PLN 18.70 per month for a household consisting of at least five people are so limited that it is difficult to find correla-tions with any other incentive.59
5.3.3. Individual income tax deduction for thermal modernisation and RES ex-penses
From 1 January 2019, expenses related to thermal modernisation and RES installation can be deducted from income tax. According to the Ministry of Finance, the new law allows for a tax deduction of 23% capped at PLN 53,000s for all expenses related to home retrofits once rel-evant invoices are provided. It allows deductions for the 2019 tax period if the modernisation is completed within three years.60 This tax deduction is difficult to obtain in practice (i.e. the Installation Market portal61) mainly given its bureaucratic requirements. After an in-depth analy-sis of the act, one quickly discovers that the tax office introduced significant restrictions to the optimistic numbers commonly repeated by the politicians. First of all, given the fact that only 23% of the income can be deducted with a maximum value of PLN 53,000, the actual deduction limit will amount only to PLN 12,190 (23% x PLN 53,000). Another limitation is that the thermal modernisation tax deduction will not apply to expenses covered by other tax concessions or support from NFOŚiGW and its voivodship branches.
5.3.4. Thermal Modernisation and Refurbishment Fund
This already mentioned national instrument (Fundusz Termomodernizacji i Remontów) has been operating since January 1999 and has been managed by the BGK. Thus far, approximately EUR 500 million have been spent on modernisation-related initiatives “targeting housing coopera-tives, housing communities, private individuals and local governments” in order to decrease energy consumption and the costs of heating of households.62 While the funding is popular in some voivodships (particularly in śląskie with 7,549 applications), there are voivodships, i.e. świętokrzyskie, where only 722 applications for assistance have been submitted between 1999 and 2018.63 This confirms that the Fund is not promoted equally across the country. Moreover, even in those regions where the programme is working well, the funds available are not suffi-
59 For more information see: https://www.gov.pl/web/energia/jak-uzyskac-dodatek-energetyczny- 60 For more information see: https://www.mf.gov.pl/ministerstwo-finansow/wiadomosci/aktualnosci/ministerstwo-
finansow2/-/asset_publisher/M1vU/content/id/6516934# 61 For more information see: http://www.rynekinstalacyjny.pl/aktualnosc/id9881,czy-ulga-termomodernizacyjna-
naprawde-jest-korzystna 62 For more information see: https://www.publenef-toolbox.eu/sites/default/files/2018-06/GP37_PUBLENEF_Po-
land_factsheet.pdf 63 For more information see: https://www.bgk.pl/files/public/Pliki/Fundusze_i_programy/FTiR/Dane_liczbowe_
FTiR_02_2019.pdf p. 6.
219
CASE Reports | No. 499 (2019)
cient to boost EE retrofits. This can be confirmed by the fact that by 2015, only 0.01% of single-family houses have been modernised. Other lessons learned collected after nearly 20 years of the fund’s operation for the H2020 PUBLEnEf project purposes are: “no comprehensive assess-ment of the potential for the application of high-efficiency cogeneration and efficient district heating and cooling has been completed at national level; innovative financing mechanisms are not used; insufficient in-house expertise about financial tools; insufficient own funds require-ments; lack of knowledge regarding existing financial tools”.64
5.3.5. Bank Ochrony Środowiska (BOŚ S.A.) schemes
Bank Ochrony Środowiska S.A. (BOŚ S.A.) is a commercial Polish bank created in 1991 and NFOŚiGW is its major shareholder. The bank itself also won various eco-oriented awards in-cluding “Leader of Polish Ecology” or “Polish Ecology Hall of Fame”. As a result, bank activities predominantly target environment protection and various eco-schemes for both individual and commercial clients are offered. The most important ones include:
Eco-loans with additional subsidies to reduce cost of home maintenance
Eco-loans are available for those planning home insulation, the replacement of an old coal boiler with a gas one, as well as installation of solar collectors, heat pumps, or household sewage treat-ment plants. Thanks to subsidies from the WFOŚiGWs, financing is provided for up to 90% of the investment costs with additional capital amounting to 40% of the investment costs. What is important to note is that BOŚ allows for a wide range of products and services to be covered by subsidies and offers advisory assistance in completing the formalities related to obtaining subsidies as well as a flexible loan period of up to 20 years.65 Given the last three features, this programme might be considered a direct competitor of EuroPACE. Currently eco-loans are avail-able in 10 out of 16 Polish voivodships.66
Mortgage for eco-wooden houses
Funding is also available for those planning to buy a wooden eco-house built using prefabricated frame technology. A long pay-back period – up to 35 years – and lending itself available for up to 80% of the property value are currently offered by BOŚ, making it an attractive scheme.67 Al-though the share of eco-wooden houses in total building stock is marginal, at the end of 2018, the government began to heavily promote this technology. As a start, the Polish Wooden Houses
64 For more information see: https://www.publenef-toolbox.eu/cases/thermal-modernisation-and-refurbishment-fund-poland
65 For more information see: https://www.bosbank.pl/klienci-indywidualni/finansowanie-twoich-marzen/kredyty-dla-domu/kredyty/ekokredyty-z-doplatami
66 The full list is available here: https://www.bosbank.pl/klienci-indywidualni/finansowanie-twoich-marzen/kredyty-dla-domu/kredyty/ekokredyty-z-doplatami/oferta-w-wojewodztwach
67 For more information see: https://www.bosbank.pl/klienci-indywidualni/finansowanie-twoich-marzen/kredyty-dla-domu/kredyty/hipoteka-na-domy-drewniane
220
CASE Reports | No. 499 (2019)
company was established. Its main goal is to support the construction of buildings with the use of energy-saving wood technologies at all stages. In the pilot phase between 2018 and 2022, 11,000 dwellings are expected to be built in multi-family buildings, with 950 single-family houses.68
Prosument II
This loan scheme is addressed both to individual property owners and cooperatives as well as housing communities and municipalities interested in owning a small power plant using RES – these owners are called “Prosumers”. Between 2014 and 2022, the budget of the programme will amount to PLN 800 million.69 At the same time, the call for proposals was recently closed given high interest in the programme. The purchase and installation of RES for the production of electricity or heat for the needs of single-family or multi-family residential buildings are eligible costs, as is the replacement of existing installations with more efficient and environmentally friendly ones. According to the programme’s rules, a preferential loan together with the subsidy may constitute up to 100% of eligible costs of the installation, and the subsidy itself may amount to 15% or 30%.
5.3.6. Polish Residential Energy Efficiency Financing Facility (PolREFF)
The Facility was launched on 25 October 2016 by the European Bank for Reconstruction and Development (EBRD) with support of the TaiwanBusiness EBRD Technical Cooperation Fund and the EBRD Shareholders Special Fund responsible for the Technical Support element of the programme.70 The programme provides both individuals as well as cooperatives and adminis-trators of residential buildings with loans for thermal modernisation, RES installation, and EE investments, ultimately improving their living conditions. With a total budget of approximately PLN 860 million (EUR 200 million), projects within PolREFF are carried out through the Euro Bank SA, and through 31 December 2017, PolREFF loans were also available through Bank Zachodni WBK (Santander Group). In addition, “for completing the Declaration of Assignment of funds from a loan for energy-saving solutions, the applicant receives PLN 100. One can also receive up to 5% of the loan amount or 5% of the top-up value (that is, up to PLN 500) for documenting that min. 50% of funds obtained from the bank have been allocated for solutions increasing EE indicated in the Declaration”.71
Apart from a detailed tab on the Euro Bank website, PolREFF has its own web-portal, where several additional functionalities are offered. One can, among other things, estimate potential savings after replacing windows or building insulation with the online Energy Saving Calculator,
68 For more information see: http://projekty-rozwojowe.lasy.gov.pl/projekty-rozwojowe/-/asset_publisher/ 7PcENrBXlBZJ/content/polskie-domy-drewniane
69 For more information see: http://www.nfosigw.gov.pl/oferta-finansowania/srodki-krajowe/programy-prioryte-towe/prosument-dofinansowanie-mikroinstalacji-oze/informacje-o-programie/ and https://www.bosbank.pl/klienci-indywidualni/finansowanie-twoich-marzen/kredyty-dla-domu/kredyty/ekokredyt-prosument
70 For more information see: http://polreff.org 71 For more information see: https://eurobank.pl/kredyty/kredyty-gotowkowe/pozyczka-energooszczedna/

221
CASE Reports | No. 499 (2019)
or use the advice from Technology Selector – a database of items meeting the programme’s excessive criteria. The database includes devices and materials verified in terms of their energy-saving potential parameters by independent experts of the PolREFF programme. The loans are available only for the products included in the database, proving that only solutions considered the most EE will be financed.
5.3.7. The European Investment Bank (EIB) schemes
Operational agreements with BGK
In April 2018, in its capacity of Fund of Funds Manager, the EIB announced that it had signed three operational agreements with BGK to support urban regeneration projects in respective voivodships: śląskie, pomorskie, and mazowieckie. The budget of PLN 378 million (approximately EUR 85 million) is to be “disbursed for long term, preferential loans for financing projects in de-prived city areas, which aim to revive them socially, economically and environmentally by restor-ing their historical functions or assigning new ones”.72 This scheme is relevant because housing cooperatives and associations are also eligible to apply for preferential loans to finance thermal modernisation and the application of EE solutions.
Getin Noble Bank
In the summer of 2018, also in its capacity of the Fund of Funds Manager under Regional Op-erational Programmes, another three operational contracts were signed by the EIB for a total amount of PLN 273 million (EUR 64 million) with the Getin Noble Bank. In these schemes, apart from those from pomorskie and mazowieckie, “housing cooperatives and associations, so-cial housing associations, local government entities and entities that they control, and other institutions or bodies” from kujawsko-pomorskie are also targeted.73 Loans for improving EE of multi-family residential buildings that “reduce heat losses, eliminate individual sources of heat in conjunction with connecting to district heating networks, modernise local heat sources, energy upgrades in heating and ventilation systems, internal installations, installation of energy moni-toring and management systems” are available.74
5.4. A nationwide advisory support system in the field of EE and RES
The “Nationwide advisory support system for the public, housing and enterprises sector in the field of EE and RES” project implemented by the NFOŚiGW and its partners in 16 regions across the country, is financed from the Operational Program Infrastructure and Environment for the
72 For more information see: https://www.eib.org/en/infocentre/press/news/all/eib-to-support-urban-regeneration-projects-in-polish-regions.htm
73 For more information see: https://www.eib.org/en/infocentre/press/news/all/eib-support-for-energy-efficiency-projects-in-the-polish-housing-sector.htm
74 Ibidem
222
CASE Reports | No. 499 (2019)
years 2014-2020 within the framework of the 1st Priority Axis “Reduction of the emission of the economy”.75 The project overall objective is to enable access to professional energy advisors familiar with advising on environmentally friendly investments and other issues related to com-munication activities.
5.5. Local initiatives
Depending on the exact location, there are multiple financing schemes in Poland related to the renovation of the buildings, with different target groups and financing terms.
5.5.1. LIFE projects
The Małopolska region has its LIFE Integrated Project “Implementation of Air Quality Plan for Małopolska Region – Małopolska in a healthy atmosphere”.76 This is a good example of col-laboration between municipalities in one voivodship which is severely affected by the problem of smog. As the projects aims to establish, among others, a network of knowledgeable 60 eco-managers and “strengthen advisory and administrative services for Krakow residents with re-spect to elimination of stoves and solid fuel boilers”, it substantially prepares the municipalities of Małopolska to pursue other EE and RES-oriented initiatives.
5.5.2. Local tax reductions
In 2016, Szczecin became the first city to introduce property tax reductions for the design of green buildings, which must achieve a minimum level of the Leadership in Energy and Environ-mental Design (LEED) Gold or Very Good for the Building Research Establishment Environmen-tal Assessment Method (BREEAM). The city council passed a resolution that offers businesses investing in new office or conference facilities a three-year property tax exemption for (1) newly constructed buildings or their parts; (2) high-standard office and conference facilities in newly constructed facilities; (3) land purchased after the effective date of the resolution, where invest-ments have been commenced.77 Other municipalities are slowly starting to follow, proving that local tax exemptions on green certificates can play an even more important role in the planning of investments in the coming years, also in the residential sector. The linkage between such ex-emptions and EuroPACE which aims to be linked to property tax as well, is obvious.
5.5.3. Covenant of Mayors initiatives
With 39 current commitments,78 40 Polish municipalities are signatories of the Covenant of Mayors (CoM). The initiative is managed by the NFOŚiGW (CoM’s coordinator for Poland). Out
75 The project’s website: https://www.doradztwo-energetyczne.gov.pl 76 The project’s website: https://powietrze.malopolska.pl/en/life-project/ 77 For more information see: https://www.przestrzen-miejska.pl/artykul/zielone-budownictwo-a-rola-samorzadu 78 The most up-to-date data can be found on the CoM subpage: https://www.eumayors.eu/plans-and-actions/action-
plans.html
223
CASE Reports | No. 499 (2019)
of 24 good practices, 9 concern building stock overall, out of which 5 focus on residential build-ings.
The Polish branch of Energie Cités (Stowarzyszenie Gmin Polska Sieć “Energie Cités” – PNEC), is the first Polish organisation supporting CoM activities. Energie Cités has already trained more than 4,000 local stakeholders on topics related to sustainable development and residential EE; participated in more than 60 international projects; and organized over 150 thematic seminars for relevant representatives of local and regional authorities (LRAs).79 Other CoM supporting organisations in Poland are: the Union of Baltic Cities, the Association of Polish Cities, the As-sociation Beskidy Region (Stowarzyszenie Region Beskidy), and the Baltic Energy Conservation Agency Ltd. (Bałtycka Agencja Poszanowania Energii Sp. z o.o).
5.6. Bottom-up initiatives
Many bottom-up initiatives focused on EE and sustainable development are being launched by urban activists and local leaders. Given their local knowledge and experience in programme and project management, they could be involved in the EuroPACE application, at least at the initial phase for advocacy purposes. The Progressive Cities Network (Sieć Miast Progresywnych) cre-ated in 2015, aims to, among others, build the momentum for quality discussions on ensuring “more secure, affordable and sustainable” energy for citizens. In their “Declaration of Polish Pro-gressive Cities”, they mentioned following measures to achieve this target: eliminating energy poverty by pursuing EE-friendly retrofits; ensuring that 100% of lighting sources in the cities are based on energy-efficient LED technology; ensuring that at least 50% of energy in build-ings comes from RES by 2030, and by 2050 – 100%; eliminating smog via the comprehensive thermal modernisation of buildings, and replacing coal with RES; as well as supporting residents in the development of their own energy.80 Most of the members are small towns and medium-sized cities.
The Alliance of Associations Polish Green Network/Polish Green Network – PGN (Związek Stowarzyszeń Polska Zielona Sieć/Polska Zielona Sieć – PZS) is an alliance consisting of “10 envi-ronmental and sustainable development associations and foundations based in the largest cities of Poland: Warszawa, Krakow, Lodz, Wroclaw, Lublin, Bialystok, Bielsko-Biala, Torun, Szczecin, Poznan”.81 Networks are managed by regional organisations that provide information on the state of the environment, support civic initiatives for its protection, run campaigns, libraries, websites, undertake interventions, issue environmental letters, and provide legal advice. The al-liance could be a top advisor in potential EuroPACE application in the biggest urban areas then.
79 For more information see: http://www.pnec.org.pl/ 80 Loose translation in accordance with the “Solidarity for Climate” Declaration of Polish Progressive Cities: https://
www.solidarnoscdlaklimatu.pl 81 The Alliance of Associations Polish Green Network website: http://zielonasiec.pl/en/
224
CASE Reports | No. 499 (2019)
Conclusions
The aim of this report was to assess the market potential for the development of a EuroPACE programme for private home retrofits in Poland. The literature review on the topic, the analysis of relevant statistics, as well as policies and frameworks supporting EE and RES in Poland, lead us to eight main conclusions:
1. One of the highest home ownership rates across the EU (84.2% of dwellings in Poland were privately owned in 2017) is a positive factor which needs to be considered when assessing the market demand for such a type of financial mechanism. This high rate is additionally enhanced by the fact that 68% of Poles consider environmental mitigation important and renovation costs are some of the lowest across the continent.
2. Although salaries and wages are still among the lowest across the EU, the median disposal income has significantly increased in recent years, which may make people more willing to invest in home retrofits (at least those who will not be eligible for the highest grants under the “Clean Air” programme) and to seek for new financing schemes. The already mentio-ned high rates of home ownership positively impact the possible uptake of innovative instruments such as EuroPACE, also given uncertainties related to the new MFF (namely, less EU Cohesion Funds available for Poland).
3. Together with the ageing of the housing building stock (60% is older than 40 years), the overall energy consumption of the residential sector is projected to grow and so will hou-seholds’ energy prices (politicians have been warning of this). We can therefore estimate that people will be willing to keep their bills low by investing in improving EE if the right incentives are in place.
4. The administrative obstacles to gain access to incentives and other benefits related to EE should be at the same time reduced. A one-stop-shop solving the most burdensome barriers and boosting the uptake of private financing is needed.
5. The biggest barriers are not only related to insufficient financing, but also to the limited capacity of contractors. Contractor selection and training, which come together with Eu-roPACE, should increase EE uptake.
6. The biggest question mark concerns policy measures. On one hand, Poland has commit-ted to meeting ambitious targets related to decarbonisation; however, on the other, coal is still a favoured energy carrier according to numerous politicians. Although this does not pose a direct threat to EuroPACE, it might make negotiations on EuroPACE development on a country-level more demanding and time-consuming.
7. Shortages of construction workers are equally burdensome and might significantly impe-de current upward trends in residential building construction and renovation.
8. Overall, the potential synergies of coupling the currently available but insufficient initiati-ves (particularly those under the “Clean Air” programme) with EuroPACE compensate the above-mentioned potential threats.
The following SWOT table condenses the main conclusions of the analysis for Poland related to potential EuroPACE development.
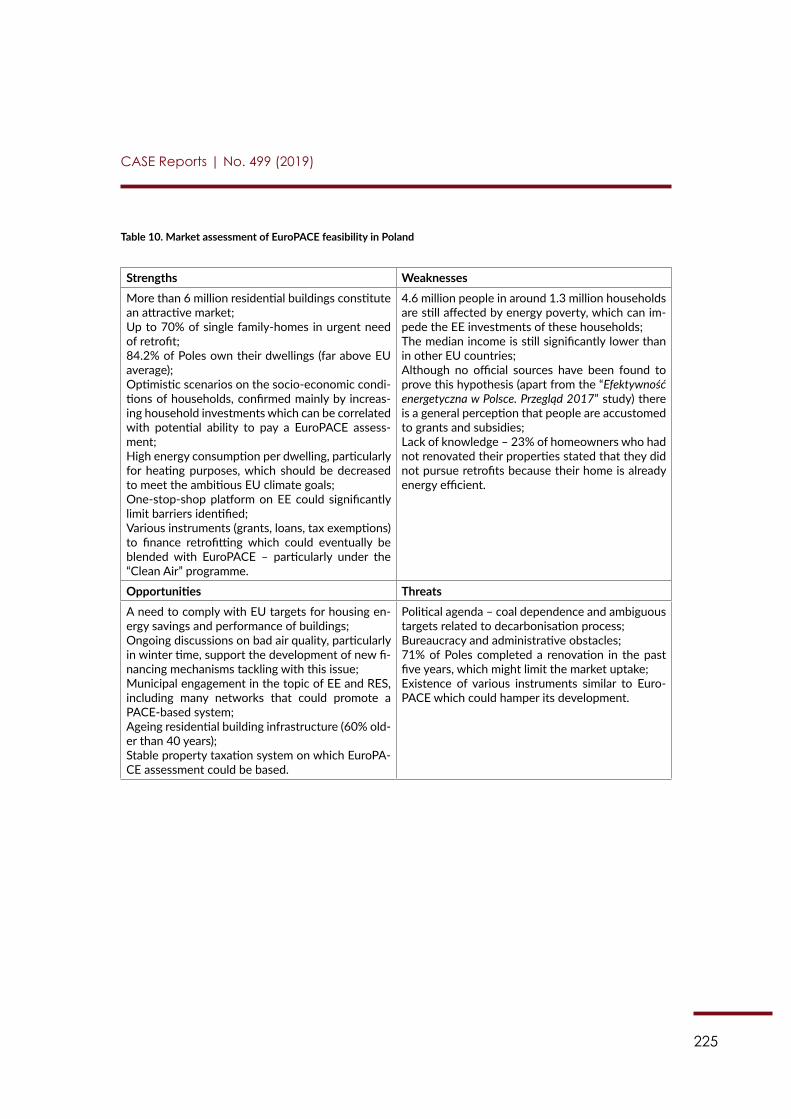
225
CASE Reports | No. 499 (2019)
Table 10. Market assessment of EuroPACE feasibility in Poland
Strengths WeaknessesMore than 6 million residential buildings constitute an attractive market;Up to 70% of single family-homes in urgent need of retrofit;84.2% of Poles own their dwellings (far above EU average);Optimistic scenarios on the socio-economic condi-tions of households, confirmed mainly by increas-ing household investments which can be correlated with potential ability to pay a EuroPACE assess-ment;High energy consumption per dwelling, particularly for heating purposes, which should be decreased to meet the ambitious EU climate goals;One-stop-shop platform on EE could significantly limit barriers identified;Various instruments (grants, loans, tax exemptions) to finance retrofitting which could eventually be blended with EuroPACE – particularly under the “Clean Air” programme.
4.6 million people in around 1.3 million households are still affected by energy poverty, which can im-pede the EE investments of these households;The median income is still significantly lower than in other EU countries;Although no official sources have been found to prove this hypothesis (apart from the “Efektywność energetyczna w Polsce. Przegląd 2017” study) there is a general perception that people are accustomed to grants and subsidies; Lack of knowledge – 23% of homeowners who had not renovated their properties stated that they did not pursue retrofits because their home is already energy efficient.
Opportunities ThreatsA need to comply with EU targets for housing en-ergy savings and performance of buildings;Ongoing discussions on bad air quality, particularly in winter time, support the development of new fi-nancing mechanisms tackling with this issue;Municipal engagement in the topic of EE and RES, including many networks that could promote a PACE-based system;Ageing residential building infrastructure (60% old-er than 40 years); Stable property taxation system on which EuroPA-CE assessment could be based.
Political agenda – coal dependence and ambiguous targets related to decarbonisation process;Bureaucracy and administrative obstacles; 71% of Poles completed a renovation in the past five years, which might limit the market uptake;Existence of various instruments similar to Euro-PACE which could hamper its development.
226
CASE Reports | No. 499 (2019)
References
BPIE (2014), “Energy performance certificates across the EU. Mapping of national approaches”.
BPIE (2018a), “Understanding potential user needs. A survey analysis of the markets for Indi-vidual Building Renovation Roadmaps in Bulgaria, Poland and Portugal”.
BPIE (2018b), “Financing renovation of buildings in Poland. An overview of public funding al-location for the renovation of buildings in Poland”.
CA EPBD (2018), “EPBD implementation in Poland”, available at: https://www.epbd-ca.eu/wp-content/uploads/2018/08/CA-EPBD-IV-Poland-2018.pdf.
European Air Quality Index – the interactive map, available at: www.eea.europa.eu.
EU JRC (2018), “Global Human Settlement Layer”.
European Commission (2018), “Energy prices and costs in Europe”, Report from the Commission to the European Parliament, the Council, the European Economic and Social Committee and the Committee of the Regions, available at: https://ec.europa.eu/energy/sites/ener/files/docu-ments/swd_-_v5_text_6_-_part_1_of_4.pdf.
European Commission (2019), “Arrears on Utility Bills”, Website EU Energy Poverty Observation, accessed 4 March 2019, available at: https://www.energypoverty.eu/indicator?primaryId=1462.
European Construction Sector Observatory (2019), “Country factsheet Poland”, available at: https://ec.europa.eu/docsroom/documents/33806.
European Parliament (2016), “Energy Efficiency for Low-Income Households”, accessed 4 March 2019, available at: http://www.europarl.europa.eu/RegData/etudes/STUD/2016/595339/IPOL_STU(2016)595339_EN.pdf.
Eurostat (2018), “Energy prices in the EU statistics”, available at: https://ec.europa.eu/eurostat/news/themes-in-the-spotlight/energy-prices-2018.
Eurostat (2019a), “People at risk of poverty or social exclusion by age and sex”. Database,[ilc_peps01], last modified 15 February 2019, accessed 5 March 2019.
Eurostat (2019b), “Housing Cost Overburden Rate by Age, Sex and Poverty Status”. Database, [ilc_lvho07a]. Last modified 15 March 2019. Accessed 18 March 2019.
227
CASE Reports | No. 499 (2019)
Eurostat (2019c), “Distribution of population by tenure status, type of household and income group”, EU-SILC survey [ilc_lvho02], last modified 28 February 2019, accessed 4 March 2019.
Eurostat (2019d), “Total population living in a dwelling with a leaking roof, damp walls, floors or foundation, or rot in window frames of floor”. EU-SILC survey [ilc_mdho01], last modified 28 February 2019, accessed 4 March 2019.
Eurostat (2019e), “Distribution of Population by Degree of Urbanisation, Dwelling Type and In-come Group”, Eurostat Database, EU-SILC Survey [ilc_lvho01], last modified 28 February 2019, accessed 5 March 2019.
GUS, (2013), “Statistical yearbook of the Republic of Poland. Zamieszkane Budynki, Narodowy Spis Powszechny Ludności i Mieszkań 2011”.
GUS (2016a), “Household projection for the years 2016-2050”.
GUS (2018a), “Poland in figures 2018”.
GUS (2018b), “Housing economy in Poland in 2017”.
GUS (2018c), “Housing Construction I-III quarter 2018”.
GUS (2018d), “Energy 2018”.
GUS and the Polish National Energy Conservation Agency – KAPE (2018), “National Report. Energy Efficiency trends and policies in Poland in years 2006-2016 prepared in framework of ODYSSEE- MURE project. Monitoring EU and national energy efficiency targets”.
IEE (2017), “Technical condition of single-family houses in Poland. Renovation needs”.
IEE (2018), “Efektywność energetyczna w Polsce. Przegląd 2017”.
Mankowski S., Szczechowiak E. (2012), Strategic research project entitled “Integrated system for reducing operating energy consumption in buildings” Research Task No. 2 Volume I, Part A: Conditions of transformations in construction.
Mieszkanie Plus programme website, available at: https://mieszkanieplus.org.pl/.
NIK (2014), “Ochrona powietrza przed zanieczyszczeniami”.
Odyssee-Mure database, available at: http://www.odyssee-mure.eu/.
228
CASE Reports | No. 499 (2019)
Sałach, K., Lewandowski, P. (2018), “Energy poverty in Poland, 2012-2016. Description and changes over time, IBS Brief Report”, 01/2018, available online at: http://ibs.org.pl/en/publica-tions/energy-poverty-in-poland-2012-2016-description-and-changes-over-time/.
“Solidarity for Climate” Declaration of Polish Progressive Cities, available at: https://www.soli-darnoscdlaklimatu.pl.
“Strategy for the modernization of buildings: 2050 road map”, 2014, available at: http://renowac-ja2050.pl/files/raport.pdf.
The Alliance of Associations Polish Green Network website: http://zielonasiec.pl/en/.
Velux, Ecofys, Fraunhofer (2019), “Barometr zdrowych domów 2018”, accessed 13 February 2019, available at: https://velcdn.azureedge.net/~/media/marketing/pl/barometrzdrowychdo-mow18/barometr%20zdrowych%20domw%202018_pl_light_2pages.pdf?la=pl-pl.
Zebra2020, interactive tool, available at: https://zebra2020.eu/.
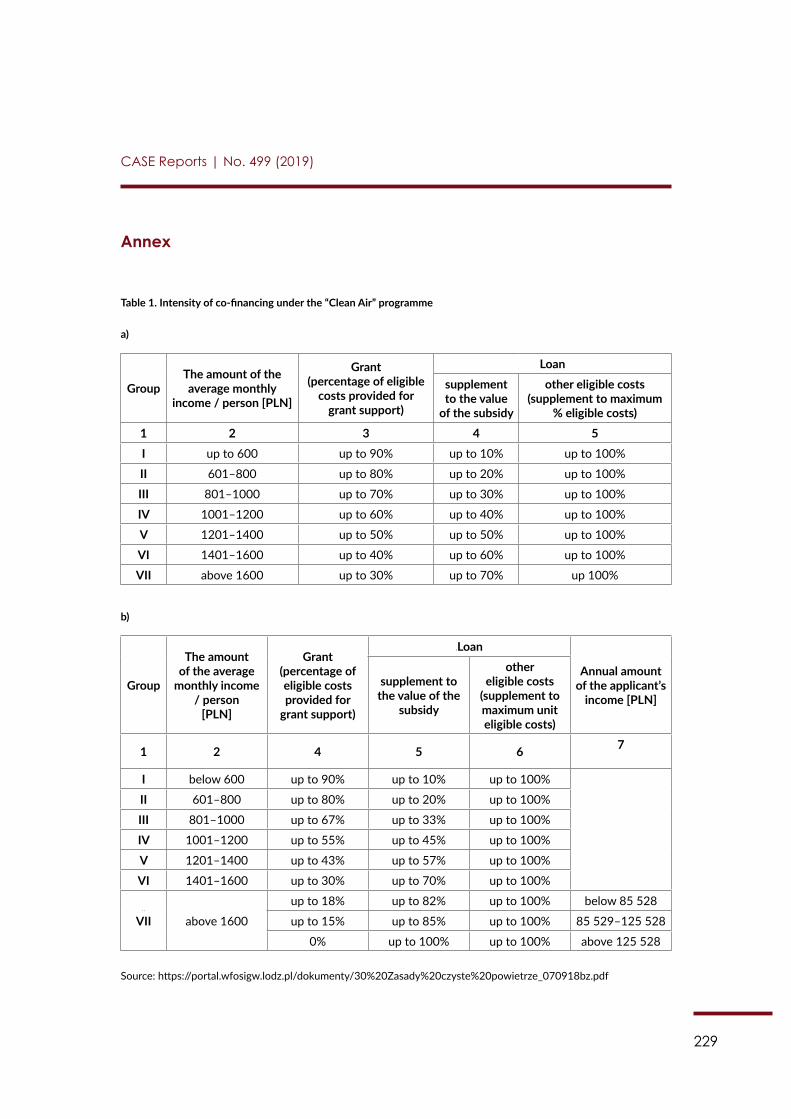
229
CASE Reports | No. 499 (2019)
Annex
Table 1. Intensity of co-financing under the “Clean Air” programme
a)
Group The amount of the average monthly
income / person [PLN]
Grant(percentage of eligible
costs provided for grant support)
Loansupplement to the value
of the subsidy
other eligible costs (supplement to maximum
% eligible costs)1 2 3 4 5 I up to 600 up to 90% up to 10% up to 100%
II 601–800 up to 80% up to 20% up to 100%
III 801–1000 up to 70% up to 30% up to 100%
IV 1001–1200 up to 60% up to 40% up to 100%
V 1201–1400 up to 50% up to 50% up to 100%
VI 1401–1600 up to 40% up to 60% up to 100%
VII above 1600 up to 30% up to 70% up 100%
b)
Group
The amount of the average
monthly income / person
[PLN]
Grant(percentage of eligible costs provided for
grant support)
Loan
Annual amount of the applicant’s
income [PLN]supplement to
the value of the subsidy
other eligible costs
(supplement to maximum unit eligible costs)
1 2 4 5 6 7
I below 600 up to 90% up to 10% up to 100%
II 601–800 up to 80% up to 20% up to 100%
III 801–1000 up to 67% up to 33% up to 100%
IV 1001–1200 up to 55% up to 45% up to 100%
V 1201–1400 up to 43% up to 57% up to 100%
VI 1401–1600 up to 30% up to 70% up to 100%
VII above 1600
up to 18% up to 82% up to 100% below 85 528
up to 15% up to 85% up to 100% 85 529–125 528
0% up to 100% up to 100% above 125 528
Source: https://portal.wfosigw.lodz.pl/dokumenty/30%20Zasady%20czyste%20powietrze_070918bz.pdf
230
Author: Dr. Pedro Afonso Fernandes
Contents
Acronyms ....................................................................................................................................232
Introduction ...............................................................................................................................233
Chapter 1: Social and economic conditions of the households .....................................2341.1. Household composition and labour force ...............................................................234
1.2. Degree of urbanisation................................................................................................236
1.3. Income level and distribution ....................................................................................238
Chapter 2: Building characteristics and ownership ..........................................................2412.1. Total number of buildings and type of housing ......................................................241
2.2. Distribution of the building stock by age ................................................................243
2.3. Ownership of the dwellings .......................................................................................244
2.4. Secondary and unoccupied dwellings ......................................................................245
2.5. The building stock by size ...........................................................................................246
2.6. Need of renovation ......................................................................................................246
2.7. Housing costs ................................................................................................................247
Chapter 3: Energy consumption in private residential buildings and type of EE/RES investments ..........................................................................................250
3.1. Energy prices .................................................................................................................250
3.2. Energy costs ...................................................................................................................250
3.3. Energy poverty .............................................................................................................251
3.4. Energy Performance Certificates ..............................................................................252
3.5. Energy consumption by source .................................................................................253
3.6. Energy consumption by end-use...............................................................................255
3.7. Energy efficiency and savings ....................................................................................256
3.8. Investments and measures related to EE/RES in residential buildings ............257
EuroPACE Market Analysis: Portugal
231
CASE Reports | No. 499 (2019)
Chapter 4: Barriers to develop EE/RES potential in private buildings .........................259
Chapter 5: Policies related to EE/RES in buildings ...........................................................2625.1. National targets and goals ..........................................................................................262
5.2. Energy performance requirements ...........................................................................264
5.3. Financial schemes to promote EE ............................................................................265
Conclusion ..................................................................................................................................269
References ..................................................................................................................................271
232
CASE Reports | No. 499 (2019)
Acronyms
ADENE Agência para a Energia (Portuguese Energy Agency)ARU Área de Reabilitação Urbana (Urban Rehabilitation Area)BCP Banco Comercial Português (Millennium BCP)BPI Banco Português de InvestimentoCEDB Council of Europe Development BankCGD Caixa Geral de DepósitosCPCI Confederação Portuguesa da Construção e do Imobiliário (Portuguese Association of
Construction and Real State)DHW Domestic Hot Waterdw Dwelling, perEDP Energias de Portugal (Energy Portugal)EE Energy EfficiencyEED European Directive on Energy EfficiencyEIB European Investment BankERDF European Regional Development FundEU European UnionEUR Euro FEE Fundo de Eficiência Energética (Energy Efficiency Fund)FNRE Fundo Nacional de Reabilitação do Edificado (National Fund for Building Rehabilitation)FUNDIESTAMO Sociedade Gestora de Fundos de Investimento Imobiliário, SA (Public Real Estate In-
vestment Agency)GDP Gross Domestic ProductIFRRU Instrumento Financeiro para a Reabilitação e Revitalização Urbanas (Financial Instru-
ment for Urban Rehabilitation)IHRU Instituto da Habitação e da Reabilitação Urbana (Housing and Urban Rehabilitation In-
stitute)IMI Imposto Municipal sobre Imóveis (Municipal Property Tax)INE Instituto Nacional de Estatística (Statistics Portugal)kWh kiloWatt-hourMS Member StateNGO Non-Governmental OrganisationPARU Plano de Ação de Reabilitação Urbana (Action Plan for Urban Rehabilitation)PNAEE Plano Nacional de Acção para a Eficiência Energética (Portuguese National Action Plan
for Energy Efficiency)PPS Purchasing Power StandardRES Renewable Energy SourcesREH Regulamento de Desempenho Energético dos Edifícios de Habitação (code on Energy
Performance of Residential Buildings)SILC Survey on Income and Living ConditionsSWOT Strengths, Weaknesses, Opportunities, and Threats (table)toe Tonnes of Oil EquivalentUCP Universidade Católica PortuguesaU-values Heat transfer coefficientsVAT Value Added TaxW Watt
233
CASE Reports | No. 499 (2019)
Introduction
The Portuguese residential sector is an interesting one on many angles, particularly given its substantial potential for renewable energy sources (RES) and energy efficiency (EE) savings. However, its tremendous needs cannot be financed only with public sources and the need to en-gage private capital is becoming more and more evident. The objective of this report is therefore to assess the market potential for the development of an innovative on-tax financing mecha-nism linked to the asset (building), called EuroPACE – an instrument focusing on improving EE and increasing the use of RES in private residential buildings in Portugal. In order to achieve the report’s main objective, the following structure has been implemented.
In Chapter 1, we start by describing the social and economic conditions of the four million Portuguese households, namely, their dimension, composition, and income level. We also cover briefly the trends of the labour market in order to find out whether Portuguese residents could afford to invest significant funds in EE measures in their respective households.
Chapter 2 focuses on the characteristics of the building stock, which consists of approxi-mately 3.5 million buildings and 5.9 million dwellings. As single-family houses are very common (87% of the total building stock) and 75% of the permanently occupied dwellings are inhabited by their owners, this chapter underlines the importance of these characteristics as they could significantly ease the implementation of the EuroPACE scheme. In addition, buildings are poorly insulated in Portugal, meaning that the housing sector is quite energy inefficient when com-pared to other European Union (EU) Member States (MS). Therefore, retrofitting is needed on a large scale. In fact, it is estimated that about one million buildings are in need of repair.
Chapter 3 focuses on these energy needs in more detail. It analyses energy consumption in private residential buildings, namely: energy prices and costs, energy poverty indicators, energy certificates (labels), and energy consumption by source and end-use. General trends in EE and RES investments are also covered.
The positive trends identified in the last section of Chapter 3 are unfortunately regularly hampered by several significant barriers. Apart from those typical for all EU MS – like financing – disinterest, limited information, short-term perspective, dependence on third party decision-making, and bureaucracy are the specific barriers for EE and RES development identified in Portugal, as presented in Chapter 4.
Chapter 5 provides an overview of the current policies related to increasing EE in residential buildings. These can be divided into (1) national level goals in terms of energy savings, (2) tech-nical requirements concerning the energy performance of residential buildings, and (3) grants, loans, tax exemptions, and other financial support available in Portugal to promote EE and hous-ing rehabilitation in general. The author attempts to assess whether these incentives could im-pact EuroPACE if developed, and if so, how exactly.
Finally, based on the findings of the report, key conclusions related to EuroPACE market potential in Portugal are pointed out. They are additionally condensed into a concise Strengths Weaknesses Opportunities, and Threats (SWOT) table which serves as a handy summary.
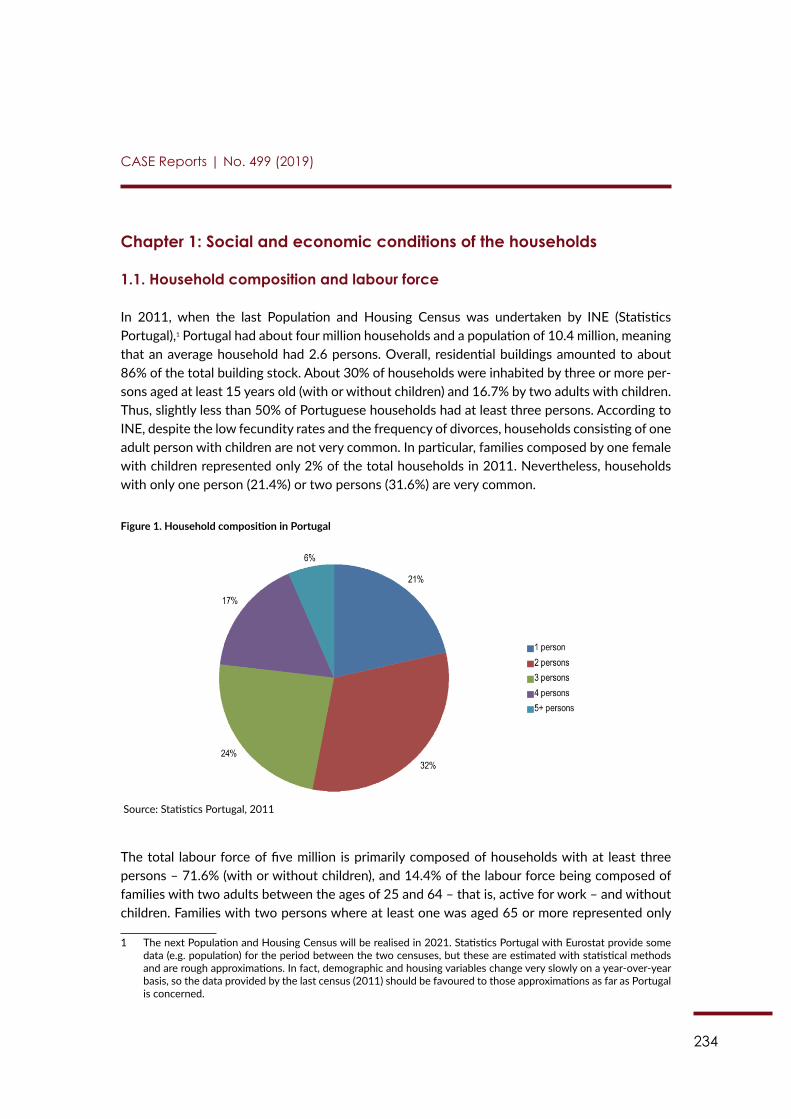
234
CASE Reports | No. 499 (2019)
Chapter 1: Social and economic conditions of the households
1.1. Household composition and labour force
In 2011, when the last Population and Housing Census was undertaken by INE (Statistics Portugal),1 Portugal had about four million households and a population of 10.4 million, meaning that an average household had 2.6 persons. Overall, residential buildings amounted to about 86% of the total building stock. About 30% of households were inhabited by three or more per-sons aged at least 15 years old (with or without children) and 16.7% by two adults with children. Thus, slightly less than 50% of Portuguese households had at least three persons. According to INE, despite the low fecundity rates and the frequency of divorces, households consisting of one adult person with children are not very common. In particular, families composed by one female with children represented only 2% of the total households in 2011. Nevertheless, households with only one person (21.4%) or two persons (31.6%) are very common.
Figure 1. Household composition in Portugal
Source: Statistics Portugal, 2011
The total labour force of five million is primarily composed of households with at least three persons – 71.6% (with or without children), and 14.4% of the labour force being composed of families with two adults between the ages of 25 and 64 – that is, active for work – and without children. Families with two persons where at least one was aged 65 or more represented only
1 The next Population and Housing Census will be realised in 2021. Statistics Portugal with Eurostat provide some data (e.g. population) for the period between the two censuses, but these are estimated with statistical methods and are rough approximations. In fact, demographic and housing variables change very slowly on a year-over-year basis, so the data provided by the last census (2011) should be favoured to those approximations as far as Portugal is concerned.

235
CASE Reports | No. 499 (2019)
2.7% of the labour force, but 15% of total households in 2011. The trend of an ageing society is typical for Portugal, as it is for most of EU countries – for instance, households with only one woman aged 65 or more represented 7.7% of the total share in 2011 and is currently believed to be even more significant.
Furthermore, according to Eurostat, in Portugal “the share of the population expressing a low or very low level of satisfaction with their dwelling was higher among those living in households without children (than those with children) where 10.9% of the population living in households without dependent children expressed the view that they had a low or very low level of satis-faction, compared with 9.5% of those living in households with dependent children”.2 It is quite peculiar as in general across the EU (with the exception of the Netherlands, Poland, Slovenia, Croatia, and Greece), households with children tend to be less satisfied with their home, while those living as a couple without children tend to be the most happy about their residential situ-ation.3
Table 1 presents the official distribution of dwellings undertaken for the last census in more detail. The major discovery is related to the fact that secondary residences (19.3%) and unoc-cupied dwellings (12.5%) consist of a large share of the total residential building stock, limiting the market for EuroPACE, given that typically people are more interested in improving their liv-ing conditions (in their primary residence) first. It of course does not mean that they definitely will not invest in their secondary residences, but simply that renovations there might not be considered a priority.
Table 1. Distribution of dwellings, households, and population by type of dwelling in 2011
Dwellings Households Population (inhabitants)Type of dwelling: Number Percentage Number Percentage Number Percentage
Permanently occupied residences
3,991,112 67.9 4,033,121 99.6 10,413,100 98.6
Secondary residences 1,133,300 19.3 0 0.0 0 0.0
Unoccupied dwellings 735,128 12.5 0 0.0 0 0.0
Other / informal dwellings
6,612 0.1 6,878 0.2 17,448 0.2
Hotel & other rented dwellings
6,811 0.1 2,266 0.1 8,033 0.1
Social/ health care & other dwellings
5,793 0.1 5,940 0.1 122,179 1.2
Total 5,878,756 100.0 4,048,205 100.0 10,560,760 100.0
Source: Statistics Portugal (INE) – Population and Housing Census, 2011
2 Based on People in the EU – statistics on housing conditions 2017 statistics, available at: https://ec.europa.eu/eurostat/statistics-explained/index.php/People_in_the_EU_-_statistics_on_housing_conditions#Housing_charac-teristics:_unoccupied_dwellings
3 Ibidem
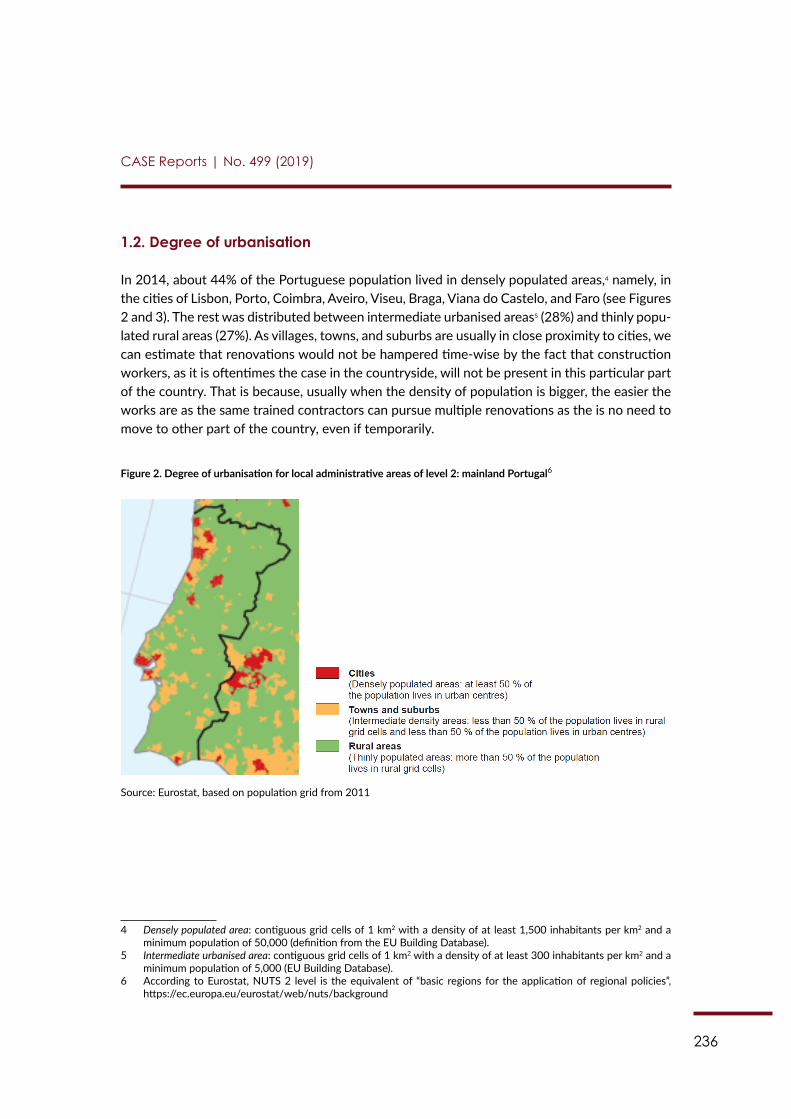
236
CASE Reports | No. 499 (2019)
1.2. Degree of urbanisation
In 2014, about 44% of the Portuguese population lived in densely populated areas,4 namely, in the cities of Lisbon, Porto, Coimbra, Aveiro, Viseu, Braga, Viana do Castelo, and Faro (see Figures 2 and 3). The rest was distributed between intermediate urbanised areas5 (28%) and thinly popu-lated rural areas (27%). As villages, towns, and suburbs are usually in close proximity to cities, we can estimate that renovations would not be hampered time-wise by the fact that construction workers, as it is oftentimes the case in the countryside, will not be present in this particular part of the country. That is because, usually when the density of population is bigger, the easier the works are as the same trained contractors can pursue multiple renovations as the is no need to move to other part of the country, even if temporarily.
Figure 2. Degree of urbanisation for local administrative areas of level 2: mainland Portugal6
199
Figure 2. Degree of urbanisation for local administrative areas of level 2: mainland Portugal332
Source: Eurostat, based on population grid from 2011
Figure 3. Degree of urbanisation (share of dwellings, %)
Source: EU Building Database, 2014
The following table complements the previous data with the distribution of the population, dwellings, and households by degree of urbanisation in 2011 (Census data estimates). It confirms that isolated houses (1.7%) are a rarity.
Table 2. Population, dwellings, and households by degree of urbanisation, 2011 332 According to Eurostat, NUTS 2 level is the equivalent of “basic regions for the application of regional policies”, https://ec.europa.eu/eurostat/web/nuts/background
Source: Eurostat, based on population grid from 2011
4 Densely populated area: contiguous grid cells of 1 km2 with a density of at least 1,500 inhabitants per km2 and a minimum population of 50,000 (definition from the EU Building Database).
5 Intermediate urbanised area: contiguous grid cells of 1 km2 with a density of at least 300 inhabitants per km2 and a minimum population of 5,000 (EU Building Database).
6 According to Eurostat, NUTS 2 level is the equivalent of “basic regions for the application of regional policies”, https://ec.europa.eu/eurostat/web/nuts/background
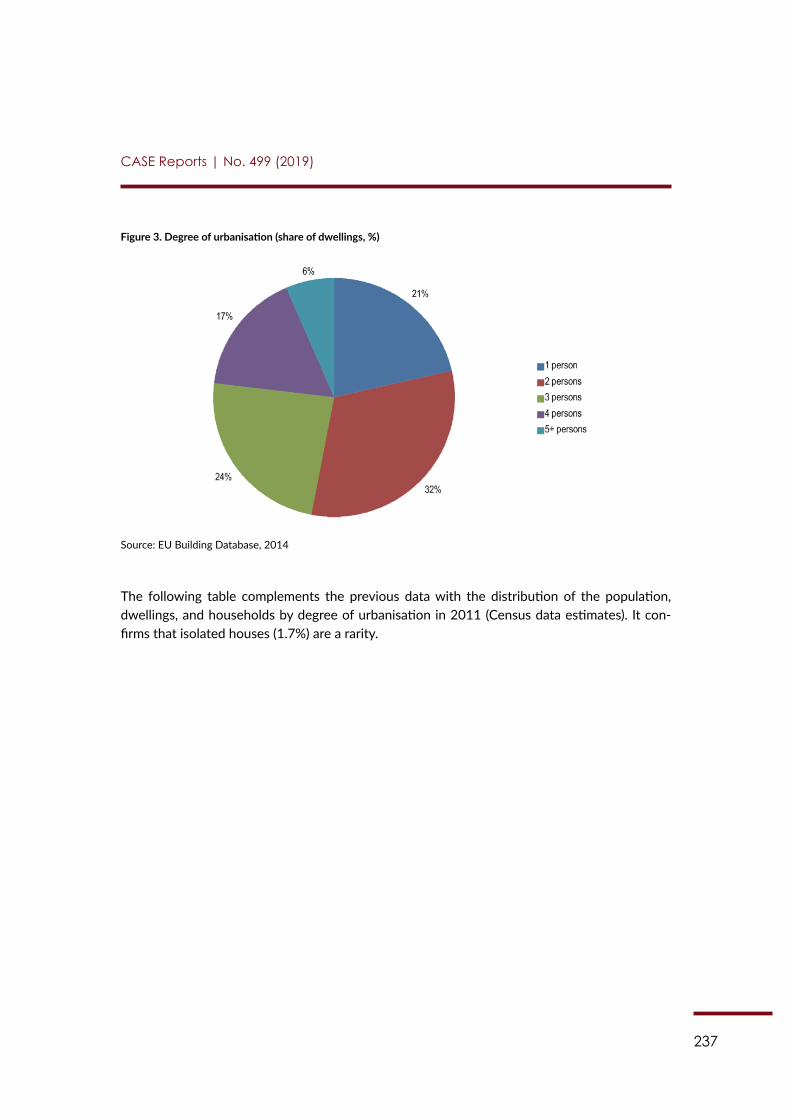
237
CASE Reports | No. 499 (2019)
Figure 3. Degree of urbanisation (share of dwellings, %)
Source: EU Building Database, 2014
The following table complements the previous data with the distribution of the population, dwellings, and households by degree of urbanisation in 2011 (Census data estimates). It con-firms that isolated houses (1.7%) are a rarity.
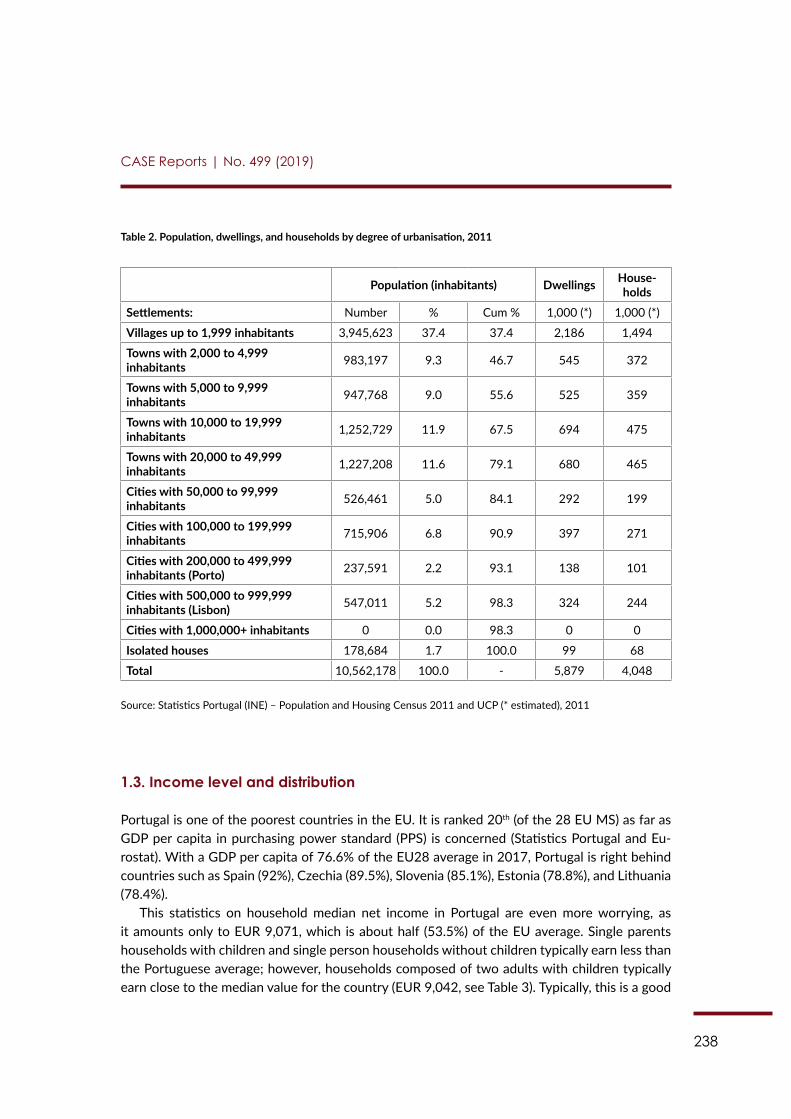
238
CASE Reports | No. 499 (2019)
Table 2. Population, dwellings, and households by degree of urbanisation, 2011
Population (inhabitants) Dwellings House- holds
Settlements: Number % Cum % 1,000 (*) 1,000 (*)
Villages up to 1,999 inhabitants 3,945,623 37.4 37.4 2,186 1,494
Towns with 2,000 to 4,999 inhabitants 983,197 9.3 46.7 545 372
Towns with 5,000 to 9,999 inhabitants 947,768 9.0 55.6 525 359
Towns with 10,000 to 19,999 inhabitants 1,252,729 11.9 67.5 694 475
Towns with 20,000 to 49,999 inhabitants 1,227,208 11.6 79.1 680 465
Cities with 50,000 to 99,999 inhabitants 526,461 5.0 84.1 292 199
Cities with 100,000 to 199,999 inhabitants 715,906 6.8 90.9 397 271
Cities with 200,000 to 499,999 inhabitants (Porto) 237,591 2.2 93.1 138 101
Cities with 500,000 to 999,999 inhabitants (Lisbon) 547,011 5.2 98.3 324 244
Cities with 1,000,000+ inhabitants 0 0.0 98.3 0 0
Isolated houses 178,684 1.7 100.0 99 68
Total 10,562,178 100.0 - 5,879 4,048
Source: Statistics Portugal (INE) – Population and Housing Census 2011 and UCP (* estimated), 2011
1.3. Income level and distribution
Portugal is one of the poorest countries in the EU. It is ranked 20th (of the 28 EU MS) as far as GDP per capita in purchasing power standard (PPS) is concerned (Statistics Portugal and Eu-rostat). With a GDP per capita of 76.6% of the EU28 average in 2017, Portugal is right behind countries such as Spain (92%), Czechia (89.5%), Slovenia (85.1%), Estonia (78.8%), and Lithuania (78.4%).
This statistics on household median net income in Portugal are even more worrying, as it amounts only to EUR 9,071, which is about half (53.5%) of the EU average. Single parents households with children and single person households without children typically earn less than the Portuguese average; however, households composed of two adults with children typically earn close to the median value for the country (EUR 9,042, see Table 3). Typically, this is a good
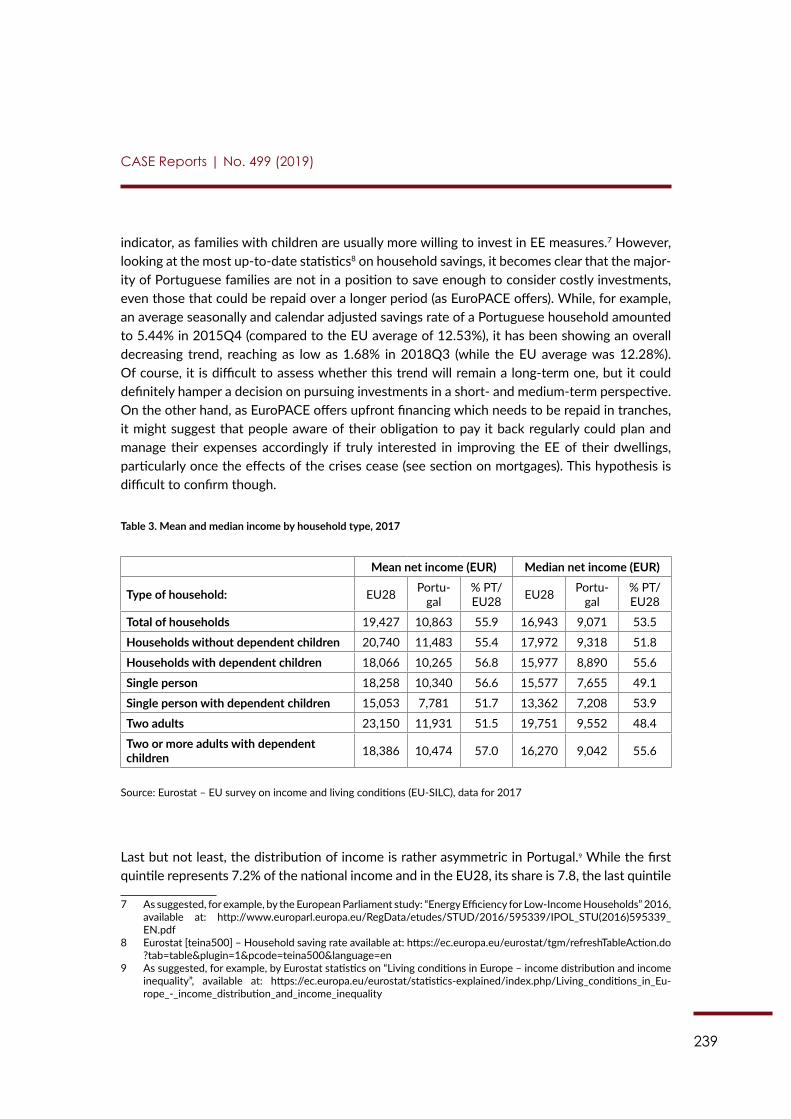
239
CASE Reports | No. 499 (2019)
indicator, as families with children are usually more willing to invest in EE measures.7 However, looking at the most up-to-date statistics8 on household savings, it becomes clear that the major-ity of Portuguese families are not in a position to save enough to consider costly investments, even those that could be repaid over a longer period (as EuroPACE offers). While, for example, an average seasonally and calendar adjusted savings rate of a Portuguese household amounted to 5.44% in 2015Q4 (compared to the EU average of 12.53%), it has been showing an overall decreasing trend, reaching as low as 1.68% in 2018Q3 (while the EU average was 12.28%). Of course, it is difficult to assess whether this trend will remain a long-term one, but it could definitely hamper a decision on pursuing investments in a short- and medium-term perspective. On the other hand, as EuroPACE offers upfront financing which needs to be repaid in tranches, it might suggest that people aware of their obligation to pay it back regularly could plan and manage their expenses accordingly if truly interested in improving the EE of their dwellings, particularly once the effects of the crises cease (see section on mortgages). This hypothesis is difficult to confirm though.
Table 3. Mean and median income by household type, 2017
Mean net income (EUR) Median net income (EUR)
Type of household: EU28 Portu-gal
% PT/EU28 EU28 Portu-
gal% PT/EU28
Total of households 19,427 10,863 55.9 16,943 9,071 53.5
Households without dependent children 20,740 11,483 55.4 17,972 9,318 51.8
Households with dependent children 18,066 10,265 56.8 15,977 8,890 55.6
Single person 18,258 10,340 56.6 15,577 7,655 49.1
Single person with dependent children 15,053 7,781 51.7 13,362 7,208 53.9
Two adults 23,150 11,931 51.5 19,751 9,552 48.4
Two or more adults with dependent children 18,386 10,474 57.0 16,270 9,042 55.6
Source: Eurostat – EU survey on income and living conditions (EU-SILC), data for 2017
Last but not least, the distribution of income is rather asymmetric in Portugal.9 While the first quintile represents 7.2% of the national income and in the EU28, its share is 7.8, the last quintile
7 As suggested, for example, by the European Parliament study: “Energy Efficiency for Low-Income Households” 2016, available at: http://www.europarl.europa.eu/RegData/etudes/STUD/2016/595339/IPOL_STU(2016)595339_EN.pdf
8 Eurostat [teina500] – Household saving rate available at: https://ec.europa.eu/eurostat/tgm/refreshTableAction.do?tab=table&plugin=1&pcode=teina500&language=en
9 As suggested, for example, by Eurostat statistics on “Living conditions in Europe – income distribution and income inequality”, available at: https://ec.europa.eu/eurostat/statistics-explained/index.php/Living_conditions_in_Eu-rope_-_income_distribution_and_income_inequality
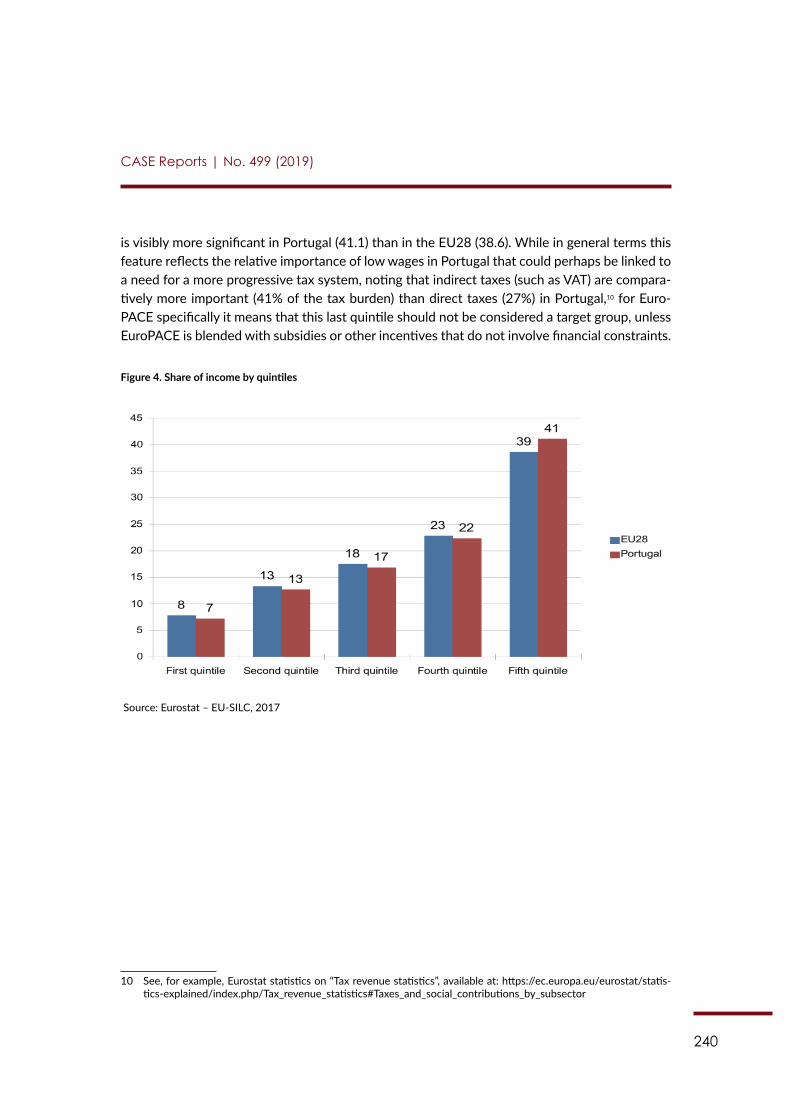
240
CASE Reports | No. 499 (2019)
is visibly more significant in Portugal (41.1) than in the EU28 (38.6). While in general terms this feature reflects the relative importance of low wages in Portugal that could perhaps be linked to a need for a more progressive tax system, noting that indirect taxes (such as VAT) are compara-tively more important (41% of the tax burden) than direct taxes (27%) in Portugal,10 for Euro-PACE specifically it means that this last quintile should not be considered a target group, unless EuroPACE is blended with subsidies or other incentives that do not involve financial constraints.
Figure 4. Share of income by quintiles
Source: Eurostat – EU-SILC, 2017
10 See, for example, Eurostat statistics on “Tax revenue statistics”, available at: https://ec.europa.eu/eurostat/statis-tics-explained/index.php/Tax_revenue_statistics#Taxes_and_social_contributions_by_subsector
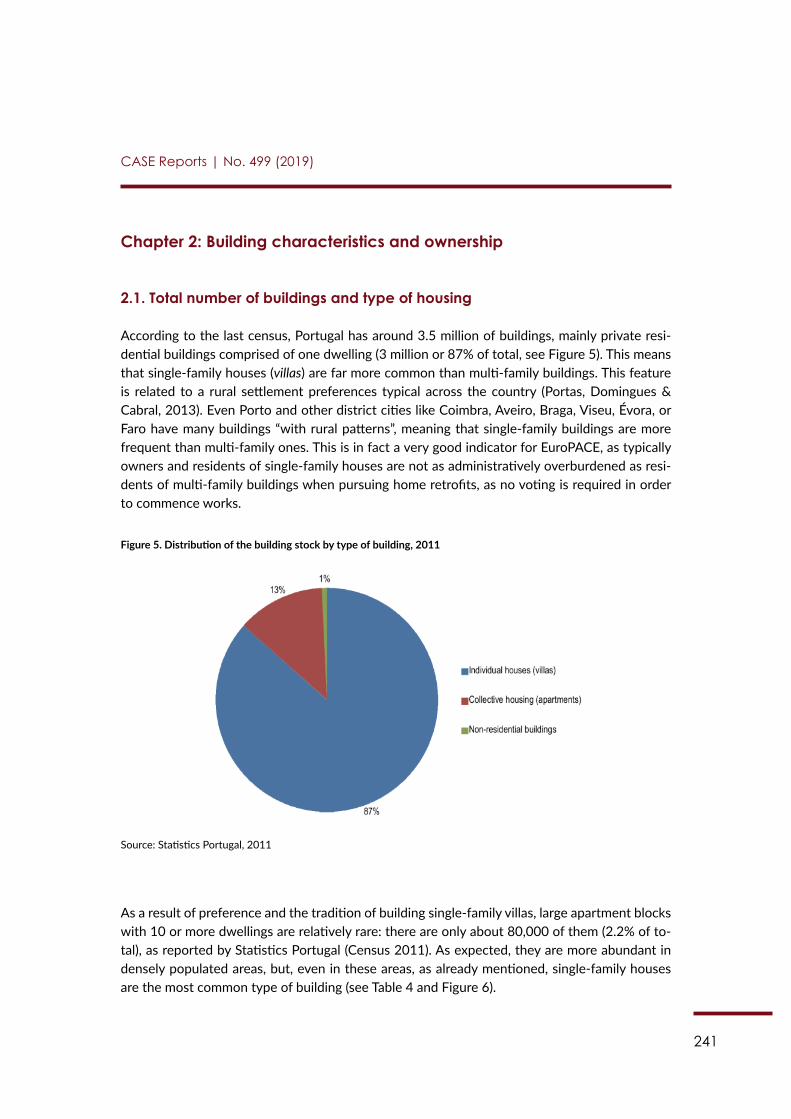
241
CASE Reports | No. 499 (2019)
Chapter 2: Building characteristics and ownership
2.1. Total number of buildings and type of housing
According to the last census, Portugal has around 3.5 million of buildings, mainly private resi-dential buildings comprised of one dwelling (3 million or 87% of total, see Figure 5). This means that single-family houses (villas) are far more common than multi-family buildings. This feature is related to a rural settlement preferences typical across the country (Portas, Domingues & Cabral, 2013). Even Porto and other district cities like Coimbra, Aveiro, Braga, Viseu, Évora, or Faro have many buildings “with rural patterns”, meaning that single-family buildings are more frequent than multi-family ones. This is in fact a very good indicator for EuroPACE, as typically owners and residents of single-family houses are not as administratively overburdened as resi-dents of multi-family buildings when pursuing home retrofits, as no voting is required in order to commence works.
Figure 5. Distribution of the building stock by type of building, 2011
Source: Statistics Portugal, 2011
As a result of preference and the tradition of building single-family villas, large apartment blocks with 10 or more dwellings are relatively rare: there are only about 80,000 of them (2.2% of to-tal), as reported by Statistics Portugal (Census 2011). As expected, they are more abundant in densely populated areas, but, even in these areas, as already mentioned, single-family houses are the most common type of building (see Table 4 and Figure 6).
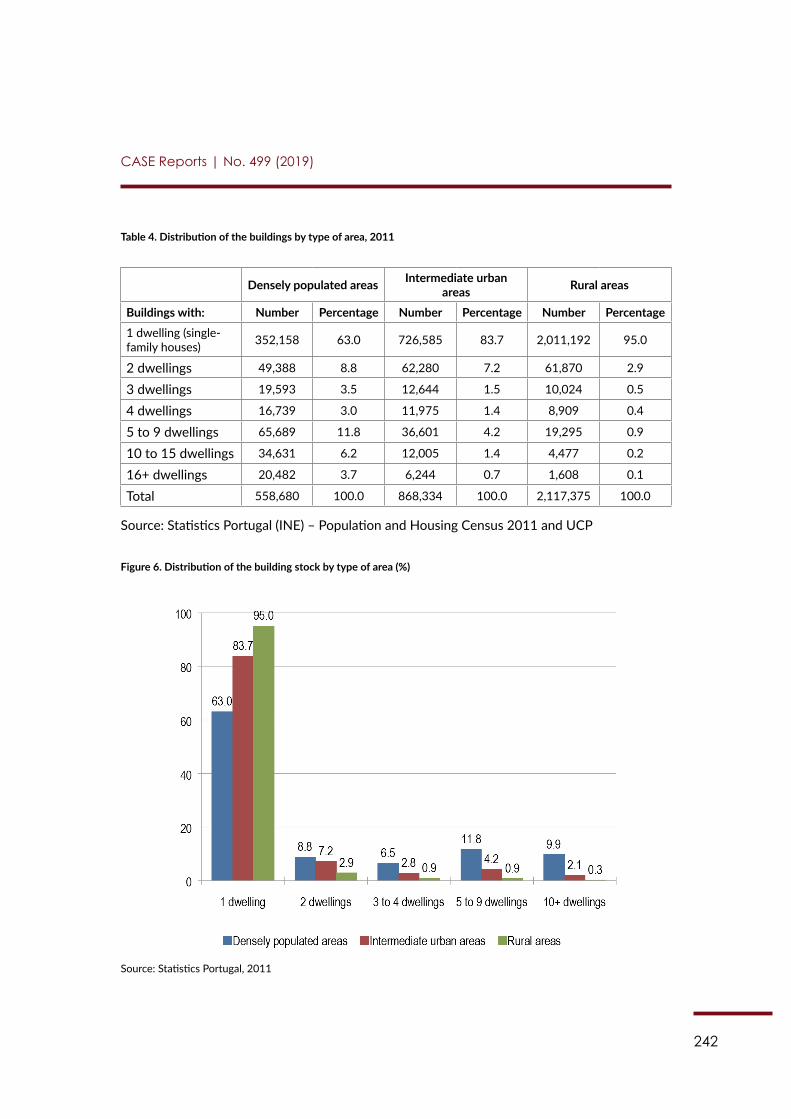
242
CASE Reports | No. 499 (2019)
Table 4. Distribution of the buildings by type of area, 2011
Densely populated areas Intermediate urban areas Rural areas
Buildings with: Number Percentage Number Percentage Number Percentage1 dwelling (single-family houses) 352,158 63.0 726,585 83.7 2,011,192 95.0
2 dwellings 49,388 8.8 62,280 7.2 61,870 2.9
3 dwellings 19,593 3.5 12,644 1.5 10,024 0.5
4 dwellings 16,739 3.0 11,975 1.4 8,909 0.4
5 to 9 dwellings 65,689 11.8 36,601 4.2 19,295 0.9
10 to 15 dwellings 34,631 6.2 12,005 1.4 4,477 0.2
16+ dwellings 20,482 3.7 6,244 0.7 1,608 0.1
Total 558,680 100.0 868,334 100.0 2,117,375 100.0
Source: Statistics Portugal (INE) – Population and Housing Census 2011 and UCP
Figure 6. Distribution of the building stock by type of area (%)
Source: Statistics Portugal, 2011
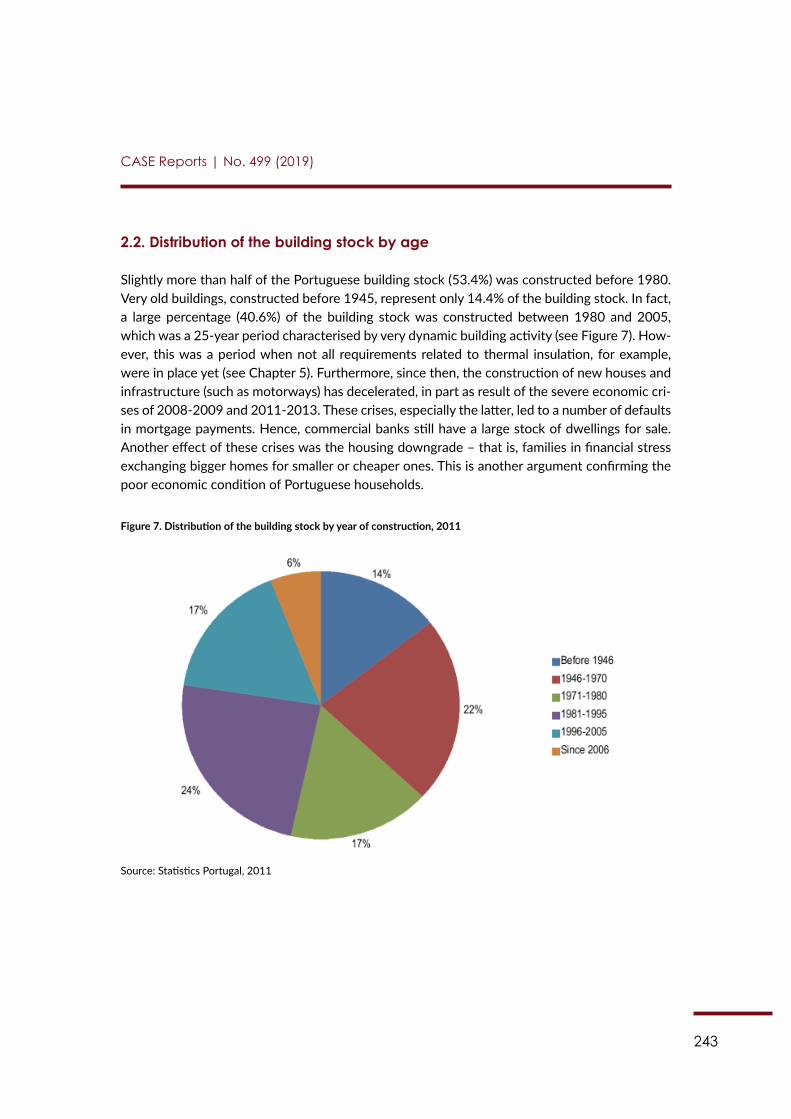
243
CASE Reports | No. 499 (2019)
2.2. Distribution of the building stock by age
Slightly more than half of the Portuguese building stock (53.4%) was constructed before 1980. Very old buildings, constructed before 1945, represent only 14.4% of the building stock. In fact, a large percentage (40.6%) of the building stock was constructed between 1980 and 2005, which was a 25-year period characterised by very dynamic building activity (see Figure 7). How-ever, this was a period when not all requirements related to thermal insulation, for example, were in place yet (see Chapter 5). Furthermore, since then, the construction of new houses and infrastructure (such as motorways) has decelerated, in part as result of the severe economic cri-ses of 2008-2009 and 2011-2013. These crises, especially the latter, led to a number of defaults in mortgage payments. Hence, commercial banks still have a large stock of dwellings for sale. Another effect of these crises was the housing downgrade – that is, families in financial stress exchanging bigger homes for smaller or cheaper ones. This is another argument confirming the poor economic condition of Portuguese households.
Figure 7. Distribution of the building stock by year of construction, 2011
Source: Statistics Portugal, 2011

244
CASE Reports | No. 499 (2019)
2.3. Ownership of the dwellings
In 2011, Portugal had a total number of 5.9 million dwellings – that is, houses, apartments where one family could live permanently. The number of permanently occupied dwellings is 4 million (67.9% of the total, see Table 1), noting once again that secondary residences (19.3%) and unoc-cupied/empty dwellings (12.5%) are frequent.
What is more important from the EuroPACE perspective, is the fact, that according to Eurostat,11 only 38.5% of dwellings are owner-occupied, with no outstanding mortgage or hous-ing loan; 36.7% are owner-occupied, but with mortgage or loan; 12.9% of the dwellings are occupied by tenants paying market prices; and 11.8% of dwellings are inhabited by tenants pay-ing a reduced price or living there for free (see Figure 8). The fact that approximately 36.7% of households are already indebted is a rather negative discovery, as these households might be less interested in pursuing EE investments, particularly those which, similarly to loans, have to be repaid in specific amounts and by specific deadlines.
Figure 8. Distribution of permanently occupied dwellings by tenure status
204
2.3. Ownership of the dwellings
In 2011, Portugal had a total number of 5.9 million dwellings – that is, houses, apartments where one family could live permanently. The number of permanently occupied dwellings is 4 million (67.9% of the total, see Table 1), noting once again that secondary residences (19.3%) and unoccupied/empty dwellings (12.5%) are frequent.
What is more important from the EuroPACE perspective, is the fact, that according to Eurostat,337 only 38.5% of dwellings are owner-occupied, with no outstanding mortgage or housing loan; 36.7% are owner-occupied, but with mortgage or loan; 12.9% of the dwellings are occupied by tenants paying market prices; and 11.8% of dwellings are inhabited by tenants paying a reduced price or living there for free (see Figure 8). The fact that approximately 36.7% of households are already indebted is a rather negative discovery, as these households might be less interested in pursuing EE investments, particularly those which, similarly to loans, have to be repaid in specific amounts and by specific deadlines.
Figure 8. Distribution of permanently occupied dwellings by tenure status
The distribution of permanently occupied dwellings by age and tenure status suggests that in 2011 private-owned housing with a mortgage (currently 36.7% of the total of permanently occupied dwellings – see more recent data from Eurostat above) was typically constructed after 1981. Conversely, private housing without a mortgage is a tenure status more frequent among older houses. This evidence can be explained either by the maturity (pay-back period) of mortgage lending, which is typically 30 to 40 years in Portugal at the beginning of the loan, or by the housing policy after the revolution of 1974.338 In fact, the acquisition by each resident of their own house instead of renting has been favoured since this time, which has motivated the increase of home-ownership rate in Portugal.
Table 5. Distribution of permanently occupied dwellings by age and tenure status, 2011
337 Eurostat housing statistics (online data code: ilc_lvho05a) 338 Real Property Law – Portugal, p. 2, available at: https://www.eui.eu/documents/departmentscentres/law/researchteaching/researchthemes/europeanprivatelaw/realpropertyproject/Portugal.pdf
38,50%
36,70%
12,90%
11,80%
Owner-occupied dwellings, with no outstanding mortgage or housing loan
Owner-occupied dwellings, with mortgage or loan
Dwellings occupied by tenants paying market prices
Dwelling occupied by tenants paying a reduced price or living there for free
The distribution of permanently occupied dwellings by age and tenure status suggests that in 2011 private-owned housing with a mortgage (currently 36.7% of the total of permanently oc-cupied dwellings – see more recent data from Eurostat above) was typically constructed after
11 Eurostat housing statistics (online data code: ilc_lvho05a)
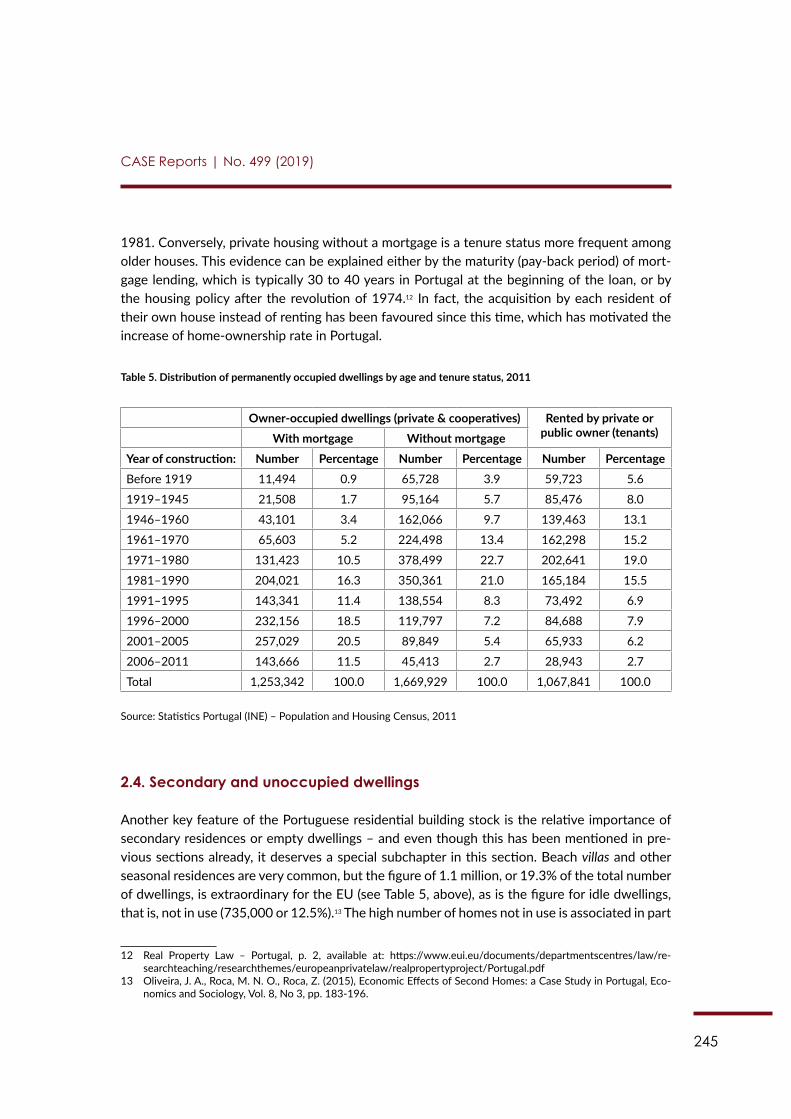
245
CASE Reports | No. 499 (2019)
1981. Conversely, private housing without a mortgage is a tenure status more frequent among older houses. This evidence can be explained either by the maturity (pay-back period) of mort-gage lending, which is typically 30 to 40 years in Portugal at the beginning of the loan, or by the housing policy after the revolution of 1974.12 In fact, the acquisition by each resident of their own house instead of renting has been favoured since this time, which has motivated the increase of home-ownership rate in Portugal.
Table 5. Distribution of permanently occupied dwellings by age and tenure status, 2011
Owner-occupied dwellings (private & cooperatives) Rented by private or public owner (tenants)With mortgage Without mortgage
Year of construction: Number Percentage Number Percentage Number PercentageBefore 1919 11,494 0.9 65,728 3.9 59,723 5.6
1919–1945 21,508 1.7 95,164 5.7 85,476 8.0
1946–1960 43,101 3.4 162,066 9.7 139,463 13.1
1961–1970 65,603 5.2 224,498 13.4 162,298 15.2
1971–1980 131,423 10.5 378,499 22.7 202,641 19.0
1981–1990 204,021 16.3 350,361 21.0 165,184 15.5
1991–1995 143,341 11.4 138,554 8.3 73,492 6.9
1996–2000 232,156 18.5 119,797 7.2 84,688 7.9
2001–2005 257,029 20.5 89,849 5.4 65,933 6.2
2006–2011 143,666 11.5 45,413 2.7 28,943 2.7
Total 1,253,342 100.0 1,669,929 100.0 1,067,841 100.0
Source: Statistics Portugal (INE) – Population and Housing Census, 2011
2.4. Secondary and unoccupied dwellings
Another key feature of the Portuguese residential building stock is the relative importance of secondary residences or empty dwellings – and even though this has been mentioned in pre-vious sections already, it deserves a special subchapter in this section. Beach villas and other seasonal residences are very common, but the figure of 1.1 million, or 19.3% of the total number of dwellings, is extraordinary for the EU (see Table 5, above), as is the figure for idle dwellings, that is, not in use (735,000 or 12.5%).13 The high number of homes not in use is associated in part
12 Real Property Law – Portugal, p. 2, available at: https://www.eui.eu/documents/departmentscentres/law/re-searchteaching/researchthemes/europeanprivatelaw/realpropertyproject/Portugal.pdf
13 Oliveira, J. A., Roca, M. N. O., Roca, Z. (2015), Economic Effects of Second Homes: a Case Study in Portugal, Eco-nomics and Sociology, Vol. 8, No 3, pp. 183-196.
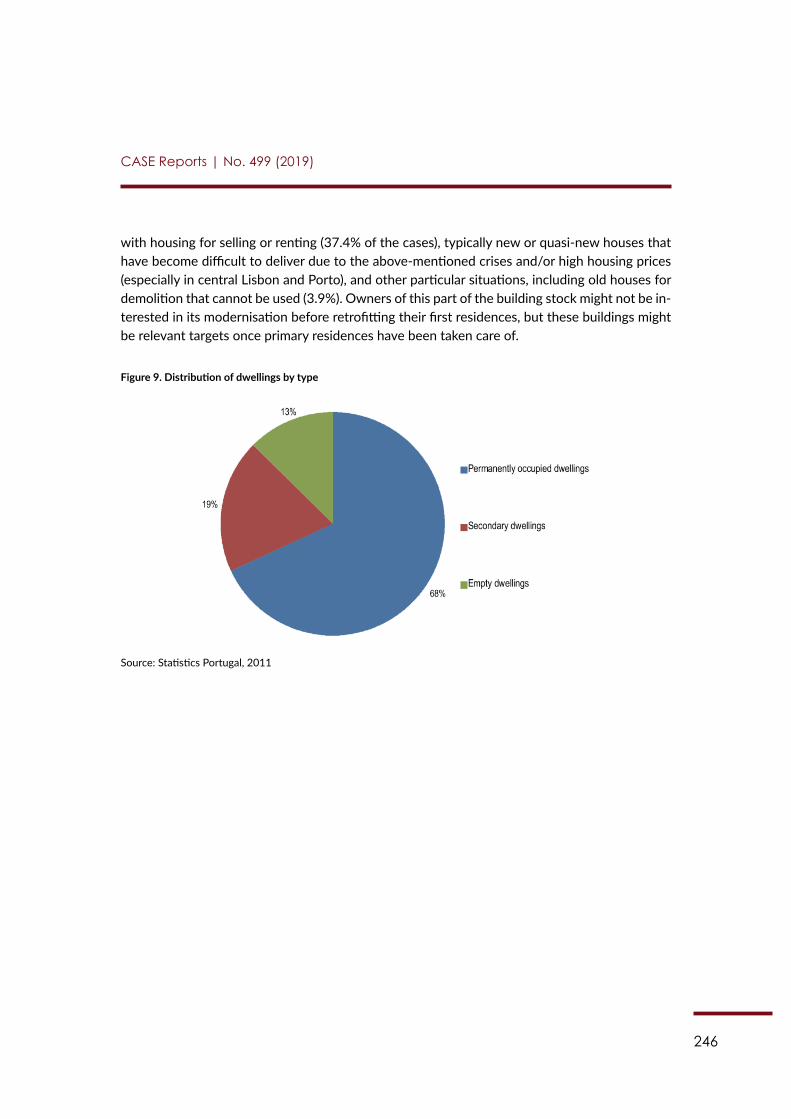
246
CASE Reports | No. 499 (2019)
with housing for selling or renting (37.4% of the cases), typically new or quasi-new houses that have become difficult to deliver due to the above-mentioned crises and/or high housing prices (especially in central Lisbon and Porto), and other particular situations, including old houses for demolition that cannot be used (3.9%). Owners of this part of the building stock might not be in-terested in its modernisation before retrofitting their first residences, but these buildings might be relevant targets once primary residences have been taken care of.
Figure 9. Distribution of dwellings by type
Source: Statistics Portugal, 2011
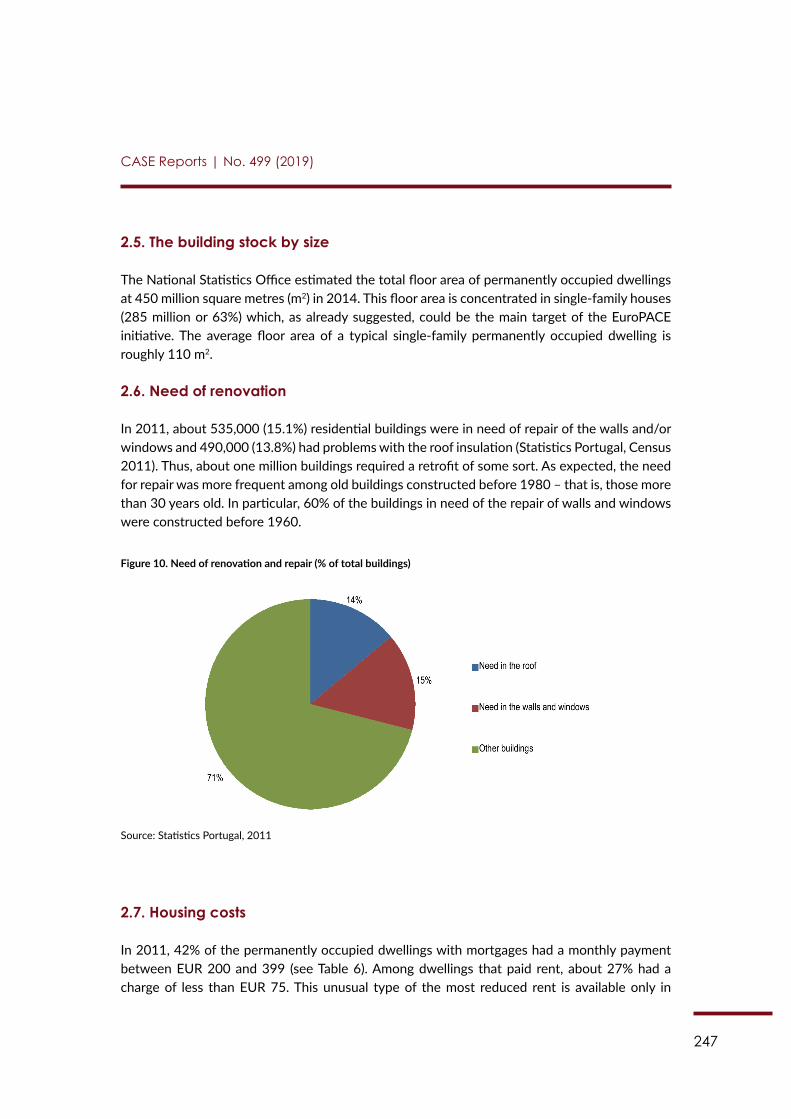
247
CASE Reports | No. 499 (2019)
2.5. The building stock by size
The National Statistics Office estimated the total floor area of permanently occupied dwellings at 450 million square metres (m2) in 2014. This floor area is concentrated in single-family houses (285 million or 63%) which, as already suggested, could be the main target of the EuroPACE initiative. The average floor area of a typical single-family permanently occupied dwelling is roughly 110 m2.
2.6. Need of renovation
In 2011, about 535,000 (15.1%) residential buildings were in need of repair of the walls and/or windows and 490,000 (13.8%) had problems with the roof insulation (Statistics Portugal, Census 2011). Thus, about one million buildings required a retrofit of some sort. As expected, the need for repair was more frequent among old buildings constructed before 1980 – that is, those more than 30 years old. In particular, 60% of the buildings in need of the repair of walls and windows were constructed before 1960.
Figure 10. Need of renovation and repair (% of total buildings)
Source: Statistics Portugal, 2011
2.7. Housing costs
In 2011, 42% of the permanently occupied dwellings with mortgages had a monthly payment between EUR 200 and 399 (see Table 6). Among dwellings that paid rent, about 27% had a charge of less than EUR 75. This unusual type of the most reduced rent is available only in
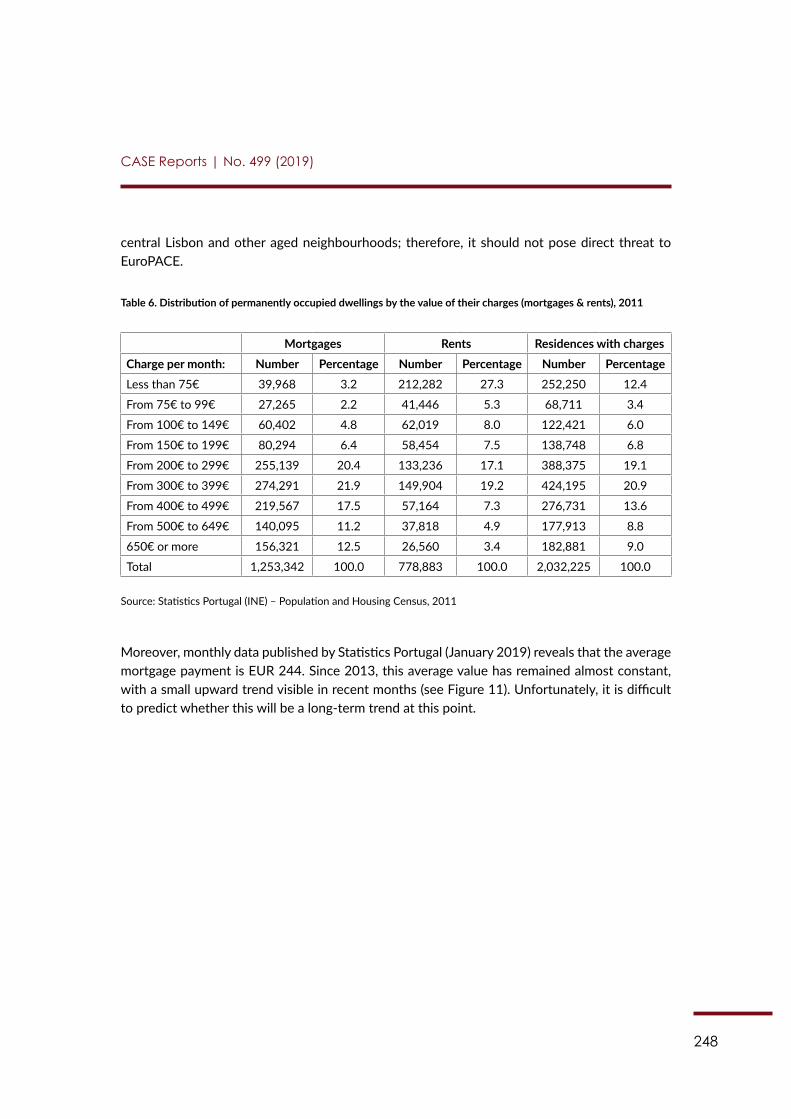
248
CASE Reports | No. 499 (2019)
central Lisbon and other aged neighbourhoods; therefore, it should not pose direct threat to EuroPACE.
Table 6. Distribution of permanently occupied dwellings by the value of their charges (mortgages & rents), 2011
Mortgages Rents Residences with chargesCharge per month: Number Percentage Number Percentage Number PercentageLess than 75€ 39,968 3.2 212,282 27.3 252,250 12.4
From 75€ to 99€ 27,265 2.2 41,446 5.3 68,711 3.4
From 100€ to 149€ 60,402 4.8 62,019 8.0 122,421 6.0
From 150€ to 199€ 80,294 6.4 58,454 7.5 138,748 6.8
From 200€ to 299€ 255,139 20.4 133,236 17.1 388,375 19.1
From 300€ to 399€ 274,291 21.9 149,904 19.2 424,195 20.9
From 400€ to 499€ 219,567 17.5 57,164 7.3 276,731 13.6
From 500€ to 649€ 140,095 11.2 37,818 4.9 177,913 8.8
650€ or more 156,321 12.5 26,560 3.4 182,881 9.0
Total 1,253,342 100.0 778,883 100.0 2,032,225 100.0
Source: Statistics Portugal (INE) – Population and Housing Census, 2011
Moreover, monthly data published by Statistics Portugal (January 2019) reveals that the average mortgage payment is EUR 244. Since 2013, this average value has remained almost constant, with a small upward trend visible in recent months (see Figure 11). Unfortunately, it is difficult to predict whether this will be a long-term trend at this point.
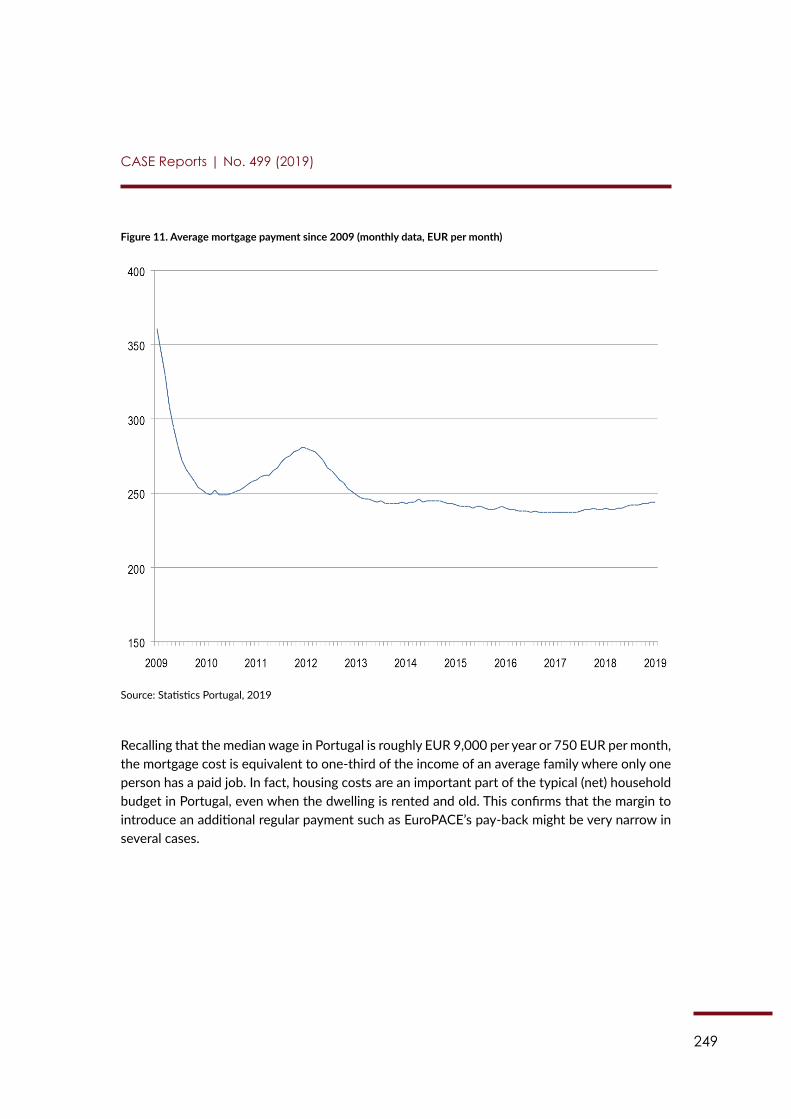
249
CASE Reports | No. 499 (2019)
Figure 11. Average mortgage payment since 2009 (monthly data, EUR per month)
Source: Statistics Portugal, 2019
Recalling that the median wage in Portugal is roughly EUR 9,000 per year or 750 EUR per month, the mortgage cost is equivalent to one-third of the income of an average family where only one person has a paid job. In fact, housing costs are an important part of the typical (net) household budget in Portugal, even when the dwelling is rented and old. This confirms that the margin to introduce an additional regular payment such as EuroPACE’s pay-back might be very narrow in several cases.
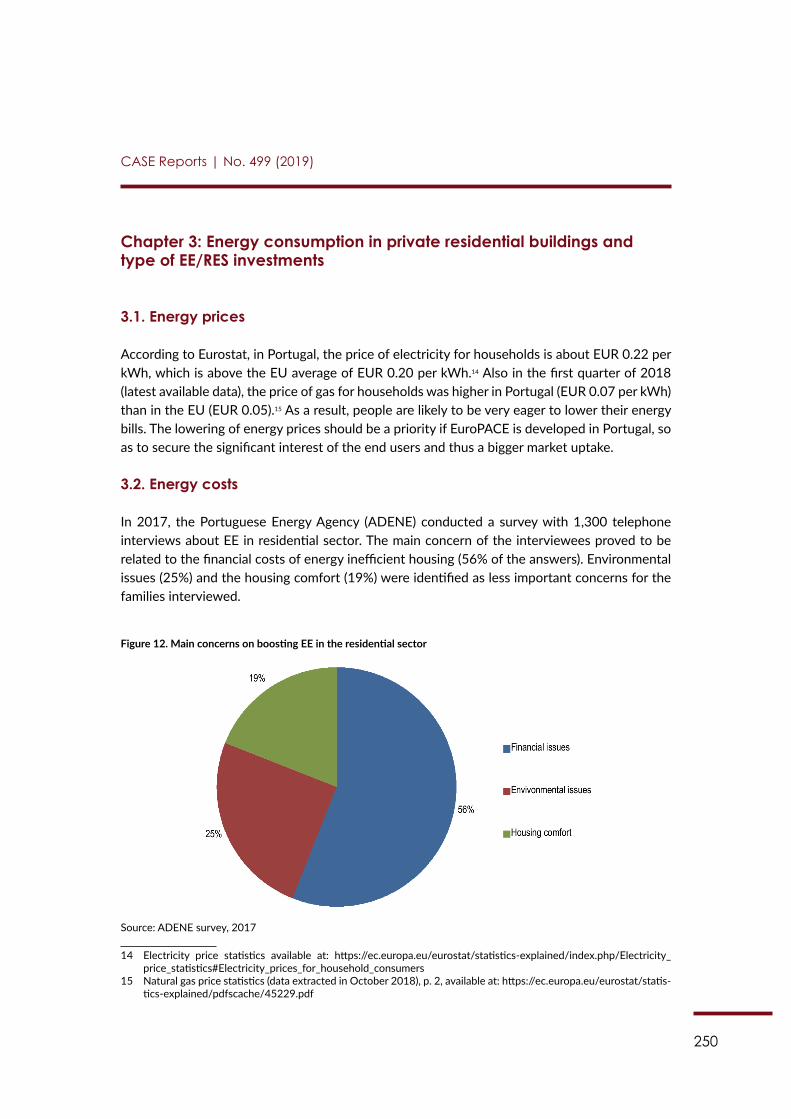
250
CASE Reports | No. 499 (2019)
Chapter 3: Energy consumption in private residential buildings and type of EE/RES investments
3.1. Energy prices
According to Eurostat, in Portugal, the price of electricity for households is about EUR 0.22 per kWh, which is above the EU average of EUR 0.20 per kWh.14 Also in the first quarter of 2018 (latest available data), the price of gas for households was higher in Portugal (EUR 0.07 per kWh) than in the EU (EUR 0.05).15 As a result, people are likely to be very eager to lower their energy bills. The lowering of energy prices should be a priority if EuroPACE is developed in Portugal, so as to secure the significant interest of the end users and thus a bigger market uptake.
3.2. Energy costs
In 2017, the Portuguese Energy Agency (ADENE) conducted a survey with 1,300 telephone interviews about EE in residential sector. The main concern of the interviewees proved to be related to the financial costs of energy inefficient housing (56% of the answers). Environmental issues (25%) and the housing comfort (19%) were identified as less important concerns for the families interviewed.
Figure 12. Main concerns on boosting EE in the residential sector
Source: ADENE survey, 2017
14 Electricity price statistics available at: https://ec.europa.eu/eurostat/statistics-explained/index.php/Electricity_price_statistics#Electricity_prices_for_household_consumers
15 Natural gas price statistics (data extracted in October 2018), p. 2, available at: https://ec.europa.eu/eurostat/statis-tics-explained/pdfscache/45229.pdf
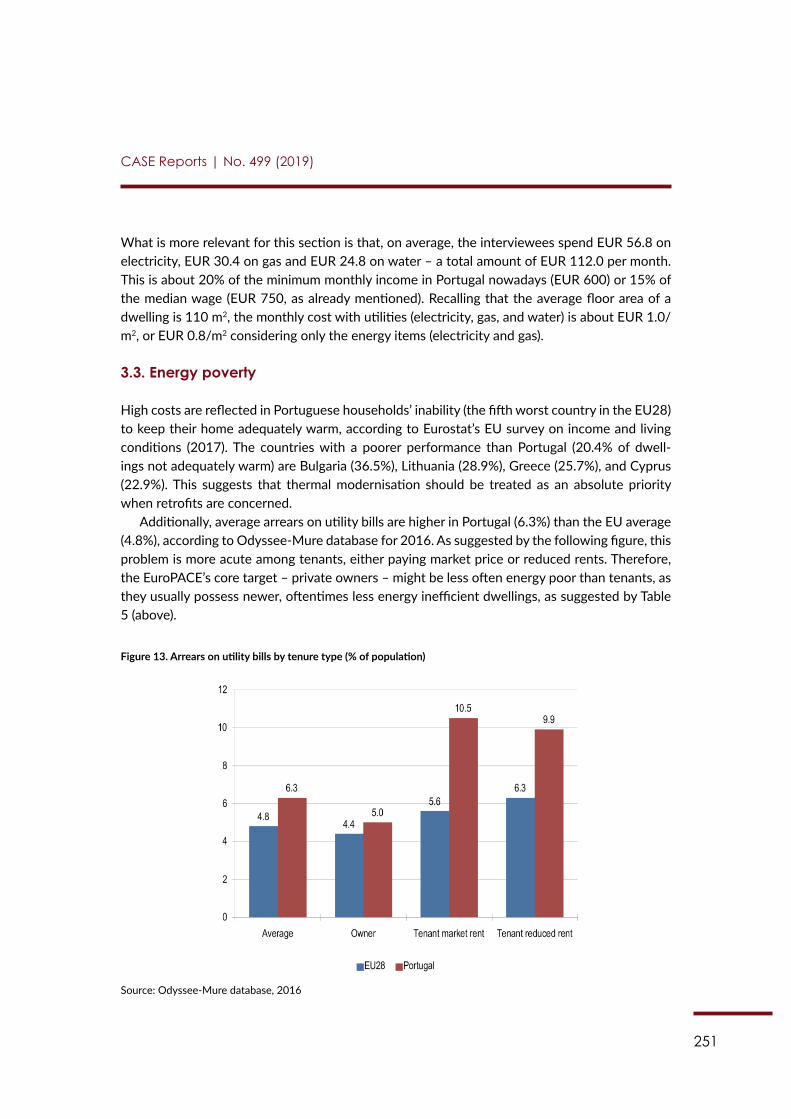
251
CASE Reports | No. 499 (2019)
What is more relevant for this section is that, on average, the interviewees spend EUR 56.8 on electricity, EUR 30.4 on gas and EUR 24.8 on water – a total amount of EUR 112.0 per month. This is about 20% of the minimum monthly income in Portugal nowadays (EUR 600) or 15% of the median wage (EUR 750, as already mentioned). Recalling that the average floor area of a dwelling is 110 m2, the monthly cost with utilities (electricity, gas, and water) is about EUR 1.0/m2, or EUR 0.8/m2 considering only the energy items (electricity and gas).
3.3. Energy poverty
High costs are reflected in Portuguese households’ inability (the fifth worst country in the EU28) to keep their home adequately warm, according to Eurostat’s EU survey on income and living conditions (2017). The countries with a poorer performance than Portugal (20.4% of dwell-ings not adequately warm) are Bulgaria (36.5%), Lithuania (28.9%), Greece (25.7%), and Cyprus (22.9%). This suggests that thermal modernisation should be treated as an absolute priority when retrofits are concerned.
Additionally, average arrears on utility bills are higher in Portugal (6.3%) than the EU average (4.8%), according to Odyssee-Mure database for 2016. As suggested by the following figure, this problem is more acute among tenants, either paying market price or reduced rents. Therefore, the EuroPACE’s core target – private owners – might be less often energy poor than tenants, as they usually possess newer, oftentimes less energy inefficient dwellings, as suggested by Table 5 (above).
Figure 13. Arrears on utility bills by tenure type (% of population)
Source: Odyssee-Mure database, 2016
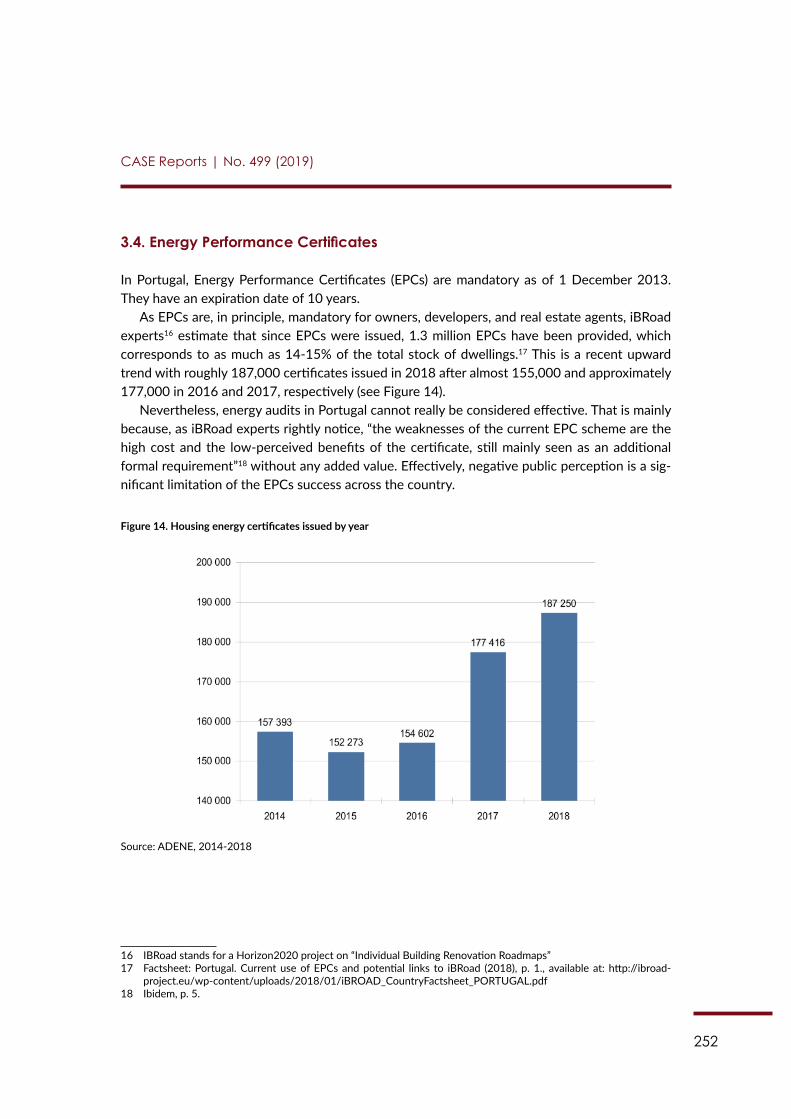
252
CASE Reports | No. 499 (2019)
3.4. Energy Performance Certificates
In Portugal, Energy Performance Certificates (EPCs) are mandatory as of 1 December 2013. They have an expiration date of 10 years.
As EPCs are, in principle, mandatory for owners, developers, and real estate agents, iBRoad experts16 estimate that since EPCs were issued, 1.3 million EPCs have been provided, which corresponds to as much as 14-15% of the total stock of dwellings.17 This is a recent upward trend with roughly 187,000 certificates issued in 2018 after almost 155,000 and approximately 177,000 in 2016 and 2017, respectively (see Figure 14).
Nevertheless, energy audits in Portugal cannot really be considered effective. That is mainly because, as iBRoad experts rightly notice, “the weaknesses of the current EPC scheme are the high cost and the low-perceived benefits of the certificate, still mainly seen as an additional formal requirement”18 without any added value. Effectively, negative public perception is a sig-nificant limitation of the EPCs success across the country.
Figure 14. Housing energy certificates issued by year
Source: ADENE, 2014-2018
16 IBRoad stands for a Horizon2020 project on “Individual Building Renovation Roadmaps”17 Factsheet: Portugal. Current use of EPCs and potential links to iBRoad (2018), p. 1., available at: http://ibroad-
project.eu/wp-content/uploads/2018/01/iBROAD_CountryFactsheet_PORTUGAL.pdf 18 Ibidem, p. 5.
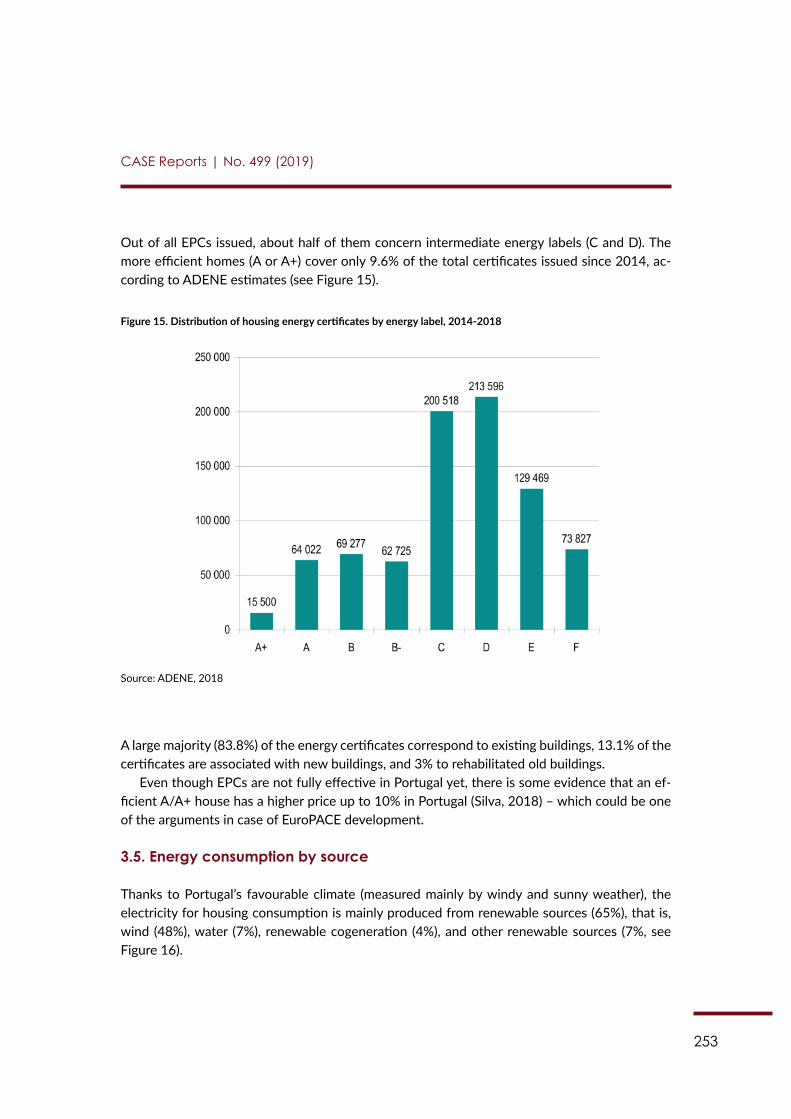
253
CASE Reports | No. 499 (2019)
Out of all EPCs issued, about half of them concern intermediate energy labels (C and D). The more efficient homes (A or A+) cover only 9.6% of the total certificates issued since 2014, ac-cording to ADENE estimates (see Figure 15).
Figure 15. Distribution of housing energy certificates by energy label, 2014-2018
Source: ADENE, 2018
A large majority (83.8%) of the energy certificates correspond to existing buildings, 13.1% of the certificates are associated with new buildings, and 3% to rehabilitated old buildings.
Even though EPCs are not fully effective in Portugal yet, there is some evidence that an ef-ficient A/A+ house has a higher price up to 10% in Portugal (Silva, 2018) – which could be one of the arguments in case of EuroPACE development.
3.5. Energy consumption by source
Thanks to Portugal’s favourable climate (measured mainly by windy and sunny weather), the electricity for housing consumption is mainly produced from renewable sources (65%), that is, wind (48%), water (7%), renewable cogeneration (4%), and other renewable sources (7%, see Figure 16).
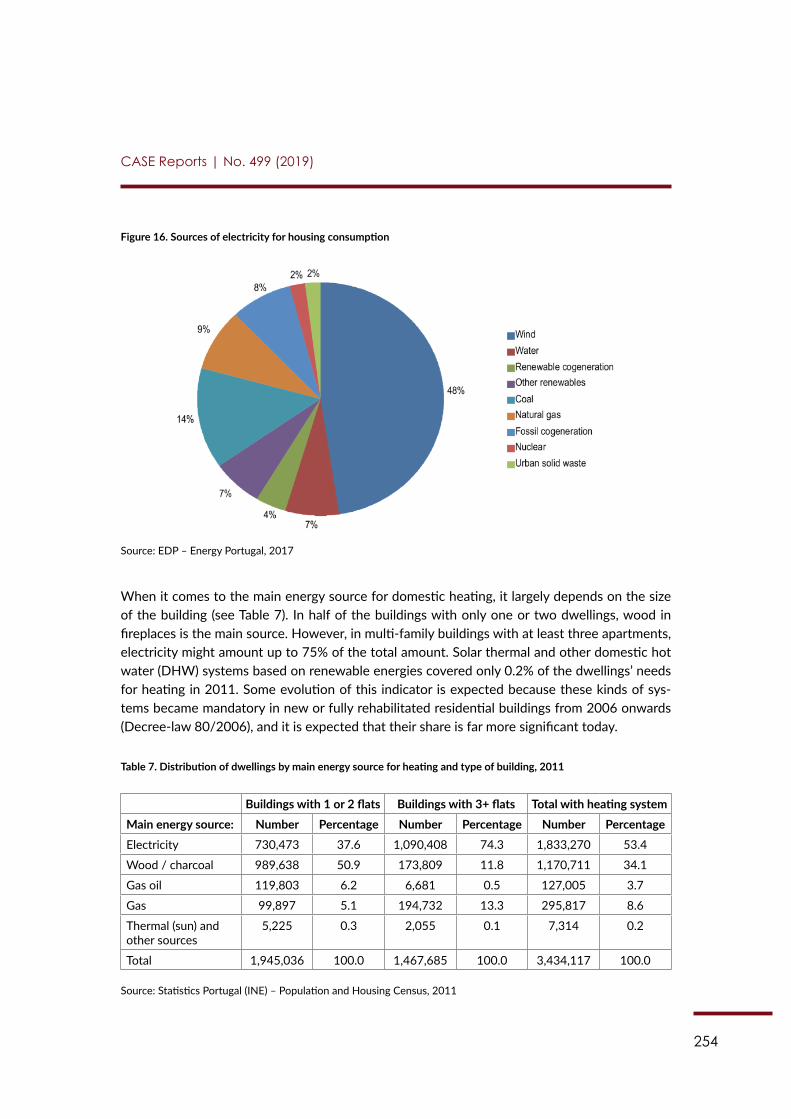
254
CASE Reports | No. 499 (2019)
Figure 16. Sources of electricity for housing consumption
Source: EDP – Energy Portugal, 2017
When it comes to the main energy source for domestic heating, it largely depends on the size of the building (see Table 7). In half of the buildings with only one or two dwellings, wood in fireplaces is the main source. However, in multi-family buildings with at least three apartments, electricity might amount up to 75% of the total amount. Solar thermal and other domestic hot water (DHW) systems based on renewable energies covered only 0.2% of the dwellings’ needs for heating in 2011. Some evolution of this indicator is expected because these kinds of sys-tems became mandatory in new or fully rehabilitated residential buildings from 2006 onwards (Decree-law 80/2006), and it is expected that their share is far more significant today.
Table 7. Distribution of dwellings by main energy source for heating and type of building, 2011
Buildings with 1 or 2 flats Buildings with 3+ flats Total with heating systemMain energy source: Number Percentage Number Percentage Number PercentageElectricity 730,473 37.6 1,090,408 74.3 1,833,270 53.4
Wood / charcoal 989,638 50.9 173,809 11.8 1,170,711 34.1
Gas oil 119,803 6.2 6,681 0.5 127,005 3.7
Gas 99,897 5.1 194,732 13.3 295,817 8.6
Thermal (sun) and other sources
5,225 0.3 2,055 0.1 7,314 0.2
Total 1,945,036 100.0 1,467,685 100.0 3,434,117 100.0
Source: Statistics Portugal (INE) – Population and Housing Census, 2011
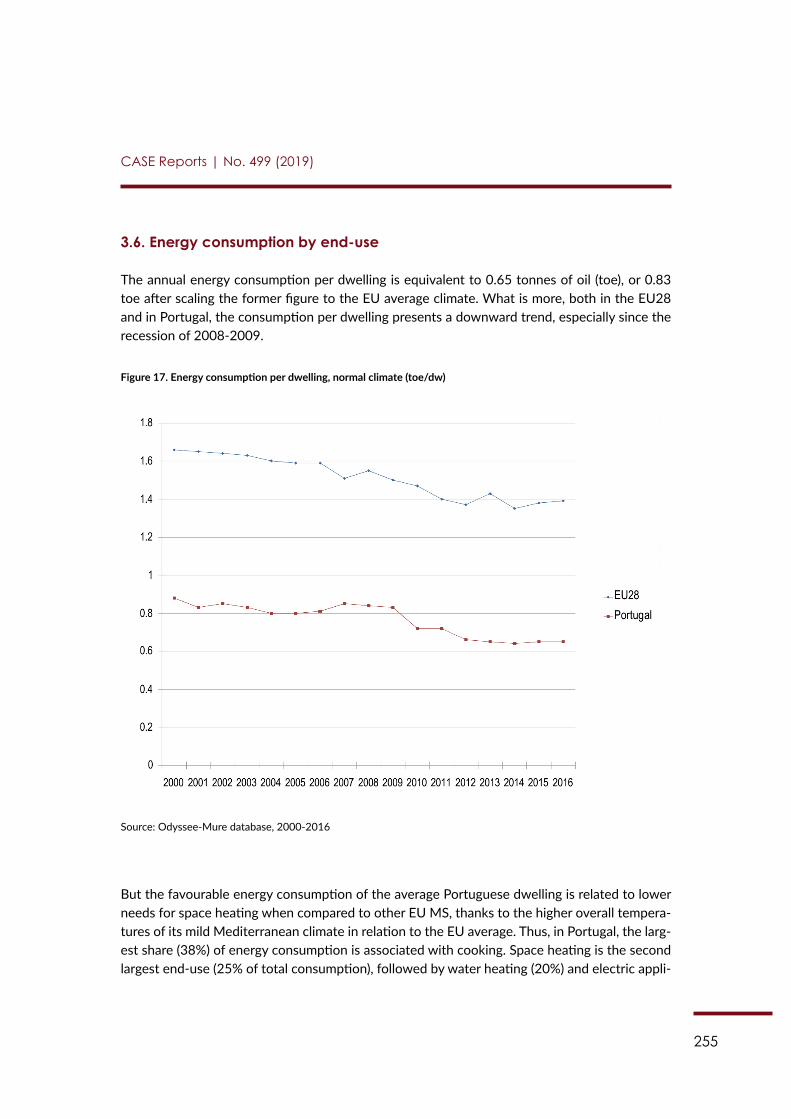
255
CASE Reports | No. 499 (2019)
3.6. Energy consumption by end-use
The annual energy consumption per dwelling is equivalent to 0.65 tonnes of oil (toe), or 0.83 toe after scaling the former figure to the EU average climate. What is more, both in the EU28 and in Portugal, the consumption per dwelling presents a downward trend, especially since the recession of 2008-2009.
Figure 17. Energy consumption per dwelling, normal climate (toe/dw)
Source: Odyssee-Mure database, 2000-2016
But the favourable energy consumption of the average Portuguese dwelling is related to lower needs for space heating when compared to other EU MS, thanks to the higher overall tempera-tures of its mild Mediterranean climate in relation to the EU average. Thus, in Portugal, the larg-est share (38%) of energy consumption is associated with cooking. Space heating is the second largest end-use (25% of total consumption), followed by water heating (20%) and electric appli-
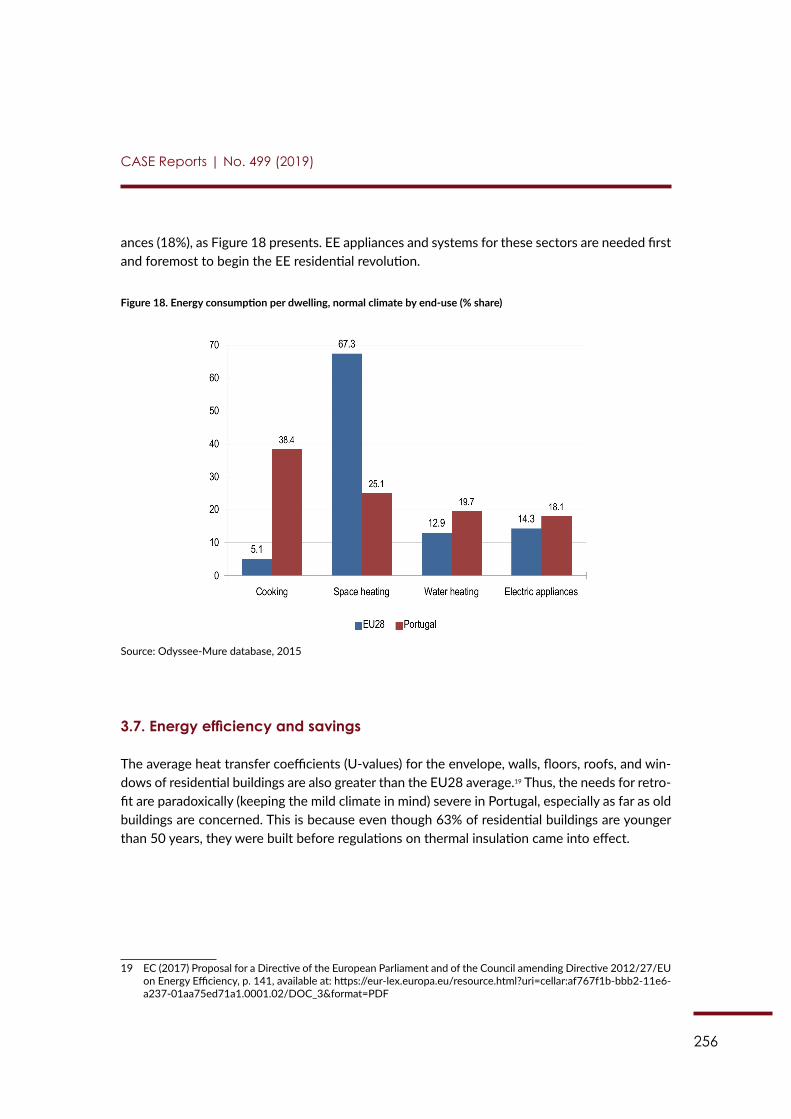
256
CASE Reports | No. 499 (2019)
ances (18%), as Figure 18 presents. EE appliances and systems for these sectors are needed first and foremost to begin the EE residential revolution.
Figure 18. Energy consumption per dwelling, normal climate by end-use (% share)
Source: Odyssee-Mure database, 2015
3.7. Energy efficiency and savings
The average heat transfer coefficients (U-values) for the envelope, walls, floors, roofs, and win-dows of residential buildings are also greater than the EU28 average.19 Thus, the needs for retro-fit are paradoxically (keeping the mild climate in mind) severe in Portugal, especially as far as old buildings are concerned. This is because even though 63% of residential buildings are younger than 50 years, they were built before regulations on thermal insulation came into effect.
19 EC (2017) Proposal for a Directive of the European Parliament and of the Council amending Directive 2012/27/EU on Energy Efficiency, p. 141, available at: https://eur-lex.europa.eu/resource.html?uri=cellar:af767f1b-bbb2-11e6-a237-01aa75ed71a1.0001.02/DOC_3&format=PDF
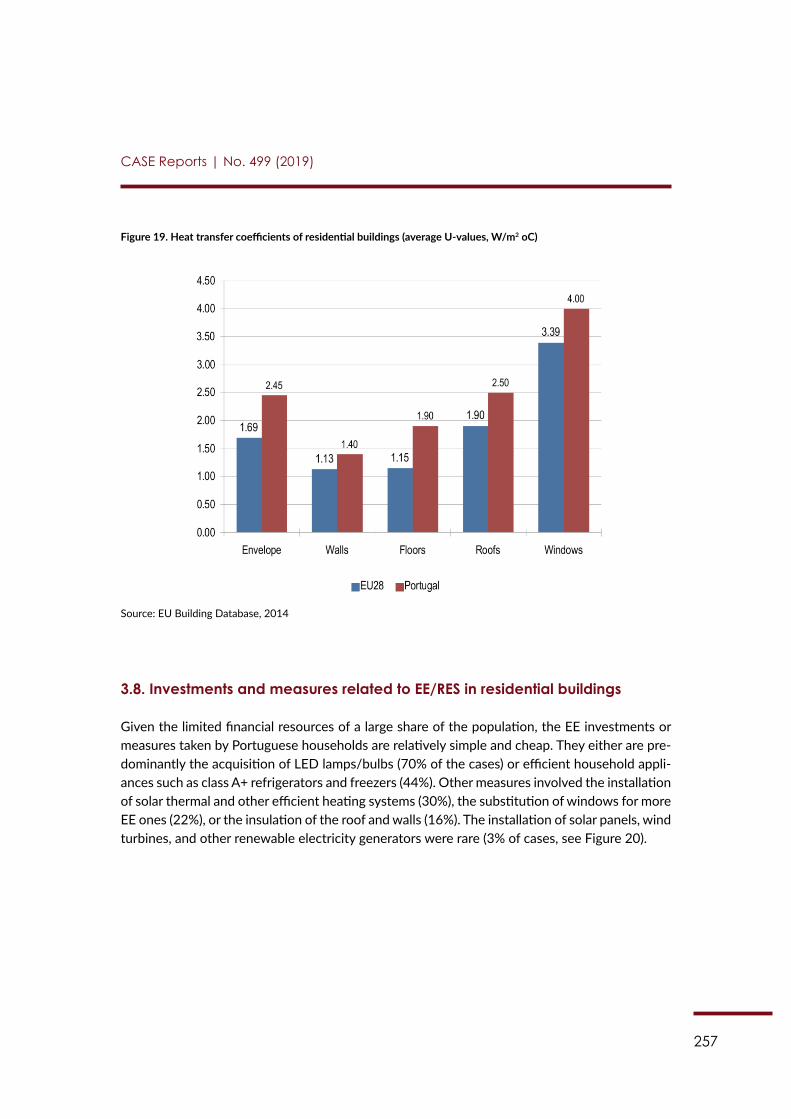
257
CASE Reports | No. 499 (2019)
Figure 19. Heat transfer coefficients of residential buildings (average U-values, W/m2 oC)
Source: EU Building Database, 2014
3.8. Investments and measures related to EE/RES in residential buildings
Given the limited financial resources of a large share of the population, the EE investments or measures taken by Portuguese households are relatively simple and cheap. They either are pre-dominantly the acquisition of LED lamps/bulbs (70% of the cases) or efficient household appli-ances such as class A+ refrigerators and freezers (44%). Other measures involved the installation of solar thermal and other efficient heating systems (30%), the substitution of windows for more EE ones (22%), or the insulation of the roof and walls (16%). The installation of solar panels, wind turbines, and other renewable electricity generators were rare (3% of cases, see Figure 20).
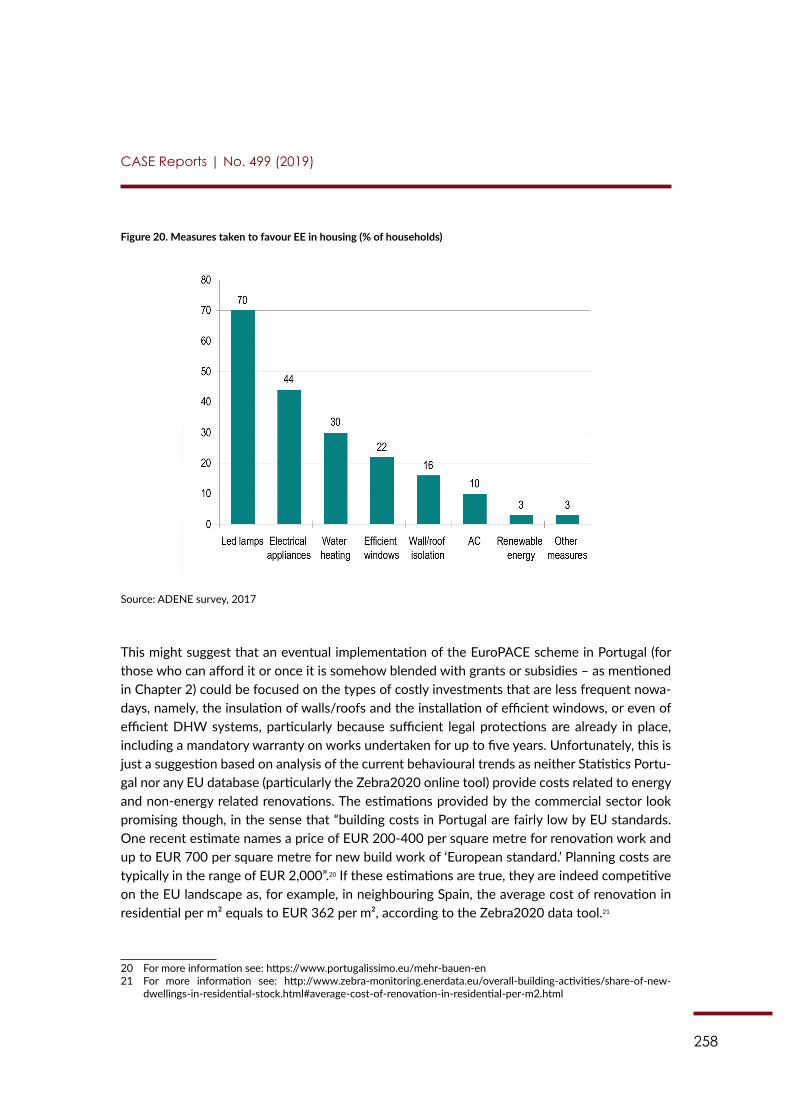
258
CASE Reports | No. 499 (2019)
Figure 20. Measures taken to favour EE in housing (% of households)
Source: ADENE survey, 2017
This might suggest that an eventual implementation of the EuroPACE scheme in Portugal (for those who can afford it or once it is somehow blended with grants or subsidies – as mentioned in Chapter 2) could be focused on the types of costly investments that are less frequent nowa-days, namely, the insulation of walls/roofs and the installation of efficient windows, or even of efficient DHW systems, particularly because sufficient legal protections are already in place, including a mandatory warranty on works undertaken for up to five years. Unfortunately, this is just a suggestion based on analysis of the current behavioural trends as neither Statistics Portu-gal nor any EU database (particularly the Zebra2020 online tool) provide costs related to energy and non-energy related renovations. The estimations provided by the commercial sector look promising though, in the sense that “building costs in Portugal are fairly low by EU standards. One recent estimate names a price of EUR 200-400 per square metre for renovation work and up to EUR 700 per square metre for new build work of ‘European standard.’ Planning costs are typically in the range of EUR 2,000”.20 If these estimations are true, they are indeed competitive on the EU landscape as, for example, in neighbouring Spain, the average cost of renovation in residential per m² equals to EUR 362 per m², according to the Zebra2020 data tool.21
20 For more information see: https://www.portugalissimo.eu/mehr-bauen-en 21 For more information see: http://www.zebra-monitoring.enerdata.eu/overall-building-activities/share-of-new-
dwellings-in-residential-stock.html#average-cost-of-renovation-in-residential-per-m2.html
259
CASE Reports | No. 499 (2019)
Chapter 4: Barriers to develop EE/RES potential in private buildings
Various factors impeding investments across the EU have already been identified. Nevertheless, local (national) energy agencies like ADENE have the most accurate insights and are often in the best position to present significant barriers; hence, this chapter builds largely on this agency’s know-how. As far as the survey conducted by ADENE (2017) is concerned, the main barriers to develop EE in the residential sector, apart from the rather low incomes (see Chapter 2), are:
• Disinterest, lack of concern, or limited awareness on the urgency of the need to save re-sources (financial and natural) and reduce waste;
• Limited information on the subject of EE and the measures to be taken to improve it;• Perception that most of the measures are difficult to implement and always entail high
costs;• Despite the return in the medium/long term, the high initial investment required by EE
measures such as the replacement of household appliances or windows is an impediment to their (full) implementation (this is easy for LED lamps because they can be purchased gradually and their price is not so high); and
• Typically, the authorisation of third parties is required to implement even moderate EE measures (decision-making process); for example, the replacement of windows or the in-stallation of solar panels must be authorised by the landlord (for tenants) or by two-thirds of the joint owners in the case of condominiums, which comes along with bureaucracy.
Additionally, factors such as the income level of the household or the age and education level of its representatives might also hamper the implementation of EE measures in the residential sector, which are more frequent in households with high incomes and/or younger representa-tives who predominantly need more efficient solutions of which they are aware due to progress-ing debates on climate change. Thus, one can infer that low incomes and elderly tenants/owners are limiting the full development of the EE potential in private residences. As already mentioned, a financing mechanism providing up-front money could partially solve this issue.
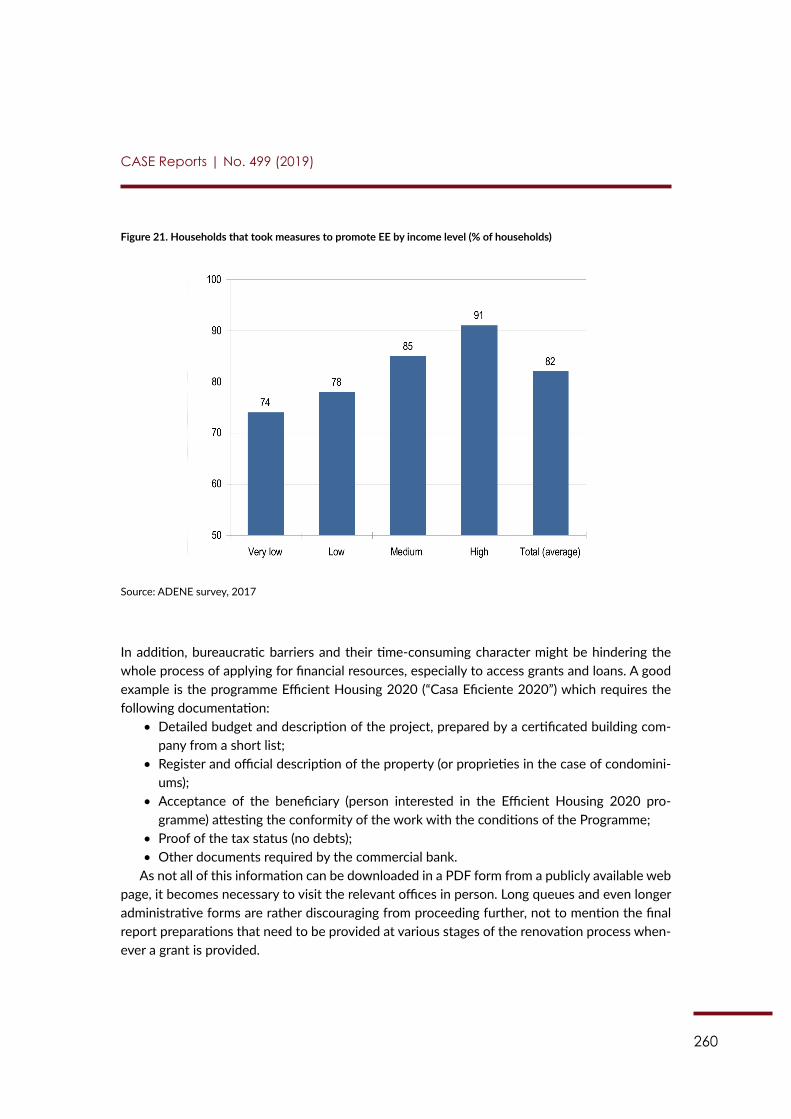
260
CASE Reports | No. 499 (2019)
Figure 21. Households that took measures to promote EE by income level (% of households)
Source: ADENE survey, 2017
In addition, bureaucratic barriers and their time-consuming character might be hindering the whole process of applying for financial resources, especially to access grants and loans. A good example is the programme Efficient Housing 2020 (“Casa Eficiente 2020”) which requires the following documentation:
• Detailed budget and description of the project, prepared by a certificated building com-pany from a short list;
• Register and official description of the property (or proprieties in the case of condomini-ums);
• Acceptance of the beneficiary (person interested in the Efficient Housing 2020 pro-gramme) attesting the conformity of the work with the conditions of the Programme;
• Proof of the tax status (no debts);• Other documents required by the commercial bank.
As not all of this information can be downloaded in a PDF form from a publicly available web page, it becomes necessary to visit the relevant offices in person. Long queues and even longer administrative forms are rather discouraging from proceeding further, not to mention the final report preparations that need to be provided at various stages of the renovation process when-ever a grant is provided.
261
CASE Reports | No. 499 (2019)
Concerning the Financial Instrument for Urban Rehabilitation (IFRRU 2020), which is a spe-cial loan scheme to retrofit whole buildings (see details below), the documentation is far more complex and includes, in addition to the previous requirements:
• Assessment of the municipality that attests the appropriateness and coherence of the project with the local Action Plan for Urban Rehabilitation (PARU);
• Energy certificate (before and after the intervention);• Archeologic study;• Three alternative budgets for the project (from different building companies);• Financial feasibility or cost-benefit study; and• Business plan.
Moreover, apart from small renovation endeavours, a building licence for more serious retro-fits are needed. Obtaining one usually involves hiring an architect and makes the whole process of modernisation longer. Overall, these requirements can be difficult to obtain or take a lot of time to be delivered by the official bodies. Therefore, many candidates cease or delay the retrofit investments.
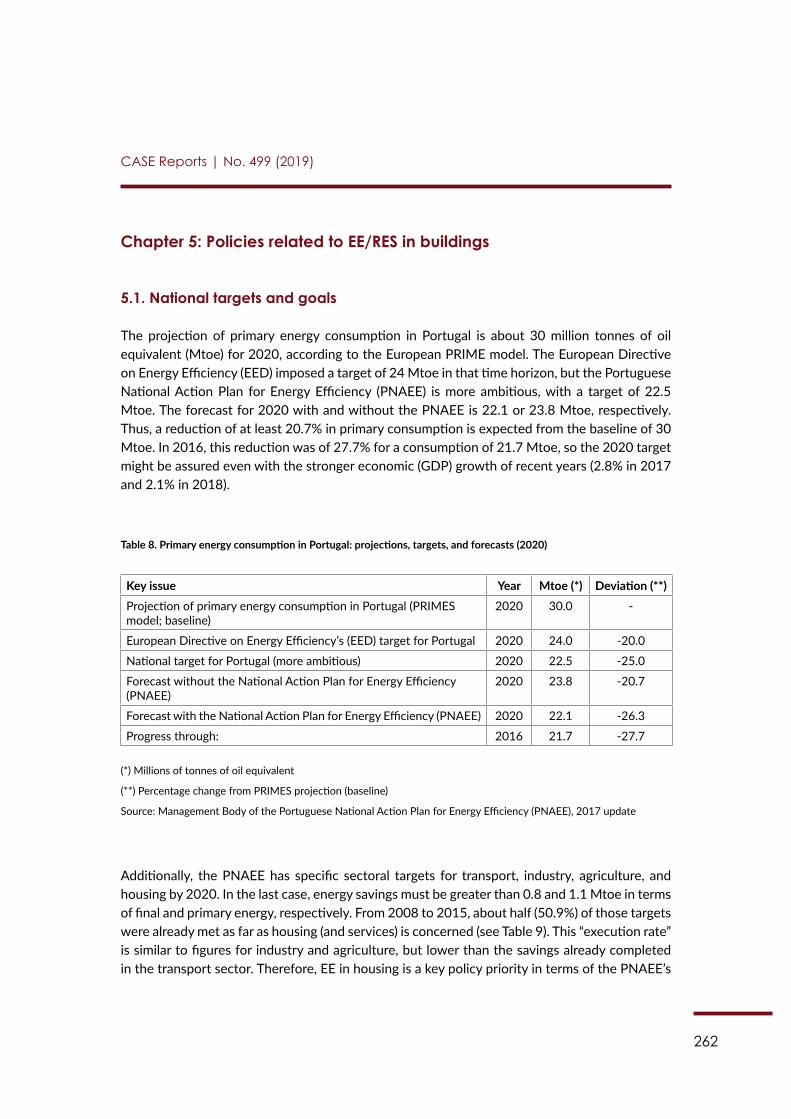
262
CASE Reports | No. 499 (2019)
Chapter 5: Policies related to EE/RES in buildings
5.1. National targets and goals
The projection of primary energy consumption in Portugal is about 30 million tonnes of oil equivalent (Mtoe) for 2020, according to the European PRIME model. The European Directive on Energy Efficiency (EED) imposed a target of 24 Mtoe in that time horizon, but the Portuguese National Action Plan for Energy Efficiency (PNAEE) is more ambitious, with a target of 22.5 Mtoe. The forecast for 2020 with and without the PNAEE is 22.1 or 23.8 Mtoe, respectively. Thus, a reduction of at least 20.7% in primary consumption is expected from the baseline of 30 Mtoe. In 2016, this reduction was of 27.7% for a consumption of 21.7 Mtoe, so the 2020 target might be assured even with the stronger economic (GDP) growth of recent years (2.8% in 2017 and 2.1% in 2018).
Table 8. Primary energy consumption in Portugal: projections, targets, and forecasts (2020)
Key issue Year Mtoe (*) Deviation (**)Projection of primary energy consumption in Portugal (PRIMES model; baseline)
2020 30.0 -
European Directive on Energy Efficiency’s (EED) target for Portugal 2020 24.0 -20.0
National target for Portugal (more ambitious) 2020 22.5 -25.0
Forecast without the National Action Plan for Energy Efficiency (PNAEE)
2020 23.8 -20.7
Forecast with the National Action Plan for Energy Efficiency (PNAEE) 2020 22.1 -26.3
Progress through: 2016 21.7 -27.7
(*) Millions of tonnes of oil equivalent
(**) Percentage change from PRIMES projection (baseline)
Source: Management Body of the Portuguese National Action Plan for Energy Efficiency (PNAEE), 2017 update
Additionally, the PNAEE has specific sectoral targets for transport, industry, agriculture, and housing by 2020. In the last case, energy savings must be greater than 0.8 and 1.1 Mtoe in terms of final and primary energy, respectively. From 2008 to 2015, about half (50.9%) of those targets were already met as far as housing (and services) is concerned (see Table 9). This “execution rate” is similar to figures for industry and agriculture, but lower than the savings already completed in the transport sector. Therefore, EE in housing is a key policy priority in terms of the PNAEE’s
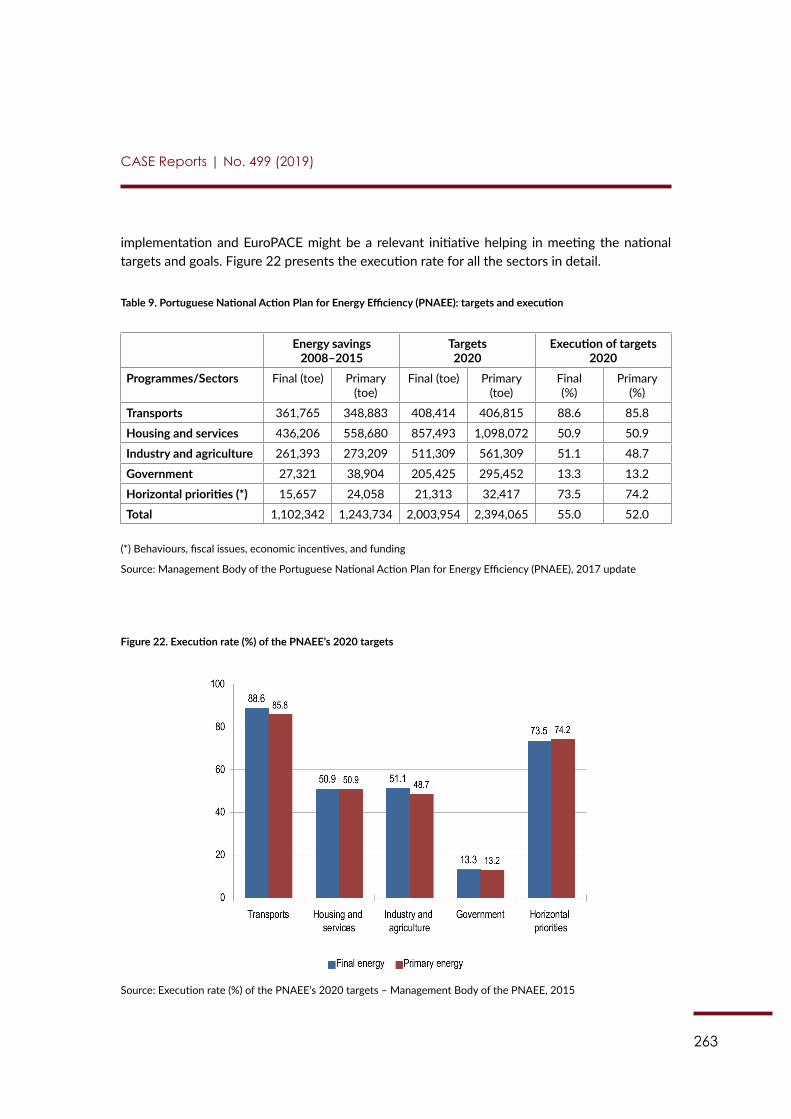
263
CASE Reports | No. 499 (2019)
implementation and EuroPACE might be a relevant initiative helping in meeting the national targets and goals. Figure 22 presents the execution rate for all the sectors in detail.
Table 9. Portuguese National Action Plan for Energy Efficiency (PNAEE): targets and execution
Energy savings 2008–2015
Targets 2020
Execution of targets 2020
Programmes/Sectors Final (toe) Primary (toe)
Final (toe) Primary (toe)
Final (%)
Primary (%)
Transports 361,765 348,883 408,414 406,815 88.6 85.8
Housing and services 436,206 558,680 857,493 1,098,072 50.9 50.9
Industry and agriculture 261,393 273,209 511,309 561,309 51.1 48.7
Government 27,321 38,904 205,425 295,452 13.3 13.2
Horizontal priorities (*) 15,657 24,058 21,313 32,417 73.5 74.2
Total 1,102,342 1,243,734 2,003,954 2,394,065 55.0 52.0
(*) Behaviours, fiscal issues, economic incentives, and funding
Source: Management Body of the Portuguese National Action Plan for Energy Efficiency (PNAEE), 2017 update
Figure 22. Execution rate (%) of the PNAEE’s 2020 targets
Source: Execution rate (%) of the PNAEE’s 2020 targets – Management Body of the PNAEE, 2015
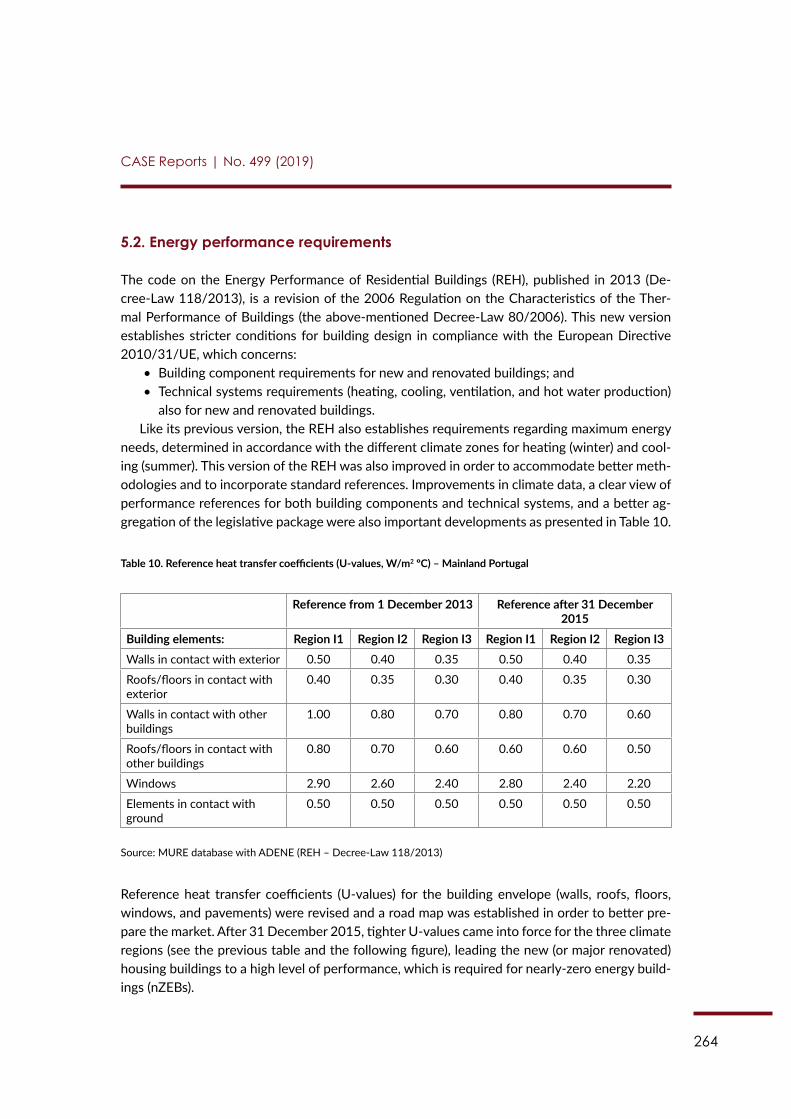
264
CASE Reports | No. 499 (2019)
5.2. Energy performance requirements
The code on the Energy Performance of Residential Buildings (REH), published in 2013 (De-cree-Law 118/2013), is a revision of the 2006 Regulation on the Characteristics of the Ther-mal Performance of Buildings (the above-mentioned Decree-Law 80/2006). This new version establishes stricter conditions for building design in compliance with the European Directive 2010/31/UE, which concerns:
• Building component requirements for new and renovated buildings; and• Technical systems requirements (heating, cooling, ventilation, and hot water production)
also for new and renovated buildings.Like its previous version, the REH also establishes requirements regarding maximum energy
needs, determined in accordance with the different climate zones for heating (winter) and cool-ing (summer). This version of the REH was also improved in order to accommodate better meth-odologies and to incorporate standard references. Improvements in climate data, a clear view of performance references for both building components and technical systems, and a better ag-gregation of the legislative package were also important developments as presented in Table 10.
Table 10. Reference heat transfer coefficients (U-values, W/m2 ºC) – Mainland Portugal
Reference from 1 December 2013 Reference after 31 December 2015
Building elements: Region I1 Region I2 Region I3 Region I1 Region I2 Region I3Walls in contact with exterior 0.50 0.40 0.35 0.50 0.40 0.35
Roofs/floors in contact with exterior
0.40 0.35 0.30 0.40 0.35 0.30
Walls in contact with other buildings
1.00 0.80 0.70 0.80 0.70 0.60
Roofs/floors in contact with other buildings
0.80 0.70 0.60 0.60 0.60 0.50
Windows 2.90 2.60 2.40 2.80 2.40 2.20
Elements in contact with ground
0.50 0.50 0.50 0.50 0.50 0.50
Source: MURE database with ADENE (REH – Decree-Law 118/2013)
Reference heat transfer coefficients (U-values) for the building envelope (walls, roofs, floors, windows, and pavements) were revised and a road map was established in order to better pre-pare the market. After 31 December 2015, tighter U-values came into force for the three climate regions (see the previous table and the following figure), leading the new (or major renovated) housing buildings to a high level of performance, which is required for nearly-zero energy build-ings (nZEBs).
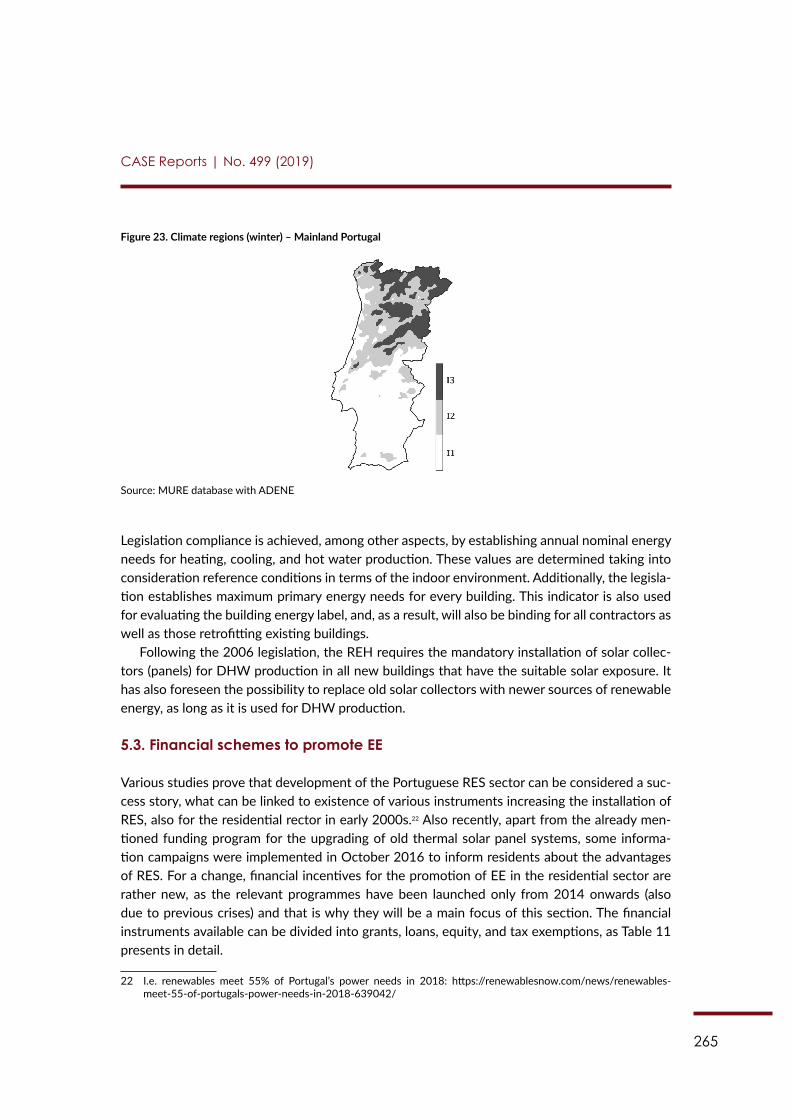
265
CASE Reports | No. 499 (2019)
Figure 23. Climate regions (winter) – Mainland Portugal
Source: MURE database with ADENE
Legislation compliance is achieved, among other aspects, by establishing annual nominal energy needs for heating, cooling, and hot water production. These values are determined taking into consideration reference conditions in terms of the indoor environment. Additionally, the legisla-tion establishes maximum primary energy needs for every building. This indicator is also used for evaluating the building energy label, and, as a result, will also be binding for all contractors as well as those retrofitting existing buildings.
Following the 2006 legislation, the REH requires the mandatory installation of solar collec-tors (panels) for DHW production in all new buildings that have the suitable solar exposure. It has also foreseen the possibility to replace old solar collectors with newer sources of renewable energy, as long as it is used for DHW production.
5.3. Financial schemes to promote EE
Various studies prove that development of the Portuguese RES sector can be considered a suc-cess story, what can be linked to existence of various instruments increasing the installation of RES, also for the residential rector in early 2000s.22 Also recently, apart from the already men-tioned funding program for the upgrading of old thermal solar panel systems, some informa-tion campaigns were implemented in October 2016 to inform residents about the advantages of RES. For a change, financial incentives for the promotion of EE in the residential sector are rather new, as the relevant programmes have been launched only from 2014 onwards (also due to previous crises) and that is why they will be a main focus of this section. The financial instruments available can be divided into grants, loans, equity, and tax exemptions, as Table 11 presents in detail.
22 I.e. renewables meet 55% of Portugal’s power needs in 2018: https://renewablesnow.com/news/renewables-meet-55-of-portugals-power-needs-in-2018-639042/
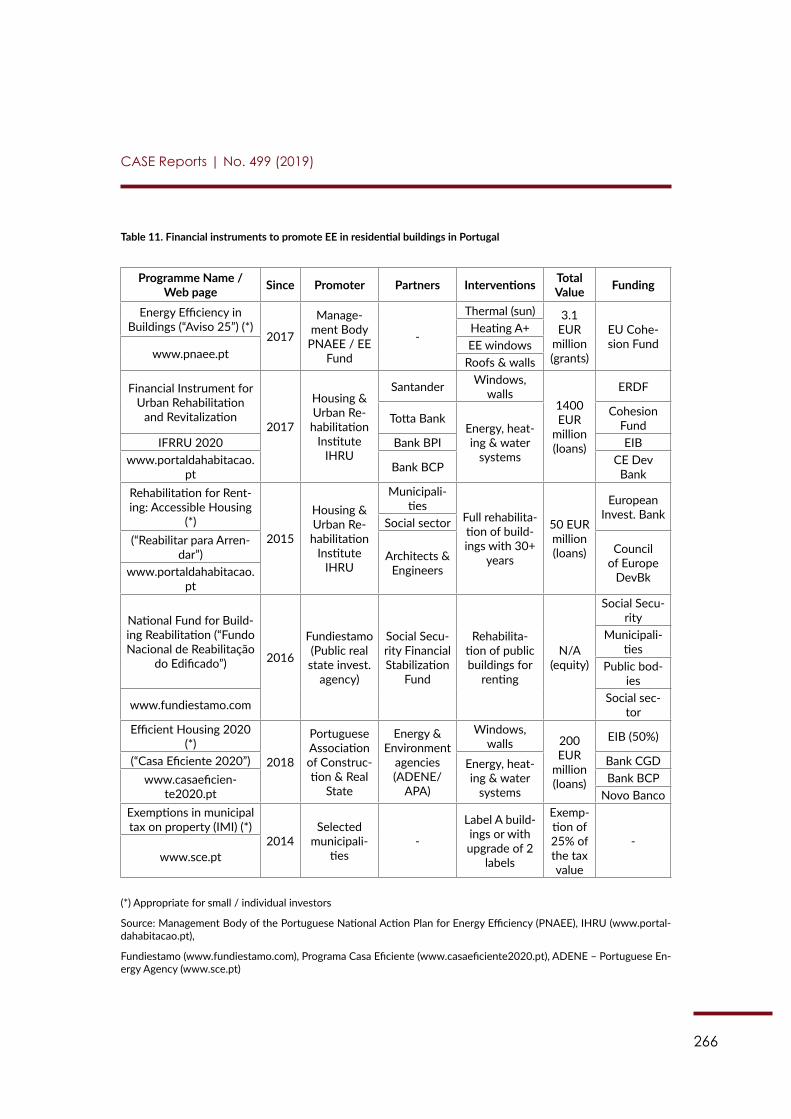
266
CASE Reports | No. 499 (2019)
Table 11. Financial instruments to promote EE in residential buildings in Portugal
Programme Name / Web page Since Promoter Partners Interventions Total
Value Funding
Energy Efficiency in Buildings (“Aviso 25”) (*)
2017
Manage-ment Body
PNAEE / EE Fund
-
Thermal (sun) 3.1 EUR
million (grants)
EU Cohe-sion Fund
Heating A+
www.pnaee.ptEE windows
Roofs & walls
Financial Instrument for Urban Rehabilitation
and Revitalization2017
Housing & Urban Re-habilitation
Institute IHRU
Santander Windows, walls
1400 EUR
million (loans)
ERDF
Totta BankEnergy, heat-ing & water
systems
Cohesion Fund
IFRRU 2020 Bank BPI EIBwww.portaldahabitacao.
pt Bank BCP CE Dev Bank
Rehabilitation for Rent-ing: Accessible Housing
(*)2015
Housing & Urban Re-habilitation
Institute IHRU
Municipali-ties
Full rehabilita-tion of build-ings with 30+
years
50 EUR million (loans)
European Invest. Bank
Social sector(“Reabilitar para Arren-
dar”) Architects & Engineers
Council of Europe
DevBkwww.portaldahabitacao.pt
National Fund for Build-ing Reabilitation (“Fundo Nacional de Reabilitação
do Edificado”) 2016
Fundiestamo (Public real state invest.
agency)
Social Secu-rity Financial Stabilization
Fund
Rehabilita-tion of public buildings for
renting
N/A (equity)
Social Secu-rity
Municipali-ties
Public bod-ies
www.fundiestamo.com Social sec-tor
Efficient Housing 2020 (*)
2018
Portuguese Association of Construc-tion & Real
State
Energy & Environment
agencies (ADENE/
APA)
Windows, walls 200
EUR million (loans)
EIB (50%)
(“Casa Eficiente 2020”) Energy, heat-ing & water
systems
Bank CGDwww.casaeficien-
te2020.ptBank BCP
Novo BancoExemptions in municipal tax on property (IMI) (*)
2014Selected
municipali-ties
-
Label A build-ings or with upgrade of 2
labels
Exemp-tion of 25% of the tax value
-www.sce.pt
(*) Appropriate for small / individual investors
Source: Management Body of the Portuguese National Action Plan for Energy Efficiency (PNAEE), IHRU (www.portal-dahabitacao.pt),
Fundiestamo (www.fundiestamo.com), Programa Casa Eficiente (www.casaeficiente2020.pt), ADENE – Portuguese En-ergy Agency (www.sce.pt)
267
CASE Reports | No. 499 (2019)
Grants are promoted on a regular (annual) basis by the Management Body of the PNAEE with the support of the EU Cohesion Funds through a special Fund for Energy Efficiency (FEE). FEE is a financial instrument capable of financing programmes and measures provided in the PNAEE in all its lines of action that are fundamental for Portugal to achieve the goals set out related to efficient energy end-use and energy services.
FEE’s last call targeting EE in buildings (“Aviso 25” or notice number 25, 2018) aims to opti-mise the conditions of use and energy consumption in the building sector. In this context, mea-sures that lead to the better energy performance of existing buildings that could contribute to the goals of the PNAEE programme or to the national goals of EE under the EED are eligible for funding, with exceptions made to all entities that are part of the public administration. The mea-sures envisaged under this call relate to solar thermal DHW, other DHW efficient equipment, the installation of efficient windows, the requalification of the envelope thermal insulation, and efficient lighting. This call was intended for small, individual investors, and owners and it was granted an overall amount of EUR 3.1 million that will be invested in retrofitting in the following years. As a result, it is difficult to assess if this type of assistance can be considered successful. Most likely, however, it could be blended with an innovative financial mechanism such as Euro-PACE – particularly for those earning below the average income.
Loans are provided by commercial banks (CGD, BCP, Novo Banco, BPI, Santander Totta) with special agreements with public bodies such as the Housing and Urban Rehabilitation Institute (IHRU) or the Portuguese Association of Construction and Real Estate (CPCI). The common goal of these agreements is to provide a premium (negative spread) in interest rate to borrowers that wish to invest in EE measures (efficient heating systems, efficient windows, or the insulation of walls and roofs).
Some loans such as the Financial Instrument for Urban Rehabilitation (IFRRU 2020) are ap-propriate for large public or private investors, but others such as Efficient Housing 2020 (“Casa Eficiente 2020”) are appropriate for owners that want to retrofit their private residences. The success of these loans is limited because interest rates are still very low in historical terms, which makes the incentives small and not very attractive for borrowers. Bureaucracy (e.g. municipal licences or assessments) is also a barrier to the effective implementation of these special loans to promote EE in housing, as described above.
An interesting instrument is the “Reabilitar para Arrendar” which provides loans co-financed by the European Investment Bank (EIB) and the Council of Europe Development Bank (CEDB) to projects concerning the full rehabilitation for the renting of buildings of 30 or more years which are located in special areas of urban rehabilitation (ARU) as defined by the municipalities. It is promoted by IHRU (which takes a fee of 0.05% of the loan value) in partnership with municipali-ties, socially focused non-government organisations (NGOs), and professional associations of architects and engineers. The total funding available in this programme is EUR 50 million since 2015. The following expenditure can be financed by “Reabilitar para Arrendar”:
• Architecture and engineering projects, geologic works, technical assistance, and project management;
• EE retrofitting investments, certifications, and supplementary studies;
268
CASE Reports | No. 499 (2019)
• Other works on roofs, walls, stairs, lifts, water, and energy grids of the building;• Selected works in each dwelling (only kitchens and bathrooms); and• VAT supported by the promoter.
Fundiestamo, the public real estate investment agency, manages the equity fund National Fund for Building Rehabilitation (FNRE). It covers only public buildings that can be attached to the fund in exchange for financing for rehabilitation, including retrofitting. The Fund FNRE is co-financed by the Portuguese Social Security Stabilization Fund.
Finally, tax exemptions are available in selected municipalities for label A/A+ buildings or with a recent upgrade of two labels, for example, from D to B- or B. These exemptions are up to 25% of the regular value of municipal tax on property (IMI) and are granted for five years. In Lisbon, the exemption is only of 15% and was introduced recently (2018). In order to be granted for exemption with this bonus, the property owner must prove the A/A+ label of their house to the local tax office. We can estimate that the EuroPACE scheme could be partially financed by a surcharge on the IMI, say 0.05% of the value of each urban property,23 for municipalities that would join the initiative, thus making it less expensive for the interested homeowners.
23 The regular IMI tax rates are 0.8% for rural property and range from 0.3% to 0.45% for urban property. For instance, in Lisbon, it is 0.3%.
269
CASE Reports | No. 499 (2019)
Conclusion
In Portugal, the market potential for EuroPACE is quite large in the sense that the majority of the buildings (3 million out of 3.5 million) are single-family houses (villas). This feature is related to the rural settlement of large proportions of the territory, namely the tradition and preference of living in a single-family building and with the relative importance of seasonal/secondary dwell-ings (19% of total), primarily along the coast (Atlantic Ocean). Thus, the decision-making process concerned with retrofitting might be facilitated in these cases (single-family houses), noting that a majority of owners (two-thirds) is necessary to approve the same kind of works in multi-family buildings. For example, in condominiums with dozens of private dwellings, the investment in the common parts of each building (e.g. exterior walls/envelope and roofs) must be approved in advance through a voting process, which could make the adoption of EE measures very diffi-cult. This problem might be more acute in the Lisbon metropolitan area, namely in its periphery, where large blocks of private-owned flats are common.
Another characteristic of the Portuguese building stock that can facilitate the adoption of the EuroPACE scheme is the relatively large share of privately owned dwellings, while renting covers less than 25% of the permanent housing, which is a rather modest figure that favours EuroPACE implementation, when compared to Germany for example. Unfortunately, the large share of buildings inhabited by owners with outstanding loans and mortgages seriously weakens this favourability. This is particularly relevant as Portugal is one of the poorest countries in the EU, and this is reflected in the low household saving rates.
On a different note, even the share of unoccupied or empty dwellings (12.5% of total) – an-other key feature of the Portuguese building stock – can be seen as an opportunity EuroPACE development, as they can be retrofit after first residences have been completed either to rein-force the market attractiveness of these assets (concerning empty dwellings to sell or rent) or to fully rehabilitate dwellings or even entire buildings over 30+ year old.
Additionally, about 30% of the buildings in Portugal have significant needs of repair concern-ing the roof, walls, and/or windows. In fact, average U-values are always greater in Portugal than in other EU countries, namely for the residential buildings’ envelope, walls, floors, roofs, and windows. The need for other energy related improvements is equally significant and the fact that sufficient legal protections are in place for a mandatory warranty on works undertaken for up to 5 years is a tremendous benefit for those interested in more EE appliances. Thus, the need to retrofit might be severe in Portugal, especially as far as old buildings are concerned.
At the same time, a recent survey conducted by the Portuguese Energy Agency (ADENE) found that homeowners are particularly troubled with the financial costs of the energy ineffi-ciency of the dwellings. It has been also found that the average expenditure for utilities includ-ing energy (electricity and gas) is about 20% of the minimum monthly income in Portugal. There-fore, an up-front financing scheme such as EuroPACE that can facilitate the retrofit investment and its phased payment along the housing lifetime might be welcome, particularly if EuroPACE is blended with other non-repayable financial assistance.
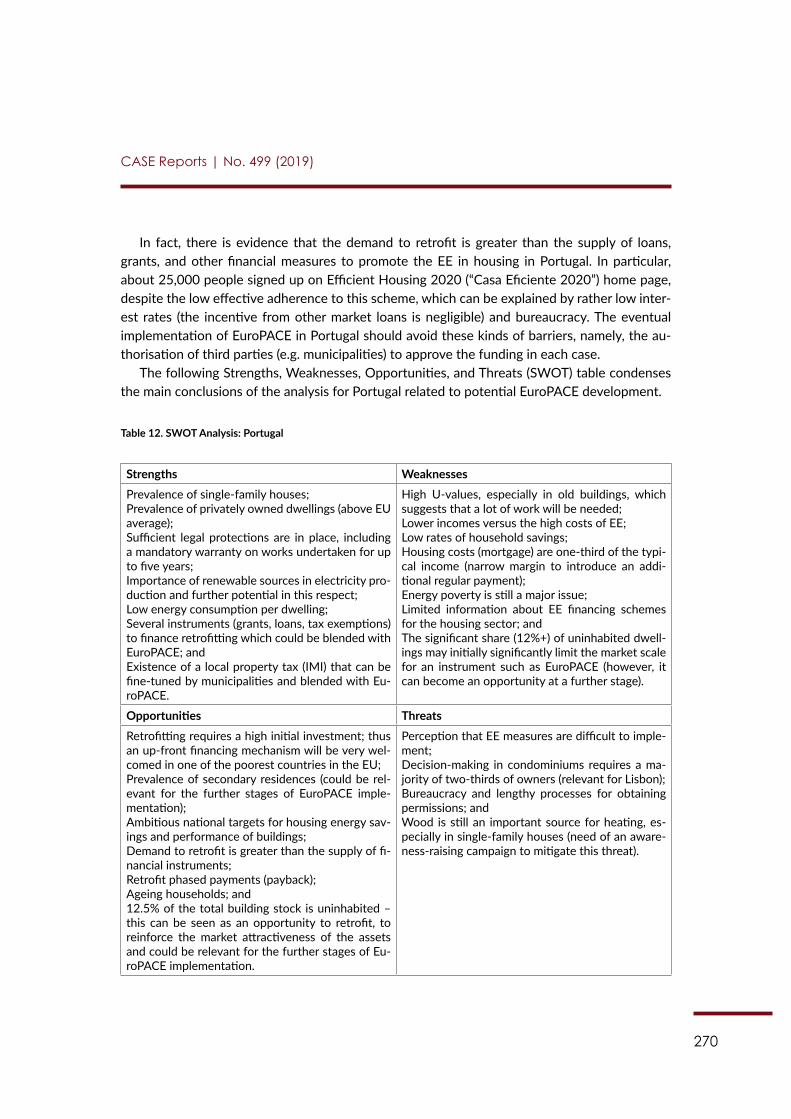
270
CASE Reports | No. 499 (2019)
In fact, there is evidence that the demand to retrofit is greater than the supply of loans, grants, and other financial measures to promote the EE in housing in Portugal. In particular, about 25,000 people signed up on Efficient Housing 2020 (“Casa Eficiente 2020”) home page, despite the low effective adherence to this scheme, which can be explained by rather low inter-est rates (the incentive from other market loans is negligible) and bureaucracy. The eventual implementation of EuroPACE in Portugal should avoid these kinds of barriers, namely, the au-thorisation of third parties (e.g. municipalities) to approve the funding in each case.
The following Strengths, Weaknesses, Opportunities, and Threats (SWOT) table condenses the main conclusions of the analysis for Portugal related to potential EuroPACE development.
Table 12. SWOT Analysis: Portugal
Strengths WeaknessesPrevalence of single-family houses;Prevalence of privately owned dwellings (above EU average);Sufficient legal protections are in place, including a mandatory warranty on works undertaken for up to five years;Importance of renewable sources in electricity pro-duction and further potential in this respect;Low energy consumption per dwelling;Several instruments (grants, loans, tax exemptions) to finance retrofitting which could be blended with EuroPACE; andExistence of a local property tax (IMI) that can be fine-tuned by municipalities and blended with Eu-roPACE.
High U-values, especially in old buildings, which suggests that a lot of work will be needed;Lower incomes versus the high costs of EE;Low rates of household savings;Housing costs (mortgage) are one-third of the typi-cal income (narrow margin to introduce an addi-tional regular payment);Energy poverty is still a major issue;Limited information about EE financing schemes for the housing sector; andThe significant share (12%+) of uninhabited dwell-ings may initially significantly limit the market scale for an instrument such as EuroPACE (however, it can become an opportunity at a further stage).
Opportunities ThreatsRetrofitting requires a high initial investment; thus an up-front financing mechanism will be very wel-comed in one of the poorest countries in the EU;Prevalence of secondary residences (could be rel-evant for the further stages of EuroPACE imple-mentation);Ambitious national targets for housing energy sav-ings and performance of buildings;Demand to retrofit is greater than the supply of fi-nancial instruments;Retrofit phased payments (payback);Ageing households; and12.5% of the total building stock is uninhabited – this can be seen as an opportunity to retrofit, to reinforce the market attractiveness of the assets and could be relevant for the further stages of Eu-roPACE implementation.
Perception that EE measures are difficult to imple-ment;Decision-making in condominiums requires a ma-jority of two-thirds of owners (relevant for Lisbon);Bureaucracy and lengthy processes for obtaining permissions; andWood is still an important source for heating, es-pecially in single-family houses (need of an aware-ness-raising campaign to mitigate this threat).
271
CASE Reports | No. 499 (2019)
References
EDP – Energy Portugal. URL: https://www.edp.pt/particulares/
Efficient Housing 2020. URL: http://www.casaeficiente2020.pt
European Commission – EU Buildings Database. URL: https://ec.europa.eu/energy/en/eubuil-dings
European Union Energy Poverty Observatory. URL: https://www.energypoverty.eu
Eurostat – Electricity price statistics 2007-2018. URL: https://ec.europa.eu/eurostat/statistics--explained/index.php/Electricity_price_statistics
Eurostat – EU survey on income and living conditions (EU-SILC) 2017. URL: https://ec.europa.eu/eurostat/statistics-explained/index.php?title=People_in_the_EU_-_statistics_on_house-hold_and_family_structures
Factsheet: Portugal. Current use of EPCs and potential links to iBRoad (2018), p. 1., available at: http://ibroad-project.eu/wp-content/uploads/2018/01/iBROAD_CountryFactsheet_PORTU-GAL.pdf
Fundiestamo – Public Real Estate Investment Agency – National Fund for Building Rehabilita-tion. URL: http://www.fundiestamo.com
Housing and Urban Rehabilitation Institute (IHRU). URL: http://www.portaldahabitacao.pt
Management Body of the Portuguese National Action Plan for Energy Efficiency (PNAEE). URL: http://www.pnaee.pt
Odyssee-Mure databases. URL: http://www.odyssee-mure.eu
Portas, N., Domingues, A., & Cabral, J. (2003). Políticas Urbanas: Tendências, estratégias e opor-tunidades. Fundação Calouste Gulbenkian.
Portuguese Energy Agency (ADENE). URL: https://www.adene.pt
Portuguese Energy Agency (ADENE) – Energy Certification of Buildings. URL: https://www.sce.pt

272
CASE Reports | No. 499 (2019)
Portuguese Energy Agency (ADENE) and Consulmark – Survey about EE in Housing, based on 1300 interviews. URL: https://www.adene.pt/edificios/
Silva, B. (2018). Certificado energético pode valer mais 10% no valor da casa. Dinheiro Vivo. URL: https://www.dinheirovivo.pt/economia/certificado-energetico-pode-valer-mais-10-no-valor-da-casa/
Statistics Portugal (INE) – GDP per capita. URL: https://www.ine.pt
Statistics Portugal (INE) – Population and Housing Census 2011. URL: https://www.ine.pt
Zebra2020 data tool. URL: http://www.zebra-monitoring.enerdata.eu
273
Author: Dr. Ramona Mara
Contents
Acronyms ....................................................................................................................................275
Introduction ...............................................................................................................................276
Chapter 1: Social and economic conditions of households ............................................2771.1. Number of households and dwellings......................................................................277
1.2. Households size and structure ..................................................................................278
1.3. Distribution of households, urban versus rural .....................................................279
1.4. Income level ...................................................................................................................280
Chapter 2: Building characteristics and ownership ..........................................................2832.1. Type of buildings ...........................................................................................................283
2.2. Multifamily buildings and condominium characteristics ....................................285
2.3. Rented and owned private buildings ........................................................................286
2.4. Distribution of the building stock by age, specifically for private residential buildings .........................................................................................287
2.5. Rate of newly constructed buildings, percentage of buildings demolished and buildings renovated ...............................................................................287
Chapter 3: Energy consumption in private residential buildings and type of EE/RES investments ..........................................................................................290
3.1. Characteristics of the building stock ........................................................................290
3.2. Detailed breakdown of the energy consumption in buildings ..........................291
3.3. Breakdown in terms of energy use ...........................................................................292
3.4. Trends in energy consumption in private residential buildings ..........................293
3.5. Energy prices for households, including energy subsidies ..................................294
3.6. Type of EE/RES investments ......................................................................................295
3.7. Energy poverty ..............................................................................................................296
EuroPACE Market Analysis: Romania
274
CASE Reports | No. 499 (2019)
Chapter 4: Barriers to develop the EE/RES potential in private buildings ..................2984.1. Types of barriers ..........................................................................................................298
4.2. Lack of market push for EE investments ................................................................298
4.3. Social perception .........................................................................................................299
Chapter 5: Policies related to EE/RES in buildings ...........................................................3005.1. Transposition of the European Directive on Energy Performance in Buildings and other EU legislation related to EE/RES in buildings .......................300
5.2. Policy objectives in terms of building renovation .................................................300
5.3. Other legal developments in the area of energy performance in buildings and use of RES in buildings ..........................................................................301
5.4. Economic incentives ....................................................................................................301
5.5. Policies to support households in energy poverty situation ...............................303
5.6. Other policy developments ........................................................................................303
5.7. Initiatives at local level to promote EE/RES in private buildings .......................303
Conclusions ................................................................................................................................306
References ..................................................................................................................................308Legislation ..............................................................................................................................310
Websites .................................................................................................................................312
Annex ..........................................................................................................................................315

275
CASE Reports | No. 499 (2019)
Acronyms
ANRE National Authority for Regulations in the Energy fieldEC European CommissionEE Energy EfficiencyEPC Energy Performance CertificateEPOV EU Energy Poverty ObservatoryEU European UnionHOA Homeowners Associations kOe Kilogram of Oil EquivalentMS Member State(s)NEEAP National Energy Efficiency Action Plan(s)pp Percentage PointRCLPP Reinforced-Concrete Large Prefabricated PanelsRES Renewable Energy SourcesSEAP Sustainable Energy Action Plan(s)SWOT Strengths, Weaknesses, Opportunities, Threats (table)WB World Bank
276
CASE Reports | No. 499 (2019)
Introduction
An extensive analysis of the state of housing stock from Romania concerning the possibility to implement EuroPACE – a home-based financing for energy efficiency (EE) and renewable energy sources (RES) in private residential buildings is realised in this study. In this regard, we attempt to identify the strengths and weaknesses of the Romanian market’s building sector. It is important to have a holistic and up-to-date view, and, for this reason, this analysis will be conducted start-ing from 2010.
This report provides a brief overview of the building policy frameworks in Romania in order to identify the possibility to develop innovative solutions to finance improvements in the energy performance of the building stock. Initially, we will consider the results obtained to-date, even though they are not very significant. Less than 1% of the total dwellings were renovated with the aim to increase EE during 2009-2017.
The study is organised as follows: Chapter 1 provides a short analysis of Romanian house-holds from social and economic perspectives, highlighting the likeliness of households to be ac-tive actors involved in the thermal rehabilitation of their homes and aware of the future benefits, especially in regard to financial benefits (lower energy bills) and increased comfort of living.
Chapter 2 is more technical and provides a general overview of the building stock in recent years. A significant share of buildings can be considered old, and, as it has been built prior to the 1990s before any EE-related standards and norms were in place, it currently suffers from degradation. Along these lines, Chapter 3 provides a short analysis of energy consumption in the residential building sector in Romania in order to identify its evolution over the past few years.
Chapter 4 presents the most significant barriers in increasing EE and building retrofits for private residential buildings. It can be concluded that in Romania, the thermal rehabilitation of residential buildings is challenging because the government and public authorities are unable to provide the necessary funds, and the legislative framework has created an excessive bureau-cracy that has discouraged both owners and builders.
Chapter 5 provides an overview of Romania’s EE legislation concerning residential buildings starting with the transposition of the European directives in the national legislation. The impact of the most important legislative measures on EE through national energy plans follows. Accord-ing to data provided by Minister of Regional Development and Public Administration, 62,559 apartments in blocks of flats were rehabilitated based on funds from state and local budgets (public funds covered 80% of the value of thermal rehabilitation contracts) between 2009 and 2016.1
Concise concluding remarks are given at the end of the report. Additionally, a strengths, weaknesses, opportunities, and threats (SWOT) table presents the key characteristics of the Romanian housing sector relevant to determining the feasibility of implementing a home-based financing scheme – such as that proposed by EuroPACE – in Romania.
1 Ministerul Dezvoltării Regionale, Administraţiei Publice şi Fondurilor Europene – MDRAP (2017), “Strategia pentru mobilizarea investiţiilor în renovarea fondului de clădiri rezidenţiale şi comerciale, atât publice cât şi private, ex-istente la nivel national”, p. 23, available at: http://www.mdrap.ro/userfiles/Strategie_renovare_cladiri_2017%20final_23octombrie2017.pdf
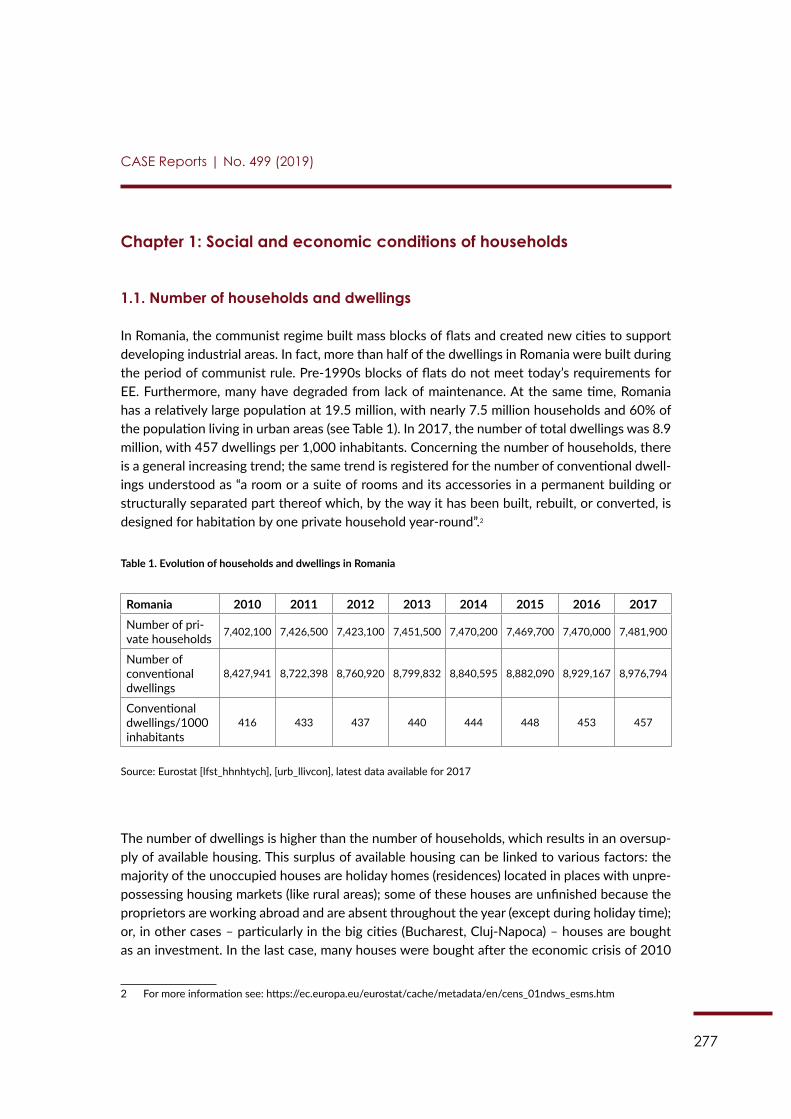
277
CASE Reports | No. 499 (2019)
Chapter 1: Social and economic conditions of households
1.1. Number of households and dwellings
In Romania, the communist regime built mass blocks of flats and created new cities to support developing industrial areas. In fact, more than half of the dwellings in Romania were built during the period of communist rule. Pre-1990s blocks of flats do not meet today’s requirements for EE. Furthermore, many have degraded from lack of maintenance. At the same time, Romania has a relatively large population at 19.5 million, with nearly 7.5 million households and 60% of the population living in urban areas (see Table 1). In 2017, the number of total dwellings was 8.9 million, with 457 dwellings per 1,000 inhabitants. Concerning the number of households, there is a general increasing trend; the same trend is registered for the number of conventional dwell-ings understood as “a room or a suite of rooms and its accessories in a permanent building or structurally separated part thereof which, by the way it has been built, rebuilt, or converted, is designed for habitation by one private household year-round”.2
Table 1. Evolution of households and dwellings in Romania
Romania 2010 2011 2012 2013 2014 2015 2016 2017Number of pri-vate households 7,402,100 7,426,500 7,423,100 7,451,500 7,470,200 7,469,700 7,470,000 7,481,900
Number of conventional dwellings
8,427,941 8,722,398 8,760,920 8,799,832 8,840,595 8,882,090 8,929,167 8,976,794
Conventional dwellings/1000 inhabitants
416 433 437 440 444 448 453 457
Source: Eurostat [lfst_hhnhtych], [urb_llivcon], latest data available for 2017
The number of dwellings is higher than the number of households, which results in an oversup-ply of available housing. This surplus of available housing can be linked to various factors: the majority of the unoccupied houses are holiday homes (residences) located in places with unpre-possessing housing markets (like rural areas); some of these houses are unfinished because the proprietors are working abroad and are absent throughout the year (except during holiday time); or, in other cases – particularly in the big cities (Bucharest, Cluj-Napoca) – houses are bought as an investment. In the last case, many houses were bought after the economic crisis of 2010
2 For more information see: https://ec.europa.eu/eurostat/cache/metadata/en/cens_01ndws_esms.htm
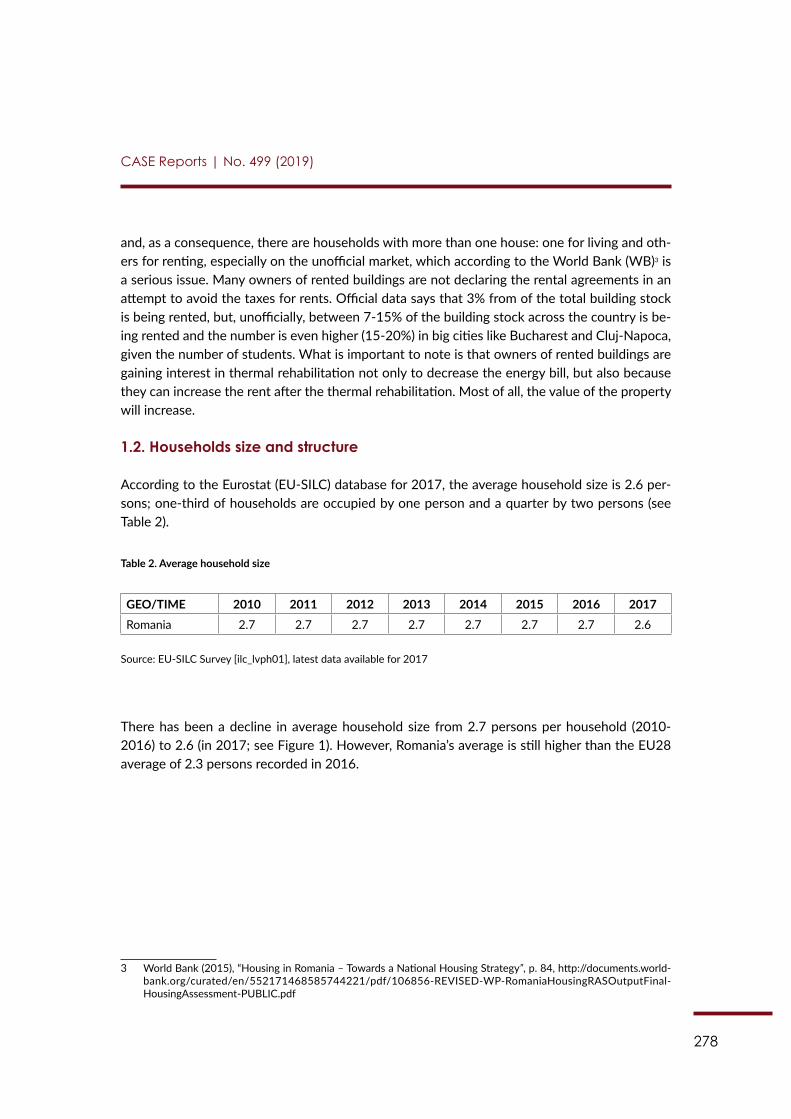
278
CASE Reports | No. 499 (2019)
and, as a consequence, there are households with more than one house: one for living and oth-ers for renting, especially on the unofficial market, which according to the World Bank (WB)3 is a serious issue. Many owners of rented buildings are not declaring the rental agreements in an attempt to avoid the taxes for rents. Official data says that 3% from of the total building stock is being rented, but, unofficially, between 7-15% of the building stock across the country is be-ing rented and the number is even higher (15-20%) in big cities like Bucharest and Cluj-Napoca, given the number of students. What is important to note is that owners of rented buildings are gaining interest in thermal rehabilitation not only to decrease the energy bill, but also because they can increase the rent after the thermal rehabilitation. Most of all, the value of the property will increase.
1.2. Households size and structure
According to the Eurostat (EU-SILC) database for 2017, the average household size is 2.6 per-sons; one-third of households are occupied by one person and a quarter by two persons (see Table 2).
Table 2. Average household size
GEO/TIME 2010 2011 2012 2013 2014 2015 2016 2017Romania 2.7 2.7 2.7 2.7 2.7 2.7 2.7 2.6
Source: EU-SILC Survey [ilc_lvph01], latest data available for 2017
There has been a decline in average household size from 2.7 persons per household (2010-2016) to 2.6 (in 2017; see Figure 1). However, Romania’s average is still higher than the EU28 average of 2.3 persons recorded in 2016.
3 World Bank (2015), “Housing in Romania – Towards a National Housing Strategy”, p. 84, http://documents.world-bank.org/curated/en/552171468585744221/pdf/106856-REVISED-WP-RomaniaHousingRASOutputFinal-HousingAssessment-PUBLIC.pdf
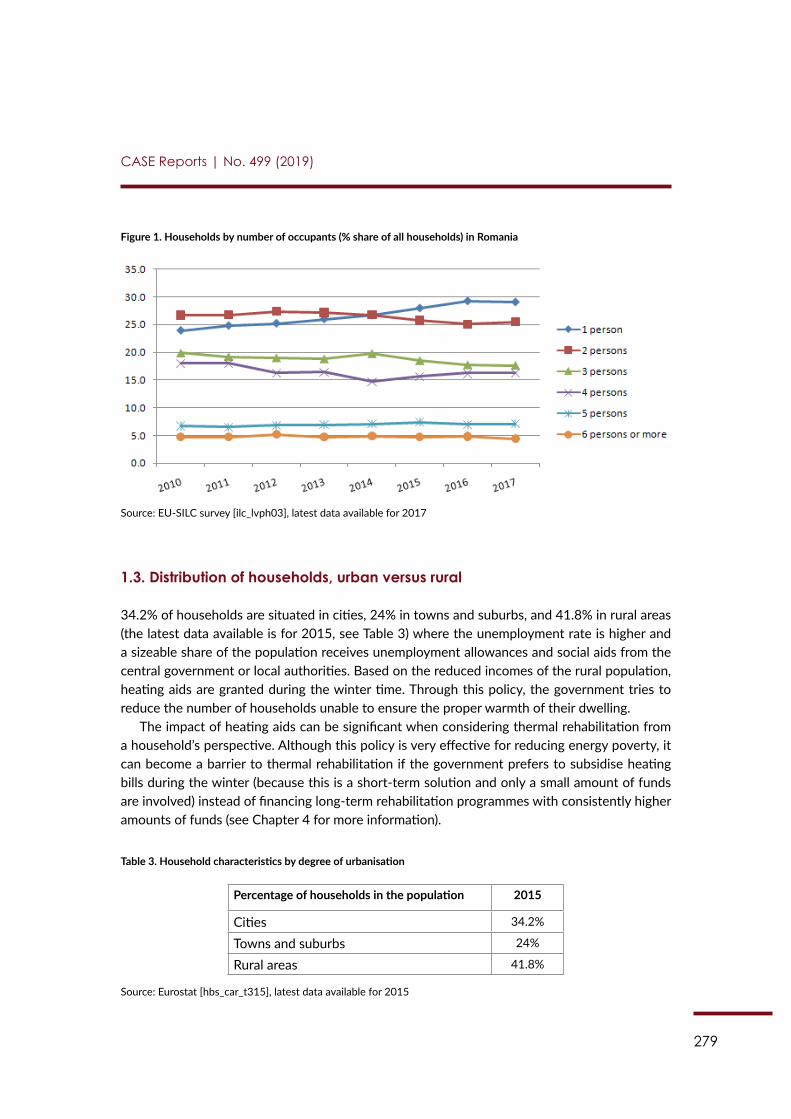
279
CASE Reports | No. 499 (2019)
Figure 1. Households by number of occupants (% share of all households) in Romania
Source: EU-SILC survey [ilc_lvph03], latest data available for 2017
1.3. Distribution of households, urban versus rural
34.2% of households are situated in cities, 24% in towns and suburbs, and 41.8% in rural areas (the latest data available is for 2015, see Table 3) where the unemployment rate is higher and a sizeable share of the population receives unemployment allowances and social aids from the central government or local authorities. Based on the reduced incomes of the rural population, heating aids are granted during the winter time. Through this policy, the government tries to reduce the number of households unable to ensure the proper warmth of their dwelling.
The impact of heating aids can be significant when considering thermal rehabilitation from a household’s perspective. Although this policy is very effective for reducing energy poverty, it can become a barrier to thermal rehabilitation if the government prefers to subsidise heating bills during the winter (because this is a short-term solution and only a small amount of funds are involved) instead of financing long-term rehabilitation programmes with consistently higher amounts of funds (see Chapter 4 for more information).
Table 3. Household characteristics by degree of urbanisation
Percentage of households in the population 2015
Cities 34.2%
Towns and suburbs 24%
Rural areas 41.8%
Source: Eurostat [hbs_car_t315], latest data available for 2015
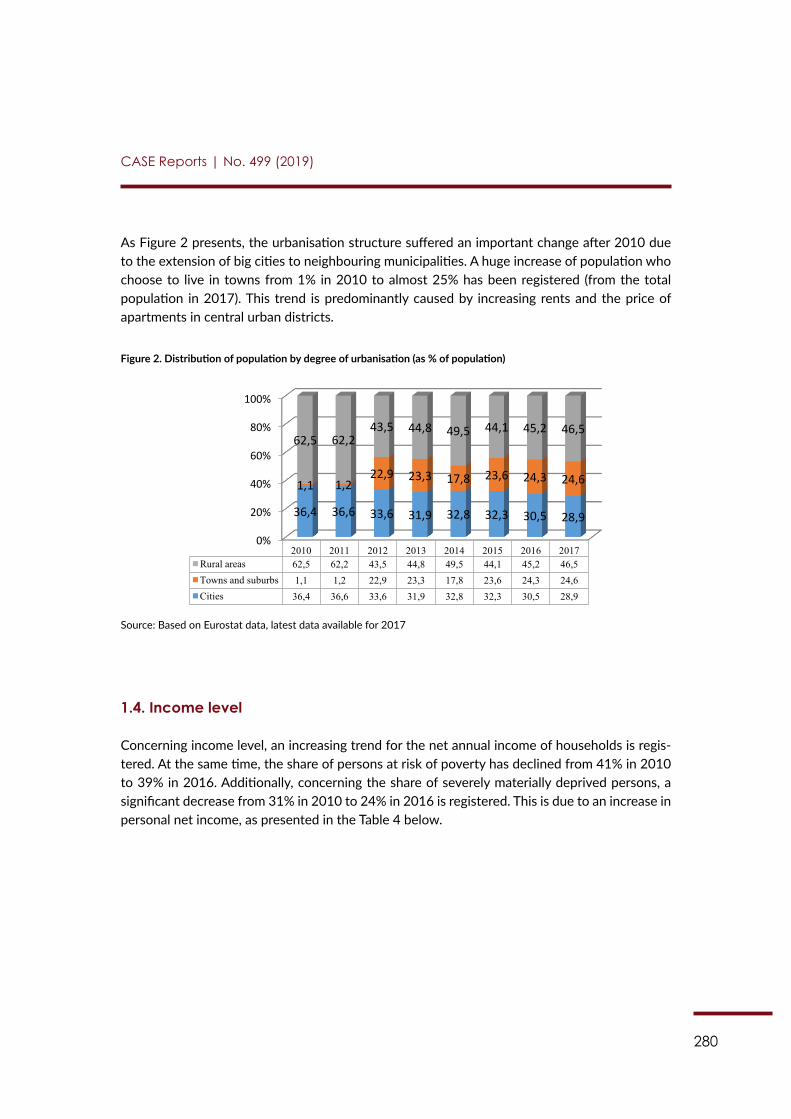
280
CASE Reports | No. 499 (2019)
As Figure 2 presents, the urbanisation structure suffered an important change after 2010 due to the extension of big cities to neighbouring municipalities. A huge increase of population who choose to live in towns from 1% in 2010 to almost 25% has been registered (from the total population in 2017). This trend is predominantly caused by increasing rents and the price of apartments in central urban districts.
Figure 2. Distribution of population by degree of urbanisation (as % of population)
233
in towns from 1% in 2010 to almost 25% has been registered (from the total population in 2017). This trend is predominantly caused by increasing rents and the price of apartments in central urban districts.
Figure 2. Distribution of population by degree of urbanisation (as % of population)
Source: Based on Eurostat data, latest data available for 2017
1.4. Income level
Concerning income level, an increasing trend for the net annual income of households is registered. At the same time, the share of persons at risk of poverty has declined from 41% in 2010 to 39% in 2016. Additionally, concerning the share of severely materially deprived persons, a significant decrease from 31% in 2010 to 24% in 2016 is registered. This is due to an increase in personal net income, as presented in the Table 4 below.
Table 4. Living conditions – functional urban areas Romania 2010 2011 2012 2013 2014 2015 2016 2017 Private
households353 7,402,227 7,426,797 7,423,550
7,451,658 7,470,429 7,470,429 Population
living in private
households
21,336,135
21,286,131 19,923,765 19,859,437 Number of
total dwellings 8,427,941 8,722,398 8,506,357
8,799,832 8,840,595 8,882,090 8,929,167 8,976,794 Households owning their own dwelling 7,079,412 7,084,353 7,097,218
Median disposable
annual household
income - EUR 15,516.00 16,168.00 16,042.00
: : 16,544.00 17,161.00
353 Private households (excluding institutional households). Collective households or institutional households (as opposed to private households) are, for instance: hospitals, old people’s homes, residential homes, prisons, military barracks, religious institutions, or boarding houses and workers’ hostels, among others. https://ec.europa.eu/eurostat/statistics-explained/index.php/Glossary:Household_-_social_statistics
0%
20%
40%
60%
80%
100%
2010 2011 2012 2013 2014 2015 2016 2017 Rural areas 62,5 62,2 43,5 44,8 49,5 44,1 45,2 46,5 Towns and suburbs 1,1 1,2 22,9 23,3 17,8 23,6 24,3 24,6 Cities 36,4 36,6 33,6 31,9 32,8 32,3 30,5 28,9
36,4 36,6 33,6 31,9 32,8 32,3 30,5 28,9
1,1 1,2 22,9 23,3 17,8 23,6 24,3 24,6
62,5 62,2 43,5 44,8 49,5 44,1 45,2 46,5
Source: Based on Eurostat data, latest data available for 2017
1.4. Income level
Concerning income level, an increasing trend for the net annual income of households is regis-tered. At the same time, the share of persons at risk of poverty has declined from 41% in 2010 to 39% in 2016. Additionally, concerning the share of severely materially deprived persons, a significant decrease from 31% in 2010 to 24% in 2016 is registered. This is due to an increase in personal net income, as presented in the Table 4 below.
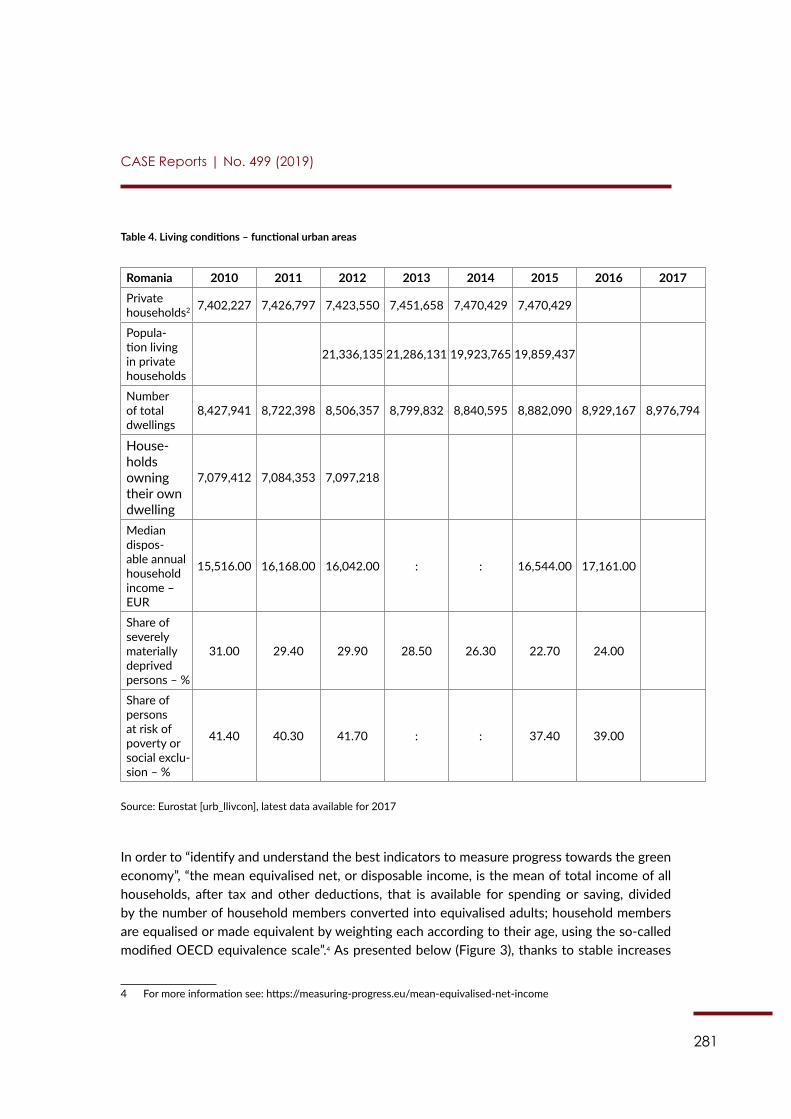
281
CASE Reports | No. 499 (2019)
Table 4. Living conditions – functional urban areas
Romania 2010 2011 2012 2013 2014 2015 2016 2017Private households2 7,402,227 7,426,797 7,423,550 7,451,658 7,470,429 7,470,429
Popula-tion living in private households
21,336,135 21,286,131 19,923,765 19,859,437
Number of total dwellings
8,427,941 8,722,398 8,506,357 8,799,832 8,840,595 8,882,090 8,929,167 8,976,794
House-holds owning their own dwelling
7,079,412 7,084,353 7,097,218
Median dispos-able annual household income – EUR
15,516.00 16,168.00 16,042.00 : : 16,544.00 17,161.00
Share of severely materially deprived persons – %
31.00 29.40 29.90 28.50 26.30 22.70 24.00
Share of persons at risk of poverty or social exclu-sion – %
41.40 40.30 41.70 : : 37.40 39.00
Source: Eurostat [urb_llivcon], latest data available for 2017
In order to “identify and understand the best indicators to measure progress towards the green economy”, “the mean equivalised net, or disposable income, is the mean of total income of all households, after tax and other deductions, that is available for spending or saving, divided by the number of household members converted into equivalised adults; household members are equalised or made equivalent by weighting each according to their age, using the so-called modified OECD equivalence scale”.4 As presented below (Figure 3), thanks to stable increases
4 For more information see: https://measuring-progress.eu/mean-equivalised-net-income
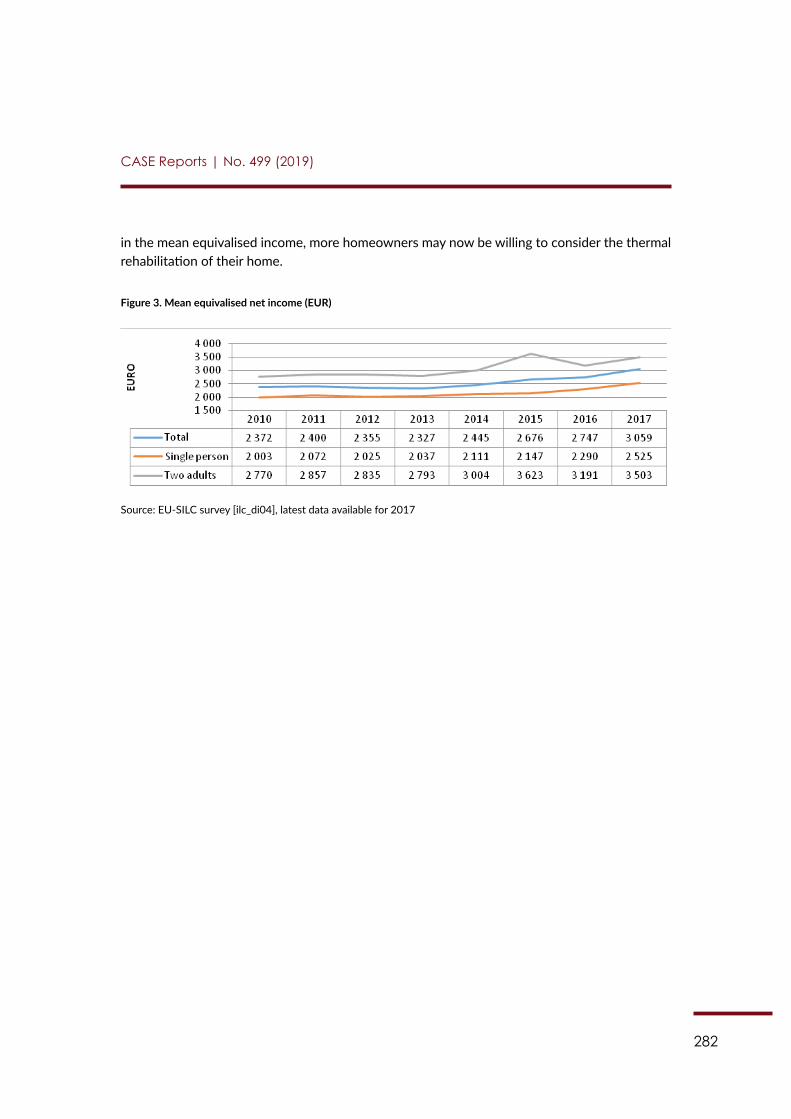
282
CASE Reports | No. 499 (2019)
in the mean equivalised income, more homeowners may now be willing to consider the thermal rehabilitation of their home.
Figure 3. Mean equivalised net income (EUR)
Source: EU-SILC survey [ilc_di04], latest data available for 2017
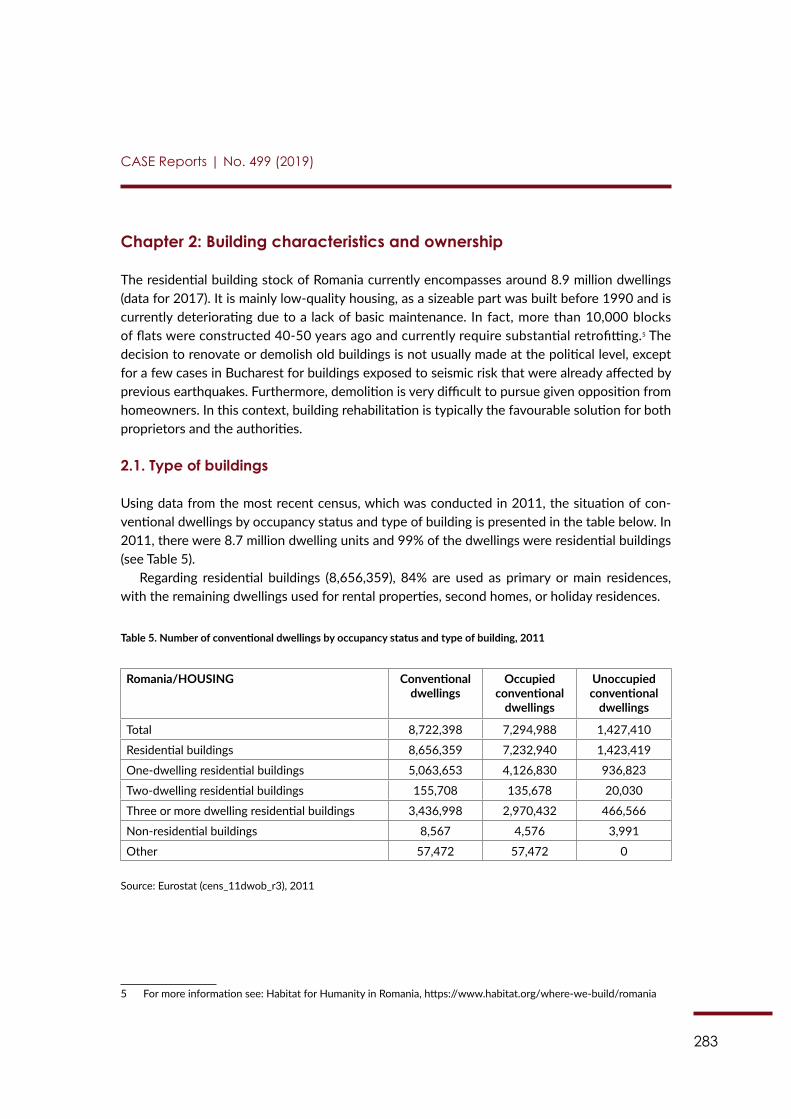
283
CASE Reports | No. 499 (2019)
Chapter 2: Building characteristics and ownership
The residential building stock of Romania currently encompasses around 8.9 million dwellings (data for 2017). It is mainly low-quality housing, as a sizeable part was built before 1990 and is currently deteriorating due to a lack of basic maintenance. In fact, more than 10,000 blocks of flats were constructed 40-50 years ago and currently require substantial retrofitting.5 The decision to renovate or demolish old buildings is not usually made at the political level, except for a few cases in Bucharest for buildings exposed to seismic risk that were already affected by previous earthquakes. Furthermore, demolition is very difficult to pursue given opposition from homeowners. In this context, building rehabilitation is typically the favourable solution for both proprietors and the authorities.
2.1. Type of buildings
Using data from the most recent census, which was conducted in 2011, the situation of con-ventional dwellings by occupancy status and type of building is presented in the table below. In 2011, there were 8.7 million dwelling units and 99% of the dwellings were residential buildings (see Table 5).
Regarding residential buildings (8,656,359), 84% are used as primary or main residences, with the remaining dwellings used for rental properties, second homes, or holiday residences.
Table 5. Number of conventional dwellings by occupancy status and type of building, 2011
Romania/HOUSING Conventional dwellings
Occupied conventional
dwellings
Unoccupied conventional
dwellings
Total 8,722,398 7,294,988 1,427,410
Residential buildings 8,656,359 7,232,940 1,423,419
One-dwelling residential buildings 5,063,653 4,126,830 936,823
Two-dwelling residential buildings 155,708 135,678 20,030
Three or more dwelling residential buildings 3,436,998 2,970,432 466,566
Non-residential buildings 8,567 4,576 3,991
Other 57,472 57,472 0
Source: Eurostat (cens_11dwob_r3), 2011
5 For more information see: Habitat for Humanity in Romania, https://www.habitat.org/where-we-build/romania
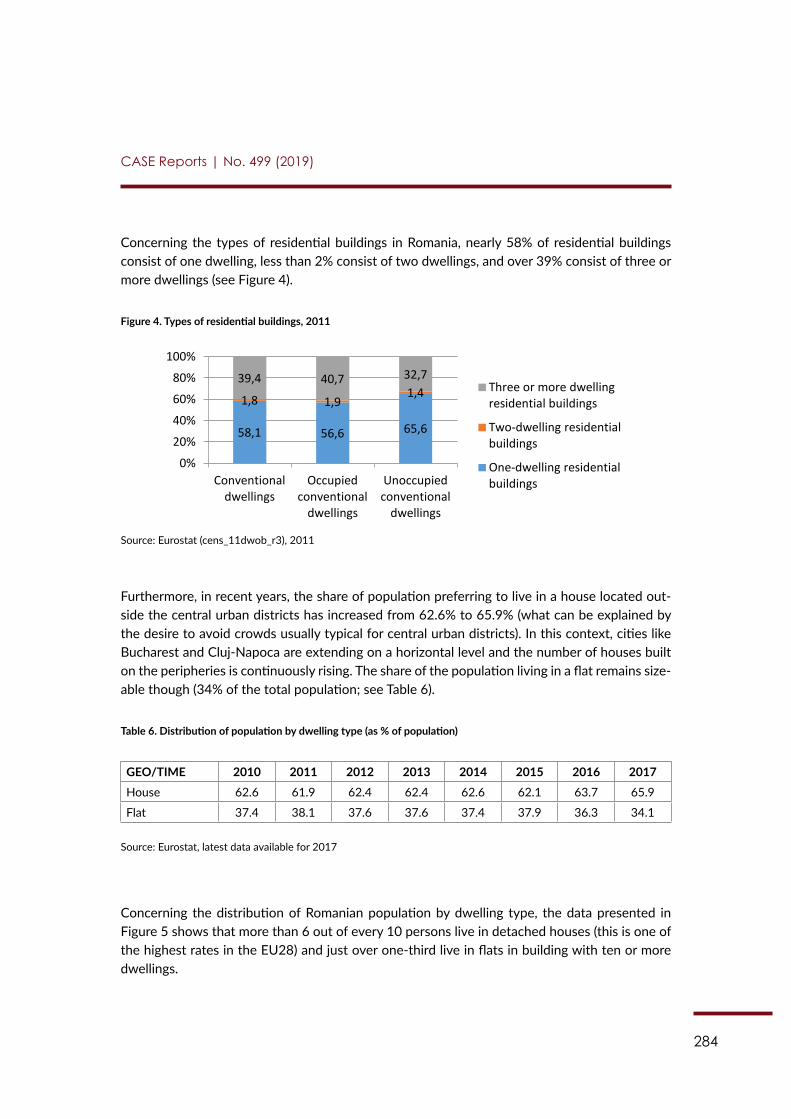
284
CASE Reports | No. 499 (2019)
Concerning the types of residential buildings in Romania, nearly 58% of residential buildings consist of one dwelling, less than 2% consist of two dwellings, and over 39% consist of three or more dwellings (see Figure 4).
Figure 4. Types of residential buildings, 2011
235
Regarding residential buildings (8,656,359), 84% are used as primary or main residences, with the remaining dwellings used for rental properties, second homes, or holiday residences.
Table 5. Number of conventional dwellings by occupancy status and type of building, 2011
Romania/HOUSING Conventional
dwellings
Occupied conventional
dwellings
Unoccupied conventional
dwellings
Total 8,722,398 7,294,988 1,427,410
Residential buildings 8,656,359 7,232,940 1,423,419
One-dwelling residential buildings 5,063,653 4,126,830 936,823
Two-dwelling residential buildings 155,708 135,678 20,030
Three or more dwelling residential buildings 3,436,998 2,970,432 466,566
Non-residential buildings 8,567 4,576 3,991
Other 57,472 57,472 0
Source: Eurostat (cens_11dwob_r3), 2011
Concerning the types of residential buildings in Romania, nearly 58% of residential buildings consist of one dwelling, less than 2% consist of two dwellings, and over 39% consist of three or more dwellings (see Figure 4).
Figure 4. Types of residential buildings, 2011
Source: Eurostat (cens_11dwob_r3), 2011
Furthermore, in recent years, the share of population preferring to live in a house located outside the central urban districts has increased from 62.6% to 65.9% (what can be explained by the desire to avoid crowds usually typical for central urban districts). In this context, cities like Bucharest and Cluj-Napoca are extending on a horizontal level and the number of houses built on the peripheries is continuously rising. The share of the population living in a flat remains sizeable though (34% of the total population; see Table 6).
Table 6. Distribution of population by dwelling type (as % of population) GEO/TIME 2010 2011 2012 2013 2014 2015 2016 2017
House 62.6 61.9 62.4 62.4 62.6 62.1 63.7 65.9
Flat 37.4 38.1 37.6 37.6 37.4 37.9 36.3 34.1
Source: Eurostat, latest data available for 2017
58,1 56,6 65,6
1,8 1,9 1,4
39,4 40,7 32,7
0%
20%
40%
60%
80%
100%
Conventional dwellings
Occupied conventional
dwellings
Unoccupied conventional
dwellings
Three or more dwelling residential buildings
Two-dwelling residential buildings
One-dwelling residential buildings
Source: Eurostat (cens_11dwob_r3), 2011
Furthermore, in recent years, the share of population preferring to live in a house located out-side the central urban districts has increased from 62.6% to 65.9% (what can be explained by the desire to avoid crowds usually typical for central urban districts). In this context, cities like Bucharest and Cluj-Napoca are extending on a horizontal level and the number of houses built on the peripheries is continuously rising. The share of the population living in a flat remains size-able though (34% of the total population; see Table 6).
Table 6. Distribution of population by dwelling type (as % of population)
GEO/TIME 2010 2011 2012 2013 2014 2015 2016 2017House 62.6 61.9 62.4 62.4 62.6 62.1 63.7 65.9
Flat 37.4 38.1 37.6 37.6 37.4 37.9 36.3 34.1
Source: Eurostat, latest data available for 2017
Concerning the distribution of Romanian population by dwelling type, the data presented in Figure 5 shows that more than 6 out of every 10 persons live in detached houses (this is one of the highest rates in the EU28) and just over one-third live in flats in building with ten or more dwellings.
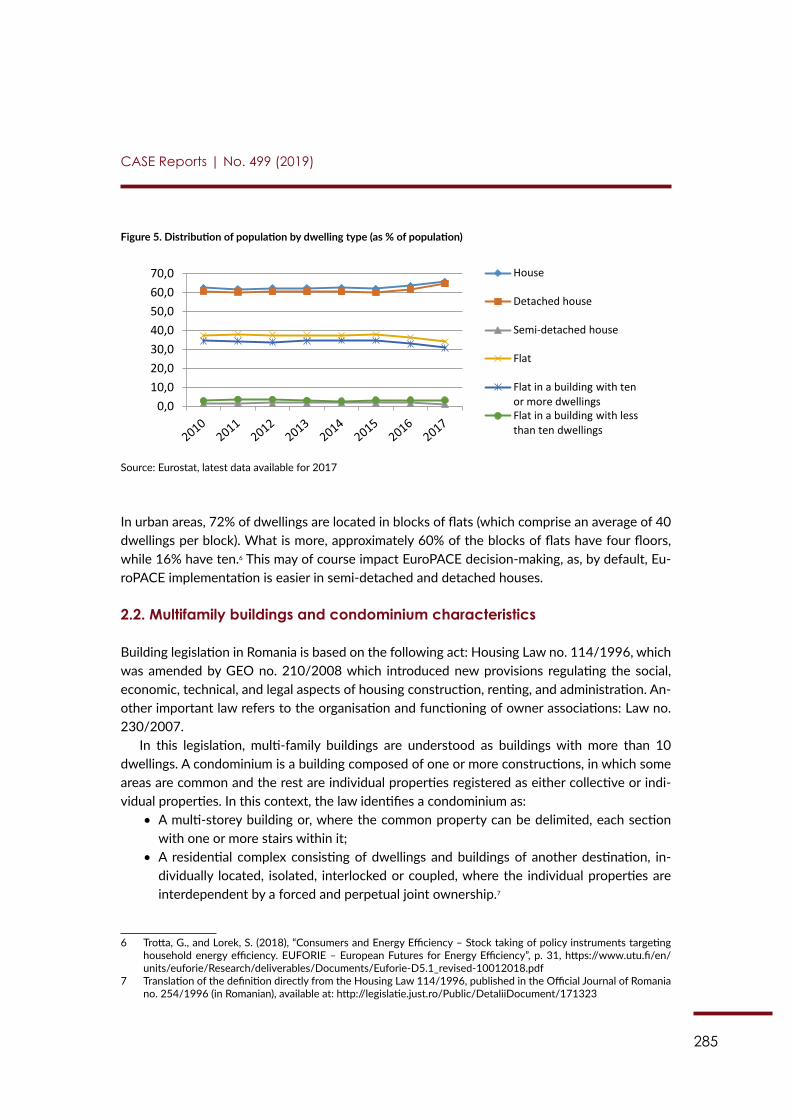
285
CASE Reports | No. 499 (2019)
Figure 5. Distribution of population by dwelling type (as % of population)
236
Concerning the distribution of Romanian population by dwelling type, the data presented in Figure 5 shows that more than 6 out of every 10 persons live in detached houses (this is one of the highest rates in the EU28) and just over one-third live in flats in building with ten or more dwellings.
Figure 5. Distribution of population by dwelling type (as % of population)
Source: Eurostat, latest data available for 2017
In urban areas, 72% of dwellings are located in blocks of flats (which comprise an average of 40 dwellings per block). What is more, approximately 60% of the blocks of flats have four floors, while 16% have ten.356 This may of course impact EuroPACE decision-making, as, by default, EuroPACE implementation is easier in semi-detached and detached houses.
2.2. Multifamily buildings and condominium characteristics
Building legislation in Romania is based on the following act: Housing Law no. 114/1996, which was amended by GEO no. 210/2008 which introduced new provisions regulating the social, economic, technical, and legal aspects of housing construction, renting, and administration. Another important law refers to the organisation and functioning of owner associations: Law no. 230/2007.
In this legislation, multi-family buildings are understood as buildings with more than 10 dwellings. A condominium is a building composed of one or more constructions, in which some areas are common and the rest are individual properties registered as either collective or individual properties. In this context, the law identifies a condominium as:
A multi-storey building or, where the common property can be delimited, each section with one or more stairs within it;
A residential complex consisting of dwellings and buildings of another destination, individually located, isolated, interlocked or coupled, where the individual properties are interdependent by a forced and perpetual joint ownership.357
Owners of condominiums are legally entitled to form Homeowners Associations (HOA).358 Their executive committees are in charge of “ensuring the physical integrity of the building(s) operated by the
356 Trotta, G., and Lorek, S. (2018), “Consumers and Energy Efficiency – Stock taking of policy instruments targeting household energy efficiency. EUFORIE – European Futures for Energy Efficiency”, p. 31, https://www.utu.fi/en/units/euforie/Research/deliverables/Documents/Euforie-D5.1_revised-10012018.pdf 357 Translation of the definition directly from the Housing Law 114/1996, published in the Official Journal of Romania no. 254/1996 (in Romanian), available at: http://legislatie.just.ro/Public/DetaliiDocument/171323 358 Law no. 230/2007 regarding the establishment, organisation, and functioning of owners associations, published in the Official Journal of Romania no. 490/2007, available at: http://legislatie.just.ro/Public/DetaliiDocument/83753
0,0 10,0 20,0 30,0 40,0 50,0 60,0 70,0 House
Detached house
Semi-detached house
Flat
Flat in a building with ten or more dwellings Flat in a building with less than ten dwellings
Source: Eurostat, latest data available for 2017
In urban areas, 72% of dwellings are located in blocks of flats (which comprise an average of 40 dwellings per block). What is more, approximately 60% of the blocks of flats have four floors, while 16% have ten.6 This may of course impact EuroPACE decision-making, as, by default, Eu-roPACE implementation is easier in semi-detached and detached houses.
2.2. Multifamily buildings and condominium characteristics
Building legislation in Romania is based on the following act: Housing Law no. 114/1996, which was amended by GEO no. 210/2008 which introduced new provisions regulating the social, economic, technical, and legal aspects of housing construction, renting, and administration. An-other important law refers to the organisation and functioning of owner associations: Law no. 230/2007.
In this legislation, multi-family buildings are understood as buildings with more than 10 dwellings. A condominium is a building composed of one or more constructions, in which some areas are common and the rest are individual properties registered as either collective or indi-vidual properties. In this context, the law identifies a condominium as:
• A multi-storey building or, where the common property can be delimited, each section with one or more stairs within it;
• A residential complex consisting of dwellings and buildings of another destination, in-dividually located, isolated, interlocked or coupled, where the individual properties are interdependent by a forced and perpetual joint ownership.7
6 Trotta, G., and Lorek, S. (2018), “Consumers and Energy Efficiency – Stock taking of policy instruments targeting household energy efficiency. EUFORIE – European Futures for Energy Efficiency”, p. 31, https://www.utu.fi/en/units/euforie/Research/deliverables/Documents/Euforie-D5.1_revised-10012018.pdf
7 Translation of the definition directly from the Housing Law 114/1996, published in the Official Journal of Romania no. 254/1996 (in Romanian), available at: http://legislatie.just.ro/Public/DetaliiDocument/171323
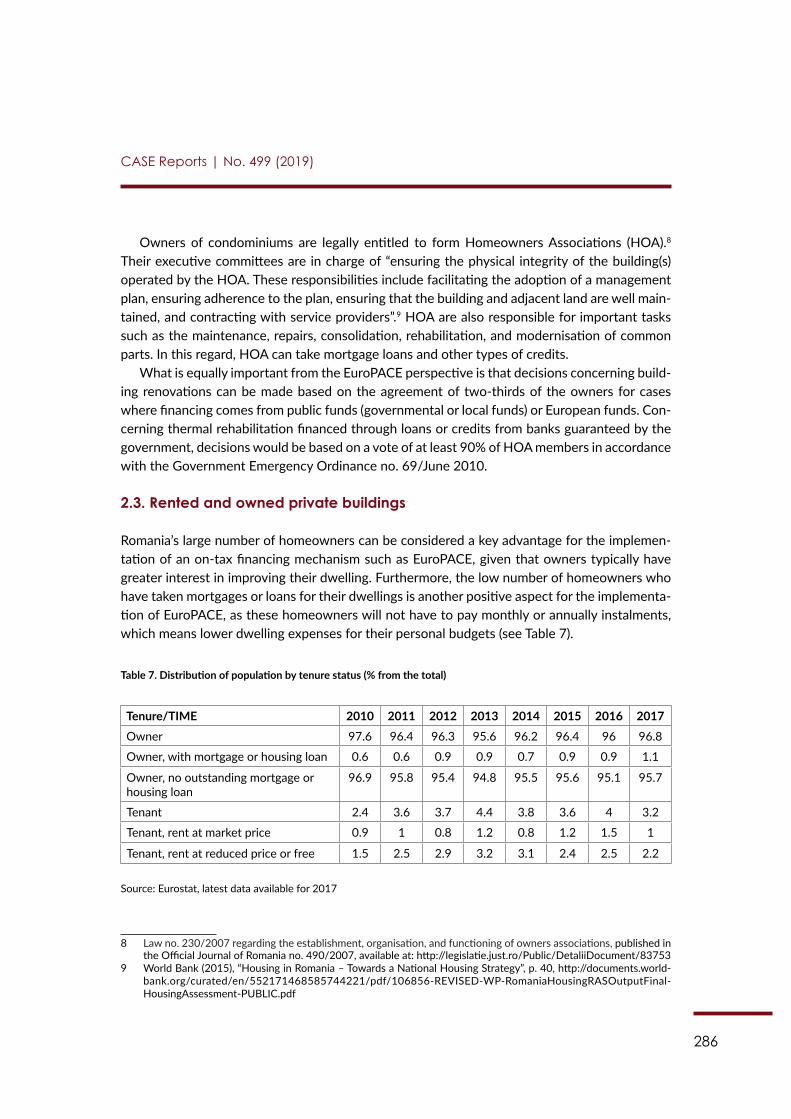
286
CASE Reports | No. 499 (2019)
Owners of condominiums are legally entitled to form Homeowners Associations (HOA).8 Their executive committees are in charge of “ensuring the physical integrity of the building(s) operated by the HOA. These responsibilities include facilitating the adoption of a management plan, ensuring adherence to the plan, ensuring that the building and adjacent land are well main-tained, and contracting with service providers”.9 HOA are also responsible for important tasks such as the maintenance, repairs, consolidation, rehabilitation, and modernisation of common parts. In this regard, HOA can take mortgage loans and other types of credits.
What is equally important from the EuroPACE perspective is that decisions concerning build-ing renovations can be made based on the agreement of two-thirds of the owners for cases where financing comes from public funds (governmental or local funds) or European funds. Con-cerning thermal rehabilitation financed through loans or credits from banks guaranteed by the government, decisions would be based on a vote of at least 90% of HOA members in accordance with the Government Emergency Ordinance no. 69/June 2010.
2.3. Rented and owned private buildings
Romania’s large number of homeowners can be considered a key advantage for the implemen-tation of an on-tax financing mechanism such as EuroPACE, given that owners typically have greater interest in improving their dwelling. Furthermore, the low number of homeowners who have taken mortgages or loans for their dwellings is another positive aspect for the implementa-tion of EuroPACE, as these homeowners will not have to pay monthly or annually instalments, which means lower dwelling expenses for their personal budgets (see Table 7).
Table 7. Distribution of population by tenure status (% from the total)
Tenure/TIME 2010 2011 2012 2013 2014 2015 2016 2017Owner 97.6 96.4 96.3 95.6 96.2 96.4 96 96.8
Owner, with mortgage or housing loan 0.6 0.6 0.9 0.9 0.7 0.9 0.9 1.1
Owner, no outstanding mortgage or housing loan
96.9 95.8 95.4 94.8 95.5 95.6 95.1 95.7
Tenant 2.4 3.6 3.7 4.4 3.8 3.6 4 3.2
Tenant, rent at market price 0.9 1 0.8 1.2 0.8 1.2 1.5 1
Tenant, rent at reduced price or free 1.5 2.5 2.9 3.2 3.1 2.4 2.5 2.2
Source: Eurostat, latest data available for 2017
8 Law no. 230/2007 regarding the establishment, organisation, and functioning of owners associations, published in the Official Journal of Romania no. 490/2007, available at: http://legislatie.just.ro/Public/DetaliiDocument/83753
9 World Bank (2015), “Housing in Romania – Towards a National Housing Strategy”, p. 40, http://documents.world-bank.org/curated/en/552171468585744221/pdf/106856-REVISED-WP-RomaniaHousingRASOutputFinal-HousingAssessment-PUBLIC.pdf
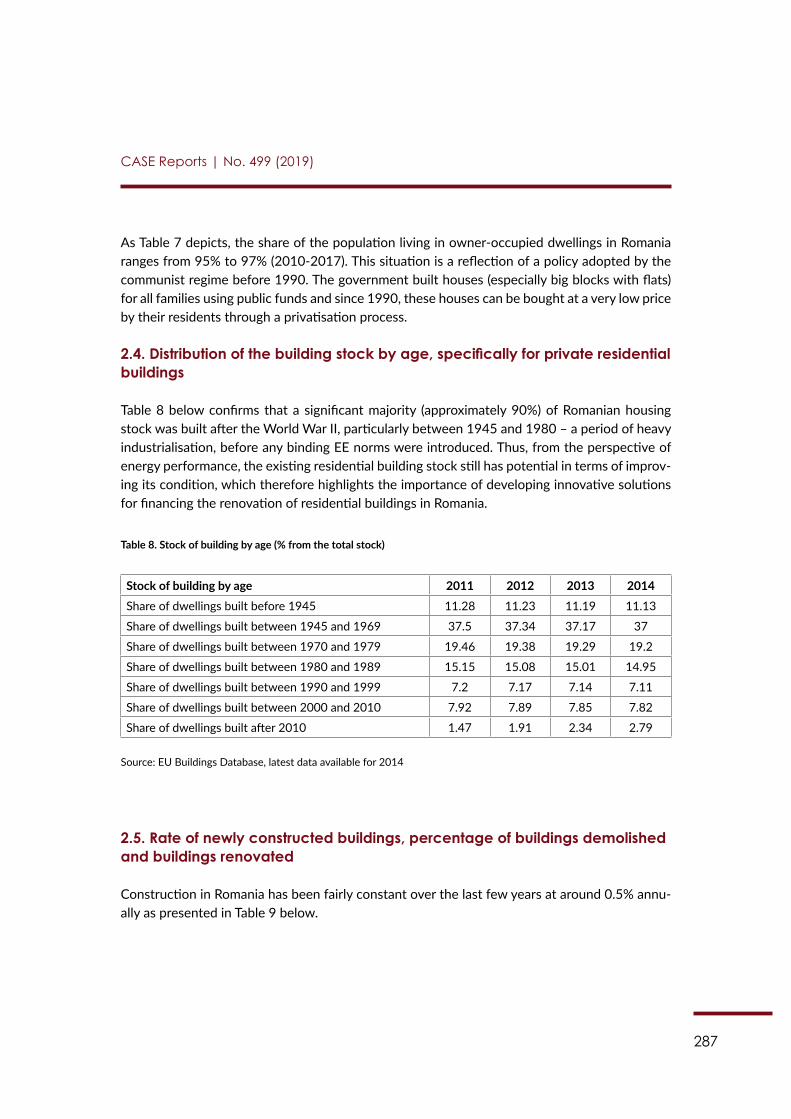
287
CASE Reports | No. 499 (2019)
As Table 7 depicts, the share of the population living in owner-occupied dwellings in Romania ranges from 95% to 97% (2010-2017). This situation is a reflection of a policy adopted by the communist regime before 1990. The government built houses (especially big blocks with flats) for all families using public funds and since 1990, these houses can be bought at a very low price by their residents through a privatisation process.
2.4. Distribution of the building stock by age, specifically for private residential buildings
Table 8 below confirms that a significant majority (approximately 90%) of Romanian housing stock was built after the World War II, particularly between 1945 and 1980 – a period of heavy industrialisation, before any binding EE norms were introduced. Thus, from the perspective of energy performance, the existing residential building stock still has potential in terms of improv-ing its condition, which therefore highlights the importance of developing innovative solutions for financing the renovation of residential buildings in Romania.
Table 8. Stock of building by age (% from the total stock)
Stock of building by age 2011 2012 2013 2014Share of dwellings built before 1945 11.28 11.23 11.19 11.13
Share of dwellings built between 1945 and 1969 37.5 37.34 37.17 37
Share of dwellings built between 1970 and 1979 19.46 19.38 19.29 19.2
Share of dwellings built between 1980 and 1989 15.15 15.08 15.01 14.95
Share of dwellings built between 1990 and 1999 7.2 7.17 7.14 7.11
Share of dwellings built between 2000 and 2010 7.92 7.89 7.85 7.82
Share of dwellings built after 2010 1.47 1.91 2.34 2.79
Source: EU Buildings Database, latest data available for 2014
2.5. Rate of newly constructed buildings, percentage of buildings demolished and buildings renovated
Construction in Romania has been fairly constant over the last few years at around 0.5% annu-ally as presented in Table 9 below.
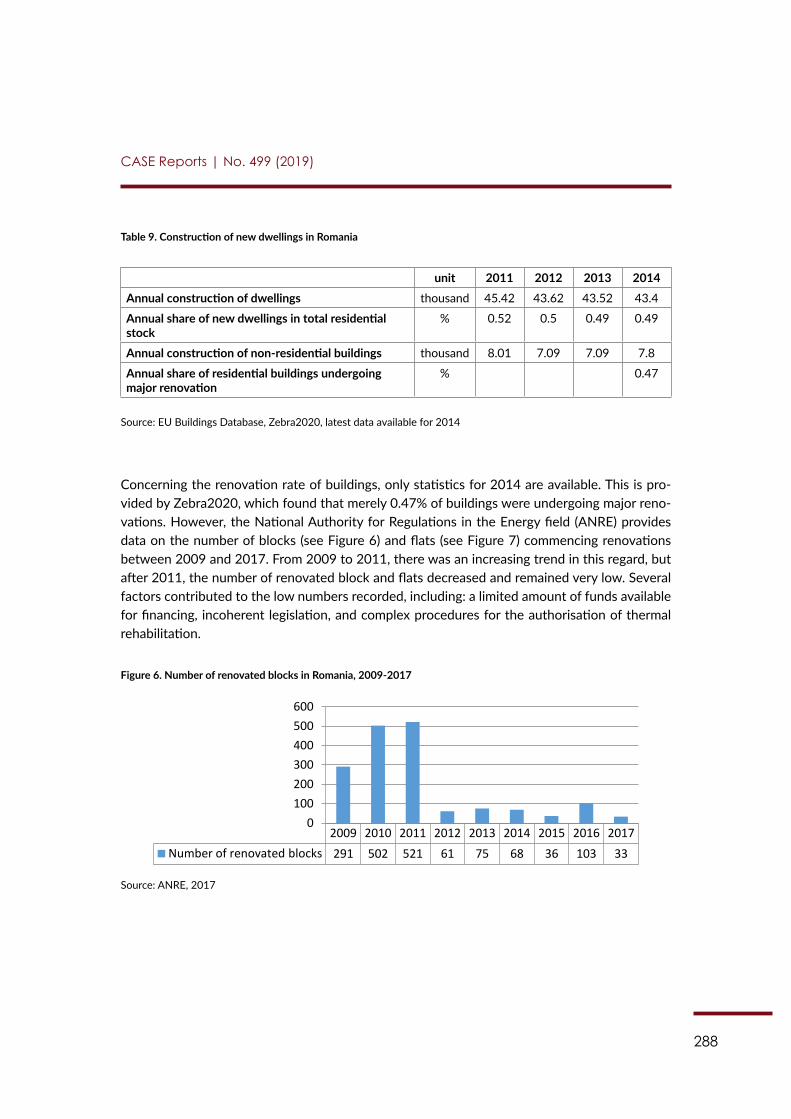
288
CASE Reports | No. 499 (2019)
Table 9. Construction of new dwellings in Romania
unit 2011 2012 2013 2014Annual construction of dwellings thousand 45.42 43.62 43.52 43.4
Annual share of new dwellings in total residential stock
% 0.52 0.5 0.49 0.49
Annual construction of non-residential buildings thousand 8.01 7.09 7.09 7.8
Annual share of residential buildings undergoing major renovation
% 0.47
Source: EU Buildings Database, Zebra2020, latest data available for 2014
Concerning the renovation rate of buildings, only statistics for 2014 are available. This is pro-vided by Zebra2020, which found that merely 0.47% of buildings were undergoing major reno-vations. However, the National Authority for Regulations in the Energy field (ANRE) provides data on the number of blocks (see Figure 6) and flats (see Figure 7) commencing renovations between 2009 and 2017. From 2009 to 2011, there was an increasing trend in this regard, but after 2011, the number of renovated block and flats decreased and remained very low. Several factors contributed to the low numbers recorded, including: a limited amount of funds available for financing, incoherent legislation, and complex procedures for the authorisation of thermal rehabilitation.
Figure 6. Number of renovated blocks in Romania, 2009-2017
239
Figure 6. Number of renovated blocks in Romania, 2009-2017
Source: ANRE, 2017
Figure 7. Number of renovated flats in Romania, 2009-2017
Source: ANRE, 2017
As for the costs, the Zebra2020 tool indicates that Romania has cheapest renovation rates across the EU.360 According to legislation for building rehabilitation, the standard cost established by the government is EUR 55 per m2.361 However, it is important to note this cost is a minimum. For instance, in Bucharest, thermal rehabilitation works realised were quantified at EUR 60 per m2. In the case of an apartment with one room of 37 m2, the total cost is EUR 2,220.362
Chapter 3: Energy consumption in private residential buildings and type of EE/RES investments 3.1. Characteristics of the building stock
A recent study by Muntean et al. (2017), which examined the collective dwellings built in Romania in the 1970s, found that buildings made of reinforced-concrete large prefabricated panels (RCLPP) represent 1.8% of Romania’s building stock and more than half of the country’s urban population.363 Despite
360 Unfortunately, the comparison can be made only for the 2005 – the last year covered in the “costs” category. 361 Government Decision 363/2010 published in the Official Journal of Romania no. 311/12.05/2010, SCOST-04/MDRT, http://legislatie.just.ro/Public/DetaliiDocument/118689 362 For more information see: http://www.b365.ro/cat-platesc-bucurestenii-la-reabilitarea-termica-a-blocurilor-din-fonduri-ue-calcule-ap-1-4-camere_235705.html 363 Muntean, D. M. et al. (2017), “Large Prefabricated Concrete Panels Collective Dwellings from the 1970s: Context and Improvements”, IOP Conf. Ser.: Mater. Sci. Eng. 245 052050, p. 1, https://iopscience.iop.org/article/10.1088/1757-899X/245/5/052050/pdf
2009 2010 2011 2012 2013 2014 2015 2016 2017 Number of renovated blocks 291 502 521 61 75 68 36 103 33
0 100 200 300 400 500 600
2009 2010 2011 2012 2013 2014 2015 2016 2017 Number of renovated
apartaments 8984 22390 18878 2285 2184 3534 953 3351 1246
0 5000
10000 15000 20000 25000
Source: ANRE, 2017
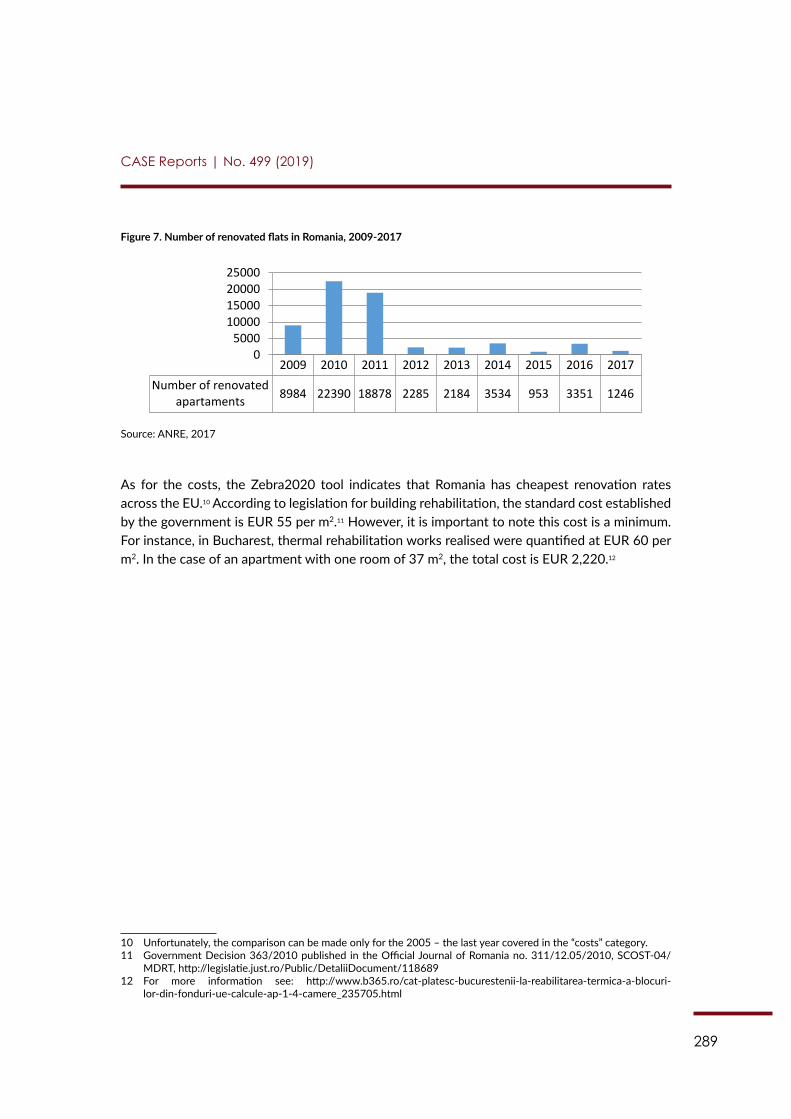
289
CASE Reports | No. 499 (2019)
Figure 7. Number of renovated flats in Romania, 2009-2017
239
Figure 6. Number of renovated blocks in Romania, 2009-2017
Source: ANRE, 2017
Figure 7. Number of renovated flats in Romania, 2009-2017
Source: ANRE, 2017
As for the costs, the Zebra2020 tool indicates that Romania has cheapest renovation rates across the EU.360 According to legislation for building rehabilitation, the standard cost established by the government is EUR 55 per m2.361 However, it is important to note this cost is a minimum. For instance, in Bucharest, thermal rehabilitation works realised were quantified at EUR 60 per m2. In the case of an apartment with one room of 37 m2, the total cost is EUR 2,220.362
Chapter 3: Energy consumption in private residential buildings and type of EE/RES investments 3.1. Characteristics of the building stock
A recent study by Muntean et al. (2017), which examined the collective dwellings built in Romania in the 1970s, found that buildings made of reinforced-concrete large prefabricated panels (RCLPP) represent 1.8% of Romania’s building stock and more than half of the country’s urban population.363 Despite
360 Unfortunately, the comparison can be made only for the 2005 – the last year covered in the “costs” category. 361 Government Decision 363/2010 published in the Official Journal of Romania no. 311/12.05/2010, SCOST-04/MDRT, http://legislatie.just.ro/Public/DetaliiDocument/118689 362 For more information see: http://www.b365.ro/cat-platesc-bucurestenii-la-reabilitarea-termica-a-blocurilor-din-fonduri-ue-calcule-ap-1-4-camere_235705.html 363 Muntean, D. M. et al. (2017), “Large Prefabricated Concrete Panels Collective Dwellings from the 1970s: Context and Improvements”, IOP Conf. Ser.: Mater. Sci. Eng. 245 052050, p. 1, https://iopscience.iop.org/article/10.1088/1757-899X/245/5/052050/pdf
2009 2010 2011 2012 2013 2014 2015 2016 2017 Number of renovated blocks 291 502 521 61 75 68 36 103 33
0 100 200 300 400 500 600
2009 2010 2011 2012 2013 2014 2015 2016 2017 Number of renovated
apartaments 8984 22390 18878 2285 2184 3534 953 3351 1246
0 5000
10000 15000 20000 25000
Source: ANRE, 2017
As for the costs, the Zebra2020 tool indicates that Romania has cheapest renovation rates across the EU.10 According to legislation for building rehabilitation, the standard cost established by the government is EUR 55 per m2.11 However, it is important to note this cost is a minimum. For instance, in Bucharest, thermal rehabilitation works realised were quantified at EUR 60 per m2. In the case of an apartment with one room of 37 m2, the total cost is EUR 2,220.12
10 Unfortunately, the comparison can be made only for the 2005 – the last year covered in the “costs” category.11 Government Decision 363/2010 published in the Official Journal of Romania no. 311/12.05/2010, SCOST-04/
MDRT, http://legislatie.just.ro/Public/DetaliiDocument/11868912 For more information see: http://www.b365.ro/cat-platesc-bucurestenii-la-reabilitarea-termica-a-blocuri-
lor-din-fonduri-ue-calcule-ap-1-4-camere_235705.html
290
CASE Reports | No. 499 (2019)
Chapter 3: Energy consumption in private residential buildings and type of EE/RES investments
3.1. Characteristics of the building stock
A recent study by Muntean et al. (2017), which examined the collective dwellings built in Roma-nia in the 1970s, found that buildings made of reinforced-concrete large prefabricated panels (RCLPP) represent 1.8% of Romania’s building stock and more than half of the country’s urban population.13 Despite looking similar to blocks of flats in other European countries, Romanian RCLPP buildings have entirely different characteristics, and significantly higher energy con-sumption.14 The expansion of this type of building was in accordance with the rapid industriali-sation process promoted by the communist regime and, in this context, new homes needed to be created in a short time frame in order to accommodate the newcomers coming from rural areas looking for a better life.15 What is more, a “repetitive pattern has resulted in what could be applied in multiple ways and the result was also known as so called ‘match boxes’, because of their small dimensions, so often met in countries from the Eastern bloc”.16
Concerning the characteristics of buildings built in Romania, it is worth to present an ex-ample of a typical block of flats from 1972 of four levels (15 flats on each). According to the authors (Teodosiu & Teodosiu, 2015): “the external façade walls are made of special large prefabri-cated panels (thickness 25 cm), including the following layers: reinforced concrete (8 cm), autoclaved cellular concrete – ACC (7 cm), polystyrene panels (4.8 cm), and reinforced concrete (5.2 cm). The external lateral walls (with loggia) are made of two layers: ACC (20 cm) and concrete (14 cm). The roof structure is also made of concrete and thermal insulation of ACC (thickness 12 cm). Windows are double-glazing (glass thickness: 3 mm) and wood frame”.17
The authors also mention the heating system of these buildings. “The heating and the domes-tic hot water for the block of flats are assured by the district heating system of municipality. The exist-ing building heating system is comprised of old cast iron radiators (equipped with partially functional vanes) and black steel pipes for the distribution”.18
The rehabilitation interventions realised in order to improve the energy performance of the envelope are also mentioned: “supplementary thermal insulation of external walls: 8 cm of poly-styrene applied on the external face of the walls – supplementary thermal insulation applied on the ceiling: 15 cm of polystyrene – supplementary thermal insulation applied on the ground floor: 8 cm
13 Muntean, D. M. et al. (2017), “Large Prefabricated Concrete Panels Collective Dwellings from the 1970s: Context and Improvements”, IOP Conf. Ser.: Mater. Sci. Eng. 245 052050, p. 1, https://iopscience.iop.org/article/10.1088/1757--899X/245/5/052050/pdf
14 Ibidem, p. 2.15 Ibidem, p. 1. 16 Ibidem, p. 2.17 Teodosiu, R., Teodosiu, C. (2015), “Building stock refurbishment in Romania. A case study in Bucharest”, Interna-
tional Journal of Civil and Structural Engineering-IJCSE, Volume 2: Issue 2, p. 355, https://www.researchgate.net/publication/286454298_Building_stock_refurbishment_in_Romania_A_case_study_in_Bucharest
18 Ibidem
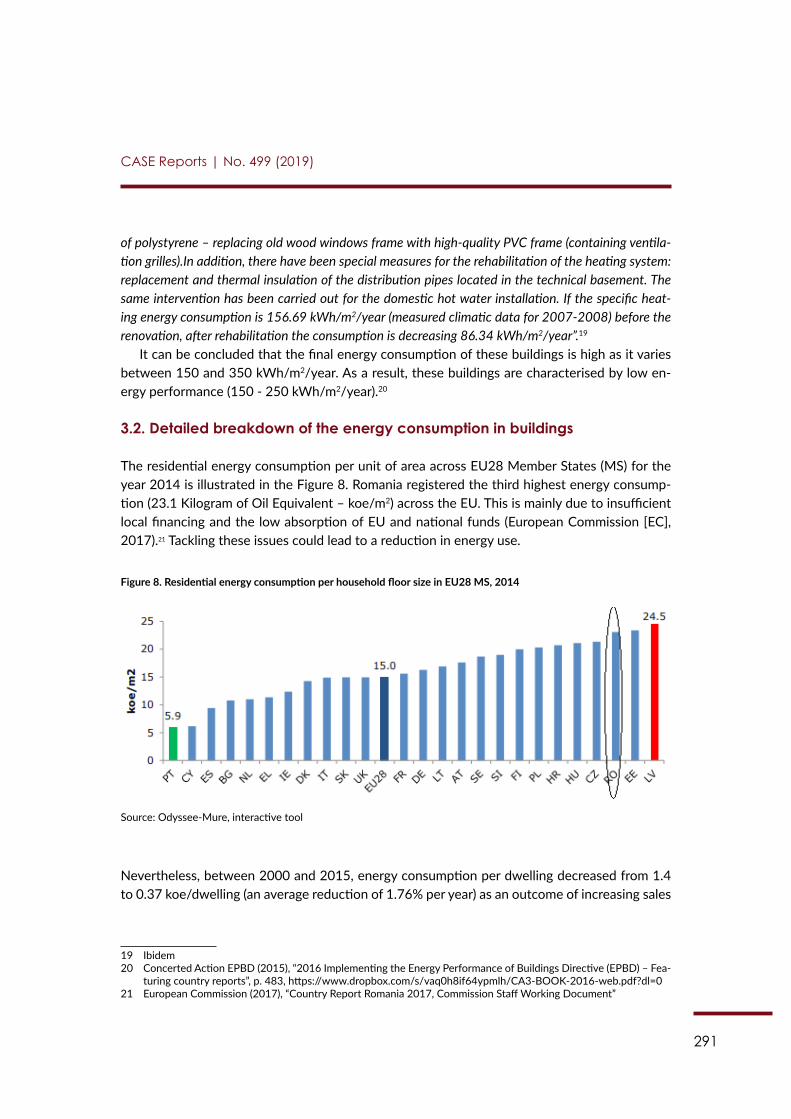
291
CASE Reports | No. 499 (2019)
of polystyrene – replacing old wood windows frame with high-quality PVC frame (containing ventila-tion grilles).In addition, there have been special measures for the rehabilitation of the heating system: replacement and thermal insulation of the distribution pipes located in the technical basement. The same intervention has been carried out for the domestic hot water installation. If the specific heat-ing energy consumption is 156.69 kWh/m2/year (measured climatic data for 2007-2008) before the renovation, after rehabilitation the consumption is decreasing 86.34 kWh/m2/year”.19
It can be concluded that the final energy consumption of these buildings is high as it varies between 150 and 350 kWh/m2/year. As a result, these buildings are characterised by low en-ergy performance (150 - 250 kWh/m2/year).20
3.2. Detailed breakdown of the energy consumption in buildings
The residential energy consumption per unit of area across EU28 Member States (MS) for the year 2014 is illustrated in the Figure 8. Romania registered the third highest energy consump-tion (23.1 Kilogram of Oil Equivalent – koe/m2) across the EU. This is mainly due to insufficient local financing and the low absorption of EU and national funds (European Commission [EC], 2017).21 Tackling these issues could lead to a reduction in energy use.
Figure 8. Residential energy consumption per household floor size in EU28 MS, 2014
Source: Odyssee-Mure, interactive tool
Nevertheless, between 2000 and 2015, energy consumption per dwelling decreased from 1.4 to 0.37 koe/dwelling (an average reduction of 1.76% per year) as an outcome of increasing sales
19 Ibidem20 Concerted Action EPBD (2015), “2016 Implementing the Energy Performance of Buildings Directive (EPBD) – Fea-
turing country reports”, p. 483, https://www.dropbox.com/s/vaq0h8if64ypmlh/CA3-BOOK-2016-web.pdf?dl=021 European Commission (2017), “Country Report Romania 2017, Commission Staff Working Document”
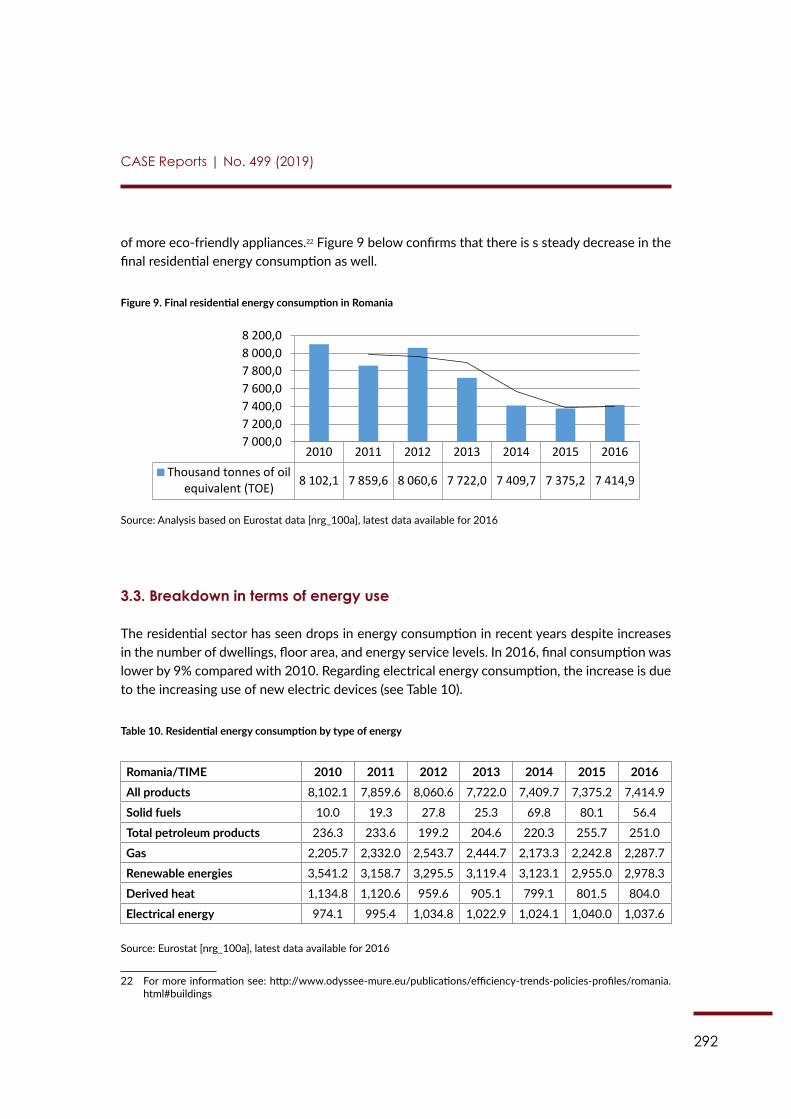
292
CASE Reports | No. 499 (2019)
of more eco-friendly appliances.22 Figure 9 below confirms that there is s steady decrease in the final residential energy consumption as well.
Figure 9. Final residential energy consumption in Romania
241
3.2. Detailed breakdown of the energy consumption in buildings
The residential energy consumption per unit of area across EU28 Member States (MS) for the year 2014 is illustrated in the Figure 8. Romania registered the third highest energy consumption (23.1 Kilogram of Oil Equivalent - koe/m2) across the EU. This is mainly due to insufficient local financing and the low absorption of EU and national funds (European Commission [EC], 2017).371 Tackling these issues could lead to a reduction in energy use.
Figure 8. Residential energy consumption per household floor size in EU28 MS, 2014
Source: Odyssee-Mure, interactive tool
Nevertheless, between 2000 and 2015, energy consumption per dwelling decreased from 1.4 to 0.37 koe/dwelling (an average reduction of 1.76% per year) as an outcome of increasing sales of more eco-friendly appliances.372 Figure 9 below confirms that there is s steady decrease in the final residential energy consumption as well.
Figure 9. Final residential energy consumption in Romania
Source: Analysis based on Eurostat data [nrg_100a], latest data available for 2016
3.3. Breakdown in terms of energy use
The residential sector has seen drops in energy consumption in recent years despite increases in the number of dwellings, floor area, and energy service levels. In 2016, final consumption was lower by 9% compared with 2010. Regarding electrical energy consumption, the increase is due to the increasing use of new electric devices (see Table 10).
371 European Commission (2017), “Country Report Romania 2017, Commission Staff Working Document” 372 For more information see: http://www.odyssee-mure.eu/publications/efficiency-trends-policies-profiles/romania.html#buildings
2010 2011 2012 2013 2014 2015 2016 Thousand tonnes of oil
equivalent (TOE) 8 102,1 7 859,6 8 060,6 7 722,0 7 409,7 7 375,2 7 414,9
7 000,0 7 200,0 7 400,0 7 600,0 7 800,0 8 000,0 8 200,0
Source: Analysis based on Eurostat data [nrg_100a], latest data available for 2016
3.3. Breakdown in terms of energy use
The residential sector has seen drops in energy consumption in recent years despite increases in the number of dwellings, floor area, and energy service levels. In 2016, final consumption was lower by 9% compared with 2010. Regarding electrical energy consumption, the increase is due to the increasing use of new electric devices (see Table 10).
Table 10. Residential energy consumption by type of energy
Romania/TIME 2010 2011 2012 2013 2014 2015 2016All products 8,102.1 7,859.6 8,060.6 7,722.0 7,409.7 7,375.2 7,414.9
Solid fuels 10.0 19.3 27.8 25.3 69.8 80.1 56.4
Total petroleum products 236.3 233.6 199.2 204.6 220.3 255.7 251.0
Gas 2,205.7 2,332.0 2,543.7 2,444.7 2,173.3 2,242.8 2,287.7
Renewable energies 3,541.2 3,158.7 3,295.5 3,119.4 3,123.1 2,955.0 2,978.3
Derived heat 1,134.8 1,120.6 959.6 905.1 799.1 801.5 804.0
Electrical energy 974.1 995.4 1,034.8 1,022.9 1,024.1 1,040.0 1,037.6
Source: Eurostat [nrg_100a], latest data available for 2016
22 For more information see: http://www.odyssee-mure.eu/publications/efficiency-trends-policies-profiles/romania.html#buildings
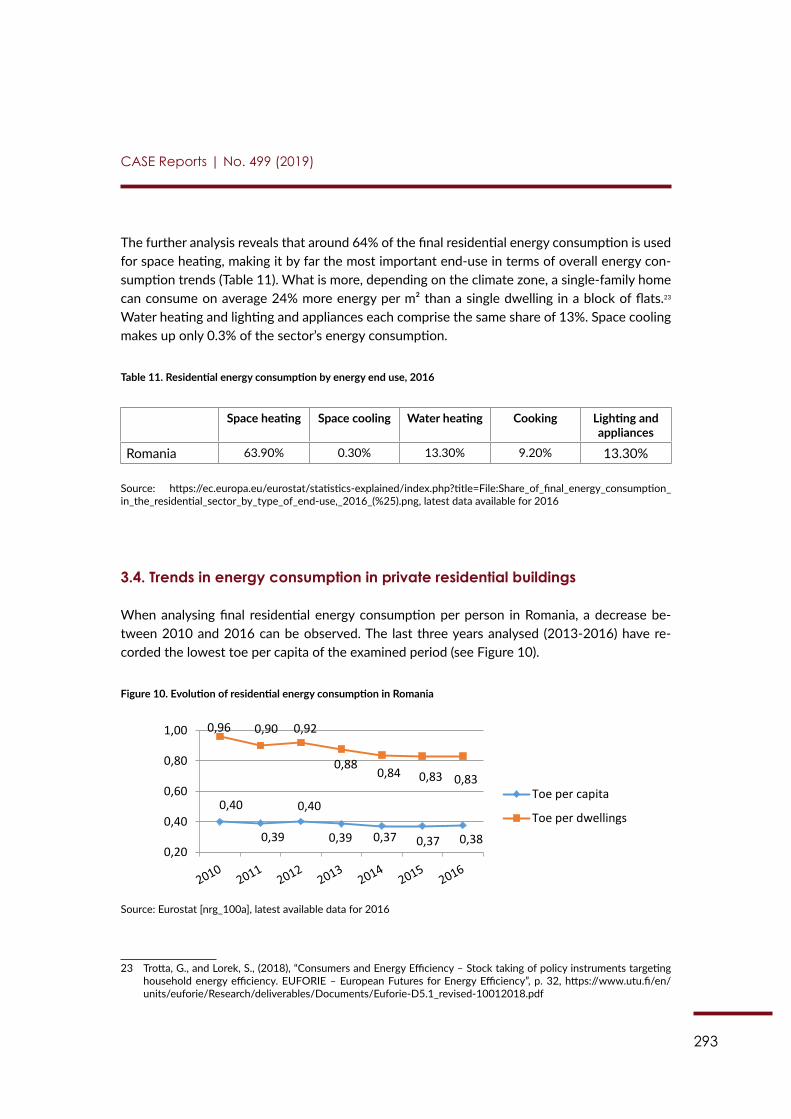
293
CASE Reports | No. 499 (2019)
The further analysis reveals that around 64% of the final residential energy consumption is used for space heating, making it by far the most important end-use in terms of overall energy con-sumption trends (Table 11). What is more, depending on the climate zone, a single-family home can consume on average 24% more energy per m² than a single dwelling in a block of flats.23 Water heating and lighting and appliances each comprise the same share of 13%. Space cooling makes up only 0.3% of the sector’s energy consumption.
Table 11. Residential energy consumption by energy end use, 2016
Space heating Space cooling Water heating Cooking Lighting and appliances
Romania 63.90% 0.30% 13.30% 9.20% 13.30%
Source: https://ec.europa.eu/eurostat/statistics-explained/index.php?title=File:Share_of_final_energy_consumption_in_the_residential_sector_by_type_of_end-use,_2016_(%25).png, latest data available for 2016
3.4. Trends in energy consumption in private residential buildings
When analysing final residential energy consumption per person in Romania, a decrease be-tween 2010 and 2016 can be observed. The last three years analysed (2013-2016) have re-corded the lowest toe per capita of the examined period (see Figure 10).
Figure 10. Evolution of residential energy consumption in Romania
242
Table 10. Residential energy consumption by type of energy Romania/TIME 2010 2011 2012 2013 2014 2015 2016
All products 8,102.1 7,859.6 8,060.6 7,722.0 7,409.7 7,375.2 7,414.9
Solid fuels 10.0 19.3 27.8 25.3 69.8 80.1 56.4
Total petroleum products 236.3 233.6 199.2 204.6 220.3 255.7 251.0
Gas 2,205.7 2,332.0 2,543.7 2,444.7 2,173.3 2,242.8 2,287.7
Renewable energies 3,541.2 3,158.7 3,295.5 3,119.4 3,123.1 2,955.0 2,978.3
Derived heat 1,134.8 1,120.6 959.6 905.1 799.1 801.5 804.0
Electrical energy 974.1 995.4 1,034.8 1,022.9 1,024.1 1,040.0 1,037.6
Source: Eurostat [nrg_100a], latest data available for 2016
The further analysis reveals that around 64% of the final residential energy consumption is used for space heating, making it by far the most important end-use in terms of overall energy consumption trends (Table 11). What is more, depending on the climate zone, a single-family home can consume on average 24% more energy per m² than a single dwelling in a block of flats.373 Water heating and lighting and appliances each comprise the same share of 13%. Space cooling makes up only 0.3% of the sector’s energy consumption.
Table 11. Residential energy consumption by energy end use, 2016
Space heating
Space cooling
Water heating Cooking
Lighting and appliances
Romania 63.90% 0.30% 13.30% 9.20% 13.30% Source: https://ec.europa.eu/eurostat/statistics-
explained/index.php?title=File:Share_of_final_energy_consumption_in_the_residential_sector_by_type_of_end-use,_2016_(%25).png, latest data available for 2016
3.4. Trends in energy consumption in private residential buildings
When analysing final residential energy consumption per person in Romania, a decrease between 2010 and 2016 can be observed. The last three years analysed (2013-2016) have recorded the lowest toe per capita of the examined period (see Figure 10).
Figure 10. Evolution of residential energy consumption in Romania
Source: Eurostat [nrg_100a], latest available data for 2016
373 Trotta, G., and Lorek, S., (2018), “Consumers and Energy Efficiency – Stock taking of policy instruments targeting household energy efficiency. EUFORIE – European Futures for Energy Efficiency”, p. 32, https://www.utu.fi/en/units/euforie/Research/deliverables/Documents/Euforie-D5.1_revised-10012018.pdf
0,40
0,39
0,40
0,39 0,37 0,37 0,38
0,96 0,90 0,92
0,88 0,84 0,83 0,83
0,20
0,40
0,60
0,80
1,00
Toe per capita
Toe per dwellings
Source: Eurostat [nrg_100a], latest available data for 2016
23 Trotta, G., and Lorek, S., (2018), “Consumers and Energy Efficiency – Stock taking of policy instruments targeting household energy efficiency. EUFORIE – European Futures for Energy Efficiency”, p. 32, https://www.utu.fi/en/units/euforie/Research/deliverables/Documents/Euforie-D5.1_revised-10012018.pdf
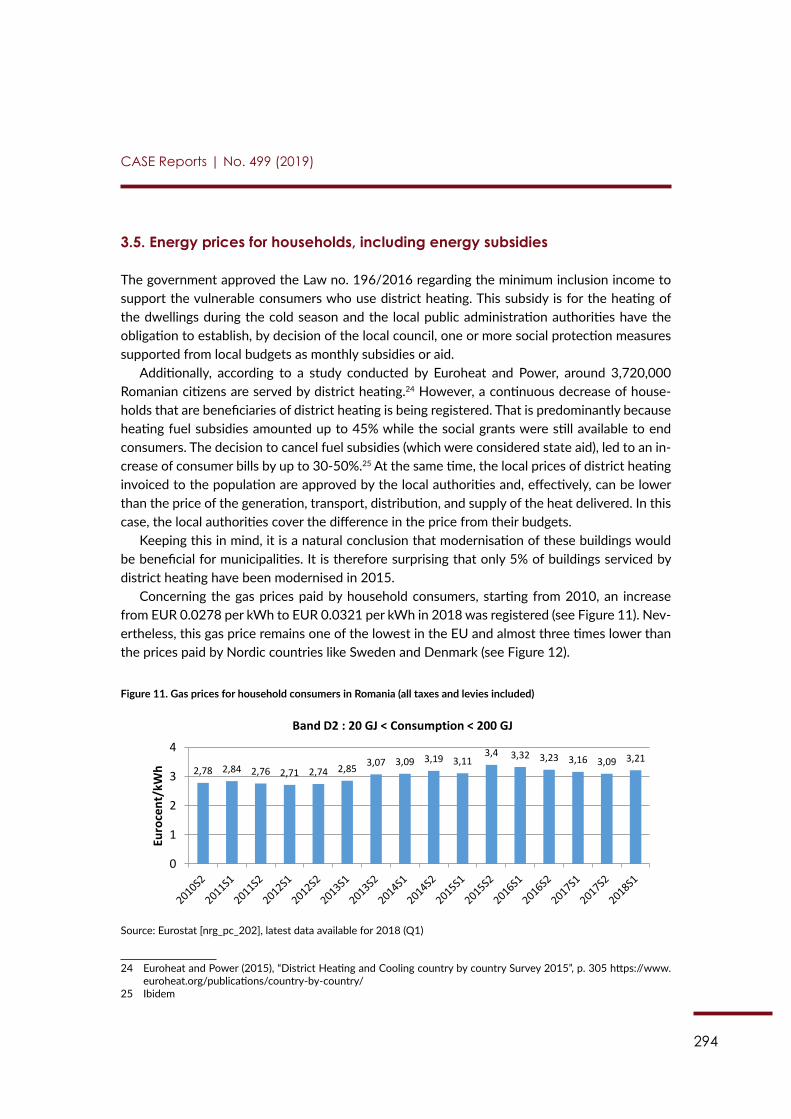
294
CASE Reports | No. 499 (2019)
3.5. Energy prices for households, including energy subsidies
The government approved the Law no. 196/2016 regarding the minimum inclusion income to support the vulnerable consumers who use district heating. This subsidy is for the heating of the dwellings during the cold season and the local public administration authorities have the obligation to establish, by decision of the local council, one or more social protection measures supported from local budgets as monthly subsidies or aid.
Additionally, according to a study conducted by Euroheat and Power, around 3,720,000 Romanian citizens are served by district heating.24 However, a continuous decrease of house-holds that are beneficiaries of district heating is being registered. That is predominantly because heating fuel subsidies amounted up to 45% while the social grants were still available to end consumers. The decision to cancel fuel subsidies (which were considered state aid), led to an in-crease of consumer bills by up to 30-50%.25 At the same time, the local prices of district heating invoiced to the population are approved by the local authorities and, effectively, can be lower than the price of the generation, transport, distribution, and supply of the heat delivered. In this case, the local authorities cover the difference in the price from their budgets.
Keeping this in mind, it is a natural conclusion that modernisation of these buildings would be beneficial for municipalities. It is therefore surprising that only 5% of buildings serviced by district heating have been modernised in 2015.
Concerning the gas prices paid by household consumers, starting from 2010, an increase from EUR 0.0278 per kWh to EUR 0.0321 per kWh in 2018 was registered (see Figure 11). Nev-ertheless, this gas price remains one of the lowest in the EU and almost three times lower than the prices paid by Nordic countries like Sweden and Denmark (see Figure 12).
Figure 11. Gas prices for household consumers in Romania (all taxes and levies included)
243
3.5. Energy prices for households, including energy subsidies
The government approved the Law no. 196/2016 regarding the minimum inclusion income to support the vulnerable consumers who use district heating. This subsidy is for the heating of the dwellings during the cold season and the local public administration authorities have the obligation to establish, by decision of the local council, one or more social protection measures supported from local budgets as monthly subsidies or aid.
Additionally, according to a study conducted by Euroheat and Power, around 3,720,000 Romanian citizens are served by district heating.374 However, a continuous decrease of households that are beneficiaries of district heating is being registered. That is predominantly because heating fuel subsidies amounted up to 45% while the social grants were still available to end consumers. The decision to cancel fuel subsidies (which were considered state aid), led to an increase of consumer bills by up to 30-50%.375 At the same time, the local prices of district heating invoiced to the population are approved by the local authorities and, effectively, can be lower than the price of the generation, transport, distribution, and supply of the heat delivered. In this case, the local authorities cover the difference in the price from their budgets.
Keeping this in mind, it is a natural conclusion that modernisation of these buildings would be beneficial for municipalities. It is therefore surprising that only 5% of buildings serviced by district heating have been modernised in 2015.
Concerning the gas prices paid by household consumers, starting from 2010, an increase from EUR 0.0278 per kWh to EUR 0.0321 per kWh in 2018 was registered (see Figure 11). Nevertheless, this gas price remains one of the lowest in the EU and almost three times lower than the prices paid by Nordic countries like Sweden and Denmark (see Figure 12).
Figure 11. Gas prices for household consumers in Romania (all taxes and levies included)
Source: Eurostat [nrg_pc_202], latest data available for 2018 (Q1)
374 Euroheat and Power (2015), “District Heating and Cooling country by country Survey 2015”, p. 305 https://www.euroheat.org/publications/country-by-country/ 375 Ibidem
2,78 2,84 2,76 2,71 2,74 2,85 3,07 3,09 3,19 3,11 3,4 3,32 3,23 3,16 3,09 3,21
0
1
2
3
4
Euro
cent
/kW
h
Band D2 : 20 GJ < Consumption < 200 GJ
Source: Eurostat [nrg_pc_202], latest data available for 2018 (Q1)
24 Euroheat and Power (2015), “District Heating and Cooling country by country Survey 2015”, p. 305 https://www.euroheat.org/publications/country-by-country/
25 Ibidem
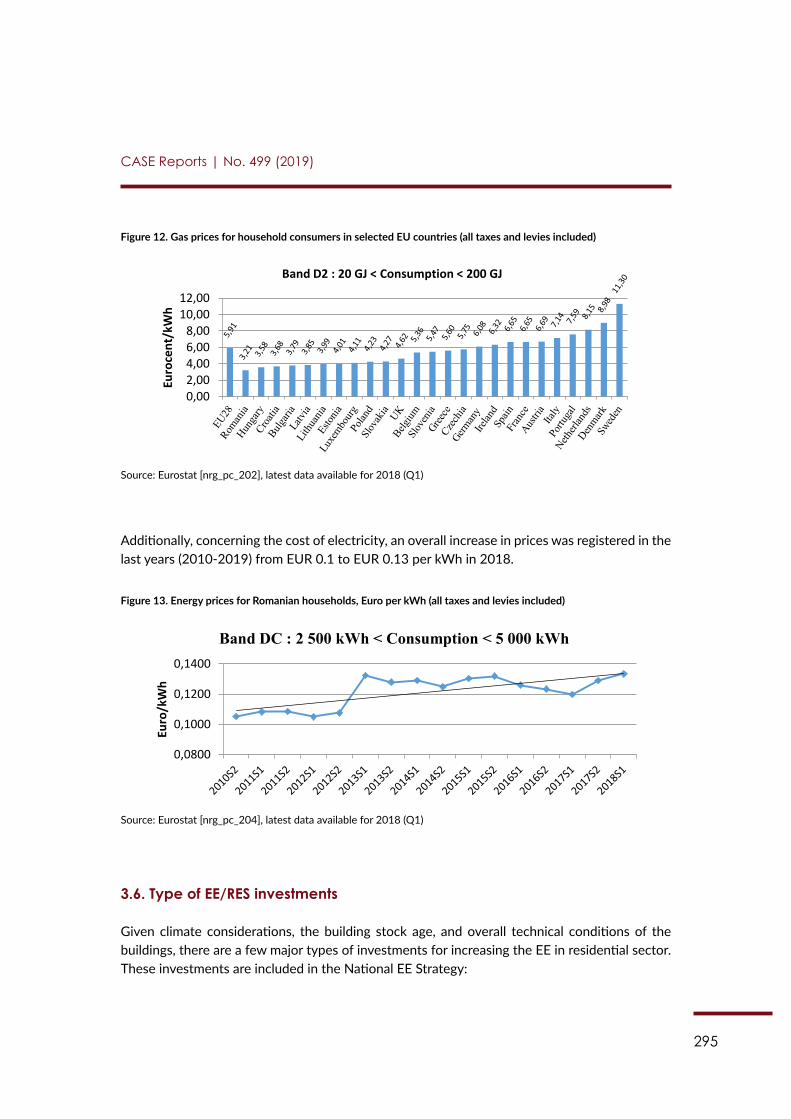
295
CASE Reports | No. 499 (2019)
Figure 12. Gas prices for household consumers in selected EU countries (all taxes and levies included)
244
Figure 12. Gas prices for household consumers in selected EU countries (all taxes and levies included)
Source: Eurostat [nrg_pc_202], latest data available for 2018 (Q1)
Additionally, concerning the cost of electricity, an overall increase in prices was registered in the last years (2010-2019) from EUR 0.1 to EUR 0.13 per kWh in 2018.
Figure 13. Energy prices for Romanian households, Euro per kWh (all taxes and levies included)
Source: Eurostat [nrg_pc_204], latest data available for 2018 (Q1)
3.6. Type of EE/RES investments
Given climate considerations, the building stock age, and overall technical conditions of the buildings, there are a few major types of investments for increasing the EE in residential sector. These investments are included in the National EE Strategy:
a) Thermal insulation of building envelopes – interior walls, floors, roofs, thermal insulation of the exterior walls of the block, replacement of the existing exterior joinery, including access to the building, thermal insulation of the terrace, thermal insulation of the floor above the last level in the case of the roof, closing of the balconies and / or logs with insulating joinery, including the thermal insulation of the parapets, thermal insulation of the floor over the basement;
b) Heating system repair / rehabilitation of the distribution system between the connection point and the floor above the basement / thermal channel, including its thermal insulation, the installation of thermostatic head valves to radiators, repair / replacement of the boiler and / or the burner in the block / scale thermal plant;
c) The rehabilitation and modernisation of the heating and hot water distribution system, including installation of thermostatic head valves on the radiators and the insulation of the subterranean / thermal duct pipes in order to reduce the losses of heat;
0,00 2,00 4,00 6,00 8,00
10,00 12,00
Euro
cent
/kW
h
Band D2 : 20 GJ < Consumption < 200 GJ
0,0800
0,1000
0,1200
0,1400
Euro
/kW
h
Band DC : 2 500 kWh < Consumption < 5 000 kWh
Source: Eurostat [nrg_pc_202], latest data available for 2018 (Q1)
Additionally, concerning the cost of electricity, an overall increase in prices was registered in the last years (2010-2019) from EUR 0.1 to EUR 0.13 per kWh in 2018.
Figure 13. Energy prices for Romanian households, Euro per kWh (all taxes and levies included)
244
Figure 12. Gas prices for household consumers in selected EU countries (all taxes and levies included)
Source: Eurostat [nrg_pc_202], latest data available for 2018 (Q1)
Additionally, concerning the cost of electricity, an overall increase in prices was registered in the last years (2010-2019) from EUR 0.1 to EUR 0.13 per kWh in 2018.
Figure 13. Energy prices for Romanian households, Euro per kWh (all taxes and levies included)
Source: Eurostat [nrg_pc_204], latest data available for 2018 (Q1)
3.6. Type of EE/RES investments
Given climate considerations, the building stock age, and overall technical conditions of the buildings, there are a few major types of investments for increasing the EE in residential sector. These investments are included in the National EE Strategy:
a) Thermal insulation of building envelopes – interior walls, floors, roofs, thermal insulation of the exterior walls of the block, replacement of the existing exterior joinery, including access to the building, thermal insulation of the terrace, thermal insulation of the floor above the last level in the case of the roof, closing of the balconies and / or logs with insulating joinery, including the thermal insulation of the parapets, thermal insulation of the floor over the basement;
b) Heating system repair / rehabilitation of the distribution system between the connection point and the floor above the basement / thermal channel, including its thermal insulation, the installation of thermostatic head valves to radiators, repair / replacement of the boiler and / or the burner in the block / scale thermal plant;
c) The rehabilitation and modernisation of the heating and hot water distribution system, including installation of thermostatic head valves on the radiators and the insulation of the subterranean / thermal duct pipes in order to reduce the losses of heat;
0,00 2,00 4,00 6,00 8,00
10,00 12,00
Euro
cent
/kW
h
Band D2 : 20 GJ < Consumption < 200 GJ
0,0800
0,1000
0,1200
0,1400
Euro
/kW
h
Band DC : 2 500 kWh < Consumption < 5 000 kWh
Source: Eurostat [nrg_pc_204], latest data available for 2018 (Q1)
3.6. Type of EE/RES investments
Given climate considerations, the building stock age, and overall technical conditions of the buildings, there are a few major types of investments for increasing the EE in residential sector. These investments are included in the National EE Strategy:
296
CASE Reports | No. 499 (2019)
1) Thermal insulation of building envelopes – interior walls, floors, roofs, thermal insulation of the exterior walls of the block, replacement of the existing exterior joinery, including access to the building, thermal insulation of the terrace, thermal insulation of the floor above the last level in the case of the roof, closing of the balconies and / or logs with insulating joinery, including the thermal insulation of the parapets, thermal insulation of the floor over the basement;
2) Heating system repair / rehabilitation of the distribution system between the connection point and the floor above the basement / thermal channel, including its thermal insulation, the in-stallation of thermostatic head valves to radiators, repair / replacement of the boiler and / or the burner in the block / scale thermal plant;
3) The rehabilitation and modernisation of the heating and hot water distribution system, inclu-ding installation of thermostatic head valves on the radiators and the insulation of the subter-ranean / thermal duct pipes in order to reduce the losses of heat;
4) Installation, where appropriate, of alternative energy generation systems / RES – solar thermal panels, solar panels, heat pumps and / or biomass thermal power plants, including their pur-chase.26
Depending on the exact building performance and results of the initial technical audit, the following activities may also be undertaken in some cases: repair of the façade building ele-ments that are potentially hazardous to detachment and / or affect the functionality of the dwelling block, repair of the roof / the repair of the meteoric water collection system at the level of the terraces / roof cover, the dismantling of the installations and equipment mounted on the facades / terraces of the apartment building.27
3.7. Energy poverty
The legal framework related to energy poverty is covered in a detailed legislation (Law 123/2012). ANRE regulations in this respect are considered a secondary source. Nevertheless, the biding legislation does not clearly describe the concept of energy poverty as a distinct term from pov-erty overall. On the other hand, it defines the vulnerable client explicitly as a narrow class as “the final client belonging to a category of household customers who, for reasons of age, health or low income, face the risk of social exclusion and who, to prevent that risk, benefit from social protection measures, including those of a financial nature”.28 As a result, energy poverty is indi-cated by “arrears on utility bills”. Keeping this terminology in mind, we see that there has been a stable decrease of the percentage of persons considered energy poor between 2011 (27.3%)
26 Loosely translated from: ANRE (2018a), “Raport de monitorizare a implementării Planului Național de Acțiune în domeniul Eficienței Energetice (PNAEE III) – 2017”, p. 33, https://www.anre.ro/ro/eficienta-energetica/rapoarte/rapoarte-de-monitorizare-a-implementarii-planului-national-de-actiune-in-domeniul-eficientei-energetice-pnaee
27 Ibidem28 Murafa, C., Sinea, A., Jiglau, G. and Badescu, G. (2017), “Energy poverty and the vulnerable consumer: How far
are we from Europe? (Sărăcia energetică și consumatorul vulnerabil. Cât de departe suntem de Europa?)”, p. 3, https://www.energypoverty.eu/publications?field_relevant_countries%5B0%5D=RO&field_date_year=&field_date_year_1=&search_api_views_fulltext=&sort_by=field_date_year
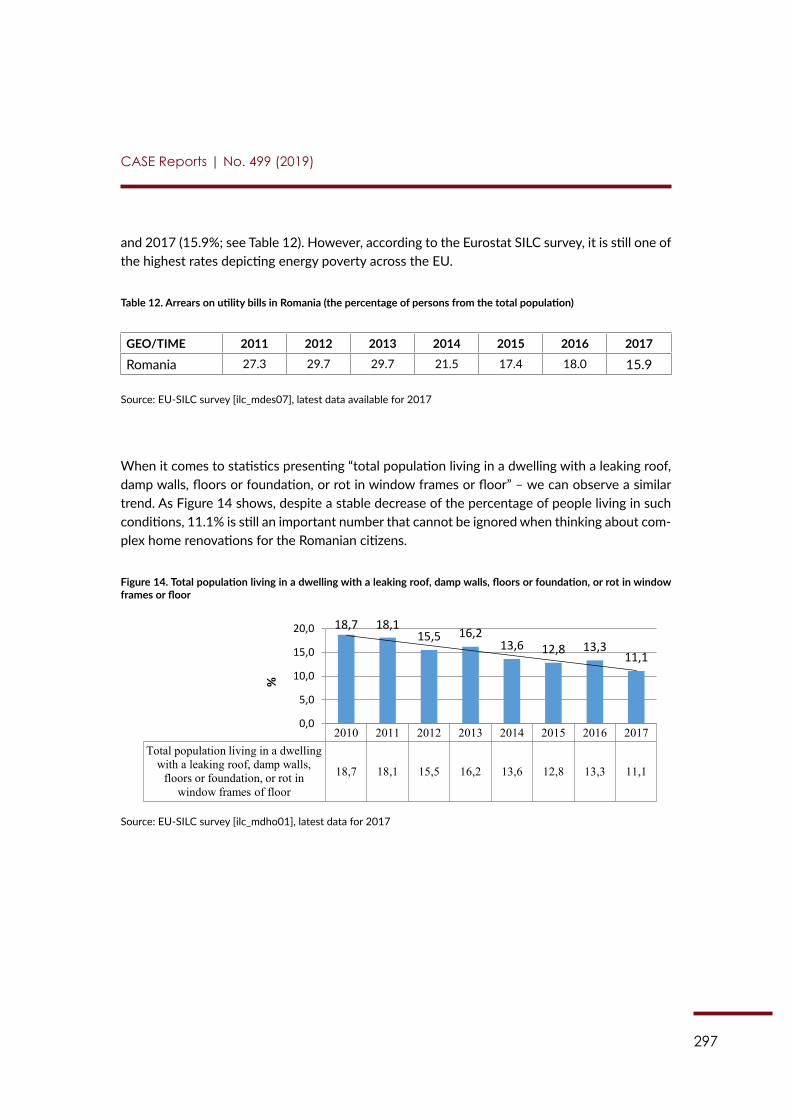
297
CASE Reports | No. 499 (2019)
and 2017 (15.9%; see Table 12). However, according to the Eurostat SILC survey, it is still one of the highest rates depicting energy poverty across the EU.
Table 12. Arrears on utility bills in Romania (the percentage of persons from the total population)
GEO/TIME 2011 2012 2013 2014 2015 2016 2017
Romania 27.3 29.7 29.7 21.5 17.4 18.0 15.9
Source: EU-SILC survey [ilc_mdes07], latest data available for 2017
When it comes to statistics presenting “total population living in a dwelling with a leaking roof, damp walls, floors or foundation, or rot in window frames or floor” – we can observe a similar trend. As Figure 14 shows, despite a stable decrease of the percentage of people living in such conditions, 11.1% is still an important number that cannot be ignored when thinking about com-plex home renovations for the Romanian citizens.
Figure 14. Total population living in a dwelling with a leaking roof, damp walls, floors or foundation, or rot in window frames or floor
246
Figure 14. Total population living in a dwelling with a leaking roof, damp walls, floors or foundation, or rot in window frames or floor
Source: EU-SILC survey [ilc_mdho01], latest data for 2017
Chapter 4: Barriers to develop the EE/RES potential in private buildings 4.1. Types of barriers
From the perspective of a potential EuroPACE investor or administrator, there are two main types of barriers to developing EE/RES for the residential building sector in Romania: financial barriers correlated with the social and economic conditions of households from a microeconomic perspective and, on the other hand, from a macroeconomic point of view, a series of legislative and administrative barriers.
First, the most important financial barrier is the low level of personal income of households. Because of this, the allocation of a share of personal income for building rehabilitation – even necessary rehabilitation – is not possible for some categories of individuals because of the high level of poverty (for instance, with retired or unemployed people). For other categories of households, thermal rehabilitation is not made a priority because many are unaware of the possible benefits that could be obtained (for instance, reduced heating bills).
There have been proposals aimed at solving these problems, such as eliminating heating aids for the households not agreeing to thermal rehabilitation.
Secondly, legislative and administrative barriers exist, particularly for public authority and for HOA willing to pursue building rehabilitations. That is because the necessary documentation required for building rehabilitation is very complex and there are no specialised bodies offering free advice and information. For this reason, an appropriate implementation of building rehabilitation has to be is supported by a very few non-governmental organisations specialised in offering consultancy in this direction through information campaign for all the actors involved: households, HOA, potential investors in this field, local municipalities, and, in some cases, even to the central authorities in order to improve and adapt the legislation to the practical needs identified. Another barrier is the ownership structure of multi-family buildings, which require all owners to come to an agreement before rehabilitation can begin.
Last but not least, another possible barrier can be the lack of training on deep renovation for (local) administrations responsible for certification of buildings (including building control and supervision bodies), designers, and construction companies.379
379 For more information see: http://bpie.eu/wp-content/uploads/2017/06/Embuild-Ro.pdf
2010 2011 2012 2013 2014 2015 2016 2017 Total population living in a dwelling
with a leaking roof, damp walls, floors or foundation, or rot in
window frames of floor
18,7 18,1 15,5 16,2 13,6 12,8 13,3 11,1
18,7 18,1 15,5 16,2
13,6 12,8 13,3 11,1
0,0
5,0
10,0
15,0
20,0
%
Source: EU-SILC survey [ilc_mdho01], latest data for 2017
298
CASE Reports | No. 499 (2019)
Chapter 4: Barriers to develop the EE/RES potential in private buildings
4.1. Types of barriers
From the perspective of a potential EuroPACE investor or administrator, there are two main types of barriers to developing EE/RES for the residential building sector in Romania: financial barriers correlated with the social and economic conditions of households from a microeco-nomic perspective and, on the other hand, from a macroeconomic point of view, a series of legislative and administrative barriers.
First, the most important financial barrier is the low level of personal income of households. Because of this, the allocation of a share of personal income for building rehabilitation – even necessary rehabilitation – is not possible for some categories of individuals because of the high level of poverty (for instance, with retired or unemployed people). For other categories of house-holds, thermal rehabilitation is not made a priority because many are unaware of the possible benefits that could be obtained (for instance, reduced heating bills).
There have been proposals aimed at solving these problems, such as eliminating heating aids for the households not agreeing to thermal rehabilitation.
Secondly, legislative and administrative barriers exist, particularly for public authority and for HOA willing to pursue building rehabilitations. That is because the necessary documentation required for building rehabilitation is very complex and there are no specialised bodies offering free advice and information. For this reason, an appropriate implementation of building reha-bilitation has to be is supported by a very few non-governmental organisations specialised in offering consultancy in this direction through information campaign for all the actors involved: households, HOA, potential investors in this field, local municipalities, and, in some cases, even to the central authorities in order to improve and adapt the legislation to the practical needs identified. Another barrier is the ownership structure of multi-family buildings, which require all owners to come to an agreement before rehabilitation can begin.
Last but not least, another possible barrier can be the lack of training on deep renovation for (local) administrations responsible for certification of buildings (including building control and supervision bodies), designers, and construction companies.29
4.2. Lack of market push for EE investments
The EE services offered by the market are still below optimal levels as the implementation of the European directives has been made in a relatively short time and grants and subsidies are still dominating instruments. According to the WB,30 “the market does not yet have the requisite
29 For more information see: http://bpie.eu/wp-content/uploads/2017/06/Embuild-Ro.pdf 30 World Bank (2015), “Housing in Romania – Towards a National Housing Strategy”, p. 150, http://documents.world-
bank.org/curated/en/552171468585744221/pdf/106856-REVISED-WP-RomaniaHousingRASOutputFinal-HousingAssessment-PUBLIC.pdf
299
CASE Reports | No. 499 (2019)
skills or capacity to deliver quality services in this sector. Skills improvement is required in all relevant professions such as architects, engineers, installers as well as auditing personnel. The National Institute for Building Research, INCERC, is already developing and running qualifica-tion schemes for installers of thermal insulation schemes through the project BUILD-UP Skills financed by Intelligent Energy Europe”. The potential outcomes can only be assessed in a few years though.
4.3. Social perception
Another barrier to making investments to improve the EE of buildings is related to the reluc-tance of owners and the lack of convergence of their income with EU salaries. Many owners are retired people with a low level of income, and potential expenditures related to building reha-bilitation represent an important share of their personal income. Another cause of reluctance is a lack of confidence in the quality of the works as well as the resistance of the works. Unfor-tunately, there have been no studies to-date conducted on the social perceptions of building energy improvement. However, a good financing mechanism for EE, particularly one offering money up-front (easy to obtain funds, verified works conducted by experts employed by local or central authorities), could have a positive impact on social perceptions.
300
CASE Reports | No. 499 (2019)
Chapter 5: Policies related to EE/RES in buildings
5.1. Transposition of the European Directive on Energy Performance in Buildings and other EU legislation related to EE/RES in buildings
The transposition of Directive 2012/27/UE on EE was realised in 2014 when Law no. 121/2014 on EE entered into force. The main purpose of the Law is to establish a coherent legislative framework for the development and application of the national EE policy in order to achieve its targets. On 19 July 2016, the Romanian Parliament adopted Law no. 160 / 2016 amending and completing EE Law no. 121 / 2014. As a result, a target of reducing energy consumption by 19% before 2020 has been agreed.31
In order to meet this target, the National Programme for Improvement of Energy Perfor-mance in Residential Blocks aims to “increase energy performance in residential blocks built as per projects prepared until December 2005 by reducing energy consumption in heating, so that the annual specific energy consumption calculated for the heating of households falls below 100 kWh/m2 of useful area; to ensure and maintain heat indoors; to reduce greenhouse gas emis-sions and to introduce, where applicable, alternative energy production sources; and to improve the urban aspect of localities”.32
Revised Directive for the Labelling of Energy-related Products (Directive 2010/30/EU) – EE improvement of heating-cooling systems on individual housing
Although Odyssee-Mure considers this policy’s impact medium, “the measure fully transpos-es into the Romanian legislation the Commission Directive 2002/31/EC implementing Council Directive 92/75/EEC with regards to the energy labelling of household air-conditioners. The Government adopted the Decision 407/2003 on establishing the energy labelling and EE re-quirements for introducing on the market household air-conditioners that entered in force in April 2004. The Government Decision 407/2003 was replaced by the Government Decision 1871/2005 in order to meet further amendments of the Commission Directive 2002/31/EC, including also provisions regarding the noise requirements, as well as the Romanian standards adopted in line with the European standards”.33
5.2. Policy objectives in terms of building renovation
According to the ANRE, the purpose of the National Programme to increase the energy per-formance of the dwelling blocks, according to GEO no. 18/2009, with the subsequent amend-ments and completions and of the Common Order MDRL no. 163/2009, on the approval of the
31 For more information see: https://ec.europa.eu/energy/sites/ener/files/documents/ro_annual_report_2018_en.pdf (p. 4)
32 Ibidem, p. 51.33 For more information see: http://www.odyssee-mure.eu/publications/efficiency-trends-policies-profiles/romania.
html#buildings
301
CASE Reports | No. 499 (2019)
Methodological Norms for the application of GOE no. 18/2009, as amended and supplemented, is to:34
• increase the energy performance of housing blocks built before December 2005 by re-ducing heating energy consumption so that the specific annual energy consumption cal-culated for heating the dwellings is below 100 kWh / m² per useful area;
• ensure and maintain the indoor thermal climate;• reduce greenhouse gas emissions and introduce, where appropriate, alternative sources
of energy generation; and• improve the urban aspect of localities.
5.3. Other legal developments in the area of energy performance in buildings and use of RES in buildings
Two financial programmes for thermal rehabilitation have been developed thus far:1. The National Programme for the Energy Performance Improvement of Housing Blocks
applies to blocks of flats built in the period 1950-1990. According to the National EE Action Plans (NEEAPs) (2017)35 between 2009 and 2016, EE works were executed in 1,657 blocks of flats in various climatic zones, representing about 62,559 apartments. The resulting energy savings are 0.04840 million toe.
2. The Thermal Rehabilitation Programme of residential buildings is financed by govern-ment-guaranteed bank loans. Through this initiative, through 31 December 2016, 13 ho-using blocks from various climatic zones were modernised (summing to 620 flats and 3 individual buildings). The total energy saving was 0.000623 million toe.36
5.4. Economic incentives
Grants from the state and local budgets
According to Law no. 231/2017 for modification and Government Emergency Ordinance no. 18/2009, concerning increasing the energy performance of housing blocks, the financing mech-anism is divided as follow:
• 60% from the state budget allocations, within the limits of the funds approved annually for this purpose in the budget of the Ministry of Regional Development, Public Adminis-tration and European Funds;
34 Loosely translated from: ANRE (2018a), “Raport de monitorizare a implementării Planului Național de Acțiune în domeniul Eficienței Energetice (PNAEE III) – 2017”, p. 32, https://www.anre.ro/ro/eficienta-energetica/rapoarte/rapoarte-de-monitorizare-a-implementarii-planului-national-de-actiune-in-domeniul-eficientei-energetice-pnaee
35 For more information see: https://ec.europa.eu/energy/en/topics/energy-efficiency/energy-efficiency-directive/national-energy-efficiency-action-plans
36 For more information see: https://ec.europa.eu/energy/sites/ener/files/documents/ro_neeap_ro.pdf
302
CASE Reports | No. 499 (2019)
• 40% from funds approved annually for this purpose in local budgets and / or other legally constituted sources, as well as from the repairers’ fund of the owners’ associations and / or other legally constituted sources.
The share of own contribution of the local public administration authorities is determined on the basis of socio-economic criteria, within a maximum of 30% of the value of the execution of the intervention works and is approved by a decision of the local councils. The contribution share of the owners’ association may not be less than 10% of the value of the execution of the intervention works and shall be ensured by it during the execution of the intervention works on the basis of the works.
Thermal Rehabilitation of Residential Buildings financed by bank loans with government guarantee
This already mentioned initiative enables building owners financing for thermal rehabilitation through loans which are more beneficial than typical bank credits simply because they are sup-ported by a government guarantees. This, by default, means lower interest rates for the lenders. At least 10% of the costs need to be paid in advance by home owners. Only properties built before 2000 are eligible for the financing. Apart from thermal rehabilitation of the building en-velope, replacement of the old and ineffective heating system may also be financed.37
Building tax exemptions
According to the Romanian Fiscal Code,38 local councils may decide to grant or reduce the tax on buildings for the following buildings: buildings where the owners executed at their own ex-pense intervention works increasing energy performance of their properties, confirmed by the official report of the acceptance of works – for example in a form of the Energy Performance Certificates (EPCs) or, as the case may be, in the energy audit report, as provided for in GEO no. 18/2009 on increasing the energy performance of housing blocks, approved with amendments and completions by Law no. 158/2011, as amended and supplemented. Based on this legisla-tive provision, municipalities may approve the exemption of 100% for the building tax for seven years.39
Moreover, in the case of the abovementioned thermal rehabilitation programme for residen-tial buildings (blocks of apartments and multi-residential buildings) financed by bank loans with government guarantees, municipalities are also allowed to provide tax reductions for the HOA and its respective members.40
37 EU Commission (2015), “Energy efficiency in public and residential buildings – Final Report Work Package 8 – Eval-uation of Cohesion Policy programmes 2007-2013. Annex 2,” p. 40, https://ec.europa.eu/regional_policy/sources/docgener/evaluation/pdf/expost2013/wp8_final_report.pdf
38 Romanian Fiscal Code, art. 456, (2) (m) available at https://static.anaf.ro/static/10/Anaf/legislatie/Cod_fiscal_norme_08012019.htm#A455
39 For more information see: https://storage.primariaclujnapoca.ro/userfiles/files/PH40f_20_12_2011.pdf40 Energy Efficiency Policies in Europe (2015), “Country Report-Romania, Energy Efficiency Plan, Analysis of National
Energy Efficiency Action Plans and Policies in EU Member States 2014”, p. 6, available at: http://www.energy-
https://ec.europa.eu/regional_policy/sources/docgener/evaluation/pdf/expost2013/wp8_final_report.pdf
303
CASE Reports | No. 499 (2019)
5.5. Policies to support households in energy poverty situation
The EU Energy Poverty Observatory (EPOV) collected an exclusive list of programmes which have been developed to fight energy poverty in Romania:
1. “Improving EE in Households and Low-Income Communities in Romania: This program-me worked on integrating energy poverty in Romanian policies, as well as carrying out energy efficiency measures in a few locations (starting year 2011).
2. Programme for EE renovations in apartment buildings: This measure finances EE im-provements in the residential sector, with a particular emphasis on apartment buildings (starting year 2009).
3. Ordinance on EE improvements financed with loans: This measure finances EE impro-vements in the residential sector through government guaranteed loans (starting year 2010).
4. Disconnection protection vulnerable consumers: according to Law no. 123/10 July 2012, it is prohibited to disconnect vulnerable consumers from the electricity network (starting year 2011).
5. Heating aid during winter: This measure provides financial assistance to households to pay their heating bills during the winter (November 1 – March 31).
6. Minimum income: This measure provides households with a minimum income to ensure a minimal standard of living.
7. Social tariff: This measure provides financial assistance to households to pay their energy bills through a social tariff. As a result, around 11% of Romanian households benefitted from the social tariff in 2016”.41
5.6. Other policy developments
The Green House Programme was launched in 2010 to boost purchases and installations of RES (solar, wood waste, and geothermal energy sources) in residential buildings across the country. Grants for this particular initiative are provided by the Environmental Fund (AFM). The grant amounts up to EUR 1,390 for solar thermal systems and biomass (solid) and EUR 1,850 for heat pumps according to the programme’s website.42
5.7. Initiatives at local level to promote EE/RES in private buildings
Additionally, various local initiatives that could help in EuroPACE development exist. Currently, 73 Romanian municipalities are Covenant of Mayors signatories and have implemented Sustain-
efficiency-watch.org/fileadmin/eew_documents/EEW3/Country_Reports_EEW3/Romania/Country_Report_Ro-mania_FINAL.pdf
41 For more information see: https://www.energypoverty.eu42 Buildings Performance Institute Europe – BPIE (2012), “Implementing nearly Zero-Energy Buildings (nZEB) in Ro-
mania – towards a definition and road map”, p.19, http://bpie.eu/wp-content/uploads/2015/10/nZEB-Full-Report-Romania.pdf
304
CASE Reports | No. 499 (2019)
able Energy Action Plans (SEAPs) and Sustainable Mobility Action Plans.43 Additionally, one city (Targu-Mures) is a member of the Climate Alliance.44 These cities could be particularly interested in developing a new financial instrument aligned with their SEAPs objectives.
Another initiative worth mentioning is Energy Cities Romania – ECR. This non-governmental organisation launched in 2017 brings together 37 members (35 municipalities and 2 metropoli-tan areas), focuses on improving EE in urban public services (heating, public lighting, water and gas supply, the collection, storage and transport of household waste, etc.) and the promotion of RES and sustainable urban mobility. Effectively, it could become a promoter of the EuroPACE initiative.
What is more, the Romania Green Building Councils is a non-profit, non-political association of businesses and other organisations active throughout the country, promoting environmental responsibility and EE in the design, construction, operation, and deconstruction of Romania’s buildings. Most likely, they could also become interested in promoting innovative instruments targeting EE and RES in residential buildings.
Additionally, there are several smaller associations which provide specialised services in the area of EE that may be able to support EuroPACE implementation:
1. Renewable Energies Employers Organization (RENERG) www.ugir1903.org;2. The Federation of Environment Employers Organizations;3. Employers Association for New Energy Sources (SUNE); 4. Employers Association for the Thermal Insulation Carpentry Manufacturers (PPTT);5. The Association of Buildings Energy Auditors www.aaec.ro; and6. The Romanian Association of Installation Engineers www.aiiro.ro.Last but not least, the city of Cluj Napoca won a project worth EUR 1,162,499 aimed at
installation of RES-based heating systems. Replacement or supplementation of the classic sys-tems for the production of thermal energy for heating and hot water consumption, with al-ternative systems that use RES in order to increase the efficiency of the centralised system of production and distribution of thermal energy at quaternary thermal power plants in a large scale in Cluj-Napoca is worth mentioning as this is an argument thanks to which Cluj Napoca is recommended for a EuroPACE pilot city.45 Thanks to implementation of such projects, the local officials already have an experience in piloting and implementing entirely new solutions what seems crucial for the purpose of the EuroPACE project appropriate development.
Additionally, Cluj Napoca is developing EE for public and residential buildings (Increasing the EE of housing blocks) financed through Regional Operational Programme 2014-2020, Priority Axis 3.3.1., with a total amount of EUR 13,578,558.45 (EU sources). Increasing EE consists of improving thermal insulation and waterproofing of the building envelope (glazed and opaque part) and other measures such as removing apparently installed installations and equipment,
43 https://www.covenantofmayors.eu/about/covenant-community/signatories.html44 For more information see: http://www.climatealliance.org/nc/municipalities/the-network.html?tx_i6camembers_
i6camemberslist%5Baction%5D=list&tx_i6camembers_i6camemberslist%5Bcontroller%5D=Members
45 For more information see: https://storage.primariaclujnapoca.ro/userfiles/files/proiecte_europene.pdf
305
CASE Reports | No. 499 (2019)
façade repairs. Expected results: 58 rehabilitated buildings, 2,511 rehabilitated apartments.46 Once this initiative is over, a window of opportunity for new large-scale projects will become even greater.
46 For more information see: https://primariaclujnapoca.ro/proiecte-europene/eficienta-energetica/
306
CASE Reports | No. 499 (2019)
Conclusions
From multiple barriers for obtaining better results in the field of EE, the most important one remains related to the financing mechanisms which are not attractive enough for all the actors involved (starting with building owners, local authorities, municipalities, and investors). Solu-tions adopted for the rehabilitation and renovation of dwellings and residential buildings thus far proved to be ineffective and with very poor results. It is necessary to adopt a new strategy based on an adequate funding mechanism that is easily accessed and implemented for all in-volved actors: government, municipalities, and households – and EuroPACE seems to meet all these expectations.
In the end, the main results of this study highlight the need to introduce an innovative fi-nancing mechanism for residential building rehabilitation in Romania, as an up-front financial instrument could become an important engine for stimulating thermal refurbishment across the country. With one of the highest rates of home ownership across the EU, and given the inefficiency of the residential building stock, Romania has great potential to develop a scheme focused predominantly on private owners, particularly in the city of Cluj Napoca where local officials are already well-positioned to manage large-scale EE- and RES-focused projects. The average income per household is indeed one of the lowest across the EU, but salaries are in-creasing, which may motivate households to invest in improvements. At the same time, there are already programmes and incentives in place that could be easily blended with EuroPACE. Moreover, according to Directive (EU) 2018/844 “Building Renovation” was changed with “Long Term Renovation Strategy”, what gives a clear indication of the purpose of modernisation activi-ties in general. Introducing an on-tax financing scheme (repaid within 20 years, for example) in Romania can be a step forward to accomplish the requirement of Directive (EU) 2018/844 for assuring a long-term renovation strategy.
“Though the national legislation is correlated and adapted with the European legislation con-cerning the implementation of measures to increase the EE of buildings in order to protect the environment by reducing greenhouse gases and reducing the consumption of energy resources, the financing solutions of these expenditures adopted in Romania, however, are completely different from the other states of the EU. The normative acts issued in this field were not suf-ficiently coherent, as some inconsistencies were identified, which led to great delays in the start of the programme”47 is the conclusion presented by Romanian Court of Accounts after the audit realised for 2010-2014 concerning building rehabilitation in the city of Bucharest. This conclu-sion is perhaps the most important trigger for developing an entirely new, less bureaucratic instrument.
The following SWOT analysis summarises the pros and cons related to EuroPACE develop-ment:
47 Curtea de Conturi a României, 2015, Sinteza Rapoartelor de auditul performanței utilizării fondurilor publice pentru reabilitarea termică a blocurilor de locuințe la nivelul Sectoarelor Municipiului București, în perioada 2010-2014, p.26, http://www.curteadeconturi.ro/Publicatii/SINTEZA%20_reabilitarea_term.pdf
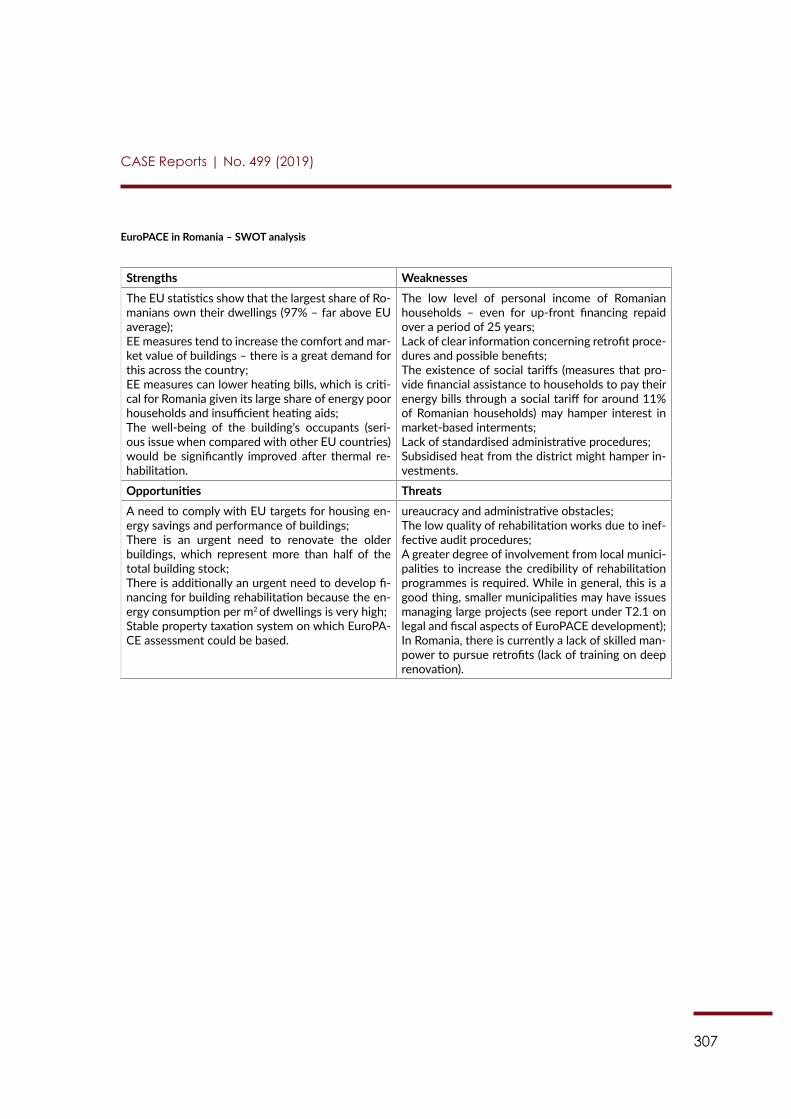
307
CASE Reports | No. 499 (2019)
EuroPACE in Romania – SWOT analysis
Strengths WeaknessesThe EU statistics show that the largest share of Ro-manians own their dwellings (97% – far above EU average);EE measures tend to increase the comfort and mar-ket value of buildings – there is a great demand for this across the country;EE measures can lower heating bills, which is criti-cal for Romania given its large share of energy poor households and insufficient heating aids;The well-being of the building’s occupants (seri-ous issue when compared with other EU countries) would be significantly improved after thermal re-habilitation.
The low level of personal income of Romanian households – even for up-front financing repaid over a period of 25 years;Lack of clear information concerning retrofit proce-dures and possible benefits;The existence of social tariffs (measures that pro-vide financial assistance to households to pay their energy bills through a social tariff for around 11% of Romanian households) may hamper interest in market-based interments;Lack of standardised administrative procedures;Subsidised heat from the district might hamper in-vestments.
Opportunities ThreatsA need to comply with EU targets for housing en-ergy savings and performance of buildings;There is an urgent need to renovate the older buildings, which represent more than half of the total building stock;There is additionally an urgent need to develop fi-nancing for building rehabilitation because the en-ergy consumption per m2 of dwellings is very high;Stable property taxation system on which EuroPA-CE assessment could be based.
ureaucracy and administrative obstacles;The low quality of rehabilitation works due to inef-fective audit procedures;A greater degree of involvement from local munici-palities to increase the credibility of rehabilitation programmes is required. While in general, this is a good thing, smaller municipalities may have issues managing large projects (see report under T2.1 on legal and fiscal aspects of EuroPACE development);In Romania, there is currently a lack of skilled man-power to pursue retrofits (lack of training on deep renovation).
308
CASE Reports | No. 499 (2019)
References
ANRE (2017), “National Energy Efficiency Action Plans” (Planul Naţional de Acţiune privind Eficienţa Energetică 2017-2020 IV), available at: https://ec.europa.eu/energy/sites/ener/files/documents/ro_neeap_ro.pdf.
ANRE (2018a), “Raport de monitorizare a implementării Planului Național de Acțiune în dome-niul Eficienței Energetice (PNAEE III) – 2017”, available at: https://www.anre.ro/ro/eficienta-energetica/rapoarte/rapoarte-de-monitorizare-a-implementarii-planului-national-de-actiune-in-domeniul-eficientei-energetice-pnaee.
ANRE (2018b), “Report on the progress achieved in the fulfilment of national energy efficiency objectives”, available at: https://ec.europa.eu/energy/sites/ener/files/documents/ro_annual_re-port_2018_en.pdf.
Buildings Performance Institute Europe – BPIE (2012), “Implementing nearly Zero-Energy Build-ings (nZEB) in Romania – towards a definition and road map”, available at: http://bpie.eu/wp-content/uploads/2015/10/nZEB-Full-Report-Romania.pdf.
Concerted Action EPBD (2015), “2016 Implementing the Energy Performance of Buildings Di-rective (EPBD) – Featuring country reports”, available at: https://www.dropbox.com/s/vaq0h-8if64ypmlh/CA3-BOOK-2016-web.pdf?dl=0.
Curtea de Conturi a României (2015), “Sinteza Rapoartelor de auditul performanței utilizării fondurilor publice pentru reabilitarea termică a blocurilor de locuințe la nivelul Sectoarelor Mu-nicipiului București, în perioada 2010 – 2014”, available at: http://www.curteadeconturi.ro/Pub-licatii/SINTEZA%20_reabilitarea_term.pdf.
Energy Efficiency Policies in Europe (2015), “Country Report-Romania, Energy Efficiency Plan, Analysis of National Energy Efficiency Action Plans and Policies in EU Member States 2014”, available at: http://www.energy-efficiency-watch.org/fileadmin/eew_documents/EEW3/Coun-try_Reports_EEW3/Romania/Country_Report_Romania_FINAL.pdf.
EU Commission (2015), “Energy efficiency in public and residential buildings – Final Report Work Package 8 – Evaluation of Cohesion Policy programmes 2007-2013. Annex 2”, available at: https://ec.europa.eu/regional_policy/sources/docgener/evaluation/pdf/expost2013/wp8_final_report.pdf.
EuroACE , (2018), “A Guide to the Implementation of the Amended Energy Performance of Buildings Directive”, available at: https://euroace.org/wp-content/uploads/2018/11/EuroACE-Guide-to-EPBD-Implementation-web-version.pdf.
https://ec.europa.eu/regional_policy/sources/docgener/evaluation/pdf/expost2013/wp8_final_report.pdf
309
CASE Reports | No. 499 (2019)
Euroheat and Power (2015), “District Heating and Cooling country by country Survey 2015”, available at: https://www.euroheat.org/publications/country-by-country/.
European Commission (2017), “Country Report Romania 2017”, Commission Staff Working Doc-ument, SWD (2017).
Eurostat (2018), “Energy balance sheets 2016 Data”, available at: https://ec.europa.eu/euro-stat/documents/3217494/9172750/KS-EN-18-001-EN-N.pdf/474c2308-002a-40cd-87b6-9364209bf936.
Ministerul Dezvoltării Regionale, Administraţiei Publice şi Fondurilor Europene – MDRAP (2017), “Strategia pentru mobilizarea investiţiilor în renovarea fondului de clădiri rezidenţiale şi comer-ciale, atât publice cât şi private, existente la nivel national”, available at: http://www.mdrap.ro/userfiles/Strategie_renovare_cladiri_2017%20final_23octombrie2017.pdf.
Ministerul Dezvoltării Regionale, Administraţiei Publice şi Fondurilor Europene – MDRAP (2017), “Strategia Națională a Locuirii”, available at: http://www.mmediu.ro/app/webroot/up-loads/files/2017_11_09_Strategia_Nationala_a_Locuirii_2017-2030.pdf.
Muntean, D. M. et al. (2017), “Large Prefabricated Concrete Panels Collective Dwellings from the 1970s: Context and Improvements”, IOP Conf. Ser.: Mater. Sci. Eng. 245 052050, available at: https://iopscience.iop.org/article/10.1088/1757-899X/245/5/052050/pdf.
Murafa, C., Sinea, A., Jiglau, G., and Badescu, G. (2017), “Energy poverty and the vulnerable consumer: How far are we from Europe?” (Sărăcia energetică și consumatorul vulnerabil. Cât de departe suntem de Europa?), available at: https://www.energypoverty.eu/publications?field_relevant_countries%5B0%5D=RO&field_date_year=&field_date_year_1=&search_api_views_fulltext=&sort_by=field_date_year.
Teodosiu, R., Teodosiu, C. (2015), “Building stock refurbishment in Romania. A case study in Bucharest”, International Journal of Civil and Structural Engineering–IJCSE, Volume 2: Issue 2, available at: https://www.researchgate.net/publication/286454298_Building_stock_refurbish-ment_in_Romania_A_case_study_in_Bucharest.
Trotta, G., and Lorek, S. (2018), “Consumers and Energy Efficiency – Stock taking of policy in-struments targeting household energy efficiency”, EUFORIE – European Futures for Energy Ef-ficiency, available at: https://www.utu.fi/en/units/euforie/Research/deliverables/Documents/Euforie-D5.1_revised-10012018.pdf.
310
CASE Reports | No. 499 (2019)
World Bank (2015), “Housing in Romania – Towards a National Housing Strategy”, available at: http://documents.worldbank.org/curated/en/552171468585744221/pdf/106856-REVISED-WP-RomaniaHousingRASOutputFinalHousingAssessment-PUBLIC.pdf.
Legislation
Directive (EU) 2018/844 of the European Parliament and of the Council of 30 May 2018 amend-ing Directive 2010/31/EU on the energy performance of buildings and Directive 2012/27/EU on energy efficiency, available at: https://eur-lex.europa.eu/legal-content/EN/TXT/?uri=uriserv%3AOJ.L_.2018.156.01.0075.01.ENG.
Directive 2012/27/EU of the European Parliament and of the Council of 25 October 2012 on energy efficiency, amending Directives 2009/125/EC and 2010/30/EU and repealing Direc-tives 2004/8/EC and 2006/32/EC. Off. J. Eur. Union 2012, L 315, 1–56., available at: https://eur-lex.europa.eu/legal-content/EN/TXT/?uri=celex%3A32012L0027.
Directive 2002/91/EC of the European Parliament and of the Council of 16 December 2002 on the energy performance of buildings, Official Journal L 001, 04/01/2003 P. 0065 – 0071, avail-able at: https://eur-lex.europa.eu/legal-content/EN/TXT/?uri=CELEX%3A32002L0091.
Commission Directive 2002/31/EC of 22 March 2002 implementing Council Directive 92/75/EEC with regard to energy labelling of household air-conditioners, Official Journal L 086 , 03/04/2002 P. 0026 – 0041, available at: https://eur-lex.europa.eu/legal-content/EN/TXT/?uri=CELEX%3A32002L0031.
Romanian Fiscal Code, art. 456, (2) (m), available at: https://static.anaf.ro/static/10/Anaf/legis-latie/Cod_fiscal_norme_08012019.htm#A455.
Law no. 196/2018 for modifying the previous Law no. 230/2007 on the establishment, organi-zation and functioning of the owners’ associations, published in the Official Journal of Romania no. 660/2018, http://legislatie.just.ro/Public/DetaliiDocument/203233.
Law no. 231/2017 for modification and completion Government Emergency Ordinance no. 18/2009 concerning the energy performance of housing blocks, published in the Official Journal of Romania no. 961/2017, available at: http://legislatie.just.ro/Public/DetaliiDocument/195432.
Law no. 196/2016 on minimum inclusion income, published in the Official Journal of Romania, no. 882/2016, available at: http://legislatie.just.ro/Public/DetaliiDocument/183328.
311
CASE Reports | No. 499 (2019)
Law no. 121/2014 on energy efficiency on 18 July 2014, which was published in the Official Journal of Romania, Part I no. 574 of 1 August 2014, available at: http://legislatie.just.ro/Public/DetaliiDocument/160331.
Law no. 123/2012 of electricity and natural gas, published in the Official Journal of Romania no. 485/2012, available at: https://www.anre.ro/en/electric-energy/legislation/primary-legisla-tion1387198683.
Law no. 158/2011 for the approval of Government Emergency Ordinance no. 18/2009 on in-creasing the energy performance of housing blocks, published in the Official Journal of Romania no. 503/2011, available at: http://legislatie.just.ro/Public/DetaliiDocument/130073.
Law no. 76/2011 for the approval of Government Emergency Ordinance no. 69/2010 on the thermal rehabilitation of dwelling buildings financed by government guaranteed bank loans, published in the Official Journal of Romania no. 403/2011, available at: http://legislatie.just.ro/Public/DetaliiDocument/129187.
Law no. 287/2009, published in the Official Journal of Romania no. 505/2011, available at: http://legislatie.just.ro/Public/DetaliiDocumentAfis/130142.
Law no. 230/2007 regarding the establishment, organization and functioning of the owners’ associations, published in the Official Journal of Romania no. 490/2007, available at: http://legislatie.just.ro/Public/DetaliiDocument/83753.
Law 260/2006 on the approval of Government Emergency Ordinance no. 187/2005 for the amendment of Government Emergency Ordinance no. 174/2002 on the establishment of spe-cial measures for the thermal rehabilitation of multi-level residential buildings, published in the Official Journal of Romania no. 575/2006, available at: http://legislatie.just.ro/Public/Detali-iDocumentAfis/73138.
Law 211/2003, published in the Official Journal of Romania no. 351 /2003, available at: http://legislatie.just.ro/Public/DetaliiDocument/43877.
The Housing Law 114/1996, published in the Official Journal of Romania no. 254/1996, avail-able at: http://legislatie.just.ro/Public/DetaliiDocument/171323.
Government Emergency Ordinance (GEO) no. 69/2010 the thermal rehabilitation of residential buildings financed by bank loans with government guarantee, published in the Official Journal of Romania no. 443/2010, available at: http://legislatie.just.ro/Public/DetaliiDocument/119995.

312
CASE Reports | No. 499 (2019)
Government Emergency Ordinance (GEO) no. 18/2009 on improving the energy performance of residential buildings, published in the Official Journal of Romania, Part I no. 155/2009, available at: http://legislatie.just.ro/Public/DetaliiDocument/103284.
Government Emergency Ordinance (GEO) no. 210/2008, published in Official Journal of Roma-nia, Part I no. 835/2008, available at: http://legislatie.just.ro/Public/DetaliiDocument/100210.
Government Emergency Ordinance (GEO) 174/2002, regarding the establishment of special measures for thermal rehabilitation of condominiums, published in the Official Journal of Roma-nia no. 890/2002, available at: http://legislatie.just.ro/Public/DetaliiDocument/40417.
Government Decision 363/2010 published in the Official Journal of Romania no. 311/12.05/2010, SCOST-04/MDRT, available at: http://legislatie.just.ro/Public/DetaliiDocument/118689.
Order no. 163 of March 17, 2009 of the Ministry of Regional Development and Public Admin-istration (MDRAP) for the approval of the Methodological Norms for the application of Gov-ernment Emergency Ordinance no. 18/2009 on increasing the energy performance of housing blocks, published in the Official Journal of Romania no. 194/2009, available at: http://legislatie.just.ro/Public/DetaliiDocument/103911.
Order no. 540/2009 of the Ministry of Public Finance (MFP) for the approval of the Method-ological Norms for the application of Government Emergency Ordinance no. 18/2009 on in-creasing the energy performance of housing blocks, available at: http://legislatie.just.ro/Public/DetaliiDocument/103917.
Websites
http://bpie.eu/wp-content/uploads/2017/06/Embuild-Ro.pdf
http://energie.gov.ro/
http://publenef-project.eu/wp-content/uploads/2017/01/GP55-AEEPM-Bucharest1-SEAP-Eng.pdf
http://publications.jrc.ec.europa.eu/repository/bitstream/JRC110326/efficiency_trends_2017__final_lr.pdf
http://www.b365.ro/cat-platesc-bucurestenii-la-reabilitarea-termica-a-blocurilor-din-fonduri-ue-calcule-ap-1-4-camere_235705.htm
313
CASE Reports | No. 499 (2019)
http://www.climatealliance.org/nc/municipalities/the-network.html?tx_i6camembers_i6camemberslist%5Baction%5D=list&tx_i6camembers_i6camemberslist%5Bcontroller%5D=Members
http://www.eib.org/projects/publications/the_eib_supporting_energy_efficiency.html
http://www.insse.ro/cms/ro/tags/conditiile-de-viata-ale-populatiei-din-romania
http://www.odyssee-mure.eu/publications/efficiency-by-sector/households/average-energy-consumption-dwelling.html
http://www.odyssee-mure.eu/publications/efficiency-trends-policies-profiles/romania.html#buildings
https://ec.europa.eu/energy/en/eubuildings
https://ec.europa.eu/energy/en/eu-buildings-factsheets
https://ec.europa.eu/energy/en/topics/energy-efficiency/energy-efficiency-directive/national-energy-efficiency-action-plans
https://ec.europa.eu/energy/sites/ener/files/documents/ro_annual_report_2018_en.pdf
https://ec.europa.eu/energy/sites/ener/files/documents/ro_neeap_ro.pdf
https://ec.europa.eu/eurostat/news/themes-in-the-spotlight/energy-prices-2017
https://ec.europa.eu/eurostat/statistics-explained/index.php/Construction_of_buildings_sta-tistics_-_NACE_Rev._2
https://ec.europa.eu/eurostat/statistics-explained/index.php/Electricity_price_statistics
https://ec.europa.eu/eurostat/statistics-explained/index.php/Housing_statistics
https://ec.europa.eu/eurostat/statistics-explained/index.php?title=Energy_statistics_-_an_overview
https://ec.europa.eu/eurostat/statistics-explained/index.php?title=People_in_the_EU_-_statis-tics_on_household_and_family_structures
https://measuring-progress.eu/mean-equivalised-net-income
314
CASE Reports | No. 499 (2019)
https://primariaclujnapoca.ro/proiecte-europene/eficienta-energetica/
https://storage.primariaclujnapoca.ro/userfiles/files/PH40f_20_12_2011.pdf
https://storage.primariaclujnapoca.ro/userfiles/files/proiecte_europene.pdf
https://www.covenantofmayors.eu/about/covenant-community/signatories.html
https://www.eea.europa.eu/publications/energy-support-measures/romania-country-profile/view
https://www.energypoverty.eu
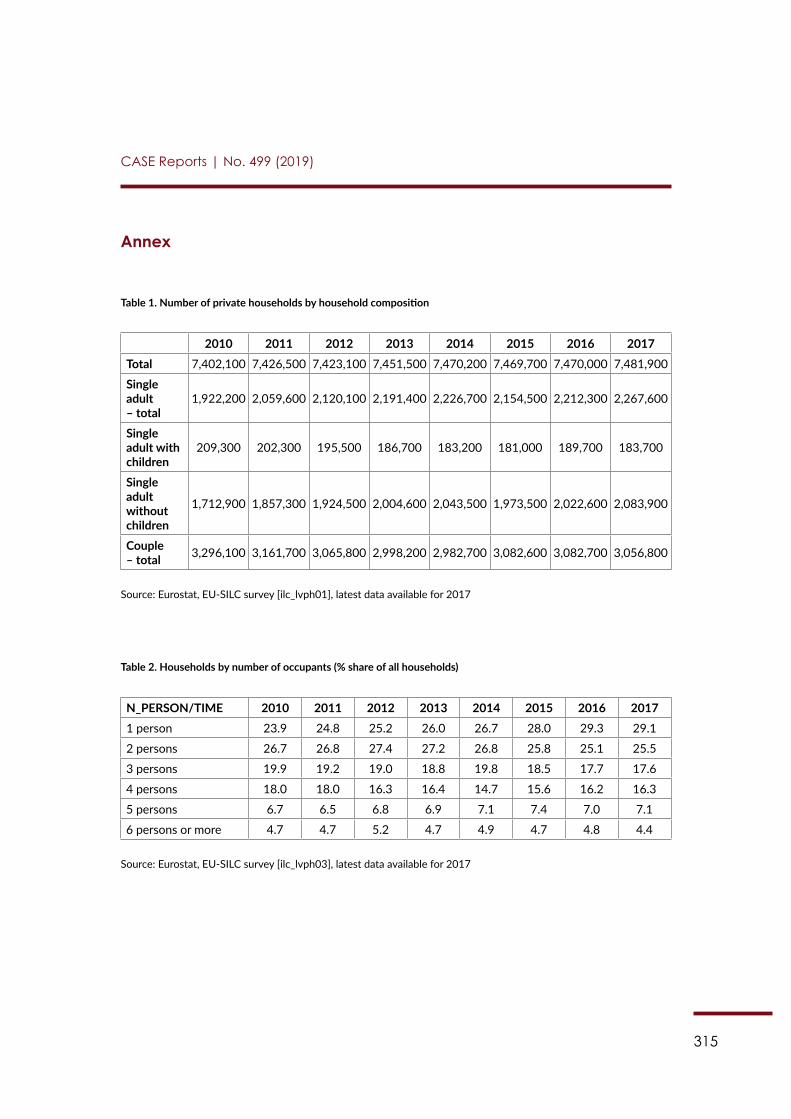
315
CASE Reports | No. 499 (2019)
Annex
Table 1. Number of private households by household composition
2010 2011 2012 2013 2014 2015 2016 2017Total 7,402,100 7,426,500 7,423,100 7,451,500 7,470,200 7,469,700 7,470,000 7,481,900
Single adult – total
1,922,200 2,059,600 2,120,100 2,191,400 2,226,700 2,154,500 2,212,300 2,267,600
Single adult with children
209,300 202,300 195,500 186,700 183,200 181,000 189,700 183,700
Single adult without children
1,712,900 1,857,300 1,924,500 2,004,600 2,043,500 1,973,500 2,022,600 2,083,900
Couple – total 3,296,100 3,161,700 3,065,800 2,998,200 2,982,700 3,082,600 3,082,700 3,056,800
Source: Eurostat, EU-SILC survey [ilc_lvph01], latest data available for 2017
Table 2. Households by number of occupants (% share of all households)
N_PERSON/TIME 2010 2011 2012 2013 2014 2015 2016 20171 person 23.9 24.8 25.2 26.0 26.7 28.0 29.3 29.1
2 persons 26.7 26.8 27.4 27.2 26.8 25.8 25.1 25.5
3 persons 19.9 19.2 19.0 18.8 19.8 18.5 17.7 17.6
4 persons 18.0 18.0 16.3 16.4 14.7 15.6 16.2 16.3
5 persons 6.7 6.5 6.8 6.9 7.1 7.4 7.0 7.1
6 persons or more 4.7 4.7 5.2 4.7 4.9 4.7 4.8 4.4
Source: Eurostat, EU-SILC survey [ilc_lvph03], latest data available for 2017
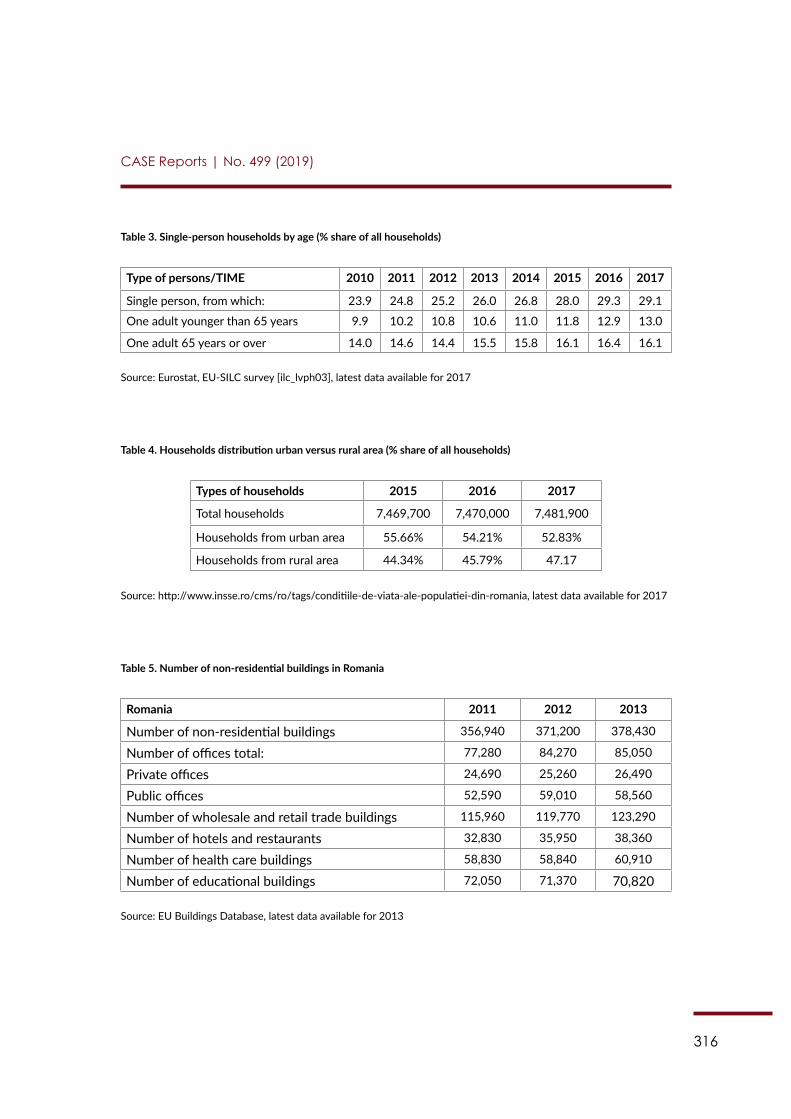
316
CASE Reports | No. 499 (2019)
Table 3. Single-person households by age (% share of all households)
Type of persons/TIME 2010 2011 2012 2013 2014 2015 2016 2017
Single person, from which: 23.9 24.8 25.2 26.0 26.8 28.0 29.3 29.1
One adult younger than 65 years 9.9 10.2 10.8 10.6 11.0 11.8 12.9 13.0
One adult 65 years or over 14.0 14.6 14.4 15.5 15.8 16.1 16.4 16.1
Source: Eurostat, EU-SILC survey [ilc_lvph03], latest data available for 2017
Table 4. Households distribution urban versus rural area (% share of all households)
Types of households 2015 2016 2017
Total households 7,469,700 7,470,000 7,481,900
Households from urban area 55.66% 54.21% 52.83%
Households from rural area 44.34% 45.79% 47.17
Source: http://www.insse.ro/cms/ro/tags/conditiile-de-viata-ale-populatiei-din-romania, latest data available for 2017
Table 5. Number of non-residential buildings in Romania
Romania 2011 2012 2013
Number of non-residential buildings 356,940 371,200 378,430
Number of offices total: 77,280 84,270 85,050
Private offices 24,690 25,260 26,490
Public offices 52,590 59,010 58,560
Number of wholesale and retail trade buildings 115,960 119,770 123,290
Number of hotels and restaurants 32,830 35,950 38,360
Number of health care buildings 58,830 58,840 60,910
Number of educational buildings 72,050 71,370 70,820
Source: EU Buildings Database, latest data available for 2013