CASE OF POWER SUPPLY BY DESCO. - BUET Central Library
67
- - A QUALITY FUNCTION DEPLOYMENT (QFD) .- APPROACH FOR IMPROVING UTILITY SERVICES: A CASE OF POWER SUPPLY BY DESCO. BY MUHAMMAD ENA YET HOSSAIN DEPARTMENT OF INDUSTRIAL & PRODUCTION ENGINEERING BANGLADESH UNIVERSITY OF ENGINEERING & TECHNOLOGY DHAKA APRIL 2008
-
Upload
khangminh22 -
Category
Documents
-
view
0 -
download
0
Transcript of CASE OF POWER SUPPLY BY DESCO. - BUET Central Library
- -A QUALITY FUNCTION DEPLOYMENT (QFD).-
APPROACH FOR IMPROVING UTILITY SERVICES: A
CASE OF POWER SUPPLY BY DESCO.
BYMUHAMMAD ENA YET HOSSAIN
DEPARTMENT OF INDUSTRIAL & PRODUCTION ENGINEERING
BANGLADESH UNIVERSITY OF ENGINEERING & TECHNOLOGY
DHAKAAPRIL 2008

A QUALITY FUNCTION DEPLOYMENT (QFD)
APPROACH FOR IMPROVING UTILITY SERVICES: A
CASE OF POWER SUPPLY BY DESCO.
BYMUHAMMAD ENAYET HOSSAIN
A Thesis Submitted to the Department of Industrial and Production Engineering,Bangladesh University of Engineering and Technology in Partial Fulfillment of therequirements for the Degree of Master or Engineering in Industrial & ProductionEngineering.
!lIIIIIDlllnl~III"11i1/J'IO~a'8#-~
DEPARTMENT OF INDUSTRIAL & PRODUCTION ENGINEERING
BANGLADESH UNIVERSITY OF ENGINEERING & TECHNOLOGY
DHAKAAPRIL 2008

..CERTIFICATE OF APPROVAL
Tlie thesis titled "A QUALITY FUNCTION DEPLOYMENT (QFD) APPROACH
FOR IMPROVING UTILlTY SERVICES: A CASE OF POWER SUPPLY BY
DESCO." submitted by Muhammad Enayel Hossain, Student No.: 040508008F,
Session: April 2005, hM been acx:epted as satisfactory in partial fulfillment of the
requirement for the degree of Master of Engin"""ring in lodustrial & PrOODction
Engineering on April 19,2008.
BOARD OF EXAMINERS
I. Chainnan
Mcmber(External)
2.
3.
Dr. A. K. M. MasudAssociate ProfessorDepartment oflndustrial & Production EngineeringBangladesh Univcr:<ity Engineering & Technology (BUEn, Dhaka
k MemberDr. Abdullahil MecroAssistant Professor,Department of Industrial & Production EngineeringBangladesh University Engineering & Technology (BUEn, Dhaka
~.Engr Mohammad KamruzzamanManager,S & D Division, KallayanpurDhaka Electric Snpply Company Ltd. (DESCO), Dhaka
m

CANDIDATE'S DECLARATION
It is hereby declared that this thesis or any part of it has not been submitted elsewhere
for the award or any degree or diploma.
MUHAMMAD ENAYET HOSSAIN
IV

This dissertation is dedicated to my parents and brothers.
v

TABLE OF CONTENTSPage No.
LIST OF FIGURES IX
LIST OF TABLES XI
NOMENCLATURE XII
ACKNOWLEDGEMENTS XIII
ABSTRACT XIV
CHAPTER-ONE 1-3
INTRODUCTION
J.l Introduction
1.2 Objectives with specific aims and possible outcomes 2
J.3 Limitations oflhe Thesis 3
CHAPTER TWO 4.18
ORGANIZATIONS IN POWER SECTOR
ANDDESCO
2.1 Organization engaged in power sector 4
2.1.1 Bangladesh Power Development Board (BPOB) 4
2.1.2 Dhaka Electric Supply Authority (DESA) 5
2.1.3 Dhaka Electric Supply Company Ltd. (DESCO) 6
2.1.4 Rural Electrification Board (REB) 6
VI

Page No.
2.1.5 Private Power Generation 6
2.1.6 Power Cell 7
2.2 The Company Profile, DESCO 9
2.2.1 Back ground 9
2.2.2 Territory 9
2.2.3 Vision, Mission & Corporate Philosophy 11
2.204 At a glance DESCO 12
2.2.5 Organogram 14
2.2.6 Load Forecast 14
2.2.7 Demand Factor 14
2.2.8 Consumer Mix 16
2.2.9 Usage by Category 16
2.2.10 Present Position of DES CO 17
CHAPTER: THREE
LITERATURE REVIEW
3.\ Introduction
3.2 Quality Function Deployment (QFD)
3.J Benefits ofQFD
VII
19-32
19
21
22

-3.4 QFDProcess
3.5 Hou.seofQualily
3.6 Outline of the functioning of the Electricity Market
3.7 Quality in the ElectricalSector
3.8 The Electrical Company as a Group of Process
CHAPTER FIVE
INVESTIGATION, RESULTS ANDANALYSIS
4.1 Stages followed in investigation
25
26
27
28
30
33-50
33
4.1.1 Analysis ofthe expectationsor demands of/he customer 33
4.1.2 Definition of the service 36
4.1.3 A study of the relationship between the customers' 37
expectations and the internal quality indicators
4.1.4 Arranging the internal quality indicators or HOWs in order of 44
importance
4.2 ResultsObtained
4.3 Analysis of Results
CHAPTER FIVE
CONCLUSION
REFERENCES
VIII
45
48
51-51
52-53

Page
No.
Figure 2.1 The area surrounded by DESCO 10
Figure 2.2 Maximum demand fOre<JaSt 14
Figure 2.3 Month wise load factor 15
Figure 2.4 Load curve of a day the high demand date 15
Figure 2.5 Consumers mix ofDESCO 16
Figure 2.6 Category wise consumer usage 17
Figure 2.7 Year Wise Loss & profit 18
Figure 2.8 Year wisc system loss 18
Figure 3.1 Benefits ofQFD 23
Figure 3.2 Relinemcnt of the QFD Chart 25
Figure 3.3 HouseofQua[ity 26
Figure 3.4 Final outline of the function ing of the electricity market 28
Figure 3.5 The rings of perceived value by T. Levitt 30
Figure 3.6 Basic Chain ofElcctrical Sector 31
Figure 4.1 The QFD matrix showing the correlation between the 41
expeclations or WHATs and the internal quality indicators or
HOWs for system operation
IX
Figure 4.2 The QFD matrix showlng the correlation between the 42
expectations or WHATs and the internal quality indicators or
HOWs for commerclal operation (Domestic Customers, Small
Businesses (L T Consumer»
Figure 4.3 Thc QFD matrix showing the correlation between the expeetations 43
Or 'WHATs and the inlernal quality indicators or HOWs for
commercial operation (Small companies and large qualified
consumer (LTI & Hl))
x

Page
No.
Table 2.1 List oflPPs and Generut;on capacity 07
Table 2.2 At a glance different technical items are shown year to year 12
Table 2.3 At a glance different Commercial items are shown yearto year 13
Table 4.1 Customer requirements in respect of System operation 35
Table 4.2 Customer requirements for domestic and small business customer 35
Table 4.3 Customer requirements for small companies and large qualified 36
customer
Table 4.4 The internal quality indicators against expectations for System 37
operation
Table 4.5 The internal quality indicators against expectations for Domestic 38
Customers, Small Businesses (L T Consumer)
Table 4.6 The internal quality indicators against eXpel:tationsfor Small 39
companies and large qualified consumer (LTI & Hl)
Table 4.7 Greatest to least internal quality Indicators for System operation 45
Table 4.8 Greatest to least internal quality indicators for Domestic
Customers, Small Businesses (L T Consumer)
46
Table 4.9 Table 4.9: Greatest to least internal quality indicators for Small 47
companies and large qualified COnSumer(LTI & HT)
Xl

NOMENCLATURE
Acronyms
QFD Quality Function Deployment
BOO B~ild, Own and Operate
BOT Build, Own and Transfer
BPDB Bangladesh Power Development Board
DESA Dhaka Electric Supply Authority
DESCO Dhaka Electric Supply Company Ltd.
GCR Gas Consumption Rate
GOP Gross Domestic Product
GOB Goverrunent of Bangladesh
GWh Giga Watt hour
IPP Independent Power Producer
KV Kilo.volt
KWh Kilo-Watt-Hour
MW Mega Watt
PBS Palli Biddut Samily
PPA Power Purchase Agreement
REB Rural Electrification Board
XII

ACKNOWLEDGEMENTS
First of all, I express my gratefulness to Almighty Allah for successfui completion ofthis
project work.
I express my protound gratitude to my honoumbie supervisor Dr. A.K.M. Masud,
Associate Professor, one of thc honorable faculties of the Department of Industrial &
Production Engineering, BUET, for his constant direction, auspicious guidance, cordial
suggestion and inspiration in pursuing the whole investigation of the present project and
have set the stage to conduct the thesis. Conducting such a thesis has given me a rare
opportunity to blend my theoretical knowledge with practical aspects of the customer
services in power swtor. Words are always insufficient to express his working capacities
and unending enthusiasm for innovative investigations. This always becomes the
everlasting souree of inspiration for his students.
I express my sincere gratitude and thankfulness to Dr. Abdullahil Azeem, Assistant
Professor, Dept. of IPE, BUET, for his constructive remarks and kind evaluation of the
thesis work. I also express my sincere gratitude and thankfulness to Mohammad
Kamruzzaman, Manager, S & D Kallyanpur, DESCa, for his invaluable guidance,
constructive remarks and kind evaluation of the thesis work.! am also grateful to BUET
authority for providing the financial grant for this work.
I am grateful to Engr. Abdul Latif, Engr. Abdul Malek ,Md. Waliul Islam Chowdhury
and Engr. Sazzad Nazmul alam ,Engr. Nazmul Haque Chow. , Engr. Md. Niaz Banda
Assistant Manager, S & 0 kallyanpur, DESCa, for their kind cooperation. I wish to
thank specially my senior brother S. T. Mahrnud (phd. Student, Department of Physics,
BUET), my friends Farid, Rabbu, Ratan, Safiul for their inspiration and encouragement.
i also gratefully acknowledge the wishes of my younger brothers Sujon, ashiq, ahad, and
innumerable friends.
Ultimately, I would mention a very special gratefulness for the moral support and
sustaining inspiration provided by the members of my family specially my father Abdus
Sukur Dhali & my brother Md. Shahid Hossain. This dissertation would never have been
possible without their love and affection.
,m

ABSTRACT
Quality Function Deployment (QFD) is a basic TQM tool that systematically develops
customcr"s needs and expectations. The methodology of QFO allows the depioyment of the
expectations of the customer, or r~ther, the characteristics expected of this service, through
all the functions of the company; it is possible therefore, to translate the expectations (what
the customer wants) with the appropriate means, into specifications of service and internal
actions (how we should do it). The QFD is a management tool, where the customer's expec-
tations are used to manage the design of the processes. It is not only used in the development
of new services, it is also used for the improvement of an existing service, such as that given
by the distributing and retailing companies of electricity - the objective of the present article.
The typical electrical company in Bangladesh is at present surrounded by an environment of
progressive liberalization in the sector, where quality has become a key factor in
competitiveness. In order to improve its qualily the company needs to be aware of the
expectations of its customers and how to satisfy them. In this thesis the key processes of the
Distributing companies of the Bangladesh electrical .sector are defined, Identifying internal
quality indicators associated with the expectations of the final customer. The objective of
this work is to provide the companies that distribute and commcrcialize electrical energy
with a methodology that allows them to identi/)' the focal point of their organization. This
should also detennine on which processes, customer service channels, or other services they
should concentrate in order to satis/)' their customer's expectations while continuously
improving quallty. TIle Quality Function Deployment (QFD) method is applied in order to
correlate the expectations of the customers and the internal quality indicators of these
processes. The expectations of the customer have to be gathered, analyzed and dealt with.
We have chosen as a starting point the segmentation made by this company and the results
of investigations made on quality as seen by the different segments of customers, basically
on processes, channels of attention and the image of the company. The opinions of ten
experts of the same company have supplied the basis for the correlation of the expectations
with the indicators of the basic processes. The results lead to improvements in the basic
process.

CHAPTER-ONE
INTRODUCTION
1.1 Introduction
Energy is essential for promoting living standards, It is a pre-requisite for economic growth
and technological progress. In Bangladesh, per capita generation of electricity in 1995 was
only 92 KWh which is lower in comparison to that in neighboring countries. In view of the
prevailing low generation and consumption of energy, efforts should be made to develop
this sector in such a way that the nccds of ail sectors can be met adequately, efficiently and
economically.
In thc process of restructuring the Power Sector and to improve the key operational and
financial activities in the electricity distribution system, Dhaka Electric Supply Company
Ltd. (DESCO) was created on 03 November 1996 under the Companies Act 1994 as a Public
Limited Company o\\l1ed by the Government with an Authorized Capital of 500 crores.
DESCO started its operational activities in September 24, 1998 in Mirpur area with
consumer strength of 71161 and a load demand of95 MW. Afterthat, it takes a huge area to
distribute electricity. Till April 2007 the consumer strength and load demand increase to 3.5
lacsand450MW.
In the environment of progressive liberalirution of the service sector in Bangladesh, telecom
companies find themselves in a competitive market, where the new concept of quality should
be considered a key element in the competitiveness of these companies. The commitment to
quality becomes an indispensable requirement in gaining the loyalty of customers. But, it is
absent in the utility sector.
QFD was first developed in Japan in tile late 1960s by Professor Yoji Akao and Professor
Shigeru Mizuno as a quality system. QFD was aimed at delivering prodocts and services that
efficiently satisfY customers, One should listen to the "voice of the customer" throughout the
product or service development process, Mizuno, Akao and other Japanese Quality
,

Management experts developed lhe tools and lCchniques for QFD and organized them into a
comprehensive system to assure quality and customer satisfaction in new prooucts and
services [I].
QFD improvcs customer satisfaction, reduces implementation, promotes teamwork and
provides documentation [2].QFD seeks out both "spoken" and "unspoken" customer
requirements.
TRAPPEY C. V. & others [3] dcsigned a computerized quality function deployment
approach for retail services. Kwai-Sang Chin & others performcd a quaiity function
deployment approach for improving technicai library and information services; a case study.
[4] The approach provides a practical mcans that helps organizations to identify customer
satisfaction criteria, and integrate improvement strategies and plans into management
decision-making processes.
Gin-Shuh Liang, Tsung-Yu Chou, Shu-Fen Kan constructed a fuzzy relation matrix to link
service management requirements and customer needs based on cross-functional expertise in
their paper "Applying fUll>' quality function deployment to identify service management
requirements for an ocean freight forwarder"[5].
Chun-Lang Chang has studied an Application of quality function deployment launches to
enhancing nursing home service quality. This study focuses on a long term nursing home
institute located in Yunlin area, examining its service quality and secking thc voice of
customers (Vae) by using Quality Function Deployment (QFD) [6].
1.2 Objcdivcs with specific aims and possihle outcomes
Objectives:
a) To reduce period of time from application up to installation Isubstitution of the meter
equipment.
b) To reduce period of time from reading to invoice.
c) To reduce lhe rate of claims on invoices.
d) To reduce period of time from registralion of claim up to emission.
e) To reduce the number of interruptions and also interruption time equivalent to power
supply.
2
Olltcomes:
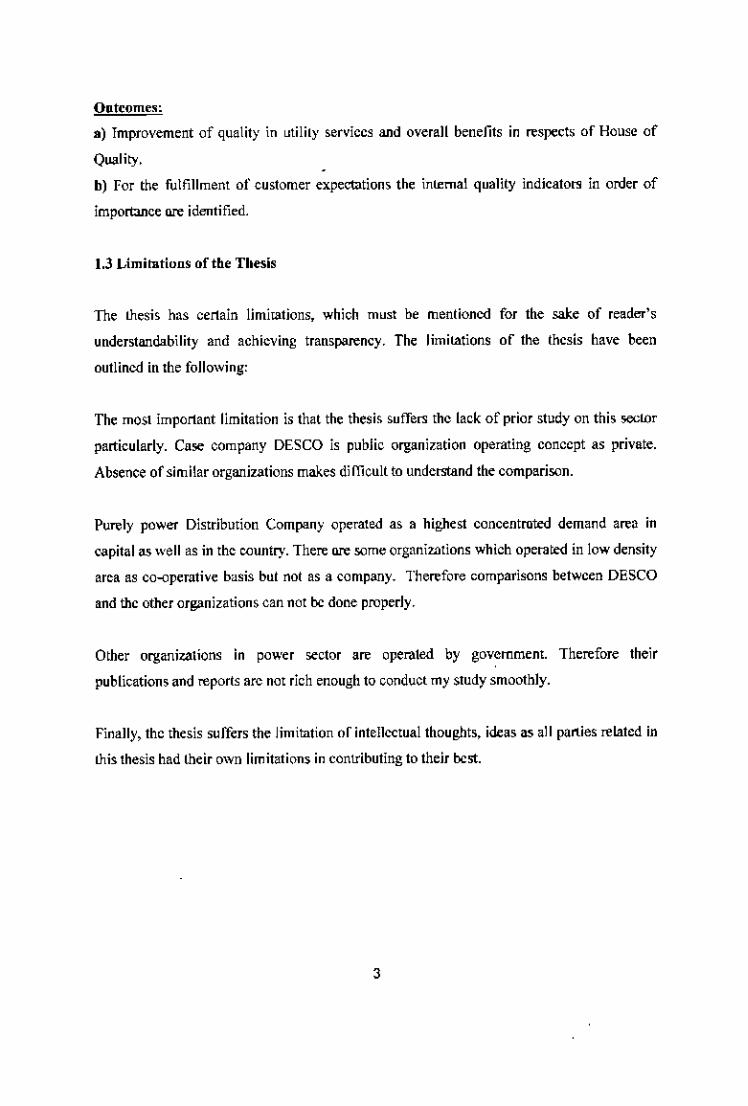
a) Improvement of quality in utilily services and overall benefits in respect5 of House of
Quality.
b) For the fulfillment of customer expectation5 the inlemal quality indicators in order of
importance are identified.
1.3 Limitations of the Thesis
The thesis has certain limitations, which must be menlioned for the sake of reader's
understWldability and achieving transparency. The limitations of the lhcsis have been
outlined in the following:
The most important limitation is that the thesis suffers the lack of prior study on this sector
particularly. Case company DESCO is public organization operating concept as private.
Absence of similar orgWlizationsmakes dimcult to understand the comparison.
Purely power Distribution Company operated as a highest concentrated demand area in
capital as well as in the country. There are some organizations which operated in iow density
area as co-operative basis bul nol as a eompWlY. Therefore comparisons between DESCO
and the other organizations can not be done properly.
Other organizations in power sector are operated by government. Therefore their
publications and reporls arc not rich enough to conduct my study smoothly.
Finally, the thesis suffers the iimitation or intellectuai thoughts, ideas as a]I parties related in
this thesis had their own limitations in contributing to their best.
3

CHAPTER: TWO
ORGANIZA nONS IN POWER SECTOR AND DESCO
2.1 Organization engaged in power sector
The major organization involved in power generation, transmission and distribution
activities in our country are Bangladesh Power Development Board (BPDB), Rural
Electrification Board (REB), Dhaka Electric Supply Aulhoril)' (DESA), Dhaka Electric
Supply Company Limited (DESCO), and Power Grid Company of Bangladesh (PGCB).
However the nationwide power production and utilization programs are being strengthened
by involving the private sector. The avowed goal of the government is to ensure access to
electricity for each household by 2020. Upto June 2003, the tolal number of consumer
connection given by difl"crcnt agencies was 70,67,420 which covers 32 percent of lhe
population. The total length of transmission line (230 Kv and 132 Kv) is 3,859 Km and
length or distribution line (33 Kv, 11Kv and 0.4 Kv) is 2,09,932 Km.
2.1.1 Bangladesh Power Development )J{)ard (DPDB)
The power sector started working mainly in 1960. Electricity Directorate was merged with
WAPDA. At that time relatively higher eapacit)' plants were bullt at Siddhlrganj, Chittagong
and Khulna (highest plant size was only 10 MW Steam Turbine at Siddirganj). At the same
time Kaptai dam was under construction under Irrigation department. Unit size of Kaptai
was 40 MW, which for that time was considered to be a large power plant. Side by side
construction of Dhaka-ehittagong 132 KV transmission line was in progress.
In 1972, after the emergence of Bangladesh through a bloody War of Liberation as an
independent state, Bangladesh Power Development Board (BPOB) was created as a public
sector organization to boost the power sector.
The Government created Rural Electrification Board (REB) in October 1977. Later in 1991
Dhaka Electric Supply Authority (DESA) was created basically to operate and develop
4

distribution system in and around Dhaka (including the metropolitan city) and bring about
improvement of customer service, collection of revenue and lessen the administrative burden
ofBPDB.
Governmcnt regulated the natural monopoly of power supply primarily to protect the
consumer's interest Structural changes are taking piace and new corporate characters are
emerging. The gradual expansion of the inlTastructure has also been justified by thc need for
realiling social goods rclating to rural electrification and low cost electricity supply to the
public.
At prescnt, BPDB has total installed capacity of 4995 MW at 66 units and IPP (mixed) 1260
MW at 37 units of power plants located at different parts of the country. The main fuel used
for power generation is indigenous gas. Total 13,223.28 Gwh gross energy was generated in
the public sector po"er plant under BPDB. In addition, total 7939.19 Gwh of energy was
purched by BPDB from Independent Power Producers (lPP) in the private scctor. The
maximum demand served during peak hours is 3720.8 MW in June, 23, 2005. The
transmission network ofBPDB is 5976 km long comprising 230 and 132 KV lines. The total
numbers of grid sub-stations arc 72 and the total capacity is 9104 MVA.
In FY 2003, BPDB had about 24.500 employccs of which 1,974 were of supervisory level
(holding positions of sub-assistant engineer or bigher or equivalent).
2.1.2 Dhaka Electric Supply Authority (DESA)
To bring dynamism and establish transparency in the power sector DESA has been
established covering greater Dhaka in pursuance of the sel:tion-36 of article of DESA Act,
1990. DESA commenced its operation on I" October 1991. the performance of electric
distribution of Dhaka has improved after the establishment of DESA, the system loss of
electric supply was 38.26 percent which decreased to 28.21 percent on an average during the
last fiscal year.
5

2.1.3 Dhaka Electric Supply Company Ltd. (DESCO)
In order to lay greater emphasis on distribution management of electricity in the
metropolitan city of Dhaka, to enhance reliability of electricity supply, to improve customer
service, to reduce system loss to a reasonable level, to augment revenue collection and abovc
all to bring dynamism in me distribution and to run it commercially DESCO was fonned on
]«1November, 1996 covcring the areas iike Mirpur, Pallabi, Gulshan and North region of
Dhaka. The company has launched its operation since 24"' of September 1998 at the Mirpur
area of Dhaka with 47.4 percent system loss and poor collection. 9'" April 2003 DESCO took
over Gulshan circle of DESA that is, Gulshan, Banani, Baridhara, Cantonment, Ultata and
nearby for its better performance. Presently DESCO become a high profitable organization
with earning per share of more than taka 57 and perfonn as leading company of Dhaka Stock
Exchange and Chiltagong Stock Exchange.
2.1.4 Rural Electrification Board (REB)
Since dcvciopment of rural area is of vital importance for economic prosperity of the
country, rural electrification is one of priority programmes of the government. As enhanced
consumption of electricity is vital for acceleration of rural development that contribute to
agricultural development, establishment of rural enterprise, income generation, poverty
alleviation and above all enlis~nent of standard of living of the rural people, government has
established REB in 1977 to ensure smooth supply & effective consumption of electricity.
2.1.5 Private Power Generation
As power sector is a capital-intensive industry, huge investment will be required for
generation capacity addition. Public sector is not in a position to secure this huge investment
for power generation. Besides, competing demands on government resources and declining
levels of external assistance from multilaterallbilateral donor agencies further constrained the
potential for public investment in the power sector. Recognizing these trends, GOB amended
its industrial policy to enable private investment in the power sector and Private Sector
Power Generation Policy was framed in 1996 for promoting private seclor participation in
6
the generation of electricity.
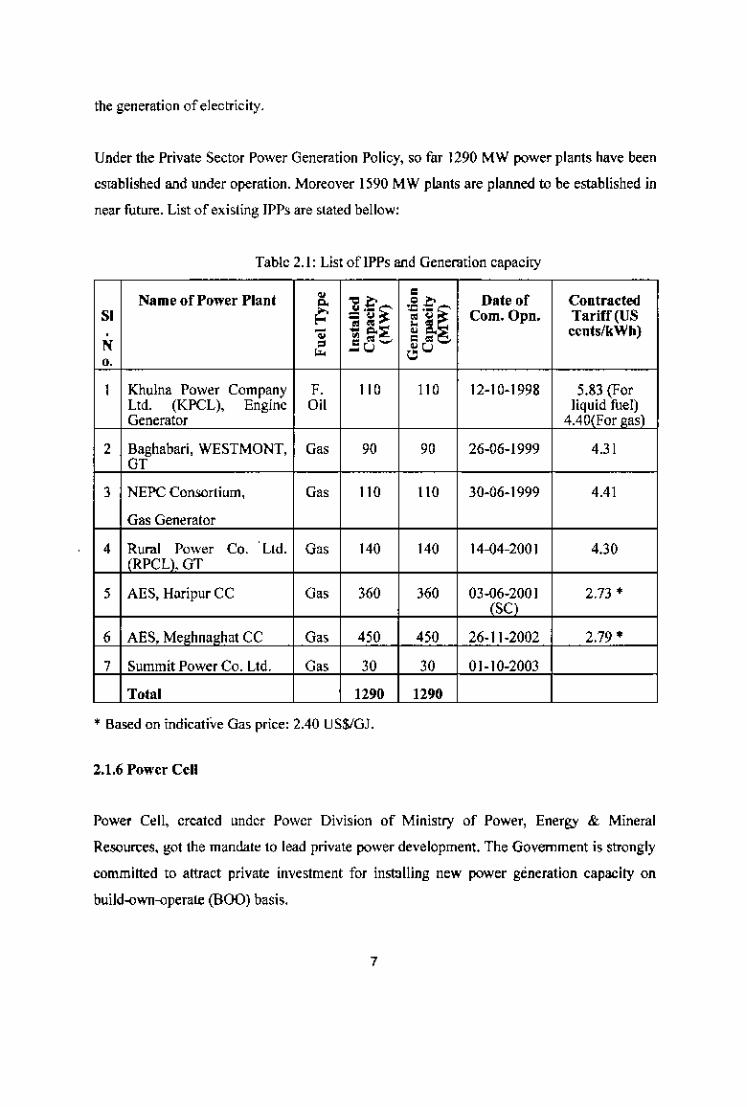
Under the Private Sector Power Generation Policy, so far 1290 MW power plants have been
established and under operation. Moreover 1590 MW plants are planned to be established in
near future. List of exisling IPP~are slated bellow:
Table 2.1: Ust oflPPs and Generation capacity
• • Date ofName of Power Plant • ~.€~U~Contracted
SI ~ ~a Com.Opn. Tariff(US•• ~ 2.:; cents/kWh)
N • ."- • •• _u ~u,.1 Khulna Power Company F. 110 110 12-10-1998 5.83 (For
Ltd. (KPCL), Engine Oil li~~~ fue;~)Generator 4.40 For gas
2 Baghabari, WESTMONT, G" 90 90 26-06-1999 4.3 IGT
3 NEPC Consorlium, G" 110 110 30-06-1999 4.41
Gas Generator
4 I f:ra!ltower c, 'Ltd. G•• 140 140 14-04-2001 4.30RPCL, GT
5 AES, Haripur CC Gas 360 360 031~2)001 2.73 +
6 AES. Me hna hat CC G" 450 450 26-11-2002 2,79 +
7 Summit Power Co. Ltd. G" 30 30 01-10-2003
Total 1290 1290• Based on indicative Gas price: 2.40 US$lGJ.
2.1.6 Power Cell
Power Cell, created under Power Division of Ministry of Power, Energy & Mineral
Resources, got the mantlate to lead private power development. The Government is strongly
committed to attract private investment for installing new power generation capacity on
buiJd-o\1ll1-operate(BOO) basis.

'.
Number of Fiscal incentives Is provided in the Policy for the private power generation
companies. Some of them are as tollows:
). Exemption from corporate income tax for a period of 15 years.
). Exemption from Customs Duties (CD), VAT (Value Added Tax) and any other
surcharges in importing plants and equipment.
). Repalrialion of equity along with dividends allowed n"eell'.
). Exemption from income tax for foreign lenders to such companies.
). Avoidance of double taxation case of foreign investors on the basis of bilateral
agreements.
'" Remittance of up to 50% of salary oflhe foreigners employed in Bangladesh.
'" Companies are eligible for all other concessions which are available to
Industrial projects.
8

2.2 The Company Profile: DESCO
2.2.1 Baek ground:
In The Process of restructuring the power sector and to improve the operational and financial
activities in the distribution syo;tem,Dhaka Electric Supply Company (DESCO) was created
in November 1996 under the company act 1994 as a Public Limited Company with an
authorized capital of Tk. 5 billion and paid up capital 1,271 million taka. However the
operational activities of (DESCO) at the field level commenced on September 24, 1994 with
the taking over the electric distribution system ofMirpur area from DESA with a customer
strength of 71161 and a load demand of 90 MW in subsequent years of suocessful
performance since inception, the operational area of DESCO has recently be expand""
through inclusion of DESA's east while Gulshan circle and eventually the total customer
strength and load demand increased to 205,803 and 315 MW respectively as of 30
June,2003. Number of con;umers was 3,47,602 and maximum demand was 451 MW at June
2007. Presently DCSCO serves 200 Square Km area of Dhaka city and nearhy. Nine
members Board of directors are engage for opemtion or DESCO. Managing Director and
two other Directors Technical and Finance are the full time directors responsible for
operations. Besides this Power division of Ministry of Energy and Minerai Resources
monitor the activities. More over in June 2006 Iwenty five percent of shares of DESCO were
sold to the public through stock exchange.
2.2.2 Territory:
The service territory of the company now comprises of the areas bounded by Baiu River in
the East, Turag river in the West, and by Turag and Balu river in the North and Mirpur Road,
Agargaon Road, Rokeya Sarani, New Airport Road, Mymensing Road, Mohakhali Jheel,
Rampura Jheel connected with Balu River in the North.
9

Figure 2, i: Area Map surrounded by DESCO.

2.2.3 Vision, Mission & Corporate Pbilosophy:
Vision:
To be a role model el«tric supply company in the region using most dependable
technologies and being a development partner in the continuous welfare ofthe society.
Mission:Service to the utmost satisfaction of consumers through reliable and unintenupted powcr
supply and provide value for money. Providc congenIal working environment for
cmployees.
Corporate Philosopby:
Service excellcnce with integrity and corporate social responsibility.
Major Funetio;m: i) Provide reliable and uninterrupted power supply
ii) Proper biIlingof supplied elcctriclty
Iii) Collected bill from cunsumers
iv) Provide eledric assistance and advice to the consumers
DEseo's Objccth'es:
To be a sustainable and consi~tent organi£alion in Power Sector DESCO IS working to
achieve the following objectives:
• Better Customer Service,
• Provide reliable and unInterrupted power supply to valued customers .
• Reduce system loss, [nerease revcnue earning to become a profitable business entity.
• Self sufficient in every avenue .
• Berter working environment.
11

2.2.4 At a glance DESCO
Table 2.2: At a glancc different technical items are shown year to year
Dcscription 00-01 01-02 02-03 03-04 04-0S OS-06
33/11 KY Substation (N",) 05 06 13 13 13 13
Capacity ofsubstation(MW) 160/224 200/280 425/593 425/593 4301602 430/602
Maximum Dt:mand (MW) 134 149.9 315.24 351.82 387.25 397.3
33 KY OiH line (Km) 17.2 17.2 73.7 76.7 76.7 76.7
33 KY U/G line {Km} 37.8 37.8 70.3 125.3 142.3 158.9
II KY OIH line (Km) 162 169 536 552 600 642
II KY U/G line (Km) 35 43 205 205 238 298
LT line (Krn) 377 422 991 1030 li05 1209
Distribution Transformer 1455 1555 3369 3594 3785 3896
(N"s)
Power Factor 0.96 0.96 0.96 0.96 0.96 0.96
Load Factor 64.36 65.67 68.96 65.51 62.77 62.53
12
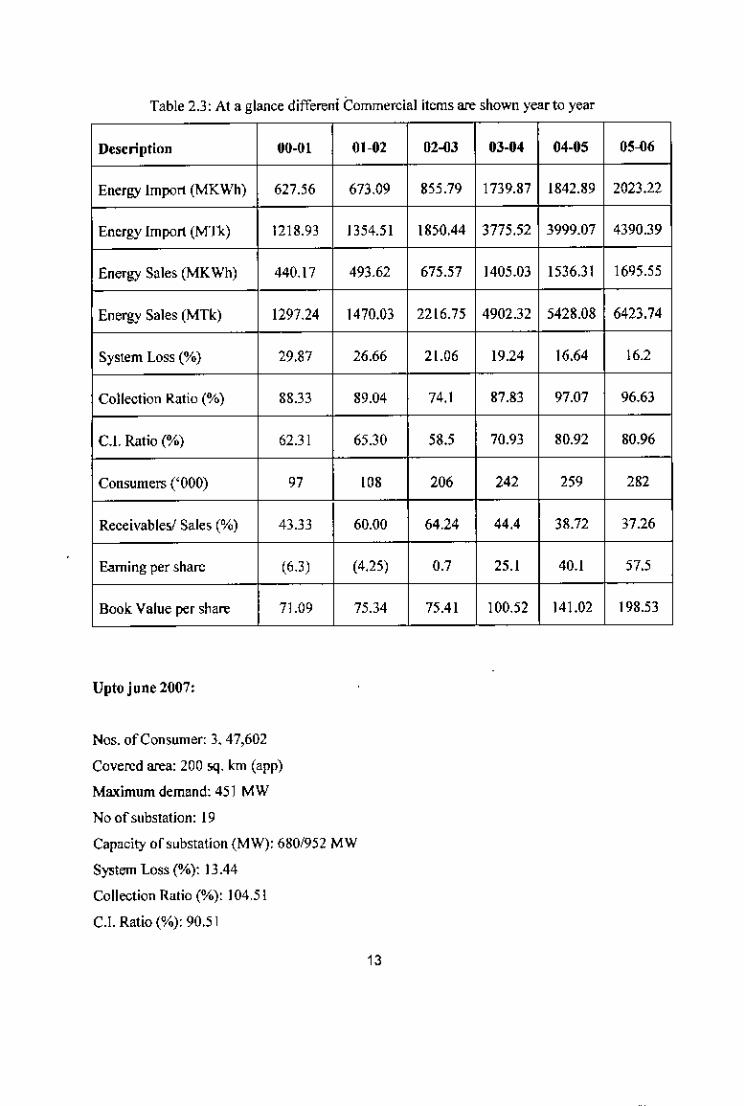
Table 2.3: At a glance different Commercial itcms are shown yearto year
Description 00-01 01-02 112-oJ llJ-1l4 04-05 05-06
Energy Import (MKWh) 627.56 673.09 855.79 1739.87 1842.89 2023.22
Energy Import (MTk) 1218.93 1354.51 1850.44 377552 3999.07 4390.39
Energy Sales (MKWh) 440.17 493.62 675.57 1405.03 1536.31 1695.55
Energy Sales (MTk) 1297.24 1470.03 2216.75 4902.32 5428.08 6423.74
System Loss ('Yo) 29.87 26.66 21.06 19.24 16.64 16.2
Collection Ratio ('Yo) 88.33 89.04 74.1 87.83 97.07 96.63
c.l. Ratio ('Yo) 62.31 65.30 585 70.93 80.92 80.96
Consumers ('000) 97 108 206 242 259 282
Receivables! Sales (%) 43.33 60.00 64.24 44.4 38.72 37.26
Earning per share (6.3) (4.25) 0.7 25.1 40.1 57.5
Book Value per share 71.09 75.34 75.41 100.52 141.02 198.53
Upto june 2007:
Nos. ofConsurner: 3. 47,602
Covered area: 200 sq. km (app)
Maximum demand: 451 MW
NoofslIbstation: 19
Capacity ofslIbstation (MW): 6801952 MW
System Loss ('Yo): 13.44
Collection Ralio ('Yo): ]04,5l
c.r. Ratio ('Yo): 90,51
13

2.2.5 Organogram
Managing Director is the operational chief of the organization. Two operation directors are
full time work as chief of Technical and Financial operation. Close supervision ofthcm tluee
General Managers and Twelve Deputy General Manager are operated the organization's
various wings and divJsions. Totai number of employee is 1008 wnong them 156 officers.
2.2.6 Load Forecast
Maximum demand of electricity in thc DESCO area was 313 MW, 362 MW, 386 MW and
439MW in year 2003 to 2006 respectively. With trend analysis it is found that maximum
demand increasing 10.2 percent per year. Jf this increasing will continue load demand in
2007 will be 485 MW, in 2010 wili be nOMW and in 2020 will be 2250MW. Tn the
following figure 2.2 load demands in coming years is shown.
2500
2000
1500 ;,1000 !II ", ;,
i500 I ~I
", ,, ! { "{0 ,
" ~ ~ • " ~ 8 0 N " ~ ~ • ~ m rn a0 0 0 0 ~ ~ ~ ~ ~ ~ ~ ~ ~ N0 0 0 0 0 0 0 0 0 0 0 0 0 0 0 0 0 0, ~ ~ N ~ N N N ~ ~ N N N N ~ ~ N ~
figure 2.2: Maximum demand forecast
2.2.7 Demand }<'actor
Demand of electricity is not similar all day long even not similat in all the year long. In
electricity business Demand Factor is a vital issue. Demand factor means average utilization
14

of lhe systcm. Dcm~nd. fllClor eqUllls the Illlio of 1I'"Cl11gCsupply of electricity to Maximum
demand for dUll period. So, the more demand fllctor indicates the more utiliution of lhe
I'C$()l1rees.Demand factor of Dlosca in !he ll1sl yelIr was 62.S3%. In tile IlISt summer !he
10l1dfllCtor WIIS73.04% lind in winlCr WIISS4.0S%. Load pattem of !he dtIy is mllximum al
cVC11inglind minimum lit mid nighl. Depending on demand pcllk hour is dcfi~ from S pm
to II pm. In figure 2.4 atypiCllI dtIy lo:ld Jlllnem is shtmn and in Figure 2.3 l.olld factor of
diffcrent monlhs is shown for undersUlnding the 10l1dsitUlllion of DES CO.
Month v.(se Load Factor
ro,70j
I:1] ~.~j,J, , ,
IlIlSSBI3B ,, , ,~ :Hl!1! ! • f ,
Month
iCiILoad factor I
Figure 2.3: Month wise I<xu!factor
--00'
." :/ ---- ••••••••••••- -[ 00.
j 00.
'"
.n I! I 111H 1111111111111 !TIm.
Figure 2.4: Load curvc ofa day !he high demand date (September 09, 2006)
15

2.2.8 Consumer Mix:
Number of consumer of DESCO was 289,000 in June 2006. Among them maximum portion
of them are domestic consumers about 90 percent and then commercial consumers abou! 7
percent. Mix of consumers is shown in the tigure 2.5.
Comm"d.IIQl40(7.'0%)
Sm"llln~">I,i.,J 114(1.21%)
Olh,,,, 3644(1.40%)
Dome,lic 230934(89.52'%)
figure 2.5: Consumers mix of DESCO
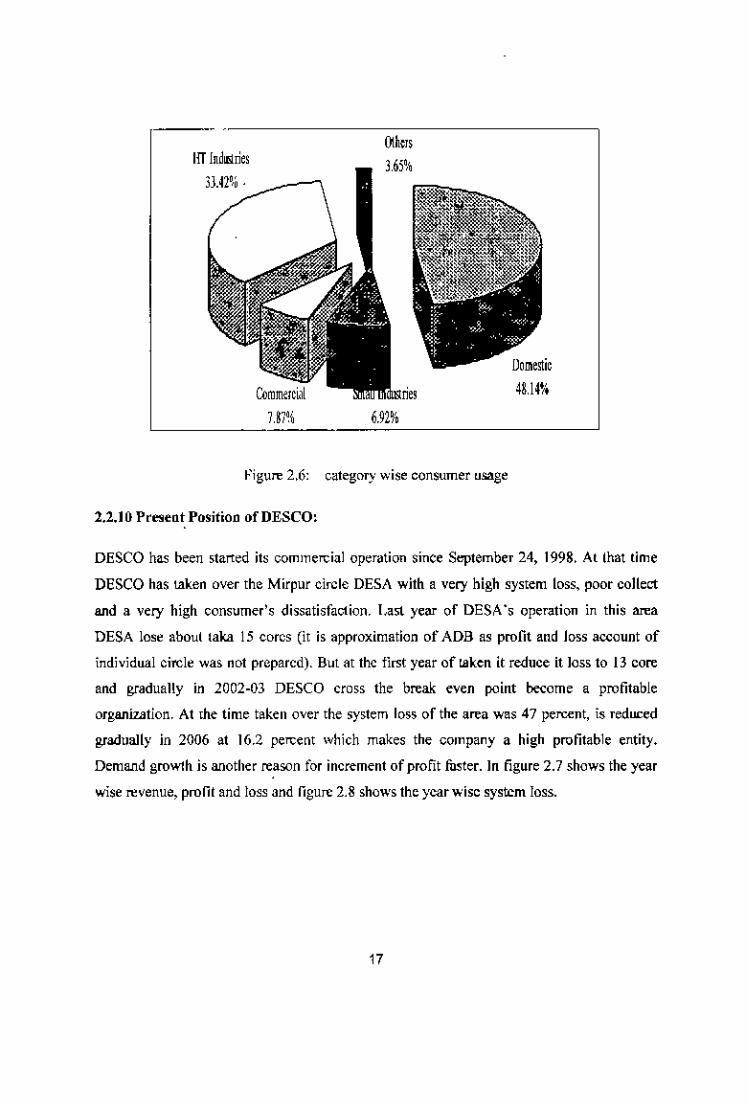
2.2.9 Usage b~' Category:
DESCO is responsible to rowel' supply in capital city and most of area are in residential and
some in commercial part. Domestic usage is high about 48 percent where as in the country
perspective It is about 38 percent. The consumer mix shows that the 90 percen! consumers
are domestic users who are use only 48 percent but only .41 percent of industrial consumers
use 33 percent of electricity. In figure 2.6 C<ltegorywise consumers usage portion is shown.
16
lIT Indllltnes3W%.
Oth~JS3.6i%
6.92%
4W%
Figure 2,6: categmy wise consumer usage
2.2.10 Present Position of DES CO:
DESCO has been ,tarted its commercial operdtion sinCe September 24, 1998, At that time
DESCO has tllken over the Mirpur circle DESA with a very high system loss, poor collect
and a very high consumer's dissatisfaction. Last year of DESA's operation in this area
DESA lose about laka 15 cores (it is approximation of ADB as profit and Joss account of
individual eircle was not prepared). But at thc first year oftllken it reduce it loss to 13 eore
and gradually in 2002-03 DESCO cross the break even point be\:ome a profitable
organizatIon. At the time taken over the system loss of the area was 47 percent, is reduced
gradually in 2006 at 16.2 percent which makes the company a high profitable entity.
Demand growth is another reason for increment of profit faster. In figure 2.7 shows the year
wise revenue, profit and loss and figure 2.8 shows the ycarwisc system loss.
17

"".~
""'"''''''''''''''''''''''''o-''''''
Ycarwlsc Rcvcnue & Profit
Yoar
Figurr 2.7: Year Wise: Loss & profit
-Year Wise System Loss
,. '-....- ••~ •••••••••• ,.0 ••••••••••~E 2.S•~ ,.'" • , , , , , , , ,
98-99 99-QO OO-Q101-Q2 02-Q3 03-D4 04-05 05-Q6,Years
~ -
Figurr 2.8: Yellr wise: system 1055
"

CHAPTER: THREE
LITERATURE REVIEW
3.1 Introduction:
Dr. Mizano, professor emeritus of the Tokyo Institute of Technology, is credited with
initiating the quality function deployment (QFD) system. The first appiication ofQfO was
at Mitsubishi Heavy industries Ltd. in the Kobe Shipyard, Japan in 1972. After four years of
the study development, refinement, and training. QfO was successfully implemented in the
production of mini-vans by Toyota.
Quality function deployment (QfO) is a planning tool used to fulfill customer expectations.
It is a disciplincd approach to product design, engineering and production and providcs in
depth evaluation of a product. An organization that correctly implements QfD can improve
engineering knowledge, productivity and quality and reduce costs, product development
time and engineering changes.
Quaiity function depioyment focuses on customer expectations or requirements, often
referred to as the voice of the customeLI! is employed to translate customer expectations, in
tenus of specific requirements, into directions and actions, in tenns of engineering
characteristics, that can be deployed through
Product pianning
Part development
Process planning
Production planning
Service
Quality function deployment is a team-based management tool in which customer
expectations are used to drive the product development process. Conflicting characteristics
or requirements are identifies early in tile QfO process and can be resolved before
production.
19

Organization, today u,e market research to decide what to produce to satisfy customer
requirements. Some customer requiremcnts adversely affect others and customers often
cannot explain their expectations. Confusion and misinterpretation are also a problem while
a product moves from marketing to design to engineering to manufacturing. Thi, activity is
where the voice of the customer becomes lost Wldthe voice of the organization adversely
enters the product design. Instead of working on what the customer expects, work is
concentrated on fixing what the customer dies nit want. In othcr words, it is not productive
to improve something the customer did not want initially. By implementing QFD, an
organization is guarantees to implement the voice ofth e customer in the final product.
Quality function deployment helps identify new quality technology and job functions to
carry ou! operations. This tool provides a historic reference to enhance future technology and
prevent design error,. QFD is primarily a set of graphically oriented planning matrices that
are used as the basis for decisions affecting any phase of the product development cycle.
Results ofQFD arc measured based on the number of design and engineering changes, time
to market, cost, and quality. It is considered by many experts to be a pertect blueprint for
quality by design.
Quality function dcployment enables the design phase to concentrate on the customer
requirements, thereby spending less time on redesign and modifications.
The saved time has been cstimated at onc-thlrd to one-half of the time taken for redesign Wld
modification using traditional means. This saving means reduced development cost and also
additional income because the product enters the market sooner.

3.2 Quality Function Deployment (QFD)
Quality Function Deployment (QFD) is a basic TQM tooi that systematicaliy develops
customer's needs and expectations. The tool provides a graphical methodology for
unearthing customers stated and unstated needs and expectations, for making decision in
cases where the;e needs and expectations conflict, and for driving these customer based-
needs requirements and expectations into the product development. QFD is driven by what
the customer wants, and for this reason, the technique is ollen described as "developing the
voice of the customer.
A technique to deploy customer requirements into design characteristics and deploy them
into subsystems, components, materials and production processes (Hoyle: i994).The initials
QFD stand for 'Quality Function Deployment'. These initials will be used when referring to
this technique.
In the new economic era [17] where the customers have greater possibility to choose than in
the past, the companies have found themselves obliged to adapt and acquire a form of customer-
oriented management. Of all the techniques and philosophies that have been developed,
QTO is one of the most complete that enables the realization of thisculturalchange.
The methodology ofQFD allows the deployment of the expectations of the customer [18],or
rather, the characteristicsexpcrtcd of this service,throughall the functions of the company; it is
possible therefore, to translate the expc<:tations(what the customer wants) with the appropriate
means, into specil1catIonsofservicc and internalActions (how we should do it), 'The QFD is a
management tool, where the customer's expectations are used to manage the design of the
processes' [2].
The QFD is\1ot only used in the development of new services. it is also used for the
improvementofan existingservice,suchas that givenby the distributing and retailing companies
of clcetricity - the objectiveof the present article.
.,The QFD ha'~"ldifferent application for each business or company, which means it has to be
adapted to the characteristics of the business, In this case, we arc not talking about the design
21

of a physical product, such as a pen for example, bul rather that the distributing and retailing
companies, as well as supplying energy, give the service of reading, invoicing, collecting
paymentand customer service,citherby telephoneor personally.So we arc dealing with a complex
service to which the methodologyof QFD hasbeen adapted.
3.3 Benefits ofQFD,
Quality funCliondepl"ymenl was originally implemented to reduce start-up costs.
Organizations using QFD have reported a reduced product dcvelopment time. For example,
U.S. car manufacturers of the late 1980s and carly 1990s nccded an average of five years to
put a producl on the market from drawing board to showroom, whereas Honda put a new
product on the market in tw" and a half years and Toyota did it in three years. Both
organizations credit this reduced time to thc use ofQFD. Product quality and consequently,
customer satisfaction improve with QFD due to numerous factors depicted in Figure 3.1
Customer Driveu
Quality function deployment looks past the usual customer response and attempts to dcfinc
the requirements in a set of basic needs, which are compared to all compctitivc information.
All competitors are evaluated equally from customer and technical perspectives. This
information can then be prioritizes using a Parcto diagram. Management can then place
resources where the} will be the most beneficial in improving quality. Also, QFD takes the
experience and information that are available within an organization and puts them together
as a structured format that is easy to assimilate. This Is important whcn an organization
employee leaves a particular project and a ncw cmployee is hired.
Reduces Implementation Time
Fewer engineering changes are needed when using QFD and when used properly, all
connicling design requirements can be identified and addressed prior to productlon. This
results in a reduction in retooling, operator training and changes in traditional quality control
measures. By using QFD, critical items are identified and can be monitored from product
inccption to production. Toyota reports lhat the quality oftheir product has improved by one
-third since lhe implementalion ofQFD.
22

Creates tocus on customer requirements
Uscs competitive information effectively
CUslumer Priorilizes resources
Driven Idenlifies ilems that can be acled upon
Structures resident experiencelinfonnation
Decrea>es midstream design changes
Reduces Limits p<Jstintroduction pl'l,)blem~
Implementation Avoid future development redundancies
Identifies future application opportunities
Surfaces missing ,,~sumptions
Based on concensus
Creates conununication at interlacesPromotcsTeamwork Idenlifies adion at interfaces
Creates global view out of details
Documcnts rationalc for dcsign
Pro,ides Easy to assimulate
Documenlmion Adds structure to the infonnation
Adapts to changes (a living document)
Provides framework for sensitivity analysis
Figure 3.1: Benefits ofQFD
23

Promotes Teamwork
Quality function deployment forces a horizontal deployment of communication channels.
Inpuls are required from all facels of an organization from marketing to production 10sales
thus ensuring that lhc voIce of the customer is being heard and that each department knows
what the other is doing. ThIs activity avoids misinterpretation opinions, and miscues. In
other words, the left hand always knows what the right hand is doing .Efficiency and
productivity always increa,e "ith enhanced teamwork.
Provides Documentation
A database for fumrc design or process improvements is created. Data that are historically
scattered within operalions, frequently lost and often referenced out of conlext are now saved
in an orderly manner to serve future needs. This database also serves as a training tool for
new engineers. Quality fun~lion deployment is also very flexible when new infonnalion is
introduced or things have to be changed on the QFD matrix.
24

3.4 QFD Process:
The QFD matrix (house of quality) is the ba.,is for all ruture matrices needed for the QFD method.
Although each house of quali\}' chart now contains a large amount of information, it is still necessary
In refwe the technical deS\:riptc>rsfurther until an action able level of detail is achieved. Often, more
than one matrix. will bc needed depending on the complexity of the project 1he process is
tICCOlllpllshedby creating a new chart in which the HOW's (technical deS\:riptors) of the previous
chart become the WHATs (customer requirements) of the new chart, as shown in Figure 3.2. This
process eontinucs un!i1 cach objective is refined to an actionable level. The HOW MUCH
(prioritized technical descriptors) values are usually carried along to the next chart to facilitate
oommWlicaticm.This action ensures that the target values are no! lost dining the QFD process. If the
target values are changed, then the product is not meeting the customer requirements and no!
listening to the wice ofthe customer, which defeats the purpose ofQFD.
WHATs
HaWs
HOW MUCH
Figure 3.2: Rctlnementofthe QFD Chart
25

3.5 House of Quality:
QFD employs a "What-How" matrix listing customer wants (the "What"), technical
requirements (the "How"), and competitive a:.sessment using customers' subjective
perceptions and the firm's own objective engineering measurements.
CorrelationMatrices
CustomerNeeds
What
,M,oR,,NCI':,
Design AttributesHOW
Relationships betweenCustomer needs anddesign attributes
Cost and FeasibilityHOW MUCH
Engineering Measures
Figure 3.3: House ofQuaJity
CustomerPerceptions
Thus, QFD provides a "a1' to integrate and subordinate specialized functions departments
into coordinated, collaborative actlvlty that provides customer value. While many
organizations will choose not to usc such a structured technique, they will have to write
operational definitions that clearly articulate the means of providing value to customer.
These definitions will have to he tran,lated into processes and operations to produce the
26
products and serviccs. QFD ,imply provides the structured methodoiogy that promotes
communication among th~ 'p~ciaiized experts who must do this work.
3.6 Outline of the fUlletioning (If the electricity market:
This study is centered on the commcrciaiization of electric energy. This can be carried
out by the Distributing companies to Non-Qualified Customers or to Qualified
Customers that are sub.i~ct to the regulated tariffs (regulated activity) and by the
Retailing company to Qualified Customers (liberalized activity).
Within, this context, it is worth emphasizing tbat in tbe case of the Qualified Customer,
he is the one who cboo,~, tbe Retailing; company and it is therefore he who decides.
Moreover, in an environment of growing competition, the way to differ from the
competition and gain the loyalty of customers is by offering a product! service with a
greater perceived valu~, from the point of view of the customer. So, pressure is then
exerted by tbe reg\llated rate customer who could, at some future point, gain access to
the liberalized market. Thesc circumstances, together with State supervision, compel
the Distributing and the Rc!ailing companies to develop products/services that satisfy
their customers. Consequently, they havc to know their customers, listen to and
understand them, anticipate and take into account all their e~pectations [20]. Thus, the
Distributing and Retaiiing companies of electrical energy must consider the need to
establish a methodology which will allow them to identify the focal point of their
organization as well as which processes, customer service channels or other services
they should improve. The aim wouid be to satisfy the expectations of their customers,
with a continuous q\laiit) improvement. Figure 3.4 represents the final outline of the
functioning ofthe cicctricity market.
27

ORD[NARY RLG'.\lLGENERA Tr.<OCOMPANIES
'"EC1AL RH,I."EGFNPRATINGCOMN"'F\
EXTUNAL,,~
J L
MARKETOrERATOR
CELECTRICITY =:> SYSTEMOPERATOR
RE1AILING CO.""AN[[S - DISTRlBUT'SG COMPANj[)S
01'ALlFlf~ ellS [OMER' REGULATE
J]figure 3.4: Final outlil1e offul1ctioning of the electricity market
3.7 Quality in the E1fftrical Sector
Quality is a strategic variable that can provide the company with a competitive advantage
[14J. Moreover, it coostitutes the main subject dealt with in this article. Therefore, before
going any deeper into this study, it is important that we defmejustwhatweare referringtowhen
we talk of quality and by which aspects it Is dctennlnoo.
We can define quality as a way of management that consists of satisfYing the expectations of the
customers while maintaining the required profitability for the company.
28

There is a strong correlation benvcen the quallty of the service, the level of customer
:;atisfaction and the profitability for the company. According to Philip Kotler [21] 'Higher
standards of quality lead to higher levels of satisfaclion in thc customcrs, which at the ssme
time increases the possibility of higher prices and fr&:Juently, lower costs. Consequcntly,
programmes for the improvement of quality normallyincreasethe companyprofitability'.
Qualily is defincd by the value pcrceivcd by lhe customer, in the present case when a contract is
signed to supply energy and to usc the services of the company. This perceived value,
accordingto the Leviltmodel (e"plainedbyJim Clemmer)[221,is delermined by lhree aspects:
a. The basic product or service offered. These are made up of factors or expectations
related to the supply of electrical energy, in the terms stipulated in the contract, as this
is what makes the machines. the light, the computers, the washing machines, etc, work.
b. The support necessary in order to offer a product or a service. This is made up of
factors or expectations related to work on thc network to supply electricity, to
contracting, to lhe .\Ubscqucnl modifications of the contract tenns and to the reading,
invoicing and collecting of payment adequate to the consumption of electrical energy
throughout the period dctailcd in the contract. Thcsc supporting activities are related to
the basic processes ofa Di;tributing company.
c. Personalized atlention, also called improved service, in lhat it exceeds the
customer's expcctations. It can consist of an option, a novelty, a benefit, a
characteristic, etc, which thc customer does not expect and therefore appreciates. In the
case of supplying electrical energy. due to the monopolistic character it has had up to
now, a determined image has neither been created, nor has it been necessary between
the suppliers. Thus, the etTorts towards the creation of an image form a large part of the
third ring.
Figure 3.5 represenls thc rings of perceived value as applied to thc service of supplying
electricity. The previous standards are represented by circles, ",;th the inner ones
corresponding to the product or service and the outer ones to personalized attention.
29

B"k ,,, .••~,,Eo,,,',;,,1'"",")
~l'PPORT:
1"0" '" ""~"",CO""'"mgCO" ••• " Moo'fi,"""'",~ead'"g, I,,,,,;cmg,CO""""" Pa"",nt
r."~.u«<lSenl,,,Cnm",,;Il"',I,nage
Figure 3.5, The rings ofperccivcd value by T. Levitt
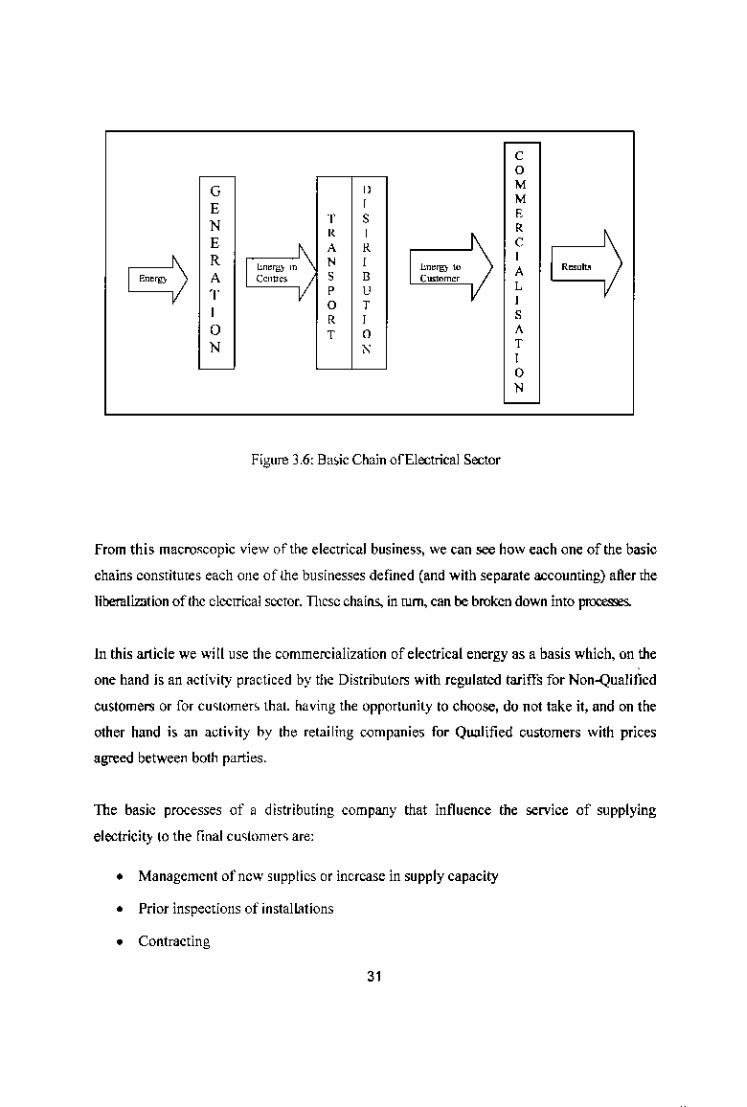
3.8 Tbe Eledricnl Company as a Group of Processes
The analysi~ ofproce,ses is used in the empirical part of this study.
The entire activity of a company Can be undcrstood as chains ofproccsscs where the output of
some feed those that follow, thus becoming input [16]. Figure 3.6 represents, in a simplified
manner, the basic chain of an electrical company with a complete cycle (before the
libcralizationoftlle electrical sector).
30
c0
G " M, ME ,N
, ,, , ,
~
E A , C
~
R , , ,hn,'ID to AA ; , ~_m"
T e " c0 , ,, , , ,
0 , 0 A
N A,,0,
Figure 3,6, B",ic Chain of Electrical Sector
from this macroscopic view "fthe electrical business, we can see how each one of the basic
chains constitutes each one of the businesses defined (and with separate accounting) after the
liberalization of the electrical scctor. TIlcsc chains, in mm, can be broken down into proce.=s.
In this article we will use the commercialization of electrical energy 3S a basis which, on the
one hand is an activity practiced by tllC Distributors with regulated tariffs for Non-Qualil1cd
customers or for cu,!omer<, lhal. having the opportunily to choose, do not take it, and on the
other hand is an activity Ill' the retailing '{lrnpanies for Qualified customers with prices
agreed between both parties.
The basic processes of ~ distributing company that influence the service of supplying
electricit} (0 the final eu<;!omer<;are:
• Management of new supplies or increase in supply capacity
• Prior inspections of instailations
• Contracting
31

• Incomc Cycle, brokcn down into three sub-processes
o Reading
o Invoicing
o Collecting Paymcnt
• Attention to and Management of Incidents in supply of electricity
The interface bet,,~~n th~ cllstorn~r and the distrihulor for the various processes can be
carried out through different channels: the customer call centre, customer service offices,
External customcr scrvicc otl1ccs, ctc.
We must poInt out lhat in the case of lhe rclmlonship between the RetailIng companies and
Large Qualified C\Lstorners (on which "e have based this article), these enjoy sp«lial
treatmentand receivepersonalattentionfj'omAccountManagersthat dealwith all their requests.
The attenlion giv~n through the,e chann~l~ affects lhe value perceived by the cu~tomer;
thereforeinternalqualityindicatorsof the sameshouldbe established.
The descriptionand detailingof lheseprocessesarc necessaryfur the subsequentidentification of the
internal quality indicators, which ,later will be related to the expectations of the customers
through the application of the QPO methodology.
32

CHAPTER FOUR
INVESTIGA nON, RESULTS AND ANALYSIS
4.1 Stages followed in investigation
4.1.t Analysis of the expectations or demands of the customer:
The expectations of the customer have to be gathered, analyzed and dealt with. We
have chosen as a starling point the ,egmentation made by this company and the
results of investigations made on quality as seen by the different segments of
customers, basically on processes. channels of attention and the image of the
company. This stage include>:
A) Identifying and arranging of cu,[omers in order of importance (segmentation of the
m"",,'In the first place the market must be segmented, Il5the expectations of service may
vary from (lne customer to another.
The groups into which DESCO segments the market are:
• Generic customers: The objective is to evaluate the customer's expectations of the
service,which is receivedregularly.Thiscovers:
o Domestic cu,tomer,
o Small hu,inesse,
o Small and medium sized companies
o Large Qualif1cd Customers
• Promoler, and Electrical lnstallers: This group is formed of agents that work and
have influence in the newly constructed or rehabilitated market.
• Recent contact: .1his group belongs to the segment of Domestic customers and
comprises the group of customers that has had contact with the compllIlYduring the
last two months, through any of the channels of the same.The requestsfur servicedefrned
=,33
o Contracting
o Customer Servicc
o Invoicing Claim.1
o Incidents in the network
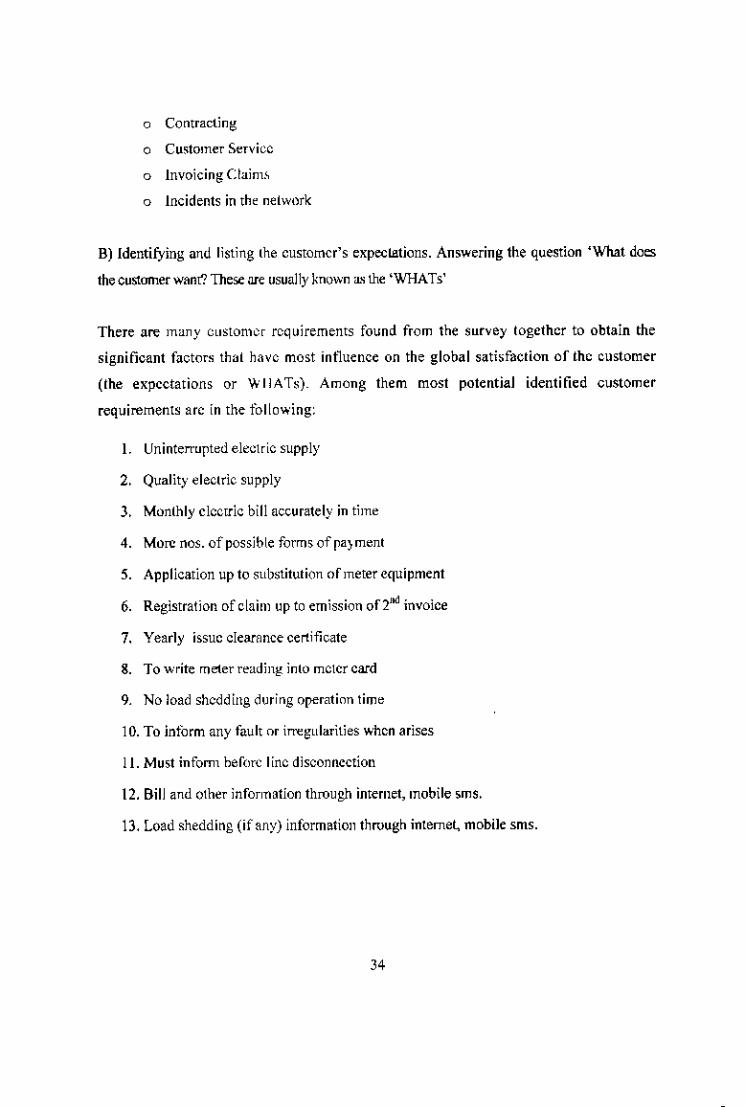
B) Identifying and listing the customcr's expectations. Answering the question 'What does
the customerwant? These are usuallykm)wnas the 'WHATs'
There are many customcr rcquirements found from the survey togethcr to obtain the
significant factors that havc most int1uence on the global sati,faclion of the customer
(the expectations or WIIAT8). Among them most potential identified customer
requirements are in the following:
I. Uninterrupted eleclric supply
2, Quality electric supply
3, Monthly clcctrlc bill accurately in time
4. More nos. ofpossibie forms ofpa}ment
5. Application up to substitution of meter equipment
6. Registration of claim up to emission of2Jod invoice
7. Yearly issuc clearance certificate
8. To write meter reading: into mClcrcard
9. No load shcdding during operatinn time
10. To intorm any fault or irregularilies whcn arises
11.Must infoml beforc linc disconnection
12. Bill and Olher infonmtion through internet, mobile sms,
13. Load shedding (if any) information through internet, mobile sms.
34

C) Putting the customer'; expectations in order: level of importance. (Considering each
expectation on a scale of 0 10 100)
Oncc the factors and their rating are obtained. an analysis ofmuitiple regressions is madc to
obtain the level of importance of the eustomcr's expectations or WHATs (coefficients),
grading them from a to IOO,The aim io t\1pul the WHATs in order of importance,
For the analysis of Customer requirements, the requirements are arranged with respect of
different strategies:
According to operation:
System operdtion
Table 4,1: CU';tomer requirements in respect ofSystcm operation
No Requirements Weight
01 Uninterrupted e!ectri, suppl} 10002 Quaiily cle<:trk supply 63
03 Registration of claim on line fault up to emission 5104 Load shedding infonnation (if any) thrQugh internet, mobile sms, 28
Commercial opcration:
Table 4.2: Customer requirements for domestic and small business customer
No. Requirement, Weight
01 Monthiy electric bill accurately in time 8002 More nOS,ofpossiblc forms of payment 5103 Applkation up to substitution of meter equipment 3304 Registration of claim up to emi~~ion on"" invoice 6805 Yearly iSM,eclearance certificate 2006 Must infonn before line disconne,tion 3307 Bill and other infonnation through internet, mobile sms, 28

Table 4.3: Customer re'luiremenlS for small companies and large qualified customer
No. Requirements Weight
01 Monthly electric bill accurately in time 9002 Registrati{ln of claim up to emission of2"J invoice 47
03 Inform before line disconnection 51
04 Bill and other infOITllationthrough internet, mobile sms. 20
4.1.2 Definition "f the service
In the second stage oj" thc QFD thc aim is to answer the question "Which service
should be developed?', (jr rather 'Which part of the service should be improved in
order to satisfy all the expectations of the customer?'. To do this, we will proeeed
to:
A) Identify the basic aspects and processes of distributing compames, or the
phases of the same which form part of the service and which have an influcnce on
the expectations ofthc customer (these are the basic processes previously defined in
the section entitled The Electrical Company as a Set of Processes).
B) Identify and enumerate the technical or functional specifications of the
processes: definition of the Internal quality indicators. These are known as the
'HOWs', and are measurable and controllable elements through which the demands
{Ifa customer can be satisfied.
At this stage. an analysis of the distributing and retailing companies of the electrical
sector is madc in order to find out their internal quality indicators - taking as
a basis of a company from the sector and that is DESCO. There follows an analysis
of the customers' expectations, selecting those internal quality indicators that
initially are most relatcd to thc customers' expectations. for those expectations that
do not havc thcir Internal quality indicators officially approved, the most suitable
indicator ;hoLLIJbc Jcllncd.36

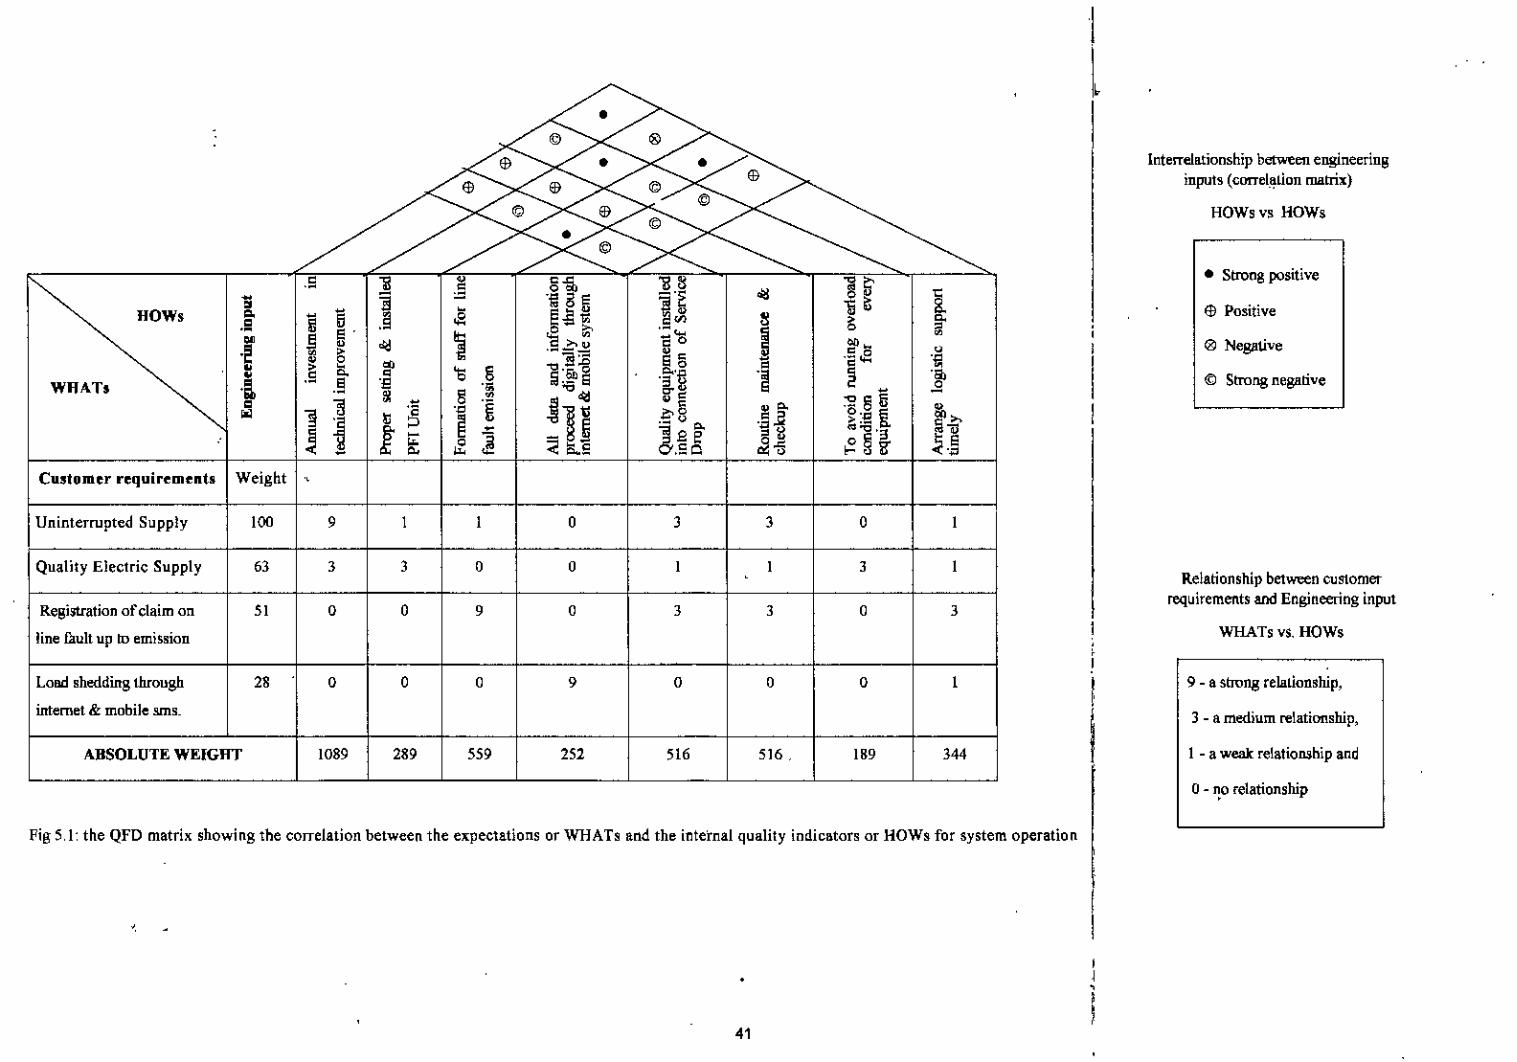
•. 1.3 A study of the relationship between the customers' expectations and the internal
quality indicators
The relationship between the expectations and the internal quality indicators is
established. by means of numerical grading according to their strength using the
traditional system [13]: 9. a strong relationship. 3 - a medium relationship, 1 - a
weak relationship and O. no relationship.
This part of the process. as stated by Knowles (2002) [19], is ollen the most time
consuming and difficult. as it in\'C\lves the experts exploring their knowledge and
experience in order to establish the correlations between the requirements or
expectation s of the eu,lomers and the qualily ind ieators.
Personal interviews have therefore been held with some professionals from DESCO
who were asked to assess the relationships between the expectations and the internal
quality indicators.
AcconJing to operation:
Table 4.4: The internal quality indicators against expectatlons lor System operation
No. Expectation, (WHATs) Internal quality indicators (HOWs)
01 Uninterrupted electric supply Annual investment in technical improvement
Routine maintenance & checkup
Quality equipment installed into connection ofService Drop
02 Quality electric supply To avoid running overload condition for everyequipment
Proper setting & installed PFI Unit
03 Registration of claim '" line Formation ofstafffor line fault emissionfault up to emission
Arrange logistic support timely
04 Load shedding (if an}) through All d,m ,"d infonnation proceed digitallyinternet and mobile sms. through internet & mobile system
37

Commercial operation:
Table 4.5: The internal quality indicators against expectations for Domestic Customers,Small 13\ISinesses (L T Consumer)
No. WHIi.Ts I HOWs01 Monthly dectrie hill A;sign "talT for collecting meter reading and
accurately in time sending bill
Timely take necessary action fo< printing &sending
Stnlllg monitoring & ..of the metersupervlsmg
reader and bi II distributor
02 More nos. of possible forms To increase fonns of paymentof payment
03 Application up to substitution Assign stafffor substitution of meter equipmentof meter equipment
Arrange logi,tic ,upport for the staff
04 Registration of claim cp <0 Formation of staff for customer serviceemission of2'.; invoice
Arrange logi,tie support for the staff
To train slafT for the motivation of customer
To train staff for knowing the official rule, andregulation
All ollicial procedure must be done digitally
05 Yearly issue clearance Timcly take necessary action roc printing &
-certitleate sending
06 Must inform before line Quarterly announce due billdisconnection
Time to lime infonn to consumer basic rules and
-regulation through newsletter
07 Bill ood olba intonnalion All data ",d infonnation proceed digitallythroug.h internel. mobile sms, through internet & mobile system
38

Table 4.6: The internal quality indicators against expectations for Small companies andlarge qualitied consumer (LTI & HT)
No. WHATs HOWs
01 Monthly electric hill Assign staIT for collecting meter reading andaccurately in time sending bill
Timely take necessary action roc printing &sending
Strong monitoring & supervlsmg of the meterreader and bill distributor
02 Registration Oi" claim op <0 Formation of staff for customer service accordingemission 01"2'" invoice to the quantity of consumer
Arrange logistic support for the staff
To train stafrfor the motivatlon of customer
To train staff for knowing the official rules andreg\llation
All official procedure must be done digitally
03 Inform bdoTe line Quarterly armounce due bill against account no.disconncet1011 to the consumer
Time 10time inform to consumer basic rules andregulation through newsletter
04 Bill ,,0 other information All dom ,od information proceed digitallythrough intemel, mobile 8m,. through Internet & mobile system
According to the QF)) methodology. the correlation between WHATs and HOWs is
univocal (0, I, 3 or 9). Nevenhele". in th~ inLe"ie"s with the experts and due to the fact
that opinions are qualitative and refer to a service, the grades given are usually difterent and
at times pr~8en[ a co",iderablc dispersion. Once the grades have been given by all the
experts and taking into account the frequency of each one, the average grading given has
been taken a, the measurement of the distribution centre of each internal quality indicator
for each expectalion.
39

After eompieting the fint s~ries or" interviews with the experts, the deviations have
been calculated and a revi8;on mad~ of lhose results that present the greatest
disper8icm. So in these cases 3 second serie8 of interview; wilh some of the experts
was carried out, "h~rc cont"lIsion h~8 been defected regarding the significance or
range of the internal indicators. Aftcr a new as'sessment, the di8persion in the results
has been considerably r~dll~cd, improving the reliability of the model used.
For each of the 8e~l11enls of cu,lOlllcrs previously defined, a matrix of the
correlalion betwcen the mentioned C\lstomer's expectations and the internal quality
indicators (,[[he processcs analyzed has been made.
Figure 4.1, 4.2, 4.3 are the QFO malrix showing the correlation between the
expeclalions or WHATs and the internal quality indicators or HOWs for the
Customer; Analy,cd segment.
40
I
HOWsvs HOWs
Interrelationship between engineeringinputs (wrreh!-tion matrix)
I.
5~
.5 gi, ~" If I I I • Strong positive- .g •• -~ ~ 'i.I • • ~~ I I I $ PositiveHOWs • li li .; ~ ,.., " ~., , ~ ~ '~'5 I~
~~ 0 ~ ~
'0 ~. I I I 0 Negative.!~
'~s:s 58 0
0 .~ ~ ~ g "tl .5il <:> '.ll .~ <S ••.~
• .~ .~I I I @ Strong negativeWHATs "- I .i .! •• •• ~._S .,
.£• ! • ~~ ~. ~ ::Hi• , ." ." .~ in ;6 .' 0~ • " ~ "S.2 O'-l:l & ~-t'j ! .~ <> ~ > .-
~ h • g~5 ~~"'"tl '3
& ~ :;;: 6..5 ~~B' ~.~
Customer requirements I Weight
-Uninterrupted Supply 100 9 1 1 0 J 3 0 1
Quality Electric Supply 53 3 3 0 0 1 1 J 1 ,Relationship between customer
Registration of claim on 51 0 0 9 0 3 J 0 3 Irequirements and Engineering input
line fill1l! up to emission I WHATs vs. HOWs>I
Load shedding through 28 0 0 0 9 0 0 0 1 I I 9 - a strong relationship,
internet & mobile sms. I I 3 - a medium relationship,
ABSOLUTE WEIGHT I 1089 I 289 I 559 I 252 I 516 I 516 _ I 189 I 344 I I' -a weak relationship and,o - ,!O relationship
I IFig 5, 1: the QFD matrix showing the correlation between the expectations or WHATs and the internal quality indicators or HOWs for system operation
•
41
,I•I

I
-
• • I r • • •
~/@/~ '-/
42
Illtcrre1ationship between engineeringinputs (correlation matrix)
HOWs VS,HOWs
• Strong positive
ffi Positive
o Negative
C9 Strong negative
Relationship between customerrequirements and Engineering input
WHATs VS.HOWs
9 - a strong relationship,
3 - a medium relationship,
1 - a weak relationship and
0- no relationship
Fig 5.2: the QFD matrix showing thecorrelation between the expcctatiolli orWHATs and the internal quality indicatorsor HOWs for commercial operation(Domestic Customers, Small Businesses (LT Consumer))

HOWs VS, HOWs
Interrelationship betweenengineering inputs (correlation
matrix)
I
II
• Strong positive
EEl Positive
~~ ~ ~D, I 0 Negative• I
~~ li " ~~j~.~ " -~ L, B~"","'~ • ~'ft iii 8~ ~~ '~ 6 ". -. '~ iii ,~, I I @ Strong negativeHOW! - '3~6 ~,~= " , , ~.s~ ,gg l~ ~;;,•• ~ "0
" Ol'E <B2,so. • • • •• g ~~.~ '.'" ,. • ,S 2,8 •• 'Ii ~ ,'" • '3" 6 2 '~ ,'. - ~ '" •~ "-~
"~1H '8"0 = ~~~ • o'~"~ .'-,~ "M" '~ "'"5'0 8 .'" '3] .•" ,.~~~ ~ ..~ :~ iii '€i o<l
8 1;II}:5 .6~~
1 -~.~t , .~ '" ~ :30" " ~ •• 0WHATs " I '0. t ~1l" "0l",C c 1:6",C ..• ~'~.iI,~~~
' ~ .,~-. ~'~~,,~ ',S 0 '" ~.•6'8 !." .~ :<li • I 0l,,_0l• 'li d e" ~~e '6 ."], -. ~ 8 ~~.<d ,- . p.,3,S d 0':5 ~,l-<£e :<,'" ~. I
Cu!tomer requirements , Relationship betweenWeight , customer requirements &Monthly electric bill90 9 9 0 3 0 0 3 0 0 1 I 0 Engineering input
accurately in time ,, WHAls vs" HOWsRegistration of claim up to ,47 0 1 9 9 0 0 0 3 3 3 1emission ofr invoice ,
I, I 9 - a strong relationship,Inform before line
51 0 1 3 1 9 0 0 1 0 1 , 3 3 - a medium relationship,disconnection ,Bill and other infonnation I 1 • a weak relationship and
20 0 0 1 1 0 9 0 0 03 1 0through internet, mobile SIDS
I I 0- no relation~hip
ABSOLUTE WEIGHT I 810 I 908 I 596 I 764 I 459 I ISO I 270 I 192 I 141 I 3421 L 200
Fig 5.3: the QFD matrix showing the correlation between the expectations or WHA Ts and the internal quality indicators or HOWs for commercial operation•
(Small companies and large qualified consumer (LTI &Hi)),,
43

4.1.4. Arranging the internal qnality indicat{lrs or HOWs in order of importance
The objective of distinguishing bctwcen and weighing up the various levels of
correlation is to arrange thc internal quaiity indicators according to their
importance. The aim is to progress front the customers. expectations to the
prioritizing of the service's quality indicat",", taking into account the relative
weight of the former. Thus, both the preferences of the different segments of
customers that are anai)zed and the strategy of the company wiii be respected at
the same time.
Within the quality indicator8 or 1I0Ws most important to each segment of
customers, II value judgement of the same is made. To do this, the weight of the
expectations or WHATs and the reiiability of the averages of the correlation of
eneh WHAT with each HO\V is taken into account, according to the differences in
the judgement of the experts.
44
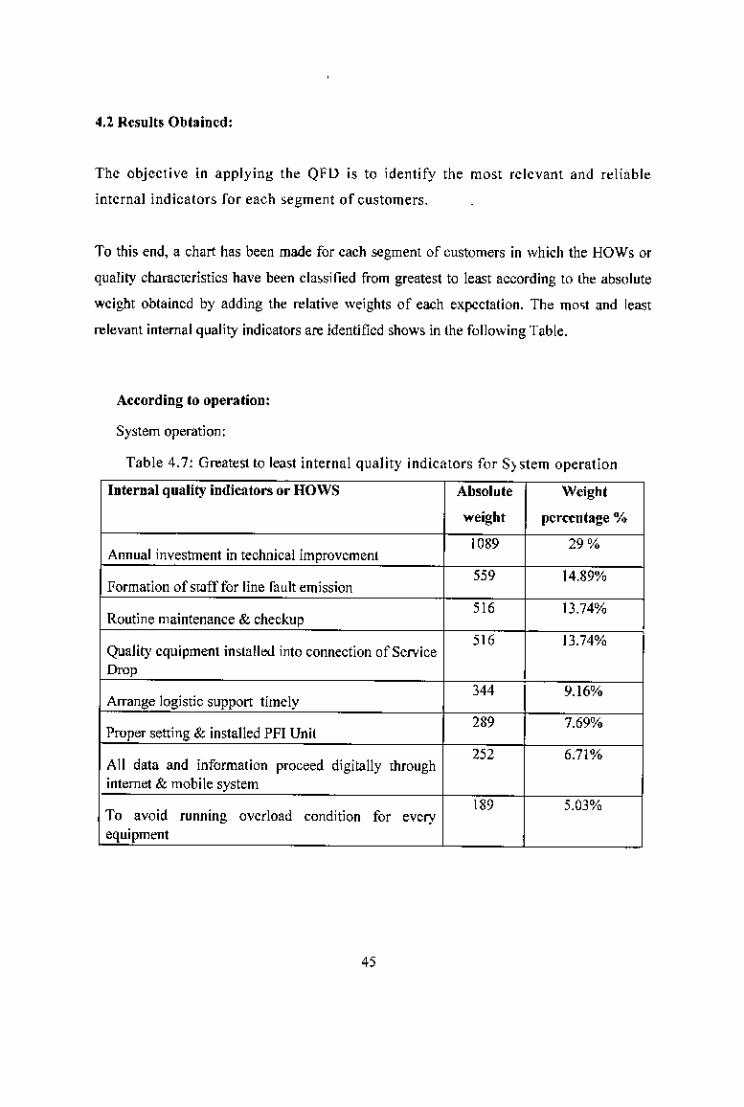
4.2 Results Obtained:
The objective in applying the QFLJ is to identify the most relevant and reliable
internal indicators for each segment of customers.
To this end, a chart has been made for each segment of customers in which the HOWs or
quality characteristics have been c1a,>sified from greatest to ieast according to the absolute
weight obtained by adding the relative weights of each expectation. The m",t and least
relevant internal quality indicators are identified shows in the following Table.
According to operation:
System operation:
Table 4.7: Greatest to least internai quality indicators for S>stem operation
Internal quality indicators Or ROWS Absolute Weight
weight percentage %
1089 29%Annual investment in technical improvement
559 14.89%Formation of staff tor line rault emission
5 16 13.74%Routine maintenance & checkup
516 13.74%Quality equipment installed into connection ofScrvieeOro,
344 9.16%Arrange logistic support timely
289 7.69%Proper setting & installed PFI Unit
252 6.71%Ail data and Information proceed digitally throughinternet & mobile system
189 5.03%To avoid runmng overload condition foe everyequipment
45

Commercial operation:
Table 4.8; Greatest to least internal quality Indicators for D(lmestic Customers,Small Businesses {L T Consumer\
Internal quality indicators or ROWS Absolute Weight
weight percentage %
Ion J6.71%Arrange logistic support for the statr
100 I 15.61%Timely take n«essary action for printing& sending
772 12.03%formation of staff for customer ",rvice
no 11.22%Assign starr for collecting meter reading and sendingbill
472 7.36%All official procedure must be done digitally
459 7.16%To increase COnTIS ofpa}ment
458 7.14%All "" '"' information proceed digitally throughinlernet & mobile system
297 4.63%Assign stafffor substitution of meIer equipment
297 4.63%Quarterly announce due bill
240 3.74%Strong monitoring & supervising of lhe meter readerand bill distributor
237 3.69%To train slaff for the motivation of customer204 3.18%To train statf roc knowing ili, official rules and
regulation185 2.88%
Time to time inform " con,umer basic rules 00'regulation through newsletter
46
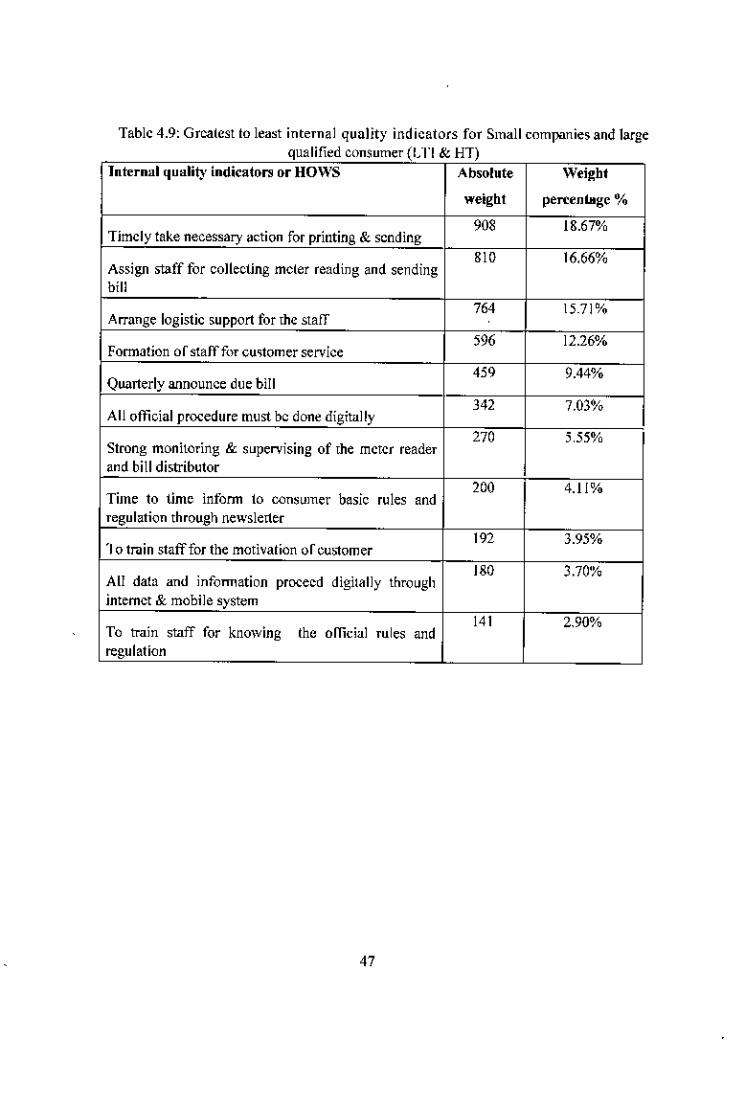
Table 4.9: Greatest to least internal quality indicators for Small companies and largequalified comumer (I TI & HT). .
Internal qualit), indicatOI"llor MOWS Absolute Wei~bt
weight penentage %
908 18.67%Timely take necessary action for printing & sending
810 16.66%Assign staff for collecting meler reading and sendingbill
764 15.71%Arrange logistic support for thc stafT
596 12.26%Fonnation of stafffor cu~tomer service
459 9.44%Quarterly announce due bill342 7.03%All official procedure must be done digitally270 5,55%
Strong monitoring & supervising of the mctcr readerand bill distributor
200 4.1l%Time to time intann to consumer basic rules andregulation through newsletter
192 3.95%'10 train stafffor the motivation of CUl>1omer
180 3,70%All data and infonnation proceed digitally throughinternct & mobile system
141 2.90%To train staff for knowing the officiai rules andregulation
47

4.3 Analysis of results
Subsequent to the application of the QFD methodology to the Distributing companies,
an analysis of the results trom the field of Quality Management i, carried out.
Emphasis is placed on the relationship existing between the value perceived by the
customer and the correct execution of the internal processes, the quality in customer
service channels and an adequate configuration of image. Thi, analysis is divided into
two groups:
(a) The QFD and the value perceived by the customer
(b) The QFD a, a tool for studying the internal quality indicators oUhe processes,
customer service channels and Image.
(a) The QFD and the value perceh'cd by the customer
Alter carrying out a comparative analysis of the value perceived by the customer,
explained by means of Levitt'~ ring, and the expeetation~ of the customer studied in
the QFD methodology, it is obvious that Levilt's rings group together different factors.
However, these gf\lUPSare not prioritized in the importance of the mentioned factors
for the customer,
A clear case of this is that of the Generic Cu~tomers, where for Dome,tic Customers,
Small Businesses (L T Con,umer) and Small and Medium Sized Companies (LTl
Consumer), factors which constitute the third ring (Image) are mOre important than
those of the first and second rings. In this type of customer, with a lower consumption
rate, the electrical supply (first ring), while still important. is taken for granted.
Only in the case of Large Qualified Customers (H T Consumer), with a high rate of
consumption, do the expectations referring to the first ring (Electrical Supply) have a
top priority rating, above that of Image.

(b) The QFD as a tool for studying the internal qualit}' indicntors of the
processes, customer service channels and Image.
Regarding the most relevant internal indicators, the study that has been made infers
that there are no key indicators that wouid translate the expectations of ali the
segments, and that improving the most relevant indicators would en'lIfe a vast
improvement of the expectations of any customer who is ,erviced by the electrical
company. Each group should be analyzed separately.
(i) Generic Customers: Domestic, Small Businesses, Small and Medium Sized
Companies, and Large Qualified Customers. The most relevant internal Indicators
COmmOnto this group are 'TIEPi' (lnterruption time equivalent to power install cd).
NIEPI (Number of interruptions equivalent to the power installcd), 'Formation of
customer service staff or of the account manager' and 'Information on the incident
in the network'. Thrcc of these stand out as referring dirccliy to the first ring of
valUe perceived by thc customer eiectrical supply.
(Ii) Promoters and L1ectrical Installers. The most relevant internal quality
indicators common to this group are: "Annual conferenccs on new technology, offers,
regulations, etc, Period of time from payment of customer and obtaining
permits, up to thc cnd of work" and "Period of time from application for a new
,uprly up to communication of technical-economic study',
( iii I Recent Contact with Domestic Customers: Contracting, Customer Service,
Invoicing Claims and Incidents in the network The internal quality Indicator common
to all types of recent contact analyzed is the 'Deiay waiting for a consultation or
service to be carried Ollt'.
After this, each type of recent contact, as it tcfers to a different proccss, has indicatorssuitable for its resoiution:
Contracting: 'Period of time from application up to installation of the meter
equipment. '
49
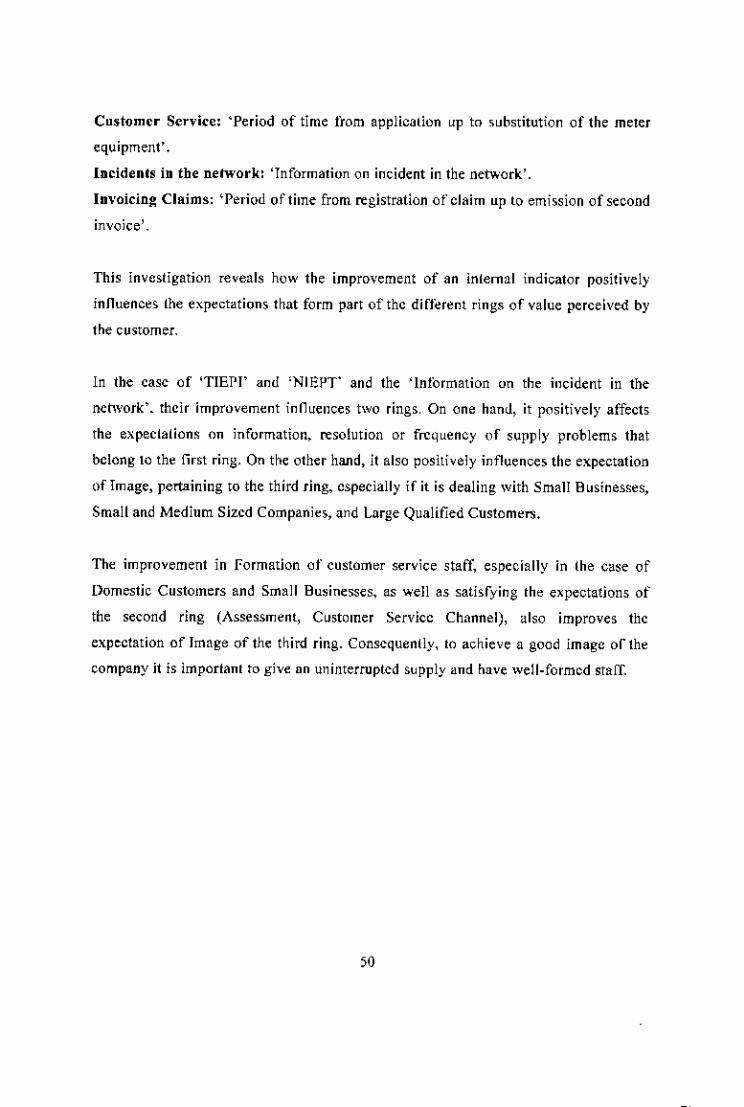
Customer Service: 'Period of time from application up to substitution of the meter
equipment',
lueidents in the network: 'Information on incident in the neovork'.
In,'oiein~ Claims: 'Period of time from registration of claim up to emission of second
invoice' .
This investigation reveals how the improvement of an internal indicator positively
influences the expectations that form part of the different rings of value perceived by
the customer.
In the case of 'TiEPr and 'NIEPT and the 'Information on the incident in the
network'. their improvement influences two rings. On one hanel, it positively affects
the expeclations On information, resolution or frequency of supply problems that
belong to the first ring. On the other hand, it also positively influences the expectation
of Image, pertaining to the third ring, especially if it is dealing with Small Businesses,
Small and Medium Sized Companies, and Large Qualified Customers,
The improvement in formation of customer service staff, especially in the case of
Domestic Customers and Small Businesses, as well as satisfying the expectations of
the second ring (Assessment, Customer Service Channel), also improves the
expectation of Image of the third ring. Consequently, to achieve a good image of the
company it is important to give an uninterrupted supply and have well-formed staff.
50

CHAPTER FIVE
CONCLUSION
The Company has to identify the focal point of its organization, and also which
processes, attention channels or other services Ilave to be improved in order to
satisfy its customer's expectations. In this thesis I found that Annual investment in
technical improvement, Fonnation of slaff for line fault emission, Routine maintenance &
checkup, Quality equipment Installed into connection of Service Drop are the most weighted
internal quality indicators for system operation to supply uninterrupted power for all groups
of consumer. On the other Iland, Arrange logistic support for the staff, Timely take necessary
action for printing & ~ding, Formation of staff for customer service, Assign staff for
collecting meter reading and sending bill arc the most weighted internal quality indieator.s
for commercial operation for both Domestic Customers, Small Businesses (L T
Consumer) and Small companies and iarge quaiified consumer (LTI & HT) to give better
customer services. In the same way, it can be Seen how the quality indieat()rs could
take on a different importance according to the segment of customers anaiyzed.
Summarizing, it can be aftirmed tllat tile sati~faction of the customers studied i~ the
object of any economic activity. But, a~ demonstrated in this articie, the
characteristics that make up the satisfaction are different for each group and couid
ev()lve with time. Therefore, the customer is the oniy meaSure "f quality and only
by knowing the customer's expectati()ns and managing activities towards satisfying
them will we optimize the usc of Our resources.
51

REFERENCES
[I] Shigeru Mizuno and Yoji Aho, QfD: The Customer-Driven Approach to Quality
Planning and Deployment, Publisher: Asian Productivity Organization, 1994
[l] Dale H. Besterfield, Carol Bcsterfield, Glen H. Besterficld, Mary I:lesterfield; Total
Quality Management, Third Edition, pp: 317-318, 287
[3] TRAPPEY C. V.; TRAPPEY A. J. c.; HWANG S. J. "A computerized quality function
deployment approach for retail services". Journal of Computers &
engineering,Vol. 30, No 4. pp: 611-<i22,1996Industrial
[4] Kwai-Sang Chin, Kit-Fai Pun, W.M. Leung, Henry Lau; "A quality function deployment
approach for Improving technical library and information services: a case study". Journal:
Library Management; Volume: 22, Issue: 4/5, pp: 195 - 204, 2001
[5] Gin-Shuh Liang, Tsung-Yu Chou, Shu.Fen Kan ; "Applying fU7.>:Yquality function
deployment to identifY service management requirements for an ocean freight forwarder"
Journal: Total Quality Management and Business Excellence; Volume 17, Number 5. pp:
539 - 554, 2006
[6] Chun-Lang Chang; "Application ofqualil)' function deploymenl launches to enhancing
nursing home service quality"; Journal: Total Quality Management and Business Excellence;
Volume 17,Number 3, pp: 287 - 302, 2006
17JEugene F. Brigham and Michael C. Ehrhardt; Financial Management, 10th Edition
[8] Krishna G. Palepu, Paul M. Healy, Victor L. Bernafd, (2'cdEdition), l3usiness Analysis &
Valuation - Using Financial Statement
[9] Stephen A. Ross, Randolph W. WesterfIeld, Jeffrey f. Jaffe; Corporate finance, 6'"Edition.
52
1101Annual Report 2003-04, Dhaka EIeetI1cSupply Company Ltd.
111]Annual Report 2004-05, Dhaka Eleetr1cSupply Company Ltd.
112]Annual Report 2005-06, Dhaka Electric Supply Company Ltd.
[131Akao Y, (F.d.);Quality function Deployment (Cambridge, MA: ProductivIty Press), 1993
[14] Dahlgaard 1.J., Kristensen K. & Kanji G, K,; fundamentals ofTolll1 Quality Management
(London:Chapman & Hall) , 1998
[15] M, kamruzzaman; "Report on Power Sector in Bangladesh Focused on Organizational
Business and Development Activities of DESCO", EMBA, University of Dhaka,
Bangladesh,2007
[16] Conti T.; Building Total Quality (London: Chapman & Hall), 1997
[17] Deming, W. E.; The New Economics for Industry, Government and Education
(Cambridge, MA: MIT Centre for Advanced Engineering Study), 1993
[18] Park, H.S. & Noh, S. J.; Enhancement of web design quality through the QFD
approach, Total Quality Management, 13(3), pp 393-401, 2002
[19] Knowless, G.; QFD: Customer driven design of products and services, J. Antony & D.
Preece (Eds.); Understanding, Managing and Implementing Quality, pp. 57-80, 2002
[201Zcithmal V. A., Parasuraman A. & Berry L. L.; Delivering Quality Service, The Free
Press, 1993
[21] Kotler P., Camara D., Grande I., & Cruz I.; Marketing Management, The Millennium
Edition (Prentice Hall), pp. 63-64, 2000
[22) Clemmer J, & Sheely B.; Firing on all Cylinders, pp. 29-38, 1992
53