Can Tho Urban Development and Resilience Project - World ...
191
Environmental and social impact assessment – CTUDR 1 PEOPLE COMMITTEE OF CAN THO CITY ODA PROJECT MANAGEMENT UNIT, CAN THO CITY CAN THO URBAN DEVELOPMENT AND RESILIENCE PROJECT ANNEXS ENVIRONMENTAL AND SOCIAL IMPACT ASSESSMENT Public Disclosure Authorized Public Disclosure Authorized Public Disclosure Authorized Public Disclosure Authorized
-
Upload
khangminh22 -
Category
Documents
-
view
2 -
download
0
Transcript of Can Tho Urban Development and Resilience Project - World ...
Environmental and social impact assessment – CTUDR
1
PEOPLE COMMITTEE OF CAN THO CITY
ODA PROJECT MANAGEMENT UNIT, CAN THO CITY
CAN THO URBAN DEVELOPMENT AND RESILIENCE PROJECT
ANNEXS
ENVIRONMENTAL AND SOCIAL
IMPACT ASSESSMENT
Pub
lic D
iscl
osur
e A
utho
rized
Pub
lic D
iscl
osur
e A
utho
rized
Pub
lic D
iscl
osur
e A
utho
rized
Pub
lic D
iscl
osur
e A
utho
rized
WB371432
Typewritten Text
SFG1540 V2
WB371432
Typewritten Text
WB371432
Typewritten Text
WB371432
Typewritten Text
WB371432
Typewritten Text
CAN THO URBAN DEVELOPMENT AND RESILIENCE ENHANCEMENT PROJECT
Social Assessment Report
2
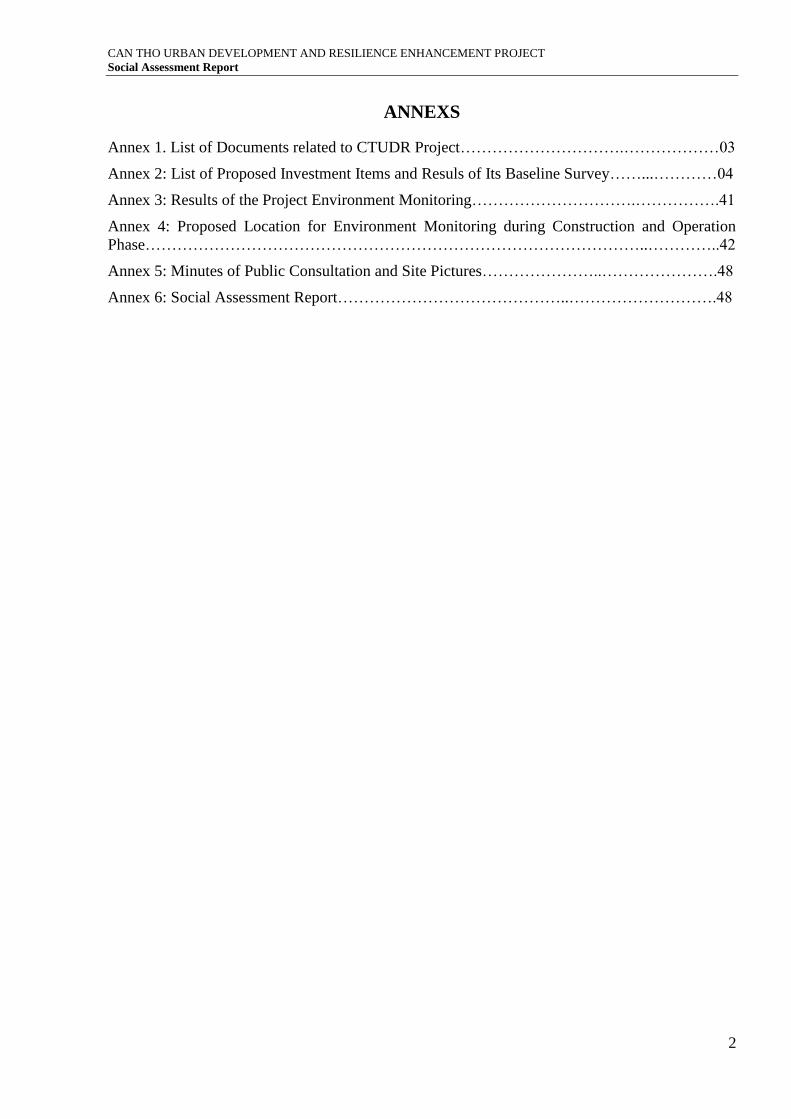
ANNEXS
Annex 1. List of Documents related to CTUDR Project………………………….………………03
Annex 2: List of Proposed Investment Items and Resuls of Its Baseline Survey……...…………04
Annex 3: Results of the Project Environment Monitoring………………………….…………….41
Annex 4: Proposed Location for Environment Monitoring during Construction and Operation
Phase…………………………………………………………………………………..…………..42
Annex 5: Minutes of Public Consultation and Site Pictures…………………..………………….48
Annex 6: Social Assessment Report……………………………………..……………………….48
CAN THO URBAN DEVELOPMENT AND RESILIENCE ENHANCEMENT PROJECT
Social Assessment Report
3
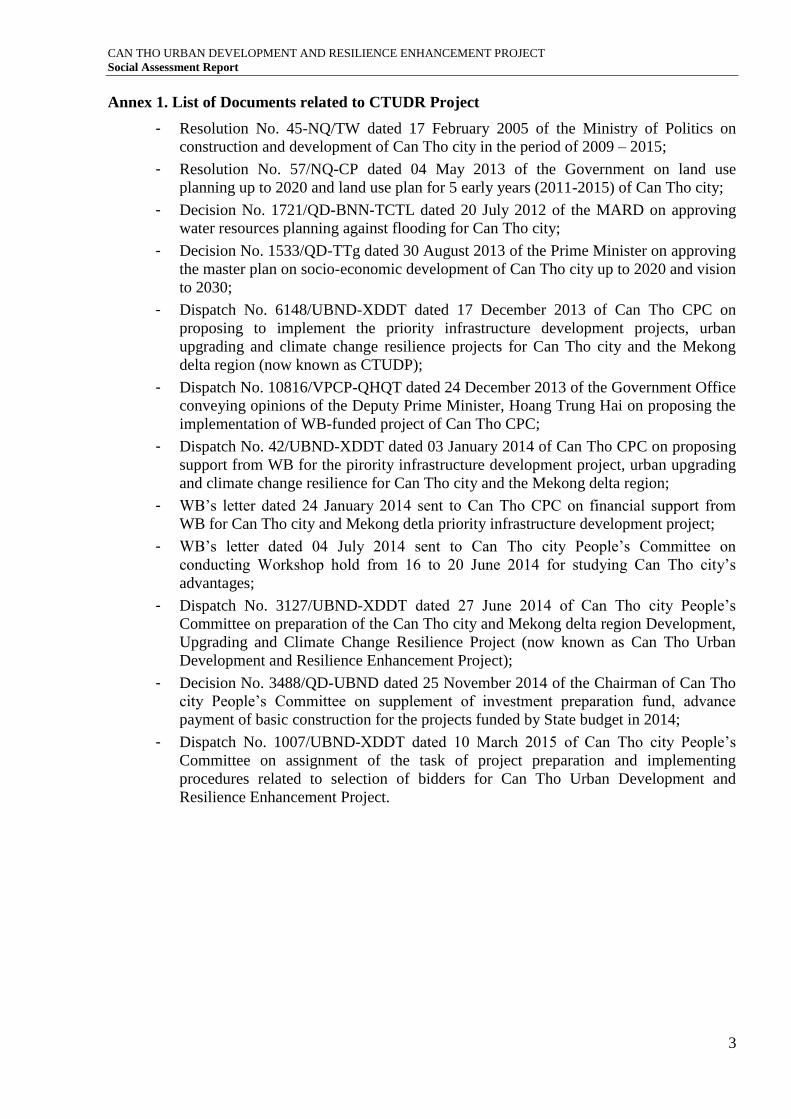
Annex 1. List of Documents related to CTUDR Project
- Resolution No. 45-NQ/TW dated 17 February 2005 of the Ministry of Politics on
construction and development of Can Tho city in the period of 2009 – 2015;
- Resolution No. 57/NQ-CP dated 04 May 2013 of the Government on land use
planning up to 2020 and land use plan for 5 early years (2011-2015) of Can Tho city;
- Decision No. 1721/QD-BNN-TCTL dated 20 July 2012 of the MARD on approving
water resources planning against flooding for Can Tho city;
- Decision No. 1533/QD-TTg dated 30 August 2013 of the Prime Minister on approving
the master plan on socio-economic development of Can Tho city up to 2020 and vision
to 2030;
- Dispatch No. 6148/UBND-XDDT dated 17 December 2013 of Can Tho CPC on
proposing to implement the priority infrastructure development projects, urban
upgrading and climate change resilience projects for Can Tho city and the Mekong
delta region (now known as CTUDP);
- Dispatch No. 10816/VPCP-QHQT dated 24 December 2013 of the Government Office
conveying opinions of the Deputy Prime Minister, Hoang Trung Hai on proposing the
implementation of WB-funded project of Can Tho CPC;
- Dispatch No. 42/UBND-XDDT dated 03 January 2014 of Can Tho CPC on proposing
support from WB for the pirority infrastructure development project, urban upgrading
and climate change resilience for Can Tho city and the Mekong delta region;
- WB’s letter dated 24 January 2014 sent to Can Tho CPC on financial support from
WB for Can Tho city and Mekong detla priority infrastructure development project;
- WB’s letter dated 04 July 2014 sent to Can Tho city People’s Committee on
conducting Workshop hold from 16 to 20 June 2014 for studying Can Tho city’s
advantages;
- Dispatch No. 3127/UBND-XDDT dated 27 June 2014 of Can Tho city People’s
Committee on preparation of the Can Tho city and Mekong delta region Development,
Upgrading and Climate Change Resilience Project (now known as Can Tho Urban
Development and Resilience Enhancement Project);
- Decision No. 3488/QD-UBND dated 25 November 2014 of the Chairman of Can Tho
city People’s Committee on supplement of investment preparation fund, advance
payment of basic construction for the projects funded by State budget in 2014;
- Dispatch No. 1007/UBND-XDDT dated 10 March 2015 of Can Tho city People’s
Committee on assignment of the task of project preparation and implementing
procedures related to selection of bidders for Can Tho Urban Development and
Resilience Enhancement Project.
CAN THO URBAN DEVELOPMENT AND RESILIENCE ENHANCEMENT PROJECT
Social Assessment Report
4
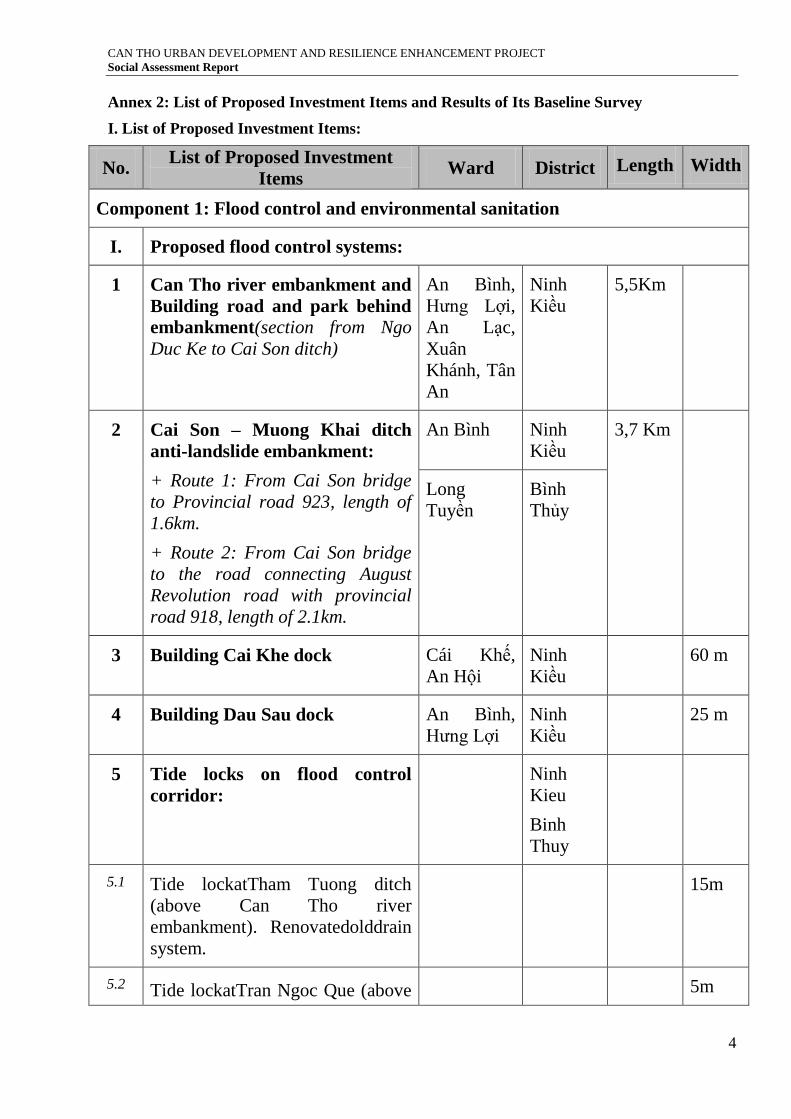
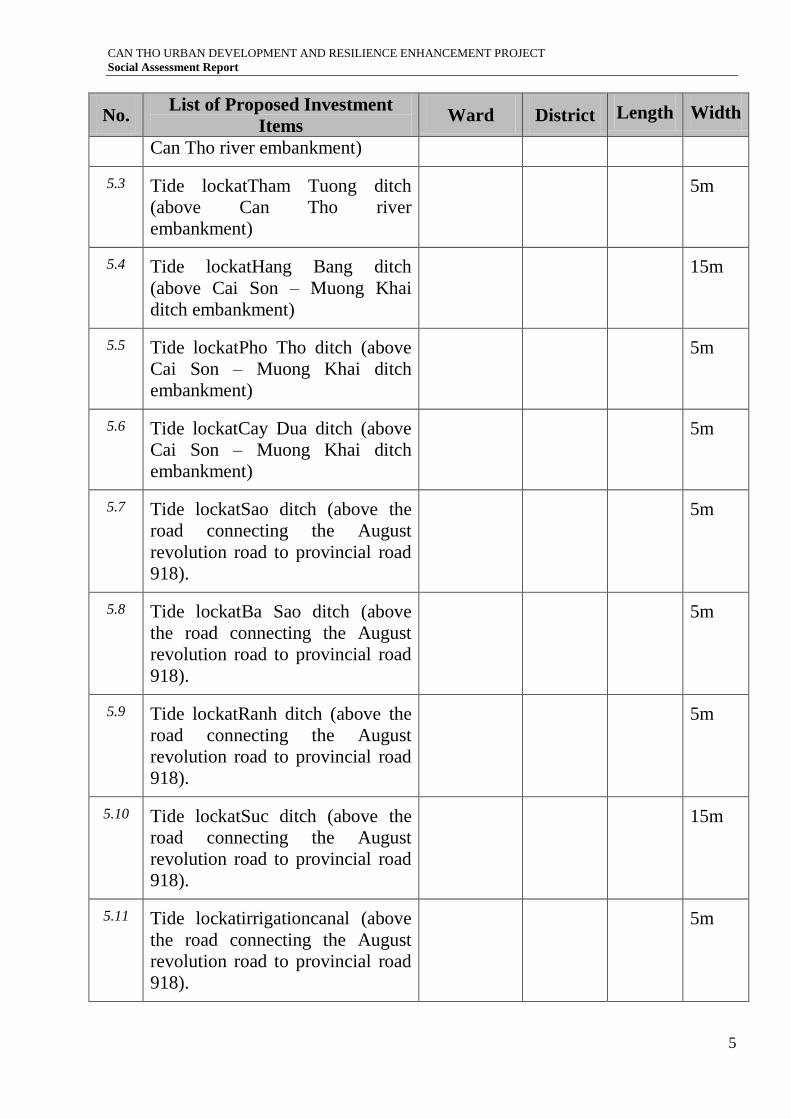
Annex 2: List of Proposed Investment Items and Results of Its Baseline Survey
I. List of Proposed Investment Items:
No. List of Proposed Investment
Items Ward District Length Width
Component 1: Flood control and environmental sanitation
I. Proposed flood control systems:
1 Can Tho river embankment and
Building road and park behind
embankment(section from Ngo
Duc Ke to Cai Son ditch)
An Bình,
Hưng Lợi,
An Lạc,
Xuân
Khánh, Tân
An
Ninh
Kiều
5,5Km
2 Cai Son – Muong Khai ditch
anti-landslide embankment:
+ Route 1: From Cai Son bridge
to Provincial road 923, length of
1.6km.
+ Route 2: From Cai Son bridge
to the road connecting August
Revolution road with provincial
road 918, length of 2.1km.
An Bình Ninh
Kiều
3,7 Km
Long
Tuyền
Bình
Thủy
3 Building Cai Khe dock Cái Khế,
An Hội
Ninh
Kiều
60 m
4 Building Dau Sau dock An Bình,
Hưng Lợi
Ninh
Kiều
25 m
5 Tide locks on flood control
corridor:
Ninh
Kieu
Binh
Thuy
5.1 Tide lockatTham Tuong ditch
(above Can Tho river
embankment). Renovatedolddrain
system.
15m
5.2 Tide lockatTran Ngoc Que (above 5m
CAN THO URBAN DEVELOPMENT AND RESILIENCE ENHANCEMENT PROJECT
Social Assessment Report
5
No. List of Proposed Investment
Items Ward District Length Width
Can Tho river embankment)
5.3 Tide lockatTham Tuong ditch
(above Can Tho river
embankment)
5m
5.4 Tide lockatHang Bang ditch
(above Cai Son – Muong Khai
ditch embankment)
15m
5.5 Tide lockatPho Tho ditch (above
Cai Son – Muong Khai ditch
embankment)
5m
5.6 Tide lockatCay Dua ditch (above
Cai Son – Muong Khai ditch
embankment)
5m
5.7 Tide lockatSao ditch (above the
road connecting the August
revolution road to provincial road
918).
5m
5.8 Tide lockatBa Sao ditch (above
the road connecting the August
revolution road to provincial road
918).
5m
5.9 Tide lockatRanh ditch (above the
road connecting the August
revolution road to provincial road
918).
5m
5.10 Tide lockatSuc ditch (above the
road connecting the August
revolution road to provincial road
918).
15m
5.11 Tide lockatirrigationcanal (above
the road connecting the August
revolution road to provincial road
918).
5m
CAN THO URBAN DEVELOPMENT AND RESILIENCE ENHANCEMENT PROJECT
Social Assessment Report
6
No. List of Proposed Investment
Items Ward District Length Width
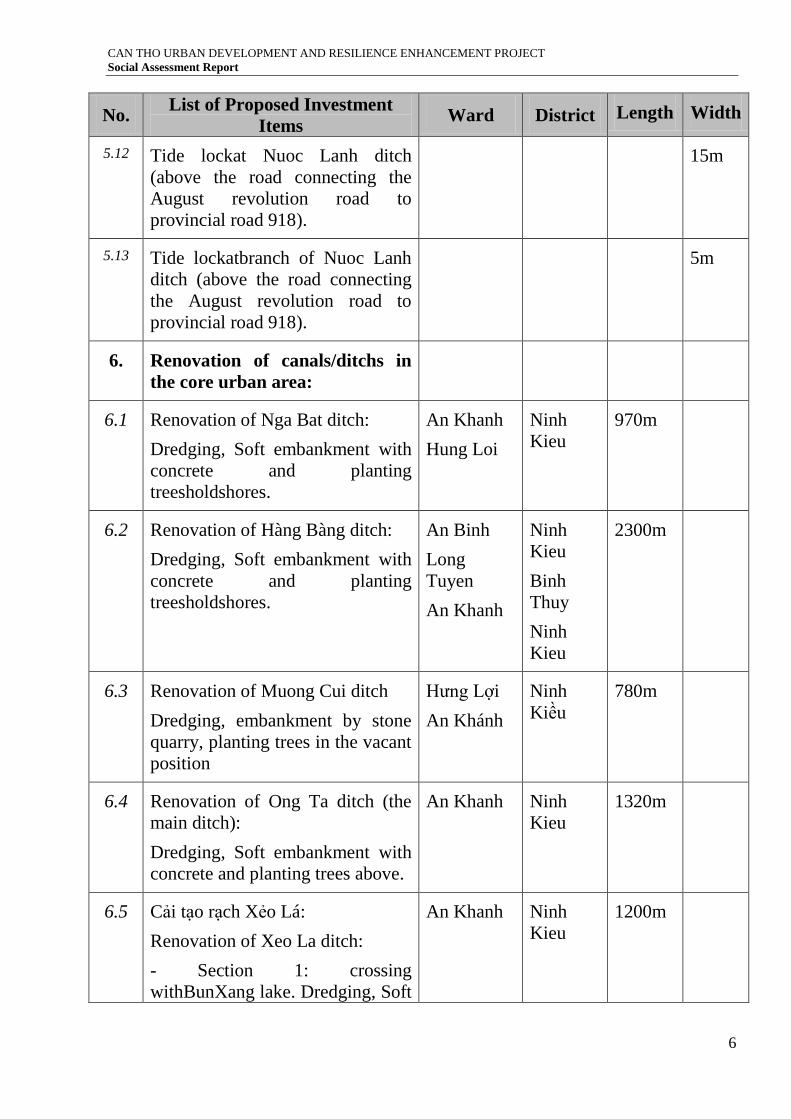
5.12 Tide lockat Nuoc Lanh ditch
(above the road connecting the
August revolution road to
provincial road 918).
15m
5.13 Tide lockatbranch of Nuoc Lanh
ditch (above the road connecting
the August revolution road to
provincial road 918).
5m
6. Renovation of canals/ditchs in
the core urban area:
6.1 Renovation of Nga Bat ditch:
Dredging, Soft embankment with
concrete and planting
treesholdshores.
An Khanh
Hung Loi
Ninh
Kieu
970m
6.2 Renovation of Hàng Bàng ditch:
Dredging, Soft embankment with
concrete and planting
treesholdshores.
An Binh
Long
Tuyen
An Khanh
Ninh
Kieu
Binh
Thuy
Ninh
Kieu
2300m
6.3 Renovation of Muong Cui ditch
Dredging, embankment by stone
quarry, planting trees in the vacant
position
Hưng Lợi
An Khánh
Ninh
Kiều
780m
6.4 Renovation of Ong Ta ditch (the
main ditch):
Dredging, Soft embankment with
concrete and planting trees above.
An Khanh Ninh
Kieu
1320m
6.5 Cải tạo rạch Xẻo Lá:
Renovation of Xeo La ditch:
- Section 1: crossing
withBunXang lake. Dredging, Soft
An Khanh Ninh
Kieu
1200m
CAN THO URBAN DEVELOPMENT AND RESILIENCE ENHANCEMENT PROJECT
Social Assessment Report
7
No. List of Proposed Investment
Items Ward District Length Width
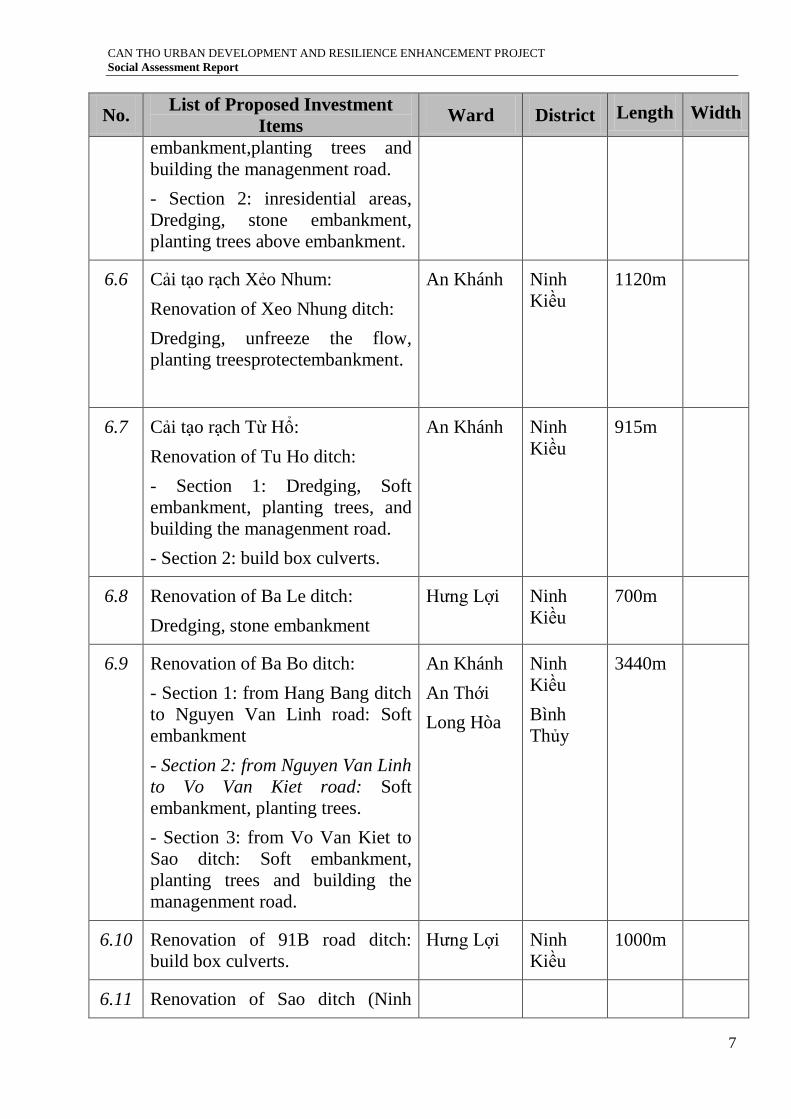
embankment,planting trees and
building the managenment road.
- Section 2: inresidential areas,
Dredging, stone embankment,
planting trees above embankment.
6.6 Cải tạo rạch Xẻo Nhum:
Renovation of Xeo Nhung ditch:
Dredging, unfreeze the flow,
planting treesprotectembankment.
An Khánh Ninh
Kiều
1120m
6.7 Cải tạo rạch Từ Hổ:
Renovation of Tu Ho ditch:
- Section 1: Dredging, Soft
embankment, planting trees, and
building the managenment road.
- Section 2: build box culverts.
An Khánh Ninh
Kiều
915m
6.8 Renovation of Ba Le ditch:
Dredging, stone embankment
Hưng Lợi Ninh
Kiều
700m
6.9 Renovation of Ba Bo ditch:
- Section 1: from Hang Bang ditch
to Nguyen Van Linh road: Soft
embankment
- Section 2: from Nguyen Van Linh
to Vo Van Kiet road: Soft
embankment, planting trees.
- Section 3: from Vo Van Kiet to
Sao ditch: Soft embankment,
planting trees and building the
managenment road.
An Khánh
An Thới
Long Hòa
Ninh
Kiều
Bình
Thủy
3440m
6.10 Renovation of 91B road ditch:
build box culverts.
Hưng Lợi Ninh
Kiều
1000m
6.11 Renovation of Sao ditch (Ninh
CAN THO URBAN DEVELOPMENT AND RESILIENCE ENHANCEMENT PROJECT
Social Assessment Report
8
No. List of Proposed Investment
Items Ward District Length Width
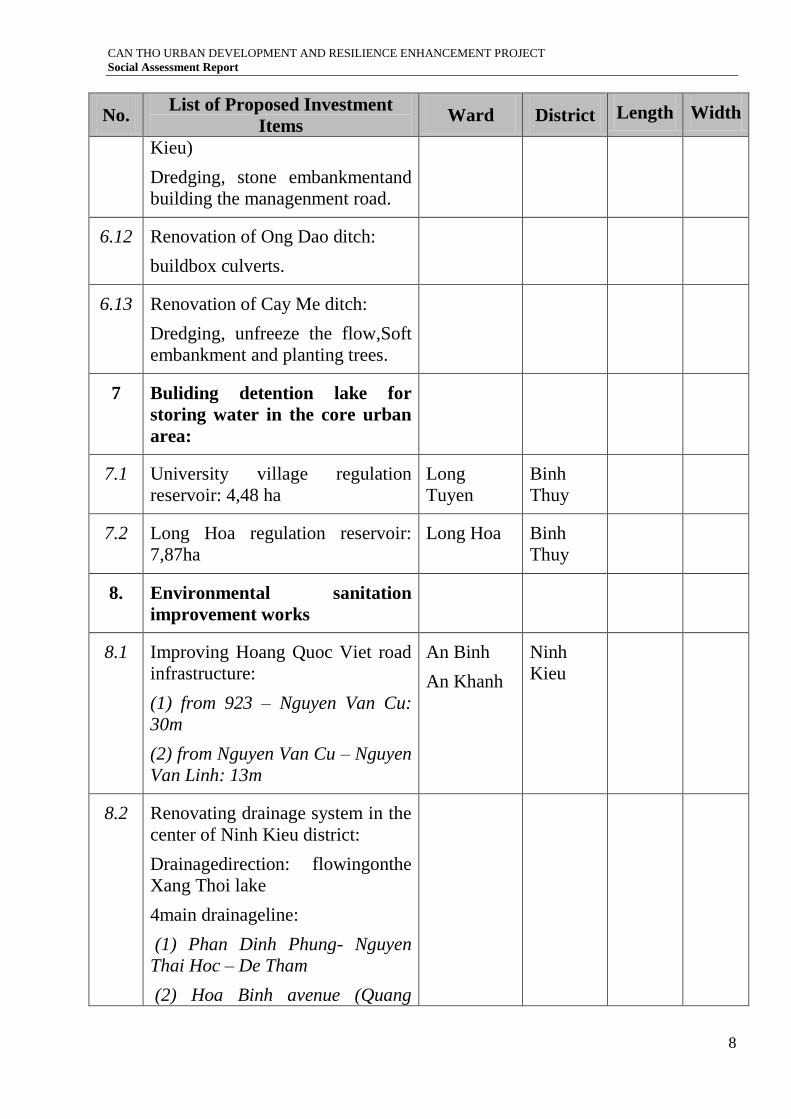
Kieu)
Dredging, stone embankmentand
building the managenment road.
6.12 Renovation of Ong Dao ditch:
buildbox culverts.
6.13 Renovation of Cay Me ditch:
Dredging, unfreeze the flow,Soft
embankment and planting trees.
7 Buliding detention lake for
storing water in the core urban
area:
7.1 University village regulation
reservoir: 4,48 ha
Long
Tuyen
Binh
Thuy
7.2 Long Hoa regulation reservoir:
7,87ha
Long Hoa Binh
Thuy
8. Environmental sanitation
improvement works
8.1 Improving Hoang Quoc Viet road
infrastructure:
(1) from 923 – Nguyen Van Cu:
30m
(2) from Nguyen Van Cu – Nguyen
Van Linh: 13m
An Binh
An Khanh
Ninh
Kieu
8.2 Renovating drainage system in the
center of Ninh Kieu district:
Drainagedirection: flowingonthe
Xang Thoi lake
4main drainageline:
(1) Phan Dinh Phung- Nguyen
Thai Hoc – De Tham
(2) Hoa Binh avenue (Quang
CAN THO URBAN DEVELOPMENT AND RESILIENCE ENHANCEMENT PROJECT
Social Assessment Report
9
No. List of Proposed Investment
Items Ward District Length Width
Trung bridge) – De Tham
(3) Hoa Binh avenue (Xo Viet
Nghe Tinh road - De Tham road)
(4) Vo Thi Sau – Nguyen Khuyen
– De Tham
Buildingpump station at Xang
Thoi lake.
Component 2: Urban corridor development
1 Building Quang Trung bridge
(bay 2)
- Construction ofa newbridge
section
- Extendingthe existingbridge
- Constructionof the
bridgepath
- Construction oflighting
systems
Xuân
Khánh
Hưng Phú
Ninh
Kiêu
Cai Rang
481m 11m
2. Building Tran Hoang Na road
bridge, and parallel road IC3
Hung Loi
An Binh
An Khanh
Hung
Thanh
Ninh
Kieu
Cai Rang
3794m
3. Building the road connecting the
August revolution road to
provincial road 918
An Thoi
Long Hoa
Long
Tuyen
Binh
Thuy
4 Building residential areas for
resettlement:
InfrastructureConstruction: road,
Drainage, water supply, light up,
green trees, culture house… with
53haarea
An Binh Ninh
Kieu
CAN THO URBAN DEVELOPMENT AND RESILIENCE ENHANCEMENT PROJECT
Social Assessment Report
10
II. Results of Its Baseline Survey
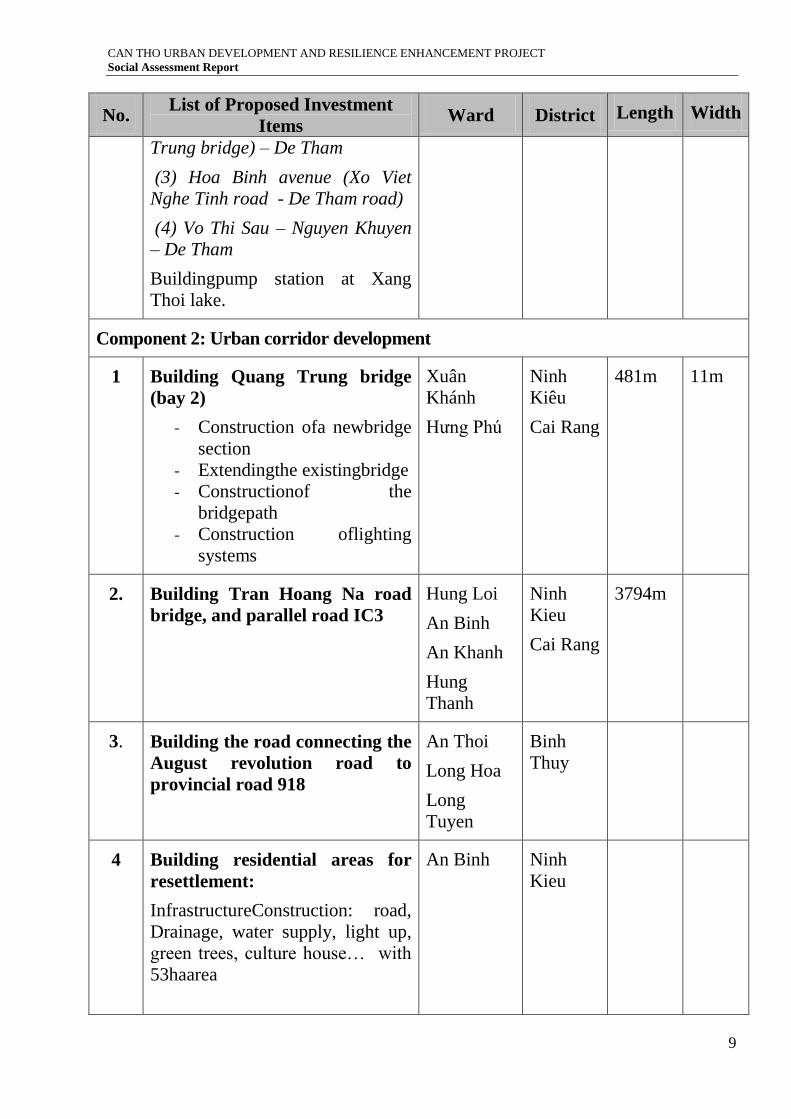
1. Can Tho river embankment (section from Ngo Duc Ke to Cai Son ditch):
Status: The left bank was built and a part of embankment to Ngo Duc Ke road was
built.The area where the embankment crosses is crowded. There are some sections to be
encroached and regularly landslided. Below are some pictures of current status of Can Tho river
section to be built with the embankment.
No
. Section Characteristics of the route Illustrative picture
Can Tho river (Ngo Duc Ke – Cai Son ditch)
Km0 –
Km1+420
Coordinates of start point:
10o01’47,69”N - 105
o47’16,64”E
The start point begins from the
interchange of Ngo Duc Ke road and
Vo Thi Sau road, stetching to end of
Nguyen Thi Minh Khai road. The
population is crowded and many
households living adjacent to river
bank, encroach the river bank.There is
no embankment in this section. There
are two successive roads along the river
banks, including Vo Thi Sau and
Nguyen Thi Minh Khai. Road
pavement is paved with asphalt, built
with sidewalk but non-homogeneous,
built with drainage system and lighting
system. The start point section has
Preventive Medicine Center of the
city, guest house No. 2 (Km0); 2
markets of Tan An (Km0+220) and An
Lac (Km0+710) located near river
banks, Cathedral (Km0+480) with
coordinates (10o01’36,72”N -
105o47’06,42”E); Ninh Kieu
Methadone treatment facility
(Km0+850) ; The Military Court of
Region 9 (Km0+860); Quang Trung
bridge (Km0+985); Nguyen Thi Minh
Khai bridge (Km1+300)
CAN THO URBAN DEVELOPMENT AND RESILIENCE ENHANCEMENT PROJECT
Social Assessment Report
11
No
. Section Characteristics of the route Illustrative picture
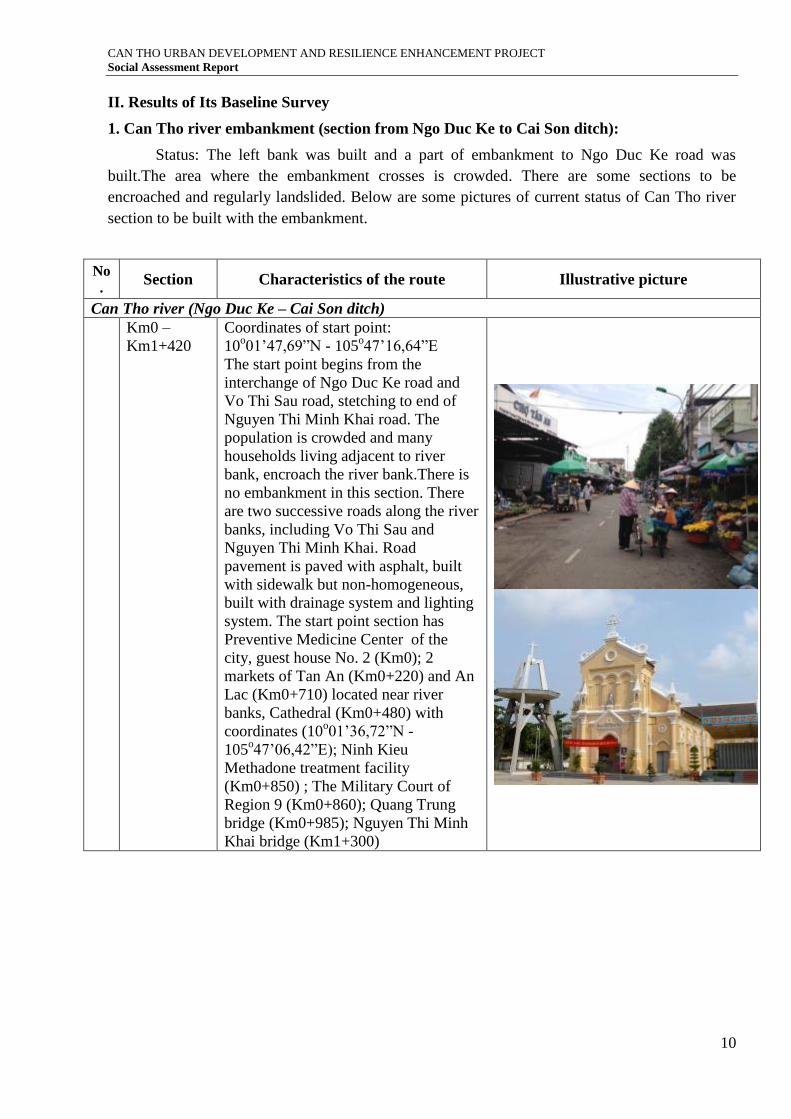
Km1+420 -
Km2+080
The river bank section from the end of
Nguyen Thi Minh Khai road to head of
Tam Vu road. This section has no road
along riverbank, therefore, few
population live near riverbank.
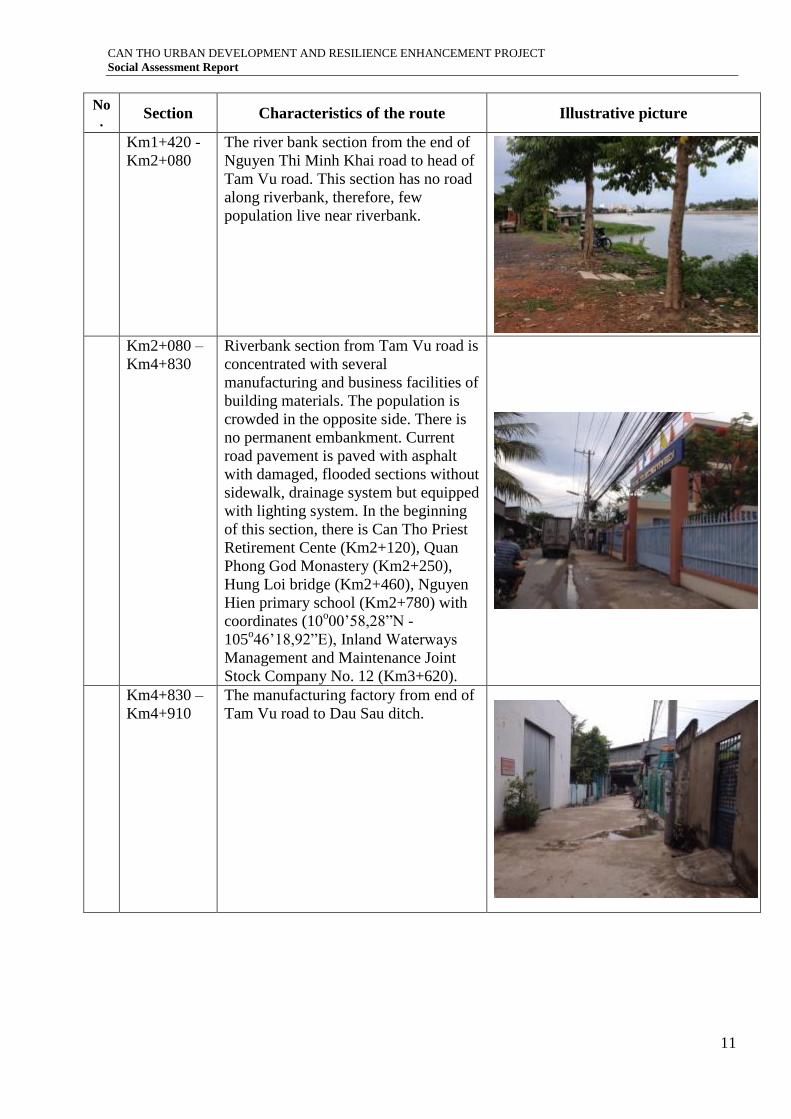
Km2+080 –
Km4+830
Riverbank section from Tam Vu road is
concentrated with several
manufacturing and business facilities of
building materials. The population is
crowded in the opposite side. There is
no permanent embankment. Current
road pavement is paved with asphalt
with damaged, flooded sections without
sidewalk, drainage system but equipped
with lighting system. In the beginning
of this section, there is Can Tho Priest
Retirement Cente (Km2+120), Quan
Phong God Monastery (Km2+250),
Hung Loi bridge (Km2+460), Nguyen
Hien primary school (Km2+780) with
coordinates (10o00’58,28”N -
105o46’18,92”E), Inland Waterways
Management and Maintenance Joint
Stock Company No. 12 (Km3+620).
Km4+830 –
Km4+910
The manufacturing factory from end of
Tam Vu road to Dau Sau ditch.
CAN THO URBAN DEVELOPMENT AND RESILIENCE ENHANCEMENT PROJECT
Social Assessment Report
12
No
. Section Characteristics of the route Illustrative picture
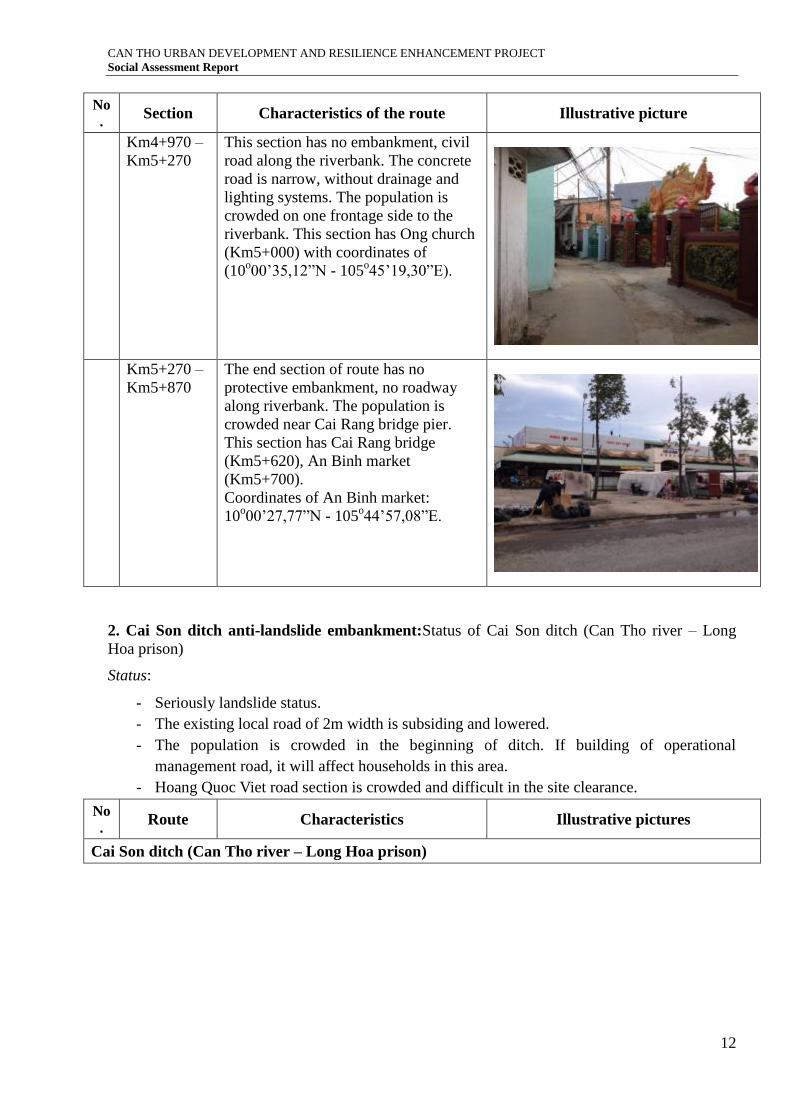
Km4+970 –
Km5+270
This section has no embankment, civil
road along the riverbank. The concrete
road is narrow, without drainage and
lighting systems. The population is
crowded on one frontage side to the
riverbank. This section has Ong church
(Km5+000) with coordinates of
(10o00’35,12”N - 105
o45’19,30”E).
Km5+270 –
Km5+870
The end section of route has no
protective embankment, no roadway
along riverbank. The population is
crowded near Cai Rang bridge pier.
This section has Cai Rang bridge
(Km5+620), An Binh market
(Km5+700).
Coordinates of An Binh market:
10o00’27,77”N - 105
o44’57,08”E.
2. Cai Son ditch anti-landslide embankment:Status of Cai Son ditch (Can Tho river – Long
Hoa prison)
Status:
- Seriously landslide status.
- The existing local road of 2m width is subsiding and lowered.
- The population is crowded in the beginning of ditch. If building of operational
management road, it will affect households in this area.
- Hoang Quoc Viet road section is crowded and difficult in the site clearance.
No
. Route Characteristics Illustrative pictures
Cai Son ditch (Can Tho river – Long Hoa prison)
CAN THO URBAN DEVELOPMENT AND RESILIENCE ENHANCEMENT PROJECT
Social Assessment Report
13
No
. Route Characteristics Illustrative pictures
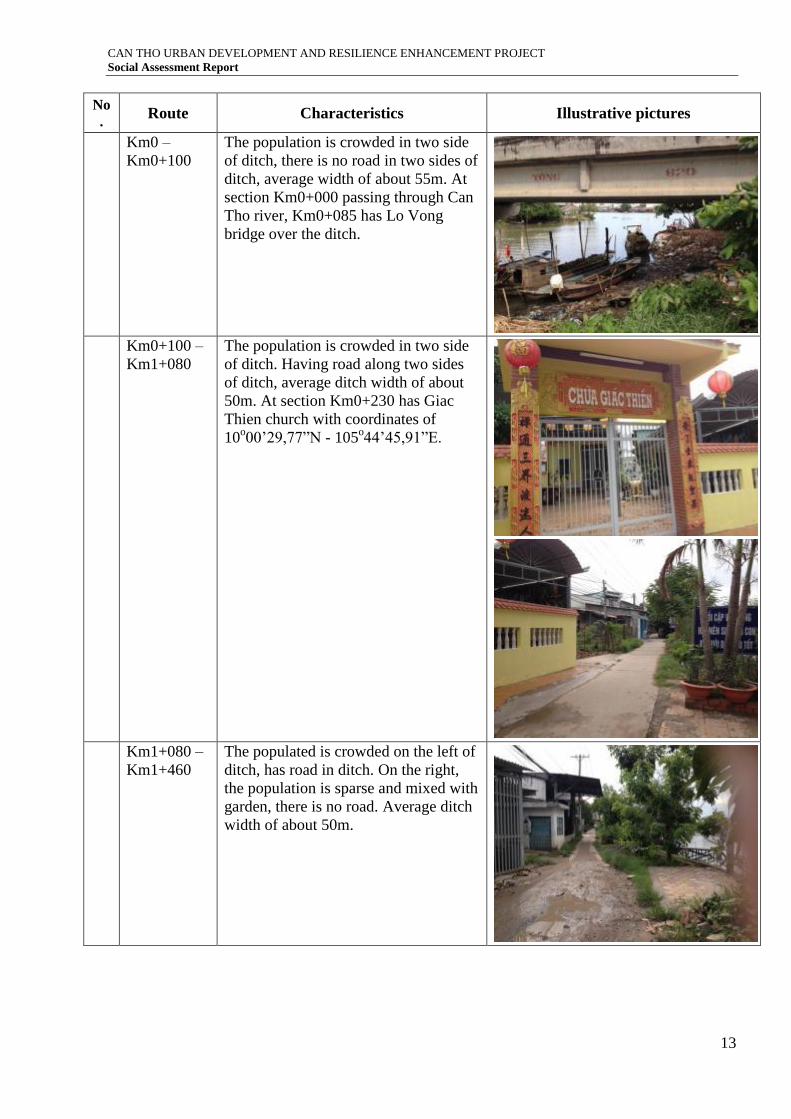
Km0 –
Km0+100
The population is crowded in two side
of ditch, there is no road in two sides of
ditch, average width of about 55m. At
section Km0+000 passing through Can
Tho river, Km0+085 has Lo Vong
bridge over the ditch.
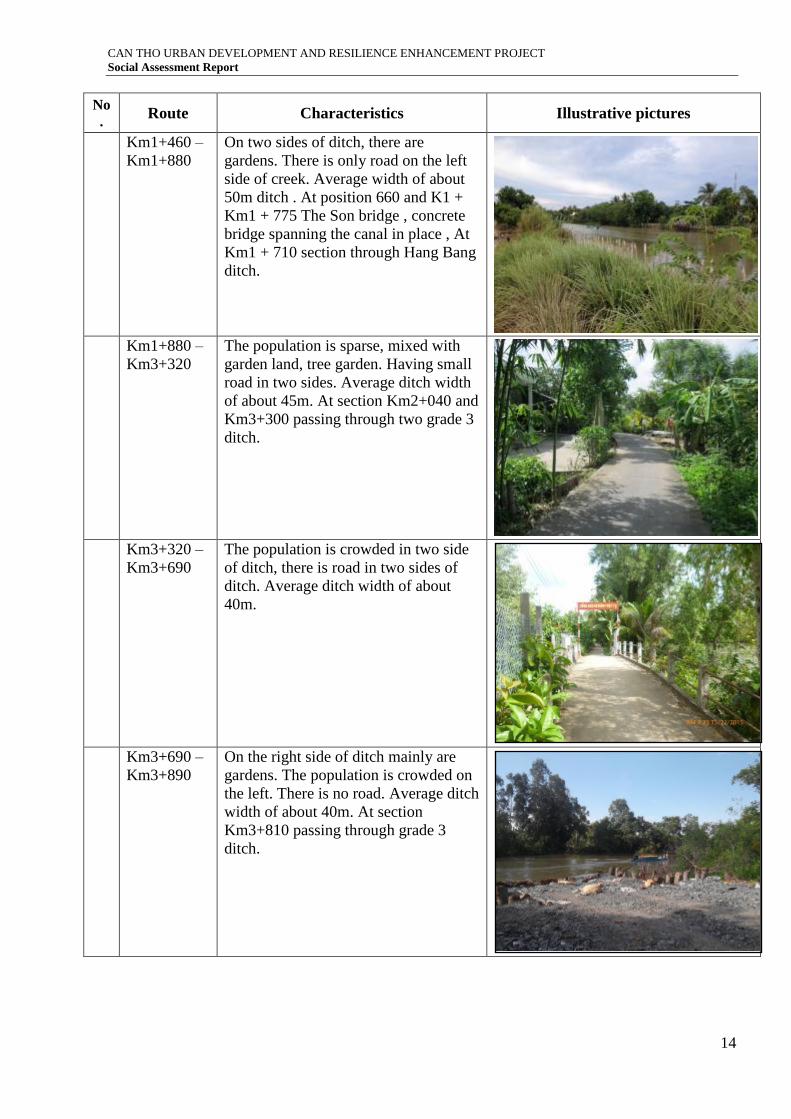
Km0+100 –
Km1+080
The population is crowded in two side
of ditch. Having road along two sides
of ditch, average ditch width of about
50m. At section Km0+230 has Giac
Thien church with coordinates of
10o00’29,77”N - 105
o44’45,91”E.
Km1+080 –
Km1+460
The populated is crowded on the left of
ditch, has road in ditch. On the right,
the population is sparse and mixed with
garden, there is no road. Average ditch
width of about 50m.
CAN THO URBAN DEVELOPMENT AND RESILIENCE ENHANCEMENT PROJECT
Social Assessment Report
14
No
. Route Characteristics Illustrative pictures
Km1+460 –
Km1+880
On two sides of ditch, there are
gardens. There is only road on the left
side of creek. Average width of about
50m ditch . At position 660 and K1 +
Km1 + 775 The Son bridge , concrete
bridge spanning the canal in place , At
Km1 + 710 section through Hang Bang
ditch.
Km1+880 –
Km3+320
The population is sparse, mixed with
garden land, tree garden. Having small
road in two sides. Average ditch width
of about 45m. At section Km2+040 and
Km3+300 passing through two grade 3
ditch.
Km3+320 –
Km3+690
The population is crowded in two side
of ditch, there is road in two sides of
ditch. Average ditch width of about
40m.
Km3+690 –
Km3+890
On the right side of ditch mainly are
gardens. The population is crowded on
the left. There is no road. Average ditch
width of about 40m. At section
Km3+810 passing through grade 3
ditch.
CAN THO URBAN DEVELOPMENT AND RESILIENCE ENHANCEMENT PROJECT
Social Assessment Report
15
3. Status of Dau Sau ditch
No
. Route Characteristics Illustrative picture
Dau Sau ditch (from Can Tho river – Dau Sau ditch bridge – Ba Bo ditch)
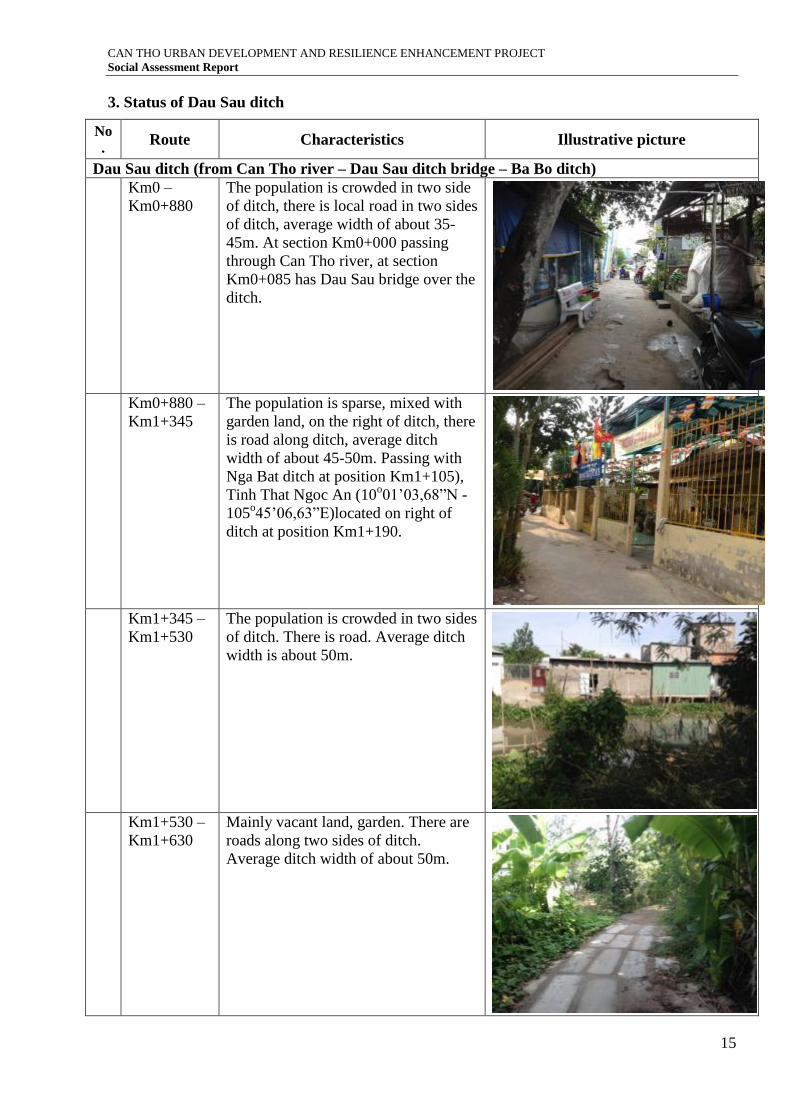
Km0 –
Km0+880
The population is crowded in two side
of ditch, there is local road in two sides
of ditch, average width of about 35-
45m. At section Km0+000 passing
through Can Tho river, at section
Km0+085 has Dau Sau bridge over the
ditch.
Km0+880 –
Km1+345
The population is sparse, mixed with
garden land, on the right of ditch, there
is road along ditch, average ditch
width of about 45-50m. Passing with
Nga Bat ditch at position Km1+105),
Tinh That Ngoc An (10o01’03,68”N -
105o45’06,63”E)located on right of
ditch at position Km1+190.
Km1+345 –
Km1+530
The population is crowded in two sides
of ditch. There is road. Average ditch
width is about 50m.
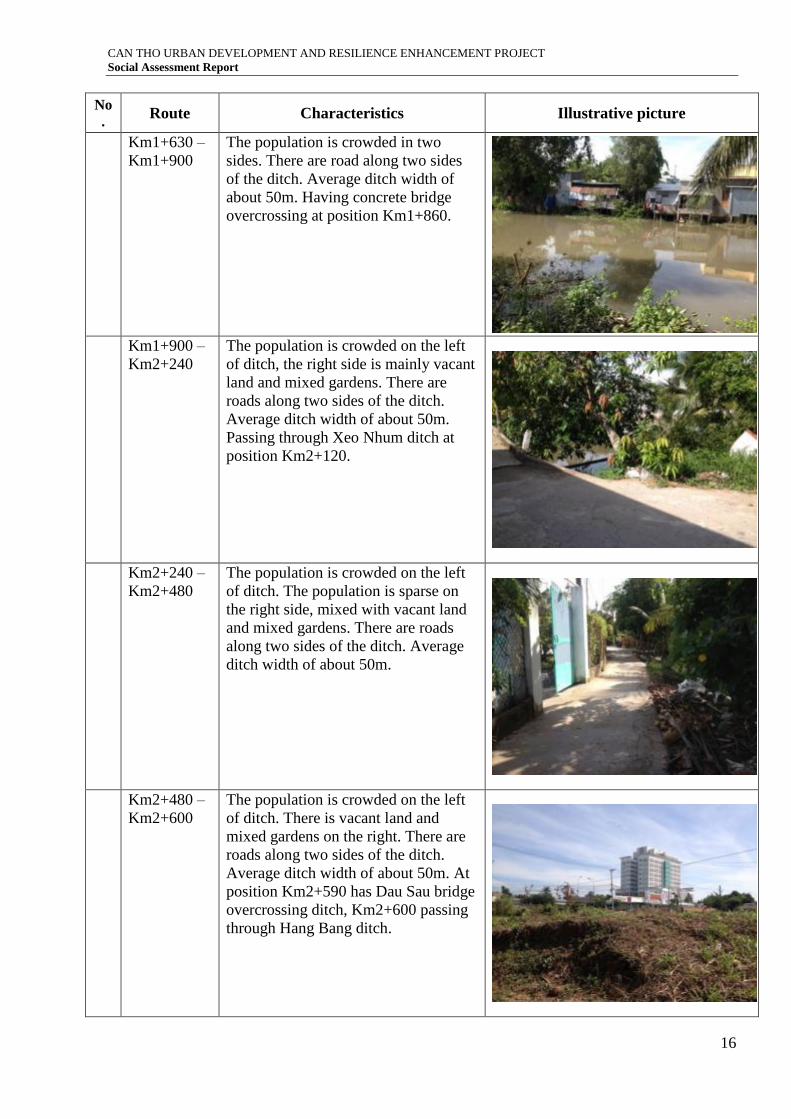
Km1+530 –
Km1+630
Mainly vacant land, garden. There are
roads along two sides of ditch.
Average ditch width of about 50m.
CAN THO URBAN DEVELOPMENT AND RESILIENCE ENHANCEMENT PROJECT
Social Assessment Report
16
No
. Route Characteristics Illustrative picture
Km1+630 –
Km1+900
The population is crowded in two
sides. There are road along two sides
of the ditch. Average ditch width of
about 50m. Having concrete bridge
overcrossing at position Km1+860.
Km1+900 –
Km2+240
The population is crowded on the left
of ditch, the right side is mainly vacant
land and mixed gardens. There are
roads along two sides of the ditch.
Average ditch width of about 50m.
Passing through Xeo Nhum ditch at
position Km2+120.
Km2+240 –
Km2+480
The population is crowded on the left
of ditch. The population is sparse on
the right side, mixed with vacant land
and mixed gardens. There are roads
along two sides of the ditch. Average
ditch width of about 50m.
Km2+480 –
Km2+600
The population is crowded on the left
of ditch. There is vacant land and
mixed gardens on the right. There are
roads along two sides of the ditch.
Average ditch width of about 50m. At
position Km2+590 has Dau Sau bridge
overcrossing ditch, Km2+600 passing
through Hang Bang ditch.
CAN THO URBAN DEVELOPMENT AND RESILIENCE ENHANCEMENT PROJECT
Social Assessment Report
17
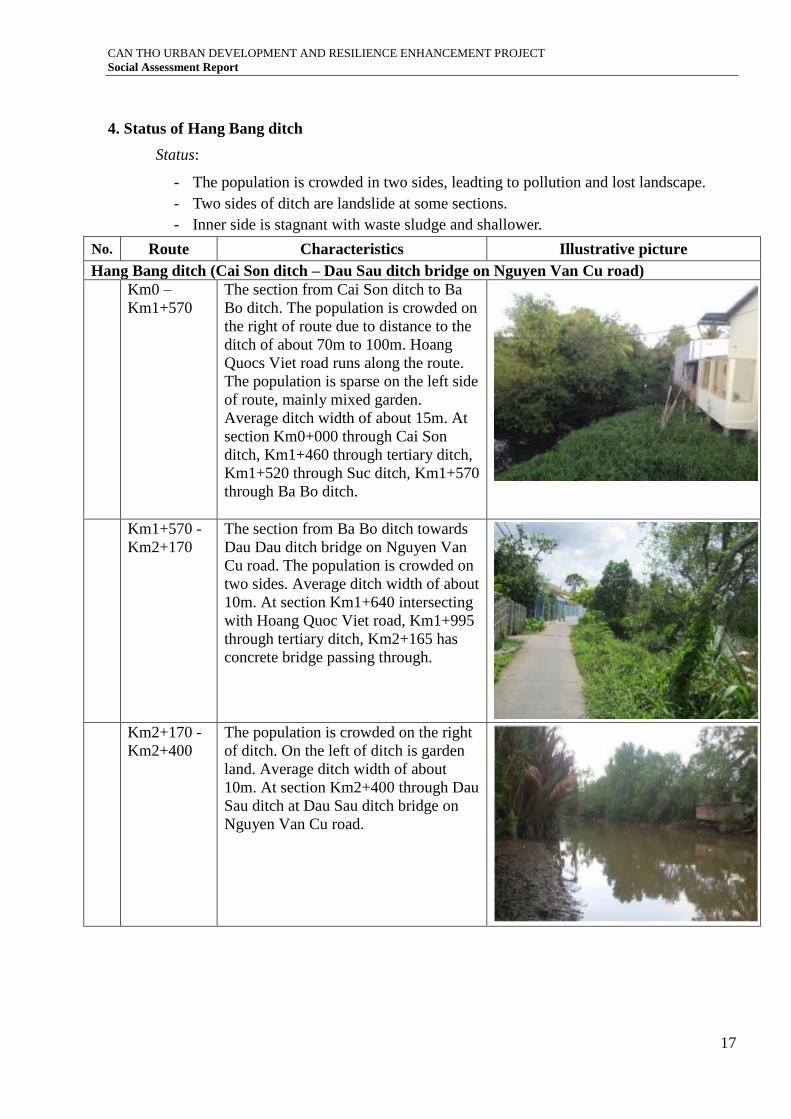
4. Status of Hang Bang ditch
Status:
- The population is crowded in two sides, leadting to pollution and lost landscape.
- Two sides of ditch are landslide at some sections.
- Inner side is stagnant with waste sludge and shallower.
No. Route Characteristics Illustrative picture
Hang Bang ditch (Cai Son ditch – Dau Sau ditch bridge on Nguyen Van Cu road)
Km0 –
Km1+570
The section from Cai Son ditch to Ba
Bo ditch. The population is crowded on
the right of route due to distance to the
ditch of about 70m to 100m. Hoang
Quocs Viet road runs along the route.
The population is sparse on the left side
of route, mainly mixed garden.
Average ditch width of about 15m. At
section Km0+000 through Cai Son
ditch, Km1+460 through tertiary ditch,
Km1+520 through Suc ditch, Km1+570
through Ba Bo ditch.
Km1+570 -
Km2+170
The section from Ba Bo ditch towards
Dau Dau ditch bridge on Nguyen Van
Cu road. The population is crowded on
two sides. Average ditch width of about
10m. At section Km1+640 intersecting
with Hoang Quoc Viet road, Km1+995
through tertiary ditch, Km2+165 has
concrete bridge passing through.
Km2+170 -
Km2+400
The population is crowded on the right
of ditch. On the left of ditch is garden
land. Average ditch width of about
10m. At section Km2+400 through Dau
Sau ditch at Dau Sau ditch bridge on
Nguyen Van Cu road.
CAN THO URBAN DEVELOPMENT AND RESILIENCE ENHANCEMENT PROJECT
Social Assessment Report
18
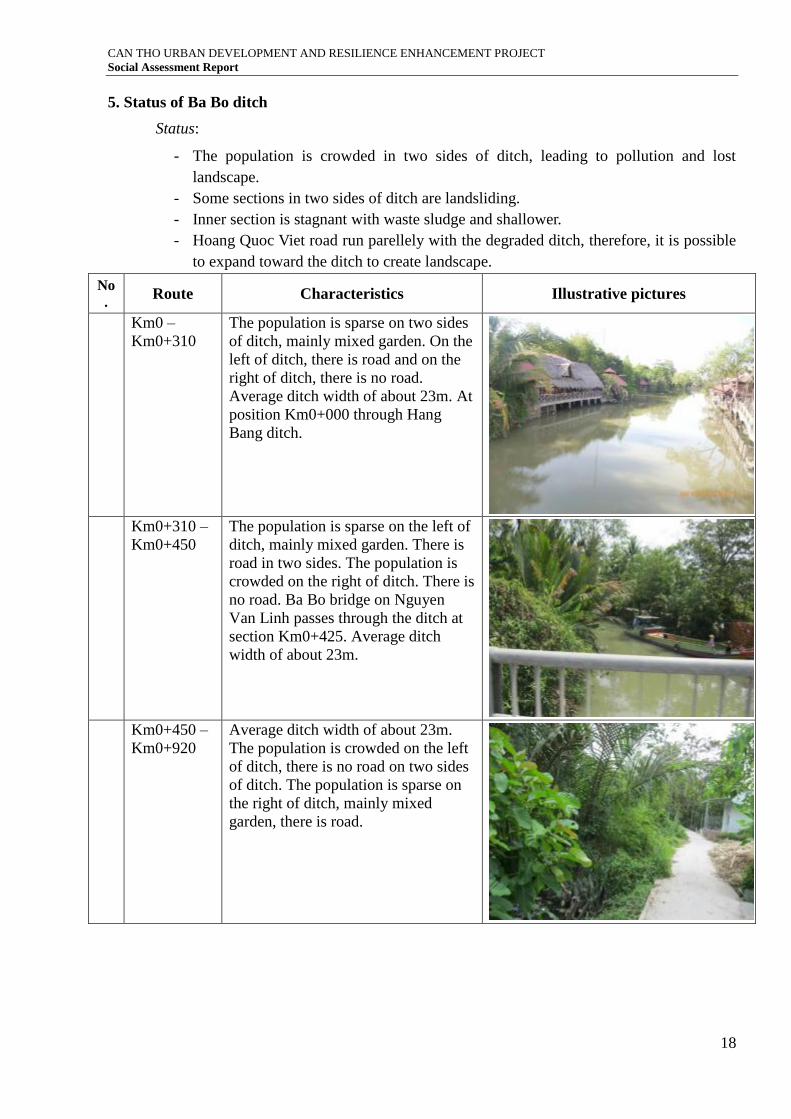
5. Status of Ba Bo ditch
Status:
- The population is crowded in two sides of ditch, leading to pollution and lost
landscape.
- Some sections in two sides of ditch are landsliding.
- Inner section is stagnant with waste sludge and shallower.
- Hoang Quoc Viet road run parellely with the degraded ditch, therefore, it is possible
to expand toward the ditch to create landscape.
No
. Route Characteristics Illustrative pictures
Km0 –
Km0+310
The population is sparse on two sides
of ditch, mainly mixed garden. On the
left of ditch, there is road and on the
right of ditch, there is no road.
Average ditch width of about 23m. At
position Km0+000 through Hang
Bang ditch.
Km0+310 –
Km0+450
The population is sparse on the left of
ditch, mainly mixed garden. There is
road in two sides. The population is
crowded on the right of ditch. There is
no road. Ba Bo bridge on Nguyen
Van Linh passes through the ditch at
section Km0+425. Average ditch
width of about 23m.
Km0+450 –
Km0+920
Average ditch width of about 23m.
The population is crowded on the left
of ditch, there is no road on two sides
of ditch. The population is sparse on
the right of ditch, mainly mixed
garden, there is road.
CAN THO URBAN DEVELOPMENT AND RESILIENCE ENHANCEMENT PROJECT
Social Assessment Report
19
No
. Route Characteristics Illustrative pictures
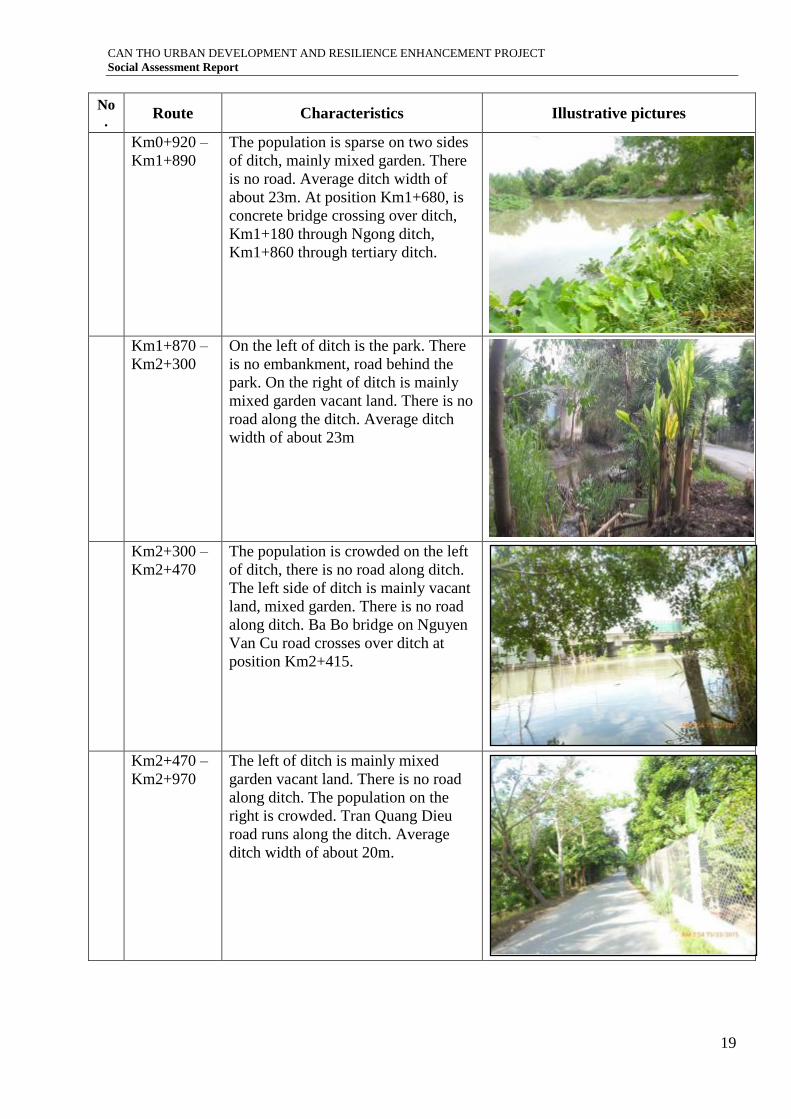
Km0+920 –
Km1+890
The population is sparse on two sides
of ditch, mainly mixed garden. There
is no road. Average ditch width of
about 23m. At position Km1+680, is
concrete bridge crossing over ditch,
Km1+180 through Ngong ditch,
Km1+860 through tertiary ditch.
Km1+870 –
Km2+300
On the left of ditch is the park. There
is no embankment, road behind the
park. On the right of ditch is mainly
mixed garden vacant land. There is no
road along the ditch. Average ditch
width of about 23m
Km2+300 –
Km2+470
The population is crowded on the left
of ditch, there is no road along ditch.
The left side of ditch is mainly vacant
land, mixed garden. There is no road
along ditch. Ba Bo bridge on Nguyen
Van Cu road crosses over ditch at
position Km2+415.
Km2+470 –
Km2+970
The left of ditch is mainly mixed
garden vacant land. There is no road
along ditch. The population on the
right is crowded. Tran Quang Dieu
road runs along the ditch. Average
ditch width of about 20m.
CAN THO URBAN DEVELOPMENT AND RESILIENCE ENHANCEMENT PROJECT
Social Assessment Report
20
No
. Route Characteristics Illustrative pictures
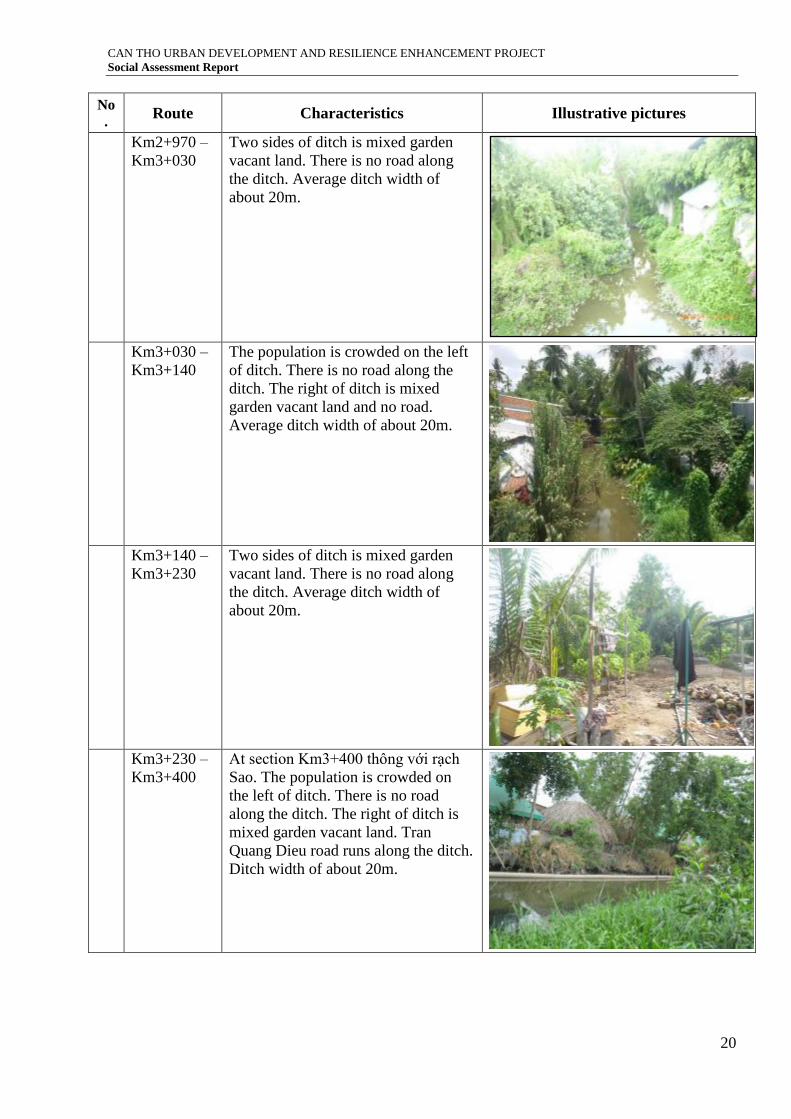
Km2+970 –
Km3+030
Two sides of ditch is mixed garden
vacant land. There is no road along
the ditch. Average ditch width of
about 20m.
Km3+030 –
Km3+140
The population is crowded on the left
of ditch. There is no road along the
ditch. The right of ditch is mixed
garden vacant land and no road.
Average ditch width of about 20m.
Km3+140 –
Km3+230
Two sides of ditch is mixed garden
vacant land. There is no road along
the ditch. Average ditch width of
about 20m.
Km3+230 –
Km3+400
At section Km3+400 thông với rạch
Sao. The population is crowded on
the left of ditch. There is no road
along the ditch. The right of ditch is
mixed garden vacant land. Tran
Quang Dieu road runs along the ditch.
Ditch width of about 20m.
CAN THO URBAN DEVELOPMENT AND RESILIENCE ENHANCEMENT PROJECT
Social Assessment Report
21
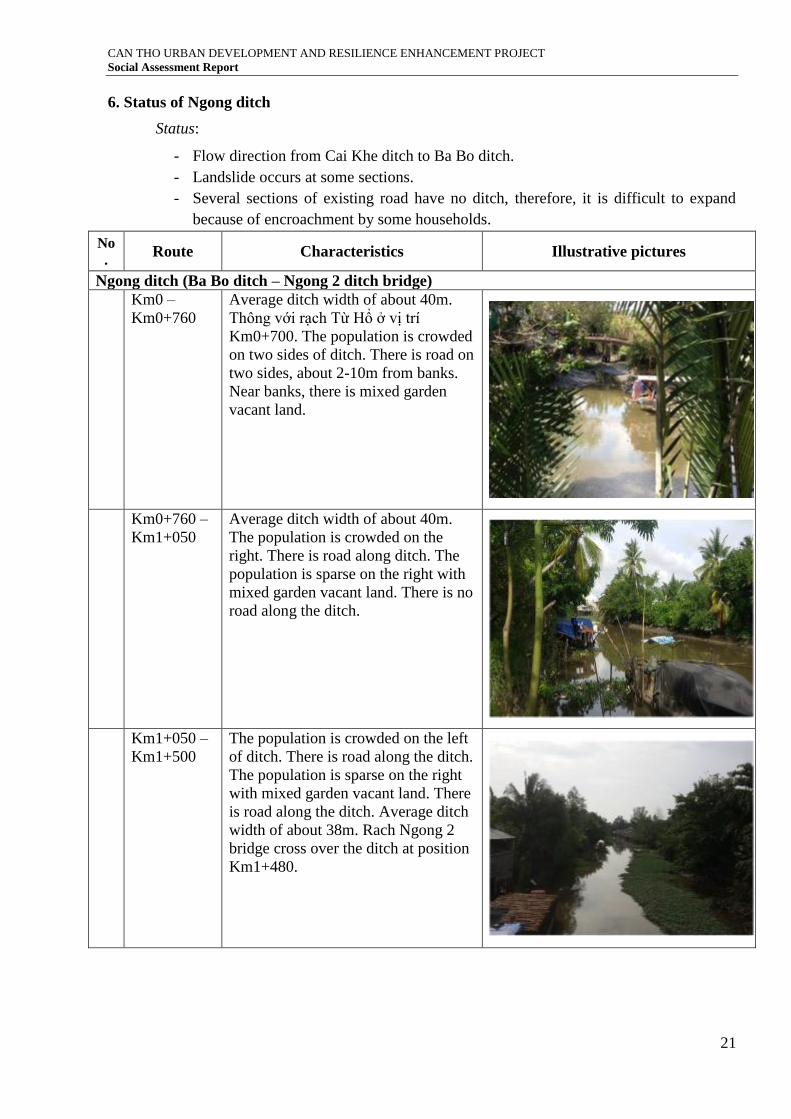
6. Status of Ngong ditch
Status:
- Flow direction from Cai Khe ditch to Ba Bo ditch.
- Landslide occurs at some sections.
- Several sections of existing road have no ditch, therefore, it is difficult to expand
because of encroachment by some households.
No
. Route Characteristics Illustrative pictures
Ngong ditch (Ba Bo ditch – Ngong 2 ditch bridge)
Km0 –
Km0+760
Average ditch width of about 40m.
Thông với rạch Từ Hổ ở vị trí
Km0+700. The population is crowded
on two sides of ditch. There is road on
two sides, about 2-10m from banks.
Near banks, there is mixed garden
vacant land.
Km0+760 –
Km1+050
Average ditch width of about 40m.
The population is crowded on the
right. There is road along ditch. The
population is sparse on the right with
mixed garden vacant land. There is no
road along the ditch.
Km1+050 –
Km1+500
The population is crowded on the left
of ditch. There is road along the ditch.
The population is sparse on the right
with mixed garden vacant land. There
is road along the ditch. Average ditch
width of about 38m. Rach Ngong 2
bridge cross over the ditch at position
Km1+480.
CAN THO URBAN DEVELOPMENT AND RESILIENCE ENHANCEMENT PROJECT
Social Assessment Report
22
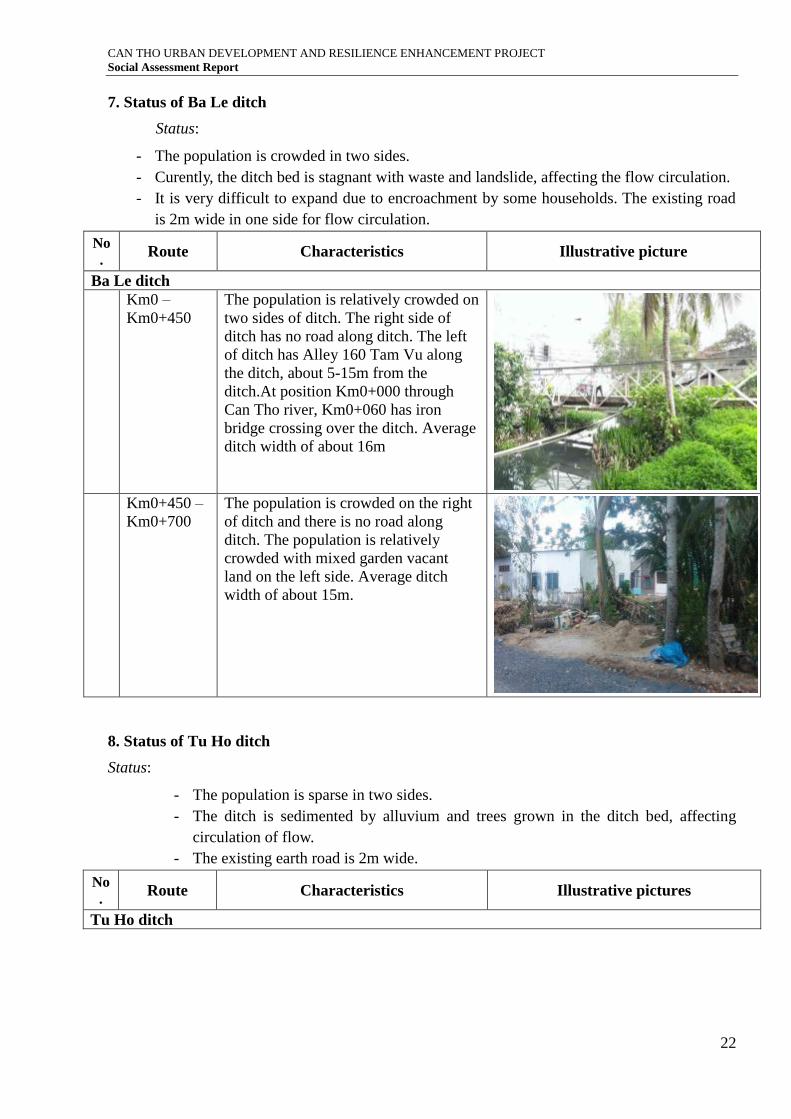
7. Status of Ba Le ditch
Status:
- The population is crowded in two sides.
- Curently, the ditch bed is stagnant with waste and landslide, affecting the flow circulation.
- It is very difficult to expand due to encroachment by some households. The existing road
is 2m wide in one side for flow circulation.
No
. Route Characteristics Illustrative picture
Ba Le ditch
Km0 –
Km0+450
The population is relatively crowded on
two sides of ditch. The right side of
ditch has no road along ditch. The left
of ditch has Alley 160 Tam Vu along
the ditch, about 5-15m from the
ditch.At position Km0+000 through
Can Tho river, Km0+060 has iron
bridge crossing over the ditch. Average
ditch width of about 16m
Km0+450 –
Km0+700
The population is crowded on the right
of ditch and there is no road along
ditch. The population is relatively
crowded with mixed garden vacant
land on the left side. Average ditch
width of about 15m.
8. Status of Tu Ho ditch
Status:
- The population is sparse in two sides.
- The ditch is sedimented by alluvium and trees grown in the ditch bed, affecting
circulation of flow.
- The existing earth road is 2m wide.
No
. Route Characteristics Illustrative pictures
Tu Ho ditch
CAN THO URBAN DEVELOPMENT AND RESILIENCE ENHANCEMENT PROJECT
Social Assessment Report
23
No
. Route Characteristics Illustrative pictures
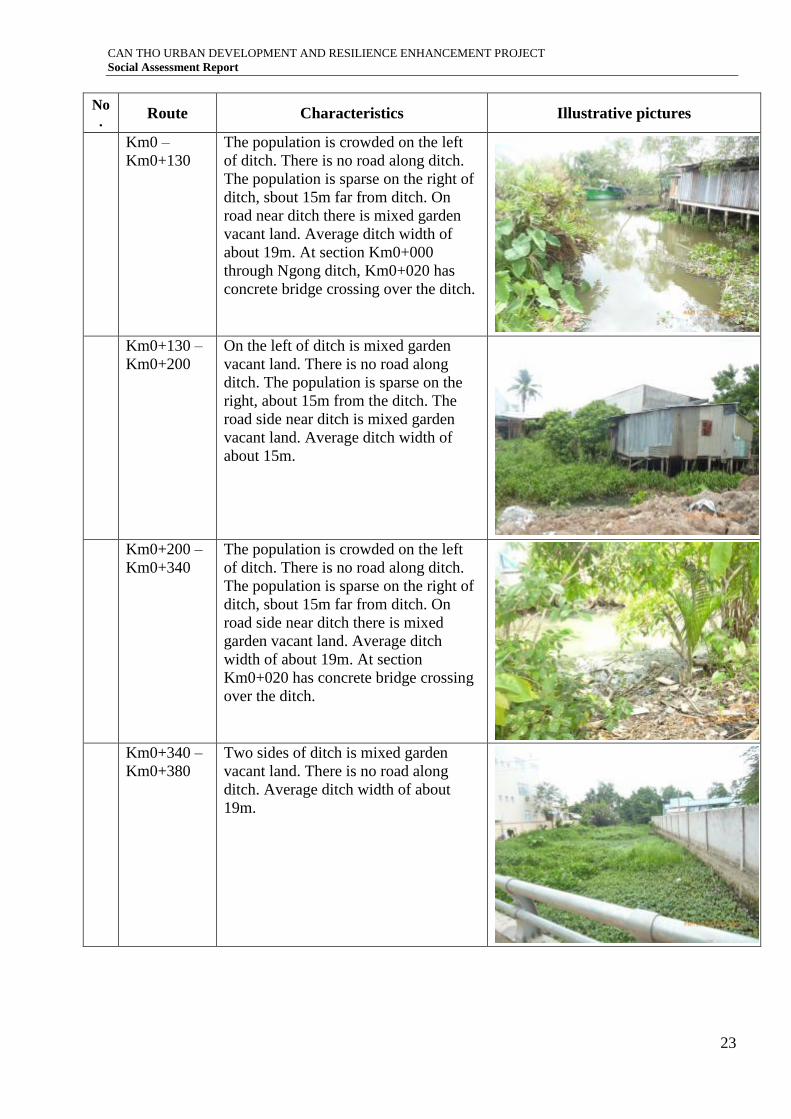
Km0 –
Km0+130
The population is crowded on the left
of ditch. There is no road along ditch.
The population is sparse on the right of
ditch, sbout 15m far from ditch. On
road near ditch there is mixed garden
vacant land. Average ditch width of
about 19m. At section Km0+000
through Ngong ditch, Km0+020 has
concrete bridge crossing over the ditch.
Km0+130 –
Km0+200
On the left of ditch is mixed garden
vacant land. There is no road along
ditch. The population is sparse on the
right, about 15m from the ditch. The
road side near ditch is mixed garden
vacant land. Average ditch width of
about 15m.
Km0+200 –
Km0+340
The population is crowded on the left
of ditch. There is no road along ditch.
The population is sparse on the right of
ditch, sbout 15m far from ditch. On
road side near ditch there is mixed
garden vacant land. Average ditch
width of about 19m. At section
Km0+020 has concrete bridge crossing
over the ditch.
Km0+340 –
Km0+380
Two sides of ditch is mixed garden
vacant land. There is no road along
ditch. Average ditch width of about
19m.
CAN THO URBAN DEVELOPMENT AND RESILIENCE ENHANCEMENT PROJECT
Social Assessment Report
24
No
. Route Characteristics Illustrative pictures
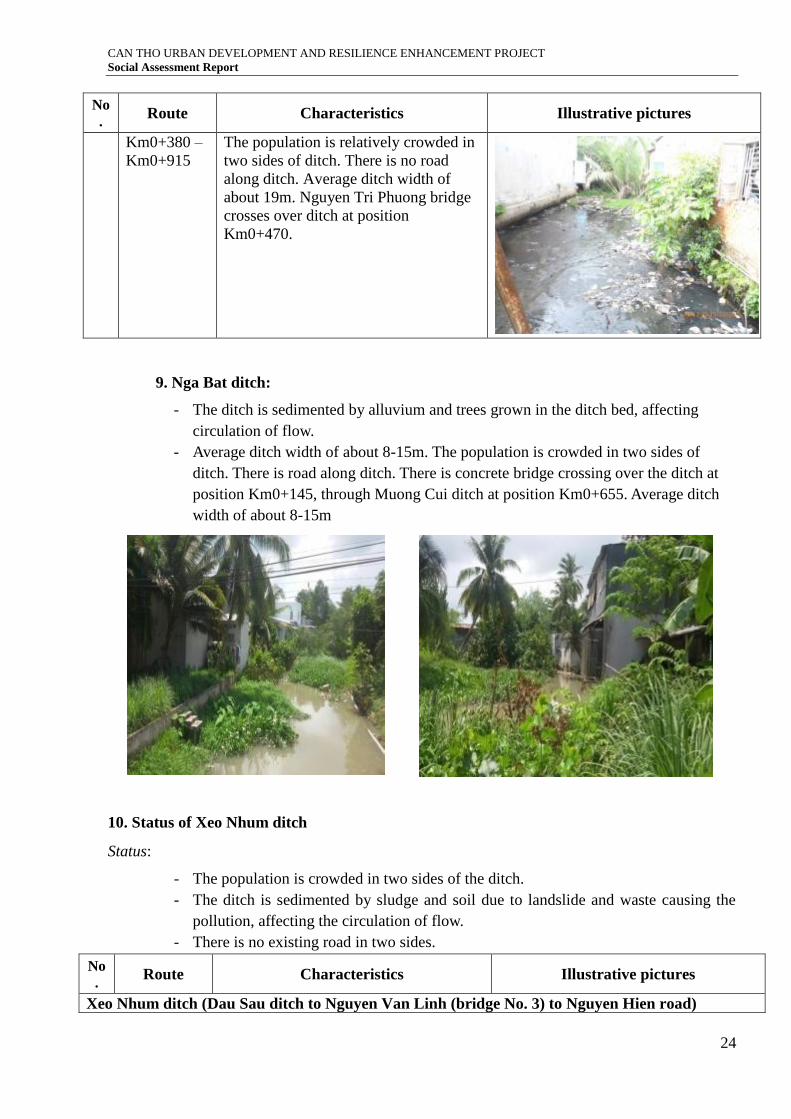
Km0+380 –
Km0+915
The population is relatively crowded in
two sides of ditch. There is no road
along ditch. Average ditch width of
about 19m. Nguyen Tri Phuong bridge
crosses over ditch at position
Km0+470.
9. Nga Bat ditch:
- The ditch is sedimented by alluvium and trees grown in the ditch bed, affecting
circulation of flow.
- Average ditch width of about 8-15m. The population is crowded in two sides of
ditch. There is road along ditch. There is concrete bridge crossing over the ditch at
position Km0+145, through Muong Cui ditch at position Km0+655. Average ditch
width of about 8-15m
10. Status of Xeo Nhum ditch
Status:
- The population is crowded in two sides of the ditch.
- The ditch is sedimented by sludge and soil due to landslide and waste causing the
pollution, affecting the circulation of flow.
- There is no existing road in two sides.
No
. Route Characteristics Illustrative pictures
Xeo Nhum ditch (Dau Sau ditch to Nguyen Van Linh (bridge No. 3) to Nguyen Hien road)
CAN THO URBAN DEVELOPMENT AND RESILIENCE ENHANCEMENT PROJECT
Social Assessment Report
25
No
. Route Characteristics Illustrative pictures
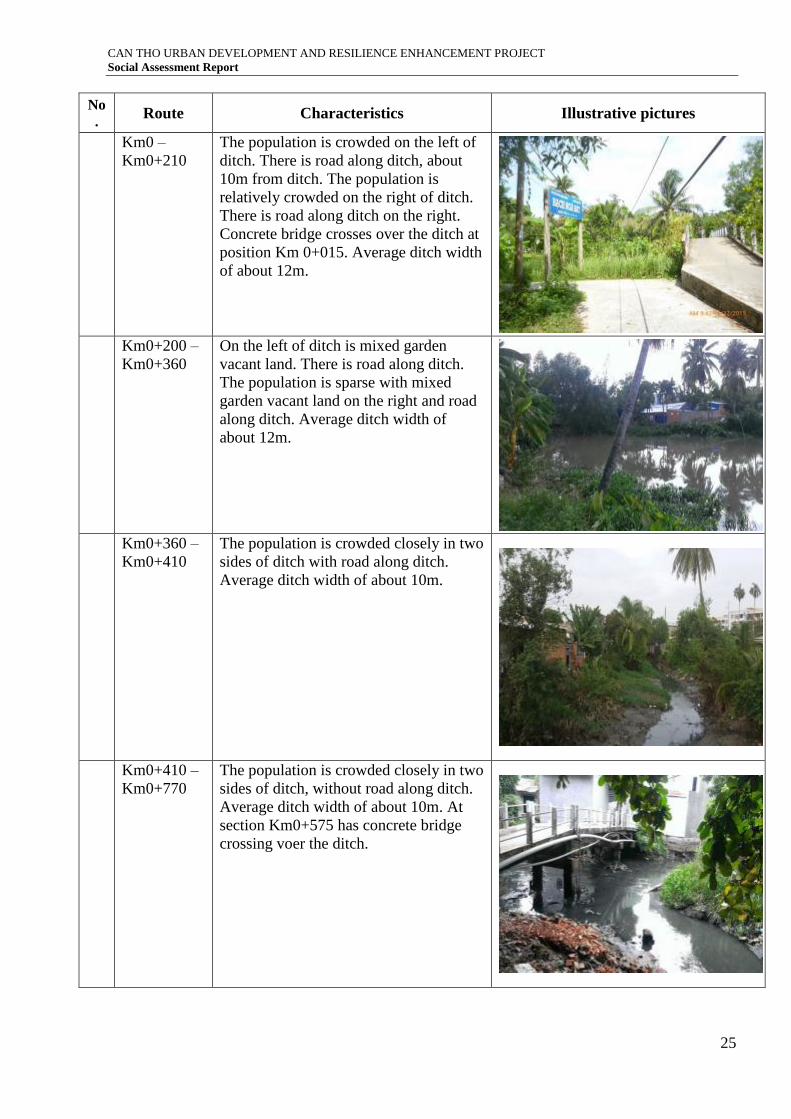
Km0 –
Km0+210
The population is crowded on the left of
ditch. There is road along ditch, about
10m from ditch. The population is
relatively crowded on the right of ditch.
There is road along ditch on the right.
Concrete bridge crosses over the ditch at
position Km 0+015. Average ditch width
of about 12m.
Km0+200 –
Km0+360
On the left of ditch is mixed garden
vacant land. There is road along ditch.
The population is sparse with mixed
garden vacant land on the right and road
along ditch. Average ditch width of
about 12m.
Km0+360 –
Km0+410
The population is crowded closely in two
sides of ditch with road along ditch.
Average ditch width of about 10m.
Km0+410 –
Km0+770
The population is crowded closely in two
sides of ditch, without road along ditch.
Average ditch width of about 10m. At
section Km0+575 has concrete bridge
crossing voer the ditch.
CAN THO URBAN DEVELOPMENT AND RESILIENCE ENHANCEMENT PROJECT
Social Assessment Report
26
No
. Route Characteristics Illustrative pictures
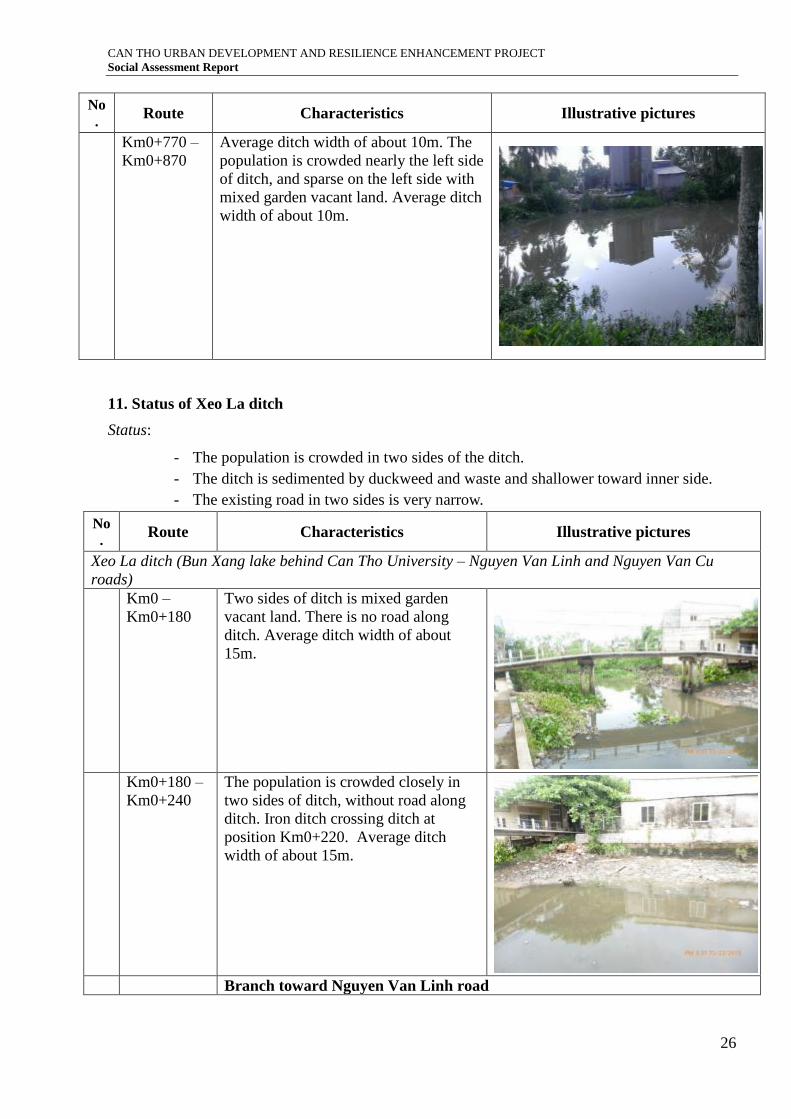
Km0+770 –
Km0+870
Average ditch width of about 10m. The
population is crowded nearly the left side
of ditch, and sparse on the left side with
mixed garden vacant land. Average ditch
width of about 10m.
11. Status of Xeo La ditch
Status:
- The population is crowded in two sides of the ditch.
- The ditch is sedimented by duckweed and waste and shallower toward inner side.
- The existing road in two sides is very narrow.
No
. Route Characteristics Illustrative pictures
Xeo La ditch (Bun Xang lake behind Can Tho University – Nguyen Van Linh and Nguyen Van Cu
roads)
Km0 –
Km0+180
Two sides of ditch is mixed garden
vacant land. There is no road along
ditch. Average ditch width of about
15m.
Km0+180 –
Km0+240
The population is crowded closely in
two sides of ditch, without road along
ditch. Iron ditch crossing ditch at
position Km0+220. Average ditch
width of about 15m.
Branch toward Nguyen Van Linh road
CAN THO URBAN DEVELOPMENT AND RESILIENCE ENHANCEMENT PROJECT
Social Assessment Report
27
No
. Route Characteristics Illustrative pictures
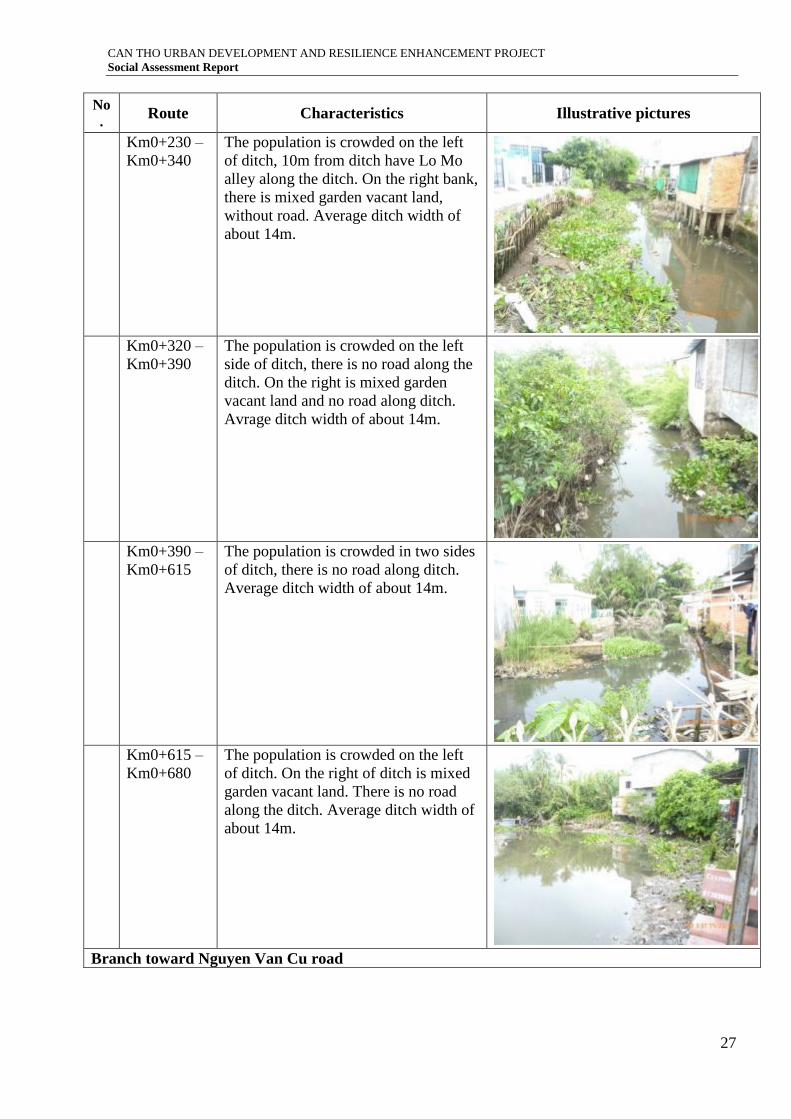
Km0+230 –
Km0+340
The population is crowded on the left
of ditch, 10m from ditch have Lo Mo
alley along the ditch. On the right bank,
there is mixed garden vacant land,
without road. Average ditch width of
about 14m.
Km0+320 –
Km0+390
The population is crowded on the left
side of ditch, there is no road along the
ditch. On the right is mixed garden
vacant land and no road along ditch.
Avrage ditch width of about 14m.
Km0+390 –
Km0+615
The population is crowded in two sides
of ditch, there is no road along ditch.
Average ditch width of about 14m.
Km0+615 –
Km0+680
The population is crowded on the left
of ditch. On the right of ditch is mixed
garden vacant land. There is no road
along the ditch. Average ditch width of
about 14m.
Branch toward Nguyen Van Cu road
CAN THO URBAN DEVELOPMENT AND RESILIENCE ENHANCEMENT PROJECT
Social Assessment Report
28
No
. Route Characteristics Illustrative pictures
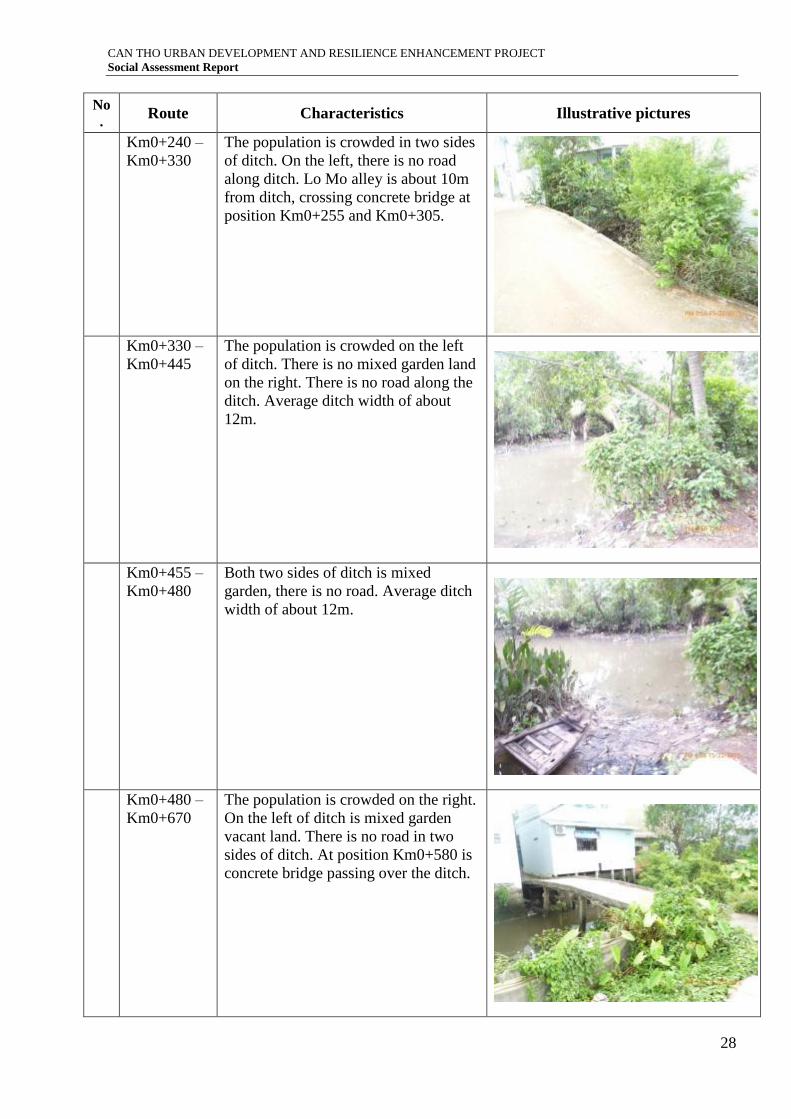
Km0+240 –
Km0+330
The population is crowded in two sides
of ditch. On the left, there is no road
along ditch. Lo Mo alley is about 10m
from ditch, crossing concrete bridge at
position Km0+255 and Km0+305.
Km0+330 –
Km0+445
The population is crowded on the left
of ditch. There is no mixed garden land
on the right. There is no road along the
ditch. Average ditch width of about
12m.
Km0+455 –
Km0+480
Both two sides of ditch is mixed
garden, there is no road. Average ditch
width of about 12m.
Km0+480 –
Km0+670
The population is crowded on the right.
On the left of ditch is mixed garden
vacant land. There is no road in two
sides of ditch. At position Km0+580 is
concrete bridge passing over the ditch.
CAN THO URBAN DEVELOPMENT AND RESILIENCE ENHANCEMENT PROJECT
Social Assessment Report
29
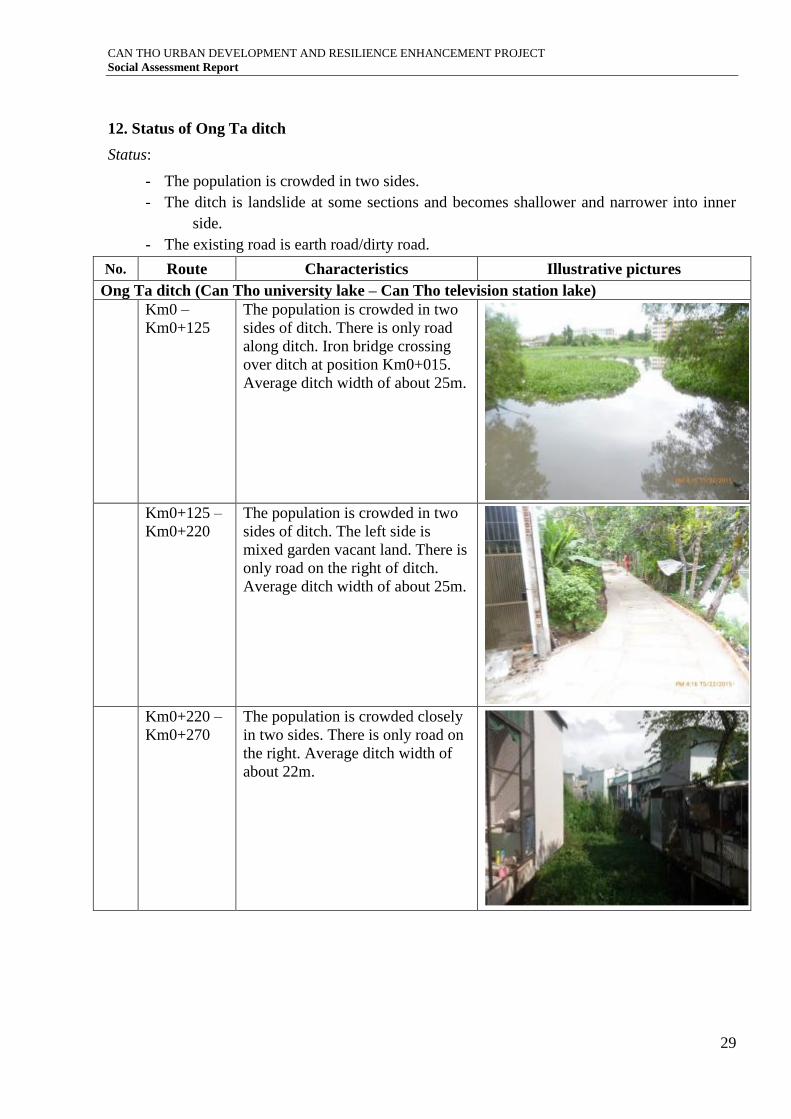
12. Status of Ong Ta ditch
Status:
- The population is crowded in two sides.
- The ditch is landslide at some sections and becomes shallower and narrower into inner
side.
- The existing road is earth road/dirty road.
No. Route Characteristics Illustrative pictures
Ong Ta ditch (Can Tho university lake – Can Tho television station lake)
Km0 –
Km0+125
The population is crowded in two
sides of ditch. There is only road
along ditch. Iron bridge crossing
over ditch at position Km0+015.
Average ditch width of about 25m.
Km0+125 –
Km0+220
The population is crowded in two
sides of ditch. The left side is
mixed garden vacant land. There is
only road on the right of ditch.
Average ditch width of about 25m.
Km0+220 –
Km0+270
The population is crowded closely
in two sides. There is only road on
the right. Average ditch width of
about 22m.
CAN THO URBAN DEVELOPMENT AND RESILIENCE ENHANCEMENT PROJECT
Social Assessment Report
30
No. Route Characteristics Illustrative pictures
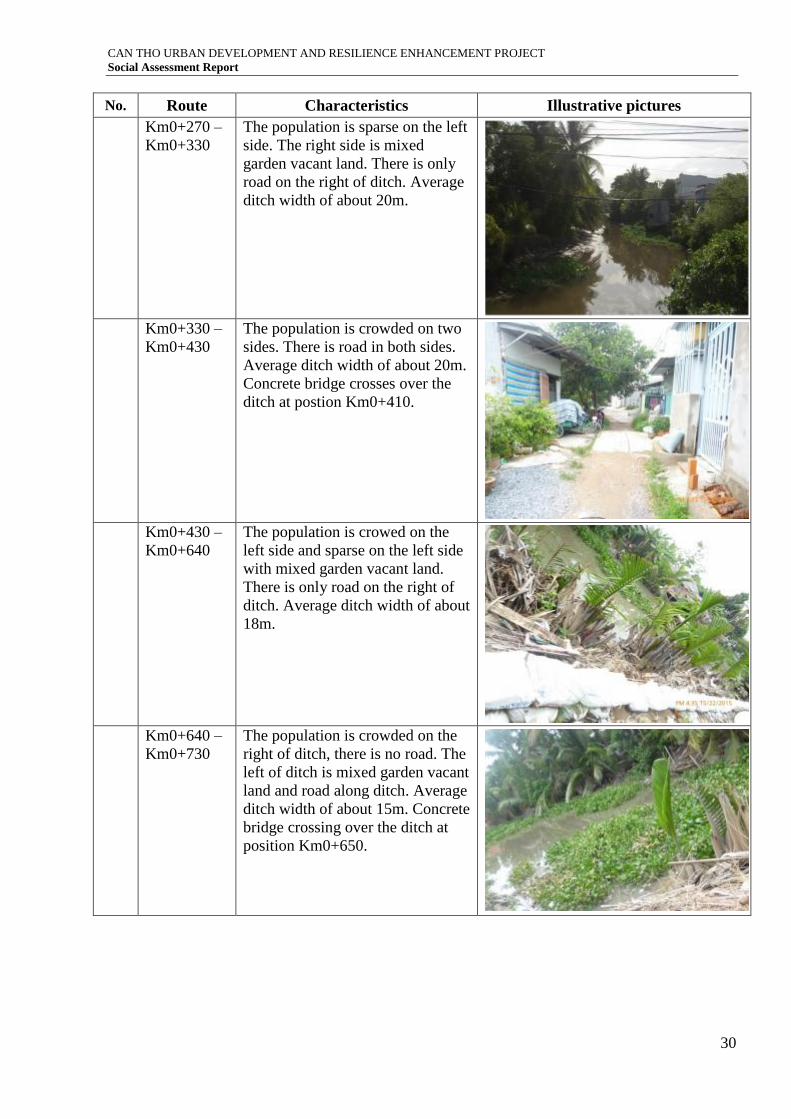
Km0+270 –
Km0+330
The population is sparse on the left
side. The right side is mixed
garden vacant land. There is only
road on the right of ditch. Average
ditch width of about 20m.
Km0+330 –
Km0+430
The population is crowded on two
sides. There is road in both sides.
Average ditch width of about 20m.
Concrete bridge crosses over the
ditch at postion Km0+410.
Km0+430 –
Km0+640
The population is crowed on the
left side and sparse on the left side
with mixed garden vacant land.
There is only road on the right of
ditch. Average ditch width of about
18m.
Km0+640 –
Km0+730
The population is crowded on the
right of ditch, there is no road. The
left of ditch is mixed garden vacant
land and road along ditch. Average
ditch width of about 15m. Concrete
bridge crossing over the ditch at
position Km0+650.
CAN THO URBAN DEVELOPMENT AND RESILIENCE ENHANCEMENT PROJECT
Social Assessment Report
31
No. Route Characteristics Illustrative pictures
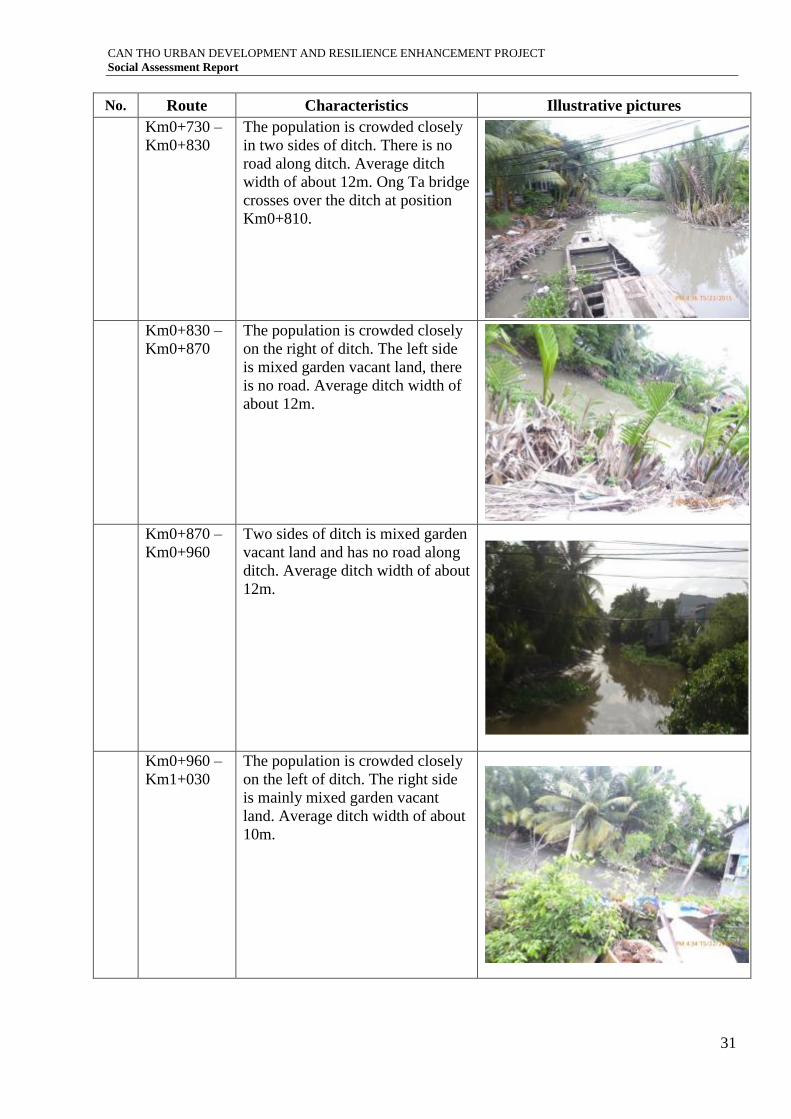
Km0+730 –
Km0+830
The population is crowded closely
in two sides of ditch. There is no
road along ditch. Average ditch
width of about 12m. Ong Ta bridge
crosses over the ditch at position
Km0+810.
Km0+830 –
Km0+870
The population is crowded closely
on the right of ditch. The left side
is mixed garden vacant land, there
is no road. Average ditch width of
about 12m.
Km0+870 –
Km0+960
Two sides of ditch is mixed garden
vacant land and has no road along
ditch. Average ditch width of about
12m.
Km0+960 –
Km1+030
The population is crowded closely
on the left of ditch. The right side
is mainly mixed garden vacant
land. Average ditch width of about
10m.
CAN THO URBAN DEVELOPMENT AND RESILIENCE ENHANCEMENT PROJECT
Social Assessment Report
32
No. Route Characteristics Illustrative pictures
Km1+030 –
Km1+210
The population is crowded in two
sides of ditch, there is no road in
two side. Average ditch width of
about 8m.
13. Status of Sao ditch
Status:
- The population is crowded in two sides.
- The local road is 2m wide and landslide at some sections.
- Some households encroaches into the ditch.
No
. Route Characteristics Illustrative pictures
Sao ditch (from Binh Thuy river – Tran Quang Dieu intersection)
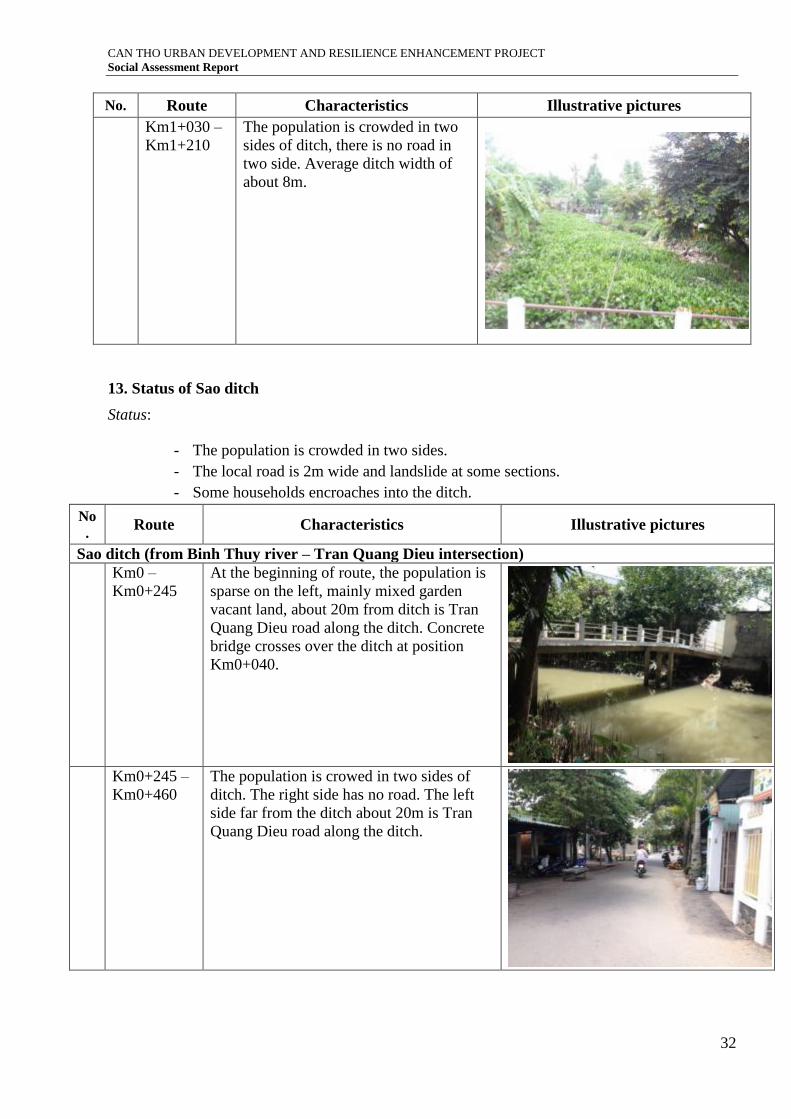
Km0 –
Km0+245
At the beginning of route, the population is
sparse on the left, mainly mixed garden
vacant land, about 20m from ditch is Tran
Quang Dieu road along the ditch. Concrete
bridge crosses over the ditch at position
Km0+040.
Km0+245 –
Km0+460
The population is crowed in two sides of
ditch. The right side has no road. The left
side far from the ditch about 20m is Tran
Quang Dieu road along the ditch.
CAN THO URBAN DEVELOPMENT AND RESILIENCE ENHANCEMENT PROJECT
Social Assessment Report
33
No
. Route Characteristics Illustrative pictures
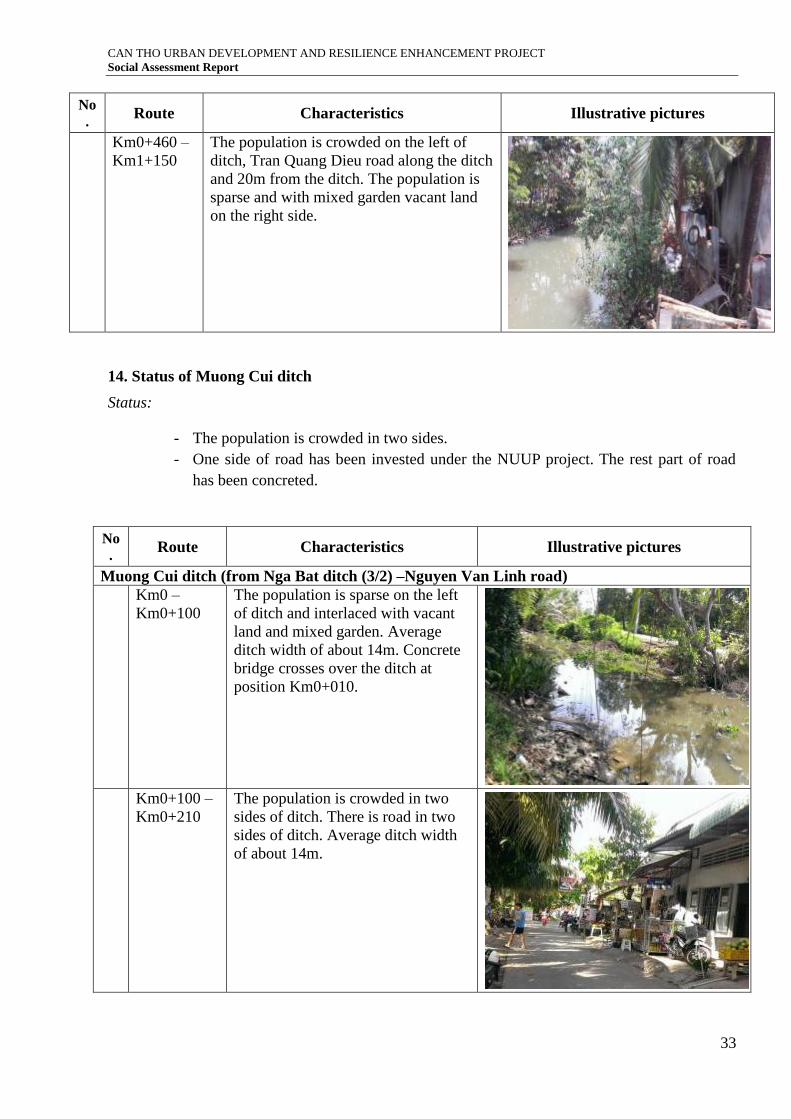
Km0+460 –
Km1+150
The population is crowded on the left of
ditch, Tran Quang Dieu road along the ditch
and 20m from the ditch. The population is
sparse and with mixed garden vacant land
on the right side.
14. Status of Muong Cui ditch
Status:
- The population is crowded in two sides.
- One side of road has been invested under the NUUP project. The rest part of road
has been concreted.
No
. Route Characteristics Illustrative pictures
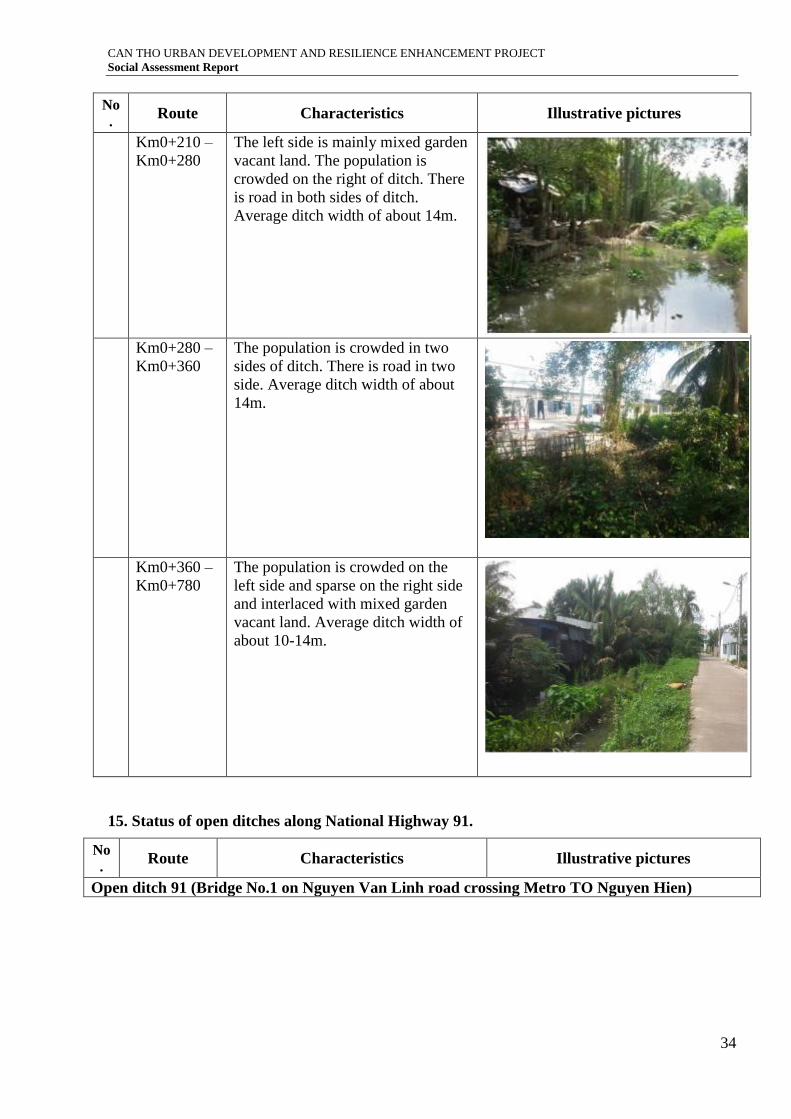
Muong Cui ditch (from Nga Bat ditch (3/2) –Nguyen Van Linh road)
Km0 –
Km0+100
The population is sparse on the left
of ditch and interlaced with vacant
land and mixed garden. Average
ditch width of about 14m. Concrete
bridge crosses over the ditch at
position Km0+010.
Km0+100 –
Km0+210
The population is crowded in two
sides of ditch. There is road in two
sides of ditch. Average ditch width
of about 14m.
CAN THO URBAN DEVELOPMENT AND RESILIENCE ENHANCEMENT PROJECT
Social Assessment Report
34
No
. Route Characteristics Illustrative pictures
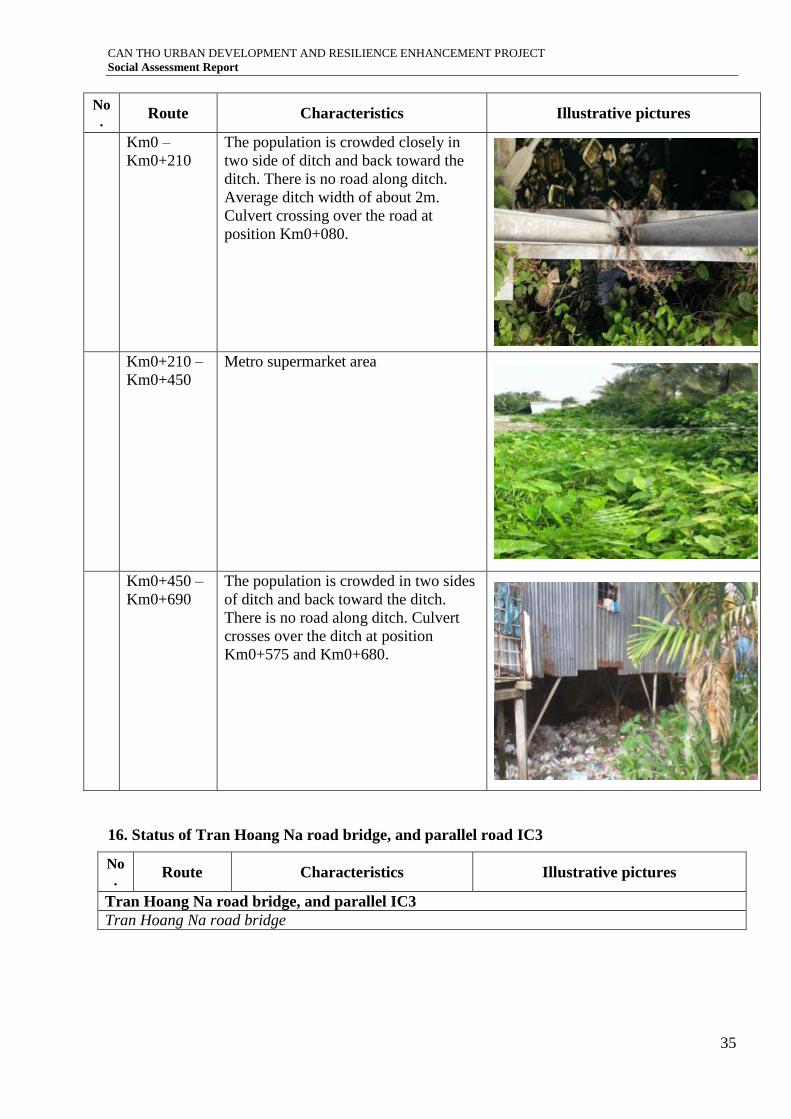
Km0+210 –
Km0+280
The left side is mainly mixed garden
vacant land. The population is
crowded on the right of ditch. There
is road in both sides of ditch.
Average ditch width of about 14m.
Km0+280 –
Km0+360
The population is crowded in two
sides of ditch. There is road in two
side. Average ditch width of about
14m.
Km0+360 –
Km0+780
The population is crowded on the
left side and sparse on the right side
and interlaced with mixed garden
vacant land. Average ditch width of
about 10-14m.
15. Status of open ditches along National Highway 91.
No
. Route Characteristics Illustrative pictures
Open ditch 91 (Bridge No.1 on Nguyen Van Linh road crossing Metro TO Nguyen Hien)
CAN THO URBAN DEVELOPMENT AND RESILIENCE ENHANCEMENT PROJECT
Social Assessment Report
35
No
. Route Characteristics Illustrative pictures
Km0 –
Km0+210
The population is crowded closely in
two side of ditch and back toward the
ditch. There is no road along ditch.
Average ditch width of about 2m.
Culvert crossing over the road at
position Km0+080.
Km0+210 –
Km0+450
Metro supermarket area
Km0+450 –
Km0+690
The population is crowded in two sides
of ditch and back toward the ditch.
There is no road along ditch. Culvert
crosses over the ditch at position
Km0+575 and Km0+680.
16. Status of Tran Hoang Na road bridge, and parallel road IC3
No
. Route Characteristics Illustrative pictures
Tran Hoang Na road bridge, and parallel IC3
Tran Hoang Na road bridge
CAN THO URBAN DEVELOPMENT AND RESILIENCE ENHANCEMENT PROJECT
Social Assessment Report
36
No
. Route Characteristics Illustrative pictures
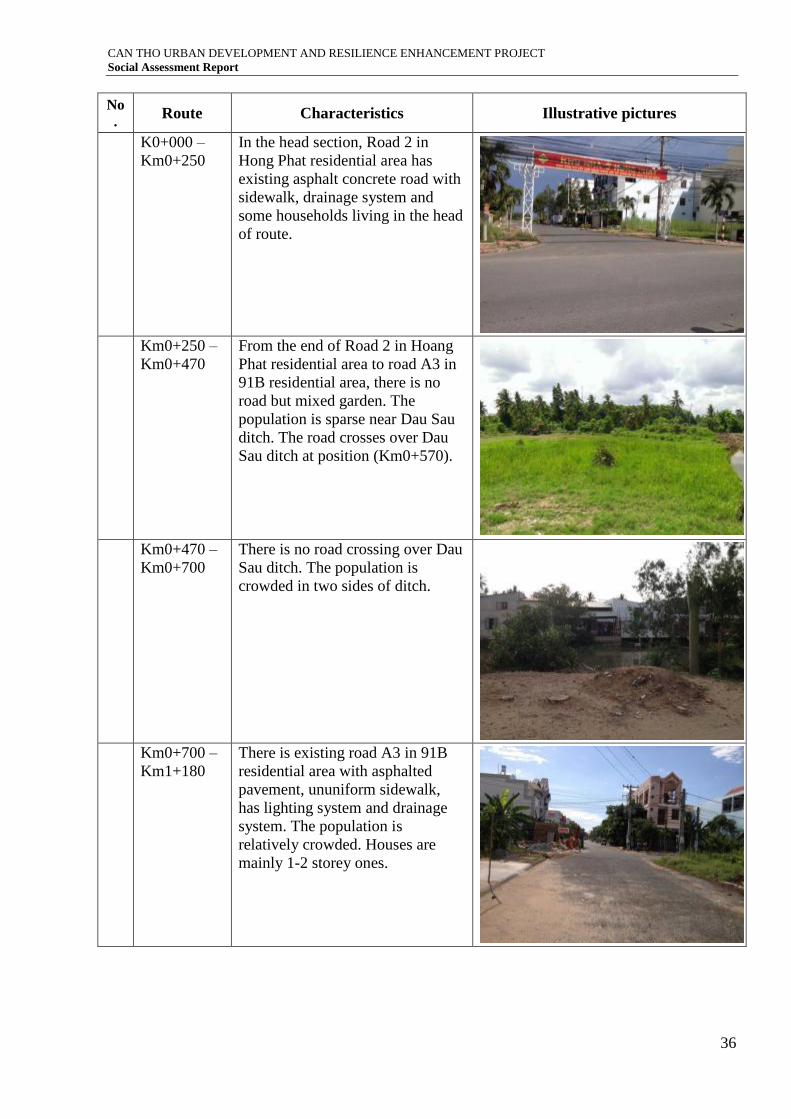
K0+000 –
Km0+250
In the head section, Road 2 in
Hong Phat residential area has
existing asphalt concrete road with
sidewalk, drainage system and
some households living in the head
of route.
Km0+250 –
Km0+470
From the end of Road 2 in Hoang
Phat residential area to road A3 in
91B residential area, there is no
road but mixed garden. The
population is sparse near Dau Sau
ditch. The road crosses over Dau
Sau ditch at position (Km0+570).
Km0+470 –
Km0+700
There is no road crossing over Dau
Sau ditch. The population is
crowded in two sides of ditch.
Km0+700 –
Km1+180
There is existing road A3 in 91B
residential area with asphalted
pavement, ununiform sidewalk,
has lighting system and drainage
system. The population is
relatively crowded. Houses are
mainly 1-2 storey ones.
CAN THO URBAN DEVELOPMENT AND RESILIENCE ENHANCEMENT PROJECT
Social Assessment Report
37
No
. Route Characteristics Illustrative pictures
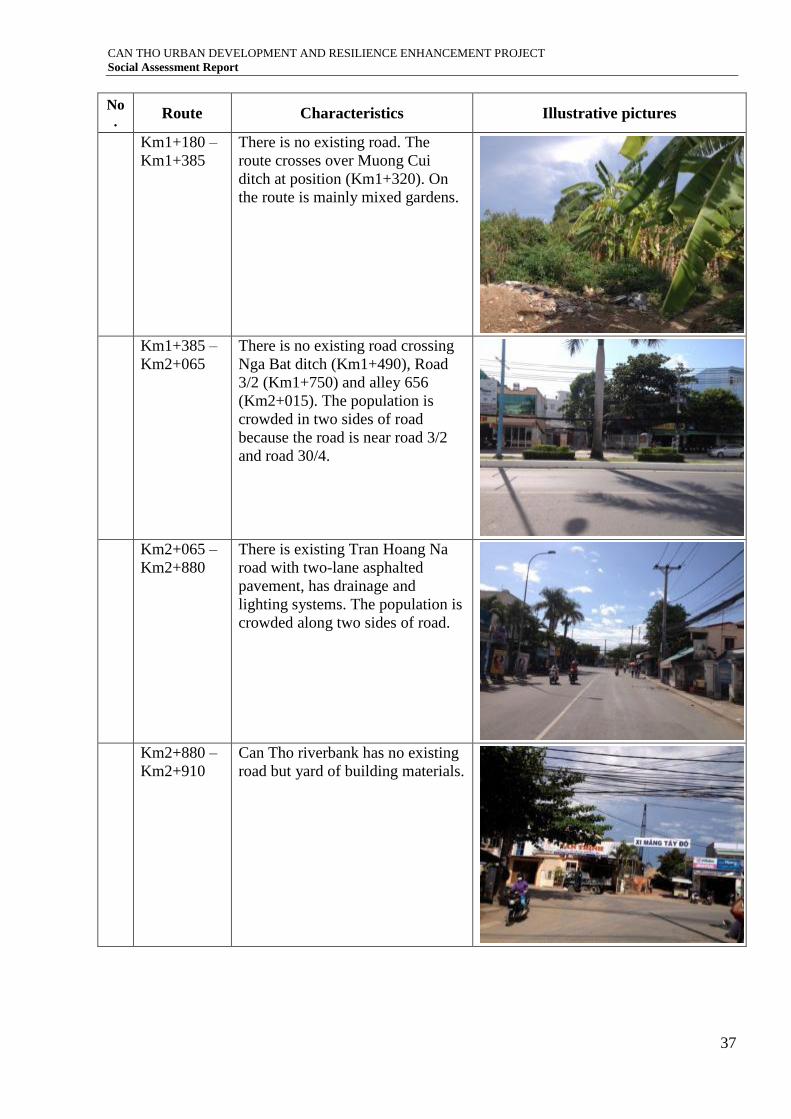
Km1+180 –
Km1+385
There is no existing road. The
route crosses over Muong Cui
ditch at position (Km1+320). On
the route is mainly mixed gardens.
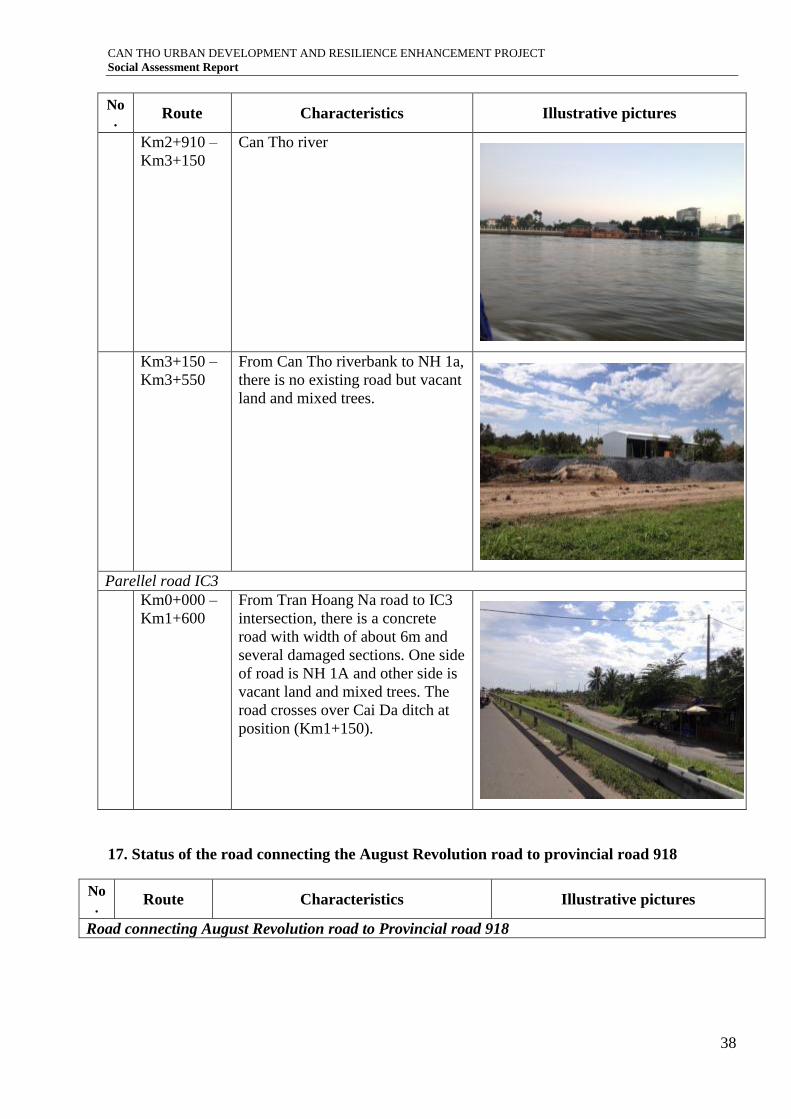
Km1+385 –
Km2+065
There is no existing road crossing
Nga Bat ditch (Km1+490), Road
3/2 (Km1+750) and alley 656
(Km2+015). The population is
crowded in two sides of road
because the road is near road 3/2
and road 30/4.
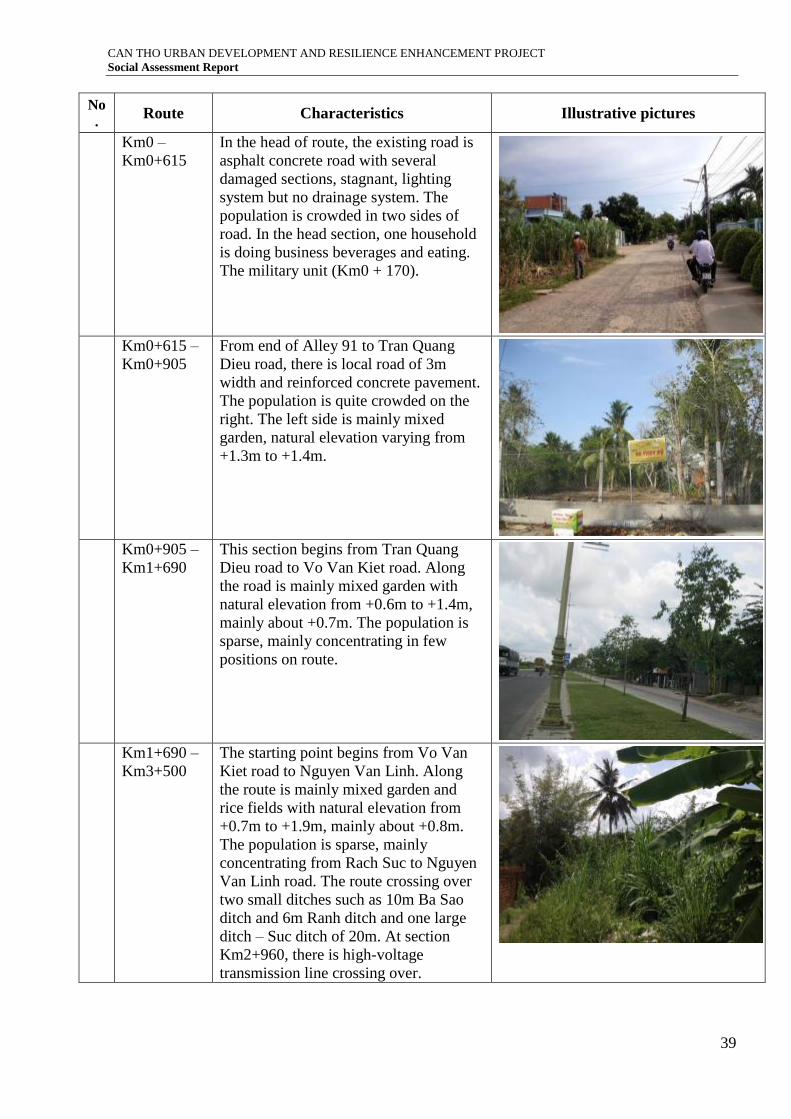
Km2+065 –
Km2+880
There is existing Tran Hoang Na
road with two-lane asphalted
pavement, has drainage and
lighting systems. The population is
crowded along two sides of road.
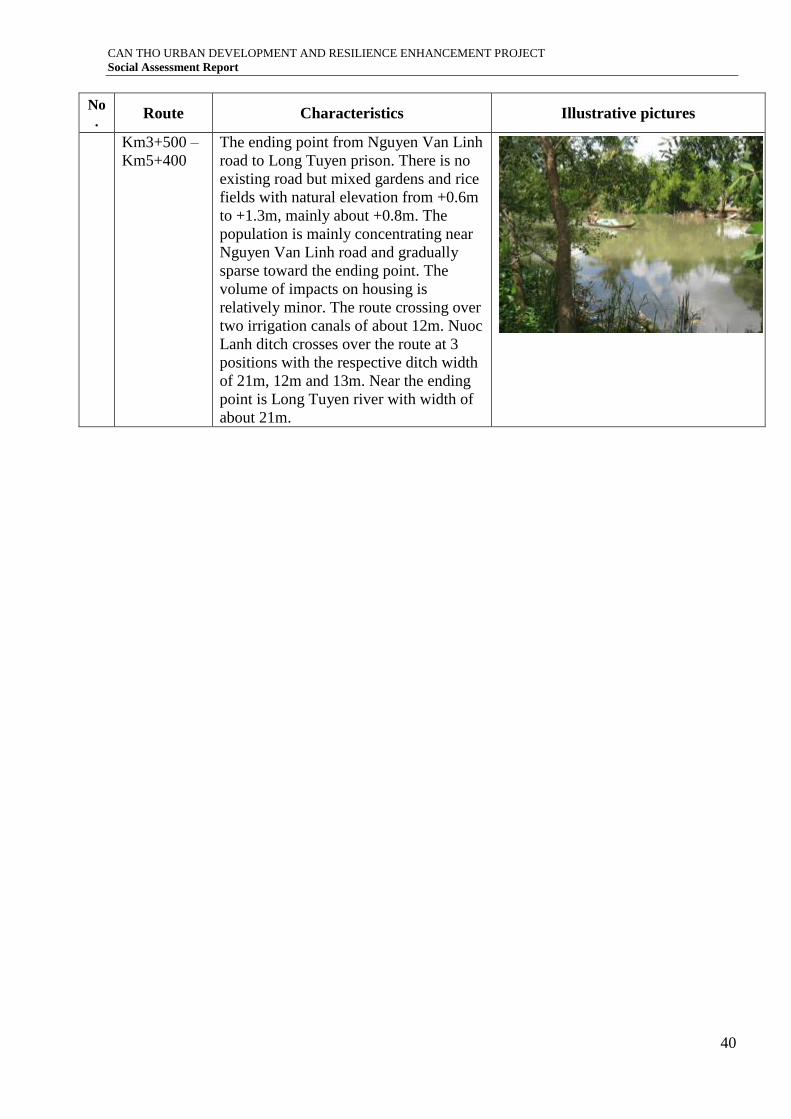
Km2+880 –
Km2+910
Can Tho riverbank has no existing
road but yard of building materials.
CAN THO URBAN DEVELOPMENT AND RESILIENCE ENHANCEMENT PROJECT
Social Assessment Report
38
No
. Route Characteristics Illustrative pictures
Km2+910 –
Km3+150
Can Tho river
Km3+150 –
Km3+550
From Can Tho riverbank to NH 1a,
there is no existing road but vacant
land and mixed trees.
Parellel road IC3
Km0+000 –
Km1+600
From Tran Hoang Na road to IC3
intersection, there is a concrete
road with width of about 6m and
several damaged sections. One side
of road is NH 1A and other side is
vacant land and mixed trees. The
road crosses over Cai Da ditch at
position (Km1+150).
17. Status of the road connecting the August Revolution road to provincial road 918
No
. Route Characteristics Illustrative pictures
Road connecting August Revolution road to Provincial road 918
CAN THO URBAN DEVELOPMENT AND RESILIENCE ENHANCEMENT PROJECT
Social Assessment Report
39
No
. Route Characteristics Illustrative pictures
Km0 –
Km0+615
In the head of route, the existing road is
asphalt concrete road with several
damaged sections, stagnant, lighting
system but no drainage system. The
population is crowded in two sides of
road. In the head section, one household
is doing business beverages and eating.
The military unit (Km0 + 170).
Km0+615 –
Km0+905
From end of Alley 91 to Tran Quang
Dieu road, there is local road of 3m
width and reinforced concrete pavement.
The population is quite crowded on the
right. The left side is mainly mixed
garden, natural elevation varying from
+1.3m to +1.4m.
Km0+905 –
Km1+690
This section begins from Tran Quang
Dieu road to Vo Van Kiet road. Along
the road is mainly mixed garden with
natural elevation from +0.6m to +1.4m,
mainly about +0.7m. The population is
sparse, mainly concentrating in few
positions on route.
Km1+690 –
Km3+500
The starting point begins from Vo Van
Kiet road to Nguyen Van Linh. Along
the route is mainly mixed garden and
rice fields with natural elevation from
+0.7m to +1.9m, mainly about +0.8m.
The population is sparse, mainly
concentrating from Rach Suc to Nguyen
Van Linh road. The route crossing over
two small ditches such as 10m Ba Sao
ditch and 6m Ranh ditch and one large
ditch – Suc ditch of 20m. At section
Km2+960, there is high-voltage
transmission line crossing over.
CAN THO URBAN DEVELOPMENT AND RESILIENCE ENHANCEMENT PROJECT
Social Assessment Report
40
No
. Route Characteristics Illustrative pictures
Km3+500 –
Km5+400
The ending point from Nguyen Van Linh
road to Long Tuyen prison. There is no
existing road but mixed gardens and rice
fields with natural elevation from +0.6m
to +1.3m, mainly about +0.8m. The
population is mainly concentrating near
Nguyen Van Linh road and gradually
sparse toward the ending point. The
volume of impacts on housing is
relatively minor. The route crossing over
two irrigation canals of about 12m. Nuoc
Lanh ditch crosses over the route at 3
positions with the respective ditch width
of 21m, 12m and 13m. Near the ending
point is Long Tuyen river with width of
about 21m.

CAN THO URBAN DEVELOPMENT AND RESILIENCE ENHANCEMENT PROJECT
Social Assessment Report
41
Annex 3: Results of the Project Environment Monitoring
CAN THO URBAN DEVELOPMENT AND RESILIENCE ENHANCEMENT PROJECT
Social Assessment Report
42
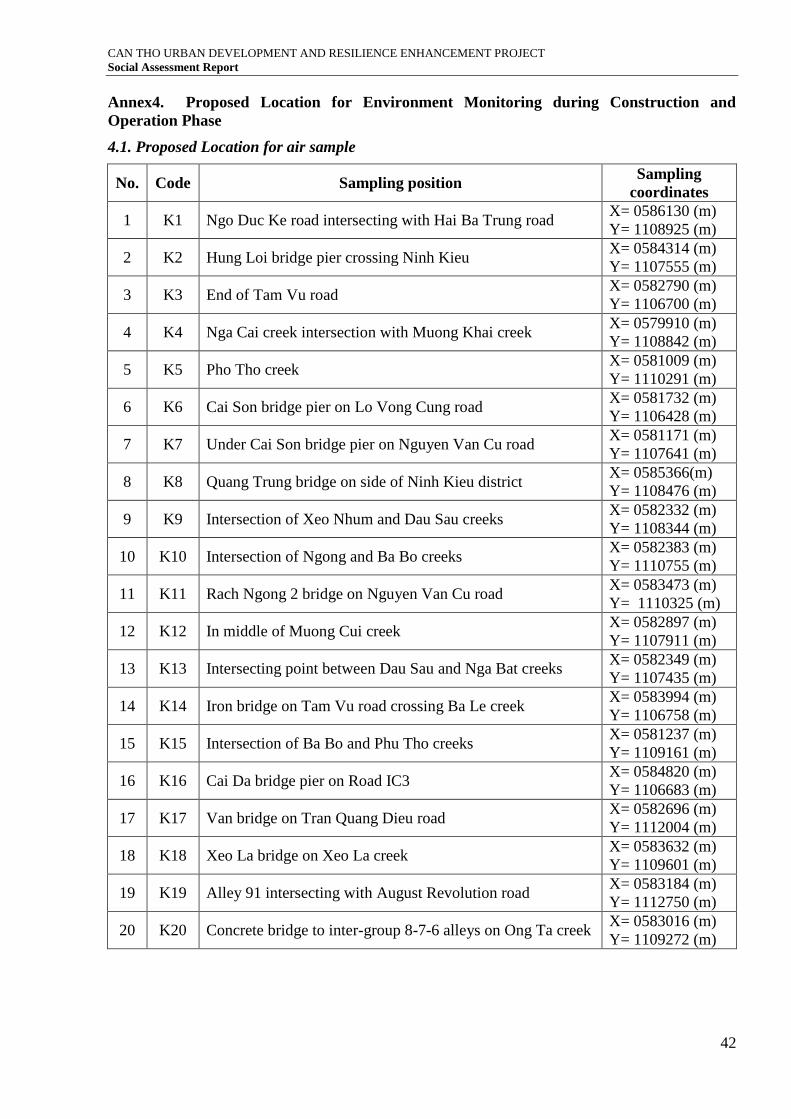
Annex4. Proposed Location for Environment Monitoring during Construction and
Operation Phase
4.1. Proposed Location for air sample
No. Code Sampling position Sampling
coordinates
1 K1 Ngo Duc Ke road intersecting with Hai Ba Trung road X= 0586130 (m)
Y= 1108925 (m)
2 K2 Hung Loi bridge pier crossing Ninh Kieu X= 0584314 (m)
Y= 1107555 (m)
3 K3 End of Tam Vu road X= 0582790 (m)
Y= 1106700 (m)
4 K4 Nga Cai creek intersection with Muong Khai creek X= 0579910 (m)
Y= 1108842 (m)
5 K5 Pho Tho creek X= 0581009 (m)
Y= 1110291 (m)
6 K6 Cai Son bridge pier on Lo Vong Cung road X= 0581732 (m)
Y= 1106428 (m)
7 K7 Under Cai Son bridge pier on Nguyen Van Cu road X= 0581171 (m)
Y= 1107641 (m)
8 K8 Quang Trung bridge on side of Ninh Kieu district X= 0585366(m)
Y= 1108476 (m)
9 K9 Intersection of Xeo Nhum and Dau Sau creeks X= 0582332 (m)
Y= 1108344 (m)
10 K10 Intersection of Ngong and Ba Bo creeks X= 0582383 (m)
Y= 1110755 (m)
11 K11 Rach Ngong 2 bridge on Nguyen Van Cu road X= 0583473 (m)
Y= 1110325 (m)
12 K12 In middle of Muong Cui creek X= 0582897 (m)
Y= 1107911 (m)
13 K13 Intersecting point between Dau Sau and Nga Bat creeks X= 0582349 (m)
Y= 1107435 (m)
14 K14 Iron bridge on Tam Vu road crossing Ba Le creek X= 0583994 (m)
Y= 1106758 (m)
15 K15 Intersection of Ba Bo and Phu Tho creeks X= 0581237 (m)
Y= 1109161 (m)
16 K16 Cai Da bridge pier on Road IC3 X= 0584820 (m)
Y= 1106683 (m)
17 K17 Van bridge on Tran Quang Dieu road X= 0582696 (m)
Y= 1112004 (m)
18 K18 Xeo La bridge on Xeo La creek X= 0583632 (m)
Y= 1109601 (m)
19 K19 Alley 91 intersecting with August Revolution road X= 0583184 (m)
Y= 1112750 (m)
20 K20 Concrete bridge to inter-group 8-7-6 alleys on Ong Ta creek X= 0583016 (m)
Y= 1109272 (m)
CAN THO URBAN DEVELOPMENT AND RESILIENCE ENHANCEMENT PROJECT
Social Assessment Report
43
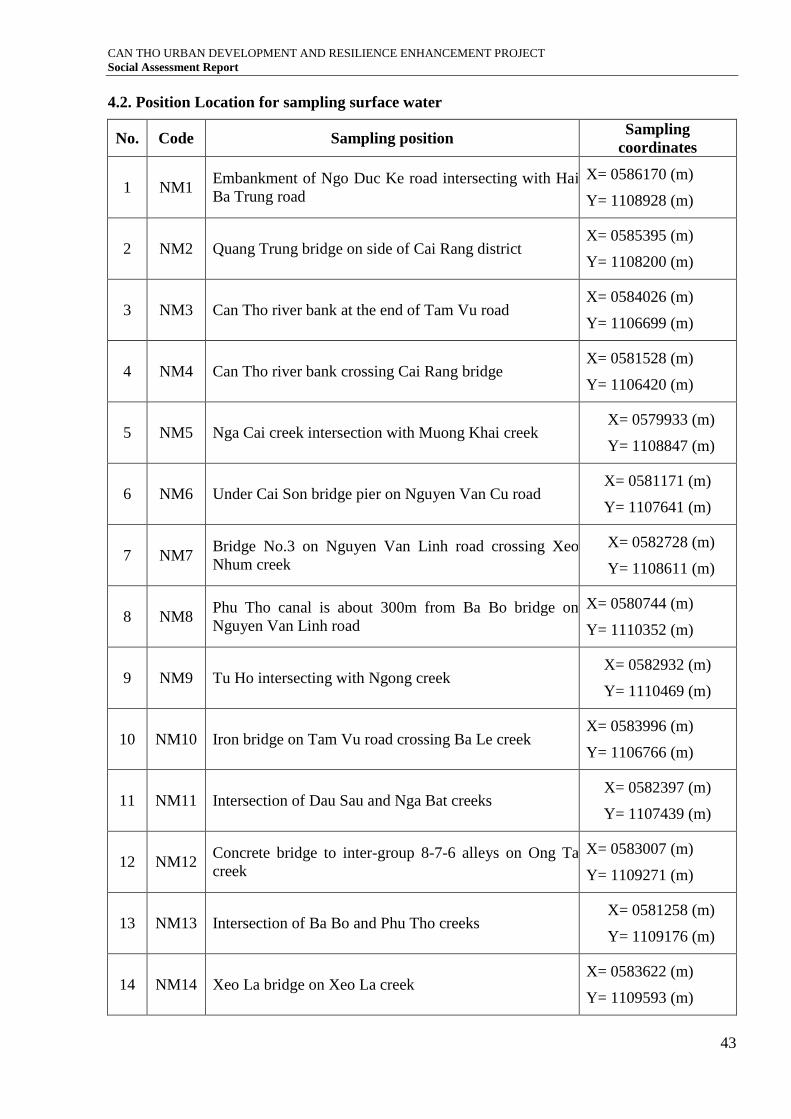
4.2. Position Location for sampling surface water
No. Code Sampling position Sampling
coordinates
1 NM1 Embankment of Ngo Duc Ke road intersecting with Hai
Ba Trung road
X= 0586170 (m)
Y= 1108928 (m)
2 NM2 Quang Trung bridge on side of Cai Rang district X= 0585395 (m)
Y= 1108200 (m)
3 NM3 Can Tho river bank at the end of Tam Vu road X= 0584026 (m)
Y= 1106699 (m)
4 NM4 Can Tho river bank crossing Cai Rang bridge X= 0581528 (m)
Y= 1106420 (m)
5 NM5 Nga Cai creek intersection with Muong Khai creek X= 0579933 (m)
Y= 1108847 (m)
6 NM6 Under Cai Son bridge pier on Nguyen Van Cu road X= 0581171 (m)
Y= 1107641 (m)
7 NM7 Bridge No.3 on Nguyen Van Linh road crossing Xeo
Nhum creek
X= 0582728 (m)
Y= 1108611 (m)
8 NM8 Phu Tho canal is about 300m from Ba Bo bridge on
Nguyen Van Linh road
X= 0580744 (m)
Y= 1110352 (m)
9 NM9 Tu Ho intersecting with Ngong creek X= 0582932 (m)
Y= 1110469 (m)
10 NM10 Iron bridge on Tam Vu road crossing Ba Le creek X= 0583996 (m)
Y= 1106766 (m)
11 NM11 Intersection of Dau Sau and Nga Bat creeks X= 0582397 (m)
Y= 1107439 (m)
12 NM12 Concrete bridge to inter-group 8-7-6 alleys on Ong Ta
creek
X= 0583007 (m)
Y= 1109271 (m)
13 NM13 Intersection of Ba Bo and Phu Tho creeks X= 0581258 (m)
Y= 1109176 (m)
14 NM14 Xeo La bridge on Xeo La creek X= 0583622 (m)
Y= 1109593 (m)
CAN THO URBAN DEVELOPMENT AND RESILIENCE ENHANCEMENT PROJECT
Social Assessment Report
44
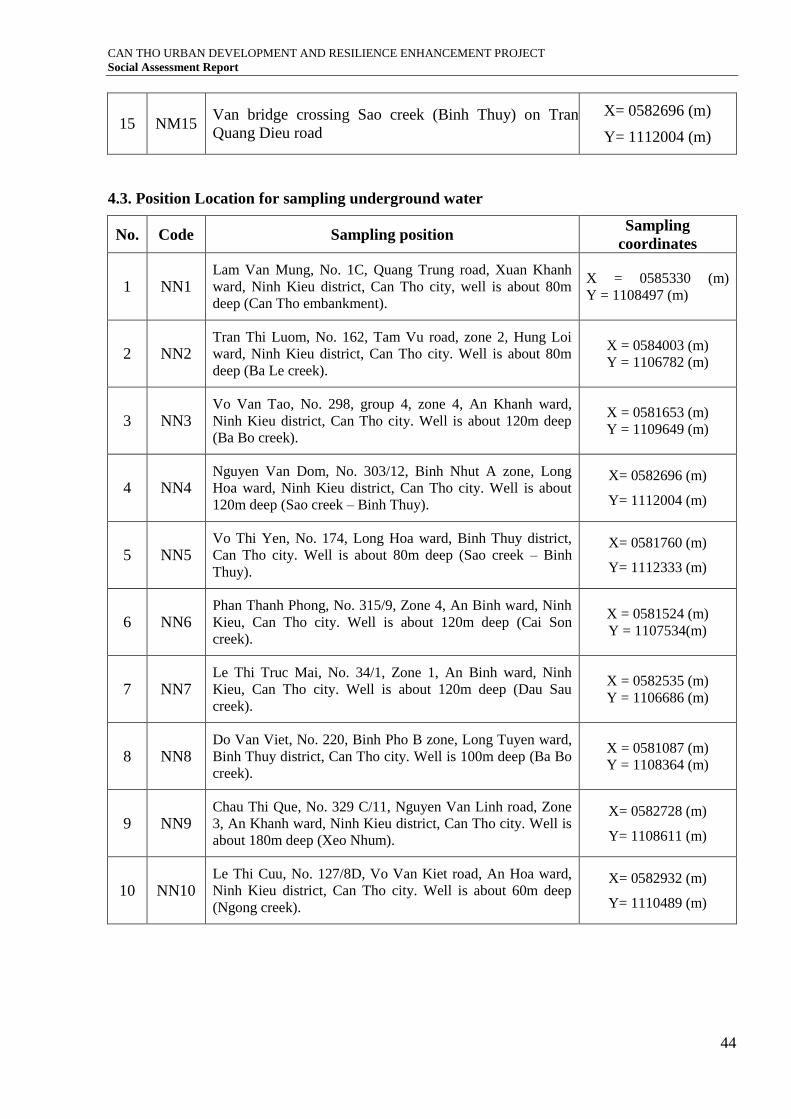
15 NM15 Van bridge crossing Sao creek (Binh Thuy) on Tran
Quang Dieu road
X= 0582696 (m)
Y= 1112004 (m)
4.3. Position Location for sampling underground water
No. Code Sampling position Sampling
coordinates
1 NN1 Lam Van Mung, No. 1C, Quang Trung road, Xuan Khanh
ward, Ninh Kieu district, Can Tho city, well is about 80m
deep (Can Tho embankment).
X = 0585330 (m)
Y = 1108497 (m)
2 NN2 Tran Thi Luom, No. 162, Tam Vu road, zone 2, Hung Loi
ward, Ninh Kieu district, Can Tho city. Well is about 80m
deep (Ba Le creek).
X = 0584003 (m)
Y = 1106782 (m)
3 NN3 Vo Van Tao, No. 298, group 4, zone 4, An Khanh ward,
Ninh Kieu district, Can Tho city. Well is about 120m deep
(Ba Bo creek).
X = 0581653 (m)
Y = 1109649 (m)
4 NN4 Nguyen Van Dom, No. 303/12, Binh Nhut A zone, Long
Hoa ward, Ninh Kieu district, Can Tho city. Well is about
120m deep (Sao creek – Binh Thuy).
X= 0582696 (m)
Y= 1112004 (m)
5 NN5 Vo Thi Yen, No. 174, Long Hoa ward, Binh Thuy district,
Can Tho city. Well is about 80m deep (Sao creek – Binh
Thuy).
X= 0581760 (m)
Y= 1112333 (m)
6 NN6 Phan Thanh Phong, No. 315/9, Zone 4, An Binh ward, Ninh
Kieu, Can Tho city. Well is about 120m deep (Cai Son
creek).
X = 0581524 (m)
Y = 1107534(m)
7 NN7 Le Thi Truc Mai, No. 34/1, Zone 1, An Binh ward, Ninh
Kieu, Can Tho city. Well is about 120m deep (Dau Sau
creek).
X = 0582535 (m)
Y = 1106686 (m)
8 NN8 Do Van Viet, No. 220, Binh Pho B zone, Long Tuyen ward,
Binh Thuy district, Can Tho city. Well is 100m deep (Ba Bo
creek).
X = 0581087 (m)
Y = 1108364 (m)
9 NN9 Chau Thi Que, No. 329 C/11, Nguyen Van Linh road, Zone
3, An Khanh ward, Ninh Kieu district, Can Tho city. Well is
about 180m deep (Xeo Nhum).
X= 0582728 (m)
Y= 1108611 (m)
10 NN10 Le Thi Cuu, No. 127/8D, Vo Van Kiet road, An Hoa ward,
Ninh Kieu district, Can Tho city. Well is about 60m deep
(Ngong creek).
X= 0582932 (m)
Y= 1110489 (m)
CAN THO URBAN DEVELOPMENT AND RESILIENCE ENHANCEMENT PROJECT
Social Assessment Report
45
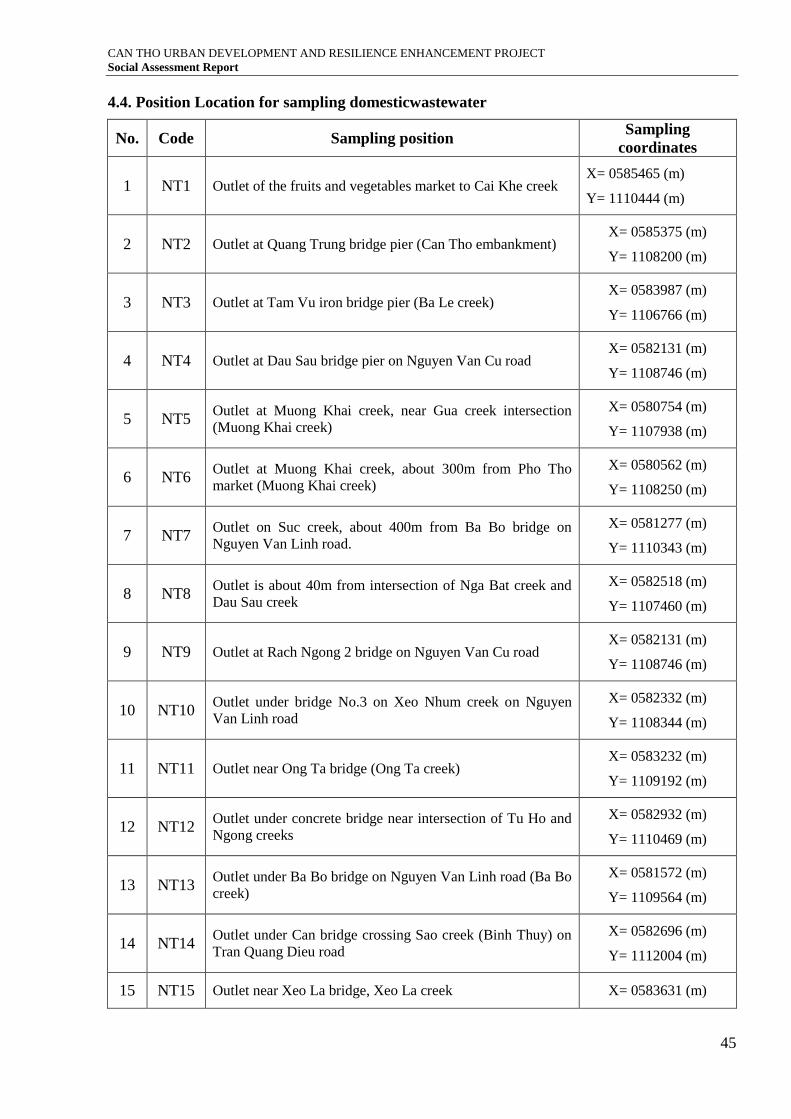
4.4. Position Location for sampling domesticwastewater
No. Code Sampling position Sampling
coordinates
1 NT1 Outlet of the fruits and vegetables market to Cai Khe creek X= 0585465 (m)
Y= 1110444 (m)
2 NT2 Outlet at Quang Trung bridge pier (Can Tho embankment) X= 0585375 (m)
Y= 1108200 (m)
3 NT3 Outlet at Tam Vu iron bridge pier (Ba Le creek) X= 0583987 (m)
Y= 1106766 (m)
4 NT4 Outlet at Dau Sau bridge pier on Nguyen Van Cu road X= 0582131 (m)
Y= 1108746 (m)
5 NT5 Outlet at Muong Khai creek, near Gua creek intersection
(Muong Khai creek)
X= 0580754 (m)
Y= 1107938 (m)
6 NT6 Outlet at Muong Khai creek, about 300m from Pho Tho
market (Muong Khai creek)
X= 0580562 (m)
Y= 1108250 (m)
7 NT7 Outlet on Suc creek, about 400m from Ba Bo bridge on
Nguyen Van Linh road.
X= 0581277 (m)
Y= 1110343 (m)
8 NT8 Outlet is about 40m from intersection of Nga Bat creek and
Dau Sau creek
X= 0582518 (m)
Y= 1107460 (m)
9 NT9 Outlet at Rach Ngong 2 bridge on Nguyen Van Cu road X= 0582131 (m)
Y= 1108746 (m)
10 NT10 Outlet under bridge No.3 on Xeo Nhum creek on Nguyen
Van Linh road
X= 0582332 (m)
Y= 1108344 (m)
11 NT11 Outlet near Ong Ta bridge (Ong Ta creek) X= 0583232 (m)
Y= 1109192 (m)
12 NT12 Outlet under concrete bridge near intersection of Tu Ho and
Ngong creeks
X= 0582932 (m)
Y= 1110469 (m)
13 NT13 Outlet under Ba Bo bridge on Nguyen Van Linh road (Ba Bo
creek)
X= 0581572 (m)
Y= 1109564 (m)
14 NT14 Outlet under Can bridge crossing Sao creek (Binh Thuy) on
Tran Quang Dieu road
X= 0582696 (m)
Y= 1112004 (m)
15 NT15 Outlet near Xeo La bridge, Xeo La creek X= 0583631 (m)
CAN THO URBAN DEVELOPMENT AND RESILIENCE ENHANCEMENT PROJECT
Social Assessment Report
46
Y= 1109628 (m)
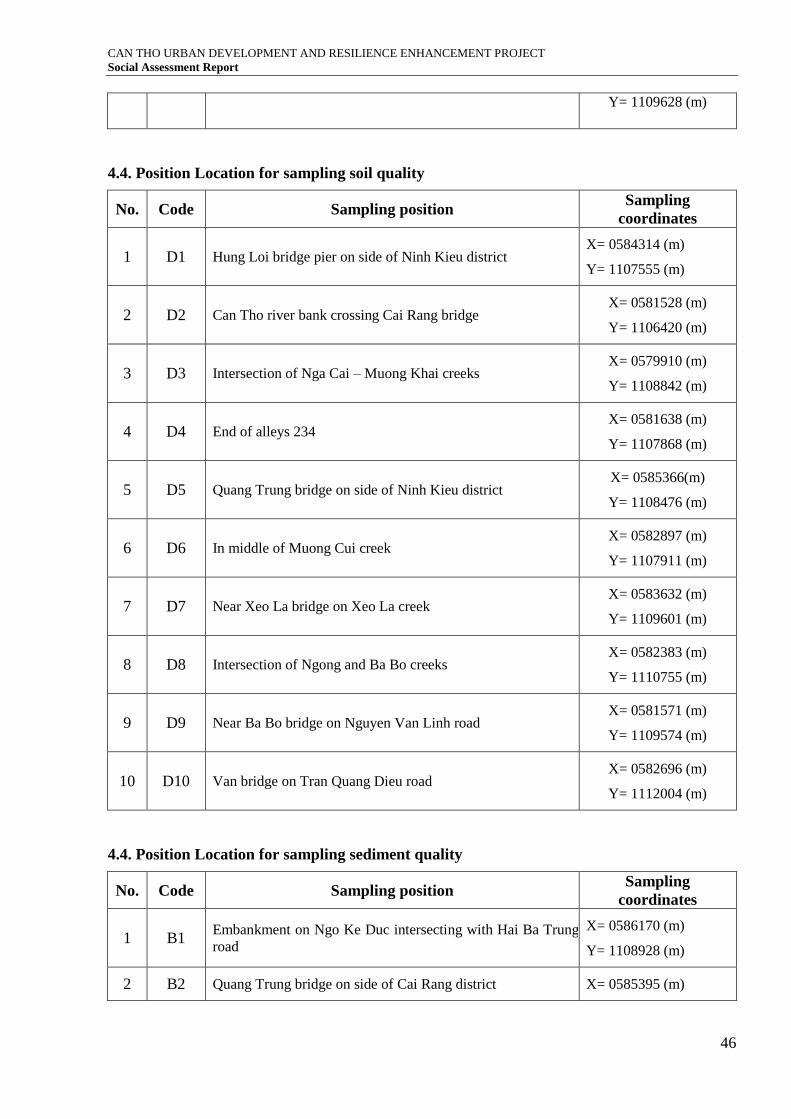
4.4. Position Location for sampling soil quality
No. Code Sampling position Sampling
coordinates
1 D1 Hung Loi bridge pier on side of Ninh Kieu district X= 0584314 (m)
Y= 1107555 (m)
2 D2 Can Tho river bank crossing Cai Rang bridge X= 0581528 (m)
Y= 1106420 (m)
3 D3 Intersection of Nga Cai – Muong Khai creeks X= 0579910 (m)
Y= 1108842 (m)
4 D4 End of alleys 234 X= 0581638 (m)
Y= 1107868 (m)
5 D5 Quang Trung bridge on side of Ninh Kieu district X= 0585366(m)
Y= 1108476 (m)
6 D6 In middle of Muong Cui creek X= 0582897 (m)
Y= 1107911 (m)
7 D7 Near Xeo La bridge on Xeo La creek X= 0583632 (m)
Y= 1109601 (m)
8 D8 Intersection of Ngong and Ba Bo creeks X= 0582383 (m)
Y= 1110755 (m)
9 D9 Near Ba Bo bridge on Nguyen Van Linh road X= 0581571 (m)
Y= 1109574 (m)
10 D10 Van bridge on Tran Quang Dieu road X= 0582696 (m)
Y= 1112004 (m)
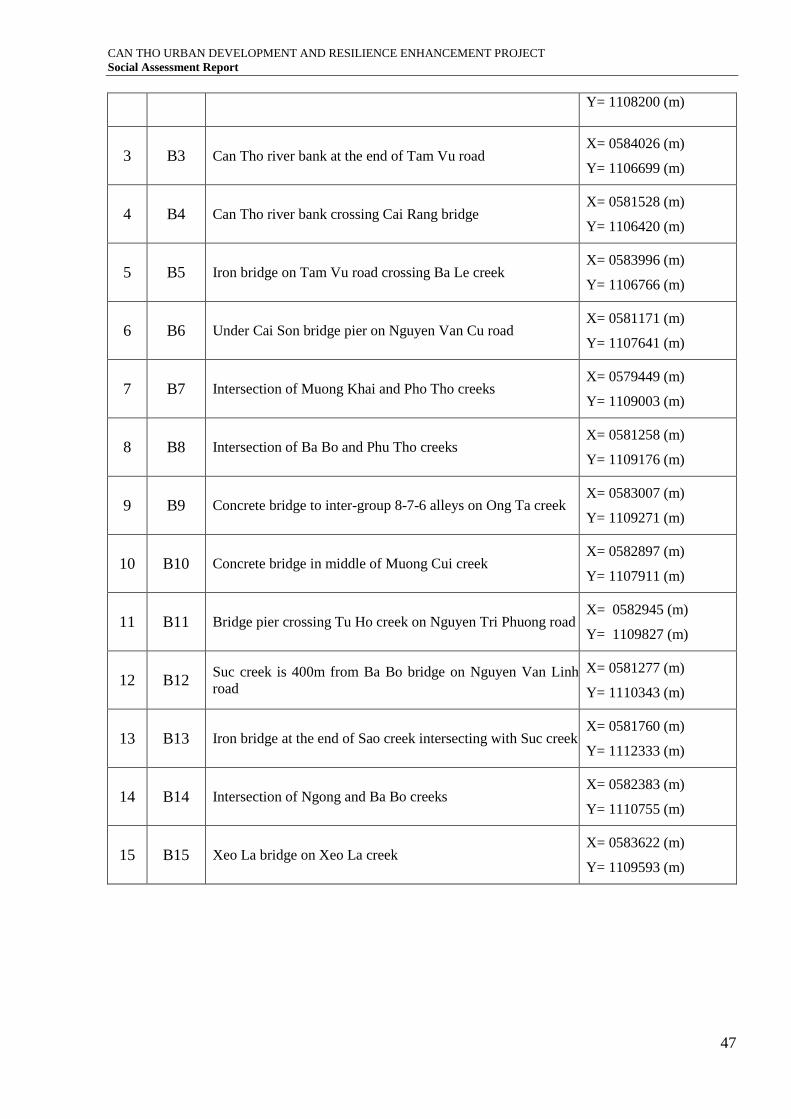
4.4. Position Location for sampling sediment quality
No. Code Sampling position Sampling
coordinates
1 B1 Embankment on Ngo Ke Duc intersecting with Hai Ba Trung
road
X= 0586170 (m)
Y= 1108928 (m)
2 B2 Quang Trung bridge on side of Cai Rang district X= 0585395 (m)
CAN THO URBAN DEVELOPMENT AND RESILIENCE ENHANCEMENT PROJECT
Social Assessment Report
47
Y= 1108200 (m)
3 B3 Can Tho river bank at the end of Tam Vu road X= 0584026 (m)
Y= 1106699 (m)
4 B4 Can Tho river bank crossing Cai Rang bridge X= 0581528 (m)
Y= 1106420 (m)
5 B5 Iron bridge on Tam Vu road crossing Ba Le creek X= 0583996 (m)
Y= 1106766 (m)
6 B6 Under Cai Son bridge pier on Nguyen Van Cu road X= 0581171 (m)
Y= 1107641 (m)
7 B7 Intersection of Muong Khai and Pho Tho creeks X= 0579449 (m)
Y= 1109003 (m)
8 B8 Intersection of Ba Bo and Phu Tho creeks X= 0581258 (m)
Y= 1109176 (m)
9 B9 Concrete bridge to inter-group 8-7-6 alleys on Ong Ta creek X= 0583007 (m)
Y= 1109271 (m)
10 B10 Concrete bridge in middle of Muong Cui creek X= 0582897 (m)
Y= 1107911 (m)
11 B11 Bridge pier crossing Tu Ho creek on Nguyen Tri Phuong road X= 0582945 (m)
Y= 1109827 (m)
12 B12 Suc creek is 400m from Ba Bo bridge on Nguyen Van Linh
road
X= 0581277 (m)
Y= 1110343 (m)
13 B13 Iron bridge at the end of Sao creek intersecting with Suc creek X= 0581760 (m)
Y= 1112333 (m)
14 B14 Intersection of Ngong and Ba Bo creeks X= 0582383 (m)
Y= 1110755 (m)
15 B15 Xeo La bridge on Xeo La creek X= 0583622 (m)
Y= 1109593 (m)
CAN THO URBAN DEVELOPMENT AND RESILIENCE ENHANCEMENT PROJECT
Social Assessment Report
48
Annex 5: Minutes of Public Consultation and Site Pictures
* Note:double click into the icon to open the file.
Annex 6: Social Asssessment Report
CAN THO URBAN DEVELOPMENT AND RESILIENCE ENHANCEMENT PROJECT
Social Assessment Report
49
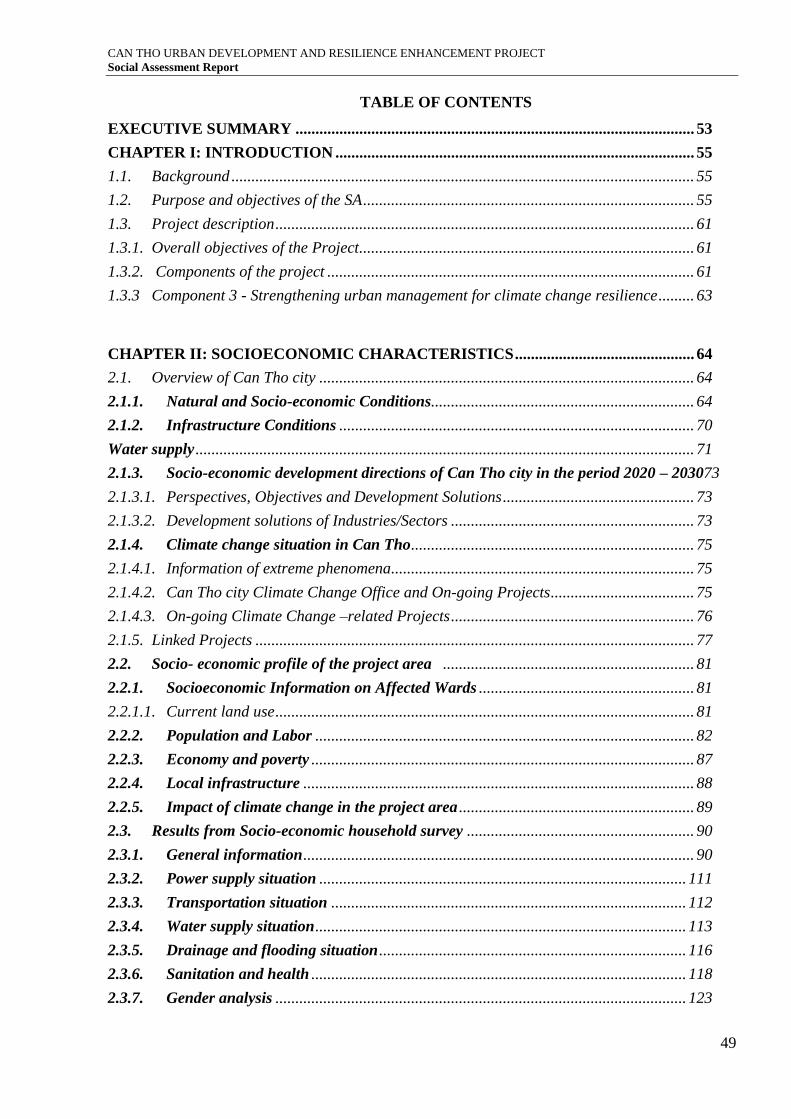
TABLE OF CONTENTS
EXECUTIVE SUMMARY .................................................................................................... 53
CHAPTER I: INTRODUCTION .......................................................................................... 55
1.1. Background .................................................................................................................... 55
1.2. Purpose and objectives of the SA ................................................................................... 55
1.3. Project description ......................................................................................................... 61
1.3.1. Overall objectives of the Project .................................................................................... 61
1.3.2. Components of the project ............................................................................................ 61
1.3.3 Component 3 - Strengthening urban management for climate change resilience ......... 63
CHAPTER II: SOCIOECONOMIC CHARACTERISTICS ............................................. 64
2.1. Overview of Can Tho city .............................................................................................. 64
2.1.1. Natural and Socio-economic Conditions.................................................................. 64
2.1.2. Infrastructure Conditions ......................................................................................... 70
Water supply ............................................................................................................................. 71
2.1.3. Socio-economic development directions of Can Tho city in the period 2020 – 203073
2.1.3.1. Perspectives, Objectives and Development Solutions ................................................ 73
2.1.3.2. Development solutions of Industries/Sectors ............................................................. 73
2.1.4. Climate change situation in Can Tho ....................................................................... 75
2.1.4.1. Information of extreme phenomena............................................................................ 75
2.1.4.2. Can Tho city Climate Change Office and On-going Projects .................................... 75
2.1.4.3. On-going Climate Change –related Projects ............................................................. 76
2.1.5. Linked Projects .............................................................................................................. 77
2.2. Socio- economic profile of the project area ............................................................... 81
2.2.1. Socioeconomic Information on Affected Wards ...................................................... 81
2.2.1.1. Current land use ......................................................................................................... 81
2.2.2. Population and Labor ............................................................................................... 82
2.2.3. Economy and poverty ................................................................................................ 87
2.2.4. Local infrastructure .................................................................................................. 88
2.2.5. Impact of climate change in the project area ........................................................... 89
2.3. Results from Socio-economic household survey ......................................................... 90
2.3.1. General information .................................................................................................. 90
2.3.2. Power supply situation ............................................................................................ 111
2.3.3. Transportation situation ......................................................................................... 112
2.3.4. Water supply situation ............................................................................................. 113
2.3.5. Drainage and flooding situation ............................................................................. 116
2.3.6. Sanitation and health .............................................................................................. 118
2.3.7. Gender analysis ....................................................................................................... 123
CAN THO URBAN DEVELOPMENT AND RESILIENCE ENHANCEMENT PROJECT
Social Assessment Report
50
2.3.8. Local authorities’ Resilience to Climate Change ........................................................ 127
2.3.9. Community health ................................................................................................... 132
CHAPTER III: MAIN FINDINGS .................................................................................... 141
3.1. Main social issues ....................................................................................................... 141
3.2. Potential Project Impacts and Social Risks ............................................................... 146
CHAPTER IV: STAKEHOLDERS CONSULTATION AND ENGAGEMENT ............... 150
4.1. Stakeholders ................................................................................................................ 150
4.1.1. Definition of stakeholders ........................................................................................... 150
4.1.2. Roles of Associations and Mass Organizations ......................................................... 152
4.1.3. Project preparation and implementation support human resources ........................ 157
4.1.4. Stakeholder Communication, consultation and participation strategies .................. 157
4.2. Participation ................................................................................................................ 163
CHAPTER V: PROPOSED ACTION PLANS AND MITIGATION MEASURES ........... 169
5.1. Gender Action Plan and Gender Monitoring Plan ................................................... 169
5,2. Stakeholder Participation Plan ...................................................................................... 169
5.3 Social Action Plan ............................................................................................................ 169
CHAPTER VI: INFORMATION UPDATING, MONITORING AND EVALUATION ... 174
6.1. Objectives of monitoring and assessment .................................................................. 174
6.2. Targets and indicators ................................................................................................ 174
6.3. Monitoring responsibilities ......................................................................................... 175
CHAPTER VIII: CONCLUSION ........................................................................................ 177
_Toc435640875
ANNEXES ............................................................................................................................. 178
Annex 1: Gender Action and Monitoring Plan ....................................................................... 179
Annex 2: Stakeholder Participation Plan ............................................................................... 182
Annex 3: Picture at site ........................................................................................................... 190
CAN THO URBAN DEVELOPMENT AND RESILIENCE ENHANCEMENT PROJECT
Social Assessment Report
51
LIST OF TABLES
Table 2.1: Scale, area, population and population density of Can Tho city ................................... 66
Table 2. 2: No. of near-poor households by ethnicity..................................................................... 67
Table 2.3. Poverty rate of Can Tho city .......................................................................................... 69
Table 2.4: Link projects .................................................................................................................. 79
Table 2.5: Total area of the wards in the project area ..................................................................... 81
Table 2.6: Population - Number of households in wards................................................................ 82
Table 2.7. Population - Labor in wards .......................................................................................... 84
Table 2.8. Ethnic composition in surveyed wards .......................................................................... 86
Table 2.9. Number of households surveyed.................................................................................... 90
Table 2.10. Gender of the respondent ............................................................................................. 91
Table 2.111. Age of respondents .................................................................................................... 92
Table 2.12. Relationship to the head of the household ................................................................... 93
Table 2.13. Educational level of the respondent ............................................................................. 94
Table 2.14. Ethnic composition of the household........................................................................... 95
Table 2.15. Occupation of the respondent ...................................................................................... 96
Table 2.16. Household size ............................................................................................................. 97
Table 2.17. The number of households living in the same house ................................................... 98
Table 2.18. Household's assets ....................................................................................................... 99
Table 2.19. Housing of the household .......................................................................................... 101
Table 2.20. Location of the households' house surveyed ............................................................. 102
Table 2.21. Vulnerable households ............................................................................................... 103
Table 2.22. Household's economy by income and expenditure .................................................... 104
Table 2.23. Household's situation by districts .............................................................................. 105
Table 2.24. Incomes and expenditures by person per month in wards ......................................... 105
Table 2.25. Incomes and expenditures of the project wards ......................................................... 107
Table 2.26. Monthly electricity consumption of households ........................................................ 111
Table 2.27. Current situation of roads where households live ...................................................... 113
Table 2.28. Water sources used by households ............................................................................ 114
Table 2.29. Volume in m3 of tap water used monthly – payment amount ................................... 115
Table 2.30. Description of the current drainage system situation in the project area ................... 116
Table 2.31. The extent of floods in residential areas .................................................................... 117
Table 2.32. Categories of toilets owned by households................................................................ 120
Table 2.33. Status of using toilet by household economic sector ................................................. 121
Table 2.34. Environmental pollution status .................................................................................. 122
Table 2.35. Subscription to land and assets of family .................................................................. 123
Table 2.36. Gender and participation in activities ........................................................................ 124
Table 2.37. Cross tabulation table between education level and Gender ..................................... 125
Table 2.38. Abonormal changes in weather, climate at localities ................................................ 128
Table 2.39. People’s solutions to adapt to climate change ........................................................... 130
Table 2.40. People will adapt to climate change .......................................................................... 131
Table 2.41. Community’s participation in the project .................................................................. 134
Table 2.42. Households’ demands of borrowing loans ................................................................. 136
Table 2. 43: Suggestions from the local authorities ...................................................................... 139
CAN THO URBAN DEVELOPMENT AND RESILIENCE ENHANCEMENT PROJECT
Social Assessment Report
52
Table 3. 1. Information about the land acquisition of 02 project components ............................. 141
Table 3. 2: Summary of land use planning for new Tan An market ............................................ 142
Table 3. 3 Summary of area- number of blocks for commodities ................................................ 142
Table 3. 4: Potential Impacts and Social Risks for Flood Control & Sanitation Component....... 147
Table 3.5: Potential Impacts and Social Risks for Urban Corridor Development Component .... 149
Table 4. 1: Roles of stakeholders during the project preparation and implementation…………………...85
Table 4. 2: Stakeholder Communication and Consultation Strategy……………………………..91
Table 5. 1: Social Action plan Framework for the CTUDRP ............................................................ 170
CAN THO URBAN DEVELOPMENT AND RESILIENCE ENHANCEMENT PROJECT
Social Assessment Report
53
Executive Summary
Can ThoUrban Development and Resilience Enhancement Project is funded by the World
Bank. The objective of the Project is to develop urban transport infrastructure in combination
with flood control; secure city-level agencies and facilities, region-level bodies (institutes,
universities, hospitals...) and concentrated living areas; strengthen local transport links and those
between areas in the city in order to ensure conditions of work, study and investment for
sustainable socio-economic development; develop public transport systems and enhance the
accessibility of the people in low-income areas to the social infrastructure service of the city,
reducing travel time between the city center area and development areas with low flood risk to
promote growth, build works synchronously to control and mitigate flooding and increase
drainage capacity and improve environmental sanitation in combination with urban
embellishment and enhance living conditions in urban areas.
Project includes 03 components, in which Component 1 – Flooding control and
environmental sanitation; Component 2 - Urban corridor development and Component 3 -
Strengthening urban management for climate change resilience. Can Tho CPC assigned ODA-
PMU of Can Tho city to manage, organize and implement project preparation activities, including
preparation PDO, FS, safeguard policy reports according to the Donor’s requirements.
The Project will generate positive impacts during theoperational phase such as : (i)
Improved public health and living conditions in the project area,especially for poor and low
income households encroaching on the Can Tho River’s banks andhouseholds located in
areasadjacent to existing open channels and drains and lakes withheavy pollution; (ii)
Minimizedflooding for households and commercial areas along two Can Tho riversides; (iii)
Safety issuesalong two river banks is secured; (iv) Increased income in the construction phase; (v)
increased opportunities for commerce,tourism, local recreation and exercise; (vii) Improved
access to markets and primary socialservices (health, education) and urban employment
opportunities (viii) Reduced floodingbecause the drainage system is improved; (ix)
Increasedincome from production and marketing of agricultural products (x) Increased efficiency
ofproduction and consumption of goods due to better market accessibilities (xi) The
flooding,inundation and bad smell will disappear in the city through flood control works,
drainagesystems under the project.
Despite of the overall positive impacts, the project will cause some adverse social impact
which areinevitable. The project will have significant impacts on land acquisition and
resettlement: 4.539 households will be affected of which 1,814 will be relocated, 1,354,055 m2,
of land will be acquired (361,936 m2 (26.8%) of residential and 735,736 m2 (54.4%) of
agricultural land). Impacts on livelihoods (agriculture production and small business to be
relocated) will also be significant, A Resettlement Plan and an income restoration plans were
prepared to mitigate these impacts.
Other potential social impacts on local communities include road and public safetyduring
construction, spreading of HIV/AIDS during the construction period and disruption of
communities and livelihoods during site clearance and construction. The SA also highlighted that
women are more vulnerable to hardship due to loss of economic and social base due to land
acquisition, relocation and loss of livelihood. As part of the SA, a Gender Action Plan was
prepared.
The social assessment (SA) was conducted to examine the potential impact of the project
(both positive and negative).This Social Assessment Report is prepared aiming to: (i) identify
CAN THO URBAN DEVELOPMENT AND RESILIENCE ENHANCEMENT PROJECT
Social Assessment Report
54
potential direct economic and social impacts and those associated impacts that occur near the
project or area of influence that result from the Bank assisted investment project; (ii) provide
social inputs obtained through consultations with local people and included or integrated into
preparation of the project feasibility study that in particularly paid much attention to demands of
the affected community; (iii) provide specific recommendations on the participatory approached
management for high social risk infrastructure investments, then define criteria and methodology
for determining whether or not proposing investments are accepted by the community; and (iv)
provide baseline data for project monitoring and evaluation.
As part of the SA, a Social Action Plan (SAP) was prepared to ensure that social benefits are
maximized and adverse impacts are mitigated, if not avoided. The SAP also includes gender
mainstreaming.
CAN THO URBAN DEVELOPMENT AND RESILIENCE ENHANCEMENT PROJECT
Social Assessment Report
Page 55
CHAPTER I: INTRODUCTION
1.1. Background
According to the World Bank’s assessment, Vietnam is one of 05 countries around the world
severely affected by climate change and sea level rise, in which Can Tho city in particular and the
Mekong Delta region in general are forecasted to be most severely affected by the negative impacts
of climate change. The fact shows that flooding is now a pressing problem. Flooding caused by
rains, tide, floods and ground subsidence has been occurring regularly in Can Tho city, which
increases the risks of landslides and generation of several epidemics and causes significant impacts
on the lives of people and damages to infrastructures. In Can Tho city, there are many rivers, canals
and creeks, therefore, in case of heavy rains in combination with tide, the city will become rapidly
flooded in longer period.
The process of spontaneous/uncontrolled urbanization and immigration in Can Tho city led to illegal
encroachment on the canals and creeks for the purposes of residence of many households.
Furthermore, the disordered garbage discharge and sediment have narrowed flow and reduced the
drainage capacity of canals and creeks, leading to environmental pollution and affected urban
landscape, and putting pressure on the infrastructure of the city. Those impacts associated with sea
level rise, unusual heavy rains, ground subsidence make flooding more severe in Can Tho city. In
addition, according to the census of 2009 (WB’s calculations are done by the consumption-based
approach), 12% of the population of Can Tho city is poor households and 31% of the population
falls into low-income group of the country. The poor and low income households living along rivers,
canals and creeks are likely to be vulnerable from natural disasters and changes in economic
conditions. On the other hand, the development of industry, trade and services will require great
demands on labour, increasing flow of means of transport, especially roads linking industrial zones
and head ports, traffic routes linking surrounding provinces with the central area which has service
building, leading to overload of the existing traffic infrastructure.
Two Urban Upgrading Projects funded by WB on progress in Can Tho city have been improving and
upgrading some canals and lakes in the urban areas. However, there are still a lot of canals that need
to be improved and upgraded. In addition to finding “soft” solutions to adapt to climate change and
living with floods for the purpose of socio-economic development, there should be structure
measures to fight and minimize potential negative impacts in the future due to climate change and
help poor households in case of negative changes in nature.
When the CTUDR is implemented, it will meet full compulsory criteria of WB on hunger
eradication and poverty reduction, improvement of living standards for low-income residents and the
GoV’s Comprehensive Strategy on Growth and Hunger Eradication and Poverty Reduction.
Simultaneously, the project’s outcome is one of importance actions defined for climate change
resilience of Can Tho city and the Mekong delta region.
1.2. Purpose and objectives of the SA
1.2.1 Objectives of social assessment
Social problems arise largely due to conflict between economic development and natural
resources. Economic losses and social costs from environment degradation often occur long after
economic benefit of development have been realized. Most often, the development project provide
economic benefit and better ling environment, but they also affect local people adversely. Therefore,
social assessment help in understanding, minimizing and addressing such impacts. It involves in (i)
processes through which the World bank and Can Tho City People's Committee can better
understand how socio-cultural, institutional, historical and political contexts influence the social
CAN THO URBAN DEVELOPMENT AND RESILIENCE ENHANCEMENT PROJECT
Social Assessment Report
Page 56
development outcomes of the specific project proposed investments; (ii) enhancing equity,
strengthen social inclusion and cohesion, promote transparency and empower the poor and the
vulnerable in the project design and/or implementation of the project; (iii) creating mechanisms to
identify the opportunities, constraints, impacts and social risks associated with the proposed project
design; (iv) setting up a framework for dialogue on development priorities among social group, civil
society, grassroots organizations and other stakeholders involved in the project; and (v) approach to
identify and mitigate the potential social risks, including adverse social impacts, of the Can Tho
Urban Development and Resilience (CTUDR).
In the project context, the social assessment covers the social aspects of the project planning
and design to address appropriately both potential positive and negative impact of the project’s
activities. It is related to key social issues, including land acquisition, involuntary resettlement,
gender, indigenous peoples, public health, public consultation, participation and communication.
This task is expected to be carried out in a coordinated manner with the environmental assessment
and planning aspects which will be done under a separate assignment. These assessment can enable
the World bank and Can Tho City to not only identify social impacts, but also to put in place suitable
institutional, organizational and project specific mechanisms to mitigate the adverse effects. It also
bright about greater social issue inclusion and participation in the design and implementation stages
of the project.
The assignment will comply with relevant laws and policies of the Government of Vietnam
and the relevant safeguard policies of the World Bank. Besides that, based on results of SA the
project will develop Resettlement Policy Framework (RPF).
1.2.2 The Project Area of Influence
The project is implemented in 3 districts of Can Tho City including NinhKieu, BinhThuy and
Cai Rang. The layout of the project area is presented in the map below:
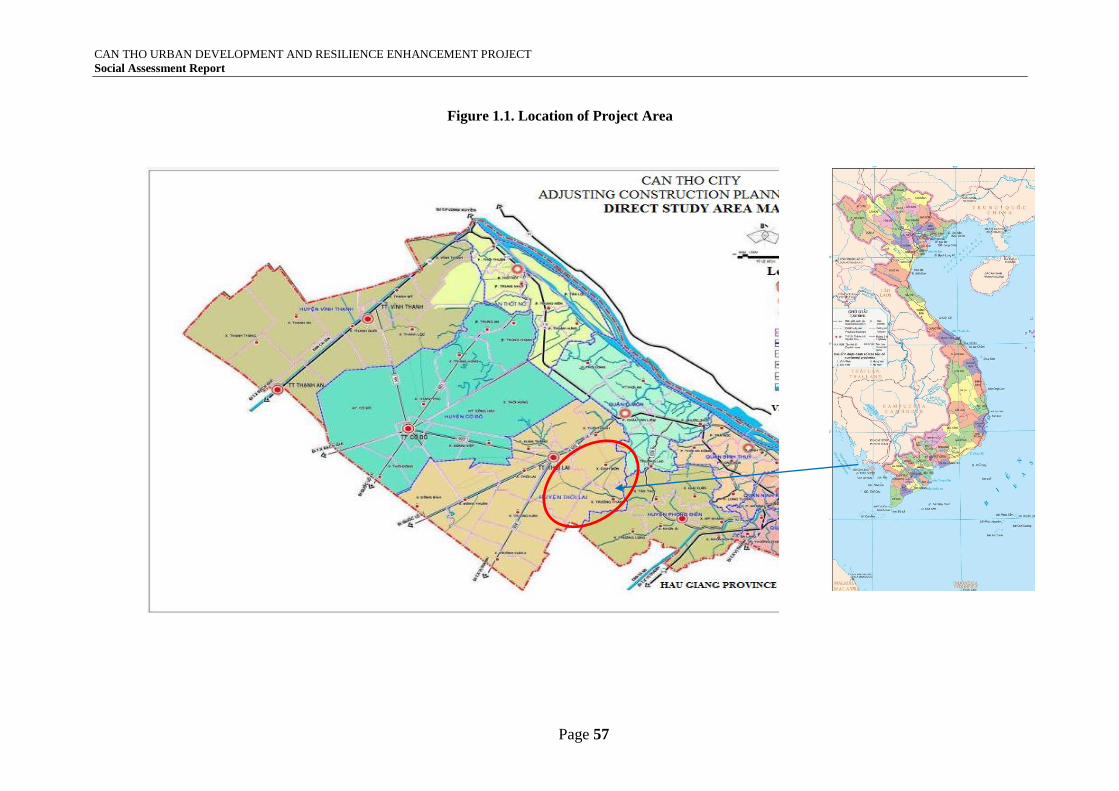
CAN THO URBAN DEVELOPMENT AND RESILIENCE ENHANCEMENT PROJECT
Social Assessment Report
Page 57
Figure 1.1. Location of Project Area
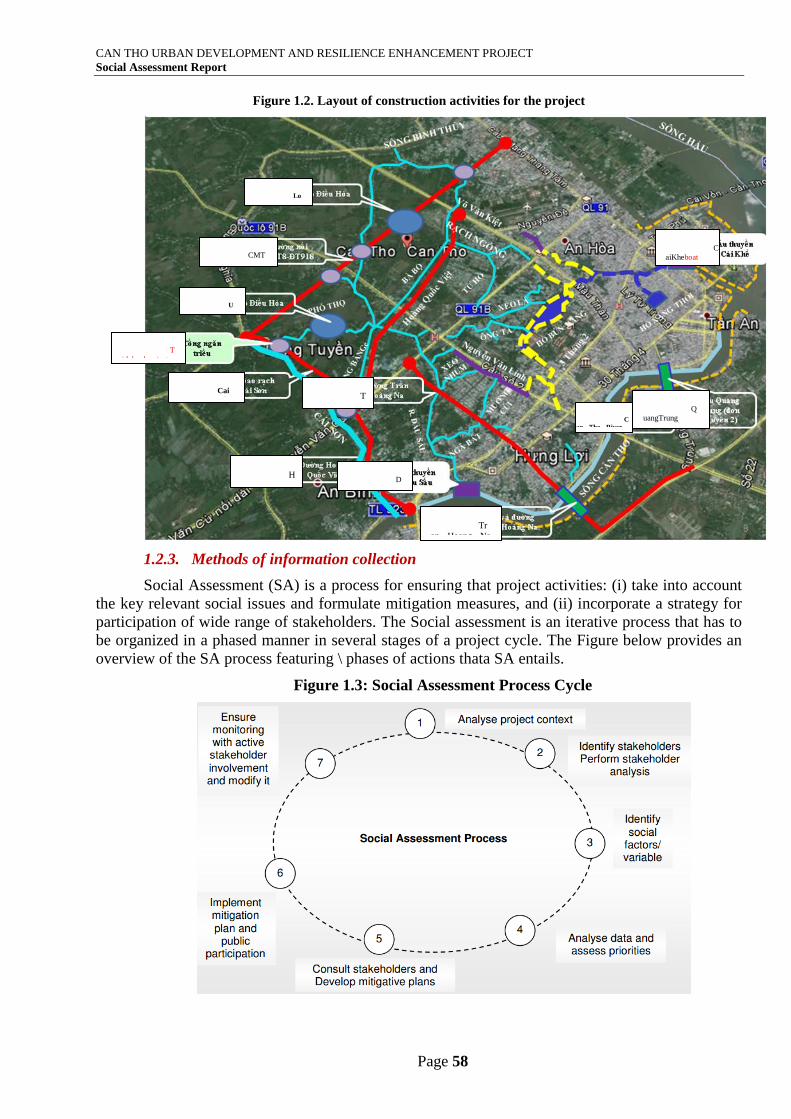
CAN THO URBAN DEVELOPMENT AND RESILIENCE ENHANCEMENT PROJECT
Social Assessment Report
Page 58
Figure 1.2. Layout of construction activities for the project
1.2.3. Methods of information collection
Social Assessment (SA) is a process for ensuring that project activities: (i) take into account
the key relevant social issues and formulate mitigation measures, and (ii) incorporate a strategy for
participation of wide range of stakeholders. The Social assessment is an iterative process that has to
be organized in a phased manner in several stages of a project cycle. The Figure below provides an
overview of the SA process featuring \ phases of actions thata SA entails.
Figure 1.3: Social Assessment Process Cycle
C
an Tho River
embankment
U
niversity Village
Ecological Lake
Q
uangTrung
Bridge (2ndUnit)
C
aiKheboat
movement
T
idal valves/gates
Tr
an Hoang Na
road and bridge
Cai
Son erosion
prevention embankment
Lo
ng Hoa Ecological
Lake
CMT
8 –provincial road
918
D
auSauBoat
movement
T
ran Hoang
Na road
H
oang Quoc
Viet road
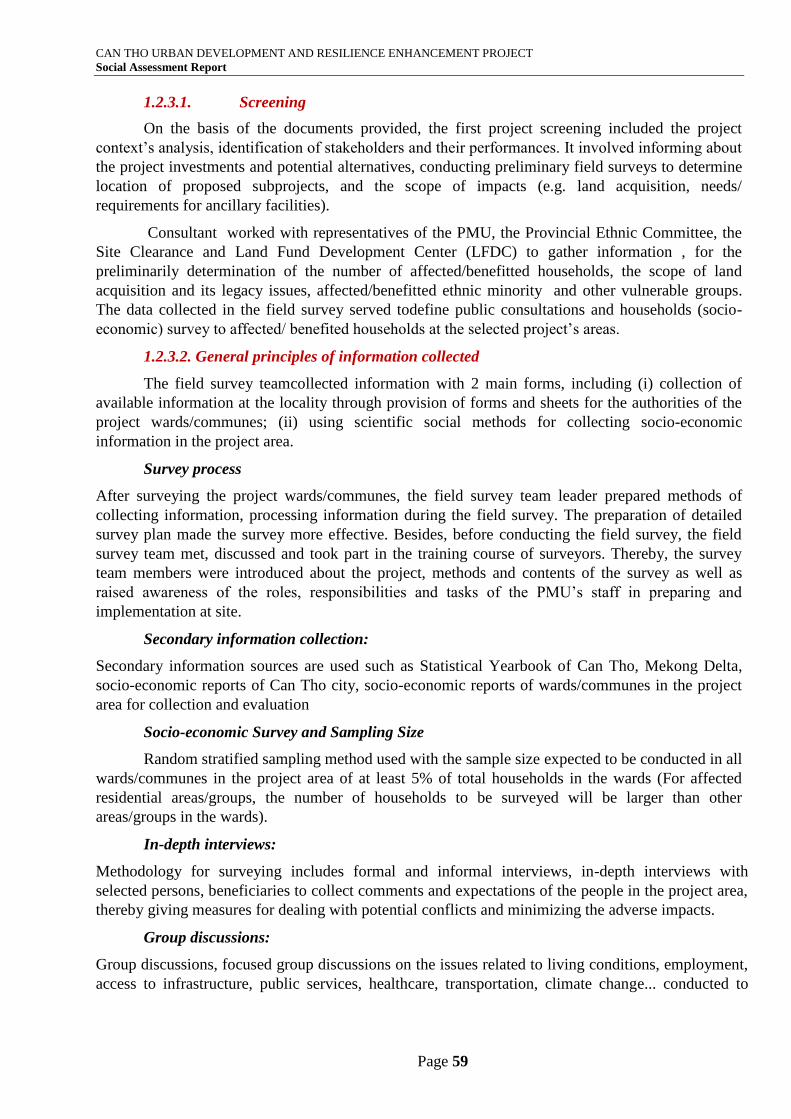
CAN THO URBAN DEVELOPMENT AND RESILIENCE ENHANCEMENT PROJECT
Social Assessment Report
Page 59
1.2.3.1. Screening
On the basis of the documents provided, the first project screening included the project
context’s analysis, identification of stakeholders and their performances. It involved informing about
the project investments and potential alternatives, conducting preliminary field surveys to determine
location of proposed subprojects, and the scope of impacts (e.g. land acquisition, needs/
requirements for ancillary facilities).
Consultant worked with representatives of the PMU, the Provincial Ethnic Committee, the
Site Clearance and Land Fund Development Center (LFDC) to gather information , for the
preliminarily determination of the number of affected/benefitted households, the scope of land
acquisition and its legacy issues, affected/benefitted ethnic minority and other vulnerable groups.
The data collected in the field survey served todefine public consultations and households (socio-
economic) survey to affected/ benefited households at the selected project’s areas.
1.2.3.2. General principles of information collected
The field survey teamcollected information with 2 main forms, including (i) collection of
available information at the locality through provision of forms and sheets for the authorities of the
project wards/communes; (ii) using scientific social methods for collecting socio-economic
information in the project area.
Survey process
After surveying the project wards/communes, the field survey team leader prepared methods of
collecting information, processing information during the field survey. The preparation of detailed
survey plan made the survey more effective. Besides, before conducting the field survey, the field
survey team met, discussed and took part in the training course of surveyors. Thereby, the survey
team members were introduced about the project, methods and contents of the survey as well as
raised awareness of the roles, responsibilities and tasks of the PMU’s staff in preparing and
implementation at site.
Secondary information collection:
Secondary information sources are used such as Statistical Yearbook of Can Tho, Mekong Delta,
socio-economic reports of Can Tho city, socio-economic reports of wards/communes in the project
area for collection and evaluation
Socio-economic Survey and Sampling Size
Random stratified sampling method used with the sample size expected to be conducted in all
wards/communes in the project area of at least 5% of total households in the wards (For affected
residential areas/groups, the number of households to be surveyed will be larger than other
areas/groups in the wards).
In-depth interviews:
Methodology for surveying includes formal and informal interviews, in-depth interviews with
selected persons, beneficiaries to collect comments and expectations of the people in the project area,
thereby giving measures for dealing with potential conflicts and minimizing the adverse impacts.
Group discussions:
Group discussions, focused group discussions on the issues related to living conditions, employment,
access to infrastructure, public services, healthcare, transportation, climate change... conducted to
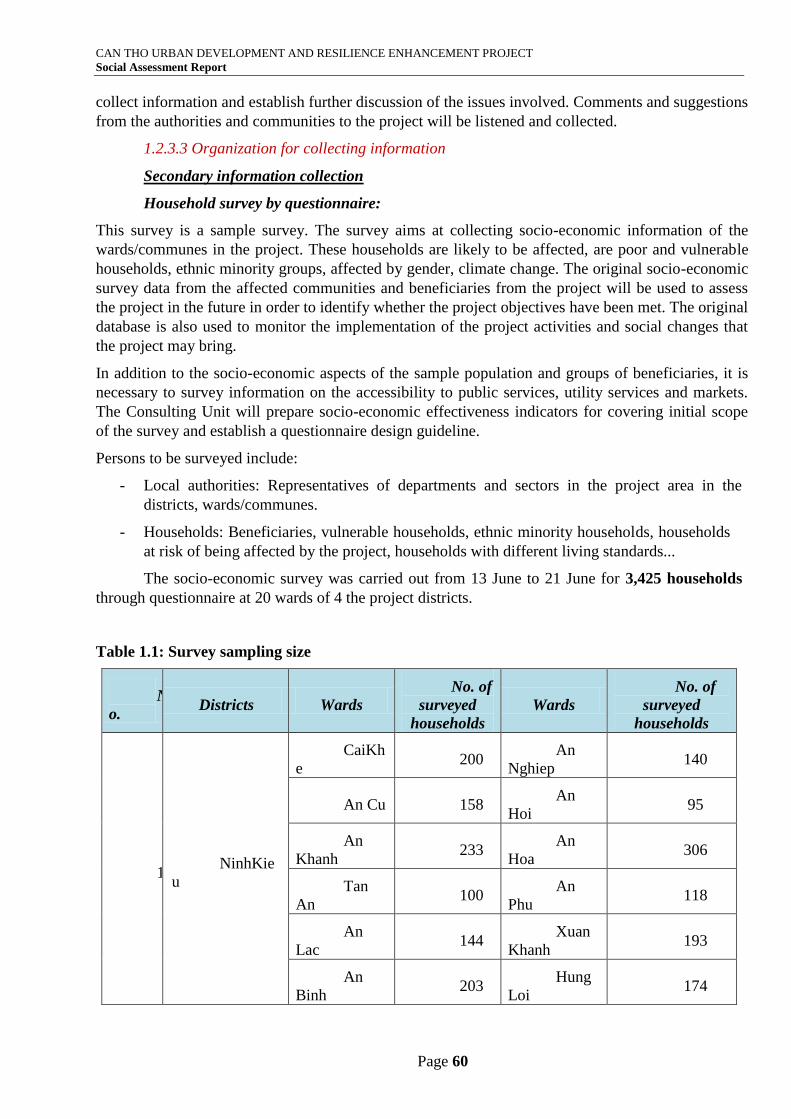
CAN THO URBAN DEVELOPMENT AND RESILIENCE ENHANCEMENT PROJECT
Social Assessment Report
Page 60
collect information and establish further discussion of the issues involved. Comments and suggestions
from the authorities and communities to the project will be listened and collected.
1.2.3.3 Organization for collecting information
Secondary information collection
Household survey by questionnaire:
This survey is a sample survey. The survey aims at collecting socio-economic information of the
wards/communes in the project. These households are likely to be affected, are poor and vulnerable
households, ethnic minority groups, affected by gender, climate change. The original socio-economic
survey data from the affected communities and beneficiaries from the project will be used to assess
the project in the future in order to identify whether the project objectives have been met. The original
database is also used to monitor the implementation of the project activities and social changes that
the project may bring.
In addition to the socio-economic aspects of the sample population and groups of beneficiaries, it is
necessary to survey information on the accessibility to public services, utility services and markets.
The Consulting Unit will prepare socio-economic effectiveness indicators for covering initial scope
of the survey and establish a questionnaire design guideline.
Persons to be surveyed include:
- Local authorities: Representatives of departments and sectors in the project area in the
districts, wards/communes.
- Households: Beneficiaries, vulnerable households, ethnic minority households, households
at risk of being affected by the project, households with different living standards...
The socio-economic survey was carried out from 13 June to 21 June for 3,425 households
through questionnaire at 20 wards of 4 the project districts.
Table 1.1: Survey sampling size
N
o. Districts Wards
No. of
surveyed
households
Wards
No. of
surveyed
households
1 NinhKie
u
CaiKh
e 200
An
Nghiep 140
An Cu 158 An
Hoi 95
An
Khanh 233
An
Hoa 306
Tan
An 100
An
Phu 118
An
Lac 144
Xuan
Khanh 193
An
Binh 203
Hung
Loi 174
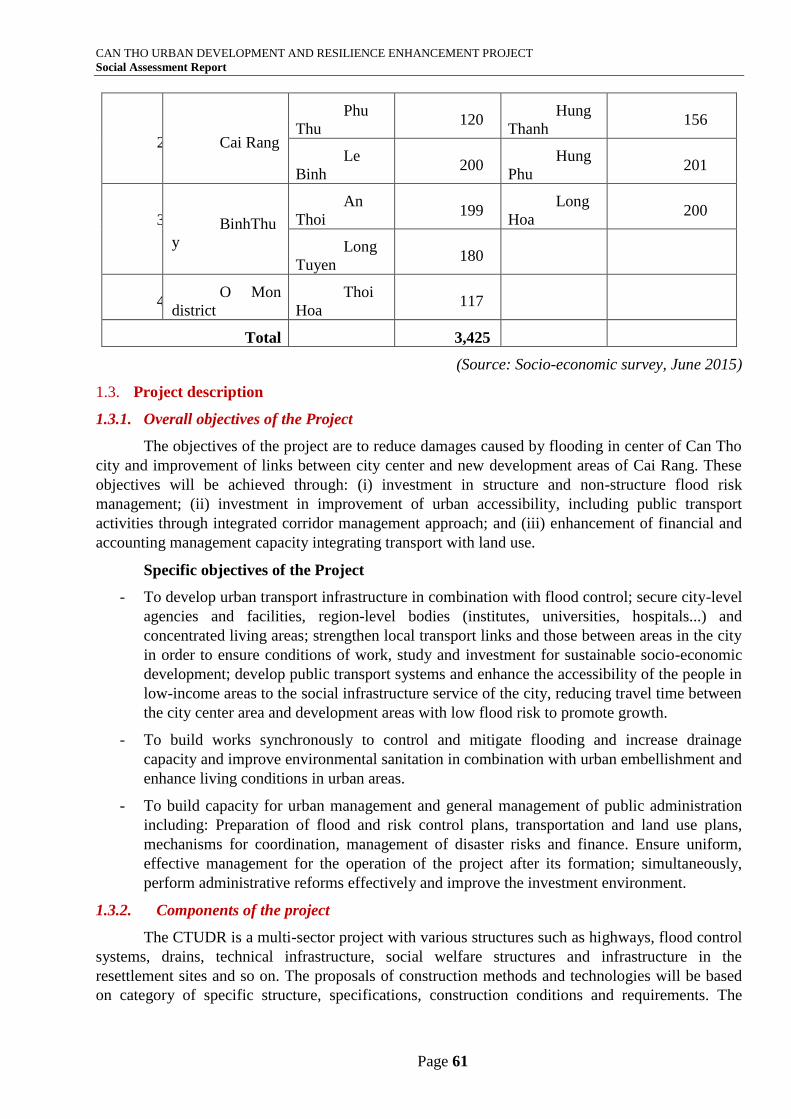
CAN THO URBAN DEVELOPMENT AND RESILIENCE ENHANCEMENT PROJECT
Social Assessment Report
Page 61
2 Cai Rang
Phu
Thu 120
Hung
Thanh 156
Le
Binh 200
Hung
Phu 201
3
BinhThu
y
An
Thoi 199
Long
Hoa 200
Long
Tuyen 180
4 O Mon
district
Thoi
Hoa 117
Total 3,425
(Source: Socio-economic survey, June 2015)
1.3. Project description
1.3.1. Overall objectives of the Project
The objectives of the project are to reduce damages caused by flooding in center of Can Tho
city and improvement of links between city center and new development areas of Cai Rang. These
objectives will be achieved through: (i) investment in structure and non-structure flood risk
management; (ii) investment in improvement of urban accessibility, including public transport
activities through integrated corridor management approach; and (iii) enhancement of financial and
accounting management capacity integrating transport with land use.
Specific objectives of the Project
- To develop urban transport infrastructure in combination with flood control; secure city-level
agencies and facilities, region-level bodies (institutes, universities, hospitals...) and
concentrated living areas; strengthen local transport links and those between areas in the city
in order to ensure conditions of work, study and investment for sustainable socio-economic
development; develop public transport systems and enhance the accessibility of the people in
low-income areas to the social infrastructure service of the city, reducing travel time between
the city center area and development areas with low flood risk to promote growth.
- To build works synchronously to control and mitigate flooding and increase drainage
capacity and improve environmental sanitation in combination with urban embellishment and
enhance living conditions in urban areas.
- To build capacity for urban management and general management of public administration
including: Preparation of flood and risk control plans, transportation and land use plans,
mechanisms for coordination, management of disaster risks and finance. Ensure uniform,
effective management for the operation of the project after its formation; simultaneously,
perform administrative reforms effectively and improve the investment environment.
1.3.2. Components of the project
The CTUDR is a multi-sector project with various structures such as highways, flood control
systems, drains, technical infrastructure, social welfare structures and infrastructure in the
resettlement sites and so on. The proposals of construction methods and technologies will be based
on category of specific structure, specifications, construction conditions and requirements. The
CAN THO URBAN DEVELOPMENT AND RESILIENCE ENHANCEMENT PROJECT
Social Assessment Report
Page 62
designing and construction organization shall comply with the applicable Vietnamese standards,
regulations and codes of construction.
Based on the current situation, objectives and principles of project development, and
beneficiaries, the proposed components of the project include:
Component 1 – Flooding control and environmental sanitation
Component 1.1: Flood control system
- Embankment for Can Tho river (section from Ngo DucKe road to Cai Son creek) with a
length of about 5.5km;
- Relocation for households occupying and suffering pollution from Can Tho river, upgrading
and rehabilitation of road behind embankment;
- Construction of valves/tide drains (with or without locks), drainage pumping system (if
necessary) for the center area;
- Rehabilitation of the main canals/ditches in the center area, dredging, upgrading and
improvement of protective embankment, road, relocation of households occupying
canals/ditches, supplement of reservoirs for rapid water regulation, anti-flooding in
BinhThuy district, supplement of synchronous connection of canals, creeks, lake for 2 urban
upgrading projects which was implemented with new systems;
- Anti-landslide embankment for O Mon River, renovation of the Ranh ditch and irrigation
canal in Cai Rang district on the basis of urgency for travel safety of the people and
improvement of environmental sanitation.
Component 1.2: Environmental sanitation
- Rehabilitation and synchronous supplement of the drainage system connecting the collection
system in NinhKieu center area (length of about 11 km) and about 10km in the remaining
areas;
- Construction of sludge treatment zone in Cai Rang district with a capacity of 150 m3/day-
night to treat residual sludge from the wastewater treatment system and sludge dredged from
the culverts;
- Equipment serving the works and equipment supporting the management and operation,
regulating and monitoring of the drainage system, dredging of culverts, ditches, pumping
stations, lakes and control valves.
Component 2 - Urban corridor development
- QuangTrung bridge (2nd
Unit): Construction of QuangTrung bridge (2nd
unit) from
NinhKieu to Cai Rang with a total length of about 869m, the bridge is 481m long, 11m wide
- Tran Hoang Na road and bridge: Total length of route of about 3.794km, of which
Road: Improving and upgrading of road in length of about 1.6km, with 20m and 28m
lines; Newly building of 1.6km length, 20m and 28m lines;
Bridge: Length of about 549m, width of about 21m crossing Can ThoRiver.
In addition, further investment in the parallel road in National Highway 1A (section
from Tran Hoang Na to the intersection IC3) in length of about 1.6km and 12m line.
CAN THO URBAN DEVELOPMENT AND RESILIENCE ENHANCEMENT PROJECT
Social Assessment Report
Page 63
- The August Revolution Road (National Highway 91) and provincial road DT918: with a
total of 5.3 km, building line of 40m
- Construction of a resettlement area: In NinhKieu district covering an area of about 40
hectares, ensuring appropriate planning of technical and social infrastructure and facilitate
living conditions for local people
- Work associated equipment serving project’s operation and management, including: (i)
Establishment of GIS centers; (ii) Street devices, bus-stop facilities
1.3.3 Component 3 - Strengthening urban management for climate change resilience
- Management of disaster risks and climate change resilience;
- Transportation management and urban development;
- Financial plan of the city;
- Technology application in urban management.
CAN THO URBAN DEVELOPMENT AND RESILIENCE ENHANCEMENT PROJECT
Social Assessment Report
Page 64
CHAPTER II: SOCIOECONOMIC CHARACTERISTICS
2.1. Overview of Can Tho city
2.1.1. Natural and Socio-economic Conditions
Can Tho City is located in the center of the Mekong river delta region, stretching over 55km
along the Western bank of the Hauriver, a total natural area of 1,401.61 km2, accounting for 3.49% of
the entire area. Can Thocity has no natural forest and 75 km from the Eastern Sea. The distance to
other municipalities in the region are as follows: 60km away from Long Xuyen, 116km away from
Rach Gia, 179km away from Ca Mau and 169km away from Ho Chi Minh city.
Geographical coordinates:105013’38” to 105
050’35” East longitude; 09
055’08” to 10
019’38”
northern latitude with 4 following adjacent regions:
- Its West borders An Giang province.
- Its South borders HauGiang province.
- Its Southwest borders KienGiang province.
- Its East borders Vinh Long and Dong Thap.
Topographical characteristics
Can Tho City lies in the alluvial land deposited from the Mekong River for many millennia
and now continue to be deposited regularly over alluvial water source of the HauRiver.
The average altitude is about 1.00 – 2.00m sloped from the cultivation land along the Hau
river, Can Tho river, lower toward the infield (from Northeast to Southwest). Due to being located
near the big river, Can Tho city has a thick network of rivers, canals and ditches. Besides, the city
also has the dunes and islands on the HauRiver as Au dune, Khuong dune, Son dune and Tan Lap
Island.
Socio-economic conditions
Total gross domestic product in the locality (GDP- comparative price in 2010) is estimated at
69,514.7 billion dong, an increase of 12.05% compared with 20131, which meets the plan as set forth.
The economic structure continues to shift in the right direction of increasing the density of Zones II
and III, accounting for 92.73 %; gradually reducing the density of Zone I, accounting for 7.27% in
the economic structure of the city, especially the quality is improved when all three areas grow
compared to the same period2.
Thanks to sustaining of economic growth rate, incomes have been increased and living standards of
the people have been improved. Per capita GDP is estimated at 70.2 million dong, an increase of 7.1
million dong compared with 20133, which meets the plan as set forth. It is equivalent to US.$ 3,298,
an increase of US.$ 294 compared with 2013.
Industry and construction
The city focused on directing to address difficulties in production and implementation of
development supporting measures and timely solve suggestions and proposals for businesses, particularly
the exporting businesses, contributing to enhancing competitiveness and promoting production
1The Plan 2014 has an increase of 12-12.5%, implementation result of 2013 had an increase of 11.32%);
2Zone I has an increase of 0.95%; Zone II has an increase of 10.51%,Zone III has an increase of 14.85%. In the GDP structure, Zone I
accounts for 7.27%, Zone II accounts for 35.79% and Zone III accounts for 56.94%.
3 Per capita GDP (current price) reaches 70-70.5 million dong, equivalent to US.$ 3,280 – 3,330;
CAN THO URBAN DEVELOPMENT AND RESILIENCE ENHANCEMENT PROJECT
Social Assessment Report
Page 65
appropriately under the current situation. The results of industrial production continued to develop in a
positive direction, the index of industrial production is estimated to increase by 8.4% compared to 20134.
The industrial parks attracted 05 projects with a total registered investment capital of US.$ 48 million. Up
to now, the industrial parks have 214 projects in force5, employ 567.19 ha of industrial land with a total
registered investment capital of US.$ 1,919 million, implementation vapital of US. $ 852.4 million,
accounting for 44.4% of total registered investment capital. A total of 31,716 employees working at the
industrial parks, a reduction of 803 employees.
Agriculture – Forestry and Aquaculture
Continue to develop for expanding the large field model, strengthen the use of special rice
varieties, improving quality and value; forming the link from production to consumption, and improve
efficiency and stability of production. The situation of rice production all year is good. Area of sown rice
all year is 232,335 ha6, exceeding the target by 6.7%, accounting for 98.2% over the previous year. The
yield of year is estimated at 1,423 million tons7, exceeding the target by 13%, an increase of 3.9% over
the previous year. Closely monitoring the cattle-breedingcarries out the regular and periodical vaccination,
control epidemic for cattle and poultry. The survey results showed that there has no epidemic in the
locality. Develop the aquaculture according to the food hygiene and safety standards such as Global GAP,
VietGAP, etc. to increase value of goods. It is estimated that area of aquaculture all year is 13,190 ha,
exceeding the target by 1.5%, an increase of 2.5% over the previous year. Total output of seafood from
breeding is estimated at 193,316 tons, exceeding the target by 4.5%, an increase of 6.7% over the previous
year8.
Trading – Services
Domestic trade activity continued vibrant, besides the appropriate solutions and policies of the
Government, the city celebrated many activities to support businesses to promote trade, connect supply
and demand between producers - distributors, exhibitions, the program “bring Vietnamese products to
suburbs”, etc. in combination with the forms of promotion, attractive marketing of businesses,
supermarkets and utility stores, encouraging consumption and increasing purchasing power in end months
of year, promoting production, market development so that Can Tho city becomes a trading center of the
Mekong delta region.
Population – Labor
Currently, the city is mobilizing sources to complete the technical and social infrastructure to
ensure the city’s development in prevailing and in the future to deserve being one of five cities
directly under the Central government.
Up to 2010, Can Tho city has a total of 09 administrative units, including 5 urban districts of
NinhKieu, O Mon, BinhThuy, Cai Rang and Thot Not and 04 rural districts including Vinh Thanh,
Co Do, PhongDien and Thoi Lai. Scale, area and population of these districts are shown in the table
bellowed:
4 The processing industry has an increase of 9.13%, production and distribution of power energy has an increase of 75.88%; water
supply, waste management and treatment increase 14.59%. 5 There are 192 on progress, 16 projects under the construction and 06 outstanding projects. 6Of which, area of sowing Winter-Spring rice is 88,007,9 ha, exceeding the target by 0.2%, area of sowing Summer-Autumn rice is
81,088.5 ha, exceeding the target by 1.4%; area of sowing Autumn-Winter rice is 63,238.6 ha, exceeding the target by 26.5%. 7Of which, the output of Winter-Spring rice is 646,129 tons, exceeding the target by 1.4%; output of Summer-Autumn rice is 455,460
tons, exceeding the target by 10.5%, output of Autumn-Winter rice is 322,010 tons, exceeding the target by 52.8%.
8 Of which, area of breeding Pangasius catfish is 842 ha, reaching 99.1%, equivalent to 98.4% compared with the previous
year. The output is 150,444 tons, exceeding the target by 0.3%, an increase of 5.9% over the pervious year.
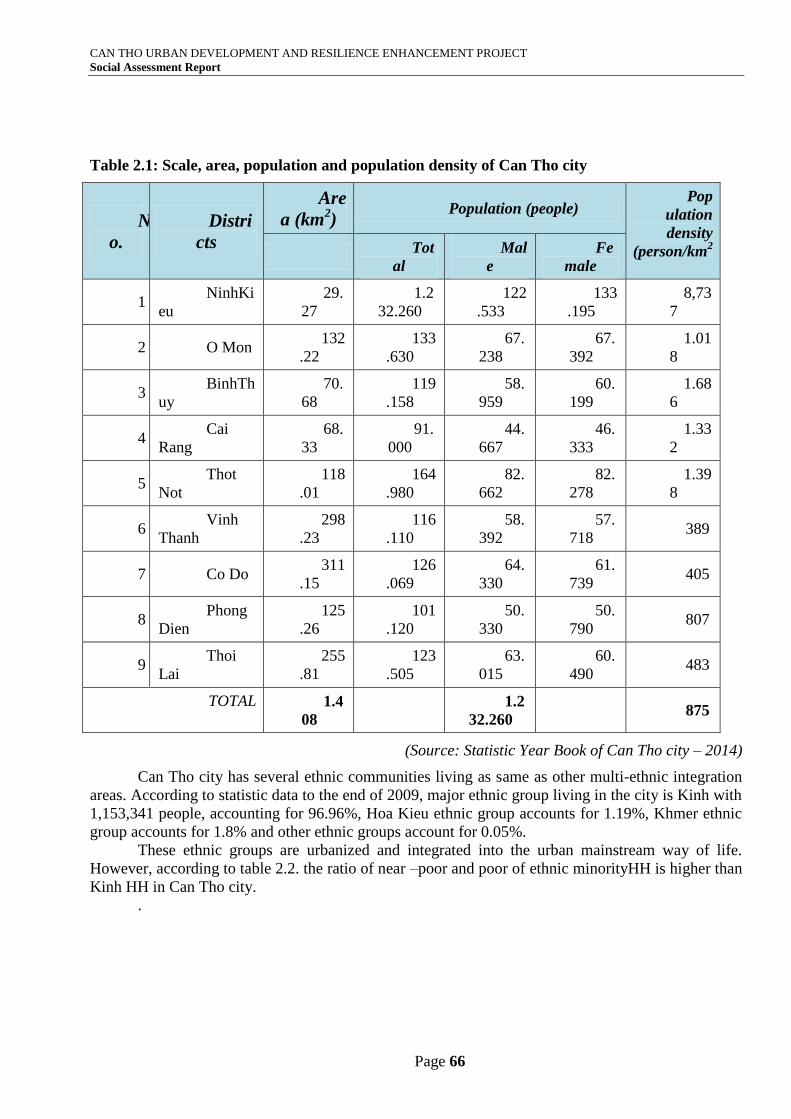
CAN THO URBAN DEVELOPMENT AND RESILIENCE ENHANCEMENT PROJECT
Social Assessment Report
Page 66
Table 2.1: Scale, area, population and population density of Can Tho city
N
o.
Distri
cts
Are
a (km2)
Population (people) Pop
ulation
density
(person/km2
Tot
al
Mal
e
Fe
male
1 NinhKi
eu
29.
27
1.2
32.260
122
.533
133
.195
8,73
7
2 O Mon 132
.22
133
.630
67.
238
67.
392
1.01
8
3 BinhTh
uy
70.
68
119
.158
58.
959
60.
199
1.68
6
4 Cai
Rang
68.
33
91.
000
44.
667
46.
333
1.33
2
5 Thot
Not
118
.01
164
.980
82.
662
82.
278
1.39
8
6 Vinh
Thanh
298
.23
116
.110
58.
392
57.
718 389
7 Co Do 311
.15
126
.069
64.
330
61.
739 405
8 Phong
Dien
125
.26
101
.120
50.
330
50.
790 807
9 Thoi
Lai
255
.81
123
.505
63.
015
60.
490 483
TOTAL 1.4
08
1.2
32.260 875
(Source: Statistic Year Book of Can Tho city – 2014)
Can Tho city has several ethnic communities living as same as other multi-ethnic integration
areas. According to statistic data to the end of 2009, major ethnic group living in the city is Kinh with
1,153,341 people, accounting for 96.96%, Hoa Kieu ethnic group accounts for 1.19%, Khmer ethnic
group accounts for 1.8% and other ethnic groups account for 0.05%.
These ethnic groups are urbanized and integrated into the urban mainstream way of life.
However, according to table 2.2. the ratio of near –poor and poor of ethnic minorityHH is higher than
Kinh HH in Can Tho city.
.
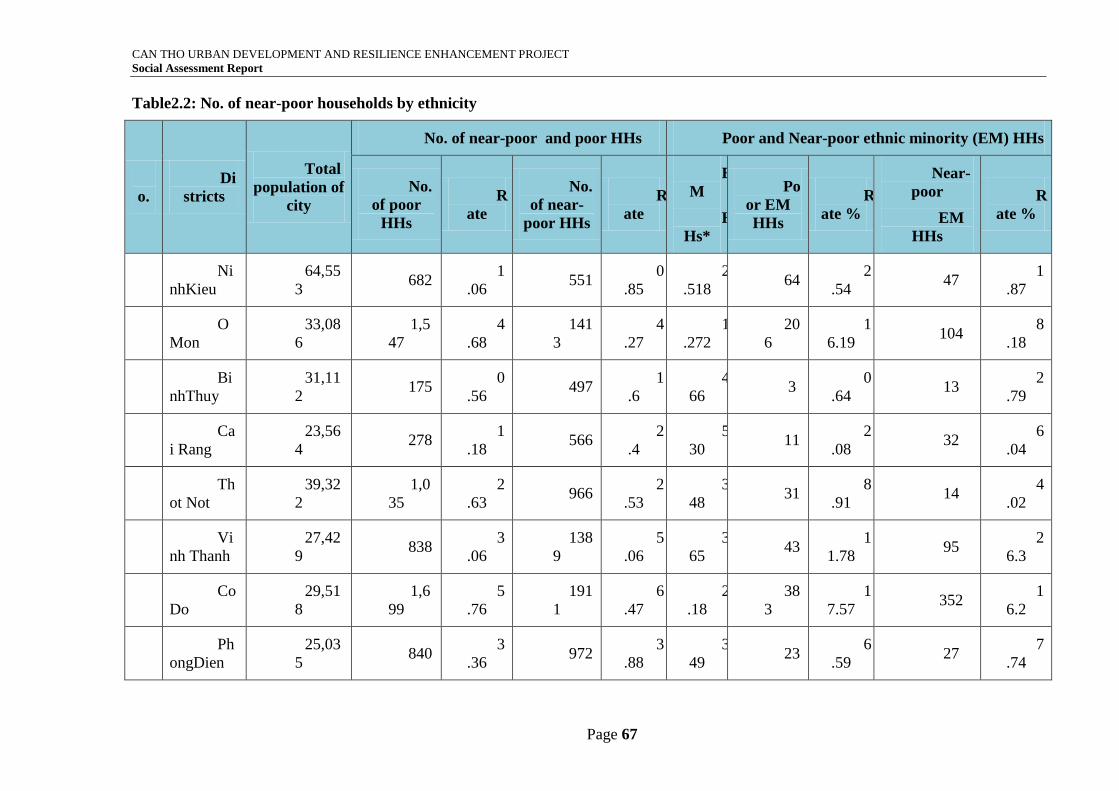
CAN THO URBAN DEVELOPMENT AND RESILIENCE ENHANCEMENT PROJECT
Social Assessment Report
Page 67
Table2.2: No. of near-poor households by ethnicity
N
o.
Di
stricts
Total
population of
city
No. of near-poor and poor HHs Poor and Near-poor ethnic minority (EM) HHs
No.
of poor
HHs
R
ate
No.
of near-
poor HHs
R
ate
E
M
H
Hs*
Po
or EM
HHs
R
ate %
Near-
poor
EM
HHs
R
ate %
1 Ni
nhKieu
64,55
3 682
1
.06 551
0
.85
2
.518 64
2
.54 47
1
.87
2 O
Mon
33,08
6
1,5
47
4
.68
141
3
4
.27
1
.272
20
6
1
6.19 104
8
.18
3 Bi
nhThuy
31,11
2 175
0
.56 497
1
.6
4
66 3
0
.64 13
2
.79
4 Ca
i Rang
23,56
4 278
1
.18 566
2
.4
5
30 11
2
.08 32
6
.04
5 Th
ot Not
39,32
2
1,0
35
2
.63 966
2
.53
3
48 31
8
.91 14
4
.02
6 Vi
nh Thanh
27,42
9 838
3
.06
138
9
5
.06
3
65 43
1
1.78 95
2
6.3
7 Co
Do
29,51
8
1,6
99
5
.76
191
1
6
.47
2
.18
38
3
1
7.57 352
1
6.2
8 Ph
ongDien
25,03
5 840
3
.36 972
3
.88
3
49 23
6
.59 27
7
.74
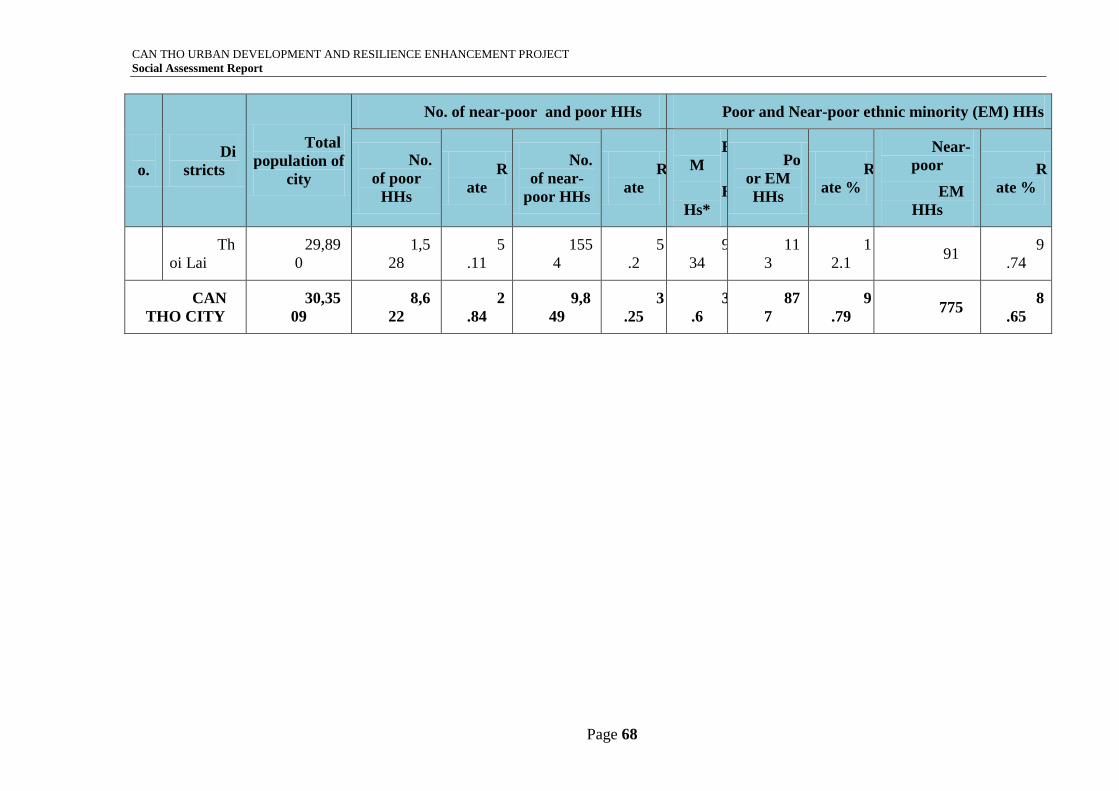
CAN THO URBAN DEVELOPMENT AND RESILIENCE ENHANCEMENT PROJECT
Social Assessment Report
Page 68
N
o.
Di
stricts
Total
population of
city
No. of near-poor and poor HHs Poor and Near-poor ethnic minority (EM) HHs
No.
of poor
HHs
R
ate
No.
of near-
poor HHs
R
ate
E
M
H
Hs*
Po
or EM
HHs
R
ate %
Near-
poor
EM
HHs
R
ate %
9 Th
oi Lai
29,89
0
1,5
28
5
.11
155
4
5
.2
9
34
11
3
1
2.1 91
9
.74
CAN
THO CITY
30,35
09
8,6
22
2
.84
9,8
49
3
.25
3
.6
87
7
9
.79 775
8
.65
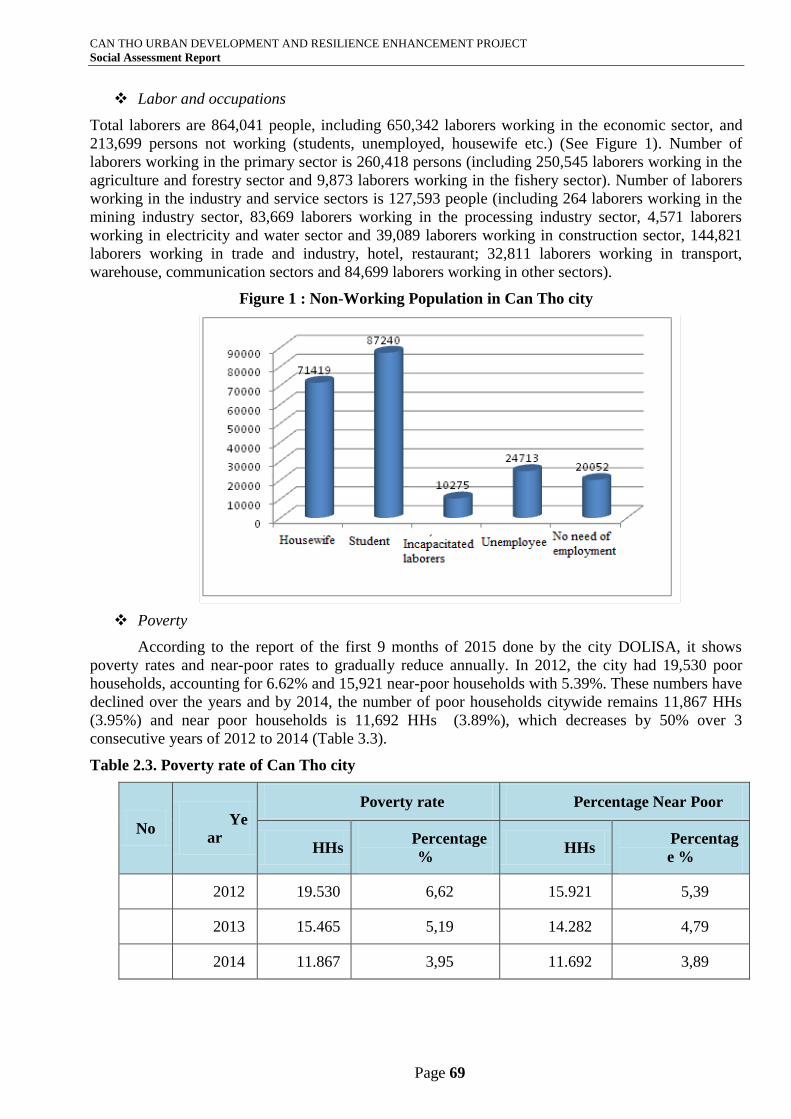
CAN THO URBAN DEVELOPMENT AND RESILIENCE ENHANCEMENT PROJECT
Social Assessment Report
Page 69
Labor and occupations
Total laborers are 864,041 people, including 650,342 laborers working in the economic sector, and
213,699 persons not working (students, unemployed, housewife etc.) (See Figure 1). Number of
laborers working in the primary sector is 260,418 persons (including 250,545 laborers working in the
agriculture and forestry sector and 9,873 laborers working in the fishery sector). Number of laborers
working in the industry and service sectors is 127,593 people (including 264 laborers working in the
mining industry sector, 83,669 laborers working in the processing industry sector, 4,571 laborers
working in electricity and water sector and 39,089 laborers working in construction sector, 144,821
laborers working in trade and industry, hotel, restaurant; 32,811 laborers working in transport,
warehouse, communication sectors and 84,699 laborers working in other sectors).
Figure 1 : Non-Working Population in Can Tho city
Poverty
According to the report of the first 9 months of 2015 done by the city DOLISA, it shows
poverty rates and near-poor rates to gradually reduce annually. In 2012, the city had 19,530 poor
households, accounting for 6.62% and 15,921 near-poor households with 5.39%. These numbers have
declined over the years and by 2014, the number of poor households citywide remains 11,867 HHs
(3.95%) and near poor households is 11,692 HHs (3.89%), which decreases by 50% over 3
consecutive years of 2012 to 2014 (Table 3.3).
Table 2.3. Poverty rate of Can Tho city
No Ye
ar
Poverty rate Percentage Near Poor
HHs Percentage
% HHs
Percentag
e %
1 2012 19.530 6,62 15.921 5,39
2 2013 15.465 5,19 14.282 4,79
3 2014 11.867 3,95 11.692 3,89
0
10000
20000
30000
40000
50000
60000
70000
80000
90000
Nội trợ Học sinh Mất sức lao
động
Thất nghiệp Không có
nhu cầu làm
việc
71419
87240
10275
2471320052
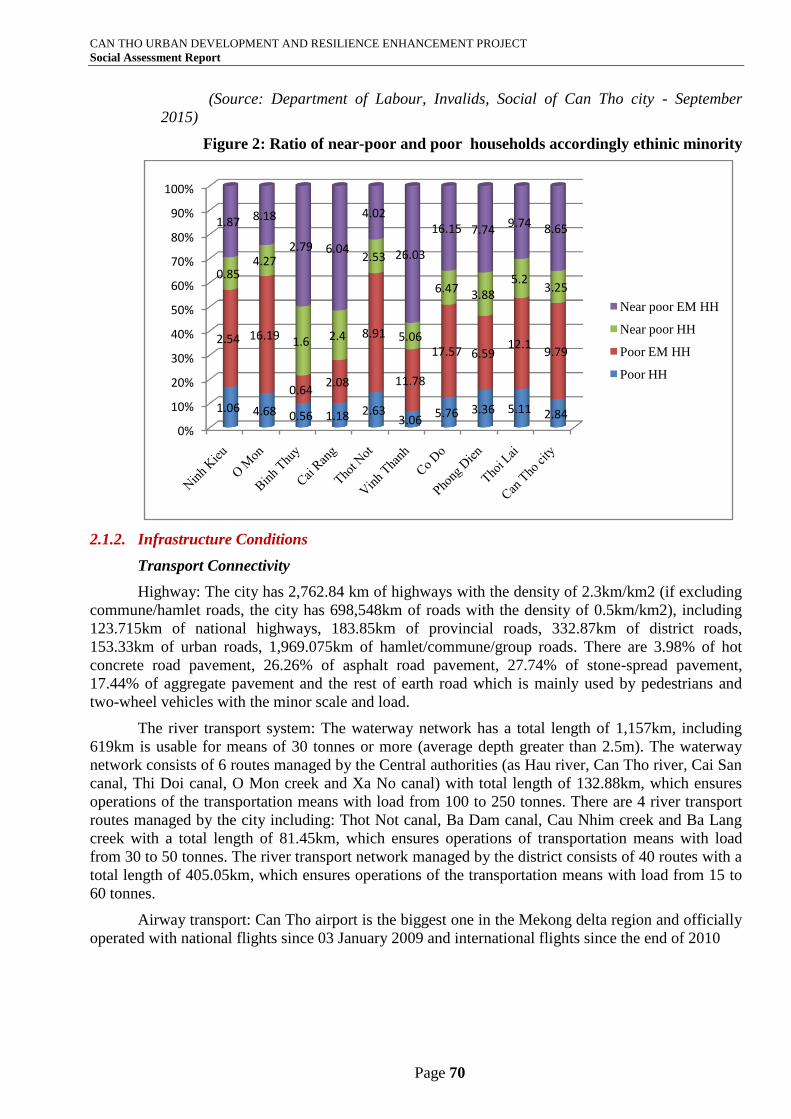
CAN THO URBAN DEVELOPMENT AND RESILIENCE ENHANCEMENT PROJECT
Social Assessment Report
Page 70
(Source: Department of Labour, Invalids, Social of Can Tho city - September
2015)
Figure 2: Ratio of near-poor and poor households accordingly ethinic minority
2.1.2. Infrastructure Conditions
Transport Connectivity
Highway: The city has 2,762.84 km of highways with the density of 2.3km/km2 (if excluding
commune/hamlet roads, the city has 698,548km of roads with the density of 0.5km/km2), including
123.715km of national highways, 183.85km of provincial roads, 332.87km of district roads,
153.33km of urban roads, 1,969.075km of hamlet/commune/group roads. There are 3.98% of hot
concrete road pavement, 26.26% of asphalt road pavement, 27.74% of stone-spread pavement,
17.44% of aggregate pavement and the rest of earth road which is mainly used by pedestrians and
two-wheel vehicles with the minor scale and load.
The river transport system: The waterway network has a total length of 1,157km, including
619km is usable for means of 30 tonnes or more (average depth greater than 2.5m). The waterway
network consists of 6 routes managed by the Central authorities (as Hau river, Can Tho river, Cai San
canal, Thi Doi canal, O Mon creek and Xa No canal) with total length of 132.88km, which ensures
operations of the transportation means with load from 100 to 250 tonnes. There are 4 river transport
routes managed by the city including: Thot Not canal, Ba Dam canal, Cau Nhim creek and Ba Lang
creek with a total length of 81.45km, which ensures operations of transportation means with load
from 30 to 50 tonnes. The river transport network managed by the district consists of 40 routes with a
total length of 405.05km, which ensures operations of the transportation means with load from 15 to
60 tonnes.
Airway transport: Can Tho airport is the biggest one in the Mekong delta region and officially
operated with national flights since 03 January 2009 and international flights since the end of 2010
0%
10%
20%
30%
40%
50%
60%
70%
80%
90%
100%
1.06 4.68 0.56 1.18 2.633.06
5.76 3.36 5.11 2.84
2.54 16.19
0.642.08
8.91
11.78
17.57 6.5912.1
9.79
0.854.27
1.6 2.4
2.53
5.06
6.47 3.885.2
3.25
1.87 8.18
2.79 6.04
4.02
26.03
16.15 7.749.74 8.65
Near poor EM HH
Near poor HH
Poor EM HH
Poor HH
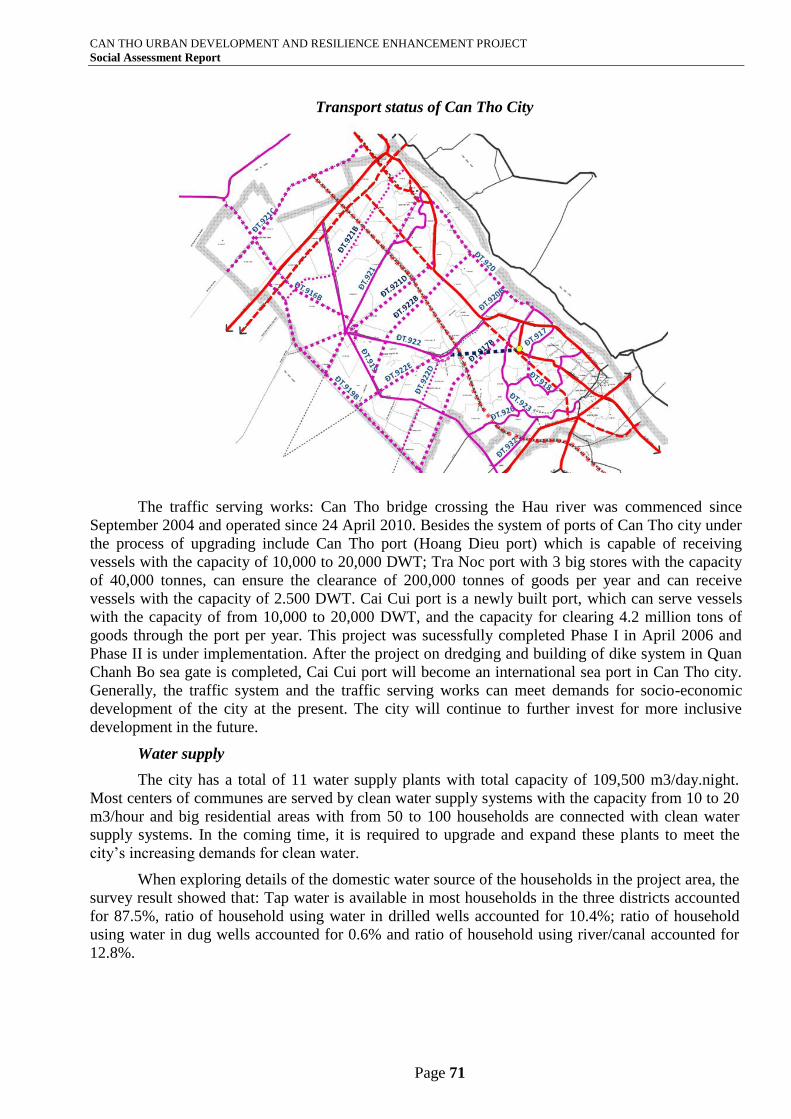
CAN THO URBAN DEVELOPMENT AND RESILIENCE ENHANCEMENT PROJECT
Social Assessment Report
Page 71
Transport status of Can Tho City
The traffic serving works: Can Tho bridge crossing the Hau river was commenced since
September 2004 and operated since 24 April 2010. Besides the system of ports of Can Tho city under
the process of upgrading include Can Tho port (Hoang Dieu port) which is capable of receiving
vessels with the capacity of 10,000 to 20,000 DWT; Tra Noc port with 3 big stores with the capacity
of 40,000 tonnes, can ensure the clearance of 200,000 tonnes of goods per year and can receive
vessels with the capacity of 2.500 DWT. Cai Cui port is a newly built port, which can serve vessels
with the capacity of from 10,000 to 20,000 DWT, and the capacity for clearing 4.2 million tons of
goods through the port per year. This project was sucessfully completed Phase I in April 2006 and
Phase II is under implementation. After the project on dredging and building of dike system in Quan
Chanh Bo sea gate is completed, Cai Cui port will become an international sea port in Can Tho city.
Generally, the traffic system and the traffic serving works can meet demands for socio-economic
development of the city at the present. The city will continue to further invest for more inclusive
development in the future.
Water supply
The city has a total of 11 water supply plants with total capacity of 109,500 m3/day.night.
Most centers of communes are served by clean water supply systems with the capacity from 10 to 20
m3/hour and big residential areas with from 50 to 100 households are connected with clean water
supply systems. In the coming time, it is required to upgrade and expand these plants to meet the
city’s increasing demands for clean water.
When exploring details of the domestic water source of the households in the project area, the
survey result showed that: Tap water is available in most households in the three districts accounted
for 87.5%, ratio of household using water in drilled wells accounted for 10.4%; ratio of household
using water in dug wells accounted for 0.6% and ratio of household using river/canal accounted for
12.8%.
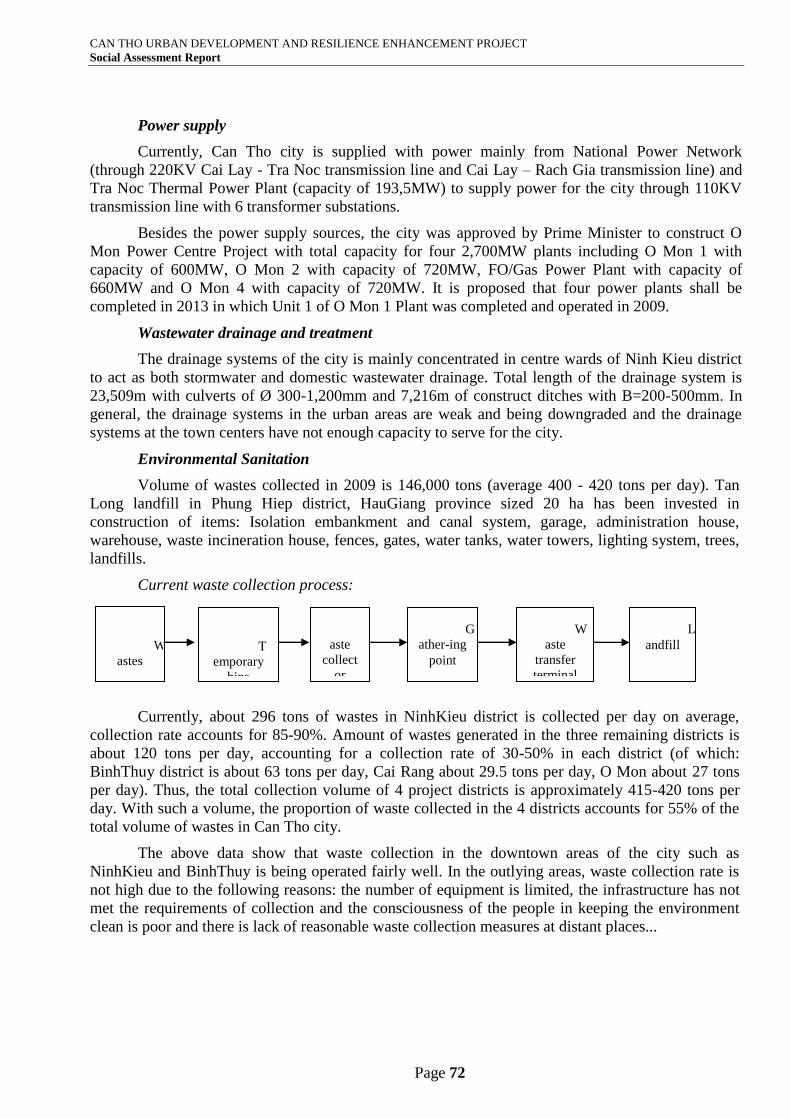
CAN THO URBAN DEVELOPMENT AND RESILIENCE ENHANCEMENT PROJECT
Social Assessment Report
Page 72
Power supply
Currently, Can Tho city is supplied with power mainly from National Power Network
(through 220KV Cai Lay - Tra Noc transmission line and Cai Lay – Rach Gia transmission line) and
Tra Noc Thermal Power Plant (capacity of 193,5MW) to supply power for the city through 110KV
transmission line with 6 transformer substations.
Besides the power supply sources, the city was approved by Prime Minister to construct O
Mon Power Centre Project with total capacity for four 2,700MW plants including O Mon 1 with
capacity of 600MW, O Mon 2 with capacity of 720MW, FO/Gas Power Plant with capacity of
660MW and O Mon 4 with capacity of 720MW. It is proposed that four power plants shall be
completed in 2013 in which Unit 1 of O Mon 1 Plant was completed and operated in 2009.
Wastewater drainage and treatment
The drainage systems of the city is mainly concentrated in centre wards of Ninh Kieu district
to act as both stormwater and domestic wastewater drainage. Total length of the drainage system is
23,509m with culverts of Ø 300-1,200mm and 7,216m of construct ditches with B=200-500mm. In
general, the drainage systems in the urban areas are weak and being downgraded and the drainage
systems at the town centers have not enough capacity to serve for the city.
Environmental Sanitation
Volume of wastes collected in 2009 is 146,000 tons (average 400 - 420 tons per day). Tan
Long landfill in Phung Hiep district, HauGiang province sized 20 ha has been invested in
construction of items: Isolation embankment and canal system, garage, administration house,
warehouse, waste incineration house, fences, gates, water tanks, water towers, lighting system, trees,
landfills.
Current waste collection process:
Currently, about 296 tons of wastes in NinhKieu district is collected per day on average,
collection rate accounts for 85-90%. Amount of wastes generated in the three remaining districts is
about 120 tons per day, accounting for a collection rate of 30-50% in each district (of which:
BinhThuy district is about 63 tons per day, Cai Rang about 29.5 tons per day, O Mon about 27 tons
per day). Thus, the total collection volume of 4 project districts is approximately 415-420 tons per
day. With such a volume, the proportion of waste collected in the 4 districts accounts for 55% of the
total volume of wastes in Can Tho city.
The above data show that waste collection in the downtown areas of the city such as
NinhKieu and BinhThuy is being operated fairly well. In the outlying areas, waste collection rate is
not high due to the following reasons: the number of equipment is limited, the infrastructure has not
met the requirements of collection and the consciousness of the people in keeping the environment
clean is poor and there is lack of reasonable waste collection measures at distant places...
W
astes
T
emporary
bins
W
aste
collect
or
G
ather-ing
point
W
aste
transfer
terminal
L
andfill
CAN THO URBAN DEVELOPMENT AND RESILIENCE ENHANCEMENT PROJECT
Social Assessment Report
Page 73
2.1.3. Socio-economic development directions of Can Tho city in the period 2020 – 2030
2.1.3.1.Perspectives, Objectives and Development Solutions
Overall objectives are developing Can Tho city to become the modern and developedcity with
typical characteristics of the Mekong Deltaregion and basically become an industrialized city by
2020; become socio-economic, education and training, science and technology centre, health and
cultural and sports Centre of Mekong River Delta region; become the important traffic junction for
inter-regional transportation and international transportation; become the key city holding the
strategic position in terms of national defense and national security of Mekong River Delta region and
the country; become a development pole which plays motive role in promoting the strong
development of Mekong River Delta region9;
To achieve the objectives, the development perspectives of Can Tho city are as follows:
- Economic restructuring of city towards industrial - service - high-tech agriculture in the period
to 2020 and oriented service - industrial - high-tech agriculture in the period after 2020,
towards and create the potentials for development (critical infrastructure, key sectors and
products, technology and human resources). The structure of economic grows fast, ensures
stability, sustainability, justice, and social progress.
- Investment for economic growth in width and depth, mainly depth. Investment focuses on a
number of fields which the city has competitive advantages such as: services, tourism,
industry with high technological content; high quality agricultural products, seafood.
2.1.3.2.Development solutions of Industries/Sectors
Industry and construction
a, Industry
- Quickly formation and development of key industries, investing focus towards innovative
equipment, advanced and modern technology, create products which have the ability to create
highly competitive, large contributions on economic growth and sustainable high speed;
- Continue to focus on areas of comparative advantage, motivating development (industrial
processing of agricultural, forestry and fishery, food - beverages, biotechnology, chemical and
biochemical products, information technology (software, digital), energy industries and new
materials, engineering and machine building, industrial building and repair of ships)
investment towards intensive, high technology, clean technology;
- Prioritize the development of supporting industries, including production materials industries,
spare parts, accessories, semi-finished products for industry provides mechanical, electronics -
informatics, production automobile assembly, textiles - garments, leather - footwear and high-
tech industries;
- To accelerate the deployment plan and complete the construction of infrastructure, attract
investment in Hung Phu Industrial Zone I, II, Thot Not, North O Mon, O Mon. Adjustment of
industrial planning of Thot Not IP to fit Ho Chi Minh planning road. Planning and
implementing the focus information technology industry to research, develop, and product and
train human resources in the information technology industry (hardware, software). Plan the
high-tech incubators and hi-tech park construction. Planning industrial clusters facilitated the
9Reference to Decision No. 1533/QD-TTg of the Prime Minister dated 30 August 2013 on approving the master plan of
socio-economic development of Can Tho up to 2020 and vision to 2030.
CAN THO URBAN DEVELOPMENT AND RESILIENCE ENHANCEMENT PROJECT
Social Assessment Report
Page 74
development of rural industrialization and relocation of production facilities pollutants out of
residential areas and urban areas;
b, Construction
- Accelerate investment in urban areas, residential areas, urban resettlement, student houses and
houses for workers and low-income, etc. Construction and management of architectural
planning and urban management bright, clean, green, beautiful, civilized urban lifestyle
according to the criteria of grade I urban.
Services
a, The general development orientation of service areas
- Develop Can Tho city became the center of commerce and trade of the region. Focus on
development of traditional services, priority development of the service sector which has great
potential, with high added value, especially in the service sector has strengths and advantages
such as: Trade - Import exports, tourism, finance, banking, insurance, logistic, transport,
postal - telecommunications, business services, real estate development, stock exchanges,
public service science and technology;
- Promote international co-operation with major urban areas ASEAN, Asia - Pacific. Strengthen
the relationship between the Can Tho city with Ho Chi Minh City and the Mekong Delta
provinces to best exploit comparative advantages and development;
- Estimated total retail sales of goods and services increased on average from 20.5 to 21% / year
in the period 2011-2015, and about 19-20% / year 2016-2020
b, The development orientation of the service sector
- Trade: Modernizing the commercial infrastructure. Continued consolidation, investment and
development network wholesale and retail (supermarkets, wholesale markets, traditional
markets in districts and communes, wards and townships), create conditions that promote the
development of trade in the direction to increase the role of regional trade center;
- Tourism: Maximizing the potential and advantages of the city center, attracts powerful
resources and foreign investment in tourism development, making tourism a key economic
sector of the city, the tourist center of the Mekong Delta. Develop ecotourism such as gardens,
rivers. Construct PhongDien ecotourism urban. Continue to invest and early complete some
infrastructure, tourism, large-scale tourist areas, and synthesis amusement parks, building eco-
tourism Au Islet, Khuong Islet, Tan Loc. Opening of new tourist destinations, inter-regional
tours, international travel and tourism development along the waterway Mekong.
Agriculture, fishery and new rural development
Investing completed irrigation system along the river embankment to prevent twisting, sliding
and landscaping. Focus on investment embankment erosion control for Xom Chai, TraNienRiver, O
Mon River, TraNocRiver, Can Tho river embankments, Xa No canal, and dredging Thot Not canal.
a) General orientation of development
- Formation of sub-regional agricultural characteristics, including food production belt around
urban with high-tech applications, the specialty fruit combined with tourism, the intensive
high-quality rice area, the development of focused animal husbandry and aquaculture, the
seedlings produced for cities and provinces in the region.
- Coordinate with facilities for scientific research in the area, at the forefront of research - the
application of high-tech agriculture, contribute to the supply of products and services for high-
tech agricultural implement targeted provinces agricultural development in the Mekong Delta
and the country. Agricultural development associated with the construction of new rural and
CAN THO URBAN DEVELOPMENT AND RESILIENCE ENHANCEMENT PROJECT
Social Assessment Report
Page 75
process industrialization, urbanization, implement social justice, security, defense, social
stability and the rural environment.
b) Development orientation of sectors
- Cultivation: Increase the proportion of the value of effective industry such as high-quality rice
for export, safe vegetables, flowers, ornamental plants, fruits, industrial crops. Promote the
development of rice production, the first line of fruit varieties, vegetable seeds, and flower
varieties.
- Animal husbandry: Speeding up the development of the pig, cow, chicken manner focusing
scale (farm), put livestock out of the urban and rural population, reduce and increase the
number of farmers on each household size.
- Aquaculture: Maintaining high growth rates on the basis of various models of freshwater
aquaculture suitable with ecological conditions for key products: catfish, crayfish, fish copper.
- Development of high-tech agriculture: Estimated build 3 high-tech agricultural zones in the
agricultural seed center of the city in Thoi Thanh (Thoi Lai district), Song Hau Company and
Co Do Company. Construct agricultural station with hi-tech applications, they are satellites of
the high-tech agriculture in Vinh Thanh, Thot Not and PhongDien and implementation of
projects under the program for high-tech agriculture.
- New rural development: To promote the new rural construction, paying special attention to
the planning of new rural construction. Striving to achieve the rate of social new countryside
criteria is 30% in 2015, 70-80% by 2002.
-
2.1.4. Climate change situation in Can Tho
2.1.4.1.Information of extreme phenomena
Can Tho city is located in the downstream area of Mekong Delta and often suffers from adverse
impacts of natural disasters and faces with major risks such as: floods, landslides, saline intrusion,
storms, cyclones... Among these, riverbank erosion, floods caused by heavy rains and tides, cyclones
and thunders are natural disasters that impact the most on the lives, economy and property of the
people in Can Tho city. According to the Institute of Meteorology, Hydrology and Environment, over
the past 30 years, the average annual temperature in Can Tho has increased by 0.5 degrees Celsius
with the highest water level rise of about 50cm. Climate change actually made storms, floods and
droughts occur more in Can Tho.
2.1.4.2.Can Tho city Climate Change Office and On-going Projects
To cope with climate change, Can Tho city People's Committee has established a Steering
board for the implementation of climate change response under Decision No. 158 which was based
on Decision No. 2208/QĐ-UBND dated August 13, 2010. The Steering board included a chairman
who was a Vice president of the city and 16 members from the relevant departments and agencies of
the city. The Steering board is responsible for counseling the city People's Committee to effectively
implement relevant tasks under Decision No. 158/2008/QĐ-TTg dated December 2, 2008 of the
Prime Minister approving the National Target Program on response to climate change. Accordingly,
the Can Tho Climate change coordination office (CCCO) has been established under Decision No.
2746/QĐ-UBND dated December 06, 2010 as a specialized agency to support the Steering board
established under Decision No. 158.
Up to now, the Steering board has cooperated with organizations such as: ISET International
Vietnam, Challenge to change (CTC), Institute for Social Change and Environment (ISET),
Challenge to Change (CTC), National Institute for Science and Technology Policy and Strategy
CAN THO URBAN DEVELOPMENT AND RESILIENCE ENHANCEMENT PROJECT
Social Assessment Report
Page 76
Studies (NISTPASS), Dragon Institute of Can Tho University and the Southern Institute of Water
Resources Research (SIWRR)... to implement forecast models, evaluate the impacts of climate
change scenarios on Can Tho city and recommend implementing resilience measures . As a result,
many projects are implemented, contributing to loss mitigation and resilience to climate change.
Typically: Project to enhance resilience capacity to climate change of Can Tho city; Youth initiatives
and communication project; Project for construction of embankment at O Mon river to celebrate for
10 years of Can Tho central level city. Community-based climate change projects; flood prevention
project in An Binh ward; project to enhance resilience capacity of Can Tho city to saline intrusion
caused by climate change... have been implementing, helping raise the awareness about climate
change resilience of all strata of people.
The project "Response enhancement to climate change of Can Tho city" has been conducted
from 2010, including activities such as: providing clean water for the people in Son islet (BinhThuy
district), surveying for construction of the resettlement area in Bo Bao hamlet, Thanh An commune,
Vinh Thanh district;
The most outstanding projects, programs are those for helping the people's livelihood, socio-
economic development, contributing to the response to climate change that the city has been
performing for 10 the last years. The urban upgrading project in Can Tho City with a total investment
of 39 million USD has expanded and upgraded 62 alleys, renovated XangThoiLake and ThamTuong
canal.
Can Tho city has also approved of the plan for prevention of landslides at rivers/ditches in
Can Tho city by the Department of Agriculture and Rural Development with fund of 2,030 billion
dong. The plan includes key measures: improving the current situation, applying precautionary and
prevention measures to minimize the extent of damage caused by landslides from now on to 2015;
Farmers’ resilience contest to climate change: On 07 and 08 of April, 2012 at Bai Cat Park,
Can Tho city, a community media program called "Vietnamese farmers with climate change" took
place with the theme "Green agriculture- clean agricultural products". The program was joined by 18
teams as the representatives of the farmer's association of southern provinces (Ho Chi Minh City,
Southwest and Southeast).
This contest was a community-based activity combining multiple communication forms to
help the teams and the community understand more about the causes, impacts and solutions of
climate change resilience; especially the impact of climate change on agricultural production.
The program helped to raise awareness and promoted the interest of the people about the
environment, farming, negative climate change impacts... since farmers are the subject to be impacted
by climate change. In the framework of the contest, different forms of propaganda were expanded in
Can Tho city and vicinal areas.
2.1.4.3.On-going Climate Change –related Projects
Can Tho city strength analysis program
Urban Resilience to Climate Change Program was started by a World Bank group in
December 2013 to help cities improve resilience capacity to new situations, as well as fight against
and recover quickly from the effects related to climate change, natural disasters, significant changes
and other stressful situations. The program acts as patron for analyzing, providing the grounds and
causes as well as supporting the local authorities in establishing the content of climate change
resilience as part of the joint program on urban management.
Preparation of plan for flood risk management in Can Tho city project
According to the forecast, Can Tho city will be one of the provinces under great influences of
climate change and sea level rise. To cope with this risk, Can Tho city has cooperated with the World
CAN THO URBAN DEVELOPMENT AND RESILIENCE ENHANCEMENT PROJECT
Social Assessment Report
Page 77
Bank (WB) to study the project "Building a comprehensive resilience plan for integrated flood risk
management in Can Tho".
The specific assignment is to provide assessments on environment quality of each key area
monitored to serve the immediate needs of all State-managed levels on environmental protection;
provide timely warning of abnormal circumstances or the risks of pollution and environmental
degradation; establish database on environmental quality for the purpose of storage, supply and
exchange of information within the country.
Project of Climate change response capacity enhancement for poor Khmer people in Chau
Van Liem Ward - Can Tho City
Chau Van Liem ward in O Mon district is an area having many poor Khmer people. The
people living here (in the clusters supported by project 134) often face the risk of flooding by high
tides and have difficult living conditions: lack of power, lack of clean water and having unstable
incomes. Implementation of the project will address the matters of raising the awareness of the people
about the prevention of risks from natural disasters and the participation of the people in solving
flooding problems and changes in livelihood and income, solve poverty issues of the community.
Project of Climate change response capacity enhancement and free of poverty for Con Son
community, Bui HuuNghia ward, BinhThuy district, Can Tho city
Con Son in BinhThuy district is emerged in the middle of HauRiver - it is referred to as an
oasis. People living here often have to face the risk of flooding during flood season (they are
protected by the dykes around the islet). The area lacks power, clean water and production, and the
people's incomes are unstable. Implementation of the project will address the matters of raising the
awareness of the people about the prevention of risks from natural disasters and the participation of
the people in solving flooding problems and changes in livelihood and income, solve poverty issues
of the community.
Project of flood prevention capacity enhancement based on communities in BinhThuy
district.
BinhThuy is a central district of Can Tho city. The district has considerable changes but many
areas in the district face with "hot" issues concerning urban flooding and livelihoods of poor people
such as wards of An Hoa, Long Tuyen and ThoiAn Dong. Implementation of the project will address
the matters of raising the awareness of the people about climate change and the participation of the
people in solving urban flooding problems and changes in livelihood and income, solve poverty
issues of the community.
2.1.5. Linked Projects
In recent years, with the support of the Government, donors and international credit
institutions, Can Tho city has been implementing various programs and development projects for
Mekong Delta region in general Can Thocity in particular. These projects have been bringing
remarkable efficiency for socio-economic development, improvement of living conditions of people
as well as poverty reduction in the urban areas. In addition, to orientate the long-term and sustainable
development for Can Tho city, the Prime Minister issued Decision No. 366 on building and
development of Can Tho city in the period 2009-2015. The list of 66 works to be prioritized for
investment is estimated at about 79,820 billion dong. Some works under the investment include
Upgrading and expanding Can Tho international airport (Phase 1); Upgrading and expanding Can
Tho port complex; Upgrading National Highway 91; O Mon Electricity Center; Regional Vocational
Training College; High-tech health center; Mekong delta region sports center; University of
Technology; Mekong Delta Region Tourism Intermediate School; Mekong Delta Region Job
CAN THO URBAN DEVELOPMENT AND RESILIENCE ENHANCEMENT PROJECT
Social Assessment Report
Page 78
Introduction Center; Can ThoOrthosis and Rehabilitation Center and some other works. The Can Tho
Embankment Project using bond fund (section from CaiKhe to Ngo DucKe road and the left bank
side in Cai Rang district) and Upgrading National Highway 91 Project directly affect the CTUDR
project through transforming works under this Project into flood control corridor in the North and
East of the Can Tho city’s center area. The works under two above-mentioned projects have been
implemented with technical factors related to elevation, scope suitable with flooding control in center
of Can Tho city.
The linkage with the donor-funded projects with same targets of urban upgrading and
development, flood management, water source management, wastewater collection and treatment,
urban poverty reduction has been studied to ensure no overlap in investment among the projects. This
project will contribute to supplementing and coordinating with other projects to help Can Tho
citymaximize effectiveness of the project. Specifically, the linkage with the donor-funded projects is
shown in the table bellowed:
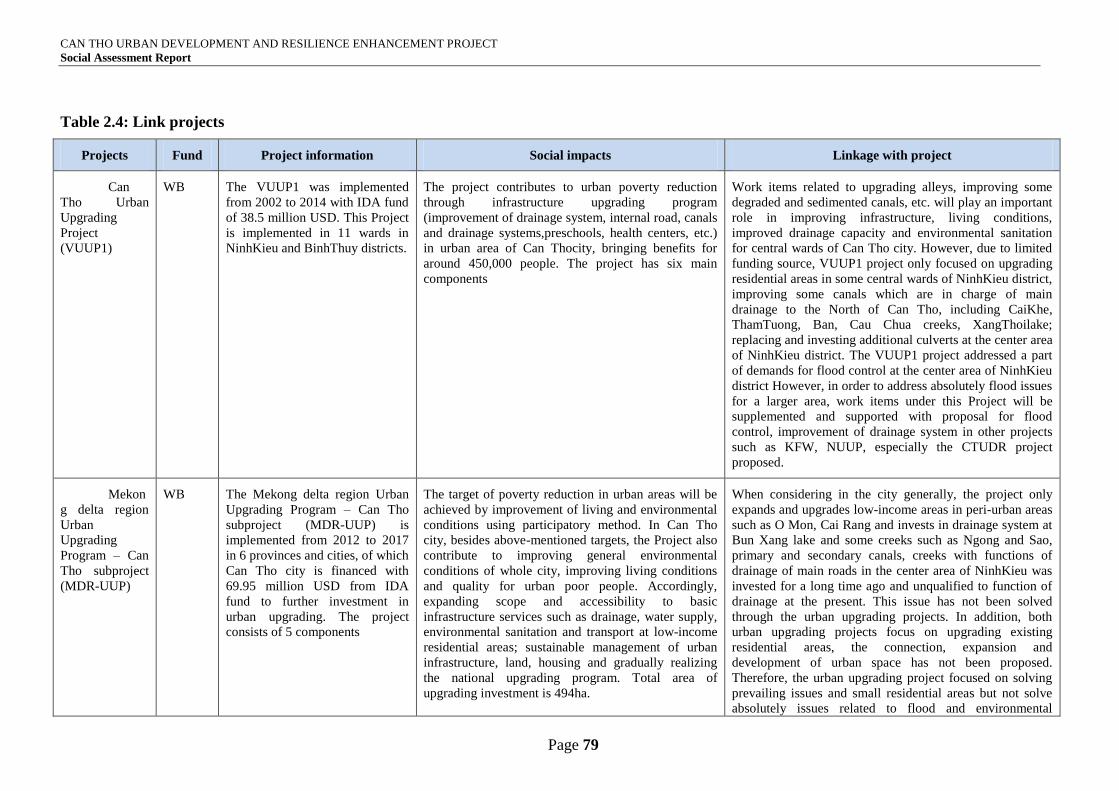
CAN THO URBAN DEVELOPMENT AND RESILIENCE ENHANCEMENT PROJECT
Social Assessment Report
Page 79
Table 2.4: Link projects
Projects Fund Project information Social impacts Linkage with project
Can
Tho Urban
Upgrading
Project
(VUUP1)
WB The VUUP1 was implemented
from 2002 to 2014 with IDA fund
of 38.5 million USD. This Project
is implemented in 11 wards in
NinhKieu and BinhThuy districts.
The project contributes to urban poverty reduction
through infrastructure upgrading program
(improvement of drainage system, internal road, canals
and drainage systems,preschools, health centers, etc.)
in urban area of Can Thocity, bringing benefits for
around 450,000 people. The project has six main
components
Work items related to upgrading alleys, improving some
degraded and sedimented canals, etc. will play an important
role in improving infrastructure, living conditions,
improved drainage capacity and environmental sanitation
for central wards of Can Tho city. However, due to limited
funding source, VUUP1 project only focused on upgrading
residential areas in some central wards of NinhKieu district,
improving some canals which are in charge of main
drainage to the North of Can Tho, including CaiKhe,
ThamTuong, Ban, Cau Chua creeks, XangThoilake;
replacing and investing additional culverts at the center area
of NinhKieu district. The VUUP1 project addressed a part
of demands for flood control at the center area of NinhKieu
district However, in order to address absolutely flood issues
for a larger area, work items under this Project will be
supplemented and supported with proposal for flood
control, improvement of drainage system in other projects
such as KFW, NUUP, especially the CTUDR project
proposed.
Mekon
g delta region
Urban
Upgrading
Program – Can
Tho subproject
(MDR-UUP)
WB The Mekong delta region Urban
Upgrading Program – Can Tho
subproject (MDR-UUP) is
implemented from 2012 to 2017
in 6 provinces and cities, of which
Can Tho city is financed with
69.95 million USD from IDA
fund to further investment in
urban upgrading. The project
consists of 5 components
The target of poverty reduction in urban areas will be
achieved by improvement of living and environmental
conditions using participatory method. In Can Tho
city, besides above-mentioned targets, the Project also
contribute to improving general environmental
conditions of whole city, improving living conditions
and quality for urban poor people. Accordingly,
expanding scope and accessibility to basic
infrastructure services such as drainage, water supply,
environmental sanitation and transport at low-income
residential areas; sustainable management of urban
infrastructure, land, housing and gradually realizing
the national upgrading program. Total area of
upgrading investment is 494ha.
When considering in the city generally, the project only
expands and upgrades low-income areas in peri-urban areas
such as O Mon, Cai Rang and invests in drainage system at
Bun Xang lake and some creeks such as Ngong and Sao,
primary and secondary canals, creeks with functions of
drainage of main roads in the center area of NinhKieu was
invested for a long time ago and unqualified to function of
drainage at the present. This issue has not been solved
through the urban upgrading projects. In addition, both
urban upgrading projects focus on upgrading existing
residential areas, the connection, expansion and
development of urban space has not been proposed.
Therefore, the urban upgrading project focused on solving
prevailing issues and small residential areas but not solve
absolutely issues related to flood and environmental
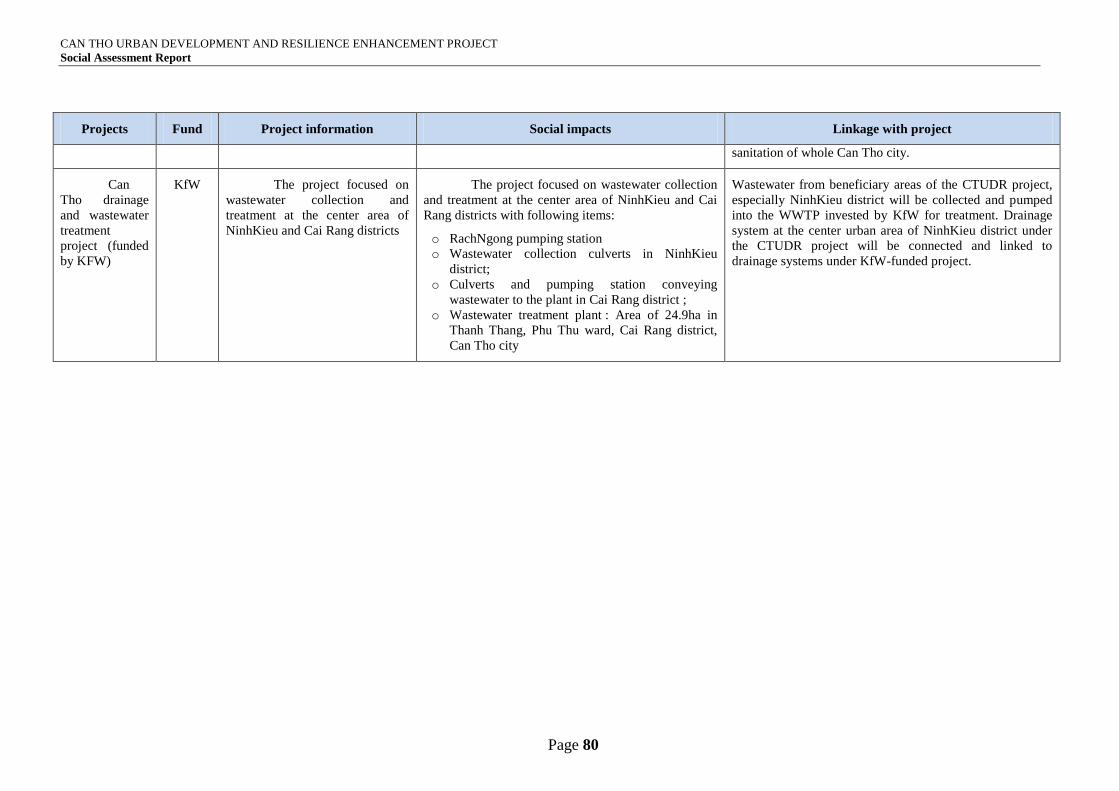
CAN THO URBAN DEVELOPMENT AND RESILIENCE ENHANCEMENT PROJECT
Social Assessment Report
Page 80
Projects Fund Project information Social impacts Linkage with project
sanitation of whole Can Tho city.
Can
Tho drainage
and wastewater
treatment
project (funded
by KFW)
KfW The project focused on
wastewater collection and
treatment at the center area of
NinhKieu and Cai Rang districts
The project focused on wastewater collection
and treatment at the center area of NinhKieu and Cai
Rang districts with following items:
o RachNgong pumping station
o Wastewater collection culverts in NinhKieu
district;
o Culverts and pumping station conveying
wastewater to the plant in Cai Rang district ;
o Wastewater treatment plant : Area of 24.9ha in
Thanh Thang, Phu Thu ward, Cai Rang district,
Can Tho city
Wastewater from beneficiary areas of the CTUDR project,
especially NinhKieu district will be collected and pumped
into the WWTP invested by KfW for treatment. Drainage
system at the center urban area of NinhKieu district under
the CTUDR project will be connected and linked to
drainage systems under KfW-funded project.
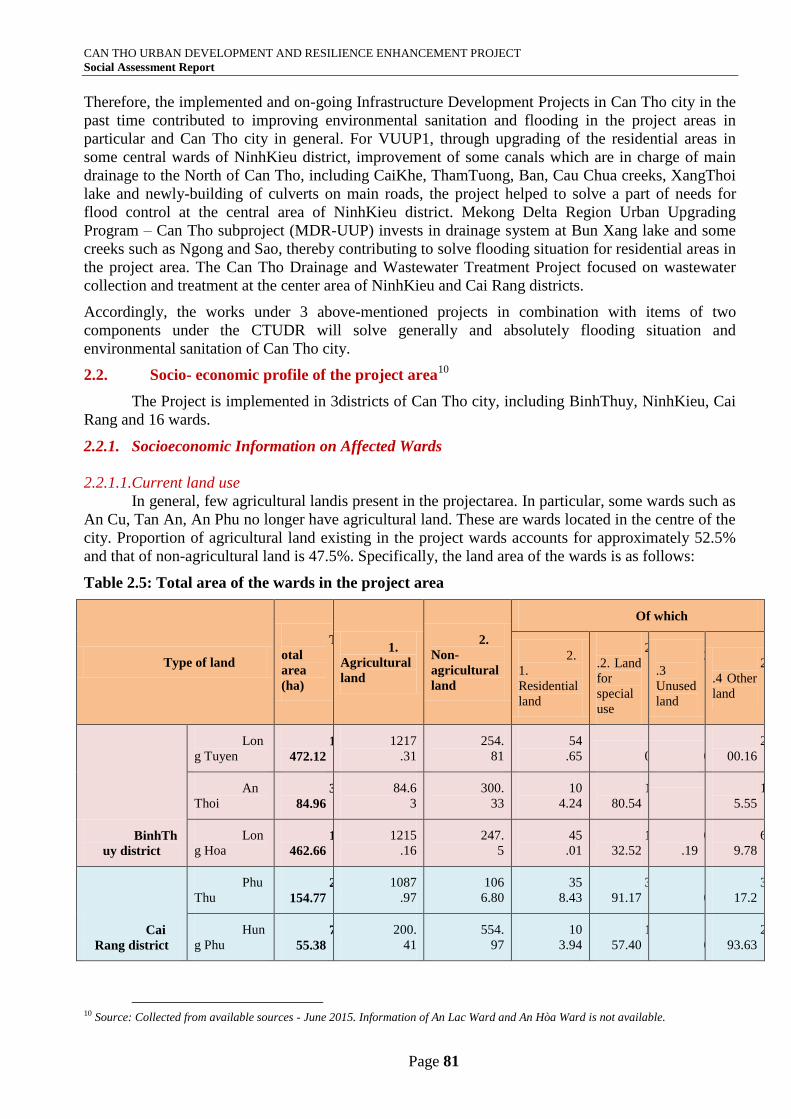
CAN THO URBAN DEVELOPMENT AND RESILIENCE ENHANCEMENT PROJECT
Social Assessment Report
Page 81
Therefore, the implemented and on-going Infrastructure Development Projects in Can Tho city in the
past time contributed to improving environmental sanitation and flooding in the project areas in
particular and Can Tho city in general. For VUUP1, through upgrading of the residential areas in
some central wards of NinhKieu district, improvement of some canals which are in charge of main
drainage to the North of Can Tho, including CaiKhe, ThamTuong, Ban, Cau Chua creeks, XangThoi
lake and newly-building of culverts on main roads, the project helped to solve a part of needs for
flood control at the central area of NinhKieu district. Mekong Delta Region Urban Upgrading
Program – Can Tho subproject (MDR-UUP) invests in drainage system at Bun Xang lake and some
creeks such as Ngong and Sao, thereby contributing to solve flooding situation for residential areas in
the project area. The Can Tho Drainage and Wastewater Treatment Project focused on wastewater
collection and treatment at the center area of NinhKieu and Cai Rang districts.
Accordingly, the works under 3 above-mentioned projects in combination with items of two
components under the CTUDR will solve generally and absolutely flooding situation and
environmental sanitation of Can Tho city.
2.2. Socio- economic profile of the project area10
The Project is implemented in 3districts of Can Tho city, including BinhThuy, NinhKieu, Cai
Rang and 16 wards.
2.2.1. Socioeconomic Information on Affected Wards
2.2.1.1.Current land use
In general, few agricultural landis present in the projectarea. In particular, some wards such as
An Cu, Tan An, An Phu no longer have agricultural land. These are wards located in the centre of the
city. Proportion of agricultural land existing in the project wards accounts for approximately 52.5%
and that of non-agricultural land is 47.5%. Specifically, the land area of the wards is as follows:
Table 2.5: Total area of the wards in the project area
Type of land
T
otal
area
(ha)
1.
Agricultural
land
2.
Non-
agricultural
land
Of which
2.
1.
Residential
land
2
.2. Land
for
special
use
2
.3
Unused
land
2
.4 Other
land
BinhTh
uy district
Lon
g Tuyen 1
472.12
1217
.31
254.
81
54
.65 0 0
2
00.16
An
Thoi 3
84.96
84.6
3
300.
33
10
4.24
1
80.54
1
5.55
Lon
g Hoa 1
462.66
1215
.16
247.
5
45
.01
1
32.52
0
.19
6
9.78
Cai
Rang district
Phu
Thu 2
154.77
1087
.97
106
6.80
35
8.43
3
91.17 0
3
17.2
Hun
g Phu 7
55.38
200.
41
554.
97
10
3.94
1
57.40 0
2
93.63
10 Source: Collected from available sources - June 2015. Information of An Lac Ward and An Hòa Ward is not available.
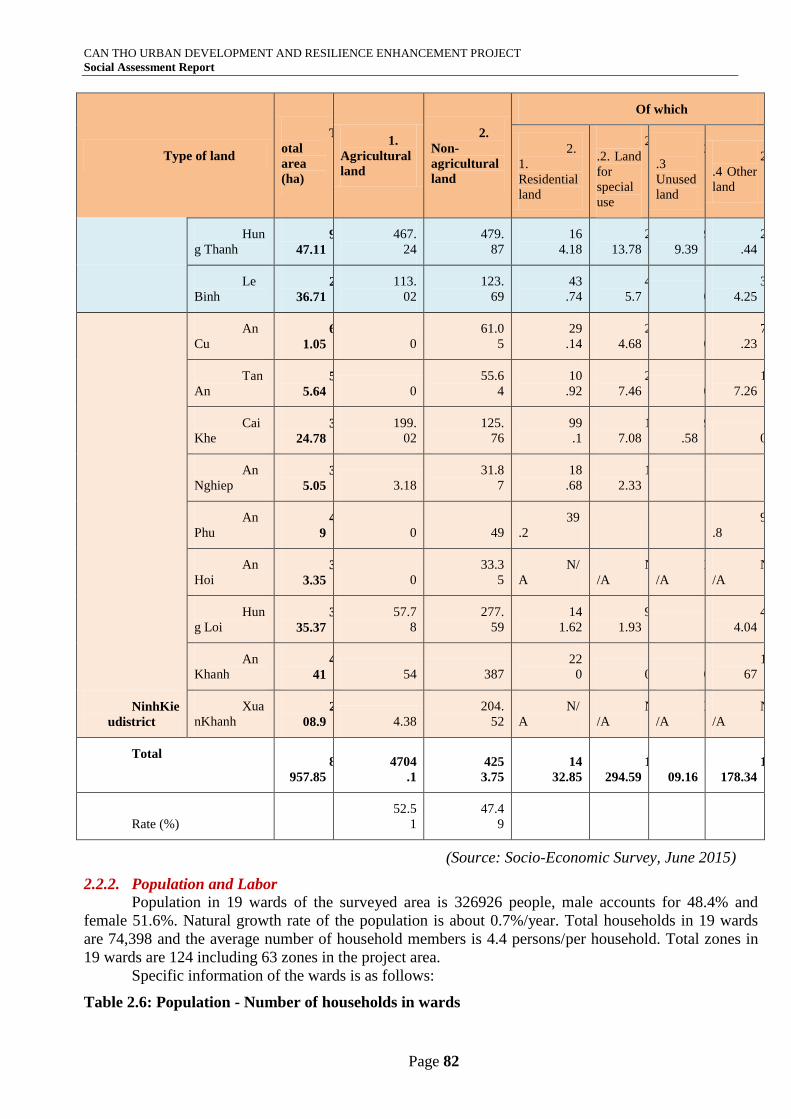
CAN THO URBAN DEVELOPMENT AND RESILIENCE ENHANCEMENT PROJECT
Social Assessment Report
Page 82
Type of land
T
otal
area
(ha)
1.
Agricultural
land
2.
Non-
agricultural
land
Of which
2.
1.
Residential
land
2
.2. Land
for
special
use
2
.3
Unused
land
2
.4 Other
land
Hun
g Thanh 9
47.11
467.
24
479.
87
16
4.18
2
13.78
9
9.39
2
.44
Le
Binh 2
36.71
113.
02
123.
69
43
.74
4
5.7 0
3
4.25
NinhKie
udistrict
An
Cu 6
1.05 0
61.0
5
29
.14
2
4.68 0
7
.23
Tan
An 5
5.64 0
55.6
4
10
.92
2
7.46 0
1
7.26
Cai
Khe 3
24.78
199.
02
125.
76
99
.1
1
7.08
9
.58 0
An
Nghiep 3
5.05 3.18
31.8
7
18
.68
1
2.33
An
Phu 4
9 0 49
39
.2
9
.8
An
Hoi 3
3.35 0
33.3
5
N/
A
N
/A
N
/A
N
/A
Hun
g Loi 3
35.37
57.7
8
277.
59
14
1.62
9
1.93
4
4.04
An
Khanh 4
41 54 387
22
0 0 0
1
67
Xua
nKhanh 2
08.9 4.38
204.
52
N/
A
N
/A
N
/A
N
/A
Total
8
957.85
4704
.1
425
3.75
14
32.85
1
294.59
1
09.16
1
178.34
Rate (%)
52.5
1
47.4
9
(Source: Socio-Economic Survey, June 2015)
2.2.2. Population and Labor
Population in 19 wards of the surveyed area is 326926 people, male accounts for 48.4% and
female 51.6%. Natural growth rate of the population is about 0.7%/year. Total households in 19 wards
are 74,398 and the average number of household members is 4.4 persons/per household. Total zones in
19 wards are 124 including 63 zones in the project area.
Specific information of the wards is as follows:
Table 2.6: Population - Number of households in wards
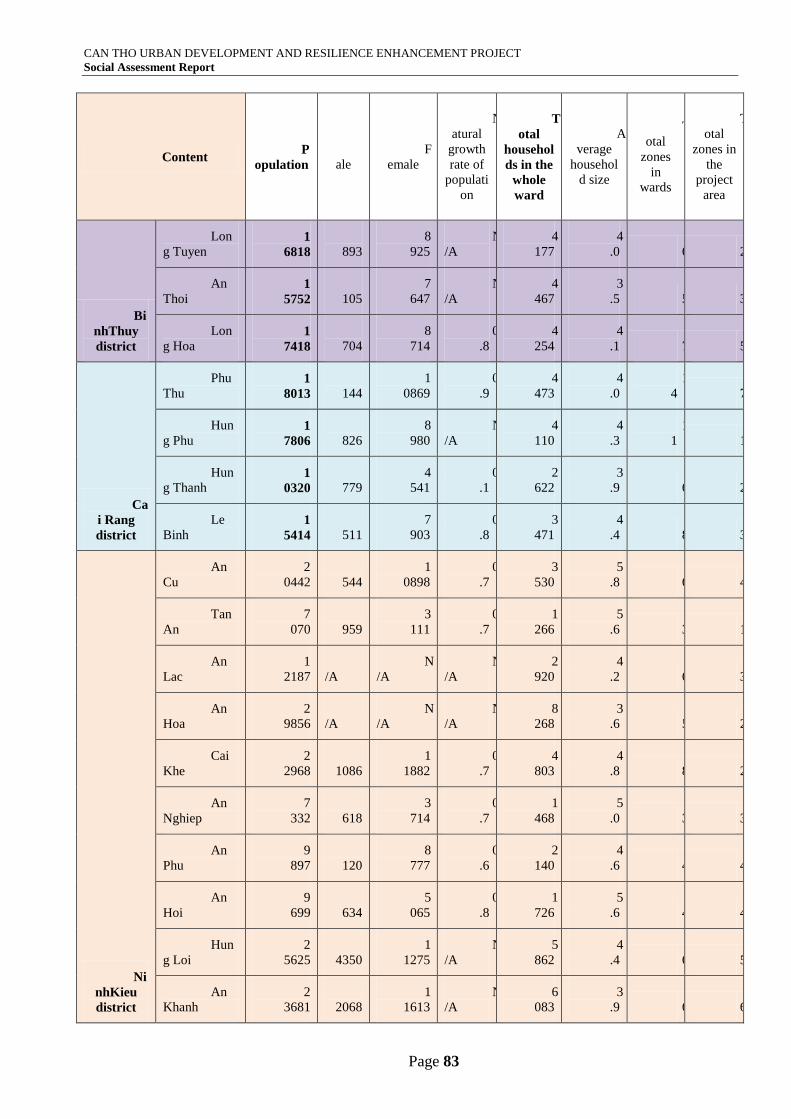
CAN THO URBAN DEVELOPMENT AND RESILIENCE ENHANCEMENT PROJECT
Social Assessment Report
Page 83
Content P
opulation
M
ale
F
emale
N
atural
growth
rate of
populati
on
T
otal
househol
ds in the
whole
ward
A
verage
househol
d size
T
otal
zones
in
wards
T
otal
zones in
the
project
area
Bi
nhThuy
district
Lon
g Tuyen 1
6818
7
893
8
925
N
/A
4
177
4
.0 6 2
An
Thoi 1
5752
8
105
7
647
N
/A
4
467
3
.5 5 3
Lon
g Hoa 1
7418
8
704
8
714
0
.8
4
254
4
.1 7 5
Ca
i Rang
district
Phu
Thu 1
8013
7
144
1
0869
0
.9
4
473
4
.0
1
4 7
Hun
g Phu 1
7806
8
826
8
980
N
/A
4
110
4
.3
1
1 1
Hun
g Thanh 1
0320
5
779
4
541
0
.1
2
622
3
.9 6 2
Le
Binh 1
5414
7
511
7
903
0
.8
3
471
4
.4 8 3
Ni
nhKieu
district
An
Cu
2
0442
9
544
1
0898
0
.7
3
530
5
.8 6 4
Tan
An
7
070
3
959
3
111
0
.7
1
266
5
.6 3 1
An
Lac
1
2187
N
/A
N
/A
N
/A
2
920
4
.2 6 3
An
Hoa
2
9856
N
/A
N
/A
N
/A
8
268
3
.6 5 2
Cai
Khe
2
2968
1
1086
1
1882
0
.7
4
803
4
.8 8 2
An
Nghiep
7
332
3
618
3
714
0
.7
1
468
5
.0 3 3
An
Phu
9
897
1
120
8
777
0
.6
2
140
4
.6 4 4
An
Hoi
9
699
4
634
5
065
0
.8
1
726
5
.6 4 4
Hun
g Loi
2
5625
1
4350
1
1275
N
/A
5
862
4
.4 6 5
An
Khanh
2
3681
1
2068
1
1613
N
/A
6
083
3
.9 6 6
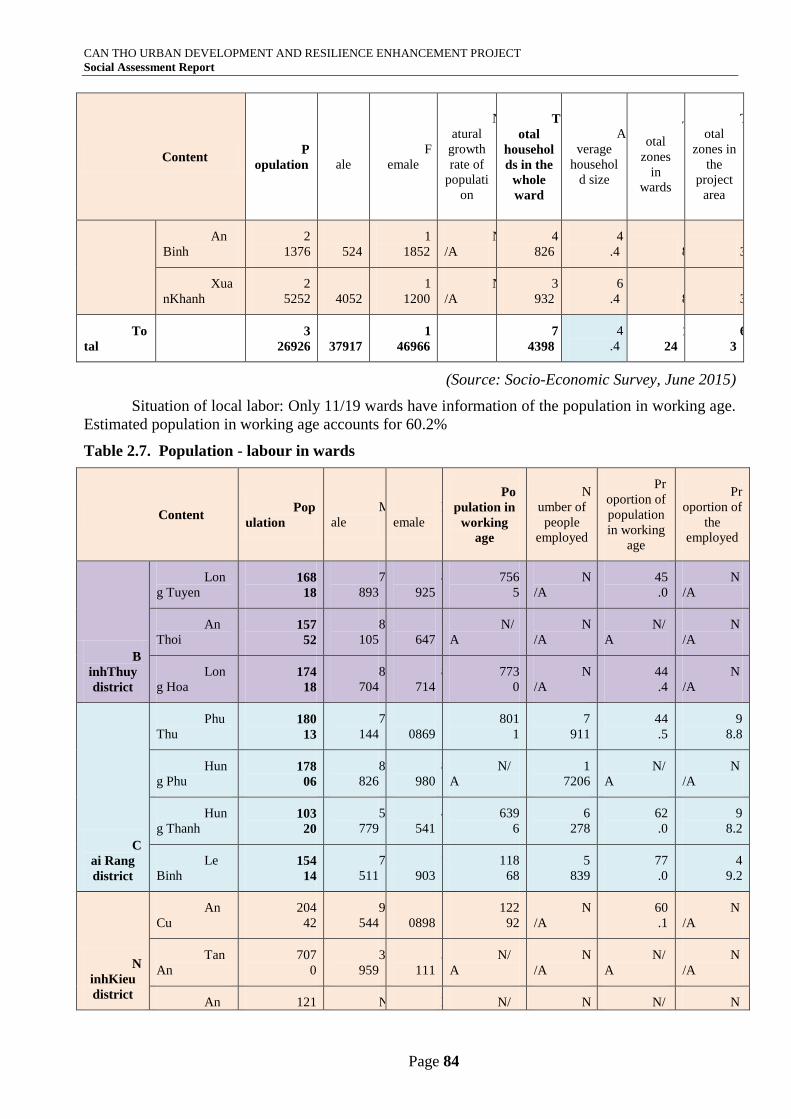
CAN THO URBAN DEVELOPMENT AND RESILIENCE ENHANCEMENT PROJECT
Social Assessment Report
Page 84
Content P
opulation
M
ale
F
emale
N
atural
growth
rate of
populati
on
T
otal
househol
ds in the
whole
ward
A
verage
househol
d size
T
otal
zones
in
wards
T
otal
zones in
the
project
area
An
Binh
2
1376
9
524
1
1852
N
/A
4
826
4
.4 8 3
Xua
nKhanh
2
5252
1
4052
1
1200
N
/A
3
932
6
.4 8 3
To
tal
3
26926
1
37917
1
46966
7
4398
4
.4 1
24
6
3
(Source: Socio-Economic Survey, June 2015)
Situation of local labor: Only 11/19 wards have information of the population in working age.
Estimated population in working age accounts for 60.2%
Table 2.7. Population - labour in wards
Content Pop
ulation
M
ale
F
emale
Po
pulation in
working
age
N
umber of
people
employed
Pr
oportion of
population
in working
age
Pr
oportion of
the
employed
B
inhThuy
district
Lon
g Tuyen 168
18
7
893
8
925
756
5
N
/A
45
.0
N
/A
An
Thoi 157
52
8
105
7
647
N/
A
N
/A
N/
A
N
/A
Lon
g Hoa 174
18
8
704
8
714
773
0
N
/A
44
.4
N
/A
C
ai Rang
district
Phu
Thu 180
13
7
144
1
0869
801
1
7
911
44
.5
9
8.8
Hun
g Phu 178
06
8
826
8
980
N/
A
1
7206
N/
A
N
/A
Hun
g Thanh 103
20
5
779
4
541
639
6
6
278
62
.0
9
8.2
Le
Binh 154
14
7
511
7
903
118
68
5
839
77
.0
4
9.2
N
inhKieu
district
An
Cu
204
42
9
544
1
0898
122
92
N
/A
60
.1
N
/A
Tan
An
707
0
3
959
3
111
N/
A
N
/A
N/
A
N
/A
An 121 N N N/ N N/ N
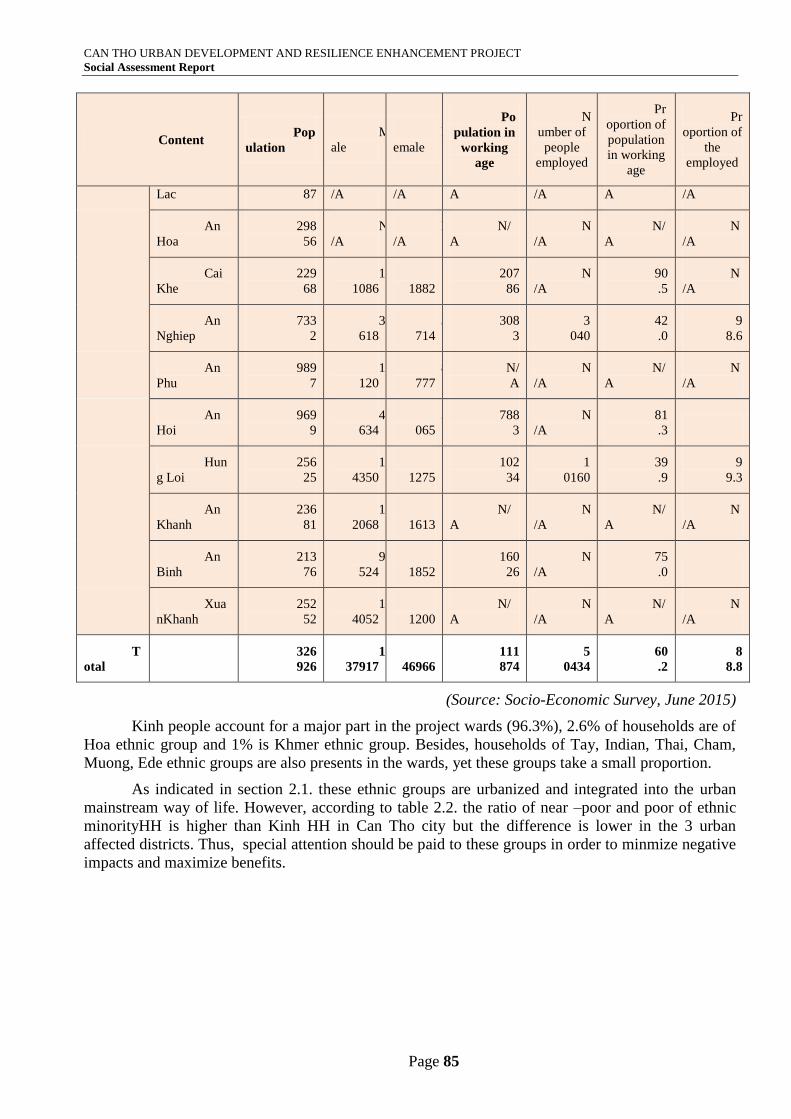
CAN THO URBAN DEVELOPMENT AND RESILIENCE ENHANCEMENT PROJECT
Social Assessment Report
Page 85
Content Pop
ulation
M
ale
F
emale
Po
pulation in
working
age
N
umber of
people
employed
Pr
oportion of
population
in working
age
Pr
oportion of
the
employed
Lac 87 /A /A A /A A /A
An
Hoa
298
56
N
/A
N
/A
N/
A
N
/A
N/
A
N
/A
Cai
Khe
229
68
1
1086
1
1882
207
86
N
/A
90
.5
N
/A
An
Nghiep
733
2
3
618
3
714
308
3
3
040
42
.0
9
8.6
An
Phu
989
7
1
120
8
777
N/
A
N
/A
N/
A
N
/A
An
Hoi
969
9
4
634
5
065
788
3
N
/A
81
.3
Hun
g Loi
256
25
1
4350
1
1275
102
34
1
0160
39
.9
9
9.3
An
Khanh
236
81
1
2068
1
1613
N/
A
N
/A
N/
A
N
/A
An
Binh
213
76
9
524
1
1852
160
26
N
/A
75
.0
Xua
nKhanh
252
52
1
4052
1
1200
N/
A
N
/A
N/
A
N
/A
T
otal
326
926
1
37917
1
46966
111
874
5
0434
60
.2
8
8.8
(Source: Socio-Economic Survey, June 2015)
Kinh people account for a major part in the project wards (96.3%), 2.6% of households are of
Hoa ethnic group and 1% is Khmer ethnic group. Besides, households of Tay, Indian, Thai, Cham,
Muong, Ede ethnic groups are also presents in the wards, yet these groups take a small proportion.
As indicated in section 2.1. these ethnic groups are urbanized and integrated into the urban
mainstream way of life. However, according to table 2.2. the ratio of near –poor and poor of ethnic
minorityHH is higher than Kinh HH in Can Tho city but the difference is lower in the 3 urban
affected districts. Thus, special attention should be paid to these groups in order to minmize negative
impacts and maximize benefits.
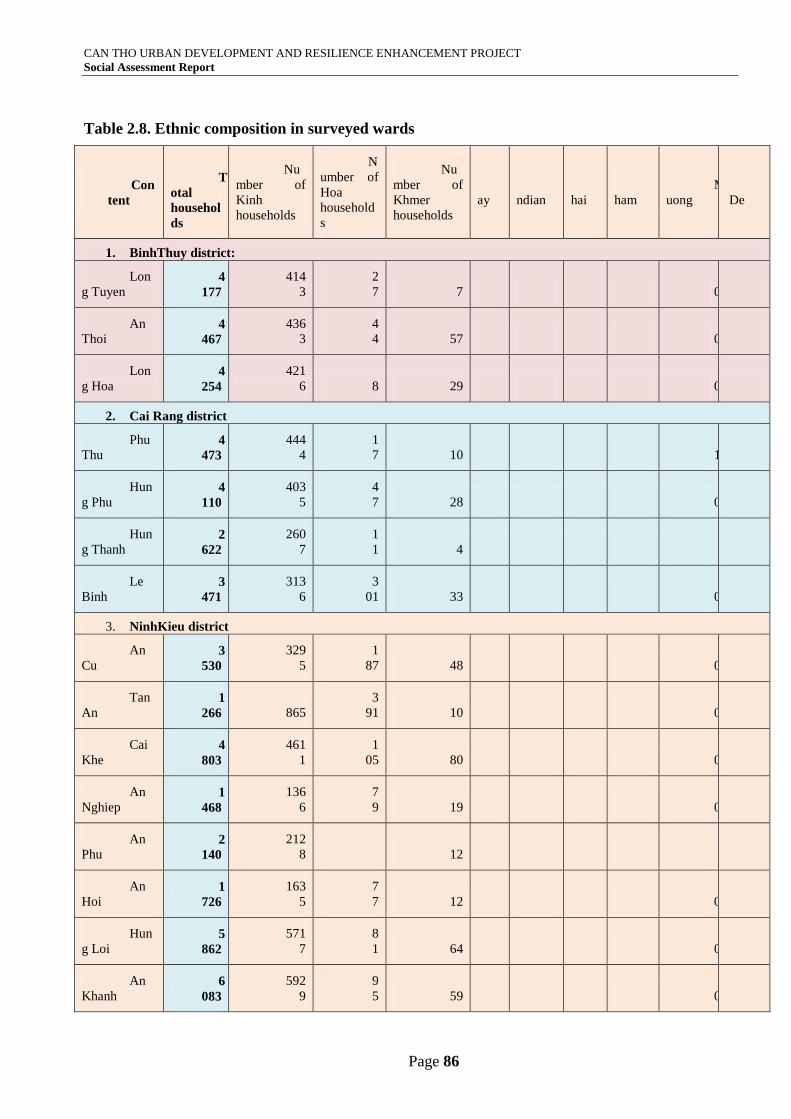
CAN THO URBAN DEVELOPMENT AND RESILIENCE ENHANCEMENT PROJECT
Social Assessment Report
Page 86
Table 2.8. Ethnic composition in surveyed wards
Con
tent
T
otal
househol
ds
Nu
mber of
Kinh
households
N
umber of
Hoa
household
s
Nu
mber of
Khmer
households
T
ay
I
ndian
T
hai
C
ham
M
uong
E
De
1. BinhThuy district:
Lon
g Tuyen 4
177
414
3
2
7 7 0 0 0 0 0 0
An
Thoi 4
467
436
3
4
4 57 0 0 2 1 0 0
Lon
g Hoa 4
254
421
6 8 29 1 0 0 0 0 0
2. Cai Rang district
Phu
Thu 4
473
444
4
1
7 10 0 0 0 0 1 1
Hun
g Phu 4
110
403
5
4
7 28 0 0 0 0 0 0
Hun
g Thanh 2
622
260
7
1
1 4
Le
Binh 3
471
313
6
3
01 33 0 0 0 1 0 0
3. NinhKieu district
An
Cu 3
530
329
5
1
87 48 0 0 0 0 0 0
Tan
An 1
266 865
3
91 10 0 0 0 0 0 0
Cai
Khe 4
803
461
1
1
05 80 2 5 0 0 0 0
An
Nghiep 1
468
136
6
7
9 19 0 0 1 3 0 0
An
Phu 2
140
212
8 12
An
Hoi 1
726
163
5
7
7 12 0 2 0 0 0 0
Hun
g Loi 5
862
571
7
8
1 64 0 0 0 0 0 0
An
Khanh 6
083
592
9
9
5 59 0 0 0 0 0 0
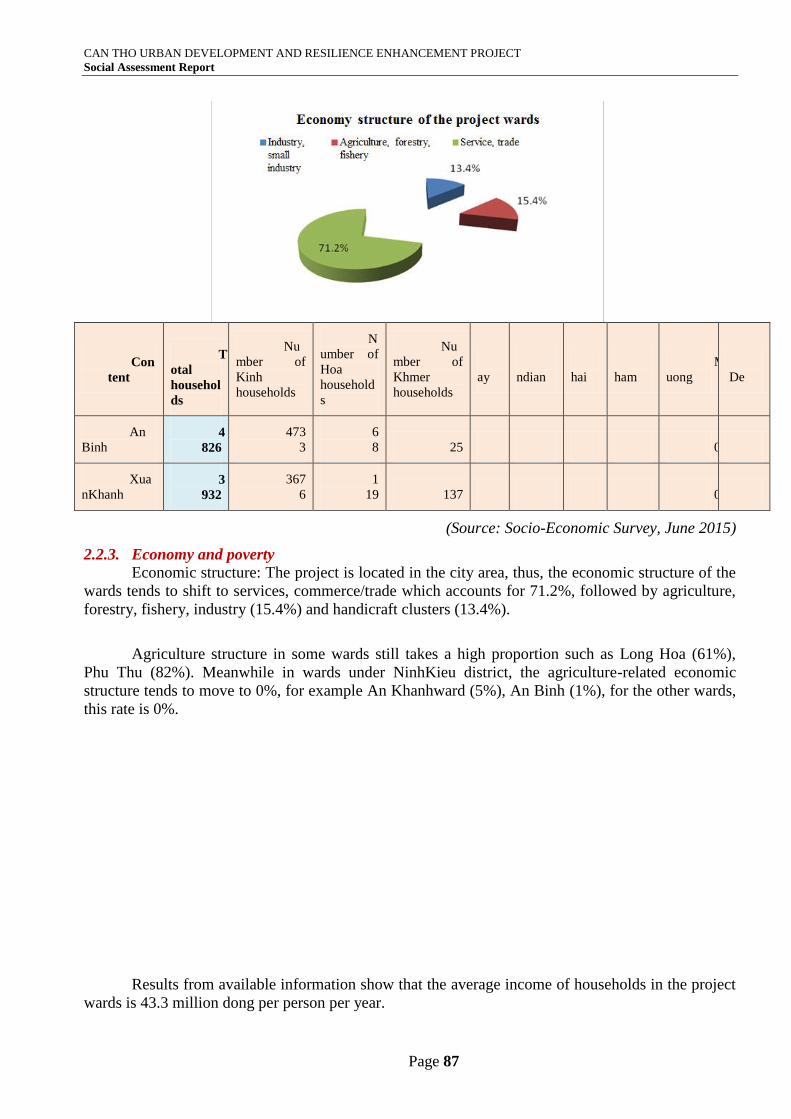
CAN THO URBAN DEVELOPMENT AND RESILIENCE ENHANCEMENT PROJECT
Social Assessment Report
Page 87
Con
tent
T
otal
househol
ds
Nu
mber of
Kinh
households
N
umber of
Hoa
household
s
Nu
mber of
Khmer
households
T
ay
I
ndian
T
hai
C
ham
M
uong
E
De
An
Binh 4
826
473
3
6
8 25 0 0 0 0 0 0
Xua
nKhanh 3
932
367
6
1
19 137 0 0 0 0 0 0
(Source: Socio-Economic Survey, June 2015)
2.2.3. Economy and poverty
Economic structure: The project is located in the city area, thus, the economic structure of the
wards tends to shift to services, commerce/trade which accounts for 71.2%, followed by agriculture,
forestry, fishery, industry (15.4%) and handicraft clusters (13.4%).
Agriculture structure in some wards still takes a high proportion such as Long Hoa (61%),
Phu Thu (82%). Meanwhile in wards under NinhKieu district, the agriculture-related economic
structure tends to move to 0%, for example An Khanhward (5%), An Binh (1%), for the other wards,
this rate is 0%.
Results from available information show that the average income of households in the project
wards is 43.3 million dong per person per year.
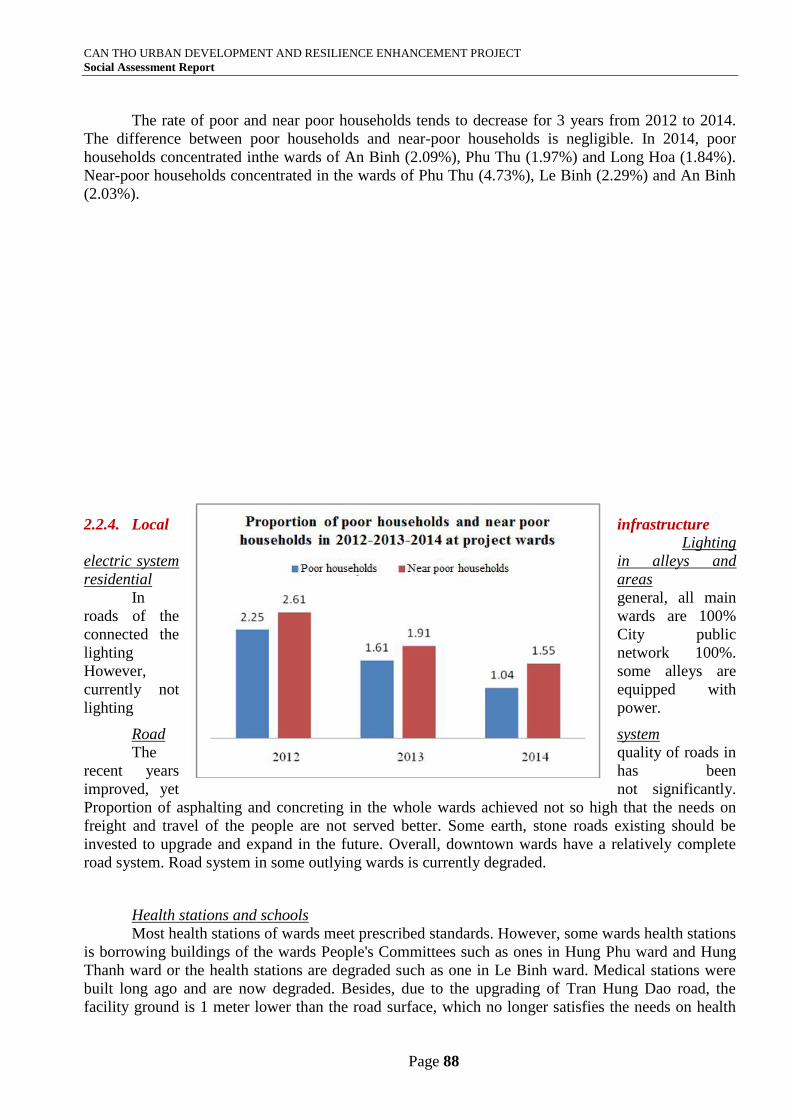
CAN THO URBAN DEVELOPMENT AND RESILIENCE ENHANCEMENT PROJECT
Social Assessment Report
Page 88
The rate of poor and near poor households tends to decrease for 3 years from 2012 to 2014.
The difference between poor households and near-poor households is negligible. In 2014, poor
households concentrated inthe wards of An Binh (2.09%), Phu Thu (1.97%) and Long Hoa (1.84%).
Near-poor households concentrated in the wards of Phu Thu (4.73%), Le Binh (2.29%) and An Binh
(2.03%).
2.2.4. Local infrastructure
Lighting
electric system in alleys and
residential areas
In general, all main
roads of the wards are 100%
connected the City public
lighting network 100%.
However, some alleys are
currently not equipped with
lighting power.
Road system
The quality of roads in
recent years has been
improved, yet not significantly.
Proportion of asphalting and concreting in the whole wards achieved not so high that the needs on
freight and travel of the people are not served better. Some earth, stone roads existing should be
invested to upgrade and expand in the future. Overall, downtown wards have a relatively complete
road system. Road system in some outlying wards is currently degraded.
Health stations and schools
Most health stations of wards meet prescribed standards. However, some wards health stations
is borrowing buildings of the wards People's Committees such as ones in Hung Phu ward and Hung
Thanh ward or the health stations are degraded such as one in Le Binh ward. Medical stations were
built long ago and are now degraded. Besides, due to the upgrading of Tran Hung Dao road, the
facility ground is 1 meter lower than the road surface, which no longer satisfies the needs on health
CAN THO URBAN DEVELOPMENT AND RESILIENCE ENHANCEMENT PROJECT
Social Assessment Report
Page 89
check and treatment. Hence, health stations should be newly built to meet the health care needs of the
people.
Schools in wards generally meet the standards. In some wards, schools are currently being
built/renovated to meet the standards. Some schools have deteriorated and need to be rebuilt and
renovate as well.
Markets and trade centers
The number of wards having large markets or trade centers is very small in the project wards:
On the areas of the wards exist temporary markets. These are the places which are complained by the
local community due to environmental pollution at the market areas affecting the lives of the
surrounding people. However, purchase at the temporary markets is a daily routine of the people and
is unlikely to cancel.
The project will affect one market in Tan An ward. A new market will be built. Consultation
meetings were carried out to minimize negative impacts for business household in this market.
Drainage system
Overall in main streets, the pavements are equipped a centralized drainage system. However,
since the drainage system in alleys is not as complete and consistent as that in main roads, floods
occur when it rains and the water is not drained well. This situation is easy to see in the project area:
Water supply system
Most of the project wards have a tap water supply system available. In some wards, there are
households not provided with tap water and they are using water in dug/drilled wells.
Wastes - Toilets and Sanitation
Domestic wastes in residential areas in the wards are collected properly: 100%. In small
alleys, wastes are gathered at alley head where the wastes are collected by the collecting unit. Each
household is charged 15 thousand dong per month on average for waste collection, for street
households, it is 30 thousand dong per household per month.
Amusement parks and community cultural houses
Almost all of the wards in the project area lack a playground for the community. Except some
central wards where some entertainment spots gathering people from other wards exist.
The survey also shows that most of the wards have a community cultural house and public
information house. However, some cultural houses built long ago have been degrading.
2.2.5. Impact of climate change in the project area
Condition climate situation
Rising tides are common in the project wards and often appear in September -October every
year with 2 times on daily basis.
Wards with canals, ditches, rivers, embankments running through are observed landslides
along the river and reflected by many people. This provides potential risks to the lives and houses of
families living in and near these areas.
Responses to climate change
In general, responses to climate change in local areas are of single nature and each locality has
different measures. Every year, any locality has ditch landslides is provided with little financial
supported by the district. Thus, the local wards authorities have to mobilize funds from the local
people such as fund for flood prevention at 10-30 thousand dong per household or a custom
contribution of the households. Work related to climate change adaptation in wards is mainly as
reinforcing banks of canals, rivers and ditches; relocating households at risk of suffering from
landslides to temporary shelters, establishing a team for flood prevention.
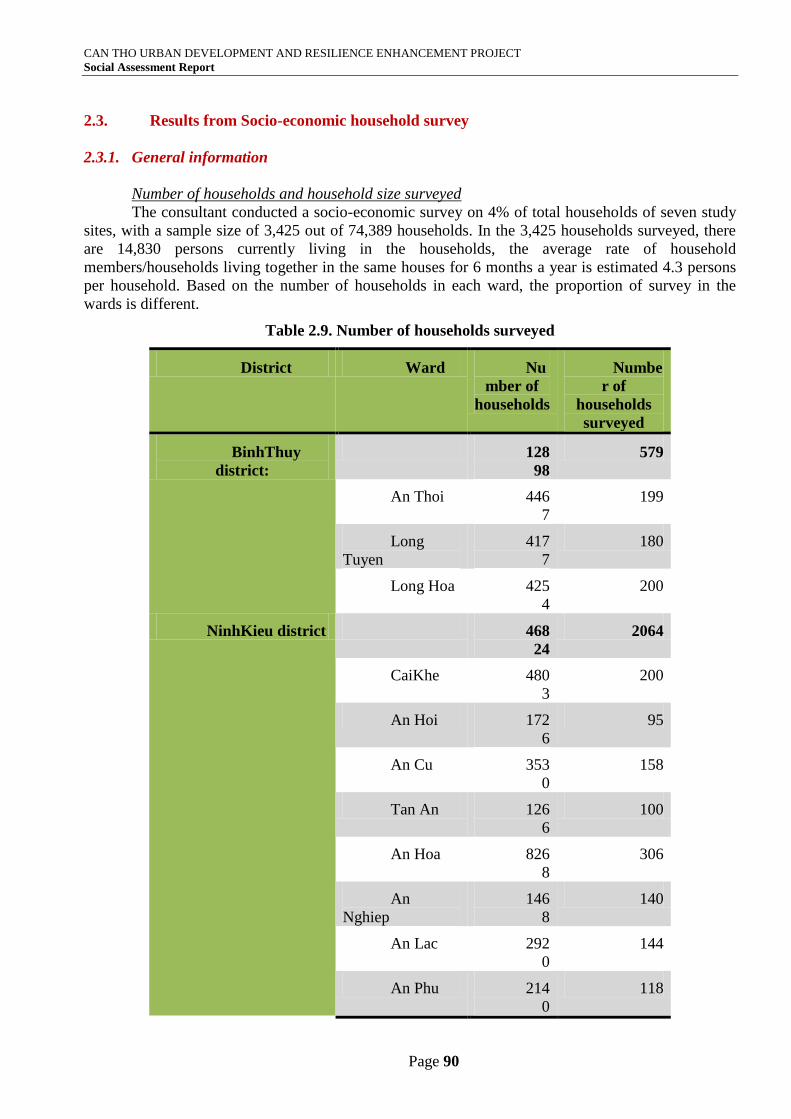
CAN THO URBAN DEVELOPMENT AND RESILIENCE ENHANCEMENT PROJECT
Social Assessment Report
Page 90
2.3. Results from Socio-economic household survey
2.3.1. General information
Number of households and household size surveyed
The consultant conducted a socio-economic survey on 4% of total households of seven study
sites, with a sample size of 3,425 out of 74,389 households. In the 3,425 households surveyed, there
are 14,830 persons currently living in the households, the average rate of household
members/households living together in the same houses for 6 months a year is estimated 4.3 persons
per household. Based on the number of households in each ward, the proportion of survey in the
wards is different.
Table 2.9. Number of households surveyed
District Ward Nu
mber of
households
Numbe
r of
households
surveyed
BinhThuy
district:
128
98
579
An Thoi 446
7
199
Long
Tuyen
417
7
180
Long Hoa 425
4
200
NinhKieu district 468
24
2064
CaiKhe 480
3
200
An Hoi 172
6
95
An Cu 353
0
158
Tan An 126
6
100
An Hoa 826
8
306
An
Nghiep
146
8
140
An Lac 292
0
144
An Phu 214
0
118
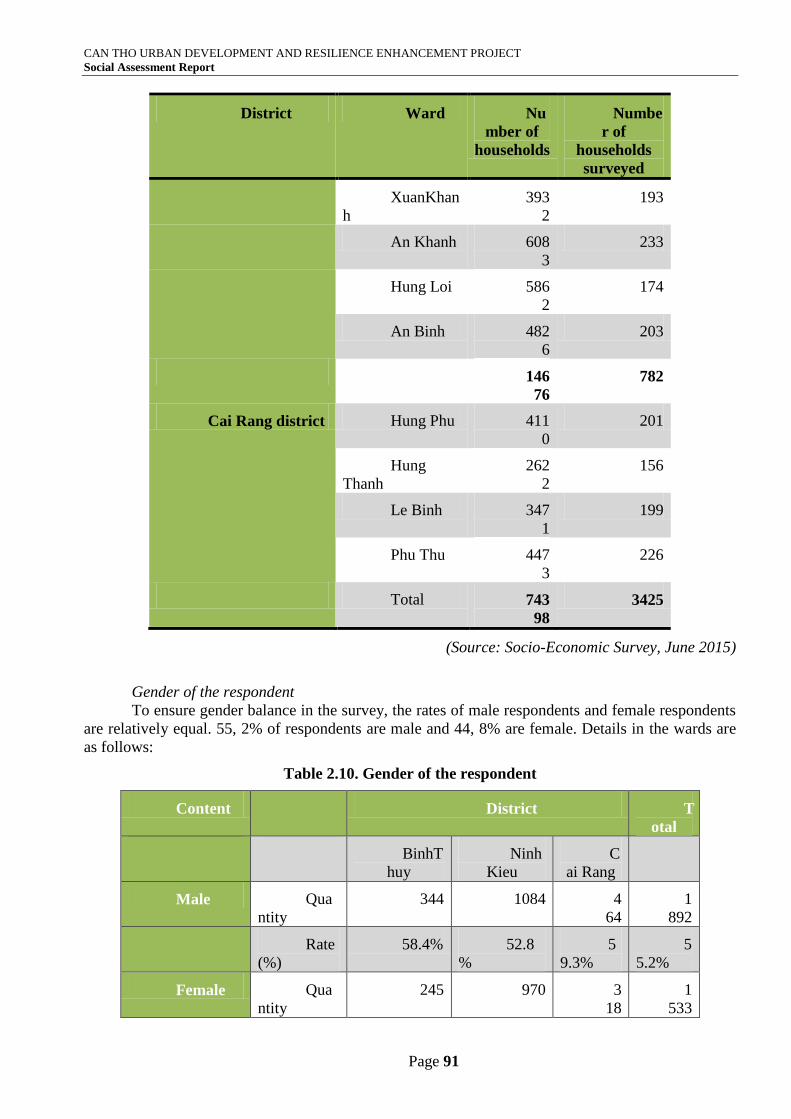
CAN THO URBAN DEVELOPMENT AND RESILIENCE ENHANCEMENT PROJECT
Social Assessment Report
Page 91
District Ward Nu
mber of
households
Numbe
r of
households
surveyed
XuanKhan
h
393
2
193
An Khanh 608
3
233
Hung Loi 586
2
174
An Binh 482
6
203
146
76
782
Cai Rang district Hung Phu 411
0
201
Hung
Thanh
262
2
156
Le Binh 347
1
199
Phu Thu 447
3
226
Total 743
98
3425
(Source: Socio-Economic Survey, June 2015)
Gender of the respondent
To ensure gender balance in the survey, the rates of male respondents and female respondents
are relatively equal. 55, 2% of respondents are male and 44, 8% are female. Details in the wards are
as follows:
Table 2.10. Gender of the respondent
Content District T
otal
BinhT
huy
Ninh
Kieu
C
ai Rang
Male Qua
ntity
344 1084 4
64
1
892
Rate
(%)
58.4% 52.8
%
5
9.3%
5
5.2%
Female Qua
ntity
245 970 3
18
1
533
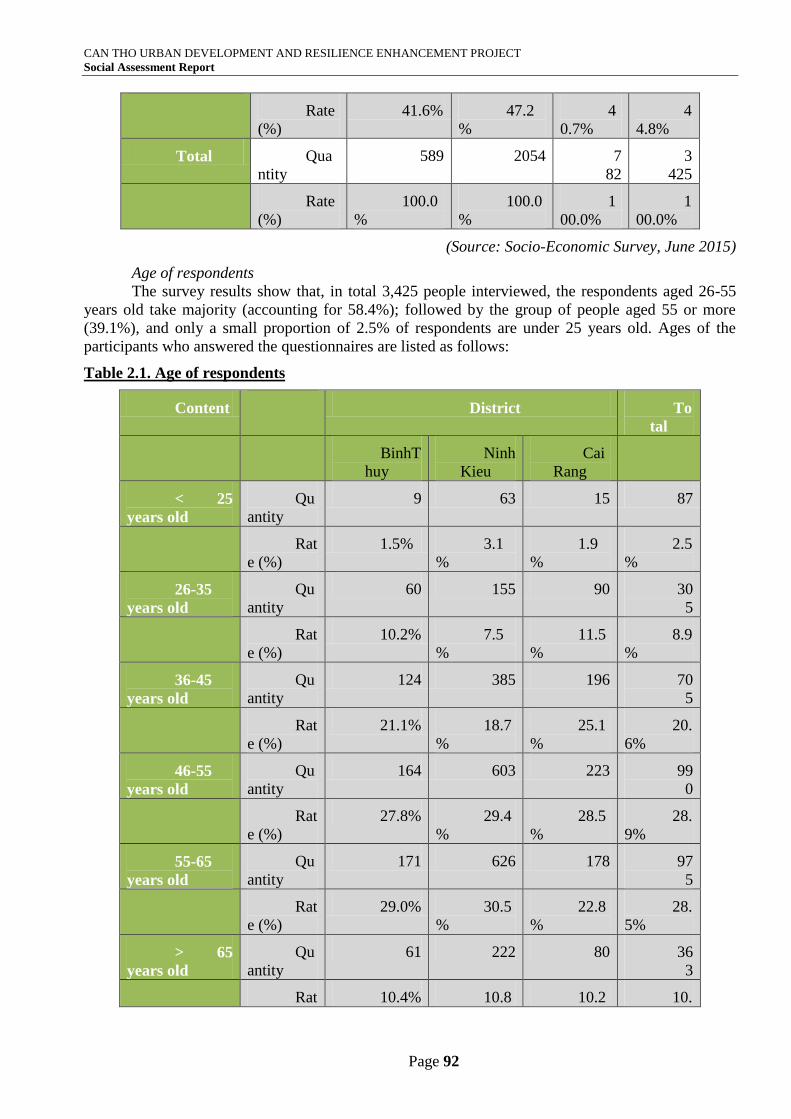
CAN THO URBAN DEVELOPMENT AND RESILIENCE ENHANCEMENT PROJECT
Social Assessment Report
Page 92
Rate
(%)
41.6% 47.2
%
4
0.7%
4
4.8%
Total Qua
ntity
589 2054 7
82
3
425
Rate
(%)
100.0
%
100.0
%
1
00.0%
1
00.0%
(Source: Socio-Economic Survey, June 2015)
Age of respondents
The survey results show that, in total 3,425 people interviewed, the respondents aged 26-55
years old take majority (accounting for 58.4%); followed by the group of people aged 55 or more
(39.1%), and only a small proportion of 2.5% of respondents are under 25 years old. Ages of the
participants who answered the questionnaires are listed as follows:
Table 2.1. Age of respondents
Content District To
tal
BinhT
huy
Ninh
Kieu
Cai
Rang
< 25
years old
Qu
antity
9 63 15 87
Rat
e (%)
1.5% 3.1
%
1.9
%
2.5
%
26-35
years old
Qu
antity
60 155 90 30
5
Rat
e (%)
10.2% 7.5
%
11.5
%
8.9
%
36-45
years old
Qu
antity
124 385 196 70
5
Rat
e (%)
21.1% 18.7
%
25.1
%
20.
6%
46-55
years old
Qu
antity
164 603 223 99
0
Rat
e (%)
27.8% 29.4
%
28.5
%
28.
9%
55-65
years old
Qu
antity
171 626 178 97
5
Rat
e (%)
29.0% 30.5
%
22.8
%
28.
5%
> 65
years old
Qu
antity
61 222 80 36
3
Rat 10.4% 10.8 10.2 10.
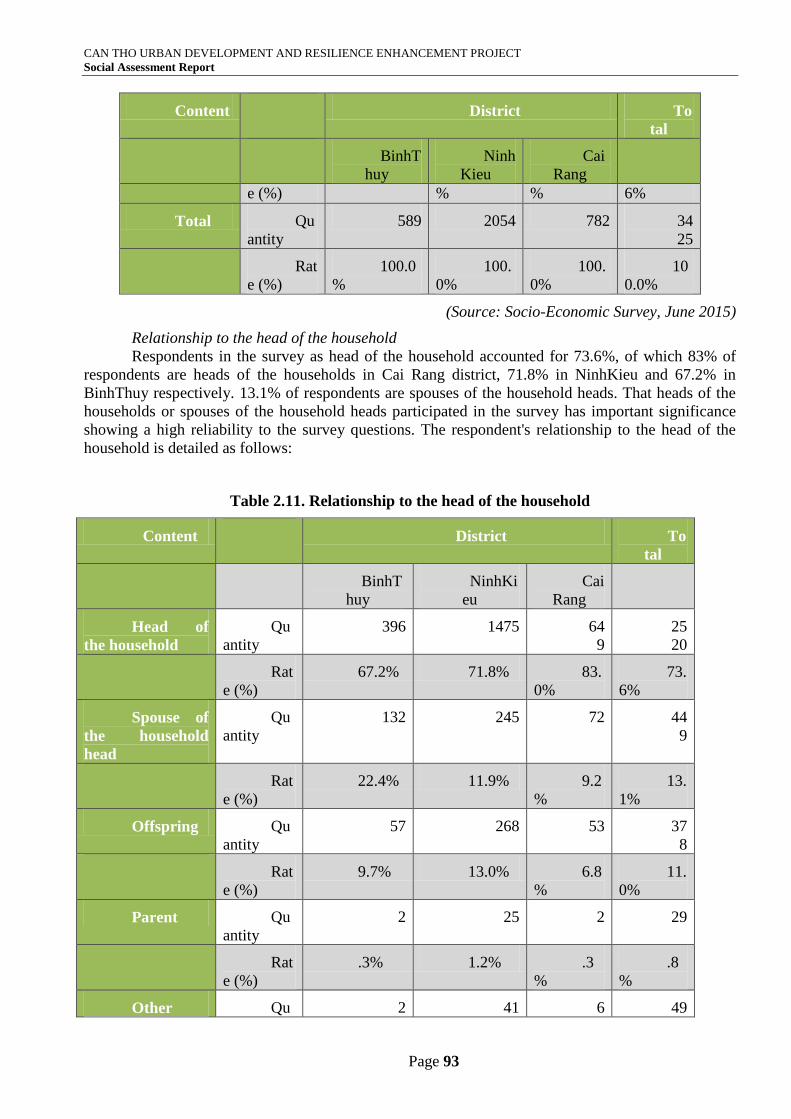
CAN THO URBAN DEVELOPMENT AND RESILIENCE ENHANCEMENT PROJECT
Social Assessment Report
Page 93
Content District To
tal
BinhT
huy
Ninh
Kieu
Cai
Rang
e (%) % % 6%
Total Qu
antity
589 2054 782 34
25
Rat
e (%)
100.0
%
100.
0%
100.
0%
10
0.0%
(Source: Socio-Economic Survey, June 2015)
Relationship to the head of the household
Respondents in the survey as head of the household accounted for 73.6%, of which 83% of
respondents are heads of the households in Cai Rang district, 71.8% in NinhKieu and 67.2% in
BinhThuy respectively. 13.1% of respondents are spouses of the household heads. That heads of the
households or spouses of the household heads participated in the survey has important significance
showing a high reliability to the survey questions. The respondent's relationship to the head of the
household is detailed as follows:
Table 2.11. Relationship to the head of the household
Content District To
tal
BinhT
huy
NinhKi
eu
Cai
Rang
Head of
the household
Qu
antity
396 1475 64
9
25
20
Rat
e (%)
67.2% 71.8% 83.
0%
73.
6%
Spouse of
the household
head
Qu
antity
132 245 72 44
9
Rat
e (%)
22.4% 11.9% 9.2
%
13.
1%
Offspring Qu
antity
57 268 53 37
8
Rat
e (%)
9.7% 13.0% 6.8
%
11.
0%
Parent Qu
antity
2 25 2 29
Rat
e (%)
.3% 1.2% .3
%
.8
%
Other Qu 2 41 6 49
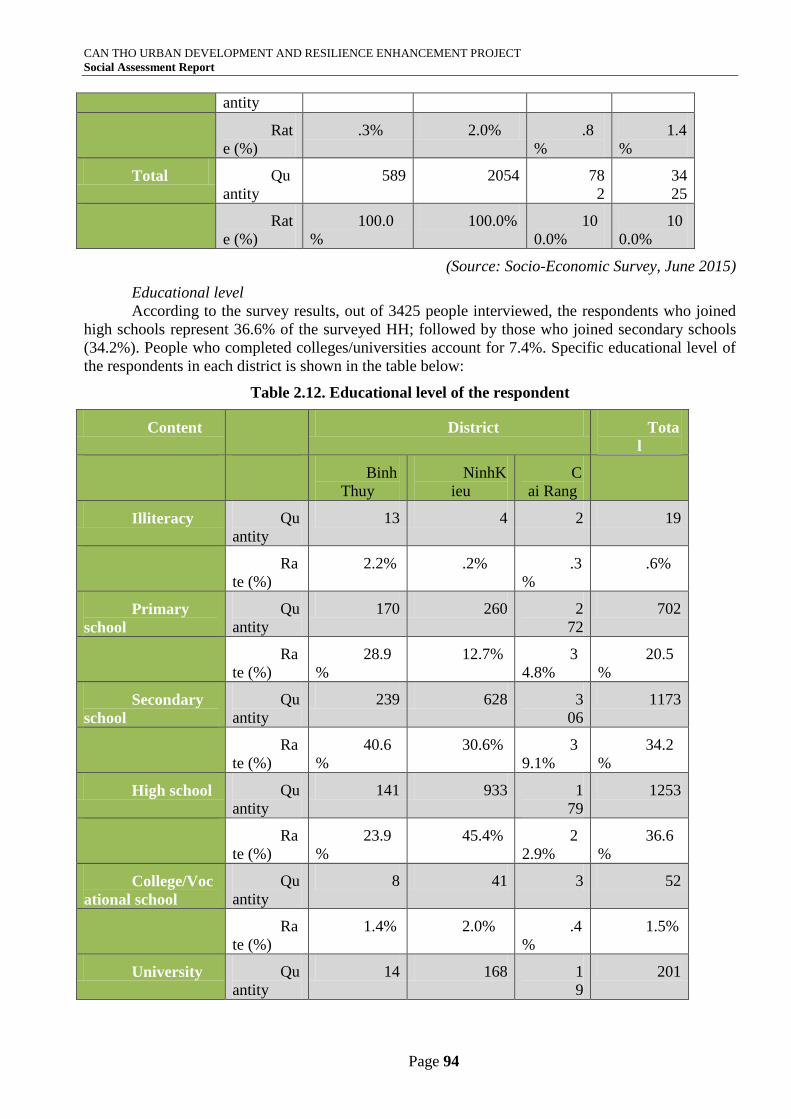
CAN THO URBAN DEVELOPMENT AND RESILIENCE ENHANCEMENT PROJECT
Social Assessment Report
Page 94
antity
Rat
e (%)
.3% 2.0% .8
%
1.4
%
Total Qu
antity
589 2054 78
2
34
25
Rat
e (%)
100.0
%
100.0% 10
0.0%
10
0.0%
(Source: Socio-Economic Survey, June 2015)
Educational level
According to the survey results, out of 3425 people interviewed, the respondents who joined
high schools represent 36.6% of the surveyed HH; followed by those who joined secondary schools
(34.2%). People who completed colleges/universities account for 7.4%. Specific educational level of
the respondents in each district is shown in the table below:
Table 2.12. Educational level of the respondent
Content District Tota
l
Binh
Thuy
NinhK
ieu
C
ai Rang
Illiteracy Qu
antity
13 4 2 19
Ra
te (%)
2.2% .2% .3
%
.6%
Primary
school
Qu
antity
170 260 2
72
702
Ra
te (%)
28.9
%
12.7% 3
4.8%
20.5
%
Secondary
school
Qu
antity
239 628 3
06
1173
Ra
te (%)
40.6
%
30.6% 3
9.1%
34.2
%
High school Qu
antity
141 933 1
79
1253
Ra
te (%)
23.9
%
45.4% 2
2.9%
36.6
%
College/Voc
ational school
Qu
antity
8 41 3 52
Ra
te (%)
1.4% 2.0% .4
%
1.5%
University Qu
antity
14 168 1
9
201
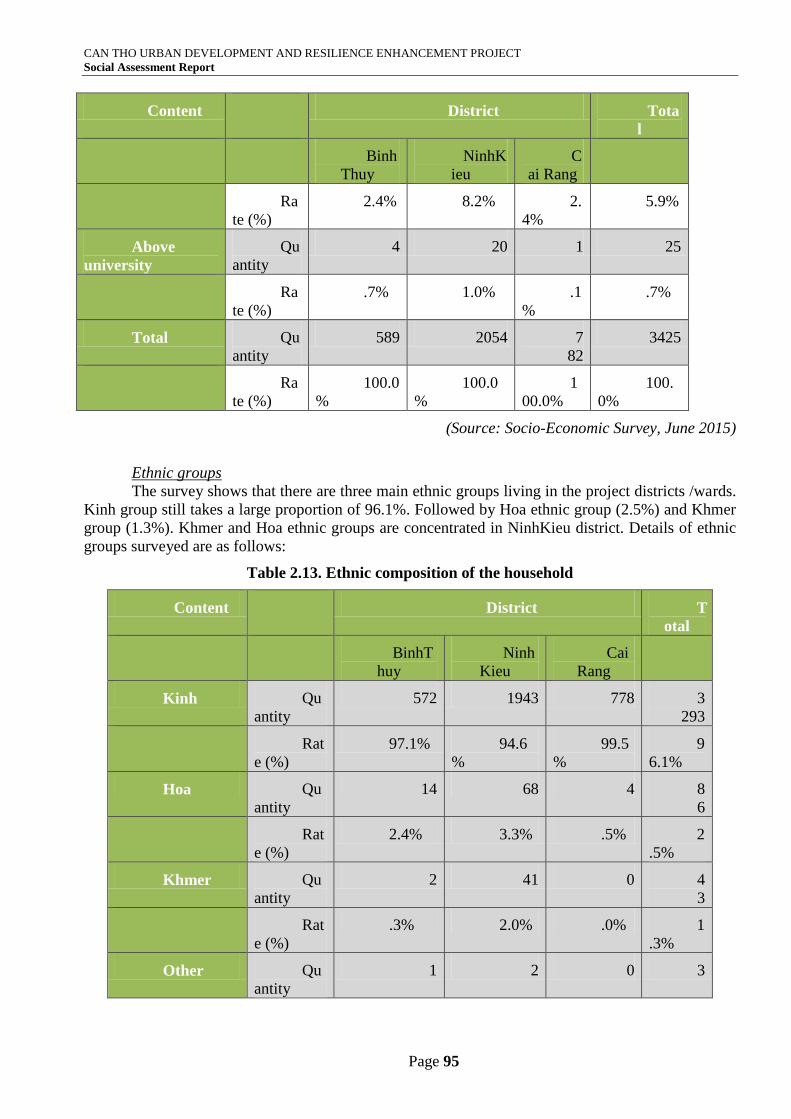
CAN THO URBAN DEVELOPMENT AND RESILIENCE ENHANCEMENT PROJECT
Social Assessment Report
Page 95
Content District Tota
l
Binh
Thuy
NinhK
ieu
C
ai Rang
Ra
te (%)
2.4% 8.2% 2.
4%
5.9%
Above
university
Qu
antity
4 20 1 25
Ra
te (%)
.7% 1.0% .1
%
.7%
Total Qu
antity
589 2054 7
82
3425
Ra
te (%)
100.0
%
100.0
%
1
00.0%
100.
0%
(Source: Socio-Economic Survey, June 2015)
Ethnic groups
The survey shows that there are three main ethnic groups living in the project districts /wards.
Kinh group still takes a large proportion of 96.1%. Followed by Hoa ethnic group (2.5%) and Khmer
group (1.3%). Khmer and Hoa ethnic groups are concentrated in NinhKieu district. Details of ethnic
groups surveyed are as follows:
Table 2.13. Ethnic composition of the household
Content District T
otal
BinhT
huy
Ninh
Kieu
Cai
Rang
Kinh Qu
antity
572 1943 778 3
293
Rat
e (%)
97.1% 94.6
%
99.5
%
9
6.1%
Hoa Qu
antity
14 68 4 8
6
Rat
e (%)
2.4% 3.3% .5% 2
.5%
Khmer Qu
antity
2 41 0 4
3
Rat
e (%)
.3% 2.0% .0% 1
.3%
Other Qu
antity
1 2 0 3
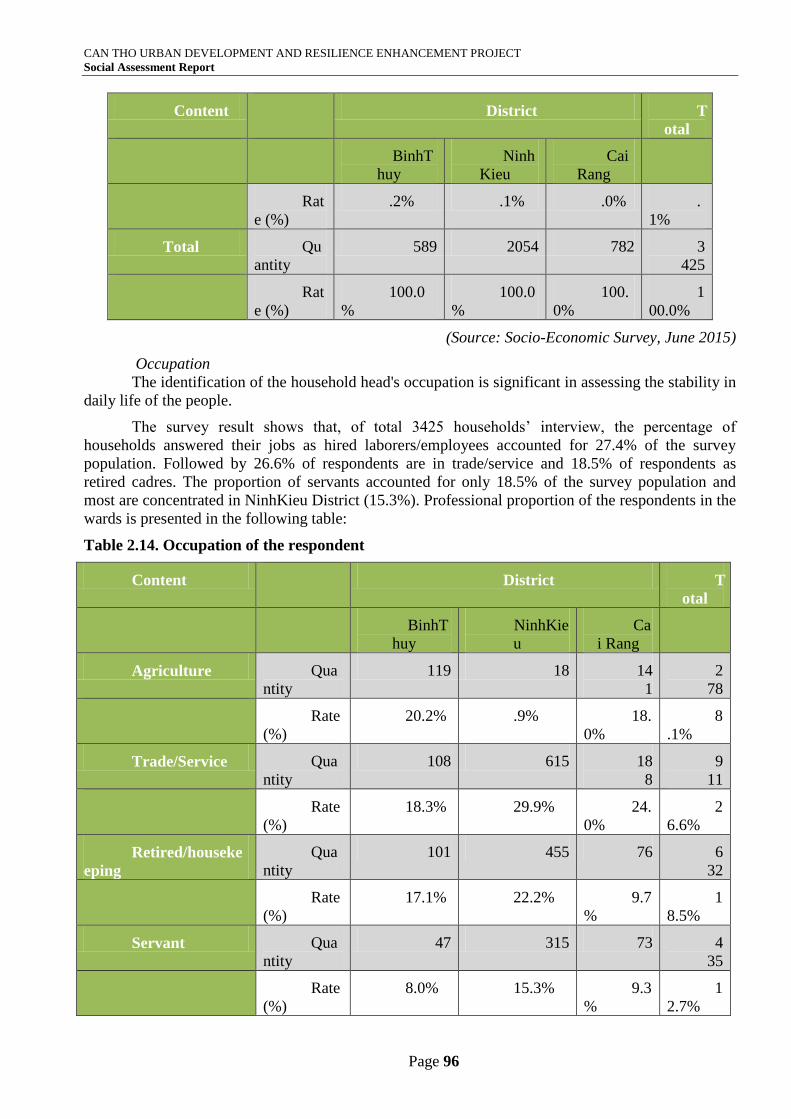
CAN THO URBAN DEVELOPMENT AND RESILIENCE ENHANCEMENT PROJECT
Social Assessment Report
Page 96
Content District T
otal
BinhT
huy
Ninh
Kieu
Cai
Rang
Rat
e (%)
.2% .1% .0% .
1%
Total Qu
antity
589 2054 782 3
425
Rat
e (%)
100.0
%
100.0
%
100.
0%
1
00.0%
(Source: Socio-Economic Survey, June 2015)
Occupation
The identification of the household head's occupation is significant in assessing the stability in
daily life of the people.
The survey result shows that, of total 3425 households’ interview, the percentage of
households answered their jobs as hired laborers/employees accounted for 27.4% of the survey
population. Followed by 26.6% of respondents are in trade/service and 18.5% of respondents as
retired cadres. The proportion of servants accounted for only 18.5% of the survey population and
most are concentrated in NinhKieu District (15.3%). Professional proportion of the respondents in the
wards is presented in the following table:
Table 2.14. Occupation of the respondent
Content District T
otal
BinhT
huy
NinhKie
u
Ca
i Rang
Agriculture Qua
ntity
119 18 14
1
2
78
Rate
(%)
20.2% .9% 18.
0%
8
.1%
Trade/Service Qua
ntity
108 615 18
8
9
11
Rate
(%)
18.3% 29.9% 24.
0%
2
6.6%
Retired/houseke
eping
Qua
ntity
101 455 76 6
32
Rate
(%)
17.1% 22.2% 9.7
%
1
8.5%
Servant Qua
ntity
47 315 73 4
35
Rate
(%)
8.0% 15.3% 9.3
%
1
2.7%
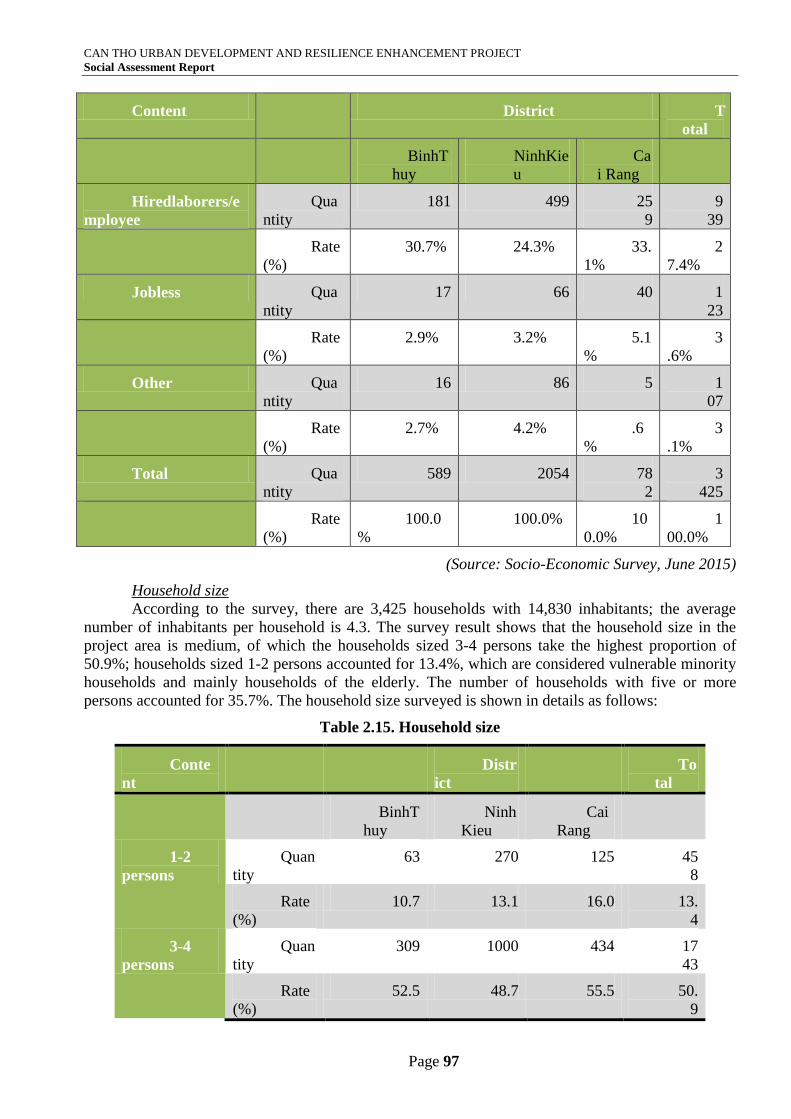
CAN THO URBAN DEVELOPMENT AND RESILIENCE ENHANCEMENT PROJECT
Social Assessment Report
Page 97
Content District T
otal
BinhT
huy
NinhKie
u
Ca
i Rang
Hiredlaborers/e
mployee
Qua
ntity
181 499 25
9
9
39
Rate
(%)
30.7% 24.3% 33.
1%
2
7.4%
Jobless Qua
ntity
17 66 40 1
23
Rate
(%)
2.9% 3.2% 5.1
%
3
.6%
Other Qua
ntity
16 86 5 1
07
Rate
(%)
2.7% 4.2% .6
%
3
.1%
Total Qua
ntity
589 2054 78
2
3
425
Rate
(%)
100.0
%
100.0% 10
0.0%
1
00.0%
(Source: Socio-Economic Survey, June 2015)
Household size
According to the survey, there are 3,425 households with 14,830 inhabitants; the average
number of inhabitants per household is 4.3. The survey result shows that the household size in the
project area is medium, of which the households sized 3-4 persons take the highest proportion of
50.9%; households sized 1-2 persons accounted for 13.4%, which are considered vulnerable minority
households and mainly households of the elderly. The number of households with five or more
persons accounted for 35.7%. The household size surveyed is shown in details as follows:
Table 2.15. Household size
Conte
nt
Distr
ict
To
tal
BinhT
huy
Ninh
Kieu
Cai
Rang
1-2
persons
Quan
tity
63 270 125 45
8
Rate
(%)
10.7 13.1 16.0 13.
4
3-4
persons
Quan
tity
309 1000 434 17
43
Rate
(%)
52.5 48.7 55.5 50.
9
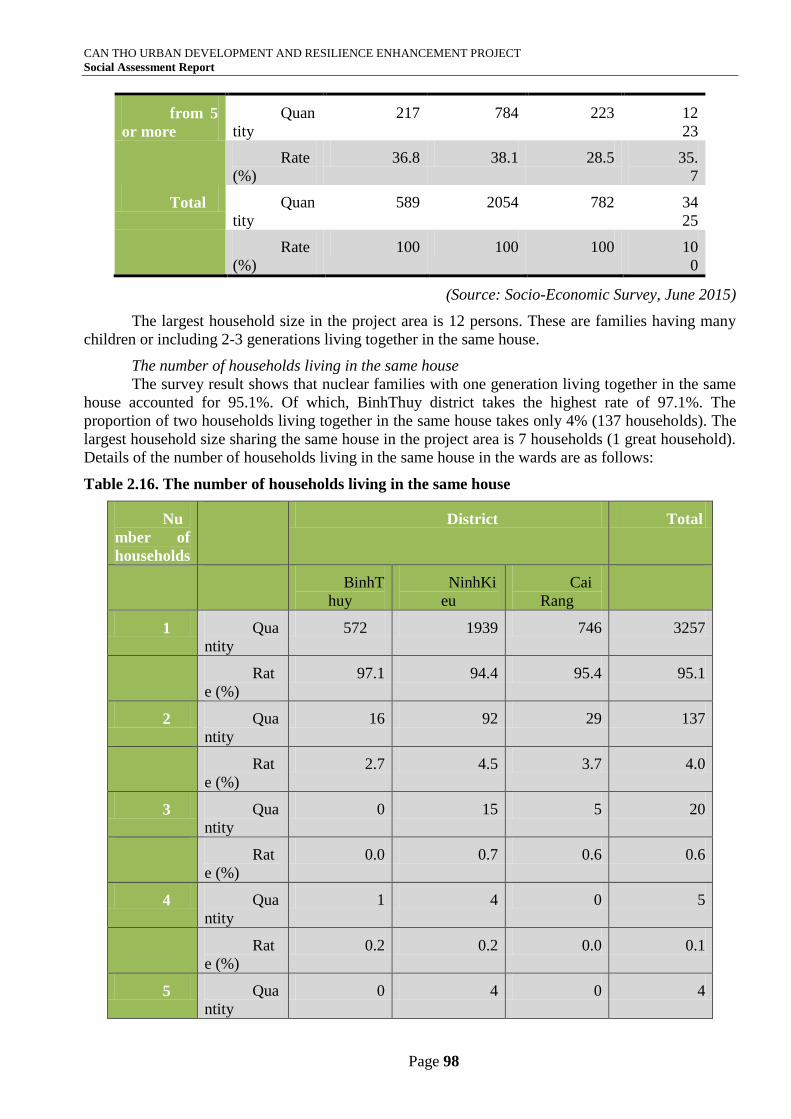
CAN THO URBAN DEVELOPMENT AND RESILIENCE ENHANCEMENT PROJECT
Social Assessment Report
Page 98
from 5
or more
Quan
tity
217 784 223 12
23
Rate
(%)
36.8 38.1 28.5 35.
7
Total Quan
tity
589 2054 782 34
25
Rate
(%)
100 100 100 10
0
(Source: Socio-Economic Survey, June 2015)
The largest household size in the project area is 12 persons. These are families having many
children or including 2-3 generations living together in the same house.
The number of households living in the same house
The survey result shows that nuclear families with one generation living together in the same
house accounted for 95.1%. Of which, BinhThuy district takes the highest rate of 97.1%. The
proportion of two households living together in the same house takes only 4% (137 households). The
largest household size sharing the same house in the project area is 7 households (1 great household).
Details of the number of households living in the same house in the wards are as follows:
Table 2.16. The number of households living in the same house
Nu
mber of
households
District Total
BinhT
huy
NinhKi
eu
Cai
Rang
1 Qua
ntity
572 1939 746 3257
Rat
e (%)
97.1 94.4 95.4 95.1
2 Qua
ntity
16 92 29 137
Rat
e (%)
2.7 4.5 3.7 4.0
3 Qua
ntity
0 15 5 20
Rat
e (%)
0.0 0.7 0.6 0.6
4 Qua
ntity
1 4 0 5
Rat
e (%)
0.2 0.2 0.0 0.1
5 Qua
ntity
0 4 0 4
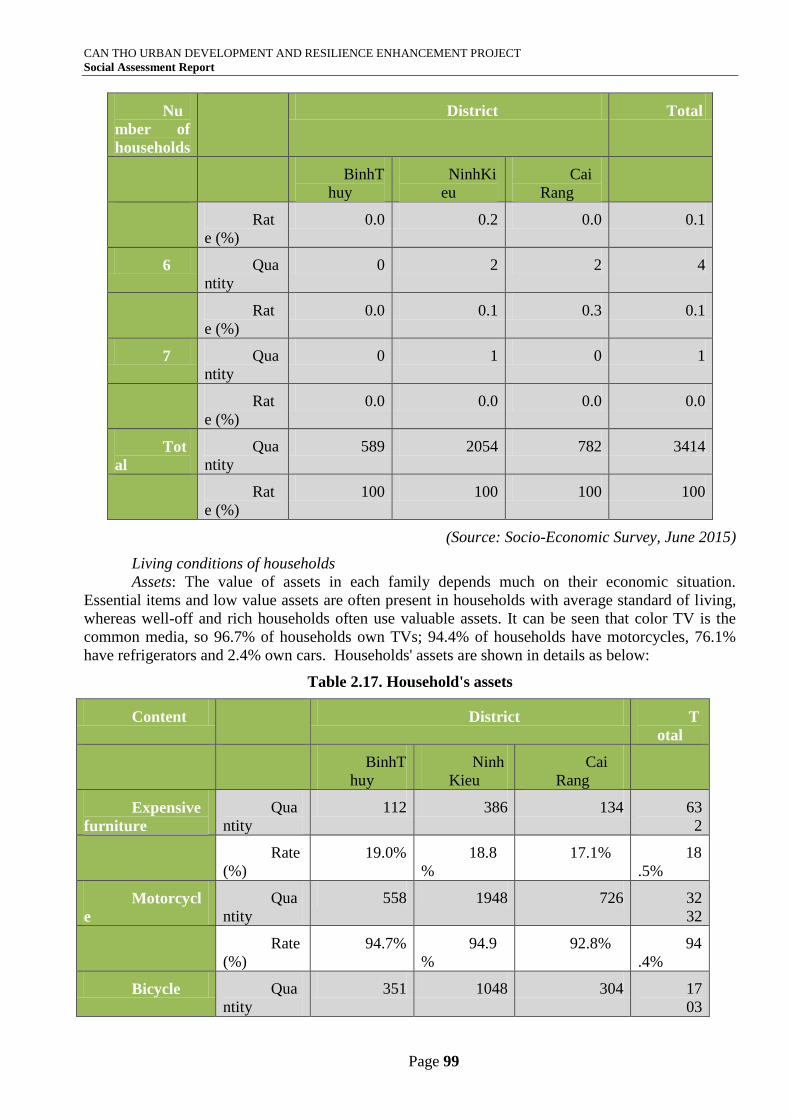
CAN THO URBAN DEVELOPMENT AND RESILIENCE ENHANCEMENT PROJECT
Social Assessment Report
Page 99
Nu
mber of
households
District Total
BinhT
huy
NinhKi
eu
Cai
Rang
Rat
e (%)
0.0 0.2 0.0 0.1
6 Qua
ntity
0 2 2 4
Rat
e (%)
0.0 0.1 0.3 0.1
7 Qua
ntity
0 1 0 1
Rat
e (%)
0.0 0.0 0.0 0.0
Tot
al
Qua
ntity
589 2054 782 3414
Rat
e (%)
100 100 100 100
(Source: Socio-Economic Survey, June 2015)
Living conditions of households
Assets: The value of assets in each family depends much on their economic situation.
Essential items and low value assets are often present in households with average standard of living,
whereas well-off and rich households often use valuable assets. It can be seen that color TV is the
common media, so 96.7% of households own TVs; 94.4% of households have motorcycles, 76.1%
have refrigerators and 2.4% own cars. Households' assets are shown in details as below:
Table 2.17. Household's assets
Content District T
otal
BinhT
huy
Ninh
Kieu
Cai
Rang
Expensive
furniture
Qua
ntity
112 386 134 63
2
Rate
(%)
19.0% 18.8
%
17.1% 18
.5%
Motorcycl
e
Qua
ntity
558 1948 726 32
32
Rate
(%)
94.7% 94.9
%
92.8% 94
.4%
Bicycle Qua
ntity
351 1048 304 17
03
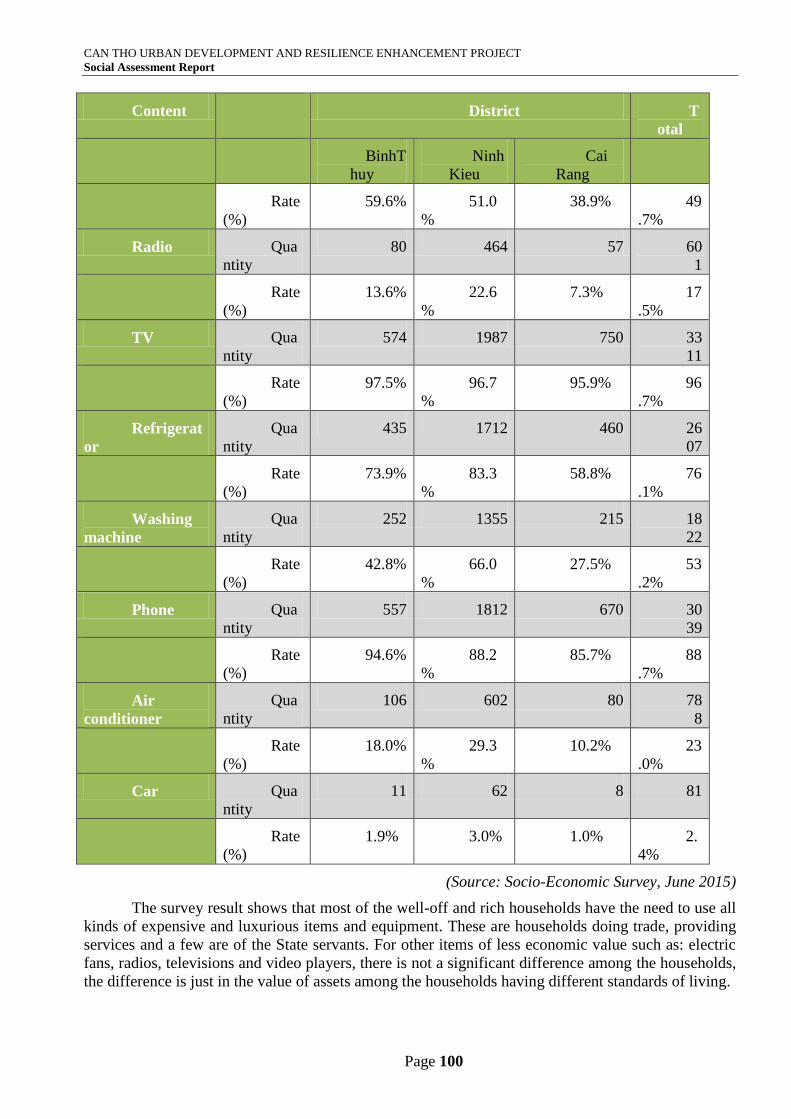
CAN THO URBAN DEVELOPMENT AND RESILIENCE ENHANCEMENT PROJECT
Social Assessment Report
Page 100
Content District T
otal
BinhT
huy
Ninh
Kieu
Cai
Rang
Rate
(%)
59.6% 51.0
%
38.9% 49
.7%
Radio Qua
ntity
80 464 57 60
1
Rate
(%)
13.6% 22.6
%
7.3% 17
.5%
TV Qua
ntity
574 1987 750 33
11
Rate
(%)
97.5% 96.7
%
95.9% 96
.7%
Refrigerat
or
Qua
ntity
435 1712 460 26
07
Rate
(%)
73.9% 83.3
%
58.8% 76
.1%
Washing
machine
Qua
ntity
252 1355 215 18
22
Rate
(%)
42.8% 66.0
%
27.5% 53
.2%
Phone Qua
ntity
557 1812 670 30
39
Rate
(%)
94.6% 88.2
%
85.7% 88
.7%
Air
conditioner
Qua
ntity
106 602 80 78
8
Rate
(%)
18.0% 29.3
%
10.2% 23
.0%
Car Qua
ntity
11 62 8 81
Rate
(%)
1.9% 3.0% 1.0% 2.
4%
(Source: Socio-Economic Survey, June 2015)
The survey result shows that most of the well-off and rich households have the need to use all
kinds of expensive and luxurious items and equipment. These are households doing trade, providing
services and a few are of the State servants. For other items of less economic value such as: electric
fans, radios, televisions and video players, there is not a significant difference among the households,
the difference is just in the value of assets among the households having different standards of living.
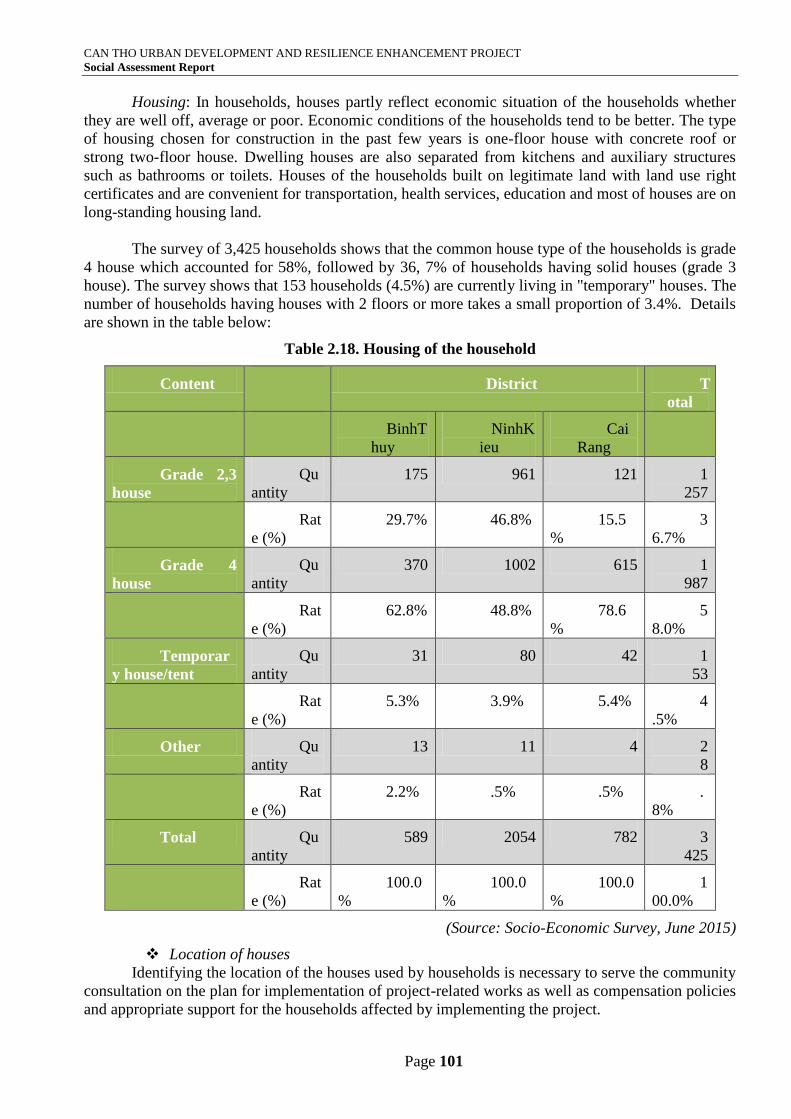
CAN THO URBAN DEVELOPMENT AND RESILIENCE ENHANCEMENT PROJECT
Social Assessment Report
Page 101
Housing: In households, houses partly reflect economic situation of the households whether
they are well off, average or poor. Economic conditions of the households tend to be better. The type
of housing chosen for construction in the past few years is one-floor house with concrete roof or
strong two-floor house. Dwelling houses are also separated from kitchens and auxiliary structures
such as bathrooms or toilets. Houses of the households built on legitimate land with land use right
certificates and are convenient for transportation, health services, education and most of houses are on
long-standing housing land.
The survey of 3,425 households shows that the common house type of the households is grade
4 house which accounted for 58%, followed by 36, 7% of households having solid houses (grade 3
house). The survey shows that 153 households (4.5%) are currently living in "temporary" houses. The
number of households having houses with 2 floors or more takes a small proportion of 3.4%. Details
are shown in the table below:
Table 2.18. Housing of the household
Content District T
otal
BinhT
huy
NinhK
ieu
Cai
Rang
Grade 2,3
house
Qu
antity
175 961 121 1
257
Rat
e (%)
29.7% 46.8% 15.5
%
3
6.7%
Grade 4
house
Qu
antity
370 1002 615 1
987
Rat
e (%)
62.8% 48.8% 78.6
%
5
8.0%
Temporar
y house/tent
Qu
antity
31 80 42 1
53
Rat
e (%)
5.3% 3.9% 5.4% 4
.5%
Other Qu
antity
13 11 4 2
8
Rat
e (%)
2.2% .5% .5% .
8%
Total Qu
antity
589 2054 782 3
425
Rat
e (%)
100.0
%
100.0
%
100.0
%
1
00.0%
(Source: Socio-Economic Survey, June 2015)
Location of houses
Identifying the location of the houses used by households is necessary to serve the community
consultation on the plan for implementation of project-related works as well as compensation policies
and appropriate support for the households affected by implementing the project.
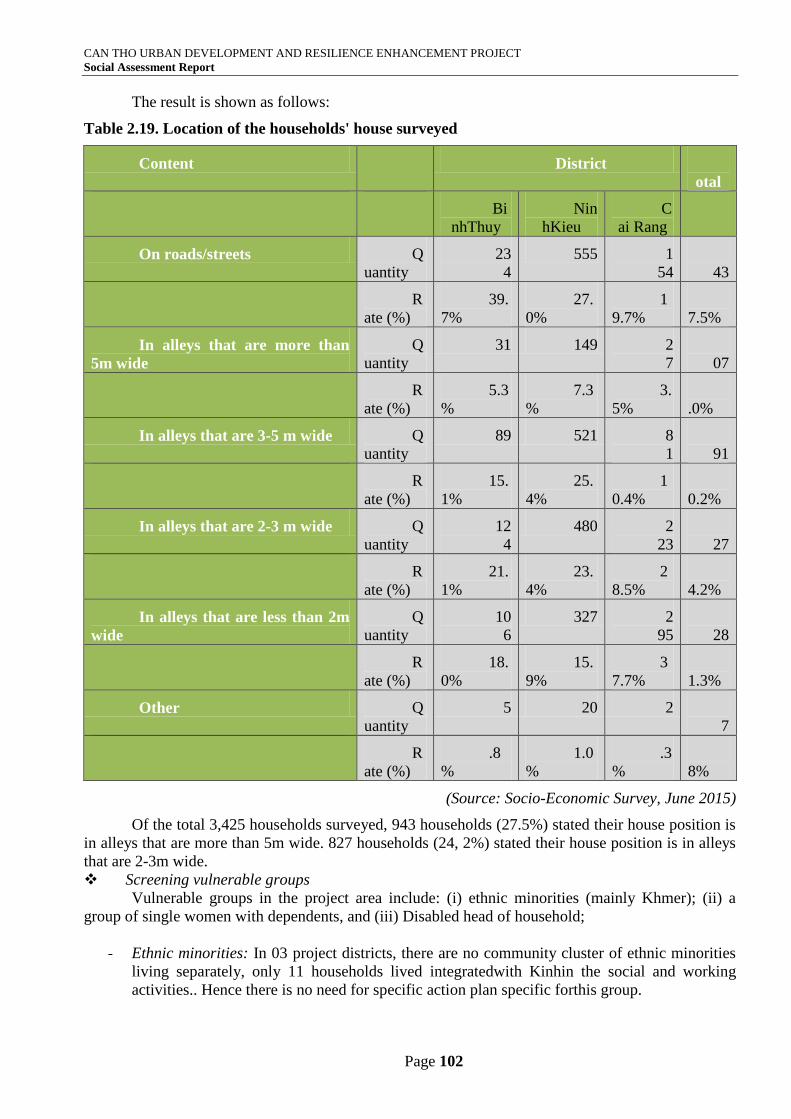
CAN THO URBAN DEVELOPMENT AND RESILIENCE ENHANCEMENT PROJECT
Social Assessment Report
Page 102
The result is shown as follows:
Table 2.19. Location of the households' house surveyed
Content District T
otal
Bi
nhThuy
Nin
hKieu
C
ai Rang
On roads/streets Q
uantity
23
4
555 1
54
9
43
R
ate (%)
39.
7%
27.
0%
1
9.7%
2
7.5%
In alleys that are more than
5m wide
Q
uantity
31 149 2
7
2
07
R
ate (%)
5.3
%
7.3
%
3.
5%
6
.0%
In alleys that are 3-5 m wide Q
uantity
89 521 8
1
6
91
R
ate (%)
15.
1%
25.
4%
1
0.4%
2
0.2%
In alleys that are 2-3 m wide Q
uantity
12
4
480 2
23
8
27
R
ate (%)
21.
1%
23.
4%
2
8.5%
2
4.2%
In alleys that are less than 2m
wide
Q
uantity
10
6
327 2
95
7
28
R
ate (%)
18.
0%
15.
9%
3
7.7%
2
1.3%
Other Q
uantity
5 20 2 2
7
R
ate (%)
.8
%
1.0
%
.3
%
.
8%
(Source: Socio-Economic Survey, June 2015)
Of the total 3,425 households surveyed, 943 households (27.5%) stated their house position is
in alleys that are more than 5m wide. 827 households (24, 2%) stated their house position is in alleys
that are 2-3m wide.
Screening vulnerable groups
Vulnerable groups in the project area include: (i) ethnic minorities (mainly Khmer); (ii) a
group of single women with dependents, and (iii) Disabled head of household;
- Ethnic minorities: In 03 project districts, there are no community cluster of ethnic minorities
living separately, only 11 households lived integratedwith Kinhin the social and working
activities.. Hence there is no need for specific action plan specific forthis group.
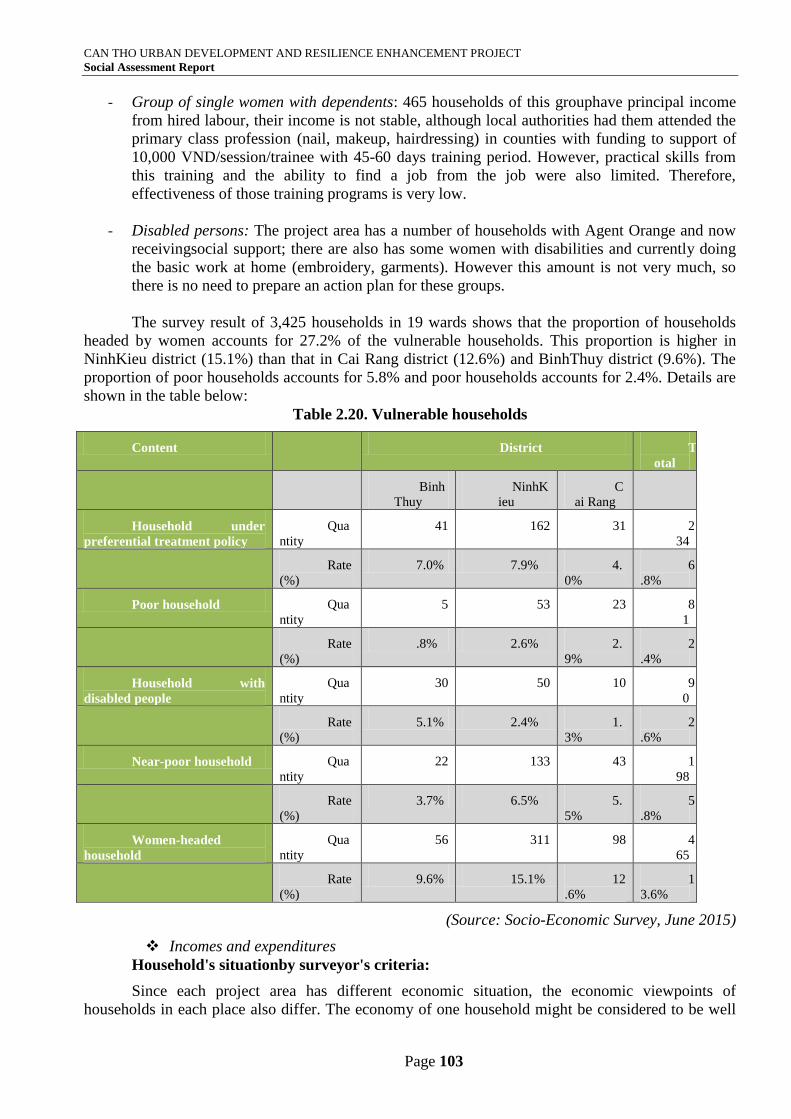
CAN THO URBAN DEVELOPMENT AND RESILIENCE ENHANCEMENT PROJECT
Social Assessment Report
Page 103
- Group of single women with dependents: 465 households of this grouphave principal income
from hired labour, their income is not stable, although local authorities had them attended the
primary class profession (nail, makeup, hairdressing) in counties with funding to support of
10,000 VND/session/trainee with 45-60 days training period. However, practical skills from
this training and the ability to find a job from the job were also limited. Therefore,
effectiveness of those training programs is very low.
- Disabled persons: The project area has a number of households with Agent Orange and now
receivingsocial support; there are also has some women with disabilities and currently doing
the basic work at home (embroidery, garments). However this amount is not very much, so
there is no need to prepare an action plan for these groups.
The survey result of 3,425 households in 19 wards shows that the proportion of households
headed by women accounts for 27.2% of the vulnerable households. This proportion is higher in
NinhKieu district (15.1%) than that in Cai Rang district (12.6%) and BinhThuy district (9.6%). The
proportion of poor households accounts for 5.8% and poor households accounts for 2.4%. Details are
shown in the table below:
Table 2.20. Vulnerable households
Content District T
otal
Binh
Thuy
NinhK
ieu
C
ai Rang
Household under
preferential treatment policy
Qua
ntity
41 162 31 2
34
Rate
(%)
7.0% 7.9% 4.
0%
6
.8%
Poor household Qua
ntity
5 53 23 8
1
Rate
(%)
.8% 2.6% 2.
9%
2
.4%
Household with
disabled people
Qua
ntity
30 50 10 9
0
Rate
(%)
5.1% 2.4% 1.
3%
2
.6%
Near-poor household Qua
ntity
22 133 43 1
98
Rate
(%)
3.7% 6.5% 5.
5%
5
.8%
Women-headed
household
Qua
ntity
56 311 98 4
65
Rate
(%)
9.6% 15.1% 12
.6%
1
3.6%
(Source: Socio-Economic Survey, June 2015)
Incomes and expenditures
Household's situationby surveyor's criteria:
Since each project area has different economic situation, the economic viewpoints of
households in each place also differ. The economy of one household might be considered to be well
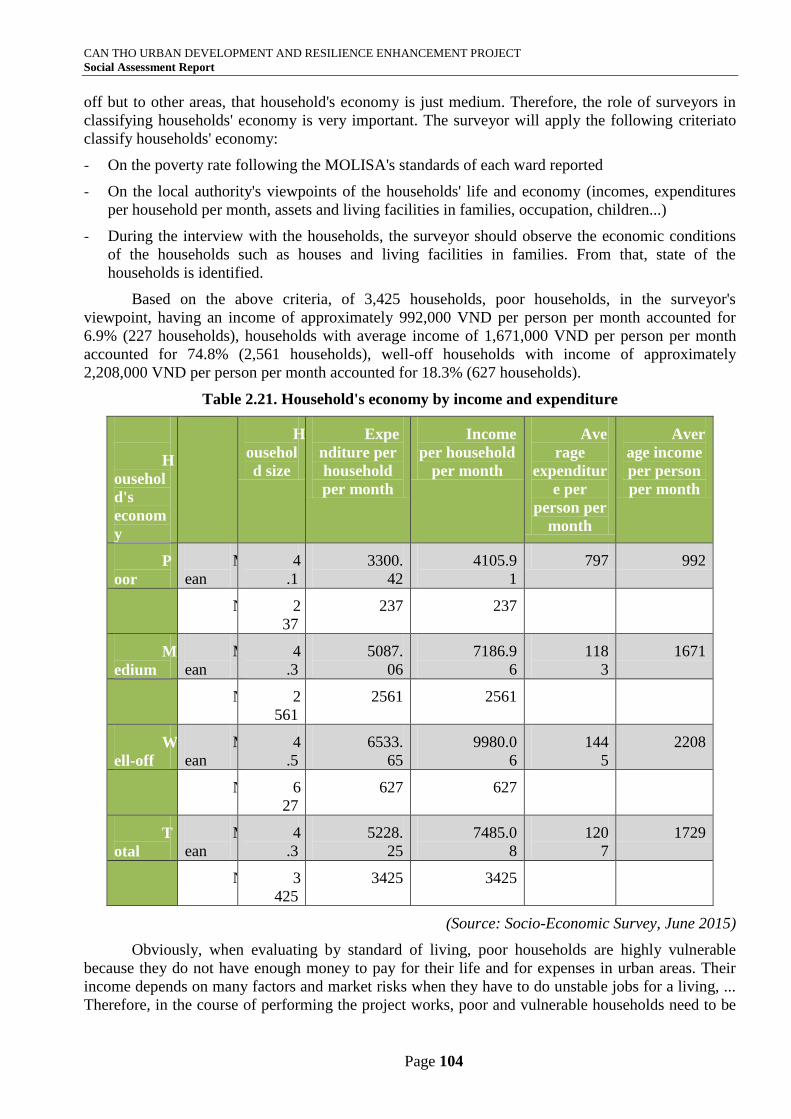
CAN THO URBAN DEVELOPMENT AND RESILIENCE ENHANCEMENT PROJECT
Social Assessment Report
Page 104
off but to other areas, that household's economy is just medium. Therefore, the role of surveyors in
classifying households' economy is very important. The surveyor will apply the following criteriato
classify households' economy:
- On the poverty rate following the MOLISA's standards of each ward reported
- On the local authority's viewpoints of the households' life and economy (incomes, expenditures
per household per month, assets and living facilities in families, occupation, children...)
- During the interview with the households, the surveyor should observe the economic conditions
of the households such as houses and living facilities in families. From that, state of the
households is identified.
Based on the above criteria, of 3,425 households, poor households, in the surveyor's
viewpoint, having an income of approximately 992,000 VND per person per month accounted for
6.9% (227 households), households with average income of 1,671,000 VND per person per month
accounted for 74.8% (2,561 households), well-off households with income of approximately
2,208,000 VND per person per month accounted for 18.3% (627 households).
Table 2.21. Household's economy by income and expenditure
H
ousehol
d's
econom
y
H
ousehol
d size
Expe
nditure per
household
per month
Income
per household
per month
Ave
rage
expenditur
e per
person per
month
Aver
age income
per person
per month
P
oor
M
ean
4
.1
3300.
42
4105.9
1
797 992
N 2
37
237 237
M
edium
M
ean
4
.3
5087.
06
7186.9
6
118
3
1671
N 2
561
2561 2561
W
ell-off
M
ean
4
.5
6533.
65
9980.0
6
144
5
2208
N 6
27
627 627
T
otal
M
ean
4
.3
5228.
25
7485.0
8
120
7
1729
N 3
425
3425 3425
(Source: Socio-Economic Survey, June 2015)
Obviously, when evaluating by standard of living, poor households are highly vulnerable
because they do not have enough money to pay for their life and for expenses in urban areas. Their
income depends on many factors and market risks when they have to do unstable jobs for a living, ...
Therefore, in the course of performing the project works, poor and vulnerable households need to be
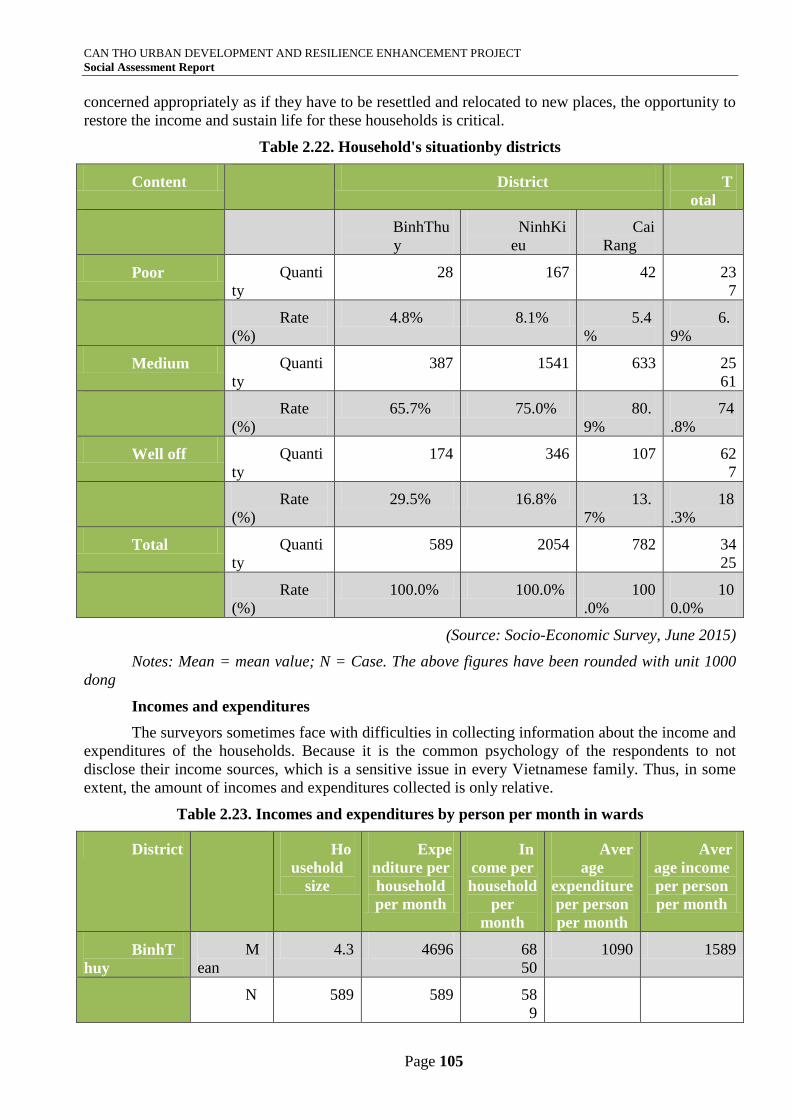
CAN THO URBAN DEVELOPMENT AND RESILIENCE ENHANCEMENT PROJECT
Social Assessment Report
Page 105
concerned appropriately as if they have to be resettled and relocated to new places, the opportunity to
restore the income and sustain life for these households is critical.
Table 2.22. Household's situationby districts
Content District T
otal
BinhThu
y
NinhKi
eu
Cai
Rang
Poor Quanti
ty
28 167 42 23
7
Rate
(%)
4.8% 8.1% 5.4
%
6.
9%
Medium Quanti
ty
387 1541 633 25
61
Rate
(%)
65.7% 75.0% 80.
9%
74
.8%
Well off Quanti
ty
174 346 107 62
7
Rate
(%)
29.5% 16.8% 13.
7%
18
.3%
Total Quanti
ty
589 2054 782 34
25
Rate
(%)
100.0% 100.0% 100
.0%
10
0.0%
(Source: Socio-Economic Survey, June 2015)
Notes: Mean = mean value; N = Case. The above figures have been rounded with unit 1000
dong
Incomes and expenditures
The surveyors sometimes face with difficulties in collecting information about the income and
expenditures of the households. Because it is the common psychology of the respondents to not
disclose their income sources, which is a sensitive issue in every Vietnamese family. Thus, in some
extent, the amount of incomes and expenditures collected is only relative.
Table 2.23. Incomes and expenditures by person per month in wards
District Ho
usehold
size
Expe
nditure per
household
per month
In
come per
household
per
month
Aver
age
expenditure
per person
per month
Aver
age income
per person
per month
BinhT
huy
M
ean
4.3 4696 68
50
1090 1589
N 589 589 58
9
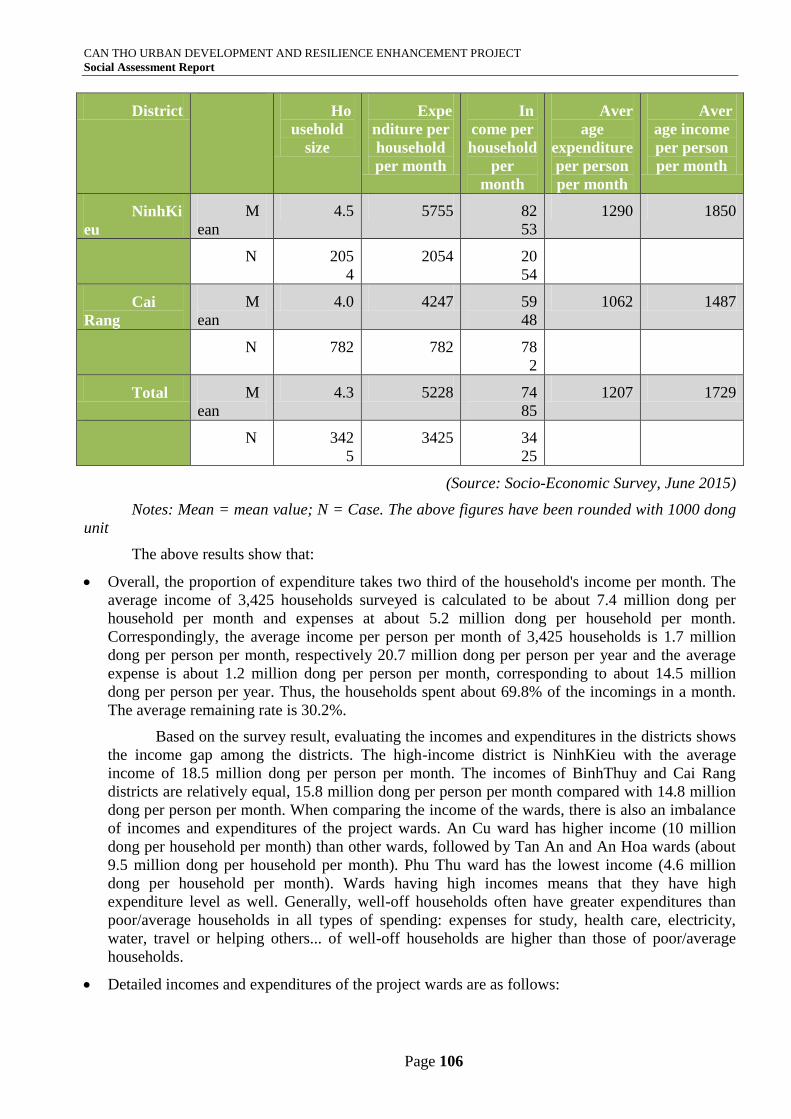
CAN THO URBAN DEVELOPMENT AND RESILIENCE ENHANCEMENT PROJECT
Social Assessment Report
Page 106
District Ho
usehold
size
Expe
nditure per
household
per month
In
come per
household
per
month
Aver
age
expenditure
per person
per month
Aver
age income
per person
per month
NinhKi
eu
M
ean
4.5 5755 82
53
1290 1850
N 205
4
2054 20
54
Cai
Rang
M
ean
4.0 4247 59
48
1062 1487
N 782 782 78
2
Total M
ean
4.3 5228 74
85
1207 1729
N 342
5
3425 34
25
(Source: Socio-Economic Survey, June 2015)
Notes: Mean = mean value; N = Case. The above figures have been rounded with 1000 dong
unit
The above results show that:
Overall, the proportion of expenditure takes two third of the household's income per month. The
average income of 3,425 households surveyed is calculated to be about 7.4 million dong per
household per month and expenses at about 5.2 million dong per household per month.
Correspondingly, the average income per person per month of 3,425 households is 1.7 million
dong per person per month, respectively 20.7 million dong per person per year and the average
expense is about 1.2 million dong per person per month, corresponding to about 14.5 million
dong per person per year. Thus, the households spent about 69.8% of the incomings in a month.
The average remaining rate is 30.2%.
Based on the survey result, evaluating the incomes and expenditures in the districts shows
the income gap among the districts. The high-income district is NinhKieu with the average
income of 18.5 million dong per person per month. The incomes of BinhThuy and Cai Rang
districts are relatively equal, 15.8 million dong per person per month compared with 14.8 million
dong per person per month. When comparing the income of the wards, there is also an imbalance
of incomes and expenditures of the project wards. An Cu ward has higher income (10 million
dong per household per month) than other wards, followed by Tan An and An Hoa wards (about
9.5 million dong per household per month). Phu Thu ward has the lowest income (4.6 million
dong per household per month). Wards having high incomes means that they have high
expenditure level as well. Generally, well-off households often have greater expenditures than
poor/average households in all types of spending: expenses for study, health care, electricity,
water, travel or helping others... of well-off households are higher than those of poor/average
households.
Detailed incomes and expenditures of the project wards are as follows:
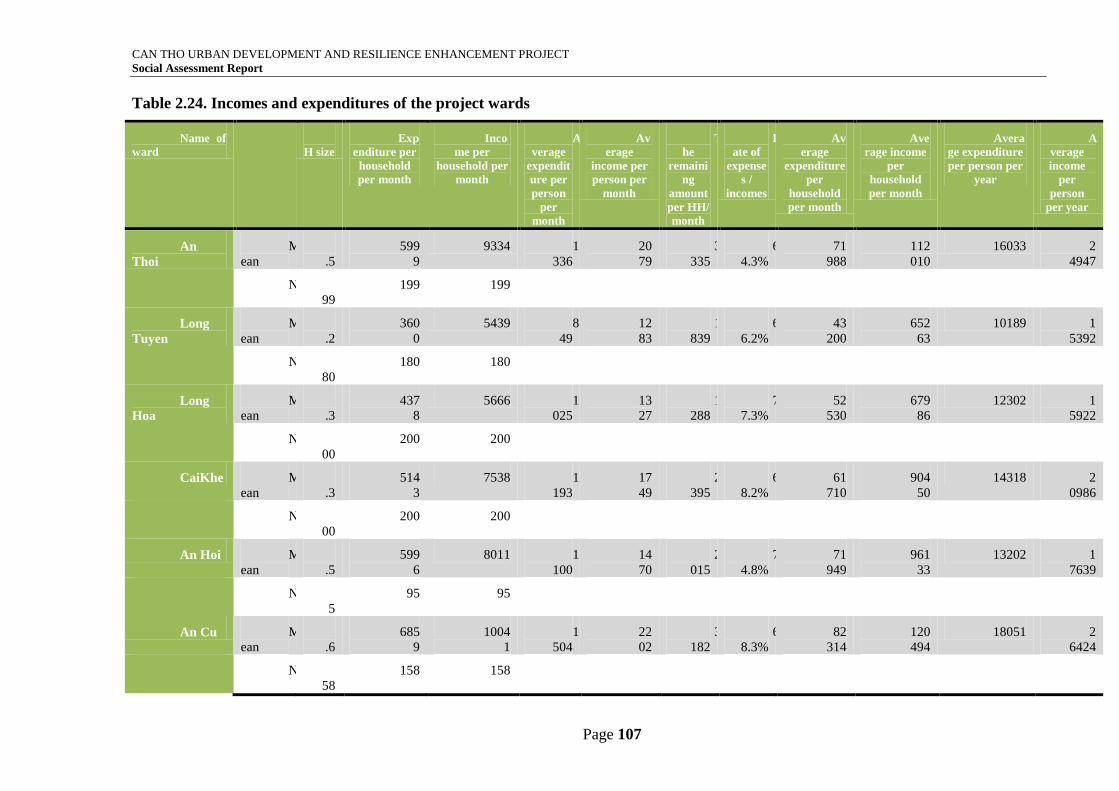
CAN THO URBAN DEVELOPMENT AND RESILIENCE ENHANCEMENT PROJECT
Social Assessment Report
Page 107
Table 2.24. Incomes and expenditures of the project wards
Name of
ward
H
H size
Exp
enditure per
household
per month
Inco
me per
household per
month
A
verage
expendit
ure per
person
per
month
Av
erage
income per
person per
month
T
he
remaini
ng
amount
per HH/
month
R
ate of
expense
s /
incomes
Av
erage
expenditure
per
household
per month
Ave
rage income
per
household
per month
Avera
ge expenditure
per person per
year
A
verage
income
per
person
per year
An
Thoi
M
ean
4
.5
599
9
9334 1
336
20
79
3
335
6
4.3%
71
988
112
010
16033 2
4947
N 1
99
199 199
Long
Tuyen
M
ean
4
.2
360
0
5439 8
49
12
83
1
839
6
6.2%
43
200
652
63
10189 1
5392
N 1
80
180 180
Long
Hoa
M
ean
4
.3
437
8
5666 1
025
13
27
1
288
7
7.3%
52
530
679
86
12302 1
5922
N 2
00
200 200
CaiKhe M
ean
4
.3
514
3
7538 1
193
17
49
2
395
6
8.2%
61
710
904
50
14318 2
0986
N 2
00
200 200
An Hoi M
ean
5
.5
599
6
8011 1
100
14
70
2
015
7
4.8%
71
949
961
33
13202 1
7639
N 9
5
95 95
An Cu M
ean
4
.6
685
9
1004
1
1
504
22
02
3
182
6
8.3%
82
314
120
494
18051 2
6424
N 1
58
158 158
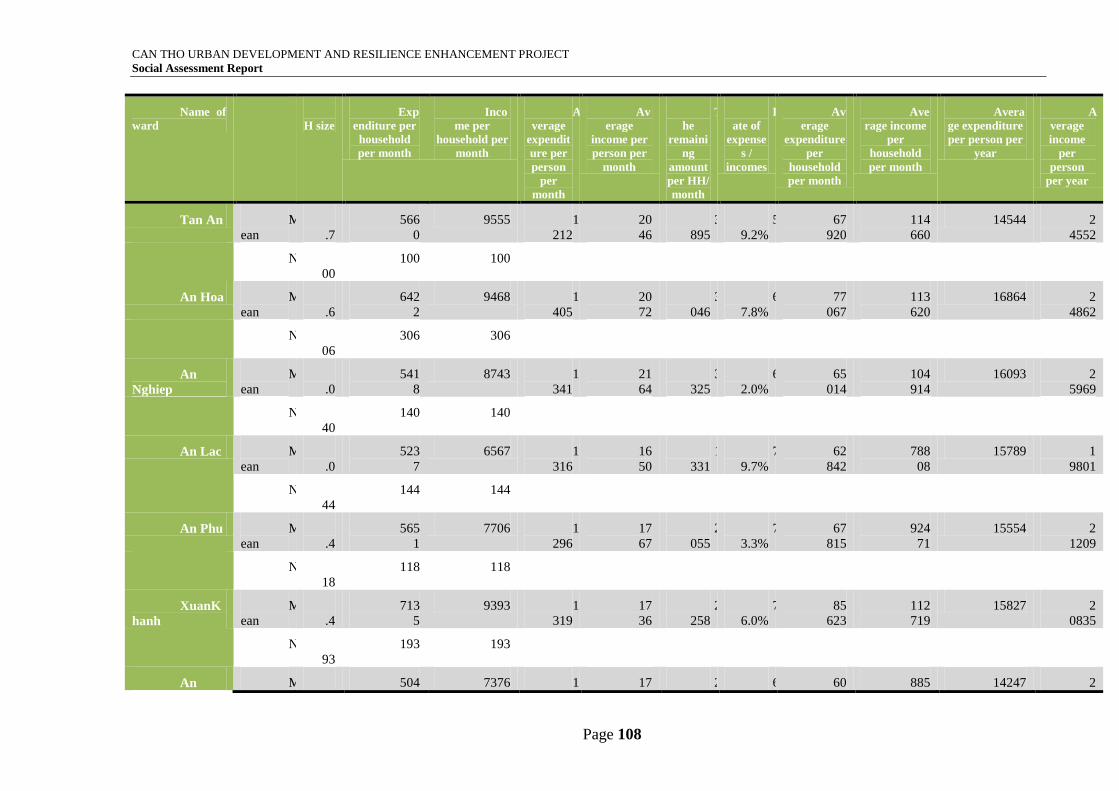
CAN THO URBAN DEVELOPMENT AND RESILIENCE ENHANCEMENT PROJECT
Social Assessment Report
Page 108
Name of
ward
H
H size
Exp
enditure per
household
per month
Inco
me per
household per
month
A
verage
expendit
ure per
person
per
month
Av
erage
income per
person per
month
T
he
remaini
ng
amount
per HH/
month
R
ate of
expense
s /
incomes
Av
erage
expenditure
per
household
per month
Ave
rage income
per
household
per month
Avera
ge expenditure
per person per
year
A
verage
income
per
person
per year
Tan An M
ean
4
.7
566
0
9555 1
212
20
46
3
895
5
9.2%
67
920
114
660
14544 2
4552
N 1
00
100 100
An Hoa M
ean
4
.6
642
2
9468 1
405
20
72
3
046
6
7.8%
77
067
113
620
16864 2
4862
N 3
06
306 306
An
Nghiep
M
ean
4
.0
541
8
8743 1
341
21
64
3
325
6
2.0%
65
014
104
914
16093 2
5969
N 1
40
140 140
An Lac M
ean
4
.0
523
7
6567 1
316
16
50
1
331
7
9.7%
62
842
788
08
15789 1
9801
N 1
44
144 144
An Phu M
ean
4
.4
565
1
7706 1
296
17
67
2
055
7
3.3%
67
815
924
71
15554 2
1209
N 1
18
118 118
XuanK
hanh
M
ean
5
.4
713
5
9393 1
319
17
36
2
258
7
6.0%
85
623
112
719
15827 2
0835
N 1
93
193 193
An M 4 504 7376 1 17 2 6 60 885 14247 2
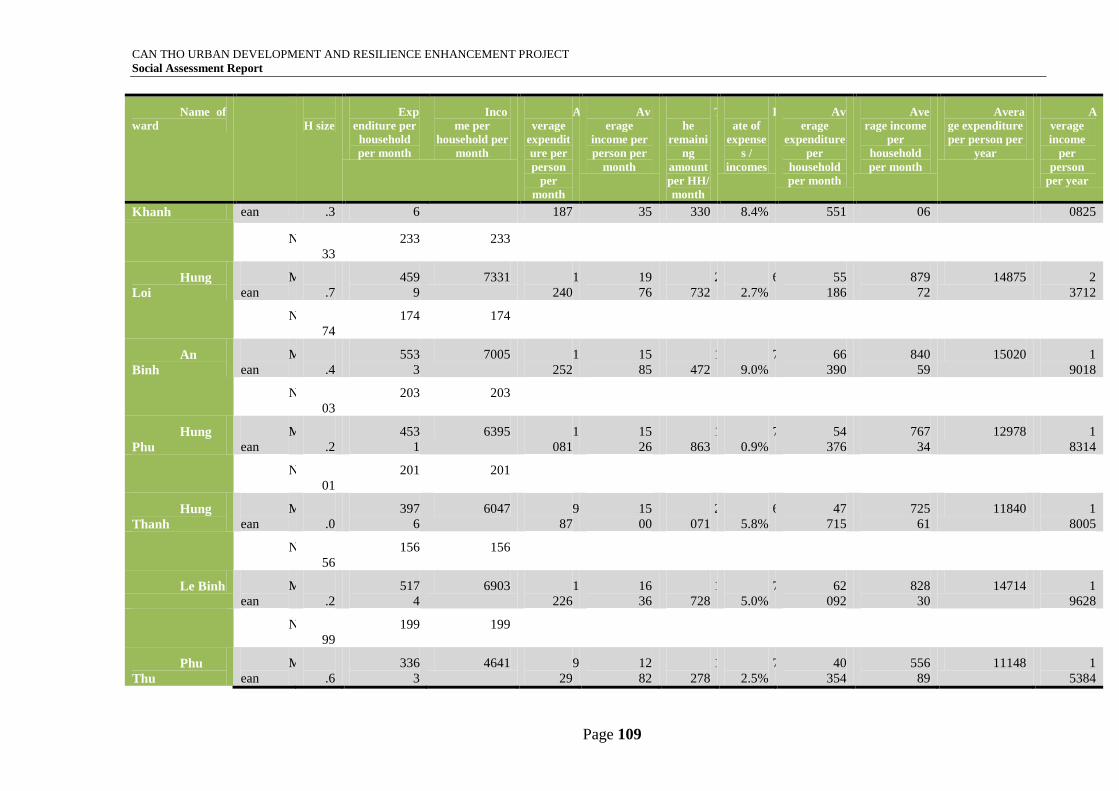
CAN THO URBAN DEVELOPMENT AND RESILIENCE ENHANCEMENT PROJECT
Social Assessment Report
Page 109
Name of
ward
H
H size
Exp
enditure per
household
per month
Inco
me per
household per
month
A
verage
expendit
ure per
person
per
month
Av
erage
income per
person per
month
T
he
remaini
ng
amount
per HH/
month
R
ate of
expense
s /
incomes
Av
erage
expenditure
per
household
per month
Ave
rage income
per
household
per month
Avera
ge expenditure
per person per
year
A
verage
income
per
person
per year
Khanh ean .3 6 187 35 330 8.4% 551 06 0825
N 2
33
233 233
Hung
Loi
M
ean
3
.7
459
9
7331 1
240
19
76
2
732
6
2.7%
55
186
879
72
14875 2
3712
N 1
74
174 174
An
Binh
M
ean
4
.4
553
3
7005 1
252
15
85
1
472
7
9.0%
66
390
840
59
15020 1
9018
N 2
03
203 203
Hung
Phu
M
ean
4
.2
453
1
6395 1
081
15
26
1
863
7
0.9%
54
376
767
34
12978 1
8314
N 2
01
201 201
Hung
Thanh
M
ean
4
.0
397
6
6047 9
87
15
00
2
071
6
5.8%
47
715
725
61
11840 1
8005
N 1
56
156 156
Le Binh M
ean
4
.2
517
4
6903 1
226
16
36
1
728
7
5.0%
62
092
828
30
14714 1
9628
N 1
99
199 199
Phu
Thu
M
ean
3
.6
336
3
4641 9
29
12
82
1
278
7
2.5%
40
354
556
89
11148 1
5384
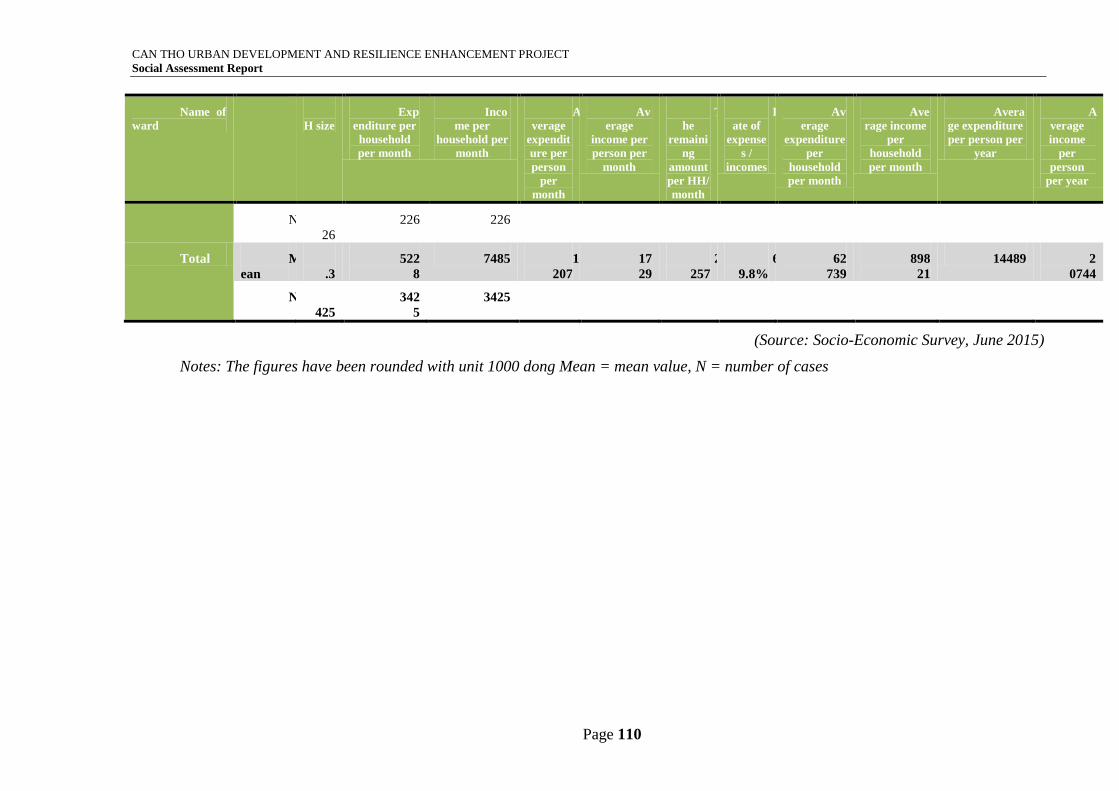
CAN THO URBAN DEVELOPMENT AND RESILIENCE ENHANCEMENT PROJECT
Social Assessment Report
Page 110
Name of
ward
H
H size
Exp
enditure per
household
per month
Inco
me per
household per
month
A
verage
expendit
ure per
person
per
month
Av
erage
income per
person per
month
T
he
remaini
ng
amount
per HH/
month
R
ate of
expense
s /
incomes
Av
erage
expenditure
per
household
per month
Ave
rage income
per
household
per month
Avera
ge expenditure
per person per
year
A
verage
income
per
person
per year
N 2
26
226 226
Total M
ean
4
.3
522
8
7485 1
207
17
29
2
257
6
9.8%
62
739
898
21
14489 2
0744
N 3
425
342
5
3425
(Source: Socio-Economic Survey, June 2015)
Notes: The figures have been rounded with unit 1000 dong Mean = mean value, N = number of cases
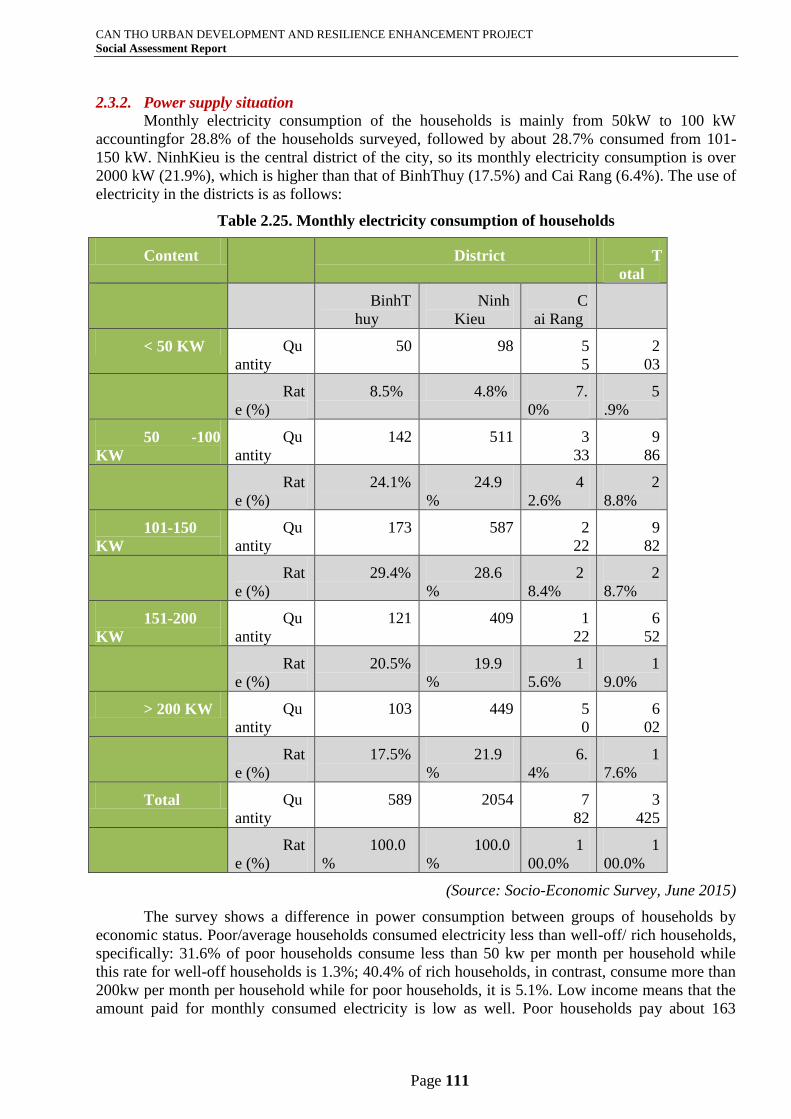
CAN THO URBAN DEVELOPMENT AND RESILIENCE ENHANCEMENT PROJECT
Social Assessment Report
Page 111
2.3.2. Power supply situation
Monthly electricity consumption of the households is mainly from 50kW to 100 kW
accountingfor 28.8% of the households surveyed, followed by about 28.7% consumed from 101-
150 kW. NinhKieu is the central district of the city, so its monthly electricity consumption is over
2000 kW (21.9%), which is higher than that of BinhThuy (17.5%) and Cai Rang (6.4%). The use of
electricity in the districts is as follows:
Table 2.25. Monthly electricity consumption of households
Content District T
otal
BinhT
huy
Ninh
Kieu
C
ai Rang
< 50 KW Qu
antity
50 98 5
5
2
03
Rat
e (%)
8.5% 4.8% 7.
0%
5
.9%
50 -100
KW
Qu
antity
142 511 3
33
9
86
Rat
e (%)
24.1% 24.9
%
4
2.6%
2
8.8%
101-150
KW
Qu
antity
173 587 2
22
9
82
Rat
e (%)
29.4% 28.6
%
2
8.4%
2
8.7%
151-200
KW
Qu
antity
121 409 1
22
6
52
Rat
e (%)
20.5% 19.9
%
1
5.6%
1
9.0%
> 200 KW Qu
antity
103 449 5
0
6
02
Rat
e (%)
17.5% 21.9
%
6.
4%
1
7.6%
Total Qu
antity
589 2054 7
82
3
425
Rat
e (%)
100.0
%
100.0
%
1
00.0%
1
00.0%
(Source: Socio-Economic Survey, June 2015)
The survey shows a difference in power consumption between groups of households by
economic status. Poor/average households consumed electricity less than well-off/ rich households,
specifically: 31.6% of poor households consume less than 50 kw per month per household while
this rate for well-off households is 1.3%; 40.4% of rich households, in contrast, consume more than
200kw per month per household while for poor households, it is 5.1%. Low income means that the
amount paid for monthly consumed electricity is low as well. Poor households pay about 163
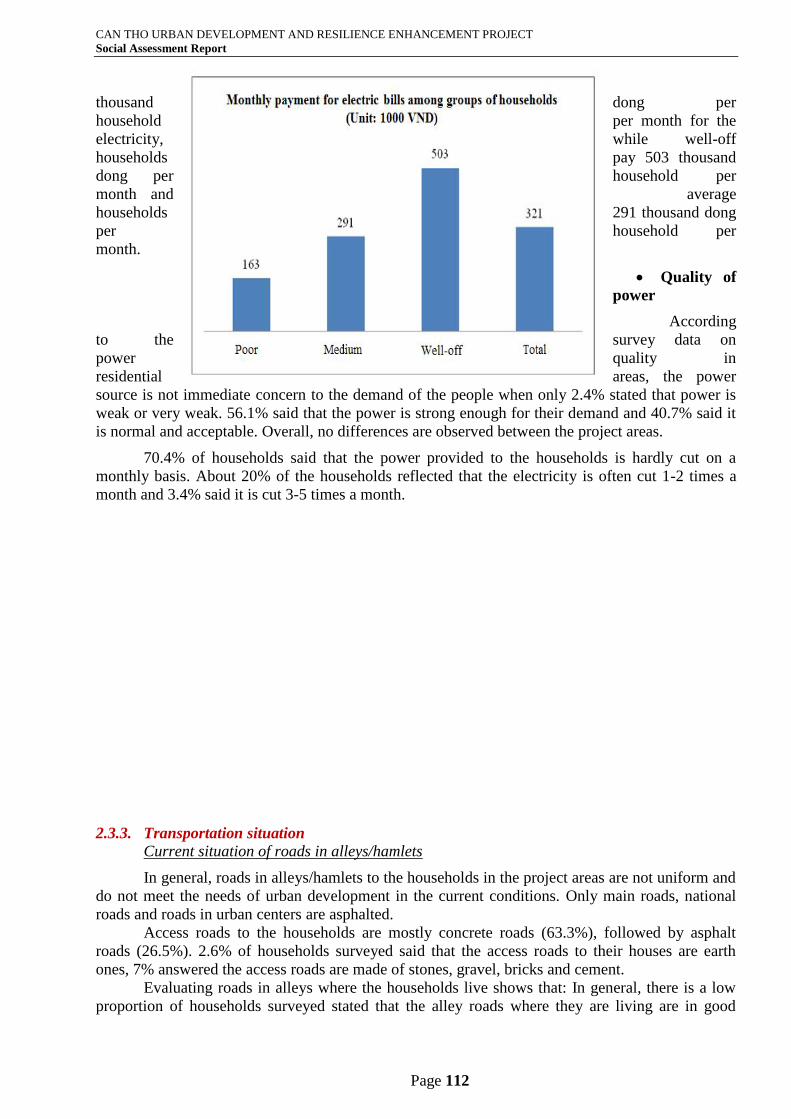
CAN THO URBAN DEVELOPMENT AND RESILIENCE ENHANCEMENT PROJECT
Social Assessment Report
Page 112
thousand dong per
household per month for the
electricity, while well-off
households pay 503 thousand
dong per household per
month and average
households 291 thousand dong
per household per
month.
Quality of
power
According
to the survey data on
power quality in
residential areas, the power
source is not immediate concern to the demand of the people when only 2.4% stated that power is
weak or very weak. 56.1% said that the power is strong enough for their demand and 40.7% said it
is normal and acceptable. Overall, no differences are observed between the project areas.
70.4% of households said that the power provided to the households is hardly cut on a
monthly basis. About 20% of the households reflected that the electricity is often cut 1-2 times a
month and 3.4% said it is cut 3-5 times a month.
2.3.3. Transportation situation
Current situation of roads in alleys/hamlets
In general, roads in alleys/hamlets to the households in the project areas are not uniform and
do not meet the needs of urban development in the current conditions. Only main roads, national
roads and roads in urban centers are asphalted.
Access roads to the households are mostly concrete roads (63.3%), followed by asphalt
roads (26.5%). 2.6% of households surveyed said that the access roads to their houses are earth
ones, 7% answered the access roads are made of stones, gravel, bricks and cement.
Evaluating roads in alleys where the households live shows that: In general, there is a low
proportion of households surveyed stated that the alley roads where they are living are in good
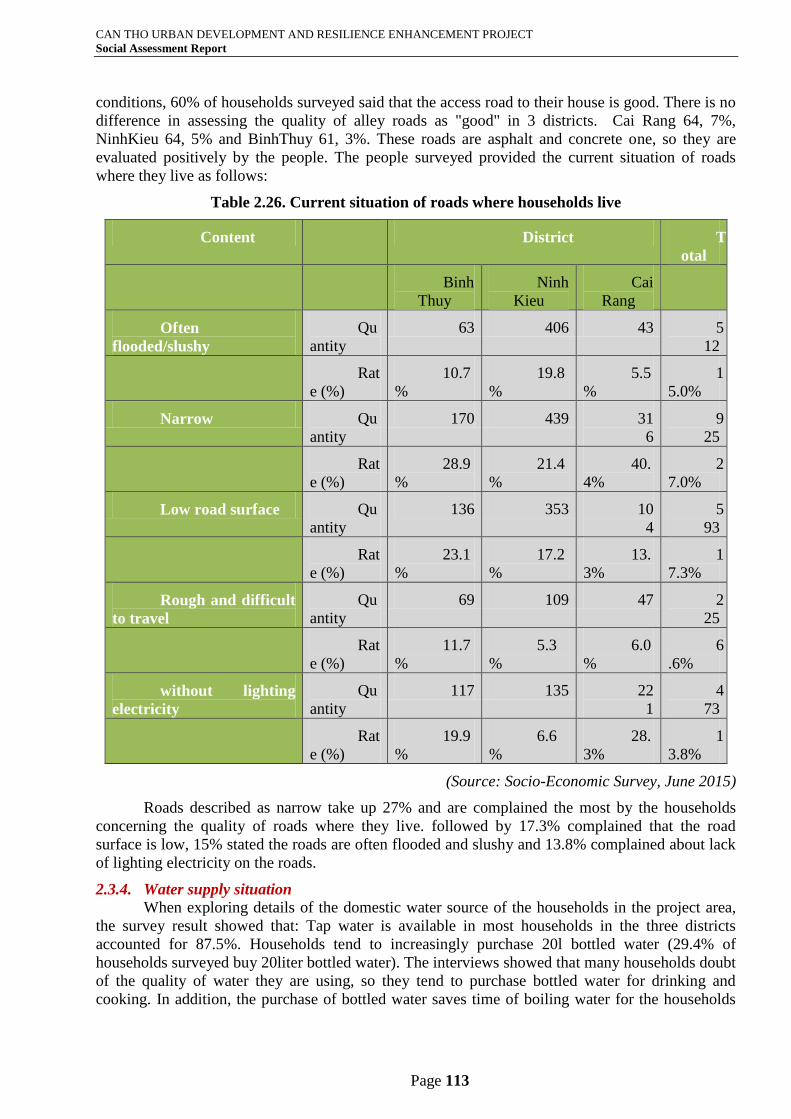
CAN THO URBAN DEVELOPMENT AND RESILIENCE ENHANCEMENT PROJECT
Social Assessment Report
Page 113
conditions, 60% of households surveyed said that the access road to their house is good. There is no
difference in assessing the quality of alley roads as "good" in 3 districts. Cai Rang 64, 7%,
NinhKieu 64, 5% and BinhThuy 61, 3%. These roads are asphalt and concrete one, so they are
evaluated positively by the people. The people surveyed provided the current situation of roads
where they live as follows:
Table 2.26. Current situation of roads where households live
Content District T
otal
Binh
Thuy
Ninh
Kieu
Cai
Rang
Often
flooded/slushy
Qu
antity
63 406 43 5
12
Rat
e (%)
10.7
%
19.8
%
5.5
%
1
5.0%
Narrow Qu
antity
170 439 31
6
9
25
Rat
e (%)
28.9
%
21.4
%
40.
4%
2
7.0%
Low road surface Qu
antity
136 353 10
4
5
93
Rat
e (%)
23.1
%
17.2
%
13.
3%
1
7.3%
Rough and difficult
to travel
Qu
antity
69 109 47 2
25
Rat
e (%)
11.7
%
5.3
%
6.0
%
6
.6%
without lighting
electricity
Qu
antity
117 135 22
1
4
73
Rat
e (%)
19.9
%
6.6
%
28.
3%
1
3.8%
(Source: Socio-Economic Survey, June 2015)
Roads described as narrow take up 27% and are complained the most by the households
concerning the quality of roads where they live. followed by 17.3% complained that the road
surface is low, 15% stated the roads are often flooded and slushy and 13.8% complained about lack
of lighting electricity on the roads.
2.3.4. Water supply situation
When exploring details of the domestic water source of the households in the project area,
the survey result showed that: Tap water is available in most households in the three districts
accounted for 87.5%. Households tend to increasingly purchase 20l bottled water (29.4% of
households surveyed buy 20liter bottled water). The interviews showed that many households doubt
of the quality of water they are using, so they tend to purchase bottled water for drinking and
cooking. In addition, the purchase of bottled water saves time of boiling water for the households
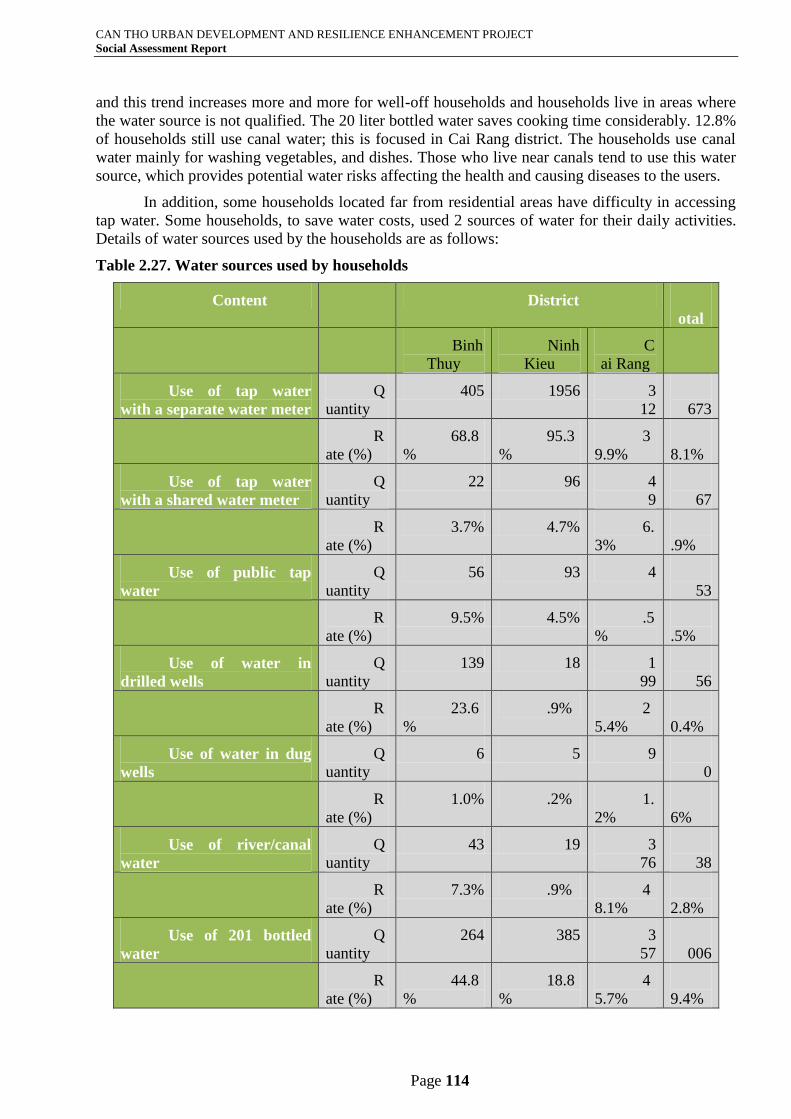
CAN THO URBAN DEVELOPMENT AND RESILIENCE ENHANCEMENT PROJECT
Social Assessment Report
Page 114
and this trend increases more and more for well-off households and households live in areas where
the water source is not qualified. The 20 liter bottled water saves cooking time considerably. 12.8%
of households still use canal water; this is focused in Cai Rang district. The households use canal
water mainly for washing vegetables, and dishes. Those who live near canals tend to use this water
source, which provides potential water risks affecting the health and causing diseases to the users.
In addition, some households located far from residential areas have difficulty in accessing
tap water. Some households, to save water costs, used 2 sources of water for their daily activities.
Details of water sources used by the households are as follows:
Table 2.27. Water sources used by households
Content District T
otal
Binh
Thuy
Ninh
Kieu
C
ai Rang
Use of tap water
with a separate water meter
Q
uantity
405 1956 3
12
2
673
R
ate (%)
68.8
%
95.3
%
3
9.9%
7
8.1%
Use of tap water
with a shared water meter
Q
uantity
22 96 4
9
1
67
R
ate (%)
3.7% 4.7% 6.
3%
4
.9%
Use of public tap
water
Q
uantity
56 93 4 1
53
R
ate (%)
9.5% 4.5% .5
%
4
.5%
Use of water in
drilled wells
Q
uantity
139 18 1
99
3
56
R
ate (%)
23.6
%
.9% 2
5.4%
1
0.4%
Use of water in dug
wells
Q
uantity
6 5 9 2
0
R
ate (%)
1.0% .2% 1.
2%
.
6%
Use of river/canal
water
Q
uantity
43 19 3
76
4
38
R
ate (%)
7.3% .9% 4
8.1%
1
2.8%
Use of 201 bottled
water
Q
uantity
264 385 3
57
1
006
R
ate (%)
44.8
%
18.8
%
4
5.7%
2
9.4%
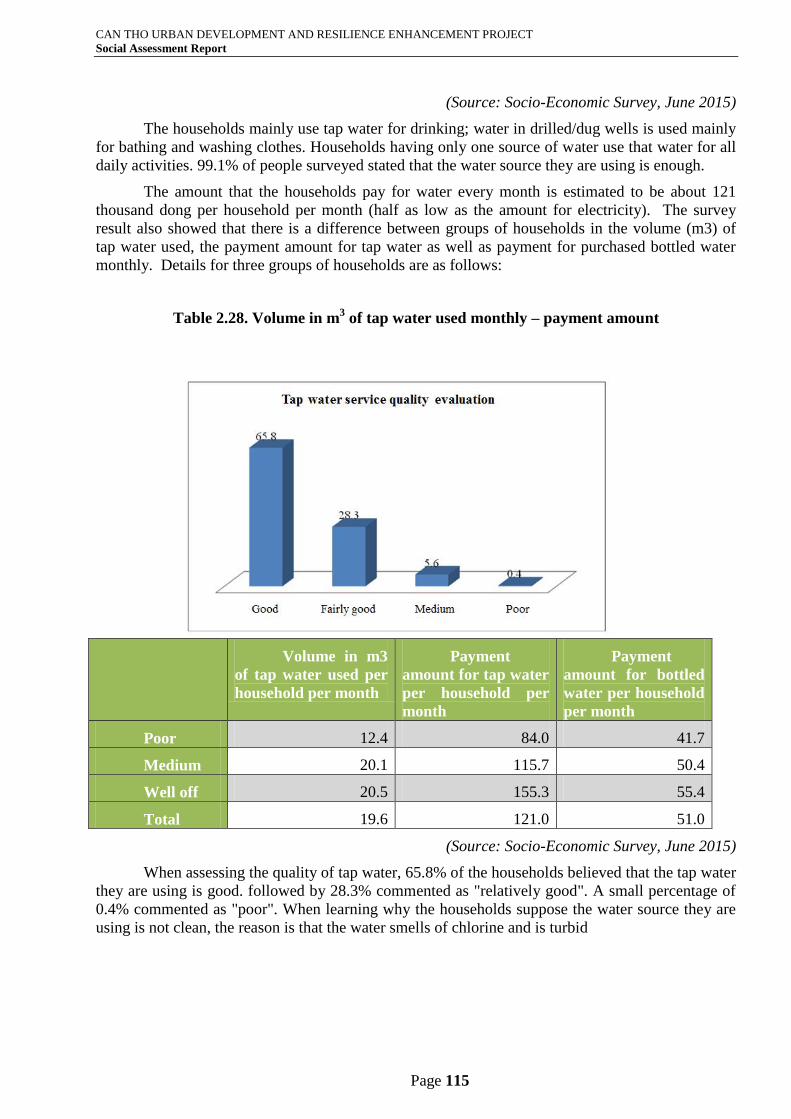
CAN THO URBAN DEVELOPMENT AND RESILIENCE ENHANCEMENT PROJECT
Social Assessment Report
Page 115
(Source: Socio-Economic Survey, June 2015)
The households mainly use tap water for drinking; water in drilled/dug wells is used mainly
for bathing and washing clothes. Households having only one source of water use that water for all
daily activities. 99.1% of people surveyed stated that the water source they are using is enough.
The amount that the households pay for water every month is estimated to be about 121
thousand dong per household per month (half as low as the amount for electricity). The survey
result also showed that there is a difference between groups of households in the volume (m3) of
tap water used, the payment amount for tap water as well as payment for purchased bottled water
monthly. Details for three groups of households are as follows:
Table 2.28. Volume in m3 of tap water used monthly – payment amount
Volume in m3
of tap water used per
household per month
Payment
amount for tap water
per household per
month
Payment
amount for bottled
water per household
per month
Poor 12.4 84.0 41.7
Medium 20.1 115.7 50.4
Well off 20.5 155.3 55.4
Total 19.6 121.0 51.0
(Source: Socio-Economic Survey, June 2015)
When assessing the quality of tap water, 65.8% of the households believed that the tap water
they are using is good. followed by 28.3% commented as "relatively good". A small percentage of
0.4% commented as "poor". When learning why the households suppose the water source they are
using is not clean, the reason is that the water smells of chlorine and is turbid
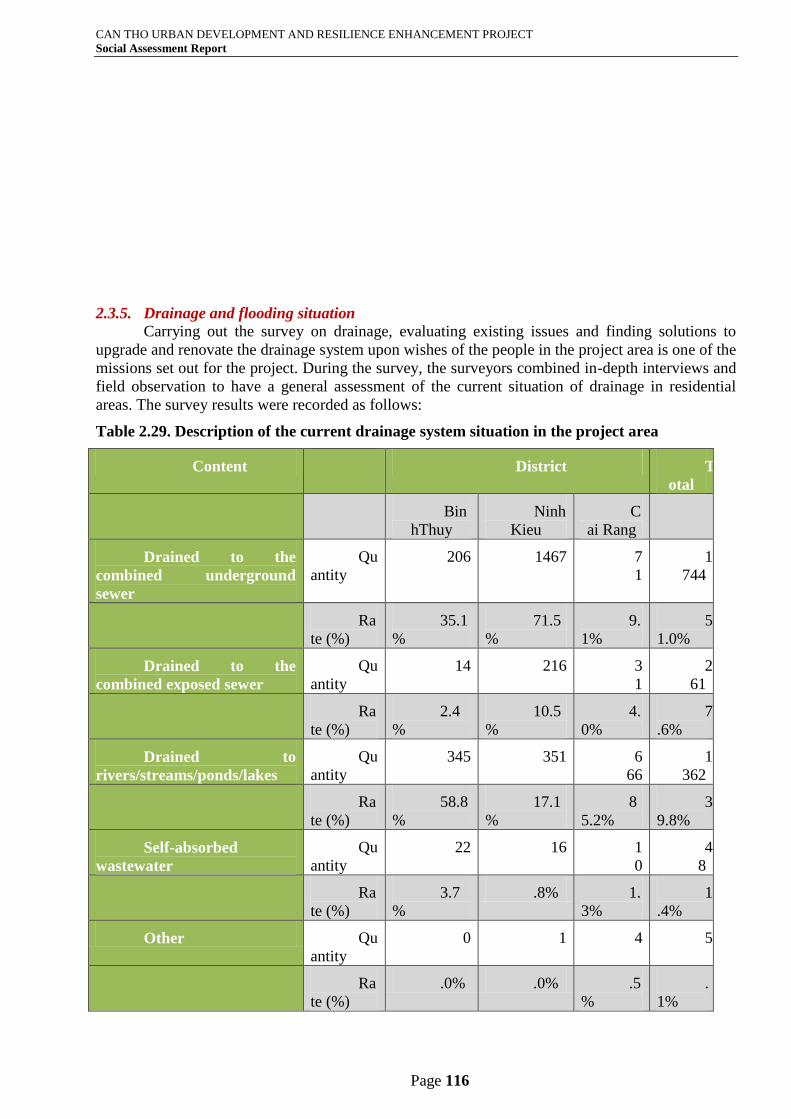
CAN THO URBAN DEVELOPMENT AND RESILIENCE ENHANCEMENT PROJECT
Social Assessment Report
Page 116
2.3.5. Drainage and flooding situation
Carrying out the survey on drainage, evaluating existing issues and finding solutions to
upgrade and renovate the drainage system upon wishes of the people in the project area is one of the
missions set out for the project. During the survey, the surveyors combined in-depth interviews and
field observation to have a general assessment of the current situation of drainage in residential
areas. The survey results were recorded as follows:
Table 2.29. Description of the current drainage system situation in the project area
Content District T
otal
Bin
hThuy
Ninh
Kieu
C
ai Rang
Drained to the
combined underground
sewer
Qu
antity
206 1467 7
1
1
744
Ra
te (%)
35.1
%
71.5
%
9.
1%
5
1.0%
Drained to the
combined exposed sewer
Qu
antity
14 216 3
1
2
61
Ra
te (%)
2.4
%
10.5
%
4.
0%
7
.6%
Drained to
rivers/streams/ponds/lakes
Qu
antity
345 351 6
66
1
362
Ra
te (%)
58.8
%
17.1
%
8
5.2%
3
9.8%
Self-absorbed
wastewater
Qu
antity
22 16 1
0
4
8
Ra
te (%)
3.7
%
.8% 1.
3%
1
.4%
Other Qu
antity
0 1 4 5
Ra
te (%)
.0% .0% .5
%
.
1%
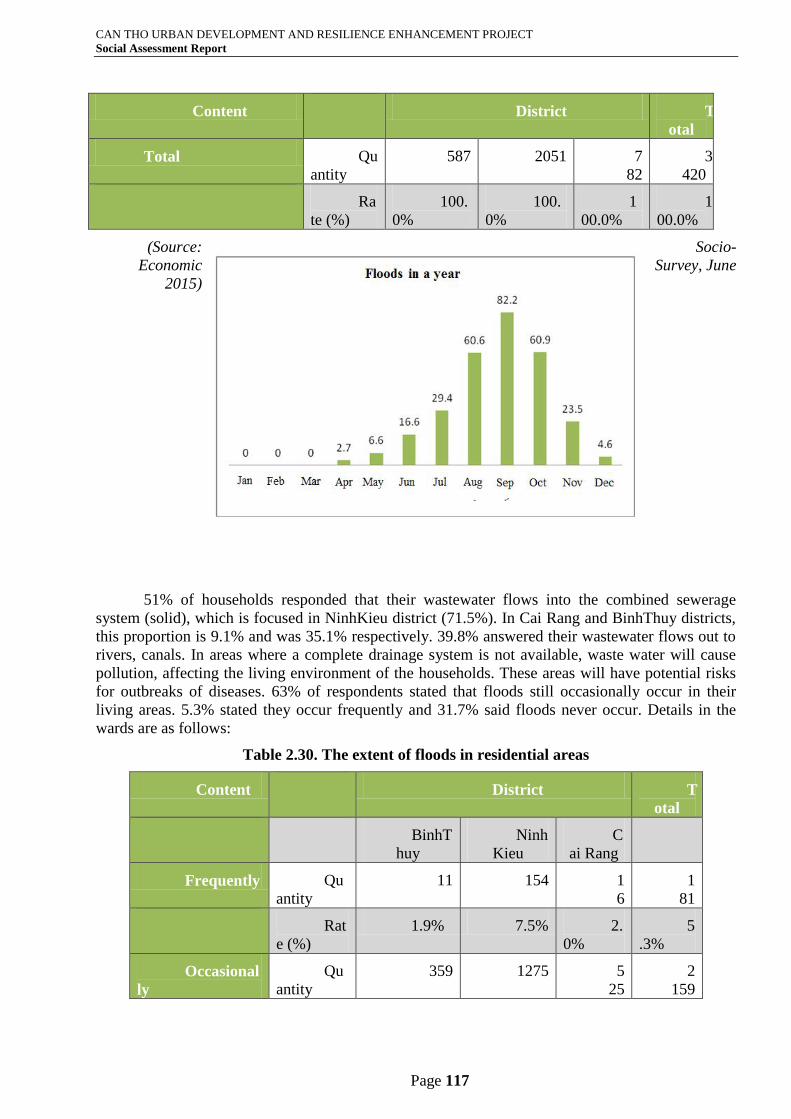
CAN THO URBAN DEVELOPMENT AND RESILIENCE ENHANCEMENT PROJECT
Social Assessment Report
Page 117
Content District T
otal
Total Qu
antity
587 2051 7
82
3
420
Ra
te (%)
100.
0%
100.
0%
1
00.0%
1
00.0%
(Source: Socio-
Economic Survey, June
2015)
51% of households responded that their wastewater flows into the combined sewerage
system (solid), which is focused in NinhKieu district (71.5%). In Cai Rang and BinhThuy districts,
this proportion is 9.1% and was 35.1% respectively. 39.8% answered their wastewater flows out to
rivers, canals. In areas where a complete drainage system is not available, waste water will cause
pollution, affecting the living environment of the households. These areas will have potential risks
for outbreaks of diseases. 63% of respondents stated that floods still occasionally occur in their
living areas. 5.3% stated they occur frequently and 31.7% said floods never occur. Details in the
wards are as follows:
Table 2.30. The extent of floods in residential areas
Content District T
otal
BinhT
huy
Ninh
Kieu
C
ai Rang
Frequently Qu
antity
11 154 1
6
1
81
Rat
e (%)
1.9% 7.5% 2.
0%
5
.3%
Occasional
ly
Qu
antity
359 1275 5
25
2
159
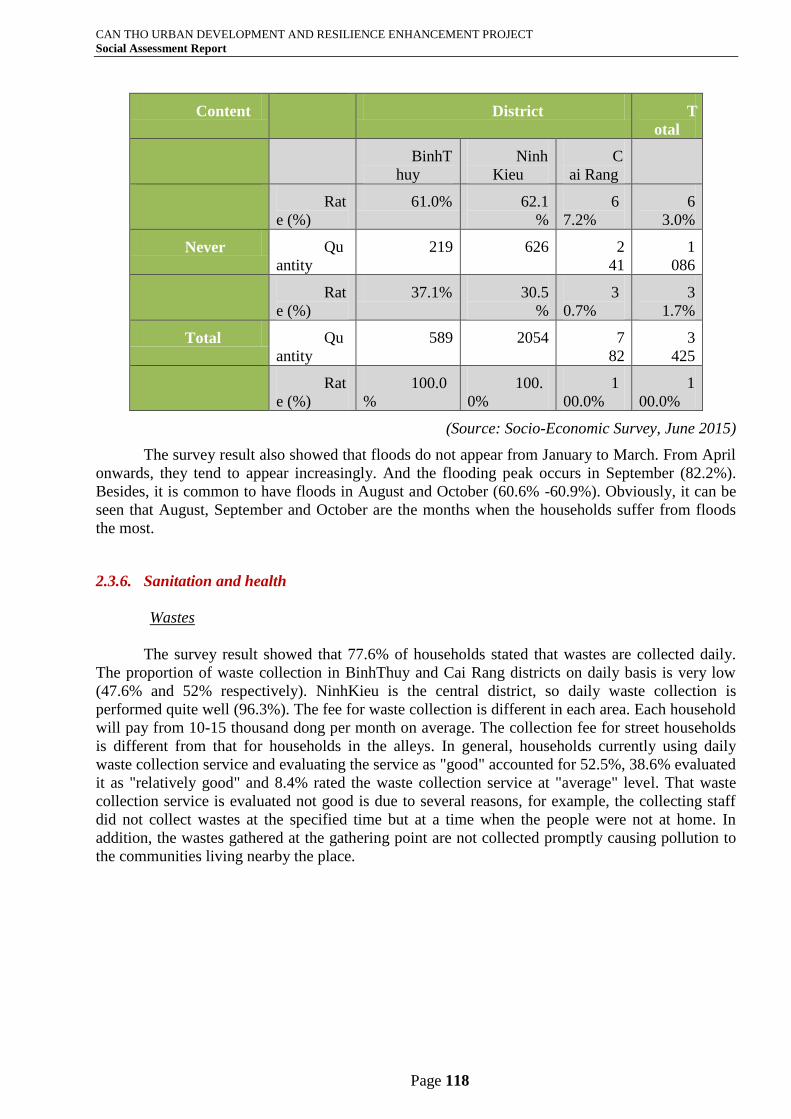
CAN THO URBAN DEVELOPMENT AND RESILIENCE ENHANCEMENT PROJECT
Social Assessment Report
Page 118
Content District T
otal
BinhT
huy
Ninh
Kieu
C
ai Rang
Rat
e (%)
61.0% 62.1
%
6
7.2%
6
3.0%
Never Qu
antity
219 626 2
41
1
086
Rat
e (%)
37.1% 30.5
%
3
0.7%
3
1.7%
Total Qu
antity
589 2054 7
82
3
425
Rat
e (%)
100.0
%
100.
0%
1
00.0%
1
00.0%
(Source: Socio-Economic Survey, June 2015)
The survey result also showed that floods do not appear from January to March. From April
onwards, they tend to appear increasingly. And the flooding peak occurs in September (82.2%).
Besides, it is common to have floods in August and October (60.6% -60.9%). Obviously, it can be
seen that August, September and October are the months when the households suffer from floods
the most.
2.3.6. Sanitation and health
Wastes
The survey result showed that 77.6% of households stated that wastes are collected daily.
The proportion of waste collection in BinhThuy and Cai Rang districts on daily basis is very low
(47.6% and 52% respectively). NinhKieu is the central district, so daily waste collection is
performed quite well (96.3%). The fee for waste collection is different in each area. Each household
will pay from 10-15 thousand dong per month on average. The collection fee for street households
is different from that for households in the alleys. In general, households currently using daily
waste collection service and evaluating the service as "good" accounted for 52.5%, 38.6% evaluated
it as "relatively good" and 8.4% rated the waste collection service at "average" level. That waste
collection service is evaluated not good is due to several reasons, for example, the collecting staff
did not collect wastes at the specified time but at a time when the people were not at home. In
addition, the wastes gathered at the gathering point are not collected promptly causing pollution to
the communities living nearby the place.
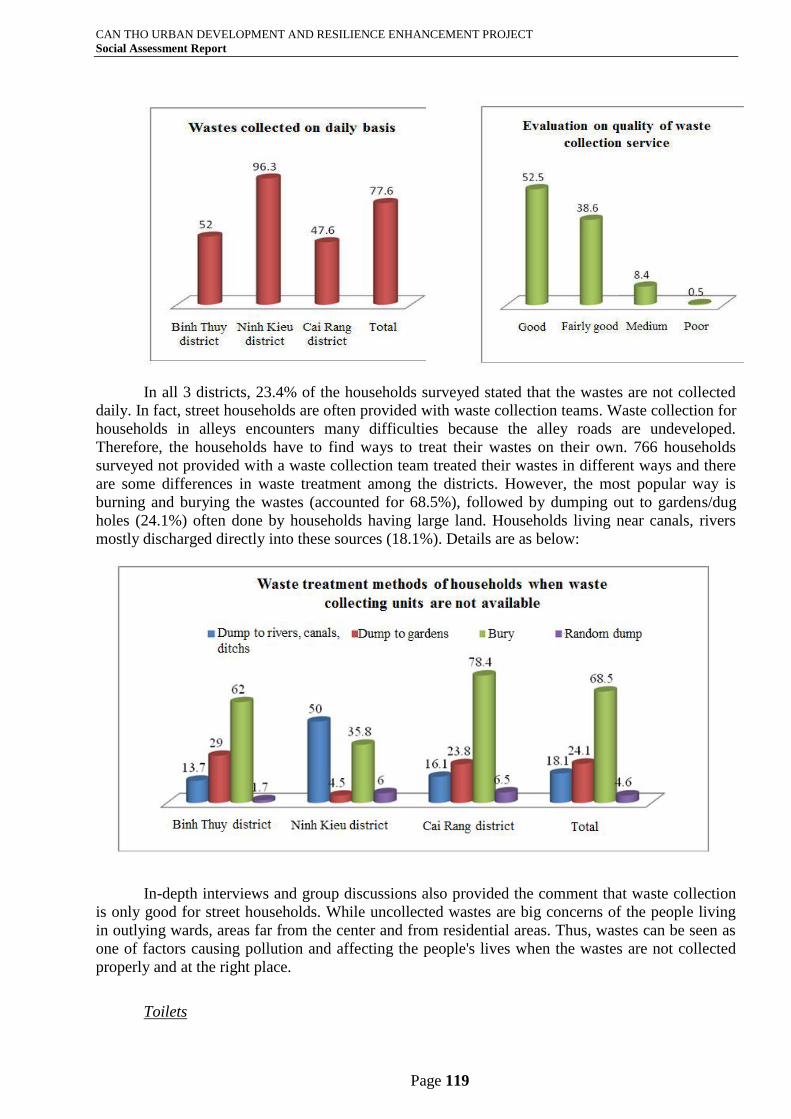
CAN THO URBAN DEVELOPMENT AND RESILIENCE ENHANCEMENT PROJECT
Social Assessment Report
Page 119
In all 3 districts, 23.4% of the households surveyed stated that the wastes are not collected
daily. In fact, street households are often provided with waste collection teams. Waste collection for
households in alleys encounters many difficulties because the alley roads are undeveloped.
Therefore, the households have to find ways to treat their wastes on their own. 766 households
surveyed not provided with a waste collection team treated their wastes in different ways and there
are some differences in waste treatment among the districts. However, the most popular way is
burning and burying the wastes (accounted for 68.5%), followed by dumping out to gardens/dug
holes (24.1%) often done by households having large land. Households living near canals, rivers
mostly discharged directly into these sources (18.1%). Details are as below:
In-depth interviews and group discussions also provided the comment that waste collection
is only good for street households. While uncollected wastes are big concerns of the people living
in outlying wards, areas far from the center and from residential areas. Thus, wastes can be seen as
one of factors causing pollution and affecting the people's lives when the wastes are not collected
properly and at the right place.
Toilets
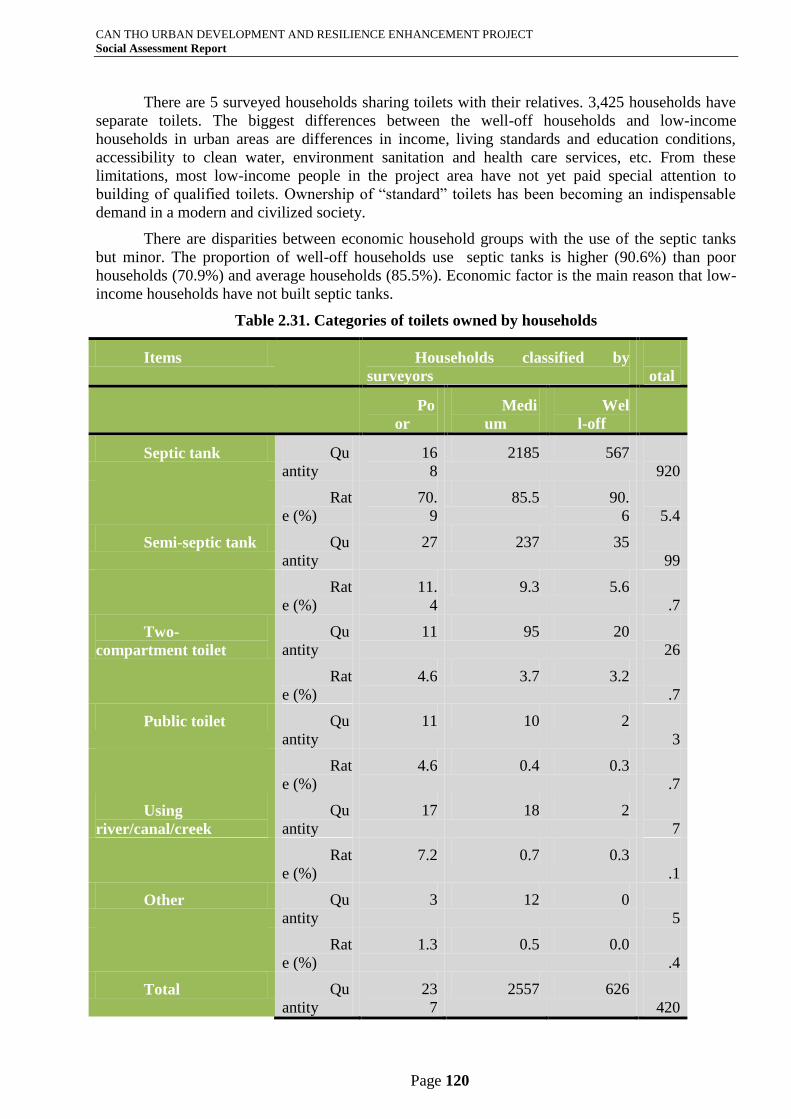
CAN THO URBAN DEVELOPMENT AND RESILIENCE ENHANCEMENT PROJECT
Social Assessment Report
Page 120
There are 5 surveyed households sharing toilets with their relatives. 3,425 households have
separate toilets. The biggest differences between the well-off households and low-income
households in urban areas are differences in income, living standards and education conditions,
accessibility to clean water, environment sanitation and health care services, etc. From these
limitations, most low-income people in the project area have not yet paid special attention to
building of qualified toilets. Ownership of “standard” toilets has been becoming an indispensable
demand in a modern and civilized society.
There are disparities between economic household groups with the use of the septic tanks
but minor. The proportion of well-off households use septic tanks is higher (90.6%) than poor
households (70.9%) and average households (85.5%). Economic factor is the main reason that low-
income households have not built septic tanks.
Table 2.31. Categories of toilets owned by households
Items Households classified by
surveyors
T
otal
Po
or
Medi
um
Wel
l-off
Septic tank Qu
antity
16
8
2185 567 2
920
Rat
e (%)
70.
9
85.5 90.
6
8
5.4
Semi-septic tank Qu
antity
27 237 35 2
99
Rat
e (%)
11.
4
9.3 5.6 8
.7
Two-
compartment toilet
Qu
antity
11 95 20 1
26
Rat
e (%)
4.6 3.7 3.2 3
.7
Public toilet Qu
antity
11 10 2 2
3
Rat
e (%)
4.6 0.4 0.3 0
.7
Using
river/canal/creek
Qu
antity
17 18 2 3
7
Rat
e (%)
7.2 0.7 0.3 1
.1
Other Qu
antity
3 12 0 1
5
Rat
e (%)
1.3 0.5 0.0 0
.4
Total Qu
antity
23
7
2557 626 3
420
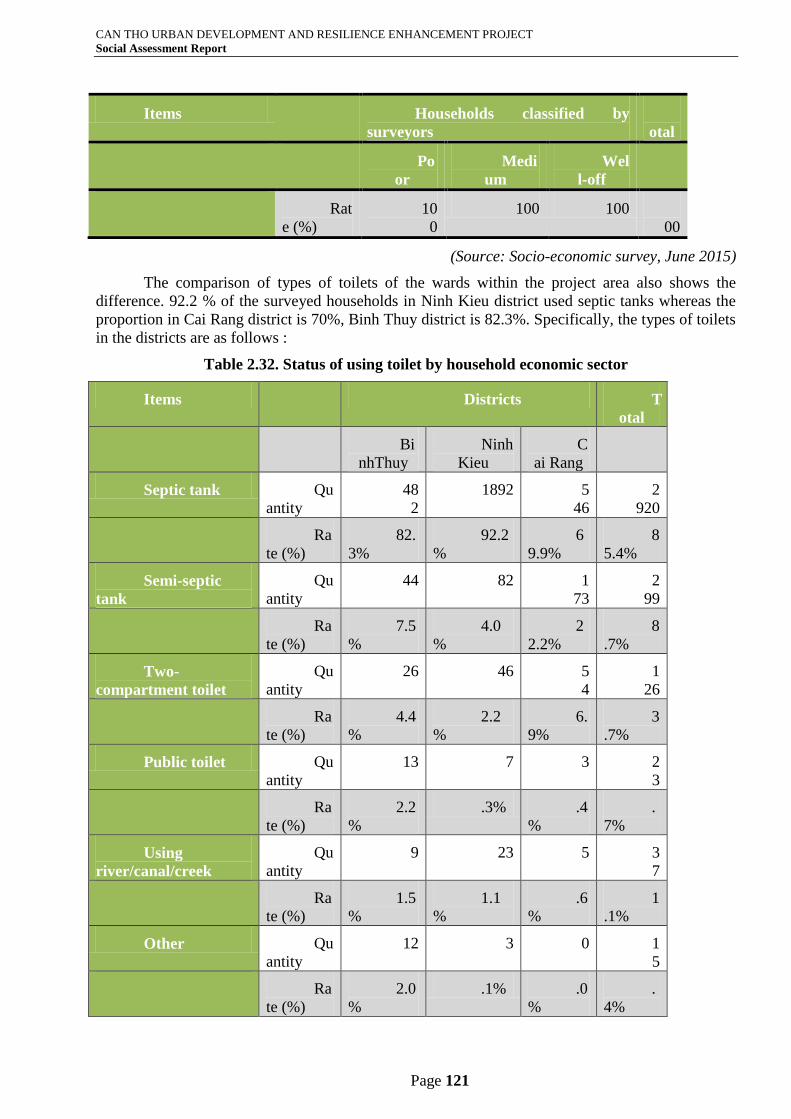
CAN THO URBAN DEVELOPMENT AND RESILIENCE ENHANCEMENT PROJECT
Social Assessment Report
Page 121
Items Households classified by
surveyors
T
otal
Po
or
Medi
um
Wel
l-off
Rat
e (%)
10
0
100 100 1
00
(Source: Socio-economic survey, June 2015)
The comparison of types of toilets of the wards within the project area also shows the
difference. 92.2 % of the surveyed households in Ninh Kieu district used septic tanks whereas the
proportion in Cai Rang district is 70%, Binh Thuy district is 82.3%. Specifically, the types of toilets
in the districts are as follows :
Table 2.32. Status of using toilet by household economic sector
Items Districts T
otal
Bi
nhThuy
Ninh
Kieu
C
ai Rang
Septic tank Qu
antity
48
2
1892 5
46
2
920
Ra
te (%)
82.
3%
92.2
%
6
9.9%
8
5.4%
Semi-septic
tank
Qu
antity
44 82 1
73
2
99
Ra
te (%)
7.5
%
4.0
%
2
2.2%
8
.7%
Two-
compartment toilet
Qu
antity
26 46 5
4
1
26
Ra
te (%)
4.4
%
2.2
%
6.
9%
3
.7%
Public toilet Qu
antity
13 7 3 2
3
Ra
te (%)
2.2
%
.3% .4
%
.
7%
Using
river/canal/creek
Qu
antity
9 23 5 3
7
Ra
te (%)
1.5
%
1.1
%
.6
%
1
.1%
Other Qu
antity
12 3 0 1
5
Ra
te (%)
2.0
%
.1% .0
%
.
4%
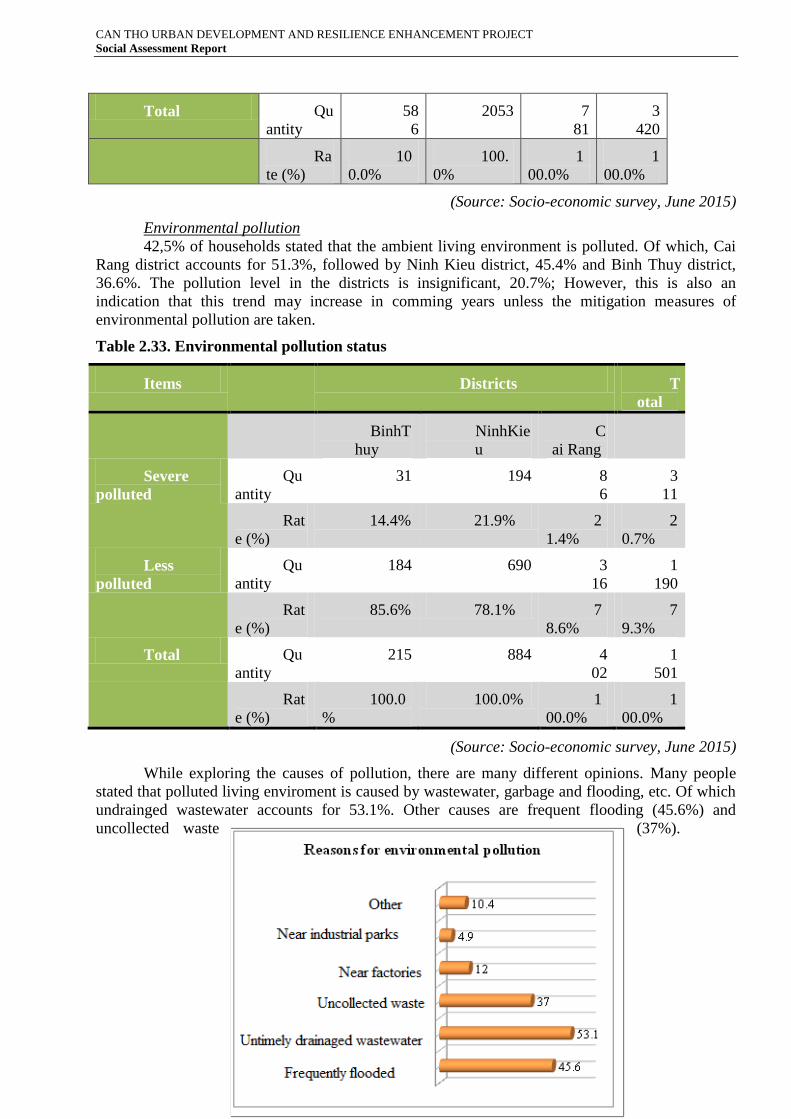
CAN THO URBAN DEVELOPMENT AND RESILIENCE ENHANCEMENT PROJECT
Social Assessment Report
Page 122
Total Qu
antity
58
6
2053 7
81
3
420
Ra
te (%)
10
0.0%
100.
0%
1
00.0%
1
00.0%
(Source: Socio-economic survey, June 2015)
Environmental pollution
42,5% of households stated that the ambient living environment is polluted. Of which, Cai
Rang district accounts for 51.3%, followed by Ninh Kieu district, 45.4% and Binh Thuy district,
36.6%. The pollution level in the districts is insignificant, 20.7%; However, this is also an
indication that this trend may increase in comming years unless the mitigation measures of
environmental pollution are taken.
Table 2.33. Environmental pollution status
Items Districts T
otal
BinhT
huy
NinhKie
u
C
ai Rang
Severe
polluted
Qu
antity
31 194 8
6
3
11
Rat
e (%)
14.4% 21.9% 2
1.4%
2
0.7%
Less
polluted
Qu
antity
184 690 3
16
1
190
Rat
e (%)
85.6% 78.1% 7
8.6%
7
9.3%
Total Qu
antity
215 884 4
02
1
501
Rat
e (%)
100.0
%
100.0% 1
00.0%
1
00.0%
(Source: Socio-economic survey, June 2015)
While exploring the causes of pollution, there are many different opinions. Many people
stated that polluted living enviroment is caused by wastewater, garbage and flooding, etc. Of which
undrainged wastewater accounts for 53.1%. Other causes are frequent flooding (45.6%) and
uncollected waste (37%).
Do thường xuyên bị ngập
Do nước thải không tiêu thoát kịp
Do rác thải không được thu gom
Do gần các nhà máy, xí nghiẹp
Do gần các khu công nghiệp
Khác
45.6
53.1
37
12
4.9
10.4
Reasons for environmental pollution
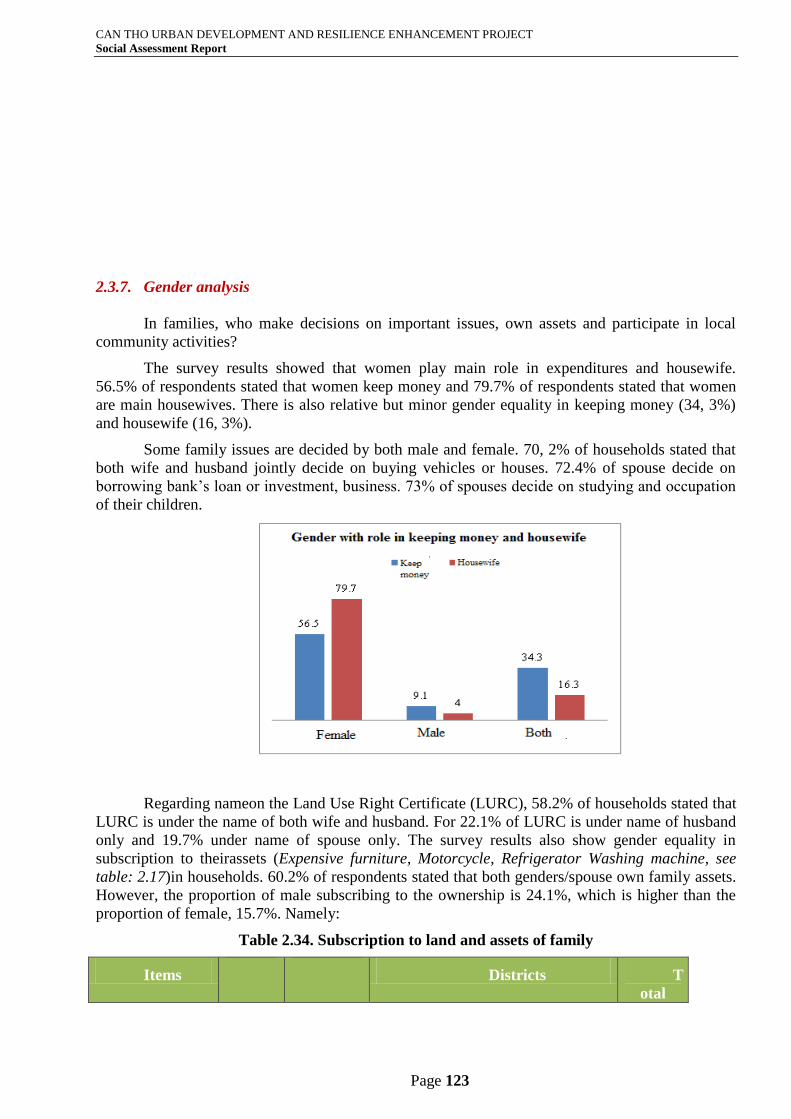
CAN THO URBAN DEVELOPMENT AND RESILIENCE ENHANCEMENT PROJECT
Social Assessment Report
Page 123
2.3.7. Gender analysis
In families, who make decisions on important issues, own assets and participate in local
community activities?
The survey results showed that women play main role in expenditures and housewife.
56.5% of respondents stated that women keep money and 79.7% of respondents stated that women
are main housewives. There is also relative but minor gender equality in keeping money (34, 3%)
and housewife (16, 3%).
Some family issues are decided by both male and female. 70, 2% of households stated that
both wife and husband jointly decide on buying vehicles or houses. 72.4% of spouse decide on
borrowing bank’s loan or investment, business. 73% of spouses decide on studying and occupation
of their children.
Regarding nameon the Land Use Right Certificate (LURC), 58.2% of households stated that
LURC is under the name of both wife and husband. For 22.1% of LURC is under name of husband
only and 19.7% under name of spouse only. The survey results also show gender equality in
subscription to theirassets (Expensive furniture, Motorcycle, Refrigerator Washing machine, see
table: 2.17)in households. 60.2% of respondents stated that both genders/spouse own family assets.
However, the proportion of male subscribing to the ownership is 24.1%, which is higher than the
proportion of female, 15.7%. Namely:
Table 2.34. Subscription to land and assets of family
Items Districts T
otal
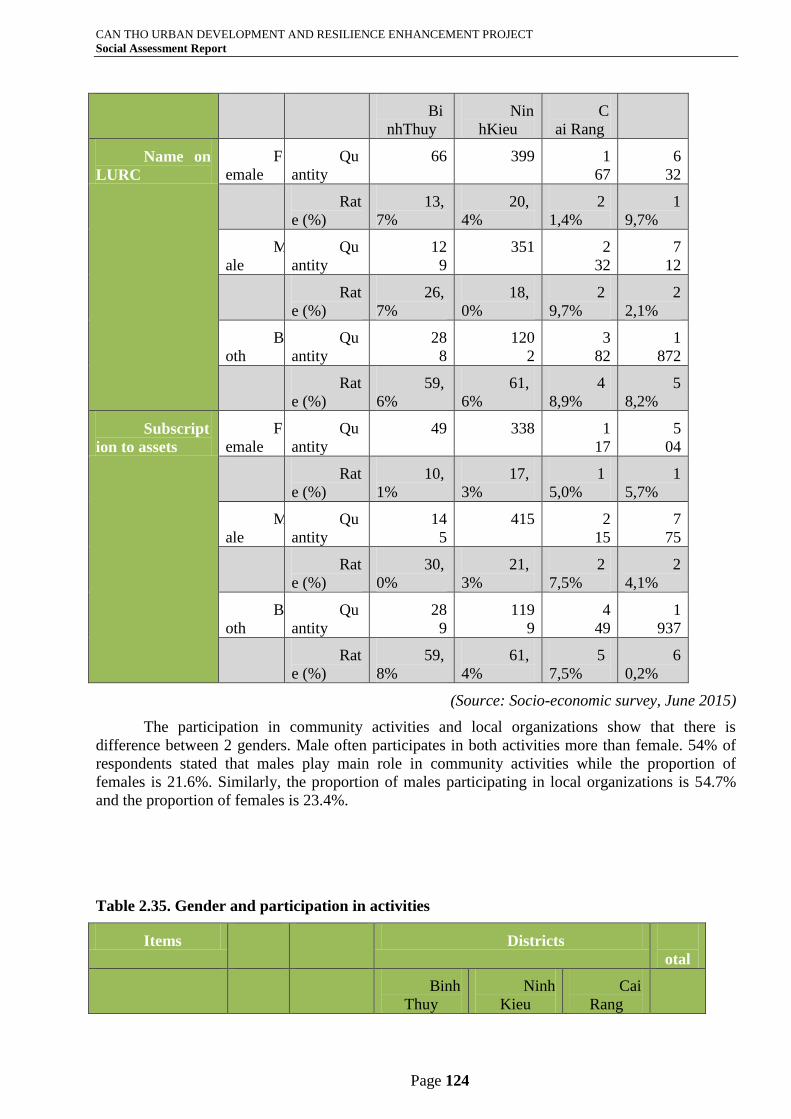
CAN THO URBAN DEVELOPMENT AND RESILIENCE ENHANCEMENT PROJECT
Social Assessment Report
Page 124
Bi
nhThuy
Nin
hKieu
C
ai Rang
Name on
LURC
F
emale
Qu
antity
66 399 1
67
6
32
Rat
e (%)
13,
7%
20,
4%
2
1,4%
1
9,7%
M
ale
Qu
antity
12
9
351 2
32
7
12
Rat
e (%)
26,
7%
18,
0%
2
9,7%
2
2,1%
B
oth
Qu
antity
28
8
120
2
3
82
1
872
Rat
e (%)
59,
6%
61,
6%
4
8,9%
5
8,2%
Subscript
ion to assets
F
emale
Qu
antity
49 338 1
17
5
04
Rat
e (%)
10,
1%
17,
3%
1
5,0%
1
5,7%
M
ale
Qu
antity
14
5
415 2
15
7
75
Rat
e (%)
30,
0%
21,
3%
2
7,5%
2
4,1%
B
oth
Qu
antity
28
9
119
9
4
49
1
937
Rat
e (%)
59,
8%
61,
4%
5
7,5%
6
0,2%
(Source: Socio-economic survey, June 2015)
The participation in community activities and local organizations show that there is
difference between 2 genders. Male often participates in both activities more than female. 54% of
respondents stated that males play main role in community activities while the proportion of
females is 21.6%. Similarly, the proportion of males participating in local organizations is 54.7%
and the proportion of females is 23.4%.
Table 2.35. Gender and participation in activities
Items Districts T
otal
Binh
Thuy
Ninh
Kieu
Cai
Rang
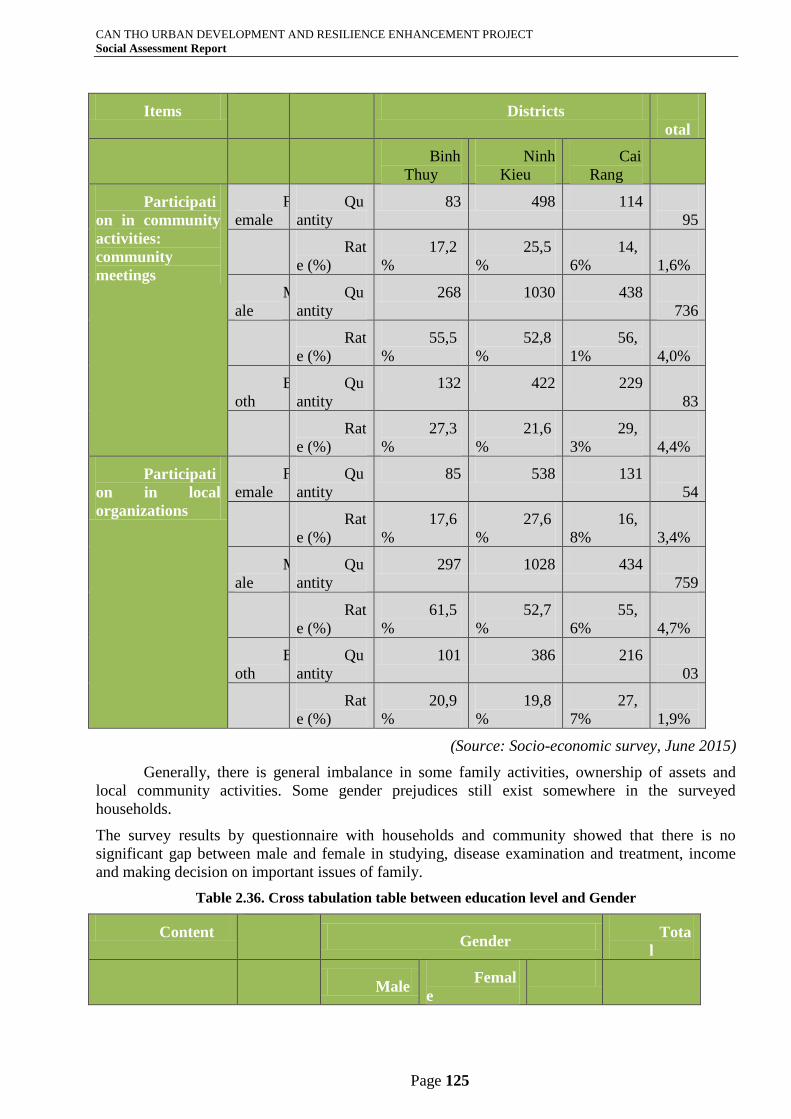
CAN THO URBAN DEVELOPMENT AND RESILIENCE ENHANCEMENT PROJECT
Social Assessment Report
Page 125
Items Districts T
otal
Binh
Thuy
Ninh
Kieu
Cai
Rang
Participati
on in community
activities:
community
meetings
F
emale
Qu
antity
83 498 114 6
95
Rat
e (%)
17,2
%
25,5
%
14,
6%
2
1,6%
M
ale
Qu
antity
268 1030 438 1
736
Rat
e (%)
55,5
%
52,8
%
56,
1%
5
4,0%
B
oth
Qu
antity
132 422 229 7
83
Rat
e (%)
27,3
%
21,6
%
29,
3%
2
4,4%
Participati
on in local
organizations
F
emale
Qu
antity
85 538 131 7
54
Rat
e (%)
17,6
%
27,6
%
16,
8%
2
3,4%
M
ale
Qu
antity
297 1028 434 1
759
Rat
e (%)
61,5
%
52,7
%
55,
6%
5
4,7%
B
oth
Qu
antity
101 386 216 7
03
Rat
e (%)
20,9
%
19,8
%
27,
7%
2
1,9%
(Source: Socio-economic survey, June 2015)
Generally, there is general imbalance in some family activities, ownership of assets and
local community activities. Some gender prejudices still exist somewhere in the surveyed
households.
The survey results by questionnaire with households and community showed that there is no
significant gap between male and female in studying, disease examination and treatment, income
and making decision on important issues of family.
Table 2.36. Cross tabulation table between education level and Gender
Content Gender
Tota
l
Male
Femal
e
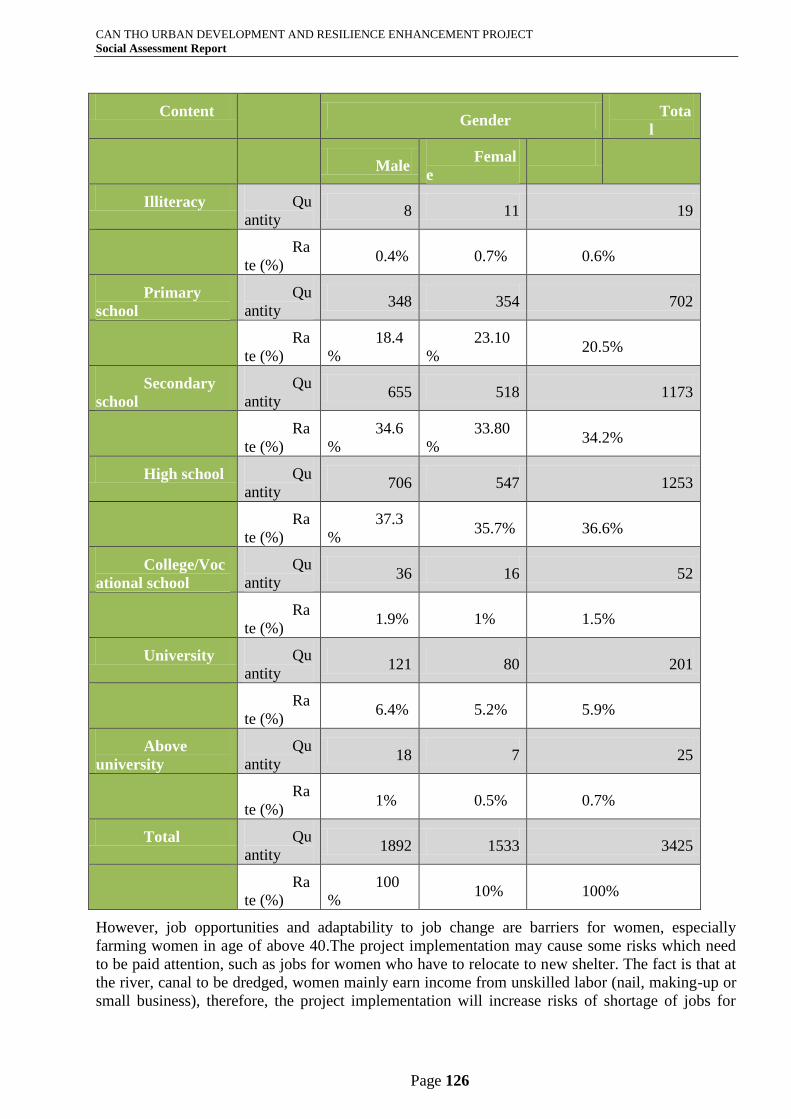
CAN THO URBAN DEVELOPMENT AND RESILIENCE ENHANCEMENT PROJECT
Social Assessment Report
Page 126
Content Gender
Tota
l
Male
Femal
e
Illiteracy Qu
antity 8 11 19
Ra
te (%) 0.4% 0.7% 0.6%
Primary
school
Qu
antity 348 354 702
Ra
te (%)
18.4
%
23.10
% 20.5%
Secondary
school
Qu
antity 655 518 1173
Ra
te (%)
34.6
%
33.80
% 34.2%
High school Qu
antity 706 547 1253
Ra
te (%)
37.3
% 35.7% 36.6%
College/Voc
ational school
Qu
antity 36 16 52
Ra
te (%) 1.9% 1% 1.5%
University Qu
antity 121 80 201
Ra
te (%) 6.4% 5.2% 5.9%
Above
university
Qu
antity 18 7 25
Ra
te (%) 1% 0.5% 0.7%
Total Qu
antity 1892 1533 3425
Ra
te (%)
100
% 10% 100%
However, job opportunities and adaptability to job change are barriers for women, especially
farming women in age of above 40.The project implementation may cause some risks which need
to be paid attention, such as jobs for women who have to relocate to new shelter. The fact is that at
the river, canal to be dredged, women mainly earn income from unskilled labor (nail, making-up or
small business), therefore, the project implementation will increase risks of shortage of jobs for
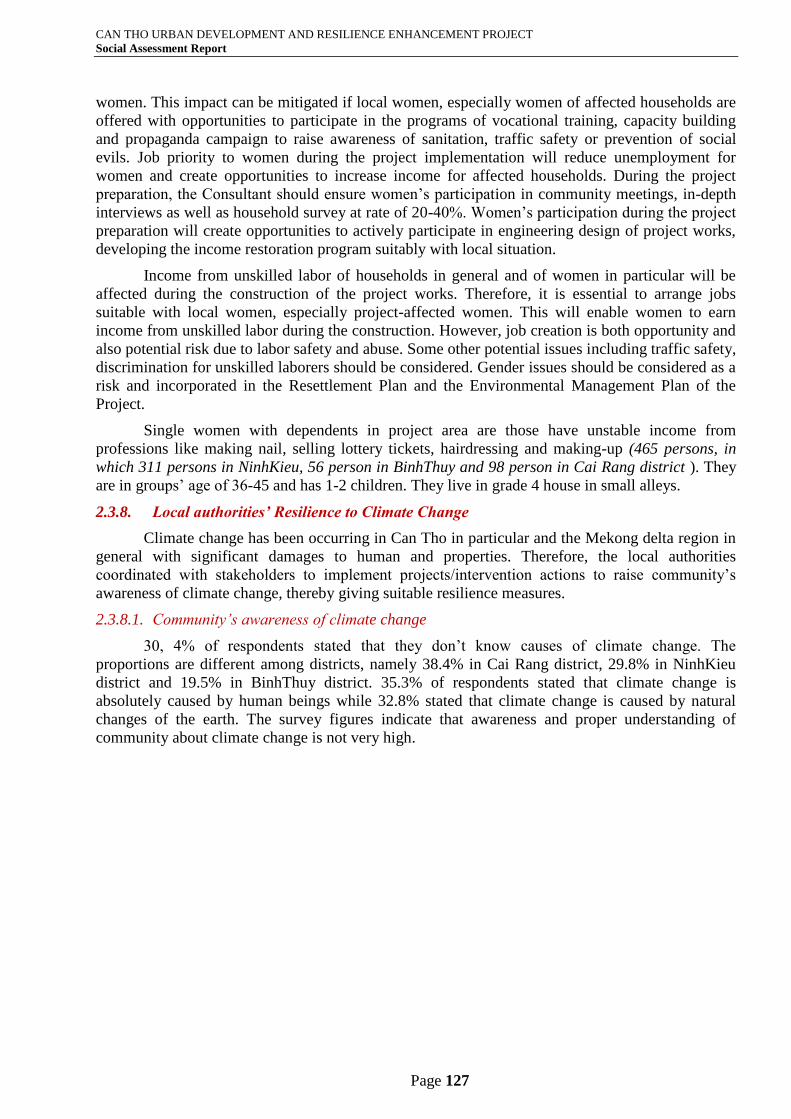
CAN THO URBAN DEVELOPMENT AND RESILIENCE ENHANCEMENT PROJECT
Social Assessment Report
Page 127
women. This impact can be mitigated if local women, especially women of affected households are
offered with opportunities to participate in the programs of vocational training, capacity building
and propaganda campaign to raise awareness of sanitation, traffic safety or prevention of social
evils. Job priority to women during the project implementation will reduce unemployment for
women and create opportunities to increase income for affected households. During the project
preparation, the Consultant should ensure women’s participation in community meetings, in-depth
interviews as well as household survey at rate of 20-40%. Women’s participation during the project
preparation will create opportunities to actively participate in engineering design of project works,
developing the income restoration program suitably with local situation.
Income from unskilled labor of households in general and of women in particular will be
affected during the construction of the project works. Therefore, it is essential to arrange jobs
suitable with local women, especially project-affected women. This will enable women to earn
income from unskilled labor during the construction. However, job creation is both opportunity and
also potential risk due to labor safety and abuse. Some other potential issues including traffic safety,
discrimination for unskilled laborers should be considered. Gender issues should be considered as a
risk and incorporated in the Resettlement Plan and the Environmental Management Plan of the
Project.
Single women with dependents in project area are those have unstable income from
professions like making nail, selling lottery tickets, hairdressing and making-up (465 persons, in
which 311 persons in NinhKieu, 56 person in BinhThuy and 98 person in Cai Rang district ). They
are in groups’ age of 36-45 and has 1-2 children. They live in grade 4 house in small alleys.
2.3.8. Local authorities’ Resilience to Climate Change
Climate change has been occurring in Can Tho in particular and the Mekong delta region in
general with significant damages to human and properties. Therefore, the local authorities
coordinated with stakeholders to implement projects/intervention actions to raise community’s
awareness of climate change, thereby giving suitable resilience measures.
2.3.8.1. Community’s awareness of climate change
30, 4% of respondents stated that they don’t know causes of climate change. The
proportions are different among districts, namely 38.4% in Cai Rang district, 29.8% in NinhKieu
district and 19.5% in BinhThuy district. 35.3% of respondents stated that climate change is
absolutely caused by human beings while 32.8% stated that climate change is caused by natural
changes of the earth. The survey figures indicate that awareness and proper understanding of
community about climate change is not very high.
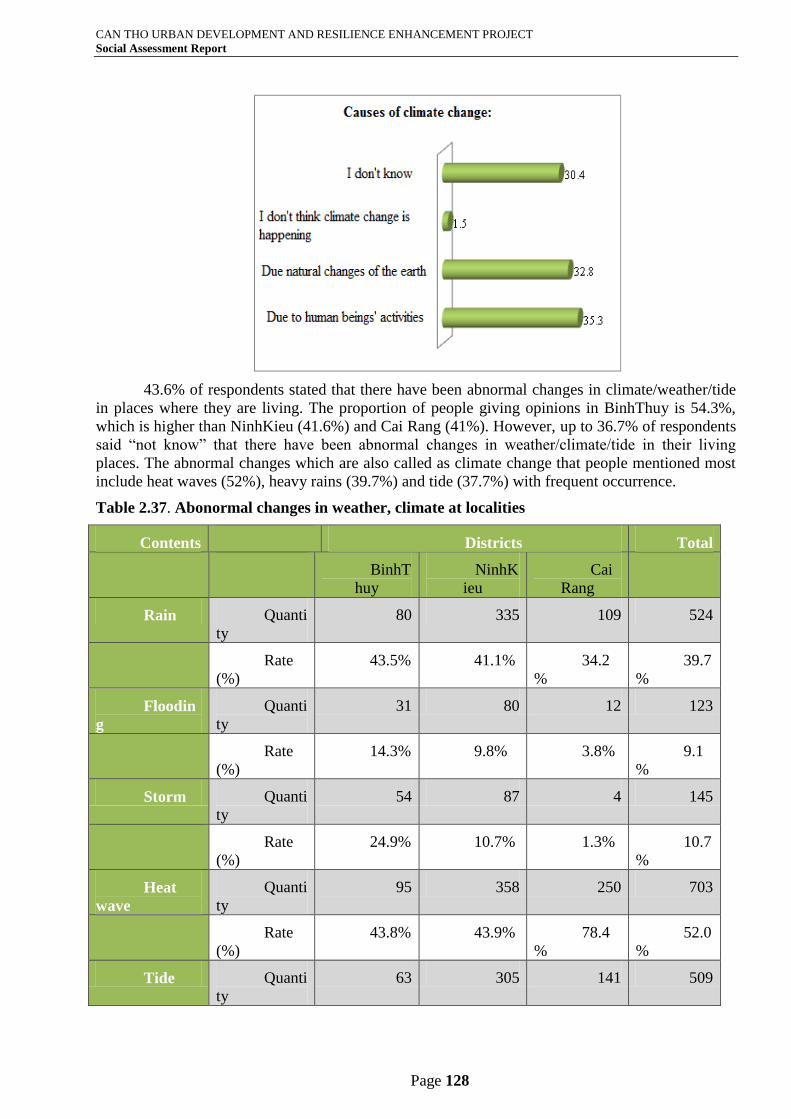
CAN THO URBAN DEVELOPMENT AND RESILIENCE ENHANCEMENT PROJECT
Social Assessment Report
Page 128
43.6% of respondents stated that there have been abnormal changes in climate/weather/tide
in places where they are living. The proportion of people giving opinions in BinhThuy is 54.3%,
which is higher than NinhKieu (41.6%) and Cai Rang (41%). However, up to 36.7% of respondents
said “not know” that there have been abnormal changes in weather/climate/tide in their living
places. The abnormal changes which are also called as climate change that people mentioned most
include heat waves (52%), heavy rains (39.7%) and tide (37.7%) with frequent occurrence.
Table 2.37. Abonormal changes in weather, climate at localities
Contents Districts Total
BinhT
huy
NinhK
ieu
Cai
Rang
Rain Quanti
ty
80 335 109 524
Rate
(%)
43.5% 41.1% 34.2
%
39.7
%
Floodin
g
Quanti
ty
31 80 12 123
Rate
(%)
14.3% 9.8% 3.8% 9.1
%
Storm Quanti
ty
54 87 4 145
Rate
(%)
24.9% 10.7% 1.3% 10.7
%
Heat
wave
Quanti
ty
95 358 250 703
Rate
(%)
43.8% 43.9% 78.4
%
52.0
%
Tide Quanti
ty
63 305 141 509
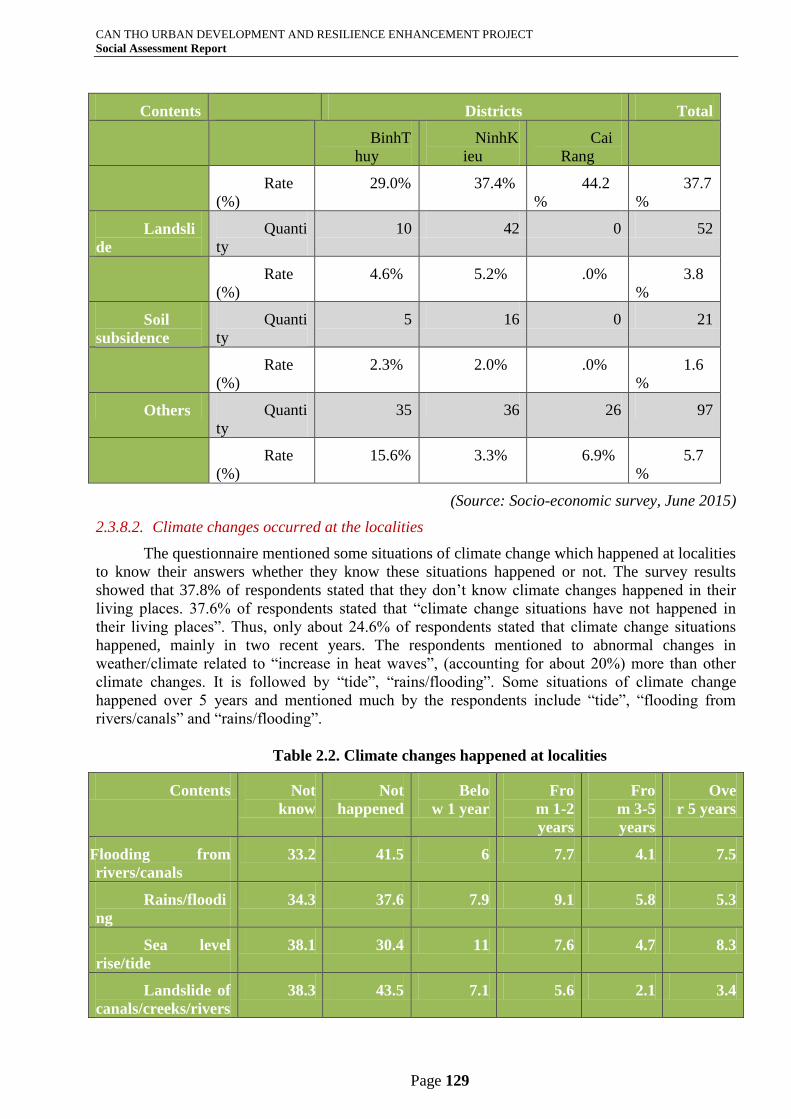
CAN THO URBAN DEVELOPMENT AND RESILIENCE ENHANCEMENT PROJECT
Social Assessment Report
Page 129
Contents Districts Total
BinhT
huy
NinhK
ieu
Cai
Rang
Rate
(%)
29.0% 37.4% 44.2
%
37.7
%
Landsli
de
Quanti
ty
10 42 0 52
Rate
(%)
4.6% 5.2% .0% 3.8
%
Soil
subsidence
Quanti
ty
5 16 0 21
Rate
(%)
2.3% 2.0% .0% 1.6
%
Others Quanti
ty
35 36 26 97
Rate
(%)
15.6% 3.3% 6.9% 5.7
%
(Source: Socio-economic survey, June 2015)
2.3.8.2. Climate changes occurred at the localities
The questionnaire mentioned some situations of climate change which happened at localities
to know their answers whether they know these situations happened or not. The survey results
showed that 37.8% of respondents stated that they don’t know climate changes happened in their
living places. 37.6% of respondents stated that “climate change situations have not happened in
their living places”. Thus, only about 24.6% of respondents stated that climate change situations
happened, mainly in two recent years. The respondents mentioned to abnormal changes in
weather/climate related to “increase in heat waves”, (accounting for about 20%) more than other
climate changes. It is followed by “tide”, “rains/flooding”. Some situations of climate change
happened over 5 years and mentioned much by the respondents include “tide”, “flooding from
rivers/canals” and “rains/flooding”.
Table 2.2. Climate changes happened at localities
Contents Not
know
Not
happened
Belo
w 1 year
Fro
m 1-2
years
Fro
m 3-5
years
Ove
r 5 years
Flooding from
rivers/canals
33.2 41.5 6 7.7 4.1 7.5
Rains/floodi
ng
34.3 37.6 7.9 9.1 5.8 5.3
Sea level
rise/tide
38.1 30.4 11 7.6 4.7 8.3
Landslide of
canals/creeks/rivers
38.3 43.5 7.1 5.6 2.1 3.4
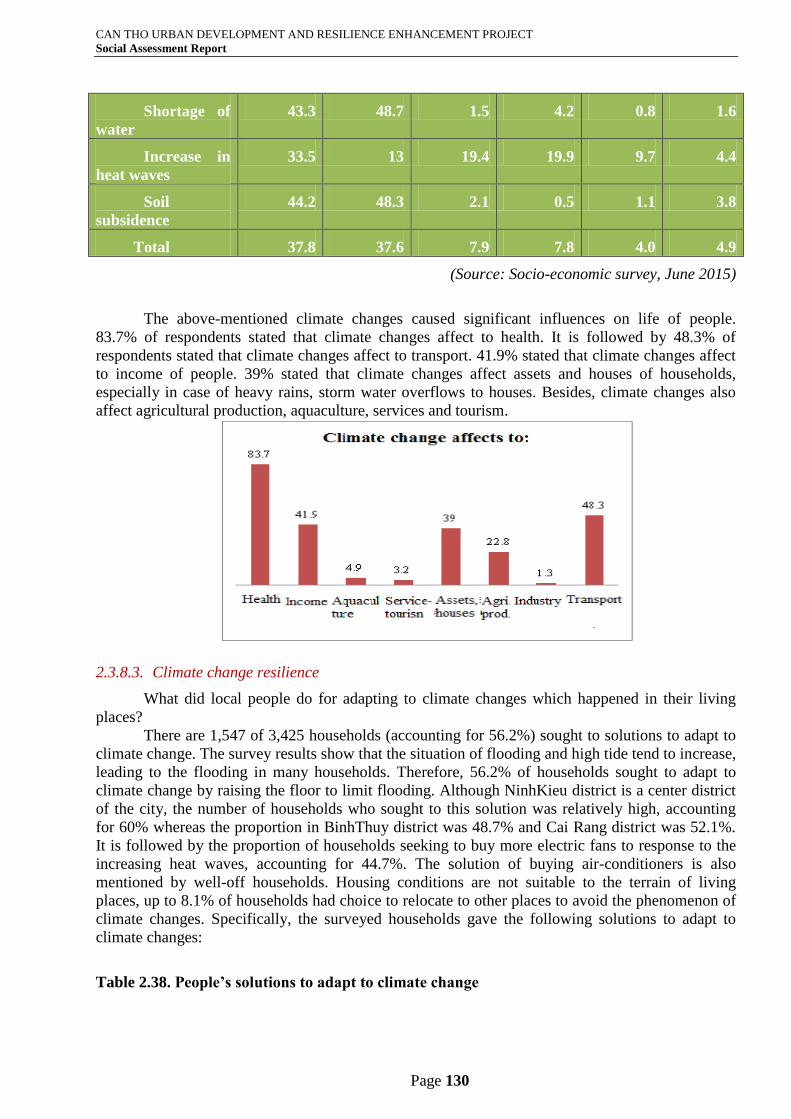
CAN THO URBAN DEVELOPMENT AND RESILIENCE ENHANCEMENT PROJECT
Social Assessment Report
Page 130
Shortage of
water
43.3 48.7 1.5 4.2 0.8 1.6
Increase in
heat waves
33.5 13 19.4 19.9 9.7 4.4
Soil
subsidence
44.2 48.3 2.1 0.5 1.1 3.8
Total 37.8 37.6 7.9 7.8 4.0 4.9
(Source: Socio-economic survey, June 2015)
The above-mentioned climate changes caused significant influences on life of people.
83.7% of respondents stated that climate changes affect to health. It is followed by 48.3% of
respondents stated that climate changes affect to transport. 41.9% stated that climate changes affect
to income of people. 39% stated that climate changes affect assets and houses of households,
especially in case of heavy rains, storm water overflows to houses. Besides, climate changes also
affect agricultural production, aquaculture, services and tourism.
2.3.8.3. Climate change resilience
What did local people do for adapting to climate changes which happened in their living
places?
There are 1,547 of 3,425 households (accounting for 56.2%) sought to solutions to adapt to
climate change. The survey results show that the situation of flooding and high tide tend to increase,
leading to the flooding in many households. Therefore, 56.2% of households sought to adapt to
climate change by raising the floor to limit flooding. Although NinhKieu district is a center district
of the city, the number of households who sought to this solution was relatively high, accounting
for 60% whereas the proportion in BinhThuy district was 48.7% and Cai Rang district was 52.1%.
It is followed by the proportion of households seeking to buy more electric fans to response to the
increasing heat waves, accounting for 44.7%. The solution of buying air-conditioners is also
mentioned by well-off households. Housing conditions are not suitable to the terrain of living
places, up to 8.1% of households had choice to relocate to other places to avoid the phenomenon of
climate changes. Specifically, the surveyed households gave the following solutions to adapt to
climate changes:
Table 2.38. People’s solutions to adapt to climate change
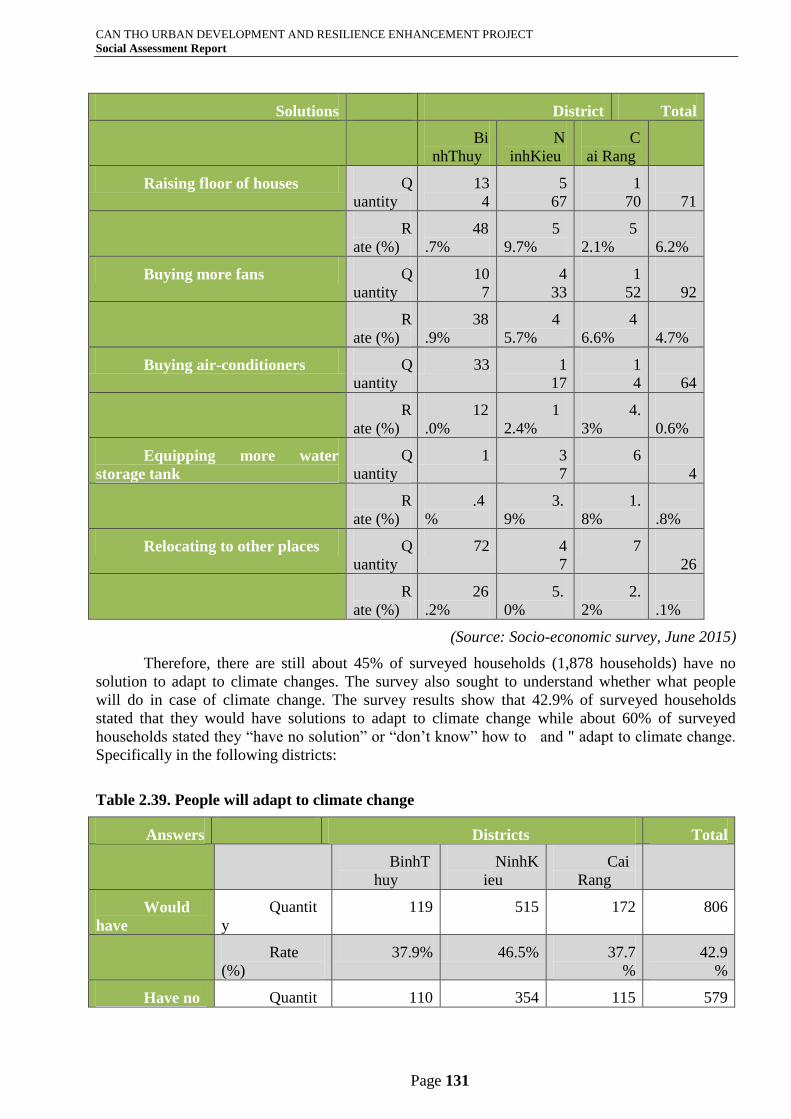
CAN THO URBAN DEVELOPMENT AND RESILIENCE ENHANCEMENT PROJECT
Social Assessment Report
Page 131
Solutions District Total
Bi
nhThuy
N
inhKieu
C
ai Rang
Raising floor of houses Q
uantity
13
4
5
67
1
70
8
71
R
ate (%)
48
.7%
5
9.7%
5
2.1%
5
6.2%
Buying more fans Q
uantity
10
7
4
33
1
52
6
92
R
ate (%)
38
.9%
4
5.7%
4
6.6%
4
4.7%
Buying air-conditioners Q
uantity
33 1
17
1
4
1
64
R
ate (%)
12
.0%
1
2.4%
4.
3%
1
0.6%
Equipping more water
storage tank
Q
uantity
1 3
7
6 4
4
R
ate (%)
.4
%
3.
9%
1.
8%
2
.8%
Relocating to other places Q
uantity
72 4
7
7 1
26
R
ate (%)
26
.2%
5.
0%
2.
2%
8
.1%
(Source: Socio-economic survey, June 2015)
Therefore, there are still about 45% of surveyed households (1,878 households) have no
solution to adapt to climate changes. The survey also sought to understand whether what people
will do in case of climate change. The survey results show that 42.9% of surveyed households
stated that they would have solutions to adapt to climate change while about 60% of surveyed
households stated they “have no solution” or “don’t know” how to and " adapt to climate change.
Specifically in the following districts:
Table 2.39. People will adapt to climate change
Answers Districts Total
BinhT
huy
NinhK
ieu
Cai
Rang
Would
have
Quantit
y
119 515 172 806
Rate
(%)
37.9% 46.5% 37.7
%
42.9
%
Have no Quantit 110 354 115 579
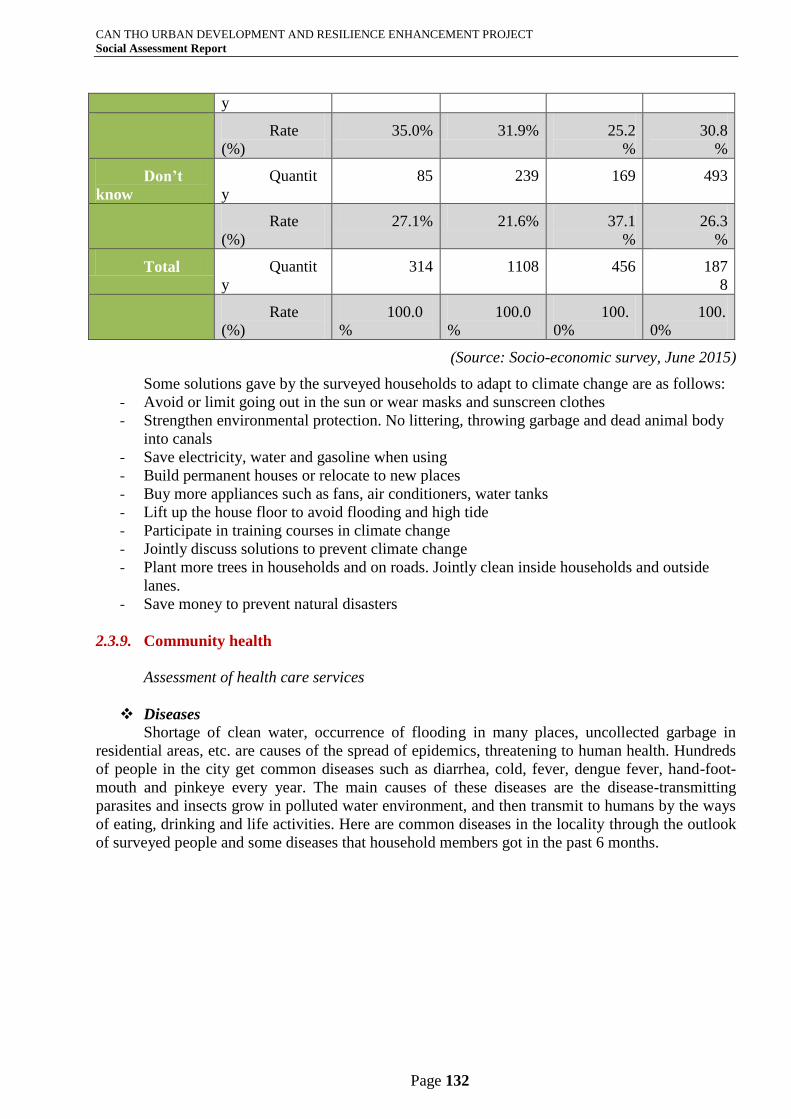
CAN THO URBAN DEVELOPMENT AND RESILIENCE ENHANCEMENT PROJECT
Social Assessment Report
Page 132
y
Rate
(%)
35.0% 31.9% 25.2
%
30.8
%
Don’t
know
Quantit
y
85 239 169 493
Rate
(%)
27.1% 21.6% 37.1
%
26.3
%
Total Quantit
y
314 1108 456 187
8
Rate
(%)
100.0
%
100.0
%
100.
0%
100.
0%
(Source: Socio-economic survey, June 2015)
Some solutions gave by the surveyed households to adapt to climate change are as follows:
- Avoid or limit going out in the sun or wear masks and sunscreen clothes
- Strengthen environmental protection. No littering, throwing garbage and dead animal body
into canals
- Save electricity, water and gasoline when using
- Build permanent houses or relocate to new places
- Buy more appliances such as fans, air conditioners, water tanks
- Lift up the house floor to avoid flooding and high tide
- Participate in training courses in climate change
- Jointly discuss solutions to prevent climate change
- Plant more trees in households and on roads. Jointly clean inside households and outside
lanes.
- Save money to prevent natural disasters
2.3.9. Community health
Assessment of health care services
Diseases
Shortage of clean water, occurrence of flooding in many places, uncollected garbage in
residential areas, etc. are causes of the spread of epidemics, threatening to human health. Hundreds
of people in the city get common diseases such as diarrhea, cold, fever, dengue fever, hand-foot-
mouth and pinkeye every year. The main causes of these diseases are the disease-transmitting
parasites and insects grow in polluted water environment, and then transmit to humans by the ways
of eating, drinking and life activities. Here are common diseases in the locality through the outlook
of surveyed people and some diseases that household members got in the past 6 months.
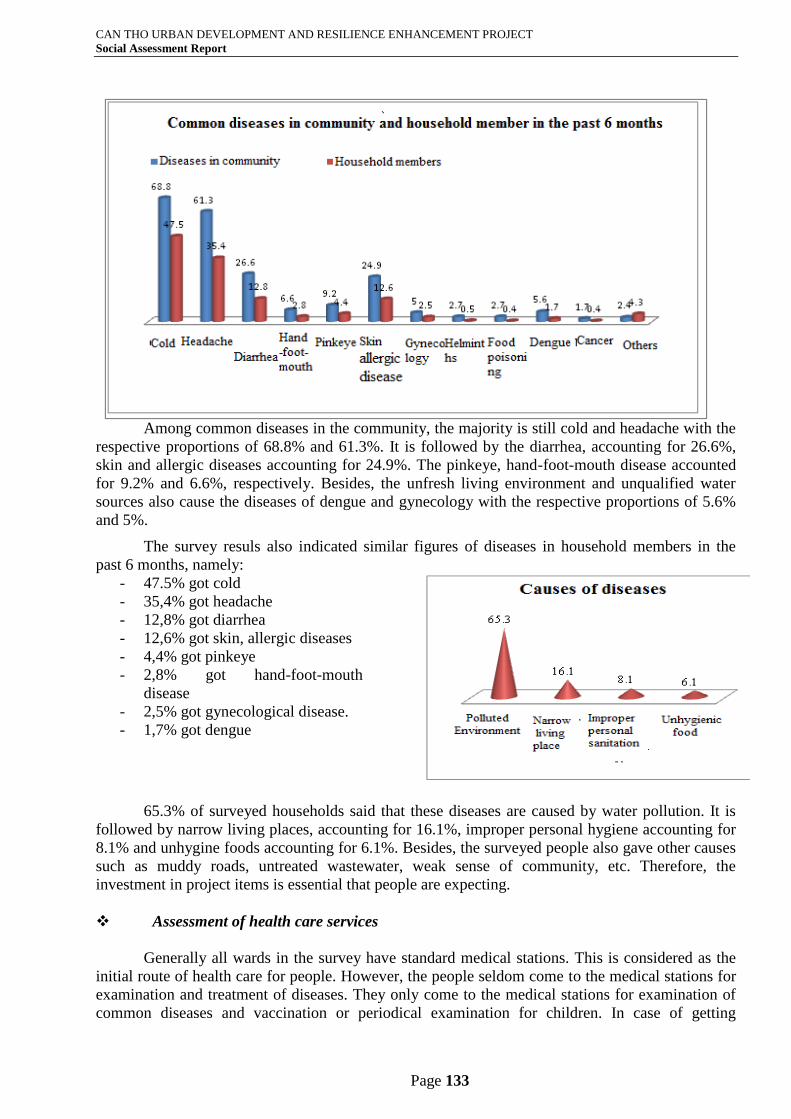
CAN THO URBAN DEVELOPMENT AND RESILIENCE ENHANCEMENT PROJECT
Social Assessment Report
Page 133
Among common diseases in the community, the majority is still cold and headache with the
respective proportions of 68.8% and 61.3%. It is followed by the diarrhea, accounting for 26.6%,
skin and allergic diseases accounting for 24.9%. The pinkeye, hand-foot-mouth disease accounted
for 9.2% and 6.6%, respectively. Besides, the unfresh living environment and unqualified water
sources also cause the diseases of dengue and gynecology with the respective proportions of 5.6%
and 5%.
The survey resuls also indicated similar figures of diseases in household members in the
past 6 months, namely:
- 47.5% got cold
- 35,4% got headache
- 12,8% got diarrhea
- 12,6% got skin, allergic diseases
- 4,4% got pinkeye
- 2,8% got hand-foot-mouth
disease
- 2,5% got gynecological disease.
- 1,7% got dengue
65.3% of surveyed households said that these diseases are caused by water pollution. It is
followed by narrow living places, accounting for 16.1%, improper personal hygiene accounting for
8.1% and unhygine foods accounting for 6.1%. Besides, the surveyed people also gave other causes
such as muddy roads, untreated wastewater, weak sense of community, etc. Therefore, the
investment in project items is essential that people are expecting.
Assessment of health care services
Generally all wards in the survey have standard medical stations. This is considered as the
initial route of health care for people. However, the people seldom come to the medical stations for
examination and treatment of diseases. They only come to the medical stations for examination of
common diseases and vaccination or periodical examination for children. In case of getting
Cảm
cúm
Nhức
đầu
Tiêu
chảy
Tay
chân
miệng
Đau
mắt đỏ
Bệnh
ngoài
da, di
ứng
Phụ
khoa
Giun
sán
Ngộ
độc
thực
phẩm
Sốt
xuất
huyết
Ung
thư
Khác
68.8
61.3
26.6
6.6 9.2
24.9
5 2.7 2.75.6
1.7 2.4
47.5
35.4
12.8
2.8 4.4
12.6
2.5 0.5 0.4 1.7 0.44.3
Những bệnh thường gặp trong cộng đồng và những bệnh thành viên trong gia đình
trong 6 tháng qua đã mắc phải
Những bệnh trong cộng đồng thành viên trong gia đình trong vòng 6 tháng qua bị mắc bệnh
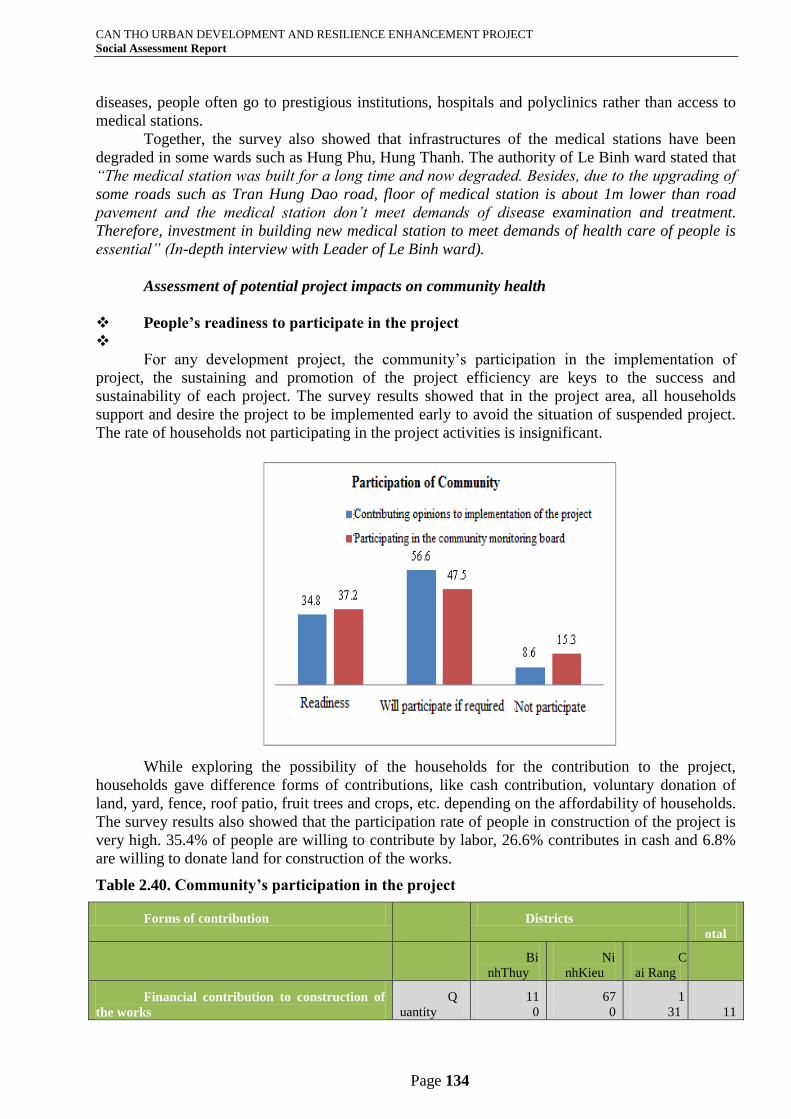
CAN THO URBAN DEVELOPMENT AND RESILIENCE ENHANCEMENT PROJECT
Social Assessment Report
Page 134
diseases, people often go to prestigious institutions, hospitals and polyclinics rather than access to
medical stations.
Together, the survey also showed that infrastructures of the medical stations have been
degraded in some wards such as Hung Phu, Hung Thanh. The authority of Le Binh ward stated that
“The medical station was built for a long time and now degraded. Besides, due to the upgrading of
some roads such as Tran Hung Dao road, floor of medical station is about 1m lower than road
pavement and the medical station don’t meet demands of disease examination and treatment.
Therefore, investment in building new medical station to meet demands of health care of people is
essential” (In-depth interview with Leader of Le Binh ward).
Assessment of potential project impacts on community health
People’s readiness to participate in the project
For any development project, the community’s participation in the implementation of
project, the sustaining and promotion of the project efficiency are keys to the success and
sustainability of each project. The survey results showed that in the project area, all households
support and desire the project to be implemented early to avoid the situation of suspended project.
The rate of households not participating in the project activities is insignificant.
While exploring the possibility of the households for the contribution to the project,
households gave difference forms of contributions, like cash contribution, voluntary donation of
land, yard, fence, roof patio, fruit trees and crops, etc. depending on the affordability of households.
The survey results also showed that the participation rate of people in construction of the project is
very high. 35.4% of people are willing to contribute by labor, 26.6% contributes in cash and 6.8%
are willing to donate land for construction of the works.
Table 2.40. Community’s participation in the project
Forms of contribution Districts T
otal
Bi
nhThuy
Ni
nhKieu
C
ai Rang
Financial contribution to construction of
the works
Q
uantity
11
0
67
0
1
31
9
11
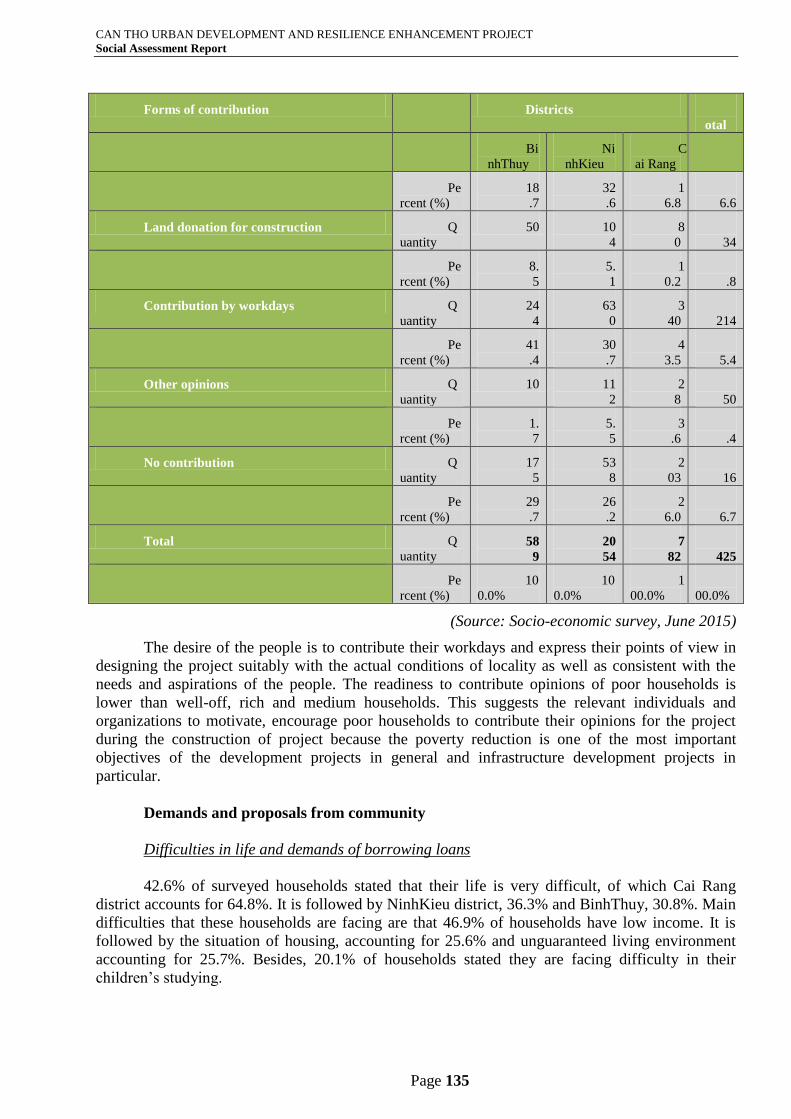
CAN THO URBAN DEVELOPMENT AND RESILIENCE ENHANCEMENT PROJECT
Social Assessment Report
Page 135
Forms of contribution Districts T
otal
Bi
nhThuy
Ni
nhKieu
C
ai Rang
Pe
rcent (%)
18
.7
32
.6
1
6.8
2
6.6
Land donation for construction Q
uantity
50 10
4
8
0
2
34
Pe
rcent (%)
8.
5
5.
1
1
0.2
6
.8
Contribution by workdays Q
uantity
24
4
63
0
3
40
1
214
Pe
rcent (%)
41
.4
30
.7
4
3.5
3
5.4
Other opinions Q
uantity
10 11
2
2
8
1
50
Pe
rcent (%)
1.
7
5.
5
3
.6
4
.4
No contribution Q
uantity
17
5
53
8
2
03
9
16
Pe
rcent (%)
29
.7
26
.2
2
6.0
2
6.7
Total Q
uantity 58
9
20
54
7
82
3
425
Pe
rcent (%)
10
0.0%
10
0.0%
1
00.0%
1
00.0%
(Source: Socio-economic survey, June 2015)
The desire of the people is to contribute their workdays and express their points of view in
designing the project suitably with the actual conditions of locality as well as consistent with the
needs and aspirations of the people. The readiness to contribute opinions of poor households is
lower than well-off, rich and medium households. This suggests the relevant individuals and
organizations to motivate, encourage poor households to contribute their opinions for the project
during the construction of project because the poverty reduction is one of the most important
objectives of the development projects in general and infrastructure development projects in
particular.
Demands and proposals from community
Difficulties in life and demands of borrowing loans
42.6% of surveyed households stated that their life is very difficult, of which Cai Rang
district accounts for 64.8%. It is followed by NinhKieu district, 36.3% and BinhThuy, 30.8%. Main
difficulties that these households are facing are that 46.9% of households have low income. It is
followed by the situation of housing, accounting for 25.6% and unguaranteed living environment
accounting for 25.7%. Besides, 20.1% of households stated they are facing difficulty in their
children’s studying.
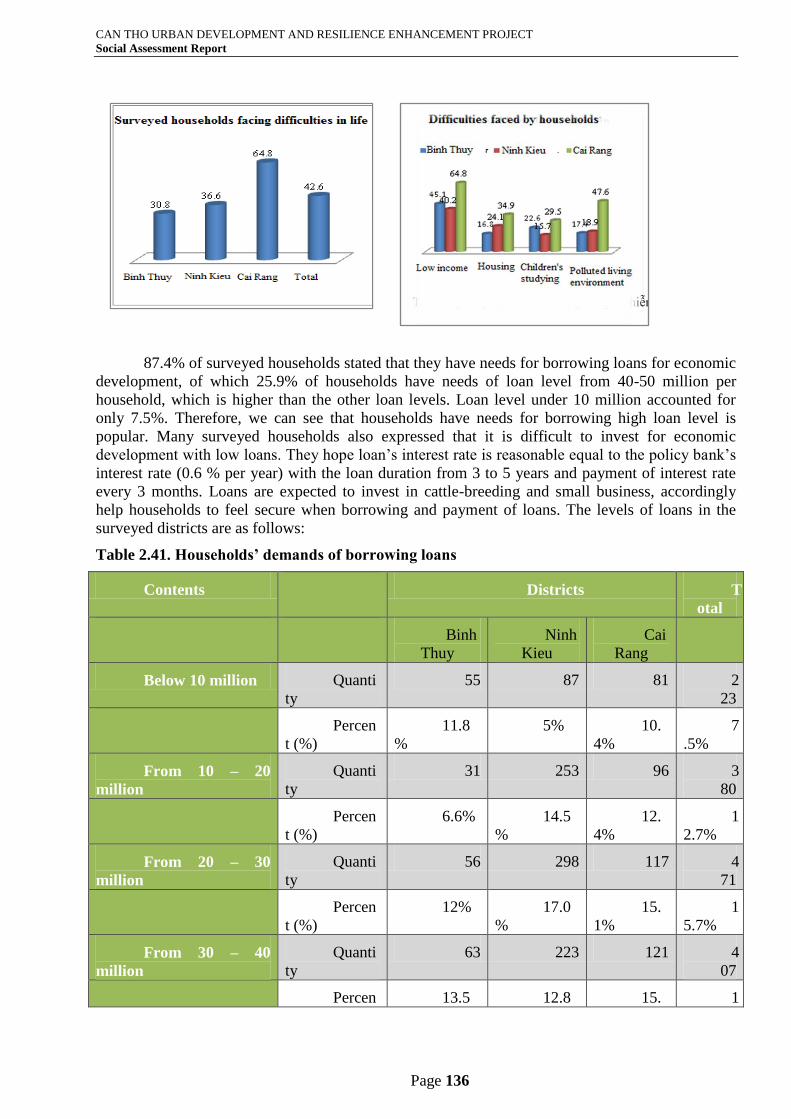
CAN THO URBAN DEVELOPMENT AND RESILIENCE ENHANCEMENT PROJECT
Social Assessment Report
Page 136
87.4% of surveyed households stated that they have needs for borrowing loans for economic
development, of which 25.9% of households have needs of loan level from 40-50 million per
household, which is higher than the other loan levels. Loan level under 10 million accounted for
only 7.5%. Therefore, we can see that households have needs for borrowing high loan level is
popular. Many surveyed households also expressed that it is difficult to invest for economic
development with low loans. They hope loan’s interest rate is reasonable equal to the policy bank’s
interest rate (0.6 % per year) with the loan duration from 3 to 5 years and payment of interest rate
every 3 months. Loans are expected to invest in cattle-breeding and small business, accordingly
help households to feel secure when borrowing and payment of loans. The levels of loans in the
surveyed districts are as follows:
Table 2.41. Households’ demands of borrowing loans
Contents Districts T
otal
Binh
Thuy
Ninh
Kieu
Cai
Rang
Below 10 million Quanti
ty
55 87 81 2
23
Percen
t (%)
11.8
%
5% 10.
4%
7
.5%
From 10 – 20
million
Quanti
ty
31 253 96 3
80
Percen
t (%)
6.6% 14.5
%
12.
4%
1
2.7%
From 20 – 30
million
Quanti
ty
56 298 117 4
71
Percen
t (%)
12% 17.0
%
15.
1%
1
5.7%
From 30 – 40
million
Quanti
ty
63 223 121 4
07
Percen 13.5 12.8 15. 1
Bình
Thủy
Ninh
Kều
Cái
Răng
Tổng
chung
30.8 36.6
64.8
42.6
Hộ gia đình khảo sát hiện "có" gặp
khó khăn trong cuộc sống
Thu nhập thấpNhà ởViệc học của con cáiMôi trường sống ô nhiễm
45.1
16.8 22.6 17.4
40.224.1
15.7 18.9
64.8
34.9 29.547.6
Những khó khăn hiện nay hộ dân
đang gặp phải
Q. Bình Thủy Q. Ninh Kiều
Q. Cái Răng
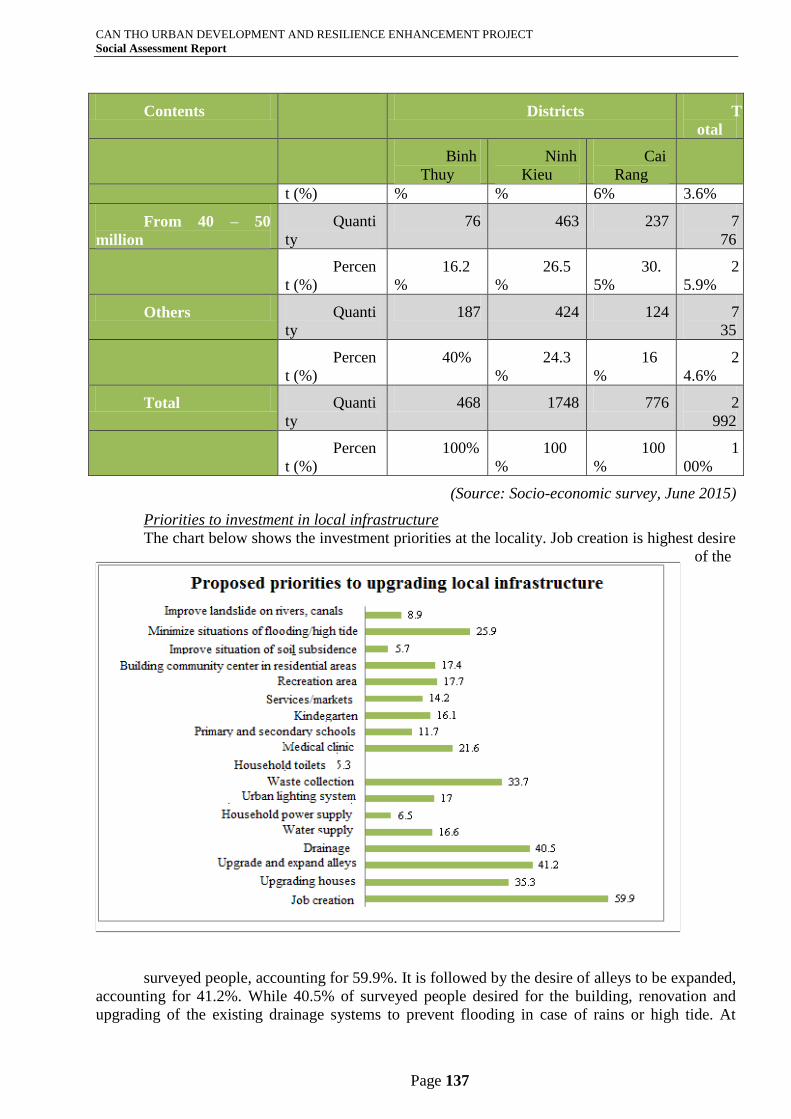
CAN THO URBAN DEVELOPMENT AND RESILIENCE ENHANCEMENT PROJECT
Social Assessment Report
Page 137
Contents Districts T
otal
Binh
Thuy
Ninh
Kieu
Cai
Rang
t (%) % % 6% 3.6%
From 40 – 50
million
Quanti
ty
76 463 237 7
76
Percen
t (%)
16.2
%
26.5
%
30.
5%
2
5.9%
Others Quanti
ty
187 424 124 7
35
Percen
t (%)
40% 24.3
%
16
%
2
4.6%
Total Quanti
ty
468 1748 776 2
992
Percen
t (%)
100% 100
%
100
%
1
00%
(Source: Socio-economic survey, June 2015)
Priorities to investment in local infrastructure
The chart below shows the investment priorities at the locality. Job creation is highest desire
of the
surveyed people, accounting for 59.9%. It is followed by the desire of alleys to be expanded,
accounting for 41.2%. While 40.5% of surveyed people desired for the building, renovation and
upgrading of the existing drainage systems to prevent flooding in case of rains or high tide. At
59.9
35.3
41.2
40.5
16.6
6.5
17
33.7
21.6
11.7
16.1
14.2
17.7
17.4
5.7
25.9
8.9
Việc làm
Nâng cấp nhà ở
Nâng cấp mở rộng hẻm
Thoát nước
Cấp nước
Cấp điện hộ gia đình
Hệ thống chiếu sáng đô thị
Thu gom rác
NVS hộ gia đình 5.3
Phòng khám bệnh
Trường học cấp 1,2
Nhà trẻ/mẫu giáo
Dịch vụ/chợ
Khu vui chơi giải trí
NVH khu dân cư
Cải tạo tình trạng sụt lún đất
Hạn chế tối đa tình trạng ngập úng/triều cường
Cải tạo, tình trạn sạt lở kênh, sông
Những ưu tiên đề xuất nâng cấp/cải tạo CSHT tại địa phương
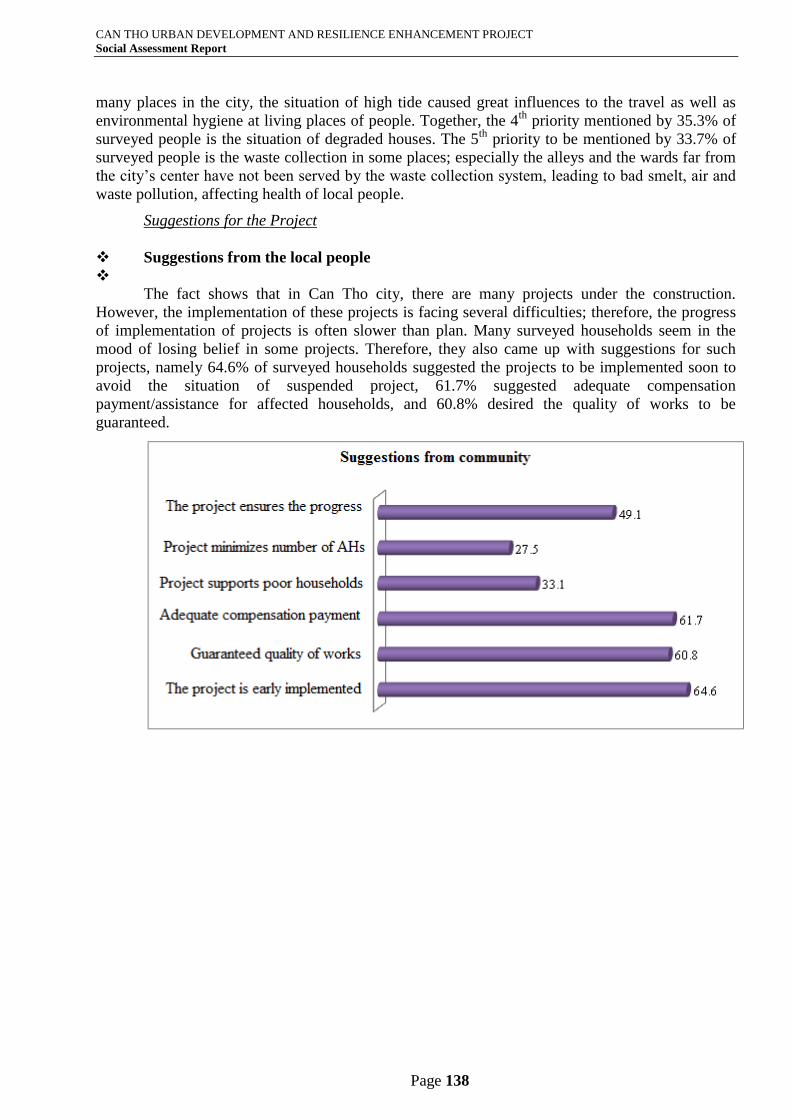
CAN THO URBAN DEVELOPMENT AND RESILIENCE ENHANCEMENT PROJECT
Social Assessment Report
Page 138
many places in the city, the situation of high tide caused great influences to the travel as well as
environmental hygiene at living places of people. Together, the 4th
priority mentioned by 35.3% of
surveyed people is the situation of degraded houses. The 5th
priority to be mentioned by 33.7% of
surveyed people is the waste collection in some places; especially the alleys and the wards far from
the city’s center have not been served by the waste collection system, leading to bad smelt, air and
waste pollution, affecting health of local people.
Suggestions for the Project
Suggestions from the local people
The fact shows that in Can Tho city, there are many projects under the construction.
However, the implementation of these projects is facing several difficulties; therefore, the progress
of implementation of projects is often slower than plan. Many surveyed households seem in the
mood of losing belief in some projects. Therefore, they also came up with suggestions for such
projects, namely 64.6% of surveyed households suggested the projects to be implemented soon to
avoid the situation of suspended project, 61.7% suggested adequate compensation
payment/assistance for affected households, and 60.8% desired the quality of works to be
guaranteed.
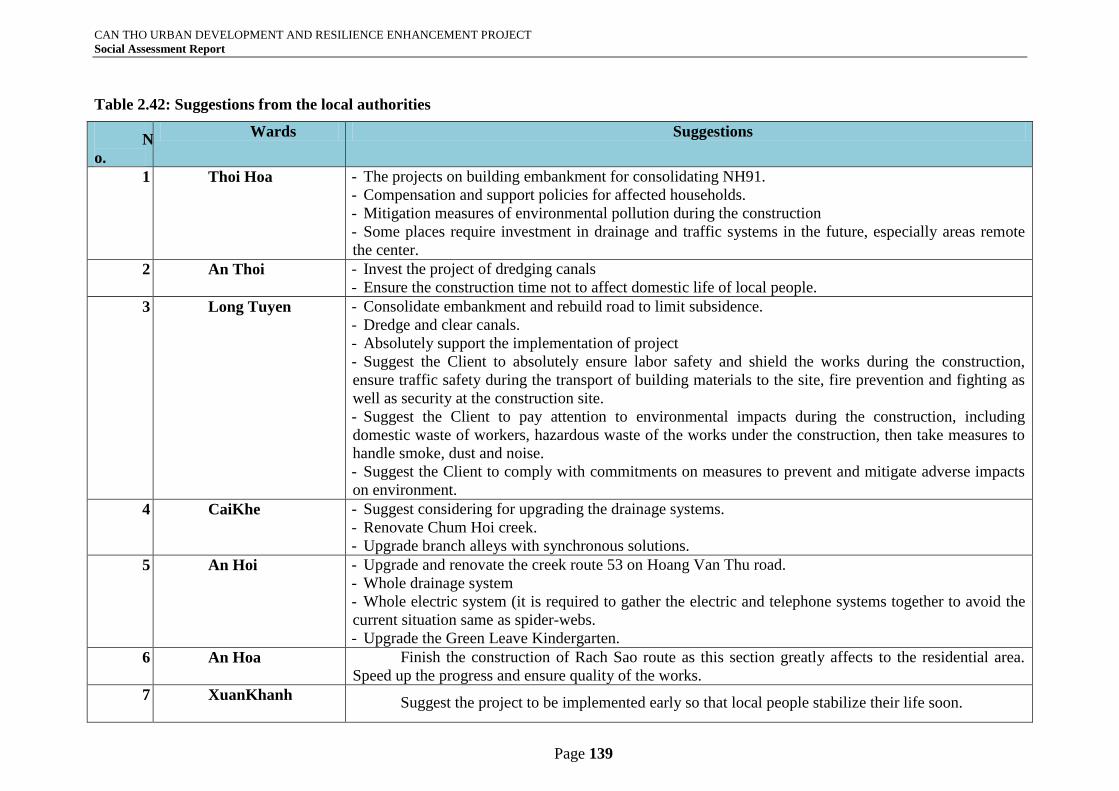
CAN THO URBAN DEVELOPMENT AND RESILIENCE ENHANCEMENT PROJECT
Social Assessment Report
Page 139
Table 2.42: Suggestions from the local authorities
N
o.
Wards Suggestions
1 Thoi Hoa - The projects on building embankment for consolidating NH91.
- Compensation and support policies for affected households.
- Mitigation measures of environmental pollution during the construction
- Some places require investment in drainage and traffic systems in the future, especially areas remote
the center.
2 An Thoi - Invest the project of dredging canals
- Ensure the construction time not to affect domestic life of local people.
3 Long Tuyen - Consolidate embankment and rebuild road to limit subsidence.
- Dredge and clear canals.
- Absolutely support the implementation of project
- Suggest the Client to absolutely ensure labor safety and shield the works during the construction,
ensure traffic safety during the transport of building materials to the site, fire prevention and fighting as
well as security at the construction site.
- Suggest the Client to pay attention to environmental impacts during the construction, including
domestic waste of workers, hazardous waste of the works under the construction, then take measures to
handle smoke, dust and noise.
- Suggest the Client to comply with commitments on measures to prevent and mitigate adverse impacts
on environment.
4 CaiKhe - Suggest considering for upgrading the drainage systems.
- Renovate Chum Hoi creek.
- Upgrade branch alleys with synchronous solutions.
5 An Hoi - Upgrade and renovate the creek route 53 on Hoang Van Thu road.
- Whole drainage system
- Whole electric system (it is required to gather the electric and telephone systems together to avoid the
current situation same as spider-webs.
- Upgrade the Green Leave Kindergarten.
6 An Hoa Finish the construction of Rach Sao route as this section greatly affects to the residential area.
Speed up the progress and ensure quality of the works.
7 XuanKhanh
Suggest the project to be implemented early so that local people stabilize their life soon.
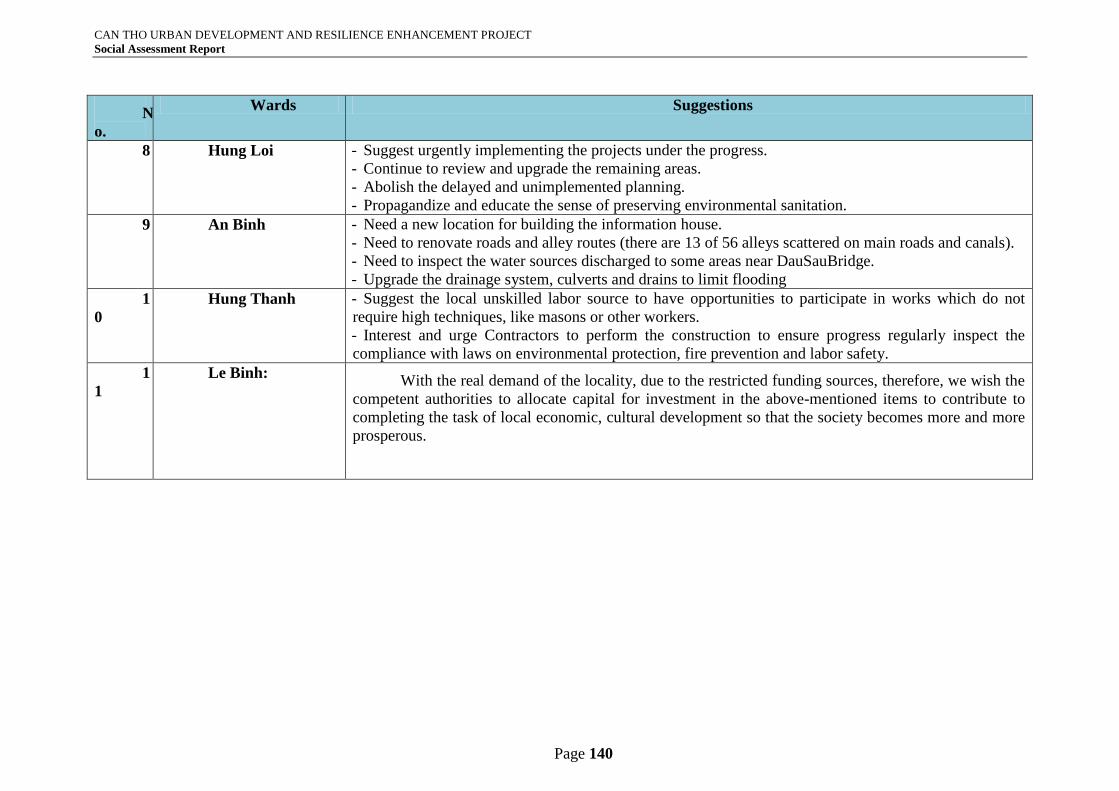
CAN THO URBAN DEVELOPMENT AND RESILIENCE ENHANCEMENT PROJECT
Social Assessment Report
Page 140
N
o.
Wards Suggestions
8 Hung Loi
- Suggest urgently implementing the projects under the progress.
- Continue to review and upgrade the remaining areas.
- Abolish the delayed and unimplemented planning.
- Propagandize and educate the sense of preserving environmental sanitation.
9 An Binh - Need a new location for building the information house.
- Need to renovate roads and alley routes (there are 13 of 56 alleys scattered on main roads and canals).
- Need to inspect the water sources discharged to some areas near DauSauBridge.
- Upgrade the drainage system, culverts and drains to limit flooding
1
0
Hung Thanh - Suggest the local unskilled labor source to have opportunities to participate in works which do not
require high techniques, like masons or other workers.
- Interest and urge Contractors to perform the construction to ensure progress regularly inspect the
compliance with laws on environmental protection, fire prevention and labor safety.
1
1
Le Binh: With the real demand of the locality, due to the restricted funding sources, therefore, we wish the
competent authorities to allocate capital for investment in the above-mentioned items to contribute to
completing the task of local economic, cultural development so that the society becomes more and more
prosperous.
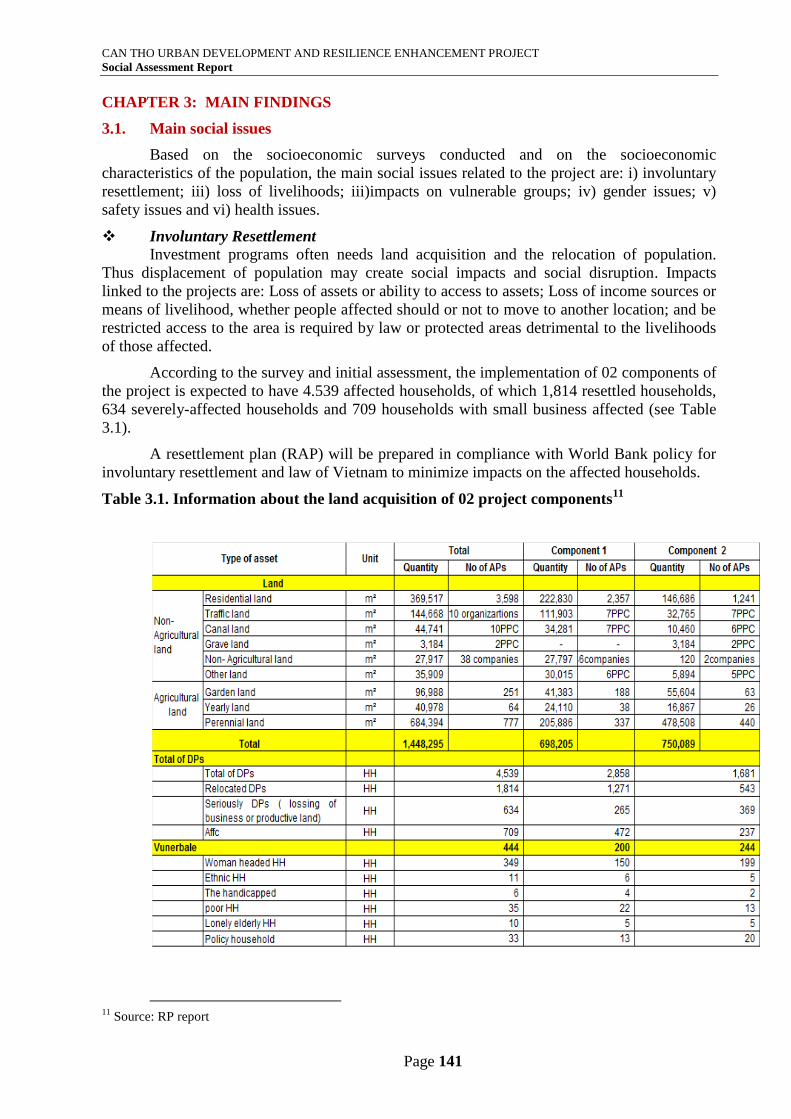
CAN THO URBAN DEVELOPMENT AND RESILIENCE ENHANCEMENT PROJECT
Social Assessment Report
Page 141
CHAPTER 3: MAIN FINDINGS
3.1. Main social issues
Based on the socioeconomic surveys conducted and on the socioeconomic
characteristics of the population, the main social issues related to the project are: i) involuntary
resettlement; iii) loss of livelihoods; iii)impacts on vulnerable groups; iv) gender issues; v)
safety issues and vi) health issues.
Involuntary Resettlement
Investment programs often needs land acquisition and the relocation of population.
Thus displacement of population may create social impacts and social disruption. Impacts
linked to the projects are: Loss of assets or ability to access to assets; Loss of income sources or
means of livelihood, whether people affected should or not to move to another location; and be
restricted access to the area is required by law or protected areas detrimental to the livelihoods
of those affected.
According to the survey and initial assessment, the implementation of 02 components of
the project is expected to have 4.539 affected households, of which 1,814 resettled households,
634 severely-affected households and 709 households with small business affected (see Table
3.1).
A resettlement plan (RAP) will be prepared in compliance with World Bank policy for
involuntary resettlement and law of Vietnam to minimize impacts on the affected households.
Table 3.1. Information about the land acquisition of 02 project components11
11
Source: RP report
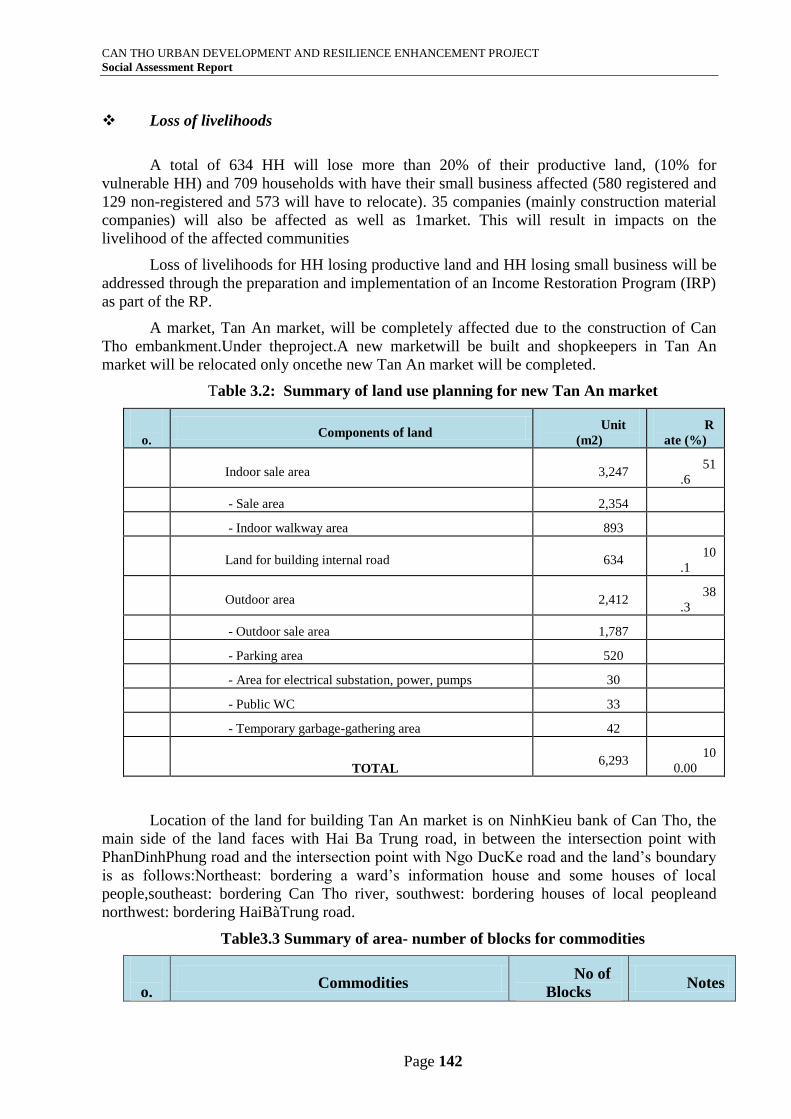
CAN THO URBAN DEVELOPMENT AND RESILIENCE ENHANCEMENT PROJECT
Social Assessment Report
Page 142
Loss of livelihoods
A total of 634 HH will lose more than 20% of their productive land, (10% for
vulnerable HH) and 709 households with have their small business affected (580 registered and
129 non-registered and 573 will have to relocate). 35 companies (mainly construction material
companies) will also be affected as well as 1market. This will result in impacts on the
livelihood of the affected communities
Loss of livelihoods for HH losing productive land and HH losing small business will be
addressed through the preparation and implementation of an Income Restoration Program (IRP)
as part of the RP.
A market, Tan An market, will be completely affected due to the construction of Can
Tho embankment.Under theproject.A new marketwill be built and shopkeepers in Tan An
market will be relocated only oncethe new Tan An market will be completed.
Table 3.2: Summary of land use planning for new Tan An market
N
o. Components of land
Unit
(m2)
R
ate (%)
1 Indoor sale area 3,247 51
.6
- Sale area 2,354
- Indoor walkway area 893
2 Land for building internal road 634 10
.1
3 Outdoor area 2,412 38
.3
- Outdoor sale area 1,787
- Parking area 520
- Area for electrical substation, power, pumps 30
- Public WC 33
- Temporary garbage-gathering area 42
TOTAL 6,293
10
0.00
Location of the land for building Tan An market is on NinhKieu bank of Can Tho, the
main side of the land faces with Hai Ba Trung road, in between the intersection point with
PhanDinhPhung road and the intersection point with Ngo DucKe road and the land’s boundary
is as follows:Northeast: bordering a ward’s information house and some houses of local
people,southeast: bordering Can Tho river, southwest: bordering houses of local peopleand
northwest: bordering HaiBàTrung road.
Table3.3 Summary of area- number of blocks for commodities
N
o. Commodities
No of
Blocks Notes
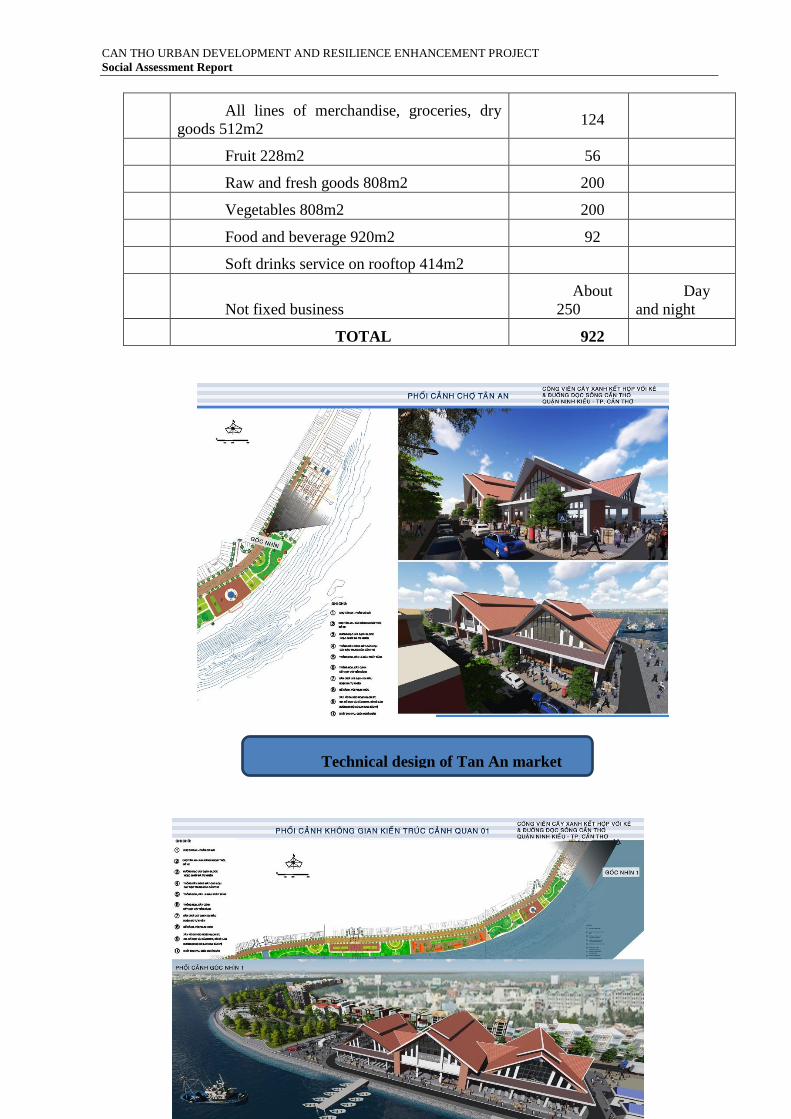
CAN THO URBAN DEVELOPMENT AND RESILIENCE ENHANCEMENT PROJECT
Social Assessment Report
Page 143
1 All lines of merchandise, groceries, dry
goods 512m2 124
2 Fruit 228m2 56
3 Raw and fresh goods 808m2 200
4 Vegetables 808m2 200
5 Food and beverage 920m2 92
6 Soft drinks service on rooftop 414m2
9 Not fixed business
About
250
Day
and night
TOTAL 922
Technical design of Tan An market
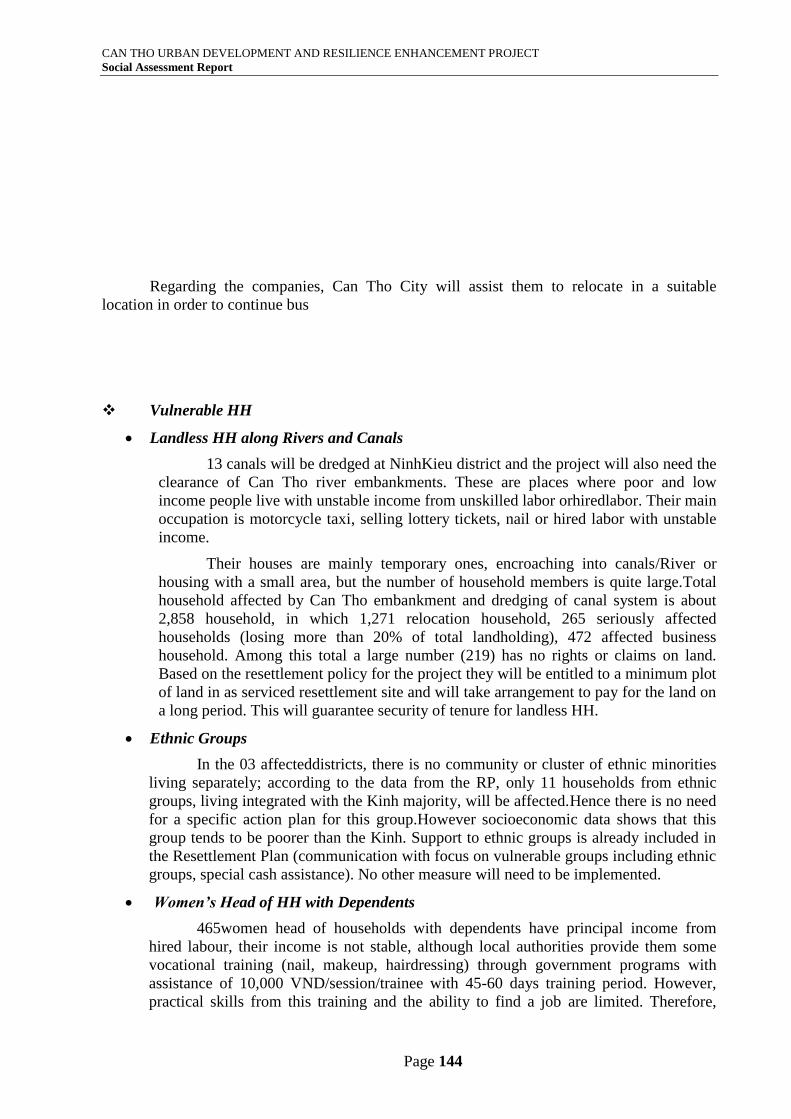
CAN THO URBAN DEVELOPMENT AND RESILIENCE ENHANCEMENT PROJECT
Social Assessment Report
Page 144
Regarding the companies, Can Tho City will assist them to relocate in a suitable
location in order to continue bus
Vulnerable HH
Landless HH along Rivers and Canals
13 canals will be dredged at NinhKieu district and the project will also need the
clearance of Can Tho river embankments. These are places where poor and low
income people live with unstable income from unskilled labor orhiredlabor. Their main
occupation is motorcycle taxi, selling lottery tickets, nail or hired labor with unstable
income.
Their houses are mainly temporary ones, encroaching into canals/River or
housing with a small area, but the number of household members is quite large.Total
household affected by Can Tho embankment and dredging of canal system is about
2,858 household, in which 1,271 relocation household, 265 seriously affected
households (losing more than 20% of total landholding), 472 affected business
household. Among this total a large number (219) has no rights or claims on land.
Based on the resettlement policy for the project they will be entitled to a minimum plot
of land in as serviced resettlement site and will take arrangement to pay for the land on
a long period. This will guarantee security of tenure for landless HH.
Ethnic Groups
In the 03 affecteddistricts, there is no community or cluster of ethnic minorities
living separately; according to the data from the RP, only 11 households from ethnic
groups, living integrated with the Kinh majority, will be affected.Hence there is no need
for a specific action plan for this group.However socioeconomic data shows that this
group tends to be poorer than the Kinh. Support to ethnic groups is already included in
the Resettlement Plan (communication with focus on vulnerable groups including ethnic
groups, special cash assistance). No other measure will need to be implemented.
Women’s Head of HH with Dependents
465women head of households with dependents have principal income from
hired labour, their income is not stable, although local authorities provide them some
vocational training (nail, makeup, hairdressing) through government programs with
assistance of 10,000 VND/session/trainee with 45-60 days training period. However,
practical skills from this training and the ability to find a job are limited. Therefore,
CAN THO URBAN DEVELOPMENT AND RESILIENCE ENHANCEMENT PROJECT
Social Assessment Report
Page 145
effectiveness of those training programs is very low. Credit program is a better option
for livelihood restoration.
Gender Issues
The CTUDRP can impact differently on men and women. Women’s livelihoods are
often located in the informal sector (small business) where impacts can often be overlooked.
The project is expected to have significant negative impacts on the livelihoods of women as
well as men and also on livelihoods which are not formally registered (especially for HH living
along the Can Tho River). The compensation process associated with land acquisition has also
the potential to alienate women from household assets if compensation is not made to both
spouses heading households. Female-headed households face additional challenges associated
with resettlement, especially when they are reliant on extended family and social networks for
the care and socialization of children.
Women are also more susceptible to the risks of HIV/AIDS infection compared to men.
Women are physiologically more susceptible to infection through sexual contact than
men. Partnered women are also less able to reduce their risks of infection simply by modifying
their own behavior as they are reliant on their partner’s behavior to avert the risk of infection.
To address these issues, the Resettlement Plan includes an Income Restoration plan
with specific focus on small business affected. A Gender Action Plan (GAP) has also been
prepared (see Annex 1). The objectives of the GAP are: (1) provide opportunities for and
strengthen the role of women in local economic activities; (2) disseminate information about
urban environmental sustainability and social risks to men and women; and (3) increase female
representation in the sector and in decision making positions.
Safety Issues
During the construction, the transportation of materials may increase risks of traffic
accidents and hinder daily travel of residents and damage to local roads, waterway, increase
conflicts in using water for irrigation and domestic purposes. To minimize impacts during the
construction, the contractors should disclose the construction schedule, at the same time; install
fully signals at the construction areas to ensure safety for residents. The ESIA includes
measures to minimize impacts on safety.
Health Issues Beside environmental impacts to community health during the construction, the project
implementation also causes risks of spread of infectious diseases.
Risks of spreading Sexually Transmitted infections(STIs) may be caused by the project
for the following reasons: (i) existing dissemination and infection rate; (ii) community’s
knowledge about infection ways and prevention measures; and (iii) presence of
international/outsourced laborers. In the fact, the results of consultations at project
districts/communes showed that local people are regularly provided with information about
HIV/STIs by medical officials in coordination with Family planning division/ Ward/commune
Women’s Union. In addition, provision of condoms and disseminations of information about
HIV/STIs will be provided.
Mitigation measures of risks of spreading STIs and HIV during the construction of
project items should be taken. These measures include raising awareness of STIs and HIV for
benefitted/affected communities as well as workers. The project should also link to existing
initiatives to raise awareness of prevention measures. These prevention measures include:
CAN THO URBAN DEVELOPMENT AND RESILIENCE ENHANCEMENT PROJECT
Social Assessment Report
Page 146
- The construction contract will require the contractors to establish a human force to
participate in STIs, HIV/AIDS prevention seminar hold by a service provider approved.
Seminars will be hold for laborers before commencement of the works;
- Providing condoms at the construction site;
- Basing on community to raise awareness of risks of spreading of STIs and HIV,
reproductive health, safe sex and human trafficking.
3.2. Potential Project Impacts and Social Risks
This section examines the potential project impacts for the two projects’ components. Social
impacts, both positive and negatives and social risks are identified in the following tables for
the two components of the Project: i) Flood Control and Sanitation Component and ii) Urban
Corridor Development Component.
3.2.1. Flood Control & Sanitation Component
The positive and negative impacts and the social risks associated with the Flood Control
and sanitation component are presented in the table below.
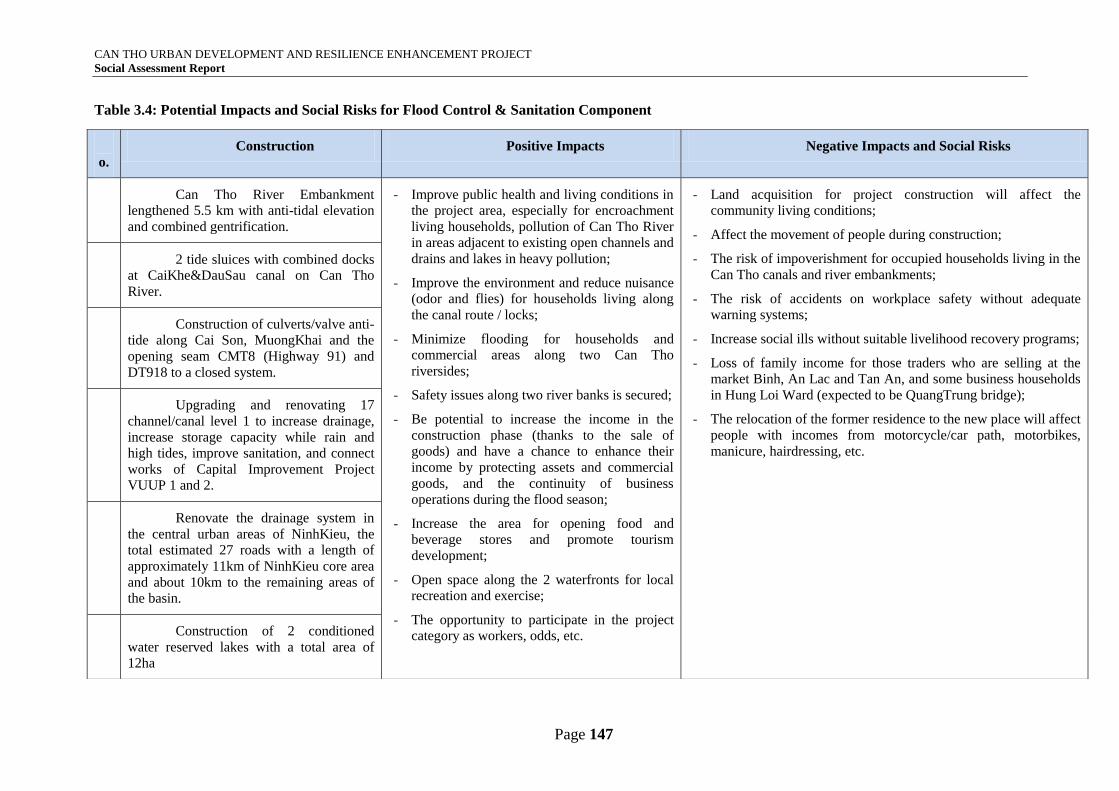
CAN THO URBAN DEVELOPMENT AND RESILIENCE ENHANCEMENT PROJECT
Social Assessment Report
Page 147
Table 3.4: Potential Impacts and Social Risks for Flood Control & Sanitation Component
N
o.
Construction Positive Impacts Negative Impacts and Social Risks
1 Can Tho River Embankment
lengthened 5.5 km with anti-tidal elevation
and combined gentrification.
- Improve public health and living conditions in
the project area, especially for encroachment
living households, pollution of Can Tho River
in areas adjacent to existing open channels and
drains and lakes in heavy pollution;
- Improve the environment and reduce nuisance
(odor and flies) for households living along
the canal route / locks;
- Minimize flooding for households and
commercial areas along two Can Tho
riversides;
- Safety issues along two river banks is secured;
- Be potential to increase the income in the
construction phase (thanks to the sale of
goods) and have a chance to enhance their
income by protecting assets and commercial
goods, and the continuity of business
operations during the flood season;
- Increase the area for opening food and
beverage stores and promote tourism
development;
- Open space along the 2 waterfronts for local
recreation and exercise;
- The opportunity to participate in the project
category as workers, odds, etc.
- Land acquisition for project construction will affect the
community living conditions;
- Affect the movement of people during construction;
- The risk of impoverishment for occupied households living in the
Can Tho canals and river embankments;
- The risk of accidents on workplace safety without adequate
warning systems;
- Increase social ills without suitable livelihood recovery programs;
- Loss of family income for those traders who are selling at the
market Binh, An Lac and Tan An, and some business households
in Hung Loi Ward (expected to be QuangTrung bridge);
- The relocation of the former residence to the new place will affect
people with incomes from motorcycle/car path, motorbikes,
manicure, hairdressing, etc.
2 2 tide sluices with combined docks
at CaiKhe&DauSau canal on Can Tho
River.
3 Construction of culverts/valve anti-
tide along Cai Son, MuongKhai and the
opening seam CMT8 (Highway 91) and
DT918 to a closed system.
4 Upgrading and renovating 17
channel/canal level 1 to increase drainage,
increase storage capacity while rain and
high tides, improve sanitation, and connect
works of Capital Improvement Project
VUUP 1 and 2.
5 Renovate the drainage system in
the central urban areas of NinhKieu, the
total estimated 27 roads with a length of
approximately 11km of NinhKieu core area
and about 10km to the remaining areas of
the basin.
6 Construction of 2 conditioned
water reserved lakes with a total area of 12ha
CAN THO URBAN DEVELOPMENT AND RESILIENCE ENHANCEMENT PROJECT
Social Assessment Report
Page 148
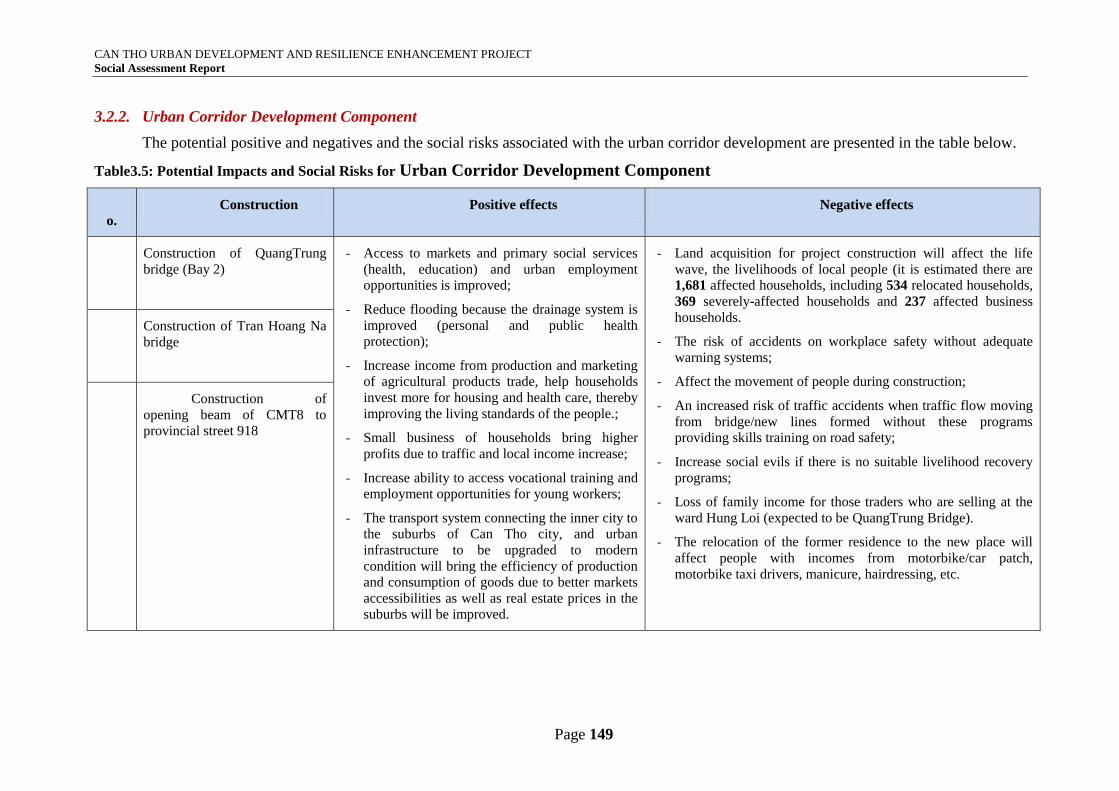
CAN THO URBAN DEVELOPMENT AND RESILIENCE ENHANCEMENT PROJECT
Social Assessment Report
Page 149
3.2.2. Urban Corridor Development Component
The potential positive and negatives and the social risks associated with the urban corridor development are presented in the table below.
Table3.5: Potential Impacts and Social Risks for Urban Corridor Development Component
N
o.
Construction Positive effects Negative effects
1 Construction of QuangTrung
bridge (Bay 2)
- Access to markets and primary social services
(health, education) and urban employment
opportunities is improved;
- Reduce flooding because the drainage system is
improved (personal and public health
protection);
- Increase income from production and marketing
of agricultural products trade, help households
invest more for housing and health care, thereby
improving the living standards of the people.;
- Small business of households bring higher
profits due to traffic and local income increase;
- Increase ability to access vocational training and
employment opportunities for young workers;
- The transport system connecting the inner city to
the suburbs of Can Tho city, and urban
infrastructure to be upgraded to modern
condition will bring the efficiency of production
and consumption of goods due to better markets
accessibilities as well as real estate prices in the
suburbs will be improved.
- Land acquisition for project construction will affect the life
wave, the livelihoods of local people (it is estimated there are
1,681 affected households, including 534 relocated households,
369 severely-affected households and 237 affected business
households.
- The risk of accidents on workplace safety without adequate
warning systems;
- Affect the movement of people during construction;
- An increased risk of traffic accidents when traffic flow moving
from bridge/new lines formed without these programs
providing skills training on road safety;
- Increase social evils if there is no suitable livelihood recovery
programs;
- Loss of family income for those traders who are selling at the
ward Hung Loi (expected to be QuangTrung Bridge).
- The relocation of the former residence to the new place will
affect people with incomes from motorbike/car patch,
motorbike taxi drivers, manicure, hairdressing, etc.
2 Construction of Tran Hoang Na
bridge
3 Construction of
opening beam of CMT8 to
provincial street 918
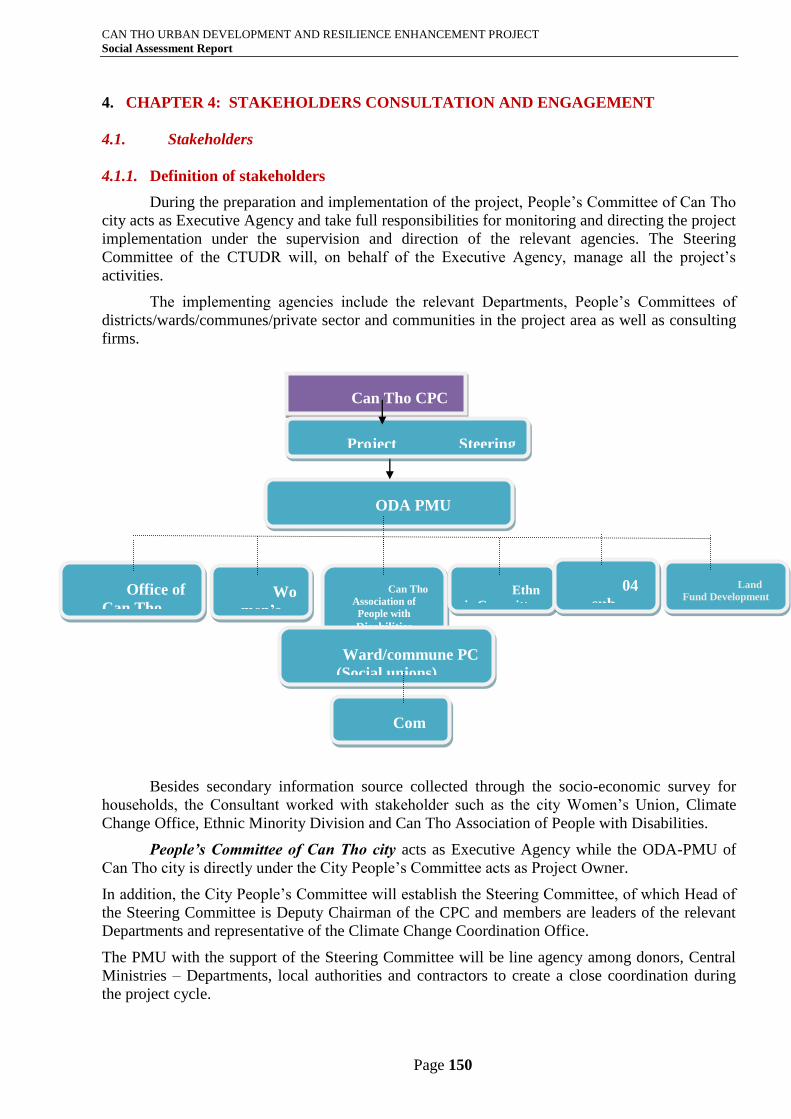
CAN THO URBAN DEVELOPMENT AND RESILIENCE ENHANCEMENT PROJECT
Social Assessment Report
Page 150
4. CHAPTER 4: STAKEHOLDERS CONSULTATION AND ENGAGEMENT
4.1. Stakeholders
4.1.1. Definition of stakeholders
During the preparation and implementation of the project, People’s Committee of Can Tho
city acts as Executive Agency and take full responsibilities for monitoring and directing the project
implementation under the supervision and direction of the relevant agencies. The Steering
Committee of the CTUDR will, on behalf of the Executive Agency, manage all the project’s
activities.
The implementing agencies include the relevant Departments, People’s Committees of
districts/wards/communes/private sector and communities in the project area as well as consulting
firms.
3.2.2. Roles of the Management Agencies
Besides secondary information source collected through the socio-economic survey for
households, the Consultant worked with stakeholder such as the city Women’s Union, Climate
Change Office, Ethnic Minority Division and Can Tho Association of People with Disabilities.
People’s Committee of Can Tho city acts as Executive Agency while the ODA-PMU of
Can Tho city is directly under the City People’s Committee acts as Project Owner.
In addition, the City People’s Committee will establish the Steering Committee, of which Head of
the Steering Committee is Deputy Chairman of the CPC and members are leaders of the relevant
Departments and representative of the Climate Change Coordination Office.
The PMU with the support of the Steering Committee will be line agency among donors, Central
Ministries – Departments, local authorities and contractors to create a close coordination during
the project cycle.
Can Tho CPC
Office of
Can Tho
Climate Change
ODA PMU
Wo
men’s
Union
Can Tho
Association of
People with
Disabilities
Ethn
ic Committee
04
sub-
committee
s
Land
Fund Development
Center
Ward/commune PC
(Social unions)
Com
munity
Project Steering
Committtee
CAN THO URBAN DEVELOPMENT AND RESILIENCE ENHANCEMENT PROJECT
Social Assessment Report
Page 151
After obtaining the approval and loans, the GoV will authorize the People’s Committee of Can
Tho city to manage the above-mentioned loan.
The CPC will appoint the ODA-PMU of Can Tho city to be Client of the project and allocate such
loan for the Client to implement the Project.
Pursuant to Decision No. 53/QD- BCD dated 20 April 2015 of the Project Steering
Committee on establishment of Project Steering Sub-Committees as follows:
The Investment, Planning and Financial Sub-Committee
Work Items Preparation Sub-Committee.
Compensation, Assistance, Resettlement and Environmental Assessment Sub-Committee.
Capacity Building and Technical Assistance Sub-Committee.
In addition, the city People's Committee established the Steering Board with the Chairman
of Steering Committee as Vice chairman of CPC and members from Department - related sector of
the city and a representative from office of Climate Change. The function of the Steering Board is
to take responsibility for preparation of work plan and controls the loan disbursement and ensures
the relationship with the agencies involved in provincial and central government. Project Steering
Committee will be institutionalized fully competent for the project management unit, as well as the
provincial departments and the departments of the cities involved in the project implementation.
This authority will be determined after legally province issued a decision on the implementation of
the loan agreements.
ODA PMU established under Decision 3966 / QD-Committee dated 12/29/2014 of People's
Committee of Can Tho City on the basis of subject professional model project is the city
committee tasked with the implementation of ODA projects in the city. Project Management Board
with support from the Steering Committee will be the liaison between donors, ministries - Central
Sector, local authorities and contractors to create a connected throughout the project
implementation.
Can Tho city Women’s union implement the tasks of propaganda, political education, ideological,
revolutionary ideals, virtues, lifestyle; guidelines and policies of the Party, the policies and laws of
the State; Advocating the elite women take the initiative and actively implement the guidelines and
the Party's guidelines and policies, the State law, to participate in building the Party, the State,
economic development - social and protection Country; advocacy, support women capacity
building, education, building a happy family; care for the improvement of material life, the spirit
of women;
Can Tho City Climate ChangeOffice was established under Decision No. 2746 / QD-Committee
dated 06/12/2010 as specialized agencies support the Steering Committee Decision 158/2008 /
QD-TTg December 2, 2008 by the Prime Minister on approving the National Target Programme to
Respond to Climate Change.
Ethnic Committee of Can Tho City was established by Decision No. 48/2010 / QD-Committee
dated 05.08.2010 of the MPC, the Committee for Ethnic Minorities specialized agencies across the
Department of City People's Committee has the function of advising and assisting MPC performs
the function of State management on ethnic affairs
Can Tho Association of People with Disabilitiesformerly known as Disability (PWD CLB) under
DOLISA Tho established on 01.05.2001. After 6 years of operation efficiency and create
opportunities for people with disabilities should be well integrated community of Can Tho City
People's Committee signed Decision No. 2594 / QD 14/11/2007 Committee disabilities move from
CAN THO URBAN DEVELOPMENT AND RESILIENCE ENHANCEMENT PROJECT
Social Assessment Report
Page 152
club Tho City. The objective is to raise awareness of people with disabilities and their families on
issues of disability; build the home for people with disabilities and encourage the Mekong Delta,
promote, and create conditions for people with disabilities participate in the labor market in order
to contribute to poverty reduction and improve the value PWD.
District Land Fund Development Centre: shall be responsible for making decisions on
compensation and resettlement regimes and policies in the city, handing over of site for the
construction contractor on progress. Coordinate with the PMU to carry out the resettlement and
site clearance to ensure construction progress and social safeguard policies of the WB.
Ward/Commune People’s Committees: Ward/Commune People’s Committees will
coordinate with the PMU to disclose information of the project to the local people, carry out the
compensation, site clearance activities; Coordinate with the Construction Contractors, PMU, and
Independent Monitoring Consultants during the monitoring of the Construction Contractors.
Ward/Commune People’s Committees will receive feedbacks from local people regarding their
disadvantageous issues caused by the project. Ward/Commune People’s Committees play
important role in several activities both during the preparation and implementation phases.
4.1.2. Roles of Associations and Mass Organizations
The organizations, associations, mass organizations and beneficiaries from the Project play
important roles during the implementation of the project.
Political – Social Organizations, like Fatherland Front, Women’s Union, Farmers’ Union,
the Youth Union, the Elderly’s Union with large force of membership and structure to each
population group. The social organizations are in charge of closely monitoring the project
implementation process, especially the period of land acquisition and resettlement compensation to
ensure conformity with safeguard policies of the WB and the Vietnam’s current regulations. The
organizations, unions and mass organizations understand issues and feedbacks from people
regarding activities of the project during the preparation, construction and putting the works into
operation. The coordination among the organizations and population groups in the monitoring
work plays an important role in supporting the PMU and Contractors promptly adjust the design,
construction activities in order to minimize the undesirable impacts on the lives of the people in
the affected area.
Population groups: Population groups are functioned to work directly with the local people
and reflect issues raised during the preparation, construction and operation of project work items.
Population groups will be final agencies to provide the project’s information to local people and
initial agencies to receive project-related feedbacks from local people. Population groups play an
important role in reflecting objectively and timely expectations and suggestions of local people
regarding the monitoring during the project implementation in order to minimize undesired
impacts on their lives. In addition, feedbacks from the population groups also help to develop the
project items more suitable and bring higher socio-economic efficiency to the community in
directly beneficiary area of the project.
Coordination among Stakeholders
During the project preparation and implementation, the participation of the stakeholders
plays a special significance. Firstly, the participation during the designing of work items will
contribute to adjusting design to meet technical requirements and increase socio-economic
efficiency, minimize undesired impacts caused by the construction on the lives of local people,
especially social and environmental issues during the construction and operation of the works. The
uneffective coordination among stakeholders will casue the waste of resources and delay the
project’s progress, cause adverse social and environmental impacts. During the project
implementation, the effective coordination among stakeholders will ensure progress of the project.
CAN THO URBAN DEVELOPMENT AND RESILIENCE ENHANCEMENT PROJECT
Social Assessment Report
Page 153
Through the analysis of two WB-funded projects under progress in the city (including
VUUP 1 and VUUP 2) and the preparation phase of the CTUDR project, it can be realize that the
coordination among stakeholder is quite good. Potential problems related to the stakeholder
coordination that may occur during the implementation of the Project are level of participation of
agencies in charge of management and operating the project items (roads, bridges and
embankment, etc.) during the detailed design and construction/installation. Namely, participate in
contributing opinions to design alternatives, construction supervision, building management model
and calculating operation unit price.
One of criteria for the success of the Project is to ensure that stakeholders will involve in all
phases of the project. This objective requires to develop the Participation Plan. Roles and
responsibilities for participation will be assigned for stakeholders as follow:
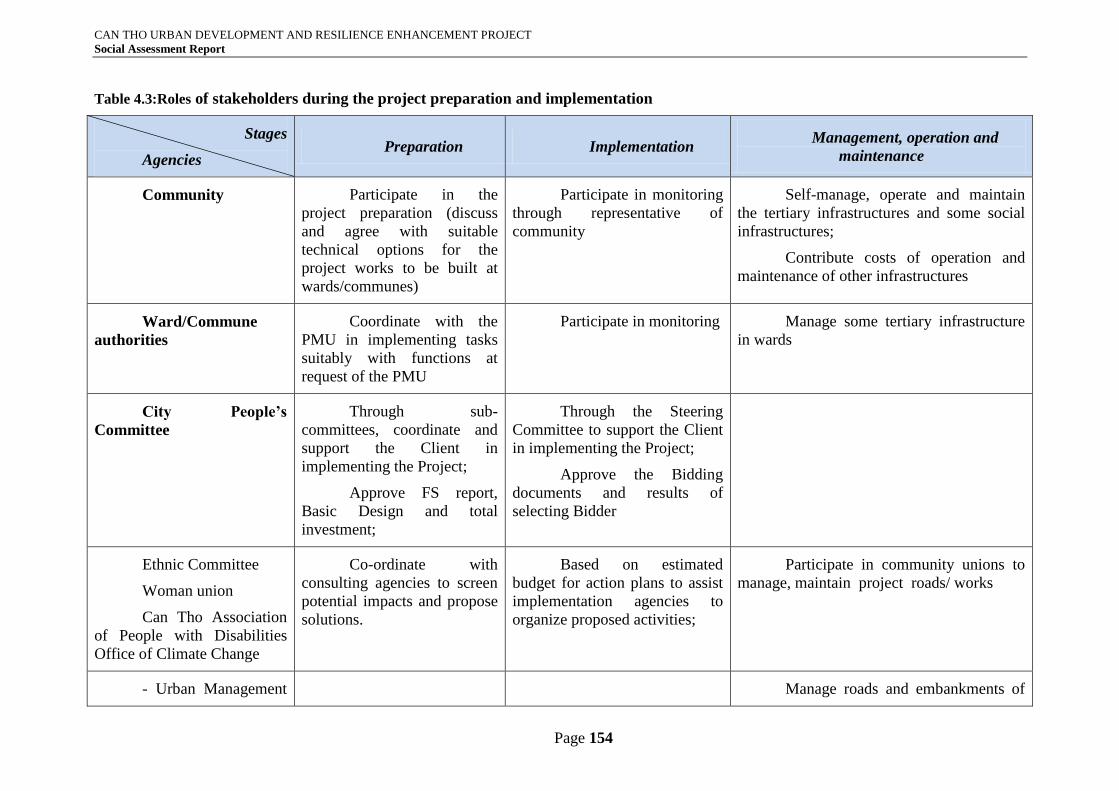
CAN THO URBAN DEVELOPMENT AND RESILIENCE ENHANCEMENT PROJECT
Social Assessment Report
Page 154
Table 4.3:Roles of stakeholders during the project preparation and implementation
Stages
Agencies Preparation Implementation
Management, operation and
maintenance
Community Participate in the
project preparation (discuss
and agree with suitable
technical options for the
project works to be built at
wards/communes)
Participate in monitoring
through representative of
community
Self-manage, operate and maintain
the tertiary infrastructures and some social
infrastructures;
Contribute costs of operation and
maintenance of other infrastructures
Ward/Commune
authorities
Coordinate with the
PMU in implementing tasks
suitably with functions at
request of the PMU
Participate in monitoring Manage some tertiary infrastructure
in wards
City People’s
Committee
Through sub-
committees, coordinate and
support the Client in
implementing the Project;
Approve FS report,
Basic Design and total
investment;
Through the Steering
Committee to support the Client
in implementing the Project;
Approve the Bidding
documents and results of
selecting Bidder
Ethnic Committee
Woman union
Can Tho Association
of People with Disabilities
Office of Climate Change
Co-ordinate with
consulting agencies to screen
potential impacts and propose
solutions.
Based on estimated
budget for action plans to assist
implementation agencies to
organize proposed activities;
Participate in community unions to
manage, maintain project roads/ works
- Urban Management Manage roads and embankments of
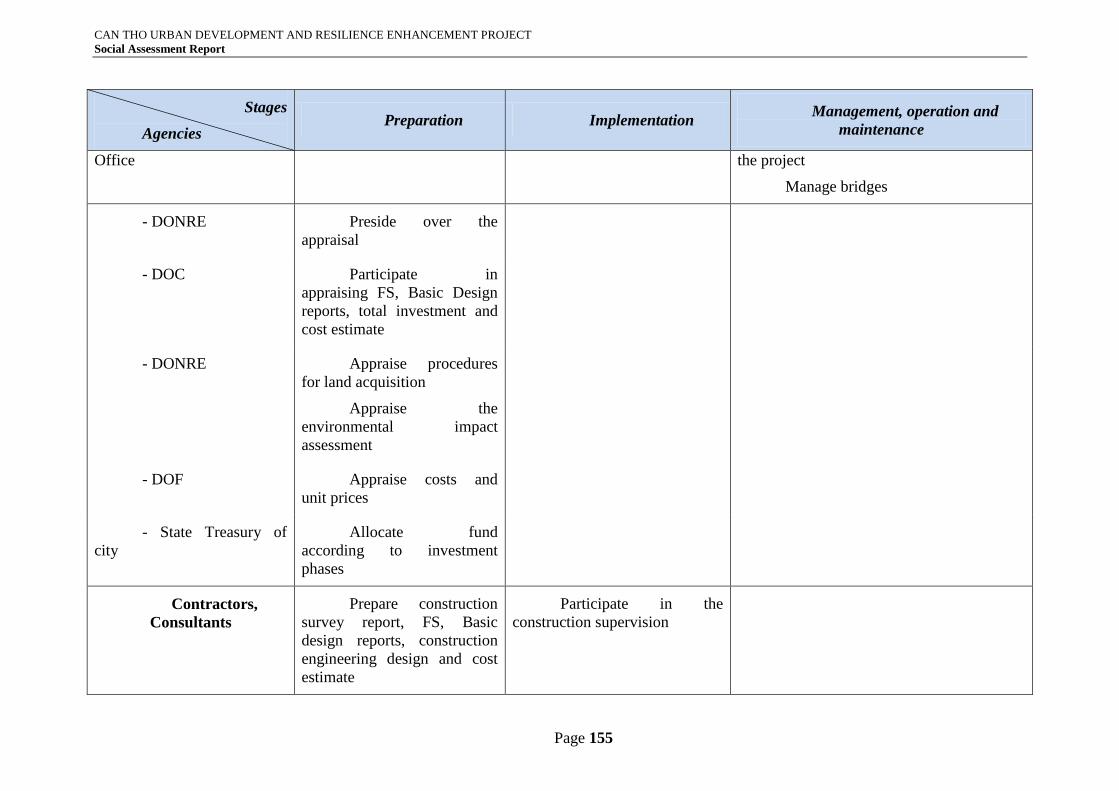
CAN THO URBAN DEVELOPMENT AND RESILIENCE ENHANCEMENT PROJECT
Social Assessment Report
Page 155
Stages
Agencies Preparation Implementation
Management, operation and
maintenance
Office the project
Manage bridges
- DONRE Preside over the
appraisal
- DOC Participate in
appraising FS, Basic Design
reports, total investment and
cost estimate
- DONRE Appraise procedures
for land acquisition
Appraise the
environmental impact
assessment
- DOF Appraise costs and
unit prices
- State Treasury of
city
Allocate fund
according to investment
phases
Contractors,
Consultants
Prepare construction
survey report, FS, Basic
design reports, construction
engineering design and cost
estimate
Participate in the
construction supervision
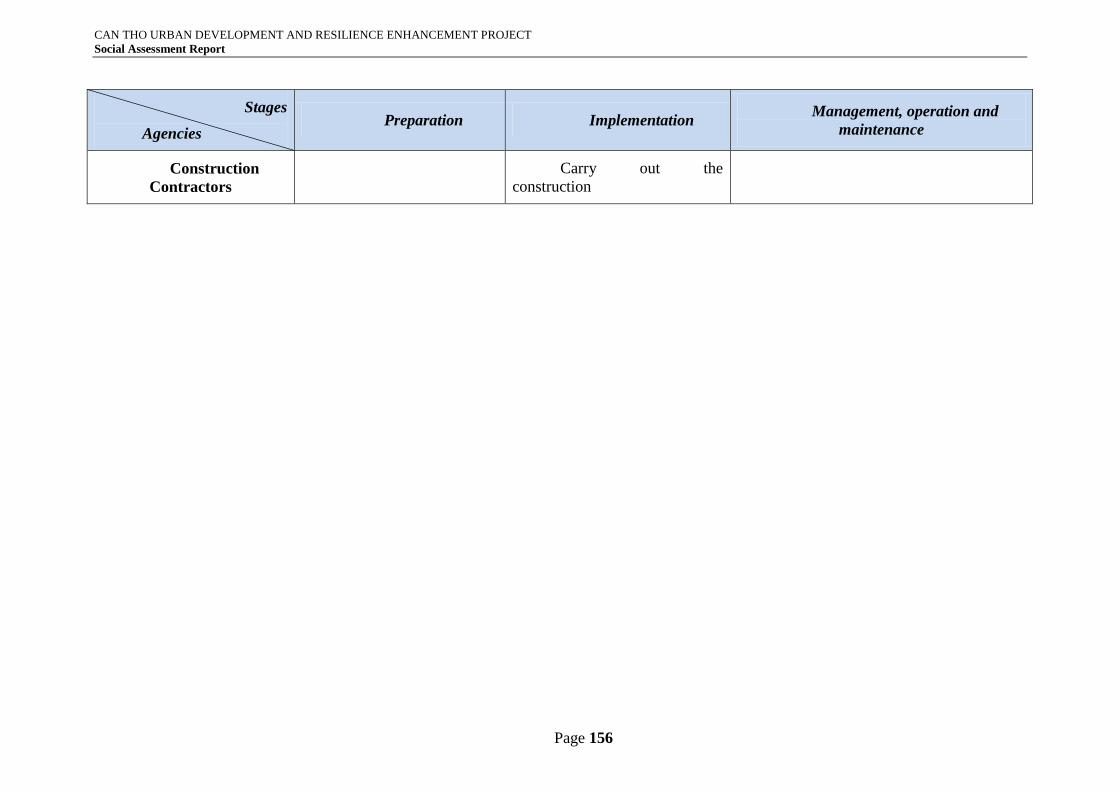
CAN THO URBAN DEVELOPMENT AND RESILIENCE ENHANCEMENT PROJECT
Social Assessment Report
Page 156
Stages
Agencies Preparation Implementation
Management, operation and
maintenance
Construction
Contractors
Carry out the
construction
CAN THO URBAN DEVELOPMENT AND RESILIENCE ENHANCEMENT PROJECT
Social Assessment Report
Page 157
4.1.3. Project preparation and implementation support human resources
The People’s Committee of Can Tho city established four sub-committees in charge of
supporting the preparation and implementation of the Project.
Heads of these Sub-Committees will be Director/ Deputy Director of the relevant Departments
while members of Sub-Committees are staff from the relevant Departments or the People’s
Committees of the project districts. The Sub-Committees are assigned tasks suitably with their
typical characteristics. Head of the PMU will be Chairman of CPC and take responsibility for
managing and directing the Sub-Committees to fulfill their tasks from the investment preparation
to project implementation in accordance with the Loan Agreement, as well as coordinating with
the relevant Ministries, Departments and Authorities in carrying out the preparation to ensure the
progress and quality of the project works.
The ODA-PMU of Can Tho city is functioned to support the Client in preparing the
project for submitting to the competent authorities for approval and implementing the project after
approval, organize the acceptance, final settlement and handing over of the project to the
management agencies in compliance with Investment Management and Construction Rules. The
PMU consists of 6 functional divisions with over a half of staff who are experienced in project
management, compensation, site clearance, design management, construction supervision from
two WB-funded projects – VUUP 1 and VUUP 2. The PMU shall be responsible for managing
the preparation of the project and continue undertaking the task of project management after the
Implementation Agreement is signed.
4.1.4. Stakeholder Communication, consultation and participation strategies
Stakeholder communication, consultation strategies
Main objectives of the communication strategy is ensure the affected communities,
households, local authorities, relevant agencies to be provided with information about the project,
consulting about selection of technical options, potential impacts on land, income and non-land
assets. Information disclosure plays an important role in promoting the progress of the project
during the implementation, preparation and operation of the project with the consensus of
communities, local authorities and relevant agencies. This will minimize possibility of conflicts
and risks, increase investment efficiency and social significance of the project.
The overall objective of the Communication Strategy at local level is to ensure that the
designs and implementation methods of the components are socio-economically affordable and
appropriate
The specific objectives of the Communication Strategy are:
To disseminate timely information on the subproject components specific to each city.
To establish two-way information sharing/dialogue mechanisms with stakeholders.
To raise public awareness on environmental protection through focusing upon
Wastewater management, solid waste management and “greening industry”.
To change behavior regarding gender equity.
However, during the implementation, there are still some risks and challenges of the
Communication Strategy, including:
Regarding: Local authorities:
Not enough attention paid to women, illiterate people and ethnic minorities.
Information and consultation meetings often exclude the poor.
CAN THO URBAN DEVELOPMENT AND RESILIENCE ENHANCEMENT PROJECT
Social Assessment Report
Page 158
Weak skills and capacity of local staff to conduct Communication Strategy activities.
Regarding: Community:
Women often face heightened cultural barriers, and the traditional gender relationships
and time constraints restrict their participation in consultations and decision-making
Vulnerable groups like the poorest people, the disabled and some ethnic minorities, have
no time or lack means to attend meetings or to access mass media.
Information-Awareness-Education (IAE) material: Lack of locally relevant IAE-material,
and few materials in main ethnic minorities’ languages
Mass media: Limited resources of provincial mass media (radio and TV) to produce
specific local programs.
Main groups of stakeholders have been identified as being involved in the Communication
Strategy:
Local government, i.e. the PMU that will have the overall responsibility for the
implementation of the Communication Strategy.
Civil society (Women’s Union, Youth’s Union, and Veterans’ Association): will be in
charge of information dissemination and awareness raising campaigns.
Beneficiaries from the subprojects and their outcomes, including indigenous people, poor
and vulnerable groups.
Local media that will develop and disseminate Information-Awareness-Education (IAE)
materials.
Private sector whose small and medium sized enterprises can benefit from business
opportunities linked to infrastructure improvement.
The messages must appeal to the target stakeholders and be simple to facilitate
understanding by people with low education levels. Messages will be tailored to the specificity of
the local communities, i.e. with reference to gender, poverty and ethnicity aspects. The language
used in communication activities should be Vietnamese or ethnic minority language (Khome etc.)
based on a language understanding assessment of the target groups. The majority of the
communities can understand Vietnamese proficiently. The materials will be pre-tested before their
broader use.
The one-way information messages will focus on the key project benefits, project
implementation phases and the impacts – both positive and negative – on the communities, and on
the expected participation of the communities.
The mechanisms to ensure information sharing and dialogue with the communities will be
developed through:
Elaborating a consultation method in accordance with the traditional culture of the
locality, and by taking the ADB gender, poverty and social safeguards measures into
account.
Designing consultation activities that maximize the participation of vulnerable peoples to
ensure that local concerns are addressed during implementation.
Providing a feedback mechanism to the affected communities ensuring their views are
incorporated into project preparation and implementation.
Identifying the channels of consultation that are preferred by the communities.
CAN THO URBAN DEVELOPMENT AND RESILIENCE ENHANCEMENT PROJECT
Social Assessment Report
Page 159
The Communication Strategy activities will be organized in cooperation with the
Ward/Commune People’s Committees. The responsibility for implementing the strategy will be
shared between several stakeholders:
The PMU will have the overall responsibility for updating and implementing the
Communication Strategy and will be in charge of the activities targeted at the private
sector.
The Women’s Union will support the dissemination of information and conduct awareness
raising activities on environmental sanitation practices, including cooperation with schools
to educate children, and on strengthening gender equality.
The local media will produce IAE materials: print materials, newspapers, radio and TV
programs, web, etc.
To fulfill the tasks, capacity building activities will be organized as follows:
PMU officers in charge of Communication: Training in communication skills.
Women’s Union: Training in communication skills of community women members.
Key Women’s Union members: training in gender equity through applying a Training of
Trainers approach (ToT).
These stakeholders will receive the support from the national and international
Institutional Specialists as well as from the national and international Social and Gender
Specialists.
Resources Required
The resources required for the implementation of the Communication Strategy refer to:
The cost of the Communication Strategy activities that will be covered by the Capacity
Building Program.
The Consultancy cost for the National and International Institutional Specialists, and for
the National and International Social and Gender Specialists.
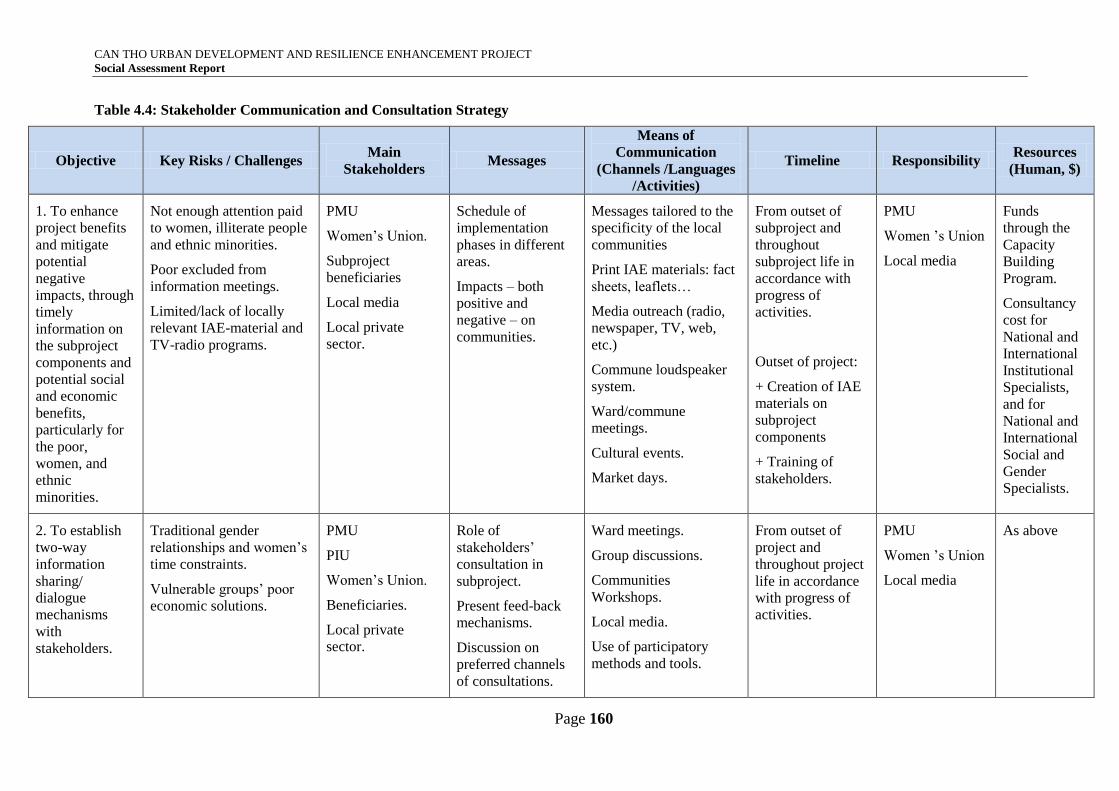
CAN THO URBAN DEVELOPMENT AND RESILIENCE ENHANCEMENT PROJECT
Social Assessment Report
Page 160
Table 4.4: Stakeholder Communication and Consultation Strategy
Objective Key Risks / Challenges Main
Stakeholders Messages
Means of
Communication
(Channels /Languages
/Activities)
Timeline Responsibility Resources
(Human, $)
1. To enhance
project benefits
and mitigate
potential
negative
impacts, through
timely
information on
the subproject
components and
potential social
and economic
benefits,
particularly for
the poor,
women, and
ethnic
minorities.
Not enough attention paid
to women, illiterate people
and ethnic minorities.
Poor excluded from
information meetings.
Limited/lack of locally
relevant IAE-material and
TV-radio programs.
PMU
Women’s Union.
Subproject
beneficiaries
Local media
Local private
sector.
Schedule of
implementation
phases in different
areas.
Impacts – both
positive and
negative – on
communities.
Messages tailored to the
specificity of the local
communities
Print IAE materials: fact
sheets, leaflets…
Media outreach (radio,
newspaper, TV, web,
etc.)
Commune loudspeaker
system.
Ward/commune
meetings.
Cultural events.
Market days.
From outset of
subproject and
throughout
subproject life in
accordance with
progress of
activities.
Outset of project:
+ Creation of IAE
materials on
subproject
components
+ Training of
stakeholders.
PMU
Women ’s Union
Local media
Funds
through the
Capacity
Building
Program.
Consultancy
cost for
National and
International
Institutional
Specialists,
and for
National and
International
Social and
Gender
Specialists.
2. To establish
two-way
information
sharing/
dialogue
mechanisms
with
stakeholders.
Traditional gender
relationships and women’s
time constraints.
Vulnerable groups’ poor
economic solutions.
PMU
PIU
Women’s Union.
Beneficiaries.
Local private
sector.
Role of
stakeholders’
consultation in
subproject.
Present feed-back
mechanisms.
Discussion on
preferred channels
of consultations.
Ward meetings.
Group discussions.
Communities
Workshops.
Local media.
Use of participatory
methods and tools.
From outset of
project and
throughout project
life in accordance
with progress of
activities.
PMU
Women ’s Union
Local media
As above
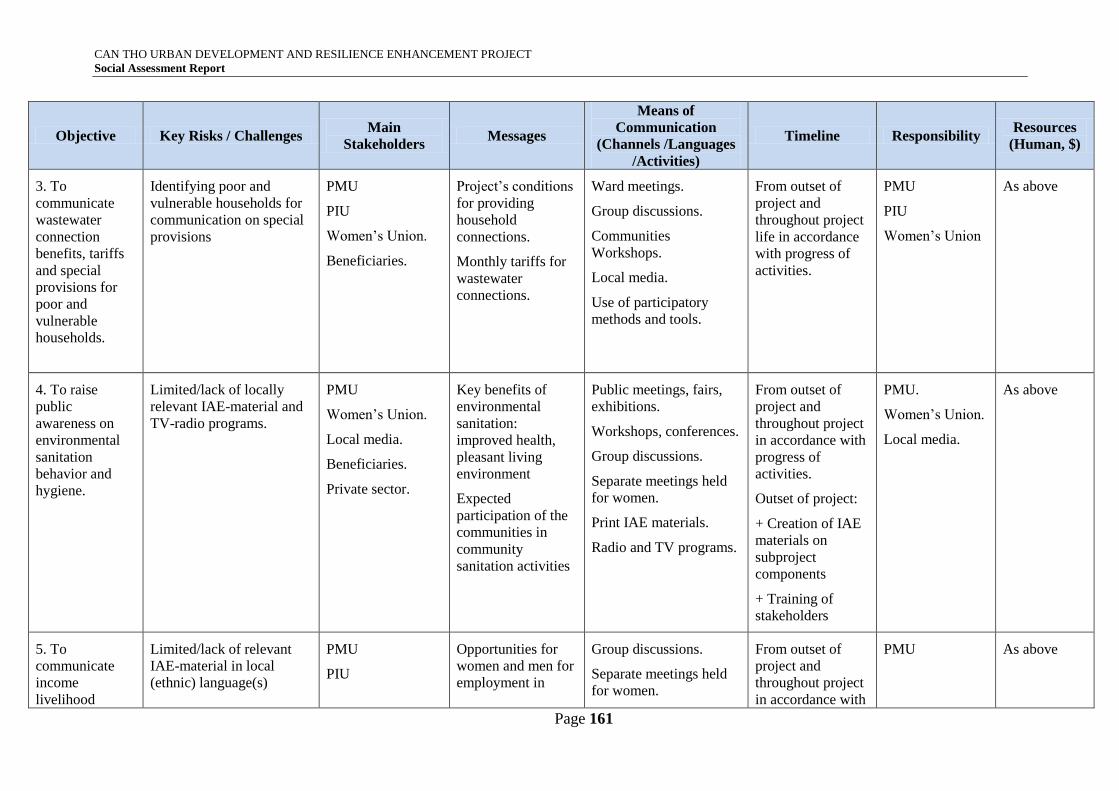
CAN THO URBAN DEVELOPMENT AND RESILIENCE ENHANCEMENT PROJECT
Social Assessment Report
Page 161
Objective Key Risks / Challenges Main
Stakeholders Messages
Means of
Communication
(Channels /Languages
/Activities)
Timeline Responsibility Resources
(Human, $)
3. To
communicate
wastewater
connection
benefits, tariffs
and special
provisions for
poor and
vulnerable
households.
Identifying poor and
vulnerable households for
communication on special
provisions
PMU
PIU
Women’s Union.
Beneficiaries.
Project’s conditions
for providing
household
connections.
Monthly tariffs for
wastewater
connections.
Ward meetings.
Group discussions.
Communities
Workshops.
Local media.
Use of participatory
methods and tools.
From outset of
project and
throughout project
life in accordance
with progress of
activities.
PMU
PIU
Women’s Union
As above
4. To raise
public
awareness on
environmental
sanitation
behavior and
hygiene.
Limited/lack of locally
relevant IAE-material and
TV-radio programs.
PMU
Women’s Union.
Local media.
Beneficiaries.
Private sector.
Key benefits of
environmental
sanitation:
improved health,
pleasant living
environment
Expected
participation of the
communities in
community
sanitation activities
Public meetings, fairs,
exhibitions.
Workshops, conferences.
Group discussions.
Separate meetings held
for women.
Print IAE materials.
Radio and TV programs.
From outset of
project and
throughout project
in accordance with
progress of
activities.
Outset of project:
+ Creation of IAE
materials on
subproject
components
+ Training of
stakeholders
PMU.
Women’s Union.
Local media.
As above
5. To
communicate
income
livelihood
Limited/lack of relevant
IAE-material in local
(ethnic) language(s)
PMU
PIU
Opportunities for
women and men for
employment in
Group discussions.
Separate meetings held
for women.
From outset of
project and
throughout project
in accordance with
PMU
As above
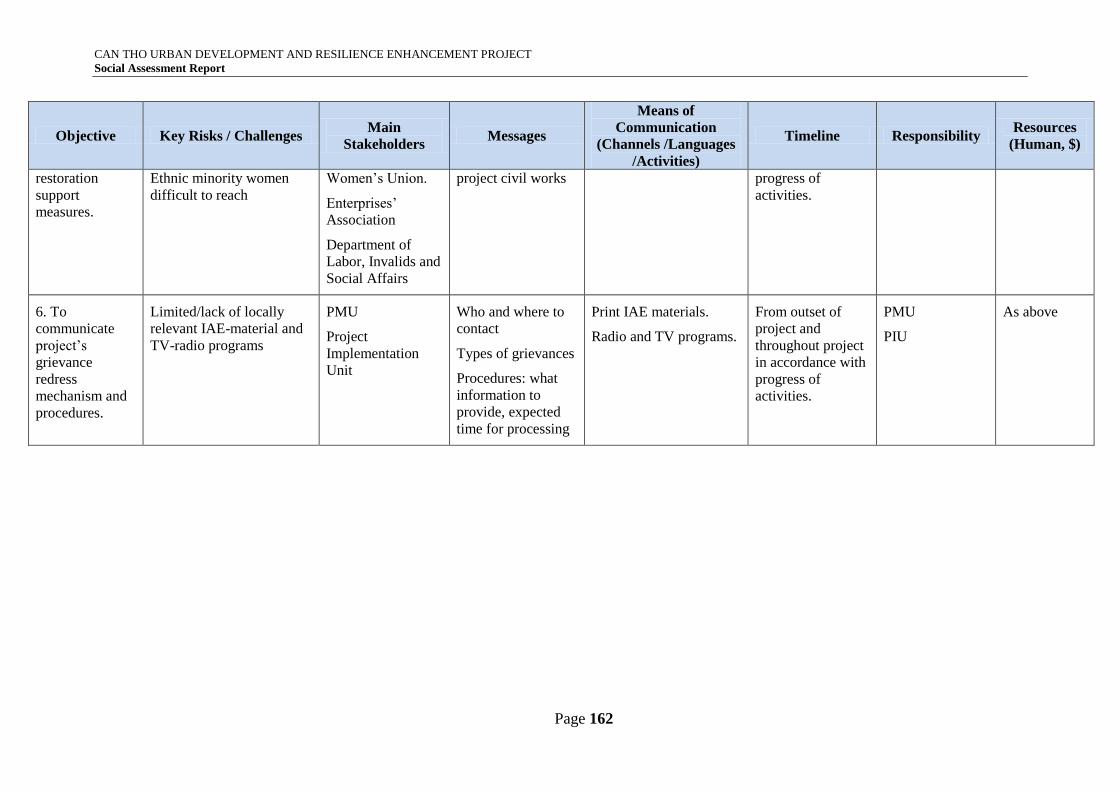
CAN THO URBAN DEVELOPMENT AND RESILIENCE ENHANCEMENT PROJECT
Social Assessment Report
Page 162
Objective Key Risks / Challenges Main
Stakeholders Messages
Means of
Communication
(Channels /Languages
/Activities)
Timeline Responsibility Resources
(Human, $)
restoration
support
measures.
Ethnic minority women
difficult to reach
Women’s Union.
Enterprises’
Association
Department of
Labor, Invalids and
Social Affairs
project civil works
progress of
activities.
6. To
communicate
project’s
grievance
redress
mechanism and
procedures.
Limited/lack of locally
relevant IAE-material and
TV-radio programs
PMU
Project
Implementation
Unit
Who and where to
contact
Types of grievances
Procedures: what
information to
provide, expected
time for processing
Print IAE materials.
Radio and TV programs.
From outset of
project and
throughout project
in accordance with
progress of
activities.
PMU
PIU
As above
CAN THO URBAN DEVELOPMENT AND RESILIENCE ENHANCEMENT PROJECT
Social Assessment Report
Page 163
4.2. Participation
In compliance with WB gender, poverty and social safeguard measures,
consultations with local residents are designed to maximize their participation and to ensure that
local concerns are addressed during each phase of the project. Particular attention is given to
women who are disadvantaged by poverty, and ethnic and female prejudices. Community
consultation and participation are done through information sharing, consultation meetings in the
form of group discussions, and interactive decision-making.
Issues to be addressed by participation include:
Assessment of current infrastructure problems in the cities (urban roads, existing drainage
systems and embankments);
General introduction of the project components with a focus on their potential social
benefits, particularly for the poor, women, and ethnic minorities and vulnerable groups;
Modalities of Indigenous Peoples’ and women’s participation in the construction,
monitoring and post-construction maintenance phases of the activities (including
introduction of grievance redress mechanism);
Presentation of the chosen construction designs and activities implementation
framework, including monitoring;
Monitoring of the community engagement in project’s implementation
Participation methods
Participation is ensured during each phase of the project through:
Weekly and ad hoc meetings of local government staff in their respective
departments.
Inter-departmental meetings
Visits to construction sites
Information-sharing between stakeholders
Timely information disclosure to communities, including women, disadvantaged and
vulnerable groups
Consultations meetings with civil society, beneficiaries and private sector
Incorporation of affected communities’ views into decision making
Education and awareness raising campaigns
Monitoring of subproject components
Dissemination of elaborated monthly report between local government stakeholders
The data collection methods with the beneficiaries are qualitative through group
discussions with key members of the communities, and gender segregated group discussions
with poor indigenous people at the project sites.
Timeline for participatory activities
To maximize local communities’ participation, consultations are organized at each
milestone of the project.
During the Assessment and Planning Stage, consultations are useful for the
identification of stakeholders’ perception of problems and their interests to participate in their
CAN THO URBAN DEVELOPMENT AND RESILIENCE ENHANCEMENT PROJECT
Social Assessment Report
Page 164
coping. This knowledge is also useful to formulate information messages that make sense from the
target audiences' point of view. The participation and awareness of local communities in
identifying vulnerability and adaptation options also contribute to the community acceptance of
subproject activities.
During the public consultations and focus group discussions carried out in June – August
2015 to provide qualitative information and elicit potential beneficiaries’ views and concerns
related to the various components of the project. As far as practically feasible the Public
Consultations were carried out jointly by the various consulting team. The following consultations
have been conducted as part of the consulting team.
During the Implementation Stage, a second round of communities’ consultations is
organized. These contribute to the participation of the local communities in the design of
infrastructure improvements and plan for community engagement at the component locations.
They aim to ensure that the choice of infrastructure options, and the planning, organization,
implementation and maintenance of works at the sites are accepted by the population.
19 public consultations at the project wards were carried out during the preparation of the
Social Assessment to further understand about needs of the community, suggestions and opinions
of the local authorities and people in the project area to the works proposed to be built at the
locality. Based on consultations with local authorities and residents in the area, the projects
generally consult and propose mitigation measures for each issue, as follows.
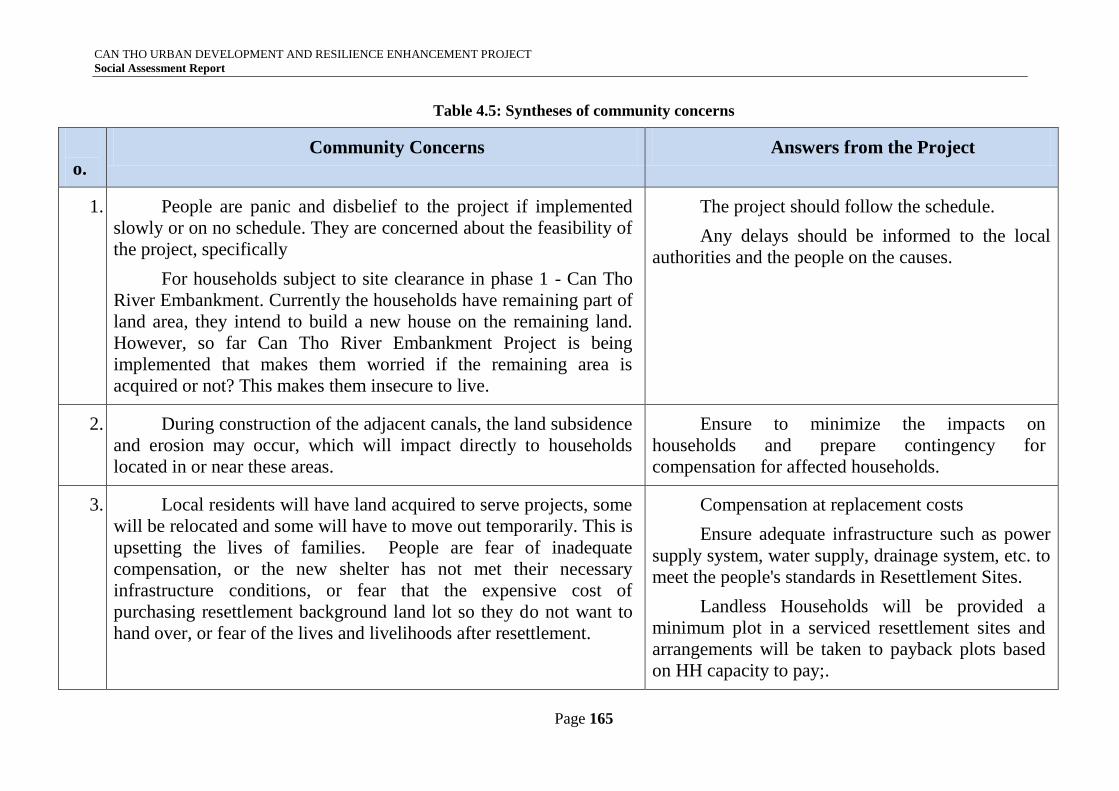
CAN THO URBAN DEVELOPMENT AND RESILIENCE ENHANCEMENT PROJECT
Social Assessment Report
Page 165
Table 4.5: Syntheses of community concerns
N
o.
Community Concerns Answers from the Project
1. People are panic and disbelief to the project if implemented
slowly or on no schedule. They are concerned about the feasibility of
the project, specifically
For households subject to site clearance in phase 1 - Can Tho
River Embankment. Currently the households have remaining part of
land area, they intend to build a new house on the remaining land.
However, so far Can Tho River Embankment Project is being
implemented that makes them worried if the remaining area is
acquired or not? This makes them insecure to live.
The project should follow the schedule.
Any delays should be informed to the local
authorities and the people on the causes.
2. During construction of the adjacent canals, the land subsidence
and erosion may occur, which will impact directly to households
located in or near these areas.
Ensure to minimize the impacts on
households and prepare contingency for
compensation for affected households.
3. Local residents will have land acquired to serve projects, some
will be relocated and some will have to move out temporarily. This is
upsetting the lives of families. People are fear of inadequate
compensation, or the new shelter has not met their necessary
infrastructure conditions, or fear that the expensive cost of
purchasing resettlement background land lot so they do not want to
hand over, or fear of the lives and livelihoods after resettlement.
Compensation at replacement costs
Ensure adequate infrastructure such as power
supply system, water supply, drainage system, etc. to
meet the people's standards in Resettlement Sites.
Landless Households will be provided a
minimum plot in a serviced resettlement sites and
arrangements will be taken to payback plots based
on HH capacity to pay;.
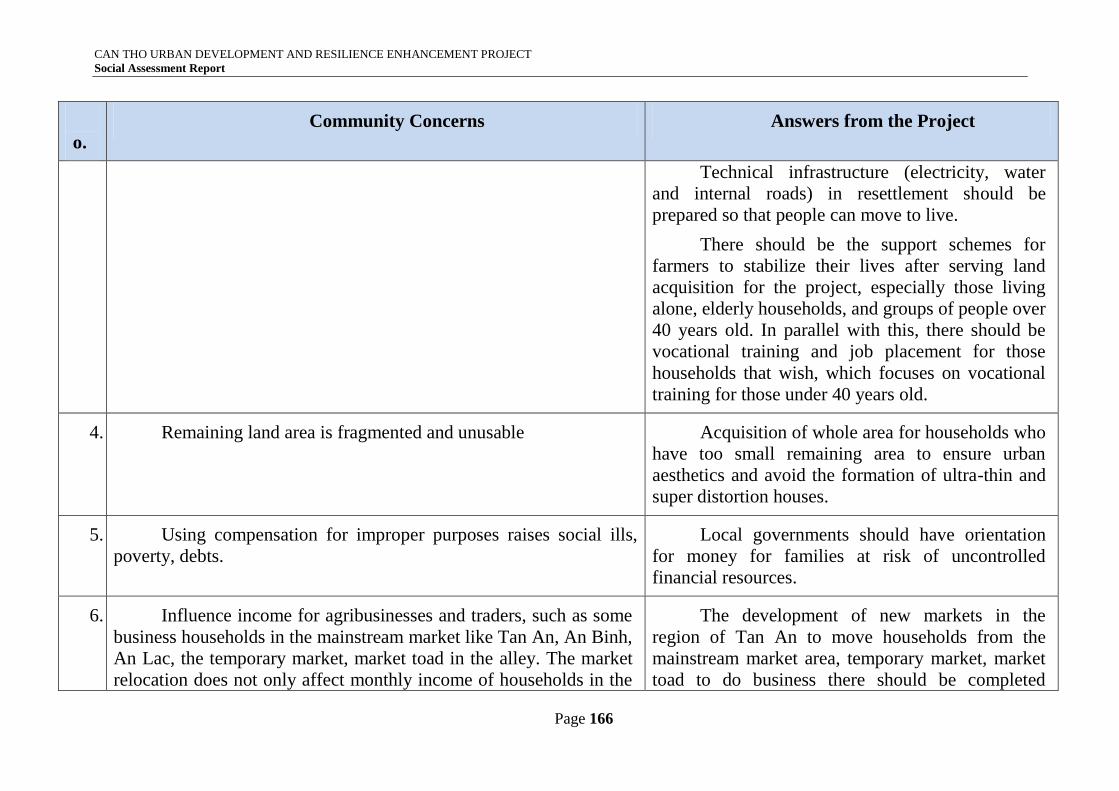
CAN THO URBAN DEVELOPMENT AND RESILIENCE ENHANCEMENT PROJECT
Social Assessment Report
Page 166
N
o.
Community Concerns Answers from the Project
Technical infrastructure (electricity, water
and internal roads) in resettlement should be
prepared so that people can move to live.
There should be the support schemes for
farmers to stabilize their lives after serving land
acquisition for the project, especially those living
alone, elderly households, and groups of people over
40 years old. In parallel with this, there should be
vocational training and job placement for those
households that wish, which focuses on vocational
training for those under 40 years old.
4. Remaining land area is fragmented and unusable Acquisition of whole area for households who
have too small remaining area to ensure urban
aesthetics and avoid the formation of ultra-thin and
super distortion houses.
5. Using compensation for improper purposes raises social ills,
poverty, debts.
Local governments should have orientation
for money for families at risk of uncontrolled
financial resources.
6. Influence income for agribusinesses and traders, such as some
business households in the mainstream market like Tan An, An Binh,
An Lac, the temporary market, market toad in the alley. The market
relocation does not only affect monthly income of households in the
The development of new markets in the
region of Tan An to move households from the
mainstream market area, temporary market, market
toad to do business there should be completed
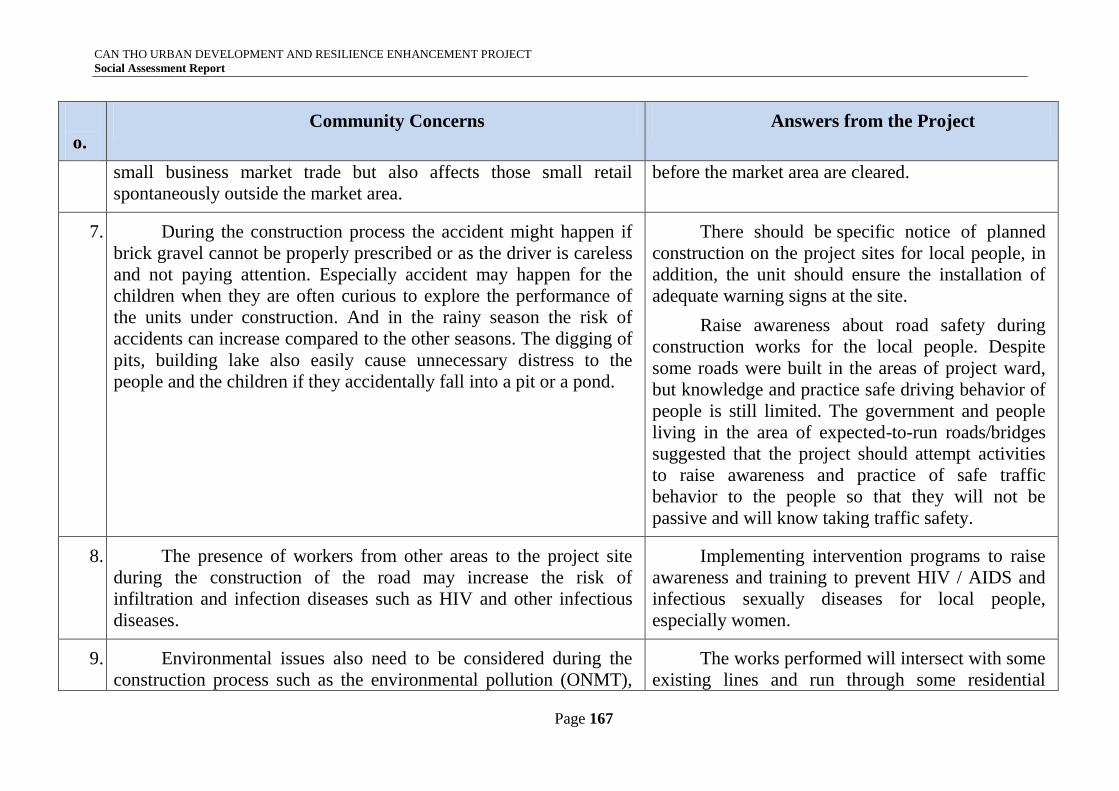
CAN THO URBAN DEVELOPMENT AND RESILIENCE ENHANCEMENT PROJECT
Social Assessment Report
Page 167
N
o.
Community Concerns Answers from the Project
small business market trade but also affects those small retail
spontaneously outside the market area.
before the market area are cleared.
7. During the construction process the accident might happen if
brick gravel cannot be properly prescribed or as the driver is careless
and not paying attention. Especially accident may happen for the
children when they are often curious to explore the performance of
the units under construction. And in the rainy season the risk of
accidents can increase compared to the other seasons. The digging of
pits, building lake also easily cause unnecessary distress to the
people and the children if they accidentally fall into a pit or a pond.
There should be specific notice of planned
construction on the project sites for local people, in
addition, the unit should ensure the installation of
adequate warning signs at the site.
Raise awareness about road safety during
construction works for the local people. Despite
some roads were built in the areas of project ward,
but knowledge and practice safe driving behavior of
people is still limited. The government and people
living in the area of expected-to-run roads/bridges
suggested that the project should attempt activities
to raise awareness and practice of safe traffic
behavior to the people so that they will not be
passive and will know taking traffic safety.
8. The presence of workers from other areas to the project site
during the construction of the road may increase the risk of
infiltration and infection diseases such as HIV and other infectious
diseases.
Implementing intervention programs to raise
awareness and training to prevent HIV / AIDS and
infectious sexually diseases for local people,
especially women.
9. Environmental issues also need to be considered during the
construction process such as the environmental pollution (ONMT),
The works performed will intersect with some
existing lines and run through some residential
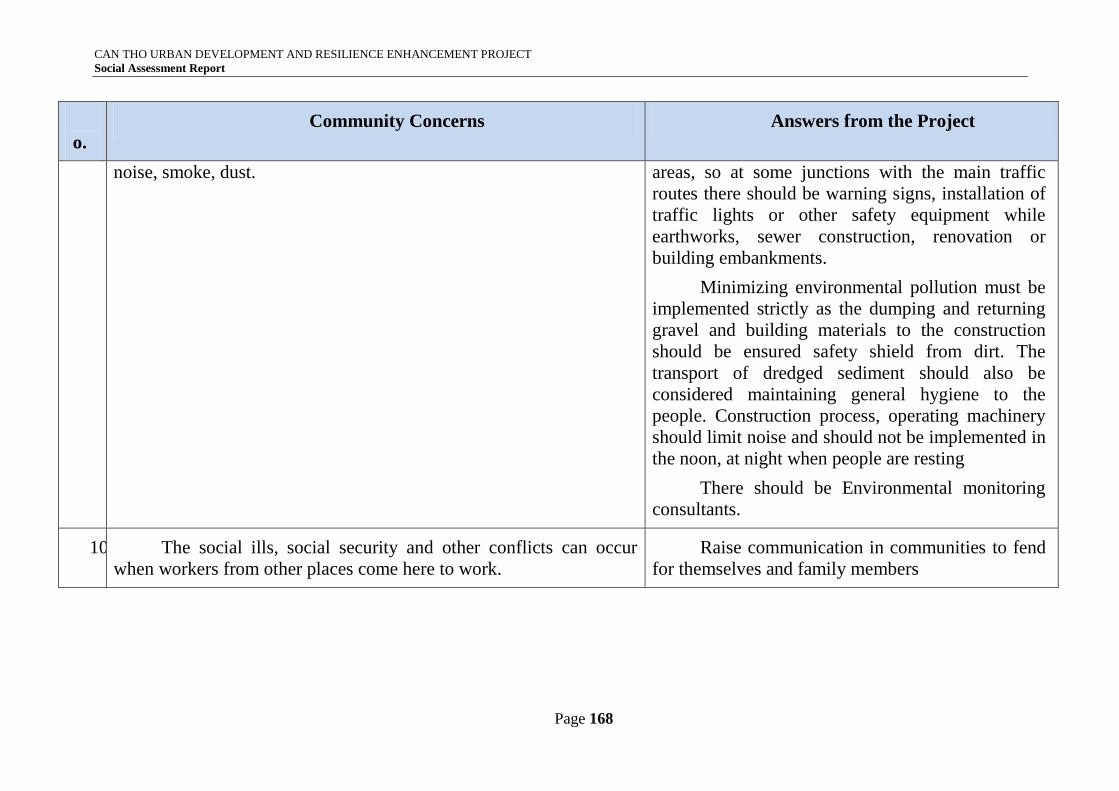
CAN THO URBAN DEVELOPMENT AND RESILIENCE ENHANCEMENT PROJECT
Social Assessment Report
Page 168
N
o.
Community Concerns Answers from the Project
noise, smoke, dust. areas, so at some junctions with the main traffic
routes there should be warning signs, installation of
traffic lights or other safety equipment while
earthworks, sewer construction, renovation or
building embankments.
Minimizing environmental pollution must be
implemented strictly as the dumping and returning
gravel and building materials to the construction
should be ensured safety shield from dirt. The
transport of dredged sediment should also be
considered maintaining general hygiene to the
people. Construction process, operating machinery
should limit noise and should not be implemented in
the noon, at night when people are resting
There should be Environmental monitoring
consultants.
10. The social ills, social security and other conflicts can occur
when workers from other places come here to work.
Raise communication in communities to fend
for themselves and family members
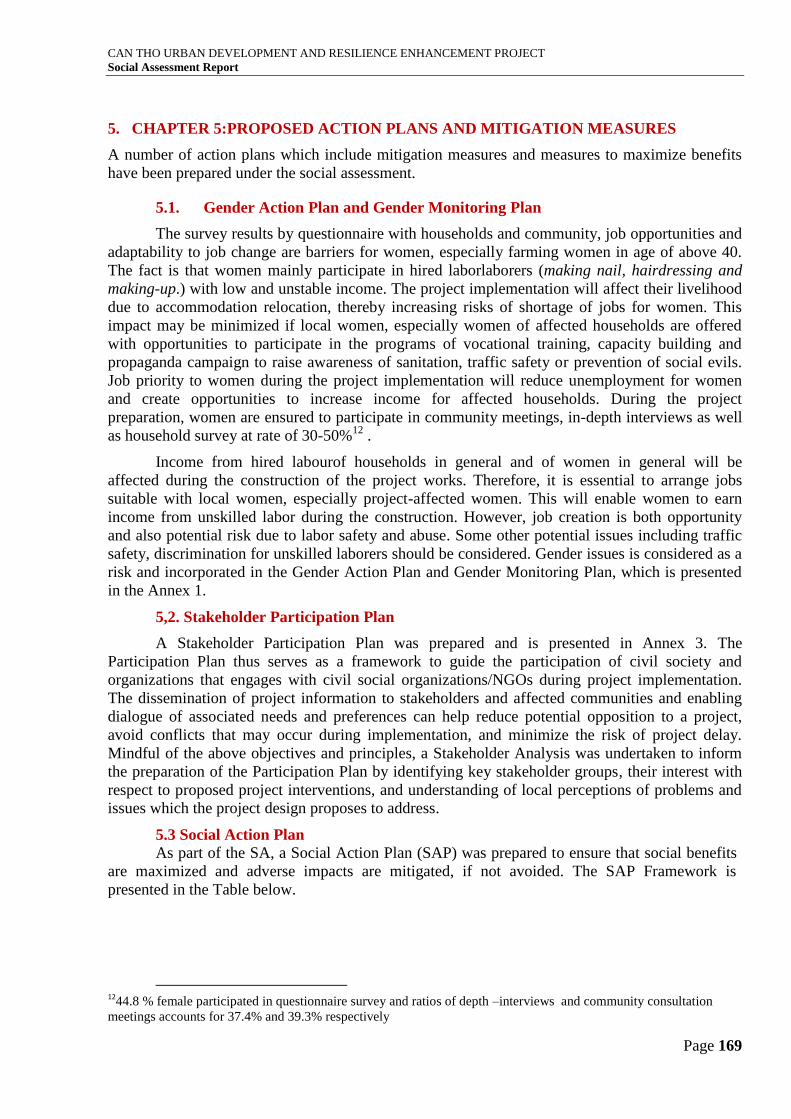
CAN THO URBAN DEVELOPMENT AND RESILIENCE ENHANCEMENT PROJECT
Social Assessment Report
Page 169
5. CHAPTER 5:PROPOSED ACTION PLANS AND MITIGATION MEASURES
A number of action plans which include mitigation measures and measures to maximize benefits
have been prepared under the social assessment.
5.1. Gender Action Plan and Gender Monitoring Plan
The survey results by questionnaire with households and community, job opportunities and
adaptability to job change are barriers for women, especially farming women in age of above 40.
The fact is that women mainly participate in hired laborlaborers (making nail, hairdressing and
making-up.) with low and unstable income. The project implementation will affect their livelihood
due to accommodation relocation, thereby increasing risks of shortage of jobs for women. This
impact may be minimized if local women, especially women of affected households are offered
with opportunities to participate in the programs of vocational training, capacity building and
propaganda campaign to raise awareness of sanitation, traffic safety or prevention of social evils.
Job priority to women during the project implementation will reduce unemployment for women
and create opportunities to increase income for affected households. During the project
preparation, women are ensured to participate in community meetings, in-depth interviews as well
as household survey at rate of 30-50%12
.
Income from hired labourof households in general and of women in general will be
affected during the construction of the project works. Therefore, it is essential to arrange jobs
suitable with local women, especially project-affected women. This will enable women to earn
income from unskilled labor during the construction. However, job creation is both opportunity
and also potential risk due to labor safety and abuse. Some other potential issues including traffic
safety, discrimination for unskilled laborers should be considered. Gender issues is considered as a
risk and incorporated in the Gender Action Plan and Gender Monitoring Plan, which is presented
in the Annex 1.
5,2. Stakeholder Participation Plan
A Stakeholder Participation Plan was prepared and is presented in Annex 3. The
Participation Plan thus serves as a framework to guide the participation of civil society and
organizations that engages with civil social organizations/NGOs during project implementation.
The dissemination of project information to stakeholders and affected communities and enabling
dialogue of associated needs and preferences can help reduce potential opposition to a project,
avoid conflicts that may occur during implementation, and minimize the risk of project delay.
Mindful of the above objectives and principles, a Stakeholder Analysis was undertaken to inform
the preparation of the Participation Plan by identifying key stakeholder groups, their interest with
respect to proposed project interventions, and understanding of local perceptions of problems and
issues which the project design proposes to address.
5.3 Social Action Plan
As part of the SA, a Social Action Plan (SAP) was prepared to ensure that social benefits
are maximized and adverse impacts are mitigated, if not avoided. The SAP Framework is
presented in the Table below.
12
44.8 % female participated in questionnaire survey and ratios of depth –interviews and community consultation
meetings accounts for 37.4% and 39.3% respectively
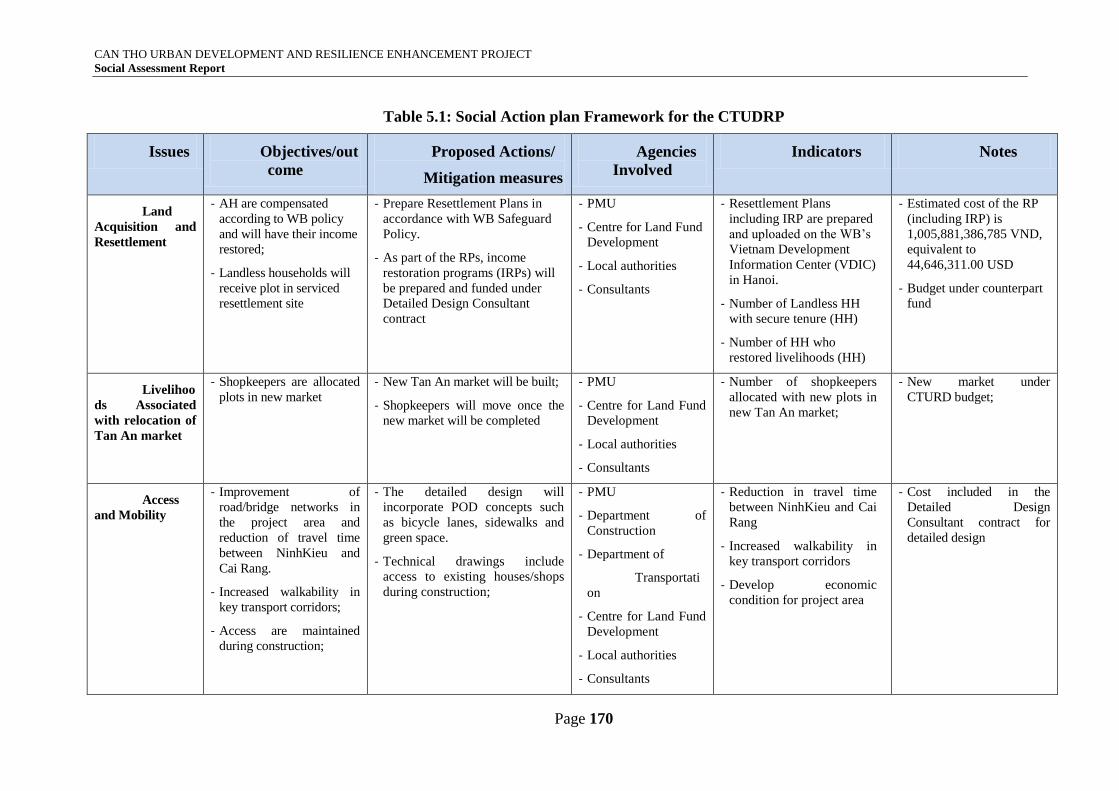
CAN THO URBAN DEVELOPMENT AND RESILIENCE ENHANCEMENT PROJECT
Social Assessment Report
Page 170
Table 5.1: Social Action plan Framework for the CTUDRP
Issues Objectives/out
come
Proposed Actions/
Mitigation measures
Agencies
Involved
Indicators Notes
Land
Acquisition and
Resettlement
- AH are compensated
according to WB policy
and will have their income
restored;
- Landless households will
receive plot in serviced
resettlement site
- Prepare Resettlement Plans in
accordance with WB Safeguard
Policy.
- As part of the RPs, income
restoration programs (IRPs) will
be prepared and funded under
Detailed Design Consultant
contract
- PMU
- Centre for Land Fund
Development
- Local authorities
- Consultants
- Resettlement Plans
including IRP are prepared
and uploaded on the WB’s
Vietnam Development
Information Center (VDIC)
in Hanoi.
- Number of Landless HH
with secure tenure (HH)
- Number of HH who
restored livelihoods (HH)
- Estimated cost of the RP
(including IRP) is
1,005,881,386,785 VND,
equivalent to
44,646,311.00 USD
- Budget under counterpart
fund
Livelihoo
ds Associated
with relocation of
Tan An market
- Shopkeepers are allocated
plots in new market
- New Tan An market will be built;
- Shopkeepers will move once the
new market will be completed
- PMU
- Centre for Land Fund
Development
- Local authorities
- Consultants
- Number of shopkeepers
allocated with new plots in
new Tan An market;
- New market under
CTURD budget;
Access
and Mobility
- Improvement of
road/bridge networks in
the project area and
reduction of travel time
between NinhKieu and
Cai Rang.
- Increased walkability in
key transport corridors;
- Access are maintained
during construction;
- The detailed design will
incorporate POD concepts such
as bicycle lanes, sidewalks and
green space.
- Technical drawings include
access to existing houses/shops
during construction;
- PMU
- Department of
Construction
- Department of
Transportati
on
- Centre for Land Fund
Development
- Local authorities
- Consultants
- Reduction in travel time
between NinhKieu and Cai
Rang
- Increased walkability in
key transport corridors
- Develop economic
condition for project area
- Cost included in the
Detailed Design
Consultant contract for
detailed design
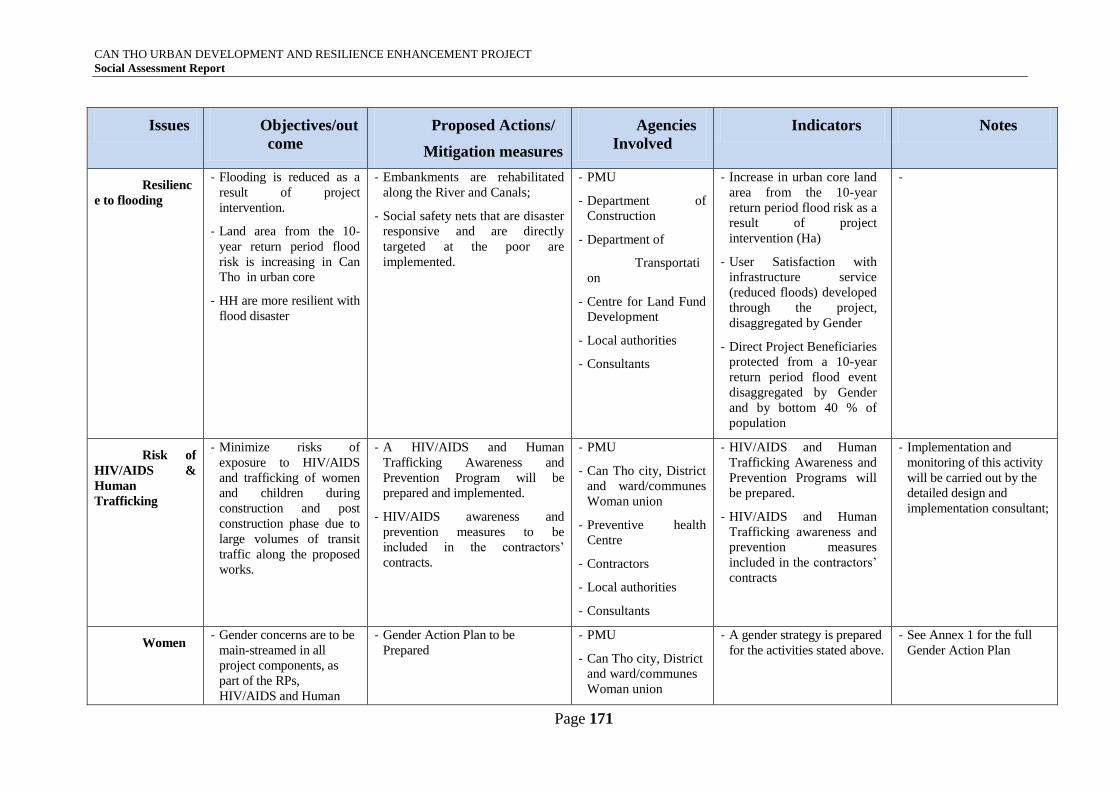
CAN THO URBAN DEVELOPMENT AND RESILIENCE ENHANCEMENT PROJECT
Social Assessment Report
Page 171
Issues Objectives/out
come
Proposed Actions/
Mitigation measures
Agencies
Involved
Indicators Notes
Resilienc
e to flooding
- Flooding is reduced as a
result of project
intervention.
- Land area from the 10-
year return period flood
risk is increasing in Can
Tho in urban core
- HH are more resilient with
flood disaster
- Embankments are rehabilitated
along the River and Canals;
- Social safety nets that are disaster
responsive and are directly
targeted at the poor are
implemented.
- PMU
- Department of
Construction
- Department of
Transportati
on
- Centre for Land Fund
Development
- Local authorities
- Consultants
- Increase in urban core land
area from the 10-year
return period flood risk as a
result of project
intervention (Ha)
- User Satisfaction with
infrastructure service
(reduced floods) developed
through the project,
disaggregated by Gender
- Direct Project Beneficiaries
protected from a 10-year
return period flood event
disaggregated by Gender
and by bottom 40 % of
population
-
Risk of
HIV/AIDS &
Human
Trafficking
- Minimize risks of
exposure to HIV/AIDS
and trafficking of women
and children during
construction and post
construction phase due to
large volumes of transit
traffic along the proposed
works.
- A HIV/AIDS and Human
Trafficking Awareness and
Prevention Program will be
prepared and implemented.
- HIV/AIDS awareness and
prevention measures to be
included in the contractors’
contracts.
- PMU
- Can Tho city, District
and ward/communes
Woman union
- Preventive health
Centre
- Contractors
- Local authorities
- Consultants
- HIV/AIDS and Human
Trafficking Awareness and
Prevention Programs will
be prepared.
- HIV/AIDS and Human
Trafficking awareness and
prevention measures
included in the contractors’
contracts
- Implementation and
monitoring of this activity
will be carried out by the
detailed design and
implementation consultant;
Women - Gender concerns are to be
main-streamed in all
project components, as
part of the RPs,
HIV/AIDS and Human
- Gender Action Plan to be
Prepared
- PMU
- Can Tho city, District
and ward/communes
Woman union
- A gender strategy is prepared
for the activities stated above.
- See Annex 1 for the full
Gender Action Plan
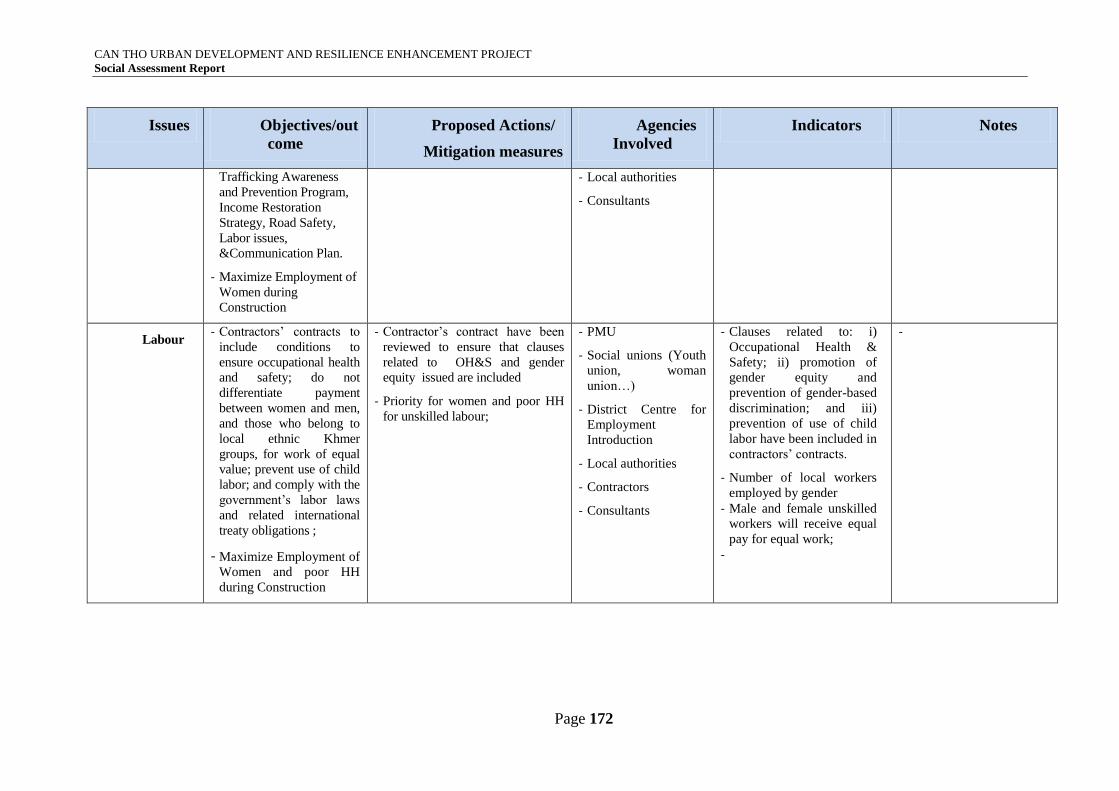
CAN THO URBAN DEVELOPMENT AND RESILIENCE ENHANCEMENT PROJECT
Social Assessment Report
Page 172
Issues Objectives/out
come
Proposed Actions/
Mitigation measures
Agencies
Involved
Indicators Notes
Trafficking Awareness
and Prevention Program,
Income Restoration
Strategy, Road Safety,
Labor issues,
&Communication Plan.
- Maximize Employment of
Women during
Construction
- Local authorities
- Consultants
Labour - Contractors’ contracts to
include conditions to
ensure occupational health
and safety; do not
differentiate payment
between women and men,
and those who belong to
local ethnic Khmer
groups, for work of equal
value; prevent use of child
labor; and comply with the
government’s labor laws
and related international
treaty obligations ;
- Maximize Employment of
Women and poor HH
during Construction
- Contractor’s contract have been
reviewed to ensure that clauses
related to OH&S and gender
equity issued are included
- Priority for women and poor HH
for unskilled labour;
- PMU
- Social unions (Youth
union, woman
union…)
- District Centre for
Employment
Introduction
- Local authorities
- Contractors
- Consultants
- Clauses related to: i)
Occupational Health &
Safety; ii) promotion of
gender equity and
prevention of gender-based
discrimination; and iii)
prevention of use of child
labor have been included in
contractors’ contracts.
- Number of local workers
employed by gender
- Male and female unskilled
workers will receive equal
pay for equal work;
-
-
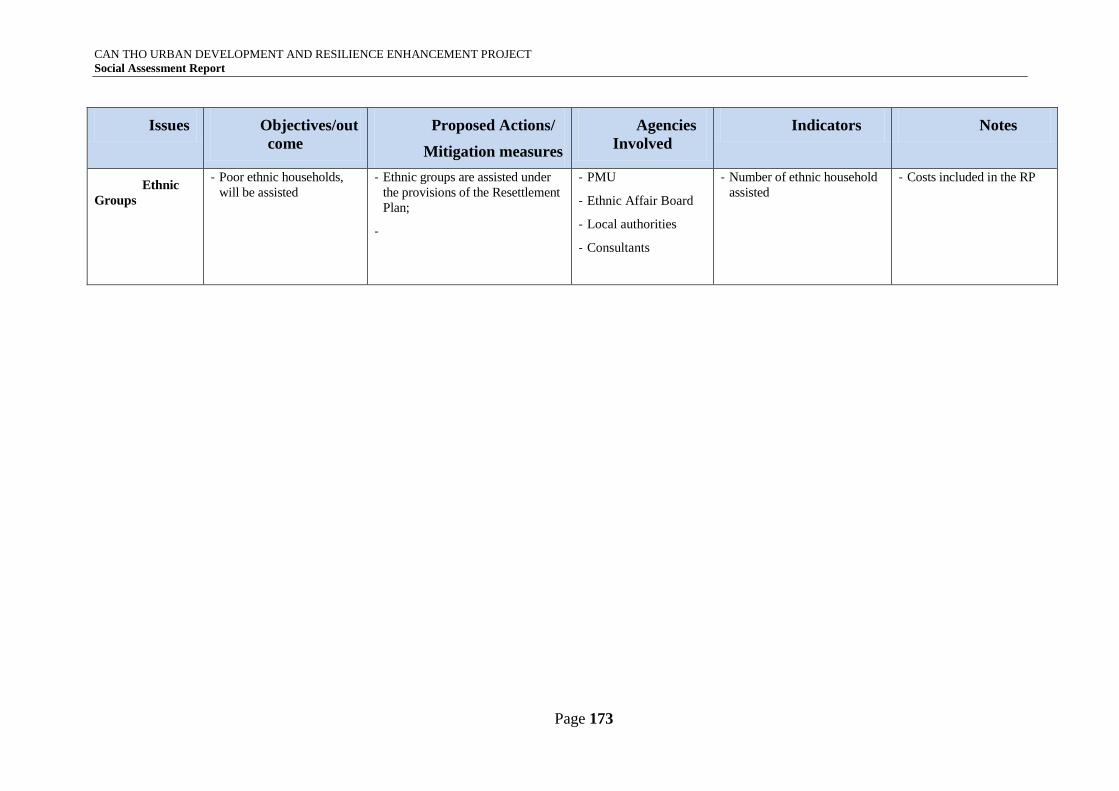
CAN THO URBAN DEVELOPMENT AND RESILIENCE ENHANCEMENT PROJECT
Social Assessment Report
Page 173
Issues Objectives/out
come
Proposed Actions/
Mitigation measures
Agencies
Involved
Indicators Notes
Ethnic
Groups
- Poor ethnic households,
will be assisted
- Ethnic groups are assisted under
the provisions of the Resettlement
Plan;
-
- PMU
- Ethnic Affair Board
- Local authorities
- Consultants
- Number of ethnic household
assisted
- Costs included in the RP
CAN THO URBAN DEVELOPMENT AND RESILIENCE ENHANCEMENT PROJECT
Social Assessment Report
Page 174
6. CHAPTER 6: INFORMATION UPDATING, MONITORING AND EVALUATION
6.1. Objectives of monitoring and assessment
Purposes of monitoring and evaluation are (i) to consider whether the project’s activities are
completed effectively or not, in terms of quantity, quality and timeline; (ii) to evaluate whether these
activities meet objectives and purposes of the project and level of achievement.
To ensure efficiency of the project, it is required to prepare the monitoring plan with the
participation of the relevant agencies such as DONRE, DOC, DPI, DOT. The agencies in charge of
directly managing and operating the project items should be involved in monitoring during the design
and construction of the works.
Together with the independent monitoring team of the project, it also requires a community-level
monitoring team to monitor the project’s activities, especially activities related to resettlement,
environmental sanitation and construction of work items. The monitoring team consists of
representatives of local authorities, unions such as Women’s Union, Fatherland Front, Veterans’
Union, Farmers’ Union and representatives of local people. The community-level monitoring team
will coordinate with the independent monitoring team and base on social safeguard indicators to
monitor the project’s activities. Indicators of life restoration, production, environmental sanitation,
transport, drainage will be established to serve the project’s monitoring plan. Through the reality
monitoring, the community-level monitoring team can reflect timely information about progress of the
project and issues arised during the project implementation to inform the PMU for promptly
addressing. The community-level monitoring team shall be responsible for collecting feedbacks of
local people for submitting to the competent authorities and PMU. Simultaneously, local people also
participate in the construction supervision, ensuring labor safety and environmental sanitation during
the construction.
The community-level monitoring team should be provided with a traning plan for strengthen capacity
of monitoring and evaluation for the project’s activities. Monitoring skills will be trained and
considered as a part of the participatory monitoring plan of the project.
It is noted to apply the Resolution No. 80/CP on community monitoring for the local
construction works.
6.2. Targets and indicators
Indicator for project impacts: Can Tho city will have increased economic activities, social
benefits and a fresher environment. As indicated in Table 4.1, the following indicators will be
measured;
Indicators
- Landless HH with secure tenure (HH)
- Number of HH who restored livelihoods (HH)
- Number of poor ethnic household assisted
- Number of shopkeepers from Tan An market allocated with new plots in new Tan An
market(nb);
- Reduction in travel time between NinhKieu and Cai Rang
- Increased walkability in key transport corridors
- Reduction of flooding incidence;
CAN THO URBAN DEVELOPMENT AND RESILIENCE ENHANCEMENT PROJECT
Social Assessment Report
Page 175
- Develop economic condition for project area
- Increase in urban core land area from the 10-year return period flood risk as a result of project
intervention (Ha)
- User Satisfaction with infrastructure service (reduced floods) developed through the project,
disaggregated by Gender
- Direct Project Beneficiaries protected from a 10-year return period flood event disaggregated
by Gender and by bottom 40 % of population
Data source
- PMU/Consultant internal monitoring reports;
- IMA monitoring reports;
- Socio-economic development reports and statistics of the districts, wards/communes of the
project.
- Reports and Statistics of Can Tho city
- Supplementary survey (e.g. urban development completion and traffic studies)
6.3. Monitoring responsibilities
Can Tho People’s Committee
Establish and operate the project monitoring and evaluation system at level of executing
agency, inspect the project at least once a year and arrange required human resources for the
monitoring and evulation.
Implement the reporting regime in accordance with the current regulations and guidelines of
the MPI.
Timely and fully reflect suggestions of the Project Owner in the project progress and
assessment result reports, coordinate with the Donor and relevant agencies to carry out ad-hoc
evaluation if necessary.
Organize to evaluate project impacts under its authority according to the annual impact
assessment plan of the MPI.
Share information through the monitoring and evaluation system of the project at level of
executing agency to ensure the transparency and participation of community.
Project Management Unit
Establish the internal information system, collect and store fully information, data, dossiers,
books and documents of the project, reports of the contractors, changes in Vietnam’s policies and laws
and Donor’s regulations on project management.
Prepare reports, provide and share information through the monitoring and evaluation system
at department, local and national level.
Support the Project Owner in the monitoring and evaluation of the Project.
To monitor the progress of the Project in achieving outcome and output, the PMU will
establish and maintain a management system of project’s activities with the required flexibility for
correcting consequences in designing, plan, activities and impacts of the Project. The management
system will use following indicators: (i) implementation progress of subprojects; (ii) outcome of the
capacity building program; (iii) household connection with drainage and supply systems; (iv) reduced
flooding risks; (v) social development and poverty.
CAN THO URBAN DEVELOPMENT AND RESILIENCE ENHANCEMENT PROJECT
Social Assessment Report
Page 176
In the early phase of the Project, the PMU will consult the City People’s Committee to develop
a completed project management process in order to provide information about outputs and inputs of
the Project, socio-economic situation and environmental indicators for environmental impact
assessment in systematic manner.
The PMU will complete the project management framework to determine whether objectives
can be achieved or not, consolidate the monitoring organization, recognize and establish systems and
procedures at least 6 months after implementing the Project.Baseline and progress of the Project will
be reported by the functional agencies to the PMU at required period, including the annual water
resource reports and environmental management plan. The PMUshall be responsible for analyzing and
summarizing report data through the information management systems and reporting achievements to
WB in the quarterly progress reports.
Stakeholders
The Government of Vietnam, through the Prime Minister, shall manage all Ministries and
Government agencies with the following functions and tasks:
The MPI is a line agency that supports the Prime Minister to collect opinions of the relevant
Ministries, Departments and local authorities, then submit to the Prime Minister for approving the
Project detailed outline, investment plan and annual disbursement plan.
The Ministry of Finance shall be responsible for issuing guidelines for the project financial
mechanism before the Loan Agreement is signed. The Ministry shall inspect, consider and agree in
written to allow withdrawing funds from donors for covering costs of project implementation at the
request of the Client. The MOF shall preside over, follow-up and approve the final settlement of
investment fund for balancing investment after the project is completed.
State Bank of Vietnam shall be on behalf of the Government negotiate and sign the Loan
Agreement and WB’s legal documents.
The Ministry of Construction with functions and tasks in sector management shall consider
technical issues of the project components and directly support the city with non-structural measures.
The MOC shall be responsible for appraising Basic Design and some other verifications of the project.
The Ministry of Agricuture and Rural Development, the Ministry of Transport and other
relevant ministries, departments with the functions and tasks in sector management to consider
technical issues of all project components and directly support the city with non-structural measures.
The Ministry of Natural Resources and Environment shall consider environmental issues.
CAN THO URBAN DEVELOPMENT AND RESILIENCE ENHANCEMENT PROJECT
Social Assessment Report
Page 177
7. CHAPTER 7: CONCLUSION
The Project will generate positive environmental, social and economic impacts
during theoperational phase. This includes: improved public health and living conditions in
the project area; reduction of flooding for households and commercial areas along the two
sides of the Can Tho; and increased efficiency ofproduction and consumption of goods due
to better market accessibilities.
The main negative social impacts related to the project includes: i) involuntary
resettlement; iii) loss of livelihoods; iii) impacts on vulnerable groups; iv) impacts on
safety and health.
These impacts will be mitigated through a number of plans and programs prepared
for the Project:
- Resettlement Plan;
- Income Restoration Program;
- Environmental and Social Management Plan
- Social Action Plan
- Gender Action Plan.
- Stakeholder Participation Plan
These plans also include measures to maximize benefits for the community.
The PMU will be in charge of the implementation of these plans and programs and
will provide a strong organization to manage the social safeguards component of the
Project.
.
CAN THO URBAN DEVELOPMENT AND RESILIENCE ENHANCEMENT PROJECT
Social Assessment Report
Page 178
CHAPTER 8. ANNEXES
Annex 1: Gender Action and Monitoring Plan
Annex 2: Stakeholder Participation Plan
Annex 3: Some picture at site
CAN THO URBAN DEVELOPMENT AND RESILIENCE ENHANCEMENT PROJECT
Social Assessment Report
Page 179
Annex 1: Gender Action and Monitoring Plan
A. Overall Objective and Strategy
The objective of the GAP is to promote women’s participation in the project and share in the
benefits, maximize positive gender equality impacts as well mitigate possible risks and negative
impacts. The GAP has a three pronged approach: (1) provide opportunities for and strengthen the
role of women in local economic activities; (2) disseminate information about urban environmental
sustainability and social risks to men and women; and (3) increase female representation in the
sector and in decision making positions. These strategies seek to address limited availability of
sustainable livelihoods and gender equality in livelihood opportunities, unequal impact from the
poor environmental sanitation due to female higher exposure and gender defined responsibilities,
risk of human trafficking and low female representation in government institutions and decision
making processes. The GAP includes gender sensitive design elements in urban infrastructure
provision; targets for female staff in PMU with training in key management areas; gender
sensitization training for all community leaders, government officers, and consultants involved in
project implementation and delivery; promotion and monitoring of women’s employment in all
available project positions; and community information campaigns to enhance awareness of
benefits from environmental sanitation improvements and dissemination of social risks of human
trafficking. The GAP will be complemented by targeted skills development, supported by market
and value chain studies, provided through the Capacity Development Plan to enhance local capture
of employment opportunities resulting from project investments. Collection and monitoring of sex-
disaggregated data with gender sensitive indicators will be established in the Project’s Performance
Monitoring and Information System (PPMIS).
B. Budget and Implementation Arrangements
The GAP budget is part of an integrated budget allocation for the implementation of social
development initiatives financed by the Government of Viet Nam, as part of their counterpart
funding commitment, under consultancy services and the incremental administration cost. The city
People’s Committee will act as the EA, which will work with the towns PMU/PIU to implement
and monitor the GAP with support from the national social development and gender specialist and
local gender focal. International and national community development specialists will assist through
the Capacity Building Program, financed from government counterpart funds. The PMU will
incorporate GAP monitoring in their quarterly progress reports, (using the WB’s GAP Progress
Report template) to Government and WB.
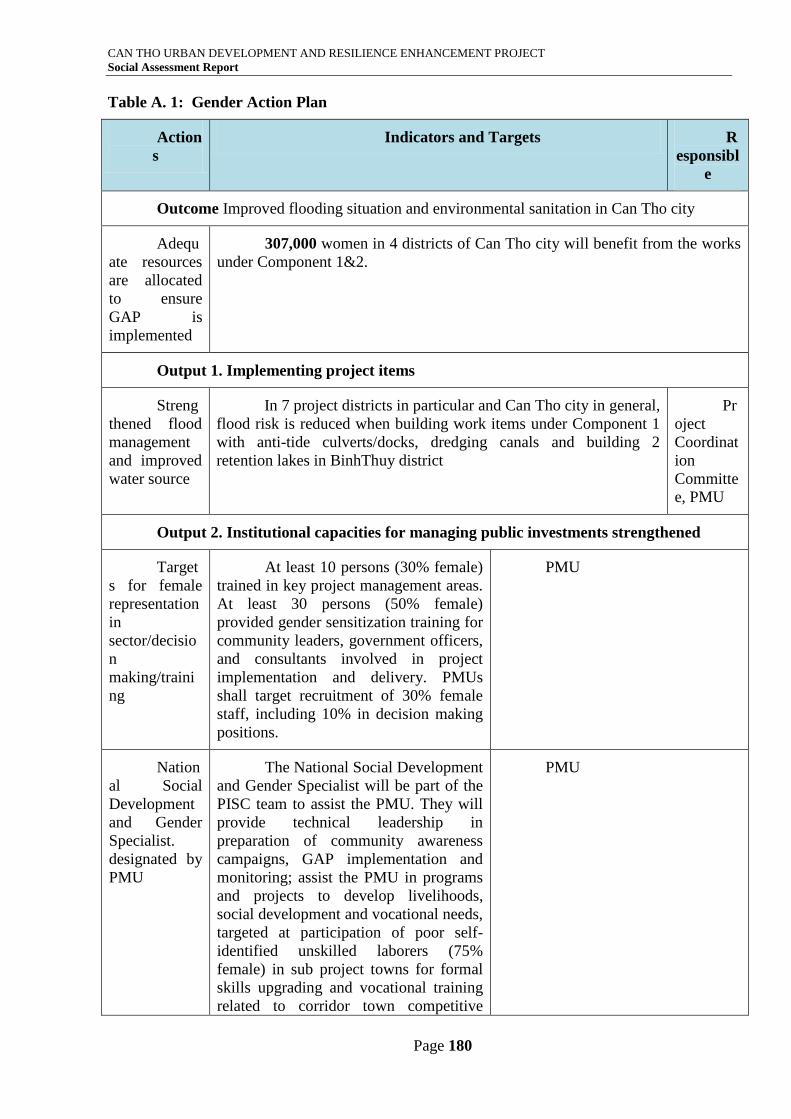
CAN THO URBAN DEVELOPMENT AND RESILIENCE ENHANCEMENT PROJECT
Social Assessment Report
Page 180
Table A. 1: Gender Action Plan
Action
s
Indicators and Targets R
esponsibl
e
Outcome Improved flooding situation and environmental sanitation in Can Tho city
Adequ
ate resources
are allocated
to ensure
GAP is
implemented
307,000 women in 4 districts of Can Tho city will benefit from the works
under Component 1&2.
Output 1. Implementing project items
Streng
thened flood
management
and improved
water source
In 7 project districts in particular and Can Tho city in general,
flood risk is reduced when building work items under Component 1
with anti-tide culverts/docks, dredging canals and building 2
retention lakes in BinhThuy district
Pr
oject
Coordinat
ion
Committe
e, PMU
Output 2. Institutional capacities for managing public investments strengthened
Target
s for female
representation
in
sector/decisio
n
making/traini
ng
At least 10 persons (30% female)
trained in key project management areas.
At least 30 persons (50% female)
provided gender sensitization training for
community leaders, government officers,
and consultants involved in project
implementation and delivery. PMUs
shall target recruitment of 30% female
staff, including 10% in decision making
positions.
PMU
Nation
al Social
Development
and Gender
Specialist.
designated by
PMU
The National Social Development
and Gender Specialist will be part of the
PISC team to assist the PMU. They will
provide technical leadership in
preparation of community awareness
campaigns, GAP implementation and
monitoring; assist the PMU in programs
and projects to develop livelihoods,
social development and vocational needs,
targeted at participation of poor self-
identified unskilled laborers (75%
female) in sub project towns for formal
skills upgrading and vocational training
related to corridor town competitive
PMU
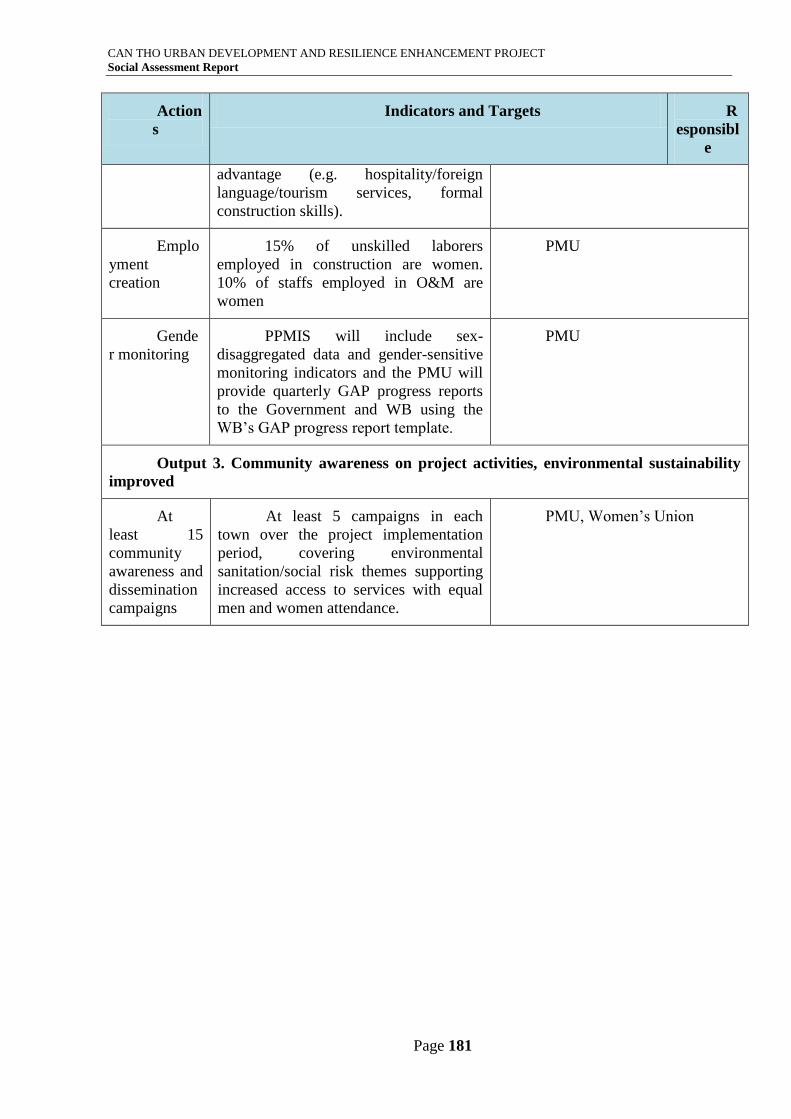
CAN THO URBAN DEVELOPMENT AND RESILIENCE ENHANCEMENT PROJECT
Social Assessment Report
Page 181
Action
s
Indicators and Targets R
esponsibl
e
advantage (e.g. hospitality/foreign
language/tourism services, formal
construction skills).
Emplo
yment
creation
15% of unskilled laborers
employed in construction are women.
10% of staffs employed in O&M are
women
PMU
Gende
r monitoring
PPMIS will include sex-
disaggregated data and gender-sensitive
monitoring indicators and the PMU will
provide quarterly GAP progress reports
to the Government and WB using the
WB’s GAP progress report template.
PMU
Output 3. Community awareness on project activities, environmental sustainability
improved
At
least 15
community
awareness and
dissemination
campaigns
At least 5 campaigns in each
town over the project implementation
period, covering environmental
sanitation/social risk themes supporting
increased access to services with equal
men and women attendance.
PMU, Women’s Union
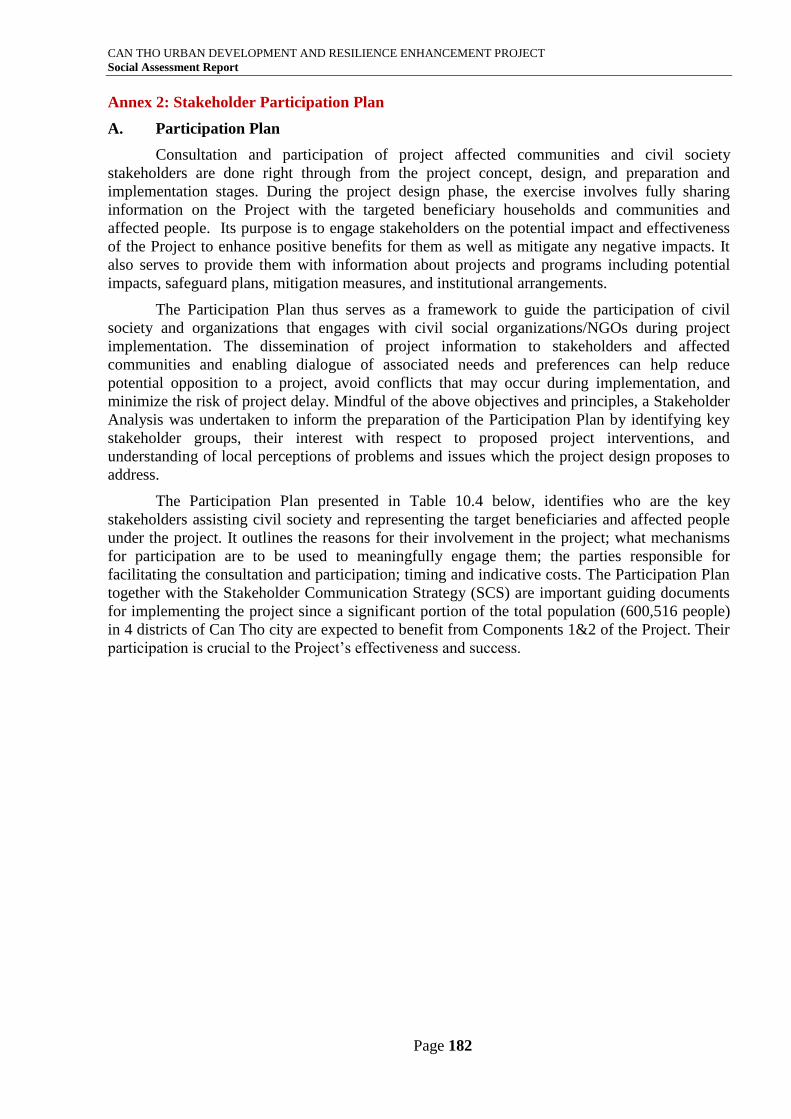
CAN THO URBAN DEVELOPMENT AND RESILIENCE ENHANCEMENT PROJECT
Social Assessment Report
Page 182
Annex 2: Stakeholder Participation Plan
A. Participation Plan
Consultation and participation of project affected communities and civil society
stakeholders are done right through from the project concept, design, and preparation and
implementation stages. During the project design phase, the exercise involves fully sharing
information on the Project with the targeted beneficiary households and communities and
affected people. Its purpose is to engage stakeholders on the potential impact and effectiveness
of the Project to enhance positive benefits for them as well as mitigate any negative impacts. It
also serves to provide them with information about projects and programs including potential
impacts, safeguard plans, mitigation measures, and institutional arrangements.
The Participation Plan thus serves as a framework to guide the participation of civil
society and organizations that engages with civil social organizations/NGOs during project
implementation. The dissemination of project information to stakeholders and affected
communities and enabling dialogue of associated needs and preferences can help reduce
potential opposition to a project, avoid conflicts that may occur during implementation, and
minimize the risk of project delay. Mindful of the above objectives and principles, a Stakeholder
Analysis was undertaken to inform the preparation of the Participation Plan by identifying key
stakeholder groups, their interest with respect to proposed project interventions, and
understanding of local perceptions of problems and issues which the project design proposes to
address.
The Participation Plan presented in Table 10.4 below, identifies who are the key
stakeholders assisting civil society and representing the target beneficiaries and affected people
under the project. It outlines the reasons for their involvement in the project; what mechanisms
for participation are to be used to meaningfully engage them; the parties responsible for
facilitating the consultation and participation; timing and indicative costs. The Participation Plan
together with the Stakeholder Communication Strategy (SCS) are important guiding documents
for implementing the project since a significant portion of the total population (600,516 people)
in 4 districts of Can Tho city are expected to benefit from Components 1&2 of the Project. Their
participation is crucial to the Project’s effectiveness and success.
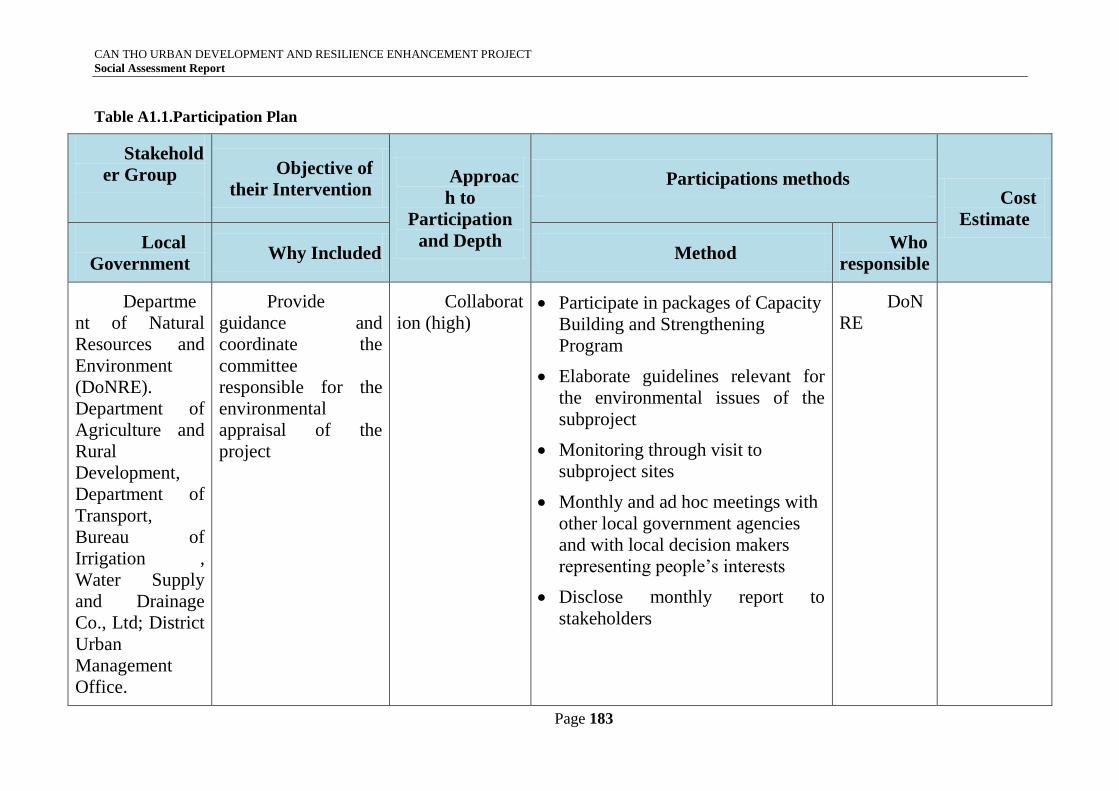
CAN THO URBAN DEVELOPMENT AND RESILIENCE ENHANCEMENT PROJECT
Social Assessment Report
Page 183
Table A1.1.Participation Plan
Stakehold
er Group
Objective of
their Intervention Approac
h to
Participation
and Depth
Participations methods Cost
Estimate
Local
Government Why Included Method
Who
responsible
Departme
nt of Natural
Resources and
Environment
(DoNRE).
Department of
Agriculture and
Rural
Development,
Department of
Transport,
Bureau of
Irrigation ,
Water Supply
and Drainage
Co., Ltd; District
Urban
Management
Office.
Provide
guidance and
coordinate the
committee
responsible for the
environmental
appraisal of the
project
Collaborat
ion (high) Participate in packages of Capacity
Building and Strengthening
Program
Elaborate guidelines relevant for
the environmental issues of the
subproject
Monitoring through visit to
subproject sites
Monthly and ad hoc meetings with
other local government agencies
and with local decision makers
representing people’s interests
Disclose monthly report to
stakeholders
DoN
RE
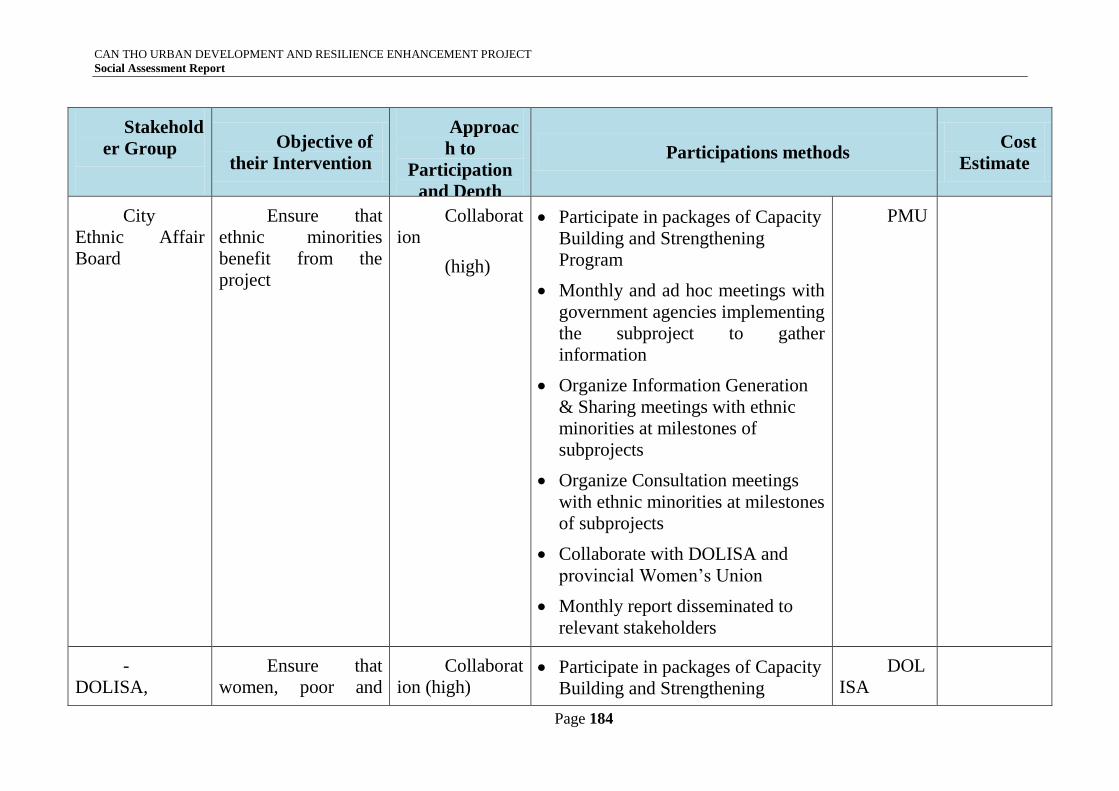
CAN THO URBAN DEVELOPMENT AND RESILIENCE ENHANCEMENT PROJECT
Social Assessment Report
Page 184
Stakehold
er Group
Objective of
their Intervention
Approac
h to
Participation
and Depth
Participations methods Cost
Estimate
City
Ethnic Affair
Board
Ensure that
ethnic minorities
benefit from the
project
Collaborat
ion
(high)
Participate in packages of Capacity
Building and Strengthening
Program
Monthly and ad hoc meetings with
government agencies implementing
the subproject to gather
information
Organize Information Generation
& Sharing meetings with ethnic
minorities at milestones of
subprojects
Organize Consultation meetings
with ethnic minorities at milestones
of subprojects
Collaborate with DOLISA and
provincial Women’s Union
Monthly report disseminated to
relevant stakeholders
PMU
-
DOLISA,
Ensure that
women, poor and
Collaborat
ion (high) Participate in packages of Capacity
Building and Strengthening
DOL
ISA
CAN THO URBAN DEVELOPMENT AND RESILIENCE ENHANCEMENT PROJECT
Social Assessment Report
Page 185
Stakehold
er Group
Objective of
their Intervention
Approac
h to
Participation
and Depth
Participations methods Cost
Estimate
vulnerable people
benefit from the
project
Program
Monthly and ad hoc meetings with
government agencies implementing
the project to gather information
Organize Consultation meetings
with women, ethnic minority
people at milestones of project
Collaborate with city Women’s
Union
Monthly report disseminated to
relevant stakeholders
Women’s
Union (WU)
Expertise in
Empowerment of
Women
Large outreach
and presence in
communities
Collaborat
ion (high) Participate in packages of Capacity
Building and Strengthening
Program
Organize Information Generation
& Sharing meetings with women at
milestones of the project
Organize Consultation meetings
with women at milestones of the
project
Wom
en’s Union
Costs
included in
Capacity
Development
budget
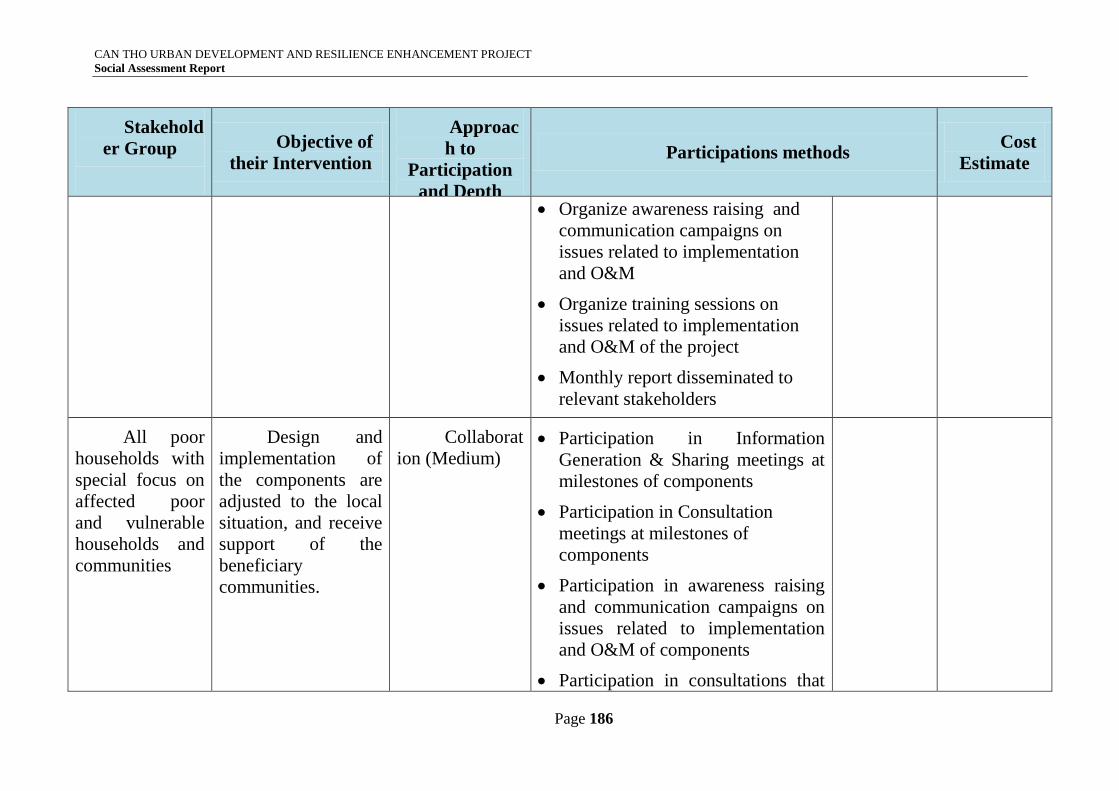
CAN THO URBAN DEVELOPMENT AND RESILIENCE ENHANCEMENT PROJECT
Social Assessment Report
Page 186
Stakehold
er Group
Objective of
their Intervention
Approac
h to
Participation
and Depth
Participations methods Cost
Estimate
Organize awareness raising and
communication campaigns on
issues related to implementation
and O&M
Organize training sessions on
issues related to implementation
and O&M of the project
Monthly report disseminated to
relevant stakeholders
All poor
households with
special focus on
affected poor
and vulnerable
households and
communities
Design and
implementation of
the components are
adjusted to the local
situation, and receive
support of the
beneficiary
communities.
Collaborat
ion (Medium) Participation in Information
Generation & Sharing meetings at
milestones of components
Participation in Consultation
meetings at milestones of
components
Participation in awareness raising
and communication campaigns on
issues related to implementation
and O&M of components
Participation in consultations that
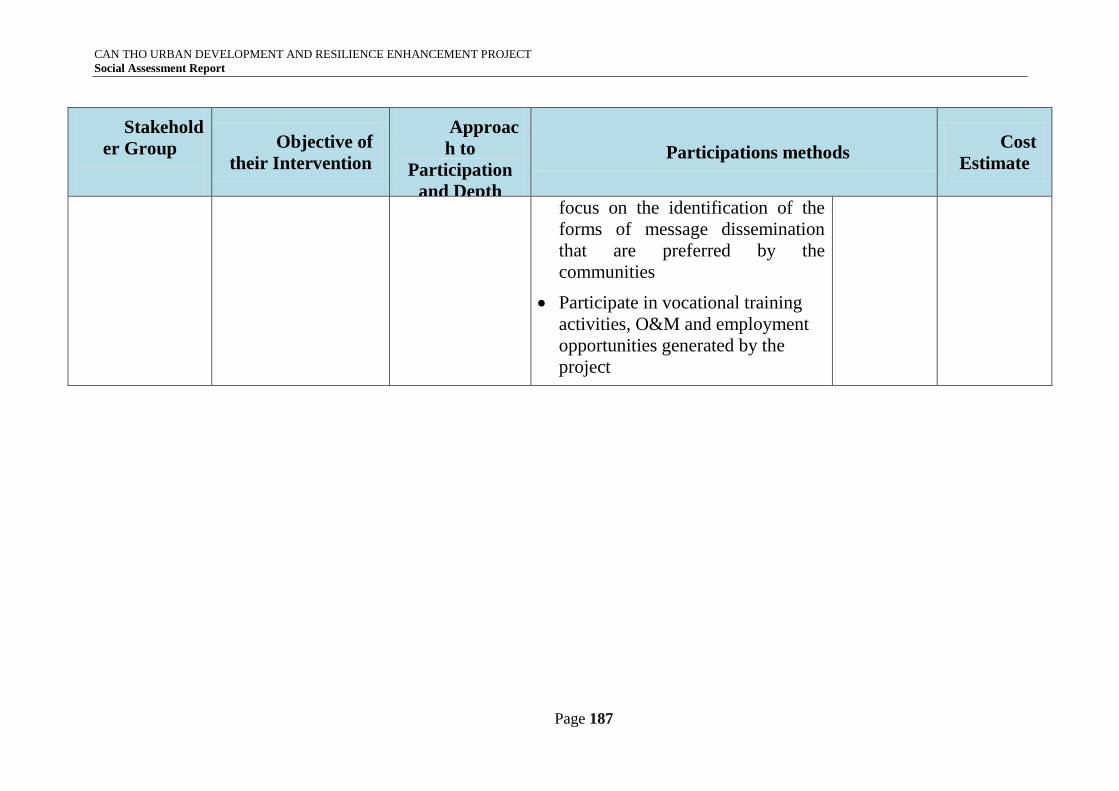
CAN THO URBAN DEVELOPMENT AND RESILIENCE ENHANCEMENT PROJECT
Social Assessment Report
Page 187
Stakehold
er Group
Objective of
their Intervention
Approac
h to
Participation
and Depth
Participations methods Cost
Estimate
focus on the identification of the
forms of message dissemination
that are preferred by the
communities
Participate in vocational training
activities, O&M and employment
opportunities generated by the
project
Environmental and social impact assessment – CTUDR
IAC Vietnam and Sinh Thai CICE Page | 188
B. Stakeholder Communication Strategy (SCS)
The preparation and adoption of a stakeholder communication strategy is to ensure
inclusiveness, transparency, timeliness and the meaningful participation of stakeholders in the
project. The SCS promotes select messages targeted at key stakeholders consistent with
established communication objectives as to what perspectives; actions and changes should be
promoted to ensure the project’s success.
Key stakeholders, who are essential to engage to achieve project objectives and lessen
project specific risks and challenges, have been identified. Stakeholders include (i) government
agencies responsible for the design, management, and implementation of the project (CPC, PMU,
DPI, Ethnic Affair Board, WU); (ii) Department of Transport, Department of Agriculture and
Rural Development, DONRE, Can Tho Water Supply and Drainage Co., Ltd., Bureau of
Irrigation and District urban management office; (iii) residents in wards and communes; and (iv)
local media. The strategy serves to inform and support community development, enhance
government agency capacity to manage project outcome, and enhance project benefits and
mitigate negative impacts
Objectives of SCS
To enhance project benefits and mitigate potential negative impacts, through timely
information on the subproject components and potential social and economic benefits,
particularly for the poor, women, and ethnic minorities;
To establish two-way information sharing/dialogue mechanisms with stakeholders;
To communicate wastewater connection benefits, tariffs and special provisions for poor
and vulnerable households;
To raise public awareness on environmental sanitation behavior and hygiene.
To communicate IR livelihood support measures;
To communicate project’s grievance redress mechanism and procedures;
To promote gender equity generally and with a particular focus upon women
empowerment, women’s access to economic opportunities;
C. Responsibilities and Resources
The SCS activities will be organized in cooperation with Women’s Union and the
Commune/Ward People’s Committees. The responsibility for implementing the strategy
will be shared between several stakeholders.
The PMU will have the overall responsibility for updating and implementing the SCS and
will be in charge of the activities targeted at the private sector.
The Women’s Union will assist in the dissemination of information and conduct
awareness-raising activities on the subjects listed in the GAP, possibly engaging relevant
NGOs/CSOs.
The local media will produce IAE materials: print materials, newspapers, radio and TV
programs, web, etc.
To fulfil the tasks, capacity building activities will be organized as follows:
PMU officers in charge of Communication: Training in communication skills.
Environmental and social impact assessment – CTUDR
IAC Vietnam and Sinh Thai CICE Page | 189
Key Women’s Union staff: training on personal value and self-esteem and subsequent
training of WU members, applying a Training of Trainers approach (ToT).
These stakeholders will receive the support from the national and international Institutional
Specialists as well as from the national and international Social and Gender Specialists.
Resources Required
The resources required for the implementation of the SCS refers to:
The cost of the Communication Strategy activities that will be covered by the Capacity
Building Program.
The Consultancy cost for the National and International Institutional Specialists, and for
the National and International Social and Gender Specialists.
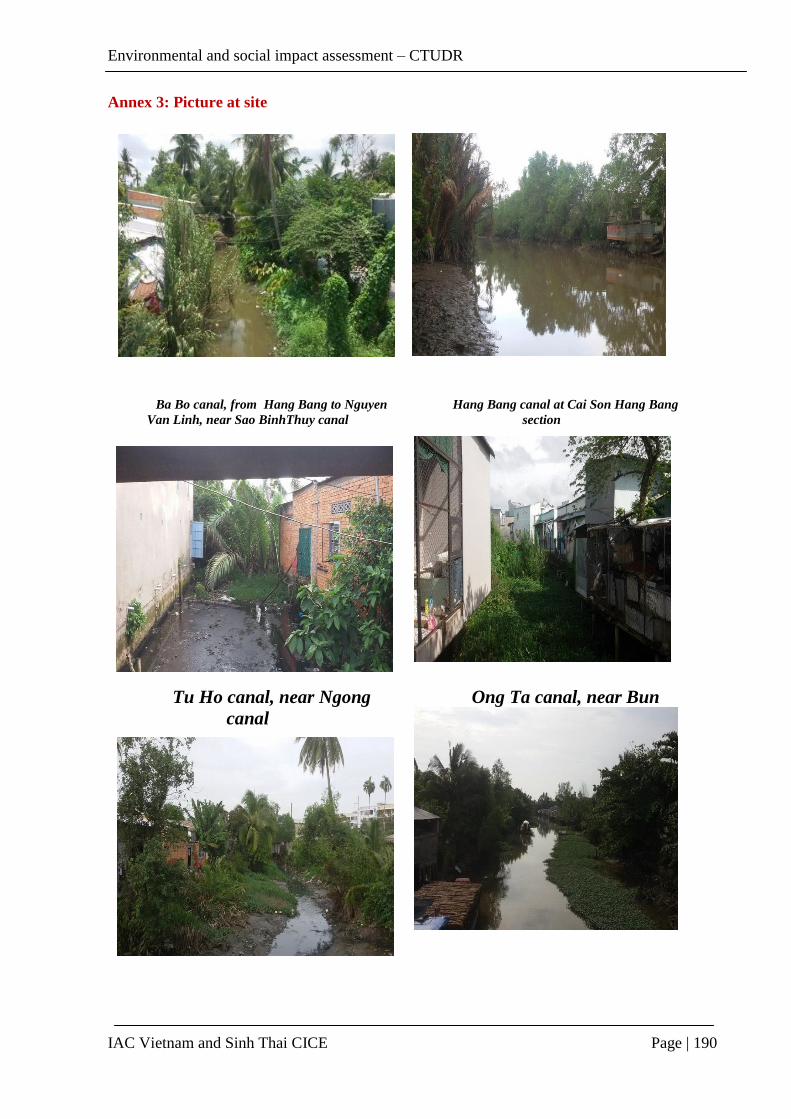
Environmental and social impact assessment – CTUDR
IAC Vietnam and Sinh Thai CICE Page | 190
Annex 3: Picture at site
Ba Bo canal, from Hang Bang to Nguyen
Van Linh, near Sao BinhThuy canal
Hang Bang canal at Cai Son Hang Bang
section
Tu Ho canal, near Ngong
canal
Ong Ta canal, near Bun
Xang lake
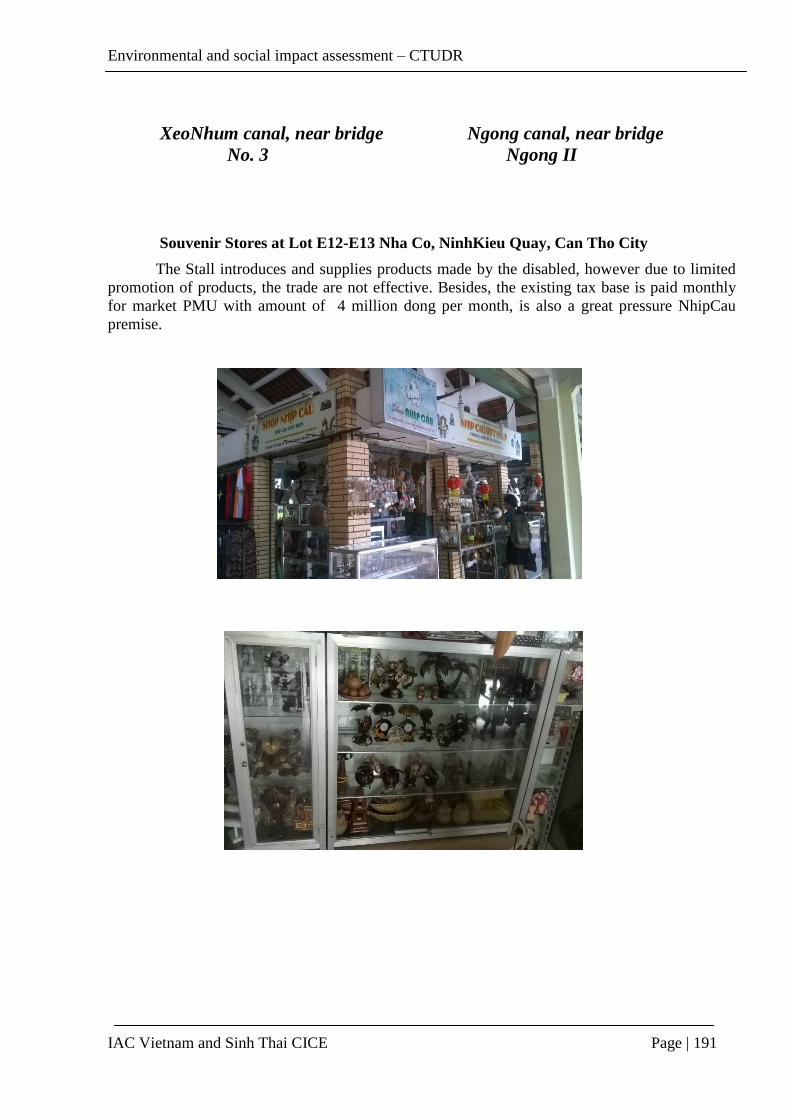
Environmental and social impact assessment – CTUDR
IAC Vietnam and Sinh Thai CICE Page | 191
XeoNhum canal, near bridge
No. 3
Ngong canal, near bridge
Ngong II
Souvenir Stores at Lot E12-E13 Nha Co, NinhKieu Quay, Can Tho City
The Stall introduces and supplies products made by the disabled, however due to limited
promotion of products, the trade are not effective. Besides, the existing tax base is paid monthly
for market PMU with amount of 4 million dong per month, is also a great pressure NhipCau
premise.