scode seat sub Expr1 External Marks commun icated External ...
Upload
khangminh22Category
view
3download
0
Can internal and external load measures via Polar Vantage V
predict training status in trained individuals?
- A prospective study during a normal and a heavy load training week.
Jens Offerman
Master Thesis, 30 hp
Master’s programme in Sports Medicine, 60 hp
Spring Term 2019
Section of Sports Medicine, Inst. for community medicine and rehabilitation
Umea University, 901 87 Umea
Abstract
Purpose To evaluate the information provided by Polar Vantage V, a new generation of heart rate
monitor/watch (HRM-watch) to the user, regarding the acute:chronic load ratio (ACLR), based on
the external and internal load measures and examine the measures against psychological and phys-
iological measures before and during a threshold test with VO2max testing.
Method A five-week prospective study with results and data collected during and after four normal
training weeks and during a fifth week with a very high training load. The results from HRM-watch
were then evaluated against the results from physiological and psychological tests. Eight endurance
runners were recruited.
Results Differences in ACLR against the differences in HRR show a R2 value of 0.77 (p<0.05).
ACLR significantly increased with an average of 0.33 from 0.93 to 1.26 (p=0.003, 95 % CI= 0.17 –
0.49). Differences in ACLR against differences in total mood disturbance (TMD) from POMS show
in regression analyses a R2value of 0.67 (p=0.05). No significant difference was noted in neither
resting HRV (p=0.3, 95% CI= -22.2 – 8.5) or standing HRV (p=0.15, 95% CI= - 4.15 – 20.8).
Conclusion Based on the result of the present study it can be concluded that training status, well-
being and present mood state can be predicted fairly good with the information from the internal and
external load measurements from the Polar Vantage V. However, the power of present exploratory
study was low due to a low number of included participants. Future research with greater number
of participants and an improved study design is needed to verify these interesting findings.
Keywords: Acute:chronic load ratio, POMS, Heart-rate recovery, Running Index
1
Acknowledgements
A huge thanks to. . .
. . . Supervisor Michael Svensson for strategic help and encouragement throughout the project.
. . . The entire Sports lab personnel for their support, encouragement and laughter.
. . . The department of Sports medicine for pushing me and make me grow as a human being.
. . . My partner, family and friends for all their love and support.
Extra information about the thesis:
External collaboration with Polar Electro.
This thesis has been designed and implemented in collaboration with external partners.
2
Abbreviations
HR – Heart rate
HRV – Heart rate variability
HRR – Heart rate recovery
ACLR – Acute: chronic load ratio
VO2max – Maximal oxygen uptake
ANS – Autonomic nervous system
PNS – Parasympathetic nervous system
SNS – Sympathetic nervous system
HRM – Heart rate monitor
NFOR – Non-functional overreaching
POMS – Profile of mood states
TMD – Total mood disturbance
TTE – Time to exhaustion
HR-RS index– Running speed index
RMSSD – Root mean square of difference in
successive R-R intervals
Internal load measures – Perceived exer-
tion (Borg-RPE), Heart rate and Heart rate
variability (Soligard et al., 2016)
External load measures – Training time
(hours) or frequency (sessions per day or week),
power output, speed, distance, acute: chronic
load ratio (Soligard et al., 2016).
Acute:chronic load ratio – Shows the re-
lationship between changes in load and risk of
injury. It describes the last week of training
load (acute) to the last four weeks of rolling av-
erage of training load (chronic). A ratio of 0.5
means you have trained half as much during
the last week, compared to the last four weeks,
a ratio of 2.0 means you have trained twice
as much (Gabbett, Hulin, Blanch & Whiteley,
2016).
Heart rate variability – The physiological
variation in the interval between heart beats.
Also called R-R intervals. It reflects the ac-
tivity of the sympathetic and parasympathetic
nervous systems tone on HR, and a measurable
indicator of cardiovascular fitness (Singh et al.,
2018).
High HRV Indices – Indicates better gen-
eral health and is associated with good training
adaptation, increased vagal activity in trained
individuals and improvements in cardiorespira-
tory fitness and performance (Hedelin, Bjerle
& Henriksson-Larsen, 2001; Georgiou et al.,
2018; Vesterinen et al., 2013).
Low HRV Indices – Associated with in-
creased cardiovascular morbidity and mortal-
ity, fatigue, stress and burnout in athletes. It
indicates poor training adaptations, decreased
HRV could also be used as a marker for over-
training and exhaustion (Georgiou et al., 2018;
Kiss et al., 2016).
3
Contents
1 Introduction 6
1.1 Monitoring internal and external measures . . . . . . . . . . . . . . . . . . . . . . . . 7
1.2 Purpose and research questions . . . . . . . . . . . . . . . . . . . . . . . . . . . . . . 9
2 Method 10
2.1 Experimental approach . . . . . . . . . . . . . . . . . . . . . . . . . . . . . . . . . . . 10
2.2 Participants . . . . . . . . . . . . . . . . . . . . . . . . . . . . . . . . . . . . . . . . . 10
2.3 Equipment . . . . . . . . . . . . . . . . . . . . . . . . . . . . . . . . . . . . . . . . . 11
2.4 Measurements . . . . . . . . . . . . . . . . . . . . . . . . . . . . . . . . . . . . . . . . 11
2.5 Procedure . . . . . . . . . . . . . . . . . . . . . . . . . . . . . . . . . . . . . . . . . . 14
2.6 Statistical methods . . . . . . . . . . . . . . . . . . . . . . . . . . . . . . . . . . . . . 16
2.7 Ethical consideration . . . . . . . . . . . . . . . . . . . . . . . . . . . . . . . . . . . . 16
3 Results 17
3.1 Internal and external measurements vs physiological
measurements . . . . . . . . . . . . . . . . . . . . . . . . . . . . . . . . . . . . . . . . 17
3.2 Internal and external measurements vs
psychological measurements . . . . . . . . . . . . . . . . . . . . . . . . . . . . . . . . 21
4 Discussion 23
4.1 Internal and external measurements vs physiological
measurements . . . . . . . . . . . . . . . . . . . . . . . . . . . . . . . . . . . . . . . . 23
4.2 Internal and external measurements vs psychological
measurements . . . . . . . . . . . . . . . . . . . . . . . . . . . . . . . . . . . . . . . . 26
4.3 Ethical and Social reflection . . . . . . . . . . . . . . . . . . . . . . . . . . . . . . . . 27
4.4 Methodological reflection . . . . . . . . . . . . . . . . . . . . . . . . . . . . . . . . . 27
5 Conclusion 29
6 Practical Application 30
4

7 References 31
8 Appendices 35
8.1 Appendix 1. . . . . . . . . . . . . . . . . . . . . . . . . . . . . . . . . . . . . . . . . 36
8.2 Appendix 2. . . . . . . . . . . . . . . . . . . . . . . . . . . . . . . . . . . . . . . . . 39
8.3 Appendix 3. . . . . . . . . . . . . . . . . . . . . . . . . . . . . . . . . . . . . . . . . 40
8.4 Appendix 4. . . . . . . . . . . . . . . . . . . . . . . . . . . . . . . . . . . . . . . . . 44
5
Chapter 1
Introduction
The primary purpose of endurance training is to improve the aerobic capacity. But the road to
success in endurance sports is often limited by stress-related injuries, insufficient training stimuli or
non-functional overreaching. Optimal adaptation is best achieved by adjusting training stimuli to
individual’s ability to tolerate and adapt training-induced load, through an individualized training
program (Kiviniemi et al., 2010; Vesterinen et al., 2014). Measuring the physical capacity and
monitoring positive and negative adaptations in heart rate (HR) and heart rate variability (HRV)
are important methods when designing a training program (Lamberts et al., 2010). The International
Olympic Committee recommends monitoring of the training load based on both an external (e.g.
speed) and internal (e.g. heart rate) load (Soligard et al., 2016). Soligard et al (2016) gave in their
consensus statement recommendations of regular monitoring of athlete to ensure appropriate and
therapeutic levels of external and internal loads, so that the athlete can maximize performance and
minimize the risk of injury. The concept acute:chronic load ratio (ACLR) has been validated with
data from three different sports (cricket, rugby and football) (Gabbett et al., 2016). This way of
dividing the training load into internal and external load has proven to be efficient in identifying
deviations in a runner’s performance and indicate the risk of overload and injury (Gabbett et al.,
2016; Singh et al., 2018; Vesterinen et al., 2014). Laboratory tests are commonly used to determine
adaptations to training, but they are not cost efficient or practical to use on a weekly or monthly
basis. Therefore, a low cost and practical training monitoring method that provides athletes with
valid information is of great value. This could help both elite athletes and exercisers to follow and
learn from their own progress (Vesterinen et al., 2014). In recent years, the new generation heart-
rate monitors (HRM) provide information on variability in heart rate, work intensity (speed, energy
consumption, power) and recovery rate. One such device is the Polar Vantage V with H10 chest
6
strap. It measures and monitors internal and external measures, running index, ACLR, sleep and
HRV through orthostatic tests with the H10 Polar chest straps.
1.1 Monitoring internal and external measures
Heart rate monitoring (beats/min) with HRM watch is probably the most used device to measure
training intensity and load (Georgiou et al., 2018; Vesterinen et al., 2014). At submaximal exercise,
HR has been observed to decrease after eight weeks of endurance training (Buchheit et al., 2010;
Lambert, Mbambo & St Clair Gibson, 1998). Heart-rate has a linear relationship with exercise
intensity (e.g. running speed), out of this relationship the heart rate - running speed (HR-RS) index
was constructed. This index includes average speed and HR from a running exercise and shows
the difference between a potential and actual running speed. Submaximal exercise HR, used for
assessing autonomic status may be an efficient method, therefore HR-RS index can be a helpful
way to track changes in performance. It is a cost efficient and practical tool for daily monitoring
of individuals’ training response without the use of laboratory testing (Vesterinen et al., 2014). In
the last few decades HRV as a marker of autonomic nervous system (ANS) function has emerged
as a non-invasive tool to monitor recovery and training responses (Dong, 2016; Kiss et al., 2016;
Georgiou et al., 2018; Singh et al., 2018a; Vesterinen et al., 2013). Several studies have examined
the usefulness of monitoring HRV on a daily basis and adjusting training load according to the
increasing or decreasing HRV, and it has been shown to be a successful method to increase perfor-
mance and to avoid non-functional overreaching (Buchheit et al., 2010; Hedelin et al., 2001; Kiss et
al., 2016; Kiviniemi, Hautala, Kinnunen & Tulppo, 2007; Kiviniemi et al., 2010; Vesterinen et al.,
2013). Heart-rate and HRV’s connection to ANS is based on the activity of the PNS and SNS. A
higher activity in SNS reflects a reduced HRV and an increased HR at rest, is associated to inferior
training response, whereas increased activity in the PNS indicates an improved training response
and a lower HR at rest. Changes of ANS has an effect on both HR and HRV and therefore a major
factor related to the adaptation to training, both acute and chronic adaptations (Carter, Banister &
Blaber, 2003; Hautala et al., 2003; Vesterinen et al., 2014). Reduced HRV indices have the potential
to predict athlete’s inability to manage the training load and respond to accumulation of fatigue
(Maheshwari et al., 2016).
Based on the work of Banister and Calvert (1980), the new concept ACLR was introduced, which is
based on both the positive and negative effects of training and competition loads. A well-prepared
athlete with low likelihood of injury (10%) will show an ACLR between 0.8-1.3.
7
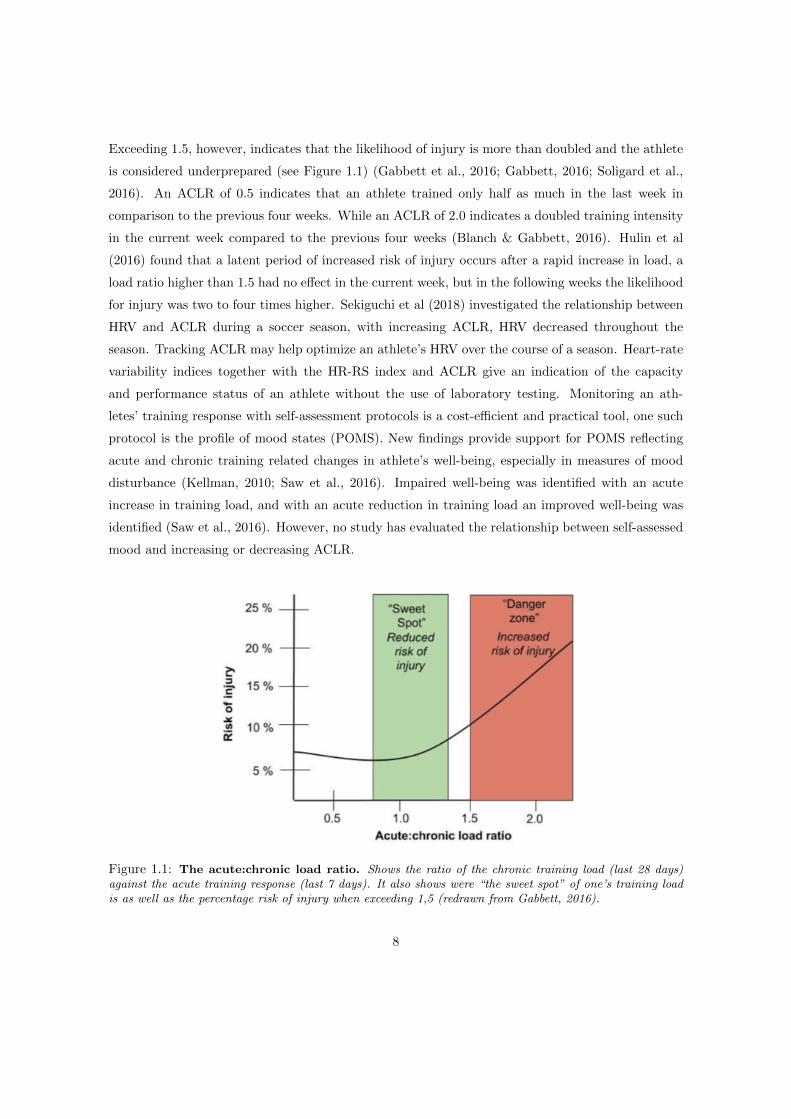
Exceeding 1.5, however, indicates that the likelihood of injury is more than doubled and the athlete
is considered underprepared (see Figure 1.1) (Gabbett et al., 2016; Gabbett, 2016; Soligard et al.,
2016). An ACLR of 0.5 indicates that an athlete trained only half as much in the last week in
comparison to the previous four weeks. While an ACLR of 2.0 indicates a doubled training intensity
in the current week compared to the previous four weeks (Blanch & Gabbett, 2016). Hulin et al
(2016) found that a latent period of increased risk of injury occurs after a rapid increase in load, a
load ratio higher than 1.5 had no effect in the current week, but in the following weeks the likelihood
for injury was two to four times higher. Sekiguchi et al (2018) investigated the relationship between
HRV and ACLR during a soccer season, with increasing ACLR, HRV decreased throughout the
season. Tracking ACLR may help optimize an athlete’s HRV over the course of a season. Heart-rate
variability indices together with the HR-RS index and ACLR give an indication of the capacity
and performance status of an athlete without the use of laboratory testing. Monitoring an ath-
letes’ training response with self-assessment protocols is a cost-efficient and practical tool, one such
protocol is the profile of mood states (POMS). New findings provide support for POMS reflecting
acute and chronic training related changes in athlete’s well-being, especially in measures of mood
disturbance (Kellman, 2010; Saw et al., 2016). Impaired well-being was identified with an acute
increase in training load, and with an acute reduction in training load an improved well-being was
identified (Saw et al., 2016). However, no study has evaluated the relationship between self-assessed
mood and increasing or decreasing ACLR.
Figure 1.1: The acute:chronic load ratio. Shows the ratio of the chronic training load (last 28 days)against the acute training response (last 7 days). It also shows were “the sweet spot” of one’s training loadis as well as the percentage risk of injury when exceeding 1,5 (redrawn from Gabbett, 2016).
8
1.2 Purpose and research questions
It is of great importance that the information provided from HRM watches is trustworthy, which then
can be helpful in evaluating training and recovery, as well as in designing new training programs.
Therefore, the purpose of the present project is to evaluate the information provided by Polar
Vantage V towards the user. Particularly the information regarding the ACLR, which are based on
external (exercise amount, speed) and internal (HR, HRV) load measures. They will be examined
against psychological (POMS, BORG-RPE) and physiological (HRR, lactate, VO2, HR) measures
before and during a threshold test with VO2max testing.
- Can current training status be predicted based on Polar Vantage V’s ACLR, when compared to
physiological (HRR, lactate, VO2 and psychological measurements (POMS, BORG-RPE)?
9
Chapter 2
Method
2.1 Experimental approach
In a five-week prospective study, the results from Polar Vantage V (ACLR, running index, exercise
amount, HR and HRV) are tested against the results from physiological tests and self-assessments
(POMS and BORG-RPE). The results and data are collected during and after four normal training
weeks and during and following a fifth week with a very high training load. This will later be
compared and analyzed to examine if the same variations from the Polar Vantage V can be seen in
the physiological and psychological measurements.
2.2 Participants
A total of eight well-trained (61.3 ± 5.5 ml/kg/min) endurance runners (seven males, one woman)
in Umea were recruited for this five-week study. All participants met the inclusion criteria of
minimum age 20, fully healthy and performing endurance training (preferably running) at least four
days a week. Exclusion criteria were; heart abnormalities, exercise induced asthma that requires
medication, overload issues that hinder running or a recent interruption in training (>2 weeks).
10
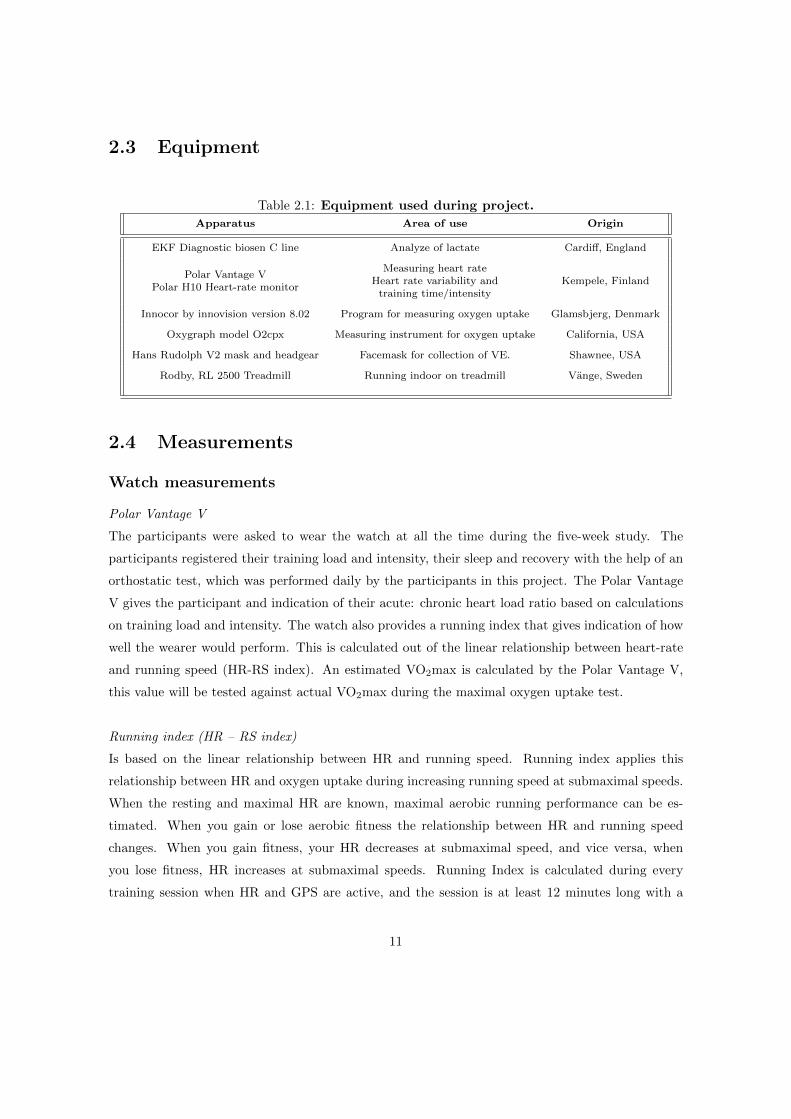
2.3 Equipment
Table 2.1: Equipment used during project.
Apparatus Area of use Origin
EKF Diagnostic biosen C line Analyze of lactate Cardiff, England
Polar Vantage VPolar H10 Heart-rate monitor
Measuring heart rateHeart rate variability and
training time/intensityKempele, Finland
Innocor by innovision version 8.02 Program for measuring oxygen uptake Glamsbjerg, Denmark
Oxygraph model O2cpx Measuring instrument for oxygen uptake California, USA
Hans Rudolph V2 mask and headgear Facemask for collection of VE. Shawnee, USA
Rodby, RL 2500 Treadmill Running indoor on treadmill Vange, Sweden
2.4 Measurements
Watch measurements
Polar Vantage V
The participants were asked to wear the watch at all the time during the five-week study. The
participants registered their training load and intensity, their sleep and recovery with the help of an
orthostatic test, which was performed daily by the participants in this project. The Polar Vantage
V gives the participant and indication of their acute: chronic heart load ratio based on calculations
on training load and intensity. The watch also provides a running index that gives indication of how
well the wearer would perform. This is calculated out of the linear relationship between heart-rate
and running speed (HR-RS index). An estimated VO2max is calculated by the Polar Vantage V,
this value will be tested against actual VO2max during the maximal oxygen uptake test.
Running index (HR – RS index)
Is based on the linear relationship between HR and running speed. Running index applies this
relationship between HR and oxygen uptake during increasing running speed at submaximal speeds.
When the resting and maximal HR are known, maximal aerobic running performance can be es-
timated. When you gain or lose aerobic fitness the relationship between HR and running speed
changes. When you gain fitness, your HR decreases at submaximal speed, and vice versa, when
you lose fitness, HR increases at submaximal speeds. Running Index is calculated during every
training session when HR and GPS are active, and the session is at least 12 minutes long with a
11

minimum pace of six km/h. After the training session the Polar Vantage V displays a running index
value and shows an estimate on the performance on certain routes (e.g. cooper test, 5 km and
marathon) (Polar, 2019). The running index will be noted before every test and an average index
for the normal training weeks will be used and analyzed against the running index during the heavy
training week and the variations will be analyzed against physiological and psychological measures.
Orthostatic test
Participants performed a daily test with the chest strap, preferably in the morning before coffee
or food. The test was performed with the Polar Vantage V (Kempele, Finland) watch and the
H10 chest strap which uses electrocardiography (ECG) electrodes, its recording signals more accu-
rate compared with Photoplethysmography (PPG) method which is commonly used in other pulse
watches and chest straps (Georgiou et al., 2018; Singh et al., 2018). It is asked that they standardize
the way they perform the test (e.g. in bed or sitting down) and perform it the same way every day.
The test starts by initiate the orthostatic test on their watch. It then measures the HR and HRV in
R-R intervals; changes in measurements reflect changes in autonomic regulation of the cardiovascular
system (Polar, 2019). During the test participants are asked to lie down and relax, for two minutes,
then asked to stand up and relax for two minutes. The test gives an indication of how well recovered
or not the participant is. As well as a measure of day to day HRV (ms) and HR (beats/min) and
average score over time.
Acute:chronic heart-load ratio
Is based on the ACLR and takes in consideration the last seven days of training (acute) against
the last 28 days of training (chronic). Based on the work of Banister and Calvert (1980); the heart
derived training impulse (TRIMP). It shows the acute TRIMP of the last seven days against the tol-
erance from the last 28 days of TRIMP. After at least 28 days it shows a reliable ratio (Polar, 2019),
which is connected to either under loading (0.5-0.7), maintaining (0.8-1.0), developing (1.1-1.4) or
overloading (1.4-2.5). After the four normal training load weeks and after the fifth heavy load week,
the ratio is noted and then analyzed against physiological and self-assessed measurements.
Physiological measurements
Threshold test with maximal oxygen uptake test
The participants performed a submaximal threshold test twice on a treadmill (RL2500E, Rodby)
at the Sports lab, Umea. The test started with ten minutes of warm up at 8 km/h for men and
7 km/h for women with no gradient. After the warm up the participants performed four minutes
12
of running on four different speeds with no gradient. For men the speed of the thresholds was
set to 10 km/h, 12 km/h, 14 km/h and 16 km/h. For women the speed was set to 9 km/h, 11
km/h, 13 km/h and 15 km/h. Based on the recommendations of Currell and Jeukendrup (2008) a
familiarization test was implemented. During this test the participants ran on a treadmill on the
threshold speeds and rated their perceived exertion with BORG-RPE. Based on the participants
estimations at the familiarization test, either the speed of the treadmill increased or remained at
the original speed for the second and third threshold test. If they estimated lower than 13 on the
last threshold then their speed was increased by one km/h, and if they estimated lower than 12, it
was increased by two km/h. The increase was implemented during the second and third threshold
test In between every four-minute block, the participants had a one-minute break where blood was
taken capillary for lactate analyze (Biosen C line) and perceived exertion was assessed with BORG-
RPE scale (Borg, 1975). After the four thresholds the participants had a ten-minute break before
the VO2max test began. Maximal oxygen uptake (VO2max) was assessed from an incremental
treadmill test. Starting speed and slope was set after each participants capacity. This was based
on how they scored the perceived exertion with BORG-RPE, their HR and RER on the third and
fourth threshold. A threshold speed leading to a rating 13 or higher, HR >140 and RER >0.9, was
set at starting speed. Slope was then increased with 1 degree every minute until exhaustion. Time to
exhaustion was noted. Criteria for maximal oxygen uptake were, leveling off of oxygen uptake (VO2)
and HR with an increased work rate, elevated respiratory exchange ratio (VCO2/VO2) ≥1.10, ±10
strokes from known maximal heart rate and perceived exertion rate higher than 17 with BORG-
RPE scale (Powers & Howley, 2007). Oxygen uptake was measured with an Oxygraph model O2cpx
(California, USA) and analyzed with Innocor software (Glamsbjerg, Denmark). An average of the
last two minutes of every threshold in HR and VO2 during the entire threshold test were used for
analyzing as well as the perceived exertion with BORG-RPE and lactate at every threshold. The
highest VO2value during the maximal oxygen uptake test (VO2max test) symbolize the participants’
VO2max. An average of oxygen uptake (VO2) during the threshold test, and an average of lactate
in the blood from capillary blood analyzes, as well as average HR during threshold test will be used
as physiological measurements. An increase in those parameters could indicate an inferior capacity
or on the verge of overtraining. Heart rate recovery (HRR) is being implemented as a marker of
autonomic function and training status in the participants. Heart rate recovery shows at what rate
HR is declining after finishing e.g. threshold test (Daanen, Lamberts, Kallen, Jin & Van Meeteren,
2012). HR at one minute of recovery is a validated measurement and is recommended to be included
in all treadmill tests (Shetler et al., 2001) This will be implemented post threshold test and the
differences from normal to heavy training load will be analyzed against the difference of the ACLR.
13
Psychological measurements
Profile of mood state (POMS) abbreviated version
Is a self-assessment tool for mood and affective states. Based on the 65-item questionnaire, this
abbreviated version with 37 items, has been used frequently by clinicians and practitioners for
psychological monitoring of training, overtraining and under recovery. It has been validated and
tested against the original 65-item version (Shacham, 1983). It has been shown to be more time
efficient due to the lower number of items in the questionnaire. It is important that the participant
does not lack motivation during the filling out process, this might lead to them not filling it out
correctly, not taking the time to think and answer truthfully (McNair, Lorr & Dropplemann, 1981;
Shacham, 1983). Therefore, the shorter version of POMS was implemented during the present study.
Participants answer the 37-item questionnaire with a likert scale of 1 (not at all) to 4 (extremely).
Measures of mood and the impact of training on the mood is assessed through seven subscales
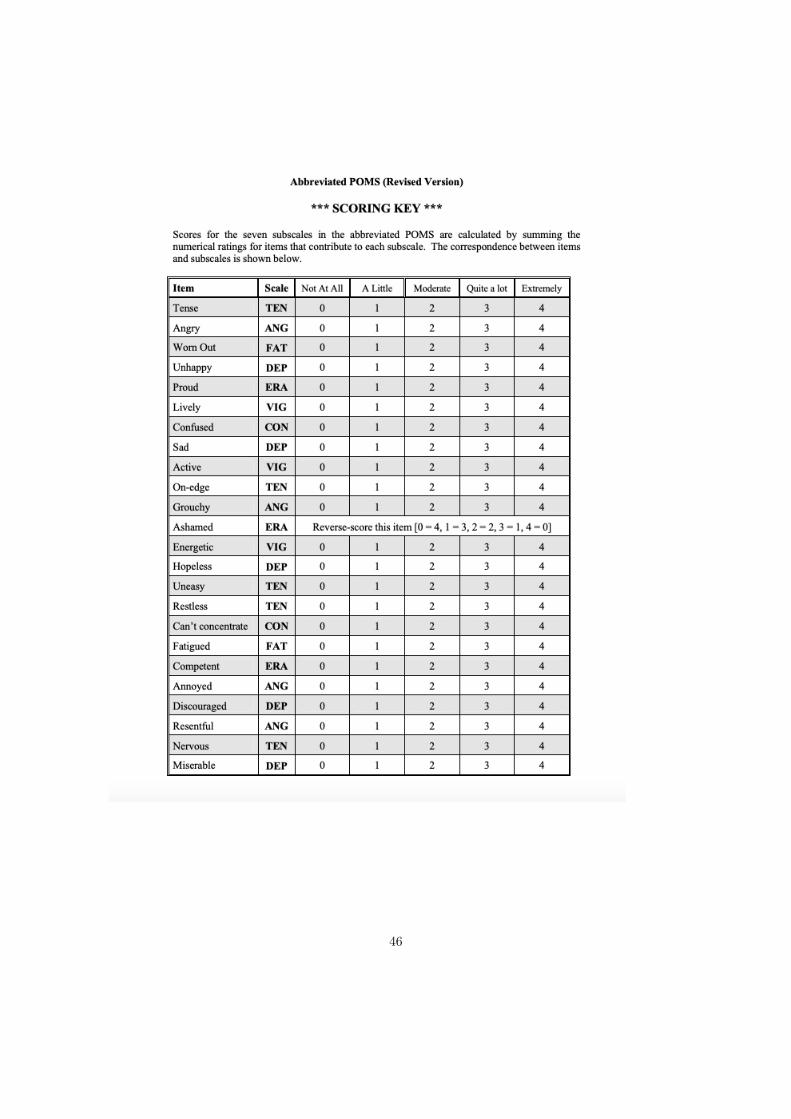
(Depression, Fatigue, Anger, Tension, ERA, Vigor and Confusion). With the help of a score-key the
questionnaire gives a score of total mood disturbance (TMD), as well as a score in each subscale.
This is calculated by adding a constant value of 100 and then adding the scores from the subscales
fatigue, anger, tension, depression and confusion then subtract the score from the subscales of ERA
and vigor (see Appendix 4). A higher score indicates inferior mood, while a lower score indicates
a better mood over the last seven days (McNair et al., 1981). The questionnaire detects mood
fluctuations in exercise and can provide early indicators of overtraining in athletes. POMS can
also detect psychological changes in athletes with varying lengths of training sessions and recovery
periods. It does not provide information about the causes of overtraining (McNair et al., 1981;
Kellman, 2010). TMD as well as the score of the different subscales will be used as a measurement
of one’s psychological state and well-being and will be analyzed against participants ACLR.
2.5 Procedure
Participants wore the Polar Vantage V initially for four weeks (29 ± 2 days) to collect baseline values
as well as for another week (7 ± 1 days) with heavy training load. The participants were asked to
initially train with a normal training load. During the fifth week they were asked to increase their
training load with about 30%, symbolizing a heavy training load. Four weeks were needed to assess
a true normal value in both the ACLR and the orthostatic test (HRV indices) for the participants.
During week two, participants went through a familiarization threshold test without VO2max test.
Studies have shown it is important for participants to get familiarized with the equipment and
apparatus prior to performance tests (Currell & Jeukendrup, 2008). Participants registered their
14
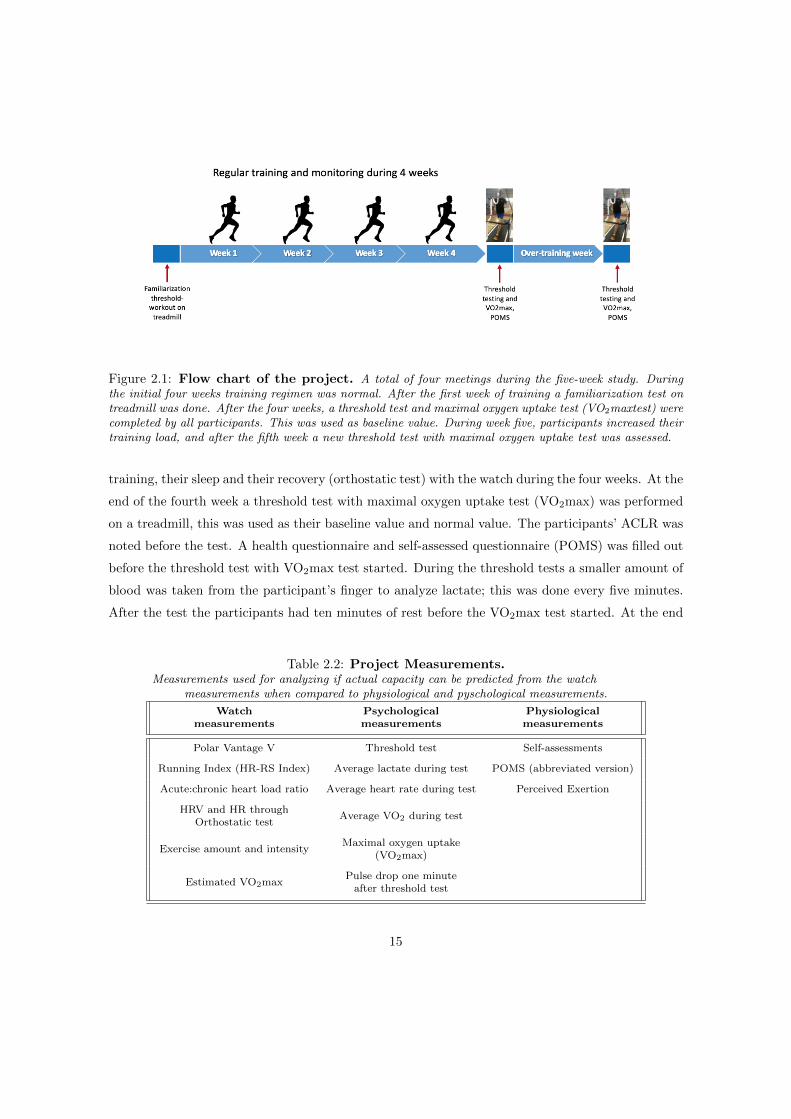
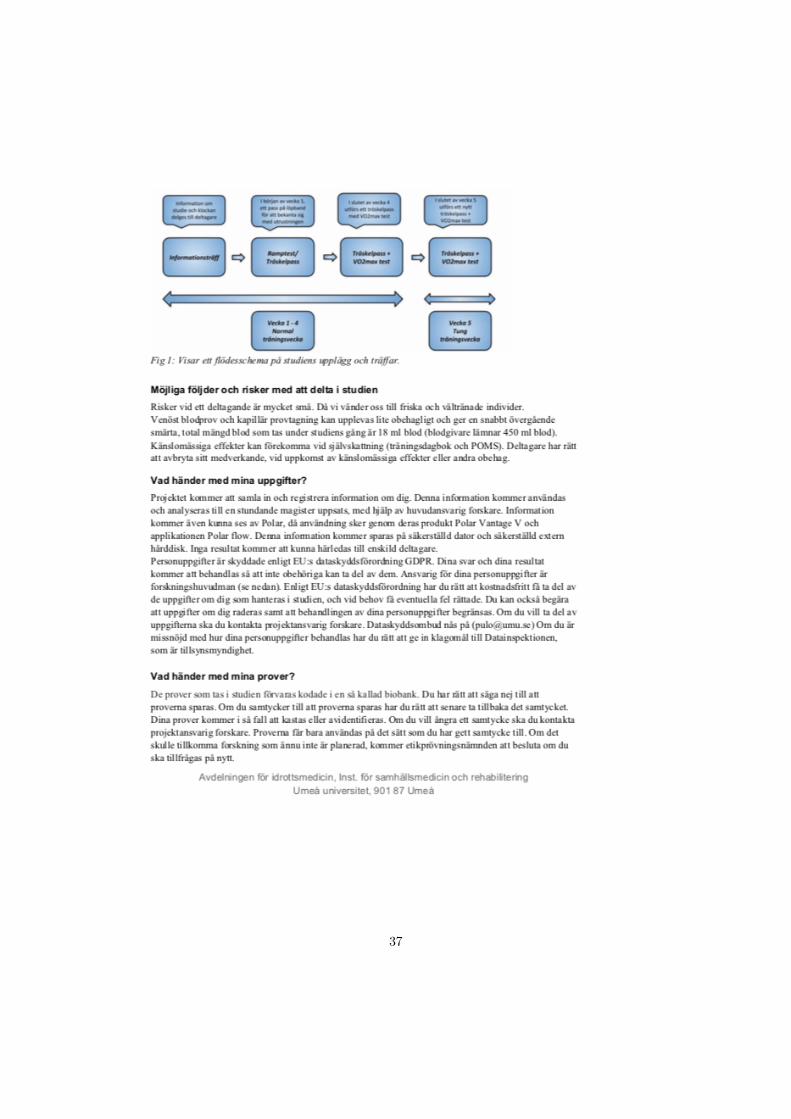
Figure 2.1: Flow chart of the project. A total of four meetings during the five-week study. Duringthe initial four weeks training regimen was normal. After the first week of training a familiarization test ontreadmill was done. After the four weeks, a threshold test and maximal oxygen uptake test (VO2maxtest) werecompleted by all participants. This was used as baseline value. During week five, participants increased theirtraining load, and after the fifth week a new threshold test with maximal oxygen uptake test was assessed.
training, their sleep and their recovery (orthostatic test) with the watch during the four weeks. At the
end of the fourth week a threshold test with maximal oxygen uptake test (VO2max) was performed
on a treadmill, this was used as their baseline value and normal value. The participants’ ACLR was
noted before the test. A health questionnaire and self-assessed questionnaire (POMS) was filled out
before the threshold test with VO2max test started. During the threshold tests a smaller amount of
blood was taken from the participant’s finger to analyze lactate; this was done every five minutes.
After the test the participants had ten minutes of rest before the VO2max test started. At the end
Table 2.2: Project Measurements.Measurements used for analyzing if actual capacity can be predicted from the watch
measurements when compared to physiological and pyschological measurements.
Watchmeasurements
Psychologicalmeasurements
Physiologicalmeasurements
Polar Vantage V Threshold test Self-assessments
Running Index (HR-RS Index) Average lactate during test POMS (abbreviated version)
Acute:chronic heart load ratio Average heart rate during test Perceived Exertion
HRV and HR throughOrthostatic test
Average VO2 during test
Exercise amount and intensityMaximal oxygen uptake
(VO2max)
Estimated VO2maxPulse drop one minute
after threshold test
15

of the fifth week another threshold test with VO2max test was performed on the treadmill. Health
questionnaire and self-assessment (POMS) were filled out before the test started. The variations
between the two threshold test with VO2max testing were analyzed, to see if variations in the ACLR
from different training weeks could be linked to physiological and psychological measurements.
2.6 Statistical methods
The changes in ACLR, physiological and psychological parameters was calculated as differences
between baseline weeks and overload training week. Delta values were compared against each other.
Data were analyzed with JMP software (JMP, version 13; JMP, Buckinghamshire, England). Normal
distribution of data was tested with histograms, Q-Q plots and goodness of fit test. Descriptive
statistics are shown in tables of mean values together with 95% CI from the physiological and as
median values from the psychological measurements made during the study. Matched paired T-test
was applied to analyze data if normal distributed, otherwise if data is non-parametric a Wilcoxon
signed rank test was applied to see if changes had occurred. Regression analysis was used to predict
current training status and correlations were assessed to see if any relationship between parameters
could be found. The p ≤ 0.05 criterion was used for establishing statistical significance as well as
95% CI. Bland-Altman scatterplots was applied to determine how well the estimated VO2max value
from the Polar Vantage V matched their true VO2max value from the laboratory test.
2.7 Ethical consideration
The ethics committee of the medical faculty, Umea University, has approved the present study and
it was carried out in agreement with the World Medical Association Declaration of Helsinki (2013).
All participants gave informed consent after verbal and written information about the project was
provided to them (see Appendix 1). Participants were allowed to put an end to their participation
at any time. Data was treated accordingly to GDPR and participants were informed that they have
the right at any given time see and get information on their result from the present study. Small
discomfort is associated with the maximal effort during the maximal oxygen uptake test, but all
participants were runners that are used to strenuous exercise and running on treadmill. The present
study could be of great value for both the participants in the study and the general population,
based on the information gained from the tests and from the HRM-watches. Overall, the potential
benefits from the present study is considered larger than the total sum of discomfort and risks.
16
Chapter 3
Results
A total of six subjects (five males and one woman) completed the five-week study. No significant
changes in participants characteristics occurred from normal training load to heavy training load
week. All training amount except sessions per week and high intensity workouts (HIW) increased
significantly during week five. Sessions per week increased with an average of 1.6 or 20% for all
participants, from 7.9 to 9.5 (Wilcoxon p=0.06). Time per week increased significantly with 119
minutes or 32% from 370 to 489 minutes (p=0.01 95 % CI= 42.9 – 192.6). Distance per week
increased significantly from 62 to 84 kilometers per week (p=0.04, 95% CI= 1.1 – 43.6). Low intensity
workouts (LIW) increased significantly with an average of 90 minutes or 31% for participants from
278.5 to 365.3 minutes per week (p=0.05, 95% CI= 0.08 – 180). HIW increased with 29 minutes or
32% from 90 to 119 minutes, but not significantly (p=0.2, 95% CI= -22.6 – 82.4) (see Table 3.1).
3.1 Internal and external measurements vs physiological
measurements
Differences in ACLR against the differences in HRR show a R2 value of 0.76 (p=0.05) (see Figure
3.1). ACLR significantly increases with an average of 0.33 from 0.93 to 1.26 from the first to the
second testing (p=0.003, 95% CI= 0.17 – 0.49). No significant changes are seen in lactate, heart-rate
or oxygen uptake between test one and test two. All participants raised their ACLR as shown in
figure 3.2. Lactate value was decreased for the second test for all participants, but not statistically
significant (see Figure 3.3). No significant difference is noted in neither resting HRV (p=0.3, 95%
CI= -22.2 – 8.5) or standing HRV (p=0.15, 95% CI= - 4.15 – 20.8) from the weeks of normal training
load to the week of heavy training load.
17
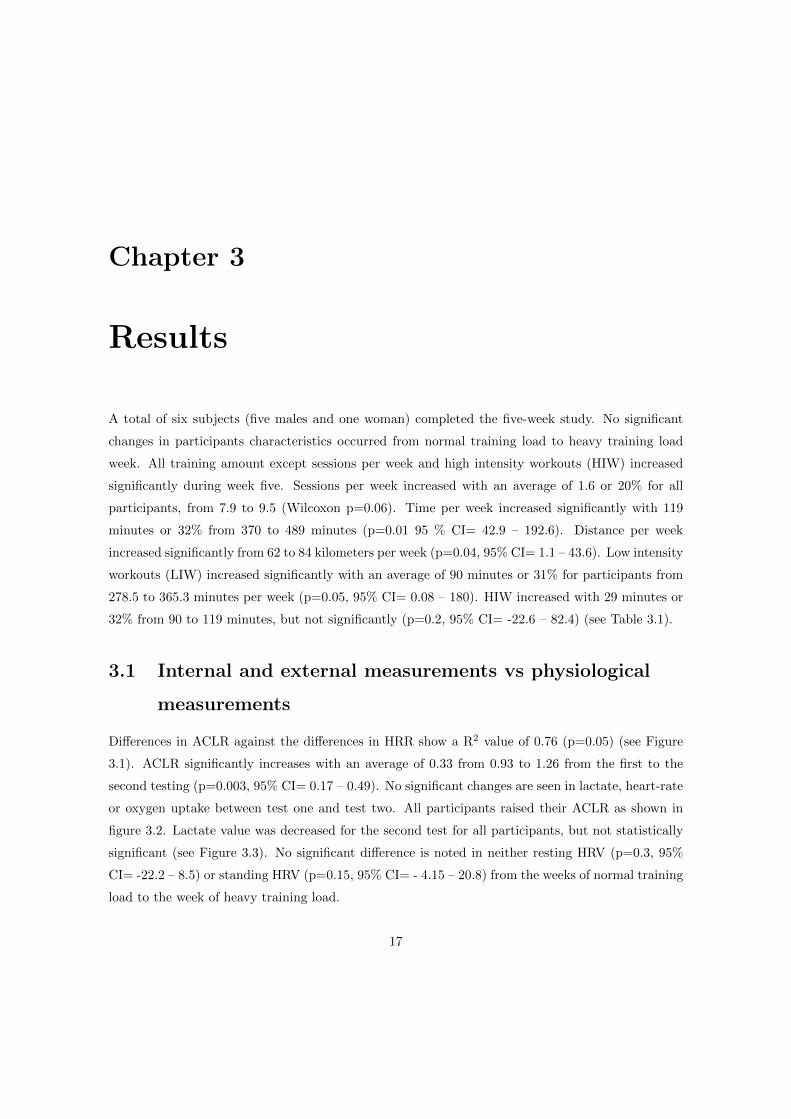
Bland-Altman plots showing that all values are within the level of agreement (LOA) (see Figure 3.4).
Bias 0.84, Lower LOA -14.7 and Upper LOA value 16.4. Indicating that the estimated VO2max is
closely related to the actual VO2max value of the participants.
Figure 3.1: Regression analysis of difference in ACLR against differences in heart rate recovery(HRR) one minute after finishing threshold test. Shows a prediction (R2= 0.76, p=0.02) where alower ACLR indicate a lower HRR and inferior recovery, with a higher increase in ACLR the participantshad a more rapid recovery.
Figure 3.2: Acute: chronic load ratio of participants Acute: chronic load ratio after week four andafter week five for all participants, all subjects increased their ACLR for the last week of the study whichwould symbolize a heavy training week.
18
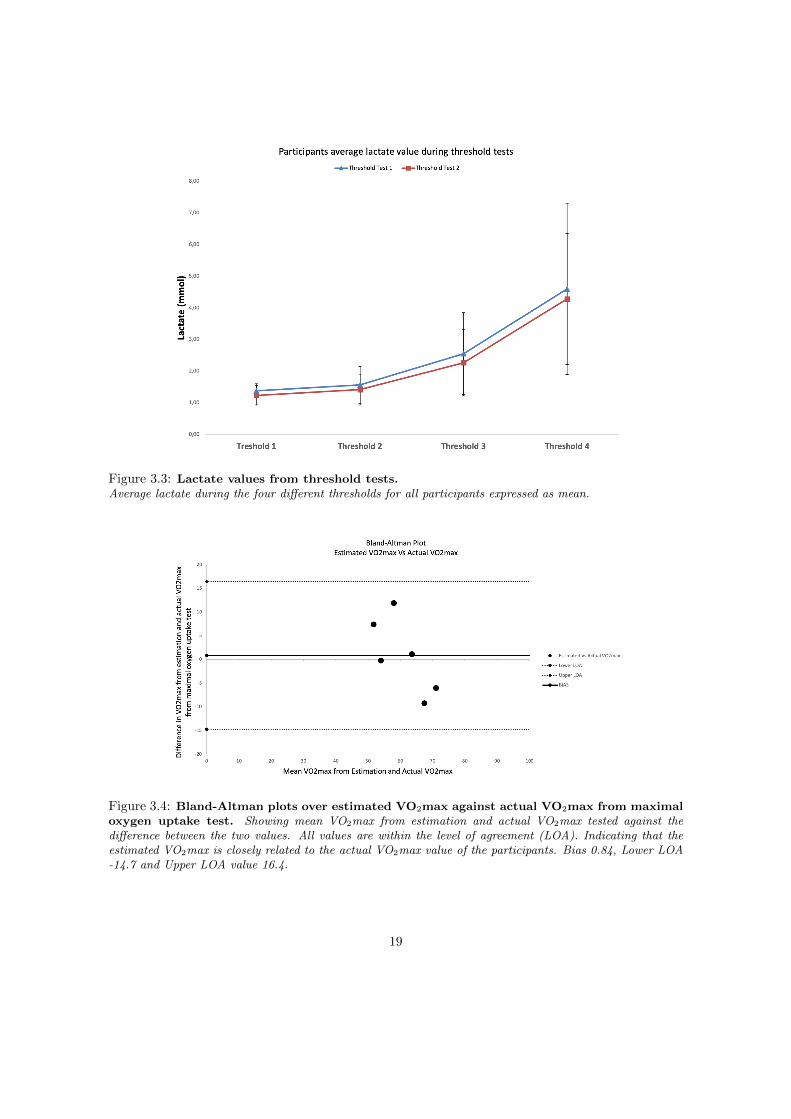
Figure 3.3: Lactate values from threshold tests.Average lactate during the four different thresholds for all participants expressed as mean.
Figure 3.4: Bland-Altman plots over estimated VO2max against actual VO2max from maximaloxygen uptake test. Showing mean VO2max from estimation and actual VO2max tested against thedifference between the two values. All values are within the level of agreement (LOA). Indicating that theestimated VO2max is closely related to the actual VO2max value of the participants. Bias 0.84, Lower LOA-14.7 and Upper LOA value 16.4.
19
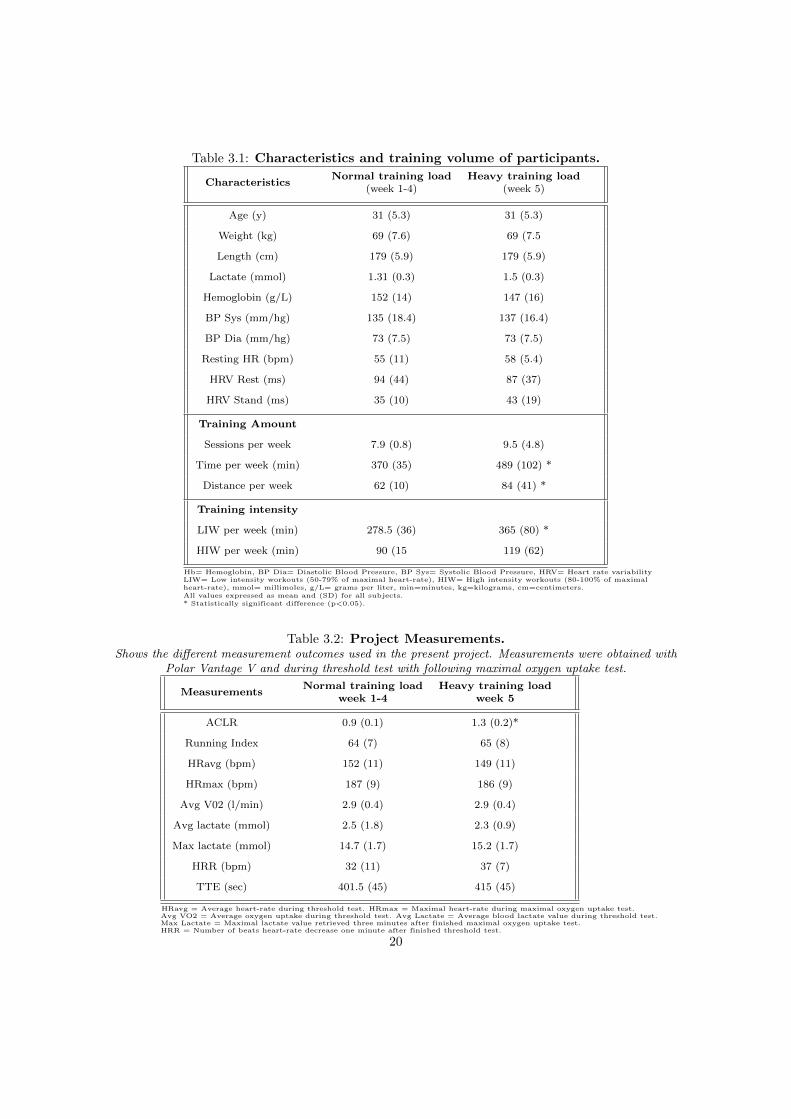
Table 3.1: Characteristics and training volume of participants.
CharacteristicsNormal training load
(week 1-4)Heavy training load
(week 5)
Age (y) 31 (5.3) 31 (5.3)
Weight (kg) 69 (7.6) 69 (7.5
Length (cm) 179 (5.9) 179 (5.9)
Lactate (mmol) 1.31 (0.3) 1.5 (0.3)
Hemoglobin (g/L) 152 (14) 147 (16)
BP Sys (mm/hg) 135 (18.4) 137 (16.4)
BP Dia (mm/hg) 73 (7.5) 73 (7.5)
Resting HR (bpm) 55 (11) 58 (5.4)
HRV Rest (ms) 94 (44) 87 (37)
HRV Stand (ms) 35 (10) 43 (19)
Training Amount
Sessions per week 7.9 (0.8) 9.5 (4.8)
Time per week (min) 370 (35) 489 (102) *
Distance per week 62 (10) 84 (41) *
Training intensity
LIW per week (min) 278.5 (36) 365 (80) *
HIW per week (min) 90 (15 119 (62)
Hb= Hemoglobin, BP Dia= Diastolic Blood Pressure, BP Sys= Systolic Blood Pressure, HRV= Heart rate variabilityLIW= Low intensity workouts (50-79% of maximal heart-rate), HIW= High intensity workouts (80-100% of maximalheart-rate), mmol= millimoles, g/L= grams per liter, min=minutes, kg=kilograms, cm=centimeters.All values expressed as mean and (SD) for all subjects.* Statistically significant difference (p<0.05).
Table 3.2: Project Measurements.Shows the different measurement outcomes used in the present project. Measurements were obtained with
Polar Vantage V and during threshold test with following maximal oxygen uptake test.
MeasurementsNormal training load
week 1-4Heavy training load
week 5
ACLR 0.9 (0.1) 1.3 (0.2)*
Running Index 64 (7) 65 (8)
HRavg (bpm) 152 (11) 149 (11)
HRmax (bpm) 187 (9) 186 (9)
Avg V02 (l/min) 2.9 (0.4) 2.9 (0.4)
Avg lactate (mmol) 2.5 (1.8) 2.3 (0.9)
Max lactate (mmol) 14.7 (1.7) 15.2 (1.7)
HRR (bpm) 32 (11) 37 (7)
TTE (sec) 401.5 (45) 415 (45)
HRavg = Average heart-rate during threshold test. HRmax = Maximal heart-rate during maximal oxygen uptake test.Avg VO2 = Average oxygen uptake during threshold test. Avg Lactate = Average blood lactate value during threshold test.Max Lactate = Maximal lactate value retrieved three minutes after finished maximal oxygen uptake test.HRR = Number of beats heart-rate decrease one minute after finished threshold test.
20
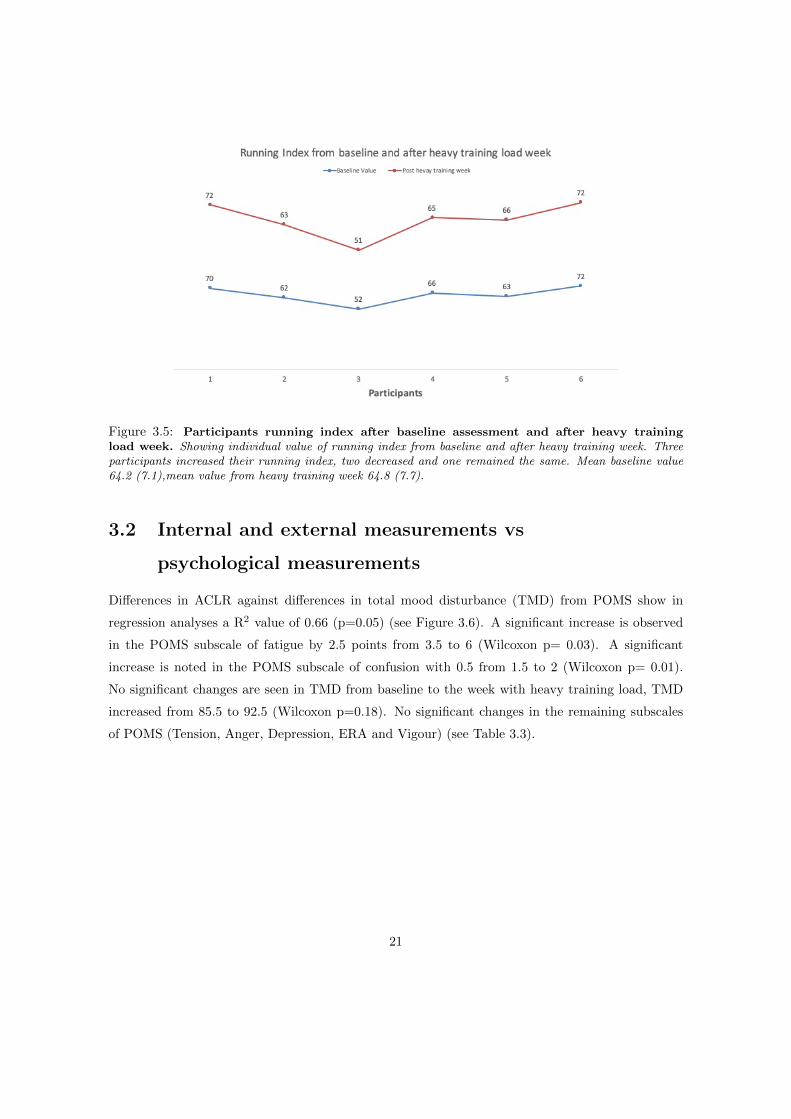
Figure 3.5: Participants running index after baseline assessment and after heavy trainingload week. Showing individual value of running index from baseline and after heavy training week. Threeparticipants increased their running index, two decreased and one remained the same. Mean baseline value64.2 (7.1),mean value from heavy training week 64.8 (7.7).
3.2 Internal and external measurements vs
psychological measurements
Differences in ACLR against differences in total mood disturbance (TMD) from POMS show in
regression analyses a R2 value of 0.66 (p=0.05) (see Figure 3.6). A significant increase is observed
in the POMS subscale of fatigue by 2.5 points from 3.5 to 6 (Wilcoxon p= 0.03). A significant
increase is noted in the POMS subscale of confusion with 0.5 from 1.5 to 2 (Wilcoxon p= 0.01).
No significant changes are seen in TMD from baseline to the week with heavy training load, TMD
increased from 85.5 to 92.5 (Wilcoxon p=0.18). No significant changes in the remaining subscales
of POMS (Tension, Anger, Depression, ERA and Vigour) (see Table 3.3).
21
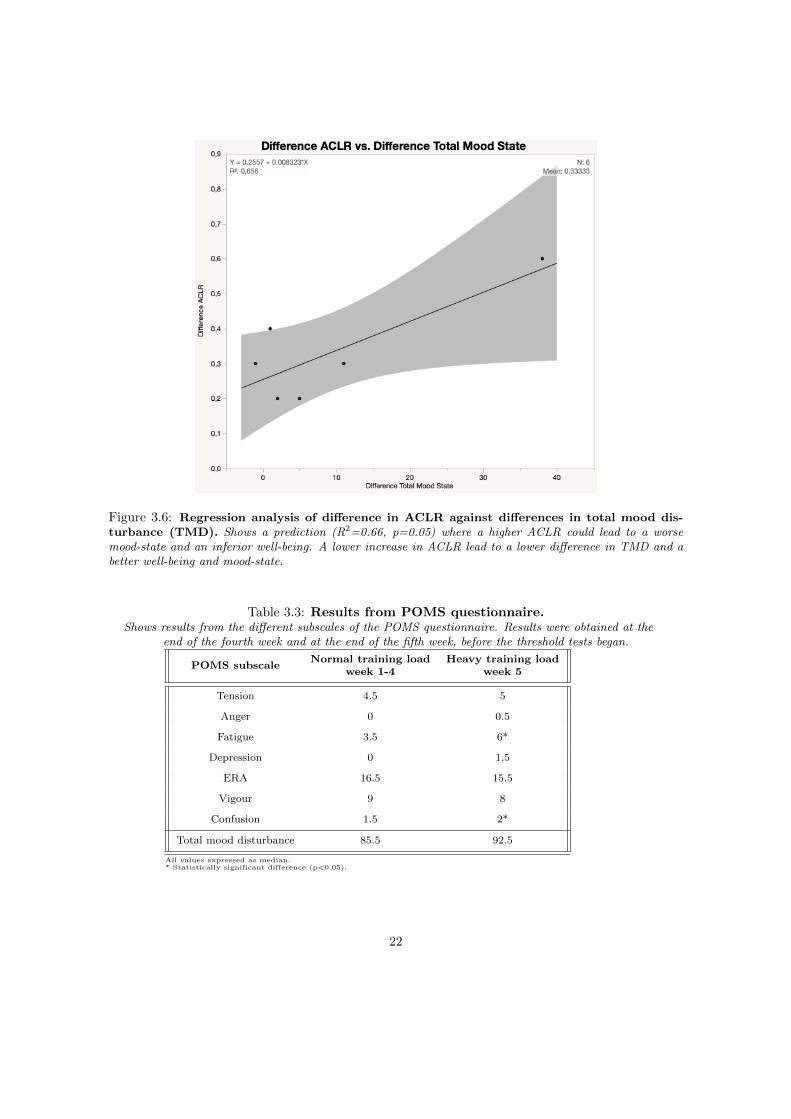
Figure 3.6: Regression analysis of difference in ACLR against differences in total mood dis-turbance (TMD). Shows a prediction (R2=0.66, p=0.05) where a higher ACLR could lead to a worsemood-state and an inferior well-being. A lower increase in ACLR lead to a lower difference in TMD and abetter well-being and mood-state.
Table 3.3: Results from POMS questionnaire.Shows results from the different subscales of the POMS questionnaire. Results were obtained at the
end of the fourth week and at the end of the fifth week, before the threshold tests began.
POMS subscaleNormal training load
week 1-4Heavy training load
week 5
Tension 4.5 5
Anger 0 0.5
Fatigue 3.5 6*
Depression 0 1.5
ERA 16.5 15.5
Vigour 9 8
Confusion 1.5 2*
Total mood disturbance 85.5 92.5
All values expressed as median.* Statistically significant difference (p<0.05).
22
Chapter 4
Discussion
The main findings of this study are that athletes’ training status, well-being and mood state can be
predicted by internal and external measures from the Polar Vantage V. Regression analysis of TMD
and HRR against the difference in ACLR, showed that an increase in participants ACLR leads to
increasing TMD which could indicate an inferior mood and well-being. A higher ACLR led to an
improved HRR, indicating a more rapid recovery. This is despite the fact that proper assumptions
are difficult to make with such a low number of participants.
4.1 Internal and external measurements vs physiological
measurements
Participants ACLR increased with an average of 0.3 during the overload training week. However, the
significantly increased training load did not result in a negative response. Instead, the training load
during the overload training week resulted in physiological and psychological responses associated
to a so called “sweet spot” (see Figure 1.1) in training load. Studies have shown that when athletes
are within the ratio of 0.8 to 1.3, they improve/perform better and have a reduced risk of injury
(Gabbett, 2016; Gabbett et al., 2016; Hulin et al., 2016). All participants except one were within
this ratio. Heart-rate recovery improved with increasing ACLR and training amount. It is suggested
that HRR improves with increasing amount of training and remains unchanged when there is no
change in training amount (Daanen et al., 2012). Heart-rate recovery is characterized by an increase
in parasympathetic activity leading to a decrease in sympathetic nervous activity (Halson, 2014).
Heart-rate recovery is often used as a way of monitoring accumulation of fatigue in athletes, where
60’s post exercise is the most commonly used method (Daanen et al., 2012), which was implemented
23

in the present study. Lactate levels from the threshold test tended to decrease by the overload week,
although not significantly. This tendency could be interpreted as improved running efficiency and
aerobic capacity. Urhausen and coworkers has stated that lactate accumulation is a measurement of
high level of stress and increased risk of overtraining (Urhausen, Gabriel & Kindermann, 1995). In
present study lowered lactate levels following overload training could also be a result of a familiar-
ization process that might have occurred. However, the participants in the present study were used
with treadmill running. Nevertheless, is of great importance that a familiarization test is conducted
and that it is equal to the test that will be conducted in the study (Currell & Jeukendrup, 2008). As
only one familiarization test was performed in the present study it cannot be ruled out that this was
insufficient. In agreement with a tendency of improved lactate response during submaximal running
at test following the overload training almost all participants performed better at the VO2max test
and prolonged their time to exhaustion at same occasion of the test. All in all, these results indicate
a general improvement in the overall performance. Several studies have used the TTE (Buchheit
et al., 2010; Kiviniemi et al., 2010; Vesterinen et al., 2013) as a method to measure the athlete’s
ability to perform, especially in trained individuals who often have a leveling off effect in VO2 be-
fore they reach exhaustion. This shows their ability to perform and maintain the intensity even
though oxygen uptake does not increase as their performance does (e.g. reaching further during an
incremental treadmill test). This is making TTE a good measure of performance. Increasing ACLR
led to participants reaching the “sweet spot”, which might have boosted the performance of the
participants despite their overload week. However, a pure performance test such as a cooper test,
would have been preferable to the TTE test, because of its higher reliability (Laursen et al., 2007).
The participants HRV did not significantly change during the heavy training load, a tendency to-
wards lower indices could be seen. Studies which have followed athletes during a season or longer
have seen that HRV decreases with increased training amount, especially when the acute load ex-
ceeds the chronic load, and the athlete does not have the tolerance for the increased amount of
training (Buchheit, 2014; Sekiguchi et al., 2018; Vesterinen et al., 2013). Because of the athletes
inability to manage the training load and predict any accumulation of fatigue, this could lead to
an inferior training adaptation with an athlete not feeling optimally recovered (Maheshwari et al.,
2016). The fact that only a lower tendency in the participants’ HRV could be observed may be
due to the fact that they were not over trained but only experienced symptoms of fatigue and not
exhaustion or non-functional overreaching (NFOR), as discussed later. The time span could have
been a reason that the participants did not reach overtraining as well. Buchheit (2014) explains,
that it is a well-known fact that HRV changes throughout a training season, with increasing indices
24
when acute training load are low and decreasing when training load is high. Sekiguchi et al (2018)
found that a higher ACLR was related to reduced HRV throughout a training season. This is in
agreement with the present study, although no significant changes were detected we could see a trend
towards a reduced HRV with an increased ACLR. A common misconception is that HRV and fitness
has a linear relationship, when there is in fact a bell-shaped relationship in highly trained athletes
(Buchheit, 2014; Plews et al., 2013), this mean that the vagal tone indices of HRV are reduced. An
athletes HRV can decrease despite increasing performance level. This makes it more challenging
to use HRV when monitoring training adaptations and recovery from a highly trained population
(Buchheit, 2014; Plews et al., 2013).
Running index did not change significantly, a small tendency towards a higher running index was
noticed. This could indicate a better training status in the participants, although only three of the
six participants increased their running index, two decreased and one remained the same (see Figure
3.5). Therefore, it is hard to make any assumptions in this matter. Running index is used to track
performance, it takes into consideration both external (speed) and internal load measures (HR), and
is a valid and cost-efficient tool to find deviations in a runners performance (Vesterinen et al., 2014).
Deviations in running performance is present when overtraining and NFOR is present. In the current
study, the participants did not experience symptoms of overtraining or NFOR. Therefore, making
it hard to find any deviations in their running performance. If the participants would have had a
longer time span with heavy training and a clearer standardization around the training scheme, it
would have probably shown a different result in their running index.
The Bland-Altman plots show that all values are within the levels of agreement. The Bland-Altman
scatterplot is a method to analyze how accurate a test is compared to a true mean. In this case the
true mean were the participants VO2max from maximal oxygen uptake test together with estimated
VO2max or running index. This was later compared to the differences between the two values, actual
VO2max and estimated value from the Polar vantage V. Although all values where within levels of
agreement it is hard to make any assumptions because of the large spread in the values and the low
number of subjects.
25
4.2 Internal and external measurements vs psychological
measurements
The regression analyses showed that a higher ACLR was related to an inferior mood state and
well-being. Fatigue increased for all participants, showing that the significantly higher training load
made the participants more tired and bushed. The subscales of fatigue and confusion increased
during the fifth week, showing more fatigued participants, likely due to the higher training load.
Although no significant changes occurred in TMD, a trend towards a decreased mood state could
be seen. Interestingly, the depression subscale was unresponsive throughout the training weeks.
Depression is one out of many symptoms of overtraining syndrome (Armstrong & VanHeest, 2002).
These results point towards the fact that the participants were not having symptoms of overtraining
syndrome, but instead the lighter symptoms of being fatigued and worn out. This could be seen in
the confusion subscale as well as the fatigue subscale. Fatigued athletes often have problems with
concentration and cognition as well as impaired psychomotor speed. Together these symptoms can
be used as early markers of overtraining syndrome as well as a marker of functional overreaching
(Nederhof, Lemmink, Visscher, Meeusen & Mulder, 2006).
These findings provide support that subjective measurements with POMS, especially in the subscales
of fatigue and confusion, could reflect the acute training related changes that occurred during the
week with heavy training load and that were also observable by the watch with the ACLR. Acute
increases in training load have been shown to consistently impair well-being in athletes and vice
versa with a reduction in acute training load (Saw et al., 2016).
No significant changes were noted in perceived exertion with BORG-RPE scale between the threshold
tests. As discussed before, this could have been because the athletes did not show any symptoms
of overtraining but only symptoms of fatigue. A risk with using BORG-RPE scale is that some
people want to estimate their perceived exertion lower than it actually is. This is true especially for
males and elite-athletes. Chen et al (2002) found that the validity of BORG may not be as high as
previously thought especially with males under certain conditions during submaximal exercise, were
it showed a lower correlation with their lactate values, but a higher correlation when they maximal
exerted themselves. This could be that the participants want to rate their perceived exertion lower
than it actually is.
26
4.3 Ethical and Social reflection
When an external partner is involved in a scientific study, Polar in present study. There is always a
risk of conflict in interests. This has been avoided by a great transparency towards all the results,
no matter their outcome. It has also been important to emphasize on the value gained for all
involved (study participants, society and the external partner) by creating greater knowledge about
the reliability of the HRM-watches. When recruiting participants to the present study, we used
both direct recruiting as well as contact with different clubs and associations around Umea. This
may cause a problem in regard to generalizability, since the recruiting becomes targeted and not all
have the chance to apply. It also becomes a problem when thinking of practical application after
the study. Because we targeted people who train more than four hours a week, but we recruited
people who train more than six hours a week e.g. people that are on the verge of elite-athletes,
the generalizability is only directed at these athletes. This complicates the generalizability of this
studies results for a larger population.
4.4 Methodological reflection
Standardization of factors that influence HR is also influencing HRR and is therefore of great
importance to take into consideration when using HRR as a measurement of recovery and training
status of an athlete (Halson, 2014). In the present study standardization of these factors was not
done properly, therefore the improvement in HRR could be misleading. Participants were given
instructions not to drink coffee one hour prior to the test and not to train the day before. Examples
of parameters that could have been standardized and thus improved the study are e.g. hydration,
dehydration, the amount of sleep they had the previous nights (Achten & Jeukendrup, 2003).
Time to exhaustion was considered as a measurement of performance for the participants, this
was done during the maximal oxygen uptake test were the subjects ran on the treadmill as far as
they could. According to Laursen et al (2007) a better way to measure performance is with a time
trial test, e.g. a cooper test, where you run 3000 meters as fast as you can or run as far as you can
for 12 minutes. It would likewise have been interesting to see how well the estimations from the
running index derived from the watch match up with the participants actual time on a real event
cooper test. In future research this is highly recommended to be implemented.
In the present study the participants could obtain any information of their performance that was
shown on the machines monitor. Furthermore, they had the chance to see and hear clues about
27
the test from the surrounding staff. There is a risk when the subjects get this information, that
they don’t push themselves as hard as they could have, or a risk that they maintain that extra
second in order to push their limit. Ideally the researcher should be careful with giving information
and clues about the test, no feedback should be given until the last trial is completed (Currell &
Jeukendrup, 2008). The participants had a familiarization test performed on the treadmill, how-
ever without the head mask or the use of the oxygen uptake machine. In future design this should
be done. Verbal encouragement was kept to a minimum during the threshold test, accordingly to
the recommendations of Currell and Jeukendrup (2008), but during the maximal oxygen uptake
tests the encouragement was set to motivate and push the participant. Examples of encouraging
words were “good job”, “you look strong”, “nice focus”. The increasement of the treadmill during
the maximal oxygen uptake test was set to 1 degree every minute. In case this elevation was in
fact too tough for the participants, it would have led to leg muscles giving up prior to the partic-
ipants reaching its ventilatory threshold. This would change the limiting factor from the actually
addressed central cardiovascular system (Powers & Howley, 2007), to the muscles in the legs. As a
higher elevation puts a higher demand on the muscles in the legs than on the cardiovascular system,
an exaggerated increase in angle could lead to reaching a VO2 plateau too early. Many of the par-
ticipants mentioned this after the test when asked what gave up first, almost all of them said the legs.
No significant differences were noted in HIW, this could have been one of the main reasons why
the participants could stay clear from overtraining symptoms even though they were asked to in-
crease their training load the fifth week. Although, some participants increased their HIW and some
did in fact decrease their HIW. Recommendations on the increased training load was given to the
subjects, unfortunately these recommendations were not clear enough. This led to most of them
only increasing their actual training time, instead of increasing both HIW and LIW. A significant
increase was seen in LIW as well as in measured time spent training. As stated above, a higher
increase in HIW could have led to the participants having more symptoms of fatigue and overtrain-
ing. It would probably raise the ACLR in the watch, which in this present study did not exceed
the ratio of 1.3, indicating that the participants still are in a developmental phase. With a better
and more individualized increase in their training load, the ACLR would most likely raise above 1.5
indicating overtraining and risk of injury. This would probably have led to different results in both
the physiological and psychological tests. Therefore, a clearer information on what heavy training
week meant would have been of major importance. This issue once again highlights the difficulty in
communicating work load.
28
Chapter 5
Conclusion
The present study is one of the first of its kind to have examined the relationship between POMS and
ACLR. The results showed that with an increasing ACLR the mood states and well-being decreased.
However, the power of the present exploratory study was low due to a low number of included par-
ticipants, which provides a severe obstacle towards drawing any general conclusions. Based on the
result of the present study it can however be concluded that training status, well-being and present
mood state can be predicted fairly good with the internal and external measurements from the
Polar Vantage V. Of great importance was also the HRM-watches ability to correctly predict the
participants development phases through ACLR measurements and the HRR. This information is in-
dicating the recovery and training status of the athlete which in turn is an indicator of improvement.
Future research should be directed towards:
• Examine if aerobic capacity gets better when using an HRM-watch. This should be tested
and examined with a larger number of participants (20-30) and for a longer time span (8-
10 weeks). One relevant study design would concern one group that trains according to the
recommendations from the watch and another group trains long a laid-back training schedule
of a training expert.
• Further examine the relationship between self-assessed mood with POMS and the acute:
chronic load ratio. Examine the relationship between over trained subjects (ACLR above
1.6) and self-assessments with POMS.
29
Chapter 6
Practical Application
The practical application for the present study is that it seems likely that the Polar Vantage V
estimates valid information about training status and well-being based on internal and external
measurements. It is of great importance for the target group of HRM-watches to know that they
are reliable providing trustworthy information that is comparable to tests from a sports laboratory.
The information given is of great importance for people who train on a higher level as well as for
practitioners and trainers helping athletes. The major benefit is the support they get from the watch
to monitor and plan their training on a day to day basis and be able to follow their own or their
athletes training status.
30
Chapter 7
References
Achten, J., & Jeukendrup, A. E. (2003). Heart
rate monitoring. Sports medicine, 33(7), 517-538.
Banister, E. W., & Calvert, T. W. (1980). Plan-
ning for future performance: implications for long
term training. Canadian journal of applied sport
sciences. Journal canadien des sciences appliquees
au sport, 5(3), 170-176.
Blanch, P., & Gabbett, T. J. (2016). Has the
athlete trained enough to return to play safely?
The acute: chronic workload ratio permits clin-
icians to quantify a player’s risk of subsequent
injury. Br J Sports Med, 50(8), 471-475.
Borg, G. (1970). Perceived exertion as an indi-
cator of somatic stress. Scand j rehabil med, 2,
92-98.
Buchheit, M., Chivot, A., Parouty, J., Mercier,
D., Al Haddad, H., Laursen, P. B., & Ahmaidi,
S. (2010). Monitoring endurance running perfor-
mance using cardiac parasympathetic function.
European journal of applied physiology, 108(6),
1153-1167.
Buchheit, M. (2014). Monitoring training status
with HR measures: do all roads lead to Rome?.
Frontiers in physiology, 5, 73.
Chen, M. J., Fan, X., & Moe, S. T. (2002).
Criterion-related validity of the Borg ratings of
perceived exertion scale in healthy individuals: a
meta-analysis. Journal of sports sciences, 20(11),
873-899.
Currell, K., & Jeukendrup, A. E. (2008). Validity,
reliability and sensitivity of measures of sporting
performance. Sports medicine, 38(4), 297–316.
Daanen, H. A., Lamberts, R. P., Kallen, V. L., Jin,
A., & Van Meeteren, N. L. (2012). A systematic
review on heart-rate recovery to monitor changes
in training status in athletes. International jour-
nal of sports physiology and performance, 7(3),
251-260.
31
Dong, J. G. (2016). The role of heart rate vari-
ability in sports physiology. Experimental and
therapeutic medicine, 11(5), 1531–1536.
Gabbett, T. J. (2016). The training—injury
prevention paradox: should athletes be training
smarter and harder?. Br J Sports Med, 50(5),
273-280.
Gabbett, T. J., Hulin, B. T., Blanch, P., & White-
ley, R. (2016). High training workloads alone do
not cause sports injuries: how you get there is the
real issue. Br J Sports Med 2016;50:444-5
Carter, J. B., Banister, E. W., & Blaber, A. P.
(2003). Effect of endurance exercise on autonomic
control of heart rate. Sports medicine, 33(1), 33-
46.
Georgiou, K., Larentzakis, A. V., Khamis, N.
N., Alsuhaibani, G. I., Alaska, Y. A., & Giallafos,
E. J. (2018). Can Wearable Devices Accurately
Measure Heart Rate Variability? A Systematic
Review. Folia medica, 60(1), 7-20.
Hautala, A. J., Makikallio, T. H., Kiviniemi, A.,
Laukkanen, R. T., Nissila, S., Huikuri, H. V., &
Tulppo, M. P. (2003). Cardiovascular autonomic
function correlates with the response to aerobic
training in healthy sedentary subjects. Ameri-
can Journal of Physiology-Heart and Circulatory
Physiology, 285(4), H1747-H1752.
Hedelin, R., Bjerle, P., & Henriksson-larsEn, K.
(2001). Heart rate variability in athletes: rela-
tionship with central and peripheral performance.
Medicine and science in sports and exercise, 33(8),
1394-1398.
Hopkins, W. G. (2000). Measures of reliability
in sports medicine and science. Sports medicine,
30(1), 1-15.
Hulin, B. T., Gabbett, T. J., Blanch, P., Chapman,
P., Bailey, D., & Orchard, J. W. (2014). Spikes in
acute workload are associated with increased in-
jury risk in elite cricket fast bowlers. Br J Sports
Med, 48(8), 708-712.
Kellmann, M. (2010). Preventing overtrain-
ing in athletes in high-intensity sports and
stress/recovery monitoring. Scandinavian jour-
nal of medicine & science in sports, 20, 95-102.
Kiss, O., Sydo, N., Vargha, P., Vago, H., Cz-
imbalmos, C., Edes, E., ... & Becker, D. (2016).
Detailed heart rate variability analysis in athletes.
Clinical Autonomic Research, 26(4), 245-252.
Kiviniemi, A. M., Hautala, A. J., Kinnunen, H., &
Tulppo, M. P. (2007). Endurance training guided
individually by daily heart rate variability mea-
surements. European journal of applied physiol-
ogy, 101(6), 743-751.
Kiviniemi, A. M., Hautala, A. J., Kinnunen, H.,
Nissila, J., Virtanen, P., Karjalainen, J., & Tulppo,
M. P. (2010). Daily exercise prescription on the
basis of HR variability among men and women.
Medicine and science in sports and exercise, 42(7),
1355-1363.
Lambert, M. I., Mbambo, Z. H., & Gibson, A.
S. C. (1998). Heart rate during training and com-
32
petition for long distance running. Journal of
sports sciences, 16(sup1), 85-90.
Lamberts, R. P., Rietjens, G. J., Tijdink, H. H.,
Noakes, T. D., & Lambert, M. I. (2010). Mea-
suring submaximal performance parameters to
monitor fatigue and predict cycling performance:
a case study of a world-class cyclo-cross cyclist.
European journal of applied physiology, 108(1),
183-190.
Laursen, P. B., Francis, G. T., Abbiss, C. R.,
Newton, M. J., & Nosaka, K. (2007). Reliabil-
ity of time-to-exhaustion versus time-trial running
tests in runners. Medicine and science in sports
and exercise, 39(8), 1374-1379.
Mazzeo, R. S. (1991). Catecholamine responses
to acute and chronic exercise. Medicine and Sci-
ence in Sports and Exercise, 23(7), 839-845.
Maheshwari, A., Norby, F. L., Soliman, E. Z.,
Adabag, S., Whitsel, E. A., Alonso, A., & Chen,
L. Y. (2016). Low heart rate variability in a 2-
minute electrocardiogram recording is associated
with an increased risk of sudden cardiac death in
the general population: the atherosclerosis risk in
communities study. PloS one, 11(8), e0161648.
McNair P, Lorr M, Droppleman L. (1981). POMS
manual. 2nd edn. San Diego, CA: Education and
Industrial Testing Service.
Nederhof, E., Lemmink, K. A., Visscher, C.,
Meeusen, R., & Mulder, T. (2006). Psychomo-
tor speed. Sports medicine, 36(10), 817-82
Saw, A. E., Main, L. C., & Gastin, P. B. (2016).
Monitoring the athlete training response: subjec-
tive self-reported measures trump commonly used
objective measures: a systematic review. Br J
Sports Med, 50(5), 281–291.
Shacham, S. (1983). A shortened version of the
Profile of Mood States. Journal of personality as-
sessment, 47(3), 305-306.
Shetler, K., Marcus, R., Froelicher, V. F., Vora, S.,
Kalisetti, D., Prakash, M., ... & Myers, J. (2001).
Heart rate recovery: validation and methodologic
issues. Journal of the American College of Cardi-
ology, 38(7), 1980-1987.
Singh, N., Moneghetti, K. J., Christle, J. W.,
Hadley, D., Froelicher, V., & Plews, D. (2018).
Heart Rate Variability: An Old Metric with New
Meaning in the Era of Using mHealth technologies
for Health and Exercise Training Guidance. Part
One: Physiology and Methods. Arrhythmia &
electrophysiology review, 7(3), 193-198.
Sekiguchi, Y., Huggins, R. A., Curtis, R. M., Ben-
jamin, C. L., Adams, W. M., Looney, D. P., ... &
Casa, D. J. (2018). Relationship Between Heart
Rate Variability and Acute: Chronic Load Ratio
Throughout a Season in NCAA D1 Men’s Soccer
Players. Journal of strength and conditioning re-
search.
Soligard, T., Schwellnus, M., Alonso, J. M., Bahr,
R., Clarsen, B., Dijkstra, H. P., ... & Van Rens-
burg, C. J. (2016). How much is too much?(Part
1) International Olympic Committee consensus
statement on load in sport and risk of injury. Br
33
J Sports Med, 50(17), 1030-1041.
Plews, D. J., Laursen, P. B., Stanley, J., Kilding,
A. E., & Buchheit, M. (2013). Training adapta-
tion and heart rate variability in elite endurance
athletes: opening the door to effective monitoring.
Sports medicine, 43(9), 773-781.
Polar support (2019) The what and how
of orthostatic test. Retrieved 2019-02-13/
from https://support.polar.com/en/support /the-
whatandhowoforthostatictest
Polar support (2019) The what and how of
Running Index. Retrieved 2019-03-04/from
https://support.polar.com/en/support/tips /Run-
ningIndex
Powers, S. K., Howley, E. T. (2007). Exercise
Physiology (6th ed). New York: McGraw Hill.
Prinsloo, G. E., Rauch, H. L., & Derman, W.
E. (2014). A brief review and clinical application
of heart rate variability biofeedback in sports, ex-
ercise, and rehabilitation medicine. The Physician
and sportsmedicine, 42(2), 88–99.
Urhausen, A., Gabriel, H., & Kindermann, W.
(1995). Blood hormones as markers of training
stress and overtraining. Sports medicine, 20(4),
251–276.
Vesterinen, V., Hokka, L., Hynynen, E., Mikkola,
J., Hakkinen, K., & Nummela, A. (2014). Heart
rate-running speed index may be an efficient
method of monitoring endurance training adap-
tation. The Journal of Strength & Conditioning
Research, 28(4), 902-908.
Vesterinen, V., Hakkinen, K., Hynynen, E.,
Mikkola, J., Hokka, L., & Nummela, A. (2013).
Heart rate variability in prediction of individ-
ual adaptation to endurance training in recre-
ational endurance runners. Scandinavian journal
of medicine & science in sports, 23(2), 171–180.
34

35
Chapter 8
Appendices
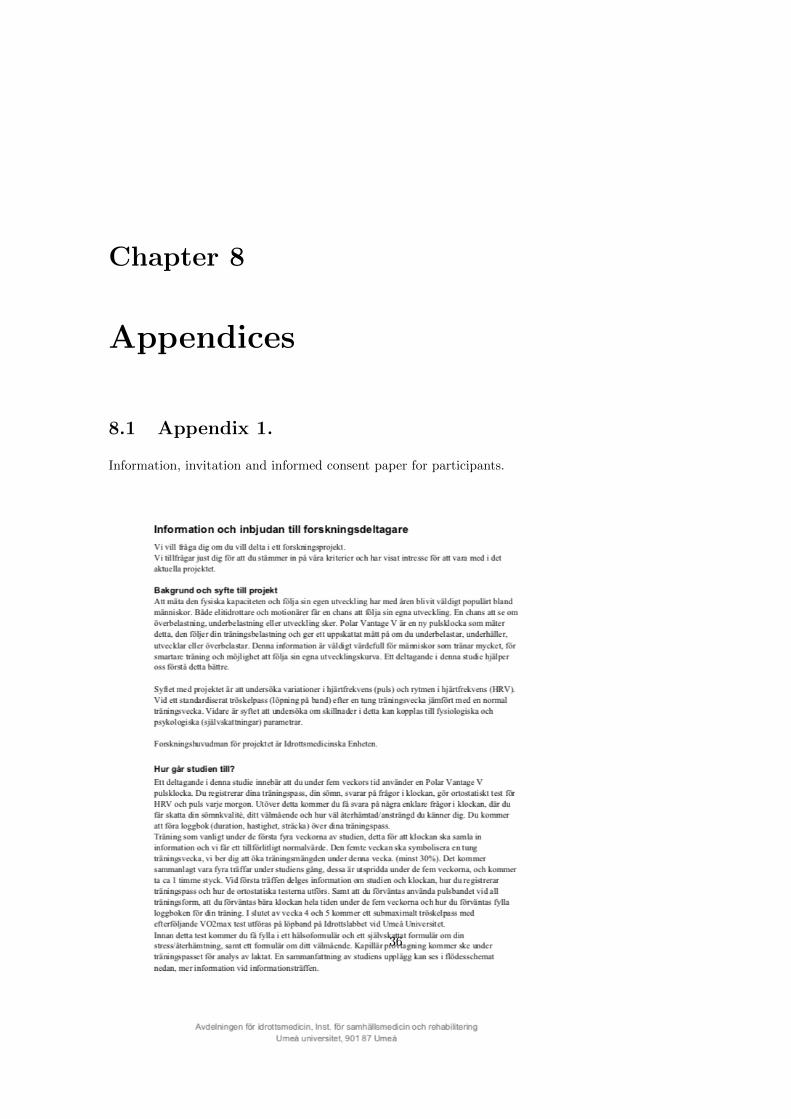
8.1 Appendix 1.
Information, invitation and informed consent paper for participants.
36
37
38
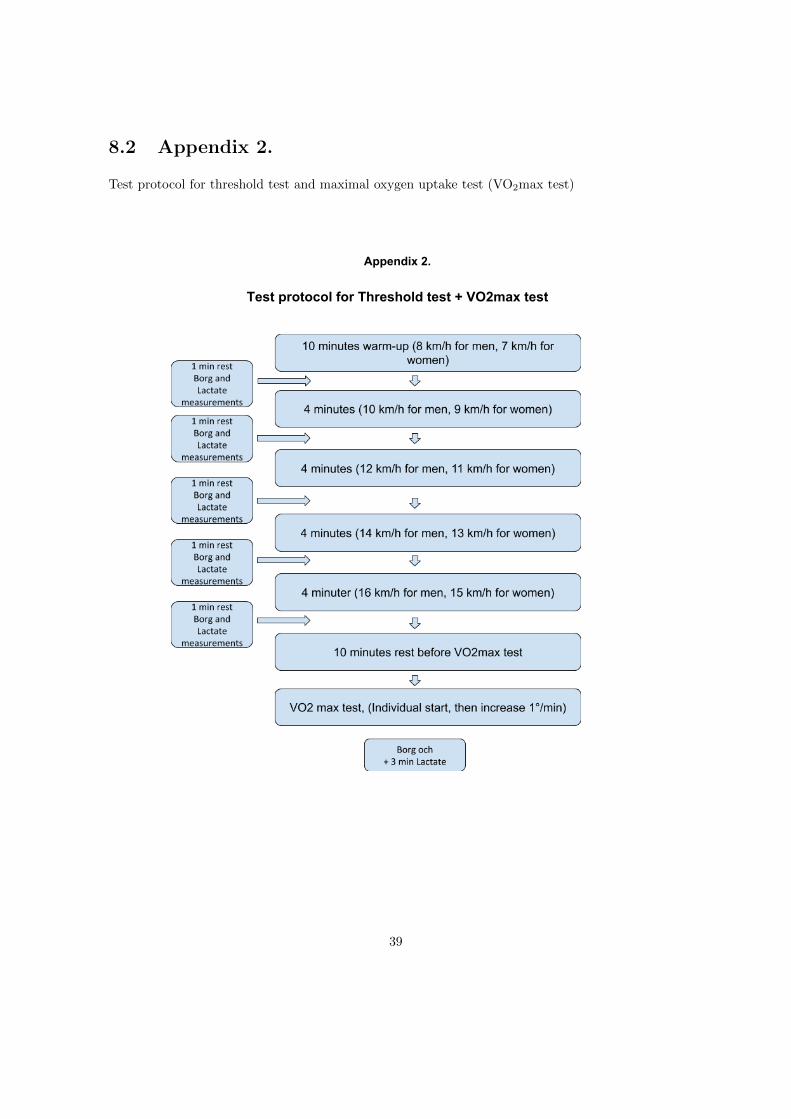
8.2 Appendix 2.
Test protocol for threshold test and maximal oxygen uptake test (VO2max test)
Appendix 2.
Test protocol for Threshold test + VO2max test
39

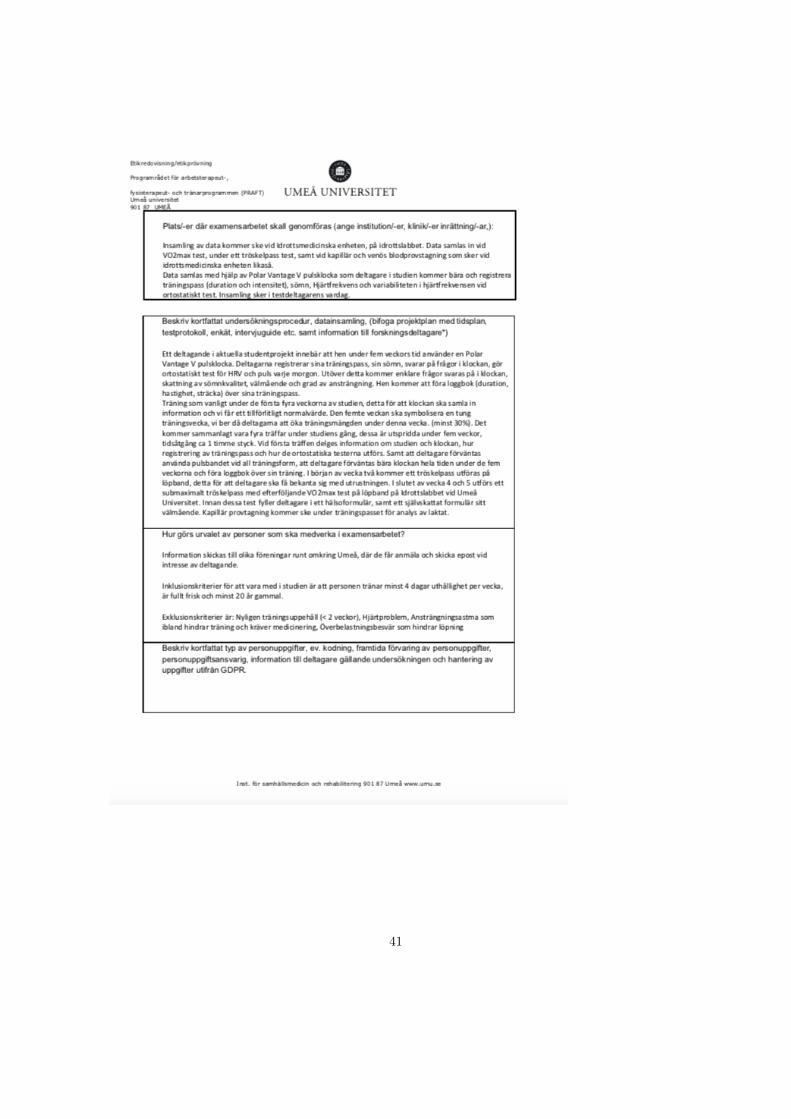
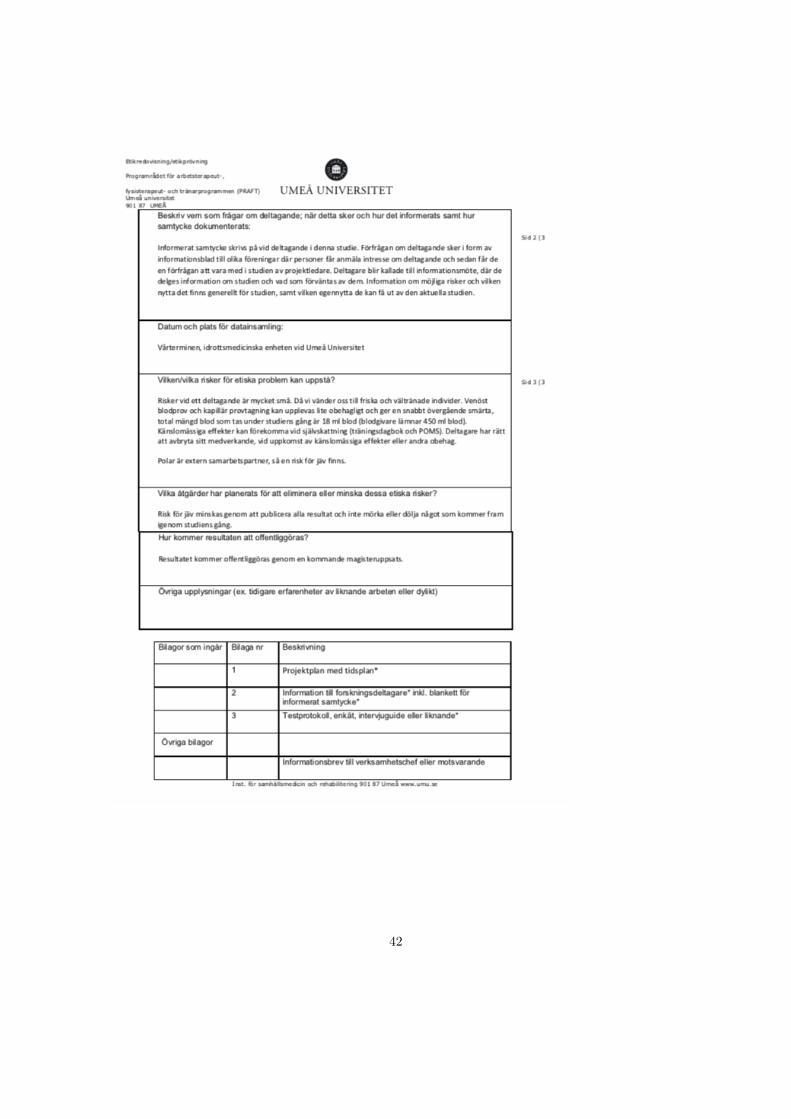
8.3 Appendix 3.
Ethics application
40
41
42
43
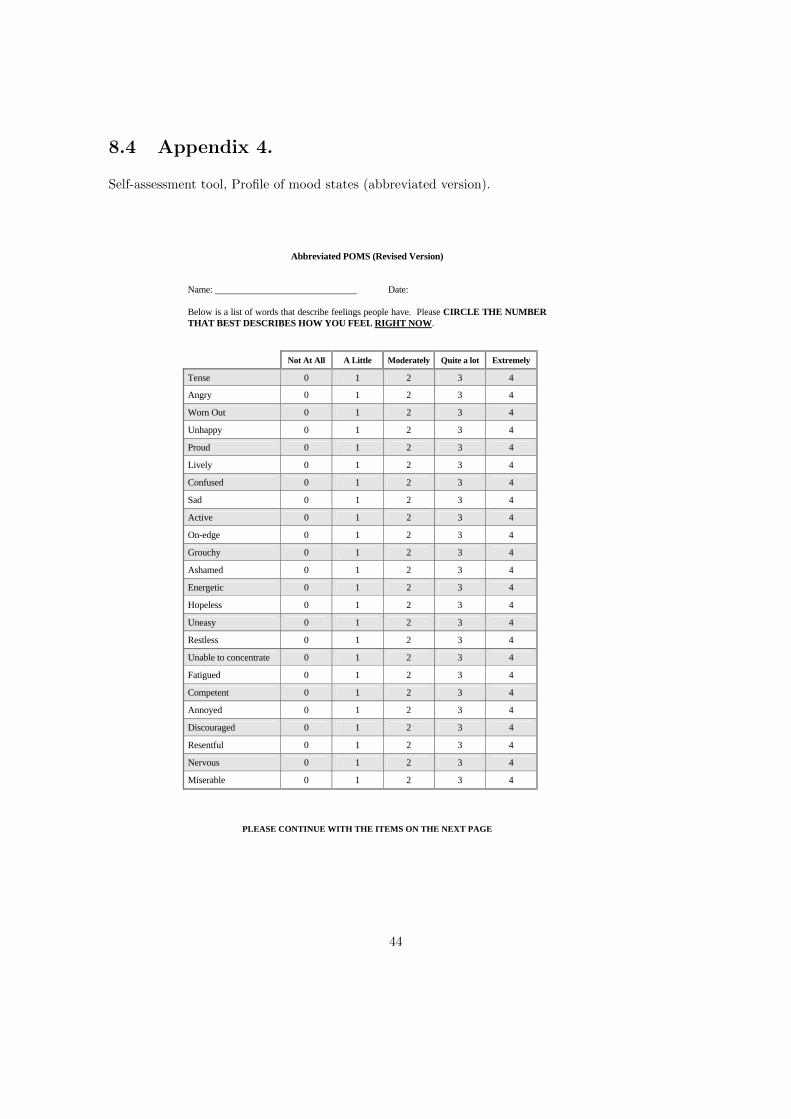
8.4 Appendix 4.
Self-assessment tool, Profile of mood states (abbreviated version).
PLEASE CONTINUE WITH THE ITEMS ON THE NEXT PAGE
Abbreviated POMS (Revised Version) Name: Date: Below is a list of words that describe feelings people have. Please CIRCLE THE NUMBER THAT BEST DESCRIBES HOW YOU FEEL RIGHT NOW. Not At All A Little Moderately Quite a lot Extremely
Tense 0 1 2 3 4
Angry 0 1 2 3 4
Worn Out 0 1 2 3 4
Unhappy 0 1 2 3 4
Proud 0 1 2 3 4
Lively 0 1 2 3 4
Confused 0 1 2 3 4
Sad 0 1 2 3 4
Active 0 1 2 3 4
On-edge 0 1 2 3 4
Grouchy 0 1 2 3 4
Ashamed 0 1 2 3 4
Energetic 0 1 2 3 4
Hopeless 0 1 2 3 4
Uneasy 0 1 2 3 4
Restless 0 1 2 3 4
Unable to concentrate 0 1 2 3 4
Fatigued 0 1 2 3 4
Competent 0 1 2 3 4
Annoyed 0 1 2 3 4
Discouraged 0 1 2 3 4
Resentful 0 1 2 3 4
Nervous 0 1 2 3 4
Miserable 0 1 2 3 4
44

45
46

47
Copyright © 2022 FDOKUMEN