Can Exposure to Celebrities Reduce Prejudice? The Effect of ...
85
Working Paper Series IPL working papers are circulated for discussion and comment purposes. They have not been formally peer reviewed. © 2019 by Ala’ Alrababa’h, William Marble, Salma Mousa, and Alexandra Siegel. All rights reserved. Working Paper No. 19-04 Ala’ Alrababa’h, William Marble, Salma Mousa, and Alexandra Siegel Can Exposure to Celebrities Reduce Prejudice? The Effect of Mohamed Salah On Islamophobic Behaviors and Attitudes
-
Upload
khangminh22 -
Category
Documents
-
view
2 -
download
0
Transcript of Can Exposure to Celebrities Reduce Prejudice? The Effect of ...

Working Paper Series
IPL working papers are circulated for discussion and comment purposes. They have not been formally peer reviewed. © 2019 by Ala’ Alrababa’h, William Marble, Salma Mousa, and Alexandra Siegel.
All rights reserved.
Working Paper No. 19-04
Ala’ Alrababa’h, William Marble, Salma Mousa, and Alexandra Siegel
Can Exposure to Celebrities Reduce Prejudice? The Effect of Mohamed Salah On Islamophobic Behaviors and Attitudes

Can Exposure to Celebrities Reduce Prejudice?*The Effect of Mohamed Salah on Islamophobic Behaviors and Attitudes
Ala’ Alrababa’h,1,2,a William Marble,1 Salma Mousa,1,2 Alexandra Siegel2,3
1 Department of Political Science, Stanford University2 Immigration Policy Lab, Stanford University and ETH Zurich
3 Department of Political Science, University of Colorado Bouldera Corresponding author: [email protected]
Initial Draft: May 2019This Draft: January 2021
Abstract
Can exposure to celebrities from a stigmatized group reduce prejudice toward that group writlarge? We estimate the causal effect of Mohammed Salah—a visibly Muslim soccer player—joining Liverpool Football Club on Islamophobia, using hate crime reports throughout England,15million tweets fromBritish soccer fans, and a survey experiment of Liverpool F.C. fans. We findthat hate crimes in Merseyside (home to Liverpool F.C.) dropped by 16% compared to a syntheticcontrol, and Liverpool F.C. fans halved their rates of posting anti-Muslim tweets relative to fans ofother top-flight clubs. Our survey experiment suggests that the salience of Salah’s Muslim identityenabled positive feelings toward Salah to generalize to Muslims more broadly. Providing real-world behavioral measures of prejudice reduction and experimental evidence from a naturalisticsetting, our findings provide support for the parasocial contact hypothesis, indicating that positiveexposure to outgroup celebrities can reduce prejudice.
Keywords: prejudice, migration, intergroup contact, hate crimes
Word count: 10,355
*For helpful feedback, we thank Vincent Bauer, Lisa Blaydes, Andrew Brooks, Jens Hainmueller,Niklas Harder, David Laitin, Hans Lueders, Rachel Myrick, Christiana Parreira, James Tozer, MatthewTyler, Elisabeth van Lieshout, JeremyWeinstein, ScottWilliamson, and participants at the ImmigrationPolicy Lab. Thanks also to Toby Nowacki for replicating our empirical analyses. This project wasgenerously funded by the Institute for Research in the Social Sciences (IRiSS) at Stanford Universityand by the Immigration Policy Lab (IPL). We also thank Yiqing Xu and Licheng Lui for advice on thegsynth package. We are grateful to YouGov for sharing data.

In February 2018, fans of one of England’s most storied soccer clubs, Liverpool F.C., celebrated
a decisive victory in soccer’s most elite league. A 5 - 0 win over F.C. Porto in the UEFA Champions
League previewed an excellent season that saw Liverpool F.C. advance to the final. Mohamed Salah,
a young Egyptian striker, was key to the club’s success. After the victory, fans chanted:
If he scores another fewThen I’ll be Muslim, too.If he’s good enough for you,He’s good enough for me.Sitting in a mosque,That’s where I wanna be.
Fans created more homespun chants as Liverpool F.C. continued their successful season:
Mohamed SalahA gift from Allah.He’s always scoring,It’s almost boring.So please don’t takeMohamed away.
In the first three seasons that Salah played for Liverpool F.C., the club had been extraordinarily suc-
cessful, appearing in consecutive Champions League finals and taking the title in 2019. The club was
similarly successful in the domestic league, winning the English Premier League for the first time in
club history in 2020, with Salah being crowned the league’s top goal-scorer two years in a row.
Salah is noteworthy not only for his skill on the soccer field, but also for his conspicuous Islamic
identity — arguably unprecedented at the elite level of global soccer Salah occupies. European fans
were not accustomed to seeing players prostrate in Muslim prayer (sujood) after scoring goals, for
example, fueling media speculation that the centrality of Salah’s Muslim identity to his public image
might be reducing Islamophobia among fans (The National, 2018; Thomas, 2018).1 Some pundits
argued that Salah portrayed “favorable images of Muslims, helping to reduce stereotypes and break1We adopt a relatively expansive definition of Islamophobia: fear, hatred, or dislike of Islam or
Muslims, as well as anti-Muslim prejudicial attitudes or behaviors more generally (Sheridan, 2006).
1

down barriers within communities” (Monks, 2018). Others disagreed. Despite the fact that “everyone
loves a winner,” there was still no systematic evidence that Salah’s fame could “in any way decrease
the mainstream Islamophobia in British culture” (Al-Sayyad, 2018). Beyond anecdotes, little is known
about whether Salah has had a systematic impact on Islamophobia.
The possibility that exposure to Salah may reduce Islamophobia represents an instance of the
parasocial contact hypothesis (Schiappa, Gregg and Hewes, 2005) — the idea that mediated contact
with celebrities or characters from minority groups has the potential to reduce prejudice toward that
group as a whole. This proposed extension to Allport’s (1954) classic contact hypothesis has received
support in a plethora of observational studies, laboratory- and survey-based experiments, but not real-
world settings with causal purchase. In this paper, we provide a real-world test of the parasocial contact
hypothesis. We test the proposition that Salah’s meteoric rise has reduced anti-Muslim attitudes and
behaviors among Liverpool F.C. fans. We test this hypothesis using three complementary research
designs: an analysis of hate crimes in England, an analysis of anti-Muslim tweets among UK soccer
fans, and an original survey experiment.
First, we draw on hate crime data from 25 police departments in England between 2015 and 2018.
We employ a variant of the synthetic control method to generate a counterfactual hate crime rate for
the Merseyside police force — which covers the city of Liverpool — after Salah signed. We find that
Merseyside experienced a 16% lower hate crime rate after Salah was signed relative to the expected
rate had he not been signed. Second, we analyze 15 million tweets produced by followers of prominent
soccer clubs in the English Premier League. Using the same synthetic control method as in our hate
crime analysis, we find that the proportion of anti-Muslim tweets produced by Liverpool F.C. fans after
Salah joined was about half of the expected rate had he not joined Liverpool — 3.8% versus 7.3% of
tweets related toMuslims. Finally, we implement a survey experiment among 8,060 Liverpool F.C. fans
to explicitly test how exposure to Salah might lead to generalized tolerance toward Muslims. In line
with the parasocial contact hypothesis, our results suggest that the salience of Salah’s Muslim identity
facilitates prejudice reduction toward Muslims writ large. Priming respondents with information about
Salah’s religious practices boosted the belief that Islam is compatible with British values by around
2

5 percentage points, compared to the baseline rate of 18% among the control group. These findings
suggest that positive exposure to outgroup celebrities, especially when these celebrities’ minority group
membership is highly salient, can reduce prejudice across a range of social contexts.
This “Salah effect” is likely not unique to Salah. Celebrities with rolemodel-like qualities have long
been thought to shape social attitudes. When Jackie Robinson broke baseball’s color barrier in 1947, his
“efforts were a monumental step in the civil-rights revolution in America … [His] accomplishments
allowed Black and White Americans to be more respectful and open to one another,” according to
historian Doris Kearns Goodwin (Williams and Sielski, 2004). British-Bangladeshi Nadiyah Hussain,
the headscarf-clad winner of the most watched program on British television, The Great British Bake-
Off, was credited with doing “more for British-Muslim relations than 10 years of government policy”
after her 2015 win (Wiseman, 2018). The 2018 reboot ofQueer Eye for the Straight Guy has similarly
been lauded as a “tool for helping people unlearn” homophobia (Reyes Jr., 2018).
Indeed, exposure to celebrities through mass-media is one of the most common forms of inter-
group contact, making parasocial contact an important but understudied frontier of prejudice reduction
research (Park, 2012). This study contributes to our understanding of parasocial contact in four primary
ways. First, we study naturally occurring exposure to a celebrity — rather than exposure induced in a
laboratory or survey experiment — providing strong claims to external validity. Second, we examine
an unexpected and plausibly exogeneous increase in exposure to a celebrity from a minority group,
allowing us to estimate plausible counterfactuals for the treated units. This research design gives us
causal purchase beyond what is typically attainable in observational studies on parasocial contact or
the contact hypothesis more generally, where selection bias poses a threat to inference. Third, we
study behavioral outcomes, like hate crimes and hate speech, that are of direct interest for policy. Fi-
nally, we buttress our observational results with an original survey experiment both to lend further
credence to our causal estimates, and to test the critical assumption needed for parasocial contact with
one individual to reduce prejudice toward an entire group — the salience of minority group identity.
The rest of the paper is structured as follows. In Section 1, we draw on the intergroup contact
literature to generate empirical hypotheses. Section 2 provides context on Islamophobia in the U.K.
3

Section 3 presents our analysis of English hate crime data. In Section 4, we analyze tweets produced
by Twitter followers of English Premier League clubs. Section 5 provides tests of robustness and
generalizability. Section 6 describes our original survey experiment testing the proposition that the
salience of Salah’s identity may play a key role in reducing prejudice toward Muslims more generally.
Finally, in Section 7 we interpret the results and speak to their generalizability.
1 The Parasocial Contact Hypothesis
A rich literature documents the relationship between various forms of intergroup contact and preju-
dice. The contact hypothesis posits that personal contact across social lines can reduce prejudice if that
contact is positive, endorsed by communal authorities, egalitarian, and involves cooperating to achieve
a common goal (Allport, 1954). Such contact has been found to reduce prejudice by alleviating inter-
group anxieties, inducing empathy, highlighting commonalities, and forging friendships, among other
social, emotional, and cognitive pathways (Pettigrew and Tropp, 2006; Pettigrew, 1998). Experimen-
tal evidence from myriad contexts and countries establishes the effectiveness of positive contact in
improving intergroup relations (Burns, Corno and La Ferrara, 2015; Carrell, Hoekstra and West, 2015;
Rao, 2019; Lowe, 2017; Barnhardt, 2009). Meta-analyses subsequently conclude that positive contact
“typically reduces prejudice” (Pettigrew and Tropp, 2006; Paluck, Green and Green, 2018).
While interpersonal contact presents a promising way to foster intergroup tolerance, its potential
may be limited due to a scarcity of opportunities for such contact. Residential and occupational segre-
gation, intergroup anxiety, or the small size of some minority groups can pose social, economic, and
psychological barriers to meaningful contact between minority and majority groups (Joyce and Har-
wood, 2014; Ortiz and Harwood, 2007; Enos, 2017). This has led scholars, including the father of the
contact hypothesis, to suggest that mass media may play an important role in shaping and sustaining
prejudice (Allport, 1954).
Building on this insight, Schiappa, Gregg and Hewes (2005) propose the “parasocial contact hy-
pothesis” as an analogue of the classic contact hypothesis. This hypothesis stipulates that mediated
4

contact with members of minority groups has the potential to reduce prejudice toward that group. Nu-
merous observational and experimental laboratory studies document support for the parasocial contact
hypothesis. While much of this literature has focused on the role of negative media coverage in exacer-
bating prejudice (Ramasubramanian, 2013), exposure to fictional television characters and celebrities
has been shown to reduce diverse types of prejudice including racial prejudice, religious prejudice,
prejudice based on gender or sexual orientation, and prejudice against individuals with disabilities or
mental health disorders (Park, 2012; Wong, Lookadoo and Nisbett, 2017; Abrams, McGaughey and
Haghighat, 2018; Miller et al., 2020; Bond, 2020).
Like face-to-face contact, the quality and quantity of parasocial contact determines the degree to
which it might reduce prejudice. While the conditions under which parasocial contact might be suc-
cessful have yet to be systematically tested, Schiappa, Gregg and Hewes (2005) stress that parasocial
contact should involve repeated exposure to likable and clearly identifiable members of a minority
group. Studies of traditional intergroup contact similarly highlight the importance of repeated expo-
sure (Dovidio et al., 2017), a positive portrayal of minority group members (Aberson, 2015; Barlow
et al., 2012; Paolini, Harwood and Rubin, 2010), and a salient group identity (Al Ramiah andHewstone,
2013). When these conditions are met, individuals appear to use the same cognitive processes under-
pinning prejudice reduction during parasocial contact — for example, in developing “relationships”
with television characters — as they do in real-world interpersonal contact with outgroup members
(Park, 2012).
For Liverpool F.C. fans, exposure to Salah fulfills these criteria. First, fans have sustained contact
with Salah over time. Salah is a regular starter for Liverpool F.C.’s games within the English Premier
League, which entails 38 weeks of game play every season, in addition to appearances at other domestic
and international tournaments. Off the field, Salah is active on social media and appears in high-profile
advertisements for corporations like Pepsi, Adidas, and Vodafone. Appearances at sporting events,
sports television, and commercials are all known to facilitate parasocial relationships between fans and
celebrity athletes (Brown and Basil, 1995).
Second, with Salah enjoying tremendous success at the individual, club, and national levels during
5

the period under study, Salah is portrayed positively in the media and receives a great deal of positive
attention from fans and teammates. In May 2018, he carried his club to the world’s most watched
annual sporting event, the UEFA Champions League Final, before leading the Egyptian national side
to the FIFA World Cup for the first time in three decades one month later. His remarkable breakout
season earned him a nomination for the English Premier League’s Player of the Year and the coveted
FIFA Puskás Prize for Goal of the Year, satisfying the positive exposure criterion of parasocial contact.
Finally, Salah’s Muslim identity is highly salient. His first name is recognizably Muslim, he pros-
trates in prayer after scoring a goal, and points his index finger to the sky while reciting the shahada,
the Muslim profession of faith. Die-hard fans will also know that Salah’s daughter, Makka, is named
after Islam’s most sacred site, and his veiled wife can often be seen cheering him on from the sidelines.
Salah is distinctive in this way: Europe has seen many excellent players of Muslim heritage, but most
are dissociated from Islam in the minds of fans because of their lack of public piety. By contrast, fan
chants centered on Salah refer to mosques, Muslims, and Allah while the Liverpool F.C. coach, Jür-
gen Klopp, has also pointed to Salah’s religiosity as an integral part of his identity (Bascombe, 2019).
Given that Salah meets the three hypothesized criteria for parasocial contact to reduce prejudice —
positivity, repeated exposure, and salient outgroup identity — he provides an ideal case through which
to test the parasocial contact hypothesis.
2 Context: Islamophobia in the U.K
The British Empire has historically perpetuated racism to justify the continued occupation of for-
eign territories. South Asians and Afro-Caribbeans have subsequently endured a legacy of discrimina-
tory policies and practices, including waves of skinhead violence by far-right, anti-immigrant groups.
The government passed the Race Relations Acts of 1965 and 1976, and self-reported racist attitudes
declined between the 1980s and 2001 (BBC News, 2014). However, the terrorist attacks on September
11, 2001 and July 7, 2005 re-invigorated discrimination against visible minorities, particularly Mus-
lims. Suspicion toward Muslims manifested in the behavior of the British state, media coverage of
6

Muslims, and public attitudes toward Islam. Scholars have argued that British surveillance of Muslims
following terrorist attacks was driven in large part by an irrational fear of Muslims, and “informed by
the framing of the terror threat as an Islamic threat, which casts all Muslims as potential terrorists that
need to be monitored and categorised” (Qurashi, 2018). The sweeping skepticism toward Muslims in-
grained in the British state bureaucracy was such that even Christians from Muslim-majority countries
faced additional barriers during immigration and asylum processes (Madziva, 2018).
The British media has also played a role in perpetuating a fear of Muslims and Islam. For instance,
in response to a question by the Evening Standard about the impact of Islam on life in London, a
former BBC Today program editor asserted that “Islam is masochistic, homophobic and a totalitarian
regime. It is a fascistic, bigoted and medieval religion” (Milly and Khiabany, 2010). A columnist for
The Daily Mail characterized the veil worn by some Muslim women as an “Islamist symbol which
plays a role analogous to the use of the swastika by Nazism” (Milly and Khiabany, 2010). Meanwhile,
The Daily Express published a column that stated, “Make no mistake, the proliferation of the burka-
wearing is a direct threat to the British way of life and in all too many instances is intended to be just
that” (Milly and Khiabany, 2010). A study of the print news media between 2000 and 2008 found that
36% of stories about British Muslims overall are related to terrorism, with 32% of all stories about
Muslims in 2008 centered on the religious and cultural differences between Islam and British values
(Moore, Mason and Wren Lewis, 2008). The rise of negative portrayals of Muslims in mainstream
media has been accompanied by an increase in anti-Muslim cyber bullying, cyber harassment, cyber
incitement and threats of offline violence (Awan and Zempi, 2016).
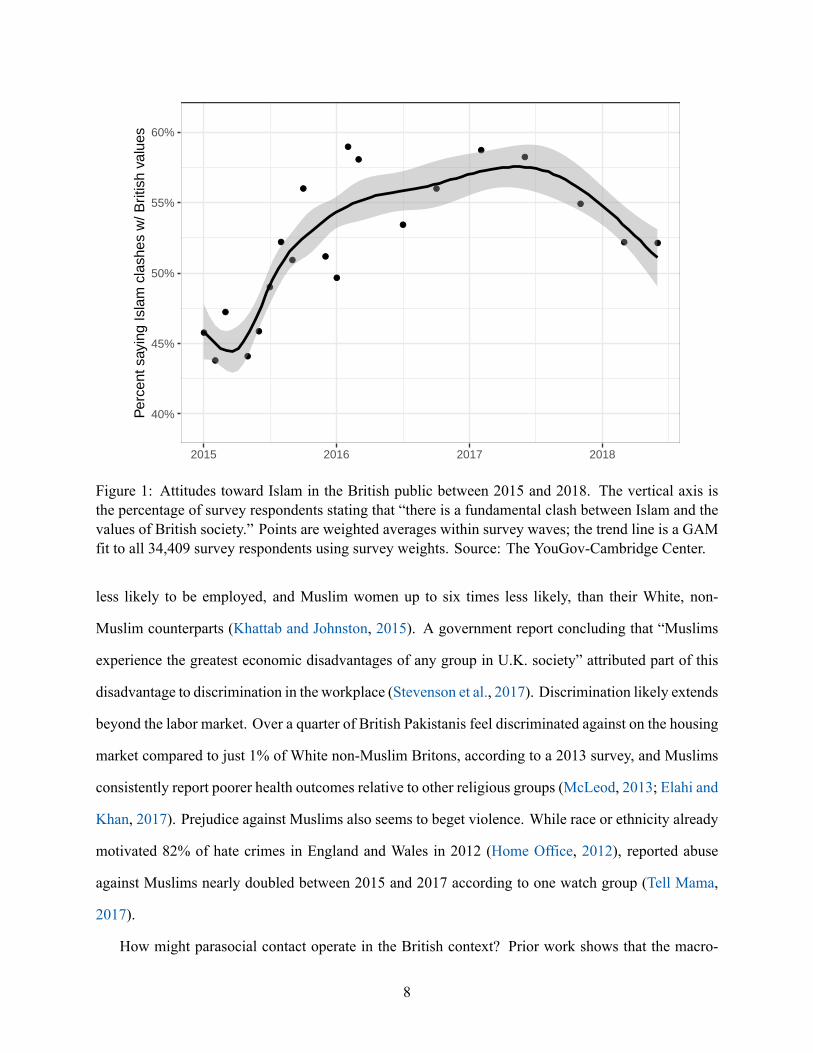
Negative attitudes toward Islam are similarly reflected in public opinion data. Figure 1 summarizes
polling data, from YouGov, that shows a steady increase in the belief that “there is a fundamental clash
between Islam and the values of British society” from 2015 to 2017. Despite a slight dip in 2017,
over half the respondents continued to affirm this sentiment in 2018, signaling a continued, strong
skepticism toward Islam in the U.K.
High levels of prejudice compound other disadvantages faced by British Muslims. Data from
the 2014 Office for National Statistics’ Labour Force survey show that Muslim men are up to 76%
7
●
●
●
●
●
●
●
●
●
●
●
●
●
●
●
●
●
●
●
●
40%
45%
50%
55%
60%
2015 2016 2017 2018
Per
cent
say
ing
Isla
m c
lash
es w
/ Brit
ish
valu
es
Figure 1: Attitudes toward Islam in the British public between 2015 and 2018. The vertical axis isthe percentage of survey respondents stating that “there is a fundamental clash between Islam and thevalues of British society.” Points are weighted averages within survey waves; the trend line is a GAMfit to all 34,409 survey respondents using survey weights. Source: The YouGov-Cambridge Center.
less likely to be employed, and Muslim women up to six times less likely, than their White, non-
Muslim counterparts (Khattab and Johnston, 2015). A government report concluding that “Muslims
experience the greatest economic disadvantages of any group in U.K. society” attributed part of this
disadvantage to discrimination in the workplace (Stevenson et al., 2017). Discrimination likely extends
beyond the labor market. Over a quarter of British Pakistanis feel discriminated against on the housing
market compared to just 1% of White non-Muslim Britons, according to a 2013 survey, and Muslims
consistently report poorer health outcomes relative to other religious groups (McLeod, 2013; Elahi and
Khan, 2017). Prejudice against Muslims also seems to beget violence. While race or ethnicity already
motivated 82% of hate crimes in England and Wales in 2012 (Home Office, 2012), reported abuse
against Muslims nearly doubled between 2015 and 2017 according to one watch group (Tell Mama,
2017).
How might parasocial contact operate in the British context? Prior work shows that the macro-
8

political environment and the tone of media coverage shape the outcomes of intergroup encounters,
but that effects are highly contextual. Hopkins (2010) finds that hostile national rhetoric, especially
when combined with local demographic change, increases individual and political hostility toward
ethnic outgroups. In contrast, Sønderskov and Thomsen (2015) show that hostile national rhetoric can
reduce prejudice among individuals with friends and coworkers from outgroups, further suggesting
differential effects of national climates on prejudice. Generating expectations as to how intergroup
contact might operate in the city of Liverpool is likely to be even more context-dependent. On the
one hand, Liverpool is less ethnically diverse than the rest of England (86.2% White vs. the national
average of 81.4%), and is located in one of the top five police jurisdictions with the highest prevalence
of hate crimes (Liverpool City Council, 2011). On the other hand, Liverpudlians have long boycotted
The Sun, one of the most influential right-wing tabloids, and therefore have more liberal attitudes on
some political issues (Foos and Bischof, 2018). Further complicating our expectations, the study period
coincides with a Brexit process fueled by anti-immigrant sentiment (Goodwin and Milazzo, 2017), but
one that was ultimately rejected by 58.2% of Liverpool residents (BBC, 2016). The complex interaction
of individual, local, and national forces thus leaves us with ambiguous expectations with regards to the
moderating effect of the political climate on intergroup contact in Liverpool during the study period.
3 Analysis of Hate Crimes in the U.K.
We begin our empirical analysis with arguably a hard test of the parasocial contact hypothesis: an
analysis of hate crimes in the U.K. If Salah’s signing decreased the general public’s tolerance of hate
crimes, or changed the underlying beliefs of bigots, then we would expect to see fewer hate crimes.2
To test this proposition, we use an event-study analysis that exploits Salah’s rapid rise to fame. We2Hate crimes are rare events that are likely to be perpetrated by extreme bigots. Hate crimes are
also public acts, and as such are likely to be subject to social pressure. A reduction in hate crimes thus
requires either that the underlying beliefs of these bigots have changed, or that hate crimes are less
socially acceptable.
9
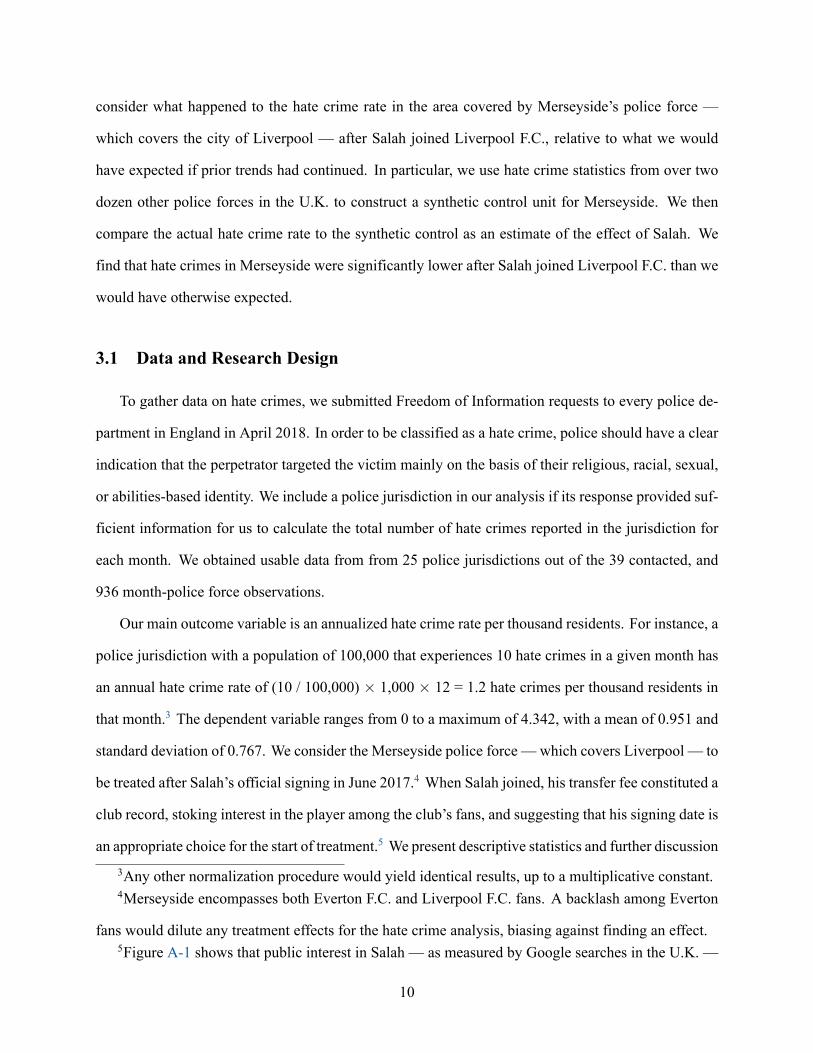
consider what happened to the hate crime rate in the area covered by Merseyside’s police force —
which covers the city of Liverpool — after Salah joined Liverpool F.C., relative to what we would
have expected if prior trends had continued. In particular, we use hate crime statistics from over two
dozen other police forces in the U.K. to construct a synthetic control unit for Merseyside. We then
compare the actual hate crime rate to the synthetic control as an estimate of the effect of Salah. We
find that hate crimes in Merseyside were significantly lower after Salah joined Liverpool F.C. than we
would have otherwise expected.
3.1 Data and Research Design
To gather data on hate crimes, we submitted Freedom of Information requests to every police de-
partment in England in April 2018. In order to be classified as a hate crime, police should have a clear
indication that the perpetrator targeted the victim mainly on the basis of their religious, racial, sexual,
or abilities-based identity. We include a police jurisdiction in our analysis if its response provided suf-
ficient information for us to calculate the total number of hate crimes reported in the jurisdiction for
each month. We obtained usable data from from 25 police jurisdictions out of the 39 contacted, and
936 month-police force observations.
Our main outcome variable is an annualized hate crime rate per thousand residents. For instance, a
police jurisdiction with a population of 100,000 that experiences 10 hate crimes in a given month has
an annual hate crime rate of (10 / 100,000) × 1,000 × 12 = 1.2 hate crimes per thousand residents in
that month.3 The dependent variable ranges from 0 to a maximum of 4.342, with a mean of 0.951 and
standard deviation of 0.767. We consider the Merseyside police force — which covers Liverpool — to
be treated after Salah’s official signing in June 2017.4 When Salah joined, his transfer fee constituted a
club record, stoking interest in the player among the club’s fans, and suggesting that his signing date is
an appropriate choice for the start of treatment.5 We present descriptive statistics and further discussion3Any other normalization procedure would yield identical results, up to a multiplicative constant.4Merseyside encompasses both Everton F.C. and Liverpool F.C. fans. A backlash among Everton
fans would dilute any treatment effects for the hate crime analysis, biasing against finding an effect.5Figure A-1 shows that public interest in Salah — as measured by Google searches in the U.K. —
10

of the data in Appendix A.1.
Our goal is to estimate how hate crimes in Merseyside changed after Salah joined Liverpool F.C.,
relative to what would have happened had he not joined the team.This task requires estimating a coun-
terfactual quantity: the trajectory of hate crimes in Merseyside had Salah not joined Liverpool. To
construct such a counterfactual, we use the pre-treatment data from Merseyside and the control group
data. Our main analysis uses the matrix completion method of Athey et al. (2018), as implemented
in the R package gsynth (Xu and Liu, 2018). This method imputes the unobserved outcomes in the
post-treatment period by first looking for structure in the pre-treatment control data that generates good
predictions of the treated unit’s outcomes in the pre-treatment period. The same structure is then ap-
plied to the post-treatment periods to generate estimates of the counterfactual potential outcomes for
the treated unit. To obtain an estimate of the treatment effect on the treated unit, we simply take the dif-
ference between the observed outcome for the treated unit in the post-treatment period and the imputed
counterfactual outcome.6
Statistical inference in the setting of a single treated unit is challenging. Standard methods for
computing standard errors based on asymptotic theory obviously do not apply. We therefore imple-
ment three complementary approaches to inference. First, we use the nonparametric bootstrap, where
we repeatedly resample control units and re-estimate the model to generate a bootstrap distribution
and standard error for the treatment effect estimator. Second, we conduct a permutation test where
we reshuffle units’ treatment status to generate a null distribution for the treatment effect estimator,
analogous to the procedure in Abadie, Diamond and Hainmueller (2010). Third, we conduct a placebo
test using other types of crime, collected by the U.K. Home Office, that are unlikely to be affected by
changes in anti-Muslim sentiment. If we find that the effect size for hate crimes is comparable to that
spiked shortly after he was signed in the summer of 2017 and then began to steadily increase afterwards
through mid-2018.6Therefore, if there are T post-treatment periods, we obtain T treatment effect estimates. In addi-
tion, we compute the treatment effect averaged over the T post-treatment periods as a simple summary
of the treatment effect.
11

for other types of crime, it would suggest that the results are capturing a more general decline in crime,
rather than an effect of Salah.
Appendix A provides greater detail on the data, research design, and methods for the hate crime
analysis. It also present the results of an alternative method of estimating the treatment effect — a
generalized difference-in-differences regression with two-way fixed effects. This approach yields very
similar results.
3.2 Results
The main results are presented in Figure 2. The top plot shows the actual outcome data for Mersey-
side, along with the imputed counterfactual for Merseyside. The bottom plot shows the difference
between the observed and imputed outcomes in all periods for Merseyside and all other permutations
of treatment assignment.7 In both plots, the shaded region indicates the post-treatment period. In
the post-treatment period, the difference between the observed and imputed outcomes is the treatment
effect estimate.
If the matrix completion method is performing well, the imputed estimates should closely match
the observed outcomes in the pre-treatment period. Reassuringly, this is the pattern we see. In the
top panel, the two lines in the pre-treatment period track each other closely. In the bottom plot, the
pre-treatment line is close to 0 in most periods. While it fluctuates at times, there does not appear to
be a trending pattern in the pre-treatment period that would cause concern about the validity of the
treatment effect estimates.
Moving on to the post-treatment periods, the observed levels of hate crime in Merseyside are con-
sistently lower than the predicted level from the synthetic control unit. Averaging across all months
in the post-treatment period, the difference between the observed outcome and the synthetic control is
−0.275 annualized hate crimes per 1,000 residents. Compared to the counterfactual imputed average
in the post-treatment period, this treatment effect represents a 16% drop in hate crimes. The bootstrap-7That is, each gray line shows the matrix completion results if we pretend that one of the control
units was, in fact, treated.
12

(a) Observed and imputed outcomes for Merseyside
1.00
1.25
1.50
1.75
2.00
2015
−01
−01
2015
−02
−01
2015
−03
−01
2015
−04
−01
2015
−05
−01
2015
−06
−01
2015
−07
−01
2015
−08
−01
2015
−09
−01
2015
−10
−01
2015
−11
−01
2015
−12
−01
2016
−01
−01
2016
−02
−01
2016
−03
−01
2016
−04
−01
2016
−05
−01
2016
−06
−01
2016
−07
−01
2016
−08
−01
2016
−09
−01
2016
−10
−01
2016
−11
−01
2016
−12
−01
2017
−01
−01
2017
−02
−01
2017
−03
−01
2017
−04
−01
2017
−05
−01
2017
−06
−01
2017
−07
−01
2017
−08
−01
2017
−09
−01
2017
−10
−01
2017
−11
−01
2017
−12
−01
2018
−01
−01
2018
−02
−01
2018
−03
−01
2018
−04
−01
Mon
thly
hat
e cr
ime
rate
Treated Estimated Y(0)
(b) Treatment effect estimates for Merseyside and placebo units
−0.6
−0.3
0.0
0.3
0.6
−30 −20 −10 0 10Months relative to treatment
Obs
erve
d −
Impu
ted
Hat
e C
rime
Rat
e
Controls Treated (Pre) Treated (Post)
Figure 2: Synthetic control results for hate crimes analysis. The top panel shows the observed (solidline) and imputed (dashed line) monthly hate crime rates in Merseyside. The bottom panel showsthe difference between the observed and imputed outcomes. In the post-treatment period, this is theestimate of the treatment effect. The red line shows the estimates obtained for Merseyside, while thegray lines show the estimates obtained when we treat each of the control units as if it were treated. Thefact that the Merseyside estimates are consistently lower than the control-group estimates providesevidence that our treatment effect estimates are unlikely to be due to chance.
13

based standard error for the treatment effect, averaging over post-treatment periods, is 0.069 and the
central 95% confidence interval is [−0.401,−0.154]. Looking at the estimates month-by-month, the
differences between the observed and imputed outcomes begin soon after Salah agreed to join Liver-
pool, in June 2017, and persist through at least April 2018 — the last month in our dataset.
The bottom plot in Figure 2 shows the estimated treatment effect for Merseyside, in red, alongside
the placebo treatment effect estimates for every other unit, in gray. This plot shows that the decrease
in hate crimes in Merseyside is large, relative to the placebo estimates. No placebo unit’s treatment
effect estimates are as consistently negative as Merseyside. When we average across post-treatment
periods, Merseyside has the largest decrease in hate crimes. Only two placebo units have treatment
effect estimates that are larger in absolute value — and these are increases in hate crimes, relative to
their respective synthetic controls. With these statistics, we can calculate one-sided and two-sided p-
values. There are 24 possible permutations of the treatment assignment —Merseyside plus 23 placebo
units — so the one-sided p-value is 1/24 = 0.042 and the two-sided p-value is 3/24 = 0.125. This
result suggests that the decrease in hate crimes observed in Merseyside is unusual relative to changes
observed in other police jurisdictions.
The change in hate crimes is consistent with a Salah effect, but it is unclear whether Salah was the
cause of the decline. Instead, it could also be that there was a general decline in crime in Merseyside
that happened to coincide with Salah’s arrival at Liverpool F.C. If this were the case, we might observe
a decrease in hate crimes relative to other police jurisdictions, even if Salah’s arrival at Liverpool F.C.
had no direct effect on hate crimes.
The placebo outcome analysis helps to address this concern. If there were a general decline in
crime, the estimated treatment effect on hate crimes would not be distinctive relative to the treatment
effect on other types of crimes. Figure 3 shows the treatment effect estimates for Merseyside for each
of 15 different types of crimes— hate crimes, plus the 14 types tracked in the U.K. Home Office police
data. The results show that the decrease in hate crimes is larger than changes observed for most other
types of crime in Merseyside. Recall that the treatment effect for hate crimes was a 16% decrease,
relative to the synthetic control in the post-treatment period. No other crime category saw such a large
14

−40%
−20%
0%
20%
40%
−30 −20 −10 0 10Months relative to treatment
Obs
erve
d −
Impu
ted
Rel
ativ
e to
pre
−tr
eatm
ent b
asel
ine
Hate crimes Other crime categories
Figure 3: Synthetic control results for all crime types in Merseyside. The red line shows the treatmenteffect estimate for hate crimes and the gray lines show treatment effect estimates for each of 14 typesof crimes defined by the U.K. Home Office. To generate estimates on comparable scales across crimetypes, the treatment effect estimates are expressed as a percent of the pre-treatment mean for each crimetype. The estimated treatment effect on hate crimes is consistently more negative than the estimate forany other crime outcome.
relative decrease, and only one, “drugs,” had a change that was larger in magnitude — and it was an
increase in crime by 19.5%. Thus, the drop in hate crimes after Salah was signed does not appear to
be attributable to a general decrease in crimes in Merseyside.
Overall, we interpret these results to support the hypothesis that Salah’s arrival at Liverpool F.C.
caused a decrease in extreme acts of bigotry. Hate crimes in Merseyside were lower after Salah was
signed than we would expect given prior hate crime trends and the trends of other police jurisdictions
after Salah was signed. This decline was more extreme than we would expect based on chance alone,
and the decrease in hate crimes was more pronounced than the decrease in any other crime category.
Taken together, the evidence points to Salah’s rise in prominence causing a decrease in hate crimes in
Liverpool F.C.’s home county.8
8Some may object to the hate crimes analysis because only about 39% of hate crimes targeted
15

4 Analysis of U.K. Soccer Fans’ Tweets
Our analysis of hate crimes in the U.K. provides evidence that Salah joining Liverpool F.C. may
have decreased hate crimes in Merseyside relative to their expected rates if he had not joined Liver-
pool F.C. Although hate crimes are extremely harmful and consequential, they are quite rare and severe
events. As such, they tell us little about how Salah’s signing may have impacted more quotidian forms
of anti-Muslim behavior among mainstream Liverpool F.C. fans. To gain more purchase on this ques-
tion, we analyze approximately 15 million tweets produced by U.K.-based soccer fans in the period
preceding and following Salah joining Liverpool F.C.
4.1 Data and Research Design
Looking at soccer fans based in the U.K., we compare the frequency of anti-Muslim tweets pro-
duced by fans of Liverpool F.C. relative to fans of other English teams over time. We began by using
Twitter’s API to scrape the account IDs of all followers of the top five most followed teams in the
English Premier League: Manchester United F.C. (19 million followers), Arsenal F.C. (14 million),
Chelsea F.C. (12 million), Liverpool F.C. (11 million), and Manchester City F.C. (6 million). We also
scraped the followers of Liverpool F.C.’s cross-town rival Everton F.C., a smaller team with 1.75 mil-
lion followers that is also located in the city of Liverpool. Fans of both clubs are nearly identical in
terms of demographics: the home stadiums are within walking distance of each other, there are no
historic political, religious, or social differences between their fanbases, and many Liverpudlian fami-
lies are mixed in their allegiances (Borden, 2014). Evertonians thus constitute the closest comparison
group in the sample, with one key difference as a result of their fierce rivalry: exposure to Salah may
Muslims (see Appendix A). Considering that Muslims make up only 5% of the British population, they
are significantly overrepresented among hate crime victims. Another objection is that Islamophobia
may be underlying some other crime categories that are used in the placebo tests. While this is a
possibility, it would bias against our findings, since the trends for all crimes would look more similar
to the trend for hate crimes.
16
skew negative for Evertonians, but is positive and goal-aligned for Liverpool F.C. fans.
After obtaining followers’ account IDs, we collected our sample of tweets as follows. First, to
ensure that the users in our sample had been soccer fans prior to Salah joining Liverpool, we subset our
follower IDs to the oldest 500,000 followers of each club and subsetted to those who live in the U.K.
based on the text of their self-reported locations. Once we identified longtime Twitter followers of
English Premier League teams that were likely to be located in the U.K., we randomly sampled 10,000
followers from each team. We used Twitter’s API to scrape up to 3,200 of the most recent tweets
published by each of these 60,000 U.K. soccer fans.9 This resulted in a dataset of approximately 15
million tweets produced by the 60,000 English followers of the “Big Five” clubs of English soccer plus
Everton F.C.
In order to identify anti-Muslim tweets, we began by identifying all tweets that are broadly about
Muslims in the data using generic keyword search and word2vec (a neural network that processes text)
to find other relevant terms in the data. We only chose to include relevant keywords that were among the
top 50 words that the word2vec model indicated were most similar to the terms “Muslim” and “Islam.”
About 44,000 of the 15 million tweets in our dataset contained one of these relevant keywords. We
then took a sample of about 1,500 of these tweets and asked three native English speakers to code each
of these tweets as anti-Muslim or not.
Using this human-coded data, we trained a Naive Bayes classifier to classify all of our tweets
containing one of the keywords described above as anti-Muslim or not.10 We then used this classifier9The 3,200 tweet limit is imposed by Twitter’s API. For most Twitter users, we observe their entire
Twitter timelines beginning on the day they first joined the platform. For 84% of users in our sample
we have tweets from before and after Salah joined Liverpool.10Our classifier’s out of sample performance yielded scores of 88% Accuracy, 98% Precision, 90%
Recall, and an F1 score (harmonic mean of Precision and Accuracy) of 94%. However, because anti-
Muslim tweets were relatively rare in our data, and our training dataset was not balanced, Balanced
Accuracy (i.e., the average of the proportion of tweets classified correctly in each class individually) is
a better and more conservative measure of classifier performance. Our classifier performed with 70%
17

to classify all 44,000 tweets relevant to Islam or Muslims in our dataset as anti-Muslim or not.11 These
classified tweets allowed us to compute a month measure of the proportion of fans’ anti-Muslim tweets
in their tweets about Muslims or Islam (relevant tweets).12 More details about the data collection and
coding, as well as descriptive statistics, are presented in Appendix B.
Following the approach we use to analyze hate crime data, our main analysis of the Twitter data
again uses the matrix completion method. This method allows us to use the rates of anti-Muslim tweets
published by fans of Liverpool F.C. and other clubs in the pre-treatment period to construct a synthetic
control unit for Liverpool F.C. fans in the post-treatment period. This, in turn, enables us to estimate
how the rates of anti-Muslim tweets among Liverpool F.C. fans’ tweets changed after Salah joined the
club, relative to what they would have been if he had not joined. The previous section provides more
details on this method.
4.2 Results
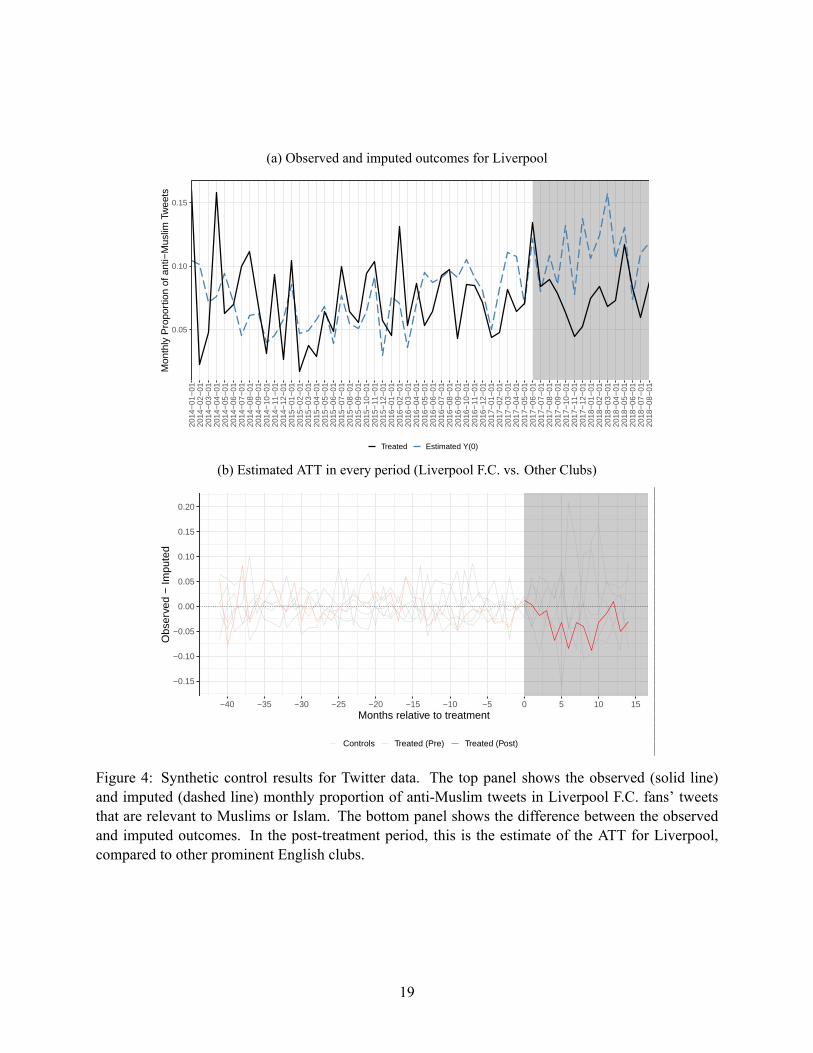
The results are presented in Figure 4. The top plot shows the actual outcome data for Liverpool
F.C. fans, along with the imputed counterfactual for these fans. The bottom plot shows the difference
between the observed and imputed outcomes in all periods for Liverpool F.C. fans as well as for fans
of four other large football clubs (Arsenal, Chelsea, Manchester United, and Manchester City) and
fans of Everton. In both plots, the shaded region indicates the post-treatment period. In the post-
Balanced Accuracy. Given that intercoder agreement among human coders was 76%, we are satisfied
that our classifier gives us a reasonable, if imperfect, measure of anti-Muslim sentiment in our tweets.11Tweets that did not contain relevant keywords were classified as irrelevant.12This measure is less sensitive to changes in the salience of topics related to Muslims or Islam
than a related outcome: the proportion of anti-Muslim tweets in fans’ total tweets. For example, terror
attacks are often followed by an uptick in anti-Muslim language, but this is generally accompanied by
much larger increases in tweets defending Muslims and Islam or condemning Islamophobia, as well as
upticks in neutral tweets discussing the event (Magdy, Darwish and Abokhodair, 2015). We thus focus
only on tweets relevant to Muslims or Islam to alleviate this concern.
18
(a) Observed and imputed outcomes for Liverpool
0.05
0.10
0.1520
14−
01−
0120
14−
02−
0120
14−
03−
0120
14−
04−
0120
14−
05−
0120
14−
06−
0120
14−
07−
0120
14−
08−
0120
14−
09−
0120
14−
10−
0120
14−
11−
0120
14−
12−
0120
15−
01−
0120
15−
02−
0120
15−
03−
0120
15−
04−
0120
15−
05−
0120
15−
06−
0120
15−
07−
0120
15−
08−
0120
15−
09−
0120
15−
10−
0120
15−
11−
0120
15−
12−
0120
16−
01−
0120
16−
02−
0120
16−
03−
0120
16−
04−
0120
16−
05−
0120
16−
06−
0120
16−
07−
0120
16−
08−
0120
16−
09−
0120
16−
10−
0120
16−
11−
0120
16−
12−
0120
17−
01−
0120
17−
02−
0120
17−
03−
0120
17−
04−
0120
17−
05−
0120
17−
06−
0120
17−
07−
0120
17−
08−
0120
17−
09−
0120
17−
10−
0120
17−
11−
0120
17−
12−
0120
18−
01−
0120
18−
02−
0120
18−
03−
0120
18−
04−
0120
18−
05−
0120
18−
06−
0120
18−
07−
0120
18−
08−
01
Mon
thly
Pro
port
ion
of a
nti−
Mus
lim T
wee
ts
Treated Estimated Y(0)
(b) Estimated ATT in every period (Liverpool F.C. vs. Other Clubs)
−0.15
−0.10
−0.05
0.00
0.05
0.10
0.15
0.20
−40 −35 −30 −25 −20 −15 −10 −5 0 5 10 15Months relative to treatment
Obs
erve
d −
Impu
ted
Controls Treated (Pre) Treated (Post)
Figure 4: Synthetic control results for Twitter data. The top panel shows the observed (solid line)and imputed (dashed line) monthly proportion of anti-Muslim tweets in Liverpool F.C. fans’ tweetsthat are relevant to Muslims or Islam. The bottom panel shows the difference between the observedand imputed outcomes. In the post-treatment period, this is the estimate of the ATT for Liverpool,compared to other prominent English clubs.
19

treatment period, the difference between the observed and imputed outcomes is our estimate of the
average treatment effect on the treated unit (ATT).
As in the hate crime results, if the matrix completion method is performing well, the imputed
estimates should closely match the observed outcomes in the pre-treatment period. Again, we observe
this pattern: the pre-treatment imputed and observed outcomes for Liverpool tend to be very similar,
and there does not appear to be a pre-treatment trend that would threaten the validity of the treatment
effect estimates.
Examining the post-treatment periods, the observed monthly proportions of anti-Muslim tweets
among Liverpool F.C. fans are consistently lower than what we would predict based on the synthetic
control. Averaging across all months in the post-treatment period, the difference between the observed
outcome and imputed outcome of the proportion of anti-Muslim tweets is −0.035 (bootstrap-based
S.E. = 0.006). Compared to the pre-treatment average among Liverpool F.C. fans, this treatment
effect represents a 47.8% drop in the proportion of anti-Muslim tweets in tweets about Muslims (from
0.073 to 0.038). Looking at the estimates month-by-month, the differences between the observed and
imputed outcomes begin soon after Salah agreed to join Liverpool, in June 2017, and persist through
at least May 2018 — almost a year after Salah joined the team.
When we employ the same permutation inference approach as in the hate crime section, only for
Liverpool F.C. followers do we estimate a consistently negative treatment effect in the post-treatment
period. The placebo estimates tend to oscillate between positive and negative treatment effects, while
the Liverpool treatment effect estimates are negative in every post-treatment month but one — again
suggesting that the observed estimate for Liverpool F.C. followers is unlikely to have occurred by
chance. As a robustness check, we again present a generalized difference-in-differences approach in
Appendix B. That analysis method generates very similar estimates as the ones reported here.
20

5 Robustness and Generalizability Tests
Overall, these two sets of analyses provide evidence that exposure to Mohamed Salah reduced
prejudice in Liverpool, as measured by real-world behavior, providing support for the parasocial con-
tact hypothesis. Hate crimes in Merseyside were lower and anti-Muslim tweets among Liverpool F.C.
fans were less common after Salah was signed, relative to what we would have expected based on
prior trends and the trends among groups that were less exposed to Salah. In this section, we briefly
summarize several extensions and robustness checks to these event study analyses.
First, one potential threat to inference is that there there were two Islamist terrorist attacks —
the Manchester Arena and London Bridge attacks — roughly one month before Salah was signed by
Liverpool F.C. If these attacks led to spikes in Islamophobia in the targeted cities, our results could be
driven by the trajectory of the control units, rather than a change in behavior in Liverpool. To verify
that our hate crime results are not driven by a spike in hate crimes in these cities, we re-run the analysis
but exclude London and Manchester. The hate crime results are virtually unchanged, as shown in
Figure A-4.
Robustness checks for the Twitter analysis are more difficult as these two cities contain all four
large control teams in the Twitter analysis.13 However, there is reason to think that the Twitter results
are not driven by upticks in Islamophobia in these cities: the treatment effects we uncover last well
beyond the terrorist attacks. The attacks would have had to have caused a long-term, sustained increase
in anti-Muslim tweets among just followers of London- and Manchester-based clubs to generate the
patterns that we observe. This would run counter to patterns observed in studies of the effect of terror
attacks on anti-Muslim tweets, which tend to spike and then re-equilibrate quickly following attacks
(Magdy, Darwish and Abokhodair, 2015).
Second, perhaps the Twitter results are driven by an uptick in anti-Muslim sentiment among fans
of rival clubs — representing a backlash to Salah. To rule out this possibility, we conduct an additional
analysis comparing tweets of rival fans to tweets from people who do not follow any soccer clubs. As13Chelsea and Arsenal are both located in London, and Manchester United and Manchester City are
of course located in Manchester.
21

we detail in Appendix B.5, rival fans did not increase anti-Muslim tweets, relative to non-soccer fans,
after Salah’s signing. In short, we find no evidence of a backlash effect.
Third, if parasocial contact is indeed reducing prejudice toward Muslims, we may wonder whether
other Muslim players have induced a similar effect. In probing the generalizability of our results, we
turn our attention to another Liverpool F.C. player, Sadio Mané — a Senegalese Muslim who joined
the squad exactly one year before Salah and who also demonstrates his religiosity to fans on occasion.
Did Mané have a similar effect on prejudice as Salah? Ex ante, Mané seems to fit the criteria for
the parasocial contact hypothesis somewhat less neatly than Salah — particularly sustained exposure
and salient group identity. Mané is not as heavily covered by the international nor local media when
compared with his Egyptian teammate. We scraped the headlines of Liverpool’s most widely circulated
newspaper, The Liverpool Echo, to analyze trends in coverage of the two players. We find that Mané’s
signing captured around 3% of headlines relative to Salah’s 9% (Figure A-7), suggesting that exposure
to Mané is weaker compared with exposure to Salah. Moreover, Mané’s group identity is likely less
salient. His name is not as recognizably as Muslim as “Mohamed,” and Black Muslims tend to be
perceived as less representative of Islam (Harvard, 2017). Fans have yet to create chants about Mané’s
religious identity (as they have done with Salah), speaking to the difference in group identity salience
between the two players. These factors suggest a weaker perceived link between player and Muslim
identity, undermining the salience of group identity needed for parasocial contact to take effect.
Nonetheless, we look for evidence of “Mané effect” using the same research designs. We find no
such effect on hate crimes when constraining the study period to the pre-Salah era, and taking the date
of Mané’s signing as the relevant time break (Figure A-8). We do, however, find a Mané effect on anti-
Muslim tweets similar in magnitude to the Salah effect (Figure A-9). Recall that the Twitter analysis
focuses only on soccer fans, who are more likely to be familiar with a less publicized player like Mané,
shedding some light on why we might detect an effect solely for the Twitter analysis. One response to
an open-ended question on our survey of Liverpool F.C. fans (detailed in the next section) underscores
the idea that club fans recognize Mané as Muslim: “I think with having Mo Salah and Mané, people
should read more into Muslim life and try to understand the kind of people our favourite players are.”
22

In sum, we find support for the parasocial contact hypothesis in two event studies centered on
Salah’s rise to fame. These results are neither driven by backlash to contemporaneous events nor
by backlash to Salah among fans of rival clubs. We also stress-test parasocial contact by replicating
our analysis for another Muslim player. We find some evidence of generalizability by studying Salah’s
teammate Sadio Mané. As expected for a player with weaker media coverage and a less salient Muslim
identity, we find evidence of prejudice reduction among Liverpool F.C. fans who closely follow their
club players, but not among broader residents of Merseyside. These additional analyses lower the
plausibility of factors other than positive parasocial contact driving effects, while increasing confidence
in the parasocial contact hypothesis by testing its applicability to another Muslim player.
6 Analysis of Survey Experimental Evidence
The evidence presented thus far suggests that exposure to Salah may have reduced anti-Muslim
behavior among Liverpool F.C. fans. As we outlined in Section 1, the parasocial contact hypothesis
suggests that sustained, positive exposure to a minority group member can reduce prejudice when that
individual’s group membership is salient. The group salience assumption is critical for all theories of
intergroup contact — any positive effects should extend beyond the specific contact partner and gener-
alize to othermembers of the outgroup (Al Ramiah and Hewstone, 2013; Brown and Hewstone, 2005).
This “generalization” of positive effects requires that the contact partner is viewed as representative of
their group, without confirming negative stereotypes (Bond, 2020). While we have argued that Salah’s
first name, family, and his public displays of religiosity all highlight his identity as a Muslim, our
analysis of aggregate-level observational data does not enable us to directly test whether awareness of
Salah’s Muslim identity leads individuals to express less prejudice toward Muslims as a whole.
To test the generalization assumption directly, we design a survey experiment to evaluate whether
priming Liverpool F.C. fans to think about Salah’s Muslim identity causes them to express more pos-
itive attitudes towards Muslims writ large.14 Our survey experiment does not directly test whether
parsocial contact reduces prejudice, as all respondents have received positive and sustained exposure14As described in Appendix D, we also attempted to test the positivity condition by providing
23

to Salah. Instead, this experiment enables us to evaluate, conditional on exposure, whether highlighting
Salah’s group identity reduces generalized prejudice toward Muslims, thus testing a necessary condi-
tion of parasocial contact.
6.1 Experimental Design
To evaluate this key condition of the parasocial contact hypothesis— the generalization assumption
— we conducted a survey targeting people who “like” the Liverpool F.C. page on Facebook and who
live in the U.K.15 These users saw a Facebook advertisement stating: “Help us research L.F.C.! Love
Liverpool F.C.? Take 2 mins. to help us research Liverpool fans!” The survey was launched from
October 2018 to January 2019, until $1,500 worth of clicks were exhausted. The survey experiment
was approved by the Stanford Institutional Review Board, protocol #47168, and pre-registered with
EGAP, #20181115AB. Before taking the survey, respondents were shown a page that explained their
rights as research subjects, gave contact information for the investigators and the IRB, and required
participants to affirm that they were at least 18 years old.
We presented people in the treated group with a picture of Salah prostrating in prayer and the
following text, which highlights Salah’s Muslim identity without affirming negative stereotypes about
Muslims:
In addition to his goal scoring, Salah is known for an attachment to his Muslim identity
prompts highlighting Salah’s success or casting doubt on his ability to maintain his successful streak.
However, our manipulation did not appear to affect respondents’ perceptions of Salah’s performance,
as shown in the manipulation check in Figure A-11. This manipulation failure is perhaps because
fans already have strong views on players’ performance and because Salah was playing well during
the study period, rendering our experimental treatment not credible. For these reasons, we relegate
discussion of this arm of the survey experiment to Appendix D.15The majority of the respondents were indeed Liverpool F.C. fans. Around 85% mentioned that
they follow Liverpool F.C. “Very closely” and over 98% mentioned they follow Liverpool F.C. at least
“Somewhat closely.”
24

both on and off the pitch. After every goal he scores, Salah touches his head to the ground
in prayer. He also fasts during Ramadan (except on match days) and shares well wishes
with his followers on social media during Islamic holidays. He named his daughterMakka
after Islam’s holiest site (Mecca).16
The control group was assigned to a pure control, and thus did not receive any treatment. All
respondents who were not in the control condition saw the following statement, which preceded each
of the vignettes: “As you probably know, Mohamed Salah is an Egyptian winger who joined Liverpool
F.C. in June 2017.” A table showing balance on pre-treatment covariates is presented in Appendix D.3.
The outcomes variables comprise three survey items that capture whether: (1) the respondent be-
lieves there is a “fundamental clash between Islam and British values”; (2) the respondent has “some”
or “a lot” in common with Muslims in the U.K.; and (3) the respondent thinks immigrants “generally
have a positive influence on the U.K..” All of these outcomes are coded as binary in a pro-tolerant
direction. We then used the first principal component generated by these items as a fourth, composite
outcome.17 These outcomes capture three communities linked with Salah to varying degrees: Islam in
general, Muslims in the U.K., and immigrants. Salah’s public piety explicitly links him to Islam, but
less so to Muslims and immigrants in the U.K. — only 5.8% of U.K. residents born abroad are from
the Middle East or North Africa (Office for National Statistics, 2019), tempering expectations around
these outcomes.
We estimate the main effect of the religiosity treatment, which is defined as the effect of the reli-
giosity treatment, averaged over the levels of other factors. This definition is directly analogous to the
average marginal component effect estimand commonly used in conjoint experiments (Hainmueller,
Hopkins and Yamamoto, 2014). Due to randomization of the treatments, the main effects can be esti-16As this was a factorial design, people in the treated group where also presented with text portraying
Salah as succeeding or failing. See Appendix D.2 for more details. In the analysis below, we pool
across both the success and failure treatments.17The outcomes were scaled to have mean 0 and unit variance for the principal component analysis.
The first principal component explained 76% of the total variance.
25

●
●
●
●Impact of Immigrants
on the U.K. (0−1)
Feel common with Muslims (0−1)
Islam compatible with British values (0−1)
PC Outcome
−0.05 0.00 0.05 0.10 0.15Estimate
Trea
tmen
t
Figure 5: Coefficient plots representing the main effect of the religiosity treatment on the four out-comes, relative to the pure control condition. The top outcome represent the first principal componentof the other three outcomes and has a mean of zero and unit variance. The other three outcomes arebinary. Bars show 95% robust confidence intervals.
mated without bias via linear regression.18
6.2 Results
Figure 5 shows a coefficient plot from regressions estimating the average treatment effect of the
religiosity treatment on the four outcome measures, which are detailed on the y-axis. We find some
effects of the Religiosity vignette on tolerance. In particular, reading a vignette emphasizing Salah’s18Due to a coding error in the survey experiment, the control group was initially much larger than
the treatment group. We corrected this survey coding error midway through data collection. However,
this correction introduced the complication that not all units had equal treatment probabilities. To
obtain unbiased treatment effect estimates, we weight all observations by the inverse probability of the
realized treatment assignment. All the results presented here represent the weighted results.
26
Muslim identity sparked a small but statistically significant increase in respondents’ belief that Islam
is compatible with British values. Reminding respondents of Salah’s Muslim identity and practices
made them around 5 percentage points more likely to say that Islam is compatible with British values,
relative to the control group baseline of 18 percent. The treatment effect on the Religiosity vignette
also increased the principal component outcome by 8% of one standard deviation. The Religiosity
prime also moved the outcome capturing tolerance toward British Muslims in the expected direction,
although this difference is not statistically significant, while tolerance toward immigrants remained
unchanged. These effects are stable across various social and political subgroups.19
This experiment provides further evidence in support of the parasocial contact hypothesis gener-
ally and the importance of group salience in particular. When reminded of Salah’s Muslim identity,
respondents express more tolerant attitudes towards Islam — consistent with the idea that a contact
partner’s group identity must be salient in order for positive feelings towards an individual to extend
to the outgroup as a whole.
7 Discussion
Taken together, our findings provide diverse sources of evidence for the parsocial contact hypoth-
esis. Our analyses demonstrate that positive and sustained exposure to Mohamed Salah likely reduced
hate crimes and anti-Muslim speech on Twitter among Liverpool F.C. fans. Specifically, we find that
hate crimes and anti-Muslim tweets decreased among people most exposed to Salah, relative to coun-
terfactual groups that were less exposed. These two outcomes are both costly and public, typically
committed by those with high levels of prejudice. Observing such a tangible effect in this context is
thus particularly compelling evidence of the effects of parasocial contact, especially given that Liver-
pool F.C. fans reside in a city that is less ethnically diverse than the rest of England and Wales and that19Full regression results are presented in Table A-5. As we show in Appendix D.4, these effects do
not differ for those who are more or less inclined to like Salah, be empathetic, or hold right-leaning
political views, suggesting a consistent effect of group salience across social and political subgroups.
27

has a relatively high prevalence of hate crimes (Liverpool City Council, 2011). These results provide
evidence, in a naturalistic setting, that exposure to celebrities from stigmatized groups can decrease
prejudice.
Our analyses of observational data provide support for the parasocial contact hypothesis. How-
ever, they do not enable us to directly test the assumptions underlying the theory. We therefore use an
original survey experiment of Liverpool F.C. fans to test one of the primary assumptions underpinning
all theories of intergroup contact — that any positive effects will generalize beyond the contact partner
to the entire outgroup when the contact partner’s outgroup identity is salient. In particular, our experi-
ment allows us to examine whether highlighting Salah’s Muslim identity encourages fans to make an
inferential leap from Salah to Muslims as a whole, and thus express lower levels of Islamophobia in
general. Our survey experiment demonstrates that being reminded of Salah’s strong Muslim identity
causes Liverpool F.C. fans to express lower levels of Islamophobia, providing direct evidence of the
mechanics underlying the parasocial contact hypothesis.
How generalizable are these results? Our findings suggest that positive and sustained exposure to
celebrities should reduce prejudice when the celebrity’s group identity is salient. Indeed, our additional
analyses of Salah’s teammate Sadio Mané show the potential for generalizability. However, to further
understand the generalizability of the phenomenon we document, future work should unpack three
(related) components of the compound treatment we study here: the positive media media coverage
Salah receives, his success on the pitch, and the fact that he does not take public political stances.
First, following the parasocial contact literature, we expect that positive media is important for the
“Salah effect” to unfold. Media commentary about Salah has been almost uniformly positive since his
arrival at the club, but it remains unclear how parasocial contact operates when the media stigmatizes
a celebrity. Media portrayals — whether they appear in news stories (e.g., Gilliam and Iyengar, 2000)
or entertainment media (e.g., Mastro and Tropp, 2004) — form the primary basis of attitudes towards
outgroups for many individuals. Mass media has often portrayed marginalized groups in negative or
otherwise stereotypical ways, further contributing to marginalization (Ramasubramanian and Murphy,
2014). Laboratory experiments have shown that showing positive media portrayals of celebrities can
28
help to reduce stated prejudice. For example, Ramasubramanian (2015) uses news stories on celebri-
ties like Kanye West and Beyoncé Knowles to show how Black celebrities exhibiting stereotypical or
counter-stereotypical behavior shapes perceptions of African Americans. How and when the media
cover a celebrity in a positive light remains hard to predict a priori, however.
Second, another component of the positive exposure to Salah is his success with Liverpool F.C.
Anecdotal evidence points to a backlash effect on prejudice when celebrity athletes underperform.
Salah has enjoyed phenomenal success at the individual and team level during the study period — so
much so that our manipulation check on a treatment arm priming fans to think of him as a failure was
unsuccessful. Nonetheless, positive attitudes towards outgroups may be conditional on the success
of their public figureheads, a claim made by several elite soccer stars of immigrant descent. When
he left the German national team because of alleged racist abuse, Mesut Özil, who is of Turkish de-
scent, stated: “I am a German when we win and an immigrant when we lose” (Stanley-Becker, 2018).
Similarly, Inter Milan star Romelu Lukaku has written that when he plays well, newspapers refer to
him as the “Belgian striker,” but when he plays poorly, they refer to him as “the Belgian striker of
Congolese descent” (Lukaku, 2018). This aspect of elite sports and other high-stakes, real-world do-
mains makes them qualitatively different from television shows, the most commonly studied media in
the parasocial contact literature (e.g., Schiappa, Gregg and Hewes, 2005, 2006; Bond, 2020). Future
work should study the role that real-world performance has on the potential for parasocial contact to
influence behaviors and attitudes.
Third, the extent to which a celebrity takes polarizing political stances may also shape the out-
comes of parasocial contact. Consider the American football player Colin Kaepernick, a young Black
quarterback who started in two conference championship games and one Superbowl. Since he began
protesting against racial injustice by kneeling during the national anthem, he has remained unsigned
— reportedly because team owners fear backlash from (mostly White) fans (Reid, 2017). Taking a
stance on divisive political issues may thus lead to a negative parasocial contact experience, in part by
fueling negative media coverage. By contrast, as one writer notes, “part of Salah’s charm is that he’s
not an outwardly political figure addressing Islamophobia in England” (Al-Sayyad, 2018). While we
29
speculate that avoiding polarizing stances can facilitate prejudice reduction, more work is needed to
understand where and when we should expect exposure to celebrities to reduce prejudice.
Finally, future work should unpack the social, emotional, and cognitive mechanisms underpinning
parasocial contact. In addition to outgroup identity salience, other possible mechanisms at play include
undermining negative stereotypes (Ramasubramanian, 2013; Fujioka, 1999), and activating vicarious
contact with ingroup members (Wright et al., 1997; Ortiz and Harwood, 2007; Vezzali et al., 2014). To
this end, Salah is known to be on friendly terms with White, British-born teammates from Liverpool-
adjacent areas, which may reduce intergroup anxiety by proxy. Research disentangling these mecha-
nisms holds important implications for generating scope conditions for “Salah effects” elsewhere.
8 Conclusion
Exposure to celebrities has become a quotidian feature of modern life both online and through tra-
ditional media channels. Yet, we know relatively little about how these public figures may influence
intergroup relations. In practice, traditional intergroup contact is difficult to orchestrate and rare in
the U.K. and beyond. Because most people rarely have meaningful interactions with members of out-
groups, positive exposure to public figures through media coverage has the potential to be particularly
impactful. We take a first step in quantifying the effect of such exposure by assessing the effect of
exposure to a successful Muslim celebrity on Islamophobia. We find evidence that positive exposure
to public figures from stigmatized groups can mitigate prejudicial behaviors, such as hate crimes and
bigoted speech. We also provide evidence for a key assumption of the parasocial contact hypothe-
sis — that the salient group identity of the public figure allows positive exposure to generalize to the
outgroup as a whole. Our survey experiment demonstrates that primes emphasizing Salah’s Muslim
identity boosted the expression of tolerant opinions of Islam among Liverpool F.C. fans.
Our work builds upon prior research literature in three key ways. First, we provide causally iden-
tified naturalistic evidence in support of the parasocial contact hypothesis. Existing studies primarily
rely on correlational evidence from surveys — showing that those who consume media portraying
30
minority group members have lower levels of prejudice — or from laboratory experiments on non-
representative populations. The first research strategy could suffer from reverse causality, if people
who already have low levels of prejudice choose to consume media portraying out-group members.
The second research strategy, while solving the internal validity problems presented by correlational
studies, is limited in its external validity. The artificial laboratory environment may generate larger
effects than would be observed in more naturalistic settings and undergraduate students may be par-
ticularly receptive to positive portrayals of out-group members. By contrast, our research design —
which leverages differential exposure to the celebrity across different subsets of the British public —
overcomes the internal validity problem. Additionally, the fact that we study real-life exposure, outside
of the artificial experimental context, provides greater external validity.
Second, existing studies focus on self-reported measures of prejudice and behavior, often measured
shortly after exposure to experimental manipulation. While these attitudinal measures are undoubtedly
important, prior research leaves open the question of whether the effects extend to real-world behav-
ior. Of the three studies we conduct here, two focus on behavioral outcomes, measured by naturally
occurring administrative and digital trace data — rather than self-reported measures. We therefore
contribute evidence that parasocial contact can change behaviors as well as attitudes.
More broadly, our work contributes to a large literature in political communication documenting
the effects of mass media on political attitudes. Political communication scholars have long been
concerned with the effect that media portrayal of minorities— especially in the news—has on political
attitudes. Experiments have shown that the way media portrays minority groups in the U.S. can shift
people’s attribution of responsibility for social issues, their evaluations of political candidates, and
their policy attitudes (e.g. Gilliam and Iyengar, 2000; Iyengar, 1996; Valentino, 1999). We add to this
literature by showing that exposure to minorities in nonpolitical media can also influence attitudes and
behavior. We hope that future work can adapt a similar research design to explore the impact of other
public figures fromminority groups on prejudice and assess the underlying mechanisms through which
parasocial contact can shape prejudice. Such work will help us to better evaluate the scope conditions
of the “Salah effect” and offer new potential avenues for building social cohesion around the globe,
31

especially where traditional contact across group lines is difficult to achieve.
32
ReferencesAbadie, Alberto, Alexis Diamond and Jens Hainmueller. 2010. “Synthetic Control Methods for Com-parative Case Studies : Estimating the Effect of California’s Tobacco Control Program.” Journal ofthe American Statistical Association 105(490):493–505.
Aberson, Christopher L. 2015. “Positive intergroup contact, negative intergroup contact, and threatas predictors of cognitive and affective dimensions of prejudice.” Group Processes & IntergroupRelations 18(6):743–760.
Abrams, Jessica R, Karen J McGaughey and Hannah Haghighat. 2018. “Attitudes toward Muslims: Atest of the parasocial contact hypothesis and contact theory.” Journal of Intercultural Communica-tion Research 47(4):276–292.
Al Ramiah, Ananthi and Miles Hewstone. 2013. “Intergroup contact as a tool for reducing, resolving,and preventing intergroup conflict: Evidence, limitations, and potential.” American Psychologist68(7):527.
Al-Sayyad, Yasmine. 2018. “Liverpool F.C.’s Mohamed Salah, an Arab Muslim Sports Star SubtlyConfronting Racism and Islamophobia.” New Yorker .URL: https://www.newyorker.com/sports/sporting-scene/liverpool-fcs-mohamed-salah-an-arab-muslim-sports-star-subtly-confronting-racism-and-islamophobia
Allport, GordonW. 1954. The Nature of Prejudice. 25 ed. Cambridge, Massachusetts: Perseus BooksPublishing, L.L.C.
Athey, Susan, Mohsen Bayati, Nikolay Doudchenko, Guido Imbens and Khashayar Khosravi. 2018.“Matrix completion methods for causal panel data models.”.
Awan, Imran and Irene Zempi. 2016. “The affinity between online and offline anti-Muslim hate crime:Dynamics and impacts.” Aggression and violent behavior 27:1–8.
Barlow, Fiona Kate, Stefania Paolini, Anne Pedersen, Matthew J Hornsey, Helena RM Radke, JakeHarwood, Mark Rubin and Chris G Sibley. 2012. “The contact caveat: Negative contact predictsincreased prejudice more than positive contact predicts reduced prejudice.” Personality and SocialPsychology Bulletin 38(12):1629–1643.
Barnhardt, Sharon. 2009. “Near and Dear? Evaluating the Impact of Neighbor Diversity on Inter-Religious Attitudes.” Unpublished Working Paper .URL: http://research.economics.unsw.edu.au/gbose/DevWorkshop/papers/Barnhardt_near_and_dear_paper.pdf
Bascombe, Chris. 2019. “Jurgen Klopp full of praise for Mohamed Salah after Time magazinerecognition: ‘It’s an important statement for the world’.”.URL: https://www.telegraph.co.uk/football/2019/04/19/jurgen-klopp-full-praise-mohamed-salah-time-magazine-recognition/
33

BBC. 2016. EU Referendum Results. Technical report.URL: https://liverpool.gov.uk/council/key-statistics-and-data/census/census-summary/
BBC News. 2014. “One third of Britons ’admit being racially prejudiced’.”.
BBC News. 2018. “Religious hate crimes: Rise in offences recorded by police.” BBC News .URL: https://www.independent.co.uk/sport/football/premier-league/kashif-siddiqi-interview-premier-league-kashif-siddiqi-foundation-altus-league-a8283736.html
Benoit, Kenneth, Drew Conway, Benjamin E Lauderdale, Michael Laver and Slava Mikhaylov. 2016.“Crowd-sourced text analysis: Reproducible and agile production of political data.” American Po-litical Science Review 110(2):278–295.
Bond, Bradley J. 2020. “The Development and Influence of Parasocial Relationships With TelevisionCharacters: A Longitudinal Experimental Test of Prejudice Reduction Through Parasocial Contact.”Communication Research p. 0093650219900632.
Borden, Sam. 2014. “The Friendly Derby? Well, Everton-Liverpool Is Friendlier.” The New YorkTimes .URL: https://www.nytimes.com/2014/01/28/sports/soccer/the-friendly-derby-well-everton-liverpool-is-friendlier.html
Brown, Rupert and Miles Hewstone. 2005. “An integrative theory of intergroup contact.” Advancesin experimental social psychology 37(37):255–343.
Brown, William J and Michael D Basil. 1995. “Media celebrities and public health: Responsesto’Magic’Johnson’s HIV disclosure and its impact on AIDS risk and high-risk behaviors.” HealthCommunication 7(4):345–370.
Burns, Justine, Lucia Corno and Eliana La Ferrara. 2015. “Interaction, Prejudice and Performance.Evidence from South Africa.” Unpublished Working Paper .URL: https://bit.ly/30T51z1
Carrell, Scott E, Mark Hoekstra and James EWest. 2015. “The Impact of Intergroup Contact on RacialAttitudes and Revealed Preferences.” National Bureau of Economic Research (No. w20940).URL: http://www.nber.org/papers/w20940
Doudchenko, Nikolay and Guido W. Imbens. 2016. “Balancing, regression, difference-in-differencesand synthetic control methods: A synthesis.” National Bureau of Economic Research (No.w22791).URL: https://www-nber-org.stanford.idm.oclc.org/papers/w22791.pdf
Dovidio, John F, Angelika Love, Fabian MH Schellhaas and Miles Hewstone. 2017. “Reducing in-tergroup bias through intergroup contact: Twenty years of progress and future directions.” GroupProcesses & Intergroup Relations 20(5):606–620.
34

Elahi, Farah and Omar Khan. 2017. “Islamophobia: Still a challenge for us all.” Runnymede Trust .URL: https://bit.ly/2K9SXDI
Enos, Ryan D. 2017. The space between us: Social geography and politics. Cambridge UniversityPress.
Foos, Florian and Daniel Bischof. 2018. “Can the tabloid media create Eurosceptic attitudes? A quasi-experiment on media influence in England.”Working Paper .URL: http://www.florianfoos.net/resources/Foos_Bischof_Hillsborough.pdf
Fujioka, Yuki. 1999. “Television portrayals and African-American stereotypes: Examination of tele-vision effects when direct contact is lacking.” Journalism & Mass Communication Quarterly76(1):52–75.
Gilliam, Franklin D. and Shanto Iyengar. 2000. “Prime Suspects: The Influence of Local TelevisionNews on the Viewing Public.” American Journal of Political Science 44(3):560.
Goodwin, Matthew and Caitlin Milazzo. 2017. “Taking back control? Investigating the role of immi-gration in the 2016 vote for Brexit.” The British Journal of Politics and International Relations19(3):450–464.
Hainmueller, Jens, Daniel J. Hopkins and Teppei Yamamoto. 2014. “Causal Inference in ConjointAnalysis: Understanding Multidimensional Choices via Stated Preference Experiments.” PoliticalAnalysis 22:1–30.
Harvard, Sarah. 2017. “Why Doesn’t the Muslim Community Look Up To Its Black Celebrities?”The Washington Post .URL: https://www.washingtonpost.com/news/acts-of-faith/wp/2017/09/20/why-doesnt-the-muslim-community-look-up-to-its-black-celebrities/?noredirect=on
Hecht, Brent, Lichan Hong, Bongwon Suh and Ed H Chi. 2011. Tweets from Justin Bieber’s heart:the dynamics of the location field in user profiles. In Proceedings of the SIGCHI conference onhuman factors in computing systems. ACM pp. 237–246.
Home Office. 2012. Hate crimes, England and Wales 2011 to 2012. Technical report.URL: https://www.gov.uk/government/publications/hate-crimes-england-and-wales-2011-to-2012--2/hate-crimes-england-and-wales-2011-to-2012
Hopkins, Daniel J. 2010. “Politicized places: Explaining where and when immigrants provoke localopposition.” American political science review 104(1):40–60.
Iyengar, Shanto. 1996. “Framing Responsibility for Social Issues.” The ANNALS of the AmericanAcademy of Political and Social Science 546(1):59–70.
Joyce, Nick and Jake Harwood. 2014. “Improving intergroup attitudes through televised vicariousintergroup contact: Social cognitive processing of ingroup and outgroup information.” Communi-cation Research 41(5):627–643.
35

Khattab, Nabil and Ron Johnston. 2015. “Ethno-religious identities and persisting penalties in the UKlabor market.” The Social Science Journal 52(4):490–502.
Liverpool City Council. 2011. Census summary. Technical report.URL: https://liverpool.gov.uk/council/key-statistics-and-data/census/census-summary/
Lowe, Matt. 2017. “Types of Contact: A Field Experiment on Collaborative and Adversarial CasteIntegration.”MIT Working Paper .
Lukaku, Romelu. 2018. “I’ve Got Some Things to Say.” The Players Tribune .URL: https://www.theplayerstribune.com/en-us/articles/romelu-lukaku-ive-got-some-things-to-say
Madziva, Roda. 2018. ““Your name does not tick the box”: the intertwining of names, bodies, religionand nationality in the construction of identity within the UK asylum system.” Ethnic and RacialStudies 41(5):938–957.
Magdy, Walid, Kareem Darwish and Norah Abokhodair. 2015. “Quantifying public response towardsIslam on Twitter after Paris attacks.” Unpublished Manuscript .URL: https://arxiv.org/abs/1512.04570
Mastro, Dana E. and Linda R. Tropp. 2004. “The Effects of Interracial Contact, Attitudes, and Stereo-typical Portrayals on Evaluations of Black Television Sitcom Characters.” Communication Re-search Reports 21(2):119–129.
McLeod, Maurice. 2013. “Theresa May’s immigration bill is a valuable tool for racist landlords.” TheGuardian .URL: https://www.theguardian.com/commentisfree/2013/oct/15/theresa-may-immigration-bill-racist-landlords
Miller, Patrick R, Andrew R Flores, Donald P Haider-Markel, Daniel C Lewis, Barry Tadlock andJami K Taylor. 2020. “The Politics of Being “Cait”: Caitlyn Jenner, Transphobia, and Paraso-cial Contact Effects on Transgender-Related Political Attitudes.” American Politics Researchp. 1532673X20906460.
Milly, Williamson and Gholam Khiabany. 2010. “UK: The veil and the politics of racism.” Race &Class 52(2):85–96.
Mislove, Alan, Sune Lehmann, Yong-Yeol Ahn, Jukka-Pekka Onnela and J Niels Rosenquist. 2011.Understanding the demographics of twitter users. In Fifth international AAAI conference on we-blogs and social media.
Monks, Kieron. 2018. “Mohamed Salah’s greatest legacy may be off the pitch.”Middle East Eye .
Moore, Kelly, Paul Mason and Justin Matthew Wren Lewis. 2008. “Images of Islam in the UK: Therepresentation of British Muslims in the national print news media 2000-2008.” Race & Class .URL: http://orca.cf.ac.uk/id/eprint/53005
36

Office for National Statistics. 2019. “Population of the UK by country of birth and nationality.”.URL: https://www.ons.gov.uk/peoplepopulationandcommunity/populationandmigration/internationalmigration/datasets/populationoftheunitedkingdombycountryofbirthandnationality/
Ortiz, Michelle and Jake Harwood. 2007. “A social cognitive theory approach to the effects of me-diated intergroup contact on intergroup attitudes.” Journal of Broadcasting & Electronic Media51(4):615–631.
Paluck, Elizabeth Levy, Seth Green and Donald P Green. 2018. “The contact hypothesis re-evaluated.”Behavioural Public Policy pp. 1–30.
Paolini, Stefania, Jake Harwood and Mark Rubin. 2010. “Negative intergroup contact makes groupmemberships salient: Explaining why intergroup conflict endures.” Personality and Social Psy-chology Bulletin 36(12):1723–1738.
Park, Sung-Yeon. 2012. “Mediated intergroup contact: concept explication, synthesis, and applica-tion.”Mass Communication and Society 15(1):136–159.
Pettigrew, Thomas F. 1998. “Intergroup contact theory.” Annual Review of Psychology 49(1):65–85.
Pettigrew, Thomas F and Linda R Tropp. 2006. “A meta-analytic test of intergroup contact theory.”Journal of personality and social psychology 90(5):751.
Qurashi, Fahid. 2018. “The Prevent strategy and the UK ‘war on terror’: embedding infrastructures ofsurveillance in Muslim communities.” Palgrave Communication 4(1):1–13.
Ramasubramanian, Srividya. 2013. “Intergroup contact, media exposure, and racial attitudes.” Journalof Intercultural Communication Research 42(1):54–72.
Ramasubramanian, Srividya. 2015. “Using Celebrity News Stories to Effectively Reduce Racial/EthnicPrejudice.” Journal of Social Issues 71(1):123–138.
Ramasubramanian, Srividya and Chantrey J. Murphy. 2014. Experimental Studies of Media Stereo-typing Effects. In Laboratory Experiments in the Social Sciences, ed. Murray Webster Jr. and JaneSell. 2 ed. Academic Press pp. 385–402.URL: http://dx.doi.org/10.1016/B978-0-12-404681-8.00017-0
Rao, Gautam. 2019. “Familiarity Does Not Breed Contempt: Diversity, Discrimination and Generosityin Delhi Schools.” American Economic Review 109(3):774–809.
Reid, Jason. 2017. “We may have seen the last of Colin Kaepernick in the NFL.” The Undefeated .URL: https://theundefeated.com/features/we-may-have-seen-the-last-of-colin-kaepernick-in-the-nfl/
Reyes Jr., Ruben E. 2018. “Queer Eye for the Small-Minded Guy.” The Harvard Crimson .URL: https://www.thecrimson.com/column/pop-cultural/article/2018/7/25/reyes-queer-eye/
37
Schiappa, Edward, Peter B Gregg and Dean E Hewes. 2005. “The parasocial contact hypothesis.”Communication monographs 72(1):92–115.
Schiappa, Edward, Peter B Gregg and Dean E Hewes. 2006. “Can one TV show make a difference?A Will & Grace and the parasocial contact hypothesis.” Journal of Homosexuality 51(4):15–37.
Sheridan, Lorraine P. 2006. “Islamophobia pre–and post–September 11th, 2001.” Journal of inter-personal violence 21(3):317–336.
Sky News. 2018. “Liverpool goalkeeper Loris Karius sent death threats after Champions Leagueblunders.”.URL: https://news.sky.com/story/liverpool-goalie-loris-karius-sent-death-threats-after-champions-league-blunders-11386990
Sloan, Luke. 2017. “Who Tweets in the United Kingdom? Profiling the Twitter Population Using theBritish Social Attitudes Survey 2015.” Social Media+ Society 3(1):1–11.
Social Backers. 2019. United Kingdom Social Marketing Reports. Technical report.URL: https://www.socialbakers.com/statistics/twitter/profiles/united-kingdom/
Sønderskov, Kim Mannemar and Jens Peter Frølund Thomsen. 2015. “Contextualizing intergroupcontact: do political party cues enhance contact effects?” Social Psychology Quarterly 78(1):49–76.
Stanley-Becker, Isaac. 2018. “Mesut Ozil: World Cup player says he is ‘a German when we win’ but‘an immigrant when we lose,’ quits national team.” The Washington Post .URL: https://www.washingtonpost.com/news/morning-mix/wp/2018/07/23/quitting-national-team-world-cup-player-says-he-is-a-german-when-we-win-but-an-immigrant-when-we-lose/
Stevenson, Jacqueline, Sean Demack, Bernie Stiell, Muna Abdi, Lisa Clarkson, Farhana Ghaffar andShaima Hassan. 2017. “The Social Mobility Challenges Faced by YoungMuslims.” Social MobilityCommission .URL: https://assets.publishing.service.gov.uk/government/uploads/system/uploads/attachment_data/file/642220/Young_Muslims_SMC.pdf
Tell Mama. 2017. Beyond the Incident: Outcomes for Victims of Anti-Muslim Prejudice. Technicalreport.URL: https://tellmamauk.org/wp-content/uploads/2018/07/Tell-MAMA-Report-2017.pdf
The National. 2018. “Footballer Mo Salah is tackling Islamophobia head-on.”.URL: https://www.thenational.ae/opinion/editorial/footballer-mo-salah-is-tackling-islamophobia-head-on-1.724010
Thomas, Andi. 2018. “Soccer star Mo Salah’s massive popularity is changing perceptions of Muslimsin the UK.” Vox.com .
38

URL: https://www.vox.com/world/2018/6/15/17433822/mo-salah-liverpool-injury-egypt-2018-world-cup-muslim-islam
Valentino, Nicholas A. 1999. “Crime News and the Priming of Racial Attitudes During Evaluations ofthe President.” 63(3):293–320.
Vezzali, Loris, Miles Hewstone, Dora Capozza, Dino Giovannini and Ralf Wolfer. 2014. “Improvingintergroup relations with extended and vicarious forms of indirect contact.” European Review ofSocial Psychology 25(1):314–389.
Williams, Pat and Mike Sielski. 2004. How to Be Like Jackie Robinson. Health Communications,Inc.
Wiseman, Eva. 2018. “Nadiya Hussain: ‘This is more than a job – it’s important to be out there’.”The Guardian .URL: https://www.theguardian.com/food/2018/dec/16/nadiya-hussain-bake-off-winner-this-is-more-than-a-job
Wong, Norman CH, Kathryn L Lookadoo and Gwendelyn S Nisbett. 2017. ““I’m Demi and I havebipolar disorder”: Effect of parasocial contact on reducing stigma toward people with bipolar disor-der.” Communication Studies 68(3):314–333.
Wright, Stephen C, Arthur Aron, Tracy McLaughlin-Volpe and Stacy A Ropp. 1997. “The extendedcontact effect: Knowledge of cross-group friendships and prejudice.” Journal of Personality andSocial psychology 73(1):73.
Xu, Yiqing. 2017. “Generalized Synthetic Control Method: Causal Inference with Interactive FixedEffects Models.” Political Analysis 25:57–76.
Xu, Yiqing and Licheng Liu. 2018. gsynth: Generalized Synthetic Control Method. R packageversion 1.0.9.URL: https://CRAN.R-project.org/package=gsynth
39

Online Appendix for “Can CelebritiesReduce Prejudice?”

ContentsA Hate Crimes Analysis 1
A.1 Data Collection . . . . . . . . . . . . . . . . . . . . . . . . . . . . . . . . . . . . 1A.2 Treatment Assignment . . . . . . . . . . . . . . . . . . . . . . . . . . . . . . . . . 1A.3 Research Design . . . . . . . . . . . . . . . . . . . . . . . . . . . . . . . . . . . . 3A.4 Generalized Difference-in-Difference . . . . . . . . . . . . . . . . . . . . . . . . . 4A.5 Are London and Manchester Driving the Results? . . . . . . . . . . . . . . . . . . . 6
B Twitter Analysis 8B.1 Data Collection . . . . . . . . . . . . . . . . . . . . . . . . . . . . . . . . . . . . 8B.2 Twitter Coding Instructions . . . . . . . . . . . . . . . . . . . . . . . . . . . . . . 10B.3 Twitter Data Descriptive Statistics . . . . . . . . . . . . . . . . . . . . . . . . . . . 11B.4 Twitter Data Additional Data Analysis . . . . . . . . . . . . . . . . . . . . . . . . 11B.5 Testing for Backlash . . . . . . . . . . . . . . . . . . . . . . . . . . . . . . . . . . 13
C Mané Effect Analysis 14C.1 Liverpool Echo . . . . . . . . . . . . . . . . . . . . . . . . . . . . . . . . . . . . 14C.2 Hate Crimes . . . . . . . . . . . . . . . . . . . . . . . . . . . . . . . . . . . . . . 14C.3 Twitter . . . . . . . . . . . . . . . . . . . . . . . . . . . . . . . . . . . . . . . . . 14
D Survey Experiment 18D.1 Survey experiment design . . . . . . . . . . . . . . . . . . . . . . . . . . . . . . . 18D.2 Vignette Descriptions . . . . . . . . . . . . . . . . . . . . . . . . . . . . . . . . . 18D.3 Balance Table for Survey Experiment . . . . . . . . . . . . . . . . . . . . . . . . . 20D.4 Heterogeneous treatment effect . . . . . . . . . . . . . . . . . . . . . . . . . . . . 20D.5 Additional Analyses . . . . . . . . . . . . . . . . . . . . . . . . . . . . . . . . . . 22

A Hate Crimes Analysis
A.1 Data CollectionTo gather data on hate crimes, we submitted Freedom of Information requests (FOI) to every police
department in England in April 2018. We requested a dataset consisting of every hate crime that wasreported to the department between January 2015 and April 2018, along with information including thedate, location, motivation for the crime, and demographic information about the victim. We includea police jurisdiction in our analysis if its response provided sufficient information for us to calculatethe total number of hate crimes reported in the jurisdiction for each month. We obtained usable datafrom from 25 police jurisdictions out of the 39 contacted, and 936 month-police force observations.Hate crimes themselves cover a range of offenses. Common violations include harassment, aggravatedcommon assault, criminal damage to vehicles, and aggravated public fear, alarm, or distress. In orderto be classified as a hate crime, police should have a clear indication that the perpetrator targeted thevictim mainly on the basis of their religious, racial, sexual, or abilities-based identity.
In our analysis, we use all reported hate crimes. We requested data on hate crimes broken down byvictim religion and ethnicity, but the responses were inconsistent. In some cases, police departmentsdo not collect this information; in others, they began collecting it near the end of the study period. As aresult, we include all reported hate crimes. The focus on all hate crimes should still reflect trends drivenby anti-Muslim incidents: the Home Office reports that 76% of hate crimes perpretrated from January2017 to January 2018 were religiously or racially motivated.1 Of these crimes, 52% were categorizedas anti-Muslim in particular (BBC News, 2018).
Our main outcome variable is an annualized hate crime rate per thousand residents. For instance, apolice jurisdiction with a population of 100,000 that experiences 10 hate crimes in a given month hasan annual hate crime rate of (10 / 100,000) × 1,000 × 12 = 1.2 hate crimes per thousand residents inthat month.2 The dependent variable ranges from 0 to a maximum of 4.342, with a mean of 0.951 andstandard deviation of 0.767.
A.2 Treatment AssignmentWe consider the Merseyside police force — which covers Liverpool — to be treated after Salah’s
official signing in June 2017. Merseyside is a metropolitan county that encompasses both EvertonF.C. and Liverpool F.C. fans.3 While a Salah effect is likely to be most pronounced after his stellarperformances with the team in late 2017, we choose his signing date as the start of treatment for tworeasons. First, any other cutoff would be somewhat arbitrary, whereas there is a clear justificationfor choosing June 2017. Second, when Salah was signed, his transfer fee constituted a club record,stoking interest in the player among the club’s fans. Figure A-1 shows that public interest in Salah —as measured by Google searches in the U.K. — spiked shortly after he was signed in the summer of2017 and then began to steadily increase afterwards through mid-2018. In Appendix C we show that
1Note that the same offense can be categorized as both racially and religiously motivated.2Any other normalization procedure would yield identical results, up to a multiplicative constant.3A backlash among Everton fans would dilute any treatment effects for the hate crime analysis,
biasing against finding an effect.
1

mentions of Salah in Liverpool Echo headlines follow a similar trend.4Figure A-2 plots the raw time series data for each police force, with Merseyside highlighted. In
the pre-treatment period, hate crimes are relatively common in Merseyside. Averaging over all pre-treatment observations, the hate crime rate in Merseyside is higher than 19 of the other 24 police forcesin the data.
0
25
50
75
100
2014 2016 2018Date
Sear
ch h
its
salah (GB−ENG)
Interest over time
Figure A-1: Normalized Google Searches for “Salah” in the UK (2014-2018)
4We also discuss other events relevant to Islamophobia that occurred around this time — which
could complicate interpretation of our estimates — in Section 7.
2

0
1
2
3
4
2015
−01
−01
2015
−02
−01
2015
−03
−01
2015
−04
−01
2015
−05
−01
2015
−06
−01
2015
−07
−01
2015
−08
−01
2015
−09
−01
2015
−10
−01
2015
−11
−01
2015
−12
−01
2016
−01
−01
2016
−02
−01
2016
−03
−01
2016
−04
−01
2016
−05
−01
2016
−06
−01
2016
−07
−01
2016
−08
−01
2016
−09
−01
2016
−10
−01
2016
−11
−01
2016
−12
−01
2017
−01
−01
2017
−02
−01
2017
−03
−01
2017
−04
−01
2017
−05
−01
2017
−06
−01
2017
−07
−01
2017
−08
−01
2017
−09
−01
2017
−10
−01
2017
−11
−01
2017
−12
−01
2018
−01
−01
2018
−02
−01
2018
−03
−01
2018
−04
−01
Ann
ualiz
ed h
ate
crim
espe
r 1,
000
resi
dent
s
Controls Treated (Pre) Treated (Post)
Figure A-2: Hate crime data across police jurisdictions. The red line shows hate crimes reported bythe Merseyside police force.
A.3 Research DesignOur goal is to estimate a counterfactual quantity: the predicted trajectory of hate crimes in Mersey-
side had Salah not joined Liverpool. A number of methods have been developed for this task, includingtwo-way fixed effects models, interactive fixed effects, the synthetic control method, and matrix com-pletion methods (Abadie, Diamond and Hainmueller, 2010; Doudchenko and Imbens, 2016; Xu, 2017;Athey et al., 2018). Roughly speaking, these methods attempt to impute the unobserved outcomes inthe post-treatment period by first looking for structure in the pre-treatment data that generates goodpredictions of the treated unit’s outcomes in the pre-treatment period. The same structure is then ap-plied to the post-treatment periods to generate estimates of the counterfactual potential outcomes forthe treated unit. To obtain an estimate of the treatment effect on the treated unit, we simply take the dif-ference between the observed outcome for the treated unit in the post-treatment period and the imputedcounterfactual outcome. Therefore, if there are T post-treatment periods, we obtain T treatment effectestimates. In addition, we compute the treatment effect averaged over the T post-treatment periods asa simple summary of the treatment effect.
This method outperforms others in approximating the outcome inMerseyside prior to the treatmentperiod, so arguably generates amore suitable counterfactual estimate than others. This method attemptsto find a low-dimensional matrix structure in the data by minimizing the mean squared error betweenthe observed outcomes and the outcomes predicted by another (low-rank) matrix. To avoid overfitting,the procedure penalizes the complexity of the matrix by adding a penalty term proportional to the
3

nuclear norm of the matrix, with the scaling factor chosen via leave-one-out cross-validation.5Statistical inference in the setting of a single treated unit is challenging. Standard methods for
computing standard errors based on asymptotic theory obviously do not apply. We implement threecomplementary approaches to inference: the nonparametric bootstrap, a permutation-based method,and a placebo analysis leveraging other types of crimes.
First, by repeatedly resampling control units and re-estimating the model, we generate a bootstrapdistribution and standard error for the treatment effect estimator. We can then compute a standard errorby taking the standard deviation of bootstrap estimates and obtain confidence intervals by taking theappropriate quantiles of the bootstrap distribution.
Second, we reshuffle units’ treatment status to generate a reference distribution for the estimator.For each control unit, we pretend it was in fact treated and estimate the “treatment effect” on the placebotreated unit. By construction, there is 0 treatment effect for these units (since they were not actuallytreated), so this procedure generates a distribution of the treatment effect estimator under the sharp nullof no treatment effect in any period, for any unit. We can then take the actual Merseyside estimatesand compare them to the null distribution to generate a permutation-based p-value. This method ofinference is proposed by Abadie, Diamond and Hainmueller (2010).6
Third, we conduct a placebo test using other types of crime that are unlikely to be affected bychanges in anti-Muslim sentiment. We collected data from the U.K. Home Office on crime at thepolice jurisdiction level.7 These data are formatted in a standard set of 14 crime types (which does notinclude hate crimes), such as shoplifting, robbery, possession of weapons, drugs, and so on. There islittle reason to believe that these crimes would be affected by a decrease in anti-Muslim sentiment. Ifwe find a significant decrease in these crimes in Merseyside after Salah was signed, it would indicatethat a decrease in hate crimes may be explained as part of a more general trend. To conduct this test,we re-run the matrix completion analysis on each of the placebo outcomes, then compare the estimatedeffect sizes (normalized by the pre-treatment mean for each outcome).
A.4 Generalized Difference-in-DifferenceAn alternative method of measuring the effect of Salah on hate crimes is to employ a generalized
difference-in-differences framework by estimating a two-way fixed-effects (TWFE) regression of the5In each cross-validation iteration, we omit one pre-treatment observation for the treated unit. We
then select the penalization parameter that produces the smallest mean-squared prediction error for the
held out observations. Because we have 30 pre-treatment periods for Merseyside, we choose k = 30-
fold cross validation in the gsynth software.6In implementing this method, we omit data from West Yorkshire because we only have data for
two pre-treatment months. In all, there are 23 placebo units we use for this procedure.7Data were downloaded from the U.K. police data download page (https://data.police.uk/
data/). Accessed on May 22, 2019.
4

form
Yit = τDit + δi + γt + ϵit, (A-1)
where Dit is an indicator that switches on for Merseyside in the post-treatment period, δi and γt areunit and month fixed effects, respectively, and ϵit is a mean-zero error term. In this framework, givenparallel trends for the treated and untreated units in the absence of treatment, τ is the the ATT.
Table A-1 presents the main regression results. The first column reports the plain TWFEmodel, thesecond adds police force-specific linear time trends, and the third and fourth add population weights.All specifications give similar results, showing that there was a decrease in the hate crime rate inMerseyside after Salah was signed. The estimates are in the range of -0.2, which is very similar to theestimated ATT yielded by the matrix completion method, which was −0.275.
In all the regression models, the estimates appear to be significant. However, with only a singletreated unit, the standard errors may not be reliable. We therefore undertake an alternative form ofinference, whereby we randomly assign a single unit to be treated, with treatment beginning in a ran-domly chosen month that is at least 4 months after the first observations in our dataset and as late asthe actual treatment month. We then estimate the TWFE specification in column (1) of Table A-1. Werepeat this procedure 10,000 times to generate a null distribution of the parameter estimate. We thencompute a p-value by calculating the proportion of simulated coefficient estimates that are at least assmall as the actual observed estimate.
The result of this exercise is presented in Figure A-3, which shows a histogram of the null distribu-tion generated using the placebo approach described above. The vertical line shows the actual estimatereported in column (1) of Table A-1. The estimated one-sided p-value is 0.139. In other words, roughly13% of simulations generated a point estimate less than−0.296. We interpret this to be weak evidencein favor of the Salah effect hypothesis.
(1) (2) (3) (4)
Treated −0.296∗∗∗−0.214∗∗∗−0.288∗∗∗−0.152∗
(0.0610) (0.0488) (0.0903) (0.0805)
Observations 969 969 969 969R-squared 0.896 0.932 0.913 0.942Police Force FE ✓ ✓ ✓ ✓Month FE ✓ ✓ ✓ ✓Unit-specific time trend ✓ ✓Weights ✓ ✓
Table A-1: Regression results with monthly annualized hate crime rate as the dependent variable.Robust standard errors, clustered by police force, are reported in parentheses. For comparison, theestimated ATT yielded by the matrix completion method, averaging across post-treatment months,was −0.275. ∗∗∗p < 0.01, ∗∗p < 0.05, ∗p < 0.1.
5
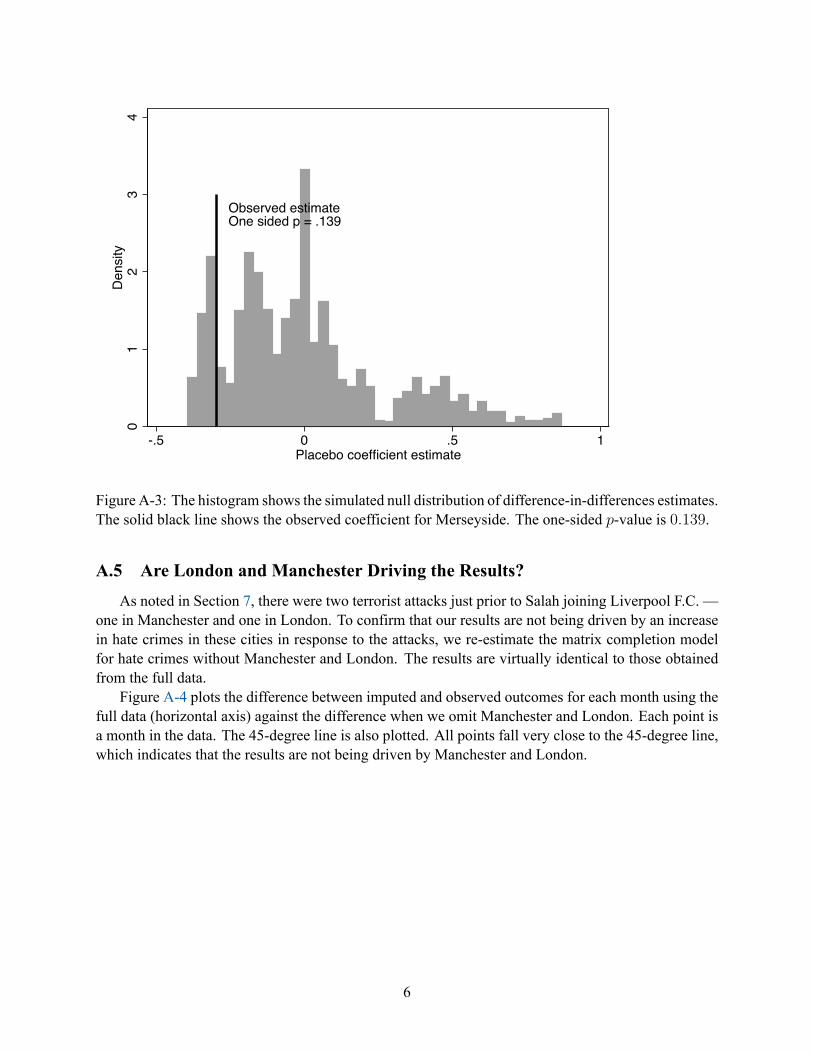
Observed estimateOne sided p = .139
01
23
4De
nsity
-.5 0 .5 1Placebo coefficient estimate
Figure A-3: The histogram shows the simulated null distribution of difference-in-differences estimates.The solid black line shows the observed coefficient for Merseyside. The one-sided p-value is 0.139.
A.5 Are London and Manchester Driving the Results?As noted in Section 7, there were two terrorist attacks just prior to Salah joining Liverpool F.C. —
one in Manchester and one in London. To confirm that our results are not being driven by an increasein hate crimes in these cities in response to the attacks, we re-estimate the matrix completion modelfor hate crimes without Manchester and London. The results are virtually identical to those obtainedfrom the full data.
Figure A-4 plots the difference between imputed and observed outcomes for each month using thefull data (horizontal axis) against the difference when we omit Manchester and London. Each point isa month in the data. The 45-degree line is also plotted. All points fall very close to the 45-degree line,which indicates that the results are not being driven by Manchester and London.
6

●●
●
●
●
●
●
●
●
●
●
●
●
●
●
●
●
●
●
●
●
●
●
●
●
●
●
●
●
●
●
●
●
●
●●
●
●
●
●
−0.4
−0.2
0.0
0.2
−0.4 −0.2 0.0 0.2
ATT using all counties
ATT
om
ittin
g Lo
ndon
and
Man
ches
ter
● ●Pre−treatment Post−treatment
Figure A-4: Difference between observed and imputed outcomes for Merseyside using the full dataset(horizontal axis) and omitting Manchester and London (vertical axis). Each point is a month. The45-degree line is shown.
7

B Twitter Analysis
B.1 Data CollectionAs of 2018, about one quarter of the U.K.’s population was an active Twitter user. While this
constitutes a large subsection of the U.K. population, recent research indicates that U.K. Twitter usersare not representative of the U.K. population as a whole. They are disproportionately young, male, andmore likely to have managerial, administrative, and professional occupations (Sloan, 2017). However,the platform is widely used by British soccer fans, with 3 of the top 20 most followed accounts in theU.K. belonging to English Premier League teams, alongside popular news accounts like the BBC andcelebrities such as Harry Styles and Emma Watson (Social Backers, 2019). Twitter data thus gives usaccess to public messages produced by a large cross-section of U.K. soccer fans.
Looking at soccer fans based in the U.K., we compare the frequency of anti-Muslim tweets pub-lished by fans of Liverpool F.C. relative to fans of other English teams over time. We began by usingTwitter’s API to scrape the account IDs of all followers of the top five most followed teams in theEnglish Premier League: Manchester United F.C. (19 million followers), Arsenal F.C. (14 million),Chelsea F.C. (12 million), Liverpool F.C. (11 million), and Manchester City F.C. (6 million). We alsoscraped the followers of Everton F.C., a smaller team with 1.75 million followers that is also locatedin the city of Liverpool. Fans of both clubs are nearly identical in terms of demographics: the homestadiums are within walking distance of each other, there are no historic political, religious, or so-cial differences between their fanbases, and many Liverpudlian families are mixed in their allegiances(Borden, 2014). Evertonians thus constitute the closest comparison group in the sample, with one keydifference as a result of their fierce rivalry: exposure to Salah may skew negative for Evertonians, butis positive and goal-aligned for Liverpool F.C. fans.
After obtaining followers’ account IDs, we collected our sample of tweets as follows. First, toensure that the users in our sample had been soccer fans prior to Salah joining Liverpool, we subset ourfollower IDs to the oldest 500,000 followers of each team. Follower IDs are scraped from Twitter’sAPI in the reverse order that the users began following the account, with newer users appearing first.This feature of the data enables us to identify long-term fans of each team, given that the team accountshave been popular for almost a decade and now have millions of followers. Then, to ensure that usersin our sample were located in the U.K., we again used Twitter’s API to download profile metadatafor the 500,000 oldest followers of each team.8 We then used their “user.location” metadata field todetermine if each user was located in the U.K. based on the text of their self-reported locations.9 Oncewe identified longtime Twitter followers of English Premier League teams that were likely to be located
8This method ensures that the sample joined Twitter before the treatment. For instance, the 500,000
most recent followers for Liverpool F.C., and the most recent accounts, were created between 2015 and
mid-2016.9Users were classified as being located in the U.K. if their “user.location” metadata field contained
either a city or country keyword indicating that the user was located in the U.K. City keywords were
obtained using the maps package in R. While this method does not necessarily capture all fans of
these soccer teams located in the U.K., as many users do not provide any location metadata at all, it
8

in the U.K., we randomly sampled 10,000 followers from each team. We used Twitter’s API a finaltime to scrape up to 3,200 of the most recent tweets published by each of these 60,000 U.K. soccerfans.10 This resulted in a dataset of approximately 15 million tweets produced by the 60,000 Englishfollowers of the “Big Five” clubs of English soccer plus Everton F.C.
In order to identify anti-Muslim tweets, which are relatively rare in this dataset of all tweets pro-duced by soccer fans in the U.K. (approximately .03% of all tweets), we first identified all tweetsbroadly about Muslims in our dataset. We began with the terms “muslim” and “islam” and useda word2vec model (a neural network that processes text) to find other relevant terms in the data.This yielded the following broad relevant keywords: “arab,” “arabs,” “islam,” “muslims,” “muslim,”“mosque,” and “mosques.”11 About 44,000 of the 15 million tweets in our dataset contained one ofthese relevant keywords. We then took a sample of about 1,500 of these tweets containing a keywordrelevant to Muslims or Islam and used Figure8 (formerly Crowdflower), a crowd-sourced data enrich-ment platform, to have three native English speakers code each of these 1,500 tweets as anti-Muslimor not.12
ensures that our sample consists only of likely U.K. residents. As Hecht et al. (2011) demonstrate, a
user’s country and state can be determined with decent accuracy using self-reported Twitter data, and
users often reveal location information with or without realizing it. Similarly, Mislove et al. (2011)
explain that because large numbers of users report their location in the “user.location” field and in
aggregate these reports are quite accurate, this is a reasonable way to determine a user’s location. This
is particularly true given that we are more interested in obtaining a high degree of precision (ensuring
that the users are actually U.K. residents) than recall (obtaining the entire population of tweets sent by
U.K. residents).10The 3,200 tweet limit is imposed by Twitter’s API and for most Twitter users covers their entire
Twitter timelines beginning on the day they first joined the platform.11The word2vec model also identified many irrelevant keywords to our study such as “rohingya”
(in reference to the ongoing conflict in Myanmar) and “assad” (in reference to the Syria conflict). We
only chose to include relevant keywords that were among the top 50 words that the word2vec model
indicated were most similar to the terms “muslim” and “islam.” Although most British Muslims are
of South Asian descent, the word ”pakistani” did not appear in the top 50 words identified by the
word2vec model and therefore we did not use it as keyword to filter our data.12The instructions provided to coders are displayed in Appendix B. For more information on using
Figure8 (formerly Crowdflower) to code data for training classifiers, see Benoit et al. (2016).
9
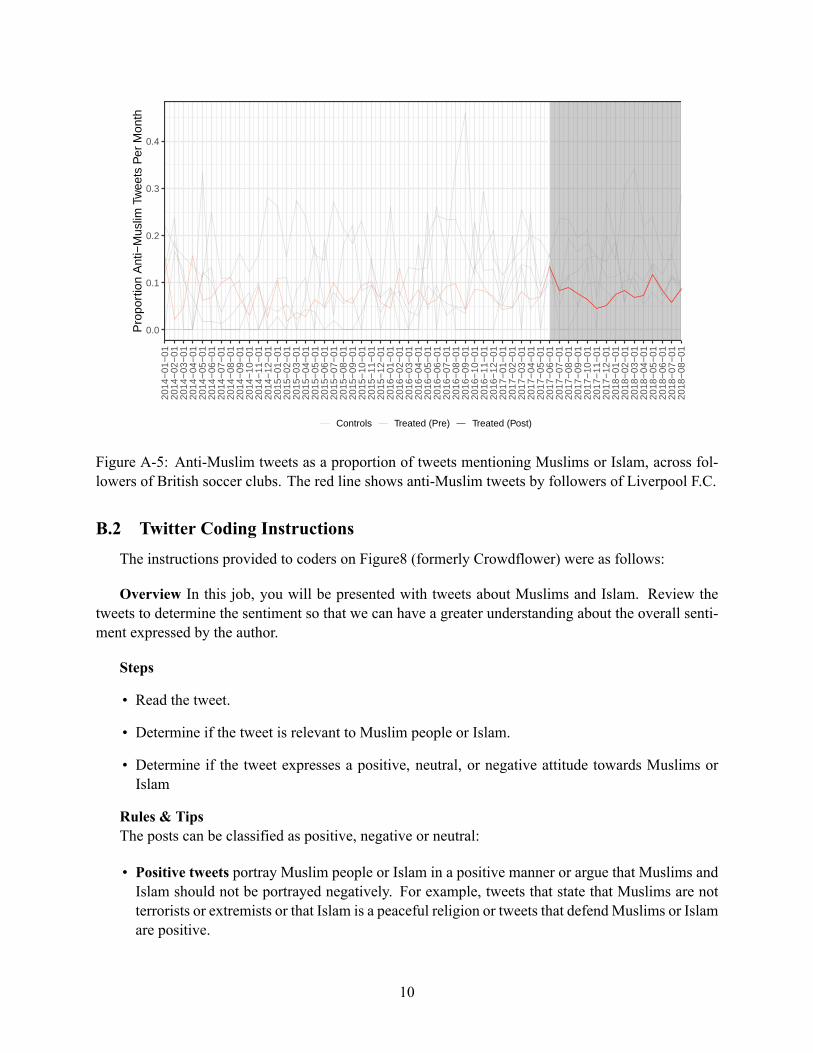
0.0
0.1
0.2
0.3
0.4
2014
−01
−01
2014
−02
−01
2014
−03
−01
2014
−04
−01
2014
−05
−01
2014
−06
−01
2014
−07
−01
2014
−08
−01
2014
−09
−01
2014
−10
−01
2014
−11
−01
2014
−12
−01
2015
−01
−01
2015
−02
−01
2015
−03
−01
2015
−04
−01
2015
−05
−01
2015
−06
−01
2015
−07
−01
2015
−08
−01
2015
−09
−01
2015
−10
−01
2015
−11
−01
2015
−12
−01
2016
−01
−01
2016
−02
−01
2016
−03
−01
2016
−04
−01
2016
−05
−01
2016
−06
−01
2016
−07
−01
2016
−08
−01
2016
−09
−01
2016
−10
−01
2016
−11
−01
2016
−12
−01
2017
−01
−01
2017
−02
−01
2017
−03
−01
2017
−04
−01
2017
−05
−01
2017
−06
−01
2017
−07
−01
2017
−08
−01
2017
−09
−01
2017
−10
−01
2017
−11
−01
2017
−12
−01
2018
−01
−01
2018
−02
−01
2018
−03
−01
2018
−04
−01
2018
−05
−01
2018
−06
−01
2018
−07
−01
2018
−08
−01
Pro
port
ion
Ant
i−M
uslim
Tw
eets
Per
Mon
th
Controls Treated (Pre) Treated (Post)
Figure A-5: Anti-Muslim tweets as a proportion of tweets mentioning Muslims or Islam, across fol-lowers of British soccer clubs. The red line shows anti-Muslim tweets by followers of Liverpool F.C.
B.2 Twitter Coding InstructionsThe instructions provided to coders on Figure8 (formerly Crowdflower) were as follows:
Overview In this job, you will be presented with tweets about Muslims and Islam. Review thetweets to determine the sentiment so that we can have a greater understanding about the overall senti-ment expressed by the author.
Steps
• Read the tweet.
• Determine if the tweet is relevant to Muslim people or Islam.
• Determine if the tweet expresses a positive, neutral, or negative attitude towards Muslims orIslam
Rules & TipsThe posts can be classified as positive, negative or neutral:
• Positive tweets portray Muslim people or Islam in a positive manner or argue that Muslims andIslam should not be portrayed negatively. For example, tweets that state that Muslims are notterrorists or extremists or that Islam is a peaceful religion or tweets that defendMuslims or Islamare positive.
10

• Neutral tweets are only informative in nature and provide no hint as to the mood of the author.They do not express an opinion about Muslims or Islam.
• Negative tweets are tweets in which some aspects of the tweet uncover a negative mood suchas, criticism, insults or a negative comparison. These include tweets portraying Muslims asterrorists, extremists, or violent, and those making negative generalizations about Muslims orIslam as a whole.
• Irrelevant tweets do not mention Muslims or Islam or are not in English. These include tweetswhere the word “Muslim” or “Islam” appears in the handle of a Twitter user and tweets in foreignlanguages, for example.
• Note: Tweets that are purely factual (links to news articles without comment) are not necessarilyNeutral — consider whether the fact/news itself is Positive or Negative regarding the businessand select one of those when possible.
B.3 Twitter Data Descriptive Statistics
Table A-2: Proportion of Anti-Muslim Tweets Pre and Post-Salah
type team post_salah meanAnti-Muslim / Muslim Relevant liverpool 0 0.073Anti-Muslim / Muslim Relevant liverpool 1 0.076Anti-Muslim / Muslim Relevant other teams 0 0.102Anti-Muslim / Muslim Relevant other teams 1 0.115
B.4 Twitter Data Additional Data AnalysisAs an alternative method of analyzing the effect of Salah joining Liverpool on the monthly pro-
portion of anti-Muslim tweets produced by Liverpool fans, we conduct difference-in-differences esti-mation as follows:
y = β0 + β1T + β2L+ β3(T · L) + ε (A-2)
Here T is a dummy variable for the time period, equal to 1 in the post-Salah period and 0 in the pre-Salah period, andL is a dummy variable for Liverpool group membership, equal to 1 for Liverpool and0 for other teams. The interacted term (T · L) is a dummy variable indicating when L = T = 1. If thecoefficient β3 on (T · L) is negative, as expected, then Liverpool fans tweet less anti-Muslim contentin the post-Salah period relative to the pre-Salah period, compared to fans of other teams. We conductthis analysis comparing Liverpool fans’ tweets to tweets produced by fans of other large teams as wellas Everton F.C.. We use the proportion of anti-Muslim tweets (anti-Muslim tweets / tweets relevant toIslam or Muslims) as our outcome variable y.
Because there is only one treated unit and standard errors may be misleading, we again undertakean alternative form of inference, whereby we randomly assign a single unit to be treated, with treatmentbeginning in a randomly chosen month that is at least 4 months after the first observations in our datasetand as late as the actual treatment month. We then estimate the difference-in-difference model above.
11
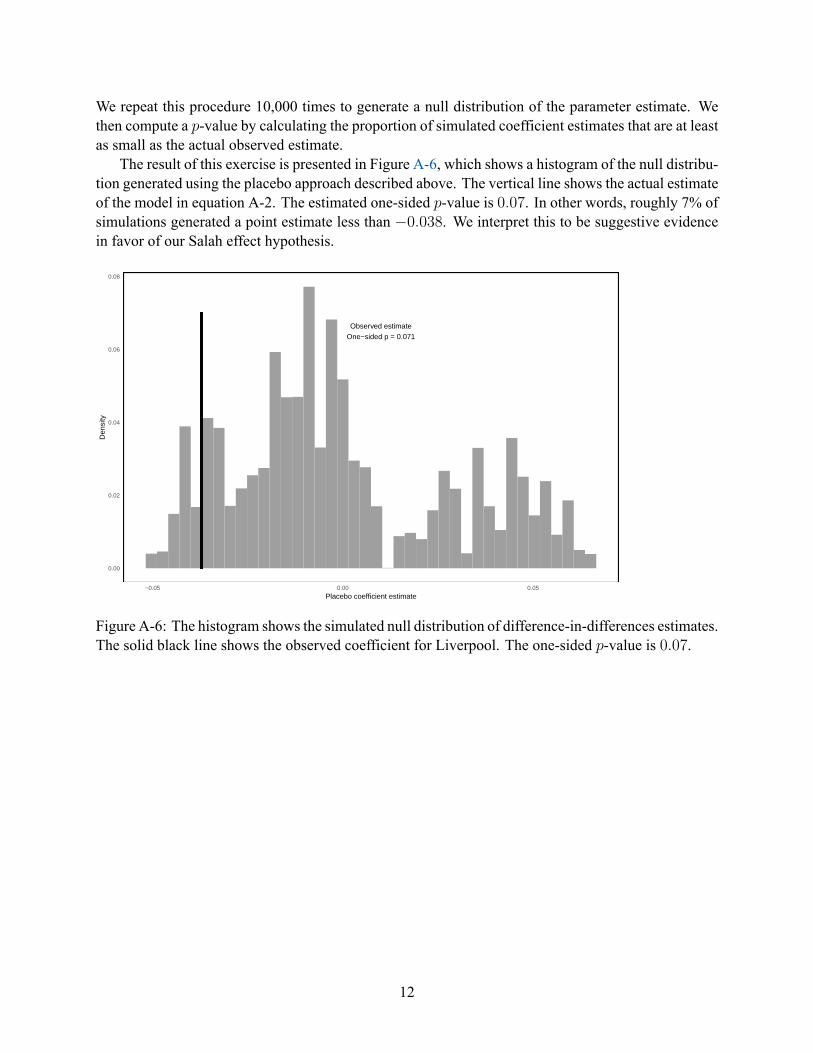
We repeat this procedure 10,000 times to generate a null distribution of the parameter estimate. Wethen compute a p-value by calculating the proportion of simulated coefficient estimates that are at leastas small as the actual observed estimate.
The result of this exercise is presented in Figure A-6, which shows a histogram of the null distribu-tion generated using the placebo approach described above. The vertical line shows the actual estimateof the model in equation A-2. The estimated one-sided p-value is 0.07. In other words, roughly 7% ofsimulations generated a point estimate less than −0.038. We interpret this to be suggestive evidencein favor of our Salah effect hypothesis.
Observed estimate
One−sided p = 0.071
0.00
0.02
0.04
0.06
0.08
−0.05 0.00 0.05
Placebo coefficient estimate
Den
sity
Figure A-6: The histogram shows the simulated null distribution of difference-in-differences estimates.The solid black line shows the observed coefficient for Liverpool. The one-sided p-value is 0.07.
12
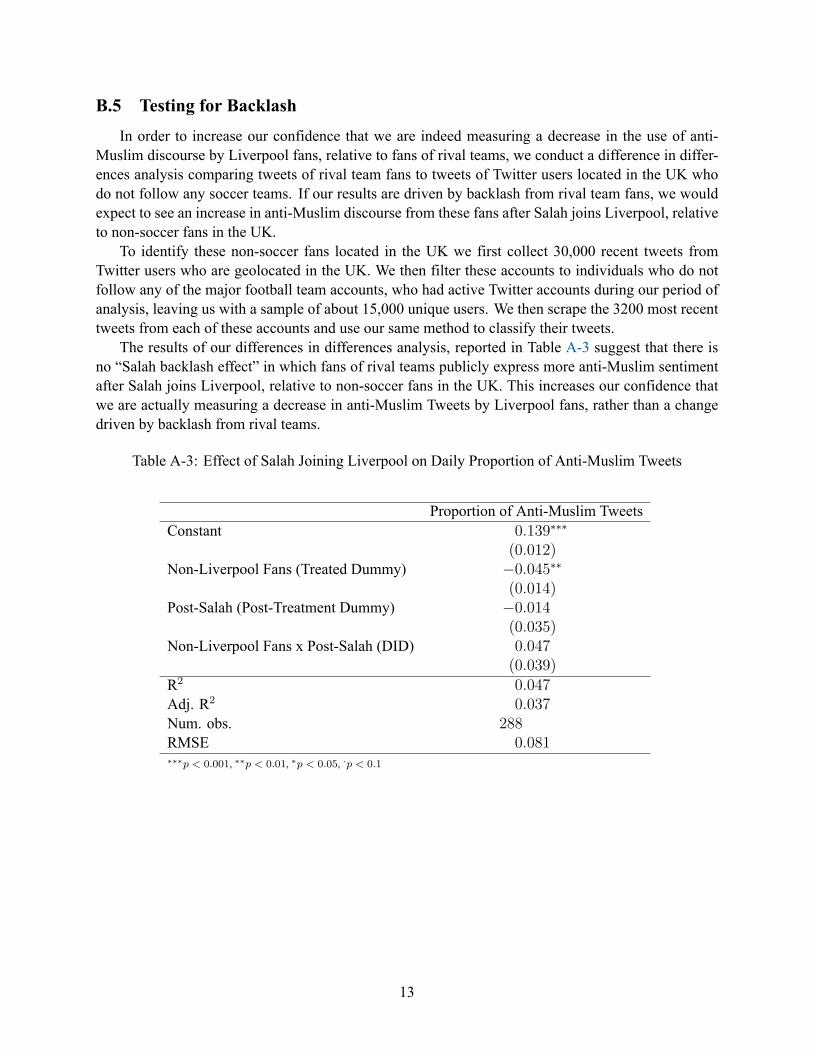
B.5 Testing for BacklashIn order to increase our confidence that we are indeed measuring a decrease in the use of anti-
Muslim discourse by Liverpool fans, relative to fans of rival teams, we conduct a difference in differ-ences analysis comparing tweets of rival team fans to tweets of Twitter users located in the UK whodo not follow any soccer teams. If our results are driven by backlash from rival team fans, we wouldexpect to see an increase in anti-Muslim discourse from these fans after Salah joins Liverpool, relativeto non-soccer fans in the UK.
To identify these non-soccer fans located in the UK we first collect 30,000 recent tweets fromTwitter users who are geolocated in the UK. We then filter these accounts to individuals who do notfollow any of the major football team accounts, who had active Twitter accounts during our period ofanalysis, leaving us with a sample of about 15,000 unique users. We then scrape the 3200 most recenttweets from each of these accounts and use our same method to classify their tweets.
The results of our differences in differences analysis, reported in Table A-3 suggest that there isno “Salah backlash effect” in which fans of rival teams publicly express more anti-Muslim sentimentafter Salah joins Liverpool, relative to non-soccer fans in the UK. This increases our confidence thatwe are actually measuring a decrease in anti-Muslim Tweets by Liverpool fans, rather than a changedriven by backlash from rival teams.
Table A-3: Effect of Salah Joining Liverpool on Daily Proportion of Anti-Muslim Tweets
Proportion of Anti-Muslim TweetsConstant 0.139∗∗∗
(0.012)Non-Liverpool Fans (Treated Dummy) −0.045∗∗
(0.014)Post-Salah (Post-Treatment Dummy) −0.014
(0.035)Non-Liverpool Fans x Post-Salah (DID) 0.047
(0.039)R2 0.047Adj. R2 0.037Num. obs. 288RMSE 0.081∗∗∗p < 0.001, ∗∗p < 0.01, ∗p < 0.05, ·p < 0.1
13

C Mané Effect Analysis
C.1 Liverpool Echo
ManeJoins
SalahJoins
0.00
0.05
0.10
0.15
2013
−06
2013
−09
2013
−12
2014
−03
2014
−06
2014
−09
2014
−12
2015
−03
2015
−06
2015
−09
2015
−12
2016
−03
2016
−06
2016
−09
2016
−12
2017
−03
2017
−06
2017
−09
2017
−12
2018
−03
2018
−06
2018
−09
2018
−12
2019
−03
2019
−06
Date
Per
cent
of a
rtic
les
per
mon
th
Mane Salah
Percent of Headlines Mentioning Player
Figure A-7: Percent of monthly titles in Liverpool Echo that mention Mané or Salah
C.2 Hate CrimesHere, we repeat the same matrix completion analysis of hate crime data as in the main text, except
treating July 2016 — the month in which Sadio Mané signed with Liverpool — as the beginning oftreatment. Additionally, to avoid picking up the Salah effect, we truncate the data to before Salahsigned.
The results are shown in Figure A-8. Overall, we see no consistent difference between observed andimputed hate crimes in Merseyside after Mané joined Liverpool (but before Salah joined). Averagingacross post-treatment months, the estimated ATT is 0.017 (S.E. = 0.049), which corresponds to a1.3% increase in the hate crime rate — though this result is not statistically significant.
C.3 TwitterWe also repeat the same matrix completion analysis of Twitter data as in the main text, except
treating July 2016 — the month in which Sadio Mané signed with Liverpool — as the beginning oftreatment. Additionally, to avoid picking up the Salah effect, we truncate the data to before Salahsigned.
14

(a) Observed and imputed outcomes for Merseyside
1.00
1.25
1.50
1.75
2.00
2.25
2015
−01
−01
2015
−02
−01
2015
−03
−01
2015
−04
−01
2015
−05
−01
2015
−06
−01
2015
−07
−01
2015
−08
−01
2015
−09
−01
2015
−10
−01
2015
−11
−01
2015
−12
−01
2016
−01
−01
2016
−02
−01
2016
−03
−01
2016
−04
−01
2016
−05
−01
2016
−06
−01
2016
−07
−01
2016
−08
−01
2016
−09
−01
2016
−10
−01
2016
−11
−01
2016
−12
−01
2017
−01
−01
2017
−02
−01
2017
−03
−01
2017
−04
−01
2017
−05
−01
2017
−06
−01
Mon
thly
hat
e cr
ime
rate
Treated Estimated Y(0)
(b) Estimated ATT in every period
−0.50
−0.25
0.00
0.25
0.50
−10 0 10
Months relative to treatment
Obs
erve
d −
Impu
ted
for
Mer
seys
ide
Figure A-8: Matrix completion results for hate crime outcomes, treating Sadio Mané’s signing asthe beginning of treatment. The top panel shows the observed (solid line) and imputed (dashed line)monthly hate crime rates in Merseyside. The bottom panel shows the difference between the observedand imputed outcomes. In the post-treatment period, this is the estimate of the ATT.
15

The results are shown in Figure A-9. Unlike the hate crime data, here we do observe a significantdecrease between observed and imputed anti-Muslim tweets inMerseyside afterMané joined Liverpool(but before Salah joined). Averaging across post-treatment months, the estimated ATT is −0.043(S.E. = 0.007), which corresponds to a 59.8% decrease in the proportion of anti-Muslim tweets.
16

(a) Observed and imputed outcomes for Merseyside
2014
−01
−01
2014
−02
−01
2014
−03
−01
2014
−04
−01
2014
−05
−01
2014
−06
−01
2014
−07
−01
2014
−08
−01
2014
−09
−01
2014
−10
−01
2014
−11
−01
2014
−12
−01
2015
−01
−01
2015
−02
−01
2015
−03
−01
2015
−04
−01
2015
−05
−01
2015
−06
−01
2015
−07
−01
2015
−08
−01
2015
−09
−01
2015
−10
−01
2015
−11
−01
2015
−12
−01
2016
−01
−01
2016
−02
−01
2016
−03
−01
2016
−04
−01
2016
−05
−01
2016
−06
−01
2016
−07
−01
2016
−08
−01
2016
−09
−01
2016
−10
−01
2016
−11
−01
2016
−12
−01
2017
−01
−01
2017
−02
−01
2017
−03
−01
2017
−04
−01
2017
−05
−01
Mon
thly
Pro
port
ion
of a
nti−
Mus
lim T
wee
ts
Treated Estimated Y(0)
(b) Estimated ATT in every period
−0.10
−0.05
0.00
0.05
0.10
0.15
0.20
0.25
−30 −25 −20 −15 −10 −5 0 5 10
Months relative to treatment
Obs
erve
d −
Impu
ted
Controls Treated (Pre) Treated (Post)
Figure A-9: Matrix completion results for tweet outcomes, treating Sadio Mané’s signing as the begin-ning of treatment. The top panel shows the observed (solid line) and imputed (dashed line) monthlyproportion of anti-Muslim tweets produced by Liverpool fans. The bottom panel shows the differencebetween the observed and imputed outcomes in Liverpool fans’ tweets (red line) relative to tweets pro-duced by fans of other U.K. football clubs (gray lines). In the post-treatment period, this is the estimateof the ATT.
17

D Survey Experiment
D.1 Survey experiment designThe survey experiment is a 2 × 2 factorial design embedded in the survey, in addition to a pure
control group. First, we provided the treated respondents with a vignette emphasizing Salah’s success(Success Condition) or speculation about his potentially declining performance (Failure Condition).13This factor is designed to test the “model minority” dimension of the positivity condition for prejudicereduction. Next, treated respondents saw another vignette emphasizing either Salah’s religiosity (Re-ligiosity Condition) or agreeable character (Character Condition).
D.2 Vignette DescriptionsRespondents in the success condition saw a picture of Mo Salah holding the Golden Boot with the
following text:
In the 2017-18 season, Salah scored 43 goals for Liverpool, setting numerous club andleague records along the way. For his efforts, he was named the Premier League’sPlayer of the Month three times, won the Golden Boot, and was awarded the PFAPlayers’ Player of the Year award. Along with Christiano Ronaldo and Luca Modric,he was shortlisted for UEFA Player of the Year. He recently won the FIFA Puskásaward for best goal.Salah was also central in taking Egypt to the World Cup and Liverpool F.C. to theChampions League final.
Respondents in the failure treatment saw an image of Salah looking regretful with the followingtext:
Despite a successful 2017-18 season, some believe he is underperforming this season.As of late October, he had scored only 4 goals in Premier League play.14 Due to thislackluster performance, some critics have suggested that Salah will be a ‘one-seasonwonder.’
After the success/failure treatment, respondents then received a treatment emphasizing either Salah’scharacter or his religiosity. Respondents who received the character treatment saw a picture of Salahwith his daughter and the following text:
13In the beginning of the 2018-2019 season, when we fielded the experiment, Salah got off to a
slower start than the previous season, which the vignette in the Failure Condition emphasized.14This statistic was updated for respondents taking the survey in or after January 1, 2019 to read:
“As of early January, he had scored in just 62% of Premier League games played — compared to 89%
last season.
18

In addition to his goal-scoring, Salah is known for his character both on and off thepitch. In his native Egypt, Salah privately donated millions of pounds to charity andto a leading anti-drug campaign. Always a sportsman, Salah does not celebrate goalsagainst his former teams and picked up only two yellow cards in 49 matches for Liv-erpool last season.
Respondents in the religious treatment saw Salah prostrating with this text:
In addition to his goal scoring, Salah is known for an attachment to his Muslim identityboth on and off the pitch. After every goal he scores, Salah touches his head to theground in prayer. He also fasts during Ramadan (except on match days) and shareswell wishes with his followers on social media during Islamic holidays. He named hisdaughter Makka after Islam’s holiest site (Mecca).
19
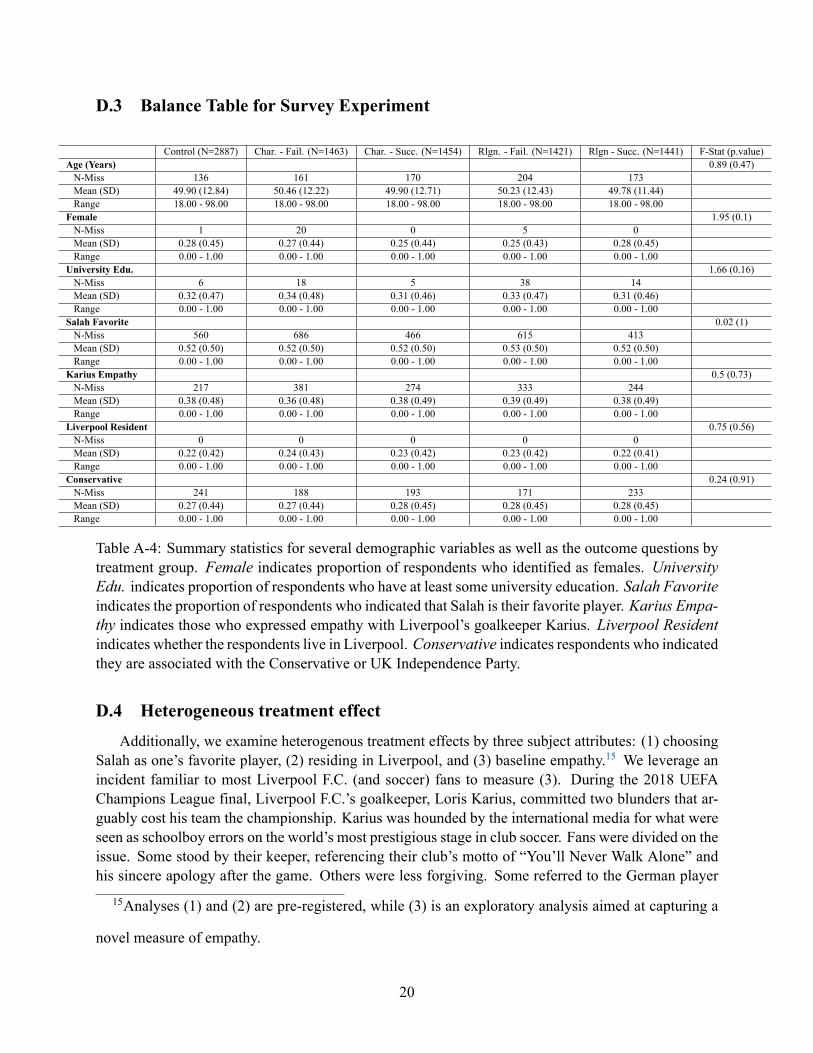
D.3 Balance Table for Survey Experiment
Control (N=2887) Char. - Fail. (N=1463) Char. - Succ. (N=1454) Rlgn. - Fail. (N=1421) Rlgn - Succ. (N=1441) F-Stat (p.value)Age (Years) 0.89 (0.47)N-Miss 136 161 170 204 173Mean (SD) 49.90 (12.84) 50.46 (12.22) 49.90 (12.71) 50.23 (12.43) 49.78 (11.44)Range 18.00 - 98.00 18.00 - 98.00 18.00 - 98.00 18.00 - 98.00 18.00 - 98.00
Female 1.95 (0.1)N-Miss 1 20 0 5 0Mean (SD) 0.28 (0.45) 0.27 (0.44) 0.25 (0.44) 0.25 (0.43) 0.28 (0.45)Range 0.00 - 1.00 0.00 - 1.00 0.00 - 1.00 0.00 - 1.00 0.00 - 1.00
University Edu. 1.66 (0.16)N-Miss 6 18 5 38 14Mean (SD) 0.32 (0.47) 0.34 (0.48) 0.31 (0.46) 0.33 (0.47) 0.31 (0.46)Range 0.00 - 1.00 0.00 - 1.00 0.00 - 1.00 0.00 - 1.00 0.00 - 1.00
Salah Favorite 0.02 (1)N-Miss 560 686 466 615 413Mean (SD) 0.52 (0.50) 0.52 (0.50) 0.52 (0.50) 0.53 (0.50) 0.52 (0.50)Range 0.00 - 1.00 0.00 - 1.00 0.00 - 1.00 0.00 - 1.00 0.00 - 1.00
Karius Empathy 0.5 (0.73)N-Miss 217 381 274 333 244Mean (SD) 0.38 (0.48) 0.36 (0.48) 0.38 (0.49) 0.39 (0.49) 0.38 (0.49)Range 0.00 - 1.00 0.00 - 1.00 0.00 - 1.00 0.00 - 1.00 0.00 - 1.00
Liverpool Resident 0.75 (0.56)N-Miss 0 0 0 0 0Mean (SD) 0.22 (0.42) 0.24 (0.43) 0.23 (0.42) 0.23 (0.42) 0.22 (0.41)Range 0.00 - 1.00 0.00 - 1.00 0.00 - 1.00 0.00 - 1.00 0.00 - 1.00
Conservative 0.24 (0.91)N-Miss 241 188 193 171 233Mean (SD) 0.27 (0.44) 0.27 (0.44) 0.28 (0.45) 0.28 (0.45) 0.28 (0.45)Range 0.00 - 1.00 0.00 - 1.00 0.00 - 1.00 0.00 - 1.00 0.00 - 1.00
Table A-4: Summary statistics for several demographic variables as well as the outcome questions bytreatment group. Female indicates proportion of respondents who identified as females. UniversityEdu. indicates proportion of respondents who have at least some university education. Salah Favoriteindicates the proportion of respondents who indicated that Salah is their favorite player. Karius Empa-thy indicates those who expressed empathy with Liverpool’s goalkeeper Karius. Liverpool Residentindicates whether the respondents live in Liverpool. Conservative indicates respondents who indicatedthey are associated with the Conservative or UK Independence Party.
D.4 Heterogeneous treatment effectAdditionally, we examine heterogenous treatment effects by three subject attributes: (1) choosing
Salah as one’s favorite player, (2) residing in Liverpool, and (3) baseline empathy.15 We leverage anincident familiar to most Liverpool F.C. (and soccer) fans to measure (3). During the 2018 UEFAChampions League final, Liverpool F.C.’s goalkeeper, Loris Karius, committed two blunders that ar-guably cost his team the championship. Karius was hounded by the international media for what wereseen as schoolboy errors on the world’s most prestigious stage in club soccer. Fans were divided on theissue. Some stood by their keeper, referencing their club’s motto of “You’ll Never Walk Alone” andhis sincere apology after the game. Others were less forgiving. Some referred to the German player
15Analyses (1) and (2) are pre-registered, while (3) is an exploratory analysis aimed at capturing a
novel measure of empathy.
20
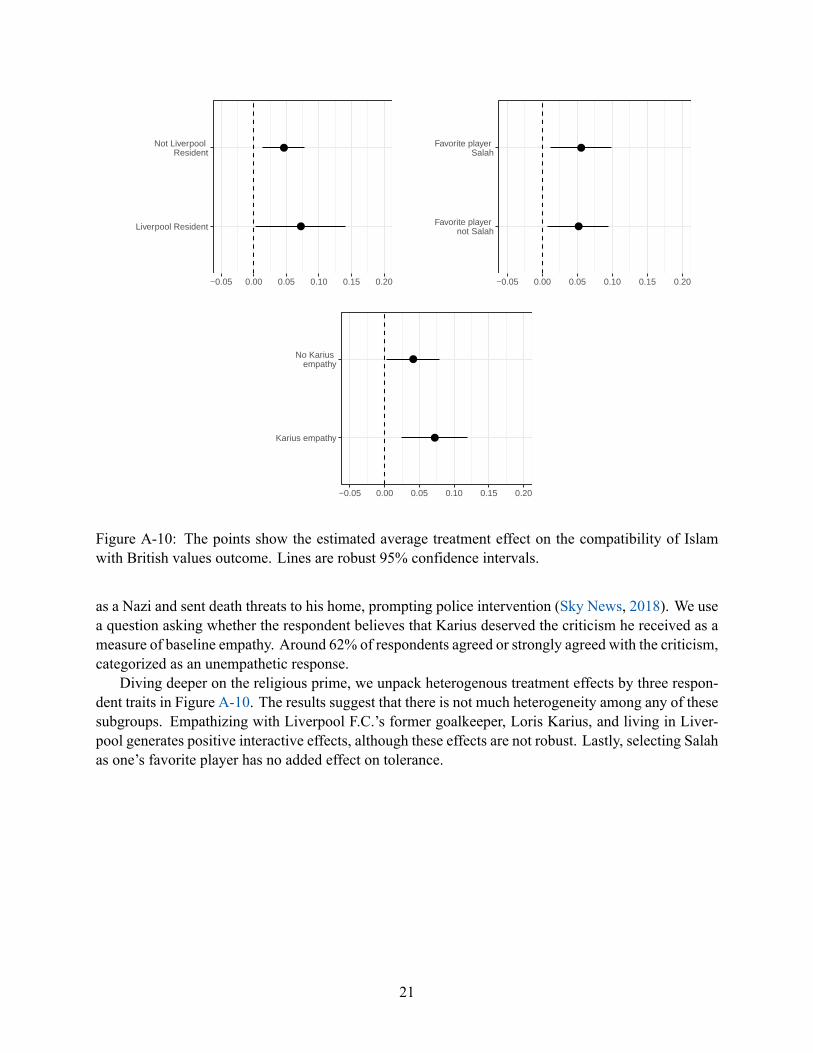
●
●Liverpool Resident
Not Liverpool Resident
−0.05 0.00 0.05 0.10 0.15 0.20
●
●
Favorite player not Salah
Favorite player Salah
−0.05 0.00 0.05 0.10 0.15 0.20
●
●Karius empathy
No Karius empathy
−0.05 0.00 0.05 0.10 0.15 0.20
Figure A-10: The points show the estimated average treatment effect on the compatibility of Islamwith British values outcome. Lines are robust 95% confidence intervals.
as a Nazi and sent death threats to his home, prompting police intervention (Sky News, 2018). We usea question asking whether the respondent believes that Karius deserved the criticism he received as ameasure of baseline empathy. Around 62% of respondents agreed or strongly agreed with the criticism,categorized as an unempathetic response.
Diving deeper on the religious prime, we unpack heterogenous treatment effects by three respon-dent traits in Figure A-10. The results suggest that there is not much heterogeneity among any of thesesubgroups. Empathizing with Liverpool F.C.’s former goalkeeper, Loris Karius, and living in Liver-pool generates positive interactive effects, although these effects are not robust. Lastly, selecting Salahas one’s favorite player has no added effect on tolerance.
21

D.5 Additional Analyses
●
●
Failure
Success
−0.10 −0.05 0.00 0.05
Estimate
Trea
tmen
t
Treatment Effect on Views of Salah's Performance
Figure A-11: Effects of treatments on views of Salah’s performance
●
●
●
●
●
●
●
●
●
●
●
●
●
●
●
●
Islam compatible with British values (0−1) PC Outcome
Feel common with Muslims (0−1)
Impact of Immigrants on the U.K. (0−1)
−0.1 0.0 0.1 −0.1 0.0 0.1
Character − Failure
Character − Success
Religion − Failure
Religion − Success
Character − Failure
Character − Success
Religion − Failure
Religion − Success
Estimate
Trea
tmen
t
Figure A-12: Coefficient plots representing the average treatment effects on the four outcomes, relativeto the pure control condition. The first three outcome variables are binary, while the the fourth is acontinuous variable with mean of zero and unit variance. Bars show 95% robust confidence intervals.
22

●
●
●
●
●
●
●
●
Islam compatible with British values (0−1) PC Outcome
Feel common with Muslims (0−1)
Impact of Immigrants on the U.K. (0−1)
−0.05 0.00 0.05 0.10 0.15 −0.05 0.00 0.05 0.10 0.15
Character
Religion
Character
Religion
Estimate
Trea
tmen
t
Figure A-13: Coefficient Plot for the average marginal component effects of the religion/charactertreatment
23

●
●
●
●
●
●
●
●
Islam compatible with British values (0−1) PC Outcome
Feel common with Muslims (0−1)
Impact of Immigrants on the U.K. (0−1)
−0.05 0.00 0.05 0.10 −0.05 0.00 0.05 0.10
Failure
Success
Failure
Success
Estimate
Trea
tmen
t
Figure A-14: Coefficient Plot for the average marginal component effects of the success/failure treat-ment
Islam compatible with British values (0−1) PC Outcome
Feel common with Muslims (0−1)
Impact of Immigrants on the U.K. (0−1)
0.0
0.1
0.2
0.3
0.4
0.5
−0.03
0.00
0.03
0.06
0.0
0.2
0.4
0.6
0.00
0.05
0.10
0.15
0.20
treatment
outc
ome
Pure Control Character − Failure Character − Success Religion − Failure Religion − Success
Figure A-15: Average of each outcome by treatment group
24

PC Outcome Muslims Common Islam Compatible Immigrant ImpactConstant −0.02 0.57∗∗∗ 0.18∗∗∗ 0.46∗∗∗
(0.03) (0.01) (0.01) (0.01)Religion 0.08∗ 0.01 0.05∗∗∗ −0.01
(0.04) (0.02) (0.02) (0.02)R2 0.00 0.00 0.00 0.00Adj. R2 0.00 0.00 0.00 -0.00Num. obs. 4997 5361 5168 5032RMSE 2.14 1.05 0.87 1.06∗∗∗p < 0.001, ∗∗p < 0.01, ∗p < 0.05
Table A-5: Main regressions using the character/religion treatments.
PC Outcome Muslims Common Islam Compatible Immigrant ImpactConstant −0.02 0.57∗∗∗ 0.18∗∗∗ 0.46∗∗∗
(0.03) (0.01) (0.01) (0.01)Character - Failure −0.02 −0.02 −0.01 0.00
(0.04) (0.02) (0.02) (0.02)Character - Success 0.00 −0.02 0.02 −0.02
(0.05) (0.02) (0.02) (0.02)Religion - Failure 0.09 0.00 0.06∗∗ 0.00
(0.05) (0.02) (0.02) (0.02)Religion - Success 0.07 0.03 0.04∗ −0.01
(0.05) (0.02) (0.02) (0.02)R2 0.00 0.00 0.00 0.00Adj. R2 0.00 0.00 0.00 -0.00Num. obs. 7515 8060 7771 7571RMSE 2.25 1.11 0.90 1.12∗∗∗p < 0.001, ∗∗p < 0.01, ∗p < 0.05
Table A-6: Average treatment effects for the main outcomes.
25
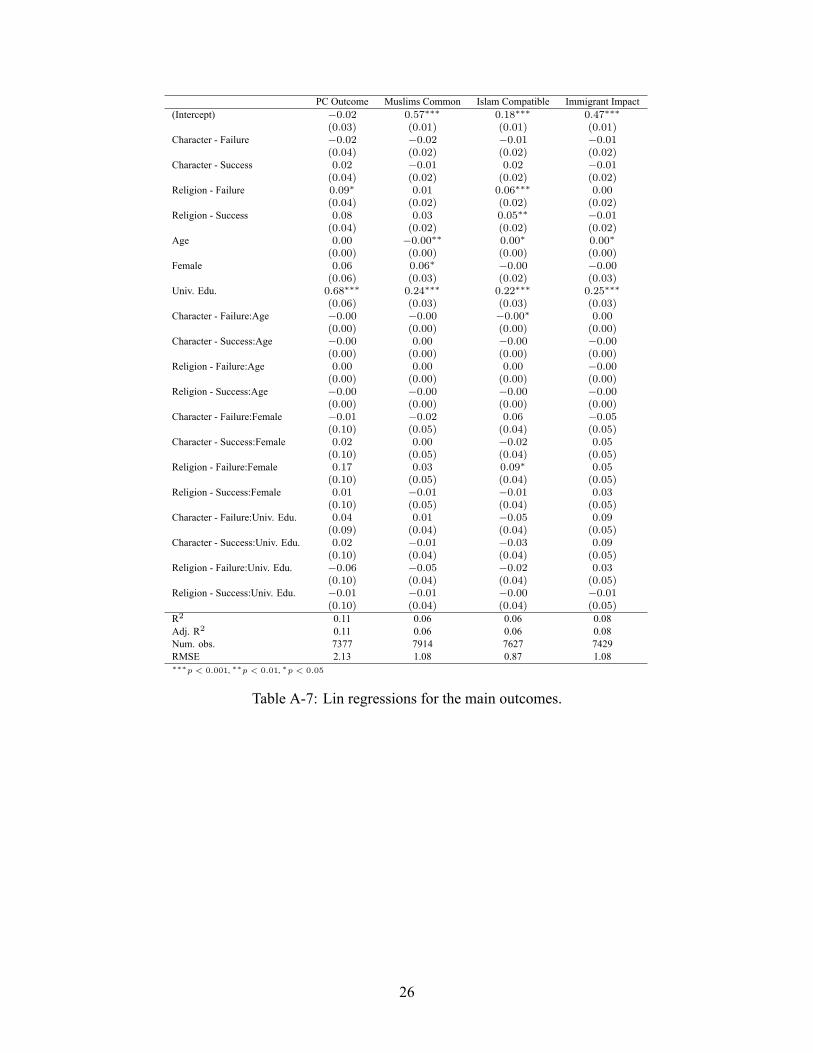
PC Outcome Muslims Common Islam Compatible Immigrant Impact(Intercept) −0.02 0.57∗∗∗ 0.18∗∗∗ 0.47∗∗∗
(0.03) (0.01) (0.01) (0.01)Character - Failure −0.02 −0.02 −0.01 −0.01
(0.04) (0.02) (0.02) (0.02)Character - Success 0.02 −0.01 0.02 −0.01
(0.04) (0.02) (0.02) (0.02)Religion - Failure 0.09∗ 0.01 0.06∗∗∗ 0.00
(0.04) (0.02) (0.02) (0.02)Religion - Success 0.08 0.03 0.05∗∗ −0.01
(0.04) (0.02) (0.02) (0.02)Age 0.00 −0.00∗∗ 0.00∗ 0.00∗
(0.00) (0.00) (0.00) (0.00)Female 0.06 0.06∗ −0.00 −0.00
(0.06) (0.03) (0.02) (0.03)Univ. Edu. 0.68∗∗∗ 0.24∗∗∗ 0.22∗∗∗ 0.25∗∗∗
(0.06) (0.03) (0.03) (0.03)Character - Failure:Age −0.00 −0.00 −0.00∗ 0.00
(0.00) (0.00) (0.00) (0.00)Character - Success:Age −0.00 0.00 −0.00 −0.00
(0.00) (0.00) (0.00) (0.00)Religion - Failure:Age 0.00 0.00 0.00 −0.00
(0.00) (0.00) (0.00) (0.00)Religion - Success:Age −0.00 −0.00 −0.00 −0.00
(0.00) (0.00) (0.00) (0.00)Character - Failure:Female −0.01 −0.02 0.06 −0.05
(0.10) (0.05) (0.04) (0.05)Character - Success:Female 0.02 0.00 −0.02 0.05
(0.10) (0.05) (0.04) (0.05)Religion - Failure:Female 0.17 0.03 0.09∗ 0.05
(0.10) (0.05) (0.04) (0.05)Religion - Success:Female 0.01 −0.01 −0.01 0.03
(0.10) (0.05) (0.04) (0.05)Character - Failure:Univ. Edu. 0.04 0.01 −0.05 0.09
(0.09) (0.04) (0.04) (0.05)Character - Success:Univ. Edu. 0.02 −0.01 −0.03 0.09
(0.10) (0.04) (0.04) (0.05)Religion - Failure:Univ. Edu. −0.06 −0.05 −0.02 0.03
(0.10) (0.04) (0.04) (0.05)Religion - Success:Univ. Edu. −0.01 −0.01 −0.00 −0.01
(0.10) (0.04) (0.04) (0.05)R2 0.11 0.06 0.06 0.08Adj. R2 0.11 0.06 0.06 0.08Num. obs. 7377 7914 7627 7429RMSE 2.13 1.08 0.87 1.08∗∗∗p < 0.001, ∗∗p < 0.01, ∗p < 0.05
Table A-7: Lin regressions for the main outcomes.
26

PC Outcome Muslims Common Islam Compatible Immigrant Impact(Intercept) −0.02 0.58∗∗∗ 0.17∗∗∗ 0.47∗∗∗
(0.04) (0.02) (0.02) (0.02)Character - Failure −0.02 −0.01 −0.02 −0.00
(0.06) (0.03) (0.02) (0.03)Character - Success 0.02 0.00 0.02 −0.03
(0.07) (0.03) (0.03) (0.03)Religion - Failure 0.05 0.00 0.04 −0.01
(0.07) (0.03) (0.03) (0.03)Religion - Success 0.11 0.05 0.06∗ −0.01
(0.07) (0.03) (0.03) (0.03)Salah Fav. 0.01 −0.01 0.02 −0.00
(0.06) (0.03) (0.02) (0.03)Character - Failure:Salah Fav. −0.00 −0.02 0.01 0.00
(0.09) (0.05) (0.03) (0.05)Character - Success:Salah Fav. −0.04 −0.04 −0.02 0.02
(0.09) (0.04) (0.04) (0.05)Religion - Failure:Salah Fav. 0.07 0.01 0.04 0.02
(0.10) (0.04) (0.04) (0.05)Religion - Success:Salah Fav. −0.06 −0.04 −0.03 0.01
(0.09) (0.04) (0.04) (0.05)R2 0.00 0.00 0.01 0.00Adj. R2 0.00 0.00 0.00 -0.00Num. obs. 7025 7531 7265 7079RMSE 2.26 1.11 0.90 1.12∗∗∗p < 0.001, ∗∗p < 0.01, ∗p < 0.05
Table A-8: Interacting the treatments with selecting Salah as the favorite player.
27

PC Outcome Muslims Common Islam Compatible Immigrant Impact(Intercept) 0.08∗ 0.61∗∗∗ 0.21∗∗∗ 0.51∗∗∗
(0.03) (0.02) (0.01) (0.02)Character - Failure −0.05 −0.04 −0.02 −0.01
(0.05) (0.03) (0.02) (0.03)Character - Success 0.01 −0.02 0.01 −0.01
(0.05) (0.03) (0.02) (0.03)Religion - Failure 0.10 0.02 0.06∗ −0.00
(0.06) (0.03) (0.02) (0.03)Religion - Success 0.07 0.03 0.04 −0.01
(0.06) (0.03) (0.02) (0.03)Conservative −0.38∗∗∗ −0.14∗∗∗ −0.12∗∗∗ −0.15∗∗∗
(0.06) (0.03) (0.02) (0.03)Character - Failure:Conservative 0.12 0.08 0.02 0.03
(0.09) (0.05) (0.03) (0.05)Character - Success:Conservative −0.01 0.00 0.02 −0.01
(0.09) (0.05) (0.03) (0.05)Religion - Failure:Conservative −0.03 −0.05 0.01 0.01
(0.10) (0.05) (0.04) (0.05)Religion - Success:Conservative −0.03 −0.00 −0.02 −0.01
(0.09) (0.05) (0.03) (0.05)R2 0.03 0.02 0.02 0.02Adj. R2 0.03 0.02 0.02 0.02Num. obs. 7372 7900 7617 7417RMSE 2.22 1.10 0.89 1.11∗∗∗p < 0.001, ∗∗p < 0.01, ∗p < 0.05
Table A-9: Interacting the treatments with an indicator for conservative views. This indicator is codedas 1 if the respondent identifies with the Conservative Party or the UK Independence Party. It is codedas 0 if the respondent identifies with the Labour Party, Liberal Democrats, other parties, or none ofthese parties.
28

PC Outcome Muslims Common Islam Compatible Immigrant Impact(Intercept) −0.06 0.57∗∗∗ 0.17∗∗∗ 0.45∗∗∗
(0.03) (0.02) (0.01) (0.02)Character - Failure −0.04 −0.03 −0.01 −0.01
(0.05) (0.02) (0.02) (0.03)Character - Success 0.01 −0.01 0.02 −0.02
(0.05) (0.02) (0.02) (0.03)Religion - Failure 0.05 −0.01 0.06∗∗ −0.02
(0.05) (0.02) (0.02) (0.03)Religion - Success 0.04 0.02 0.03 −0.02
(0.05) (0.02) (0.02) (0.03)Liverpool Res. 0.15∗ 0.02 0.06∗ 0.07∗
(0.07) (0.03) (0.03) (0.03)Character - Failure:Liverpool Res. 0.08 0.06 −0.01 0.04
(0.11) (0.05) (0.04) (0.05)Character - Success:Liverpool Res. −0.03 −0.01 −0.02 −0.01
(0.11) (0.05) (0.04) (0.05)Religion - Failure:Liverpool Res. 0.15 0.07 0.01 0.08
(0.11) (0.05) (0.05) (0.05)Religion - Success:Liverpool Res. 0.13 0.01 0.04 0.04
(0.12) (0.05) (0.05) (0.06)R2 0.01 0.00 0.01 0.01Adj. R2 0.01 0.00 0.01 0.01Num. obs. 7515 8060 7771 7571RMSE 2.25 1.11 0.89 1.12∗∗∗p < 0.001, ∗∗p < 0.01, ∗p < 0.05
Table A-10: Interacting the treatments with an indicator for residing in Liverpool.
29

PC Outcome Muslims Common Islam Compatible Immigrant Impact(Intercept) −0.02 0.56∗∗∗ 0.18∗∗∗ 0.48∗∗∗
(0.07) (0.03) (0.03) (0.03)Character - Failure −0.11 −0.06 −0.02 −0.05
(0.11) (0.06) (0.04) (0.06)Character - Success −0.13 −0.04 −0.04 −0.07
(0.11) (0.05) (0.04) (0.05)Religion - Failure 0.19 0.04 0.09 0.01
(0.12) (0.05) (0.05) (0.06)Religion - Success 0.09 0.01 0.06 0.02
(0.12) (0.06) (0.05) (0.06)Follow Liverpool −0.00 0.02 −0.00 −0.02
(0.07) (0.04) (0.03) (0.04)Character - Failure:Follow Liverpool 0.11 0.05 0.02 0.06
(0.12) (0.06) (0.04) (0.06)Character - Success:Follow Liverpool 0.15 0.03 0.06 0.06
(0.12) (0.06) (0.04) (0.06)Religion - Failure:Follow Liverpool −0.12 −0.04 −0.04 −0.02
(0.13) (0.06) (0.05) (0.06)Religion - Success:Follow Liverpool −0.02 0.02 −0.02 −0.04
(0.13) (0.06) (0.05) (0.06)R2 0.00 0.00 0.01 0.00Adj. R2 0.00 0.00 0.00 -0.00Num. obs. 7513 8057 7768 7569RMSE 2.25 1.11 0.90 1.12∗∗∗p < 0.001, ∗∗p < 0.01, ∗p < 0.05
Table A-11: Interacting the treatments with an indicator for closely following Liverpool FC. Peoplewho follow Liverpool very closely (watch every match, read news almost daily) are coded as 1 andpeople who follow Liverpool less often are coded as 0.
30

PC Outcome Muslims Common Islam Compatible Immigrant Impact(Intercept) −0.02 0.57∗∗∗ 0.18∗∗∗ 0.47∗∗∗
(0.03) (0.01) (0.01) (0.01)Character −0.00 −0.01 0.00 −0.01
(0.04) (0.02) (0.01) (0.02)Religion 0.08∗ 0.02 0.05∗∗∗ −0.00
(0.04) (0.02) (0.01) (0.02)Age 0.00 −0.00∗∗ 0.00∗ 0.00∗
(0.00) (0.00) (0.00) (0.00)Female 0.06 0.06∗ −0.00 −0.00
(0.06) (0.03) (0.02) (0.03)Univ. Edu. 0.68∗∗∗ 0.24∗∗∗ 0.22∗∗∗ 0.25∗∗∗
(0.06) (0.03) (0.03) (0.03)Character:Age −0.00 0.00 −0.00 −0.00
(0.00) (0.00) (0.00) (0.00)Religion:Age −0.00 0.00 −0.00 −0.00
(0.00) (0.00) (0.00) (0.00)Character:Female 0.01 −0.01 0.02 −0.00
(0.08) (0.04) (0.03) (0.04)Religion:Female 0.08 0.01 0.03 0.04
(0.08) (0.04) (0.03) (0.04)Character:Univ. Edu. 0.03 0.00 −0.04 0.08∗
(0.08) (0.04) (0.03) (0.04)Religion:Univ. Edu. −0.03 −0.03 −0.01 0.01
(0.08) (0.04) (0.04) (0.04)R2 0.11 0.06 0.06 0.08Adj. R2 0.11 0.06 0.06 0.08Num. obs. 7377 7914 7627 7429RMSE 2.13 1.08 0.87 1.08∗∗∗p < 0.001, ∗∗p < 0.01, ∗p < 0.05
Table A-12: Lin regressions using the character/religion treatments.
31

PC Outcome Muslims Common Islam Compatible Immigrant Impact(Intercept) 0.08∗ 0.61∗∗∗ 0.21∗∗∗ 0.51∗∗∗
(0.03) (0.02) (0.01) (0.02)Character −0.02 −0.03 −0.00 −0.01
(0.05) (0.02) (0.02) (0.02)Religion 0.09 0.02 0.05∗∗ −0.01
(0.05) (0.02) (0.02) (0.02)Conservative −0.38∗∗∗ −0.14∗∗∗ −0.12∗∗∗ −0.15∗∗∗
(0.06) (0.03) (0.02) (0.03)Character:Conservative 0.06 0.04 0.02 0.01
(0.08) (0.04) (0.03) (0.04)Religion:Conservative −0.03 −0.03 −0.00 0.00
(0.08) (0.04) (0.03) (0.04)R2 0.03 0.02 0.02 0.02Adj. R2 0.03 0.02 0.02 0.02Num. obs. 7372 7900 7617 7417RMSE 2.22 1.10 0.89 1.11∗∗∗p < 0.001, ∗∗p < 0.01, ∗p < 0.05
Table A-13: Interacting the character/religion treatments with an indicator for conservative views. Thisindicator is coded as 1 if the respondent identifies with the Conservative Party or the UK IndependenceParty. It is coded as 0 if the respondent identifies with the Labour Party, Liberal Democrats, otherparties, or none of these parties.
32
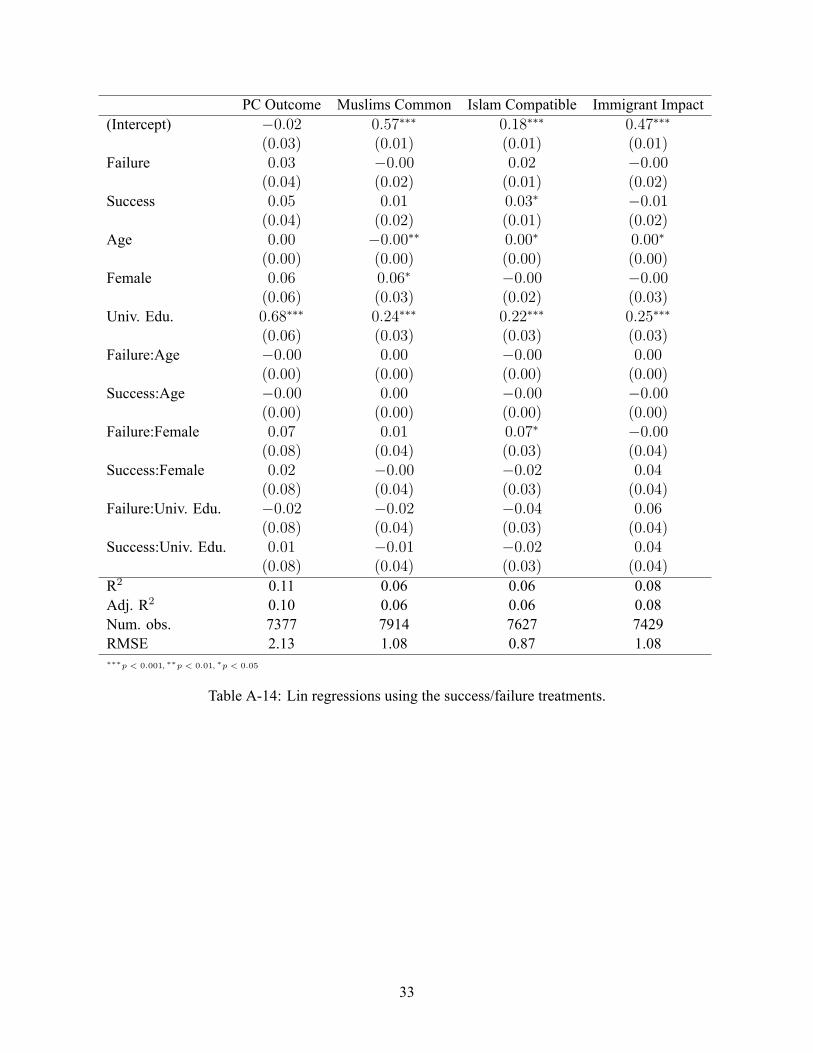
PC Outcome Muslims Common Islam Compatible Immigrant Impact(Intercept) −0.02 0.57∗∗∗ 0.18∗∗∗ 0.47∗∗∗
(0.03) (0.01) (0.01) (0.01)Failure 0.03 −0.00 0.02 −0.00
(0.04) (0.02) (0.01) (0.02)Success 0.05 0.01 0.03∗ −0.01
(0.04) (0.02) (0.01) (0.02)Age 0.00 −0.00∗∗ 0.00∗ 0.00∗
(0.00) (0.00) (0.00) (0.00)Female 0.06 0.06∗ −0.00 −0.00
(0.06) (0.03) (0.02) (0.03)Univ. Edu. 0.68∗∗∗ 0.24∗∗∗ 0.22∗∗∗ 0.25∗∗∗
(0.06) (0.03) (0.03) (0.03)Failure:Age −0.00 0.00 −0.00 0.00
(0.00) (0.00) (0.00) (0.00)Success:Age −0.00 0.00 −0.00 −0.00
(0.00) (0.00) (0.00) (0.00)Failure:Female 0.07 0.01 0.07∗ −0.00
(0.08) (0.04) (0.03) (0.04)Success:Female 0.02 −0.00 −0.02 0.04
(0.08) (0.04) (0.03) (0.04)Failure:Univ. Edu. −0.02 −0.02 −0.04 0.06
(0.08) (0.04) (0.03) (0.04)Success:Univ. Edu. 0.01 −0.01 −0.02 0.04
(0.08) (0.04) (0.03) (0.04)R2 0.11 0.06 0.06 0.08Adj. R2 0.10 0.06 0.06 0.08Num. obs. 7377 7914 7627 7429RMSE 2.13 1.08 0.87 1.08∗∗∗p < 0.001, ∗∗p < 0.01, ∗p < 0.05
Table A-14: Lin regressions using the success/failure treatments.
33

PC Outcome Muslims Common Islam Compatible Immigrant Impact(Intercept) 0.08∗ 0.61∗∗∗ 0.21∗∗∗ 0.51∗∗∗
(0.03) (0.02) (0.01) (0.02)Failure 0.02 −0.01 0.02 −0.01
(0.05) (0.02) (0.02) (0.02)Success 0.04 0.01 0.03 −0.01
(0.05) (0.02) (0.02) (0.02)Conservative −0.38∗∗∗ −0.14∗∗∗ −0.12∗∗∗ −0.15∗∗∗
(0.06) (0.03) (0.02) (0.03)Failure:Conservative 0.05 0.01 0.02 0.02
(0.08) (0.04) (0.03) (0.04)Success:Conservative −0.02 0.00 0.00 −0.01
(0.08) (0.04) (0.03) (0.04)R2 0.03 0.02 0.02 0.02Adj. R2 0.03 0.01 0.01 0.02Num. obs. 7372 7900 7617 7417RMSE 2.22 1.10 0.89 1.11∗∗∗p < 0.001, ∗∗p < 0.01, ∗p < 0.05
Table A-15: Interacting the success/failure treatments with an indicator for conservative views. Thisindicator is coded as 1 if the respondent identifies with the Conservative Party or the UK IndependenceParty. It is coded as 0 if the respondent identifies with the Labour Party, Liberal Democrats, otherparties, or none of these parties.
PC Outcome Muslims Common Islam Compatible Immigrant ImpactConstant −0.02 0.57∗∗∗ 0.18∗∗∗ 0.46∗∗∗
(0.03) (0.01) (0.01) (0.01)Failure 0.04 −0.01 0.02 0.00
(0.04) (0.02) (0.01) (0.02)Success 0.04 0.00 0.03∗ −0.02
(0.04) (0.02) (0.01) (0.02)R2 0.00 0.00 0.00 0.00Adj. R2 -0.00 -0.00 0.00 0.00Num. obs. 7515 8060 7771 7571RMSE 2.26 1.11 0.90 1.12∗∗∗p < 0.001, ∗∗p < 0.01, ∗p < 0.05
Table A-16: Main regressions using the success/failure treatments.
34

PC Outcome Muslims Common Islam Compatible Immigrant Impact(Intercept) −0.02 0.58∗∗∗ 0.17∗∗∗ 0.47∗∗∗
(0.04) (0.02) (0.02) (0.02)Failure 0.02 −0.01 0.01 −0.00
(0.06) (0.03) (0.02) (0.03)Success 0.07 0.03 0.04 −0.02
(0.06) (0.03) (0.02) (0.03)Salah Fav. 0.01 −0.01 0.02 −0.00
(0.06) (0.03) (0.02) (0.03)Failure:Salah Fav. 0.04 −0.01 0.02 0.01
(0.08) (0.04) (0.03) (0.04)Success:Salah Fav. −0.05 −0.04 −0.02 0.01
(0.08) (0.04) (0.03) (0.04)R2 0.00 0.00 0.00 0.00Adj. R2 -0.00 0.00 0.00 -0.00Num. obs. 7025 7531 7265 7079RMSE 2.26 1.11 0.90 1.12∗∗∗p < 0.001, ∗∗p < 0.01, ∗p < 0.05
Table A-17: Interacting the success/failure treatments with selecting Salah as the favorite player.
PC Outcome Muslims Common Islam Compatible Immigrant Impact(Intercept) −0.06 0.57∗∗∗ 0.17∗∗∗ 0.45∗∗∗
(0.03) (0.02) (0.01) (0.02)Failure 0.01 −0.02 0.02 −0.01
(0.04) (0.02) (0.02) (0.02)Success 0.03 0.01 0.03 −0.02
(0.04) (0.02) (0.02) (0.02)Liverpool Res. 0.15∗ 0.02 0.06∗ 0.07∗
(0.07) (0.03) (0.03) (0.03)Failure:Liverpool Res. 0.11 0.07 0.00 0.06
(0.09) (0.04) (0.04) (0.04)Success:Liverpool Res. 0.04 −0.00 0.01 0.02
(0.09) (0.04) (0.04) (0.05)R2 0.01 0.00 0.01 0.01Adj. R2 0.01 0.00 0.00 0.01Num. obs. 7515 8060 7771 7571RMSE 2.25 1.11 0.90 1.12∗∗∗p < 0.001, ∗∗p < 0.01, ∗p < 0.05
Table A-18: Interacting the success/failure treatments with an indicator for residing in Liverpool.
35

PC Outcome Muslims Common Islam Compatible Immigrant Impact(Intercept) −0.02 0.56∗∗∗ 0.18∗∗∗ 0.48∗∗∗
(0.07) (0.03) (0.03) (0.03)Failure 0.04 −0.01 0.03 −0.02
(0.10) (0.05) (0.04) (0.05)Success −0.02 −0.01 0.01 −0.03
(0.10) (0.04) (0.04) (0.05)Follow Liverpool −0.00 0.02 −0.00 −0.02
(0.07) (0.04) (0.03) (0.04)Failure:Follow Liverpool −0.00 0.01 −0.01 0.02
(0.11) (0.05) (0.04) (0.05)Success:Follow Liverpool 0.06 0.02 0.02 0.01
(0.10) (0.05) (0.04) (0.05)R2 0.00 0.00 0.00 0.00Adj. R2 -0.00 0.00 0.00 -0.00Num. obs. 7513 8057 7768 7569RMSE 2.26 1.11 0.90 1.12∗∗∗p < 0.001, ∗∗p < 0.01, ∗p < 0.05
Table A-19: Interacting the success/failure treatments with an indicator for closely following LiverpoolFC. People who follow Liverpool very closely (watch every match, read news almost daily) are codedas 1 and people who follow Liverpool less often are coded as 0.
PC Outcome Muslims Common Islam Compatible Immigrant ImpactConstant −0.02 0.57∗∗∗ 0.18∗∗∗ 0.46∗∗∗
(0.03) (0.01) (0.01) (0.01)Character −0.01 −0.02 0.00 −0.01
(0.04) (0.02) (0.01) (0.02)Religion 0.08∗ 0.01 0.05∗∗∗ −0.01
(0.04) (0.02) (0.02) (0.02)R2 0.00 0.00 0.00 0.00Adj. R2 0.00 0.00 0.00 -0.00Num. obs. 7515 8060 7771 7571RMSE 2.25 1.11 0.90 1.12∗∗∗p < 0.001, ∗∗p < 0.01, ∗p < 0.05
Table A-20: Main regressions using the character/religion treatments.
36
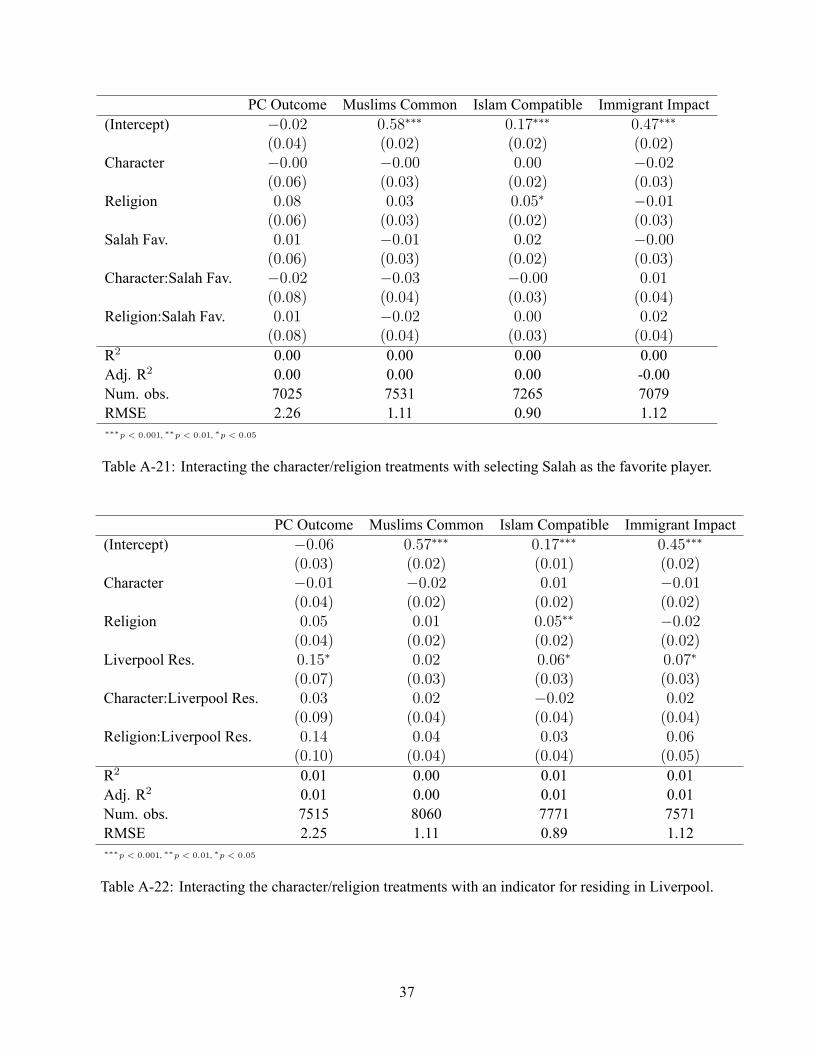
PC Outcome Muslims Common Islam Compatible Immigrant Impact(Intercept) −0.02 0.58∗∗∗ 0.17∗∗∗ 0.47∗∗∗
(0.04) (0.02) (0.02) (0.02)Character −0.00 −0.00 0.00 −0.02
(0.06) (0.03) (0.02) (0.03)Religion 0.08 0.03 0.05∗ −0.01
(0.06) (0.03) (0.02) (0.03)Salah Fav. 0.01 −0.01 0.02 −0.00
(0.06) (0.03) (0.02) (0.03)Character:Salah Fav. −0.02 −0.03 −0.00 0.01
(0.08) (0.04) (0.03) (0.04)Religion:Salah Fav. 0.01 −0.02 0.00 0.02
(0.08) (0.04) (0.03) (0.04)R2 0.00 0.00 0.00 0.00Adj. R2 0.00 0.00 0.00 -0.00Num. obs. 7025 7531 7265 7079RMSE 2.26 1.11 0.90 1.12∗∗∗p < 0.001, ∗∗p < 0.01, ∗p < 0.05
Table A-21: Interacting the character/religion treatments with selecting Salah as the favorite player.
PC Outcome Muslims Common Islam Compatible Immigrant Impact(Intercept) −0.06 0.57∗∗∗ 0.17∗∗∗ 0.45∗∗∗
(0.03) (0.02) (0.01) (0.02)Character −0.01 −0.02 0.01 −0.01
(0.04) (0.02) (0.02) (0.02)Religion 0.05 0.01 0.05∗∗ −0.02
(0.04) (0.02) (0.02) (0.02)Liverpool Res. 0.15∗ 0.02 0.06∗ 0.07∗
(0.07) (0.03) (0.03) (0.03)Character:Liverpool Res. 0.03 0.02 −0.02 0.02
(0.09) (0.04) (0.04) (0.04)Religion:Liverpool Res. 0.14 0.04 0.03 0.06
(0.10) (0.04) (0.04) (0.05)R2 0.01 0.00 0.01 0.01Adj. R2 0.01 0.00 0.01 0.01Num. obs. 7515 8060 7771 7571RMSE 2.25 1.11 0.89 1.12∗∗∗p < 0.001, ∗∗p < 0.01, ∗p < 0.05
Table A-22: Interacting the character/religion treatments with an indicator for residing in Liverpool.
37

PC Outcome Muslims Common Islam Compatible Immigrant Impact(Intercept) −0.02 0.56∗∗∗ 0.18∗∗∗ 0.48∗∗∗
(0.07) (0.03) (0.03) (0.03)Character −0.12 −0.05 −0.03 −0.06
(0.09) (0.05) (0.03) (0.05)Religion 0.14 0.02 0.07 0.02
(0.10) (0.05) (0.04) (0.05)Follow Liverpool −0.00 0.02 −0.00 −0.02
(0.07) (0.04) (0.03) (0.04)Character:Follow Liverpool 0.13 0.04 0.04 0.06
(0.10) (0.05) (0.04) (0.05)Religion:Follow Liverpool −0.07 −0.01 −0.03 −0.03
(0.11) (0.05) (0.04) (0.05)R2 0.00 0.00 0.00 0.00Adj. R2 0.00 0.00 0.00 0.00Num. obs. 7513 8057 7768 7569RMSE 2.25 1.11 0.90 1.12∗∗∗p < 0.001, ∗∗p < 0.01, ∗p < 0.05
Table A-23: Interacting the character/religion treatments with an indicator for closely following Liv-erpool FC. People who follow Liverpool very closely (watch every match, read news almost daily) arecoded as 1 and people who follow Liverpool less often are coded as 0.
38

PC Outcome Muslims Common Islam Compatible Immigrant Impact(Intercept) −0.03 0.56∗∗∗ 0.18∗∗∗ 0.47∗∗∗
(0.04) (0.02) (0.01) (0.02)Character - Failure −0.08 −0.03 −0.03 −0.03
(0.06) (0.03) (0.02) (0.03)Character - Success −0.04 −0.03 −0.00 −0.03
(0.06) (0.03) (0.02) (0.03)Religion - Failure 0.05 −0.01 0.04 −0.02
(0.06) (0.03) (0.02) (0.03)Religion - Success 0.06 0.03 0.04 −0.02
(0.06) (0.03) (0.02) (0.03)Karius Empathy 0.01 0.04 −0.01 −0.02
(0.06) (0.03) (0.02) (0.03)Character - Failure:Karius Empathy 0.17 0.05 0.05 0.08
(0.09) (0.05) (0.03) (0.05)Character - Success:Karius Empathy 0.12 0.04 0.04 0.04
(0.09) (0.04) (0.04) (0.05)Religion - Failure:Karius Empathy 0.11 0.03 0.05 0.05
(0.10) (0.05) (0.04) (0.05)Religion - Success:Karius Empathy 0.03 −0.01 0.02 0.03
(0.10) (0.04) (0.04) (0.05)R2 0.01 0.01 0.01 0.00Adj. R2 0.00 0.00 0.00 0.00Num. obs. 7510 8040 7758 7563RMSE 2.25 1.11 0.90 1.12∗∗∗p < 0.001, ∗∗p < 0.01, ∗p < 0.05
Table A-24: Interacting the treatments with expressing sympathy with Karius. Respondents are codedas empathetic with Karius if they did not agree with the criticism that Karius received after followingthe 2018 Champions League final.
39

PC Outcome Muslims Common Islam Compatible Immigrant Impact(Intercept) −0.03 0.56∗∗∗ 0.18∗∗∗ 0.47∗∗∗
(0.04) (0.02) (0.01) (0.02)Character −0.06 −0.03 −0.02 −0.03
(0.05) (0.02) (0.02) (0.02)Religion 0.05 0.01 0.04∗ −0.02
(0.05) (0.02) (0.02) (0.02)Karius Empathy 0.01 0.04 −0.01 −0.02
(0.06) (0.03) (0.02) (0.03)Character:Karius Empathy 0.15 0.05 0.05 0.06
(0.08) (0.04) (0.03) (0.04)Religion:Karius Empathy 0.07 0.01 0.03 0.04
(0.08) (0.04) (0.03) (0.04)R2 0.00 0.00 0.00 0.00Adj. R2 0.00 0.00 0.00 0.00Num. obs. 7510 8040 7758 7563RMSE 2.25 1.11 0.90 1.12∗∗∗p < 0.001, ∗∗p < 0.01, ∗p < 0.05
Table A-25: Interacting the character/religion treatments with an indicator for empathy with Karius.Respondents are coded as empathetic with Karius if they did not agree with the criticism that Kariusreceived after following the 2018 Champions League final.
40

PC Outcome Muslims Common Islam Compatible Immigrant Impact(Intercept) −0.03 0.56∗∗∗ 0.18∗∗∗ 0.47∗∗∗
(0.04) (0.02) (0.01) (0.02)Character −0.06 −0.03 −0.02 −0.03
(0.05) (0.02) (0.02) (0.02)Religion 0.05 0.01 0.04∗ −0.02
(0.05) (0.02) (0.02) (0.02)Karius Empathy 0.01 0.04 −0.01 −0.02
(0.06) (0.03) (0.02) (0.03)Character:Karius Empathy 0.15 0.05 0.05 0.06
(0.08) (0.04) (0.03) (0.04)Religion:Karius Empathy 0.07 0.01 0.03 0.04
(0.08) (0.04) (0.03) (0.04)R2 0.00 0.00 0.00 0.00Adj. R2 0.00 0.00 0.00 0.00Num. obs. 7510 8040 7758 7563RMSE 2.25 1.11 0.90 1.12∗∗∗p < 0.001, ∗∗p < 0.01, ∗p < 0.05
Table A-26: Interacting the success/failure treatments with an indicator for empathy with Karius. Re-spondents are coded as empathetic with Karius if they did not agree with the criticism that Kariusreceived after following the 2018 Champions League final.
PC Outcome Muslims Common Islam Compatible Immigrant ImpactConstant −0.00 0.56∗∗∗ 0.20∗∗∗ 0.47∗∗∗
(0.03) (0.02) (0.01) (0.02)Day After Victory −0.01 −0.00 0.01 −0.01
(0.05) (0.02) (0.02) (0.02)R2 0.00 0.00 0.00 0.00Adj. R2 -0.00 -0.00 -0.00 -0.00Num. obs. 3022 3243 3113 3037RMSE 2.27 1.12 0.90 1.12∗∗∗p < 0.001, ∗∗p < 0.01, ∗p < 0.05
Table A-27: Relationship between victory and outcomes. This compares responses on the day after aLiverpool victory with responses on the day before a Liverpool victory).
41

PC Outcome Muslims Common Islam Compatible Immigrant ImpactConstant 0.01 0.57∗∗∗ 0.20∗∗∗ 0.46∗∗∗
(0.02) (0.01) (0.01) (0.01)Day After Victory −0.02 −0.02 0.01 −0.00
(0.04) (0.02) (0.02) (0.02)R2 0.00 0.00 0.00 0.00Adj. R2 -0.00 0.00 -0.00 -0.00Num. obs. 7515 8060 7771 7571RMSE 2.26 1.11 0.90 1.12∗∗∗p < 0.001, ∗∗p < 0.01, ∗p < 0.05
Table A-28: Relationship between victory and outcomes. This compares responses on the day after aLiverpool victory with responses on all other days.
PC Outcome Muslims Common Islam Compatible Immigrant ImpactConstant −0.02 0.56∗∗∗ 0.19∗∗∗ 0.46∗∗∗
(0.03) (0.02) (0.01) (0.02)Day After Salah Scores 0.01 0.01 0.02 −0.00
(0.05) (0.02) (0.02) (0.03)R2 0.00 0.00 0.00 0.00Adj. R2 -0.00 -0.00 0.00 -0.00Num. obs. 2587 2774 2665 2602RMSE 2.26 1.11 0.89 1.12∗∗∗p < 0.001, ∗∗p < 0.01, ∗p < 0.05
Table A-29: Relationship between victory and outcomes. This compares responses on the day afterSalah scored with responses on the day before Salah scored.
PC Outcome Muslims Common Islam Compatible Immigrant ImpactConstant −0.01 0.56∗∗∗ 0.20∗∗∗ 0.46∗∗∗
(0.03) (0.02) (0.01) (0.02)Day After Salah Scores 0.00 0.00 0.01 −0.00
(0.05) (0.02) (0.02) (0.02)R2 0.00 0.00 0.00 0.00Adj. R2 -0.00 -0.00 -0.00 -0.00Num. obs. 3080 3303 3171 3095RMSE 2.26 1.12 0.90 1.12∗∗∗p < 0.001, ∗∗p < 0.01, ∗p < 0.05
Table A-30: Relationship between victory and outcomes. This compares responses on the day afterSalah scored with responses on all other days.
42