Can event-related potentials serve as neural markers for wins, losses, and near-wins in a gambling...
34
University of Wollongong Research Online Faculty of Social Sciences - Papers Faculty of Social Sciences 2013 Can event-related potentials serve as neural markers for wins, losses, and near-wins in a gambling task? A principal components analysis Lisa Lole University of Wollongong, [email protected] Craig J. Gonsalvez University of Wollongong, [email protected] Robert J. Barry University of Wollongong, [email protected] Frances M. De Blasio University of Wollongong, [email protected] Research Online is the open access institutional repository for the University of Wollongong. For further information contact the UOW Library: [email protected] Publication Details Lole, L., Gonsalvez, C. J., Barry, R. J. & De Blasio, F. M. (2013). Can event-related potentials serve as neural markers for wins, losses, and near-wins in a gambling task? A principal components analysis. International Journal of Psychophysiology, 89 (3), 390-398.
-
Upload
westernsydney -
Category
Documents
-
view
3 -
download
0
Transcript of Can event-related potentials serve as neural markers for wins, losses, and near-wins in a gambling...

University of WollongongResearch Online
Faculty of Social Sciences - Papers Faculty of Social Sciences
2013
Can event-related potentials serve as neuralmarkers for wins, losses, and near-wins in agambling task? A principal components analysisLisa LoleUniversity of Wollongong, [email protected]
Craig J. GonsalvezUniversity of Wollongong, [email protected]
Robert J. BarryUniversity of Wollongong, [email protected]
Frances M. De BlasioUniversity of Wollongong, [email protected]
Research Online is the open access institutional repository for theUniversity of Wollongong. For further information contact the UOWLibrary: [email protected]
Publication DetailsLole, L., Gonsalvez, C. J., Barry, R. J. & De Blasio, F. M. (2013). Can event-related potentials serve as neural markers for wins, losses,and near-wins in a gambling task? A principal components analysis. International Journal of Psychophysiology, 89 (3), 390-398.
Can event-related potentials serve as neural markers for wins, losses, andnear-wins in a gambling task? A principal components analysis
AbstractOriginally, the feedback related negativity (FRN) event-related potential (ERP) component was consideredto be a robust neural correlate of non-reward/punishment processing, with greater negative deflectionsobserved following unfavourable outcomes. More recently, it has been suggested that this component is betterconceptualised as a positive deflection following rewarding outcomes. The current study sought to elucidatethe nature of the FRN, as well as another component associated with incentive-value processing, the P3b,through application of a spatiotemporal principal components analysis (PCA). Seventeen healthy controlsplayed a computer electronic gaming machine (EGM) task and received feedback on credits won or lost oneach trial, and ERPs were recorded. The distribution of reward/non-reward outcomes closely matched that ofa real EGM, with frequent losses, and infrequent wins and near-wins. The PCA revealed that feedback elicitedboth a frontally maximal negative deflection to losses, and a positive deflection to wins (which was alsosensitive to reward magnitude), implying that the neural generator/s of the FRN are differentially activatedfollowing these outcomes. As expected, greater P3b amplitudes were found for wins compared to losses.Interestingly, near-wins elicited significantly smaller FRN amplitudes than losses (with no differences in P3bamplitude), and may contribute to the maintenance of gambling behaviours on EGMs. The results of thecurrent study are integrated into a response profile of healthy controls to outcomes of varying incentive value.This may provide a foundation for the future examination of individuals who exhibit abnormalities in reward/punishment processing, such as problem gamblers.
Keywordsevent, can, principal, analysis, task, components, gambling, near, losses, wins, markers, neural, serve,potentials, related
DisciplinesEducation | Social and Behavioral Sciences
Publication DetailsLole, L., Gonsalvez, C. J., Barry, R. J. & De Blasio, F. M. (2013). Can event-related potentials serve as neuralmarkers for wins, losses, and near-wins in a gambling task? A principal components analysis. InternationalJournal of Psychophysiology, 89 (3), 390-398.
This journal article is available at Research Online: http://ro.uow.edu.au/sspapers/410
1
Title Page
Can event-related potentials serve as neural markers for wins, losses, and near-wins in a
gambling task? A principal components analysis
Lisa Lole*, a, b
, Craig J. Gonsalveza, b, c
, Robert J. Barrya, b
, and Frances M. De Blasioa, b
a. School of Psychology, University of Wollongong, NSW 2522, Australia.
b. Brain & Behaviour Research Institute, University of Wollongong, NSW 2522, Australia.
c. Illawarra Institute for Mental Health, University of Wollongong, NSW 2522, Australia.
*Corresponding author:
Phone: +61 2 4221 4513, fax: +61 2 4221 4163, email: [email protected]
KEYWORDS: ERP; Electronic gaming machine; FRN; P300; Reward sensitivity; punishment
sensitivity; principal components analysis (PCA)
WORD COUNT: Abstract: 246; Article body: 5351; Figures: 5; Tables: zero; Supplemental
information: zero.
2
Abstract
Originally, the feedback related negativity (FRN) event-related potential (ERP) component
was considered to be a robust neural correlate of non-reward/punishment processing, with
greater negative deflections observed following unfavourable outcomes. More recently, it has
been suggested that this component is better conceptualised as a positive deflection following
rewarding outcomes. The current study sought to elucidate the nature of the FRN, as well as
another component associated with incentive-value processing, the P3b, through application
of a spatiotemporal principal components analysis (PCA). Seventeen healthy controls played
a computer electronic gaming machine (EGM) task and received feedback on credits won or
lost on each trial, and ERPs were recorded. The distribution of reward/non-reward outcomes
closely matched that of a real EGM, with frequent losses, and infrequent wins and near-wins.
The PCA revealed that feedback elicited both a frontally maximal negative deflection to
losses, and a positive deflection to wins (which was also sensitive to reward magnitude),
implying that the neural generator/s of the FRN are differentially activated following these
outcomes. As expected, greater P3b amplitudes were found for wins compared to losses.
Interestingly, near-wins elicited significantly smaller FRN amplitudes than losses (with no
differences in P3b amplitude), and may contribute to the maintenance of gambling
behaviours on EGMs. The results of the current study are integrated into a response profile of
healthy controls to outcomes of varying incentive value. This may provide a foundation for
the future examination of individuals who exhibit abnormalities in reward/punishment
processing, such as problem gamblers.
3
Can event-related potentials serve as neural markers for wins, losses, and near-wins in a
gambling task? A principal components analysis
1. Introduction
The neural mechanisms involved in the processing of reward and non-reward/punishment
are of particular relevance to addictive disorders, such as problem gambling, as abnormalities
in incentive value processing are believed to be one of the causal factors in such disorders.
For example, problem gamblers may be hyposensitive to non-reward/punishment (e.g.,
Reuter et al., 2005) and thus, the repeated detrimental losses experienced are not perceived to
be averse; they may be hypersensitive to reward (e.g., Hewig et al., 2010; Oberg et al., 2011)
and pursue wins at the expense of high costs; or they may be hyposensitive to reward (e.g.,
Blum et al., 2000) and engage in thrill-seeking behaviour (such as trying to obtain large wins)
in order to reach the same level of excitement associated with smaller wins in non-problem
gamblers.
A particularly valuable index of incentive value processing is an event-related potential
(ERP) component; the feedback related negativity (FRN), as it has been demonstrated to be a
robust and reliable ERP component sensitive to valence manipulations. The FRN is maximal
at fronto-central scalp sites and there is consensus that medial frontal cortical areas,
especially the anterior cingulate cortex (ACC), are involved in its generation (Bellebaum and
Daum, 2008; Miltner et al., 1997; Nieuwenhuis et al., 2004). Because of potential links to
reward mechanisms through activation of the mesencephalic dopamine system (Holroyd and
Coles, 2002), the FRN has major significance, particularly for gambling behaviours, as it
provides a window through which the effects of reward and non-reward outcomes within the
brain might be usefully examined.
4
Recently, there has been debate regarding the nature of this ERP component; specifically,
whether it is best conceptualised as a negative deflection following unfavourable outcomes or
as a positive deflection following favourable outcomes. Earlier conceptualisations of the FRN
were that it is a component characterised by greater negative responses 250-350 ms following
feedback that signals monetary losses compared to gains (San Martin et al., 2010; Toyomaki
and Murohashi, 2005; Yeung et al., 2005), or the least desired of two possible outcomes
within a certain context (e.g., zero credits elicited larger FRNs than wins when the alternative
outcome is to gain credits, compared to when the alternative is to lose credits; Gehring and
Willoughby, 2002; Holroyd et al., 2004), during tasks that resemble gambling activity.
Subjective expectancy of an outcome has also been shown to affect the FRN, with larger
amplitudes associated with unexpected compared to predicted negative outcomes, although
this effect appears to be more subtle and may not always follow objective probabilities of
such events (Hajcak et al., 2005, 2006). Whilst the link between FRN and valence appears
consistent, manipulations of incentive value magnitude have yielded equivocal results.
Specifically, some studies suggest that larger losses (compared to smaller losses) and smaller
gains (compared to larger gains) yield larger FRN magnitudes (e.g., Bellbaum et al., 2010;
Holroyd et al., 2004), whilst others have found no magnitude effects (e.g., Gu et al., 2010;
Hajcak et al., 2006; Yeung and Sanfey, 2004).
While the negative deflection to unfavourable outcomes described above has been
reported in a wide variety of circumstances, including simulated gambling (Hewig et al.,
2007), guessing tasks (Hajcak et al., 2006; Hajcak et al., 2005, 2007), time estimation tasks
(Holroyd and Krigolsen, 2007; Miltner et al., 1997; Nieuwenhuis et al., 2005), and learning
tasks (De Pascalis et al., 2010), the true nature of the FRN remains somewhat unclear, as this
component is commonly superimposed on large amplitude P300 responses that occur
immediately after it. It has been proposed that the reduced amplitude FRN observed
5
following win outcomes may not be an actual attenuated response to these events, but is
rather driven by larger P300 amplitudes following favourable outcomes (Yeung and Sanfey,
2004). Furthermore, the relative contribution of negative and positive outcomes to the FRN
remains unclear due to the fact that many studies have employed the computation of a
difference waveform to measure FRN magnitude (e.g., Dunning and Hajcak, 2007; Foti and
Hajcak, 2009; Hajcak et al., 2007; Holroyd et al., 2008; Miltner et al., 1997), and other recent
research has suggested that, rather than a negative deflection to non-reward outcomes, the
FRN is better conceptualised as a positive deflection that is greater following reward
compared to non-reward outcomes (Foti et al., 2011; Holroyd et al., 2003; Holroyd et al.,
2008).
Regardless of the actual response pattern, investigation of the latent spatial and temporal
characteristics of this feedback related ERP component (whether it be a negative deflection to
non-reward or a positive deflection to reward) in healthy controls using a principal
components analysis (PCA) will allow a more reliable and accurate account of the neural
correlates associated with incentive value processing. This will encourage the future
examination of whether these responses differ in individuals who display deficits in outcome
evaluation, such as those with gambling problems.
Typically examined as a global component, the P300 (called the LPC in many
studies), has also been shown to be sensitive to various aspects of incentive value on tasks
that simulate gambling (Bellbaum et al., 2010; Hajcak et al., 2007). The inverse relationship
between probability and P300 amplitude has been well established (Donchin and Coles,
1988), although the understanding of these results is subject to different interpretations (see
Gonsalvez et al., 2007; Verleger, 1988). Nevertheless, studies that have controlled for event
probability have demonstrated that the P300 remains sensitive to manipulations of win and
loss outcomes (e.g., Hajcak et al., 2007; Wu and Zhou, 2009; Yeung et al., 2005; Zhou et al.,

6
2010), although the pattern of these results is somewhat variable. Some studies report a
double dissociation between the FRN and P300, showing the FRN to be affected by valence
but not reward magnitude, with the opposite pattern for the P300, regardless of whether the
outcome is of positive or negative valence (Sato et al., 2005; Yeung and Sanfey, 2004). In
contrast to this, other research has demonstrated that the P300 is influenced by valence, with
wins eliciting larger amplitudes than losses (Hajack et al., 2007; Toyomaki and Murohashi,
2005). Because the P300 is established to be a complex comprising several sub-components,
it is possible that different subcomponents are independently sensitive to valence and
magnitude. For instance, stimulus salience is known to affect the P3b and win events may
elicit larger P3bs on account of their greater salience than losses. Therefore, it is of value to
determine which of the sub-components of the P300 are affected by win and loss outcomes.
By using a spatiotemporal PCA, the current study sought to examine the latent nature of both
the FRN and the LPC ERP subcomponents, that may not be perceptible using traditional ERP
data extraction methods, in response to manipulations of valence and magnitude within a
simulated electronic gaming machine (EGM; also called a ‘poker’ or ‘slot’ machine) task.
EGMs typically deliver a large number of win and loss outcomes in a short period of time
and are of particular clinical significance to problem gambling. Compared with other
gambling activities, a high percentage of gamblers seeking treatment report addiction to
EGMs (see Dowling et al., 2001), and EGM gambling is associated with a faster progression
of addiction (Breen and Zimmerman, 2002) and more severe symptoms (Petry, 2003). In the
current study all key EGM outcomes were of interest, including large and small wins, losses,
and near-wins (see Method section 2.2.2. for details on these outcomes). Traditional ERP
research has shown near wins to be less aversive (Luo et al., 2011) and more rewarding than
losses (Qi et al., 2011), and neuroimaging research has shown that, while these outcomes are
rated as more unpleasant than losses, they increase motivation to gamble by recruiting reward
7
related brain circuitry (Clark et al., 2009). The current study sought to examine whether the
latent neural correlates of incentive value processing are differentially activated for these
outcomes compared to losses, in order to evaluate their role in the development and
maintenance of gambling behaviours.
In summary, the current study sought to utlilise a PCA to parse two ERP components
previously found to index various aspects of incentive value processing from overlapping
data, and to evaluate their capacity to discriminate between win, loss, and near-win outcomes,
as well as rewards of different magnitudes.
2. Method
2.1. Participants
Seventeen undergraduate psychology students (7 male, 10 female, Mage = 18.7 years;
SD = 4.8, age range =18-23 years) from the University of Wollongong participated in the
experiment in return for course credit. No participants reported using nicotine, alcohol, or
prescription/illicit drugs in the two hours prior to testing, or a history of severe brain injury or
seizures. Written informed consent was obtained from all participants, who were advised that
participation was entirely voluntary, and that they could withdraw from the study at any time.
The study’s protocol was approved by the University of Wollongong Human Research Ethics
Committee.
2.2. Materials
2.2.1. Recording equipment
EEG was recorded from a 19-site electrode cap (comprised of tin electrodes fitted in
the standard international 10-20 system layout) using NuAmps 2.0 software (NeuroScan
8
Compumedics, USA). The electrodes were referenced to linked ears and grounded by a cap
electrode located mid-way between Fpz and Fz. Vertical eye movement (vEOG) was
monitored with two tin cup electrodes: one placed 2 cm above and the other 2 cm below the
left eye. Horizontal eye movement (hEOG) was monitored with two tin cup electrodes placed
adjacent to the outer canthus of each eye. Impedance was less than 5 kΩ for cap electrodes
and less than 3 kΩ for EOG and reference electrodes. Scalp EEG potentials were amplified ×
20 000, EOG potentials were amplified × 5000, and both were sampled at a rate of 500 Hz.
2.2.2. Computer task
A gambling task was administered using Presentation software, version 13.0
(Neurobehavioral Systems, Inc., USA) (Figure 1). The task was modelled on games
commonly run on EGMs. The screen display comprised a single row of four fruit symbols.
Because eight different fruit symbols were used, and each could appear at random in each of
the four columns, each trial was unique in terms of its stimulus configuration (symbol and
sequence). After each trial, the amount wagered on that trial, the number of credits left to
play with, and the amount won (if anything) were prominently displayed, as is typical of
EGM displays. On each trial, one of four outcomes were possible: four identical symbols
constituted a Large win, yielding ten times the amount bet; Small wins were indicated by
three identical symbols that occurred in sequence, yielding five times the amount bet; Near-
wins occurred when one different symbol was inserted between three identical symbols, and
no credits were returned; and Losses occurred when neither a win nor near-win occurred,
with no credits returned. The probability of the three main outcome types (wins, losses, and
near-wins) closely matched outcomes from a real EGM (Wilkes et al., 2010). Although
presented randomly, an equal number of Near-win (15%) and Win (Small win: 7.5%; Large
win: 7.5%) outcomes were presented, with the remaining trials being Losses (70%). The
current task differed from commercially available EGMs in that the visual and auditory
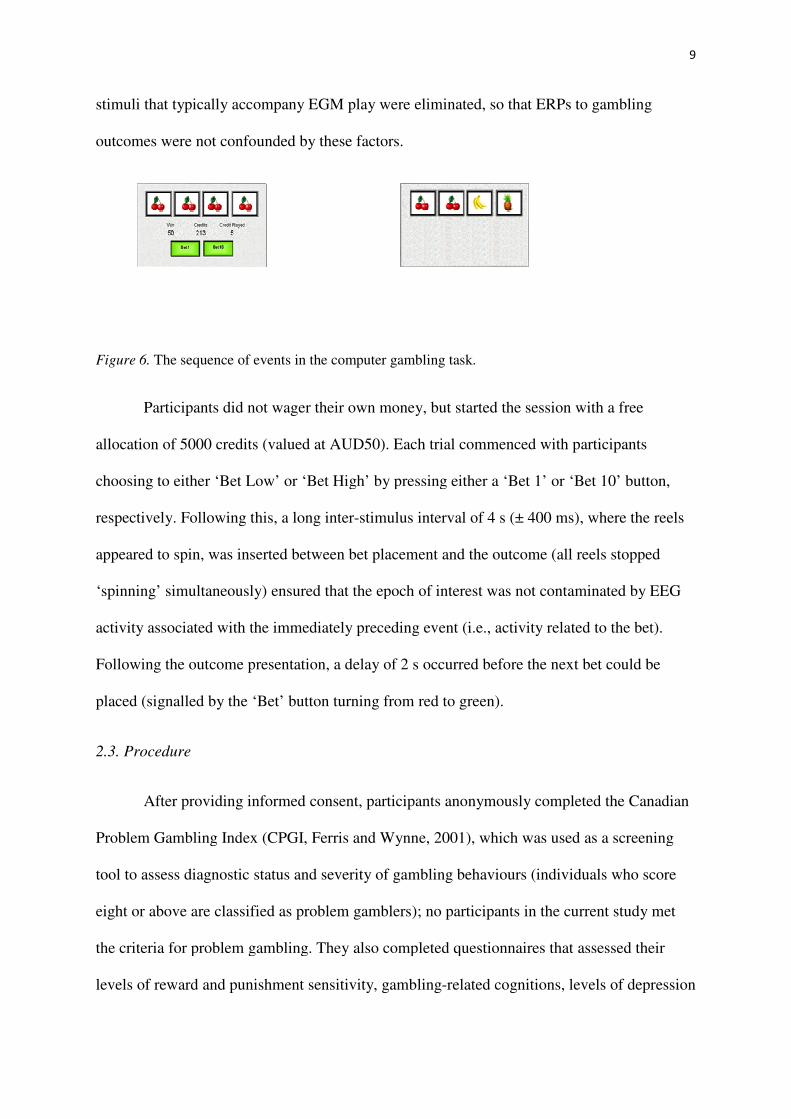
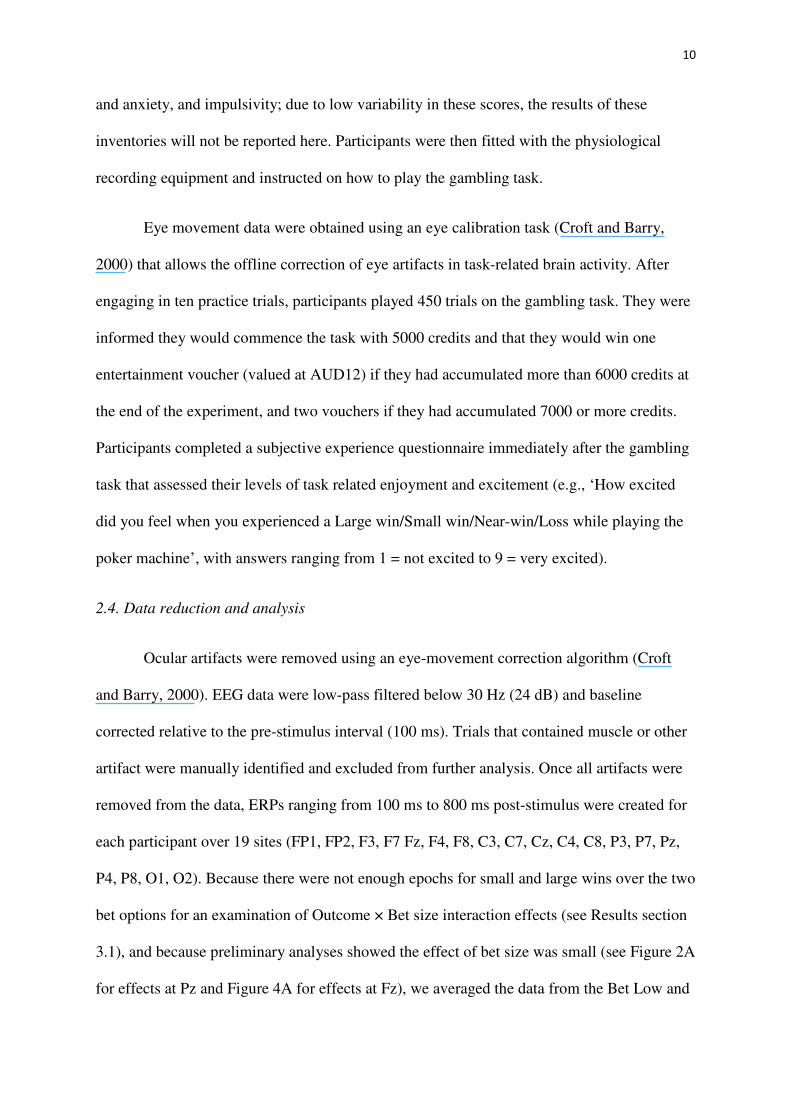
stimuli that typically accompany EGM play were eliminated, so that ERPs to gambling
outcomes were not confounded by these factors.
Figure 6. The sequence of events in the computer gambling task.
Participants did not wager their own money, but started th
allocation of 5000 credits (valued at AU
choosing to either ‘Bet Low’ or ‘Bet High’ by pressing either a ‘Bet 1’ or ‘Bet 10’ button,
respectively. Following this, a
appeared to spin, was inserted between bet placement and the outcome
‘spinning’ simultaneously) ensured
activity associated with the immediately preceding event (i.e., activity related to the bet).
Following the outcome presentation, a delay of 2
placed (signalled by the ‘Bet’ button turning from red to green).
2.3. Procedure
After providing informed consent, participants anonymously completed the
Problem Gambling Index (CPGI, Ferris and Wynne, 2001), which was used as a screening
tool to assess diagnostic status and severity of gambling behaviours (individuals who score
eight or above are classified as problem gamblers); no participants in the current study met
the criteria for problem gambling.
levels of reward and punishment sensitivity,
stimuli that typically accompany EGM play were eliminated, so that ERPs to gambling
outcomes were not confounded by these factors.
The sequence of events in the computer gambling task.
Participants did not wager their own money, but started the session with a free
allocation of 5000 credits (valued at AUD50). Each trial commenced with participants
to either ‘Bet Low’ or ‘Bet High’ by pressing either a ‘Bet 1’ or ‘Bet 10’ button,
a long inter-stimulus interval of 4 s (± 400 ms),
inserted between bet placement and the outcome (all reels stopped
ensured that the epoch of interest was not contaminated by EEG
ciated with the immediately preceding event (i.e., activity related to the bet).
Following the outcome presentation, a delay of 2 s occurred before the next bet could be
placed (signalled by the ‘Bet’ button turning from red to green).
r providing informed consent, participants anonymously completed the
Problem Gambling Index (CPGI, Ferris and Wynne, 2001), which was used as a screening
tool to assess diagnostic status and severity of gambling behaviours (individuals who score
ight or above are classified as problem gamblers); no participants in the current study met
the criteria for problem gambling. They also completed questionnaires that assessed their
levels of reward and punishment sensitivity, gambling-related cognitions, levels of depression
9
stimuli that typically accompany EGM play were eliminated, so that ERPs to gambling
e session with a free
Each trial commenced with participants
to either ‘Bet Low’ or ‘Bet High’ by pressing either a ‘Bet 1’ or ‘Bet 10’ button,
ms), where the reels
(all reels stopped
the epoch of interest was not contaminated by EEG
ciated with the immediately preceding event (i.e., activity related to the bet).
s occurred before the next bet could be
r providing informed consent, participants anonymously completed the Canadian
Problem Gambling Index (CPGI, Ferris and Wynne, 2001), which was used as a screening
tool to assess diagnostic status and severity of gambling behaviours (individuals who score
ight or above are classified as problem gamblers); no participants in the current study met
They also completed questionnaires that assessed their
levels of depression
10
and anxiety, and impulsivity; due to low variability in these scores, the results of these
inventories will not be reported here. Participants were then fitted with the physiological
recording equipment and instructed on how to play the gambling task.
Eye movement data were obtained using an eye calibration task (Croft and Barry,
2000) that allows the offline correction of eye artifacts in task-related brain activity. After
engaging in ten practice trials, participants played 450 trials on the gambling task. They were
informed they would commence the task with 5000 credits and that they would win one
entertainment voucher (valued at AUD12) if they had accumulated more than 6000 credits at
the end of the experiment, and two vouchers if they had accumulated 7000 or more credits.
Participants completed a subjective experience questionnaire immediately after the gambling
task that assessed their levels of task related enjoyment and excitement (e.g., ‘How excited
did you feel when you experienced a Large win/Small win/Near-win/Loss while playing the
poker machine’, with answers ranging from 1 = not excited to 9 = very excited).
2.4. Data reduction and analysis
Ocular artifacts were removed using an eye-movement correction algorithm (Croft
and Barry, 2000). EEG data were low-pass filtered below 30 Hz (24 dB) and baseline
corrected relative to the pre-stimulus interval (100 ms). Trials that contained muscle or other
artifact were manually identified and excluded from further analysis. Once all artifacts were
removed from the data, ERPs ranging from 100 ms to 800 ms post-stimulus were created for
each participant over 19 sites (FP1, FP2, F3, F7 Fz, F4, F8, C3, C7, Cz, C4, C8, P3, P7, Pz,
P4, P8, O1, O2). Because there were not enough epochs for small and large wins over the two
bet options for an examination of Outcome × Bet size interaction effects (see Results section
3.1), and because preliminary analyses showed the effect of bet size was small (see Figure 2A
for effects at Pz and Figure 4A for effects at Fz), we averaged the data from the Bet Low and
11
Bet High epochs together to derive four Outcome types (Large wins, Small wins, Losses,
Near wins). Furthermore, to prevent possible effects of habituation on the feedback related
response (FRR) component/s, only the first 15% of Loss outcomes were included in the
analyses.
In order to examine the latent ERP components associated with incentive value
processing, a two-step spatiotemporal PCA was conducted on the data using the ERP PCA
(EP) Toolkit, version 2.23 (Dien, 2010b). This data reduction technique was chosen over a
temporospatial PCA, as the topographies of the ERP components of interest are well-
established in the literature, and we wished to minimise the possibility of excluding ERP
components with similar latencies but different topographies. A spatial PCA was first
conducted on the data in order to identify the variance accounted for by electrode sites over
all time points, participants and conditions. A temporal PCA, which uses all time points over
all participants and conditions as variables, was then performed on the spatial components.
The covariance matrix was used for all PCAs, with Kaiser normalisation. In accordance with
the recommendation of Dien (2010a), INFOMAX rotation was performed for the spatial step
of the PCA, and PROMAX rotation was performed for the temporal step of the PCA.
Once ERP components relevant to the paradigm used were identified, the data for
each component were submitted to a four Outcome (Large win, Small win, Loss, Near-win)
repeated measures analysis of variance (ANOVA). Orthogonal planned contrasts were
conducted to examine differences between Wins (Large and Small combined) and Losses
(Losses and Near-wins combined), Large wins and Small wins, and between Losses and
Near-wins.
3. Results
3.1 Behavioural data and reports of subjective experience

12
On average, participants selected the Bet Low option on 38.9% of trials. Eight of the
seventeen participants chose to Bet High at least 75% of the time, with seven of the total
number of datasets containing five or fewer epochs in at least one of the win conditions (Bet
Low/Small win, Bet Low/Large win, Bet High/Small win, Bet High/Large win), and fifteen
of the total sample containing ten or fewer epochs (thus, as previously mentioned, outcomes
were collapsed across the two bet options for analysis).
A repeated measures ANOVA revealed participants rated Large wins (M = 5.47, SD =
1.91) as more exciting than Small wins (M = 3.59, SD = 1.46), F(1,16) = 48.76, p < .001, ηp2
= .75, and Small wins as more exciting as Losses (M = 2.35, SD = 1.45), F(1,16) = 8.25, p =
.011, ηp2
= .34).
3.2. Physiological measures
Dien (2010b; 2012) currently recommends using the parallel test (Horn, 1965), which
compares the amount of variability explained in the observed dataset using the Scree test
(Cattell, 1966) to that derived from uncorrelated variables within a dataset of totally random
noise, to determine the number of factors to retain in the first step of a PCA. When applying
this criterion, two site groupings (parietal and central, centred on Pz and Fz, respectively)
were identified to account for the majority of variance in the dataset
The minimum percentage criterion calculated by the EP Toolkit was used to
determine the number of temporal factors to be included in the second step of the PCA, as the
parallel test recommended only four factors to be included, and none of these corresponded to
the FRR ERP component/s. According to this criterion, seven temporal factors were found to
best represent the data.
Parietal factor SF1/TF1, and frontal factor SF2/TF3, most closely corresponded to the
P3b and FRN, respectively, in terms of their topography, latency, and response to
13
experimental manipulations. Two of the six remaining parietal factors (positive Slow wave
and Error positivity), and three of the six remaining frontal factors (negative Slow wave, and
P200), were identifiable ERP components; however, these either did not show factor score
differences between wins and losses, are of less theoretical importance, and/or are unrelated
to the objectives of the current paper, so will not be discussed further.
3.2.1. P300
Although both win and loss outcome types appeared to differ according to bet size
(Figure 2A), preliminary Outcome × Bet analyses showed these effects were not significant.
Thus, as mentioned above, because there were an insufficient number of epochs for a
comparison of small and large wins following decisions to Bet Low and to Bet High, the
PCA was conducted on data collapsed across the two Bet options.
The grand average virtual ERPs created by the EP toolkit were found to closely
resemble the grand average raw ERP waveforms for this dataset at site Pz (SF1) (Figure 2B).
Figure 2C shows how the grand average virtual ERP is comprised of the individual frontal
factors that were identifiable ERP components, and/or accounted for at least 1% of the
variance in the data.

Figure 2. Waveform data corresponding to the parietally maximal ERP components (SF1). A) The
raw ERP waveforms based on outcomes for each bet size at site Pz. B) The raw ERP grand average
and virtual ERP grand average (over all outcomes and bet types) at s
was found to be greatest. C) The virtual ERP components averaged over all outcomes at site Pz for the
five individual temporal factors that were identifiable ERP components, and/or accounted for more
than 1% of the variance in the dataset.
Waveform data corresponding to the parietally maximal ERP components (SF1). A) The
raw ERP waveforms based on outcomes for each bet size at site Pz. B) The raw ERP grand average
and virtual ERP grand average (over all outcomes and bet types) at site Pz, where the effect of the P3b
was found to be greatest. C) The virtual ERP components averaged over all outcomes at site Pz for the
five individual temporal factors that were identifiable ERP components, and/or accounted for more
nce in the dataset.
14
Waveform data corresponding to the parietally maximal ERP components (SF1). A) The
raw ERP waveforms based on outcomes for each bet size at site Pz. B) The raw ERP grand average
ite Pz, where the effect of the P3b
was found to be greatest. C) The virtual ERP components averaged over all outcomes at site Pz for the
five individual temporal factors that were identifiable ERP components, and/or accounted for more
The factor that corresponded to the P3b ERP component (SF1/TF1)
significantly larger amplitudes for Wins compared to Losses
= 61.76, p < .001, ηp2
= .79. Amplitudes did not
between Losses and Near-wins (Figure
Figure 3. A) Virtual ERP waveforms for each
site Pz. This factor was identified as corresponding to the P3b ERP component. B) Scalp topographies
demonstrating the difference between win types
3.2.2. Feedback related responses
The raw waveforms for the average ERP responses following
and to Bet Low for each Outcome type following can be seen in Figure 4A.
average virtual ERP was also found to closely resemble the grand average raw ERP
The factor that corresponded to the P3b ERP component (SF1/TF1)
significantly larger amplitudes for Wins compared to Losses, 472 ms post-outcome,
. Amplitudes did not differ between Small and Large w
wins (Figure 3).
waveforms for each outcome type for spatiotemporal factor, SF1/TF1, at
site Pz. This factor was identified as corresponding to the P3b ERP component. B) Scalp topographies
the difference between win types, near-wins, and losses 472 ms post
.2. Feedback related responses
The raw waveforms for the average ERP responses following decisions to Bet High
each Outcome type following can be seen in Figure 4A.
average virtual ERP was also found to closely resemble the grand average raw ERP
15
The factor that corresponded to the P3b ERP component (SF1/TF1) showed
outcome, F(1,16)
Large wins, or
outcome type for spatiotemporal factor, SF1/TF1, at
site Pz. This factor was identified as corresponding to the P3b ERP component. B) Scalp topographies
wins, and losses 472 ms post-outcome.
decisions to Bet High
each Outcome type following can be seen in Figure 4A. The grand
average virtual ERP was also found to closely resemble the grand average raw ERP
waveforms for this dataset at site Fz (
individual factors included in the PCA for this site constitute the grand average virtual ERP.
Waveform data corresponding to the frontally maximal ERP components (SF2). A) The raw ERP
waveforms based on outcomes for each bet size at site Fz. The highlighted section in
that would have been considered to be the FRN using traditional (although non
quantification methods. B) The raw ERP grand average waveform and the virtual ERP grand average
waveforms for this dataset at site Fz (SF2) (Figure 4B). Figure 4C shows how the
ded in the PCA for this site constitute the grand average virtual ERP.
Waveform data corresponding to the frontally maximal ERP components (SF2). A) The raw ERP
waveforms based on outcomes for each bet size at site Fz. The highlighted section in
that would have been considered to be the FRN using traditional (although non-difference waveform)
quantification methods. B) The raw ERP grand average waveform and the virtual ERP grand average
16
C shows how the seven
ded in the PCA for this site constitute the grand average virtual ERP.
Figure 4.
Waveform data corresponding to the frontally maximal ERP components (SF2). A) The raw ERP
waveforms based on outcomes for each bet size at site Fz. The highlighted section includes the peak
difference waveform)
quantification methods. B) The raw ERP grand average waveform and the virtual ERP grand average
17
waveform (over all outcomes and bet sizes). C) The virtual ERP components averaged over all
outcomes at site Fz for the four individual temporal factors that were identifiable ERP components,
and/or accounted for more than 1% of the variance in the dataset.
The factor that most closely corresponded to the FRN ERP component (SF2/TF3)
peaked at 290 ms post-outcome, and was characterised by both a negative deflection
following Losses, and a positive deflection following Wins (Figure 5). The difference
between win-loss outcomes was found to be statistically significant, F(1, 16) = 126.85, p <
.001, ηp2
= .89. Henceforth, negative deflections of this factor following losses will be
referred to as FRN, and positive deflections to wins will be called feedback related positivity
(FRP). Significantly larger FRP amplitudes were observed following Large wins compared to
Small wins, F(1, 16) = 7.21, p = .016, ηp2
= .31. FRN amplitude following Losses were found
to elicit significantly greater negative amplitudes compared to Near-wins, F(1,16) = 23.24, p
< .001, ηp2
= .59.
Figure 5. A) Virtual ERP waveforms
which was maximal at Fz. This factor was identified as corresponding to the feedback
negativity and the feedback related positivity ERP components. B) Scalp topographies
the difference between wins, near
4. Discussion
The current study used a PCA to
previously found to index various aspects of incentive value processing. Specifically, we
aimed to examine whether the feedback related responses (
could be considered distinct neural measures, and to determine whether they can be used as
indices of the cognitive processing of
ecologically valid paradigm.
Virtual ERP waveforms for each outcome type for spatiotemporal factor, SF2/TF3,
which was maximal at Fz. This factor was identified as corresponding to the feedback
negativity and the feedback related positivity ERP components. B) Scalp topographies
between wins, near-wins, and losses, 290 ms post-outcome.
a PCA to investigate the latent nature of two ERP components
previously found to index various aspects of incentive value processing. Specifically, we
examine whether the feedback related responses (the FRN and the
could be considered distinct neural measures, and to determine whether they can be used as
s of the cognitive processing of outcome valence and reward magnitude in an
18
outcome type for spatiotemporal factor, SF2/TF3,
which was maximal at Fz. This factor was identified as corresponding to the feedback-related
negativity and the feedback related positivity ERP components. B) Scalp topographies demonstrating
two ERP components
previously found to index various aspects of incentive value processing. Specifically, we
the FRP) and the P3b
could be considered distinct neural measures, and to determine whether they can be used as
outcome valence and reward magnitude in an

19
4.1. Wins vs. losses
4.1.1. FRN/FRP
By using a spatiotemporal PCA to parse the FRN from overlapping ERP components, we
demonstrated that loss outcomes are reflected by a negative deflection approximately 290 ms
post-feedback, a result consistent with previous FRN findings using traditional quantification
methods (Gehring and Willoughby, 2002; Hajcak, et al., 2005; Hajcak, et al., 2006; Holroyd
et al., 2006; Yeung, et al., 2005; Yeung and Sanfey, 2004). Conversely, we also demonstrated
that win outcomes elicit a positive deflection at the same latency, corroborating the findings
from other studies (Foti et al., 2011; Holroyd et al., 2003; Holroyd et al., 2008). The results of
the current study serve to elucidate how feedback of differing incentive value are processed
in the brain, as well as to consolidate and explain the disparate findings of the extant
literature - something that is of major significance, as it affords the examination of the effects
of both reward and punishment via independent neural correlates that are likely to be
generated within the same cortical structure/s and/or system/s. The reinforcement learning
theory (Holroyd and Coles, 2002), posits that outcomes are evaluated within the
mesencephalic dopamine system based on previously learned expectations. Within this
system, the basal ganglia monitor outcomes and stimulate dopamine levels: accordingly,
rewarding outcomes cause dopamine to be released, leading to feelings of pleasure, whereas
worse-than-expected outcomes are associated with reduced dopamine transmission (Fiorillo
et al., 2003; Schultz, 2007). The results of the current study are compatible with this
conjecture; the observed FRN deflection to negative feedback is likely to reflect the
disinhibition of the ACC, whereas the FRP following reward outcomes reflects inhibition of
the ACC – serving to guide future behaviours to aversive and appetitive stimuli, respectively.
Despite the probability of reward being controlled for in the analysis of the current
study, the positive response to win outcomes observed may be exaggerated due to
20
participants perceiving rewards to occur less frequently during the course of the experiment;
however, a large positive deflection (i.e., the FRP) to reward outcomes, similar to that found
in the current experiment, was also found in a recent study that used a temporospatial PCA to
examine equiprobable win and loss outcomes in a simple two-choice gambling task (Foti et
al., 2011). That study also found a much smaller FRN to loss outcomes, the reasons for which
are unclear; such a result would not be predicted by stimulus frequency effects (losses
occurred comparatively more frequently in the current study). It is possible that the more
centrally maximal distribution of the component identified by Foti and colleagues may
indicate a separate ERP component that is different from the feedback related responses of
the current study, or may reflect the different paradigms used by each study; further research
is required to consolidate these findings.
Indices of incentive value processing, including the FRN and FRP, are particularly
relevant for the examination of individuals who have been posited to display abnormalities in
the way rewarding and/or punishing/non-rewarding stimuli are evaluated. For example,
attenuated or accentuated amplitudes of the positive deflection following wins in the response
profile of problem gamblers may indicate a hyposensitivity or hypersensitivity to rewards,
respectively, whereas reduced amplitudes of the negative deflection following losses may
indicate a hyposensitivity to punishment. An examination of the responses to win and loss
stimuli in such individuals may lead to the identification of a biological marker for addiction,
and provide a foundation on which clinical treatments and interventions can be developed.
4.1.2. P3b
As predicted, we found larger P3b amplitudes for wins compared to losses, a result
consistent with prior reports on global P300 amplitudes by some researchers (e.g., Hajcak et
al., 2007), but not by others (Sato et al., 2005; Yeung and Sanfey, 2004). Thus, we did not
corroborate the double-dissociation pattern suggested previously (Sato et al., 2005; Yeung
21
and Sanfey, 2004), as both P3b and FRN were seen to be sensitive to valence. Although the
probability of win (15%), near-win (15%), and loss events (70%) were not matched in the
EGM task of the current study, probability differences between these events fail to explain
the differences observed. For instance, larger P3b amplitudes were observed to win events
compared to equiprobable near-win events (see Figure 3). While it is theoretically possible
that probability effects may have cancelled out an actual difference between near-wins and
losses, this is unlikely because the two individual effects would be expected to work in the
same direction: lower probability and great salience for near-wins would be expected to
increase P3b effects. We conclude that the larger P3b amplitudes observed for wins
(compared with losses) are associated with the motivational significance of rewards to the
individual in response to ecologically valid stimuli, reflecting factors other than probability
that are known to affect the P300 (Johnson, 1986).
4.2. Effects of reward magnitude
The current study added to previous research by examining whether reward
magnitude affects FRP and P3b amplitude. The majority of previous studies have found that
the traditionally conceptualised FRN is not sensitive to outcome magnitude (Hajcak et al.,
2006; Sato et al., 2005; Yeung and Sanfey, 2004; Yu and Zhou, 2006; cf. San Martin et al.,
2010), indicating that it reflects a dichotomous evaluation of outcomes, with events being
contextually better or worse, with no response differences for intermediate-sized outcomes
(Hajcak et al., 2006). The finding that the feedback related responses in the current study not
only differentiates the valence of outcomes, but also that the FRP is sensitive to the
magnitude of win outcomes is exciting, particularly for the future examination of problem
gambling. It could help determine whether the behaviours that are characteristic of this
disorder stem from abnormal responses to large and small wins; for example, an attenuated
22
response to small, but not large wins, may suggest a predisposition to seek larger rewards
despite personal cost.
Unlike the FRP, similar P3b component responses were found following small and
large gains, a result that contrasts with earlier research (Sato et al., 2005; Yeung and Sanfey,
2004). It is unlikely that this result was due to the lack of difference in the perceived value of
the amounts returned for large and small wins, as these amounts were comparable to those
returned in previous studies where differences in P300 amplitude were observed for different
magnitude wins (e.g., Bellbaum et al., 2010). Furthermore, although the subjective
experience questionnaire did not specifically assess the perceived value of credits returned in
the current task directly, participants did rate larger wins as more exciting than small wins.
4.3. Near-wins
While P3b amplitudes following near-wins suggest they are not as rewarding as wins
(Figure 3), these outcomes were associated with reduced FRN amplitudes (Figure 5),
implying that they are subjectively experienced as less aversive than full-loss outcomes,
despite returning nil credits. These results are consistent with previous ERP research (Luo et
al., 2011; cf. Qi et al., 2011), where near-wins resulted in reduced FRN, but no difference in
P300 amplitudes, and suggest that these frequently occurring outcomes, that are unique to
EGM gambling, are an important design feature of this gambling medium and may play a
role in the development and maintenance of gambling behaviours by reducing the unpleasant
nature of loss outcomes.
4.4. Limitations and future directions
Although attempts were made to construct an ecologically valid task, with stimulus
characteristics, event-types and bet options simulating real gambling conditions, key
differences between the laboratory task used in the current study and actual gambling need to
be acknowledged. In real gambling, significant sums of money are wagered, won, and lost
23
within a short period, whereas in previous laboratory-based studies (e.g., Lole et al., 2012;
Wilkes et al., 2010), and the current study, rewards were capped and restricted to small
amounts (movie voucher/s in the current study). Further, unlike real gambling, the participant
does not suffer the risk of losing their own money, with losses often restricted to loss of free
credits allocated to the research participant. It is often assumed that findings from controlled
laboratory conditions will be replicated in, and may be generalised to actual gambling
behaviors, but this remains to be demonstrated. Within the autonomic realm, research has
examined electrodermal and cardiac data in real club settings when patrons bet with their own
money (e.g., Coventry and Constable, 1999; Diskin and Hodgins, 2003; Griffiths, 1993;
Krueger et al., 2005; Meyer et al., 2000). In a similar context, the implications of ERP
findings for problem gambling have been alluded to in most laboratory studies, although we
found no more than two studies that compared ERPs in response to reward and punishment
sensitivity between problem and non-problem gamblers (Hewig et al., 2010; Oberg et al.,
2011). The application of such information in the applied domain is clearly warranted and an
urgent priority, although ethical and technical issues (e.g., challenges of recording reliable
ERPs in a live-gambling environment) remain major challenges. Nevertheless, laboratory
studies, where variables may be manipulated without the confounding factors that are
encountered in vivo (e.g., the presence of others, financial implications, ingestion of
psychoactive substances), are essential to establish a foundation of knowledge on which
future applied research can build.
4.5. Conclusions
The application of a spatiotemporal PCA in the current study allowed an examination
of the feedback related responses and P3b without the confounding influence of overlapping
ERP components. The results of the feedback related responses from the current study
consolidate those from previous research, in that two distinct ERP components sensitive to

24
outcome valence occur at the same latency post-feedback; the FRN, characterised by a
negative deflection to losses, and the FRP, characterised by a positive deflection to wins. The
P3b was also confirmed to be a reliable index of reward valence, with greater amplitudes
following win compared to loss outcomes. The current study was the first to examine the
latent nature of the responses to different sized wins, and found the FRP, but not the P3b, to
be a reliable index of reward magnitude, with greater amplitudes following large compared to
small wins. The current study was also the first to examine near-wins using a PCA; these
outcomes were found to elicit smaller FRN amplitudes compared to losses, which implies
that they are perceived as less unfavourable than loss outcomes, and that they may play a role
in the particular appeal of EGM gambling. Thus, the current study was able to achieve a
comprehensive examination of the latent psychophysiological profile of healthy controls in
response to gambling stimuli that are commonly encountered in real gambling environments.
These findings may guide future research on problem gambling behaviours in order to
determine whether this disorder is caused by an abnormal response to reward and/or
punishment/non-reward stimuli.
Acknowledgement
This project was supported by an Australian Research Council Linkage Grant, LP0776836.
25
References
Bellebaum, C., Daum, I., 2008. Learning-related changes in reward expectancy are reflected
in the feedback-related negativity. Eur. J. Neurosci. 27, 1823-1835.
Bellbaum, C., Polezzi, D., Daum, I., 2010. It is less than you expected: The feedback-related
negativity reflects violations of reward magnitude expectations. Neuropsychologia 48,
3343-3350.
Blum, K., Braverman, E.R., Holder, J.M., Lubar, J.F., Monastra, V.J., Miller, D. et al., 2000.
Reward deficiency syndrome: A biogenetic model for the diagnosis and treatment of
impulsive, addictive, and compulsive behaviors. J Psychoactive Drugs 32, 1-112.
Breen, R.B., Zimmerman, M., 2002. Rapid onset of pathological gambling in machine
gamblers. J. Gambl. Stud. 18, 31-43.
Cattell, R.B., 1966. The scree test for the number of factors. Multivariate Behav.
Res. 1, 245-276.
Clark, L., Lawrence, A.J., Astley-Jones, F., Gray, N., 2009. Gambling near-misses enhance
motivation to gamble and recruit win-related brain circuitry. Neuron 61, 481-490.
Coventry, K.R., Constable, B., 1999. Physiological arousal and sensation-seeking in female
fruit machine gamblers. Addiction 94, 425-430.
Croft, R.J., Barry, R.J., 2000. EOG correction of blinks with saccade coefficients: A test and
revision of the aligned-artifact average solution. Clin. Neurophysiol. 3, 444-455.
De Pascalis, V., Varriale, V., D'Antuono, L., 2010. Event-related components of the
punishment and reward sensitivity. Clin. Neurophysiol. 121, 60-76.
26
Dien, J., 2010a. Evaluating two-step PCA of ERP data with Geomin, Infomax, Oblimin,
Promax, and Varimax rotations. Psychophysiology 47, 170-183
Dien, J., 2010b. The ERP PCA Toolkit: An open source program for advanced
statistical analysis of event-related potential data. J. Neurosci. Meth. 187, 138-145.
Dien, J., 2012. Applying principal components analysis to event-related potentials: A tutorial.
Dev. Neuropsychol. 37, 497-517.
Diskin, K.M., Hodgins, D.C., 2003. Psychophysiological and subjective arousal during
gambling in pathological and non-pathological video lottery gamblers. International
Gambling Studies 3, 37-51.
Donchin, E., Coles, M.G., 1988. Is the P300 component a manifestation of context updating?
Behav. Brain Sci. 11, 355-372.
Dowling, N., Smith, D., Thomas, T., 2001. Electronic gaming machines: Are they the ‘crack-
cocaine’ of gambling? Addiction 100, 33-45.
Dunning, J.P., Hajcak, G., 2007. Error-related negativities elicited by monetary loss and cues
that predict loss. NeuroReport 18, 1875-1878.
Ferris, J., Wynne, H., 2001. The Canadian Problem Gambling Index: Final Report. Ottawa:
Canadian Centre on Substance Abuse.
Fiorillo, C.D., Tobler, P.N., Schultz, W., 2003. Discrete coding of reward probability and
uncertainty by dopamine neurons. Science 299, 1898 -1902.
Foti, D., Hajcak, G., 2009. Depression and reduced sensitivity to non-rewards versus
rewards: Evidence from event-related potentials. Biol. Psychol. 81, 1-8.
Foti, D., Weinberg, A., Dien, J., Hajcak, G., 2011. Event-related potential activity in the basal
ganglia differentiates rewards from nonrewards: Temporospatial principal

27
components analysis and source localization of the feedback negativity. Hum. Brain
Mapp. 32, 2207-2216.
Gehring, W.J., Willoughby, A.R., 2002. The medial frontal cortex and the rapid processing of
monetary gains and losses. Science 295, 2279-2282.
Gonsalvez, C.J., Barry, R.J., Rushby, J., Polich, J., 2007. Target-to-target interval, intensity
and P300 from an auditory single-stimulus task. Psychophysiology 44, 245-250.
Griffiths, M., 1993. Tolerance in gambling: An objective measure using the
psychophysiological analysis of male fruit machine gamblers. Addict. Behav. 18, 365-
372.
Gu, R., Huang, Y., Luo, Y., 2010. Anxiety and feedback negativity. Psychophysiology 47,
961-967.
Hajcak, G., Holroyd, C.B., Moser, J.S., Simons, R.F., 2005. Brain potentials associated with
expected and unexpected good and bad outcomes. Psychophysiology 42, 161-170.
Hajcak, G., Moser, J.S., Holroyd, C.B., Simons, R.F., 2006. The feedback-related negativity
reflects the binary evaluation of good versus bad outcomes. Biol. Psychol. 71, 148-
154.
Hajcak, G., Moser, J.S., Holroyd, C.B., Simons, R.F., 2007. It's worse than you thought: The
feedback negativity and violations of reward prediction in gambling tasks.
Psychophysiology 44, 905-912.
Hewig, J., Trippe, R.H., Hecht, H., Coles, M.G.H., Holroyd, C.B., Miltner, W.H.R., 2007.
Decision-making in blackjack: An electrophysiological analysis. Cerebr. Cortex 17,
865-877.
28
Hewig, J., Kretschmer, N., Trippe, R.H., Hecht, H., Coles, M.G.H., Holroyd, C.B., Miltner,
W.H.R., 2010. Hypersensitivity to reward in problem gamblers. Biol. Psychiatr. 67,
781-783.
Holroyd, C.B., Coles, M.G., 2002. The neural basis of human error processing:
Reinforcement learning, dopamine, and the error-related negativity. Psychol. Rev.
109, 679-709.
Holroyd, C.B., Hajcak, G., Larsen, J.T., 2006. The good, the bad and the neutral:
Electrophysiological responses to feedback stimuli. Brain Res. 1105, 93-101.
Holroyd, C.B., Krigolsen, O.E., 2007. Reward prediction error signals associated with a
modified time estimation task. Psychophysiology 44, 913-917.
Holroyd, C.B., Larsen, J.T., Cohen, J.D., 2004. Context dependence of the event-related brain
potential associated with reward and punishment. Psychophysiology 41, 245-253.
Holroyd, C.B., Niewenhuis, S., Yeung, N., Cohen, J.D., 2003. Errors in reward prediction are
reflected in the event-related brain potential. NeuroReport 14, 2481-2484.
Holroyd, C.B., Pakzad-Vaezi, K.L., Krigolson, O.E., 2008. The feedback correct-related
positivity: Sensitivity of the event-related brain potential to unexpected positive
feedback. Psychophysiology 45, 688-697.
Horn, J.L., 1965. A rationale and test for the number of factors in factor analysis.
Psychometrika 30, 179-185.
Johnson, R., Jr., 1986. A triarchic model of P300 amplitude. Psychophysiology 23, 367-384.
Krueger, T.H.C., Schedlowski, M., Meyer, G., 2005. Cortisol and heart rate measures during
casion gambling in relation to impulsivity. Neuropsychobiology 52, 206-211.

29
Lole, L., Gonsalvez, C.J., Blaszczynski, A., Clarke, A.R., 2012. Electrodermal activity
reliably captures physiological differences between wins and losses during gambling
on electronic machines. Psychophysiology 49, 154-163.
Luo, Q., Wang, Y., Qu, C., 2011. The near-miss effect in slot-machine gambling: Modulation
of feedback-related negativity by subjective value. Neuroreport 22, 989-993.
Meyer, G., Hauffa, B.P., Schedlowski, M., Pawlak, C., Stadler, M.A., Exton, M.S., 2000.
Casino gambling increases heart rate and salivary cortisol in regular gamblers. Biol.
Psychiatr. 48, 948-953.
Miltner, W.H.R., Braun, C.H., Coles, M.G.H., 1997. Event-related brain potentials following
incorrect feedback in a time-estimation task: Evidence for a “generic” neural system
for error detection. J. Cogn. Neurosci. 9, 788-798.
Nieuwenhuis, S., Slagter, H.A., von Geusau, N.J.A., Heslenfeld, D., Holroyd, C.B., 2005.
Knowing good from bad: Differential activation of human cortical areas by positive
and negative outcomes. Eur. J. Neurosci. 21, 3161-3168.
Nieuwenhuis, S., Yeung, N., Holroyd, C.B., Schurger, A., Cohen, J.D., 2004. Sensitivity of
electrophysiological activity from medial frontal cortex to utilitarian and performance
feedback. Cereb. Cortex 14, 741-747.
Oberg, S.A.K., Christie, G.J., Tata, M.S., 2011. Problem gamblers exhibit reward
hypersensitivity in medial frontal cortex during gambling. Neuropsychologia 49,
3768-3775.
Petry, N.M., 2003. A comparison of treatment-seeking pathological gamblers based on
preferred gambling activity. Addiction 98, 645-655.
Qi, S., Ding, C., Song, Y., Yang, D., 2011. Neural correlates of near-misses effect in
gambling. Neurosci. Lett. 493, 80-85.
30
Reuter, J., Raedler, T., Rose, M., Hand, I., Glascher, J., Buchel, C., 2005. Pathological
gambling is linked to reduced activation of the mesolimbic reward system. Nat.
Neurosci. 8,147-148.
San Martin, R., Manes, F., Hurtado, E., Isla, P., Ibanez, A., 2010. Size and probability of
rewards modulate the feedback error-related negativity associated with wins but not
losses in a monetarily rewarded gambling task. NeuroImage 51, 1194-1204.
Sato, A., Yasuda, A., Ohira, H., Miyawaki, K., Nishikawa, M., Kumano, H., Kuboki, T.,
2005. Effects of value and reward magnitude on feedback negativity and P300.
NeuroReport 16, 407–411.
Schultz, W., 2007. Behavioral dopamine signals. Trends Neurosci. 30, 203-210.
Toyomaki, A., Murohashi, H., 2005. The ERPs to feedback indicating monetary loss and gain
on the game of modified “rock-paper-scissors”. Int. Congr. 1278, 381-384.
Verleger, R., 1988. Event-related potentials and cognition: A critique of the context
updating hypothesis and an alternative interpretation of P3. Behav. Brain Sci. 11, 343-
427.
Wilkes, B.L., Gonsalvez, C.J., Blaszczynski, A., 2010. Capturing SCL and HR changes to
win and loss events during gambling on electronic machines. Int. J. Psychophysiol.
78, 265-272.
Wu, Y., Zhou, X., 2009. The P300 and reward valence, magnitude, and expectancy in
outcome evaluation. Brain Res. 1286, 114-122.
Yeung, N., Holroyd, C.B., Cohen, J.D., 2005. ERP correlates of feedback and reward
processing in the presence and absence of response choice. Cereb. Cortex 15, 535-
544.
Yeung, N., Sanfey, A.G., 2004. Independent coding of reward magnitude and valence in the
human brain. J. Neurosci. 24, 6258–6264.

31
Yu, R., Zhou, X., 2006. Brain responses to outcomes of one’s own and other’s performance
in a gambling task. NeuroReport 17, 1747-1751.
Zhou, Z., Yu, R., Zhou, X., 2010. To do or not to do? Action enlarges the FRN and P300
effects in outcome evaluation. Neuropsychologia 48, 3606-3613.
32
Figure Captions
Figure 1. The sequence of events in the computer gambling task.
Figure 2. Waveform data corresponding to the parietally maximal ERP components (SF1). A) The
raw ERP waveforms based on outcomes for each bet size at site Pz. B) The raw ERP grand average
and virtual ERP grand average (over all outcomes and bet types) at site Pz, where the effect of the P3b
was found to be greatest. C) The virtual ERP components averaged over all outcomes at site Pz for the
five individual temporal factors that were identifiable ERP components, and/or accounted for more
than 1% of the variance in the dataset.
Figure 3. A) Virtual ERP waveforms for each outcome type for spatiotemporal factor, SF1/TF1, at
site Pz. This factor was identified as corresponding to the P3b ERP component. B) Scalp topographies
demonstrating the difference between win types, near-wins, and losses 472 ms post-outcome.
Figure 4. Waveform data corresponding to the frontally maximal ERP components (SF2). A) The raw
ERP waveforms based on outcomes for each bet size at site Fz. The highlighted section includes the
peak that would have been considered to be the FRN using traditional (although non-difference
waveform) quantification methods. B) The raw ERP grand average waveform and the virtual ERP
grand average waveform (over all outcomes and bet sizes). C) The virtual ERP components averaged
over all outcomes at site Fz for the four individual temporal factors that were identifiable ERP
components, and/or accounted for more than 1% of the variance in the dataset.
Figure 5. A) Virtual ERP waveforms for each outcome type for spatiotemporal factor, SF2/TF3,
which was maximal at Fz. This factor was identified as corresponding to the feedback-related
negativity and the feedback related positivity ERP components. B) Scalp topographies demonstrating
the difference between wins, near-wins, and losses, 290 ms post-outcome.