Can Africa Compete in World Soccer? - Building State Capability
32
Can Africa Compete in World Soccer? Matt Andrews CID Faculty Working Paper No. 403 January 2022 Copyright 2022 Andrews, Matt; and the President and Fellows of Harvard College at Harvard University Center for International Development Working Papers
-
Upload
khangminh22 -
Category
Documents
-
view
1 -
download
0
Transcript of Can Africa Compete in World Soccer? - Building State Capability

Can Africa Compete in World Soccer?
Matt Andrews
CID Faculty Working Paper No. 403
January 2022
Copyright 2022 Andrews, Matt; and the President and Fellows
of Harvard College
at Harvard University Center for International Development Working Papers

1
Can Africa Compete in World Soccer?
Matt Andrews
Harvard Kennedy School
Abstract
In March 2021, the Confederation of African Football’s President, Patrice Motsepe, insisted that
“An African team must win the World Cup in the near future.” This visionary statement is infused
with hope—not just for an African World Cup victory but for a fuller future in which African men’s
soccer competes with world soccer’s elite. This paper asks if there is any chance of this happening.
It suggests a simple method to assess how a country competes as both a ‘participant’ and a ‘rival’
and uses this method to examine how Africa’s top countries compete in world soccer. This analysis
points to a gap between such countries and the world’s best, which has grown in recent decades—
even though some African countries do compete more over time. The paper concludes by
suggesting that Africa’s hope of winning the World Cup is not impossible but demands more active
work, focused particularly on ensuring top African countries compete with more high-quality
competition more often. The conclusion also suggests that the research approach might be
relevant beyond a study of African soccer. It could particularly help shed light on how well African
countries compete (as participants and rivals) in the world economy.

2
Introduction
In March 2021, the Confederation of African Football’s President, Patrice Motsepe, insisted that
“An African team must win the World Cup in the near future.”1 This visionary statement is infused
with hope—not just for an African World Cup victory but for a fuller future in which African men’s
soccer competes with world soccer’s elite. What, I wonder, is the chance of this happening?
Not much, if one goes by the history of such predictions. Brazil’s great player Pelé made a similar
claim in the 1970s, positing that an African team would win the World Cup by 2000. It never
happened. Ghanaian legend Abedi Pele predicted an African win at the 2010 World Cup in South
Africa.2 It also never happened. And Nigerian playmaker Jay Jay Okocha noted that an African win
was imminent and “could even be in” the 2014 tournament in Brazil. This also never happened.
This history prompts a simple question: Why has African soccer not lived up to prior hopes of
competing to win? I see three potential answers to this question: (i) Africa’s hope of competing
with the world soccer’s elite will be satisfied at the right time, which has not yet come;3 or (ii) This
hope is too passive, and will not happen if left ‘to time’ and not given more active attention; or (iii)
This hope is unrealistic and will never happen.4 One cannot tell which answer is correct without a
reality check of how well African countries compete now and how this has changed over time.
Such analysis can show how close the continent’s soccer community is to realizing its hope of
winning, if and where it needs more work, or if it is chasing an impossible dream.
This paper offers a modest effort at such reality check, assessing how well Africa’s most successful
soccer-playing countries compete in world soccer. I start by asking what it means to ‘compete’,
suggesting a simple method to assess how a country competes as both a ‘participant’ and a ‘rival’
in world soccer. I then use this method to examine how Africa’s top countries compete in world
soccer. This analysis points to a gap between such countries and the world’s best, which has grown
1 AFP (2021). 2 Abedi Pele and Jay Jay Okocha’s comments come from Collett (2009) and Wasim (2014). 3 I draw on Fromm (2010, p.22), who describes hope as, “like a crouched tiger, which will jump only when the moment for jumping has come” and says, “[T]o hope means to be ready at every moment for that which is not yet born, and yet not become desperate if there is no birth in our lifetime.” 4 I draw on what Fromm (2010, p.22) says hope ‘is not’: “It is neither passive waiting nor is it unrealistic forcing of circumstances that cannot occur.”
3
in recent decades because Africa’s top teams enjoy weaker quality competition than elite teams
in places like Europe. There are signs that some African countries are competing better over time,
but these gains are likely to hit a ceiling without improvements in the quality of competition.
I conclude by suggesting that Africa’s hope of winning the World Cup is not impossible but
demands active work and a new strategy, focused particularly on ensuring top African countries
compete more often with elite world competitors and in elite competitions, to develop a sustained
habit of winning such contests. The conclusion also notes that my approach might be useful to
African policymakers working outside of the soccer arena. In particular, I recommend that it could
be valuable to assess how African countries compete (as participants and rivals) in the world
economy, and if these countries are competing enough to realize their national visions of
transforming from low or low-middle income economies into ‘winner’ high-income ones.
What does it mean for countries to compete?
People interact all the time, as individuals and in groups—including large groups like countries.
This interaction is ‘competitive’ when all those involved try to achieve a goal that only one or some
can achieve. These competitive interactions manifest in discrete events, or contests, like a 90-
minute soccer match played between two teams; and in longer processes, or competitions, like
the World Cup soccer tournament in which many teams play many matches over many months.
Most competitors aim to achieve as much as possible from these interactions; trying to win
matches, advance through tournaments, and even win titles. A few competitors win more than
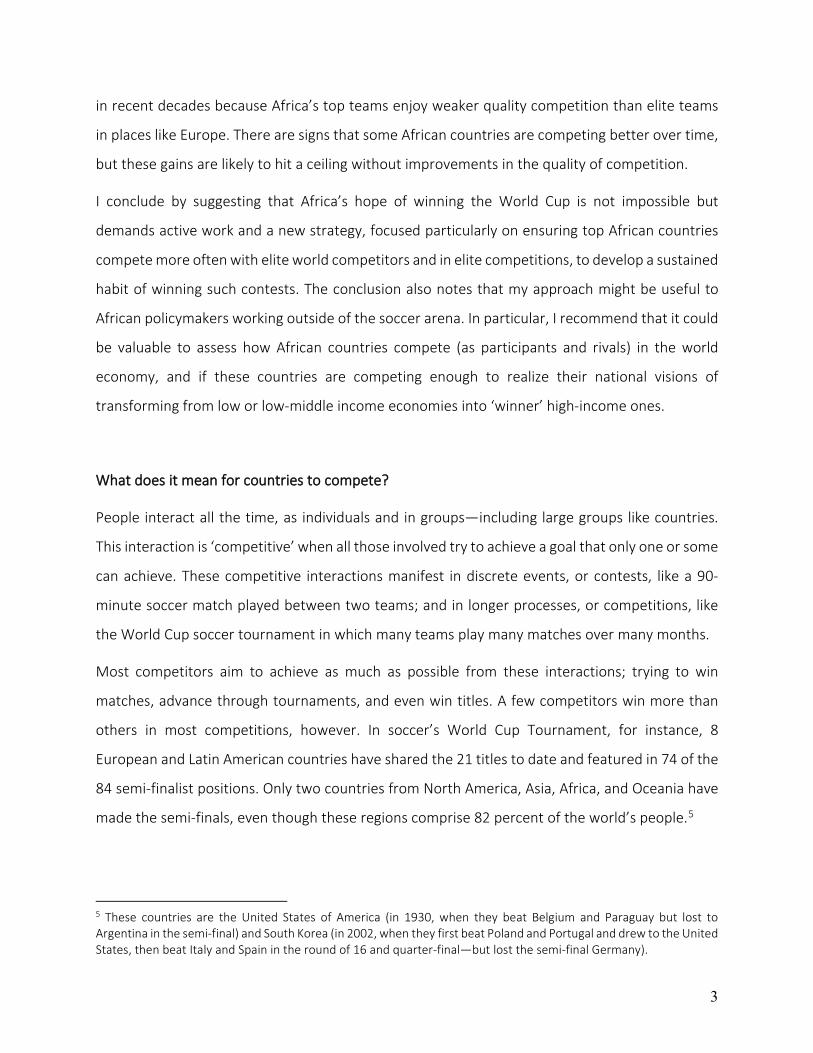
others in most competitions, however. In soccer’s World Cup Tournament, for instance, 8
European and Latin American countries have shared the 21 titles to date and featured in 74 of the
84 semi-finalist positions. Only two countries from North America, Asia, Africa, and Oceania have
made the semi-finals, even though these regions comprise 82 percent of the world’s people.5
5 These countries are the United States of America (in 1930, when they beat Belgium and Paraguay but lost to Argentina in the semi-final) and South Korea (in 2002, when they first beat Poland and Portugal and drew to the United States, then beat Italy and Spain in the round of 16 and quarter-final—but lost the semi-final Germany).

4
Studies explore why some countries win more than others, often listing attributes of winning
nations as keys to ‘competitiveness’.6 In respect of international soccer, these attributes are often
about the country, its soccer playing community, how it engages with other countries, and how it
manages and administers national teams and their interactions with teams from other nations. I
do not intend to further this work here and probe why African countries succeed or fail. Instead, I
ask a simpler question that should precede such work: How well do African countries compete in
world soccer, and what does this suggest about their hopes of winning in the future?
What it means to ‘compete’
I started my inquiry asking what it means to ‘compete’, finding a common definition that
emphasizes ‘taking part in a contest or competition’.7 This channels the Olympic Creed’s advice
that “the important thing” in competition “is not winning, but taking part.”8 It might sound like a
salve to offer someone who has just lost a contest, but it also refers to the challenge every aspiring
competitor has of gaining and retaining access to contests and competition—or competing as a
participant. Competitors who fail in this challenge—and do not get to ‘take part’ in competitive
interactions—are excluded from other gains of competing. As a result, any study on how well a
country competes should start by asking how it ‘competes as participant’, with a simple approach
to such assessment examining how many contests and competitions the competitor ‘takes part’
in, the quality of the competitors they face, and the quality of competitions to which they are able
to gain and retain access (especially if they can interact with ‘high-position’ competitors and in
‘high-position’ competitions that offer the most reward and prestige).9
6 See Barreira and Da Silva (2016), Gásquez and Royuela (2016), Peeters et al. (2019), and Rintaugu et al. (2012). 7 From the online Cambridge English dictionary (https://dictionary.cambridge.org/us/dictionary/english/compete). 8 See Torres (2006, 2011) and Reid (2015). 9 The idea of high-position competitors and competitions comes from the work of Hirsch (1976) on ‘positional goods’. These are scarce goods that confer prestige on those who access and retain them. As defined by Schneider (2007, p.62), “part or all of the satisfaction derived from possessing them is the enhancement of social status due to the fact that such satisfaction is possible only for a minority.” In respect of competition, in the spirit of Marginson (2006) on inter-university competition, I hold that some competitors and competitions are scarcer than others, and thus more prestigious. In world soccer, ‘high-position’ competitors are elite countries with the biggest audiences. ‘High-position’ competitions are Continental and World Cup Tournaments accessed every few years by only the best competitors.

5
Definitions of the word ‘compete’ go beyond ‘taking part’ in a contest or competition, however,
and refer more aggressively, to “striving consciously or unconsciously for an objective” or “being
in a state of rivalry.”10 This approach resonates with the Olympic Motto’s emphasis on being
“faster, higher, [and] stronger” –or simply better—than others11 and relates to the challenge of
winning relatively more than other competitors—or ‘competing as a rival’. Many might view this
as the more conventional approach to evaluating how effectively countries compete. It is possible
to assess such by looking at a country’s winning rate, especially against high-position competitors
and in high-position competitions, and at the reputation or positional prestige the country has
earned by ‘competing as rival’ (which generates respect and even fear in opponents).
Indexes to assess how a country competes
Acting on these ideas, Table 1 outlines a simple method to assess a country’s performance in
competing as both a ‘participant’ and a ‘rival’ in world soccer. It lists key characteristics I associate
with competing as ‘participant’ and ‘rival’ and questions to probe how well a country competes
on both aspects: In reflecting on a country’s ability to ‘compete as participant’, I suggest asking
how regularly it participates in competitive matches, what quality its opponents are, and how
often it competes against high-position competitors and in high-position competitions (like the
World Cup but also continental events like the European Championships and Africa Cup of Nations
Tournaments (AfCoNs)); To capture how a country ‘competes as rival’, I ask how often it wins (as
successful rivals do) overall, and how often it wins against high-position competitors and in high-
position competitions; and how other countries rate it as a rival (what I call its positional prestige).
The table also suggests variables to use in answering these questions (which I discuss in more
detail later). The method I propose involves identifying data to score each variable and aggregating
these scores into two indexes: one for how well a country competes as a ‘participant’ and one for
how well it competes as a ‘rival’
10 From the online Merriam Webster dictionary (https://www.merriam-webster.com/dictionary/compete). 11 See Torres (2006, 2011) and Reid (2015).

6
Table 1. A method to assess how a country competes as ‘participant’ and ‘rival’ in world soccer
The focus of an index of how well a country competes as a ‘participant’ in world soccer
‘Competing as participant’ characteristics
Question to probe how well a country competes ‘as participant’ Key variables to reference
Regularity of participation: How many international matches does the country play? Matches per year Competitor quality: What is the quality of the country’s average competitor? Average competitor rating (percentile) High-position competitors: How many high-position competitors does the country play in? % Elite competitors High-position competition: How many high-position contests does the country play in? % Possible Continental Finals Tournament matches
% Possible World Cup Finals Tournament matches The focus of an index of how well a country competes as a ‘rival’ in world soccer
‘Competing as rival’ characteristics
Question to probe how well a country competes ‘as rival’ Key variables to reference
Winning rate: How often does the country win? % Points per match Winning rate vs high position competitors:
How often does the country win vs high-position competitors? % Points per match vs. high-position competitors
Winning rate in high position competitions:
How often does the country win in high-position competitions? % Points in Continental Finals Tournament matches % Points in World Cup Finals Tournament matches
Positional prestige: How do other countries rate the country as a competitor? Average percentile rating (based on Elo scores)
Source: Author’s original work.
How well do African countries compete in world soccer?
I used the method alluded to in Table 1 to analyze records of Africa’s most prominent soccer
playing nations and a selection of the world’s leading soccer-playing countries, in each of the past
five decades, based on data from historical repositories of international soccer matches—
including the Elo ratings database used to develop national rankings.12
I identified Africa’s top soccer playing nations based on average FIFA rankings in the past 5 years,
including countries competing in the World Cup Tournaments in the 2010s. The sample is Algeria,
Cameroon, Egypt, Ghana, Ivory Coast, Morocco, Nigeria, Senegal, South Africa, and Tunisia. The
smaller sample of the world’s top countries was identified by selecting all the World Cup Winners
since 2000 and European countries who have reached recent World Cup semi-finals. The sample
is Brazil, Croatia, England, France, Germany, and Spain. I looked at data per decade to get a sense
of average competitive performance over a period of time—where countries can compete in
multiple tournaments and contests and build a pattern of ‘competing’—rather than at one
12 I drew on the Elo ratings database (https://www.eloratings.net/England) (See Gásquez and Royuela (2016)) as checked against Mart Jürisoo’s database (https://www.kaggle.com/martj42/international-football-results-from-1872-to-2017/activity). Afew differences existed between the two, with Jürisoo’s sometimes including fewer matches (particularly in earlier periods). I included these few contested data points (opting for the potential bias of having a few incorrect matches included instead of excluding matches that did exist but were hard to verify).

7
moment in time (which does not capture the sustained capabilities of a country). I started with
the 1970s because a number of African countries only obtained sovereignty in the 1960s and world
soccer saw major modifications in the 1970s (including expansion of continental and World Cup
tournaments and greater formal inclusion of Africa into the latter, through dedicated slots).
Calculating ‘competing’ index scores
I first calculated an index score to capture how well each country ‘competes as participant’. The
index is straightforward, calculated as the equally weighted sum of scores on five variables. The
first variable, ‘matches per year’, shows—as a percentage—how close a country came, on average,
to playing a full calendar of internationals per year, over the decade.13 The second variable,
‘average competitor rating’, is the percentile rating of the average competitor a country faced in
any period, based on Elo scores (which reflect a country’s record, as provided in the Elo
database).14 The third variable, ‘% elite competitors’, captures the share of top 10 percentile, high-
position competitors a country faced in all the matches it played in a period.15 Variables four and
five show (as percentages) the share of possible Continental and World Cup Finals Tournaments
matches a country played in, per period, to capture how effectively a country gained and retained
access to high-position competitions.16
Table 2 summarizes the ‘compete as participant’ analysis for England and Nigeria between 2010
and 2019. Both countries played a full calendar of matches in the period (averaging 12 or more
per year), but England had more high quality and high position participation. England played
against better competitors (with the average opponent ranked at the 86th percentile, 16 points
13 Based on my analysis of international playing patterns, I define a full international calendar as twelve matches (one a month). As such, I use 12 as a reference point for a 100 score. I calculate the ratio of games played to this reference point and multiple by 100. For example, a country with 6 matches a year scores 50 (6/12*100). I cap the score at 100, so countries with more than 12 matches a year do not get credit for the additional contests. 14 The Elo rates countries based on wins, losses, or draws, given quality of opposition, if fixtures are at home or away, competition quality, goals scored and goal difference (See Gásquez and Royuela (2016) for a full description). 15 I use Elo scores to identify these elite countries. The top ten percent of countries at any time tend to be countries scoring 1800 and above on the Elo scores, so I used 1800 as the floor score of an elite country. 16 If five matches were played in a World Cup Finals Tournament where seven matches were possible, for instance, the score would be 71. If zero matches were played in that tournament, the score would be zero—indicating a failure to even gain access to the tournament (whatever the reason).

8
above Nigeria’s average competitor). England also played against a greater share of elite countries
(with 49 of 119 matches involving countries in the world’s top decile, compared with 20 of
Nigeria’s 127 matches). England also gained and retained access to more Continental and World
Cup Finals Tournament matches (playing in 8 of 14 possible European Championship matches and
14 of 21 possible World Cup matches, compared with Nigeria’s 19 of 37 possible Africa Cup of
Nations (AfCoN) matches and 10 of 21 possible World Cup matches). In sum, England achieved a
‘compete as participant’ index score of 71 compared with Nigeria’s score of 57.
Table 2. How did England and Nigeria ‘compete as participant’ in world soccer, 2010 and 2019
Characteristic Variable England score Nigeria score
Regularity of participation: Matches per year 99 100 Competitor quality: Average competitor rating (percentile) 86 72 High-position competitors: % Elite competitors 41 16 High-position competition: % Possible Continental Finals Tournament matches
% Possible World Cup Finals Tournament matches 62 67
51 48
Overall Overall ‘compete as participant’ index score: 71 57
Source and notes: Author’s original work. All scores out of 100. Index is the summed average (with equal weightings).
I also calculated an index score to show how well each country competes as ‘rival’. Again, the index
is simple, calculated as the weighted sum of scores on five variables. The first variable, ‘points per
match’, shows how many points a country ‘won’ per match (where 0 points are given for a loss, 1
for a draw, and 3 for a win, as per soccer norms). The next three variables also capture how many
points were won in matches against elite competitors (as defined earlier) and in matches in high-
position tournaments (continental and World Cup Finals). I weighted these scores when
calculating the index to indicate their prestige and scarcity (with elite and Continental winning
rates weighted at 1.25 their value and World Cup winning rates weighted at 1.5 their value).17 The
final variable shows a country’s percentile position in world rankings, given its average Elo score,
which I take as a measure of its reputation—or positional prestige—given past performances.
Table 3 summarizes the ‘compete as rival’ analysis for England and Nigeria between 2010 and
2019. England has a higher % points per match (in general) and a much higher % of points per
match against elite competitors (where Nigeria only scores 30 percent of its possible points as
17 These matches are more valued with World Cup Finals Matches are watched by about 2.5 times more viewers than European Championships and nearly ten times more than AfCoN matches. These matches all gain more viewers than ordinary matches, apart from matches between or against elite opponents.

9
compared with England’s 68 percent). Interestingly, Nigeria scores more points in its continental
tournament matches (‘winning’ 68 percent of the points on offer in its AfCoN matches compared
with England’s 54 percent in European Championships), but England scored more of its possible
points in World Cup Finals Tournaments (43 percent as against 27 percent). Finally, England has a
higher positional prestige than Nigeria, given its record. Rated at the 97th percentile, England is a
rival feared by all, whereas Nigeria, at the 82nd percentile, is a rival that is probably not feared by
about 20 percent of potential global competitors. This difference in how the countries ‘compete
as rival’ shows in the overall index score as well, where England registers 76 and Nigeria 60.
Table 3. How did England and Nigeria ‘compete as rival’ in world soccer, 2010 and 2019
Characteristic Variable England score Nigeria score
Winning rate: % Points per match 68 57 Winning rate vs. high position competitors: % Points per match vs. high-position competitors* 68 30
Winning rate in high position competitions: % Points in Continental Finals Tournament matches* % Points in World Cup Finals Tournament matches**
54 43
68 27
Positional prestige: Average percentile rating (based on Elo scores) 96 82
Overall Overall ‘compete as rival’ index score: 76 60
Source and notes: Author’s original work. All scores out of 100. Index is the summed average of the scores (with various weightings). I use a *1.25 times rating and a **1.5 times rating to give more value to these win rates.
These index scores suggest that Nigeria is lagging England in its record of competing in world
soccer. One could simplify the message of how far behind this is by summing the difference in
indexes into one cumulative ‘gap’. In the case of these two countries, this would be 30 (14 +16).
This is a large gap, considering Nigeria’s scores are only 57 and 60 (or a combined 127). Nigeria
would need to increase its score to 157 to close this gap, which is the same as saying it needs a 23
percent improvement on its current situation. England only reached a recent World Cup semi-
final, however, so getting to the final—and winning the final—probably demands even more.
Such analysis is illuminating, as it offers a sense of how realistic it is to think about whether a team
like Nigeria can realize Africa’s hopes of competing with the world. One should remember,
however, that the two index scores need to be seen as more interactive than a single index score
allows, given that ‘rival’ scores are contextualized by the ‘participant’ scores. What I mean is that
England’s superior rival score was achieved at a higher level of competitive participation than
Nigeria’s, given stronger competitors and a larger share of matches against elite opposition and in

10
high position tournaments. As such England’s better rival score should be weighted more than
Nigeria’s—or at least we need to find a way of showing that it is different.
Charting country performances shows Africa’s lagging standing
Source: Author’s original work.
Visuals are an effective way of showing the interactive nature of the two indexes. As a result, I use
a charting approach to illustrate how countries performed in the two samples (of African and elite
teams). The chart is show in Figure 1, which plots 2010 to 2019 participant-rivalry positions of all
the countries in my two samples (African and world elite). This approach reveals the two-
dimensional difference between countries, with the chart showing England (71, 76) up and to the
right of Nigeria (57, 60). Such a two-dimensional difference equates with a two-dimensional
challenge for Nigeria; if it wants to catch up to England (a recent World Cup semi-finalist), it needs
to improve its performance as participant and as rival (not one or the other). Nigeria will not close
the ‘competing gap’ with England by just playing better at its current level of participation or
improving the quality of its opponents and continuing to lose in 70 percent of its encounters with
these high-position competitors. It needs to both compete with high-quality opponents more
regularly and learn to beat those opponents more regularly.

11
Interestingly, the top African countries bunch together with Nigeria in the center of Figure 1’s
chart—where ‘compete as participant’ scores and ‘compete as rivals’ scores ranged between 43
and 58 and 38 and 63, respectively. This block is separated from the set of elite countries, who
recorded participant and rival scores in higher ranges (between 62 and 79 and 76 to 90,
respectively). This infers that elite African soccer playing countries compete ‘in the middle’ of the
world soccer-playing community, at about the level of Greece (which is added for reference) and
well below the levels of Brazil and Germany, France, Spain, Belgium, Croatia, or England.
Unfortunately, countries in this global ‘middle’ are unlikely to win the World Cup, which means
that Africa’s top competitors do not yet compete well enough to realize their continent’s hopes of
winning the world title. This is not to say that an African country will not beat a global competitor
now and again—Ghana beat competitive Czech Republic and United States teams in the 2006
World Cup tournament and won against Serbia and the United States at the 2010 World Cup
event. The evidence does, however, infer that African teams are highly unlikely to beat top teams
repeatedly, which is what a country requires to contend with the world’s best—Ghana lost to Italy
and Brazil in 2006, for instance, and to Germany and Uruguay in 2010, which limited its progress
in both tournaments to the second round and quarterfinals. The reality of Figure 1 is that a country
like Ghana, competing as a 60 rival at a 57 participant level, cannot expect to regularly carry the
day against countries competing as 87 or 89 rivals at participant levels of 79 (like Germany and
Brazil). Countries like Ghana may have lucky days and win occasionally, but nothing more.
A deeper analysis of the scores helps explain this situation a little better, showing that all of Africa’s
top soccer playing countries lag the global elites in much the same way as Nigeria differs from
England: The African nations play lower quality opponents than the world’s top soccer playing
nations (performing worse as participants) and have worse winning records (as rivals) whenever
they play high-quality competitors. We see the lower quality opponent issue in the difference in
average opponent ratings from Ghana and Senegal (whose average competitors score at the 70th
and 62nd percentile of global ratings) and Germany and Brazil (whose average competitors are at
the 86th and 89th percentile). This difference in participation quality manifests further in the fact
that only 12 and 8 percent of Ghana and Senegal’s matches are against elite countries, compared

12
with 45 and 53 percent for Germany and Brazil. The lag in ‘rival’ capabilities at the highest-level is
demonstrated in the different win rates against elites (the kinds of countries one must beat to win
world titles): Ghana and Senegal have much lower win rates against these elite opponents (22
and 8 percent) than Germany and Brazil (at 56 and 75 percent).
Has Africa gone backwards?
Whereas Figure 1 shows that African countries lag world elites today (given 2010-2019 data),
pessimists might argue that Africa’s competitors have fallen further behind global elites in
pursuing the hope of winning over the past generation (since Pelé predicted an African win by
2000). This argument could draw on the differences in African country positions in the
international field now (illustrated in Figure 1) as compared with the 1970s (shown in Figure 2).
In comparing Figures 1 and 2, it should be apparent that most countries improved their scores
since the 1970s—generally moving to the right and up in the charts. This was largely because of a
global expansion in international competition that allowed more participation in more high-quality

13
encounters (which was like a rising tide that lifted all boats) and because of improvements in the
general quality of play (and number of high or at least higher quality countries), which some see
as a result of the growth and dissemination of soccer know-how across the globe.18
The European elites shown in the chart have improved their positions more than the countries
from Africa, however, widening the gap between the two sets of countries. The 1970s gap was
narrowest between France and Tunisia, who had almost the same participant scores (43 and 40)
and rival scores (54 and 53), indicating similar competing records and capabilities.19 Morocco and
Egypt had comparable scores to Tunisia at the time, suggesting at least three African nations were
‘close’ to European contenders. The narrowest gap in the 2010s was three times the size, between
Croatia (with scores of 62 and 70) and the Ivory Coast (at 56 and 63). Ghana and Nigeria were
similarly close (but still relatively far) from Croatia. Tunisia, Morocco, and Egypt—the closest
African contenders in the 1970s—lagged Croatia by much more at this time, having fallen
backwards in the pack of African chasers (with Tunisia, Morocco, and Egypt scoring ‘compete as
participant’ scores of 52, 43, and 47 and ‘compete as rival’ scores of 51, 50, and 44 in the 2010s).
In trying to explain why the 1970s contenders have fallen behind, I began looking at Tunisia’s
experience in relation to that of France (the country it was closest to in the 1970s). I started by
noticing that Tunisia was poised to challenge world soccer’s elite in the late 1970s. It had won 50
percent of its matches in the decade, including one 1978 World Cup Finals Tournament game
(where it was the first African team to win a World Cup match, three goals to one, against a highly
rated Mexican team, and where it also tied the global powerhouse German team) and came fourth
in the 1978 AfCoN Finals Tournament (beating Uganda, drawing to Morocco and Congo, and losing
in the play-offs to eventual champions Ghana). Unfortunately, it faltered thereafter, experiencing
a 1980s drop in both its competitive participation and winning record (playing in only one AfCoN
tournament in the 1980s, and failing to qualify for World Cup Tournaments until the late 1990s).
As Figure 3 shows, it has recovered incrementally since the 1980s, gradually growing its participant
18 See Krause and Szymanski (2019) for a discussion of ‘convergence’ in global soccer. 19 Tunisia had a better record competing in high-position tournaments, playing in one AfCoN and one World Cup Tournament, compared with France who qualified for only one World Cup in the period. Tunisia also fared better than France in their 1978 World Cup efforts, although both failed to advance from the group stages.

14
and rival capabilities to become a perennial threat in African competition (competing in over 70
percent of potential AfCoN Finals Tournament matches since 2000, winning one of these
competitions and finishing fourth in two).
Figure 3. Tunisia’s progress since the 1970s Figure 4. France’s progress since the 1970s
Source: Author’s original work.
Tunisia’s current participant and rival scores (52 and 51) reflect its standing as one of Africa’s elite
competitors. Given such standing, it has represented Africa in four of the last six World Cup Finals
tournaments. It won only one match in these events, however, against Panama in 2018, and has
proved to be a weak global competitor (playing only 8 percent of its matches in the 2010s against
elite nations and winning only 18 percent of the points in these contests). In contrast (as shown in
Figure 4), France started with similar promise in the 1970s and saw steady improvement
thereafter, with growing participant and rival scores in most decades. It now competes as a 77
participant, 25 points higher than Tunisia, where it records an 85 rival score (compared with
Tunisia’s 51 at the lower participant level). In short, France has become a world power, recording
strong results against high quality competitors (competing at all the last seven World Cup Finals
Tournaments, winning twice, and coming second once, with 43 percent of its matches in the 2010s
played against elite teams, where it won 67 percent of possible points).
Observers of Tunisia’s up and down journey over the last few decades credit its 1970s
performance to a ‘golden generation’ of players the country enjoyed at the time (including
Mokhtar Dhouib, Néjib Ghommidh, Raouf Ben Aziza, and Tarak Dhiab), who they say gave it some
4037
46
61
5253
32
46 4851
30
40
50
60
70
80
90
100
70 to 79 80 to 89 90 to 99 00 to 09 10 to 19
Tunisia Participant Tunisia Rival
43
73
65
75 77
54
8891
82 85
30
40
50
60
70
80
90
100
70 to 79 80 to 89 90 to 99 00 to 09 10 to 19
France Participant France Rival

15
World Cup winning potential. Without them, it might be argued, the country should now be
satisfied to be a regional power instead of a genuine global contender (competing at a level below
elite nations and happy to just qualify for World Cup Tournaments). Interestingly, France’s rise in
the early-to-mid 1980s was also credited to a golden generation (including a group of players—
Tigana, Platini, Giresse, and Genghini—who made up what some called the ‘magic square’), but
when this ended a new golden generation emerged20 (to win the 1998 World Cup) and when they
moved on another emerged21 (to win the 2018 World Cup).
This contrasting experience suggests that countries do not get to compete successfully at the
highest levels by depending just on ‘time’ and ‘talent’ (saying, “maybe someday we will be lucky
enough to have another golden generation”). It seems to take more active attention, and a
strategy to build the capabilities to compete over time (akin to what some call ‘making your own
luck’). Hints of such a ‘make your own luck’ strategy emerge from the experience of France, which
exited the underwhelming early-to-mid-1970s focused on ‘playing up’ against high caliber
opposition (to build its ability to compete at such level). The national team endured forty matches
against countries in the top decile of world competitors (what I have called ‘high-position
competitors’) in the six years between 1976 and 1983, with more than half of these being non-
mandated friendlies. It engaged in another 34 of these contests between 1984 and 1989. This
focus on quality competition helped increase the French ‘compete as participant’ score from 43
to 73 in one decade and was a key reason the country also became a formidable rival at the new
high-level of competition (with studies showing that soccer teams get better by playing ‘up’ against
strong opposition, and regress when playing ‘down’).22 Most importantly, France seems to have
developed a culture of playing quality competition and has retained its high participation and
performance levels over time, relying less on one generation of players and instead building
capabilities to compete consistently (and develop and attract new sets of golden generations, from
wider pools of players—often with dual nationalities, especially hailing from Africa).
20 Including players like Zidane, Henry, Trezeguet, Thuram, Blanc, Pires, Vieira, Deschamps, Petit, Desailly, and Lizarazu. 21 Including players like Lloris, Hernandez, Umtiti, Varane, Pavard, Pogba, Kante, Matuidi, Griezmann, Mbappe, and Giroud (the eleven who started in the final match of the 2018 World Cup Finals Tournament). 22 Folgado et al. (2014)

16
In contrast to France, Tunisia played only 13 matches against high-position countries in the 1970s
and 1980s and has not increased its exposure to such opposition in ensuing decades.23 Adding to
this, Tunisia’s ‘average competitor rating’ has declined through time—with this average rating
dropping from the 73rd percentile in the 1970s to the 68th percentile in the 2010s—compared with
the French score which has held constant at high levels (the 87th percentile). This weaker
competition appears to be a fundamental reason why Tunisia has not grown its ‘compete as
participant’ scores and why it struggles to ‘compete as rival’ with elites (with its elite win rate
declining from 25 percent during the golden generation to 18 percent in recent decades, well
below the French rate of 67 percent, which rose from 57 percent in the 1970s).
‘Lower quality competition’ is also the most apparent explanation for the disappointing records of
Egypt and Morocco (illustrated in Figures 5 and 6). As with Tunisia, they were poised to become
world contenders in the 1970s but failed to capitalize on this potential. Instead, they both settled
for a schedule of lower quality opposition (like Tunisia) that they regularly beat (with overall win
rates of 64 percent for Egypt and 58 percent for Morocco). Such a strategy has kept both countries
among Africa’s elite but also ensured they are a good distance away from the world elite.24
To demonstrate the gap with world elites, one should consider that Egypt participated in nine of
the last twelve AfCoN Finals Tournaments, winning four and coming second once, but lost all three
of the matches it played at the World Cup Finals Tournament in the last thirty years (when it played
in 2018). Morocco, similarly, took part in ten out of the last twelve AfCoN Finals Tournaments,
coming second once, but won only one point from its three World Cup matches as an African
representative in 2018 (where it lost to Iran and Portugal but drew with Spain). It is another
country to boast a ‘golden generation’ as the reason for success in the late 1980s and into the
1990s but has been in steady decline since (as evidenced by its failure to qualify for four of the five
World Cup tournaments in the 2000s and 2010s). Drops in Morocco’s ‘compete as participant’ and
‘compete as rival’ scores shown in Figure six illustrate the country’s decline.
23 Tunisia’s ‘% Elite competitor’ scores for the 1990s, 2000s and 2010s are 10, 13, and 8 percent. 24 Egypt and Morocco both have ‘% elite competitor’ scores of below 10 percent (compared with 30% and above for elite European countries) and ‘average competitor ratings’ of 67 percent and 66 percent respectively (both lower than that of Tunisia and twenty points below that of France).

17
Figure 5. Egypt’s progress since the 1970s Figure 6. Morocco’s progress since the 1970s
Source: Author’s original work.
Some African teams have advanced, but face limits
Other top African countries have seen more positive progress in their ‘competing’ records since
the 1970s. Figures 7, 8 and 9 show the examples of Ivory Coast, Ghana, and Nigeria, for instance
(and Appendix A briefly describes other important cases—of Algeria, Cameroon, Senegal, and
South Africa). The three countries shown here are now the ‘closest’ African competitors to
Europe’s leading nations, with Croatia and Belgium being most proximate to them (though further
than France was to Tunisia in the 1970s).
Figure 7. Ivory Coast’s progress since the 1970s
Figure 8. Ghana’s progress since the 1970s
Figure 9. Nigeria’s progress since the 1970s
Source: Author’s original work.
40
49 50 4743
53 52 5350
30
40
50
60
70
80
90
100
70 to 79 80 to 89 90 to 99 00 to 09 10 to 19
Egypt Participant Egypt Rival
4453
4447
4346
5751
44
30
40
50
60
70
80
90
100
70 to 79 80 to 89 90 to 99 00 to 09 10 to 19
Morocco Participant Morocco Rival
45 45 5156
32 36 41
59 63
0102030405060708090
100
70 to 79 80 to 89 90 to 99 00 to 09 10 to 19
Ivory Coast Participant
Ivory Coast Rival
3841
47 50
5746
39 43
58 60
0
10
20
30
40
50
60
70
80
90
100
70 to 79 80 to 89 90 to 99 00 to 09 10 to 19
Ghana Participant Ghana Rival
38
4652
59 5740
38
62 6060
0102030405060708090
100
70 to 79 80 to 89 90 to 99 00 to 09 10 to 19
Nigeria Participant Nigeria Rival

18
All three of the African countries saw gradual but consistent improvements in both ‘compete as
participant’ and ‘compete as rival’ index scores over the last fifty years, lifting these scores into
the high 50s and lower 60s in the 2010s. These gains were largely achieved by improving intra-
continental results. All three countries ramped up their ‘% Possible Continental Finals Tournament
matches’ scores in recent decades, for instance, as reliable qualifiers for AfCoN Tournaments (with
the Ivory Coast, Ghana and Nigeria playing in 15, 14 and 11 of the last 16 events, and in 75, 64 and
51 percent of possible AfCoN matches in the 2010s—up from 31, 38 and 42 percent in the 1970s).
The countries play in more AfCoN matches because they qualify for most tournaments and have
a high winning rate in these events (scoring 63, 62, and 68 on ‘% Points in Continental Finals
Tournament matches’ in the 2010s). These records translate into winning moments as well, with
the three countries sharing four AfCoN championships, seven runner-up places and 12 other semi-
final slots in the last 16 events. Such success also plays out in strong records representing Africa
at the World Cup Finals Tournaments, where the countries have held 7 of the last 16 African World
Cup slots, with high scores on ‘% Possible World Cup Finals Tournament matches’ since the 1990s
(for Nigeria) and the 2000s (for Ivory Coast and Ghana).25
All three countries had a ‘golden generation’ at some time in this period, whose impacts peaked
for Nigeria in the late 1990s and between about 2006 and 2012 for Ghana and the Ivory Coast.26
One can see the effects of these generations on the ‘compete as rival’ scores in all cases; these
rose from 38 to 62 between the 1980s and 1990s in Nigeria, and from 43 to 58 and 41 to 59 in
Ghana and the Ivory Coast between the 1990s and 2000s. These ‘rival’ gains were greater than
the ones evidenced in examples of other golden generations; like Tunisia (in the 1970s) and
Morocco (in the 1980s), shown in Figures 3 and 6. More impressive, perhaps, is that the ‘compete
as rival’ scores do not seem to be declining in the wake of these golden generations in the same
way as they did in Tunisia and Morocco. Nigeria’s ‘rival’ performance dropped slightly in the 2000s
(from 62 to 60) but has held at about the same level for two decades after the golden generation
25 Nigeria played in 38, 21, and 47 percent of possible World Cup matches in the 1990s, 2000s and 2010s. Ghana and the Ivory Coast did not qualify for these contests in the 1990s but played in 28 and 21 percent of the matches in the 2000s and 38 and 29 percent of the matches in the 2010s. 26 These included (for Nigeria) Rufai, Keshi, Okafor, Okechukwu, Oliseh, Ekoku, Yekini, Amokachi, Amuneke, Ikpeba, and Finidi George, and (for Ghana) Essien, Mensah, Muntari, Emmanuel Addoquaye Pappoe, Pimpong, Paintsil, Gyan, and Boateng, and (for Ivory Coast) Drogba, Yaya and Kolo Touré, Zokora, Eboué, Gervinho and Kalou.

19
(in which the country’s teams have proved a dominant force in AfCoN tournaments and
represented Africa in 4 out of 5 World Cup events). ‘Rival’ scores continued improving into the
2010s for Ghana and the Ivory Coast partly because the golden generations were still playing (with
one group taking Ghana to the 2010 World Cup Tournament Quarter Finals). Teams from both
countries have continued where these generations left off, however, competing in all three
AfCoNs since 2014 and achieving strong results (with the Ivory Coast winning in one of their
appearances and Ghana coming second and 4th in two of their efforts).
Such observations promote confidence in these countries’ continued improvement and suggest
they may be the ones to carry Africa’s hopes of winning the World Cup forward. One caveat,
however, is how long it will take for them to achieve this goal. The three countries have gained
about 20 points on the two index scores over thirty to forty years, achieving levels of about 60 in
both cases. Their target, given my work, is a score of at least 70 on either or both indexes (with
World Cup semi-finalists and finalists exceeding 70 points on at least one index).27 Assuming past
trajectories, the three African contenders will reach such scores in the 2030s or 2040s (unless they
have another golden generation that facilitates a bigger jump in a shorter time). Such patient
progress over long periods is difficult and requires a lot of consistent improvement.
A second caveat relates to whether the three countries in question (or others) can reach the level
of global elites using their current improvement strategy. As discussed, this strategy seems
centered on becoming intra-continental powerhouses (by dominating African competition,
especially in AfCoNs). There are limits to how much more the countries can improve their AfCoN
appearance and win rates, however, which are likely to manifest in a ‘competing improvement
ceiling’ (or may already be doing so). Such ceiling is easy to convey mathematically, given that the
countries cannot increase their ‘competing as participant’ index scores much beyond the current
rates (around 60) by just continuing to do better in intra-continental tourneys. If Nigeria played in
and won every AfCoN game possible in a ten-year period, for instance, but kept its performance
27 The only exception to this rule, given my calculations, is South Korea in 2002. The country made a World Cup Semi-Final with index scores in the 60s.

20
on other variables (like ‘Average competitor quality’ and the ‘% Elite competitors’) the same, its
‘compete as participant’ index score would only increase to about 64 (not the magic 70).
It is impossible to increase this participation score without ramping up the quality of competitors,
playing more elites, and playing in a higher % of possible World Cup matches (which requires more
than qualifying, which Nigeria does consistently, but winning matches to progress beyond the
group stage and into play-off rounds like the quarter and semi-finals). These variables can only be
improved if the countries engage more intercontinental competition, and especially high-position
international competition. This strategy is obviously associated with a risk of scoring lower
‘competing as rival’ scores, as more matches against tougher competitors could yield lower win
rates (especially when win rates against elite countries are as low as they are in the three African
countries—currently at 23, 21 and 30 percent for the Ivory Coast, Ghana, and Nigeria).
The countries will have to learn to win more high-quality match ups to improve their rival scores
beyond mathematical ceilings as well. If Nigeria does not do so, and continues focusing mostly on
its African performances, it will hit a ‘compete as rival’ ceiling of about 66 (with 100% of its AfCoN
points). A country like Nigeria needs to build winning capabilities outside of Africa to break
through this ceiling and reach the levels common to World Cup winning countries (especially given
that two out of the five variables in the ‘compete as rivals’ index are sensitive to win rates against
elite competitors or intercontinental opposition played in World Cup Finals Tournaments, and one
captures a country’s global—not African—reputation, which depends on such results).28
This new strategy—playing better quality countries more often—is demonstrated in Table 4’s
contrast between 2010s index scores of the three African countries and recent World Cup semi-
finalists, Belgium and Croatia. Both European countries scored relatively lower than their African
counterparts on the ‘% Possible Continental Finals Tournament matches’ and ‘% Points in
Continental Finals Tournament matches’, but they registered much better performances on the
variables associated with playing better quality opposition—including intercontinental countries
like Brazil, Argentina, Chile, Mexico, Uruguay, and the United States (which helps scoring on
28 The relevant variables are ‘% Points per match vs. high-position competitors’ and ‘% Points in World Cup Finals Tournament matches’ and ‘Average percentile rating (based on Elo scores)’.

21
‘Average competitor rating’, ‘% Elite competitors’, and ‘% Points per match vs. high-position
competitors’). These superior results are why the two European countries achieve marginally
better ‘compete as participant’ index scores and significantly better ‘compete as rival’ scores (of
70 or above, in the territory needed to compete for a world cup and be a perennial member of
the global elite) than the African contenders. The European competitors also have much more
opportunity to keep improving their competing index scores, given that they are working with all
the variables in the table (not just the intra-continental performance variables apparently
emphasized, implicitly perhaps, by African countries).
Table 4. Comparing Africa’s top scoring countries with the closest elite countries, 2010 and 2019
Africa’s top located countries The ‘closest’ European elite countries Variable Ivory Coast Ghana Nigeria Belgium Croatia Matches per year 100 100 100 100 100 Average competitor rating (percentile) 69 70 72
80 82
% Elite competitors 8 12 16 27 28 % Possible Continental Finals Tournament matches 75 64 51
38 54
% Possible World Cup Finals Tournament matches 29 38 47 57 48 ‘Competing as Participant’ Index Score 56 57 57 61 62 % Points per match 64 52 57 73 68 % Points per match vs. high-position competitors* 23 21 30 43 33 % Points in Continental Finals Tournament matches* 63 62 68
60 52
% Points in World Cup Finals Tournament matches** 39 38 27 83 57 Average percentile rating (based on Elo scores) 85 82 82
94 94
‘Competing as Rival’ Index Score 63 60 60 84 70
Source: Author’s original work.
Beyond the mathematics of index construction, further statistical evidence suggests (but does not
necessarily prove29) that countries who dominate their regional competitors are less likely to
prevail in World Cup competition than countries that regularly face high-quality opponents (and
work out how to consistently win points in such contests). This evidence involves simple
correlations30 that show variables associated with intra-continental performance have a positive
29 Any statistical analysis is likely to be sensitive to sample selection, for instance, and my sample here is limited (especially in size but also variation). The interaction of variables is also something that would need better treatment (either in designing the statistical work or interpretation). At time of writing, my data set is not developed enough for this kind of analysis, but that is where the work will progress. 30 I calculated correlations between various variables and the ‘% Possible World Cup Finals Tournament matches’ played and ‘% Points in World Cup Finals Tournament matches’ for a sample of twenty countries over five decades. The sample covered the ten African countries and seven elite countries, plus Greece, South Korea, and the USA.

22
but small relationship with current or future World Cup success,31 whereas variables associated
with high-quality competition have positive, large relationships with World Cup success.32 My
interpretation of such statistics is that the relatively better continental successes of Table 4’s
African countries in the 2000s and 2010s33 gave them less competitive preparation for their 2010s
World Cup performances than the higher share of games Croatia and Belgium played against high-
quality opposition in the 2000s and 2010s (which helped both countries build the capabilities to
progress further in the 2010s world tournaments, to semi-final and final matches, than their
African counterparts).34
The message arising from such comparisons is (once again) that African countries hoping to win
the World Cup—and become global soccer elites—should focus more on ensuring they are playing
higher-quality, high-position, inter-continental competition than just dominating intra-continental
competitors. As in the case of France (already discussed) this was a direct focus of Belgium’s
strategy in the 1960s, 1970s, and 1980s, when it emerged from European minnow to global
competitor. The country failed to qualify for any World Cup or European Championship matches
in the 1960s but developed a reputation at the time as the ‘world champion of friendlies’—
because of a rigorous schedule against better teams, many of whom were among the world’s best
(with 57 percent of their opponents enjoying better Elo scores than they did, and 34 percent
classified as ‘elite’ opponents). The Belgians lost 60 percent of these matches, but learned from
the experiences, continuing to play ‘up’ against a high percentage (53) of elite teams in the 1970s
31 The correlations were low for variables capturing intra-continental participation and performance: ‘% Possible Continental Finals Tournament matches’ and ‘% Points in Continental Finals Tournament matches’ enjoyed a 0.39 and 0.29 correlation with ‘% Possible World Cup Finals Tournament matches’ and a 0.36 and 0.27 correlation with ‘% Points in World Cup Finals Tournament matches’. 32 The correlations were high for variables capturing the quality of competitors: ‘Average competitor rating’, ‘% Elite competitors’, and ‘% Points per match vs. high-position competitors’ were highly correlated with ‘% Possible World Cup Finals Tournament matches’—at 0.63, 0.65, and 0.68—and with ‘% Points in World Cup Finals Tournament matches’—at 0.62, 0.61 and 0.82. Similar correlations were evident when I lagged the variables, asking for instance if a country’s ‘% Elite competitors’ in one decade was related to its ‘% Points in World Cup Finals Tournament matches’. 33 In comparing the two groups, it is clear the African countries had better intra-continental performance. The three African nations played in 10 (Ivory Coast), 10 (Ghana), and 8 (Nigeria) of the 11 AfCoN Finals Tournaments since 2000, achieving (cumulatively) 2 first, 5 second, 5 third, and 4 fourth place finishes, winning a combined 60 percent of all possible points. Croatia and Belgium participated in 5 and 3 of the 6 European Championships played between 2000 and 2019, reaching three quarterfinals (but nothing more) and scoring less than 50 percent of the possible points. 34 The African nations played in a combined 24 World Cup matches in the 2010s, winning 6, drawing 6, and losing 12. Ghana reached the 2010 Quarter-Final. Croatia and Belgium played in 22 matches, winning 15, drawing 2, and losing 5. Croatia came second in the 2018 World Cup Finals Tournament, when Belgium finished third.
23
(some in European and World Cup tournaments, where they were starting to qualify and perform
relatively well) and into the 1980s (when 57 percent of contests were against elite countries).
Belgium’s teams improved their winning record against these elite countries in this period, from
40 percent in the 1960s to 67 percent in the 1970s and 75 percent in the 1980s, and saw this new-
found winning capability translate into greater ‘compete as participant’ and ‘compete as rival’
scores and performances. Its ‘compete as participant’ scores increased from 35 to 71 and its
‘compete as rival’ scores rose from 41 to 66 in under two decades, with these gains manifesting
in new abilities to compete as evidenced in participation in three European tournaments in the
1980s and in all six World Cup tournaments from 1980 to 2002, a second-place finish in the 1980
European Championship, and 4th place finish in the 1984 World Cup. The country’s teams went
through some lean years in the 2000s but managed to maintain participant and rival levels at
higher rates than they were prior to the 1980s. The teams have recently resumed building on post-
70s gains, with a new (and more diverse) golden generation emerging as one of the world’s top
‘rivals’ in the 2010s (with a quarterfinal and semifinal achievement in the 2014 and 2018 World
Cup Finals Tournaments).
Conclusion
I introduced this paper recounting the prominent narrative that an African country will one day
win the soccer World Cup. I reflected on how this narrative fosters ‘hope’ for soccer lovers across
the continent, but wondered if such hope was warranted, given that predictions of future victory
have been made and not met for 50 years. This history of disappointment led me to offer three
ways to think about the hope of an African nation one day lifting the World Cup trophy: (i) It will
be satisfied at the right time, which has not yet come; (ii) It is too passive, and will not happen if
left ‘to time’ and not given more active attention; and (iii) It is unrealistic and will never happen.
The Belgium and French examples encourage me to reject the last idea, that this hope is unrealistic
and will never happen. The rise of both countries from European strugglers to global contenders
over the last sixty years demonstrates that countries can close ‘competing gaps’ through time and
build their capabilities to compete as both participant and rival and challenge the world’s best.

24
Such examples should feed the hope that some of Africa’s leading soccer-playing nations may
indeed become World Cup winners in future, rising like Belgium and France have. This injection of
hope is especially relevant for those countries that have achieved consistent ‘competing’
improvements in recent decades (like the Ivory Coast, Ghana, and Nigeria, but also countries like
Algeria, Cameroon, Senegal, and South Africa—discussed briefly in Appendix A). It should also
inspire Africa’s historic contenders, like Tunisia, Morocco, and Egypt, who are not competing as
close to the frontiers of global competitive possibility as they were in the 1970s, 1980s, or 1990s
but remain consistently dominant continental competitors.
The examples of Belgium and France and my analysis of the way African countries have progressed
as competitors over the past fifty years also leads me to reject the first idea proposed, that Africa’s
hope of winning will be satisfied at the right time, which has not yet come. I say this knowing that
some observers might interpret improvements over the last few decades as suggesting that
countries like the Ivory Coast, Ghana, and Nigeria are on pathways to compete at the highest levels
and will reach such status in the 2030s or 2040s if we just ‘let time’ take its course. I see
weaknesses in this argument, however, given limits of the implicit strategy African countries seem
to be relying on to improve their propensity to compete. As argued, this strategy emphasizes
dominating intra-continental opponents and winning regional tournaments (like the AfCoN). While
establishing countries as top contenders in Africa and helping African countries move from low-
level performers to ‘the middle’ of global soccer’s field (as shown visually in Figure 1), such strategy
will not suffice if these countries want to become high-level global contenders. They simply cannot
keep improving enough to reach the levels of ‘competing as participant’ or ‘competing as rival’
without proving themselves against better opponents more regularly than they currently do. They
will max out attending world tournaments and perhaps beating one or two top teams in such, but
never be good enough to win such matches as consistently as is required to be a true global force.
This perspective resonates with observations Melanie Krause and Stefan Szymanski have made
about the challenge Africa’s top soccer-playing countries have of escaping the equivalent of a
‘middle income trap’ in global soccer.35 They argue that low-level countries can improve their
35 Krause and Szymanksi (2019, pp.2995-2999).

25
competitive performance rather easily, mimicking the past best practices of the world’s best
countries against weaker or similarly weak regional competitors (where I stress the best practices
as being ‘past’ because they can only be copied if they have been documented and shared, which
takes time). However, countries find this strategy limited when they achieve ‘middling’ status (as
the African countries in this sample have): It simply does not help them compete with the world’s
best countries, which requires that they be the authors of new best practices (having the kind of
advanced talent mobilization and innovation facilitation capabilities found in high-level countries).
Krause and Szymanksi argue that these capabilities tend to emerge as ‘technology transfers’ when
middling teams play against “the world’s best teams on a regular basis” but note that countries in
regions like Africa “have fewer opportunities [for such contests, or] to hone their skills against the
world’s top national teams” given their focus on (mostly) playing against regional teams that are
not globally competitive.
Reflecting on such views, I find myself agreeing with the second idea proposed to think of the hope
of African countries winning world titles and becoming world elites: It is a valid hope, that can be
realized, but is currently too passive, and will not happen if left ‘to time’ and not given more active
attention. The active attention I propose is for Africa’s leading countries to ramp up the quality of
their competitors and competition to learn and build the kinds of capabilities needed to win more
often against the world’s best (who they seldom currently play and commonly lose to when they
do play, apparently without learning why and how to do better ‘next time’).
The quality of competition will improve to some degree when Africa sees its number of positions
in the World Cup Finals Tournament expanded in 2026 (where Africa will have nine
representatives, up from the current allotment of five).36 More World Cup Tournament slots will
likely only increase the quality of average competitors and ‘% Elite competitors’ slightly, however
(as there are only three guaranteed matches at each World Cup tournament, which Africa’s
contenders seldom progress beyond). It is also instructive that these few, irregular World Cup
36 The politics of regional allotments is important to recognize here. Europe and Africa have about the same number of countries (54 and 55), but Europe has always had many more slots at the World Cup Finals Tournaments (13, instead of Africa’s 5). The adjustment in 2026 will add four slots to Africa, but Europe will also gain—another 3. These slots allow countries opportunities to play the world’s best teams and will give more African and European teams such opportunities (but potentially also dilute the ‘high-positionality’ of the World Cup tournament).

26
Finals Tournament appearances have not proven sufficient to help Africa’s top contenders learn
how to beat the world’s best (in fact, the perennial African participants in these tournaments seem
to win less over time against top opposition).
As such, African countries intent on challenging the world’s best need to develop their own
strategies of scheduling matches against these high-position countries—just like Belgium and
France did in the 1970s and 1980s. This is necessary even if playing ‘up’ more often comes with a
risk of losing more regularly. This seems to be a required risk for any country wanting to become
a competitor at the highest levels of competition (like a ‘desirable difficulty’ one embraces to learn
new things37) and one that should itself be managed (by emphasizing learning and capability
building through high-level competition and developing methods to rebuff criticism of failure).
The words of Antonio Conte, the former Italian player and current manager of Tottenham Hotspur
Football Club, help to explain why this new capability building strategy—and its risks—are
important. Consider my own adaptation of a recent statement he made about his club’s efforts to
be more competitive:38 “We [in Africa] have a lot of space for improvement, to be a [continent]
with aspirations to win. [But] To use the verb ‘to win’ is more simple than winning because to win
you have to build something important, be solid … Then you’re ready to win. Otherwise you have
to hope [passively, on ‘time’ and the ‘luck’ of maybe one day having another golden generation].”
As I conclude, I wonder if African countries should embrace such view in thinking about its
development policies beyond the field of soccer. Countries on the continent compete with the
world in many other domains, including economics, and governments and leaders are constantly
predicting or promising that their nations are on the verge of becoming global contenders (just as
they insist the continent’s teams will win the soccer World Cup). I read such statements in the
many national vision documents that exist across the continent, with selected examples
committing (among other things) to: Make Kenya and Malawi industrialized and technologically
driven middle income countries by 2030; Establish Nigeria as one of the world’s top twenty-
countries (by 2020); Turn Gambia into a competitive, dynamic middle income country; Ensure
37 See Bjork and Bjork (2011). 38 Hytner (2022).

27
Uganda becomes a ‘competitive upper-middle income country’ by 2040; and Transform Egypt and
Mauritania into globally active high-middle to high income societies by 2030.
What chance is there of any of these visionary things happening? Are the ‘hopes’ fostered in such
vision documents unrealistic promises that are unlikely to come to pass, or are they likely to
materialize but only ‘in time’ (which is yet to come), or are African policymakers being too passive
in their efforts to make these hopes real? A reality check exercise like the one conducted here
could help answer such questions and guide Africa’s economic policymakers as they tackle the
difficult challenge of trying to make visionary hope real and improve the way countries on the
continent compete ‘as participant’ and ‘as rival’ in the world economy.
References
Association of French Press (AFP)., 2021., Africa must win World Cup soon, says new CAF boss
Motsepe. France24, March 16, 2021. Available at https://www.france24.com/en/live-
news/20210316-africa-must-win-world-cup-soon-says-new-caf-boss-motsepe.
Barreira, J. and Da Silva, C.E., 2016. National teams in Women's Soccer World Cup from 1991 to
2015: participation, performance and competitiveness. Journal of Physical Education and Sport,
16(3), p.795.
Bjork, E.L. and Bjork, R.A., 2011. Making things hard on yourself, but in a good way: Creating
desirable difficulties to enhance learning. Psychology and the real world: Essays illustrating
fundamental contributions to society, 2, pp.59-68.
Collett, M., 2009. Africa has great chance of winning World Cup-Abedi Pele. Reuters Sports
News, June 23, 2009. Available at https://www.reuters.com/article/idINIndia-40551520090623.
Folgado, H., Duarte, R., Fernandes, O. and Sampaio, J., 2014. Competing with lower level
opponents decreases intra-team movement synchronization and time-motion demands during
pre-season soccer matches. PloS one, 9(5), p.e97145.
Fromm, E., 2010. The Revolution of Hope. Rivrdale, NY.: American Mental Health Foundation
Books.

28
Gásquez, R. and Royuela, V., 2016. The determinants of international football success: A panel
data analysis of the Elo rating. Social Science Quarterly, 97(2), pp.125-141.
Hirsch, F. 1976. Social Limits to Growth. Cambridge, Mass.: Harvard University Press.
Hytnr, D. 2022. Antonio Conte insists he has nothing to prove on Chelsea return with Spurs. The
Guardian. January 3, 2022. https://www.theguardian.com/football/2022/jan/03/antonio-conte-
nothing-to-prove-chelsea-return-with-spurs-carabao-cup-covid-cases
Krause, M. and Szymanski, S., 2019. Convergence versus the middle-income trap: the case of
global soccer. Applied Economics, 51(27), pp.2980-2999.
Peeters, T.L., Mills, B.M., Pennings, E. and Sung, H., 2019. Manager migration, learning-by-hiring,
and cultural distance in international soccer. Global Strategy Journal, 11(3), pp. 494-519.
Reid, H.L., 2015. Olympism–a Philosophy of Sport?. In Routledge Handbook of the Philosophy of
Sport (pp. 368-382). Routledge.
Rintaugu, E.G., Mwisukha, A. and Onywera, V., 2012. Analysis of factors that affect the standard
of soccer in africa: the case of east african countries. Journal of Physical Education & Sport, 12(1),
pp. 135-139.
Schneider, M., 2007. The nature, history and significance of the concept of positional goods.
History of Economics Review, 45(1), pp.60-81.
Torres, C.R., 2006. Results or participation?: Reconsidering Olympism's approach to competition.
Quest, 58(2), pp.242-254.
Torres, C.R., 2011. Morally incompatible? An analysis of the relationship between competitive
sport and international relations at the Olympic Games. The SAIS Review of International Affairs,
31(1), pp.3-16.
Wassim, U., 2014. Exclusive: African team can win it, says Okocha. Dawn.com, April 6, 2014.
Available at https://www.dawn.com/news/1097944.

29
Appendix A
The paper’s main text did not show the ‘competing’ progression of four of the African countries
from my sample. I provide figures to illustrate those journeys here, first for Cameroon (in Figure
A1) and Algeria (Figure A2) and then for Senegal (Figure A3) and South Africa (Figure A4).
Figure A1. Cameroon’s progress since the 1970s Figure A2. Algeria’s progress since the 1970s
Source: Author’s original work.
Figure A3. Senegal’s progress since the 1970s Figure A4. South Africa’s progress since the 1970s
Source: Author’s original work.
31
52
58 57
5242
5453
67
38
0
20
40
60
80
100
70 to 79 80 to 89 90 to 99 00 to 09 10 to 19
Cameroon Participant Cameroon Rival
32
64
40 40
53
24
56
45
36
51
0
20
40
60
80
100
70 to 79 80 to 89 90 to 99 00 to 09 10 to 19
AlgeriaParticipant Algeria Rival
2735
40
58
43
23
42
30
68
57
0
20
40
60
80
100
70 to 79 80 to 89 90 to 99 00 to 09 10 to 19
Senegal Participant Senegal Rival
5053
434851
55
0
20
40
60
80
100
70 to 79 80 to 89 90 to 99 00 to 09 10 to 19
South Africa Participant South Africa Rival

30
A primary observation in reviewing these progress charts is that every African story is different.
Countries have progressed in different ways when it comes to competing in world soccer. It also
seems that most of the countries have relied on ‘golden generations’ to progress.
Cameroon’s golden generation emerged out of the surprising team that reached the World Cup
quarterfinals in the 1990 World Cup Finals Tournament. Cameroon qualified for the next three
World Cup tournaments, peaking as both ‘participant’ and ‘rival’ in the early 2000s (when they
won two AfCoN championships in succession and progressed to the quarter finals of the next two).
The country’s status as a rival diminished in the 2010s, but it held onto the gains it made as
participant. Improved results at the end of the 2010s (including a 2017 AfCoN championship)
suggest the country’s competing scores might rise again in the future (though they are relatively
low (at 51 and 38) compared with countries like Nigeria and the Ivory Coast).
Algeria’s first golden generation was in the 1980s when the country improved both its ‘compete
as participant’ and ‘compete as rival’ scores. This group reached the 1982 and 1986 World Cup
Finals Tournaments and won the 1990 AfCoN. The country’s fortunes dipped in the 1990s and
2000s, however, after the golden generation moved on, but recovered in the 2010s as another
golden generation appeared to have emerged (playing in two World Cup Finals Tournaments,
reaching the World Cup second round in 2014—narrowly losing to Germany after beating South
Korea and drawing to Russia—and winning the African Cup of Nations tournament in 2019). As
with Cameroon, it is likely that Algeria’s competing scores will continue improving in the 2020s,
with a lot of space to grow given their relatively low 2010s levels (52 and 51).
Senegal was arguably the weakest country in my sample in the 1970s, with participant and rival
scores of 27 and 23. They improved on both these low scores in the 1980s and continued
strengthening their ‘participant’ record in particular in the 1990s (qualifying for three out of five
AfCoN tournaments between 1990 and 1999) even though they struggled to win points in these
events (winning only three and drawing two out of eleven matches). This implicit strategy of
playing ‘up’ for much of the 1990s helped establish the national team as one of the continent’s
most competitive ‘participants’ in the 2000s and 2010s and also stood as an investment that
ultimately generated significant growth as a ‘rival’. The country played in nine of the eleven AfCoN
tournaments since 2000 and qualified for two world cups (causing its ‘compete as participant’

31
score to increase from 40 to 58 in the 2000s and to stabilize at 43 in the 2010s). It achieved one
runner-up, one fourth place and two quarter-final AfCoN finishes in the 2000s and reached the
2002 World Cup quarterfinal (remarkably beating France and drawing to Denmark and Uruguay in
what is Africa’s best performance in the World Cup to date). It has been less successful in the
2010s, but is still one of Africa’s main ‘rival’ countries (scoring 57 on the ‘compete as rival’ index,
up from 23 in the 1970s). Observers expect a lot from Senegal in the 2020s, given its rich
performance as participant and rival in the last few years of the 2010s (when it qualified for three
AfCoNs and the one World Cup Tournament, achieving runner-up status in an AfCoN and narrowly
missing the second round at 2018’s World Cup where, as Africa’s top achiever, it beat Poland and
drew with Japan).
South Africa did not compete in the 1970s and 1980s because it was banned from international
competition. In the 1990s, it emerged as an African contender with relatively high participant and
rival scores of 50 and 48. These were earned largely because of two successful appearances in the
AfCoNs (where it finished as champions and runners-up in 1996 and 1998) and an inaugural
qualification for the 1998 World Cup Finals Tournament. The country maintained its level of
participation in the 2000s by playing in all the possible AfCoN tournaments and one World Cup
event, and held its ‘compete as rival’ scores steady in this period as well. Interestingly, the
‘compete as rival’ score increased in the 2010s while the ‘compete as participant’ score declined.
The growth in rival scores reflects an increase in the country’s average winning rate (from 52
percent in the 2000s to 56 percent in the 2010s). The decline in participant scores reflects a drop
in the quality of competitor faced (with the average opponent’s ranking decreasing from the 72nd
percentile in the 1990s to the 68th percentile in the 2000s and the 64th percentile in the 2010s,
and the ‘% Elite competitors’ dropping from 17% to 11% to 4% in the same period). When
combined, the story of South African soccer seems to be that it is playing easier teams from the
region and beating these teams more often than before—but with less apparent intention of
competing outside of Africa or at the highest level in the world.