CALIFORNIA STATE UNIVERSITY OF LONG BEACH EXPERIMENT 2 CALIBRATION OF A LOAD CELL AND A...
14
CALIFORNIA STATE UNIVERSITY OF LONG BEACH EXPERIMENT 2 CALIBRATION OF A LOAD CELL AND A BOURDON-TUBE-TYPE PRESSURE GAGE PRESENT ¿ DR.HUYHOANG WRITTEN BY MARC BRUNET AND JASON TRAN GROUP 12333
-
Upload
independent -
Category
Documents
-
view
1 -
download
0
Transcript of CALIFORNIA STATE UNIVERSITY OF LONG BEACH EXPERIMENT 2 CALIBRATION OF A LOAD CELL AND A...

CALIFORNIA STATE UNIVERSITY OF LONG BEACH
EXPERIMENT 2CALIBRATION OF A LOAD CELL AND ABOURDON-TUBE-TYPE PRESSURE GAGE
PRESENT¿DR.HUYHOANG
WRITTEN BY MARC BRUNET AND JASON TRAN GROUP 12333
MAE 300 EXPERIMENT 2 Page 1
10/10/2011
I. ABSTRACT
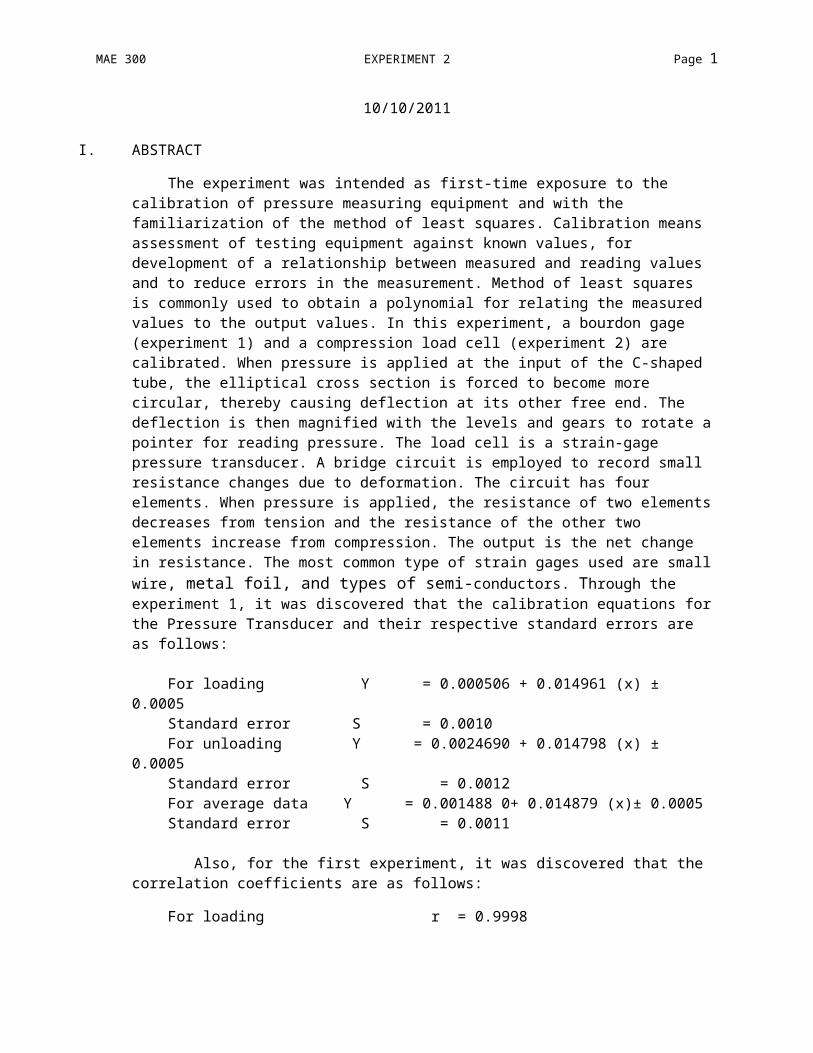
The experiment was intended as first-time exposure to the calibration of pressure measuring equipment and with the familiarization of the method of least squares. Calibration means assessment of testing equipment against known values, for development of a relationship between measured and reading values and to reduce errors in the measurement. Method of least squares is commonly used to obtain a polynomial for relating the measured values to the output values. In this experiment, a bourdon gage (experiment 1) and a compression load cell (experiment 2) are calibrated. When pressure is applied at the input of the C-shaped tube, the elliptical cross section is forced to become more circular, thereby causing deflection at its other free end. The deflection is then magnified with the levels and gears to rotate apointer for reading pressure. The load cell is a strain-gage pressure transducer. A bridge circuit is employed to record small resistance changes due to deformation. The circuit has four elements. When pressure is applied, the resistance of two elementsdecreases from tension and the resistance of the other two elements increase from compression. The output is the net change in resistance. The most common type of strain gages used are smallwire, metal foil, and types of semi-conductors. Through the experiment 1, it was discovered that the calibration equations forthe Pressure Transducer and their respective standard errors are as follows:
For loading Y = 0.000506 + 0.014961 (x) ± 0.0005
Standard error S = 0.0010For unloading Y = 0.0024690 + 0.014798 (x) ±
0.0005Standard error S = 0.0012For average data Y = 0.001488 0+ 0.014879 (x)± 0.0005Standard error S = 0.0011
Also, for the first experiment, it was discovered that the correlation coefficients are as follows:
For loading r = 0.9998
MAE 300 EXPERIMENT 2 Page 2
For unloading r = 0.9997For average data r = 0.9999
Through experiment 2, it was discovered that the calibration equations for the Bourdon gage and their respective standard errors are as follows:
For loading Y = - 21.9127+ 2.0181 (x) ± 50Standard error S = 19.3319For unloading Y = - 21.9127+ 2.0181 (x) ± 50Standard error S = 19.3319For average data Y = - 21.9127+ 2.0181 (x) ± 50Standard error S = 19.3319
Also, for the second experiment, it was discovered that thecorrelation coefficients are as follows:
For loading r = 0.9999For unloading r = 0.9999For average data r = 0.9999
II. BACKGROUND/THEORYBelow are the equations which were used to compute a
statistical analysis of the data along with a brief explanation ofhow they were used.1. Polynomial coefficients:
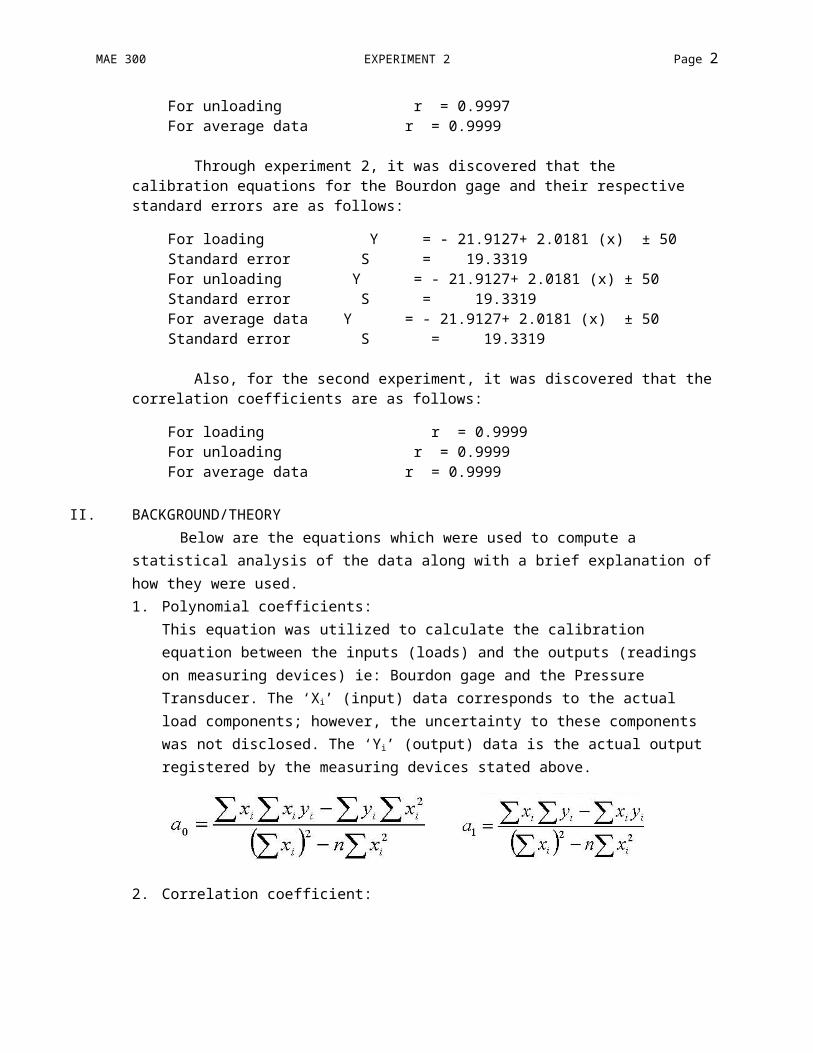
This equation was utilized to calculate the calibration equation between the inputs (loads) and the outputs (readings on measuring devices) ie: Bourdon gage and the Pressure Transducer. The ‘Xi’ (input) data corresponds to the actual load components; however, the uncertainty to these components was not disclosed. The ‘Yi’ (output) data is the actual output registered by the measuring devices stated above.
2. Correlation coefficient:
MAE 300 EXPERIMENT 2 Page 3
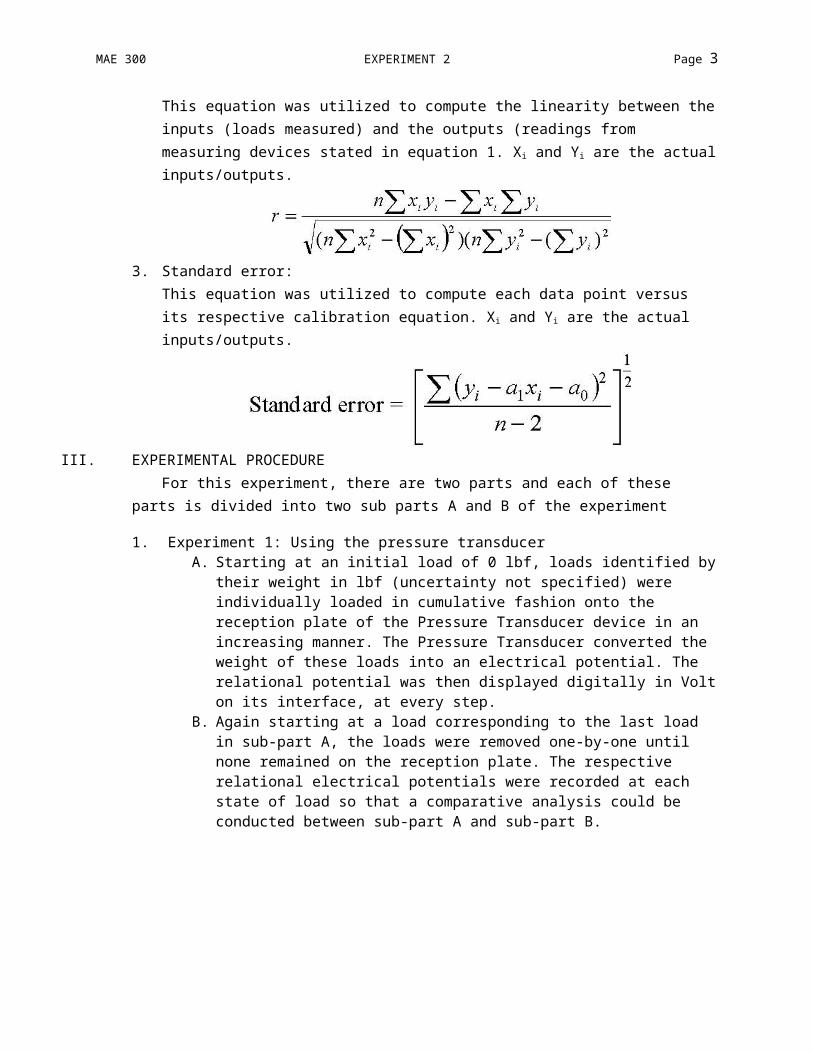
This equation was utilized to compute the linearity between theinputs (loads measured) and the outputs (readings from measuring devices stated in equation 1. Xi and Yi are the actualinputs/outputs.
3. Standard error:This equation was utilized to compute each data point versus its respective calibration equation. Xi and Yi are the actual inputs/outputs.
III. EXPERIMENTAL PROCEDUREFor this experiment, there are two parts and each of these
parts is divided into two sub parts A and B of the experiment
1. Experiment 1: Using the pressure transducerA. Starting at an initial load of 0 lbf, loads identified by
their weight in lbf (uncertainty not specified) were individually loaded in cumulative fashion onto the reception plate of the Pressure Transducer device in an increasing manner. The Pressure Transducer converted the weight of these loads into an electrical potential. The relational potential was then displayed digitally in Volton its interface, at every step.
B. Again starting at a load corresponding to the last load in sub-part A, the loads were removed one-by-one until none remained on the reception plate. The respective relational electrical potentials were recorded at each state of load so that a comparative analysis could be conducted between sub-part A and sub-part B.
MAE 300 EXPERIMENT 2 Page 4
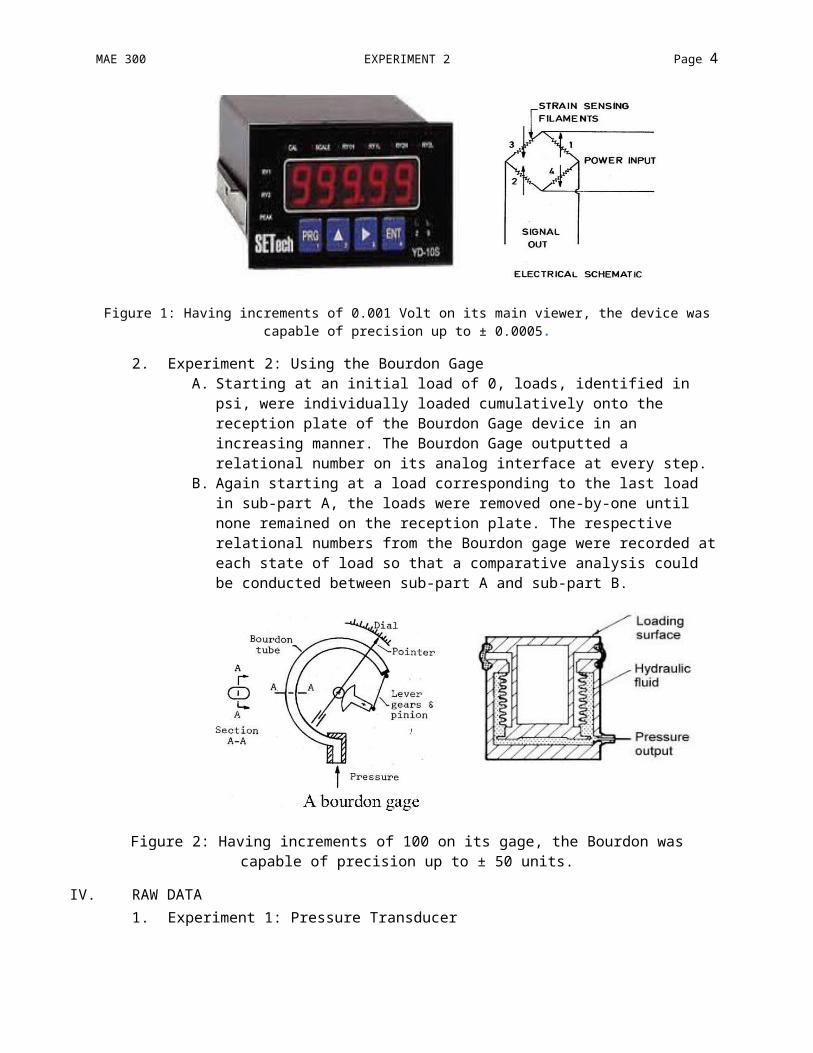
Figure 1: Having increments of 0.001 Volt on its main viewer, the device wascapable of precision up to ± 0.0005.
2. Experiment 2: Using the Bourdon GageA. Starting at an initial load of 0, loads, identified in
psi, were individually loaded cumulatively onto the reception plate of the Bourdon Gage device in an increasing manner. The Bourdon Gage outputted a relational number on its analog interface at every step.
B. Again starting at a load corresponding to the last load in sub-part A, the loads were removed one-by-one until none remained on the reception plate. The respective relational numbers from the Bourdon gage were recorded ateach state of load so that a comparative analysis could be conducted between sub-part A and sub-part B.
Figure 2: Having increments of 100 on its gage, the Bourdon wascapable of precision up to ± 50 units.
IV. RAW DATA1. Experiment 1: Pressure Transducer
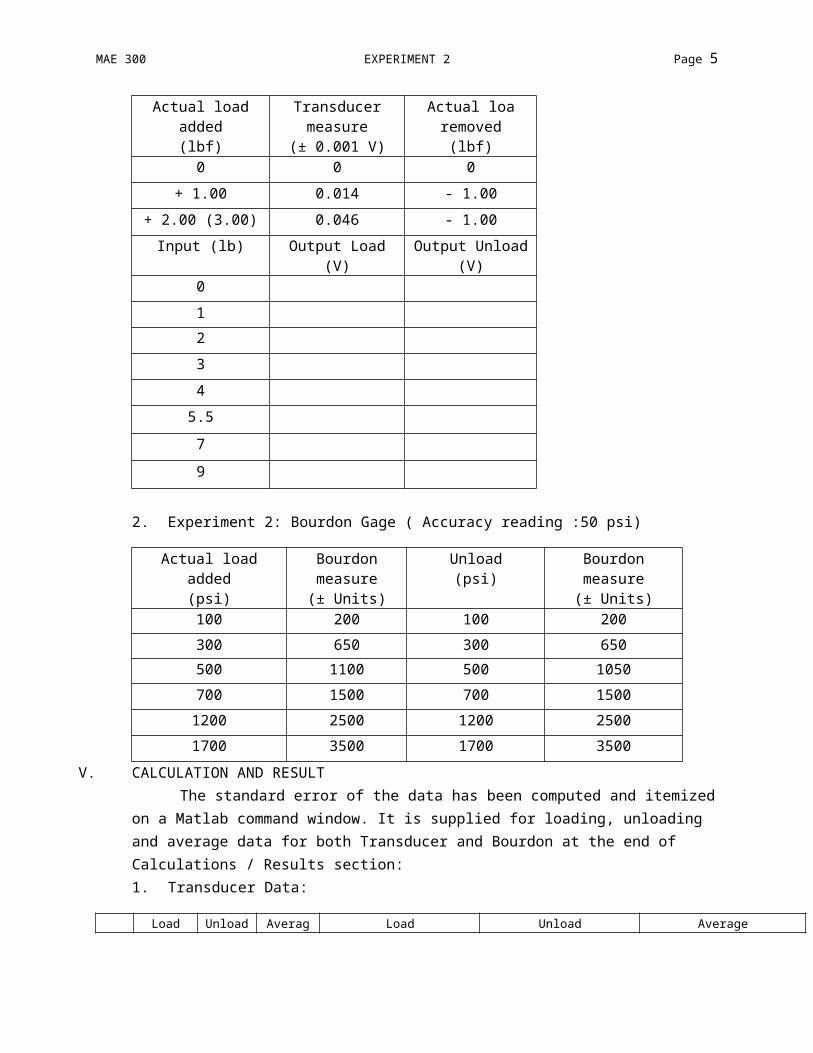
MAE 300 EXPERIMENT 2 Page 5
Actual loadadded(lbf)
Transducermeasure
(± 0.001 V)
Actual loaremoved(lbf)
0 0 0+ 1.00 0.014 - 1.00
+ 2.00 (3.00) 0.046 - 1.00Input (lb) Output Load
(V)Output Unload
(V)01234
5.579
2. Experiment 2: Bourdon Gage ( Accuracy reading :50 psi)
Actual loadadded(psi)
Bourdonmeasure(± Units)
Unload(psi)
Bourdonmeasure(± Units)
100 200 100 200300 650 300 650500 1100 500 1050700 1500 700 15001200 2500 1200 25001700 3500 1700 3500
V. CALCULATION AND RESULTThe standard error of the data has been computed and itemized
on a Matlab command window. It is supplied for loading, unloading and average data for both Transducer and Bourdon at the end of Calculations / Results section:1. Transducer Data:
Load Unload Averag Load Unload Average
MAE 300 EXPERIMENT 2 Page 6
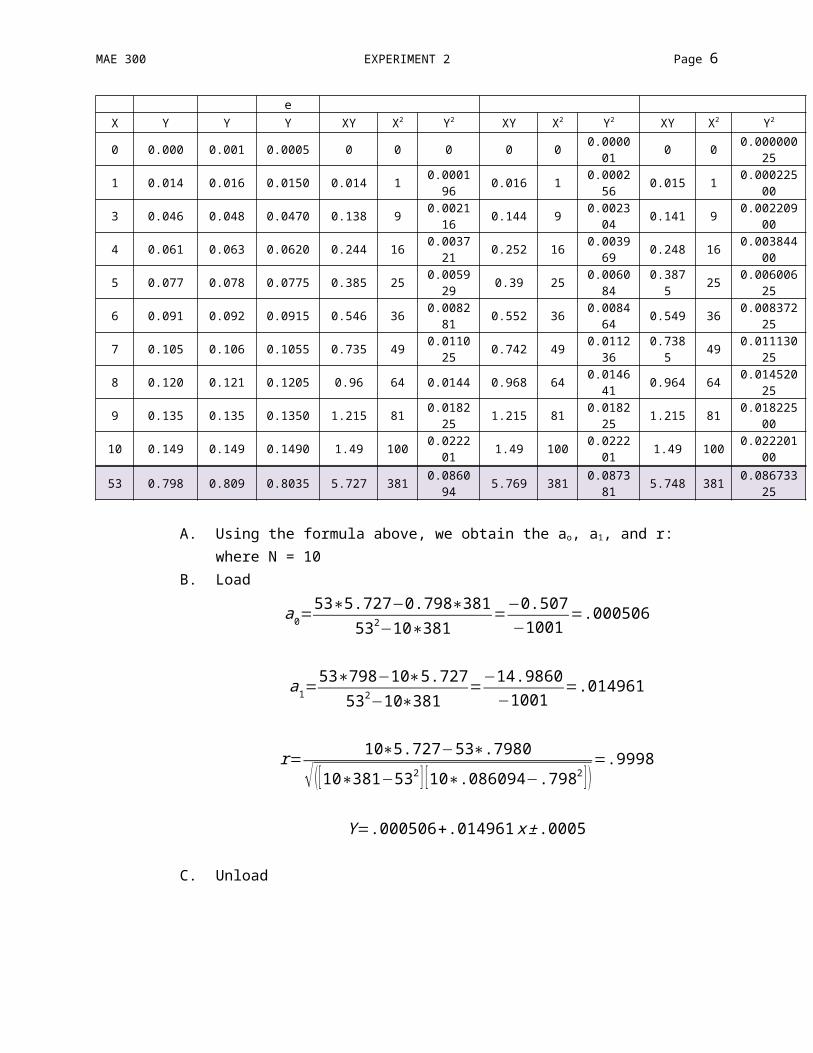
eX Y Y Y XY X2 Y2 XY X2 Y2 XY X2 Y2
0 0.000 0.001 0.0005 0 0 0 0 0 0.000001 0 0 0.000000
25
1 0.014 0.016 0.0150 0.014 1 0.000196 0.016 1 0.0002
56 0.015 1 0.00022500
3 0.046 0.048 0.0470 0.138 9 0.002116 0.144 9 0.0023
04 0.141 9 0.00220900
4 0.061 0.063 0.0620 0.244 16 0.003721 0.252 16 0.0039
69 0.248 16 0.00384400
5 0.077 0.078 0.0775 0.385 25 0.005929 0.39 25 0.0060
840.3875 25 0.006006
25
6 0.091 0.092 0.0915 0.546 36 0.008281 0.552 36 0.0084
64 0.549 36 0.00837225
7 0.105 0.106 0.1055 0.735 49 0.011025 0.742 49 0.0112
360.7385 49 0.011130
25
8 0.120 0.121 0.1205 0.96 64 0.0144 0.968 64 0.014641 0.964 64 0.014520
25
9 0.135 0.135 0.1350 1.215 81 0.018225 1.215 81 0.0182
25 1.215 81 0.01822500
10 0.149 0.149 0.1490 1.49 100 0.022201 1.49 100 0.0222
01 1.49 100 0.02220100
53 0.798 0.809 0.8035 5.727 381 0.086094 5.769 381 0.0873
81 5.748 381 0.08673325
A. Using the formula above, we obtain the ao, a1, and r: where N = 10
B. Load
a0=53∗5.727−0.798∗381
532−10∗381=−0.507
−1001=.000506
a1=53∗798−10∗5.727
532−10∗381=
−14.9860−1001
=.014961
r=10∗5.727−53∗.7980
√ ([10∗381−532 ] [10∗.086094−.7982 ] )=.9998
Y=.000506+.014961x±.0005
C. Unload
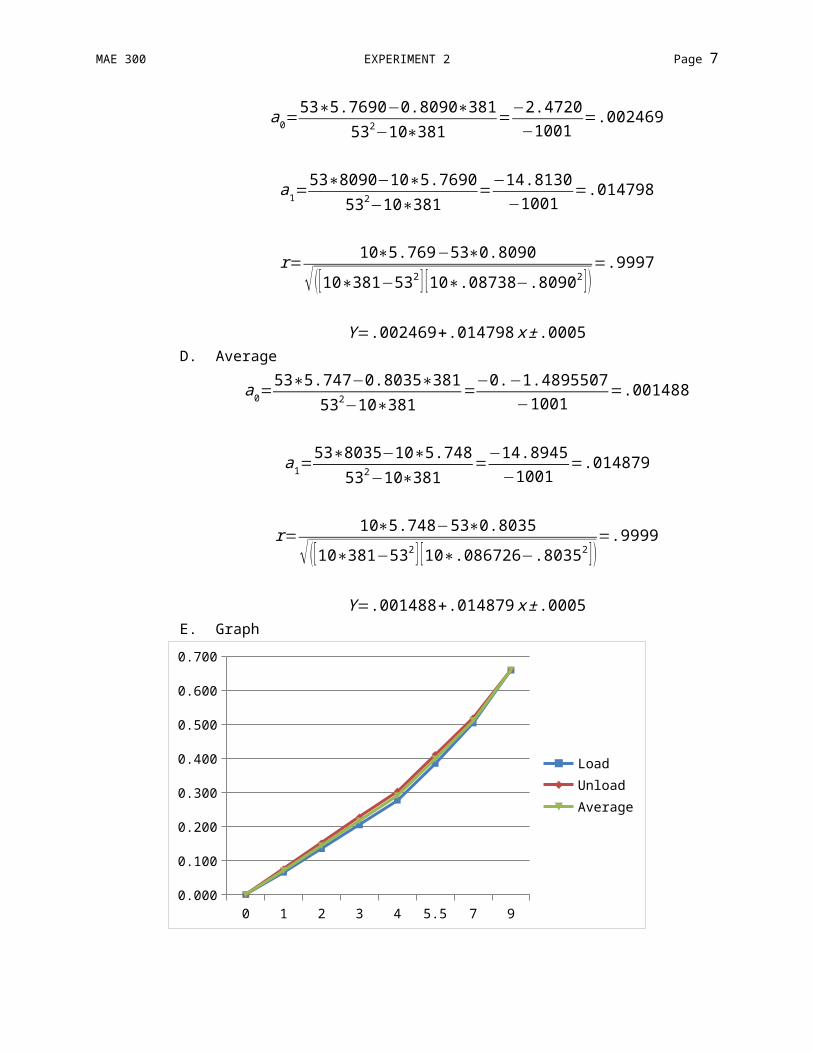
MAE 300 EXPERIMENT 2 Page 7
a0=53∗5.7690−0.8090∗381
532−10∗381=−2.4720
−1001=.002469
a1=53∗8090−10∗5.7690
532−10∗381=−14.8130
−1001=.014798
r=10∗5.769−53∗0.8090
√ ([10∗381−532 ] [10∗.08738−.80902 ])=.9997
Y=.002469+.014798x±.0005D. Average
a0=53∗5.747−0.8035∗381
532−10∗381=
−0.−1.4895507−1001
=.001488
a1=53∗8035−10∗5.748
532−10∗381=
−14.8945−1001
=.014879
r=10∗5.748−53∗0.8035
√ ([10∗381−532 ] [10∗.086726−.80352 ] )=.9999
Y=.001488+.014879x±.0005E. Graph
0 1 2 3 4 5.5 7 90.000
0.100
0.200
0.300
0.400
0.500
0.600
0.700
LoadUnloadAverage
MAE 300 EXPERIMENT 2 Page 8
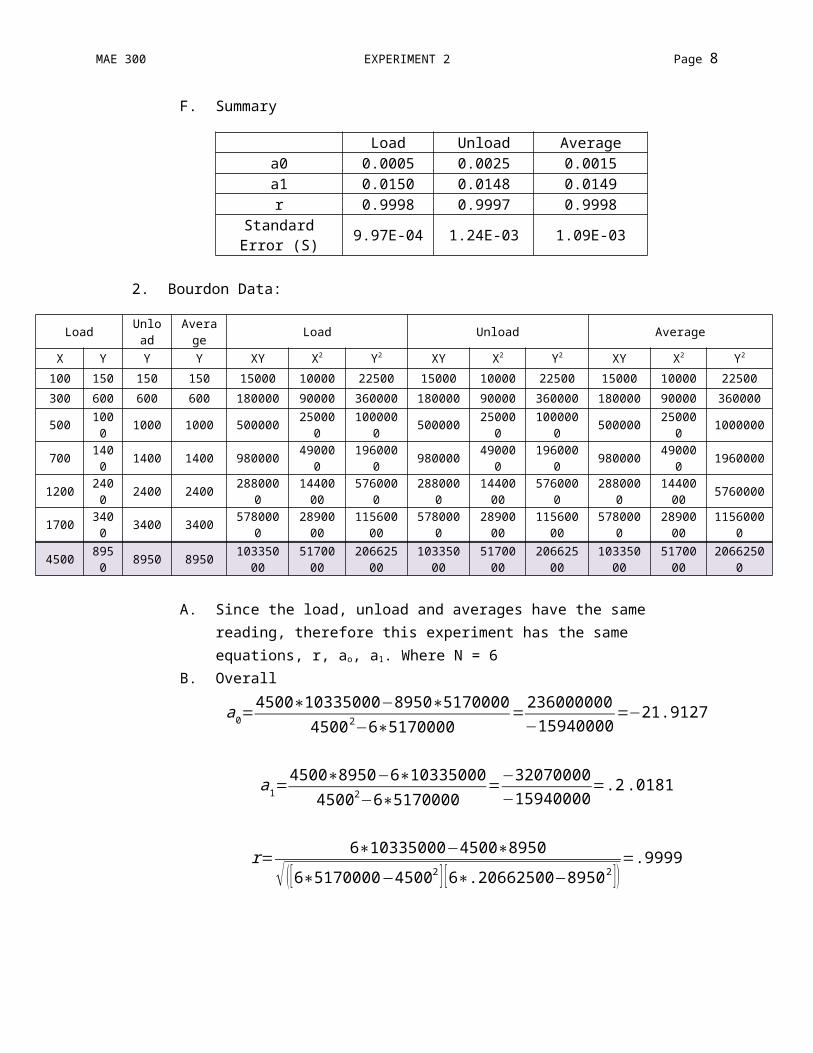
F. Summary
Load Unload Averagea0 0.0005 0.0025 0.0015a1 0.0150 0.0148 0.0149r 0.9998 0.9997 0.9998
StandardError (S) 9.97E-04 1.24E-03 1.09E-03
2. Bourdon Data:
Load Unload
Average Load Unload Average
X Y Y Y XY X2 Y2 XY X2 Y2 XY X2 Y2
100 150 150 150 15000 10000 22500 15000 10000 22500 15000 10000 22500300 600 600 600 180000 90000 360000 180000 90000 360000 180000 90000 360000
500 1000 1000 1000 500000 25000
0100000
0 500000 250000
1000000 500000 25000
0 1000000
700 1400 1400 1400 980000 49000
0196000
0 980000 490000
1960000 980000 49000
0 1960000
1200 2400 2400 2400 288000
01440000
5760000
2880000
1440000
5760000
2880000
1440000 5760000
1700 3400 3400 3400 578000
02890000
11560000
5780000
2890000
11560000
5780000
2890000
11560000
4500 8950 8950 8950 103350
005170000
20662500
10335000
5170000
20662500
10335000
5170000
20662500
A. Since the load, unload and averages have the same reading, therefore this experiment has the same equations, r, ao, a1. Where N = 6
B. Overall
a0=4500∗10335000−8950∗5170000
45002−6∗5170000=236000000−15940000
=−21.9127
a1=4500∗8950−6∗10335000
45002−6∗5170000=
−32070000−15940000
=.2.0181
r=6∗10335000−4500∗8950
√ ([6∗5170000−45002 ] [6∗.20662500−89502 ])=.9999
MAE 300 EXPERIMENT 2 Page 9
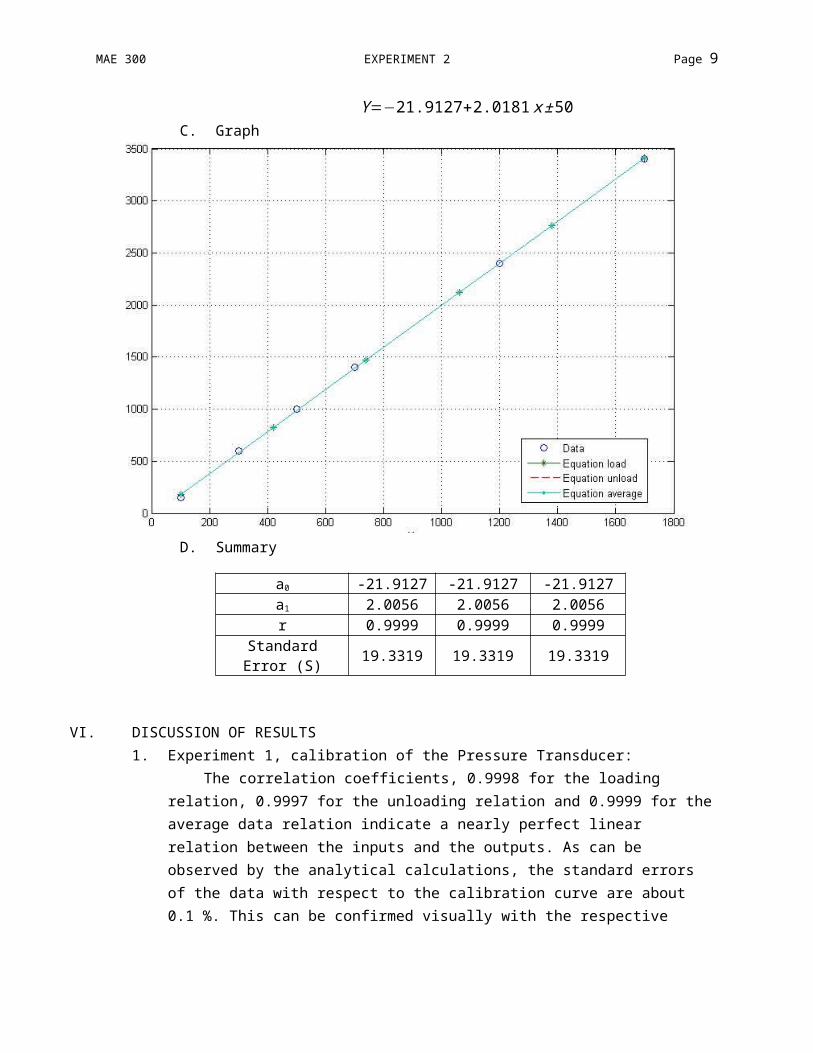
Y=−21.9127+2.0181x±50C. Graph
D. Summary
a0 -21.9127 -21.9127 -21.9127a1 2.0056 2.0056 2.0056r 0.9999 0.9999 0.9999
StandardError (S) 19.3319 19.3319 19.3319
VI. DISCUSSION OF RESULTS1. Experiment 1, calibration of the Pressure Transducer:
The correlation coefficients, 0.9998 for the loading relation, 0.9997 for the unloading relation and 0.9999 for theaverage data relation indicate a nearly perfect linear relation between the inputs and the outputs. As can be observed by the analytical calculations, the standard errors of the data with respect to the calibration curve are about 0.1 %. This can be confirmed visually with the respective
MAE 300 EXPERIMENT 2 Page 10
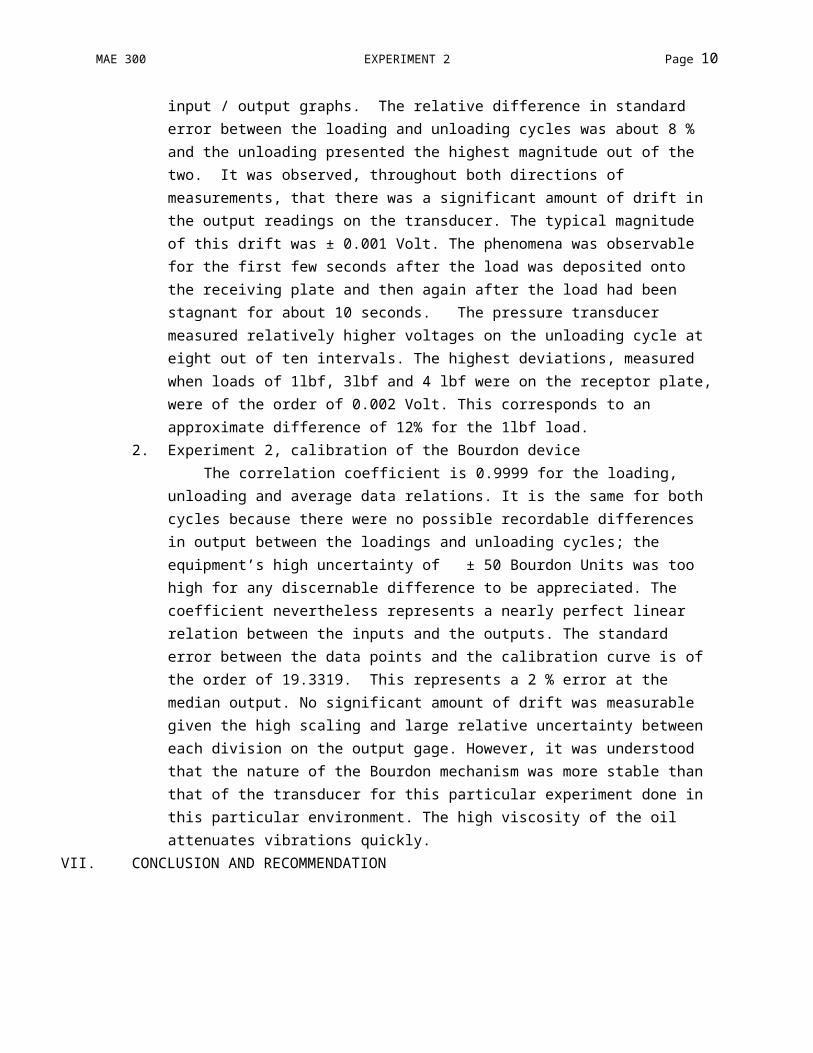
input / output graphs. The relative difference in standard error between the loading and unloading cycles was about 8 % and the unloading presented the highest magnitude out of the two. It was observed, throughout both directions of measurements, that there was a significant amount of drift in the output readings on the transducer. The typical magnitude of this drift was ± 0.001 Volt. The phenomena was observable for the first few seconds after the load was deposited onto the receiving plate and then again after the load had been stagnant for about 10 seconds. The pressure transducer measured relatively higher voltages on the unloading cycle at eight out of ten intervals. The highest deviations, measured when loads of 1lbf, 3lbf and 4 lbf were on the receptor plate,were of the order of 0.002 Volt. This corresponds to an approximate difference of 12% for the 1lbf load.
2. Experiment 2, calibration of the Bourdon deviceThe correlation coefficient is 0.9999 for the loading,
unloading and average data relations. It is the same for both cycles because there were no possible recordable differences in output between the loadings and unloading cycles; the equipment’s high uncertainty of ± 50 Bourdon Units was too high for any discernable difference to be appreciated. The coefficient nevertheless represents a nearly perfect linear relation between the inputs and the outputs. The standard error between the data points and the calibration curve is of the order of 19.3319. This represents a 2 % error at the median output. No significant amount of drift was measurable given the high scaling and large relative uncertainty between each division on the output gage. However, it was understood that the nature of the Bourdon mechanism was more stable than that of the transducer for this particular experiment done in this particular environment. The high viscosity of the oil attenuates vibrations quickly.
VII. CONCLUSION AND RECOMMENDATION
MAE 300 EXPERIMENT 2 Page 11
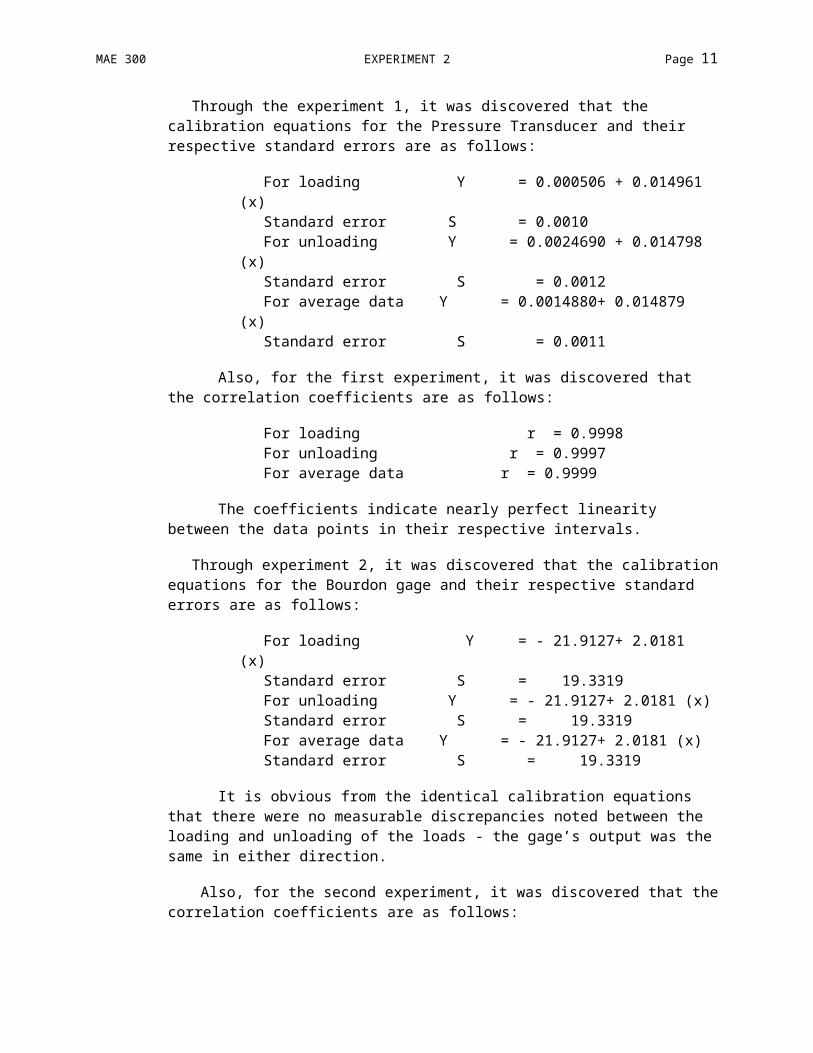
Through the experiment 1, it was discovered that the calibration equations for the Pressure Transducer and their respective standard errors are as follows:
For loading Y = 0.000506 + 0.014961 (x)
Standard error S = 0.0010For unloading Y = 0.0024690 + 0.014798
(x)Standard error S = 0.0012For average data Y = 0.0014880+ 0.014879
(x)Standard error S = 0.0011
Also, for the first experiment, it was discovered that the correlation coefficients are as follows:
For loading r = 0.9998 For unloading r = 0.9997For average data r = 0.9999
The coefficients indicate nearly perfect linearity between the data points in their respective intervals.
Through experiment 2, it was discovered that the calibrationequations for the Bourdon gage and their respective standard errors are as follows:
For loading Y = - 21.9127+ 2.0181 (x)
Standard error S = 19.3319For unloading Y = - 21.9127+ 2.0181 (x)Standard error S = 19.3319For average data Y = - 21.9127+ 2.0181 (x)Standard error S = 19.3319
It is obvious from the identical calibration equations that there were no measurable discrepancies noted between the loading and unloading of the loads - the gage’s output was thesame in either direction.
Also, for the second experiment, it was discovered that thecorrelation coefficients are as follows:
MAE 300 EXPERIMENT 2 Page 12
For loading r = 0.9999For unloading r = 0.9999For average data r = 0.9999
Again, the coefficients indicate nearly perfect linearitybetween the data points in their respective intervals.
The calibration process demonstrated the relatively high linearity of both measuring instruments. Both the Bourdon and the transducer outputted nearly perfect linear correspondencesto the inputs that were loaded onto them.
The Transducer, with its relatively low internal uncertainty of 0.0005 volt, would be better represented by thecalibration equation derived in this experiment than the Bourdon would be if we had accounted for internal equipment uncertainty in our calculations. The ratio of its maximum internal error versus the value of its calibration equation slope is less than 3%. The relative divergence between the calculated calibration equation in our experiment and a calibration equation derived by allowing our output data to beaugmented or diminished by a 0.0005 volt error would be relatively small. On the other hand, with its relatively high uncertainty at each output measurement, the Bourdon’ s calibration equation provides only a broad estimate of the true numerical relation between the inputs and outputs. A significant change in its calibration equation would be expected if we had accounted for internal uncertainty. In conjunction with the internal errors of the measuring devices,the load uncertainties were not disclosed for the purpose of this experiment. It would be expected that these would also cause a significant deviation with respect to the calibration equations. Given the significant amount of drift that was observed on the pressure transducer output, it would be preferable, for future experiments, that smaller groups approach and utilized the measuring devices while the balance of the students waited their turns at a greater distance. It was noted that drift was more acute as students around the devices moved abruptly. The device appeared to be highly responsive to moving air and vibrations. Given the effect of hysteris, which was numerically described in section 7, it would be advisable that students allowed for more time between
MAE 300 EXPERIMENT 2 Page 13
each output recording. As was noted during the experiment, when more time was allowed for each load condition to settle, the output magnitude in both load and unload cycles became more closely correlated.
VIII. REFERENCES
Hoang, H PhD, MAE-300 Class notes Fall 2011,CSULB, Long Beach, CA.
Rahai, H. PhD., “Instrumentation and measurements”,CCC Campus Company, SKU 12462346.
IX. APPENDIXN/A