Wellness, fatigue and physical performance acclimatisation to ...
Upload
khangminh22Category
view
1download
0
HEALTH AND WELLNESS
WORKING PAPER: An In-Depth Analysis of the Facts, Origins and Trends of Health and Wellness in California

2 THE FUTURE OF HEALTH AND WELLNESS
ABOUT CALIFORNIA 100
The California 100 Initiative envisions a future that is innovative, sustainable, and equitable for all. Our mission is to strengthen California’s ability to collectively solve problems and shape our long-term future over the next 100 years.
California 100 is organized around 15 policy domains and driven by interrelated stages of work: research, policy innovation and engagement with Californians. California 100’s work is guided by an expert and intergenerational Commission. Through various projects and activ-ities, California 100 seeks to move California towards an aspirational vision—changing policies and practices, attitudes and mindsets, to inspire a more vibrant future.
This California 100 Report on Policies and Future Scenarios was produced as part of California 100’s research stream of work, in partnership with 20 research institutions across the state. California 100 sponsored grants for data-driven and future-oriented research focused on un- derstanding today and planning for tomorrow. This research, anchored in California 100’s 15 core policy domains, forms the foundation for the initiative’s subsequent work by consider-ing how California has gotten to where it is and by exploring scenarios and policy alternatives for what California can become over the next 100 years.
The California 100 initiative is incubated through the University of California and Stanford.
CALIFORNIA 100 RESEARCH TEAMHenry E. Brady, Ph.D., Director of ResearchLindsay Maple, M.P.P., Senior Research AnalystAva Calanog, M.P.P., Assistant Director of Research
THE CALIFORNIA 100 EXECUTIVE LEADERSHIP TEAMAllison Berke, Ph.D., Director of Advanced TechnologyHenry E. Brady, Ph.D., Director or ResearchAmy Lerman, Ph.D., Director of InnovationJesse Melgar, M.P.P., Director of EngagementKarthick Ramakrishnan, Ph.D., Executive Director
READ MORE ABOUT THE FUTURE OF HEALTH AND WELLNESS IN CALIFORNIA
For additional background information, read the related report at California100.org.
DISCLAIMER The contents of this report reflect the views of the authors, who are responsible for the facts and the accuracy of the information presented herein. This document is dissem- inated under the sponsorship of the University of California in the interest of information exchange. The University of California assumes no liability for the contents or use thereof. Nor does the content necessarily reflect the official views or policies of the State of California. This report does not constitute a standard, specification, or regulation.

A CALIFORNIA 100 REPORT ON POLICIES AND FUTURE SCENARIOS 3
THE FUTURE OF HEALTH AND WELLNESS
A CALIFORNIA 100 WORKING PAPER

4 THE FUTURE OF HEALTH AND WELLNESS
CALIFORNIA 100 RESEARCH PARTNERS
This report is one of 15 reports that will be released in 2022 as part of the California 100 Initiative. We are proud to partner with the following research centers and institutes across California on our work:
ADVANCED TECHNOLOGY AND BASIC RESEARCH
• Bay Area Council Economic Institute/Bay Area Science and Innovation Consortium
• Silicon Valley Leadership Group Foundation’s California Center for Innovation
AGRICULTURE AND FOOD SYSTEMS
• California Polytechnic State University, San Luis Obispo, Natural ResourcesManagement and Environmental Sciences
ARTS, CULTURE, AND ENTERTAINMENT
• Allosphere at the University of California, Santa Barbara
BUSINESS CLIMATE, CORPORATE GOVERNANCE, AND ASSET FORMATION
• Loyola Marymount University, College of Business Administration
CRIMINAL JUSTICE REFORM AND PUBLIC SAFETY
• University of California, Irvine School of Social Ecology
EDUCATION
• University of California, Berkeley Institute For Young Americans
• University of California, Berkeley Graduate School of Education

A CALIFORNIA 100 REPORT ON POLICIES AND FUTURE SCENARIOS 5
ECONOMIC MOBILITY, INEQUALITY, AND WORKFORCE
• Stanford University Digital Economy Lab
• Stanford University Institute for Economic Policy Research
ENERGY, ENVIRONMENT, AND NATURAL RESOURCES
• University of California, Berkeley Goldman School of Public Policy’s Center for Environmental Public Policy
FEDERALISM AND FOREIGN POLICY
• Stanford University’s Bill Lane Center for the American West
FISCAL REFORM
• The Opportunity Institute
GOVERNANCE, MEDIA, AND CIVIL SOCIETY
• Stanford University Center for Democracy, Development and the Rule of Law
HEALTH AND WELLNESS
• University of California, Los Angeles Center for Health Policy Research
HOUSING AND COMMUNITY DEVELOPMENT
• University of California, Los Angeles Lewis Center for Regional Studies
• cityLab at UCLA
• University of California, Berkeley Terner Center for Housing Innovation
IMMIGRANT INTEGRATION
• University of Southern California Equity Research Institute
TRANSPORTATION AND URBAN PLANNING
• University of California, Los Angeles Institute of Transportation Studies

6 THE FUTURE OF HEALTH AND WELLNESS
ABOUT UCLA CENTER FOR HEALTH POLICY RESEARCH The UCLA Center for Health Policy Research (CHPR) is one of the nation's leading health policy research centers and the premier source of health policy information for California. UCLA CHPR is the home of the California Health Interview Survey (CHIS) and is based in the UCLA Fielding School of Public Health and affiliated with the UCLA Luskin School of Public Affairs. Since its founding in 1994, the UCLA CHPR has produced high-quality, objective, and evidence-based research and data that have informed effective policy making and improved the lives of millions of Californians. With nearly 100 UCLA CHPR faculty, staff, and graduate student researchers and 45 Faculty Affiliates, we tap expertise across all areas of health and well-being impacting Californians, f rom analyzing and addressing health disparities in underserved communities to providing credible enrollment estimates that helped implement health care reform, the Center has been a leading force in health policy issues.
A CALIFORNIA 100 REPORT ON POLICIES AND FUTURE SCENARIOS 7
THE FUTURE OF HEALTH AND WELLNESS REPORT AUTHORS:
Ninez A. Ponce, Ph.D., M.P.P. Director, UCLA Center for Health Policy Research (UCLA CHPR)
Susan H. Babey, Ph.D. UCLA CHPR
Linh Chuong, M.P.H. UCLA CHPR
AJ Scheitler, Ed.D. UCLA CHPR
Riti Shimkhada, Ph.D. UCLA CHPR
Sean Tan, M.P.P. UCLA CHPR
Karla Thomas, M.P.H. UCLA CHPR
Report development, revisions, and publication by California 100

2
Executive Summary Alive but Not Thriving: Health and Wellness in California California is a bellwether for the United States, providing lessons and examples of the successes and major challenges faced by health systems that aim to achieve health equity for a diverse population (Ko, Sanders, de Guia, Shimkhada, & Ponce, 2018). The health care delivery system has largely been successful in providing coverage and access to care compared to other states in the U.S. However, important challenges remain for California given approximately 7.7 percent of its population remains uninsured and the presence of wide disparities in health outcomes across socioeconomic groups, racial/ethnic populations, and regions of California. How can such an elaborate and expensive health care system, alongside years of research on health disparities, fail to achieve health equity? One simple answer is that a health care system can only do so much to achieve wellness in society.
What health care researchers, policymakers, and practitioners have begun to understand and put into practice is that the social and structural determinants of health (SSDoH) are critical to health and wellness. These determinants include the factors or conditions in the places where people live, learn, work, and play. A focus on SSDoH requires a focus on improving the systems and deeply embedded structures that marginalize whole communities and regions, making it difficult to achieve good health for all.
Health and well-being for all Californians require a commitment to access to quality and affordable health care that is coordinated and no longer siloed and fragmented as health care has typically been delivered in the U.S. California has made important strides in incorporating improving health care coverage, access, quality, and care integration, and is beginning to bring innovative local solutions to an SSDoH-oriented system of health care. For all Californians to thrive requires moving beyond treating sickness and towards treating the SSDoH through an integrated health system that also tackles social and structural barriers and needs for all.
The health system is the way in which populations or individuals obtain access to health care, thus making it an intermediary determinant of health. The structural determinants – which are the hardest to change – have shown to be the most vexing for improving population health equity, that everyone has an opportunity to be as healthy as possible. These structural determinants are what make achieving health equity so difficult. The purpose of this report is to describe the many ways in which California has made strides in laying the groundwork for achieving health equity through the establishment of policies and laws that either target the structural determinants directly or indirectly by changing intermediary determinants of health. Addressing social determinants of health is critical to move beyond reactionary systems that result in costly and inefficient approaches to care and towards mitigating and preventing the

3
production of inequities in health. Achieving health equity through universal effective coverage requires consideration of not only insurance and access to care, but the specific needs for an aging population, communities of color, immigrant communities, mental health, children’s programs, environmental impacts, and effective and integrated systems of care providers.
In this chapter, we examine two overarching questions: what is the current state of health and well-being in California and what progress has California made in achieving providing health care to its residents in a way that all people have reasonably equal access to covered services? With this, can the state strive towards ensuring population “health equity” – that everyone has a fair and just opportunity to be as healthy as possible? To answer these questions, we focus on the following topic areas of health and wellness in California: (1) regional and community level inequities, (2) protecting the health of the young and the old, (3) preventing and managing chronic conditions and mental health/substance use and (4) the health care system and financing.
Facts
California is one of the country’s most racially and ethnically diverse states. The demographic makeup is 39.4 percent Latinx, 36.3 percent white, 14.6 percent Asian, 5.5 percent African American, 0.4 percent American Indian/Alaska Native (AIAN), and 0.4 percent Native Hawaiian and Pacific Islander (NHPI). California has more immigrants than any other state. In 2021, California was home to almost 11 million immigrants, about a quarter of the foreign-born population nationwide. Black, Latinx, Asian, AIAN and NHPI populations face inequities in overall health outcomes, health care access, and quality of care. These disparities are linked to several social determinants of health including education, housing, income, incarceration as well as historical and current experiences of racism and discrimination. California has instituted several policies to expand health coverage for most Californians, improve language access in health care delivery, and establish funding and government entities dedicated to health equity to reduce health disparities.
The health and well-being of all Californians, from children and adolescents to older adults, is influenced by the high cost of living, poverty, uneven access to care and services, and disproportionate exposures to threats to health including environmental pollution. In the face of California’s uncertain future regarding extreme climate events, water shortages, and funding for health care, there will be an undue burden on communities and entire regions of the state that have been historically marginalized and made vulnerable to the threats to health. The current trends point to an Increasing prevalence of chronic conditions and disability among children and adolescents that carry on into adulthood, such as overweight/obesity and diabetes. Prevalence of mental health disorders like depression and anxiety has also been increasing and most apparent among populations of color and young adults. (Moore, 2018;

4
Weiner, 2019b). One in three adolescents reported serious psychological distress and one in seven reported moderate psychological distress.
Lack of care coordination and a fragmentation of care is a major threat to a functioning health care system for the state. There is considerable regional variation in access to care and the workforce supply, putting some regions and communities in much more precarious positions than others. The silos in the delivery of healthcare in the current healthcare system, is largely attributable to funding siloes for healthcare with funding streams coming from federal, state and private funds. While there have been some innovations in better care coordination and programs on SSDoH, the state does not currently have a coordinated approach.
California’s older adult population (ages 65+) will grow from 6 million to 9 million within the decade. Seniors with disabilities or who have limitations in activities of daily living will grow from 1 million in 2015 to 2.6 million by 2060. California’s Master Plan for Aging provides a compelling policy framework for addressing the needs of California’s older adult population, but gaps remain especially for addressing challenges in long term care services.
Origins
In the U.S., the Affordable Care Act (ACA) in 2010 was a major policy shift for the U.S. to expand health care coverage. The ACA offered states the opportunity to expand public and private health care coverage through the use of premium subsidies for private coverage purchased in a health insurance exchange, an individual health insurance mandate, and the option to expand Medicaid. As of 2021, 39 states (including Washington, D.C.) chose to expand Medicaid. California was among the first to adopt and implement expansion. Many of California’s key policy decisions to improve health care delivery have happened after the ACA. Though numerous attempts at introducing a single-payer system have failed, they are notable for the fact that it has been an issue that policymakers have thought about and grappled with. To improve access to care for all, California took steps to implement immigrant-inclusive laws and policies – from education, employment, to health care - despite efforts of the federal government to exclude immigrants as well as legislative solutions stalling in the U.S. Congress. The pro-immigrant policies create an environment that not only offers opportunities for immigrants to participate in health insurance programs, but one that supports the inclusion of immigrants in society as a whole (Wallace, Young, Rodríguez, & Brindis, 2018). While many of the policy actions on health have focused on coverage expansion, there are examples of others that attempt to achieve SSDoH-focused health and well-being in the state as seen with its Master Plan for Aging introduced in 2019.
● California became the fifth state to expand health insurance coverage to all children in 2015 when Governor Brown signed into law SB 4, the Health for All Kids Act. California joined the small group of states that had already expanded coverage to all children
5
regardless of the immigration status of the child—Washington, New York, Massachusetts, Illinois, and the District of Columbia.
● With SB 75 (Full Scope Medi-Cal for All Children) in place, starting May 2016, children under nineteen years of age are eligible for full-scope Medi-Cal benefits regardless of immigration status, as long as they meet all other income eligibility requirements (Welfare and Institutions Code section 14007.8).
● In 2019, Medi-Cal was expanded to adults under twenty-six years of age starting in 2020 via the Young Adult Expansion, modeled after SB 75, which also amends the California Welfare and Institutions Code 14007.8.
● Most recently, in 2021, Medi-Cal was expanded to all eligible adults ages 50 and over regardless of immigrant status.
● California has recently attempted large scale policy making to integrate SDOH with clinical care as exemplified in its Master Plan for Aging. Governor Gavin Newsom implemented the California Master Plan for Aging by executive order in 2019 establishing a 10-year plan to address a broad spectrum of aging population needs. The Master Plan outlines five goals, which includes housing for all ages, tackling issues in caregiving, improving quality of life as we age, enabling seniors to afford retirement, and making prescription medication more affordable and addressing care services for Californians with Alzheimer’s and Dementia.
Trends
Changing attitudes about health – The public has become more open to the idea of expanded health coverage for all and the role the government might have in a health care system that offers health coverage for everyone. According to Kaiser Family Foundation, which has been tracking public opinion around healthcare coverage: most (74%) support the federal government doing more to provide health insurance (Jan 2019) and a majority (between 53 and 56%) favor having a national health plan like Medicare-for-All (most recent poll, Oct. 2020). Surveys by the Pew Research Center and Gallup found Americans felt it is the federal government’s responsibility to make sure all Americans have health coverage (August 2020). Stigma around mental illness has improved over time and people are generally more open to the idea that good health is not simply having access to clinical care but rather having access to opportunities to thrive and live and work in places that are not polluted, safe, and with access to green space and nutritious foods (in other words, people have become more open to a broader definition of health that includes the social determinants of health).
Costs of healthcare and budgets expand – Healthcare in the U.S. is expensive relative to the size of its economy. The U.S. spends a much greater amount on healthcare per capita than other countries. There is deep concern that the cost of healthcare is to become unsustainable if

6
trends continue. The healthcare budget in California has been growing larger each year and is tied closely to the overall economy, both at the state and federal level. When financially strained, California has made major cuts and limits to public healthcare benefits, as seen during the Great Recession and threatened early on in the COVID-19 pandemic. Financial pressures also lead employers to begin to shift towards offering high deductible plans, putting a high burden on individuals and families to pay for healthcare.
Seeking technological solutions – Technology and innovation may provide numerous opportunities to improve connectedness of patients with providers and treatment through the growth and development of telehealth and data-sharing platforms. California has seen an increased use of and reimbursement for telehealth services, which has uncovered the need for a more integrated Wi-Fi network across California, especially in rural communities. Technology offers the opportunity of reaching patients through telehealth and a variety of digital interventions, and targeting testing and treatment through precision medicine, particularly in California as it is home to numerous technology companies and start-ups working on health solutions. Apart from the connectedness of providers with patients, better technology or data platforms offer the opportunity of systems to communicate with each other (interoperability) to improve care delivery and integration of clinical care with social determinants of health. Technology may have the potential to improve access to care for all, but has also the threat of increasing disparities in access by creating a larger digital divide and may deepen racial hierarchies.
Innovations in SSDoH – There are growing movements around the world to transform cities into places that support resilience and wellness so that all can thrive, for which California can look to for solutions. Solutions require bringing together decision-makers, organizations, and agencies from across a range of sectors that impact health and well-being, such as health departments, housing, parks and recreation, education, and stakeholder groups. California has made some recent investments in housing initiatives and localities have made commitments to solutions around racial equity, children’s health, and the environment. A variety of actors, including government, foundations, and nonprofits are funding community development and place-based initiatives. Health insurers are also researching and spending energy on figuring out how to link to housing and food insecurity interventions.
Tackling regional disparities and injustice as the climate changes – Away from inner city urban core regions, rural parts of the state are disproportionately impacted by pollution and lack of infrastructure for health and wellness. For example, the Central Valley, home to many of California’s immigrant communities and other communities of color, continues to be one of the most polluted regions in the U.S, putting farm workers in the state at risk of exposure to contaminants and extreme heat. Climate change will only worsen the situation as the severity and frequency of extreme weather conditions increases. Similarly, the health burden suffered

7
by communities near ports and in communities where industries have polluted and continue to pollute remain high in California. These facts have not changed despite all the action and attention put on the climate and environment in California.

8
Glossary of Key Terms Used in Facts-Origins-Trends Report Term Definition
Accountable Communities for Health (ACH)
An ACH is integrated health care with public health and social services. The organization works with the community where stakeholders form a coalition to focus on multiple determinants of health.
Accountable Care Organization (ACO)
Accountable Care Organizations are groups of doctors, hospitals, and other providers who work together as a network to provide coordinated care to their patients.
Affordable Care Act (ACA) The Affordable Care Act of 2010 was a comprehensive health reform law that mainly expanded the Medicaid program and created affordable insurance options to households that did not qualify for Medicaid.
American Indian or Alaska Native (AIAN)
AIAN refers to a person having origins in any of the original peoples of North, Central, and South America and who maintains tribal affiliation or community attachment.
Asian American Racial group defined as people having origins in East Asia, Southeast Asia, or the Indian subcontinent.
Black or African American Racial group defined as people having origins in any of the Black racial groups of Africa.
CalFresh CalFresh, known federally as the Supplemental Nutrition Assistance Program (SNAP) (formerly known as food stamps), is a program that provides federally funded benefits to help households with low income purchase the food they need to support good health.
Cap and trade Emissions trading program, which is a market-based approach to controlling pollution by providing economic incentives for reducing the emissions of pollutants.
Chronic condition A chronic illness is one that lasts one year or more and requires ongoing medical care or limits daily activities.
Community based organization (CBO)
A public or private nonprofit organization of demonstrated effectiveness that is representative of a community or significant segments of a community; and provides educational or related services to individuals in the community.
Compact of Free Association (COFA)
An agreement which established the relationship between the U.S. and the Federated States of Micronesia, the Republic of the Marshall Islands, and the Republic of Palau. Under COFA, residents are considered not U.S. citizens or nationals, but may live, work, study in the U.S. with unlimited length of stay.
Covered California California’s state health insurance marketplace for individuals and families to purchase health insurance, established under the ACA.
Diabetes Prevention Program (DPP)
A lifestyle change program designed to assist in preventing and delaying the onset of type 2 diabetes.

9
Diversity Index (DI) A tool used by the U.S. Census Bureau to measure the probability that two people chosen at random will be from different racial and ethnic groups.
Downstream determinants of health
Factors that are temporally and spatially close to health effects, but are influenced by upstream factors (see definition for upstream).
Employer Sponsored Insurance (ESI)
Health insurance obtained through employment benefits.
Environmental justice Fairness in the development of laws and regulations that affect every community’s natural surroundings and the places people live, work, play and learn.
Food insecurity Limited or uncertain access to adequate food for all people in the household.
Health disparities When one or more health outcomes are seen to a greater or lesser extent between populations (by race or ethnicity, sex, sexual identity, age, disability, socioeconomic status, geographic location, etc.).
Health care premium The amount an individual or household pays for health insurance every month.
Healthy Places Index (HPI) A tool developed by the Public Health Alliance of Southern California to measure local factors that predict life expectancy and compare community conditions across the state.
Immigration and Customs Enforcement (ICE)
Founded in 2003, the U.S. Immigration and Customs Enforcement is a federal law enforcement agency under the Department of Homeland Security.
Individual market Health insurance purchased directly by an individual or family, as opposed to obtaining it through an employer (see ESI) or from a public program (see Medicare, Medicaid). In California, health insurance may be purchased by individuals either through Covered California (or “marketplace”), or directly from an insurer “off-exchange.”
Intersectionality The idea that “race, class, gender, sexuality, ethnicity, nation, ability, and age operate not as unitary, mutually exclusive entities, but rather as reciprocally constructing phenomena.” For example, the experience of a black woman is not additive (black+woman), rather multiple, interlocking systems and structures interact to inform their experiences.
Latino (Latinx) or Hispanic Ethnicity referring to a person of Cuban, Mexican, Puerto Rican, South or Central American, or other Spanish culture or origin regardless of race. Latinx is gender neutral.
Managed Care Organization (MCO)
Health care delivery system organized to manage cost, utilization and quality for its enrollees.

10
Marginalized identities1 Those who experience patterns of social and political inequality via membership in a group that is assigned negative meanings by the broader society or the dominant culture.
Medicaid Federal health insurance for people with low income, administered by states (i.e., federal-state partnership).
Medi-Cal California’s Medicaid program provides health care coverage to adults, families, older adults, and people with disabilities who meet the income requirements.
Medicaid 1115 Demonstration Waivers
Section 1115 of the U.S. Social Security Act gives the Secretary of Health and Human Services authority to approve experimental, pilot, or demonstration projects that are found by the Secretary to be likely to assist in promoting the objectives of the Medicaid program.
Medicare Federal health insurance for people 65 years or older and for those who have disabilities or End-Stage Renal Disease. Medicare Part A = hospital insurance; Medicare Part B = medical insurance; Medicare Part D = prescription drug coverage
Native Hawaiians and Pacific Islanders (NHPIs)
NHPI refers to a person having origins in any of the original peoples of Hawai’i, Guam, Samoa or other Pacific Islands.
Public charge Defined by the U.S. government as someone “primarily dependent on the government for subsistence,” as demonstrated by either (a) using public cash assistance for income maintenance or (b) institutionalization for long-term care at government expense.
Racial justice Systematic fair treatment of people of all races that results in equitable opportunities and outcomes for everyone.
Social and Structural Determinants of Health (SSDoH)
Conditions in the places where people live, learn, work, and play that affect a wide range of health and quality of life risks and outcomes.
Special Supplemental Nutrition Program for Women, Infants, and Children (WIC)
WIC provides federal grants to states for supplemental foods, health care referrals, and nutrition education for low-income pregnant, breastfeeding, and non-breastfeeding postpartum women, and to infants and children up to age five who are found to be at nutritional risk.
Single payer The presence of a single government-operated insurance plan. This term is often used loosely to refer to different models of single payer, for example the British National Health Service (NHS) in which the government owns most hospitals and employs health care providers to the Canadian national health insurance were all residents receive coverage from government plan but are able to obtain private policies for supplemental services.
1 Williams, M. S. (1998). Voice, trust, and memory: Marginalized groups and the failings of liberal representation. Princeton University Press.

11
Supplemental Nutrition Assistance Program (SNAP)
Federal nutrition assistance program that provides benefits to supplement the food budgets of households with low income to help individuals and families purchase the food they need and want to support good health.
Supplemental Poverty Measure
The supplemental poverty measure differs from the official poverty measure in a few important ways: clothing, shelter and utilities as well as food are considered necessary expenses and the poverty thresholds are adjusted for geographic differences in cost of living.
Universal effective coverage
That everyone (no one excluded) has access to good quality and affordable health care.
Upstream determinants of health
Fundamental causes that lead to (often temporally and spatially distant) health effects through downstream factors. Upstream factors include social disadvantage, risk exposure, and social inequities.
White (race) Socially constructed racial category that has included/excluded different groups over the years. Currently, Census defines white as “A person having origins in any of the original peoples of Europe, the Middle East, or North Africa.” However, there is advocacy for Middle Eastern and North African individuals to be separately categorized.
Whole Person Care Coordination of health, behavioral health, and social services in a patient-centered manner with the goals of improved health and well-being.

12
Introduction In 1985, Secretary of Health and Human Services’ Margaret M. Heckler’s landmark report on Black and Minority Health brought to light the appalling degree to which outcomes can vary by race/ethnicity – that life expectancy among Blacks was nearly six years less than that of whites and that infant mortality was nearly double for Blacks compared to whites (Heckler 1985). But, in the 30 years since the drafting of that milestone report, the needle on improving these outcomes has scarcely moved (Henning-Smith et al. 2019; Petersen et al. 2019). Health researchers, policymakers, and practitioners are reckoning with how an elaborate and expensive healthcare system plus years of research on health disparities have not only failed to achieve equity but have in fact aided in preserving systems rooted in systemic and deeply embedded structures that marginalize whole communities and regions, making it difficult to achieve good health for all (Hardeman and Karbeah 2020; (Bailey et al., 2017; Krieger, 2020; Wright, Jarvis, Pachter, & Walker-Harding, 2020; Yearby, 2020; Zavala et al., 2020).
For Californian policymakers, these issues have been top of mind for a number of decades as the state has often been the first of all other states to create policies and programs that purposely aim to reduce disparities and support the notion that the structural systems in which we all live contribute to health and well-being. Californians have tended to support this thinking as evidenced by the propositions and legislators they have voted for. This is a dramatic shift in thinking since California’s proposition 187 in 1994 that would have prohibited non-emergency health care, public education, and the use of other public services by immigrants who were not legal residents of the U.S. (note: the proposition was struck down by a U.S. District Court judge as unconstitutional). Californians have since voted for legislators and governors who have expanded benefits to all Californians regardless of immigration status. California’s 2022 budget will include state-funded health insurance, Medi-Cal, for low-income residents over the age of 50 years old regardless of immigration status, free preschool for all four-year-olds, and free lunch for all public school students, among other expanded benefits.
While California has come close to more sweeping changes to healthcare delivery – with, for example, proposals for single-payer health care – it has never been able to introduce a system that offers health coverage for all, nor one that integrates clinical care with social needs and all other dimensions of health and wellness. The state has not yet come close to introducing a transformative system that actually addresses the larger structural determinants of health that lead to poor health and well-being.
Americans in general have become more open to the idea of expanded health coverage for all and the role the government might have in a healthcare system that offers health coverage for everyone. According to Kaiser Family Foundation, which has been tracking public opinion around health care coverage: most (74%) support the federal government doing more to

13
provide health insurance (Jan. 2019) and a majority (between 53 and 56%) favor having a national health plan like Medicare-for-All (most recent: Oct. 2020). Surveys by the Pew Research Center and Gallup found Americans felt it is the federal government’s responsibility to make sure all Americans have health coverage (August 2020). With support from Californians and lawmakers, it is not inconceivable that the state might move toward a system of universal coverage.
A critical driver of equitable health and wellness will be an integrated system that not only delivers care but addresses social and structural determinants of health (SSDoH). SSDoH are “the conditions in which people are born, grow, work, live and age and the wider set of forces and systems shaping the conditions of daily life” (World Health Organization). Research from the past 30 years establish SSDoHs as important upstream predictors of health outcomes (P. Braveman, Egerter, & Williams, 2011; Galea, Tracy, Hoggatt, Dimaggio, & Karpati, 2011). Addressing SSDoH is critical to move beyond reactionary systems that result in costly and inefficient approaches to care and towards mitigating and preventing the production of inequities in health. Achieving health equity through universal effective coverage requires consideration of not only insurance and access to care, but the specific needs for an aging population, communities of color, immigrant communities, mental health, children’s programs, environmental impacts, and effective and integrated systems of care providers. The ultimate goal of population health is to maintain and improve the health of the entire population and to reduce inequalities in health outcomes between population groups (Kindig and Stoddart 2003).
The COVID-19 pandemic exposed much of what we already knew about the existence of dramatic inequities in access to care, utilization, and treatment across populations. It demonstrated that both the U.S.’ and California’s public health systems have limited capacity to develop, vet, and scale effective risk communications strategies during a healthcare crisis. It showed us that, as a country, we generally lack data exchange infrastructure for effective surveillance, health assessment, and evaluation, especially as it relates to the connectivity between health systems and social services. These gaps are opportunities to improve–not only our response to future pandemics and other health crises and natural disasters–but for a better functioning integrated system of health and wellness.
In this report, the UCLA Center for Health Policy Research (CHPR) team examines two overarching questions: what is the current state of health and well-being in California and what progress has California made in achieving providing health care to its residents in a way that all people have reasonably equal access to covered services? With this, can the state strive towards ensuring population “health equity” – that everyone has a fair and just opportunity to be as healthy as possible? To answer these questions, we focus on the following topic areas of health and wellness in California: (1) regional- and community-level inequities, (2) protecting

14
the health of the young and the old, 3) preventing and managing chronic conditions and mental health/substance use and (4) strengthening health systems and health financing.
Methods CHPR’s approach to the Facts-Origins-Trends report involved two internal teams, the Writing Team and Expert Contributors, who collaborated with our external Community Advisors to generate evidence to populate the Facts-Origins-Trends report on seven topic areas of health and wellness. The Community Advisors ensured inclusion of a range of perspectives, including the voices of marginalized populations. The Writing Team worked with Expert Contributors and met on an ongoing basis to collaborate on the generation of facts and literature searches. The internal Writing Team and Expert Contributors communicated closely with external Community Advisors and Senior Reviewers through written correspondences and a virtual convening to gather pieces of evidence and feedback on facts, origins, and trends of health and wellness in the seven topic areas. In compiling and collating the evidence used to generate facts, origins, and trends for each of the topic areas, we conducted data analyses from the California Health Interview Survey (CHIS), 2001-2019 for each topic area. Guided by the Expert Contributors, we conducted narrative synthesis reviews to obtain input for origins and key policies in California. As part of this review, we included peer-reviewed literature and non-peer reviewed sources. For the peer-reviewed literature, we searched for articles in English published indexed in PubMed, Cochrane Library, and the Web of Sciences. From these U.S.-based studies, we looked for articles more specifically related to California as well as for comparison states or jurisdictions as directed by our contributors and advisors for each topic area. For non-peer reviewed material, such as reports by governmental and non-governmental sources, we used Google and Google News Archive. The Writing Team synthesized this information to develop a final report, which was reviewed by Community Advisors and Senior Reviewers.
Conceptual Framework We begin by grounding our work using a conceptual framework put forth by the World Health Organization (WHO) on how SSDoH interact with health systems in the production of equity in health and well-being. In this framework (Figure 1), the socioeconomic and political context are the key elements that determine an individual or a whole population’s position in society, opportunities, and pathways to mobility – these make up the social and structural determinants of health. The health system is the way in which populations or individuals obtain access to health care, thus making it an intermediary determinant of health. The structural determinants – which are the hardest to change – have shown to be the most vexing for improving population health equity, that everyone has an opportunity to be as healthy as possible. These structural determinants are what make achieving health equity so difficult.

15
Figure 1. World Health Organization’s Social Determinants of Health Framework
Source: Solar and Irwin, 2010
The purpose of this report is to describe the many ways in which California has made strides in laying the groundwork for achieving health equity through the establishment of policies and laws that either target the social and structural determinants directly or indirectly by changing intermediary determinants of health. Addressing SSDoH is critical to move beyond reactionary systems that result in costly and inefficient approaches to care and towards mitigating and preventing the production of inequities in health. Achieving health equity through universal effective coverage requires consideration of not only insurance and access to care, but the specific needs for an aging population, communities of color, immigrant communities, mental health, children’s programs, environmental impacts, and effective and integrated systems of care providers.
In highly cited work published for the County Health Rankings, clinical care has been estimated to contribute to only about twenty percent of health, as opposed to social and economic factors that contribute to about forty percent of health outcomes (Figure 2). With this in mind, a paradigm shift has been called on to incorporate often neglected social, economic, and physical environment factors into health care delivery.

16
Figure 2. Contribution of physical environment, social and economic factors, clinical care, and health behaviors on health
Source: County Health Rankings, 2014
The State of Health and Wellness in California There are a number of facts that make it difficult to argue that the healthcare system in the U.S. is functioning effectively and providing the health care for all that live in the country: there are

17
marked socioeconomic and health disparities between population groups that have not improved over the years and appear to have gotten worse as evidenced by the COVID-19 pandemic (Chu, Tsoh, Ong, & Ponce, 2021; Fang et al., 2021; J. Geyman, 2021; J. P. Geyman, 2021; Mude, Oguoma, Nyanhanda, Mwanri, & Njue, 2021; Polyakova et al., 2021; A. C. Stokes et al., 2021; Xu et al., 2021; Zelner et al., 2021). The U.S. healthcare system is the most expensive in the world (Global Burden of Disease Health Financing Collaborator Network, 2019) yet life expectancy in the U.S. continues to be shorter and health outcomes are generally worse than other comparable countries (Woolf & Schoomaker, 2019). Despite efforts to improve healthcare coverage, there are still many people – about 30 million – who remain without health insurance coverage, and the population largely suffers from chronic conditions, many of which are preventable. The U.S. is the only wealthy, industrialized country that has not achieved universal health coverage (Crowley, Daniel, Cooney, & Engel, 2020). More is needed to address the SSDoH and the systemic problems that have brought upon further marginalization of populations in the U.S. that have the highest burdens of disease (Bailey, Feldman, & Bassett, 2021).
There are fierce debates on how a multipayer health system, such as the one that has developed in the U.S. over many decades, could possibly turn into a single-payer system and whether such a transformation would compromise quality of care (Cai et al., 2020; Crowley et al., 2020; Galvani, Parpia, Foster, Singer, & Fitzpatrick, 2020; J. P. Geyman, 2021; Himmelstein & Woolhandler, 2020). These debates will likely continue; however, there is significant urgency to solve these challenges, given the costs of health care as a top-of-mind worry among households in the U.S. and in California. Yet, beyond considerations of cost and coverage, California’s healthcare system has been put on notice due to its failure to deliver equitable care to its diverse populations.
This Facts, Origins and Trends report begins with introducing regional- and community-level inequities, then provides a landscape of health and health care for the young and old segments of California. We then describe key challenges in preventing and managing chronic conditions, mental health, and substance use problems confronting Californians and conclude with the description of our system of healthcare delivery and health financing that would serve to address these challenges.
Regional and Community Level Inequities
Racial Justice Facts
California is one of the most racially/ethnically diverse states. Almost 65 percent of California’s 2020 population are people of color, compared to 40 percent nationally (National Equity Atlas).

18
California’s population is 39.4 percent Latinx, 36.3 percent white, 14.6 percent Asian, 5.5 percent African American, 0.4 percent American Indian and Alaska Native (AIAN), and 0.4 percent Native Hawaiian and Pacific Islander (NHPI) (American Community Survey).
California also ranks the highest in linguistic diversity compared to other states. Data on the state’s language diversity shows that 44.5 percent of residents speak a language other than English, which is higher than the national average of 22 percent. Spanish is the most common language spoken at home other than English and 28.8 percent of all Californians are native Spanish speakers. Chinese and Tagalog are the next most common languages in California with 3.4 percent and 2.2 percent of speakers, respectively. Rural counties have a greater number of Spanish-only or English and Spanish-speaking households compared to urban counties; in contrast, there are more Chinese- and Vietnamese-speaking households in urban than rural regions (2020 CHIS). Data on Limited English Proficiency (LEP) in California shows that over one-third of all Asian Americans and Pacific Islanders (AAPI) in California have LEP. LEP varies among AAPI subgroups: Vietnamese (50%), Korean (46%), Indian (20%), and NHPI (15%) (AAPI Data).
There are clear health disparities by race and ethnicity in California. Health outcomes, health care access, and quality of care for minority populations are related to racism and discrimination. One national study shows that of U.S. adults who experienced racism in the healthcare system, racial/ethnic discrimination was the most frequently reported. Among California’s Asian, Black, AIAN, NHPI and Latinx adults, 2.7 percent report being treated unfairly because of race/ethnicity due to the COVID-19 pandemic. Of this data, Black (6.4%) and Asian (4.2%) populations were more likely to report unfair treatment (2020 CHIS).
The following are additional racial and ethnic disparities in health:
● Black and Native American populations have higher age-adjusted death rates per 100,000 compared to the state’s average of 618.7, at 865.4 and 766.7 respectively. Latinx had a death rate of 521.8 and Asian/Pacific Islanders at 402.8 (California Health Care Almanac).
● Almost two-thirds of all Black Americans have asthma (63%) (2020 CHIS).
● Latinx and Black populations have higher rates of those ever diagnosed with diabetes than the state’s average at 12.9 percent and 15.6 percent compared to 10.9 percent (2020 CHIS).
● AIANs have the highest rate of high blood pressure of all racial and ethnic populations at 44.2 percent (2020 CHIS). Nearly 38 percent of Black Americans and 21.4 percent for Asian and Latinx populations report having or have had high blood pressure in 2020 (2020 CHIS).

19
● Black Americans have the highest rates of new cases of prostate, lung, and colorectal cancers. Latinx have the highest rate of new cases of cervical cancer of all other racial groups (California Health Care Almanac).
● Even though whites have the highest rates of new cases of breast cancer, Black Americans have the highest breast cancer mortality rate at 31.7 deaths per 100,000 compared to whites at 20.2 deaths (California Health Care Almanac).
● Life expectancy in the state also varies by race/ethnicity: Asian and Latinx populations have higher life expectancies at 86.3 and 83.2 respectively, and Black and Native American communities with lower life expectancies of 75.1 years and 80.2 years (California Health Care Almanac).
Issues in health care access also disproportionately affects communities that have been historically marginalized. The rates of uninsured for racial and ethnic minorities are higher than their white counterparts: Latinx (13.7%), African American (6.4%), Asian American & NHPI (6.1%) compared to whites (5.3%) (Becker, Babey, & Charles, 2019). Among Latinx, uninsured rates are even higher for non-citizens and those with LEP, lower educational attainment, and low income (Becker, Babey, & Charles, 2019). Nearly 8 percent of Black, 7.4 percent AIAN, 7.1 percent Asian, and 6.9 percent Latinx populations report difficulty finding or accessing primary care (CHIS). 52.9 percent of Latinx report delaying care due to cost or a lack of insurance, compared to 42.1 percent of whites, 35.3 percent of Asians, 26.6 percent of Black Americans (2018 CHIS).
There are also racial disparities in California’s healthcare workforce which may have implications for the provision of culturally and linguistically competent care, not only in medical care but also in mental health. Latinx make up 39 percent of the state’s population but only 6 percent of active physicians. Similarly, African Americans represent only 3 percent of active Medical Doctors (MDs), but are 6 percent of the total population. Asians and Pacific Islanders make up 32 percent of Active Patient Care MDs and are 15 percent of the total California population (California Health Care Foundation). Over 20 percent of all of California’s registered nurses are Filipino, 11 percent are Asian, 10 percent are Latinx, 5 percent are Black, 1 percent are NHPI and >1 percent are AIAN (California Health Care Foundation).
In measuring racial disparities across the distribution of health care expenditures: Black-white and Hispanic-white disparities diminish in the upper quantiles of expenditure, but expenditures for Black and Hispanic remain significantly lower than for whites throughout the distribution (Cook & Manning, 2009).
Homelessness
20
According to the U.S. Interagency Council on Homelessness, California has both the largest number and highest proportion of people experiencing homelessness in the country. California has almost double the number of homeless individuals as New York, which has the second largest homeless population.
Nationwide, 55 Black people experience homelessness out of every 10,000 but in California that rate is 194 out of every 10,000. Most Asians experiencing homeless (76%) live in just five states, including California. NHPIs are nine times as likely to experience homelessness as the general U.S. population, and 25% of all NHPIs live in California.
Social and Structural Determinants of Health
Many health disparities by race and ethnicity are driven by SSDoH. The California Healthy Places Index (HPI) is one tool to measure community conditions that influence health, but may not fully capture the disparities of smaller communities. The SSDoH discussed below are not exhaustive but highlight a few examples of how these factors may contribute to health disparities.
Food insecurity: Even though California produces almost half of the U.S’ fruits and vegetables, 35.8 percent of Californians are unable to afford enough food (2020 CHIS). Food insecurity rates are higher among Black and Latinx communities at 50.4 percent and 37.4 percent (2020 CHIS).
Penal system: On average, California prisons are 30 percent over capacity and there are significant racial inequities among incarcerated populations (Vera Institute of Justice). African Americans make up only 6 percent of CA residents but make up 20 percent of the incarcerated population (with Latinx at 38 percent and 41 percent, respectively) (Vera Inst. Of Justice). Black incarceration rates have increased 260 percent since 1978. Native Americans are incarcerated at 3.7 times the rate of white people. For Southeast Asian Communities, Cambodian and Laotian youth are incarcerated at 4 and 9 times the rate expected by their population proportions.
Discrimination and safety: Safety and discrimination are also important SSDoH that have impacted communities of color disproportionately. Most notably, hate crime events against racial and ethnic minorities have increased during the onset of the pandemic. Between March 2020 to June 2021, 39 percent of anti-AAPI hate incidents reported nationally to Stop AAPI Hate occurred in California— more than any other state (Stop AAPI Hate). In California, Anti-Asian hate crimes saw a 107 percent increase in 2020. The California Health Interview Survey’s 2020 Preliminary COVID-19 Estimates show that 6.8 percent of AA/NHPI adults reported a hate incident directly due to COVID-19 over the last year. Of those, 63.7 percent reported verbal abuse and attack, and 22.4 percent reported cyberbullying. From 2019 to 2020 there was an

21
87.7 percent increase in anti-Black hate crime events and 38.2 percent increase in anti-Latinx events.
Economic resources: Income and poverty also impact health. California’s poverty status shows Black Americans, AIANs, and Latinx having the highest percentages of people living below poverty level (19%, 17.8%, and 15%). Nearly 11 percent of NHPIs and 9 percent of Asians live below the poverty level in California (U.S. Census Bureau). Racial and economic gaps are also wide and persistent when examining the state’s median hourly wage from 1980 to 2017: the median wage for workers of color is $11 less than the median wage for white workers (National Equity Atlas). These issues compound for women of color and vary widely by ethnicity (Center for American Progress).
Educational opportunities: Education is strongly linked with health outcomes, health behaviors and health beliefs. People with more education experience lower levels of morbidity, mortality, and disability. Demographics of California’s educational attainment show that Latinx and AIAN have the lowest numbers of high school graduates or higher (66.4% and 78.4%). At least 90.5 percent of Black, 88.5 percent Asian, and 86.5 percent NHPI populations have at least a high school education (U.S. Census Bureau); however, when we look at subgroup communities within these umbrella racial/ethnic groups, there are still disparities (See “State of Higher Education” reports for different communities).
Marginalized Identities
Along with the social determinants of health, structural determinants of health such as governing, social or economic policies affect how and whether resources for health are distributed unjustly on the basis of race, gender, sexual identity, ability or disability or other socially defined groups of people. For example, LGBTQ+ communities have higher rates of mental health needs and utilization than the general population and bisexual adults have the highest rates of disability of all sexual orientations—in part due to chronic stress from discrimination and stigma. For those who have multiple marginalized identities, these barriers may compound (Collins, 2002). For example, families of low-income children of color face labyrinth-like challenges in education and health systems to identify their children’s mental or physical health needs and then additional hurdles as they seek proper accommodations. This report is unable to explore the full complexity of assets and needs; however, we hope a social and structural determinants of health framework can help guide readers towards understanding that the current and future health and wellness of all Californians require thorough investigation of how systems—including but not limited to education, public safety, criminal justice, and immigration systems–impact population health outcomes.

22
Origins
Federal policies have played a key role in advancing racial justice, beginning with the passing of the 1964 Civil Rights Act, a landmark bill that forbade segregation and discrimination based on race, color, religion, sex or national origin. The bill was signed during the Civil Rights Movement which was led by African Americans to gain equal rights and social justice. Immigration reform came in 1965 with the Immigration and Nationality Act, which eliminated a quota system based on national origin and established policy aimed at reuniting families, attracting skilled labor, and supporting refugees of violence or unrest. The bill had an immediate impact and led to an influx of immigrants, changing the nation’s demographic landscape forever. Many immigrants settled in California creating diverse cultural enclaves. The 1965 U.S. Medicare and Medicaid Act provided health care coverage to people over 65+, with a disability, and those with very low income. Medicare was especially important because it forced hospitals to desegregate.
The 1980 Refugee Act amended the earlier Immigration and Nationality Act to raise the ceiling for the number of incoming refugees and create the country’s first formal refugee resettlement system. Southeast Asians from Cambodia, Laos, and Vietnam are the largest group of refugees to have ever resettled into the United States, most of whom live in California. In 1985, the US Secretary of Health and Human Services Black and Minority Health Report used racial and ethnic data to identify health disparities (N. A. Ponce, 2020). The report put minority health disparities on a national stage. The Personal Responsibility and Work Opportunity Reconciliation Act of 1996 commonly referred to as the Welfare Reform Act was a comprehensive bipartisan welfare reform plan that racialized the nation's welfare system. California’s key actions and policies have also transformed health and opportunity for racial and ethnic populations, arguably creating a more equitable landscape compared to other states. The following are historical events and policies that have made the state today: 1996 Proposition 209 prohibited state governmental institutions discriminating against, or
granting preferential treatment to, any individual or group on the basis of race, sex, color, ethnicity or national origin in the operation of public employment, public education or public contracting.
1999 Diasporic communities in California face language access issues that influence racial/ethnic disparities. In 1999, California’s Medicaid program, Medi-Cal, began requiring managed care plans to make interpreter services available around clock to address cultural competency issues in health care (Ko et al., 2018; N. A. Ponce, 2020).
23
2003 California’s Health Care Language Assistance Act, SB-853 required all health plans to collect data on beneficiaries’ race/ethnicity and language and assist people with limited English-proficiency. (N. A. Ponce, 2020)
2003 Publication of Institute of Medicine’s Unequal Treatment: Confronting Racial and Ethnic Disparities in Health Care. The Institute of Medicine’s Committee concluded that,
“(al)though myriad sources contribute to these [racial/ethnic] disparities, some evidence suggests that bias, prejudice, and stereotyping on the part of health care providers may contribute to differences in care” (Shimkhada, Scheitler, & Ponce, 2021).
2004 California’s Mental Health Services Act is passed and designed to transform the state’s behavioral health system to better serve individuals with, and at risk of serious mental health issues and their families. It includes community planning and stakeholder input processes to improve culturally and linguistically appropriate services and reduce health disparities among underserved communities in California.
2010 Affordable Care Act + Medicaid Expansion in 2013 increased health care coverage for millions of low income and marginalized communities who were previously uninsured. Expansion covered additional groups such as young adults.
2012 Establishment of California’s Office of Health Equity to promote equitable social, economic, and environmental conditions to achieve optimal health, mental health and well-being for all.
Trends The California population is increasingly diverse. The new 2020 Census’ findings show that California has one of the highest Diversity Index scores in the country. California’s diversity suggests the need for public health to develop consistent and useful approaches to racial and ethnic classifications in data systems, including data disaggregation to better understand racial and ethnic disparities (Mays, Ponce, Washington, & Cochran, 2003). Black, Asian, NHPI, AIAN and Latinx communities are not monolithic. It is important to highlight the disparities or invisibility of marginalized subgroups under each racial category to provide an accurate picture and equitable lens to health and wellness in California.
The AHEAD Act or AB 1726: Race/Ethnicity Data Collection in the Department of Public Health passed in 2016 and will require data collection and reporting of health data of more underrepresented AAPI subgroups beginning in July 2022. AB 1358, introduced in February 2021, and currently held under submission, would expand data disaggregation collection and reporting to Latinx, AIAN, Caribbean, Black, North African, and Middle Eastern populations.

24
COVID-19 pandemic disproportionately affects NHPIs, Latinx, African Americans, AIAN and Asian Americans, exacerbating and illuminating pre-existing health and access disparities by race and ethnicity (Chu, Tsoh, Ong, & Ponce 2021). Ongoing research shows people can experience long-term effects of COVID-19. As of July 2021, these effects, or “long COVID,” can be considered a disability under the Americans with Disabilities Act (Center for Disease Control and Prevention).
California is increasing access to healthcare for all (see section on Health Care Financing and Delivery). Areas of particular concern for racial justice: Health4All Movement: SB 10 ACA Coverage for Immigrants; SB 75: Health for All Children; Medi-Cal eligibility expansion to young adults up to the age of 26 (2020); Medi-Cal eligibility expansion to older adults 50+ (2022).
California’s healthcare reform through the expansion of the Affordable Care Act in 2014 led to a decline in the rates of uninsured from 17 percent to 7 percent. The expansion covered most low-income young adults (19-25) previously left behind by the ACA. Although the U.S.’ uninsured rate climbed in 2018, California’s coverage expansion maintained record-low uninsured rates.
The U.S. recently restored the federal share of Medicaid coverage for Compact of Free Association (COFA) Migrants, who are Pacific Islanders from the Federated States of Micronesia, The Republic of the Marshall Islands, and the Republic of Palau, in December 2020, which was eliminated by the 1996 Welfare Reform Act. Since Welfare Reform, California used state funds to provide health care access to COFA Migrants through Emergency Medi-Cal and Covered California.
California’s immigration laws are relatively pro-Immigrant compared to other states. SB 54: California Values Act/ CA Sanctuary Law ensures that no state and local resources are used to assist federal immigration enforcement. Newly proposed legislation continues to build upon the Values Act to end collaboration between prisons/jails and Immigration and Customs Enforcement (ICE). Research has shown adverse public health effects for individuals at every step of the criminal legal system, immigration system, and beyond. Pre-migration trauma, post-migration trauma, the trauma of incarceration and family separation, and the trauma of ICE transfers profoundly harm the health of refugees and immigrants people caught up in these systems.
The elements of SB 65, which aims to reduce Black maternal disparities, are included in the California Governor’s Budget Proposal. These components would include Medi-Cal coverage for doulas beginning in 2022, extending Medi-Cal postpartum coverage to 12 months, and a guaranteed minimum income pilot for low-income families.

25
To advance racial, social, economic and environmental justice, some California county public health departments established divisions dedicated to health equity and various cities (e.g., Richmond) have included mandatory environmental and optional health components to their general plans.
Furthermore:
● SB 17 seeks to establish an Office of Racial Equity and a Racial Equity Advisory and Accountability Council to analyze outcomes data to identify racial and ethnic disparities and inform the council which will make recommendations to the governor and Legislature to address structural racism in state policies and budgets.
● San Bernardino County is the first county in California and in the nation to adopt a resolution to declare racism as a public health crisis, spearheaded by Black activists and other racially and ethnically diverse community-based organizations.
Racial inequities in SSDoH and health lead to greater societal costs. Findings show that eliminating racial disparities in health leads to potential economic gains in the billions from increased productivity and employment, and lower state and federal prison costs (Altarum Solutions to Advance Health). Recently, state and federal investments towards health equity have increased as COVID-19 reveals deep health, social, and racial inequities. In July 2021, the state’s legislature and governor passed the Asian and Pacific Islander (API) Equity Budget, a three-year investment of $156.5 million in California’s API community to address anti-API hate and other longstanding racial inequities. Soon after, Assembly Bill 1038, introduced by Assembly member Mike Gipson, passed on August 16, 2021 to create a California Health Equity Fund accompanied by a one-time $180 million General Fund budget request. The bill would support community-based organizations, community clinics, tribal organizations and local health departments that serve underserved populations. Improving health equity for marginalized communities involves addressing SSDoH but it is important to note how racism still affects health outcomes even when SSDoH are controlled. Therefore, targeting racism to advance health and wellness is critical.

26
California’s Immigrants Facts California has more immigrants than any other state. California is home to almost 11 million immigrants, which is about a quarter of the foreign-born population in the U.S. Foreign-born immigrants represent a third or more of the population in five counties: Santa Clara (39%), San Mateo (35%), Los Angeles (34%), San Francisco (34%), and Alameda (33%). And, 50 percent of California’s children have at least one immigrant parent. The majority of California’s immigrants were born in Latin America (50%) or Asia (39%). More than half of California’s immigrants are naturalized U.S. Citizens, 25 percent have some other legal status (green card and visas), and 22 percent of them are undocumented.
Limited English language proficiency and low incomes are associated with limited access to care among immigrants (Garcia-Perez, 2016; Hall & Cuellar, 2016; Lu, Kaushal, Denier, & Wang, 2017; Munoz-Blanco, Raisanen, Donohue, & Boss, 2017; Ziol-Guest & Kalil, 2012). About 70 percent of immigrants in California report speaking English proficiently and 10 percent speak no English at all. Most immigrants speak a language other than English at home, with the most common being Spanish and Chinese Mandarin or Cantonese.
Immigrants in California tend to have fewer or similar numbers of doctor visits, emergency room visits, and preventive services use compared to U.S. citizens and other immigrant groups (Pourat, Wallace, Hadler, & Ponce, 2014). Immigrants tend to arrive in the United States when they are young and healthy. However, as they continue to work and grow older, there is an increasing need for care, treatment, preventive screening services, and emergency health care, especially given the risk stemming from poor living and work conditions (N. Ponce, Cochran, Mays, Chia, & Brown, 2008).
Evidence suggests that the immigrants provide a net benefit to California’s economy. For example, in 2010 undocumented workers contributed as much as $13 billion in payroll taxes to social security, but received only $1 billion in benefits (Gross et al., 2013). The financing of the healthcare system of California raises the question of whether immigrants are paying their share in health sector revenue financing. Immigrant-led households paid $88 billion in federal taxes and $43 billion in state and local taxes in 2019. Undocumented immigrants in California paid an estimated $4.5 billion in federal taxes and $2.5 billion in state and local taxes and California DACA recipients and DACA-eligible individuals paid an estimated $627 million in state and local taxes and $905 million in federal taxes in 2019.
The majority (89%) of low-income (below 138% FPL) undocumented immigrants in California are uninsured, and 7 percent had private insurance. In comparison, only 11 percent of

27
documented adults reported being uninsured and 21 percent had privately purchased insurance (Pourat & Martinez, 2019).
Among immigrants, there is variation by immigration histories, and immigration integration trajectories. The Affordable Care Act (ACA) has led to major gains in coverage for lawful permanent residents in California, similar in scope to changes among citizens. However, undocumented immigrants have experienced only modest increases in coverage, with the resulting disparity in uninsured rates for this group relative to citizens and permanent residents widening considerably since 2014 (Porteny, Ponce, Sommers 2020).
Immigrant Policies as Social and Structural Determinants of Health and Structural Racism
Wallace et al. 2019 describe a framework of how policy environments affect the context of settlement and incorporation of immigrants and how state level immigrant policies influence health (Wallace et al., 2018). This framework builds on earlier work by Rodriguez, Young, and Wallace (2015) on state policies that affect the health of undocumented immigrants and their families. Young and Wallace 2019 expanded this work to identify specific examples on how immigrant health is affected by variations in criminalization and integration policies across states (Young, Beltrán-Sánchez, & Wallace, 2020). Sudhinaraset et al. 2021 furthered this framework by establishing an association between state-level immigration policies and preterm births (Sudhinaraset et al., 2021).
Racialized legal status can affect health by structuring access to resources and facilitating discrimination. For example, exclusionary immigration policies, as a form of structural racism, have led to a sizeable undocumented population that is largely barred from access to resources in the United States, despite evidence of lower overall health care expenditures compared to U.S. citizens and other immigrant groups (Pourat et al., 2014). Pourat et. al.’s findings in California showed that undocumented immigrants have lower rates of hospitalization for non-childbirth-related reasons, fewer visits to physicians, lower likelihood of receiving blood pressure and cholesterol checks.
Long-term stressors in the immigrant experience lead to high incidences of mental health problems. Sudhinaraset, M. et. al call out constant intra-ethnic exploitation, reduced access to services, fears of deportation, and social isolation leading to high mental health services need. Long-term stressors play an integral role in the vicious cycle that perpetuates mistrust, isolation, and silence. Higher levels of acculturation led to a significant increase in discrimination’s association with mental illness. When all respondents were undocumented, psychological well-being was predicted almost exclusively by socioeconomic status. However, current psychological well-being is most strongly predicted by DACA status, underscoring the impact of immigration policies on mental health.

28
Successes/Opportunities
Access to Care and Linguistic Access: California has taken steps to implement inclusive laws and policies to extend health care and other services to immigrants. The pro-immigrant policies create an environment that not only offers opportunities for immigrants to participate in health insurance programs, but one that supports the inclusion of immigrants in society as a whole (Wallace et al., 2018). Two key examples of this include California’s expansive policies to extend and promote health care access to its population (Ko et al., 2018; Melnick, Fonkych, & Zwanziger, 2018; Weil, 2018) and its legislative action to improve linguistic access in healthcare settings. These are described in more detail under the Origins section below.
California helped form the basis for federal language access laws, including new requirements for language assistance services under the ACA with its 2003 California Senate Bill 853, the Health Care Language Assistance Act, which began requiring health plans to collect data on race, ethnicity and language to identify health disparities and to implement interventions including providing enrollees with interpreter services and translated materials (Ko et al., 2018). CBOs, doulas, and Community Health Workers (CHWs) provide culturally and linguistically competent care. California is seeking authorization from the Centers for Medicare & Medicaid Services in order for CHWs and doulas to be compensated for their work. (Washington Post)
Policies Supporting Educational and Economic Mobility: Apart from pro-immigrant actions to improve health access, California has also taken pro-immigrant legislative action to (1) expand access to higher education (e.g. The California Dream Act passed in 2011 allows undocumented students who attended high school in California to pay in-state tuition and be eligible for the state’s student financial aid programs), (2) advance protections for immigrant workers, (3) support immigrant students through partnerships with school districts, and (4) improve opportunities for economic mobility and inclusion through access to drivers licenses, and a number of other actions such as pro bono immigration services, protections from hate crimes, and the removal of the term “alien” to describe non-citizens in California State code. Creating an environment of inclusion helps promote community well-being and opportunities for economic mobility.
Failures/Challenges
Health coverage: Among immigrants, there is variation by immigration histories, and immigration integration trajectories. The ACA has led to major gains in coverage for lawful permanent residents in California similar in scope to changes among citizens. However, undocumented immigrants have experienced only modest increases in coverage, with the resulting disparity in uninsured rates for this group relative to citizens and permanent residents widening considerably since 2014 (Porteny, Ponce, & Sommers, 2020). Within the health

29
system, barriers included bureaucratic obstacles including paperwork and registration systems. The alternative care available (safety net) was generally limited and overwhelmed. Finally, there was evidence of widespread discriminatory practices within the health care system itself.
Exclusions: Undocumented immigrants are barred from purchasing coverage in the state exchange (Covered California), even if purchasing entirely with their own money (Ponce, Lavarreda, Cabezas, 2011). Federal policy prohibits the use of federal funds to provide Medicaid to undocumented individuals (Pourat & Martinez, 2019). Therefore, immigrants must rely on those states who are willing to cover undocumented immigrants using state funding to ensure they receive coverage.
Usual source of care: The healthcare safety net serving undocumented immigrants is uneven across geography, by age group, and in some cases, by health needs. Children in families with at least one undocumented member are almost 11 percent less likely to have a usual source of care compared to children in other immigrant families, although they get health care at similar rates.
Low wages: Despite high rates of full-time employment, many immigrants work in low-wage industries such as farming, construction, groundskeeping, and maintenance that do not offer employment-based coverage. Many of these positions have been considered essential work during the COVID-19 pandemic, but immigrants continue to be exposed to work-related health hazards without any or limited labor and health protections. Along with lack of health insurance and work protections, relief and economic stimulus programs enacted in response to the COVID-19 pandemic, such as the Coronavirus Aid, Relief and Economic Security (CARES) Act, excluded 10.6 million undocumented workers and 4.9 million of their families despite 78 percent of undocumented workers being employed in sectors deemed “essential” (UCLA LPPI).
Public charge: In 2019, a federal government rule expanded the list of programs used to decide if an immigrant is considered a “public charge” (defined by the U.S. government as someone who relies primarily on government benefits for support). That 2019 change has since been reversed, and through the federal regulatory process, the Biden administration seeks to define who and what constitutes a public charge. Numerous community-based organizations worked on advocating for reversing the proposed rule change and were ultimately successful in revoking the public charge rule change that would have left many immigrants without access to care and services. Despite the rule change, many immigrants still avoided participation in public programs and two-thirds of health providers in California reported an increase in parent’s fears about enrolling their children in public programs and nearly half reported “no shows” at public health clinics following news of the updated definition of public charge.

30
Origins
Through federal policy, the ACA in 2010 was a major policy shift for the entire U.S., as it expanded both public and private health insurance coverage through the use of premium subsidies for private coverage, an individual health insurance mandate, and Medicaid expansion, which was adopted by most states around the country. However, under the ACA, non-citizen immigrants comprised the largest group facing various forms of exclusions from federally-financed health coverage programs. This is because the ACA retained many of the same exclusions for eligibility in public programs that were introduced decades earlier, namely from the Personal Responsibility and Work Opportunity and Reconciliation Act (PRWORA) of 1996 and related immigration reforms in the same year that excluded most non-citizens from federally funded Medicaid eligibility and other federally funded public benefit programs. Those eligible for public benefits according to PRWORA are:
● Lawful permanent residents, ● Refugees, ● Cuban and Haitian entrants, ● Asylees, ● Those paroled into the United States for a period of at least one year, ● Those granted withholding of deportation, ● Those granted conditional entry into the United States, and ● Certain spouses and children who have been abused.
PRWORA also introduced a five-year waiting period for eligibility of benefits after immigrants obtain qualified status.
California has been at the forefront of immigrant health protection policies, especially as a countervailing force in more exclusionary federal policies that have direct, indirect, and sometimes unintended consequences on immigrant health. As seen below in the timeline, California’s pro-immigrant policies began in the early 2000s and accelerated after the ACA.
The timeline below includes federal and state action:
1964 Title VI of the U.S. Civil Rights Act prohibits discrimination by all federally funded entities based on race, color, or national origin, which included discrimination based on language and requires language assistance to Limited English proficient (LEP) individuals seeking health care services among other services.
1965 U.S. Immigration and Nationality Act of 1965 (Hart-Cellar Act) abolished national origins quota and created a seven category preference system, which gave priority to relatives of U.S. citizens and legal permanent residents, and skilled workers. Immigration in the Western hemisphere was limited.

31
1976 U.S. Immigration and Nationality Act of 1976 and 1978 – a per country ceiling of 20,000 immigrants and a worldwide annual ceiling of 290,000 immigrants.
1986 U.S. Immigration Reform and Control Act – Congress implemented a multi-pronged system that provided amnesty for established residents, increased border enforcement, enhanced requirements for employers, and expanded guest worker programs.
1994 CA Proposition 187 - Would have prohibited non-emergency health care, public education, and the use of other public services by immigrants not legally present. Struck down by a U.S. District Court judge as unconstitutional.
1996 U.S. Personal Responsibility and Work Opportunity Reconciliation Act (PRWORA) changed immigrant access to means-tested programs and public health insurance.
2003 CA Senate Bill 853: Health Care Language Assistance Act – Required health plans to collect race/ethnicity data to identify health disparities and to implement interventions including providing enrollees with interpreter services and translated materials.
2010 U.S. Patient Protection and Affordable Care Act (ACA)
2014 CA ACA Medicaid Expansion/Covered California launch
2015 CA Senate Bill 4: Health for All Kids – health insurance coverage for all under 18 years of age regardless of immigration status
2016 CA Assembly Bill 635: Medical Interpretation Services for Medi-Cal
2017 CA Senate Bill 223: Health Care Language Assistance Services expanded language assistance
2019 CA Medi-Cal Expanded to all adults under 26 years of age regardless of immigration status
2021 CA Medi-Cal Expanded to all adults over 65 years of age regardless of immigration status
Trends California Covers Federal Shortfalls

32
As discussed above, key federal action on welfare reform in 1996 and the ACA in 2010 restricted access to services to only those immigrants who were legally present in the U.S. for at least five years, leaving behind many immigrants living in the country. After the ACA, the state began to pass a series of key legislation that allowed all children, young adults, and older adults access to Medi-Cal if they met income qualifications. For Covered California, immigrants must be lawfully present – e.g., green card holders – to purchase a plan, though there is no five-year waiting period. There is naturally a good deal of confusion regarding who qualifies for what and this was exacerbated with the federal Public Charge Rule change under the Trump administration and subsequent reversal under the Biden administration as explained earlier in this section. Thus, while immigrants may qualify for health care coverage, confusion and hesitancy from the mixed messaging has limited enrollment in health care plans. Estimates suggest 2.3 million Californians remain uninsured for various reasons, ranging from affordability challenges to explicit exclusions from health care coverage and financial assistance due to immigration status (Health Access). Public Perception of Immigrants Vagaries in public perception of immigrants tend to follow political cycles. As described under the Origins section above, Proposition 187 was one of the most restrictive pieces of legislation ever introduced – with Republican Governor Pete Wilson as one of its most prominent supporters. California voters approved the proposition by a large margin, but ultimately with wide scale efforts from grassroots advocacy groups public sentiments began to change. While Proposition 187 was deemed unconstitutional by a judge and thrown out, public sentiment about immigrants also began to change through the 2000s and subsequent Democrat Governors supported more immigrant inclusive laws and actions to expand health care to immigrants. In a survey of Californians and their views about immigrants, a vast majority (87%) believe there should be a way for undocumented immigrants to stay in the country legally, and a majority (61%) favor state and local governments making their own policies and taking actions, separate from the federal government, to protect the legal rights of undocumented immigrants in California.
Safety Net for Immigrants Safety net providers in California provide health services delivery and social services regardless of immigration status. Uninsured individuals and families rely on safety net health care from the network of public hospitals, clinics and health centers that exist around the state. Community based organizations (CBOs) also play a key role in the provision of services to immigrants. The role of 501(c)3 nonprofits has evolved over the years: CBOs serve as safe spaces where undocumented immigrants can gather, be heard, and feel a sense of belonging. Nonprofit

33
organizations play a larger role in providing critical navigation services and access to public benefit programs as well as providing social and emotional support for California’s immigrants.

34
Environmental Effects on Health Facts
Pollution or contaminants in the environment negatively impact health, which has been shown through decades of research on environmental effects on mortality and morbidity with the World Health Organization estimating that 24 percent of all deaths in the world are due to modifiable environmental factors. Negative effects due to exposures to air, water, and soil pollutants, worsened by wildfires, and climate change in California, mostly affect communities that have faced disadvantage for decades (Anderson, Kissel, Field, & Mach, 2018; Babey, Hastert, Meng, & Brown, 2007; Heyer, Palm, & Niemeier, 2020; Lipsitt et al., 2021; Meng et al., 2016). Environmental health must thus be examined through the lens of distributive or environmental justice with the goal of achieving equity in clean and safe places to live.
Mortality and morbidity
In a landmark report in 2015, The Lancet estimated exposure to polluted air, water and soil caused 9 million premature deaths across the world, which represents 16 percent of all deaths worldwide–three times the impact of HIV/AIDS, tuberculosis, and malaria combined (Landrigan et al., 2018). Pollution leads to respiratory disease, cardiovascular disease, cancer, and pregnancy outcomes. We describe the links between pollution and asthma here as an example of the body of work that has been done in California. (Note also that asthma prevalence among children is covered in the Child, Adolescent and Young Adult section of this report.)
Asthma While several studies point to the strong link between pollution and asthma, a notable study for discussion here on the effects of the environment on health in California is USC’s Children’s Health Study (CHS) conducted among children living in southern California. The CHS found children who participate in several outdoor sports and lived in communities with high ozone levels were more likely to develop asthma than similarly active children living in areas with less ozone pollution and children living near roads have an increased risk of asthma (Chen, Salam, Eckel, Breton, & Gilliland, 2015). As with pollution burden (Figure 3), there is significant geographic variability in the burden of asthma across the state. CalEnviroScreen 4.0 examined the rate of asthma emergency department visits per 10,000 in 2015-17 and found high burdens of asthma in the Central Valley and in urban areas, particularly those facing socioeconomic injustices.

35
Figure 3. Variability of Asthma in California, 2021
Source: CalEnviroScreen 4.0
Environmental Justice
Low-income communities and communities of color and indigenous peoples are more likely to be exposed to climate change threats (e.g., flooding, storms, droughts, wildfire) and structural inequalities that expose communities to inadequate housing and infrastructure. At the national

36
level, the U.S. Department of Health and Human Services (HHS) recently established a new Office of Climate Change and Health Equity in 2021.
California has a long track record of trying to address the injustices in environmental exposures. Per California’s Environmental Protection Agency (CalEPA), the principles of environmental justice call for fairness, regardless of an individual’s characteristics such as race, county of birth, or income, in the development of laws and regulations that affect every community or neighborhood. California codified environmental justice in statute (GOV § 65040.12), making it one of the first states to do so. The code calls on decision makers to include individuals disproportionately impacted by pollution in decision-making processes to lift the unfair burden of pollution from those most vulnerable to its effects. People living with low-income, people of color, immigrants and indigenous communities face higher environmental pollution and related health burdens than other groups and have also been found to have greater increases in adverse health effects at the same level of increase in exposures compared to other race/ethnicities and high income groups.
CalEPA’s CalEnviroScreen calculates pollution burden, population characteristics, and health metrics for California’s census tracts. Using the CalEnviroScreen’s impact analysis of pollution burdens, decision-makers can craft and implement policies that can improve the overall health and quality of life in these neighborhoods. Pollution burden varies significantly across the state, with urban centers and the Central Valley having the highest burden of pollution in the state (Figure 4). Pollution Burden scores for each census tract are derived from the average percentiles of the seven exposure indicators (ozone and PM2.5 concentrations, diesel PM emissions, drinking water contaminants, pesticide use, toxic releases from facilities, and traffic density) and five environmental effects indicators (cleanup sites, impaired water bodies, groundwater threats, hazardous waste facilities and generators, and solid waste sites and facilities).

37
Figure 4. Variability of Pollution Burden in California
Source: CalEnviroScreen 4.0, 2021
Transportation and Ports The transportation sector in California accounts for a large part of pollution in the state. It is estimated transportation accounts for about 50 percent of the state’s greenhouse gas emissions, about 80 percent of nitrogen oxide pollution, and 90 percent of diesel particulate matter pollution. The environment around the ports in California, such as the ports of Los Angeles, Long Beach and Oakland, have negatively impacted communities of color for decades and contributed to poor health outcomes.

38
The California Air Resources Board (CARB) has made efforts to decrease emissions in these areas. One such example is CARB’s 2006 California Goods Movement Plan, which sought to decrease emissions related to the movement of goods through ports and highways via numerous mandatory and voluntary actions. In a recent study of the impact of the plan on health outcomes, researchers found statistically significant reductions in pollutant NO2 and PM2.5 concentrations for enrollees in the counties where the plan was implemented and subsequent reductions in emergency room visits for patients with asthma and chronic obstructive pulmonary disease. While the Plan has been an example of pollution reduction for ports and an example of collaborative efforts with communities, more work is required to reduce the burden of poor environmental conditions in port areas.
Wildfires California has faced larger, more frequent, and more intense wildfires across the state in the last decade. Apart from the massive economic loss and potential for death and destruction of families and their livelihoods, wildfires contribute to poor health by the emissions they cause. Health problems related to wildfire smoke exposure range from eye and respiratory tract irritation to worsening of asthma, heart and other lung disease, and even premature death (Balmes, 2020; Enders, Rhead, Phan, & Zoerb, 2021; Reid et al., 2016). Communities most heavily impacted are low-income communities and elders (Masri, Scaduto, Jin, & Wu, 2021).
California’s Agricultural Activities Covering about 20,000 square miles, the agricultural region that makes the Central Valley is not only a geographically significant part of the state, but it is also an economic center: it produces 25 percent of the total food supplied to the country and 40 percent of the country’s fruits and nuts. Residents and farm workers in the Central Valley are exposed to extreme heat–intensified by the drought in the state, poor air and water quality, and a host of pesticides and other agricultural and industrial contaminants.
Successes/Opportunities
Regulations: It is without doubt that California has been the most proactive state in the U.S. when it comes to introducing measures to reduce pollution. The most recent policy action that has propped California up again as a leader in environmental protection is its decision to require that all new passenger cars and trucks sold be emissions free by 2035—which is expected lead to more than a 35% reduction in greenhouse gas emissions (GHG) and an 80 percent cut in nitrogen oxide emissions. California is the first state in the U.S. to make this move. Given the state hit its 2020 carbon reduction goal four years early–reducing emissions to 1990 levels by 2016–there is hope that California can make improvements in the environment while continuing to be a leading economic entity.

39
Environmental Justice Community Advocacy: There are active environmental justice and community advocacy organizations in the state working to create transformative policies and structural changes that improve the living conditions for communities that have been marginalized for generations. Two such organizations are: Communities for a Better Environment and the Asian Pacific Environmental Network. Organizations like these not only advocate for statewide transformative policy changes, but they also take action at the local level. Asian Pacific Environmental Network, for example, stopped a major oil company from expanding its oil refinery in Richmond and has stopped developers from transporting coal throughout the Bay Area.
Cap-and-Trade: California’s cap-and-trade program has been attributed to some part of California’s early successes in achieving its greenhouse gas targets with a 13 percent drop in emissions from 2004 to 2016, however researchers and advocates have pointed out that greater attention to environmental justice is needed to make the program more equitable. Early evidence shows the cap-and-trade program has not led to localized improvements in environmental equity (Cushing et al., 2018; Moghavem, 2018). Recognizing the need for improvements in achieving equity, CalEPA has sought public input on their CalEnviroScreen metrics recognizing that advancing environmental justice is central to the efforts to use data to identify and help communities most impacted by environmental and socioeconomic burdens.
Failures/Challenges Worst Polluted Urban Areas in the U.S.: Despite the improvements the state has made to clean up the environment, many of its cities consistently top the lists of most polluted cities in the U.S. For example, Los Angeles has been routinely recognized as the most polluted city in the country even before World War II. Los Angeles began to become even more polluted following the war, and in 1943, the Los Angeles County Board of Supervisors decided to study the problem. By 1945 Los Angeles began using the term smog to describe its pollution, and by the 1950s and 1960s, scientists realized the contribution of cars in creating air pollution. Despite identifying the cause, Los Angeles continues to be the city with the worst pollution in the U.S.
Regional Disparities and Injustice: Apart from urban centers, the Central Valley is another area in the state that is disproportionately impacted by not only air pollution due to its geography, but to industrial and agricultural contaminants. The Central Valley, home to many of California’s immigrant communities and other communities of color, continues to be one of the most polluted regions in the U.S. Farm workers in the state continue to be at risk of exposure to contaminants and extreme heat. Advocates are worried that climate change will only worsen the situation as the severity and frequency of extreme weather conditions increases, which leads to a greater dependence on pesticides for crops. Similarly, as described above, environmental burden suffered by communities near ports and in communities where
40
industries have polluted and continue to pollute remain high in California. Looking at pollution from non-industrial sources, communities of color and neighborhoods facing disadvantages bear the biggest burden from air pollution from vehicles. These facts have not changed despite all the action and attention put on the climate and environment in California.
Origins
In 1970, the U.S. Congress created the Environmental Protection Agency (EPA) and passed the Clean Air Act, giving the federal government authority to improve air pollution. The Clean Water Act was subsequently passed in 1972. Since then, EPA and states, tribes, local governments, and environmental groups have worked to establish programs to reduce pollution levels. In 1990, Congress dramatically revised and expanded the Clean Air Act, providing EPA even broader authority to implement and enforce regulations. California has made major strides in introducing state regulations that go beyond federal policies and is seen as a leader in environmental protection.
Due in large part to its geography, economic growth, and land use patterns, California has struggled with pollution over many decades. The state of California has made progress in creating regulations to control pollution – whether it is air, water, or soil – with a number of progressive policies that have gone beyond federal actions and those taken out in other states (L. C. Stokes, 2019).
Some key policies are listed here below:
1967 The California Mulford-Carrell Act forms the California Air Resources Board (CARB). California becomes the first state in U.S. to enact emissions standards for pollutants from cars
1967 State Water Board created to enact water cleanliness standards 1970 California Environmental Quality Act (CEQA) uplifted environmental protection in
California 1991 California Environmental Protection Agency (CalEPA) formed to
“restore, protect and enhance the environment, to ensure public health, environmental quality and economic vitality”
2002 AB 1493: Greenhouse Gas Limits – World’s first restrictions on tailpipe emissions of greenhouse gases. Strictest and most comprehensive renewable energy mandate–it currently requires utilities to generate 50 percent of their energy from renewable sources by 2030.
2006 AB 32: Global Warming Solutions Act – Most ambitious climate legislation ever passed in the U.S. requiring the whole state to reduce greenhouse gas emissions (emissions had to be at 1990 levels by 2020 and legislation enacted in 2016

41
extended and strengthened this mandate requiring emissions to decline 80% below 1990 levels by 2050) California’s Cap and Trade Program introduced
2017 AB 398: Cap-and-Trade extended to 2030 2020 Executive Order to Ban New Gas-Powered Cars by 2035 2020 Advanced Clean Trucks (ACT) regulation – Plan to begin transition of trucks to
become zero-emission vehicles.
Trends Population and Industry Growth: Certain regions in California are growing much faster than others, with the Inland Empire as an example of a region that has seen rapid population growth alongside job growth and increasing racial diversity. While the growth may be seen as generally positive as homeownership is higher and communities have the potential to be uplifted from poverty, there are worries of worsening of pollution, particularly given the rise in warehouses.
Land Use, Climate Change, and Water Supply: Land use policy in California is contentious, with debates on how much housing the state will allow to be built to accommodate the population. The housing crisis (i.e., the lack of affordable housing) pushes people to live in areas with greater wildfire risk. Similarly, water demand for the population is another debated issue with regards to how best to provide water for all Californians in the future, especially as groundwater demand is growing. By examining the historical trends of land use in California from 1992 to 2012 – including urbanization, agricultural expansion and contraction – and applying these trends to the future, researchers found that the projected water needs in the state by the year 2062 will increase beyond the available supply (Wilson, Sleeter, & Cameron, 2016). Apart from strains on water, other land use issues concerns for the state include how the state will respond to the housing crisis that has left so many without homes – the state’s unhoused population grew 16 percent between 2007 to 2020, with the largest increases in the last two years.
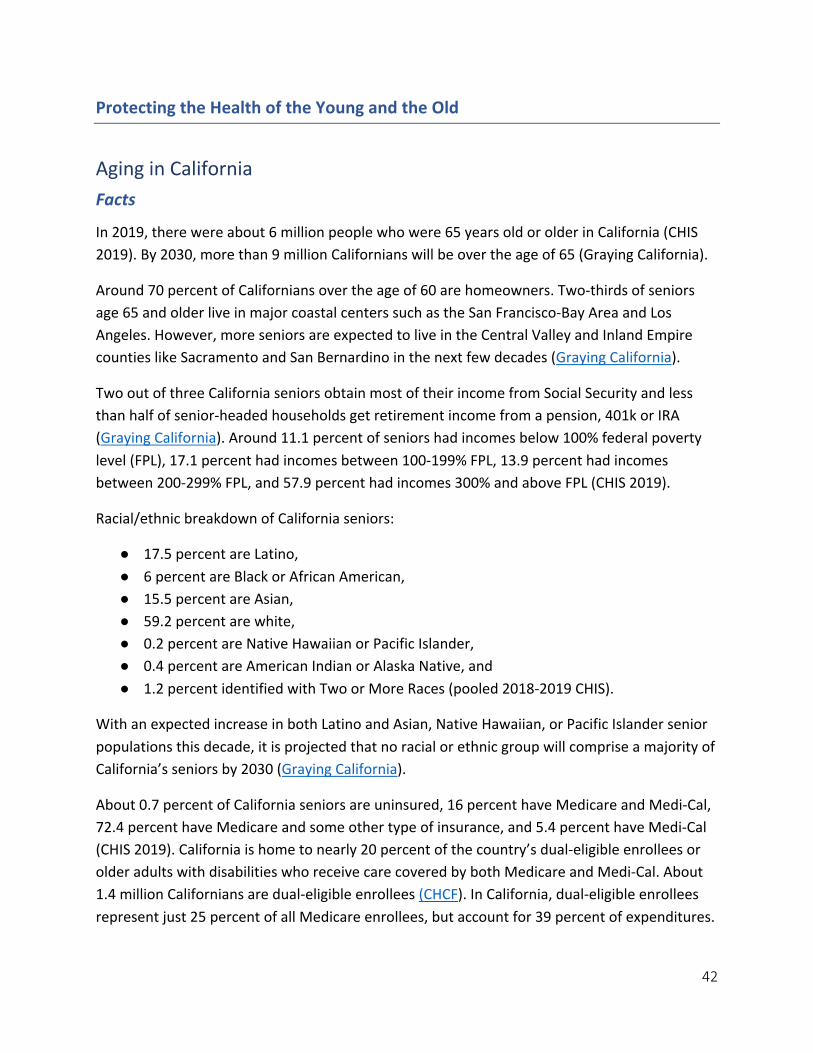
42
Protecting the Health of the Young and the Old
Aging in California Facts
In 2019, there were about 6 million people who were 65 years old or older in California (CHIS 2019). By 2030, more than 9 million Californians will be over the age of 65 (Graying California).
Around 70 percent of Californians over the age of 60 are homeowners. Two-thirds of seniors age 65 and older live in major coastal centers such as the San Francisco-Bay Area and Los Angeles. However, more seniors are expected to live in the Central Valley and Inland Empire counties like Sacramento and San Bernardino in the next few decades (Graying California).
Two out of three California seniors obtain most of their income from Social Security and less than half of senior-headed households get retirement income from a pension, 401k or IRA (Graying California). Around 11.1 percent of seniors had incomes below 100% federal poverty level (FPL), 17.1 percent had incomes between 100-199% FPL, 13.9 percent had incomes between 200-299% FPL, and 57.9 percent had incomes 300% and above FPL (CHIS 2019).
Racial/ethnic breakdown of California seniors:
● 17.5 percent are Latino, ● 6 percent are Black or African American, ● 15.5 percent are Asian, ● 59.2 percent are white, ● 0.2 percent are Native Hawaiian or Pacific Islander, ● 0.4 percent are American Indian or Alaska Native, and ● 1.2 percent identified with Two or More Races (pooled 2018-2019 CHIS).
With an expected increase in both Latino and Asian, Native Hawaiian, or Pacific Islander senior populations this decade, it is projected that no racial or ethnic group will comprise a majority of California’s seniors by 2030 (Graying California).
About 0.7 percent of California seniors are uninsured, 16 percent have Medicare and Medi-Cal, 72.4 percent have Medicare and some other type of insurance, and 5.4 percent have Medi-Cal (CHIS 2019). California is home to nearly 20 percent of the country’s dual-eligible enrollees or older adults with disabilities who receive care covered by both Medicare and Medi-Cal. About 1.4 million Californians are dual-eligible enrollees (CHCF). In California, dual-eligible enrollees represent just 25 percent of all Medicare enrollees, but account for 39 percent of expenditures.

43
Dual-eligible enrollees make up just 11 percent of Medi-Cal enrollees, but account for 32 percent of total Medi-Cal enrollees (CHCF).
Disability and Limitations in Activities of Daily Living: Close to 4 million Californians lived with a disability in 2016, representing more than 1 in 3 adults aged 65 and older. It is projected that seniors with disabilities or limitations in activities of daily living (ADL) will grow from 1 million in 2015 to 2.6 million in 2060 in California (CHCF). The number of seniors living with Alzheimer’s disease is projected to increase from 690,000 in 2020 to 840,000 in 2025. Seniors with Alzheimer’s disease or other dementias require more skilled nursing facility stays and home health care visits per year compared to other older adults.
Caregiving Needs: On average, it is expected that people aged 65-years-old in the United States will live 20 or more years, a 50 percent increase during the past century (Vega & Wallace, 2016). It is projected that by 2030, around 1 million seniors will require some assistance caring for themselves and around 900,000 of these seniors will not be living in nursing homes (PPIC). Only about 2 percent of California’s seniors live in nursing homes (Graying California). California’s typical caregiver is female, 58-years-old and cares for a parent who is 81 years old (AARP).
End of Life: In 2014, 43.3 percent of people in California with terminal conditions utilized hospice care, a form of palliative care for patients who have a prognosis of 6 months or less to live, lower than the intended target of 54 percent (Let’s Get Healthy California). Fewer than one of six hospice patients in California were non-white or Latino (CHCF). More than nine in 10 hospices in California had one or more deficiencies based on requirements to participate in the Medicare program (CHCF). More than six of 10 Californians preferred dying a natural death compared to about one in 10 who would want to receive all possible care to prolong life. Black respondents of this survey were more likely to prefer prolonging their life than other racial/ethnic groups (CHCF).
Advance Directives: An advance directive is a document expressing patients’ healthcare preferences in the event they are unable to make decisions. Treatments people would prefer to receive near the end of life are often different from the treatments they receive. Yet as of 2017, only one-third of adults in the U.S. had any type of advance directive (Yadav et al., 2017). However, advance directives have also been criticized for being insufficient (Kirschner, 2005). Medicare began reimbursing physicians for counseling regarding advance care planning in 2016.
Disparities and Social Determinants of Health
Limited English Proficiency (LEP): Approximately 5 million of America’s older adults are LEP (Justice in Aging). In most CA counties, more than one in five low-income Medicare

44
beneficiaries are LEP (Nat’l Council on Aging). About 34.9 percent of California seniors said they spoke English “Not Well or Not at All” in 2019 (CHIS 2019).
Financial Security: There are 655,000 “hidden poor” seniors in California; these seniors live alone or only with their spouse and had a 2013 income above the federal poverty level but below the Elder Economic Security Standard Index – a measure of poverty that considers the true cost of living in California’s 58 counties. These older adults lack sufficient income to meet their basic needs without a subsidy as defined by government standards for housing, food, and medical care as well as transportation and other basic necessities.
Food Insecurity: The most recent report, released in 2020 using 2018 data, found that 5.3 million seniors, or 7.3 percent of the U.S. senior population, were food insecure in 2018 (Feeding America). California had the lowest percentage of seniors enrolled in SNAP when compared to all states in 2016 (National Council on Aging). While there has been a steady increase in senior SNAP enrollment over the past decade, only 48 percent of those who are eligible for the program are enrolled (National Council on Aging).
Housing Insecurity: According to the 2018 Greater Los Angeles Homeless Count, there are 12,698 older adults (aged 55 and older) experiencing homelessness in the Los Angeles Continuum of Care (Homelessness Policy Research Institute). In a study of 350 adults ages 50 and over in Oakland, older homeless adults were found to have experienced high rates of victimization. A national study found that California had the highest rate of cost-burdened households headed among adults (aged ≥ 50 years) who rented—almost three-fifths (57.9%) spent more than 30 percent of their incomes on rent (Vega & Wallace, 2016).
Additional Areas of Concern
Alzheimer’s and other dementias: There around 690,000 California adults (55 and over) living with Alzheimer’s disease in 2020 and projected to increase to 840,000 by 2025. The lifetime risk of Alzheimer’s disease–or the probability that someone of a given age who does not have a particular condition will develop the condition during his or her remaining life span–is 20 percent for women and 10 percent for men at age 45. About 1.12 million Californians are caring for people with Alzheimer’s or other dementias (Alzheimer’s Association).
Loneliness and Social Isolation: According to a 2018 AARP Foundation national survey, nearly one-third of U.S. adults 45 years and older reported feeling lonely (Anderson & Thayer, 2018). As research into loneliness is still on the rise, disparities based on race and ethnicity have not yet been observed. Among Californians 65 and older, 21.4 percent felt lonely at least some of the time in 2019, while 25.7 percent of Latinos, and 14.3 percent of Black/African Americans expressed loneliness at least some of the time (CHIS, 2019). In Los Angeles County, 22.6 percent

45
of adults aged 65 years or older felt lonely at least some of the time, while 24.2 percent of Latino and 10.2 percent of Black/African American older adults expressed loneliness at least some of the time in 2019 (CHIS, 2019).
Mental Health: Depression is the most common mental illness in late life and decreases quality of life (Blazer, 2003). Older Californians who lived alone or with only a spouse/partner were three times as likely as those with incomes above the Elder Index to say that they had felt depressed “some, most, or all'' the time (Wallace & Padilla-Frausto, 2016). Older adults’ incidence of suicide is high among older men. Among older white men (ages 85+), the suicide rate is more than four times higher than the overall rate in the nation (Frank, Kietzman, & Palimaru, 2019). Research on associations between acculturation and depression in older adults demonstrated that life stress and acculturation stress were major concerns for Asian immigrant elders coupled with lack of financial resources and language proficiency negatively affected Asian immigrant elders’ abilities to navigate the healthcare system and social realities in the United States (Mui & Kang). Gonzalez, Haan, et. al found that there was a higher prevalence of depression among older Mexican immigrants compared to older white or Anglo-oriented adults, which the authors associated with lower acculturation and poorer health status.
Digital Divide: In 2016, 38.8 percent of Californians aged 65 and older did not use the internet, while 36.7 percent of California seniors used the internet for health information (CHIS 2016). Yoon, Jang et. al showed that African American, Latino, and Asian American older adults had lower odds of using the internet for health information when compared to older, white adults. Moreover, having a lower socioeconomic status reduced the odds of using the internet for health information when compared to those with higher socioeconomic status. Over 80 percent of COVID-19 deaths in the U.S. have been older Americans, and research estimates that about 40 percent of them were unable to access needed online resources because they lacked in-home internet (Aging Connected).
A 2021 AARP poll showed that:
● A strong majority of registered voters ages 40+ (87%) in California, across party lines, want home- and community-based services that enable older Californians to live independently at home.
● Nearly all (94%) California voters believe resources and training for caregivers are important.
● 79 percent of California registered voters ages 40+ are interested in using telehealth.
AP NORC poll showed that:

46
● Between 2018 and 2029, the percentage of people who believe that the majority of long-term care costs should be covered by insurance and government programs is increasing (AP NORC):
○ Health insurance increased from 50 percent to 59 percent (+9%) ○ Medicare increased from 45 percent to 56 percent (+11%) ○ Medicaid increased from 36 percent to 47 percent (+11%)
Successes/Opportunities Long Term Care: AB 567 established the Long Term Care Insurance Task Force to explore a statewide long-term care insurance program for people interested in insuring themselves against the risk of costs associated with functional or cognitive disability, and would require long term care, services, and support. California was ranked 9th in Long Term Support Services (LTSS) compared to other states (The Scan Foundation).
Removed Barriers to Medi-Cal: California 2021-2022 State budget eliminated the Medi-Cal asset test, which continued to apply to seniors even after the ACA eliminated the asset test for most low-income Americans and frees seniors from “spending down” to remain eligible for Medi-Cal and benefitting particularly seniors of color who identify as renters.
Increasing attention to social determinants of health: California has created opportunities to support health outside of clinic settings, including in community settings, and to address basic needs that are essential to good health as well as increased collaborations between traditional health/clinical settings, social service providers, and community-based organizations. These opportunities have resulted in calls for greater screening and assessments of SSDoH.
For example, in 2014, California implemented the Coordinated Care Initiative to better integrate and coordinate health benefits and long-term support services for dual-eligible enrollees (Mandatory enrollment in Medi-Cal managed care, long-term services and support integration, and Cal MediConnect) (CHCF).
Medicare Advantage plans can cover services such as pest control, social needs benefits, indoor air quality equipment and services, and other social determinants in their benefit packages. In contrast to the expansion in primarily health related supplemental benefits, the Centers for Medicare & Medicaid Services has interpreted the law so that Special Supplemental Benefits for Chronically Ill can be offered non-uniformly (i.e., plans can tailor benefits specifically to an enrollee’s needs) (ATI Advisory).
The Advancing and Innovating Medi-Cal (CalAIM) initiative has the potential to increase system integration and coordination for Seniors and Persons with Disabilities (SPDs) with Medi-Cal only and those that qualify for Medicare and Medi-Cal (dual-eligible). CalAIM builds upon the
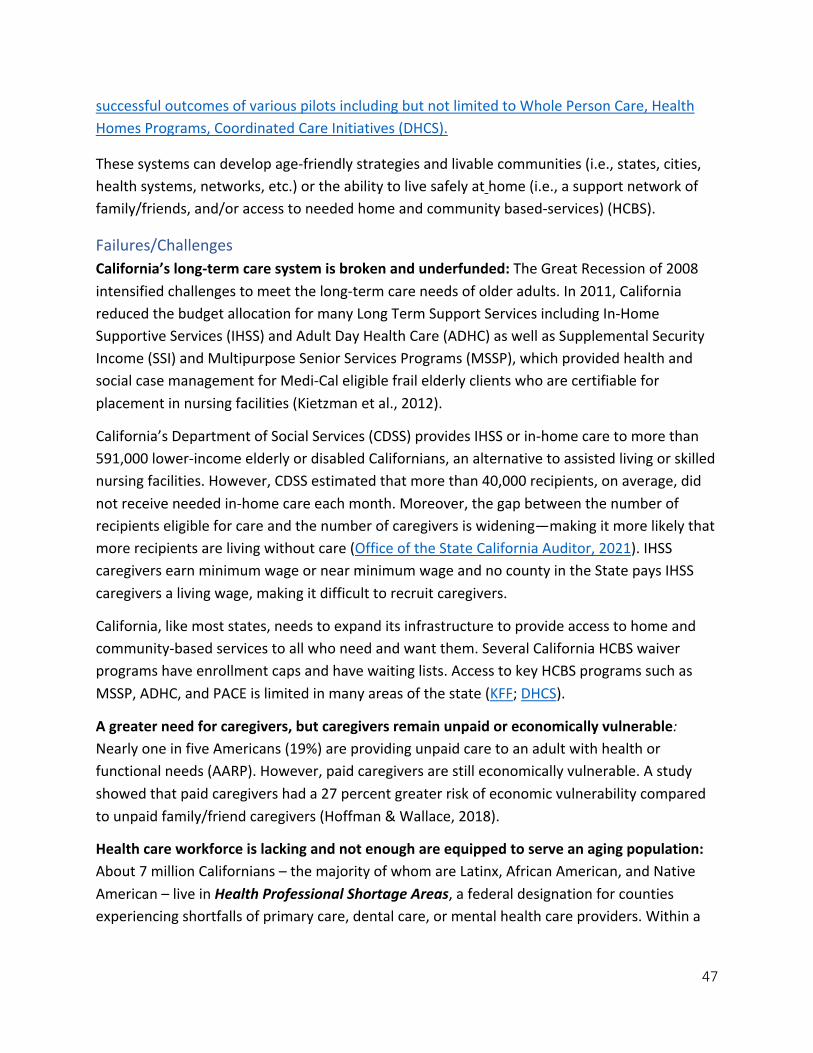
47
successful outcomes of various pilots including but not limited to Whole Person Care, Health Homes Programs, Coordinated Care Initiatives (DHCS).
These systems can develop age-friendly strategies and livable communities (i.e., states, cities, health systems, networks, etc.) or the ability to live safely at home (i.e., a support network of family/friends, and/or access to needed home and community based-services) (HCBS).
Failures/Challenges California’s long-term care system is broken and underfunded: The Great Recession of 2008 intensified challenges to meet the long-term care needs of older adults. In 2011, California reduced the budget allocation for many Long Term Support Services including In-Home Supportive Services (IHSS) and Adult Day Health Care (ADHC) as well as Supplemental Security Income (SSI) and Multipurpose Senior Services Programs (MSSP), which provided health and social case management for Medi-Cal eligible frail elderly clients who are certifiable for placement in nursing facilities (Kietzman et al., 2012).
California’s Department of Social Services (CDSS) provides IHSS or in-home care to more than 591,000 lower-income elderly or disabled Californians, an alternative to assisted living or skilled nursing facilities. However, CDSS estimated that more than 40,000 recipients, on average, did not receive needed in-home care each month. Moreover, the gap between the number of recipients eligible for care and the number of caregivers is widening—making it more likely that more recipients are living without care (Office of the State California Auditor, 2021). IHSS caregivers earn minimum wage or near minimum wage and no county in the State pays IHSS caregivers a living wage, making it difficult to recruit caregivers.
California, like most states, needs to expand its infrastructure to provide access to home and community-based services to all who need and want them. Several California HCBS waiver programs have enrollment caps and have waiting lists. Access to key HCBS programs such as MSSP, ADHC, and PACE is limited in many areas of the state (KFF; DHCS).
A greater need for caregivers, but caregivers remain unpaid or economically vulnerable: Nearly one in five Americans (19%) are providing unpaid care to an adult with health or functional needs (AARP). However, paid caregivers are still economically vulnerable. A study showed that paid caregivers had a 27 percent greater risk of economic vulnerability compared to unpaid family/friend caregivers (Hoffman & Wallace, 2018).
Health care workforce is lacking and not enough are equipped to serve an aging population: About 7 million Californians – the majority of whom are Latinx, African American, and Native American – live in Health Professional Shortage Areas, a federal designation for counties experiencing shortfalls of primary care, dental care, or mental health care providers. Within a

48
decade, California is projected to have a shortfall of more than 4,100 primary care clinicians and 600,000 home care workers (CA Future of Health Workforce Commission). In 2016, California had more than 80,000 licensed behavioral health professionals in a variety of disciplines, but very few had specialized training in geriatrics. African Americans and Latinos are underrepresented in the field of psychiatry and psychology, and Latinos are also underrepresented in counseling and social work (Frank et al., 2019).
Housing insecurity and homelessness is increasing among individuals older than 50 years old: According to the 2018 Greater Los Angeles Homeless Count, there are 12,698 older adults (aged 55 and older) experiencing homelessness in the Los Angeles Continuum of Care (Homelessness Policy Research Institute). The Elder Index shows that the cost of living for older adults factors in housing and health care expenditures vary by geography (CHIS: Steve Wallace, Imelda Padilla-Frausto). One study showed that there is a risk of persistent homelessness and violent victimization among older adults.
Food Insecurity for Older Americans: The most recent report, released in 2020 using 2018 data, found that 5.3 million seniors, or 7.3 percent of the U.S. senior population, were food insecure in 2018 (Feeding America). A little more than half of all seniors who qualify for SNAP do not participate. While there has been a steady increase in senior SNAP enrollment over the past decade, only 48 percent of those who are eligible for the program are enrolled (National Council on Aging).
Origins
The Medicare and Medicaid Act of 1965 and Older Americans Act (OAA) lead to the formation of California’s Department of Rehabilitation and the California Commission on Aging (CCoA) under the state’s Health and Human Welfare Agency. In 1972, the Center for Independent Living (CIL) at UC Berkeley was created and became a hub for the independent living movement of the 1960s. The Rehabilitation Act of 1973 became one of the first U.S. laws giving protection to people with disabilities. It gives civil rights protection to federal employees, federal contractor employees and people participating in programs receiving federal money. The OAA Comprehensive Services Amendments of 1973 established Area Agencies on Aging, Native American Aging Programs, and multi-purpose senior centers.
In 1978 California passed Proposition 13, which capped property taxes at the level of taxes based on the time the home was purchased. This Proposition has allowed seniors to age in place more easily by helping people with fixed incomes stay in their homes (grayingcalifornia.org). In that same year, Governor Jerry Brown designated Disability Rights

49
California (DRC) as the organization in California to advocate for people with developmental disabilities.
The California Legislature passed AB 1805 (1982) and SB1210 (1983) which established a mandated reporting law for Adult Protective Services effective January 1, 1984. The law was later expanded to include dependent adults (Garfield, 1991; GAO, 1991). The Americans with Disabilities Act (ADA) in 1990 established a clear and comprehensive prohibition of discrimination on the basis of disability. The Federal Family and Medical Leave Act of 1993 gives all public sector and private sector employees of both genders, whose employers have 50 or more workers, the right to 12-weeks of job-protected unpaid family or medical leave (Feinberg, 2011). In 1999 the California Kin Care legislation required that employers who provide paid sick leave must permit employees to use up to 50 percent of their annual allotment to care for a sick child, parent, or spouse (Feinberg, 2011). In 2002 California amended the State Disability Insurance program to provide Paid Family Leave of up to 6 weeks per year for bonding with a newborn, adopted, or foster child or for caring for a seriously ill family member (Feinberg, 2011).
The Medicare Prescription Drug, Improvement, and Modernization Act of 2003–also called the Medicare Modernization Act (MMA)–was enacted by President George W. Bush. The MMA represented the largest overhaul of Medicare in the program's history and included the Medicare Part D Prescription Drug program. Included within the ACA, the Elder Justice Act (EJA) was also passed on March 23, 2010. The EJA is the first comprehensive legislation to address the abuse, neglect and exploitation of older adults at the federal level. The law authorized a variety of programs and initiatives to better coordinate federal response to elder abuse, promote elder justice research and innovation, support APS systems, and provide additional protections for residents in long-term care facilities.
Creation of the Centers for Medicare and Medicaid Innovation (CMMI) allows for new demonstration of approaches to delivery of Medicare and Medicaid services to seniors and persons with disabilities, emphasizing integrated care and improved access to LTSS. Additionally, the Program for All-Inclusive Care for the Elderly (PACE) Innovation Act of 2015 enables the Centers for Medicare and Medicaid Services to authorize demonstrations of PACE programs to serve other high need populations such as those under the age of 55 and those who do not qualify for nursing home level of care under the Social Security Act. The Creating High-Quality Results and Outcomes Necessary to Improve Care (CHRONIC) Act of 2018 allows Medicare Advantage plans greater flexibility to cover non-medical benefits for identified high-need/ high-risk members, protects and build on key programs serving individuals with complex care needs (e.g., dual eligible, people with chronic conditions, people living in institutions) and signals that care coordination and integration are explicit and essential purposes of Special

50
Needs Plans (SCAN Foundation). The CHRONIC Care Act also authorized Accountable Care Organizations and Medicare Advantage programs increased flexibility in use of telemedicine to bridge the Digital Divide among older adults.
Oregon was the first state to enact an Assisted Dying statute in 1996. California’s End of Life Act of 2016 (CA ABX2-15) allows patients who are terminally ill to voluntarily request and receive prescription medication from their physician that will allow them to end their life peacefully. SB 380 (Eggman) proposes to reduce the 15-day waiting period to 48 hours and remove the automatic repeal clause, which will be triggered in 2026.
Governor Gavin Newsom implemented the California Master Plan for Aging by executive order in 2019 establishing a 10-year plan to address a broad spectrum of aging population needs. The Master Plan outlines five goals, including housing for all ages, tackling issues in caregiving, improving quality of life as we age, enabling seniors to afford retirement, and making prescription medication more affordable and addressing care services for Californians with Alzheimer’s and Dementia.
Following the Master plan, the Governor has enacted policies and programs such as: ● Governor’s Task Force on Alzheimer’s Disease Prevention and Preparedness (CA Office
of the Governor), ● AB 1383 – Strengthening paid family leave for Californians by broadening the scope of
who qualifies for job-protected leave to those who work for any employer with five or more employees CA Office of the Governor),
● An executive order to achieve Broadband for All (Aging Connected), and ● The California Future of Health workforce, which–along with the 10 priorities for action
that the Commission has developed–proposed 17 other important recommendations to address critical health workforce needs, for a combined estimated cost of $6 billion.
Trends
California’s Older Adult Population is Growing Rapidly Six million Californians are over the age of 65 in 2019, projected to grow by more than 65 percent by the mid-2030s. Seniors are the state’s fastest-growing age group, far outpacing growth in children or working-age adults. In 2020, the fastest growth will occur among seniors age 75 and older. The fastest growing non-white populations will be Latinxs (1.4 million) and Asians (765,000); African American will grow 96 percent (230,000). The projected increase of seniors with disabilities will grow from 1 million in 2015 to 2.7 million in 2060–a 160 percent increase. The most “upstream” approach to improving health equity among older adults is improving the economic status of all low-income American families because that would assist both current and future generations of older adults (Vega & Wallace, 2016).

51
Potential Federal Policies and Priorities In 2021, Joe Biden became the oldest person to assume the U.S. presidency at 78. Tackling issues related to aging has become one of his top legislative priorities. For example, the federal government is considering reforming Medicare to address gaps within the program, such as providing coverage for dental, vision, and hearing. Since its inception, only a few benefits have been added to the program such as preventive care to address pneumonia, vaccines, and mammograms, as well as prescription drug coverage. Moreover, the Build Back Better Plan introduced by the Biden Administration envisions a $400 billion investment in Medicaid Home and Community Based Services (HCBS). The Supplemental Security Income (SSI) Restoration Act of 2021 has been introduced in both the House and the Senate. The bill would improve the lives of millions of SSI beneficiaries around the country, including over 2 million older adults who are living below the federal poverty level due to inadequate benefit levels, and often lose or are denied benefits due to outdated eligibility rules.
COVID-19 Pandemic Older adults, especially older adults of color, are disproportionately affected by COVID-19. Older adults are particularly susceptible to COVID-19, being more likely to be infected by the virus and have worse physical outcomes when infected compared to the general population (CDC COVID-19 Response Team et al., 2020; Shahid et al., 2020). Additionally, communities of color have also been overrepresented in the COVID-19 mortality and morbidity data (Fortuna et al., 2020). Therefore, older adults of color are in an extremely vulnerable position to the physical manifestation of COVID-19. Moreover, with the introduction of social distancing policies and closure of in-person services, COVID-19 will exacerbate existing disparities in financial insecurity and loneliness.

52
Child, Adolescent and Young Adult Health Facts California is home to 9 million children and adolescents (ages 0-17) and an additional 5 million young adults (ages 18-26). Although California has the largest number of children under 18 of any state in the U.S., slightly less than one-quarter (23.7%) of the state’s population is under 18 and the number of children has declined from nearly 9.6 million in 2004. This proportion is similar to the national estimate (23.6%), but California ranks 20th in terms of the proportion of children in the state – lower than Utah (30.8%) and Texas (27.2%), similar to Arizona (24.0%) and Nevada (23.5%), and higher than New York (21.7%) and Florida (20.8%). Forty percent of California’s children are Latinx (Figure 5). The racial/ethnic composition has changed over time with the Latinx, Asian, and multiracial populations increasing. Although California has a large immigrant population, the majority of children (95%) and young adults (80%) in the state were born in the U.S.
Figure 5. Racial Composition of Children in California
Source: 2019-20 California Health Interview Survey The health and well-being of children and adolescents is influenced by many factors including their family environment, economic resources, where they live, whether they attend preschool, and their school or preschool environment. The Kids Count Data Book evaluates child well-
American Indian/Alaska Native
0.5% Asian12.9%
Black or African American
5.7%
Latinx40.2%
Native Hawaiian/Pacific
Islander0.3%
Two or More Races2.7%
White37.7%
Racial Composition of Child and Adolescent Population in California, 2019-20

53
being in each state using indicators in four domains: economic, education, health, and family/community. According to the 2021 Kids Count Data Book, California ranks 33rd in overall child well-being. The state ranks 11th in terms of health, but much lower on the other indicators of well-being: 36th on education, 36th on family and community indicators, and 43rd on economic well-being. In terms of health, Massachusetts ranked highest and Mississippi ranked lowest. California ranked below Washington (5) and New York (10), but above Arizona (28), Florida (31), Nevada (34), and Texas (49).
Income is strongly associated with health (P. A. Braveman, Cubbin, Egerter, Williams, & Pamuk, 2010). Nearly one out of every six children in California lives in poverty (16%). Although this is the lowest rate since 2000 and is similar to the national rate of 17 percent, it is higher than more than half of the states. Although the standard poverty measure accounts for household size and income, it does not account for differences in cost of living. However, according to the Supplemental Poverty Measure, which incorporates geographic variation as well as expenses like shelter, clothing and utilities that are not included in the official poverty measure, more than one out of five children (24%) in California are living in poverty (Figure 6). Although the proportion of children living in poverty in California has declined since 2012, California has the highest child poverty rate in the country.
Figure 6. Children in Poverty in California and the United States
Source: U.S. Census Bureau, American Community Survey PUMS
27%30%
32% 32%29% 29%
27%25% 24% 24%
19%20%
22% 21%20% 20% 19% 18% 18% 17%
0%
5%
10%
15%
20%
25%
30%
35%
2009 2010 2011 2012 2013 2014 2015 2016 2017 2018
Percent of Children in Poverty, Supplemental Poverty Measure, 2009-2018, California and U.S.
California United States
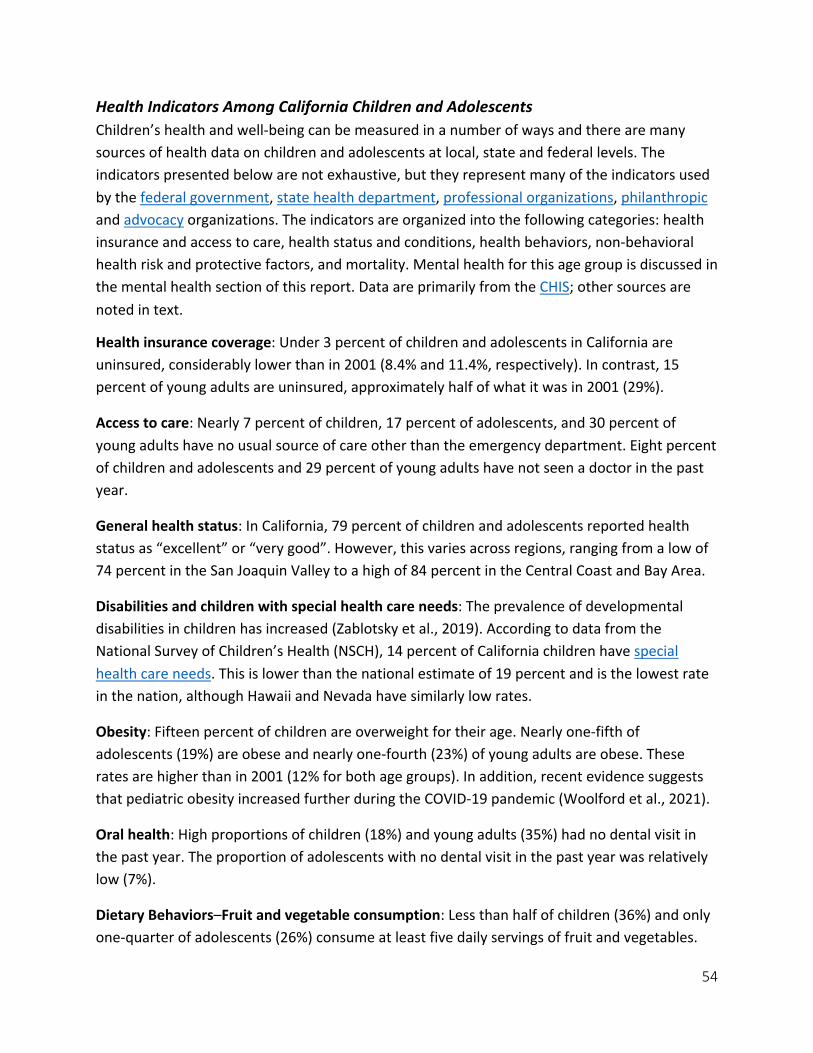
54
Health Indicators Among California Children and Adolescents Children’s health and well-being can be measured in a number of ways and there are many sources of health data on children and adolescents at local, state and federal levels. The indicators presented below are not exhaustive, but they represent many of the indicators used by the federal government, state health department, professional organizations, philanthropic and advocacy organizations. The indicators are organized into the following categories: health insurance and access to care, health status and conditions, health behaviors, non-behavioral health risk and protective factors, and mortality. Mental health for this age group is discussed in the mental health section of this report. Data are primarily from the CHIS; other sources are noted in text.
Health insurance coverage: Under 3 percent of children and adolescents in California are uninsured, considerably lower than in 2001 (8.4% and 11.4%, respectively). In contrast, 15 percent of young adults are uninsured, approximately half of what it was in 2001 (29%).
Access to care: Nearly 7 percent of children, 17 percent of adolescents, and 30 percent of young adults have no usual source of care other than the emergency department. Eight percent of children and adolescents and 29 percent of young adults have not seen a doctor in the past year.
General health status: In California, 79 percent of children and adolescents reported health status as “excellent” or “very good”. However, this varies across regions, ranging from a low of 74 percent in the San Joaquin Valley to a high of 84 percent in the Central Coast and Bay Area.
Disabilities and children with special health care needs: The prevalence of developmental disabilities in children has increased (Zablotsky et al., 2019). According to data from the National Survey of Children’s Health (NSCH), 14 percent of California children have special health care needs. This is lower than the national estimate of 19 percent and is the lowest rate in the nation, although Hawaii and Nevada have similarly low rates.
Obesity: Fifteen percent of children are overweight for their age. Nearly one-fifth of adolescents (19%) are obese and nearly one-fourth (23%) of young adults are obese. These rates are higher than in 2001 (12% for both age groups). In addition, recent evidence suggests that pediatric obesity increased further during the COVID-19 pandemic (Woolford et al., 2021).
Oral health: High proportions of children (18%) and young adults (35%) had no dental visit in the past year. The proportion of adolescents with no dental visit in the past year was relatively low (7%).
Dietary Behaviors–Fruit and vegetable consumption: Less than half of children (36%) and only one-quarter of adolescents (26%) consume at least five daily servings of fruit and vegetables.

55
Dietary Behaviors–Sugary beverage consumption. More than one-tenth of children (14%), one-third of adolescents (34%) and half of young adults (51%) drink one or more sodas every day. In addition, 41 percent of children and 36 percent of adolescents drink one or more sports drinks, energy drinks, or sweetened fruit drinks every day.
Physical activity: The proportion of children and adolescents who walked, biked, or skated home from school in the past year is relatively high: 40 percent of children and 48 percent of adolescents. However, nearly one-quarter of children (23%) and more than half of adolescents (56%) spend more than five hours per day sedentary on the weekend.
Risky health behaviors–Smoking: Cigarette smoking rates among adolescents are very low (below 1%) and have declined significantly from 6 percent in 2003. Rates have also declined for young adults from nearly 20 percent in 2003 to 5 percent in 2019. However, about 5 percent of teens and 12 percent of young adults are current e-cigarette users.
Risky health behaviors–Marijuana: High proportions of adolescents and young adults report having tried marijuana (55% of young adults and 16% of adolescents).
Risky health behaviors–Alcohol: Nearly 8 percent of teens engaged in binge drinking in the past month, which is the highest proportion since 2007 (4.8%).
Non-Behavioral Health Risk and Protective Factors
Food insecurity: Nearly half (46.8%) of low-income families with children were food insecure in 2019, increasing from 39.9 percent in 2017. In addition, 42.8 percent of young adults reported not being able to afford enough food. This proportion has been increasing and is the highest proportion since 2001 (25.3%).
Reach of nutrition assistance programs: In 2019, 44 percent of families with low-income (below 200% FPL) and with children under age 6 were participating in the WIC program and 25 percent were participating in CalFresh (California’s SNAP program). However, 72 percent of families with low-income and with children who experienced food insecurity in the past year were not participating in CalFresh—suggesting significant unmet need for nutrition assistance. This could be due in part to administrative or bureaucratic barriers to participation as well as to not meeting income eligibility criteria despite experiencing food insecurity and having low-income.
Housing cost burden: California has the highest proportion of children living in households with a high housing cost burden of any state in the U.S. (41% in 2019). For those in low-income households nearly three-quarters (73%) have a high housing cost burden. Yet, this has declined from a high of 55 percent in 2008, following national trends.

56
Education/Schools: Schools play a prominent role in health and development for children. State policies and school curriculums encourage school environments to be more supportive of healthy eating and physical activity. However, adherence to guidelines and implementation of policies intended to improve the food and activity environments at schools have been inconsistent. In addition to serving as a health care provider in some cases, educational programs both contribute to children’s health, and educational attainment are indicators of health and well-being.
Preschool participation: According to the Kids Count Data Center, half (50%) of young children (3-4 years old) in California are not enrolled in nursery school, preschool or kindergarten. This was higher than in New York (41%), similar to Florida (48%) and lower than Texas (57%), Arizona (61%), and Nevada (62%). The California Health and Human Services Agency released a Master Plan for Early Learning and Care: California for All Kids - a framework for early childhood education and care for the next decade. It calls for offering childcare to all 4-year-olds and low-income 3-year-olds, promoting quality preschool, and enhancing the workforce training for caregivers.
Vaccination rates: The majority of kindergartners–95 percent– in California have all required immunizations. School requirements have contributed to California’s high vaccination rates among school-aged children, which increased in 2016 following legislation that eliminated personal belief exemptions.
School meal programs: The National School Lunch Program, which provides low-cost or free lunches for students, reduces food insecurity. According to the National Center for Education Statistics, 59 percent of public-school students in California were eligible for free/reduced price meals in 2018-19. California is among the 10 states with the highest proportions of eligible students. Beginning in 2022, it will be the first state to offer free school meals to all public school students.
Adverse Childhood Experiences (ACEs) and Positive Childhood Experiences (PCEs): According to the NSCH, in 2018-19, 15 percent of children in California had two or more adverse childhood experiences, the fourth lowest rate in the nation. Although the NSCH measure of ACEs captures many experiences that can negatively impact health—including exposure to violence between adults, loss of a parent, and substance abuse (Felitti et al., 1998)—the measure may be too narrow to adequately capture how childhood trauma and adversity can negatively impact health. In addition, the existing measures of ACEs fail to account for varying degrees of severity of different traumatic experiences nor do they distinguish between a one-time traumatic event and ongoing/chronic trauma and some experts have questioned their suitability as screening tools and population health indicators (Anda, Porter, & Brown, 2020).

57
There is also emerging literature highlighting that ACEs measures do not consider how PCEs, such as strong parent-child attachment, positive parenting practices, good family health, and positive social relationships outside the home, may act as protective factors for health and well-being (C. Bethell, Jones, Gombojav, Linkenbach, & Sege, 2019; C. D. Bethell, Gombojav, & Whitaker, 2019; National Academies of Sciences, 2020; Sege et al., 2017)
Violence exposure can have significant health consequences (Rivara et al., 2019). However, there is emerging evidence that the negative effects of community and individual-level violence exposures can be mitigated and contained more effectively than in prior decades, especially among youth. For example: community cohesion programs such as Parks After Dark and policies that reduce problems such as youth truancy or promote positive programming such as youth diversion for at-risk youth.
In 2020, California began reimbursing health care providers for ACEs screening among patients covered by Medi-Cal.
Neighborhood safety: According to the NSCH, 57 percent of California children live in neighborhoods that their parents feel are safe. California ranks 48th among all states, higher than Nevada (54%); similar to New York (57%); and lower than Washington (60%), Florida (64%), Colorado and Texas (both 65%), and Massachusetts (74%). In a similar measure collected by CHIS, 50 percent of respondents with children reported always feeling safe in their neighborhood. This proportion is higher in rural areas (60%) and varies regional ranging from 43 percent in Los Angeles County to 57 percent in the Central Coast region.
Mortality
Infant mortality: According to vital statistics data from the CDC, California has one of the lowest infant mortality rates in the country (4.06 deaths per 1,000 live births in 2019) after New Hampshire and Massachusetts (both below 4). The rate has declined over time from 7.9 in 1990, although it appears to have leveled out since 2015. There are considerable disparities by race/ethnicity with the highest rates among Black/African American, multiracial, and Latinx populations.
Teen/young adult suicide: California has one of the lower suicide rates in the country. However, the rate among ages 10-24 increased significantly from 4.6 (per 100,000) in 2000 and to 6.9 in 2018 (Curtin, 2020).
Successes/Opportunities
Health coverage for children: California has historically low uninsured rates among children and young adults. The percent uninsured has declined from more than 9 percent uninsured in

58
2001 to 2.4 percent in 2019 for children, and from nearly 30 percent to 15 percent for young adults (Figure 7). However, uninsured rates for children and young adults have risen somewhat from the lowest points in 2016 through 2018.
Figure 7. Uninsured Children in California
Source: California Health Interview Survey
Smoking and tobacco: California has led the nation in establishing policies and programs around tobacco control. As a result, the smoking rate among teens declined from 6 percent in 2003 to less than 1 percent in 2019, and the proportion of current smokers among young adults is one-quarter of what it was in 2003 (5% in 2019 vs. 20% in 2003).
Failures/Challenges California continues to face several challenges in promoting health and well-being for all children, adolescents, and young adults. Many of these challenges are driven by social factors such as poverty and wealth, economic and employment opportunities for families, and systemic barriers such as availability of affordable nutritious food, statewide policies pre-empting action by local municipalities, funding levels for public schools, and limited benefit levels for public programs.
Health care costs continue to rise. Nationally, per capita health care spending for children increased from $2,020 in 2002 to $3,749 in 2014.
9%7% 6% 6% 5% 4% 4%
3%4% 3%
1% 2% 1% 2%
29% 28%29%
26% 27% 26% 25%24%
21%
14% 13% 12% 12%15%
0%
5%
10%
15%
20%
25%
30%
35%
2001 2003 2005 2007 2009 2011 2012 2013 2014 2015 2016 2017 2018 2019
Percent Uninsured Children and Young Adults, California, 2001-2019
Children 0-17 Young Adult (18-26)

59
Persistent health disparities. Latinx and Black children have higher rates of poverty relative to white children. A higher proportion of Latinx than white children have fair and/or poor health. Latinx, Asian, and multiracial adolescents are less likely to meet physical activity recommendations than white adolescents. Moreover, they are less likely to live within walking distance of a park or to live in a neighborhood that is perceived as safe. Both of these factors have been associated with more physical activity (Babey, Wolstein, & Diamant, 2018). Latinx, Black, and multiracial adolescents have higher rates of obesity and they are also more likely to live in neighborhoods where they don’t always have access to affordable fresh produce or to safe places to be active (Wolstein, Babey, & Diamant, 2015).
Child care costs are prohibitive. California is among the states with the highest childcare costs in the nation. Nationally, a family with median income for their state would need to spend 18 percent of income for infant care, and 13 percent of income for toddler care to pay for childcare that meets minimum licensing requirements; in California, they would spend 22 percent and 17 percent, respectively. In addition, there is a lack of available child care. In 2019, there were licensed child care spaces for only 25 percent of working families in California.
Obesity continues to be a challenge. There have been significant efforts to reduce childhood obesity, but rates have not declined. Although, rates among teens have not increased since 2015. In addition, consumption of sugary beverages has continued to increase. However, efforts to reduce consumption of sugary beverages and promote physical activity have been hampered by a number of factors including a statewide moratorium on sugary beverage taxes, inadequate and declining funding levels for public schools, and barriers to participation in public nutrition assistance programs.
Origins
State and federal policies together have led to historic lows in the proportion of uninsured children in California. The Children’s Health Insurance Program (CHIP) was created in 1997, a state-federal partnership that provides health insurance to low-income children in families who earn too much to qualify for Medicaid. The ACA expanded Medicaid eligibility to low-income adults ages 19-64 including those without children or who do not qualify based on a disability. The ACA allowed dependents up to age 26 to enroll in a parent's private insurance. More recently, California expanded Medi-Cal eligibility to children under 19 regardless of immigration status in 2016 (SB 75) and raised the age to 26 in 2020.
Children’s health is influenced by both their educational opportunities and their school environments. California has enacted several policies that support healthy eating and physical activity for children, particularly in the school setting. These include prohibiting sales of sugary beverages at school, setting nutrition standards for food sold outside school meal programs

60
(e.g., competitive foods), and mandating physical education at school. In addition, California law requires healthy beverages be the default in kids’ meals. However, many California schools struggle with insufficient funding to provide quality education and enrichment activities and there are wide disparities in resources by school district and even within school districts. Proposition 13, which limited increases in property taxes until property is sold, reduced availability of funding for schools. California went from having some of the highest per student funding of schools to among the lowest in the nation. In addition, there is a persistent achievement gap between low-income students and students of color relative to more affluent and white students. Efforts have been made to address resource disparities and the achievement gap, but both persist.
California leads the nation in establishing policies and programs around tobacco control. In 1988, Proposition 99 increased tobacco tax by 25 cents and specified tax revenue be spent on prevention programs, research, and providing health care services (Rogers, 2010). More recently, the state increased tobacco taxes again, began taxing e-cigarettes, and was the second state to raise the minimum legal age for purchase of tobacco products to 21. California was the first state to legalize marijuana for medical use, and in 2016, it was legalized for recreational use for adults 21 and older.
Trends
There is a growing movement to transform cities into places that support resilience and well-being so that all children can thrive. There are currently several initiatives globally as well as in California that could serve as models. For example, this toolkit outlines steps for creating a children’s cabinet which brings together decision-makers, organizations, and agencies from across a range of sectors that impact child health and well-being (e.g., health department, parks and recreation, libraries, school board, stakeholder groups representing parents or health clinics).
Cultural shifts in attitudes toward smoking have led to declines in teen smoking. However, due to legalization of marijuana, adolescents and young adults are demonstrating high rates of marijuana use (16% and 55%, respectively). There is also an increasing prevalence of chronic conditions and disability among children and adolescents (Newacheck & Halfon, 1998; Wise, 2004).
61
Preventing and Managing Chronic Conditions and Mental Health/Substance Use
Adult Chronic Conditions Facts
Chronic Disease Burden: A chronic illness is one that lasts one year or more and requires ongoing medical care or limits daily activities. Chronic conditions are the leading causes of death and disability in the U.S. An estimated 39 percent of people in California suffer from at least one chronic condition or disease (Brown, Gonzalez, & Dhaul, 2015). Almost 50 percent of all people with chronic conditions have multiple chronic conditions, and 25 percent of people with a chronic condition have some type of activity limitation. A recent analysis found that California had one of the lowest proportions of adults with multiple chronic conditions, lower than every other state except for Colorado and Minnesota (Newman, Tong, Levine, & Kishore, 2020).
Costs of Chronic Conditions in California: Chronic conditions are a primary driver of healthcare costs in the U.S., as well as in California. The costs of six common chronic conditions in California represented about 42 percent of total health care costs in 2010, which likely has risen since then, although more recent cost data by condition are not available for California (Brown et al., 2015). In addition, national data including a more complete inventory of chronic conditions suggests that 90 percent of annual health care expenditures are spent on chronic conditions.
Prevalence of Common Chronic Conditions: The prevalence of many of the most common chronic conditions are highlighted below. Data are from the California Health Interview Survey (CHIS), unless otherwise indicated. These data elucidate the increasing burden of chronic disease among Californians as well as numerous disparities in chronic disease by income, race/ethnicity, and region. Data shown here are not exhaustive of all chronic conditions and do not show all differences by income, race/ethnicity or region and are offered as examples.
● Diabetes: The prevalence of diabetes in California has nearly doubled between 2001 and 2019, rising from less than 6 percent in 2001 to 10 percent in 2019. Rates are higher among low-income adults and those living in rural areas. They are also higher among Latinos and Black adults than other races and ethnicities.
● Obesity: Obesity is a significant risk factor for several chronic conditions including diabetes, cardiovascular disease and some cancers. Nearly 60 percent of California adults are overweight (32.4%) or obese (27.3%). The prevalence of obesity among adults increased from less than 20 percent in 2001 to more than 27 percent in 2019. Rates of obesity are higher among low-income adults and higher among Latinx, Black, and AIAN

62
adults compared to other races and ethnicities (Note that childhood obesity is covered in the Child, Adolescent and Young Adult Health section of this report). Although obesity is modifiable and preventable, obesity has proven to be a very difficult issue to address. Obesity prevention requires policy intervention and multi-sector coordination as well as funding from both health care and non-health care sources.
● Hypertension: Hypertension, or high blood pressure, may be the single most important risk factor for heart disease and stroke (Fuchs & Whelton, 2020). In California, the prevalence of high blood pressure has increased from 22 percent in 2001 to 30 percent in 2018 (determined using the “ever diagnosed with high blood pressure” measure in CHIS; 2019 data are unavailable). Rates are higher among low-income adults and higher among Black and AIAN adults (over 40%) than other races and ethnicities. There are ongoing efforts in California and nationally to improve blood pressure control.
● Heart disease: Seven percent of adults in California have been diagnosed with heart disease in 2019, and rates have not changed drastically since 2001. Rates are higher among low-income adults, and are highest among AIAN and white adults relative to other races and ethnicities.
● Asthma: More than 15 percent of California adults have been diagnosed with asthma in 2019. The prevalence has increased slightly over time from 12 percent in 2001 and is higher among AIAN and multiracial adults as well as those adults with higher income levels. Note that asthma is also covered in the Child, Adolescent and Young Adult Health section of this report.
● Cancer: According to the American Cancer Society, in 2021 there will be an estimated 187,000 new cases of cancer in California and nearly 62,000 deaths. The highest incidence rates are breast, prostate, lung, and colon, and the highest death rates are lung, prostate, breast, and colon. Compared to other states, California has the sixth lowest cancer incidence rate and the seventh lowest cancer death rate in the U.S. There are more effective interventions to control cancer and, in some cases, prevent it including improved screening and treatment for breast and colorectal cancer, flavor bans and related policies intended to reduce vaping, and HPV vaccination to prevent cervical cancer.
● Arthritis: Approximately 19 percent of California adults have arthritis according to age-adjusted data from the 2019 Behavioral Risk Factor Surveillance System (BRFSS). The prevalence has been relatively stable for the past 15 years and does not vary significantly by income. Rates are higher among white, Black and AIAN adults relative to other racial and ethnic groups.
● Mental health is discussed in the Mental Health and Substance Use in California section of this report.

63
Regional differences in Select Chronic Conditions: The proportion of California adults with chronic conditions varies by region in the state. Data on obesity, heart disease, diabetes, and hypertension among adults by regions in California using CHIS, shows San Joaquin Valley had the highest prevalence of obesity as well as of diabetes compared to other regions and North/Sierra Counties had the highest prevalence of heart disease as well as of hypertension compared to other regions in the state (Table 1). Note there are other regional differences in chronic conditions not shown here.
Table 1. Percent of Californian Adults with Obesity, Heart Disease, Diabetes, and Hypertension by Region, California
Obesity (Body Mass Index >= 30)
Ever Diagnosed with Heart Disease
Ever Diagnosed with Diabetes
Ever Diagnosed with Hypertension
North/Sierra Counties
29% 9.5% 8.6% 34.5%
Greater Bay Area 21% 7.3% 7.8% 27.3%
Sacramento Area 28% 9.4% 10.1% 29.4%
San Joaquin Valley
39% 6.4% 13.6% 32.1%
Central Coast 21% 7.4% 9.0% 27.7%
Los Angeles 28% 6.7% 10.1% 30.3%
San Bernardino, Riverside 31.7% 6.7% 13.8% 31.0% Orange 21.8% 5.8% 7.1% 20.4% San Diego 28.8% 6.2% 9.3% 22.9% All 27.9% 7.2% 10.2% 26.4%
Source: California Health Interview Survey, 2019 data
Social Determinants of Health: Social determinants of health include access to and quality of education, economic resources, social context, and neighborhood and built environment, as well as access to and quality of health care. These factors, including built environment, access to green space and parks, and access to healthy foods have been linked to chronic conditions (Jilani et al., 2021; Marmot, Friel, Bell, Houweling, & Taylor, 2008). These conditions also vary geographically in the state and may contribute to geographic differences in chronic conditions and as well as overall health and well-being (discussed further in the section on Environmental Effects on Health in this report).

64
Successes/Opportunities Diabetes Prevention: California was the first state in the nation to mandate Medi-Cal coverage for Diabetes Prevention Program (DPP), which is a lifestyle change program designed for Medi-Cal beneficiaries diagnosed with prediabetes to prevent and delay the onset of type 2 diabetes.
California Office of Health Equity: California Department of Public Health Office of Health Equity (CDPH OHE) provides a leadership role to reduce health and mental health disparities in chronic conditions.
SSDoH and Place-Based Disparities: The Healthy Communities Data and Indicators Project (HCI) of the California Office of Health Equity has been important to the state as a means of surveillance of social determinants of health to identify place-based disparities. The HCI aims to improve public health by providing a standardized set of statistical measures and tools for planning healthy communities and evaluating the impact of policy and other changes on community health.
Failures/Challenges Persistent Disparities: The fact that there remain persistent disparities in chronic disease conditions throughout the state point to a failure to successfully address equity in prevention and disease management. The prevalence of many chronic conditions continues to increase, especially diabetes and hypertension. And, obesity prevalence remains high despite many interventions and programs intended to reduce obesity.
Health Care Quality and Costs: Chronic conditions are a major contributor to the costs of health care. If the prevalence of chronic conditions continues to increase, it will contribute to increasing health care costs. While data initiatives are in place to identify health and social determinant place-based disparities though efforts such as the HCI, there remains a dearth of data on the real-time costs of disease at the state level and data on the financial burden of chronic disease, such as the out-of-pocket costs for health care, among Californians. Furthermore, data on healthcare quality metrics, many of which track management of chronic diseases, show that health plan quality scores were stagnant at best on most measures over a 10-year period.
Mental Health and Substance Use in California Facts The bad news: self-reported mental health issues are rising. Rates of suicide ideation among adults have increased steadily, from 8.7 percent in 2009 to 14 percent in 2019 (CHIS). Self-reported rates of serious psychological distress have increased 9.1 percent in 2015 to 14.6 percent in 2019 (CHIS). Left untreated, serious mental illnesses (SMI) don’t only impact quality
65
of life, they also impact survival: On average, Americans with serious mental illnesses have life expectancies 25 years shorter than the general population, in part due to untreated physical health conditions.
The good news is that views about mental illness and people with mental illness have been changing. Civil rights for people with mental illness led to the attention of the horrific treatment and deplorable environments of state institutions which then led to the closure of these institutions. An increased public awareness and reduction in stigma have led more people to recognize their own needs and seek assistance. Along with the recognition is an increase in those seeking services from a professional for mental/drug/alcohol issues. Advancements in treatments have helped many individuals with SMI reach recovery and successfully live in community settings.
But is California meeting the challenge? There are three categories of mental health services, those for SMI in adults and Severe Emotional Disturbance (SED); mild to moderate mental health issues; and substance use disorders. Services in California are divided: Mental Health Services are split across multiple departments, which makes continuum of care and treatment for comorbid substance use disorders difficult for consumers and family.
Prevalence
The need for mental health services for a spectrum of challenges is on the rise in California. Recent data show: ● One in six Californians experience a mental illness and one in twenty-four Californians
experience a serious mental illness leaving them unable to function in daily life. ● One in three adolescents reported serious psychological distress and one in seven reported
moderate psychological distress. ● Prevalence of mental health disorders like depression and anxiety has been increasing over
the last 10 years. This is being seen among populations of color and young adults (Moore, 2018; Weiner, 2019b).
● The number of suicides in California the last two decades has grown more than 50 percent between 2001 and 2017 for all ages, but more than 60 percent for adolescents ages 15-19.
● Nine percent of individuals, ages 12 and over, had a substance use disorder (SUD) in the past year and are six times more likely to attempt suicide than those without SUD.
● One-third of adults receiving county mental health services for SMI had a co-occurring SUD. ● Reports estimate that one-quarter to one-half of the unsheltered homeless population has
a mental illness and/or substance use disorder (Novasky & Rosales, 2020). ● Jails and prisons have become the “new institutions” for individuals with a mental illness
with one-third of the incarcerated population having a mental illness (Brooks-Holliday,

66
2020; Weiner, 2019a).
Critical Ages for Prevention and Early Intervention
Services and interventions are needed across the life course. Half of all lifetime cases start by the age of 14 and 75 percent start by 24 years old (Kessler et al., 2007), with the first onset of psychosis typically occurring between the ages of 21 and 35 (Häfner et al., 1998). Older adults also experience the onset of comorbid conditions found in older adults, often around age 75 (de Girolamo, Dagani, Purcell, Cocchi, & McGorry, 2012). Suicide is the second leading cause of death for Californians, ages 10-34. Suicide attempts are more prevalent in younger ages while completed suicides are more prevalent in older ages. Mental Health Service System
Gaps in mental and behavioral health parity continue to exist in the private sector despite parity laws existing since 2008. The continuum of mental and behavioral health care in the public sector are provided across multiple systems and funding sources, and services and resources for acute mental health crises are limited. National standards require one acute psychiatric bed per 2,000 people. Unfortunately, however, California has one psychiatric bed per 5,856 population, and this varies by county (Dempsey, Quanbeck, Bush, & Kruger, 2020). In fact, almost half of California’s counties have no adult psychiatric beds and the vast majority have no psychiatric beds for children. Due to the closure of many board and care facilities, many individuals with SMI have been forced into homelessness with nowhere to go.
Access to Care
The earlier the age of mental health issue onset often results in longer delays in care (Wang, Berglund, Olfson, & Kessler, 2004). From their age of onset, delays in care ranged from six to eight years for mood disorders and nine to 23 years for anxiety disorders (de Girolamo et al., 2012; Dempsey et al., 2020). In fact, three out of four children, ages 4-11, do not receive needed mental health treatment despite having health care coverage. In California, approximately one-half of adults with serious mental health issues do not receive the care they need. One in six Latino adults and nearly one in seven Asian adults did not receive needed mental health care. Inmates with SMI wait months for a state hospital bed. Among California individuals with SUD, only about one in ten received treatment.
Workforce Shortage in Mental Health
Californian’s seeking care face many barriers due to a shortage in the state’s mental health workforce. The issue is not merely a matter of numbers, there is also a lack of diversity in the mental health workforce by race, ethnicity, language, and specialization in child and older adult

67
populations. Inequities in mental/behavioral health provider network use compared to primary care provider: patients seeking care are more likely to seek services outside the network covered by their insurance, and mental health providers receive less reimbursement than physical health providers. Individuals needing mental health services are less likely to receive care in the private sector than in the public sector (Grant et al., 2011).
The state is working to try to address these gaps. In September 2020, the Office of Statewide Health Planning and Development awarded $17.3 million in grants to seven programs to help further build the pipeline of public mental health professionals in California. Collectively, the grantees will add 36 Psychiatry Residency slots and fund 336 Psychiatric Mental Health Nurse Practitioner slots. The funding will also help launch a new Child and Adolescent Psychiatry Fellowship program.
Cost of Mental Health Services
Cost remains a major barrier. Medi-Cal outside of county Behavioral Health services in 2020 is estimated at: $118 billion (includes the mild to moderate benefit). Funding for Medi-Cal, uninsured and privately insured served by the public safety net is at approximately $8 billion, despite the fact that physical health services dropped in 2020 and mental health services increased.
Origins In 1963, the federal Community Mental Health Act was created in response to the horrific treatment of individuals with mental illness in deplorable state-run institutions. Through implementation of the Medi-Cal Mental Health Services Program in 1966, California provided federal fees for service reimbursements for mental health services which included psychiatric in-patient hospital services, nursing facility care, and professional services provided by psychiatrist and psychologists.
Specifically, in California, the Short-Doyle Program of 1965 required counties to ensure the delivery of mental health services from a system of county-operated contract providers. With the Lanterman-Petris-Short Act of 1967, California attempted to end the inappropriate, indefinite, and involuntary commitment of persons with mental illness. Shortly following this law, California added the Short-Doyle Medi-Cal Mental Health Services in 1971 in order to expand the scope of benefits of the Medi-Cal program, which then enabled counties to obtain federal matching funds on their costs for providing services such as in-patient services delivered in acute care hospitals, individual, group, or family therapy delivered in outpatient or clinic settings and various partial day or day treatment programs. This resulted in California having

68
two mental health delivery systems under Medi-Cal: state Fee for Service (FFS) and county based Short-Doyle services (SD).
California adopted Program Realignment also known as the Bronzan-McCorquodale Act in 1991. The intent of this law was to decentralize administrative and fiscal control of the mental health system from the state to the county level; it replaced general funds for mental health services with revenues raised from a sales tax hike (Masland, 1996).
At the federal level, Congress passed the Mental Health Parity Act (MHPA) of 1996, which prohibited large employer sponsored group health plans–both for fully-insured and self-insured group plans that offered mental health benefits–from imposing higher annual or lifetime dollar limits on mental health benefits than those applicable to medical or surgical benefits. California followed this federal law with Assembly Bill 88: Mental Health Parity in California in 1999. This law required all health care plans and all health insurance policies to cover the diagnosis and medically necessary treatment of nine severe mental illnesses of any age and serious emotional disturbances of a child.
California passed Laura’s Law (AB 1421) in 2002, which was recently reformed with AB 1976 in 2020. The intent of Laura’s Law was to provide court-ordered assisted out-patient treatment to individuals with mental illness who meet strict legal criteria and are unable, due to their mental illness, to voluntarily access community mental health services. California also approved Proposition 64 (the Mental Health Services Act) in 2004, which sought to create a proactive system of care rather than the current reactive system of care. To meet this goal, funds were set aside for community services and supports (CSS), prevention and early intervention (PEI) services, innovations, workforce, infrastructure.
The federal Mental Health Parity and Addiction Equity Act (MHPAEA) was passed in 2008, which was meant to prevent private health plans and insurers that provide benefits for mental health or substance use disorder from imposing less favorable benefit limitations for mental/ behavioral health services than for services for medical and surgical services. Specifically, it prohibited differences in treatment limits, cost sharing, and in- and out-of-network coverage.
California’s Mental Health Wellness Act (SB 82) from 2013 sought to provide grant funds through MHSA to improve access to and delivery of effective outpatient and crisis stabilization services. The Act’s goals were to better meet the needs of individuals in crisis in the least restrictive manner, and to cut costs through reduction of avoidable emergency department use, law enforcement involvement, and inpatient hospitalizations.
In 2014, the ACA increased health coverage and access to care for physical, mental, and behavioral health. It increased eligibility criteria for Medicaid up to 138 percent of the federal poverty level, mandated small group insurance plans and Medicaid expansion to cover 10

69
essential health benefits (EHB), which includes mental health and substance abuse disorders, and prevented health plans from denying coverage or imposing cost barriers because of preexisting mental health conditions. California’s implementation of the ACA in 2014 expanded Medi-Cal outpatient services for mild and moderate mental health problems through the Medi-Cal managed care program.
California passed the Drug Medi-Cal Organized Delivery System in 2015 to integrate Medi-Cal drug treatment programs into larger physical and mental health systems. In 2020, California passed SB 855 (Closing Loop-Holes in Mental Health Parity), which requires all commercial health plans to cover all mental health and substance use conditions at the same cost as physical health conditions, and must cover the full spectrum of all medically necessary treatment in all settings including medication management, therapist sessions, out-patient intensive treatment, and in-patient residential treatment. The law also mandates that if an enrollee cannot find an appropriate mental health provider in their health plan network, the health plan must arrange and pay for out-of-network services at no additional cost to enrollee.
Successes/Opportunities 988 Crisis hotline starting July 2022: DHCS will invest $20 million to support the launch of a mental health crisis hotline to connect callers to suicide prevention and behavioral health crisis counselors. The funding expands the statewide network of mental health call centers which anticipate an increase in, an alternative to 9-1-1 for callers reporting a mental health crisis.
Full-Service Partnerships under MHSA - 2005: Client-driven and recovery-oriented programs that extend Assertive Community Treatment (ACT) programs by emphasizing housing first and implementing a team approach have reduced hospitalization and incarceration.
Mental health services should also see benefits from improvements to CalAIM and Drug Medi-Cal, an organized delivery system. Both of these are addressed in the section on health delivery systems.
Proposed Reforms to the Behavioral Health Care System in 2020: Governor Newsom signed 16 bills to expand access to quality behavioral health care for all Californians and to help individuals experiencing homelessness and serious mental illness (Office of the California Governor, 2020). The administration also made more than $9 billion in investments in 2021 including grants to construct, acquire, and rehabilitate new facilities to expand the community continuum of behavioral health treatment resources, creating a new and innovative behavioral health system for youth ages 0 to 25, expanding the behavioral health workforce, funding for the Mental Health Student Services Act program, supporting evidence-based behavioral health programs, strengthening county prevention efforts to avoid youth entering the foster care system and addressing the complex needs of foster youth as an alternative to out-of-state

70
placements, addressing the lack of board and cares for individuals living on Social Security Income, including those with mental illnesses, and supporting the California Reducing Disparities Project under the California Department of Public Health.
SB 803 - Medicaid Peer Support Specialist Benefit: In 2020, California became the 49th state to opt in to the federal Medicaid Peer Support Specialist benefit. SB 803 required DHCS to seek federal approval to establish Peer Specialist as a provider type and to provide distinct peer support services under the Medi-Cal Specialty Mental Health Services and Drug Medi-Cal-Organized Delivery System programs.
Telehealth Flexibilities for Mental Health Medi-Cal Services: COVID-19 stay at home orders accelerated the rapid adoption of tele-mental health had to be implemented and for the most part was successful and improved delivery of services for some populations (Haque, 2021; Miu, Vo, Palka, Glowacki, & Robinson, 2020)).
Failures/Challenges Full Enforcement of Mental Health Parity: While state regulators have assessed and ensured parity compliance in financial requirement and quantitative treatment limits, parity for non-quantitative treatment limits such as utilization management, medical necessity criteria, and network adequacy are issues that continue to impede access to needed services.
Barriers for Private Practice Clinicians to Join Insurance Panel or Network: Nearly one-half of licensed psychologists have a private practice and many do not accept insurance due to administrative burdens associated with approval and reimbursement of care, low reimbursement rates and credentialing requirements (Fabian, 2020).
Medicaid Institutions for Mental Disease (IMD) Exclusion: Congress has failed to ensure mental health parity for Medicaid beneficiaries, ages 21 to 64, who need medically necessary care for SMI and/or SUD in inpatient psychiatric or residential treatment facilities larger than 16 beds. When those small facilities are full, someone experiencing a crisis is taken to an ER, often released into homelessness or incarceration.
Funding for Community-Based Services and Supports: The deinstitutionalization of people with serious mental illnesses was meant to provide care in less restrictive community-based settings. However, the lack of funding for community mental health centers and the lack of implementing wrap-around services to help people with SMI to live in the community has left many to become homeless or incarcerated. This, in turn, has led to individuals with SMI needing more intensive and costly services as well as more social supports to address basic needs of living like housing, food, health care and occupational supports like education, training, and employment.

71
Access to Timely and Appropriate Care: Individuals with mental health issues – across ages, across severity level, across insurance providers, and across continuum of care services – do not have access to timely and appropriate care.
Fragmented Mental and Behavioral Health Safety-Net System: Multiple funding streams and systems of care structures undermines consistent, coordinated, and comprehensive services that are easily accessible in a timely manner.
Integrated and Coordinated Physical, Mental, and Behavioral Health Care
Individuals with serious mental illness die 10-25 years earlier than the general population partially due to cardiovascular, respiratory, metabolic, and infectious diseases as well as barriers to care (Cunningham, Peters, & Mannix, 2013).
Racial and Ethnic Inequities: Black individuals are three to four times more likely to be diagnosed with schizophrenia than white patients (Schwartz & Blankenship, 2014). Findings from a large body of literature suggest that racial differences in the diagnosis of schizophrenia in the United States result in part from clinicians underemphasizing the relevance of mood symptoms among African Americans compared with other racial-ethnic groups (Gara, Minsky, Silverstein, Miskimen, & Strakowski, 2019).
A 2017 law established new requirements for data in access to mental health care for Medi-Cal recipients. The required reports indicate the racial and ethnic gaps in access, informing policy makers and program providers important evidence to develop new strategies to address these inequities. Major disparities in the digital divide were seen among populations of color and for homeless populations during the pandemic for mental telehealth services.
Data Collection: The state should assist counties in coordinating the collection of key information including:
● Mental and behavioral health needs assessment for adults, adolescents, and children. ● Mental and behavioral health needs assessment for homeless and incarcerated
populations. ● Suicide surveillance systems, including attempted suicides seen in ER. ● Surveillance of continuum of care services by county and service areas, in particular,
board and care facilities. ● Outcome data for adults and adolescents with SMI and children with SED, by
payer/delivery system
There are also limited statewide goals and data to demonstrate what has been accomplished with MHSA funds. State regulators (OAC and DHCS) do not collect outcome data on MHSA funded activities (other than Full Service Partnerships) in a way that allows for analyzing

72
activities across counties (Niendam et al., 2019).
Major challenges: Comprehensive and Fully Funded Mental Health Emergency/Crisis Response System: Twenty five out of 58 counties have some components of a crisis response system. Funding and support for a well-designed, non-coercive, trauma-informed crisis response system is needed in California.
Decriminalization of Mental Illnesses and Substance Use Disorders: Efforts like crisis intervention teams or co-responders show promising outcomes for connecting individuals with acute mental health crisis to appropriate mental health services such as assisted outpatient treatment (AOT) resulting in better outcomes for individuals with SMI including fewer interactions with criminal system (Dempsey et al., 2020).
Recovery Residence, Transitional and Affordable Permanent Housing: For individuals experiencing homelessness or incarceration and who have SMI and/or SUD, there is lack of housing options throughout their recovery period to ensure long-term recovery outcomes. Pending legislation seeks to address this issue.
Continuum of Care for Individuals with SMI or SED: Currently, our state hospitals largely serve a forensic or medically high risk population which limits access to individuals needing acute psychiatric hospitalizations (Dempsey et al., 2020). Similarly board and care facilities are reimbursed at a very low rate forcing many to close.
Mental Health Workforce Shortage and Lack of Diversity: The shortage of the mental health workforce is a major barrier to timely and appropriate care, especially for those with SMI and SED.
Trends
Reduction in Stigma: Views about mental illness and people with mental illness have been slowly changing over the past 60 years. Civil rights for people with mental illness led to the attention of the horrific treatment and deplorable environments of state institutions which then led to the closure of these institutions. Advancement in research and brain imaging has helped with understanding that many mental illnesses are brain disorders and not the result of individual weakness.
Increased Understanding of Mental Health, Mental Illnesses, and Recovery: Mental health literacy and the promotion of it has been increasing and will continue to increase.

73
Advancements in treatments have helped many individuals with serious mental illness reach recovery and successfully live in community settings.
Increased Understanding and Identification of Mental Health Inequities: There have been increased efforts to integrate mental/behavioral health with physical health for Medicaid recipients, including:
● Identification and understanding of the social and structural determinants of mental health inequities have been and will continue to increase. For example, racism and discrimination as social determinants of mental health inequities have been extensively documented.
● The World Health Organization’s leadership on acknowledging mental health as being more than the absence of mental illness has led to a more public health approach on the social determinants of mental health and emphasis on prevention and early intervention (Ilyas, Chesney, & Patel, 2017).
● Treatments to address social determinants have increased, for example, through trauma-based therapy.
Strengthening Health Systems in California
Health Care Delivery System and Financing Providing healthcare to all, which is so expensive in the U.S., is particularly challenging in economic downturns. When financially strained, California has made major cuts and limits to public health care benefits, as seen during the Great Recession and threatened early on in the COVID-19 pandemic. Financial pressures also lead employers to begin to shift towards offering high deductible plans. The section below offers selected facts about the current health care delivery and financing system of the state, major federal and state legislation that has led the current state of health care in California, and key trends that are likely to shape health care moving forward.
Facts
Health Insurance Coverage: Consistent with national trends, the main sources of health insurance for Californians are employer-sponsored insurance (ESI) (48%), followed by Medicaid (25%), and Medicare (11%) (see Figure 8). An estimated 7 percent of coverage comes through individually-purchased insurance–a critical option for the 2.2 million residents who do not qualify for ESI or public insurance. Covered California is considered likely the most successful ACA marketplace for individually purchased insurance in the U.S.

74
Figure 8: Comparison of Health Insurance Coverage Type Among Five Largest States, 2019
Source: Kaiser Family Foundation, State Heath Facts: Health Insurance Coverage of the Total Population, 2019
Health Care Premiums: Average annual employee contribution to premiums in California were slightly below the national average, according to an analysis conducted by the Kaiser Family Foundation using data from the Medical Expenditure Panel Survey (MEPS) Insurance Component, at $1,302 compared to $1,489 respectively. Employee contributions in Texas are $1,512. In contrast, employer contributions in California are higher than the national average, $5,637 compared to $5,483, respectively. And, in Texas employer contributions are lower than the national average at $5,455. While these California values may appear promising relative to the nation, Californians report struggling to afford job-based coverage premiums, with about 15 percent reporting being “very worried.” In California, premiums for the average family health plan in the employer market in California have increased 133 percent since 2002, outpacing inflation. Covered California, the state’s health care marketplace established under the ACA, has had a good track record of keeping premiums low with an average premium rate increase of 1.8 percent in 2022, and a three-year average of only 1.1 percent (2020-2022).
The Federal American Rescue Plan Act includes federal subsidies that replaced the state subsidies provided in 2020 for those with incomes up to 600 percent of the federal poverty level—removing the subsidy cliff, so no consumer will pay more than 8.5 percent of their premium (in effect through 2022). The increased federal subsidies will become permanent if the current $3.5 trillion human infrastructure bill passes Congress.
Access to Care: Access to care is a major concern for Californians and depends on health insurance, provider supply, and availability. Access to care also differs considerably across

75
regions in California. A study commissioned by the California Health Care Foundation on regional variations in the healthcare market in California found variation exists between regions and how localized the healthcare system in California can be. The variations are most apparent in the degree to which the regional market has been consolidated, the level of managed care use, provider shortages, and availability of safety net providers. Residents of the North/Sierra Counties in California have the most difficult time accessing care (CHIS 2019 results, Figure 9). Table 2. Percent of Californians Reporting Difficulty Finding Primary and Specialty Care, 2019
Californians reporting difficulty finding -
Primary Care Specialty Care
North/Sierra Counties 17.1% 23.4% Greater Bay Area 7.3% 13.4% Sacramento Area 7.4% 17.9% San Joaquin Valley 9.6% 17.6% Central Coast 9.6% 17.0% Los Angeles 8.2% 17.1% San Bernardino, Riverside 9.0% 17.9% Orange 4.7% 12.9%
San Diego 5.1% 11.8% All 8.0% 15.9%
Source: California Health Interview Survey, 2019 data Quality of Care: Quality care is that which is “consistent, affordable, patient-centered, timely, and delivered in a linguistically and culturally competent manner.” Quality care was propelled by the ACA with its mandate that at least 80 percent of health insurance premiums be spent on medical claims and improving quality of care. Covered California set an example in the state by setting benefit and quality rules for participating insurers to meet that required more standardization than what the ACA required.
At the wider state level there are state initiatives to track quality of care. Let’s Get Healthy California, for example, provides health assessment reports and improvement plans for a number of health indicators, with many metrics from the Healthcare Effectiveness Data and Information Set (HEDIS) and Office of Statewide Health Planning and Development – tracked across race/ethnic groups and regions across the state. Quality linked to payment through

76
incentive programs to improve quality of care are discussed in the Payment Reform subsection below.
Health system providers: Providers in the health care system include those working in primary care, specialists, hospital providers, long term care, and providers in oral health, mental health and substance abuse. We list below key issues impacting health system providers in California.
Workforce Supply: Employment in health care as a percent of total employment in California is low compared to other states – California ranks 44th with 10 percent employed in health care, compared to 14 percent in New York and 11 percent in Texas (KFF, 2020). About 44 percent of the need for health professionals is met in California compared to 58 percent for Texas using the Primary Care Health Professional Shortage Areas (HPSAs) metric (KFF, 2020). It is estimated that about one-third of Californians (or 11,226,111 people) live in an area with a shortage of primary care providers.
As the population ages, the shortage is expected to worsen in the state. California is projected to have a shortage of about 4,100 primary care providers and 600,000 home care workers if the current trend continues. Other projections show that demand for primary care providers in California will increase by 12 to 17 percent above the current demand. Workforce shortages within California show a high degree of variation county by county with the worst shortages in non-urban counties. For example, while 7 percent of residents in Alameda County are in a HPSA, 100 percent of residents in Calaveras County are in a HPSA.
Furthermore, underrepresentation of Black, Latino, and Native Americans in the health workforce exists and continues to persist. The availability of providers who are willing to provide care to low-income populations and participate in the safety net system is of specific concern. Even in urban areas that are not considered HPSA areas, safety net providers, such as community clinics, struggle to compete with large healthcare systems and providers in hiring and retaining primary care providers. California’s safety net system consists of a patchwork of county-owned hospitals, community clinics, federally-funded health centers, and a relatively small share of private providers participating in Medi-Cal. Most low-income undocumented residents receive preventive, primary, and specialty health care services to from counties and health centers as cornerstones of the safety-net programs.
Consolidation: Like much of the U.S., California is experiencing consolidation of providers in two ways–consolidation of solo and provider groups into larger groups, and consolidation of solo and provider groups into hospital systems and similar organizations. A number of studies point to consolidation raising prices and premiums, limiting access to care, and contributing to physician burnout with mixed evidence on quality improvement (Beaulieu et al., 2020; Scheffler, Arnold, & Whaley, 2018).
77
Policy Makers and Regulators: California has been a trendsetter in developing and implementing bold policies that are not just driven by politicians, but through the work of advocates, who are a voice to the people and often driven by research, as well as industries that have a financial interest in health care policy. The California legislature regularly introduces bills that impact multiple aspects of health insurance including benefits, cost-sharing, and providers. Per the National Conference of State Legislatures, state legislatures decisions can include budget appropriations, requirements for doctors obtaining their licenses, which services are covered by insurance, how personal health information is managed, and which immunizations children must receive, among many other issues. California is one of few states that has an independent body to review medical, financial, and public health evidence to assess how they are impacted by proposed health benefit mandate legislation, called the California Health Benefits Review Program, which has informed decision-making (Charles et al., 2017; Kominski, Ripps, Laugesen, Cosway, & Pourat, 2006). California also has advocates representing consumers, communities of color, and other vulnerable populations, who work together to advance their interests, increase access to health care services, and work towards a more equitable health care system.
Charged to protect consumers’ health care rights and to ensure stability in the health care delivery system, California Department of Managed Health Care (DMHC), serves as California’s primary health insurance regulator. DMHC regulates over 95 percent of commercial and government health plan enrollment; some provider organizations are regulated by the California Department of Insurance (CDI). DMHC uses a number of key indicators to regulate: rates, timely access to care, continuity of care, and health equity.
Successes/Opportunities Coverage: The number of Californians who are uninsured has halved over the last two decades (Figure 10). Uninsurance rates have declined for all race/ethnic groups and coverage disparities between groups have narrowed over time (Figure 11).

78
Figure 10. Trends in Health Insurance Type in California for All Ages from 2001-2019
Source: California Health Interview Surveys
Figure 11. Trends in Uninsured Rates in California by Race for All Ages from 2001-2019
Source: California Health Interview Surveys
Quality of Care Measurement and Reporting: California has made strides in healthcare quality measurement and reporting through the use of public facing dashboards and reports based on administrative and clinical data from the Healthcare Effectiveness Data and Information Set
26% 29% 29% 28% 30% 33% 34% 33% 37% 43% 45% 42% 42% 38%
60% 57% 58% 59% 55% 53% 52% 53% 51% 49% 48% 51% 51% 55%
15% 14% 14% 13% 15% 14% 15% 14% 12% 8% 7% 7% 7% 7%
0%
20%
40%
60%
80%
100%
2001 2003 2005 2007 2009 2011 2012 2013 2014 2015 2016 2017 2018 2019
HEALTH INSURANCE TYPE IN CALIFORNIA FOR ALL AGES, 2001-2019
Public Private Uninsured
0.0%
5.0%
10.0%
15.0%
20.0%
25.0%
30.0%
2001 2003 2005 2007 2009 2011 2013 2015 2017 2019
Latino
White (non-latino)
Black or AfricanAmerican (non-latino)
Asian (non-latino)
All

79
(HEDIS) the Consumer Assessment of Healthcare Providers and Systems (CAHPS). Moreover, the California Office of the Patient Advocate annually displays clinical performance and patient experience data for the state's largest HMO and PPO health plans on the Health Plan Report Card. The Department of Managed Health Care’s (DMHC’s) Health Equity and Quality Committee will provide initial recommendations on standard health equity and quality measures in 2022 to the state, including annual benchmark standards for assessing equity and quality in health care delivery (CA Health and Safety Code Section 1399.870).
Covered California: California has made significant efforts to regulate the individual market. More than 1.5 million people enrolled in Covered California in 2021, with more than 85 percent of enrollees in health plans with ratings of three or more stars. Covered California successes include a number of initiatives and policies that have increased coverage while keeping premiums down and maintaining a healthy risk pool such as: Covered California’s community-based organization (CBO) navigator program to improve enrollment, a standardized health benefit plan for all insurers to comply with, state subsidies to supplement federal Advanced Premium Tax Credits (which served as a model for the American Rescue Plan’s increased federal tax credits for 2021 and 2022), a corresponding state health coverage mandate/penalty, and requiring plans meet certain quality measures and health outcomes to reduce health disparities. California is the only state that requires all plans on the individual market be standardized.
Managed Care: Managed care has a strong presence in the state (Melnick et al., 2018). The drive to managed care in California really accelerated in the early 1980s when the state allowed insurers to use selective contracting with providers (i.e., to exclude providers from their networks). Care in the Medi-Cal program is mostly provided by managed care organizations that cover medical procedures, office visits, and other health-related expenses. Over 80 percent of all Medi-Cal beneficiaries are enrolled in one of six managed care models.
Medi-Cal 2020 Demonstration: California has implemented a series of Section 1115(a) Medicaid Waivers, the latest of which was called Medi-Cal 2020 and was approved by the Centers for Medicare & Medicaid Services, which operated from 2016 to 2020 with a one-year extension for several major programs. The Medi-Cal 2020 Demonstration aimed to transform and improve the quality of care, access, and efficiency of health care services for all Medi-Cal members. For example, under this 1115 waiver, Medi-Cal expanded access to substance use disorder services and launched the Drug Medi-Cal Organized Delivery System (DMCODS). In 2020, 37 of California’s 58 counties were actively implementing DMCODS, representing 96 percent of the Medi-Cal population statewide.
Whole Person Care (WPC) was another key initiative under the 1115 Medicaid waiver, with California launching a $3 billion pilot program to coordinate the care of high utilizing Medi-Cal

80
beneficiaries across their medical, behavioral, and socioeconomic needs. Twenty-five pilot programs across the state were awarded WPC funds. These pilots were largely successful in achieving program goals namely in improving data sharing and delivery-system infrastructure for cross-sector coordination of care (Chuang et al., 2020). The WPC pilots reported lessons learned on how to transition into the larger initiative Medi-Cal is undertaking with its CalAIM plan (Pourat, O’Masta, Haley, & Chuang, 2021), described below, and is illustrative of how Medi-Cal pilots turn into larger programs and initiatives after examination of impact.
CalAIM Initiative: Following the Medi-Cal 2020 Waiver, DHCS launched the California Advancing and Innovating Medi-Cal (CalAIM) initiative to continue advances made under the waiver and to implement new projects. The initiative is far-reaching and is a multi-year plan to seamlessly integrate health and social services. Several of the programs will begin in January 2022, and additional ones will be phased in later. CalAIM includes a fourth Section 1115 waiver that will continue through 2027. One key feature of CalAIM is to reduce variability across counties in access and quality of programs. While not yet implemented, the CalAIM plan represents an opportunity for Medi-Cal to continue its push to provide quality care in a coordinated manner.
Medical Interpreter Project: DHCS is implementing a pilot Medical Interpreter Project in up to four counties to provide interpreter services to LEP Medi-Cal beneficiaries. Given the cultural/linguistic diversity of Californians (see Racial Justice for more details), initiatives like this that address cultural and linguistic competence help ensure health care quality and access for more Californians.
Nurse Practitioners (NPs) Scope of Work: California has made efforts to address limitations in supply of primary care providers. One example is through the use of NPs to help relieve the primary care provider shortage in the state. Historically, California has been one of 22 states that restricted NPs from working without physician oversight. However, this will change with Assembly Bill 890 that will take effect in 2023, and NPs will be allowed to practice independently. The bill stipulates that NPs qualify only after having worked for three years under a physician’s supervision.
Federally Funded Health Centers: The expansion of Medi-Cal in California following the ACA has led to an increase in availability of primary care due the growth of Federally Qualified Health Centers (FQHCs). These are nonprofit organizations and premier providers of primary care in the safety net. They provide care to low-income and uninsured patients regardless of ability to pay. In 2019, California’s Federally Qualified Health Centers (FQHCs) served 5.6 million patients and 26.4 million patient visits. The number of FQHCs in the state has grown substantially in the period between 2013 to 2019 according to a recent report, amounting to increases of 40 percent in patients and 66 percent in visits over the review period. California

81
health centers expanded to 1,963 delivery sites in 2019, an increase of 147 locations–or 8 percent–over the prior year.
SSDoH Innovations: Californians—government, nonprofits, communities, health systems, researchers—have been investing in a variety of innovative initiatives to promote and integrate health and well-being. Researchers and health delivery systems are co-developing an array of screening tools for social needs; hospitals and clinics have built out food “farmacies” and fostered partnerships to improve education, housing, and income outcomes. California has invested in multi-billion dollar housing initiatives and localities have made commitments to racial equity, children’s health, the environment; a variety of actors, including government, foundations, and nonprofits are funding community development and place-based initiatives; health insurers are also researching and spending hundreds of millions on housing and food insecurity interventions (Alderwick, Gottlieb, Fichtenberg, & Adler, 2018; Donohue, Severson, & Martin, 2021; Gottlieb, Wing, & Adler, 2017; Jutte, Miller, & Erickson, 2015).
Payment Reform: California continues to promote value-based payment reform as a tool to promote health and increase accountability. This mechanism has been used in the last two Section 1115 Medicaid Waivers including the Public Hospital Redesign and Incentives in Medi-Cal (PRIME) under Medi-Cal 2020 and is continuing this effort under the Quality Incentive Payment for public hospitals. These initiatives are trying to change the financial incentives of the health system in California and to promote high-value care and reduce waste and low value care (Joynt Maddox & McClellan, 2019; McCullough et al., 2020; Shrank, Rogstad, & Parekh, 2019). Health plans and physician groups in California have been working on pay for performance programs with the Integrated Healthcare Association since 2011.
Health Care Affordability: California is proposing the creation of the Office of Health Care Affordability (OHCA) in recent legislation AB 1130 and the 2021-2022 Governor’s Budget, which would study high costs and would include a commitment to shifting further towards value-based care. It will also set enforceable cost-growth targets, by sector and region and offer tools to meet those goals, and focus on accountability, for example requiring performance improvement plans and including commensurate financial penalties when not met.
Failures/Challenges Lack of Universal and Effective Coverage: Despite Medi-Cal expansion and establishment of Covered California to facilitate purchase of subsidized and affordable individual health insurance following the affordable care act, close to 8% of California’s population remain without health insurance. This is in part due to lack of affordable options for some Californians, lack of knowledge of available benefits and programs, or ineligibility due to immigration status. Among the uninsured, the ACA implementation was correlated with a decline in uninsured rates but the significant remaining uninsured Californians report cost as the main factor for

82
their uninsured status and these numbers are steadily rising (see Figure 12). Among the insured, ESI remains a main source of health insurance but there has been a two-decade decline in the number of individuals covered by ESI (5% within California from 2001-2019). ESI provides more affordable insurance than that purchased on the individual market, despite subsidies for the latter. Individuals who rely on the individual market are reporting difficulty paying for their insurance plans and cost-sharing, such as deductibles, co-pays, and co-insurance (Mulkey and Wilson 2019), resulting in one-quarter deferring or not obtaining care altogether. Beyond financial barriers, there are also access issues such as finding reliable transportation and culturally and linguistically competent care. These challenges raise concerns for affordability, access, and care coordination among the insured. Unemployment during the COVID-19 pandemic has also demonstrated the volatility of relying on ESI as a source of health insurance. Figure 12: Trend in Remaining Uninsured Adults Aged 18-64 Identifying Cost as Main Reason for Current Uninsured Status from 2007-2019
Source: California Health Interview Surveys
Fragmentation in Financing and Delivery and Lack of Care Coordination: There is considerable fragmentation and inequity in the current healthcare system, related in part to funding siloes that have led to silos in delivery of health care. Many patients struggle to find a provider that accepts their health insurance including specialty care, mental and behavioral health services, and social services. Recognizing this failure, the Healthy California for All Commission was established in 2019 to develop a plan for advancing progress toward achieving a health care delivery system for California that provides coverage and access through a unified financing
0.0%
10.0%
20.0%
30.0%
40.0%
50.0%
60.0%
70.0%
2007 2009 2011 2013 2015 2017 2019
Adult 18-24 Adult 25-39 Adult 40-64 All

83
system. This includes exploration of how a single-payer financing system can be established. Despite CalAIM and delivery of care coordination to Medi-Cal beneficiaries, these efforts are not universal among all payers.
Limited Focus on SSDoH, Need for Expansion: The challenges in the existing healthcare system requires culturally and linguistically competent care, a culturally diverse workforce, and integrating oral, mental, and behavioral health. However, for all Californians to achieve health and well-being requires an increasing focus on overall well-being and giving everyone an equal opportunity to thrive. This includes equitable access to quality education, access to clean environments and green spaces, access to healthy foods, financial security, safe housing, and employment opportunities that support a living wage. While California has made some notable progress in this area through the use of various programs (as noted above under Successes/Opportunities), more needs to be done to achieve equity in SSDoH.
Origins
While there have been many efforts at healthcare reform in California and nationally over the last century (Starr, 1982), our existing health care financing system is heavily shaped by employers and the government.
After the creation of Medicare and Medicaid in 1965, the Medicare expansion to individuals with long-term disabilities or end-stage renal disease in 1972, and the creation of the State Children’s Health Insurance Program in 1997, the Affordable Care Act (ACA) in 2010 was a major policy shift for the U.S. to expand health care coverage. The ACA offered states the opportunity to expand public and private health care coverage through the use of premium subsidies for private coverage purchased in a health insurance exchange, an individual health insurance mandate, and the option to expand Medicaid. As of 2021, 39 states (including Washington, D.C.) chose to expand Medicaid. California was among the first to adopt and implement expansion.
Many of California’s key policy decisions to improve health care delivery have happened after the ACA. Though numerous attempts at introducing a single-payer system have failed, they are notable for the fact that it has been an issue policymakers have thought about and grappled with. Below are the key policy actions in California policy that have shaped health care delivery in the state.
1966 Creation of Medi-Cal, California’s Medicaid program.
1995-1996 Implementation of strategic plan for managed care in Medi-Cal program; Began the movement towards managed care in the state.

84
1997 California Healthy Families Program (initially this was the implementation of the SCHIP national program and it was later folded into the Medi-Cal program). Health care coverage was given to children with low family income but above the Medi-Cal eligibility limit.
2010-14 ACA Implementation and Medi-Cal Expansion – Citizen and lawfully present childless adults with income at or below 138 percent of the federal poverty level (FPL) and parents with income between 108 percent and 138 percent FPL also became newly-eligible for Medi-Cal.
Creation of Covered CA health care marketplace: Citizens and lawfully present immigrants with incomes at or below 400% FPL who are not offered coverage through an employer, or whose employer-sponsored insurance is unaffordable (costs more than 9.69% of worker’s household income) or does not meet a “minimum value” standard of benefits, are eligible for subsidies to help them afford coverage through Covered California.
2015-16 CA Health4All: Medi-Cal coverage for undocumented children, expansion of eligibility for safety-net services.
2019-2020 Young Adult Expansion of Medi-Cal coverage for undocumented adults under 26 years of age.
2016-2020 Various bills in California to ensure health care access and affordability, many in response to uncertainty around ACA at federal level under the Trump administration.
● Protect patients from surprise bills and cost-sharing limits put in place.
● Reinstated the penalty for not having health insurance.
● Established California generic manufacturing, which permits the state to contract directly to make generic drugs and distribute under California label.
● Established Health Care Cost Transparency Database within the Office of Statewide Health Planning and Development (OSHPD) to collect data on costs, quality, and equity to inform policy decisions.
● State subsidies to supplement the federal subsidies, up to 600% FPL
2021 Medi-Cal Expansion to Seniors, 50 years and older (in effect May 2022)

85
The ACA in 2010 was a major policy shift for the U.S. as a whole and expanded both public and private health insurance coverage of individuals, with California having gone further than most states in providing access to health insurance coverage by expanding eligibility for the Medi-Cal to all low-income adults earning up to 138 percent of the FPL guidelines (Kominski, Nonzee, & Sorensen, 2017). Prior to ACA implementation, California had the largest number of uninsured of any state in the country. Since the ACA coverage expansion went into effect in 2014, the uninsured rate in California declined from 15 percent in 2013 to about 8 percent in 2019. California became the fifth state to expand health insurance coverage to all children in 2015 when Governor Brown signed into law SB 4, the Health for All Kids Act. California joined the small group of states that had already expanded coverage to all children regardless of the immigration status of the child—Washington, New York, Massachusetts, Illinois, and the District of Columbia. With SB 75 (Full Scope Medi-Cal for All Children) in place, starting May 2016, children under nineteen years of age are eligible for full-scope Medi-Cal benefits regardless of immigration status, as long as they meet all other income eligibility requirements (Welfare and Institutions Code section 14007.8). In 2019, Medi-Cal was expanded to adults under twenty-six years of age starting in 2020 via the Young Adult Expansion, modeled after SB 75, which also amends the California Welfare and Institutions Code 14007.8. Most recently, in 2021, Medi-Cal has expanded its program to one of the most vulnerable populations, those unauthorized immigrants 50 and over who need health care the most.”
Trends
Costs of Care: Healthcare in the U.S. is expensive – relative to the size of its economy the U.S. spends a much greater amount on health care per capita than other countries – for example health spending per person in the U.S. in 2019 was $10,966, compared to $4,653 in the U.K. and $7,732 in Switzerland. The burden on paying for health care in the U.S. is higher for those with the lowest incomes; it is estimated that in the U.S. households in the bottom fifth of the income group pay about 34 percent of their income toward health care (compared to 16% for the highest income group). There is deep concern, even among corporate leaders, that the cost of health care is to become unsustainable if trends continue.
Despite efforts to improve health care coverage and legislative efforts to reduce the burden of health care costs on individuals and families, Californians still struggle to afford health care. Fortunately, national trends indicate a decline in medical debt. But, in a CHCF study on affordability of health care, authors cite the average cost of a family health insurance plan in California is nearly $20,000 per year, which is nearly one-third of median family income in the state. The average deductible facing a California family exceeds $3,000 and the average copay for a physician office visit is about $25. Lowering the cost of health care ranked high in the list

86
of Californians priorities in 2019 according to a survey by KFF. The state is exploring ways to tackle costs, often focusing on costs of drugs, for example by venturing into the production of generic medications with SB-852. The future of this bill is uncertain and unclear whether it would dramatically bring down costs of certain drugs.
Health Care and Public Health Budgets: Related to the rising costs of care, the healthcare budget in California is growing large, with the largest jump between 2018-19 and 2020-21 and likely even larger jump in 2021-22 with investments in health care spending post COVID-19 pandemic. California policymakers are eyeing a large increase in the budget given the unprecedented $85 billion budget surplus from higher-than-expected tax revenues and federal COVID-19 relief funding. It is uncertain that this type of surplus will occur again in future years, thus policymakers see this as a one-time short-term spending hedge against a potential downturn. Public health, notably, makes up about 2 percent of the Health and Human Services budget in California.
In recognition of the need to strengthen the state’s public health system to address public health emergencies and to move towards a more equitable health care system, especially after COVID-19, more funding has been provided by the federal government, as well as increased state funding invested in the state and local public health departments, which needs to continue. In efforts to better develop the public health infrastructure in the state, the Department of Public Health will conduct a study on identifying the needs to develop an “agile and flexible public health infrastructure at the local and statewide level” and have a plan in 2022. Whether this will lead to investments in public health remains to be seen. California’s relationship to the federal government for its health care budget is critical to the future of healthcare in the state. About 65 percent (or two-thirds) of the Medi-Cal budget is federal, 23 percent is from the State General Fund, and the remainder is Other State and Local funds. Medi-Cal's share of all General Fund spending has remained relatively constant in the last eight years with most of the spending growth coming from federal funds. Thus, California’s future spending on Medi-Cal is highly tied to the economic trends and political will at the federal level.
Technology and Innovation: Technology and innovation may provide numerous opportunities to improve connectedness of patients with providers and treatment through the growth and development of telehealth and data-sharing platforms. California has seen an increase use of and reimbursement for telehealth services which has uncovered the need for a more integrated Wi-Fi network across California, especially in rural communities. Technology offers the opportunity of reaching patients through telehealth and a variety of digital interventions, and targeting testing and treatment through precision medicine, particularly in California as it is home to numerous technology companies and start-ups working on health solutions.

87
Apart from the connectedness of providers with patients, better technology or data platforms offer the opportunity of systems to communicate with each other (interoperability) to improve care delivery and integration of clinical care with social determinants of health. One of CalAIM’s anticipated new benefits will be the Enhanced Care Management (ECM) benefit, which will bridge clinical care with nonclinical services and for which a focus on technology in data exchange and sharing is critical and investments will need to be made on data sharing and integration across systems. Federal rules to be implemented in 2022 will allow patients download their electronic health records and other health care data onto their smartphone. Allowing patients greater access to their health records is an attempt to allow people have greater autonomy and ability to manage their own health care.
While there may be hope that technological solutions will help build the bridge to integration, there have been notable failures for big sweeping successes of technology to provide transformation in the healthcare industry. For example, the dissolution of Haven, the joint health venture between Amazon, JPMorgan, and Berkshire Hathaway, was anticipated to transform healthcare delivery. Furthermore, technology may also further exacerbate existing inequalities, including the lack of access to, or facility in using, the internet, broadband, and digital technology, and low technology literacy. Telehealth is a good example of how it may have the potential to improve access to care for all, but has also the threat of increasing disparities in access by creating a larger digital divide. Other large concerns are around how technology may deepen racial hierarchies. Some concerns from race scholar Ruha Benjamin include algorithmic bias because algorithms are not race-neutral. She suggests that technology may instead reproduce racial/digital divides where there is “surveillance and control for some, security and freedom for others," including corporations, researchers, health systems, and providers shielded by a technological façade (Benjamin, 2019).
Conclusion California has continuously worked to improve health coverage to its residents and has the potential to provide health coverage to all Californians in the coming decades. However, health coverage is unequal in quality and cost, fragmented in funding and delivery, and difficult to navigate for the average resident and especially for individuals with disabilities, LGBTQ communities, populations with limited English proficiency, immigrants, individuals with mental health conditions, and individuals and households facing poverty and low incomes. The current healthcare delivery system is fragmented and has not been addressed the social needs of individuals largely due to the historical precedents of how health insurance has been tied to employment and how health care has been focused on what happens inside clinic and hospital walls in the U.S. At a minimum, health and well-being for all Californians will require a commitment to universal effective coverage: that everyone can access quality and affordable health care through an integrated health system. For Californians to thrive requires we move

88
beyond treating sickness and towards treating the structural determinants of health inequities (see WHO Framework in Figure 1) through an integrated health system that also tackles social and structural barriers and needs.
89
References
Alderwick, H. A. J., Gottlieb, L. M., Fichtenberg, C. M., & Adler, N. E. (2018). Social Prescribing in the U.S. and England: Emerging Interventions to Address Patients' Social Needs. Am J Prev Med, 54(5), 715-718. doi:10.1016/j.amepre.2018.01.039
Anda, R. F., Porter, L. E., & Brown, D. W. (2020). Inside the Adverse Childhood Experience Score: Strengths, Limitations, and Misapplications. Am J Prev Med, 59(2), 293-295. doi:10.1016/j.amepre.2020.01.009
Anderson, C. M., Kissel, K. A., Field, C. B., & Mach, K. J. (2018). Climate Change Mitigation, Air Pollution, and Environmental Justice in California. Environ Sci Technol, 52(18), 10829-10838. doi:10.1021/acs.est.8b00908
Babey, S. H., Hastert, T. A., Meng, Y. Y., & Brown, E. R. (2007). Low-income Californians bear unequal burden of asthma. Policy Brief UCLA Cent Health Policy Res(Pb2007-1), 1-7.
Babey, S. H., Wolstein, J., & Diamant, A. L. (2018). Few California Children and Adolescents Meet Physical Activity Guidelines. Policy Brief UCLA Cent Health Policy Res, 2018(8), 1-8.
Bailey, Z. D., Feldman, J. M., & Bassett, M. T. (2021). How Structural Racism Works - Racist Policies as a Root Cause of U.S. Racial Health Inequities. N Engl J Med, 384(8), 768-773. doi:10.1056/NEJMms2025396
Bailey, Z. D., Krieger, N., Agénor, M., Graves, J., Linos, N., & Bassett, M. T. (2017). Structural racism and health inequities in the USA: evidence and interventions. Lancet, 389(10077), 1453-1463. doi:10.1016/s0140-6736(17)30569-x
Balmes, J. R. (2020). The Changing Nature of Wildfires: Impacts on the Health of the Public. Clin Chest Med, 41(4), 771-776. doi:10.1016/j.ccm.2020.08.006
Beaulieu, N. D., Dafny, L. S., Landon, B. E., Dalton, J. B., Kuye, I., & McWilliams, J. M. (2020). Changes in Quality of Care after Hospital Mergers and Acquisitions. New England Journal of Medicine, 382(1), 51-59. doi:10.1056/NEJMsa1901383
Benjamin, R. (2019). Race After Technology : Abolitionist Tools for the New Jim Code: Cambridge: Polity.
Bethell, C., Jones, J., Gombojav, N., Linkenbach, J., & Sege, R. (2019). Positive Childhood Experiences and Adult Mental and Relational Health in a Statewide Sample: Associations Across Adverse Childhood Experiences Levels. JAMA Pediatr, e193007. doi:10.1001/jamapediatrics.2019.3007
Bethell, C. D., Gombojav, N., & Whitaker, R. C. (2019). Family Resilience And Connection Promote Flourishing Among US Children, Even Amid Adversity. Health Aff (Millwood), 38(5), 729-737. doi:10.1377/hlthaff.2018.05425
Blazer, D. G. (2003). Depression in late life: review and commentary. J Gerontol A Biol Sci Med Sci, 58(3), 249-265. doi:10.1093/gerona/58.3.m249

90
Braveman, P., Egerter, S., & Williams, D. R. (2011). The social determinants of health: coming of age. Annu Rev Public Health, 32(1), 381-398. doi:10.1146/annurev-publhealth-031210-101218
Braveman, P. A., Cubbin, C., Egerter, S., Williams, D. R., & Pamuk, E. (2010). Socioeconomic disparities in health in the United States: what the patterns tell us. American Journal of Public Health, 100 Suppl 1(Suppl 1), S186-S196. doi:10.2105/AJPH.2009.166082
Brown, P. M., Gonzalez, M., & Dhaul, R. S. (2015). Cost of Chronic Disease in California: Estimates at the County Level. Journal of Public Health Management and Practice, 21(1). Retrieved from https://journals.lww.com/jphmp/Fulltext/2015/01000/Cost_of_Chronic_Disease_in_California__Estimates.21.aspx
Cai, C., Runte, J., Ostrer, I., Berry, K., Ponce, N., Rodriguez, M., . . . Kahn, J. G. (2020). Projected costs of single-payer healthcare financing in the United States: A systematic review of economic analyses. PLoS Med, 17(1), e1003013. doi:10.1371/journal.pmed.1003013
Charles, S. A., Ponce, N., Ritley, D., Guendelman, S., Kempster, J., Lewis, J., & Melnikow, J. (2017). Health Benefits Mandates and Their Potential Impacts on Racial/Ethnic Group Disparities in Insurance Markets. Journal of Immigrant and Minority Health, 19(4), 921-928. doi:10.1007/s10903-016-0436-9
Chen, Z., Salam, M. T., Eckel, S. P., Breton, C. V., & Gilliland, F. D. (2015). Chronic effects of air pollution on respiratory health in Southern California children: findings from the Southern California Children's Health Study. J Thorac Dis, 7(1), 46-58. doi:10.3978/j.issn.2072-1439.2014.12.20
Chu, J. N., Tsoh, J. Y., Ong, E., & Ponce, N. A. (2021). The Hidden Colors of Coronavirus: the Burden of Attributable COVID-19 Deaths. J Gen Intern Med, 36(5), 1463-1465. doi:10.1007/s11606-020-06497-4
Chuang, E., Pourat, N., Haley, L. A., O'Masta, B., Albertson, E., & Lu, C. (2020). Integrating Health And Human Services In California's Whole Person Care Medicaid 1115 Waiver Demonstration. Health Affairs, 39(4), 639-648. doi:10.1377/hlthaff.2019.01617
Collins, P. H. (2002). Black Feminist Thought: Knowledge, Consciousness, and the Politics of Empowerment. New York: Routledge.
Cook, B. L., & Manning, W. G. (2009). Measuring racial/ethnic disparities across the distribution of health care expenditures. Health Serv Res, 44(5 Pt 1), 1603-1621. doi:10.1111/j.1475-6773.2009.01004.x
Crowley, R., Daniel, H., Cooney, T. G., & Engel, L. S. (2020). Envisioning a Better U.S. Health Care System for All: Coverage and Cost of Care. Ann Intern Med, 172(2 Suppl), S7-s32. doi:10.7326/m19-2415

91
Cunningham, C., Peters, K., & Mannix, J. (2013). Physical Health Inequities in People with Severe Mental Illness: Identifying Initiatives for Practice Change. Issues in Mental Health Nursing, 34(12), 855-862. doi:10.3109/01612840.2013.832826
Curtin, S. C. (2020). State suicide rates among adolescents and young adults aged 10–24: United States, 2000–2018.
Cushing, L., Blaustein-Rejto, D., Wander, M., Pastor, M., Sadd, J., Zhu, A., & Morello-Frosch, R. (2018). Carbon trading, co-pollutants, and environmental equity: Evidence from California's cap-and-trade program (2011-2015). PLoS Med, 15(7), e1002604. doi:10.1371/journal.pmed.1002604
de Girolamo, G., Dagani, J., Purcell, R., Cocchi, A., & McGorry, P. D. (2012). Age of onset of mental disorders and use of mental health services: needs, opportunities and obstacles. Epidemiology and Psychiatric Sciences, 21(1), 47-57. doi:10.1017/S2045796011000746
Dempsey, C., Quanbeck, C., Bush, C., & Kruger, K. (2020). Decriminalizing mental illness: specialized policing responses. CNS Spectrums, 25(2), 181-195. doi:10.1017/S1092852919001640
Donohue, J., Severson, T., & Martin, L. (2021). The Food Pharmacy: Theory, Implementation, and Opportunities. American Journal of Preventive Cardiology, 5, 100145. doi:10.1016/j.ajpc.2020.100145
Enders, J. J., Rhead, T. W., Phan, J. A., & Zoerb, M. C. (2021). Impacts of 2018 California Wildfires on Organic Aerosol Composition and Air Quality under Low Smoke Conditions. Acs Earth and Space Chemistry, 5(2), 163-169. doi:10.1021/acsearthspacechem.0c00202
Fang, F. C., Benson, C. A., Del Rio, C., Edwards, K. M., Fowler, V. G., Fredricks, D. N., . . . Schooley, R. T. (2021). COVID-19-Lessons Learned and Questions Remaining. Clin Infect Dis, 72(12), 2225-2240. doi:10.1093/cid/ciaa1654
Felitti, V. J., Anda, R. F., Nordenberg, D., Williamson, D. F., Spitz, A. M., Edwards, V., . . . Marks, J. S. (1998). Relationship of childhood abuse and household dysfunction to many of the leading causes of death in adults. The Adverse Childhood Experiences (ACE) Study. Am J Prev Med, 14(4), 245-258. doi:10.1016/s0749-3797(98)00017-8
Frank, J. C., Kietzman, K. G., & Palimaru, A. (2019). California's Behavioral Health Services Workforce is Inadequate for Older Adults. Policy Brief UCLA Cent Health Policy Res, 2019(1), 1-8.
Fuchs, F. D., & Whelton, P. K. (2020). High Blood Pressure and Cardiovascular Disease. Hypertension, 75(2), 285-292. doi:10.1161/HYPERTENSIONAHA.119.14240
Galea, S., Tracy, M., Hoggatt, K. J., Dimaggio, C., & Karpati, A. (2011). Estimated deaths attributable to social factors in the United States. Am J Public Health, 101(8), 1456-1465. doi:10.2105/AJPH.2010.300086

92
Galvani, A. P., Parpia, A. S., Foster, E. M., Singer, B. H., & Fitzpatrick, M. C. (2020). Improving the prognosis of health care in the USA. Lancet, 395(10223), 524-533. doi:10.1016/s0140-6736(19)33019-3
Gara, M. A., Minsky, S., Silverstein, S. M., Miskimen, T., & Strakowski, S. M. (2019). A Naturalistic Study of Racial Disparities in Diagnoses at an Outpatient Behavioral Health Clinic. Psychiatr Serv, 70(2), 130-134. doi:10.1176/appi.ps.201800223
Garcia-Perez, M. (2016). Converging to American: Healthy Immigrant Effect in Children of Immigrants. American Economic Review, 106(5), 461-466. doi:10.1257/aer.p20161110
Geyman, J. (2021). COVID-19 Has Revealed America's Broken Health Care System: What Can We Learn? Int J Health Serv, 51(2), 188-194. doi:10.1177/0020731420985640
Geyman, J. P. (2021). Beyond the COVID-19 Pandemic: The Urgent Need to Expand Primary Care and Family Medicine. Fam Med, 53(1), 48-53. doi:10.22454/FamMed.2021.709555
Global Burden of Disease Health Financing Collaborator Network. (2019). Past, present, and future of global health financing: a review of development assistance, government, out-of-pocket, and other private spending on health for 195 countries, 1995-2050. Lancet, 393(10187), 2233-2260. doi:10.1016/s0140-6736(19)30841-4
Gottlieb, L. M., Wing, H., & Adler, N. E. (2017). A Systematic Review of Interventions on Patients' Social and Economic Needs. Am J Prev Med, 53(5), 719-729. doi:10.1016/j.amepre.2017.05.011
Grant, D., Padilla-Frausto, I., Aydin, M., Streja, L., Aguilar-Gaxiola, S., & Caldwell, J. (2011). Adult Mental Health in California: Findings from the 2007 California Health Interview Survey. Los Angeles: UCLA Center for Health Policy Research, 2011.
Häfner, H., Maurer, K., Löffler, W., an der Heiden, W., Munk-Jørgensen, P., Hambrecht, M., & Riecher-Rössler, A. (1998). The ABC schizophrenia study: a preliminary overview of the results. Social Psychiatry and Psychiatric Epidemiology, 33(8), 380-386. doi:10.1007/s001270050069
Hall, E., & Cuellar, N. G. (2016). Immigrant Health in the United States: A Trajectory Toward Change. Journal of Transcultural Nursing, 27(6), 611-626. doi:10.1177/1043659616672534
Haque, S. N. (2021). Telehealth Beyond COVID-19. Psychiatr Serv, 72(1), 100-103. doi:10.1176/appi.ps.202000368
Heyer, J., Palm, M., & Niemeier, D. (2020). Are we keeping up? Accessibility, equity and air quality in regional planning. Journal of Transport Geography, 89, 11. doi:10.1016/j.jtrangeo.2020.102891
Himmelstein, D. U., & Woolhandler, S. (2020). Single-Payer Reform: Heed the Evidence, Not the Soothsayers. Am J Public Health, 110(4), 447-448. doi:10.2105/ajph.2020.305571

93
Hoffman, G. J., & Wallace, S. P. (2018). The Cost of Caring: Economic Vulnerability, Serious Emotional Distress, and Poor Health Behaviors Among Paid and Unpaid Family and Friend Caregivers. Research on Aging, 40(8), 791-809. doi:10.1177/0164027517742430
Ilyas, A., Chesney, E., & Patel, R. (2017). Improving life expectancy in people with serious mental illness: should we place more emphasis on primary prevention? Br J Psychiatry, 211(4), 194-197. doi:10.1192/bjp.bp.117.203240
Jilani, M. H., Javed, Z., Yahya, T., Valero-Elizondo, J., Khan, S. U., Kash, B., . . . Nasir, K. (2021). Social Determinants of Health and Cardiovascular Disease: Current State and Future Directions Towards Healthcare Equity. Curr Atheroscler Rep, 23(9), 55. doi:10.1007/s11883-021-00949-w
Joynt Maddox, K. E., & McClellan, M. B. (2019). Toward Evidence-Based Policy Making to Reduce Wasteful Health Care Spending. Jama, 322(15), 1460-1462. doi:10.1001/jama.2019.13977
Jutte, D. P., Miller, J. L., & Erickson, D. J. (2015). Neighborhood adversity, child health, and the role for community development. Pediatrics, 135 Suppl 2, S48-57. doi:10.1542/peds.2014-3549F
Kessler, R. C., Angermeyer, M., Anthony, J. C., De Graaf, R., Demyttenaere, K., Gasquet, I., . . . Ustün, T. B. (2007). Lifetime prevalence and age-of-onset distributions of mental disorders in the World Health Organization's World Mental Health Survey Initiative. World psychiatry : official journal of the World Psychiatric Association (WPA), 6(3), 168-176. Retrieved from https://pubmed.ncbi.nlm.nih.gov/18188442; https://www.ncbi.nlm.nih.gov/pmc/articles/PMC2174588/
Kietzman, K. G., Wallace, S. P., Durazo, E. M., Torres, J. M., Choi, A. S., Benjamin, A. E., & Mendez-Luck, C. (2012). A portrait of older Californians with disabilities who rely on public services to remain independent. Home Health Care Serv Q, 31(4), 317-336. doi:10.1080/01621424.2012.734744
Kirschner, K. L. (2005). When written advance directives are not enough. Clin Geriatr Med, 21(1), 193-209, x. doi:10.1016/j.cger.2004.08.006
Ko, M., Sanders, C., de Guia, S., Shimkhada, R., & Ponce, N. A. (2018). Managing Diversity To Eliminate Disparities: A Framework For Health. Health Aff (Millwood), 37(9), 1383-1393. doi:10.1377/hlthaff.2018.0438
Kominski, G. F., Nonzee, N. J., & Sorensen, A. (2017). The Affordable Care Act's Impacts on Access to Insurance and Health Care for Low-Income Populations. In J. E. Fielding (Ed.), Annual Review of Public Health, Vol 38 (Vol. 38, pp. 489-505). Palo Alto: Annual Reviews.
Kominski, G. F., Ripps, J. C., Laugesen, M. J., Cosway, R. G., & Pourat, N. (2006). The California Cost and Coverage Model: analyses of the financial impacts of benefit mandates for the California legislature. Health Serv Res, 41(3 Pt 2), 1027-1044. doi:10.1111/j.1475-6773.2006.00518.x

94
Krieger, N. (2020). Measures of Racism, Sexism, Heterosexism, and Gender Binarism for Health Equity Research: From Structural Injustice to Embodied Harm-An Ecosocial Analysis. Annu Rev Public Health, 41, 37-62. doi:10.1146/annurev-publhealth-040119-094017
Landrigan, P. J., Fuller, R., Acosta, N. J. R., Adeyi, O., Arnold, R., Basu, N. N., . . . Zhong, M. (2018). The Lancet Commission on pollution and health. Lancet, 391(10119), 462-512. doi:10.1016/s0140-6736(17)32345-0
Lipsitt, J., Chan-Golston, A. M., Liu, J., Su, J., Zhu, Y., & Jerrett, M. (2021). Spatial analysis of COVID-19 and traffic-related air pollution in Los Angeles. Environ Int, 153, 106531. doi:10.1016/j.envint.2021.106531
Lu, Y., Kaushal, N., Denier, N., & Wang, J. (2017). Health of newly arrived immigrants in Canada and the United States: Differential selection on health. Health & Place, 48, 1-10. doi:10.1016/j.healthplace.2017.08.011
Marmot, M., Friel, S., Bell, R., Houweling, T. A., & Taylor, S. (2008). Closing the gap in a generation: health equity through action on the social determinants of health. Lancet, 372(9650), 1661-1669. doi:10.1016/s0140-6736(08)61690-6
Masland, M. C. (1996). The political development of “Program Realignment”: California’s 1991 mental health care reform. The journal of mental health administration, 23(2), 170-179. doi:10.1007/BF02519108
Masri, S., Scaduto, E., Jin, Y., & Wu, J. (2021). Disproportionate Impacts of Wildfires among Elderly and Low-Income Communities in California from 2000-2020. Int J Environ Res Public Health, 18(8). doi:10.3390/ijerph18083921
Mays, V. M., Ponce, N. A., Washington, D. L., & Cochran, S. D. (2003). Classification of race and ethnicity: implications for public health. Annu Rev Public Health, 24, 83-110. doi:10.1146/annurev.publhealth.24.100901.140927
McCullough, J. M., Speer, M., Magnan, S., Fielding, J. E., Kindig, D., & Teutsch, S. M. (2020). Reduction in US Health Care Spending Required to Meet the Institute of Medicine's 2030 Target. Am J Public Health, 110(12), 1735-1740. doi:10.2105/ajph.2020.305793
Melnick, G. A., Fonkych, K., & Zwanziger, J. (2018). The California Competitive Model: How Has It Fared, And What's Next? Health Aff (Millwood), 37(9), 1417-1424. doi:10.1377/hlthaff.2018.0418
Meng, Y. Y., Rahman, T., Hanaya, D., Lam, V., Gomez, M., Toy, P., & Wallace, S. P. (2016). Unequal Protection: Secondhand Smoke Threatens Health of Tenants in Multi-Unit Housing in Los Angeles. Policy Brief UCLA Cent Health Policy Res(Pb2016-2), 1-8.
Miu, A. S., Vo, H. T., Palka, J. M., Glowacki, C. R., & Robinson, R. J. (2020). Teletherapy with serious mental illness populations during COVID-19: telehealth conversion and engagement. Counselling Psychology Quarterly, 1-18. doi:10.1080/09515070.2020.1791800
95
Moghavem, N. (2018). The California Cap-and-Trade Program: A Model Policy for Promoting Environmental Justice Using Accountability for Reasonableness. Am J Bioeth, 18(3), 57-59. doi:10.1080/15265161.2017.1418935
Mude, W., Oguoma, V. M., Nyanhanda, T., Mwanri, L., & Njue, C. (2021). Racial disparities in COVID-19 pandemic cases, hospitalisations, and deaths: A systematic review and meta-analysis. J Glob Health, 11, 05015. doi:10.7189/jogh.11.05015
Munoz-Blanco, S., Raisanen, J. C., Donohue, P. K., & Boss, R. D. (2017). Enhancing Pediatric Palliative Care for Latino Children and Their Families: A Review of the Literature and Recommendations for Research and Practice in the United States. Children (Basel), 5(1). doi:10.3390/children5010002
National Academies of Sciences, E., and Medicine. (2020). Promoting Positive Adolescent Health Behaviors and Outcomes: Thriving in the 21st Century. Washington, D.C.: National Academies Press.
Newacheck, P. W., & Halfon, N. (1998). Prevalence and impact of disabling chronic conditions in childhood. American Journal of Public Health, 88(4), 610-617. doi:10.2105/AJPH.88.4.610
Newman, D., Tong, M., Levine, E., & Kishore, S. (2020). Prevalence of multiple chronic conditions by U.S. state and territory, 2017. PLOS ONE, 15(5), e0232346. doi:10.1371/journal.pone.0232346
Niendam, T. A., Sardo, A., Savill, M., Patel, P., Xing, G., Loewy, R. L., . . . Melnikow, J. (2019). The Rise of Early Psychosis Care in California: An Overview of Community and University-Based Services. Psychiatr Serv, 70(6), 480-487. doi:10.1176/appi.ps.201800394
Polyakova, M., Udalova, V., Kocks, G., Genadek, K., Finlay, K., & Finkelstein, A. N. (2021). Racial Disparities In Excess All-Cause Mortality During The Early COVID-19 Pandemic Varied Substantially Across States. Health Aff (Millwood), 40(2), 307-316. doi:10.1377/hlthaff.2020.02142
Ponce, N., Cochran, S., Mays, V., Chia, J., & Brown, E. (2008). Health coverage of low-income citizen and noncitizen wage earners: sources and disparities. J Immigr Minor Health, 10(2), 167-176. doi:10.1007/s10903-007-9059-5
Ponce, N. A. (2020). Centering Health Equity in Population Health Surveys. JAMA Health Forum, 1(12), e201429-e201429. doi:10.1001/jamahealthforum.2020.1429
Porteny, T., Ponce, N., & Sommers, B. D. (2020). Immigrants and the Affordable Care Act: Changes in Coverage and Access to Care by Documentation Status. J Immigr Minor Health. doi:10.1007/s10903-020-01124-0
Pourat, N., O’Masta, B., Haley, L. A., & Chuang, E. (2021). A snapshot of California’s Whole Person Care Pilot Program: Implementation strategies and enrollees. Health Policy Brief. UCLA Center for Health Policy Research. Available at:
96
https://healthpolicy.ucla.edu/publications/Documents/PDF/2021/wholepersoncare-policybrief-may2021.pdf.
Pourat, N., Wallace, S. P., Hadler, M. W., & Ponce, N. (2014). Assessing health care services used by California's undocumented immigrant population in 2010. Health Aff (Millwood), 33(5), 840-847. doi:10.1377/hlthaff.2013.0615
Reid, C. E., Brauer, M., Johnston, F. H., Jerrett, M., Balmes, J. R., & Elliott, C. T. (2016). Critical Review of Health Impacts of Wildfire Smoke Exposure. Environ Health Perspect, 124(9), 1334-1343. doi:10.1289/ehp.1409277
Rivara, F., Adhia, A., Lyons, V., Massey, A., Mills, B., Morgan, E., . . . Rowhani-Rahbar, A. (2019). The Effects Of Violence On Health. Health Affairs, 38(10), 1622-1629. doi:10.1377/hlthaff.2019.00480
Rogers, T. (2010). The California Tobacco Control Program: introduction to the 20-year retrospective. Tobacco Control, 19(Suppl 1), i1. doi:10.1136/tc.2010.036293
Scheffler, R. M., Arnold, D. R., & Whaley, C. M. (2018). Consolidation Trends In California’s Health Care System: Impacts On ACA Premiums And Outpatient Visit Prices. Health Affairs, 37(9), 1409-1416. doi:10.1377/hlthaff.2018.0472
Schwartz, R. C., & Blankenship, D. M. (2014). Racial disparities in psychotic disorder diagnosis: A review of empirical literature. World journal of psychiatry, 4(4), 133-140. doi:10.5498/wjp.v4.i4.133
Sege, R., Bethell, C., Linkenbach, J., Jones, J. A., Klika, B., & Pecora, P. J. (2017). Balancing Adverse Childhood Experiences (ACEs) with HOPE: New insights into the role of positive experience on child and family development. Retrieved from Boston:
Shimkhada, R., Scheitler, A. J., & Ponce, N. A. (2021). Capturing Racial/Ethnic Diversity in Population-Based Surveys: Data Disaggregation of Health Data for Asian American, Native Hawaiian, and Pacific Islanders (AANHPIs). Population Research and Policy Review, 40(1), 81-102. doi:10.1007/s11113-020-09634-3
Shrank, W. H., Rogstad, T. L., & Parekh, N. (2019). Waste in the US Health Care System: Estimated Costs and Potential for Savings. Jama, 322(15), 1501-1509. doi:10.1001/jama.2019.13978
Starr, P. (1982). The Social Transformation of American Medicine: The Rise of a Sovereign Profession and the Making of a Vast Industry: Basic Books.
Stokes, A. C., Lundberg, D. J., Elo, I. T., Hempstead, K., Bor, J., & Preston, S. H. (2021). COVID-19 and excess mortality in the United States: A county-level analysis. PLoS Med, 18(5), e1003571. doi:10.1371/journal.pmed.1003571
Stokes, L. C. (2019). California Greenin': How the Golden State Became an Environmental Leader. Political Science Quarterly, 134(3), 574-576. doi:10.1002/polq.12951
Sudhinaraset, M., Woofter, R., Young, M. T., Landrian, A., Vilda, D., & Wallace, S. P. (2021). Analysis of State-Level Immigrant Policies and Preterm Births by Race/Ethnicity Among

97
Women Born in the US and Women Born Outside the US. JAMA Netw Open, 4(4), e214482. doi:10.1001/jamanetworkopen.2021.4482
Vega, W. A., & Wallace, S. P. (2016). Affordable Housing: A Key Lever to Community Health for Older Americans. Am J Public Health, 106(4), 635-636. doi:10.2105/ajph.2015.303034
Wallace, S. P., Young, M.-E. D. T., Rodríguez, M. A., & Brindis, C. D. (2018). A social determinants framework identifying state-level immigrant policies and their influence on health. SSM - population health, 7, 016-016. doi:10.1016/j.ssmph.2018.10.016
Wang, P. S., Berglund, P. A., Olfson, M., & Kessler, R. C. (2004). Delays in initial treatment contact after first onset of a mental disorder. Health services research, 39(2), 393-415. doi:10.1111/j.1475-6773.2004.00234.x
Weil, A. R. (2018). California: Leading The Way? Health Aff (Millwood), 37(9), 1351. doi:10.1377/hlthaff.2018.1047
Wilson, T. S., Sleeter, B. M., & Cameron, D. R. (2016). Future land-use related water demand in California. Environmental Research Letters, 11(5), 054018. doi:10.1088/1748-9326/11/5/054018
Wise, P. H. (2004). The Transformation Of Child Health In The United States. Health Affairs, 23(5), 9-25. doi:10.1377/hlthaff.23.5.9
Wolstein, J., Babey, S. H., & Diamant, A. L. (2015). Obesity in California. Woolf, S. H., & Schoomaker, H. (2019). Life Expectancy and Mortality Rates in the United States,
1959-2017. Jama, 322(20), 1996-2016. doi:10.1001/jama.2019.16932 Woolford, S. J., Sidell, M., Li, X., Else, V., Young, D. R., Resnicow, K., & Koebnick, C. (2021).
Changes in Body Mass Index Among Children and Adolescents During the COVID-19 Pandemic. Jama. doi:10.1001/jama.2021.15036
Wright, J. L., Jarvis, J. N., Pachter, L. M., & Walker-Harding, L. R. (2020). "Racism as a public health issue" APS racism series: at the intersection of equity, science, and social justice. Pediatr Res. doi:10.1038/s41390-020-01141-7
Xu, J. J., Chen, J. T., Belin, T. R., Brookmeyer, R. S., Suchard, M. A., & Ramirez, C. M. (2021). Racial and Ethnic Disparities in Years of Potential Life Lost Attributable to COVID-19 in the United States: An Analysis of 45 States and the District of Columbia. Int J Environ Res Public Health, 18(6). doi:10.3390/ijerph18062921
Yadav, K. N., Gabler, N. B., Cooney, E., Kent, S., Kim, J., Herbst, N., . . . Courtright, K. R. (2017). Approximately One In Three US Adults Completes Any Type Of Advance Directive For End-Of-Life Care. Health Affairs, 36(7), 1244-1251. doi:10.1377/hlthaff.2017.0175
Yearby, R. (2020). Structural Racism and Health Disparities: Reconfiguring the Social Determinants of Health Framework to Include the Root Cause. J Law Med Ethics, 48(3), 518-526. doi:10.1177/1073110520958876

98
Young, M.-E. D. T., Beltrán-Sánchez, H., & Wallace, S. P. (2020). States with fewer criminalizing immigrant policies have smaller health care inequities between citizens and noncitizens. BMC public health, 20(1), 1460. doi:10.1186/s12889-020-09525-4
Zablotsky, B., Black, L. I., Maenner, M. J., Schieve, L. A., Danielson, M. L., Bitsko, R. H., . . . Boyle, C. A. (2019). Prevalence and Trends of Developmental Disabilities among Children in the United States: 2009–2017. Pediatrics, 144(4), e20190811. doi:10.1542/peds.2019-0811
Zavala, V. A., Bracci, P. M., Carethers, J. M., Carvajal-Carmona, L., Coggins, N. B., Cruz-Correa, M. R., . . . Fejerman, L. (2020). Cancer health disparities in racial/ethnic minorities in the United States. Br J Cancer. doi:10.1038/s41416-020-01038-6
Zelner, J., Trangucci, R., Naraharisetti, R., Cao, A., Malosh, R., Broen, K., . . . Delamater, P. (2021). Racial Disparities in Coronavirus Disease 2019 (COVID-19) Mortality Are Driven by Unequal Infection Risks. Clin Infect Dis, 72(5), e88-e95. doi:10.1093/cid/ciaa1723
Ziol-Guest, K. M., & Kalil, A. (2012). Health and medical care among the children of immigrants. Child Dev, 83(5), 1494-1500. doi:10.1111/j.1467-8624.2012.01795.x

CALIFORNIA100.ORG | @WEARECA100 | #CALIFORNIA100
Copyright © 2022 FDOKUMEN