cal poly pomona foundation, inc.
153
CAL POLY POMONA FOUNDATION, INC. CALIFORNIA STATE POLYTECHNIC UNIVERSITY, POMONA INVESTMENT COMMITTEE MEETING Monday, September 15, 2014 11:00 am – 12:00 pm Building #55 – Executive Conference Room AGENDA CONSENSUS ACTION ITEMS PAGE Consensus Action Items: Items in this section are considered to be routine and acted on by the committee in one motion. Each item of the Consent agenda approved by the committee shall be deemed to have been considered in full and adopted as recommended. Any committee member may request that a consent item be removed from the consent agenda to be considered as a separate action item. If no additional information is requested, the approval vote will be taken without discussion. 1. Minutes of April 23, 2014 meeting Tom Goff 1 - 3 ACTION: Approval ACTION ITEMS 2. Investment Report 4th Quarter 2013-14 David Prenovost 4 - 53 ACTION: Approval 3. Investment Hedge Fund Asset Fund Allocation Proposal David Prenovost/ 54 - 108 ACTION: Approval Andrew Price 4. Endowment Spending Distribution Approval G. Paul Storey 109 - 113 ACTION: Approval DISCUSSION ITEMS INFORMATION ITEMS The following items provide information and reports by management staff to the committee. Staff and committee may engage in discussion on any item if requested by committee member or staff member. 5. Investment Fixed Income PIMCO Asset David Prenovost/ 114 - 125 Allocation Analysis Andrew Price 6. Executive Director’s Report G. Paul Storey OPEN FORUM
-
Upload
khangminh22 -
Category
Documents
-
view
1 -
download
0
Transcript of cal poly pomona foundation, inc.

CAL POLY POMONA FOUNDATION, INC.
CALIFORNIA STATE POLYTECHNIC UNIVERSITY, POMONA
INVESTMENT COMMITTEE MEETING
Monday, September 15, 2014 11:00 am – 12:00 pm
Building #55 – Executive Conference Room
AGENDA
CONSENSUS ACTION ITEMS PAGE Consensus Action Items: Items in this section are considered to be routine and acted on by the committee in one motion. Each item of the Consent agenda approved by the committee shall be deemed to have been considered in full and adopted as recommended. Any committee member may request that a consent item be removed from the consent agenda to be considered as a separate action item. If no additional information is requested, the approval vote will be taken without discussion. 1. Minutes of April 23, 2014 meeting Tom Goff 1 - 3 ACTION: Approval ACTION ITEMS 2. Investment Report 4th Quarter 2013-14 David Prenovost 4 - 53
ACTION: Approval 3. Investment Hedge Fund Asset Fund Allocation Proposal David Prenovost/ 54 - 108
ACTION: Approval Andrew Price
4. Endowment Spending Distribution Approval G. Paul Storey 109 - 113 ACTION: Approval
DISCUSSION ITEMS
INFORMATION ITEMS The following items provide information and reports by management staff to the committee. Staff and committee may engage in discussion on any item if requested by committee member or staff member. 5. Investment Fixed Income PIMCO Asset David Prenovost/ 114 - 125 Allocation Analysis Andrew Price 6. Executive Director’s Report G. Paul Storey
OPEN FORUM

CAL POLY POMONA FOUNDATION, INC.Investment Committee Meeting Minutes
April 23, 2014
Present: Steven Garcia, Tom Goff, Darwin Labordo, and Kathy Tully via Web Ex
Absent: Richard Lapidus
Visitors: Anne McLoughlin, Debra Poe, David Prenovost, Karen Sandoval and Paul Storey
CALL TO ORDER
Tom Goff called the meeting to order at 8:30am.
CONSENSUS ACTION ITEMS
1. Minutes - February 6, 2014
The minutes for February 6, 2014 were approved by consent.
ACTION ITEMS
2. General Investment Budget
David Prenovost stated for the first eight months of this fiscal year 2013-14, the equity portion of this portfoliowas managed by the Common Fund and the last four months the equity portion of this portfolio is managed byGraystone Consulting, a division of Morgan Stanley. We are forecasting the general investment portfolio togenerate a net surplus of $1.8 million and have a value of $38.7 million by June 2014. The forecasted gain onequity and real assets is 4%; fixed income is 1%; dividends are 1.3% and interest is 2.1%. There are noforecasted additions to the portfolio. Distribution of the yield (interest) to the programs and scholarships is$257,000. Graystone's fees are 20 basis points and the Foundation's administrative fee is 50 basis points offthe yield (interest) of 2.1%.
The proposed budget for the General Investment portfolio will generate a surplus of $1.1 million and has a valueof $42.1 million in June 2015. The annual gain on equity and real assets is 4%; fixed income is 1%; dividends is1.3% and interest is 2.1%. Additions to the portfolio include a total of $2.0 million, $1.0 in April and $1.0 May2015. Distribution of the yield (interest) to the programs and scholarships is $257,000. Graystone's fees are 20basis points and the Foundation's administrative fee is 50 basis points off the yield (interest) of 2.1%.
A motion was made by Darwin Labordo to accept the General Investment Budget for 2014-15 and forward tothe Board of Directors for final approval. The motion was seconded by Steven Garcia and approved 4-Ayes,0-Nays and 0-Abstentions.
3. Endowment Investment Budget
David Prenovost explained the forecast is projected to generate a surplus of $12.8 million due to donationsand portfolio returns. The endowment portfolio's value is forecasted to be $84.0 million as of June 2014.Working with our investment advisor at Graystone Consulting a division of Morgan Stanley, we haveforecasted an annual gain of 5.9% for the equity and real assets portion of the portfolio excluding dividends.Dividends and interest are forecasted to return 1.3% and 3.6% respectively. Total investment fees areforecasted to be 0.38 basis points (10 basis points to Graystone Consulting and the balance to third partyaccount managers). There are two internal fees charged per Policy # 133, a 5% fee on all donations and0.75% fee for administration (excluding any terms specific to an endowment). Donations are forecasted to be$9.4 million per the Division of Advancement. We have included the 4.8% or $3.4 million endowment earningsdistribution from September 2013.
The proposed budget generates a surplus of $9.4 million mainly due to donations and portfolio returns. Theendowment portfolio's value is projected to be $93.3 million as of June 2015. Working with'our investment
1

Investment Committee Meeting Minutes April 23, 2014Page 2
advisor, we have proposed an annual gain of 5.9% for the equity portion of the portfolio excluding dividends.Dividends and interest are forecasted to return 1.3% and 3.6% respectively. Total investment fees areforecasted to be 0.38 basis points (10 basis points to Graystone Consulting and the balance to third partyaccount managers). There are two internal fees charged per Policy # 133, a 5% fee on all donations and0.75% fee for administration (excluding any terms specific to an endowment). Donations are projected to be$9.0 million per the Division of Advancement. We anticipate a 4.9% or $4.1 million endowment earningsdistribution in September 2014.
A motion was made by Darwin Labordo to approve the Endowment Investment Budget and the EndowmentDonation Budget for 2014-15 and forward to the Board of Directors for final approval. The motion wasseconded by Steven Garcia and approved 4-Ayes, 0-Nays and 0-Abstentions.
4. Investment Report 3rd Quarter 2013-14
David Prenovost explained the General Investment Portfolio has a current market value of $41.5 million atMarch 31, 2014. Per the Foundation's Policy # 133, only the annualized yield is distributed; for the firstquarter the yield is 0.37% and the scholarship programs received $10,622 and the Foundation programsreceived $91,947; for the second quarter the yield is 0.31% and the scholarship programs received $13,117and the Foundation programs received $78,207; for the third quarter the yield is 0.285% and the scholarshipprograms received $9,139 and the Foundation programs received $80,716.
The Foundation has received capital call notices and has contributed $203,750 against its commitment of$250,000 to Capital Partners IV and $565,125 against its commitment of $750,000 to Capital Private EquityPartners VII. The value of the Non-Marketable Investments is $743,113 as of September 2013.
The Alternative Investment in Innovation Way infrastructure is $2.3 million and fiscal year to date wascharged $31,050 per the terms of the investment. This alternative investment repaid $300,000 in the firstquarter of fiscal year 2013-14.
The Endowment Investment Portfolio (Portfolio) has a market value of $83.4 million at March 31, 2013;returned 11.86% versus 13.60% benchmark for the fiscal year to date and the asset allocation differenceswere no greater or less than 1.2% compared to the target asset allocation at March 31, 2014.
Tom Goff mentioned the credit quality of the General Investment Portfolio is currently an A rating and shouldbe a AA- or Ai-. There was further discussion surrounding the investment manager concentration i.e. PIMCOLow Duration Fixed Income which is currently listed as A credit quality rating and currently has an allocationof 80% of the fixed income portfolio. David agreed and will contact Graystone Consulting for further reviewand suggested changes to the credit quality and investment managers of the General Investment Portfolio.
A motion was made by Steven Garcia to accept the quarterly investment reports as in compliance with theinvestment policies and recommends the quarterly investment reports be presented at the Board of Directorsfor approval. The motion was seconded by Darwin Labordo and approved 4-Ayes, 0-Nays and 0-Abstentions.
5. 2014-15 Budget Resolution
Paul Storey summarized the proposed 2014-15 Budget for the Committee. The budget includes contributinga blended rate of 9.2% to the three pension Plans with CALPERS for a total of approximately $886,000 andchanges to salary grade ranges (previously approved in November 2013) and a 3% or approximately$200,000 wage adjustment for eligible employees including the Executive Director and the Chief FinancialOfficer, and contribute $1.0 million to the VEBA Trust and assume 7.5% or $614,273 as the benefit cost forthe postretirement health care plan as per actuarial studies.
A motion was made by Darwin Labordo to accept the review of the proposed 2014-15 Budget and to forwardthe resolution to the Board of Directors for approval. The motion was seconded by Steven Garcia andapproved 4-Ayes, 0-Nays and 0-Abstentions.
DISCUSSION ITEMS
A managed portfolio of hedge funds was discussed.2

Investment Committee Meeting Minutes April 23, 2014Page 3
INFORMATION ITEMS
6. Executive Director's Report
a. The next Board of Directors meeting is Thursday, May 22, 2014, 2:00pm at Kellogg West Garden VistaRoom.
OPEN FORUM
Meeting was adjourned at 9:30am
Respectfull mit ed,
omas M. GoffInvestment Committee, Chair
3

Memorandum
Date: August 25, 2014
To: Investment CommitteeCal Poly Pomona Fou9pation, Inc.
From: David F. PreffOrvostSenior Managing Director/CFO
Subject: INVESTMENT HIGHLIGHTS - Fourth Quarter 2013-14
GENERAL INVESTMENT PORTFOLIO
Cal Poly Pomona
Foundation
The General Investment Portfolio (Portfolio) has a current market value of $39.2 million atJune 30, 2014, please see Asset Class ranges and target worksheet as well as Graystone'sreport of funds managed for asset allocation and performance.
Per the Foundation's Policy # 133, only the annualized yield is distributed; the annualized yieldwas 1.35% and the scholarship programs received $44,735 and the Foundation programsreceived $354,383.
The Foundation has received capital call notices and has contributed $203,750 against itscommitment of $250,000 to Capital Partners IV and $565,125 against its commitment of$750,000 to Capital Private Equity Partners VII. The value of the Non-Marketable Investments is$828,965 as of March 31, 2014, please see Common Fund Private Programs Investment reportfor further details.
The Alternative Investment in Innovation Way infrastructure is $2.3 million and for the fiscal year2013-14 was charged $42,520 per the terms of the investment. This alternative investmentrepaid $300,000 in the first quarter of fiscal year 2014-15.
ENDOWMENT INVESTMENT PORTFOLIO
The Endowment Investment Portfolio (Portfolio) has a market value of $86.6 million at June 30,2013; please see Graystone's report for asset allocation and performance.
Recommended Action: The Foundation's Endowment and General Investment Policies 130and 131 requires a comprehensive quarterly report of the investment portfolios performance beprovided to the Investment Committee and Board of Directors at a regularly scheduled meeting.Foundation management believes that the quarterly investment reports are in compliance withthe investment policies and recommends the quarterly investment reports be presented at thenext regularly scheduled Board of Directors meeting.
PASSED AND ADbPT D T S 15th DAY OF SEPTEMBER 2014.
Thomas M. Goff, S hInvestment Committ e
4
Memorandum
Date:
To:
From:
August 25,2014
Investment CommitteeCal Poly Pomona Fou
ty*-i-4I.v\'- I
g-I,ffiCal Poh Pumsm
Fnundali*n:
David F.Senior Managing Director/CFO
Subject: INVESTMENT HIGHLIGHTS - Fourth Quarter 2013-14
GENERAL INVESTMENT PORTFOLIO
The General Investment Portfolio (Portfolio) has a current market value of $39.2 million atJune 30, 2014, please see Asset Class ranges and target worksheet as well as Graystone'sreport of funds managed for asset allocation and performance.
Per the Foundation's Policy # 133, only the annualized yield is distributed; the annualized yieldwas 1.35% and the scholarship programs received $44,735 and the Foundation programsreceived $354,383.
The Foundation has received capital call notices and has contributed $203,750 against itscommitment of $250,000 to Capital Partners lV and $565,125 against its commitment of$750,000 to Capital Private Equity Partners Vll. The value of the Non-Marketable Investments is$828,965 as of March 31,2014, please see Common Fund Private Programs Investment reportfor further details.
The Altemative Investment in Innovation Way infrastructure is $2.3 million and for the fiscal year2013-14 was charged $42,520 per the terms of the investment. This alternative investmentrepaid $300,000 in the first quarter of fiscal year 2O14-15.
ENDOWMENT INVESTMENT PORTFOLIO
The Endowment Investment Portfolio (Portfolio) has a market value of $86.6 million at June 30,2013; please see Graystone's report for asset allocation and performance.
Recommended Action: The Foundation's Endowment and General Investment Policies 130and 131 requires a comprehensive quarterly report of the investment portfolios performance beprovided to the lnvestment Committee and Board of Directors at a regularly scheduled meeting.Foundation management believes that the quarterly investment reports are in compliance withthe investment policies and recommends the quarterly investment reports be presented at thenext regularly scheduled Board of Directors meeting.
15th DAY OF SEPTEMBER 2014.

Cal Poly Pomona Foundation Capital Markets Commentary
June 30, 2014
Graystone Consulting Andrew Price, CIMA® Executive Director Institutional Consulting Director Todd Au, CIMA®
Second Vice President
Senior Investment Management Consultant Tim Skelly, CIMA® Senior Vice President Institutional Consulting Director David Weinberg Client Service Associate
Address:
1999 Avenue of the Stars Suite 2400 Los Angeles, CA 90067 Phones: Main Line 310-788-2043 Toll-Free 800-786-0048 Fax 310-961-3180 E-Mail:
5

..
2 The information contained herein has been taken from sources deemed reliable, but there is no guarantee of its complete accuracy.
Capital Markets Observations: Q2-2014 Recap
Factors driving the capital markets and influencing asset values in the recent quarter…
Global capital markets appear to be back on track, after enduring a meandering detour in the first half of 2014.
Entering Q2, investor sentiment remained tentative, but the methodical accumulation of positive data
points reassured market observers that US economic growth was back on course after a temporary weather-related pause. For instance, US non-farm payrolls averaged a monthly gain of 272,000 in Q2 and the jobless rate dropped to 6.1%. Meanwhile, non-US markets also stabilized, supported by various monetary and other policy initiatives. However, growth potential could remain muted due to a lack of re-leveraging (see p. 6).
Even though Fed Chair Yellen distanced herself from her recent blunt remarks about raising interest rates, the Fed is still moving towards a well-telegraphed policy shift. With the Fed’s bond-buying program set to expire in October, market expectations have centered on March/April 2015 as the probable lift-off date for
interest rate hikes. In June, St Louis Fed President Bullard assured investors that the US economy is now on solid footing and can tolerate higher rates. Meanwhile, both the European Central Bank (ECB) and the Bank of Japan continue to offer policy support by adding to global liquidity. Indeed, ECB President Draghi offered a new round of policies in June.
Fed Chair Janet Yellen settled into her role at the
FRB. She appears set to guide the Fed to a policy
shift in 2015 – higher interest rates – but overall
policy should remain accommodative.
The disruptive market rotation that closed Q1 extended into April, causing volatility and losses among high-priced Internet and biotech securities, but growth-sensitive risk assets slowly recovered and established a leadership role as Q2 unfolded.
By late June, the Energy and Technology sectors were pacing the markets along with US small-cap securities, Emerging Markets and Frontier Markets. Meanwhile, high-quality US bonds again posted gains in Q2 due mostly to steady foreign demand, but the bond strength showed signs of fading by late June due to a growing awareness that Fed Policy changes are up ahead.
6

3 The information contained herein has been taken from sources deemed reliable, but there is no guarantee of its complete accuracy.
Capital Markets Performance Summary: Q2-2014
Global capital markets appear to be back on track, after enduring a meandering detour to begin 2014…
Sources: FactSet, Graystone Consulting 6/30/2014
Global Asset Class Returns QTD YTD1 Year
Return
1 Year
Risk
MSCI Emerging Markets 6.60% 6.14% 14.31% 11.81%
BC EM Debt (USD) 5.24% 8.99% 11.04% 6.30%
S&P 500 Index 5.23% 7.14% 24.61% 9.07%
BC 20+ Year UST 5.06% 13.19% 6.57% 8.08%
MSCI EAFE (Developed) 4.09% 4.78% 23.57% 10.56%
Gold (GLD) 2.96% 9.88% 7.71% 16.42%
BC 7-10 Year UST 2.49% 5.20% 3.15% 4.51%
BC Corporate High Yield 2.41% 5.46% 11.73% 2.82%
BC Mortgage Securities 2.09% 3.81% 6.13% 2.28%
Russell 2000 Index 2.05% 3.19% 23.64% 12.62%
BC Aggregate Bond 2.04% 3.93% 4.37% 2.29%
DJ-UBS Commodities 0.08% 7.08% 8.21% 8.50%
Global Equity Sectors (ACWI) QTD YTD1 Year
Return
1 Year
Risk
Energy 11.71% 12.81% 28.35% 11.65%
Utilities 7.40% 15.77% 22.98% 9.35%
Info Tech 6.21% 8.42% 31.03% 7.98%
Consumer Staples 5.10% 5.49% 14.50% 10.60%
MSCI ACWI (Net) 5.04% 6.18% 22.95% 9.27%
Healthcare 4.81% 10.78% 28.48% 9.46%
Materials 4.46% 5.38% 22.41% 9.23%
Telecomm 3.97% 1.95% 18.12% 9.91%
Consumer Disc 3.44% 1.68% 20.74% 11.89%
Industrials 3.31% 3.14% 24.45% 10.50%
Financials 3.20% 3.74% 19.07% 10.52%
Note: 1-year risk reflects standard deviation of monthly returns.
0%
2%
4%
6%
8%
10%
12%
14%
Prominent Asset Classes: Q2 & YTD 2014 Returns
QTD
YTD
0%
2%
4%
6%
8%
10%
12%
14%
16%
18%
Global Equity Sectors: Q2 & YTD 2014 Returns
QTD
YTD
7

4 The information contained herein has been taken from sources deemed reliable, but there is no guarantee of its complete accuracy.
Capital Markets Highlights: Q2-2014
US & Global Equities
US equities marched higher as economic data stabilized. Japan and Europe reported mixed data, but policy initiatives provided support. The S&P 500 gained 5.2%. Japan and Europe gained 6.7% and 3.3%, respectively.
Energy was the top-performing global sector based on a positive demand outlook, attractive valuations, rising crude prices, and investor preferences for cyclical exposures. S&P 500, Russell 2000, and ACWI energy sectors gained 12.1%, 10.6%, and 11.4% respectively.
Emerging Markets rallied 6.6% in Q2, but remain bifurcated as observers debate the strength of fundamentals. India gained 12.7% on positive election results and dislocated Russia rebounded 10.7%. Positive EM fund flows signaled improving investor sentiment.
Global & Specialty Fixed Income
High-quality US bonds continued to defy expectations as intermediate and long-duration interest rates moved lower. From a global perspective, US Treasuries (UST) continue to offer a relative yield advantage, resulting in steady demand from foreign buyers. The UST 10-year closed Q2 at a yield of 2.53%. German and Japanese 10-year bonds yielded 1.25% and 0.55%, respectively.
The BC Aggregate Bond Index gained 2.0% in Q2, but long-duration USTs gained 5.1%. Investment-grade corporates gained 2.7%. High-yield bonds gained 2.4% as credit spreads remained at pre-crisis lows of +353.
Non-US sovereign debt gained as central banks provided ongoing liquidity. The Citigroup WGBI gained 2.3%. EM debt attracted positive fund flows and gained 5.2%.
Commodities & Real Assets
In the ongoing search for yield, cash-flow generating real assets surged in Q2. The Alerian MLP Index gained 14.2%. Dow Jones US and international real estate funds gained 7.0% and 8.8%, respectively.
Diversified commodities were flat in Q2. Agriculture commodities declined 10.0%, but economically-sensitive energy (+4.4%) and base metals (+8.5%) gained with an improving global growth assessment. Meanwhile, precious metals gained in response to rising inflation and escalating geopolitical tensions. Gold was up 3.0% in Q2.
Hedge Funds & Alternative Strategies
The HFRX Global Hedge Fund Index gained 0.7% in Q2. Directional hedge funds struggled early in Q2 during the market rotation that caused losses in momentum securities. In response, many funds reduced risk exposures, resulting in muted gains as Q2 unfolded.
Event Driven strategies gained 1.6% in Q2 and continue to benefit from corporate activity including M&A, debt restructurings, activist investing, and other situations.
Macro/CTA funds continued to lag with a gain of 0.3%.
Sources: Russell Investments, FactSet, MSCI Barra, Barclays Capital, S&P Capital IQ, Bespoke Investment Group, HFRI
8

5 The information contained herein has been taken from sources deemed reliable, but there is no guarantee of its complete accuracy.
Current Capital Markets Viewpoints
Current market views that shape our portfolio positioning and performance expectations:
Global GDP outlook appears stable, but growth levels remain muted due to a lack of re-leveraging by consumers and corporations. This could restrain growth potential, but also extend the cycle by limiting near-term recession risk.
US private sector growth has been steady and should strengthen through the balance of 2014, supported by positive trends in employment and housing, which resumed in Q2 as weather conditions improved. Consumers have deleveraged; corporations have been slow to invest, but after an increase in both stock repurchases and M&A activity, an acceleration in corporate capital spending (CAPEX) is now expected.
Developed Markets have stabilized and indicators suggest continued (if uneven) improvement. Europe’s austerity measures have expired, but loan growth is still modest as banks sit on reserves and repair
capital bases. Nonetheless, growth and productivity are slowly improving, and Draghi initiated a new series of expansive liquidity programs in Q2. Meanwhile, Japan’s recovery stalled in early 2014, but “bad news is good
news” as investors anticipate cuts in corporate tax rates and other structural reforms to promote growth.
Emerging Markets continue to show divergent economic outcomes due to a myriad of concerns (e.g. inflation, growth potential, debt levels, currency values, monetary policy). Index valuations remain cheap by historical measures, but hide a more nuanced picture: Many large state-owned enterprises (SOEs) trade at single-digit multiples due to shrinking businesses, while many smaller private companies – with better growth fundamentals – trade at much higher valuations. Positive fund flows in Q2 suggest sentiment has bottomed.
Corporate balance sheets & profitability remain solid, especially in the US with signs of improvement in Europe and Japan. Equity valuations remain reasonable, but are now more fully valued with above-average prices for
certain market segments. Risk assets offer opportunities, but a more discriminating approach could be in order.
Interest rates seem poised to move higher in the US due to the expected shift in Fed Policy, but rate increases could be limited due to foreign demand and the increasingly accommodative policies of the ECB and BoJ. Our base-case anticipates a gradual normalization process with rates trending higher towards the end of 2014 and into 2015.
9

6 The information contained herein has been taken from sources deemed reliable, but there is no guarantee of its complete accuracy.
Portfolio Positioning Insights
Compelling opportunities are currently limited, but this could change as data points emerge…
Macro policy factors remain a key source of short-term market volatility, but underlying economic and corporate fundamentals have been trending positively and could exert greater influence throughout 2014.
We continue to favor risk-based assets over safe-haven assets, including equities over interest-rate sensitive bonds. Within equities, we favor growth-oriented cyclicals over defensive/yield-oriented sectors. Across asset classes, we favor active and less market-dependent event driven strategies.
US equities present favorable risk/reward based on relative stability and consistency, but higher valuations make the US a bit less compelling. Europe’s recovery is continuing at an uneven pace, supported by ECB policy initiatives, but sentiment has improved and valuations are now less compelling due to recent gains. Japan is less expensive with ongoing policy support and could be more sensitive to a global recovery.
Emerging Markets offer long-term growth potential, but the current environment remains uncertain. Capturing such opportunities requires a selective methodology. We favor an active/non-index approach, targeting preferred EM revenue sources and all-cap privately-run businesses, including Frontier Markets. Recent behavior suggests EM sentiment has bottomed, leading to a potentially favorable environment with positive fund flows. (As an aside, EM revenue exposure can be derived via DM-based global companies.)
In fixed-income, we continue to favor credit risk over interest rate-risk, but credit spreads have tightened and risk/reward is less compelling. High-yield allocations must be monitored – and possibly trimmed where overweights exist. We favor long/short & event-driven credit strategies that provide unique off-the-run
exposures. We remain underweight high-quality bonds, holding them for their defensive attributes, but as rates move higher, such portfolio protection and diversification should become more attractively priced.
Real assets – commodities, real estate, infrastructure, MLPs, natural resources – are expected to provide diversification and inflation protection. Inflation has been muted, but remains a long-term risk. Our real asset allocations favor a mix of assets growing cash flows with capital appreciation potential.
10

7 The information contained herein has been taken from sources deemed reliable, but there is no guarantee of its complete accuracy.
Graystone House Views – July 2014
On the topics of US economic strength and a potential shift to higher interest rates:
“Yes, it’s a dovish committee, but I don’t think investors should be pricing in an even more dovish committee than
what we’ve already got… I am starting to think the economy could tolerate at least a little bit of the central bank
getting back to a more normal stance.”
- James Bullard, President, St. Louis Federal Reserve Bank, June 26, 2014
Topic Current Outlook Other Considerations
US Expansion Economic growth validated in Q2, supported by employment gains
Equity valuations modestly above average; credit spreads at pre-crisis levels; preferred risk exposures tied to company-specific factors
Inflation pressures mounting as PCEPI approaches key 2% level, but global competitiveness still a positive
Limits to market-wide gains in an extended expansion; more selective approach is favored going forward
European Recovery Economic/profits recovery moving at an uneven pace; continued policy support and liquidity from the ECB
Some prices ahead of fundamentals
Core Europe (Germany and UK) is most stable, but more fully valued
Distressed periphery (Spain, Italy), most volatile, but most upside
Japan Recovery Domestic economy stabilizing after increases to consumption tax
BoJ targeting a revival in consumer demand and spending; domestic businesses assumed to benefit
Deflationary challenges persist (i.e. aging population, savings culture)
Abenomics could lead to long-term growth initiatives that benefit shareholders (e.g. corporate tax cuts, rotation from bonds to equities)
11

8 The information contained herein has been taken from sources deemed reliable, but there is no guarantee of its complete accuracy.
Graystone House Views – July 2014
Topic Current Outlook Other Considerations
Emerging Markets Bifurcated based on growth potential, inflation, currency factors, fiscal/monetary policies
China has the willingness and financial strength to implement growth initiatives if needed
Uncertainties persist, but surveys and recent positive fund flows suggest EM sentiment may have bottomed in Q1
Overall index valuations remain inexpensive, but attractive growth assets are more fully valued
Structural reforms in China point to long-term productivity gains and capital markets efficiencies
Index betas could lead an initial liquidity-driven recovery phase, but active, non-index exposures are preferred over the long-term
High-Quality Fixed Income Expect higher interest rates in 2014, but Fed policies remain supportive; maintain high-quality bonds for defensive purposes only
Favor complex and less efficient strategies (i.e. MBS, ABS), interest rate hedges wherever possible
Credit Spread Strategies Favor credit risk over interest rate risk; economic expansion continues with below-average default rates, but trimming overweights to HY
Spreads continue to tighten, so gradually reduce exposures; favor off-the-run securities, hedged credit & relative value arbitrage trades
Event Driven Strategies Lower correlations support bottom-up fundamental analysis; company-specific factors as drivers of return
Increased corporate activity via M&A, spin-offs, restructurings, etc.
Noticeable rotation from credit situations to equity positions in US
European activity appears to be gaining momentum; seeing modestly increased asset sales by banks
12

To the extent the investments depicted herein represent international securities, you should be aware that there may be addit ional risks associated with international investing, including foreign economic, political, monetary and/or legal factors, changing currency exchange rates, foreign taxes, and differences in financial and accounting standards. These risks may be magnified in emerging markets. International investing may not be for everyone. Small capitalization companies may lack the financial resources, product diversification and competitive strengths of larger companies. In addition, the securities of small capitalization companies may not trade as readily as, and be subject to higher volatility than, those of larger, more established companies. All mutual fund products and exchange traded funds are sold by prospectus, which contains more complete information about the fund. Please contact your Financial Advisor for copies. Please read the prospectus and consider the fund's objectives, risks, charges and expenses carefully before investing. The prospectus contains this and other information about the fund. Bonds are subject to interest rate risk. When interest rates rise bond prices fall; generally the longer a bond's maturity, the more sensitive it is to this risk. Bonds may also be subject to call risk, which allows the issuer to retain the right to redeem the debt, fully or partially, before the scheduled maturity date. Proceeds from sales prior to maturity may be more or less than originally invested due to changes in market conditions or changes in the credit quality of the issuer. Investing in alternative investments is speculative, not suitable for all clients, and intended for experienced and sophisticated investors who are willing to bear the high economic risks of the investment, which can include:
• loss of all or a substantial portion of the investment due to leveraging, short-selling or other speculative investment practices; • lack of liquidity in that there may be no secondary market for the fund and none expected to develop; • volatility of returns; • restrictions on transferring interests in the fund; • potential lack of diversification and resulting higher risk due to concentration of trading authority with a single advisor ; • absence of information regarding valuations and pricing; • delays in tax reporting; • less regulation and higher fees than mutual funds; and • advisor risk.
Although the statements and data in this report have been obtained from, and are based upon, sources that the Firm believes to be reliable, we do not guarantee their accuracy, and any such information may be incomplete or condensed. All opinions included in this report constitute the presenters judgment as of the date of this report and are subject to change without notice. This report is for informational purposes only and is not intended as an offer or solicitation with respect to the purchase or sale of any security. Past performance is not a guarantee of future results.
Actual returns would be reduced by expenses that may include management fees and costs of transactions. Expected return and risk (standard deviation) calculations are based on historical data for periods indicated.
The views expressed herein are those of the author and do not necessarily reflect the views of Morgan Stanley Wealth Management or its affiliates. All opinions are subject to change without notice. Neither the information provided nor any opinion expressed constitutes a solicitation for the purchase or sale of any security. Past performance is no guarantee of future results.
© 2014 Graystone Consulting is a business of Morgan Stanley.
9
Important Disclosures
13

Cal Poly Pomona Foundation Investment Results
as of June 30, 2014
Graystone Consulting Andrew Price, CIMA® Executive Director Institutional Consulting Director Todd Au, CIMA® Second Vice President Senior Investment Management Consultant Tim Skelly, CIMA® Senior Vice President Institutional Consulting Director J.P. Szabo Consulting Group Analyst
Address: 1999 Avenue of the Stars Suite 2400 Los Angeles, CA 90067 Phones: Main Line 310-788-2043 Toll-Free 800-786-0048 Fax 310-961-3180 E-Mail: [email protected] [email protected] [email protected] [email protected]
14

Cal Poly Pomona Foundation Executive Summary
Type of Fund Endowment Time Horizon Perpetuity Investment Horizon Over 10 Years Target Return Greater Los Angeles Area CPI + 5% Normal Policy Allocation 40% S&P 500 / 30% EAFE / 30% BC Aggregate Asset Allocation Guidelines
Asset Class Allocation
Total Equities 60.0%Domestic Equity 30.0%International Equity 30.0%
Fixed Income includes MBS 30.0%Domestic and International 30.0%
Real Assets 10.0%Cash Equivalents 0.0%
15

June 30, 2014 : $86,657,511
Market Value($)
Allocation(%)
Domestic Equities 19,346,351 22.33¢£
Global Equities 15,630,900 18.04¢£
International and EM Equities 17,896,345 20.65¢£
Fixed Income 24,787,038 28.60¢£
Real Assets 8,473,226 9.78¢£
Cash & Equivalents 523,651 0.60¢£
Total Fund
($) %
All/Large Cap Equities 15,706,487 18.12
Touchstone All Cap Growth 7,848,689 9.06Aristotle Large Cap Value 7,857,798 9.07
Small/Mid Cap Equities 3,639,864 4.20
Keeley SMID Value* 1,777,361 2.05Apex SMID Cap Growth* 1,862,503 2.15
International and EM Equities 17,896,345 20.65
William Blair International Growth 6,484,287 7.48Harbor International Equity 6,421,412 7.41DuPont Emerging Markets 4,990,646 5.76
Global Equities 15,630,900 18.04
First Eagle 7,833,822 9.04Delaware Focus Global Growth 7,797,078 9.00
Total Public Equities 52,873,595 61.01
Domestic Fixed Income 18,437,854 21.28
PIMCO Total Return* 3,694,756 4.26Met West Total Return 3,720,231 4.29JP Morgan Strategic Income 6,806,563 7.85Nuveen Symphony Credit Opportunities 4,216,305 4.87
Global Fixed Income 6,349,184 7.33
Brandywine Global Fixed Income 3,222,998 3.72Templeton Global Bond Fund 3,126,186 3.61
Total Fixed Income 24,787,038 28.60
Real Assets 8,473,226 9.78
PIMCO AAAA 4,182,243 4.83RS Global Natural Resources 4,290,983 4.95
Cash & Equivalents 523,651 0.60
Cash Holding Account 523,651 0.60
Cal Poly Pomona Foundation Total Fund 86,657,511 100.00
June 30, 2014
Allocation Differences
0.0% 0.6% 1.2% 1.8% 2.4%-0.6 %-1.2 %-1.8 %-2.4 %
Cash & Equivalents
Real Assets
Fixed Income
Global Equities
International Equities
Domestic Equities
0.6%
-0.2 %
-1.4 %
0.0%
-0.3 %
1.3%
June 30, 2014Market Value
($)Allocation
(%)Target
(%)
Domestic Equities 19,346,351 22.33 21.00International Equities 17,896,345 20.65 21.00Global Equities 15,630,900 18.04 18.00Fixed Income 24,787,038 28.60 30.00Real Assets 8,473,226 9.78 10.00Cash & Equivalents 523,651 0.60 0.00Total Fund 86,657,511 100.00 100.00
Cal Poly Pomona FoundationBalances and Asset Allocation
June 30, 2014
*Value includes dividend accruals not shown on statement16

AllocationMarketValue
($)%
Performance(%)Quarter
ToDate
FiscalYTD
1Year
3Years
5Years
SinceInception
Fiscal Year2013
Fiscal Year2012
Fiscal Year2011
Fiscal Year2010
InceptionDate
Cal Poly Pomona Foundation Total Fund 86,657,511 100.00 3.52 15.80 15.80 8.21 12.68 8.68 10.95 -1.38 23.96 15.63 10/01/2008
Cal Poly Pomona Blended Benchmark 3.94 18.08 18.08 10.28 12.88 9.10 13.42 0.15 22.26 11.75Difference -0.42 -2.28 -2.28 -2.07 -0.20 -0.42 -2.47 -1.53 1.70 3.88
70% S&P 500 / 30% BC Aggregate 4.28 18.33 18.33 12.90 14.83 10.44 13.96 6.74 22.30 13.41 10/01/2008
Public Equities 52,873,595 61.01 3.97 21.41 21.41 9.89 15.25 9.52 15.49 -5.35 33.64 14.65 10/01/2008
MSCI AC World Net 5.04 22.97 22.97 10.26 14.28 9.12 16.58 -6.49 30.13 11.77Difference -1.07 -1.56 -1.56 -0.37 0.97 0.40 -1.09 1.14 3.51 2.88
Domestic Equities 19,346,351 22.33 4.48 28.21 28.21 15.67 18.76 12.01 20.83 -0.09 34.77 13.27 10/01/2008
Russell 3000 4.87 25.22 25.22 16.46 19.33 12.28 21.49 3.84 32.37 15.72Difference -0.39 2.99 2.99 -0.79 -0.57 -0.27 -0.66 -3.93 2.40 -2.45
Touchstone Westfield All Cap Growth 7,848,689 9.06 4.49 30.37 30.37 N/A N/A 17.49 24.92 N/A N/A N/A 08/01/2011
Russell 3000 Gr 4.86 26.74 26.74 N/A N/A 17.11 17.58 N/A N/A N/ADifference -0.37 3.63 3.63 N/A N/A 0.38 7.34 N/A N/A N/A
Aristotle Large Cap Value 7,857,798 9.07 4.88 28.11 28.11 N/A N/A 23.22 N/A N/A N/A N/A 06/01/2013
S&P 500 5.24 24.62 24.62 N/A N/A 21.01 N/A N/A N/A N/ADifference -0.36 3.49 3.49 N/A N/A 2.21 N/A N/A N/A N/A
Keeley SMID Value 1,777,361 2.05 3.10 23.34 23.34 N/A N/A 19.45 36.08 N/A N/A N/A 08/01/2011
Russell 2500 Vl 4.19 24.94 24.94 N/A N/A 18.04 26.87 N/A N/A N/ADifference -1.09 -1.60 -1.60 N/A N/A 1.41 9.21 N/A N/A N/A
Apex SMID Cap Growth 1,862,503 2.15 4.01 30.48 30.48 N/A N/A 19.31 25.33 N/A N/A N/A 08/01/2011
Russell 2500 Gr 2.89 26.26 26.26 N/A N/A 16.91 24.02 N/A N/A N/ADifference 1.12 4.22 4.22 N/A N/A 2.40 1.31 N/A N/A N/A
Global Equities 15,630,900 18.04 3.80 16.29 16.29 N/A N/A 9.58 12.09 N/A N/A N/A 08/01/2011
MSCI AC World Net 5.04 22.97 22.97 N/A N/A 11.19 16.58 N/A N/A N/ADifference -1.24 -6.68 -6.68 N/A N/A -1.61 -4.49 N/A N/A N/A
First Eagle 7,833,822 9.04 3.39 17.81 17.81 N/A N/A 10.07 12.08 N/A N/A N/A 08/01/2011
MSCI AC World Net 5.04 22.97 22.97 N/A N/A 11.19 16.58 N/A N/A N/ADifference -1.65 -5.16 -5.16 N/A N/A -1.12 -4.50 N/A N/A N/A
Cal Poly Pomona Foundation
Asset Allocation & Performance
As of June 30, 2014
*Cal Poly Pomona Blended Benchmark consists of 40% S&P 500/30% EAFE/30% BC Aggregate
17

Cal Poly Pomona Foundation
Asset Allocation & Performance
As of June 30, 2014Allocation
MarketValue
($)%
Performance(%)Quarter
ToDate
FiscalYTD
1Year
3Years
5Years
SinceInception
Fiscal Year2013
Fiscal Year2012
Fiscal Year2011
Fiscal Year2010
InceptionDate
Delaware Focus Global Growth 7,797,078 9.00 4.23 N/A N/A N/A N/A 10.67 N/A N/A N/A N/A 10/01/2013
MSCI AC World Net 5.04 N/A N/A N/A N/A 13.95 N/A N/A N/A N/ADifference -0.81 N/A N/A N/A N/A -3.28 N/A N/A N/A N/A
International and EM Equities 17,896,345 20.65 3.58 17.93 17.93 4.08 11.62 7.37 10.83 -13.73 30.71 17.59 10/01/2008
MSCI AC World ex US Net 5.02 21.75 21.75 5.74 11.11 7.28 13.65 -14.56 29.73 10.42Difference -1.44 -3.82 -3.82 -1.66 0.51 0.09 -2.82 0.83 0.98 7.17
William Blair International Growth 6,484,287 7.48 3.90 20.00 20.00 8.51 13.77 9.17 17.33 -9.26 27.92 16.64 10/01/2008
MSCI EAFE Net 4.08 23.57 23.57 8.10 11.77 7.40 18.63 -13.83 30.36 5.92Difference -0.18 -3.57 -3.57 0.41 2.00 1.77 -1.30 4.57 -2.44 10.72
Harbor International 6,421,412 7.41 3.34 21.48 21.48 6.97 13.52 8.38 14.10 -11.69 35.68 13.50 10/01/2008
MSCI EAFE Net 4.08 23.57 23.57 8.10 11.77 7.40 18.63 -13.83 30.36 5.92Difference -0.74 -2.09 -2.09 -1.13 1.75 0.98 -4.53 2.14 5.32 7.58
DuPont Emerging Markets 4,990,646 5.76 3.48 10.79 10.79 N/A N/A -2.11 -3.37 N/A N/A N/A 08/01/2011
MSCI EM Net 6.59 14.31 14.31 N/A N/A -0.25 2.87 N/A N/A N/ADifference -3.11 -3.52 -3.52 N/A N/A -1.86 -6.24 N/A N/A N/A
Fixed Income 24,787,038 28.60 1.96 5.57 5.57 4.86 6.94 7.57 3.43 5.60 5.49 14.98 10/01/2008
BC Aggregate 2.04 4.37 4.37 3.67 4.85 5.37 -0.69 7.47 3.90 9.50Difference -0.08 1.20 1.20 1.19 2.09 2.20 4.12 -1.87 1.59 5.48
PIMCO Total Return 3,694,756 4.26 2.36 4.47 4.47 3.06 5.55 6.52 -1.19 6.04 5.38 13.59 10/01/2008
BC Aggregate 2.04 4.37 4.37 3.67 4.85 5.37 -0.69 7.47 3.90 9.50Difference 0.32 0.10 0.10 -0.61 0.70 1.15 -0.50 -1.43 1.48 4.09
Met West Total Return 3,720,231 4.29 2.15 5.92 5.92 N/A N/A 5.73 4.76 N/A N/A N/A 08/01/2011
BC Aggregate 2.04 4.37 4.37 N/A N/A 3.21 -0.69 N/A N/A N/ADifference 0.11 1.55 1.55 N/A N/A 2.52 5.45 N/A N/A N/A
JP Morgan Strategic Income 6,806,563 7.85 0.11 2.22 2.22 N/A N/A 3.52 5.68 N/A N/A N/A 08/01/2011
BC Aggregate 2.04 4.37 4.37 N/A N/A 3.21 -0.69 N/A N/A N/ADifference -1.93 -2.15 -2.15 N/A N/A 0.31 6.37 N/A N/A N/A
*Cal Poly Pomona Blended Benchmark consists of 40% S&P 500/30% EAFE/30% BC Aggregate
18

Cal Poly Pomona Foundation
Asset Allocation & Performance
As of June 30, 2014Allocation
MarketValue
($)%
Performance(%)Quarter
ToDate
FiscalYTD
1Year
3Years
5Years
SinceInception
Fiscal Year2013
Fiscal Year2012
Fiscal Year2011
Fiscal Year2010
InceptionDate
Brandywine Global Fixed Income 3,222,998 3.72 4.34 7.67 7.67 N/A N/A 5.87 3.80 N/A N/A N/A 08/01/2011
Citi WGBI UnH 2.27 6.85 6.85 N/A N/A 0.82 -4.50 N/A N/A N/ADifference 2.07 0.82 0.82 N/A N/A 5.05 8.30 N/A N/A N/A
Templeton Global Bond Fund 3,126,186 3.61 2.66 7.05 7.05 N/A N/A 4.38 7.84 N/A N/A N/A 08/01/2011
Citi WGBI UnH 2.27 6.85 6.85 N/A N/A 0.82 -4.50 N/A N/A N/ADifference 0.39 0.20 0.20 N/A N/A 3.56 12.34 N/A N/A N/A
Nuveen Symphony Credit Opportunities 4,216,305 4.87 2.18 N/A N/A N/A N/A 7.95 N/A N/A N/A N/A 10/01/2013
CS Leveraged Loan VL 1.45 N/A N/A N/A N/A 4.65 N/A N/A N/A N/ADifference 0.73 N/A N/A N/A N/A 3.30 N/A N/A N/A N/A
Real Assets 8,473,226 9.78 5.52 6.07 6.07 N/A N/A 4.38 3.29 N/A N/A N/A 08/01/2011
RS Global Natural Resources 4,290,983 4.95 7.13 N/A N/A N/A N/A 7.42 N/A N/A N/A N/A 10/01/2013
S&P NAM Natural Resources 13.17 N/A N/A N/A N/A 22.28 N/A N/A N/A N/ADifference -6.04 N/A N/A N/A N/A -14.86 N/A N/A N/A N/A
PIMCO AAAA 4,182,243 4.83 3.92 6.93 6.93 N/A N/A 4.77 3.29 N/A N/A N/A 08/01/2011
S&P 500 5.24 24.62 24.62 16.59 18.84 N/A 20.60 5.45 30.69 14.43 01/01/1961
BC Aggregate 2.04 4.37 4.37 3.67 4.85 7.92 -0.69 7.47 3.90 9.50 01/01/1976
HFRI FoF Composite N/A N/A N/A N/A N/A N/A 7.26 -4.51 6.68 4.68 01/01/1990
*Cal Poly Pomona Blended Benchmark consists of 40% S&P 500/30% EAFE/30% BC Aggregate
19

Asset Allocation Over Time
CurrentQuarter
FiscalYTD
Fiscal Year2013
Fiscal Year2012
Oct 2008To
Dec 2008
SinceInception
InceptionDate
Cal Poly Pomona Foundation Total Fund 10/01/2008 Beginning Market Value 83,426,753 69,290,107 55,579,506 49,983,520 31,161,294 31,161,294 Net Contributions 290,352 5,871,633 7,024,252 6,269,492 -475,941 27,823,012 Fees/Expenses -35,126 -146,319 -119,298 -120,966 -51,340 -773,914 Income 252,631 2,576,070 2,423,285 1,213,128 630,728 9,423,429 Gain/Loss 2,722,902 9,066,020 4,382,362 -1,765,668 -5,921,902 19,023,690 Ending Market Value 86,657,511 86,657,511 69,290,107 55,579,506 25,342,839 86,657,511
CurrentQuarter
FiscalYTD
Fiscal Year2013
Fiscal Year2012
Oct 2008To
Dec 2008
SinceInception
InceptionDate
Cal Poly Pomona Foundation Total Fund 3.52 15.80 10.95 -1.38 -17.44 8.68 10/01/2008Cal Poly Pomona Blended Benchmark 3.94 18.08 13.42 0.15 -13.59 9.10 10/01/200870% S&P 500 / 30% BC Aggregate 4.28 18.33 13.96 6.74 -13.99 10.44 10/01/2008
US Equity International Equity Global Equity International-Emerging Equity
US Fixed Income Global Fixed Income US REIT (Real-Estate Funds) US Real Return
Global Real Return US Mixed Assets Global Mixed Assets Cash
Hedge Fund
0.0
25.0
50.0
75.0
100.0
All
oc
ati
on
(%)
9/08 3/09 9/09 3/10 9/10 3/11 9/11 3/12 9/12 3/13 9/13 3/14 6/14
Cal Poly Pomona FoundationPerformance and Asset Allocation History
June 30, 2014
*Cal Poly Pomona Blended Benchmark consists of 40% S&P/30% EAFE/30% BC Aggregate
20

Disclosures
21

Index Definitions
Lehman Aeareciate Bond IndexLehman Aggregate Bond Index is an index comprised of approximately 6,000 publicly traded bonds including U.S. Government, mortgage-backed, corporate, and Yankee bonds with an approximateaveragematurity of 10 years. An investment cannot be made directly in a market index.MSCI EAFES) Index (Europe, Australasia, Far East)The MSCI EAFE8 Index (Europe, Australasia, Far East) is a free float-adjusted market capitalization index that is designed to measure developed market equity performance, excludingthe US & Canada. As ofMay 2005 the MSG! EAFE Index consisted of the following 21 developed market country indices: Australia, Austria, Belgium, Denmark, Finland, France, Germany, Greece, Hong Kong,Ireland, Italy, Japan, theNetherlands, New Zealand, Norway, Portugal, Singapore, Spain, Sweden, Switzerland and the United Kingdom. An investment cannot be made directly in a market index.Russell 10000 IndexRussell 10000 Index measures the performance of the 1,000 largest companies in the Russell 3000 Index, which represents approximately 92% of the total market capitalizationof the Russell 3000 Index. Aninvestment cannot be made directly in a market index.Russell 10000 Growth IndexRussell 10008 Growth Index measures the performance of those Russell 1000 companies with higher price-to-book ratios and higher forecasted growth values An investment cannot be made directly in amarket index.Russell 10000 Value IndexRussell 10000 Value Index measures the performance of those Russell 1000 companies with lower price-to-book ratios and lower forecasted growth values. An investment cannot be made directly in a marketindex.Russell zoom IndexRussell 20008 Index measures the performance of the 2,000 smallest companies in the Russell 3000 Index, which represents approximately 8% of the total market capitalizationof the Russell 3000 Index. Aninvestment cannot be made directly in a market index.Russell nooe Growth IndexRussell 20000 Growth Index measures the performance of those Russell 2000 companies with higher price-to-book ratios and higher forecasted growth values An investment cannot be made directly in amarket index.Russell 20000 Value IndexRussell 20008 Value Index measures the performance of those Russell 2000 companies with lower price-to-book ratios and lower forecasted growth values. An investment cannot be made directly in a marketindex.Russell 25001. IndexRussell 2500T. Index measures the performance of the 2,500 smallest companies in the Russell 3000 Index, which represents approximately 16% of the total market capitalizationof the Russell 3000 Index. at
investment cannot be made directly in a market index.Russell 2500TM Growth IndexRussell 2500., Growth Index measures the performance of those Russell 2500 companies with higher price-to-book ratios and higher forecasted growth values. An investment cannot be made directly in amarket index.Russell 25001m Value IndexRussell 2500T. Value Index measures the performance of those Russell 2500 companies with lower price-to-book ratios and lower forecasted growth values. An investment cannot be made directly in a marketindex.Russell 30000 IndexRussell 30000 Index measures the performance of the 3,000 largest U.S. companies based on total market capitalization, which represents approximately 98% of the investable U.S.equity market. Aninvestment cannot be made directly in a market index.Russell Midcap0 IndexRussell Midcap® Index measures the performance of the 800 smallest companies in the Russell 1000 Index, which represent approximately 25% of the total market capitalizationof the Russell 1000 Index. Aninvestment cannot be made directly in a market index.Russell Midcap3) Growth IndexRussell Midcap8 Growth Index measures the performance of those Russell Midcap companies with higher price-to-book ratios and higher forecasted growth values. The stocks are alsomembers of the Russell1000 Growth index. An investment cannot be made directly in a market index.Russell Midcape Value IndexRussell Midcap® Value Index measures the performance of those Russell Midcap companies with lower price-to-book ratios and lower forecasted growth values. The stocks are alsomembers of the Russell1000 Value index. An investment cannot be made directly in a market index.Standard & Poor's 500 IndexS&P 500 Index is an unmanaged, market value-weighted index of 500 stocks generally representative of the broad stock market. An investment cannot be made directly in a market index.
Important Disclosures
22

Important Disclosures To the extent the investments depicted herein represent international securities, you should be aware that there may be additional risks associated with international investing, including foreign economic, political, monetary and/or legal factors, changing currency exchange rates, foreign taxes, and differences in financial and accounting standards. These risks may be magnified in emerging markets. International investing may not be for everyone. Small capitalization companies may lack the financial resources, product diversification and competitive strengths of larger companies. In addition, the securities of small capitalization companies may not trade as readily as, and be subject to higher volatility than, those of larger, more established companies. Bonds are subject to interest rate risk. When interest rates rise bond prices fall; generally the longer a bond's maturity, the more sensitive it is to this risk. Bonds may also be subject to call risk, which allows the issuer to retain the right to redeem the debt, fully or partially, before the scheduled maturity date. Proceeds from sales prior to maturity may be more or less than originally invested due to changes in market conditions or changes in the credit quality of the issuer. Investing in alternative investments is speculative, not suitable for all clients, and intended for experienced and sophisticated investors who are willing to bear the high economic risks of the investment, which can include: • loss of all or a substantial portion of the investment due to leveraging, short-selling or other speculative investment practices; • lack of liquidity in that there may be no secondary market for the fund and none expected to develop; • volatility of returns; • restrictions on transferring interests in the fund; • potential lack of diversification and resulting higher risk due to concentration of trading authority with a single advisor; • absence of information regarding valuations and pricing; • delays in tax reporting; • less regulation and higher fees than mutual funds; and • advisor risk. Although the statements of fact and data in this report have been obtained from, and are based upon, sources that the Firm believes to be reliable, we do not guarantee their accuracy, and any such information may be incomplete or condensed. All opinions included in this report constitute the Firm’s judgment as of the date of this report and are subject to change without notice. This report is for informational purposes only and is not intended as an offer or solicitation with respect to the purchase or sale of any security. Past performance is not a guarantee of future results. Actual returns would be reduced by expenses that may include management fees and costs of transactions. Expected return and risk (standard deviation) calculations are based on historical data for periods indicated. International investing may not be suitable for every investor and is subject to additional risks, including currency fluctuations, political factors, withholding, lack of liquidity, the absence of adequate financial information, and exchange control restrictions impacting foreign issuers. These risks may be magnified in emerging markets. Mutual fund investments are subject to market risk, including the possible loss of principal. They are sold by prospectus only. The prospectus contains the investment objectives, risks, fees, charges and expenses, and other information regarding the mutual fund and variable annuity contract and its underlying investments, which should be carefully considered before investing. Prospectuses are available through your Financial Advisor or at www.smithbarney.com. Read the prospectus carefully before you invest. © 2014 Graystone Consulting is a business of Morgan Stanley Smith Barney LLC.
23

Analysis Disclosure
The analysis is based on published investment manager rate of return data, capital market indices, custom (benchmarks, indices and universes), as well as software developed by Zephyr Associates. Investment manager rate of return data includes: Effron Plan Sponsor Network Database. Capital markets index data includes: Capital market indices (supplied by Zephyr), Canadian indices (supplied by Zephyr), Salomon Brothers Fixed Income indices, Morgan Stanley Capital International indices, and Dow Jones Global indices. Zephyr StyleADVISOR uses principles of William Sharpe's theory of returns-based style analysis. Returns-based style analysis assists in identifying investment style without examining the individual security holdings of a portfolio. StyleADVISOR regresses the historical returns of the individual manager(s) against different style indices to identify the pattern of returns that the fund is most closely correlated to. SSB does not recommend the use of returns-based style analysis without the supporting fundamental research of the fund (research attribution reports). The underlying data is believed to be reliable but accuracy and completeness cannot be assured. While the historical rates of return described in this report are believed to accurately reflect the overall nature of the portfolio, the constituent securities have not been reviewed. This evaluation is for informational purposes only and is not intended to be an offer, solicitation or recommendation with respect to the purchase or sale of any security or a recommendation of the services provided by any money management organization. Past results are not necessarily indicative of future performance. Investors should consider the investment objectives, risks, charges, fees and expenses of the mutual fund carefully before investing. The prospectus contains more complete information about these factors and other information about the investment company. Read the prospectus carefully before you invest.
24

Cal Poly Pomona Foundation – General Investment Portfolio
Investment Results as of June 30, 2014
Graystone Consulting Andrew Price, CIMA® Executive Director Institutional Consulting Director Todd Au, CIMA® Second Vice President Senior Investment Management Consultant Tim Skelly, CIMA® Senior Vice President Institutional Consulting Director J.P. Szabo Consulting Group Analyst
Address: 1999 Avenue of the Stars Suite 2400 Los Angeles, CA 90067 Phones: Main Line 310-788-2043 Toll-Free 800-786-0048 Fax 310-961-3180 E-Mail: [email protected] [email protected] [email protected] [email protected]
25

Total Fund ($) (%)
Domestic Equities $3,145,321 8.0%Touchstone Westfield All Cap Growth $1,273,448 3.3%Aristotle Large Cap Value $1,321,391 3.4%Apex SMID Cap Growth $274,613 0.7%Keeley SMID Cap Value $275,868 0.7%
International and EM Equities $3,395,133 8.7%Harbor International Value $1,451,332 3.7%William Blair International Growth $1,459,797 3.7%Dupont Emerging Markets $484,004 1.2% Market Value Allocation
($) (%)Global Equities $2,782,624 7.1% Public Equities $9,323,078 23.8%First Eagle Global $1,391,804 3.6% Fixed Income $28,931,454 73.8%Delaware Focused Global Growth $1,390,820 3.5% Real Assets $878,520 2.2%
Cash & Equivalents $45,204 0.1%Public Equities $9,323,078 23.8%
June 30, 2014Fixed Income $28,931,454 73.8%Doubleline Total Return $2,344,726 6.0%JP Morgan Strategic Income $1,718,085 4.4%Brandywine Global Opportunistic $1,234,928 3.2%Nuveen Symphony Credit Opportunity $590,785 1.5%PIMCO Low Duration $23,042,930 58.8%
Real Assets $878,520 2.2%Barclays Ipath DJP UBS Commodities $137,977 0.4%REMS Real Estate Value Opportunity $179,048 0.5%Nuveen Symphony Credit Opportunity $239,555 0.6%PIMCO All Asset All Authority $176,924 0.5% Allocation DifferencesRS Natural Global Resources $145,017 0.4% June 30, 2014
Market Value Allocation TargetCash and Equivalents $45,204 0.1% ($) (%) (%)Cash and Equivalents $45,204 0.1% Public Equities $9,323,078 23.8% 26.0%
Fixed Income $28,931,454 73.8% 72.0%General Investment Portfolio $39,178,257 100.0% Real Assets $878,520 2.2% 2.0%
Cash & Equivalents $45,204 0.1% 0.0%
Cal Poly Pomona Foundation - General Investment PortfolioBalances and Asset Allocation
as of June 30, 2014
0.1%
0.2%
1.8%
-2.2%
-3.0% -2.0% -1.0% 0.0% 1.0% 2.0% 3.0%
1
2
3
4
June 30, 2014 : $38,447,500
The information contained herein was prepared by the undersigned for informational purposes only and does not represent an official statement of your account at the Firm. Please refer to your monthly statements for a complete record of your transactions, holdings and balances. Graystone Consulting is a business of Morgan Stanley Smith Barney.
Cash & Equivalents
Real Assets
Fixed Income
Public Equities
26

AllocationMarketValue
($)
Performance(%)Quarter
ToDate
FiscalYTD
1Year
3Years
5Years
SinceInception
InceptionDate
General Investment Portfolio 39,178,257 1.75 4.02 4.02 N/A N/A 2.25 03/01/2013
Cal Poly Pomona Blended Benchmark* 2.27 4.13 4.13 N/A N/A 1.87Difference -0.52 -0.11 -0.11 N/A N/A 0.38
Public Equities 9,323,078 3.95 N/A N/A N/A N/A 3.95 04/01/2014
MSCI AC World Net 5.04 N/A N/A N/A N/A 5.04Difference -1.09 N/A N/A N/A N/A -1.09
Domestic Equities 3,145,321 4.48 N/A N/A N/A N/A 4.48 04/01/2014
Russell 3000 4.87 N/A N/A N/A N/A 4.87Difference -0.39 N/A N/A N/A N/A -0.39
Touchstone Westfield All Cap Growth 1,273,448 4.47 N/A N/A N/A N/A 4.47 04/01/2014Russell 3000 Gr 4.86 N/A N/A N/A N/A 4.86Difference -0.39 N/A N/A N/A N/A -0.39
Aristotle Large Cap Value 1,321,391 4.89 N/A N/A N/A N/A 4.89 04/01/2014Russell 1000 Vl 5.10 N/A N/A N/A N/A 5.10Difference -0.21 N/A N/A N/A N/A -0.21
Apex SMID Cap Growth 274,613 4.03 N/A N/A N/A N/A 4.03 04/01/2014Russell 2500 Gr 2.89 N/A N/A N/A N/A 2.89Difference 1.14 N/A N/A N/A N/A 1.14
Keeley SMID Cap Value 275,868 3.07 N/A N/A N/A N/A 3.07 04/01/2014Russell 2500 Vl 4.19 N/A N/A N/A N/A 4.19Difference -1.12 N/A N/A N/A N/A -1.12
International and EM Equities 3,395,133 3.59 N/A N/A N/A N/A 3.59 04/01/2014
MSCI AC World ex US Net 5.02 N/A N/A N/A N/A 5.02Difference -1.43 N/A N/A N/A N/A -1.43
Harbor International Value 1,451,332 3.32 N/A N/A N/A N/A 3.32 04/01/2014MSCI AC World ex US Net 5.02 N/A N/A N/A N/A 5.02Difference -1.70 N/A N/A N/A N/A -1.70
Cal Poly Pomona Foundation - General Investment Portfolio
Asset Allocation & Performance
As of June 30, 2014
*Inception to 2/28/2014 100% Barclays Int. Gov't Credit. 3/31/2014 to Present 72% Barclays Int. Gov't Credit, 26% MSCI ACWI, 2% Real Assets Benchmark**65% ACWI / 35% WGBI (Subject to change)
27

Cal Poly Pomona Foundation - General Investment Portfolio
Asset Allocation & Performance
As of June 30, 2014Allocation
MarketValue
($)
Performance(%)Quarter
ToDate
FiscalYTD
1Year
3Years
5Years
SinceInception
InceptionDate
William Blair International Growth 1,459,797 3.89 N/A N/A N/A N/A 3.89 04/01/2014MSCI EAFE Net 4.08 N/A N/A N/A N/A 4.08Difference -0.19 N/A N/A N/A N/A -0.19
DuPont Emerging Markets 484,004 3.45 N/A N/A N/A N/A 3.45 04/01/2014MSCI EM Net 6.59 N/A N/A N/A N/A 6.59Difference -3.14 N/A N/A N/A N/A -3.14
Global Equities 2,782,624 3.78 N/A N/A N/A N/A 3.78 04/01/2014
MSCI AC World Net 5.04 N/A N/A N/A N/A 5.04Difference -1.26 N/A N/A N/A N/A -1.26
First Eagle Global 1,391,804 3.36 N/A N/A N/A N/A 3.36 04/01/2014MSCI AC World Net 5.04 N/A N/A N/A N/A 5.04Difference -1.68 N/A N/A N/A N/A -1.68
Delaware Focused Global Growth 1,390,820 4.20 N/A N/A N/A N/A 4.20 04/01/2014MSCI AC World Net 5.04 N/A N/A N/A N/A 5.04Difference -0.84 N/A N/A N/A N/A -0.84
Fixed Income 28,974,020 1.00 3.14 3.14 N/A N/A 1.60 03/01/2013
BC Gov/Cr Intm 1.23 2.86 2.86 N/A N/A 0.94Difference -0.23 0.28 0.28 N/A N/A 0.66
Short-Term Portfolio Strategy 28,974,020 1.00 3.14 3.14 N/A N/A 1.60 03/01/2013BC Gov/Cr Intm 1.23 2.86 2.86 N/A N/A 0.94Difference -0.23 0.28 0.28 N/A N/A 0.66
Real Assets 881,158 4.14 N/A N/A N/A N/A 4.14 04/01/2014
Real Assets Blended Benchmark** 4.07 N/A N/A N/A N/A 4.07Difference 0.07 N/A N/A N/A N/A 0.07
Real Assets Portfolio 881,158 4.14 N/A N/A N/A N/A 4.14 04/01/2014Real Assets Blended Benchmark** 4.07 N/A N/A N/A N/A 4.07Difference 0.07 N/A N/A N/A N/A 0.07
*Inception to 2/28/2014 100% Barclays Int. Gov't Credit. 3/31/2014 to Present 72% Barclays Int. Gov't Credit, 26% MSCI ACWI, 2% Real Assets Benchmark**65% ACWI / 35% WGBI (Subject to change)
28

Asset Allocation Over Time
CurrentQuarter
FiscalYTD
SinceInception
InceptionDate
General Investment Portfolio 03/01/2013
Beginning Market Value 38,447,500 26,122,666 24,301,287 Net Contributions 56,099 11,817,106 13,972,646 Fees/Expenses -21,392 -62,440 -79,509 Income 162,756 533,707 848,854 Gain/Loss 533,293 767,217 134,979 Ending Market Value 39,178,257 39,178,257 39,178,257
CurrentQuarter
FiscalYTD
SinceInception
InceptionDate
General Investment Portfolio 1.75 4.02 2.25 03/01/2013
Cal Poly Pomona Blended Benchmark 2.27 4.13 1.87 03/01/2013
US Equity International Equity Global Equity
International-Emerging Equity US Fixed Income Global Mixed Assets
0.0
25.0
50.0
75.0
100.0
All
oc
ati
on
(%)
2/13 3/13 4/13 5/13 6/13 7/13 8/13 9/13 10/13 11/13 12/13 1/14 2/14 3/14 4/14 5/14 6/14
Cal Poly Pomona Foundation - General Investment PortfolioPerformance and Asset Allocation History
June 30, 2014
*Inception to 2/28/2014 100% Barclays Int. Gov't Credit. 3/31/2014 to Present 72% Barclays Int. Gov't Credit, 26% MSCI ACWI, 2% Real Assets Benchmark
29

Portfolio Summary
Asset Class Investment Manager Allocation Values as of 6/30/14
Average Credit
Quality
Duration (Years) Yield
Short Duration Fixed Income PIMCO Low Duration Fixed Income 80.00% 23,042,930 A- 2.83 1.50%Global Unconstrained Credit JP Morgan Strategic Income Opportunities 6.00% 1,718,085 A -0.29 1.94%Mortgage Backed Securities Doubleline Total Return 8.00% 2,344,726 A 3.35 4.73%Global Fixed Income Brandywine Global Opportunistic Fixed Income 4.00% 1,234,928 A 6.87 4.65%Global High Yield / Floating Rate Nuveen Symphony Credit Opportunity Fund 2.00% 590,785 B+ 2.90 5.65%Totals* 100.00% 28,974,020 A- 2.85 1.99%
Barclays US 1-3 Year Treasury Index 1.89 0.35%Barclays Intermediate Government/Credit Index 3.83 1.70%
Global High Yield / Floating Rate2%
Global Fixed Income4%
Mortgage Backed Securities8%
Global Unconstrained Credit6%
Short Duration Fixed Income80%*Account contained a cash balance of $42,565.99
Yield and duration totals are weighted averages. Source: Investment Managers Data as of 6/30/14
30

Cal Poly Pomona - Fixed Income Fund AnalysisManager vs Benchmark: ReturnJuly 2004 - June 2014 (not annualized if less than 1 year)
Ret
urn
0
0.5
1
1.5
2
2.5
3
3.5
4
4.5
1 quarter 1 year 3 years 5 years 7 years 10 years
PIMCO - Low Duration BofA Merrill Lynch 1-3 Year US Treasury
Risk / ReturnJuly 2004 - June 2014 (Single Computation)
Ret
urn
0%
0.5%
1%
1.5%
2%
2.5%
3%
3.5%
4%
4.5%
Standard Deviation0% 0.5% 1% 1.5% 2% 2.5% 3% 3.5%
PIMCO - Low Duration Market Benchmark:BofA Merrill Lynch 1-3 Year US Treasury
Cash Equivalent:Citigroup 3-month T-bill
10-year StatisticsJuly 2004 - June 2014: Summary Statistics
PIMCO - Low Duration
BofA Merrill Lynch 1-3 Year US Treasury
Return Excess Return StandardDeviation
SharpeRatio
InformationRatio Alpha Beta Maximum
DrawdownUp
CaptureDown
Capture
3.96% 1.34% 3.44% 0.70 0.38 3.04% 0.36 -4.13% 119.37% -404.90%
2.62% 0.00% 1.76% 0.61 0.00 0.00% 1.00 -0.86% 100.00% 100.00%
Fiscal Year ReturnsJuly 2004 - June 2014 (12-Month Moving Windows, Computed Monthly)
PIMCO - Low Duration
BofA Merrill Lynch 1-3 Year US Treasury
Jun 2014 Jun 2013 Jun 2012 Jun 2011 Jun 2010 Jun 2009 Jun 2008 Jun 2007 Jun 2006
2.71% 1.23% 2.66% 4.32% 8.88% 4.26% 7.54% 4.45% 1.11%
0.76% 0.33% 0.79% 1.34% 2.69% 4.39% 7.30% 5.07% 1.83%
Jun 2005
2.67%
1.87%
Manager vs Benchmark: ReturnJuly 2004 - June 2014 (not annualized if less than 1 year)
1 quarter 1 year 3 years 5 years 7 years 10 years
0.80% 2.71% 2.20% 3.93% 4.48% 3.96%
0.27% 0.76% 0.63% 1.18% 2.49% 2.62%
31

Cal Poly Pomona - Fixed Income Fund AnalysisManager vs Benchmark: ReturnJuly 2009 - June 2014 (not annualized if less than 1 year)
Ret
urn
0
1
2
3
4
5
6
1 quarter 1 year 3 years 5 years
JPMorgan - Strategic Income Barclays U.S. Aggregate
Risk / ReturnJuly 2009 - June 2014 (Single Computation)
Ret
urn
0%
1%
2%
3%
4%
5%
6%
Standard Deviation0% 0.5% 1% 1.5% 2% 2.5% 3% 3.5% 4%
JPMorgan - Strategic Income Market Benchmark:Barclays U.S. Aggregate
Cash Equivalent:Citigroup 3-month T-bill
5-year StatisticsJuly 2009 - June 2014: Summary Statistics
JPMorgan - Strategic Income
Barclays U.S. Aggregate
Return Excess Return StandardDeviation
SharpeRatio
InformationRatio Alpha Beta Maximum
DrawdownUp
CaptureDown
Capture
5.26% 0.41% 4.08% 1.27 0.08 5.98% -0.13 -4.55% 76.52% -115.86%
4.85% 0.00% 3.24% 1.47 0.00 0.00% 1.00 -2.44% 100.00% 100.00%
Fiscal Year ReturnsJuly 2009 - June 2014 (12-Month Moving Windows, Computed Monthly)
JPMorgan - Strategic Income
Barclays U.S. Aggregate
Jun 2014 Jun 2013 Jun 2012 Jun 2011
2.40% 5.63% 1.85% 6.18%
4.37% -0.69% 7.47% 3.90%
Jun 2010
10.49%
9.50%
Manager vs Benchmark: ReturnJuly 2009 - June 2014 (not annualized if less than 1 year)
1 quarter 1 year 3 years 5 years
0.12% 2.40% 3.28% 5.26%
2.04% 4.37% 3.66% 4.85%
32

Cal Poly Pomona - Fixed Income Fund AnalysisManager vs Benchmark: ReturnJuly 2004 - June 2014 (not annualized if less than 1 year)
Ret
urn
0
2
4
6
8
10
1 quarter 1 year 3 years 5 years 7 years 10 years
DoubleLine - Total Return Barclays U.S. Aggregate
Risk / ReturnJuly 2004 - June 2014 (Single Computation)
Ret
urn
0%
1%
2%
3%
4%
5%
6%
7%
8%
9%
Standard Deviation0% 0.5% 1% 1.5% 2% 2.5% 3% 3.5% 4% 4.5%
DoubleLine - Total Return Market Benchmark:Barclays U.S. Aggregate
Cash Equivalent:Citigroup 3-month T-bill
10-year StatisticsJuly 2004 - June 2014: Summary Statistics
DoubleLine - Total Return
Barclays U.S. Aggregate
Return Excess Return StandardDeviation
SharpeRatio
InformationRatio Alpha Beta Maximum
DrawdownUp
CaptureDown
Capture
7.94% 3.00% 4.37% 1.47 0.90 3.64% 0.86 -1.59% 139.97% 10.84%
4.93% 0.00% 3.30% 1.03 0.00 0.00% 1.00 -2.44% 100.00% 100.00%
Fiscal Year ReturnsJuly 2004 - June 2014 (12-Month Moving Windows, Computed Monthly)
DoubleLine - Total Return
Barclays U.S. Aggregate
Jun 2014 Jun 2013 Jun 2012 Jun 2011 Jun 2010 Jun 2009 Jun 2008 Jun 2007 Jun 2006
4.87% 3.94% 9.43% 12.97% 18.50% 8.78% 7.81% 6.17% 0.85%
4.37% -0.69% 7.47% 3.90% 9.50% 6.05% 7.12% 6.12% -0.81%
Jun 2005
7.04%
6.80%
Manager vs Benchmark: ReturnJuly 2004 - June 2014 (not annualized if less than 1 year)
1 quarter 1 year 3 years 5 years 7 years 10 years
2.05% 4.87% 6.05% 9.81% 9.38% 7.94%
2.04% 4.37% 3.66% 4.85% 5.35% 4.93%
33

Cal Poly Pomona - Fixed Income Fund AnalysisManager vs Benchmark: ReturnJuly 2004 - June 2014 (not annualized if less than 1 year)
Ret
urn
0
2
4
6
8
10
1 quarter 1 year 3 years 5 years 7 years 10 years
Brandywine - Global Opportunistic FI Citigroup World Government Bond Index
Risk / ReturnJuly 2004 - June 2014 (Single Computation)
Ret
urn
0%
1%
2%
3%
4%
5%
6%
7%
8%
Standard Deviation0% 1% 2% 3% 4% 5% 6% 7% 8%
Brandywine - Global Opportunistic FI Market Benchmark:Citigroup World Government Bond Index
Cash Equivalent:Citigroup 3-month T-bill
10-year StatisticsJuly 2004 - June 2014: Summary Statistics
Brandywine - Global Opportunistic FI
Citigroup World Government Bond Index
Return Excess Return StandardDeviation
SharpeRatio
InformationRatio Alpha Beta Maximum
DrawdownUp
CaptureDown
Capture
7.14% 2.32% 7.55% 0.74 0.33 4.49% 0.56 -13.08% 90.51% 18.61%
4.82% 0.00% 7.41% 0.44 0.00 0.00% 1.00 -7.27% 100.00% 100.00%
Fiscal Year ReturnsJuly 2004 - June 2014 (4-Quarter Moving Windows, Computed Quarterly)
Brandywine - Global Opportunistic FI
Citigroup World Government Bond Index
Jun 2014 Jun 2013 Jun 2012 Jun 2011 Jun 2010 Jun 2009 Jun 2008 Jun 2007 Jun 2006
7.97% 3.87% 8.03% 14.25% 14.25% -1.69% 10.11% 3.92% 2.34%
6.85% -4.50% 2.68% 10.54% 3.03% 4.00% 17.00% 2.85% -0.36%
Jun 2005
9.49%
7.61%
Manager vs Benchmark: ReturnJuly 2004 - June 2014 (not annualized if less than 1 year)
1 quarter 1 year 3 years 5 years 7 years 10 years
4.06% 7.97% 6.60% 9.60% 7.98% 7.14%
2.27% 6.85% 1.57% 3.60% 5.47% 4.82%
34

Cal Poly Pomona - Fixed Income Fund AnalysisManager vs Benchmark: ReturnJuly 2010 - June 2014 (not annualized if less than 1 year)
Ret
urn
0
2
4
6
8
10
12
1 quarter 1 year 3 years 4 years
Nuveen Symphony - Credit Opportunity Credit Suisse Leveraged Loan Index
Risk / ReturnJuly 2010 - June 2014 (Single Computation)
Ret
urn
0%
2%
4%
6%
8%
10%
12%
Standard Deviation0% 1% 2% 3% 4% 5% 6%
Nuveen Symphony - Credit Opportunity Market Benchmark:Credit Suisse Leveraged Loan Index
Cash Equivalent:Citigroup 3-month T-bill
4-year StatisticsJuly 2010 - June 2014: Summary Statistics
Nuveen Symphony - Credit Opportunity
Credit Suisse Leveraged Loan Index
Return Excess Return StandardDeviation
SharpeRatio
InformationRatio Alpha Beta Maximum
DrawdownUp
CaptureDown
Capture
11.71% 5.05% 6.27% 1.85 1.59 0.36% 1.68 -5.82% 174.54% 154.57%
6.66% 0.00% 3.51% 1.87 0.00 0.00% 1.00 -3.77% 100.00% 100.00%
Fiscal Year ReturnsJuly 2010 - June 2014 (12-Month Moving Windows, Computed Monthly)
Nuveen Symphony - Credit Opportunity
Credit Suisse Leveraged Loan Index
Jun 2014 Jun 2013
11.81% 10.95%
6.11% 7.63%
Jun 2012
8.21%
3.32%
Jun 2011
15.99%
9.68%
Manager vs Benchmark: ReturnJuly 2010 - June 2014 (not annualized if less than 1 year)
1 quarter 1 year 3 years
2.19% 11.81% 10.31%
1.45% 6.11% 5.67%
4 years
11.71%
6.66%
35

Disclosures
36

Index Definitions
Lehman Aeareciate Bond IndexLehman Aggregate Bond Index is an index comprised of approximately 6,000 publicly traded bonds including U.S. Government, mortgage-backed, corporate, and Yankee bonds with an approximateaveragematurity of 10 years. An investment cannot be made directly in a market index.MSCI EAFES) Index (Europe, Australasia, Far East)The MSCI EAFE8 Index (Europe, Australasia, Far East) is a free float-adjusted market capitalization index that is designed to measure developed market equity performance, excludingthe US & Canada. As ofMay 2005 the MSG! EAFE Index consisted of the following 21 developed market country indices: Australia, Austria, Belgium, Denmark, Finland, France, Germany, Greece, Hong Kong,Ireland, Italy, Japan, theNetherlands, New Zealand, Norway, Portugal, Singapore, Spain, Sweden, Switzerland and the United Kingdom. An investment cannot be made directly in a market index.Russell 10000 IndexRussell 10000 Index measures the performance of the 1,000 largest companies in the Russell 3000 Index, which represents approximately 92% of the total market capitalizationof the Russell 3000 Index. Aninvestment cannot be made directly in a market index.Russell 10000 Growth IndexRussell 10008 Growth Index measures the performance of those Russell 1000 companies with higher price-to-book ratios and higher forecasted growth values An investment cannot be made directly in amarket index.Russell 10000 Value IndexRussell 10000 Value Index measures the performance of those Russell 1000 companies with lower price-to-book ratios and lower forecasted growth values. An investment cannot be made directly in a marketindex.Russell zoom IndexRussell 20008 Index measures the performance of the 2,000 smallest companies in the Russell 3000 Index, which represents approximately 8% of the total market capitalizationof the Russell 3000 Index. Aninvestment cannot be made directly in a market index.Russell nooe Growth IndexRussell 20000 Growth Index measures the performance of those Russell 2000 companies with higher price-to-book ratios and higher forecasted growth values An investment cannot be made directly in amarket index.Russell 20000 Value IndexRussell 20008 Value Index measures the performance of those Russell 2000 companies with lower price-to-book ratios and lower forecasted growth values. An investment cannot be made directly in a marketindex.Russell 25001. IndexRussell 2500T. Index measures the performance of the 2,500 smallest companies in the Russell 3000 Index, which represents approximately 16% of the total market capitalizationof the Russell 3000 Index. at
investment cannot be made directly in a market index.Russell 2500TM Growth IndexRussell 2500., Growth Index measures the performance of those Russell 2500 companies with higher price-to-book ratios and higher forecasted growth values. An investment cannot be made directly in amarket index.Russell 25001m Value IndexRussell 2500T. Value Index measures the performance of those Russell 2500 companies with lower price-to-book ratios and lower forecasted growth values. An investment cannot be made directly in a marketindex.Russell 30000 IndexRussell 30000 Index measures the performance of the 3,000 largest U.S. companies based on total market capitalization, which represents approximately 98% of the investable U.S.equity market. Aninvestment cannot be made directly in a market index.Russell Midcap0 IndexRussell Midcap® Index measures the performance of the 800 smallest companies in the Russell 1000 Index, which represent approximately 25% of the total market capitalizationof the Russell 1000 Index. Aninvestment cannot be made directly in a market index.Russell Midcap3) Growth IndexRussell Midcap8 Growth Index measures the performance of those Russell Midcap companies with higher price-to-book ratios and higher forecasted growth values. The stocks are alsomembers of the Russell1000 Growth index. An investment cannot be made directly in a market index.Russell Midcape Value IndexRussell Midcap® Value Index measures the performance of those Russell Midcap companies with lower price-to-book ratios and lower forecasted growth values. The stocks are alsomembers of the Russell1000 Value index. An investment cannot be made directly in a market index.Standard & Poor's 500 IndexS&P 500 Index is an unmanaged, market value-weighted index of 500 stocks generally representative of the broad stock market. An investment cannot be made directly in a market index.
Important Disclosures
37

Important Disclosures To the extent the investments depicted herein represent international securities, you should be aware that there may be additional risks associated with international investing, including foreign economic, political, monetary and/or legal factors, changing currency exchange rates, foreign taxes, and differences in financial and accounting standards. These risks may be magnified in emerging markets. International investing may not be for everyone. Small capitalization companies may lack the financial resources, product diversification and competitive strengths of larger companies. In addition, the securities of small capitalization companies may not trade as readily as, and be subject to higher volatility than, those of larger, more established companies. Bonds are subject to interest rate risk. When interest rates rise bond prices fall; generally the longer a bond's maturity, the more sensitive it is to this risk. Bonds may also be subject to call risk, which allows the issuer to retain the right to redeem the debt, fully or partially, before the scheduled maturity date. Proceeds from sales prior to maturity may be more or less than originally invested due to changes in market conditions or changes in the credit quality of the issuer. Investing in alternative investments is speculative, not suitable for all clients, and intended for experienced and sophisticated investors who are willing to bear the high economic risks of the investment, which can include: • loss of all or a substantial portion of the investment due to leveraging, short-selling or other speculative investment practices; • lack of liquidity in that there may be no secondary market for the fund and none expected to develop; • volatility of returns; • restrictions on transferring interests in the fund; • potential lack of diversification and resulting higher risk due to concentration of trading authority with a single advisor; • absence of information regarding valuations and pricing; • delays in tax reporting; • less regulation and higher fees than mutual funds; and • advisor risk. Although the statements of fact and data in this report have been obtained from, and are based upon, sources that the Firm believes to be reliable, we do not guarantee their accuracy, and any such information may be incomplete or condensed. All opinions included in this report constitute the Firm’s judgment as of the date of this report and are subject to change without notice. This report is for informational purposes only and is not intended as an offer or solicitation with respect to the purchase or sale of any security. Past performance is not a guarantee of future results. Actual returns would be reduced by expenses that may include management fees and costs of transactions. Expected return and risk (standard deviation) calculations are based on historical data for periods indicated. International investing may not be suitable for every investor and is subject to additional risks, including currency fluctuations, political factors, withholding, lack of liquidity, the absence of adequate financial information, and exchange control restrictions impacting foreign issuers. These risks may be magnified in emerging markets. Mutual fund investments are subject to market risk, including the possible loss of principal. They are sold by prospectus only. The prospectus contains the investment objectives, risks, fees, charges and expenses, and other information regarding the mutual fund and variable annuity contract and its underlying investments, which should be carefully considered before investing. Prospectuses are available through your Financial Advisor or at www.smithbarney.com. Read the prospectus carefully before you invest. © 2014 Graystone Consulting is a business of Morgan Stanley Smith Barney LLC.
38

Analysis Disclosure
The analysis is based on published investment manager rate of return data, capital market indices, custom (benchmarks, indices and universes), as well as software developed by Zephyr Associates. Investment manager rate of return data includes: Effron Plan Sponsor Network Database. Capital markets index data includes: Capital market indices (supplied by Zephyr), Canadian indices (supplied by Zephyr), Salomon Brothers Fixed Income indices, Morgan Stanley Capital International indices, and Dow Jones Global indices. Zephyr StyleADVISOR uses principles of William Sharpe's theory of returns-based style analysis. Returns-based style analysis assists in identifying investment style without examining the individual security holdings of a portfolio. StyleADVISOR regresses the historical returns of the individual manager(s) against different style indices to identify the pattern of returns that the fund is most closely correlated to. SSB does not recommend the use of returns-based style analysis without the supporting fundamental research of the fund (research attribution reports). The underlying data is believed to be reliable but accuracy and completeness cannot be assured. While the historical rates of return described in this report are believed to accurately reflect the overall nature of the portfolio, the constituent securities have not been reviewed. This evaluation is for informational purposes only and is not intended to be an offer, solicitation or recommendation with respect to the purchase or sale of any security or a recommendation of the services provided by any money management organization. Past results are not necessarily indicative of future performance. Investors should consider the investment objectives, risks, charges, fees and expenses of the mutual fund carefully before investing. The prospectus contains more complete information about these factors and other information about the investment company. Read the prospectus carefully before you invest.
39

Graystone Consultingsm
Portfolio Summary
Asset Class Investment Manager AllocationValues as of
6/30/14
Average Credit
Quality
Duration (Years)
Yield
Short Duration Fixed Income PIMCO Low Duration Fixed Income 80.00% 23,042,930 A- 2.83 1.50%
Global Unconstrained Credit JP Morgan Strategic Income Opportunities 6.00% 1,718,085 A -0.29 1.94%
Mortgage Backed Securities Doubleline Total Return 8.00% 2,344,726 A 3.35 4.73%
Global Fixed Income Brandywine Global Opportunistic Fixed Income 4.00% 1,234,928 A 6.87 4.65%
Global High Yield / Floating Rate Nuveen Symphony Credit Opportunity Fund 2.00% 590,785 B+ 2.90 5.65%
Totals* 100.00% 28,974,020 A- 2.85 1.99%
Barclays US 1-3 Year Treasury Index 1.89 0.35%
Barclays Intermediate Government/Credit Index 3.83 1.70%
Global High Yield / Floating Rate2%
Global Fixed Income4%
Mortgage Backed Securities8%
Global Unconstrained Credit6%
Short Duration Fixed Income80%*Account contained a cash balance of $42,565.99
Yield and duration totals are weighted averages. Source: Investment ManagersData as of 6/30/14
40

Cal Poly Pomona - Fixed Income Fund AnalysisManager vs Benchmark: ReturnJuly 2004 - June 2014 (not annualized if less than 1 year)
Ret
urn
0
0.5
1
1.5
2
2.5
3
3.5
4
4.5
1 quarter 1 year 3 years 5 years 7 years 10 years
PIMCO - Low Duration BofA Merrill Lynch 1-3 Year US Treasury
Risk / ReturnJuly 2004 - June 2014 (Single Computation)
Ret
urn
0%
0.5%
1%
1.5%
2%
2.5%
3%
3.5%
4%
4.5%
Standard Deviation
0% 0.5% 1% 1.5% 2% 2.5% 3% 3.5%
PIMCO - Low DurationMarket Benchmark:BofA Merrill Lynch 1-3 Year US Treasury
Cash Equivalent:Citigroup 3-month T-bill
10-year StatisticsJuly 2004 - June 2014: Summary Statistics
PIMCO - Low Duration
BofA Merrill Lynch 1-3 Year US Treasury
Return Excess ReturnStandardDeviation
SharpeRatio
InformationRatio Alpha Beta
MaximumDrawdown
UpCapture
DownCapture
3.96% 1.34% 3.44% 0.70 0.38 3.04% 0.36 -4.13% 119.37% -404.90%
2.62% 0.00% 1.76% 0.61 0.00 0.00% 1.00 -0.86% 100.00% 100.00%
Fiscal Year ReturnsJuly 2004 - June 2014 (12-Month Moving Windows, Computed Monthly)
PIMCO - Low Duration
BofA Merrill Lynch 1-3 Year US Treasury
Jun 2014 Jun 2013 Jun 2012 Jun 2011 Jun 2010 Jun 2009 Jun 2008 Jun 2007 Jun 2006
2.71% 1.23% 2.66% 4.32% 8.88% 4.26% 7.54% 4.45% 1.11%
0.76% 0.33% 0.79% 1.34% 2.69% 4.39% 7.30% 5.07% 1.83%
Jun 2005
2.67%
1.87%
Manager vs Benchmark: ReturnJuly 2004 - June 2014 (not annualized if less than 1 year)
1 quarter 1 year 3 years 5 years 7 years 10 years
0.80% 2.71% 2.20% 3.93% 4.48% 3.96%
0.27% 0.76% 0.63% 1.18% 2.49% 2.62%
41

Cal Poly Pomona - Fixed Income Fund AnalysisManager vs Benchmark: ReturnJuly 2009 - June 2014 (not annualized if less than 1 year)
Ret
urn
0
1
2
3
4
5
6
1 quarter 1 year 3 years 5 years
JPMorgan - Strategic Income Barclays U.S. Aggregate
Risk / ReturnJuly 2009 - June 2014 (Single Computation)
Ret
urn
0%
1%
2%
3%
4%
5%
6%
Standard Deviation
0% 0.5% 1% 1.5% 2% 2.5% 3% 3.5% 4%
JPMorgan - Strategic IncomeMarket Benchmark:Barclays U.S. Aggregate
Cash Equivalent:Citigroup 3-month T-bill
5-year StatisticsJuly 2009 - June 2014: Summary Statistics
JPMorgan - Strategic Income
Barclays U.S. Aggregate
Return Excess ReturnStandardDeviation
SharpeRatio
InformationRatio Alpha Beta
MaximumDrawdown
UpCapture
DownCapture
5.26% 0.41% 4.08% 1.27 0.08 5.98% -0.13 -4.55% 76.52% -115.86%
4.85% 0.00% 3.24% 1.47 0.00 0.00% 1.00 -2.44% 100.00% 100.00%
Fiscal Year ReturnsJuly 2009 - June 2014 (12-Month Moving Windows, Computed Monthly)
JPMorgan - Strategic Income
Barclays U.S. Aggregate
Jun 2014 Jun 2013 Jun 2012 Jun 2011
2.40% 5.63% 1.85% 6.18%
4.37% -0.69% 7.47% 3.90%
Jun 2010
10.49%
9.50%
Manager vs Benchmark: ReturnJuly 2009 - June 2014 (not annualized if less than 1 year)
1 quarter 1 year 3 years 5 years
0.12% 2.40% 3.28% 5.26%
2.04% 4.37% 3.66% 4.85%
42

Cal Poly Pomona - Fixed Income Fund AnalysisManager vs Benchmark: ReturnJuly 2004 - June 2014 (not annualized if less than 1 year)
Ret
urn
0
2
4
6
8
10
1 quarter 1 year 3 years 5 years 7 years 10 years
DoubleLine - Total Return Barclays U.S. Aggregate
Risk / ReturnJuly 2004 - June 2014 (Single Computation)
Ret
urn
0%
1%
2%
3%
4%
5%
6%
7%
8%
9%
Standard Deviation
0% 0.5% 1% 1.5% 2% 2.5% 3% 3.5% 4% 4.5%
DoubleLine - Total ReturnMarket Benchmark:Barclays U.S. Aggregate
Cash Equivalent:Citigroup 3-month T-bill
10-year StatisticsJuly 2004 - June 2014: Summary Statistics
DoubleLine - Total Return
Barclays U.S. Aggregate
Return Excess ReturnStandardDeviation
SharpeRatio
InformationRatio Alpha Beta
MaximumDrawdown
UpCapture
DownCapture
7.94% 3.00% 4.37% 1.47 0.90 3.64% 0.86 -1.59% 139.97% 10.84%
4.93% 0.00% 3.30% 1.03 0.00 0.00% 1.00 -2.44% 100.00% 100.00%
Fiscal Year ReturnsJuly 2004 - June 2014 (12-Month Moving Windows, Computed Monthly)
DoubleLine - Total Return
Barclays U.S. Aggregate
Jun 2014 Jun 2013 Jun 2012 Jun 2011 Jun 2010 Jun 2009 Jun 2008 Jun 2007 Jun 2006
4.87% 3.94% 9.43% 12.97% 18.50% 8.78% 7.81% 6.17% 0.85%
4.37% -0.69% 7.47% 3.90% 9.50% 6.05% 7.12% 6.12% -0.81%
Jun 2005
7.04%
6.80%
Manager vs Benchmark: ReturnJuly 2004 - June 2014 (not annualized if less than 1 year)
1 quarter 1 year 3 years 5 years 7 years 10 years
2.05% 4.87% 6.05% 9.81% 9.38% 7.94%
2.04% 4.37% 3.66% 4.85% 5.35% 4.93%
43

Cal Poly Pomona - Fixed Income Fund AnalysisManager vs Benchmark: ReturnJuly 2004 - June 2014 (not annualized if less than 1 year)
Ret
urn
0
2
4
6
8
10
1 quarter 1 year 3 years 5 years 7 years 10 years
Brandywine - Global Opportunistic FI Citigroup World Government Bond Index
Risk / ReturnJuly 2004 - June 2014 (Single Computation)
Ret
urn
0%
1%
2%
3%
4%
5%
6%
7%
8%
Standard Deviation
0% 1% 2% 3% 4% 5% 6% 7% 8%
Brandywine - Global Opportunistic FIMarket Benchmark:Citigroup World Government Bond Index
Cash Equivalent:Citigroup 3-month T-bill
10-year StatisticsJuly 2004 - June 2014: Summary Statistics
Brandywine - Global Opportunistic FI
Citigroup World Government Bond Index
Return Excess ReturnStandardDeviation
SharpeRatio
InformationRatio Alpha Beta
MaximumDrawdown
UpCapture
DownCapture
7.14% 2.32% 7.55% 0.74 0.33 4.49% 0.56 -13.08% 90.51% 18.61%
4.82% 0.00% 7.41% 0.44 0.00 0.00% 1.00 -7.27% 100.00% 100.00%
Fiscal Year ReturnsJuly 2004 - June 2014 (4-Quarter Moving Windows, Computed Quarterly)
Brandywine - Global Opportunistic FI
Citigroup World Government Bond Index
Jun 2014 Jun 2013 Jun 2012 Jun 2011 Jun 2010 Jun 2009 Jun 2008 Jun 2007 Jun 2006
7.97% 3.87% 8.03% 14.25% 14.25% -1.69% 10.11% 3.92% 2.34%
6.85% -4.50% 2.68% 10.54% 3.03% 4.00% 17.00% 2.85% -0.36%
Jun 2005
9.49%
7.61%
Manager vs Benchmark: ReturnJuly 2004 - June 2014 (not annualized if less than 1 year)
1 quarter 1 year 3 years 5 years 7 years 10 years
4.06% 7.97% 6.60% 9.60% 7.98% 7.14%
2.27% 6.85% 1.57% 3.60% 5.47% 4.82%
44

Cal Poly Pomona - Fixed Income Fund AnalysisManager vs Benchmark: ReturnJuly 2010 - June 2014 (not annualized if less than 1 year)
Ret
urn
0
2
4
6
8
10
12
1 quarter 1 year 3 years 4 years
Nuveen Symphony - Credit Opportunity Credit Suisse Leveraged Loan Index
Risk / ReturnJuly 2010 - June 2014 (Single Computation)
Ret
urn
0%
2%
4%
6%
8%
10%
12%
Standard Deviation
0% 1% 2% 3% 4% 5% 6%
Nuveen Symphony - Credit OpportunityMarket Benchmark:Credit Suisse Leveraged Loan Index
Cash Equivalent:Citigroup 3-month T-bill
4-year StatisticsJuly 2010 - June 2014: Summary Statistics
Nuveen Symphony - Credit Opportunity
Credit Suisse Leveraged Loan Index
Return Excess ReturnStandardDeviation
SharpeRatio
InformationRatio Alpha Beta
MaximumDrawdown
UpCapture
DownCapture
11.71% 5.05% 6.27% 1.85 1.59 0.36% 1.68 -5.82% 174.54% 154.57%
6.66% 0.00% 3.51% 1.87 0.00 0.00% 1.00 -3.77% 100.00% 100.00%
Fiscal Year ReturnsJuly 2010 - June 2014 (12-Month Moving Windows, Computed Monthly)
Nuveen Symphony - Credit Opportunity
Credit Suisse Leveraged Loan Index
Jun 2014 Jun 2013
11.81% 10.95%
6.11% 7.63%
Jun 2012
8.21%
3.32%
Jun 2011
15.99%
9.68%
Manager vs Benchmark: ReturnJuly 2010 - June 2014 (not annualized if less than 1 year)
1 quarter 1 year 3 years
2.19% 11.81% 10.31%
1.45% 6.11% 5.67%
4 years
11.71%
6.66%
45

»Overview:� MetWest Low Duration is a short-term fixed income fund, seeking to consistently
outperform the ML 1-3 Year Treasury Index which maintaining overall risk similar to that of the index. The fund concentrates primarily on investments in treasuries, agencies, mortgage-backed securities and investment grade corporates. The portfolio can invest up to 20% in below-investment grade issues but cannot invest in issues lower than BB. The can fund invest in domestic and international securities, including emerging markets. The investment process combines top-down and bottom-up strategies. The investment process seeks to add value through duration positioning, yield curve management, sector allocation, quantitative screening selection and buy/sell strategies.
»Current Portfolio Positioning� MetWest Low Duration is underweight US Treasuries relative to the index.� The fund holds an overweight to MBS, specifically emphasizing non-agency
residential mortgage securities. � Interest rate risk is managed by having a shorter duration than the index and the
fund in cautious in their allocations to the corporate credit sector, preferring issues that are higher in capital structure.
MetWest Low Duration
46

Met West Low Duration vs PIMCO Low DurationManager Style
12-Quarter Moving Windows, Computed Quarterly
July 2004 - June 2014
Merrill Lynch Treasuries 1-10yr Merrill Lynch Treasuries 10+yr
Merrill Lynch Corporates 1-10yr Merrill Lynch Corporates 10+yr
Corp
-1
0
1
Treasury
Int -1 0 1 Long
Metropolitan West Low Duration Bond IPIMCO Low Duration InstlMerrill Lynch Fixed Income Indexes
Alpha vs. Market Benchmark/Time12-Quarter Moving Windows, Computed Quarterly
July 2004 - June 2014
Alp
ha
-5%
0%
5%
10%
15%
TimeQ2 2007 Q4 2008 Q4 2009 Q4 2010 Q4 2011 Q4 2012 Q2 2014
Metropolitan West Low Duration Bond I PIMCO Low Duration Instl
Market Benchmark:Barclays U.S. Treasury: 1-3 Year
Annualized Excess Return / Standard Deviation of Excess Return12-Quarter Moving Windows, Computed Quarterly
vs. Barclays U.S. Treasury: 1-3 Year
July 2004 - June 2014
Exc
ess
Ret
urn
-10%
-5%
0%
5%
10%
Tracking Error0% 2% 4% 6% 8% 10%
July 2004 - June 2014: Summary Statistics
Metropolitan West Low Duration Bond I
PIMCO Low Duration Instl
Barclays U.S. Treasury: 1-3 Year
Return Std. Deviation Sharpe Alpha Beta R-Squared Correlation Excess Return Tracking Error Info Ratio
3.60% 4.96% 0.42 3.32% -1.05 10.45% -0.36 0.98% 5.85% 0.17
4.06% 3.44% 0.73 2.02% 0.48 4.50% 0.18 1.44% 3.58% 0.40
2.62% 1.79% 0.60 0.00% 1.00 100.00% 1.00 0.00% 0.00% 0.00
July 2004 - June 2014: Summary Statistics
Metropolitan West Low Duration Bond I
PIMCO Low Duration Instl
Barclays U.S. Treasury: 1-3 Year
Max Drawdown Up Periods Down Periods Average Up Average Down Best Period Return Worst Period Return Batting Averag Up Capture Down Capture
-16.87% 32 8 1.75% -2.42% 8.24% -8.01% 72.50% 97.67% -498.71%
-4.08% 33 7 1.48% -1.20% 7.11% -3.79% 67.50% 121.40% -374.85%
-0.96% 34 6 0.82% -0.29% 3.07% -0.96% 0.00% 100.00% 100.00%
Histogram of ReturnsJuly 2004 - June 2014
Per
cent
age
of Q
uarter
s (%
)
0
10
20
30
40
50
Returns Range (%)
< -8.1 -8.1 to -7.5 -7.5 to -6.9 -6.9 to -6.3 -6.3 to -5.7 -5.7 to -5.1 -5.1 to -4.5 -4.5 to -3.9 -3.9 to -3.3 -3.3 to -2.7 -2.7 to -2.1 -2.1 to -1.5 -1.5 to -0.9 -0.9 to -0.3 -0.3 to 0.3 0.3 to 0.9 0.9 to 1.5 1.5 to 2.1 2.1 to 2.7 2.7 to 3.3 3.3 to 3.9 3.9 to 4.5 4.5 to 5.1 5.1 to 5.7 5.7 to 6.3 6.3 to 6.9 6.9 to 7.5 7.5 to 8.1 > 8.1
Metropolitan West Low Duration Bond I PIMCO Low Duration InstlBarclays U.S. Treasury: 1-3 Year
Calendar Year Return
Metropolitan West Low Duration Bond I
PIMCO Low Duration Instl
YTD 2013 2012 2011 2010 2009 2008 2007 2006 2005
1.36% 2.00% 7.86% 1.19% 10.64% 15.35% -14.60% 2.68% 6.35% 3.02%
1.23% 0.10% 6.16% 1.71% 4.96% 13.36% -1.28% 7.92% 3.75% 1.55%
Barclays U.S. Treasury: 1-3 Year 0.41% 0.36% 0.43% 1.55% 2.40% 0.80% 6.67% 7.31% 3.93% 1.62%
Manager vs Benchmark: Return through June 2014
1 year 3 years 5 years 7 years 10 years
2.51% 3.48% 7.03% 3.09% 3.60%
2.81% 2.30% 4.03% 4.59% 4.06%
0.76% 0.63% 1.19% 2.51% 2.62%
47

II r common nd
Solutions for strategic investorsTM
Cal Poly Pomona Foundation
March 31, 2014 - June 30, 2014
Private Programs Investment ReportAll Accounts
48

All Accounts
Past performance is no assurance of future returns
1 8/25/2014 8:00:45 PM Cal Poly Pomona Foundation
Account Summary as of 6/30/2014
VintageYear
CapitalCommitted Capital Called
RemainingCapital to be
CalledCapital
DistributionsCapital
Balance Multiple IRR Value Date
General Fund - 06
Multi-Asset
Capital Partners IV 2007 $250,000 $203,750 $46,250 ($45,787) $236,320 1.38 9.63% 3/31/2014
Total Multi-Asset $250,000 $203,750 $46,250 ($45,787) $236,320 1.38 9.63% 3/31/2014
US Private Equity
Private Equity Partners VII 2007 $750,000 $565,125 $184,875 ($162,293) $591,290 1.33 10.53% 3/31/2014
Total US Private Equity $750,000 $565,125 $184,875 ($162,293) $591,290 1.33 10.53% 3/31/2014
Commonfund Real Estate
Realty Investors 2004-12 (Tranche) 2005 $1,500,000 $1,500,000 $0 ($281,643) $1,355 0.19 -26.29% 12/31/2013
Total Commonfund Real Estate $1,500,000 $1,500,000 $0 ($281,643) $1,355 0.19 -26.29% 12/31/2013
Total General Fund - 06 $2,500,000 $2,268,875 $231,125 ($489,723) $828,965 0.58 3/31/2014
Grand Total $2,500,000 $2,268,875 $231,125 ($489,723) $828,965 0.58 3/31/2014
• All performance data set forth herein is net of all fees and carried interest. Internal Rates of Return (IRR) should be evaluated in light of information on the investment programof the partnership, the risks associated therewith, and performance of the partnership as disclosed in the Offering Memorandum forthe partnership, the Audited Annual Reportsof the partnership and the Quarterly Reports of the partnership. Return information is presented for these partnerships on a dollar-weighted (e.g., internal rate of return) basis,which is standard for the private capital industry, rather than the time-weighted (i.e.,annual or other period rate of return) basis, which is used principally to report performanceof publicly-traded securities. The IRR since inception is the most commonly used calculation methodology for presentation of performance in the private capital business.Comparison of returns calculated on an IRR basis with returns on a time-weighted basis is not appropriate.
• Net Multiple is total value to invested capital net of the general partner’s carried interest = (Distribution + Ending Capital Balance)/Capital Drawdown).• Net annualized internal rate of return since inception through value date.• IRR information is not shown for liquidated funds or for funds where the information is not yet meaningful due to the youth of the fund. Transaction flows and capital for these
funds are not included in the appropriate totals.
49

All Accounts
Past performance is no assurance of future returns
2 8/25/2014 8:00:45 PM Cal Poly Pomona Foundation
Non-Marketable Investments Roll Forward From Value Date to 6/30/2014
Non-Marketable Fund Incep. Date Commitment Valuation DateMost Recent
Valuation
Capital Callssince Valuation
Date
Distributionssince Valuation
DateAdjusted Market
Value
Private Equity Partners VII 9/30/2007 $750,000.00 3/31/2014 $591,290.00 $13,125.00 ($25,092.00) $579,323.00
Capital Partners IV 9/30/2007 $250,000.00 3/31/2014 $236,320.00 $3,750.00 ($10,874.00) $229,196.00
Total Core Funds $1,000,000.00 $827,610.00 $16,875.00 ($35,966.00) $808,519.00
Realty Investors 2004-12 (Tranche) 12/31/2004 $1,500,000.00 12/31/2013 $1,355.04 $0.00 $0.00 $1,355.04
Total Private Real Estate $1,500,000.00 $1,355.04 $0.00 $0.00 $1,355.04
Non-Marketable Total $2,500,000.00 $828,965.04 $16,875.00 ($35,966.00) $809,874.04
50

All Accounts
Past performance is no assurance of future returns
3 8/25/2014 8:00:45 PM Cal Poly Pomona Foundation
Transactions (4/1/2014 - 6/30/2014)
Fund NameTransaction
Date Trade SharesTrade Amount
(USD) Transaction Type
Capital Partners IV 4/25/2014 0.000 $3,750.00 Capital Call
Capital Partners IV 4/25/2014 0.000 ($3,750.00) Distribution
Capital Partners IV 6/23/2014 0.000 ($7,124.00) Distribution
Private Equity Partners VII 4/22/2014 0.000 $5,625.00 Capital Call
Private Equity Partners VII 4/22/2014 0.000 ($5,625.00) Distribution
Private Equity Partners VII 5/2/2014 0.000 ($5,810.00) Distribution
Private Equity Partners VII 5/27/2014 0.000 $1,875.00 Capital Call
Private Equity Partners VII 5/27/2014 0.000 ($8,032.00) Distribution
Private Equity Partners VII 6/23/2014 0.000 $5,625.00 Capital Call
Private Equity Partners VII 6/23/2014 0.000 ($5,625.00) Distribution
51

All Accounts
Past performance is no assurance of future returns
4 8/25/2014 8:00:45 PM Cal Poly Pomona Foundation
Performance as of 6/30/2014
Performance Item MTD QTD CYTD FYTD 3 Years 5 Years 10 YearsAccount
InceptionAccount Inception
Date
Private Equity Partners VII 0.00 2.41 11.77 19.85 14.16 11.69 0.80 12/31/2007
US Private Equity 0.00 2.41 11.77 19.85 14.16 11.69 0.80 12/31/2007
Capital Partners IV 1.98 1.98 11.81 22.25 13.17 12.17 -0.08 12/31/2007
Multi-Asset 1.98 1.98 11.81 22.25 13.17 12.17 -0.08 12/31/2007
Total Non-Marketable 0.57 2.29 11.79 20.55 13.85 -3.83 -6.97 9/30/2005
Total Portfolio 0.57 2.29 13.29 30.43 15.77 3.80 -0.39 1.13 9/30/2003
Institution Performance as of Latest Month-End• Returns include closed account history in group totals, if applicable.• Endowment fund returns are not available prior to October 1987.• Performance is calculated monthly. Therefore, returns for investments in any fund for less than a full month are not included in these performance figures.
Non-Marketable Performance Notes• Investments in Programs for Commonfund Capital and Commonfund Realty are carried as of the most recent valuation date, which may not correspond to the marketable
securities valuation dates.• All performance data set forth herein is net of all fees and carried interest. Internal Rates of Return (IRR) should be evaluated in light of information on the investment program
of the partnership, the risks associated therewith, and performance of the partnership as disclosed in the Offering Memorandum for the partnership, the Audited Annual Reports ofthe partnership and the Quarterly Reports of the partnership. Return information is presented for these partnerships on a dollar-weighted (e.g. internal rate of return) basis, whichis standard for the private capital industry, rather than the time-weighted (i.e., annual or other period rate of return) basis, which is used principally to report performance ofpublicly-traded securities. The IRR since inception is the most commonly used calculation methodology for presentation of performance in the private capital business.Comparison of returns calculated on an IRR basis with returns on a time-weighted basis is not appropriate. For a description of the two return calculation methods, see MeasuringInvestment returns, Time vs. Dollar-Weighted – What’s the Difference? A copy is available from Commonfund.
• Non-Marketable Performance information is not shown for liquidated funds or for funds where the information is not yet meaningful due to the youth of the fund. Transactionflows and capital for these funds are not included in the appropriate totals.
• Distressed Debt programs are reported with a one quarter lag. For example, if the report 'As of' date is 9/30/YY then Distressed Debt programs are represented using 6/30/YY, orprevious quarter values.
• Private Capital and Real Estate programs are reported with a one quarter lag. For example, if the report 'As of' date is 9/30/YY then Private Capital and Real Estate programs arerepresented using 6/30/YY, or previous quarter values.
• Private Capital and Commonfund Realty Partners I, L.P. returns are normally reported as an Internal Rate of Return (IRR). All other Commonfund investment returns arereported as Time Weighted Rates of Return (TWR). For Consolidated Performance reporting purposes, TWRs are used for all individual and composite returns.
52

CAL POLY POMONA FOUNDATION, INC.INVESTMENT SUMMARY AS OF JUNE 30, 2014
Policy Range Policy Range Total Graystone Common Fund FoundationAsset Class Minimum Maximum Policy Target Portfolio Allocation Portfolio Amount Portfolio Amount Portfolio Amount Portfolio Amount
Equities Domestic & Int'l (Dev & Emerging 10% 65% 23% 24% 10,150,688 9,323,078 827,610 Fixed Income 40% 85% 65% 68% 28,931,454 28,931,454 Cash Equivalents 0% 20% 0% 0% 45,205 45,205 Real Assets 0% 10% 2% 2% 878,520 878,520 Real Estate 0% 10% 0% 0% 1,355 1,355 Alternative Investments Innovation Way Infrastructure 0% 25% 10% 5% 2,289,088 2,289,088
100% 100% 42,296,310 39,178,257 828,965 2,289,088
53

Cal Poly Pomona
Foundation
Memorandum
Date: September 2, 2014
To: Investment Committee
Cal Poly Pomona Foundation, Inc. From: David F. Prenovost
Senior Managing Director/CFO Subject: INVESTMENT HEDGE FUND ASSET ALLOCATION PROPOSAL
As you may recall from our last meeting, we discussed and requested a proposal from Andrew Price, Executive Director Graystone Consulting, for an asset allocation to hedge funds in the endowment investment portfolio for your consideration. As you may know, the Endowment Investment Policy # 130 allows for a range of 0% to 20% asset allocation to hedge funds, please see attached policy for further reference. Following is Andrew’s proposal for a hedge fund asset allocation of 15% in the endowment investment portfolio.
Recommended Action: The Investment Committee has reviewed Andrew’s proposal and believes an asset allocation of 15% to hedge funds in the endowment investment portfolio is prudent and recommends the quarterly investment reports be presented at the next regularly scheduled Board of Directors meeting.
PASSED AND ADOPTED THIS 15th DAY OF SEPTEMBER 2014.
By:
Thomas M. Goff, Chair Investment Committee
54
%.
Cal Poly Pomona Hedge Fund Recommendation
Graystone Consulting 1999Avenue of the Stars Los Angeles, CA 90067 55

2
• Hedge Fund Primer Tab 1
• Manager Recommendations Tab 2
• Appendix Tab 3
– Alternatives Research
Table of Contents
56

3
Hedge Fund Primer
57

4
• Investment vehicle that allows investment managers to trade a variety of investment securities and strategies that are not normally covered by traditional managers.
Hedge Funds Defined
Hedge Fund Investing • Alpha - Primary determinant of return is manager skill
(Alpha) • Absolute Returns - Use investment and risk
management tools to seek positive returns regardless of market direction
• Traditional asset classes plus alternative classes • Long & Short • Leverage may be utilized - to enhance return
potential, however it is not a necessary component of hedge fund investing
• Performance based fee structure • Compensation increases through higher absolute
returns
Traditional Investing • Beta - Primary determinant of return is the market (Beta) • Relative Returns - Attempt to provide an incremental
return versus a benchmark (Alpha) • Publicly traded securities • Long only • No Leverage • Asset based fee structure • Compensation increases through asset growth
58

5
Hedge Funds: Advantages & Disadvantages
• Advantages of Hedge Funds: • Attractive risk-adjusted returns • Low correlation with traditional equity and fixed-income • Access to the best and brightest investment talent • Alignment of interests
• Disadvantages of Hedge Funds:
• Leverage, short selling, derivatives • High fees relative to traditional management • Reduced Liquidity (Semi-Liquid) • Limited access to transactions and/or holdings detail • UBIT – Unrelated Business Income Tax • Tax Inefficient (Mostly Short Term Gain)
59

Cash
FiduciaryDeposits
Short-TermBonds
Int.Bonds
LongBonds
High YieldBonds
Lg. CapEquities
Sm. C
Equitie
AggressiveHedge Funds
LBO/Privatequity
VentureCapital
RISK
7
RISK
Cash
FiduciaryDeposits
Short-TermBonds
Int.Bonds
Long. Bonds
DefensiveHedge AFunds
High YieldBonds
Lg. CapEquities
LBO/PrivateF,quity
AggressiveHedge Funds
Sm. Ca D
Equitie
VentureCapital
7
6
Risk-Return
60

7
7
Utilizing Alternative Strategies for Diversification
Hedge Fund Reward/Risk Profile
Low Risk
Arbitrage
Long/Short Equity
Global Macro
Managed Futures
Equity Market
Neutral
Equity Market
Neutral with
Index Overlay
Multi-Strategy
61

8
Hedge Fund Recommendations
62

9
• Target Recommendation: 15%
– Approximately $14 million
• 70% Core 30% Satellite
– We recommend investing 70% of the portfolio in two diversified fund-of-funds to get broad based diversification and hire 3 single manager funds for 30%.
• Investment Managers
Executive Overview
Recommended
Targets
Evanston Weatherlow Fund Offshore Fund, Ltd. 6.00%
Pointer Offshore, Ltd. 4.50%
Millenium Int'l Ltd. 2.25%
Litespeed Offshre Ltd. 1.25%
Canyon Value Realization Fund, Ltd. 1.00%
15.00%
Co
re 70
%Satellite 3
0%
63

10
Objectives
• Investment Objective
– Our objective when constructing the “Core + Satellite” recommendation was to create a diversified, multi-manager core, while enhancing the return potential.
• Diversification: low correlation to equity and fixed income
• Returns: Positive risk/return characteristics
• Risk: low volatility
• Structure: 70% Fund of Funds & 30% Single Manager Strategies
– As a starting point, our recommendation is for a 70% allocation to a diversified, fund of funds core and 30% to high conviction single manger strategies.
– Over time the goal is to continue to add other single manager strategies when appropriate
• Ancillary Benefits
– Lower fees than 100% fund of funds
– Improved transparency
– Control of risk & return characteristics
64

11
• Analysis of existing composite
– Analyzed the role Marketable Alternatives plays in the portfolio, strategy diversification and strategy outlook.
• Search
– Constructed the Universe
• Conducted a comprehensive search which included over 200 research covered funds in the following strategies: Activist, CTA, Distressed Restructuring, Fixed Income Arbitrage, Global Macro, Insurance, Long Short, Mortgage Arbitrage, Multi-Strategy and Relative Value Credit
– Strategy Focus
• Narrowed the search to focus on fund of funds, multi-strategy and event driven funds to maintain diversification (multi-strategy) and correspond with our positive research opinion on event driven strategies.
– Finalists
• Narrowed the search to the top performing fund of funds, multi-strategy and event driven funds. Please see appendix for finalist return analysis.
Process
65

12
• Portfolio Construction
– Blend creation. Looked at multiple different weightings between the managers to dial in the appropriate risk and return characteristics to meet the investment objectives.
– Funding Source: Looked at existing managers to determine the most appropriate source of funds.
• Chose the funds that offered the best liquidity and least attractive comparative returns and strategies.
• House Keeping
– Pre-Negotiation with managers on capacity and minimums
– Investment Policy Compliance
Process Continued
66

13
• Objectives Achieved
– Back test: the recommended blend when back tested achieves the desired diversification and return objectives.
• Diversification: The results show a low correlation to both the equity markets (0.84) and fixed income markets (-.23).
• Returns: Over the last 10 years, the recommended portfolio had greater returns than the MSCI ACWI (8.43% vs. 6.97%) and Barclays Aggregate (8.43% vs. 4.46%)
• Volatility: You will notice that the recommended blend results in a lower volatility profile than equity (7.37% vs. 18.34%) but higher than fixed income (7.73% vs. 3.49%).
• Beta: You will notice that the portfolio has a low beta to equity markets at 0.34%
• The back tested results are shown net of manager fees.
Back Tested Results
67

14
Zephyr StyleADVISORZephyr StyleADVISOR: Graystone Consulting
Manager vs Benchmark: ReturnApril 2004 - March 2014 (not annualized if less than 1 year)
CPP Hedge Fund Recommendation
Evanston - Weatherlow
Pointer Offshore LTD
Millennium
Canyon
Litespeed
HFRI FOF: Diversified Index
YTD 1 year 2 years 3 years 4 years 5 years 6 years 7 years 8 years 9 years
2.06% 11.73% 10.26% 7.56% 8.44% 10.75% 6.46% 7.21% 7.88% 8.47%
1.60% 10.26% 9.21% 5.18% 5.74% 8.52% 3.75% 5.12% 5.82% 6.73%
1.65% 11.84% 9.14% 8.01% 9.16% 9.97% 6.28% 8.08% 8.65% 9.08%
3.43% 13.38% 10.11% 9.11% 10.12% 11.37% 9.47% 9.25% 9.85% 10.35%
1.71% 10.19% 13.06% 8.38% 9.70% 16.96% 9.54% 8.04% 8.79% 9.02%
2.80% 16.41% 17.40% 14.24% 15.21% 17.96% 11.89% 8.83% 9.94% 10.04%
0.48% 6.08% 5.56% 2.57% 3.17% 4.91% 0.96% 1.08% 1.98% 3.02%
10 years
8.43%
6.68%
8.86%
10.61%
9.27%
10.01%
3.20%
CPP Hedge Fund Recommendation
Evanston - Weatherlow
Pointer Offshore LTD
Millennium
Canyon
Litespeed
HFRI FOF: Diversified Index
YTD 2013 2012 2011 2010 2009 2008 2007 2006 2005
2.06% 14.60% 9.41% 0.17% 11.41% 21.04% -18.02% 20.28% 12.92% 9.60%
1.60% 13.37% 8.48% -5.95% 9.49% 19.79% -21.60% 22.91% 11.48% 9.85%
1.65% 15.08% 7.13% 4.84% 11.06% 14.59% -16.63% 30.13% 10.87% 10.21%
3.43% 13.27% 6.32% 8.39% 13.22% 17.20% -3.04% 10.99% 16.54% 11.31%
1.71% 15.07% 17.89% -4.69% 14.66% 54.11% -29.08% 7.47% 14.25% 8.59%
2.80% 21.58% 21.91% 4.45% 16.76% 30.15% -21.27% 0.28% 20.87% 3.42%
0.48% 9.04% 4.81% -5.01% 5.48% 11.46% -20.85% 9.72% 10.18% 7.46%
Calendar Year ReturnAs of March 2014
68

15
Cumulative & 36 Month Moving ReturnsManager PerformanceApril 2004 - March 2014 (Single Computation)
50
100
150
200
250
300
Q1 2004Q4 2004 Q4 2005 Q4 2006 Q4 2007 Q4 2008 Q4 2009 Q4 2010 Q4 2011 Q4 2012 Q1 2014
CPP Hedge Fund RecommendationEvanston - WeatherlowPointer Offshore LTDMillennium Canyon Litespeed HFRI FOF: Diversified Index
Return / TimeApril 2004 - March 2014 (9-Quarter Moving Windows, Computed Quarterly)
Ret
urn
-10%
0%
10%
20%
30%
40%
TimeQ2 2006 Q4 2007 Q4 2008 Q4 2009 Q4 2010 Q4 2011 Q4 2012 Q1 2014
CPP Hedge Fund RecommendationEvanston - WeatherlowPointer Offshore LTDMillennium Canyon Litespeed
69

16
Risk & Return StatisticsApril 2004 - March 2014: Summary Statistics
CPP Hedge Fund Recommendation
Evanston - Weatherlow
Pointer Offshore LTD
Millennium
Canyon
Litespeed
MSCI ACWI (Net)
Return Std. Deviation Sharpe Alpha Beta R-Squared Correlation Excess Return Tracking Error Info Ratio
8.43% 7.37% 0.93 4.63% 0.34 71.15% 0.84 1.45% 12.80% 0.11
6.68% 8.09% 0.63 2.77% 0.37 71.77% 0.84 -0.29% 12.35% -0.02
8.86% 8.12% 0.90 5.48% 0.29 42.78% 0.65 1.89% 14.45% 0.13
10.61% 4.34% 2.09 7.82% 0.17 47.79% 0.69 3.64% 15.65% 0.23
9.27% 12.08% 0.64 4.26% 0.57 72.63% 0.85 2.29% 10.20% 0.22
10.01% 10.79% 0.78 5.45% 0.48 64.38% 0.80 3.03% 11.59% 0.26
6.97% 18.34% 0.29 0.00% 1.00 100.00% 1.00 0.00% 0.00% 0.00
Alpha vs. Market Benchmark/Time9-Quarter Moving Windows, Computed Quarterly
April 2004 - March 2014
Alph
a
-10%
-5%
0%
5%
10%
15%
20%
25%
TimeQ2 2006 Q4 2007 Q4 2008 Q4 2009 Q4 2010 Q4 2011 Q4 2012 Q1 2014
CPP Hedge Fund Recommendation Evanston - Weatherlow Pointer Of f shore LTD
Millennium Canyon Litespeed
Market Benchmark:MSCI ACWI (Net)
April 2004 - March 2014: Summary Statistics
CPP Hedge Fund Recommendation
Evanston - Weatherlow
Pointer Offshore LTD
Millennium
Canyon
Litespeed
Barclays U.S. Aggregate
Return Std. Deviation Sharpe Alpha Beta R-Squared Correlation Excess Return Tracking Error Info Ratio
8.43% 7.37% 0.93 8.45% -0.45 4.91% -0.23 3.97% 8.83% 0.45
6.68% 8.09% 0.63 7.12% -0.57 6.56% -0.24 2.22% 9.54% 0.23
8.86% 8.12% 0.90 8.25% -0.23 1.05% -0.08 4.40% 9.10% 0.48
10.61% 4.34% 2.09 9.97% -0.30 6.04% -0.29 6.15% 6.31% 0.98
9.27% 12.08% 0.64 9.87% -0.48 2.01% -0.19 4.80% 13.20% 0.36
10.01% 10.79% 0.78 12.20% -1.04 11.53% -0.41 5.54% 12.64% 0.44
4.46% 3.49% 0.83 0.00% 1.00 100.00% 1.00 0.00% 0.00% 0.00
Alpha vs. Market Benchmark/Time9-Quarter Moving Windows, Computed Quarterly
April 2004 - March 2014
Alph
a
-10%
0%
10%
20%
30%
40%
TimeQ2 2006 Q4 2007 Q4 2008 Q4 2009 Q4 2010 Q4 2011 Q4 2012 Q1 2014
CPP Hedge Fund Recommendation Evanston - Weatherlow Pointer Of f shore LTD
Millennium Canyon Litespeed
Market Benchmark:Barclays U.S. Aggregate
April 2004 - March 2014: Summary Statistics
CPP Hedge Fund Recommendation
Evanston - Weatherlow
Pointer Offshore LTD
Millennium
Canyon
Litespeed
HFRI FOF: Diversified Index
Return Std. Deviation Sharpe Alpha Beta R-Squared Correlation Excess Return Tracking Error Info Ratio
8.43% 7.37% 0.93 5.08% 1.03 92.87% 0.96 5.22% 1.96% 2.66
6.68% 8.09% 0.63 3.29% 1.11 90.56% 0.95 3.48% 2.55% 1.36
8.86% 8.12% 0.90 5.68% 0.96 68.35% 0.83 5.66% 4.51% 1.25
10.61% 4.34% 2.09 7.99% 0.54 70.32% 0.85 7.41% 3.98% 1.86
9.27% 12.08% 0.64 5.41% 1.53 73.77% 0.85 6.06% 7.23% 0.84
10.01% 10.79% 0.78 6.34% 1.34 70.24% 0.82 6.80% 6.42% 1.06
3.20% 6.94% 0.24 0.00% 1.00 100.00% 1.00 0.00% 0.00% 0.00
Alpha vs. Market Benchmark/Time9-Quarter Moving Windows, Computed Quarterly
April 2004 - March 2014
Alph
a
-5%
0%
5%
10%
15%
20%
TimeQ2 2006 Q4 2007 Q4 2008 Q4 2009 Q4 2010 Q4 2011 Q4 2012 Q1 2014
CPP Hedge Fund Recommendation Evanston - Weatherlow Pointer Of f shore LTD
Millennium Canyon Litespeed
Market Benchmark:HFRI FOF: Diversif ied Index
70

17
Downside Risk StatisticsApril 2004 - March 2014: Summary Statistics
CPP Hedge Fund Recommendation
Evanston - Weatherlow
Pointer Offshore LTD
Millennium
Canyon
Litespeed
HFRI FOF: Diversified Index
Max Drawdown Up Periods Down Periods Average Up Average Down Best Period Return Worst Period Return Batting Averag Up Capture Down Capture
-18.18% 32 8 3.58% -3.75% 5.98% -10.46% 87.50% 154.73% 65.07%
-21.60% 31 9 3.42% -4.16% 6.59% -12.45% 82.50% 141.24% 84.53%
-16.72% 32 8 3.80% -4.06% 11.51% -12.89% 82.50% 158.15% 60.39%
-6.61% 35 5 3.19% -1.75% 5.96% -5.56% 80.00% 142.22% -9.98%
-29.08% 34 6 4.19% -7.58% 19.50% -18.21% 70.00% 192.88% 105.07%
-28.18% 30 10 5.07% -4.99% 10.55% -11.50% 65.00% 194.91% 91.48%
-20.85% 28 12 2.54% -3.08% 5.28% -10.24% 0.00% 100.00% 100.00%
DrawdownApril 2004 - March 2014
-30%
-25%
-20%
-15%
-10%
-5%
0%
Q1 2004 Q4 2005 Q4 2007 Q4 2009 Q4 2011 Q1 2014
CPP Hedge Fund RecommendationEvanston - WeatherlowPointer Offshore LTDMillennium Canyon Litespeed HFRI FOF: Diversified Index
71

18
Zephyr StyleADVISORZephyr StyleADVISOR: Graystone Consulting
Standard Deviation vs. Market Benchmark/Time9-Quarter Moving Windows, Computed Quarterly
April 2004 - March 2014
Stan
dard
Dev
iatio
n
0%
5%
10%
15%
20%
25%
30%
35%
TimeQ2 2006 Q4 2006 Q4 2007 Q4 2008 Q4 2009 Q4 2010 Q4 2011 Q4 2012 Q4 2013 Q1 2014
CPP Hedge Fund Recommendation Evanston - Weatherlow Pointer Offshore LTD Millennium
Canyon Litespeed Market Benchmark:MSCI ACWI (Net)
Beta vs. Market Benchmark/Time9-Quarter Moving Windows, Computed Quarterly
April 2004 - March 2014
Beta
vs.
MSC
I AC
WI (
Net
)
-0.2
0
0.2
0.4
0.6
0.8
1
1.2
TimeQ2 2006 Q4 2006 Q4 2007 Q4 2008 Q4 2009 Q4 2010 Q4 2011 Q4 2012 Q4 2013 Q1 2014
CPP Hedge Fund Recommendation Evanston - Weatherlow Pointer Offshore LTD Millennium
Canyon Litespeed Market Benchmark:MSCI ACWI (Net)
72

19
• IPS: Compliant
– The recommendations are compliant with the Investment Policy guidelines. The key guidelines are listed below.
– Acceptable Instruments:
• “Hedge Funds. Investments in hedge funds shall be limited to funds approved by the investment advisor.”
– Liquidity:
• “The Foundation’s endowment investment portfolio will remain satisfactorily liquid to enable the Foundation to meet anticipated operating and cash flow requirements. Historical and cash flow needs are to be analyzed continuously.”
– Policy Targets: “0% to 20%.” The recommendation is within the policy maximum.
Investment Policy Considerations
73

20
Investment Manager Summaries
74

21
Subscriptions Redemptions Pre-Negotiated
Minimums
Fees
Weatherlow Offshore
Fund, Ltd
Monthly Class I shares are subject to a 12
month lock-up and Class II shares
are subject to a 36 month lock-up
$2 Million Class I: 1%, Class II: 0.85% +
10% with a 6% hurdle
Pointer Offshore II
LTD
Quarterly 2 years from date of capital
contribution
$3 Million 1%
Millennium Int’l Ltd. Monthly (Queue,
expect a window to
open in July.)
Annual or Quarterly. Quarterly:
Up to 25% of the shares may be
redeemed Quarterly with 90 days’
notice. 4% early redemption under
1 year.
$1 Million ($5
Million Stated)
0% (Cost Pass Through) & 20%
Litespeed Offshore
Ltd.
Monthly Series A: Annual with 45 days’
notice. Series B: Quarterly (1 yr.
soft lock) with 45 days’ notice. 5%
early redemption under 1 year.
$1 Million ($5
Million Stated)
Series A (Annual Liquidity)
1.5% & 20%, Series B
(Quarterly Liquidity) 2% &
20%
Canyon Value
Realization Fund, Ltd.
Monthly Quarterly, with written notice
before the last calendar day of the
first month of the quarter, subject
to a 25% gate.
$1 Million ($3
Million Stated)
1.5% and 20%
Key Terms
75

22
• Manager: – Evanston Capital Management, LLC (“ECM”) was founded in 2002 with the goal of providing institutional
quality alternative investment management services, with an emphasis on hedge funds, to endowments, foundations, corporations and high net worth families.
– As of April 1, 2014, ECM managed approximately $4.8 billion in funds-of-hedge funds and is composed of a team of individuals with complementary skills and significant vertical depth, institutional experience, and versatility across many facets of investment management.
– A majority of ECM’s equity is owned by employees of ECM, ECM's initial seed investor, and entities related to the foregoing, and a significant minority interest is owned by private equity and subordinated debt funds affiliated with TA Associates, Inc. As of April 1, 2014, ECM manages three commingled funds-of-hedge funds strategies and one fund of one strategy.
• Investment Strategy: – In October 2002, ECM launched The Weatherlow Fund I L.P. ("Weatherlow"). Weatherlow’s investment
objective is to achieve long-term returns commensurate with long-term returns from a portfolio invested in the general equity markets, while experiencing volatility more like that of a portfolio invested in the general debt markets.
– Weatherlow seeks to achieve this objective by investing predominantly in interests in Portfolio Funds – i.e., limited partnerships and similar pooled invested vehicles often referred to as “hedge funds” – managed by independent Portfolio Managers that employ diverse alternative investment strategies across a variety of asset classes.
– The Weatherlow Offshore Fund I Ltd. (the “Fund”) was launched in January 2003 and invests directly into Weatherlow as a feeder fund.
• Strategy Assets (Master-Feeder Structure as a Whole): $4,614 million as of April 1, 2014 • Fund Assets: $2,779 million as of April 1, 2014
Evanston Weatherlow Offshore Fund Ltd.
76

23
Evanston
EvanstonAlpha vs. Market Benchmark/Time
9-Quarter Moving Windows, Computed QuarterlyApril 2004 - March 2014
Alph
a vs
. HFR
I FO
F: D
iver
sifie
d In
dex
-10%
-5%
0%
5%
10%
15%
20%
TimeQ2 2006 Q4 2006 Q4 2007 Q4 2008 Q4 2009 Q4 2010 Q4 2011 Q4 2012 Q1 2014
Evanston - Weatherlow Market Benchmark:HFRI FOF: Diversified Index
Alpha vs. Market Benchmark/Time9-Quarter Moving Windows, Computed Quarterly
April 2004 - March 2014
Alph
a vs
. HFR
I FO
F: D
iver
sifie
d In
dex
-10%
-5%
0%
5%
10%
15%
20%
TimeQ2 2006 Q4 2006 Q4 2007 Q4 2008 Q4 2009 Q4 2010 Q4 2011 Q4 2012 Q1 2014
Evanston - Weatherlow Market Benchmark:HFRI FOF: Diversified Index
Histogram of ReturnsApril 2004 - March 2014
Perc
enta
ge o
f Qua
rters
(%)
0
5
10
15
20
25
30
35
Returns Range (%)
< -13 -13 to -11 -11 to -9 -9 to -7 -7 to -5 -5 to -3 -3 to -1 -1 to 1 1 to 3 3 to 5 > 5
Evanston - Weatherlow HFRI FOF: Diversified Index
Risk Return vs LB AggApril 2004 - March 2014: Summary Statistics
Evanston - Weatherlow
HFRI FOF: Diversified Index
Return StandardDeviation Alpha Beta Maximum
Drawdown R-Squared
6.68% 8.09% 3.29% 1.11 -21.60% 90.56%
3.20% 6.94% 0.00% 1.00 -20.85% 100.00%
Risk Return vs. S&P 500April 2004 - March 2014: Summary Statistics
Evanston - Weatherlow
HFRI FOF: Diversified Index
Return StandardDeviation Alpha Beta Maximum
Drawdown R-Squared
6.68% 8.09% 3.29% 1.11 -21.60% 90.56%
3.20% 6.94% 0.00% 1.00 -20.85% 100.00%
Calendar Year ReturnAs of March 2014
Evanston - Weatherlow
HFRI FOF: Diversified Index
YTD 2012 2011 2010 2009 2008 2007 2006 2005
1.60% 8.48% -5.95% 9.49% 19.79% -21.60% 22.91% 11.48% 9.85%
0.48% 4.81% -5.01% 5.48% 11.46% -20.85% 9.72% 10.18% 7.46%
Manager vs Benchmark: Return through March 2014(not annualized if less than 1 year)
1 year 3 years 5 years 7 years 10 years
10.26% 5.18% 8.52% 5.12% 6.68%
6.08% 2.57% 4.91% 1.08% 3.20%
77

24
• Manager – PMC was established in 1990 by W. Thorpe McKenzie, Joseph H. Davenport III, and John A. Stout (collectively, the
“Founders”). Prior to founding Pointer, Mr. McKenzie co-founded the Tiger Fund with Julian Robertson; Joseph Davenport ran a Coca-Cola bottling business and managed several successful leveraged buy-outs; and Mr. Stout served as an institutional broker at Morgan Keegan & Company where he covered several hedge funds across the United States, often assisting them with idea generation.
– During the 1980s, the Founders invested in and/or managed long/short equity portfolios and introduced friends and family members to certain equity hedge funds in which they were personally invested. In 1990, they decided to form a fund of hedge funds that would provide an efficient platform from which they could direct hedge fund investments for themselves and others.
– Since 1990, Pointer has successfully managed its fund of funds and grown and diversified its investor base. In 2007, Charles B. Chitty and Ward Davenport became principals of the Investment Manager and shareholders of PMC. In 2008, Tyler F. Burke became a principal of the Investment Manager and a shareholder of PMC. Jeff E. Tarumianz became a principal of the Investment Manager and a shareholder of PMC on December 31, 2009. In July 2011, Patrick B. Stowe became a principal of the Investment Manager and a shareholder of PMC.
• Fund Strategy Description – The Funds’ investment objective is to achieve capital appreciation through a balanced level of risk primarily by allocating
assets to a select number of fundamental long/short equity and credit focused managers. – Long/short equity hedge funds represent the most significant portion of the Funds’ investment portfolio and typically
comprise 70-85% of the total portfolio. The balance of the portfolio is invested opportunistically and may consist of, but is not limited to, distressed/credit, sector or commodity-related funds, or other thematic investment opportunities.
– The Funds seek to achieve balance between risk and return in two primary ways: (1) employment of a select group of managers so as to decrease the Funds’ exposure to any single manager; and (2) employment of managers who utilize diverse strategies/exposures and hedging in their individual funds. Diversification and hedging on the part of each of the Funds’ individual managers are intended to help generate positive overall returns even under adverse market conditions.
• Fund Assets: $1,789 MM in Offshore Assets and $2,866 MM in Fund Assets, as of April 1, 2014.
Pointer Offshore, Ltd.
78

25
Pointer
PointerAlpha vs. Market Benchmark/Time
9-Quarter Moving Windows, Computed QuarterlyJuly 2004 - June 2014
Alph
a vs
. HFR
I FO
F: D
iver
sifie
d In
dex
-10%
-5%
0%
5%
10%
15%
20%
TimeQ3 2006 Q4 2007 Q4 2008 Q4 2009 Q4 2010 Q4 2011 Q4 2012 Q4 2013 Q2 2014
Pointer Offshore LTD Market Benchmark:HFRI FOF: Diversified Index
Alpha vs. Market Benchmark/Time9-Quarter Moving Windows, Computed Quarterly
July 2004 - June 2014
Alph
a vs
. HFR
I FO
F: D
iver
sifie
d In
dex
-10%
-5%
0%
5%
10%
15%
20%
TimeQ3 2006 Q4 2007 Q4 2008 Q4 2009 Q4 2010 Q4 2011 Q4 2012 Q4 2013 Q2 2014
Pointer Offshore LTD Market Benchmark:HFRI FOF: Diversified Index
Histogram of ReturnsJuly 2004 - June 2014
Perc
enta
ge o
f Qua
rters
(%)
0
5
10
15
20
25
30
35
Returns Range (%)
< -13 -13 to -11 -11 to -9 -9 to -7 -7 to -5 -5 to -3 -3 to -1 -1 to 1 1 to 3 3 to 5 5 to 7 7 to 9 9 to 11 > 11
Pointer Offshore LTD HFRI FOF: Diversified Index
Risk Return vs LB AggJuly 2004 - June 2014: Summary Statistics
Pointer Offshore LTD
HFRI FOF: Diversified Index
Return StandardDeviation Alpha Beta Maximum
Drawdown R-Squared
9.63% 8.16% 6.16% 0.97 -16.72% 67.19%
3.49% 6.91% 0.00% 1.00 -20.85% 100.00%
Risk Return vs. S&P 500July 2004 - June 2014: Summary Statistics
Pointer Offshore LTD
HFRI FOF: Diversified Index
Return StandardDeviation Alpha Beta Maximum
Drawdown R-Squared
9.63% 8.16% 6.16% 0.97 -16.72% 67.19%
3.49% 6.91% 0.00% 1.00 -20.85% 100.00%
Calendar Year ReturnAs of June 2014
Pointer Offshore LTD
HFRI FOF: Diversified Index
YTD 2012 2011 2010 2009 2008 2007 2006 2005
8.12% 7.13% 4.84% 11.06% 14.59% -16.63% 30.13% 10.87% 10.21%
1.99% 4.81% -5.01% 5.48% 11.46% -20.85% 9.72% 10.18% 7.46%
Manager vs Benchmark: Return through June 2014(not annualized if less than 1 year)
1 year 3 years 5 years 7 years 10 years
18.18% 9.12% 11.12% 8.21% 9.63%
7.52% 3.49% 4.36% 0.67% 3.49%
79

26
• Strategy – Core Multi-strategy
• General Positive Attributes – Diversified, bottom-up, multi-manager trading platform structured across four core strategies with
an aim to deliver repeatable alpha-driven returns with minimal volatility and market correlation.
• Relative Value-Fundamental Equity
• Quant/Statistical Arbitrage
• Fixed Income
• Merger Arbitrage/Event Driven
– Centralized 35+ person risk management team with advanced proprietary technology for position/team level monitoring, evaluation and benchmarking.
– Diversified number of teams (140+) allows for diversification across strategies, markets and sectors.
• Excellent Performance – 20 year+ track record of uncorrelated returns, with a very tight risk management framework
including complete transparency.
– Over the last 10 years ending June of 2013 the fund has double digit annualized returns with very low beta and correlation to both the equity and fixed income markets.
Millennium International, Ltd.
80

27
• Strong Portfolio Management
– Founded by Israel “Izzy” Englander over 20 years ago.
– Leading investment professional sourcing infrastructure and skill to attract, support and manage expert trading teams. Today the fund is comprised of over 140 teams (700+ investment professionals). Each team is compensated based on individual trading profit and lsos and must operate within predefined risk metrics.
• Expected Performance…
– The fund has exhibited a long track record of consistently positive returns with low volatility and low correlation to both equity and fixed income markets.
• Points to Consider
– Firm Asset Under Management $18.95 billion, there is a current queue to get into the fund.
– The fund has thousands of positions in multiple asset classes and geographies.
– The fund does not have key man risk at the portfolio management level but at the sourcing level there is potentially key man risk when Izzy decides to retire.
– Although there is tremendous risk controls to monitor investment portfolio risk, there is no reliable way to detect fraud. With the size of the firm, over 1,300 people there is always the risk for insider trading.
Millennium International, Ltd.
81

28
Millennium International, Ltd.Alpha vs. Market Benchmark/Time
12-Quarter Moving Windows, Computed QuarterlyJuly 2004 - June 2014
Alph
a vs
. MSC
I AC
WI (
Net
)
-10%
-5%
0%
5%
10%
15%
20%
TimeQ2 2007 Q4 2007 Q4 2008 Q4 2009 Q4 2010 Q4 2011 Q4 2012 Q4 2013 Q2 2014
Millennium Market Benchmark:MSCI ACWI (Net)
Alpha vs. Market Benchmark/Time12-Quarter Moving Windows, Computed Quarterly
July 2004 - June 2014
Alp
ha v
s. B
arcl
ays
U.S
. Agg
rega
te
-10%
-5%
0%
5%
10%
15%
20%
TimeQ2 2007 Q4 2007 Q4 2008 Q4 2009 Q4 2010 Q4 2011 Q4 2012 Q4 2013 Q2 2014
Millennium Market Benchmark:Barclays U.S. Aggregate
Information Ratio vs. Style Benchmark/Time12-Quarter Moving Windows, Computed Quarterly
July 2004 - June 2014
Info
rmat
ion
Rat
io v
s. S
tyle
Ben
chm
ark
-1
0
1
2
3
4
TimeQ2 2007 Q4 2008 Q4 2009 Q4 2010 Q4 2011 Q4 2012 Q2 2014
Millennium MSCI ACWI (Net)
Barclays U.S. Aggregate Market Benchmark:MSCI ACWI (Net)
July 2004 - June 2014: Summary Statistics
Millennium
MSCI ACWI (Net)
Return StandardDev iation Alpha Beta Maximum
Drawdown
InformationRatio
vs. Sty leR-Squared Correlation
vs. Market
10.39% 4.41% 7.57% 0.16 -6.61% 3.03 45.37% 0.67
7.46% 18.36% 0.00% 1.00 -49.31% -0.19 100.00% 1.00
July 2004 - June 2014: Summary Statistics
Millennium
Barclays U.S. Aggregate
Return StandardDev iation Alpha Beta Maximum
Drawdown
InformationRatio
vs. MarketR-Squared Correlation
vs. Market
10.39% 4.41% 10.14% -0.36 -6.61% 0.86 7.74% -0.33
4.93% 3.30% 0.00% 1.00 -2.44% 0.00 100.00% 1.00
July 2004 - June 2014: Summary Statistics
Millennium
HFRI FOF: Diversified Index
Return StandardDeviation Alpha Beta Maximum
Drawdown
InformationRatio
vs. MarketR-Squared Correlation
vs. Market
10.39% 4.41% 7.63% 0.53 -6.61% 1.70 67.69% 0.83
3.49% 6.91% 0.00% 1.00 -20.85% 0.00 100.00% 1.00
Calendar Year ReturnAs of June 2014
Millennium
MSCI ACWI (Net)
Barclays U.S. Aggregate
HFRI FOF: Diversified Index
YTD 2012 2011 2010 2009 2008 2007 2006 2005
3.50% 6.32% 8.39% 13.22% 17.20% -3.04% 10.99% 16.54% 11.31%
6.18% 16.13% -7.35% 12.67% 34.63% -42.20% 11.66% 20.95% 10.84%
3.93% 4.21% 7.84% 6.54% 5.93% 5.24% 6.97% 4.33% 2.43%
1.99% 4.81% -5.01% 5.48% 11.46% -20.85% 9.72% 10.18% 7.46%
Manager vs Benchmark: Return through June 2014(not annualized if less than 1 year)
1 year 3 years 5 years 7 years 10 years
10.56% 8.55% 10.46% 8.79% 10.39%
22.95% 10.25% 14.28% 3.24% 7.46%
4.37% 3.66% 4.85% 5.35% 4.93%
7.52% 3.49% 4.36% 0.67% 3.49%
82

29
• Strategy
– Event Driven Equity & Credit
• General Positive Attributes
– Value-oriented, fundamental research aimed at “analyzable, definable and fully-monetizing” situations including debt maturities, recapitalizations, spin-offs, asset sales, liquidations, acquisitions, and bankruptcies/restructurings, etc.
– Long-biased strategy investing across capital structures. Occasional use of hedges.
– All-cap approach with meaningful participation in small/mid-cap securities, including private companies via corporate bonds and bank loans.
– Non-US exposure has averaged 15-20% over time.
– Optimal sized AUM base at $2.8 billion; large enough to have meaningful ownership positions and a voice in restructurings, but small enough to be nimble in trading with access to smaller one-off opportunities.
• Excellent Performance
– A long track record of positive absolute and risk-adjusted returns, outperforming the public markets and HFRI FOF Diversified index.
– Long-term correlation of 0.81 to MSCI ACWI with beta of 0.49 (ranging from roughly 0.20 to 0.60 over rolling 12-month periods).
Litespeed Offshore Ltd.
83

30
• Strong Portfolio Management
– Single-minded leadership of founder and PM Jamie Zimmerman. Strong background pedigree – as clerk to NYC bankruptcy court judge in 1980s, and as research analyst and PM at various investment firms including LF Rothschild where she was mentored by Michael Gordon (co-founder and CIO of Angelo Gordon).
– Lead PM supported by four analysts, two traders, and in-house attorney. Experienced professionals average 18 years in investments industry.
– Fund does not make use of leverage.
• Expected Performance…
– Litespeed has delivered strong risk-adjusted returns over time with modest correlation to broad equity markets. Assuming a benign economic/credit environment, we believe company-specific events should drive performance.
• Points to Consider
– With founder and PM Jamie Zimmerman, Litespeed has key-person risk.
– Litespeed operates a concentrated portfolio with approximately 35-50 positions.
– The strategy has credit and liquidity risk. The fund might struggle to perform during periods of economic slowdown, credit deterioration and rising corporate defaults, elevated liquidity pressures, or environments characterized by general de-risking.
Litespeed Offshore Ltd.
84

31
LitespeedAlpha vs. Market Benchmark/Time
9-Quarter Moving Windows, Computed QuarterlyApril 2004 - March 2014
Alph
a vs
. HFR
I FO
F: D
iver
sifie
d In
dex
-10%
-5%
0%
5%
10%
15%
20%
TimeQ2 2006 Q4 2006 Q4 2007 Q4 2008 Q4 2009 Q4 2010 Q4 2011 Q4 2012 Q1 2014
Litespeed Market Benchmark:HFRI FOF: Diversified Index
Alpha vs. Market Benchmark/Time9-Quarter Moving Windows, Computed Quarterly
April 2004 - March 2014
Alph
a vs
. HFR
I FO
F: D
iver
sifie
d In
dex
-10%
-5%
0%
5%
10%
15%
20%
TimeQ2 2006 Q4 2006 Q4 2007 Q4 2008 Q4 2009 Q4 2010 Q4 2011 Q4 2012 Q1 2014
Litespeed Market Benchmark:HFRI FOF: Diversified Index
Histogram of ReturnsApril 2004 - March 2014
Perc
enta
ge o
f Qua
rters
(%)
0
5
10
15
20
25
30
Returns Range (%)
< -12 -12 to -10 -10 to -8 -8 to -6 -6 to -4 -4 to -2 -2 to 0 0 to 2 2 to 4 4 to 6 6 to 8 8 to 10 > 10
Litespeed HFRI FOF: Diversified Index
Risk Return vs LB AggApril 2004 - March 2014: Summary Statistics
Litespeed
HFRI FOF: Diversified Index
Return StandardDeviation Alpha Beta Maximum
Drawdown R-Squared
10.01% 10.79% 6.34% 1.34 -28.18% 70.24%
3.20% 6.94% 0.00% 1.00 -20.85% 100.00%
Risk Return vs. S&P 500April 2004 - March 2014: Summary Statistics
Litespeed
HFRI FOF: Diversified Index
Return StandardDeviation Alpha Beta Maximum
Drawdown R-Squared
10.01% 10.79% 6.34% 1.34 -28.18% 70.24%
3.20% 6.94% 0.00% 1.00 -20.85% 100.00%
Calendar Year ReturnAs of March 2014
Litespeed
HFRI FOF: Diversified Index
YTD 2012 2011 2010 2009 2008 2007 2006 2005
2.80% 21.91% 4.45% 16.76% 30.15% -21.27% 0.28% 20.87% 3.42%
0.48% 4.81% -5.01% 5.48% 11.46% -20.85% 9.72% 10.18% 7.46%
Manager vs Benchmark: Return through March 2014(not annualized if less than 1 year)
1 year 3 years 5 years 7 years 10 years
16.41% 14.24% 17.96% 8.83% 10.01%
6.08% 2.57% 4.91% 1.08% 3.20%
85

32
• General Positive Attributes – Top-tier research capabilities with sophisticated risk analysis tools and hedging techniques – Strong corporate infrastructure led by founding partners Josh Friedman and Mitch Julis, who each
have JDs and MBAs from Harvard and over two decades of distressed investing experience
• Excellent Performance – For the 10 year period ending December 2013 the strategy has produced annualized alpha of 9.95%
versus the Barclays U.S. Aggregate index and 4.26% versus the MSCI AWCI.
• Strong Portfolio Management Team – Team-oriented approach – 5 lead portfolio managers are supported by a team of over 25 specialists
• Sound Investment Philosophy and Process
– Multi-disciplinary, opportunistic approach with expertise in credit-oriented investing including distressed and structured products • Areas of expertise include bankruptcy, capital structure analysis, bank debt, sourcing, loan
origination, leveraged loans, high yield debt and securitized products (including MBS, aircraft securitizations, etc.)
– Excellent risk management. Tenets of risk management include: • No financial leverage, short duration, high level of diversification, dedicated risk department
and a disciplined sell process
Canyon Value Realization Fund, Ltd.
86

33
• Expect Strong Performance… – Through a variety of market cycles
• Canyon has demonstrated an ability to locate under-covered areas of the market, research these niches then capitalize on the opportunity – e.g. tobacco settlement bonds
• Expect Weaker Performance When:
– While historically adding value through almost any market climate, the fund may struggle when correlations between asset classes increase toward +1 • e.g. in 2008, despite having a more credit-oriented approach, the fund experienced
equity-like performance and suffered losses
• Points to Consider – Over $500 million of employee investments – SEC registered since 1994 – Little to no fund-level leverage – Strategy assets under management of over $9.7 billion – Solid yield base (up to 10%) typically results from the fund’s largest sub-strategies such as
bank debt, high yield and securitized assets
Canyon Value Realization Fund, Ltd.
87

34
CanyonAlpha vs. Market Benchmark/Time
9-Quarter Moving Windows, Computed QuarterlyJuly 2004 - June 2014
Alph
a vs
. HFR
I FO
F: D
iver
sifie
d In
dex
-10%
-5%
0%
5%
10%
15%
20%
TimeQ3 2006 Q4 2007 Q4 2008 Q4 2009 Q4 2010 Q4 2011 Q4 2012 Q4 2013 Q2 2014
Canyon Market Benchmark:HFRI FOF: Diversified Index
Alpha vs. Market Benchmark/Time9-Quarter Moving Windows, Computed Quarterly
July 2004 - June 2014
Alph
a vs
. HFR
I FO
F: D
iver
sifie
d In
dex
-10%
-5%
0%
5%
10%
15%
20%
TimeQ3 2006 Q4 2007 Q4 2008 Q4 2009 Q4 2010 Q4 2011 Q4 2012 Q4 2013 Q2 2014
Canyon Market Benchmark:HFRI FOF: Diversified Index
Histogram of ReturnsJuly 2004 - June 2014
Perc
enta
ge o
f Qua
rters
(%)
0
5
10
15
20
25
30
Returns Range (%)
< -19 -19 to -17 -17 to -15 -15 to -13 -13 to -11 -11 to -9 -9 to -7 -7 to -5 -5 to -3 -3 to -1 -1 to 1 1 to 3 3 to 5 5 to 7 7 to 9 9 to 11 11 to 13 13 to 15 15 to 17 17 to 19 > 19
Canyon HFRI FOF: Diversified Index
Risk Return vs LB AggJuly 2004 - June 2014: Summary Statistics
Canyon
HFRI FOF: Diversified Index
Return StandardDeviation Alpha Beta Maximum
Drawdown R-Squared
9.39% 12.08% 5.07% 1.53 -29.08% 73.97%
3.49% 6.91% 0.00% 1.00 -20.85% 100.00%
Risk Return vs. S&P 500July 2004 - June 2014: Summary Statistics
Canyon
HFRI FOF: Diversified Index
Return StandardDeviation Alpha Beta Maximum
Drawdown R-Squared
9.39% 12.08% 5.07% 1.53 -29.08% 73.97%
3.49% 6.91% 0.00% 1.00 -20.85% 100.00%
Calendar Year ReturnAs of June 2014
Canyon
HFRI FOF: Diversified Index
YTD 2012 2011 2010 2009 2008 2007 2006 2005
4.29% 17.89% -4.69% 14.66% 54.11% -29.08% 7.47% 14.25% 8.59%
1.99% 4.81% -5.01% 5.48% 11.46% -20.85% 9.72% 10.18% 7.46%
Manager vs Benchmark: Return through June 2014(not annualized if less than 1 year)
1 year 3 years 5 years 7 years 10 years
11.32% 9.78% 13.43% 7.86% 9.39%
7.52% 3.49% 4.36% 0.67% 3.49%
88

35
Appendix Alternatives Research Process
89

36
• Our alternatives research department (AIP) covers multiple alternative asset classes including hedge funds, fund of hedge funds, private equity and real estate products.
• Philosophy: We believe investors benefit from the best of both worlds: extensive, global resources seeking the best investment ideas, and independent decision-making by a fully aligned team.
Alternatives Research Overview
Long Experience and Track Record • Over 20 years of investing in alternatives
Deep Network and Access • Reputation as a partner of choice for alternative investments • Experienced, high-quality investment teams leverage
proprietary technology
Specialized Resources • Strategy-specific portfolio managers and analysis • More than 200 investment, client service and operations
professionals
Broad Array of Solutions • Full range of core strategies across investment vehicles • Customized solutions • Secondaries, opportunistic and niche strategies to
complement core holdings
90
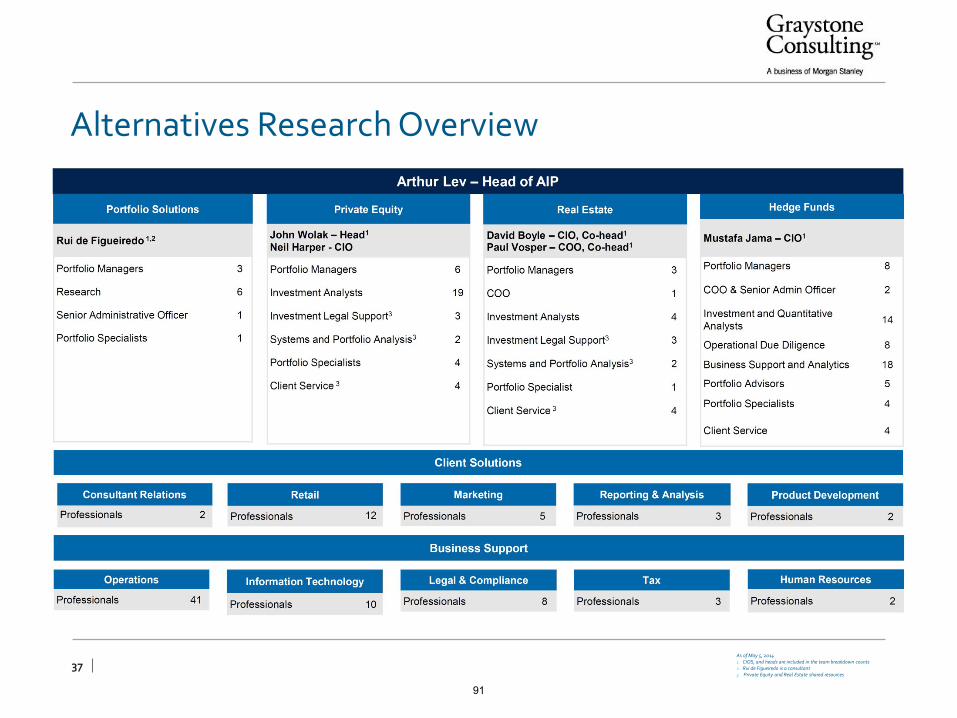
Arthur Lev - Head of AIP
Portfolio Solutions Private Equity MESS Hedge Funds
Rui de Figueiredot2 John Wolak - Head1Neil Harper - ClO
David Boyle - ClO, Co-heacPPaul Vosper - COO, Co-heacP
Mustafa Jama - CIO'
Portfolio Managers
Research
Senior Administrative Officer
Portfolio Specialists
3
6
1
1
Portfolio Managers
Investment Analysts
Investment Legal Support3
Systems and Portfolio Analysis3
Portfolio Specialists
Client Service 3
6
19
3
2
4
4
Portfolio Managers
COO
Investment Analysts
Investment Legal Support3
Systems and Portfolio Analysis3
Portfolio Specialist
Client Service 3
3
1
4
3
2
1
4
Portfolio Managers
COO & Senior Admin Officer
Investment and QuantitativeAnalysts
Operational Due Diligence
Business Support and Analytics
Portfolio Advisors
Portfolio Specialists
Client Service
8
2
14
8
18
5
4
4
Client Solutions
Consultant Relations
Professionals 2
Retail
Professionals 12
Marketing
Professionals 5
Reporting & Analysis
Professionals 3
Product Development
Professionals 2
Business Support
Operations
Professionals 41
Information Technology
Professionals 10
Legal & Compliance
Professionals 8
Tax
Professionals 3
Human Resources
Professionals 2
37
Alternatives Research Overview
As of May 5, 2014 1. CIOS, and heads are included in the team breakdown counts 2. Rui de Figueiredo is a consultant 3. Private Equity and Real Estate shared resources
91

38
Alternative Investments Research Process
Identification and Sourcing of
Prospective Funds
Qualitative Analysis
Quantitative Analysis
Operational and Business Risk Assessment
Approval by Investment Committee
Ongoing due Diligence
92

39
• We use a phased process to efficiently screen the universe of funds and focus detailed due diligence on those investment candidates with the highest potential, allowing us to analyze multiple investments simultaneously. On average, we meet several hundred candidate managers per year and conduct further analysis on approximately 120 of them, with around 25 new funds added to our research coverage each year. The process of approving a new manager consists of four phases, with clear deliverables and sign off required to move a candidate fund through each phase.
Phased Process
Phase 0
•Funds identified from multiple sources, and input into proprietary database for tracking. If rejected, rejection rationale input alongside performance data
•Successful compliance “conflicts” check required for progression to Phase 1
•Phase 0 is generally used as a means of filtering-out (rejecting) funds that are not part of our investable universe
Phase 1
•Funds identified as potential investment candidates
•Initial due diligence and formulation of investment thesis/rationale
•Initial due diligence summary, preliminary quantitative analysis and legal documentation review
•Individual portfolio manager together with CIO determine suitability for further research
Phase 2
•Full due diligence, including on-site visits by Investment and Operational Due Diligence Teams
•Investment Committee presentation and vetting
•Investment Committee approval required to move to Phase 3
Phase 3
•Completion of due diligence; finalize due diligence report, complete external reference checks, negotiate side letter terms (where appropriate)
•Investment committee approval required to approve fund for investment
•Submission of full due diligence report
93

40
• Open Architecture
– Manager sourcing starts with a global search for new investment ideas. We maintain an “open architecture” philosophy with respect to meeting new funds and continually survey the investor landscape. This allows us to benchmark incumbent funds versus newer competition, and identify particular market trends. Sourcing is the responsibility of our entire organization. We are all tasked with assisting in this process through personal networks and industry events.
• We source potential hedge fund managers in a variety of ways including:
Sourcing
Existing managers
Industry contacts
Inbound calls
Industry databases
Other sources within
Morgan Stanley
94

41
• The Investment Team uses a proprietary scorecard to analyze and rate managers. This process is performed every year. Our Investment Team follows an objective and methodical review process. Within this process are four major categories with additional sub-categories associated with each category. Each category and sub-category has a percentage weighting and a rating.
Qualitative Due Diligence
Investment Strategy
35%
• Investment Process / Alpha Generation
• Investment Process / Risk Control
• Assets
• Transparency
• Terms
Investment Team
35%
• Experience
• Structure
• Compensation
• Turnover
• References
Organization
15%
• Ownership Structure
• Business Plan / Stability
• Operational Due Diligence
Performance
15%
• Quantitative Analysis
95

42
Specific items the Investment Team looks for are:
•Evidence of skill in achieving attractive risk-adjusted returns
•Plausible and persistent sources of expected alpha
•Independent idea generation
•Rigorous approach to portfolio construction and risk control
•Experience investing across varied market cycles
Manager Attributes analyzed in Detail in include
•Systematic and rigorous approach to alpha generation
•Sources of alpha and potential for those sources to persist
•Systematic means of idea generation
•Trade structuring to isolate and capture alpha
•Repeatability of investment process given design and execution
•Research capability and supporting infrastructure / systems
Systematic approach to portfolio construction and risk controls
•Methodology for sizing and rebalancing positions; sell discipline
•Consistency of portfolio construction with objectives and constraints
•Methodology for measuring dominant risk exposures and portfolio risk
•Hedging at the position and portfolio levels to mitigate unintended risks
•Consideration of downside risk in “non-normal” scenarios
•Liquidity of positions; management of unencumbered cash
•Degree of integration of risk control with portfolio decision making
Qualitative Due Diligence
• The Investment Team’s due diligence consists of a combination of on-site visits, phone discussions, and reference checks, as well as a review of performance. Specific items the Investment Team looks for are:
96

43
• Simultaneously, the Quantitative Analysis Team performs a detailed analysis of returns, including:
• The Quantitative Analysis Team drafts their own research report, which is integrated into the Investment Due Diligence research report.
Quantitative Due Diligence
Absolute Return Analysis
• Total returns
• Volatility of returns
• Correlations with various systematic risks
• Downside risk
Relative Return Analysis
• Relative to other managers engaged in similar Strategies
Portfolio Simulations
• To ascertain how the investment would perform in various environments and with the rest of the portfolio
97

44
• The Operational Due Diligence Team conducts an analysis of the quality of the manager’s resources, controls, infrastructure and service providers. This analysis is independent of the Investment Due Diligence and Quantitative Analysis Teams. The Operational Due Diligence Team performs its evaluation of each manager through on-site meetings with management, phone discussions, background investigations, examination of fund documents, marketing materials and past audited financial statements, and discussions with the fund’s independent service providers.
Operational Due Diligence
Background Investigations
• Employment History and Resume Verification
• Corporate Records Search
• National and International Media Search
• Civil and Criminal Litigation
• Judgments, Tax Liens, and Bankruptcies
• Regulatory Sanctions/Disciplinary Action
Manager Research
• Operational infrastructure and controls
• Quality and depth of resources across the firm
• Segregation of duties and oversight
• Valuation policies, procedures and controls
• Trading and settlement
• Cash and collateral management
• Regulatory compliance policies and oversight
• Business continuity planning
• Audited financial statements
• Due diligence questionnaires
Legal Document Review
• Offering Memorandum
• LP Agreements or Articles of Association
• Subscription Documents
Evaluation of Service Providers
• The Operational Due Diligence Team performs a qualitative assessment of the service providers used by each underlying manager, particularly external auditors and administrators that maintain the official books and records for each fund.
98

45
Presentation
•The sponsoring strategy team presents its proposed investment to the Investment Committee for consideration. Generally, a hedge fund is discussed at two or three Investment Committees during which any member of the Investment Committee can raise questions and the prospective investment is fully vetted by the team. After reviewing the analysis and agreeing that the level of risk in the hedge fund and its team is appropriate, the Investment Committee either approves the new hedge fund, rejects it, or requests additional information.
Operational Veto Power
•The Operational Due Diligence Team holds veto power with respect to investment decisions made by AIP’s Investment Committee. When the team is not comfortable with the controls in place at an underlying manager, or if significant issues are identified in background checks, the investment will not be made. The team on average rejects approximately 12% of the firms due to operational due diligence concerns. By avoiding funds that have poor operational controls or weak infrastructure, AIP believes it is able to add additional alpha to its fund of hedge fund portfolios. Note that veto power can be invoked to both prevent an investment from being moved from Phase 2 to Phase 3 as well as to prevent approval of a Phase 3 investment.
Majority Vote
•Areas of potential concern and all material questions must be answered in order to obtain Investment Committee approval. A majority approval is required for manager recommendations to move forward. The Senior Administrative Officer attends each Investment Committee meeting to document the outcome and ensure that all procedures and protocols are followed. The Investment Committee conducts a full review of the comprehensive due diligence report.
Investment Committee Approval
• The Investment Committee is responsible for all manager approvals and asset allocation decisions. The Chief Operating Officer and Head of Operational Due Diligence attend these meetings.
99

Index Definitions
Lehman Aggregate Bond IndexLehman Aggregate Bond Index is an index comprised of approximately 6,000 publicly traded bonds including U.S. Government, mortgage-backed, corporate, and Yankee bonds with an approximate averagematurity of 10 years. An investment cannot be made directly in a market index.MSCI EAFE® Index (Europe. Australasia, Far East)The MSCI EAFE® Index (Europe, Australasia, Far East) is a free float-adjusted market capitalization index that is designed to measure developed market equity performance, excluding the US & Canada. As ofMay 2005 the MSCI EAFE Index consisted of the following 21 developed market country indices: Australia, Austria, Belgium, Denmark, Finland, France, Germany, Greece, Hong Kong, Ireland, Italy, Japan, theNetherlands, New Zealand, Norway, Portugal, Singapore, Spain, Sweden, Switzerland and the United Kingdom. An investment cannot be made directly in a market index.Russell 1000® IndexRussell 1000® Index measures the performance of the 1,000 largest companies in the Russell 3000 Index, which represents approximately 92% of the total market capitalization of the Russell 3000 Index. Aninvestment cannot be made directly in a market index.Russell 1000® Growth IndexRussell 1000® Growth Index measures the performance of those Russell 1000 companies with higher price-to-book ratios and higher forecasted growth values. An investment cannot bemade directly in amarket index.Russell 1000® Value IndexRussell 1000® Value Index measures the performance of those Russell 1000 companies with lower price-to-book ratios and lower forecasted growth values. An investment cannot bemade directly in a marketindex.Russell 2000® IndexRussell 2000® Index measures the performance of the 2,000 smallest companies in the Russell 3000 Index, which represents approximately 8% of the total market capitalization of the Russell 3000 Index. Aninvestment cannot be made directly in a market index.Russell 2000® Growth IndexRussell 2000® Growth Index measures the performance of those Russell 2000 companies with higher price-to-book ratios and higher forecasted growth values. An investment cannot bemade directly in amarket index.Russell 2000® Value IndexRussell 2000® Value Index measures the performance of those Russell 2000 companies with lower price-to-book ratios and lower forecasted growth values. An investment cannot bemade directly in a marketindex.Russell 2500TM IndexRussell 2500'Y Index measures the performance of the 2,500 smallest companies in the Russell 3000 Index, which represents approximately 16% of the total market capitalization of the Russell 3000 Index. /investment cannot be made directly in a market index.Russell 2500TM Growth IndexRussell 2500Ym Growth Index measures the performance of those Russell 2500 companies with higher price-to-book ratios and higher forecasted growth values An investment cannot be made directly in amarket index.Russell 2500TM Value IndexRussell 2500Thl Value Index measures the performance of those Russell 2500 companies with lower price-to-book ratios and lower forecasted growth values. An investment cannot be made directly in a marketindex.Russell 3000® IndexRussell 3000® Index measures the performance of the 3,000 largest U.S. companies based on total market capitalization, which represents approximately 98% of the investable U.S. equity market. Aninvestment cannot be made directly in a market index.Russell Midcap® IndexRussell Midcap® Index measures the performance of the 800 smallest companies in the Russell 1000 Index, which represent approximately 25% of the total market capitalization of the Russell 1000 Index Aninvestment cannot be made directly in a market index.Russell Midcap® Growth IndexRussell Midcap® Growth Index measures the performance of those Russell Midcap companies with higher price-to-book ratios and higher forecasted growth values. The stocks are also members of the Russell1000 Growth index. An investment cannot be made directly in a market index.Russell Midcap® Value IndexRussell Midcap® Value Index measures the performance of those Russell Midcap companies with lower price-to-book ratios and lower forecasted growth values. The stocks are also members of the Russell1000 Value index. An investment cannot be made directly in a market index.Standard & Poor's 500 IndexS&P 500 Index is an unmanaged, market value-weighted index of 500 stocks generally representative of the broad stock market. An investment cannot be made directlyin a market index.46
100

47
• To the extent the investments depicted herein represent international securities, you should be aware that there may be additional risks associated with international investing, including foreign economic, political, monetary and/or legal factors, changing currency exchange rates, foreign taxes, and differences in financial and accounting standards. These risks may be magnified in emerging markets. International investing may not be for everyone. Small capitalization companies may lack the financial resources, product diversification and competitive strengths of larger companies. In addition, the securities of small capitalization companies may not trade as readily as, and be subject to higher volatility than, those of larger, more established companies.
• Bonds are subject to interest rate risk. When interest rates rise bond prices fall; generally the longer a bond's maturity, the more sensitive it is to this risk. Bonds may also be subject to call risk, which allows the issuer to retain the right to redeem the debt, fully or partially, before the scheduled maturity date. Proceeds from sales prior to maturity may be more or less than originally invested due to changes in market conditions or changes in the credit quality of the issuer.
• Investing in alternative investments is speculative, not suitable for all clients, and intended for experienced and sophisticated investors who are willing to bear the high economic risks of the investment, which can include:
• • loss of all or a substantial portion of the investment due to leveraging, short-selling or other speculative investment practices; • lack of liquidity in that there may be no secondary market for the fund and none expected to develop; • volatility of returns;
• • restrictions on transferring interests in the fund; • potential lack of diversification and resulting higher risk due to concentration of trading authority with a single advisor; • absence of information regarding valuations and pricing; • delays in tax reporting; • less regulation and higher fees than mutual funds; and
• • advisor risk. • Although the statements of fact and data in this report have been obtained from, and are based upon, sources that the Firm believes to be reliable, we do not
guarantee their accuracy, and any such information may be incomplete or condensed. All opinions included in this report constitute the Firm’s judgment as of the date of this report and are subject to change without notice. This report is for informational purposes only and is not intended as an offer or solicitation with respect to the purchase or sale of any security. Past performance is not a guarantee of future results.
• Actual returns would be reduced by expenses that may include management fees and costs of transactions. Expected return and risk (standard deviation) calculations are based on historical data for periods indicated.
• International investing may not be suitable for every investor and is subject to additional risks, including currency fluctuations, political factors, withholding, lack of liquidity, the absence of adequate financial information, and exchange control restrictions impacting foreign issuers. These risks may be magnified in emerging markets.
• Mutual fund investments are subject to market risk, including the possible loss of principal. They are sold by prospectus only. The prospectus contains the investment objectives, risks, fees, charges and expenses, and other information regarding the mutual fund and variable annuity contract and its underlying investments, which should be carefully considered before investing. Prospectuses are available through your Financial Advisor or at www.smithbarney.com. Read the prospectus carefully before you invest.
• © 2014 Graystone Consulting is a business of Morgan Stanley Smith Barney LLC.
Important Disclosures
101

48
The analysis is based on published investment manager rate of return data, capital market indices, custom (benchmarks, indices and universes), as well as software developed by Zephyr Associates. Investment manager rate of return data includes: Effron Plan Sponsor Network Database. Capital markets index data includes: Capital market indices (supplied by Zephyr), Canadian indices (supplied by Zephyr), Salomon Brothers Fixed Income indices, Morgan Stanley Capital International indices, and Dow Jones Global indices. Zephyr StyleADVISOR uses principles of William Sharpe's theory of returns-based style analysis. Returns-based style analysis assists in identifying investment style without examining the individual security holdings of a portfolio. StyleADVISOR regresses the historical returns of the individual manager(s) against different style indices to identify the pattern of returns that the fund is most closely correlated to. SSB does not recommend the use of returns-based style analysis without the supporting fundamental research of the fund (research attribution reports). The underlying data is believed to be reliable but accuracy and completeness cannot be assured. While the historical rates of return described in this report are believed to accurately reflect the overall nature of the portfolio, the constituent securities have not been reviewed. This evaluation is for informational purposes only and is not intended to be an offer, solicitation or recommendation with respect to the purchase or sale of any security or a recommendation of the services provided by any money management organization. Past results are not necessarily indicative of future performance. Investors should consider the investment objectives, risks, charges, fees and expenses of the mutual fund carefully before investing. The prospectus contains more complete information about these factors and other information about the investment company. Read the prospectus carefully before you invest.
Analysis Disclosure
102

CAL POLY POMONA FOUNDATION, INC.
POLICIES AND PROCEDURES Subject:
Endowment Investment
Policy No.
130
Policy Old No.: 1991-1 Date: 04/25/91 Reference: 229-III-A; 230-II-C; 275-II-D Revision: 05/29/96; 09/04/96; 277-IV-C; 300-II-D; 348-III-E; 12/19/00, 09/27/11 350-III-B; 357-III-D 02/13/12, 11/13/13
PURPOSE AND INTENTION The purpose of this statement is to establish a clear understanding between the Cal Poly Pomona Foundation (Foundation) and their Investment Managers regarding investment objectives and policy guidelines.
OBJECTIVE The Foundation monitors and forecasts expenditures and revenues, thus enabling the Foundation to invest funds to the fullest extent possible. The Foundation attempts to obtain the highest return available, while investments meet the criteria established for safety (preservation of capital), return and liquidity.
A. SAFETY Safety of principal within the context of positioning the portfolio to have a reasonable probability of achieving the targeted returns noted in this policy is the foremost objective of the Foundation. Management of the portfolio shall be undertaken with the objective of minimizing the opportunity for loss of capital with the understanding that a degree of risk must be accepted for the portfolio to achieve the return objectives in both absolute and relative terms. The achievement of a positive risk-adjusted return is dependent upon proper design and execution of the investment strategy. In managing the portfolio, the Foundation shall be cognizant of two types of risk: credit risk and market risk.
1. Credit Risk or the risk of loss due to failure of the issuer, is managed by proper due diligence prior to investing and on an ongoing basis, and diversifying the investment portfolio so the failure of any one issuer would not materially affect the performance of the portfolio.
2. Market Risk is the risk of investment value fluctuation due to changes in the general level of interest rates or the issuer’s individual or industry sector performance. This risk shall be managed by limiting the average duration of the fixed income portion of the Foundation’s investment portfolio to five years and the maximum duration of any one security to ten years, with the exception of Mortgage-Backed Securities (MBS), the maximum maturity of which shall be limited to 30 years. Market risk shall also be mitigated by structuring the portfolio so fixed income securities maturing match cash outflows, eliminating the need to sell securities prior to their maturity. With respect to the equity portion of the portfolio, market risk is managed by due diligence in selecting and monitoring investees as well as diversification by company and by industry sector. It is recognized that within a diversified portfolio, occasional measured losses are inevitable and must be considered within the context of the overall return on the investment.
B. RETURN ON INVESTMENT The Foundation’s endowment investment portfolio shall be designed to attain or exceed a target rate of return throughout economic cycles consistent with risk limitations and prudent investment principles. The target rate of return shall be measured in “absolute”, “relative” and “comparative” terms as determined from time-to-time, by the Investment Committee. See Section IX of this Endowment Investment Policy.
C. LIQUIDITY The Foundation’s endowment investment portfolio will remain satisfactorily liquid to enable the Foundation to meet anticipated operating and cash flow requirements. Historical and cash flow needs are to be analyzed continuously.
103

SCOPE The funds identified in this section and entrusted to the Foundation will be pooled in an actively managed portfolio. The Foundation shall oversee management of the portfolio within the content of the "Uniform Prudent Management Investment Funds Act of 2008" which states:
“. . .each person responsible for managing and investing an institutional fund shall manage and invest the fund in good faith and with the care an ordinarily prudent person in a like position would exercise under similar circumstances. “
DELEGATION & GRANTS OF AUTHORITY Responsibility for the investment program has been delegated by the Foundation Board of Directors to the Investment Committee. It is the responsibility of the Investment Committee, in concert with the authorized investment manager and/or advisor, to monitor and adjust from time to time, the target weighting within the asset allocation ranges allowed per the Target Asset Mix Table, (see section VIII – Performance Evaluation). Any changes to the target weighting within the asset allocation ranges will be reported to the full Foundation Board at its next regularly scheduled meeting. A report on portfolio performance will be provided to the full Foundation Board at each regularly scheduled Board meeting.
ETHICS AND CONFLICT OF INTEREST All Foundation Board members and investment personnel including family members shall refrain from personal business activity which could create a conflict in fact or in appearance with proper execution of the investment program, or which could impair their ability to execute impartial investment decisions. All such personnel shall disclose to the Executive Director any material financial interests in financial institutions which conduct business within the jurisdiction and shall disclose any material financial investment positions which could be related in a conflicting manner to the performance of the FOUNDATION's endowment investment portfolio. The Executive Director shall report in writing to the full Board at least annually all issues, which could influence the performance of the Foundation's endowment investments.
CRITERIA FOR SELECTION OF INVESTMENT MANAGERS In order to retain investment management organizations that have demonstrated competence in executing one or more investment strategies consistent with the established policy, the following criteria will be applied in retaining existing firms and selecting new investment managers:
A. Demonstrated performance in one or more of the asset categories defined in section VIIIC. B. A sound research program; C. A disciplined consistent and measurable approach to the construction and monitoring of portfolios; D. Established investment control procedures with operating management information to assure regular review of the portfolio manager’s decisions; E. Ability to trade at the lowest competitive rates and consistently secure best price execution; F. Primary business purpose will be investment management and will have sufficient experience with educational endowment assets; G. Demonstrated ability to manage its affairs in a businesslike manner and with a high degree of financial stability; H. An experienced, highly competent professional staff, recognized as such within the industry. Continuity of such personnel will be considered; I. No conflict of interest with the policy, objectives, or organization of the investment portfolio nor any conflict which would interfere with prudent management of the portfolio’s assets; J. Capability to report accounting and performance data in a timely manner; K. Competitive fee structure.
104

AUTHORIZED INVESTMENT ADVISORS All custodians, investment advisors and brokers who perform investment transactions for the FOUNDATION must supply the Executive Director with the following:
A. Annual audited financial statements* B. Proof of National Association of Security Dealers certification** C. Proof of registration with the SEC and a copy of their ADVII*** D. Completed broker/dealer questionnaires E. Certificate of reviewing and understanding the FOUNDATION's Endowment Investment Policy F. Certificate of understanding the delivery versus payment instructions for custody G. Conflict of interest certification/statement
* Custodians and brokers only ** Brokers only *** Investment advisors only
VIII. PERFORMANCE EVALUATION Performance will be reviewed for purposes of determining adherence to appropriate risk levels, and for comparison of returns to the established objectives and specific goals.
It is recognized that investment results can fluctuate through market cycles. Achievement of total rate of return within the risk levels identified will be the primary basis upon which to evaluate manager performance. Each manager’s portfolio will be monitored quarterly by the Investment Committee. A comprehensive annual report from the Committee will be presented to the full Board of Directors. Update reports will be made to the Board of Directors by the Committee Chair quarterly.
ENDOWMENT FUND
A. RETURN OBJECTIVE The purpose of the Endowment Fund is to support the University and its mission over the long term. Accordingly, the purpose of this statement is to establish a written procedure for the investment of the Endowment’s assets, and to ensure that the future growth of the Endowment is sufficient to offset normal inflation plus reasonable spending, thereby preserving the constant dollar value and purchasing power of the Endowment. This statement will establish appropriate risk and return objectives in light of the fund’s risk tolerance and investment time horizon. These objectives, as well as asset allocation guidelines and suitable investments are outlined below.
The return objectives of the Endowment Fund shall be viewed from three perspectives as follows: Absolute - Real (i.e., net of inflation) rate-of-return Relative - Time-weighted rates of return versus capital market indices; and Comparative - Performance of the Investment Manager(s) as compared to a universe of similar investment funds.
1. The Absolute Objective of the Endowment Fund is to seek an average total annual return of 5.0% plus the percentage change in the greater Los Angeles area CPI. This objective shall be measured over rolling one, three, five and ten year time periods; The intent of this objective is to measure, over time, the return on the portfolio as measured in, inflation adjusted terms.
2. The Relative Objective of the Endowment Fund is to seek competitive investment performance versus appropriate capital market benchmarks or indices. This objective shall be measured primarily by comparing investment results over an annualized year-to-date, one, three, five and ten year time periods, to:
a) The Russell 3000 Index as a benchmark for the Domestic Equity component; b) The MSCI EAFE Index (in US dollars) for the International Equity component; c) The Barclays Aggregate Bond Index as a benchmark for the Fixed Income component; d) The 90-Day Treasury Bill Index as the benchmark for the Cash and Equivalent component. e) A comparable Index for the Real Assets component. f) A comparable REIT Index for Real Estate component.
105

3. The Comparative performance objective of the Endowment Fund is to achieve a total rate of return that is above the median performance of universe of similar endowments.
The endowment and quasi-endowment assets have a long-term, indefinite time horizon that runs concurrent with the endurance of the institution, in perpetuity. As such, these funds can assume a time horizon that extends well beyond a normal market cycle, and can assume an above-average level of return volatility (as measured by the standard deviation of annual returns) in exchange for an expected higher level of returns over the longer time horizon. It is expected, however, that both professional management and sufficient portfolio diversification will smooth volatility and help to assure a reasonable consistency of return.
B. TARGET ASSET ALLOCATION To achieve its return objectives, the Endowment Fund shall be allocated among a number of asset classes. These asset classes may include: domestic equity, domestic fixed income, international (developed and emerging) equity, international fixed income, real estate, real assets, hedge funds and cash. These asset classes may also include global funds where the manager is allowed to choose the weighting between domestic and international securities. The purpose of allocating among asset classes is to ensure the proper level of diversification within the Endowment Fund. It is understood that endowments may temporarily be placed in a cash equivalent account prior to investing in longer term instruments.
The following Target Asset Mix Table defines the Endowment Fund’s target asset allocation.
Target Asset Mix Table
Asset Class Equities
Range Target Wt. Representative Index
Domestic 20 – 50% 30% Russell 3000 International 15 – 35% 30%
Developed MSCI EAFE Emerging MSCI Emerging
Fixed Income incl. MBS (Domestic and International) 20-50% 30% Barclay Aggregate
Cash Equivalents 0-20% 0% 90-Day Treasury Rate Real Estate 0–10% 0% Comparable Index Real Assets 0-10% 10% Comparable Index Hedge Funds 0-20% 0% Comparable Index
No more than 5 percent of the asset class may be invested in any single equity or fixed income issuer, with the exception of U.S. Treasury and Agency securities.
Exposure to any industry sector shall generally be limited to 20 percent of the asset class. This sector limitation is applicable to both debt and equity.
* All limitations expressed on a market value basis.
The general policy shall be to diversify investments among both equity and fixed income securities so as to provide a balance that will enhance total return while avoiding undue risk concentration in any single asset class or investment category.
Investments (both debt and equity) in international (developed/emerging) issues shall be U.S. dollar denominated or appropriately hedged so as to eliminate fluctuations in value attributable to changes in currency exchange rates.
106

C. ACCEPTABLE INSTRUMENTS 1. Money Market Funds 2. Certificates of Deposit 3. Common and Preferred Stocks 4. U.S. Government or Government Agency Obligations, 5. Mortgage Backed Securities 6. Corporate Debt 7. Repurchase Agreements 8. Mutual Funds (Debt or Equity) 9. Real Estate Investment Trusts 10. Real Assets 11. Hedge Funds
With respect to the above listed investments, the following limitations will apply:
• Money Market Funds including the Local Agency Investment Fund (LAIF). No more than 5% of the market value of the total portfolio may be invested in any fund. All funds utilized must be pre-approved by the Investment Committee.
• Certificates of Deposit. Investments in certificates of deposit in any insured bank or savings institution shall be limited to the FDIC insurance maximum.
• Common and Preferred Stocks. No more than 5% of the total market value of the asset class may be invested in any single stock.
• No more than 20% of the market value of the asset class may be invested in the obligations of any U.S. Government Agency.
• U.S. Government or U.S. Government Agency Obligations. There is no limitation within the asset class as to the percentage of the portfolio, which can be invested in U.S. Government obligations.
• Mortgage Backed Securities. All investments in MBS shall be U.S. Agency guaranteed (e.g. GNMA, FNMA, FHLMC). No more than 5% of the total market value of the asset class may be invested in any single security and no more than 20% of the total market value of the asset class may be invested in MBS issued by any U.S. Agency.
• Corporate Debt, including Commercial Paper. No more than 5% of the market value of the asset class may be invested in debt issued by any domestic or international corporation. Corporate debt must carry an investment grade rating by at least two of three rating agencies (i.e. Moody, S&P and Fitch) at time of purchase. Rating downgrades subsequent to purchase shall be managed on a case-by-case basis. This policy authorizes investment of up to 10% of the market value of the asset class in non- investment grade debt provided that all such investments shall be made through mutual funds so as to diversify risk. The average credit rating of the total asset class shall be maintained at AA or above.
• Repurchase Agreements. The Foundation may invest in repurchase agreements with banks and Primary Dealers in U.S. Government Securities with which the Foundation has entered into a Public Securities Association (PSA) repurchase contract, which specifies terms and conditions of repurchase agreements. The maturity of repurchase agreements shall not exceed 30 days. The market value of securities used as collateral for repurchase agreements shall be monitored daily by the Foundation's staff and will not be allowed to fall below 102% of the value of the repurchase agreement. Repurchase agreements cannot exceed 20 percent of the total market value of the asset class.
• Mutual Funds. For purposes of this Policy, mutual funds shall be considered and treated as investments in common and preferred stocks and bonds and therefore subject to the same limitations.
• Real Estate. Investments in real estate shall be limited to securities (e.g. REITs) for which there is a ready and active market.
107

• Real Assets. Investments in public/private real estate, natural resources, commodities, infrastructure, timber and inflation linked securities (TIPS).
• Hedge Funds. Investments in hedge funds shall be limited to funds approved by the investment advisor. • The Foundation will not directly invest in stocks of the top 200 fossil fuel companies, by carbon in proven oil, gas and coal reserves. Although it may hold some fossil fuel stocks in commingled funds or mutual funds.
D. REBALANCING The Investment Committee, and its investment advisors, on an ongoing basis and in accordance with market fluctuations, shall rebalance the investment portfolio so it remains within 5 percentage points of the ranges of targeted asset allocations, and the planned distribution among investment managers.
Formal asset allocation studies will be conducted at least every two years, with annual evaluations of the validity of the adopted asset allocation. The asset allocation study is contained in Appendix A of this policy.
X. QUASI-ENDOWMENT FUND The purpose of the Quasi-Endowment Fund is to support the University and its mission over the term of the quasi-endowment. This fund is to be managed in accordance with the investment parameters, acceptable instruments, and guidelines set forth in Section IX, of this Policy.
XI. ENDOWMENT INVESTMENT POLICY REVIEW This Statement of Endowment Investment Policy shall be reviewed by the Investment Committee at least annually to ensure consistency with the overall objectives of the portfolio. The Statement of Endowment Investment Policy shall also be reviewed annually to ensure its compliance and relevance to the current law, financial and economic trends, and to meet the cash flow requirements of the Foundation. Investment operations are reviewed monthly by the Foundation staff during the reconciliation process of investment transactions to the third party statements and the proof of cash process. The investment portfolio is audited annually by the Foundation’s independent accountants.
108

Memorandum
Date: August 25, 2014
To: Investment CommitteeCal Poly Pomona Foundation, Inc.
From: G. Paul StoreyExecutive Director
Cal Poly Pomona
foundation
Subject: ENDOWMENT EARNINGS DISTRIBUTION 2014-15
On an annual basis, the performance of the endowment portfolio and the values of theundistributed earnings are reviewed to determine if there are funds available for anendowment distribution per the Administration of Program, Scholarship and EndowmentFunds Policy # 133, please see attached for further details. Please keep in mind, someendowments may have terms and conditions that take precedence over this policy andaccordingly the following recommendation will include such terms and conditions.
Upon review of the performance of the endowment portfolio and the values of theundistributed earnings, Foundation management is proposing an endowment distribution of$4,330,892 or 5.00% comprised of the lessor of 5% of the endowment value (corpus plusundistributed earnings) or the undistributed earnings value as of June 30, 2014 subject to anyendowment terms and conditions that would take precedence as follows:
Propose a distribution of $819,509 to 236 scholarship endowment operatingaccounts.
Propose a distribution of $1,535,775 to 97 program endowment operatingaccounts.
Propose a distribution of $1,975,608 (less $50,000 for administration) from theKellogg Foundation Legacy endowment per the terms and conditions of thegrant.
Now therefore be it resolved that the Investment Committee approves an endowmentdistribution proposal by Foundation management of a net distribution of $4,280,892 to 236scholarship endowment operating accounts, 97 program endowment operating accounts andthe Kellogg Foundation Legacy endowment operating account and $50,000 administration bepresented to the Board of Directors at their next regularly scheduled meeting for review andconsideration for approval.
PASSED ANDADOPT
By:
DAY OF SEPTEMBER 2014
omas M. Goff, ChairInvestment Committee
109
Date:
To:
From:
Memorandum
August 25,2014
Investment CommitteeCal Poly Pomona Foundation, Inc.
{il /\ ..,EP^%f*-
G. Paul Storey {Executive Director
Subject: ENDOWMENTEARN|NGSD|STR|BUT|ON2Ol4-15
On an annual basis, the performance of the endowment portfolio and the values of theundistributed earnings are reviewed to determine if there are funds available for anendowment distribution per the Administration of Program, Scholarship and EndowmentFunds Policy # 133, please see attached for further details. Please keep in mind, someendowments may have terms and conditions that take precedence ovei this policy andaccordingly the following recommendation will include such terms and conditions.
Upon review of the performance of the endowment portfolio and the values of theundistributed earnings, Foundation management is proposing an endowment distribution of$4,330,892 or 5'O0o/o comprised of the lessor of 5% oi tfre Lndowment value (corpus plusundistributed earnings) or the undistributed earnings value as of June 30, ZOf + suU;ect to'an'endowment terms and conditions that would take frecedence as follows:
. Propose a distribution of $g19,509 to 236 scholarship endowment operatingaccounts.
. Propose a distribution of $1,535,775 to 97 program endowment operatingaccounts.
. Propose a distribution of $1,975,60g (less $50,000 for administration) from theKellogg Foundation Legacy endowment per the terms and conditions of thegrant.
Now therefore be it resolved that the Investment Committee approves an endowmentdistribution proposal by Foundation management of a net distribution of $4,2g0,ggf io zloscholarship endowm.ent operating accounts, 9z program endowment operating accounts andthe Kellogg Foundation Legacy endowment opeiatirig account and $50,000 administration bepresented to the Board of Directors at their next regularly scheduled meeting for review andconsideration for approval.
PASSED AND
M. Goff, Chair
gd Fdf Pnnnnr
frundalion
By:
Investment Committee
DAY OF SEPTEMBER 2014

(8,000,000)
(6,000,000)
(4,000,000)
(2,000,000)
-
2,000,000
4,000,000
6,000,000
8,000,000
10,000,000
12,000,000
14,000,000
Endowment Distributions
DistributionsEarnings
4.72% 4.08% 4.19% 4.73% 2.88%
4.83%
Proposed 5.00%
4.89%
3.42%
110

-
10,000,000
20,000,000
30,000,000
40,000,000
50,000,000
60,000,000
70,000,000
80,000,000
90,000,000
100,000,000
Endowment Corpus and Total Value
Corpus Total Value
111

CAL POLY POMONA FOUNDATION, INC.
POLICIES AND PROCEDURES
Subject: Administration of Program, Scholarship Policy No. 133
and Endowment Funds Old No. 1996-3 Reference: 283-II-C, 301-II-D, 320-III-A, 333-III-B Date: 10/01/97 350-III-B Revision: 02/27/01, Replaces: 1973-4, 1992-1 02/17/05, 11/15/07 02/13/12 PURPOSE To provide guidance for the administration of Program, Scholarship and Endowment Funds. The recovery of administrative costs represented by this policy include a Foundation “gift of support” equivalent to 25% of the Foundation’s estimated administrative cost for maintaining Foundation program, scholarship, endowment/endowment operating accounts. POLICY The yield, mark-to-market and fees assessed will be determined by the type of funds. It is understood that donated funds may contain terms and conditions that take precedence over this policy. Foundation Program Funds - represent funds invested by the Foundation per the General Investment Policy # 131 in support of University activities. 1. Yield will be allocated quarterly on the average daily balance of the respective account. 2. The yield is the weighted average yield (coupon rate of the security plus or minus the
amortization or accretion of any premium or discount) of the interest bearing securities and cash equivalents in the General Investment Portfolio less an annual investment administrative fee of 0.50% basis points to provide support to the general fund of the Foundation.
3. An administrative fee of 2.55% will be assessed on all expenditures processed, including
transfer of funds, payroll and accounts payable disbursements to provide support to the general fund of the Foundation. The maximum administrative fee per transaction is $2,550.
4. All donations will be assessed a fee of 5%. Scholarships Funds - represent funds invested by the Foundation per the General Investment Policy # 131 that are restricted only for the distribution of scholarships. 1. Yield will be allocated quarterly on the average daily balance of the respective account.
2. The yield is the weighted average yield (coupon rate plus or minus the amortization or accretion
of any premium or discount) of the interest bearing securities and cash equivalents in the
112

Policy No. 133 Subject: Administration of Program, Scholarship and Endowment Funds Page 2
General Investment Portfolio less an annual investment administrative fee of 0.50% basis points to provide support to the general fund of the Foundation.
3. An administrative fee of 0.0% will be assessed on all expenditures processed, including transfer
of funds, payroll and accounts payable disbursements.
4. All donations will be assessed a fee of 5%. Endowment Funds - represent funds invested per the Foundation Endowment Investment Policy 130. 1. It is the Foundation’s goal to distribute annually a minimum net return of 5% of endowment
value as established on June 30th. Earnings for the fiscal year in excess of the Consumer Price Index (CPI) for the Los Angeles area, as reported in July for the prior 12 months, and in excess of 5% endowment value, may also be distributed. Endowment earnings shall generally be available for distribution from those endowments invested for no less than three (3) consecutive months. Exceptions may be authorized per approval by the Executive Director or his/her designee and the Board of Directors. Endowment earning distribution will occur in the first quarter of each fiscal year based upon the percentage of the endowment value and or an amount as approved by the Board.
2. Endowment scholarship funds with little or no earnings are eligible for an interest free loan up to 5% of the endowment value at June 30th upon approval by the Board. Loans are to be repaid within 3 years to the General Fund from future scholarship endowment earning distributions.
3. The endowment funds will be assessed an annual administrative fee of seventy-five basis points
(0.75%). If the annual earnings are less than 0.75%, fees will first be recovered from prior undistributed earnings and if no available prior year earnings, then from corpus.
4. All donations will be assessed a fee of 5%. Endowment Operating Funds - represent funds invested by the Foundation per the General Investment Policy 131. 1. Yield will be paid quarterly on the average daily balance of the respective account. 2. The yield is the weighted average yield (coupon rate of the security plus or minus the amortization
or accretion of any premium or discount) of the interest bearing securities and cash equivalents in the General Investment Portfolio less an annual investment administrative fee of 0.50% basis points to provide support to the general fund of the Foundation.
3. An administrative fee of 2.55% will be assessed on all expenditures processed, including transfer of
funds, payroll and accounts payable disbursements to provide support the general fund of the Foundation. The maximum administrative fee per transaction is $2,550.
4. All donations will be assessed a fee of 5%.
113

Cal Poly Pomona
Foundation
Memorandum
Date: September 2, 2014
To: Investment Committee
Cal Poly Pomona Foundation, Inc. From: David F. Prenovost
Senior Managing Director/CFO Subject: ASSET ALLOCATION – PIMCO LOW DURATION
As you may recall from our last meeting, we discussed and requested a review and analysis from Andrew Price, Executive Director Graystone Consulting, of the asset allocation to PIMCO Low Duration funds in the general investment portfolio for your consideration. As you may know, the General Investment Policy # 131 allows for no more than 5% of the asset class may be invested in any single equity or fixed income issuer, excluding U.S. Treasury Securities, U.S. Government Agency Securities and Mortgage Back Securities, at time of purchase, please see the enclosed policy for further reference. Following is Andrew’s review and analysis for your consideration.
114

CAL POLY POMONA FOUNDATION, INC.
POLICIES AND PROCEDURES
Subject: General Investment Policy Policy No. 131 Old No. 1994-2
Reference: 263-II-B, 273-II-B; 300-II-D; 311-II-A; Date: 12/09/94 320-III-B; 329-III-D;337-III-A-2;348-III-F, Revision: 03/07/96; 12/19/00; 354-III-C; 357-III-E; 358-III-F 02/18/03; 02/17/05;
02/22/07; 11/17/08; 09/27/11; 02/20/13 11/13/13; 02/20/14
I. POLICY
This Statement of Investment Policy is intended to provide guidelines for the prudent investment of the Foundation's (see Scope, Section III) general investment portfolio and outline the policies for maximizing the effectiveness and efficiency of the Cal Poly Pomona Foundation, Inc. ("Foundation") investment management program. The goal of this general investment policy is twofold, one is to enhance the economic status of the Foundation while preserving its capital resources; the second is to establish a clear understanding between the Foundation and their Investment Manager(s) regarding investment objectives and policy guidelines. The Foundation's general Investment Policy is to be governed by Sections 5210 and 5231 of the California Corporations Code, and California Probate Code Section 18500 et seq. (Uniform Prudent Management of Institutional Funds Act).
II. OBJECTIVE
The Foundation's investment management program is designed to monitor and forecast expenditures and revenues, thus enabling the Foundation to invest its asset portfolio to the fullest extent possible. The Foundation attempts to obtain the highest yield available, while investments meet the criteria established for safety (preservation of capital), liquidity and yield.
A. SAFETY
Asset portfolio safety is the foremost objective of the Foundation. Each investment transaction shall seek to ensure portfolio losses are avoided, whether from securities default, rating downgrades, broker/dealer defaults, or erosion of market value. Cal Poly Pomona Foundation, Inc. shall seek the preservation of its portfolio by managing two types of risk: credit risk and market risk.
1. Credit Risk - is the risk of loss due to failure of the issuer and is managed
by proper due diligence prior to investing and on an ongoing basis, and diversifying the general investment portfolio so the failure of any one issuer would not materially affect the cash flow of the Foundation.
115

Policy No. Subject: Page 2
131 General Investment Policy
2. Market Risk - is the risk of investment value fluctuations due to changes
in the general level of interest rates or the issuer’s individual or industry sector performance. This risk shall be managed by limiting the average maturity of the fixed income portion of the Foundation's g e n e r a l investment portfolio to five years and the maximum maturity of any one security to ten years, with the exception of Mortgage-Backed Securities (MBS), the maximum maturity of which shall be limited to thirty years. Market risk shall also be managed by structuring the portfolio so fixed income securities maturing match cash outflows, eliminating the need to sell securities prior to their maturity. It is recognized that within a diversified portfolio, occasional measured losses are inevitable and must be considered within the context of the overall return on the investment.
B. RETURN ON INVESTMENT
The Foundation’s g e n e r a l investment portfolio shall be designed to attain or exceed a target rate of return throughout economic cycles consistent with risk limitations and prudent investment principles. The target rate of return shall be measured in “absolute”, “relative” and “comparative” terms as determined by the Investment Committee. See Performance Evaluation Section VIII of this Genera l Investment Policy for further details.
C. LIQUIDITY
Cal Poly Pomona Foundation, Inc.'s general investment portfolio will remain satisfactorily liquid to enable the Foundation to meet anticipated operating and cash flow requirements. Historical and cash flow needs are to be analyzed continuously.
III. SCOPE
The funds identified in this section and entrusted to the Foundation will be pooled in an actively managed portfolio. The Foundation shall oversee management of the portfolio within the content of the "Uniform Prudent Management Investment Funds Act of 2008" section 18503 (b) which states:
"…each person responsible for managing and investing an institutional fund shall manage and invest the fund in good faith and with the care an ordinarily prudent person in a like position would exercise under similar circumstances."
This policy is applicable, but not limited to all funds listed below:
• General Fund • Sponsored Programs Fund • Designated Fund • Enterprise Fund • Agricultural-Aid-To-Instruction Fund • Campus Program Fund • Scholarship Fund • Continuing Education Fund • Real Estate Fund
116

Policy No. Subject: Page 3
131 General Investment Policy
IV. DELEGATION AND GRANTS OF AUTHORITY
Responsibility for the investment program has been delegated by the Foundation Board of Directors to the Investment Committee, in concert with the authorized investment manager and/or advisor, to monitor and adjust from time to time, the target weighting within the asset allocation ranges allowed per the Target Asset Mix Table, (see section VIII – Performance Evaluation). Any changes to the target weighting within the asset allocation ranges will be reported to the full Foundation Board at its next regularly scheduled meeting. A report on portfolio performance will be provided to the full Foundation Board on a quarterly basis at a regularly scheduled Board meeting.
The authority to execute investment transactions affecting the Foundation's portfolio shall be under the general direction of the Executive Director and the CFO.
V. ETHICS AND CONFLICT OF INTEREST
All Foundation Board members and investment personnel including family members shall refrain from personal business activity which could create a conflict in fact or in appearance with proper execution of the investment program, or which could impair their ability to execute impartial investment decisions. All such personnel shall disclose to the Executive Director any material financial interests in financial institutions which conduct business within the jurisdiction and shall disclose any material financial investment positions which could be related in a conflicting manner to the performance of the Foundation's g e n e r a l investment portfolio. The Executive Director shall report in writing to the full Board at least annually all issues, which could influence the performance of the Foundation's investments.
VI. CRITERIA FOR SELECTION OF INVESTMENT MANAGERS
In order to retain investment management organizations that have demonstrated competence in executing one or more investment strategies consistent with the established policy, the following criteria will be applied in retaining existing firms and selecting new investment managers:
A. Demonstrated performance in one or more of the asset categories defined in
sections X.
B. A sound research program;
C. A disciplined consistent and measurable approach to the construction and monitoring of portfolios;
D. Established investment control procedures with operating management
information to assure regular review of the portfolio manager’s decisions;
E. Ability to trade at the competitive rates and consistently secure best price execution;
F. Primary business purpose will be investment management and will have
sufficient experience with educational investment assets;
117

Policy No. Subject: Page 4
131 General Investment Policy
G. Demonstrated ability to manage its affairs in a businesslike manner and with a high degree of financial stability;
H. An experienced, highly competent professional staff, recognized as such within
the industry. Continuity of such personnel will be considered;
I. No conflict of interest with the policy, objectives, or organization of the investment portfolio nor any conflict which would interfere with prudent management of the portfolio’s assets;
J. Capability to report accounting and performance data in a timely manner;
K. Competitive fee structure.
VII. AUTHORIZED FINANCIAL DEALERS AND INSTITUTIONS
The Foundation shall transact business only with banks, savings and loan institutions and registered investment securities dealers. The dealers should be primary dealers authorized to buy and sell government securities in direct dealings with the Federal Reserve Bank of New York and qualify under the U.S. Securities and Exchange Commission Rule 15C3-1 (uniform net capital rule).
The CFO shall send a copy of the current statement of investment policy to all dealers approved to do business with the Foundation. Confirmation of the dealer's understanding of the Foundation's genera l investment policy shall be provided in writing by the dealer.
The CFO shall examine financial institutions which wish to perform business with the Foundation, in order to confirm whether the participating financial institutions are satisfactorily capitalized, are market makers in securities appropriate to the Foundation's financial investment universe and agree to comply by the conditions set forth in this General Investment Policy.
Any authorized investments (contained in Section X) can be purchased directly from the issuer.
All financial institutions and broker/dealers who qualify to perform investment transactions for the Foundation must supply the CFO the following:
A. Audited financial statements*
B. Proof of National Association of Security Dealers certification**
C. Proof of registration with the SEC and a copy of their ADVII***
D. Proof of state registration
E. Completed broker/dealer questionnaires
F. Certificate of reviewing and understanding the Cal Poly Pomona Foundation, Inc.'s general investment policy
118

Policy No. Subject: Page 5
131 General Investment Policy
G. Certificate of understanding the delivery versus payment instructions for custody
H. Conflict of interest certification statement
* Custodians and brokers only ** Brokers only *** Investment advisors only
A review of the financial condition and registration of the qualified broker/dealers and other bidders will be conducted by the CFO at least every three (3) years. This review shall be reported to the Investment Committee as an "information item only."
VIII. PERFORMANCE EVALUATION
Performance will be reviewed for purposes of determining adherence to appropriate risk levels, and for comparison of returns to the established objectives and specific goals.
It is recognized that investment results can fluctuate through market cycles. Achievement of total rate of return within the risk levels identified will be the primary basis upon which to evaluate manager performance. Each manager’s portfolio will be monitored and reported quarterly to the Investment Committee. A comprehensive quarterly report accepted by the Investment Committee will be presented to the full Board of Directors.
IX. RETURN OBJECTIVE
The purpose of the Foundation’s general investment portfolio is to support the University and its mission over the long term. Accordingly, the purpose of this statement is to establish a written procedure for the investment of the Foundation’s general investment portfolio to ensure that the future growth of the portfolio is sufficient to offset normal inflation plus reasonable spending, thereby preserving the constant dollar value and purchasing power of the portfolio. This statement will establish appropriate risk and return objectives in light of the fund’s risk tolerance and investment time horizon. These objectives, as well as asset allocation guidelines and suitable investments are outlined below.
The return objectives of the Foundation’s general investment portfolio shall be viewed from three perspectives as follows: Absolute - Real (i.e., net of inflation) rate-of-return Relative - Time-weighted rates of return versus capital market indices; and Comparative - Performance of the Investment Manager(s) as compared to a universe of similar investment funds.
1. The Absolute Objective of the Foundation’s general investment portfolio is to
seek an average total annual return of 2.0% plus the percentage change in the greater Higher Education Price Index (HEPI). This objective shall be measured over rolling one, three, five and ten year time periods; The intent of this objective is to measure, over time, the return on the portfolio as measured in inflation adjusted terms.
119
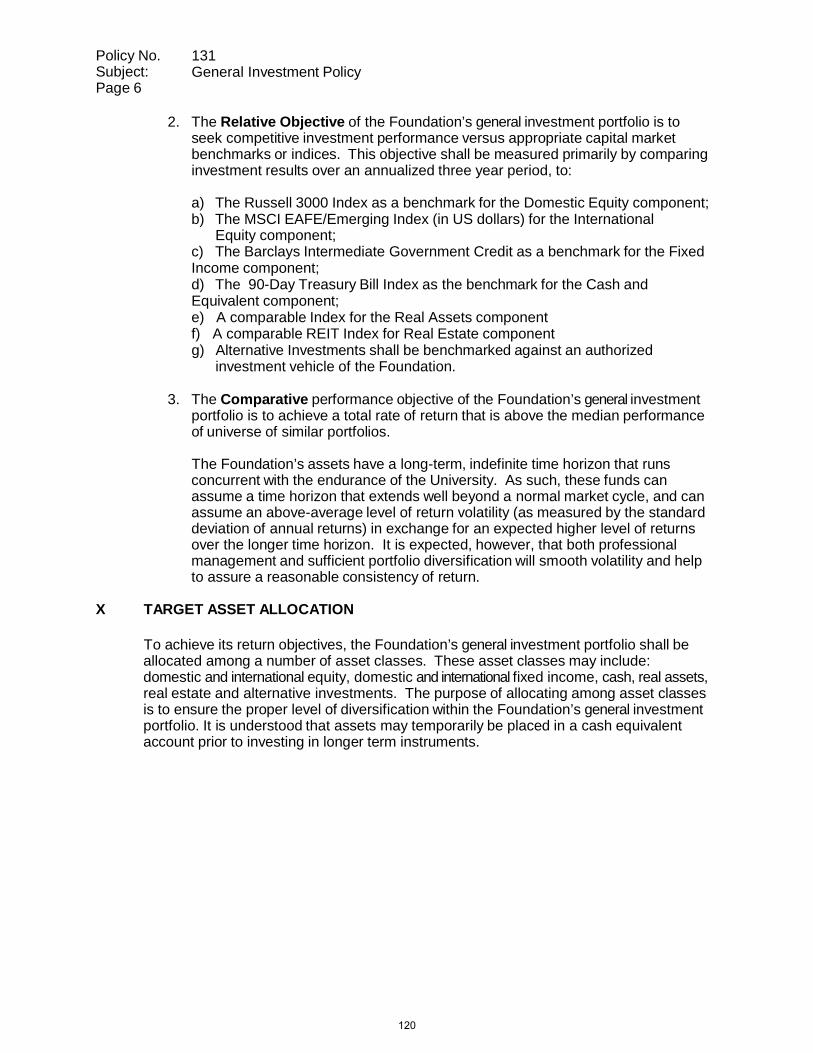
Policy No. Subject: Page 6
131 General Investment Policy
2. The Relative Objective of the Foundation’s general investment portfolio is to
seek competitive investment performance versus appropriate capital market benchmarks or indices. This objective shall be measured primarily by comparing investment results over an annualized three year period, to:
a) The Russell 3000 Index as a benchmark for the Domestic Equity component; b) The MSCI EAFE/Emerging Index (in US dollars) for the International
Equity component; c) The Barclays Intermediate Government Credit as a benchmark for the Fixed Income component; d) The 90-Day Treasury Bill Index as the benchmark for the Cash and Equivalent component; e) A comparable Index for the Real Assets component f) A comparable REIT Index for Real Estate component g) Alternative Investments shall be benchmarked against an authorized
investment vehicle of the Foundation.
3. The Comparative performance objective of the Foundation’s general investment portfolio is to achieve a total rate of return that is above the median performance of universe of similar portfolios.
The Foundation’s assets have a long-term, indefinite time horizon that runs concurrent with the endurance of the University. As such, these funds can assume a time horizon that extends well beyond a normal market cycle, and can assume an above-average level of return volatility (as measured by the standard deviation of annual returns) in exchange for an expected higher level of returns over the longer time horizon. It is expected, however, that both professional management and sufficient portfolio diversification will smooth volatility and help to assure a reasonable consistency of return.
X TARGET ASSET ALLOCATION
To achieve its return objectives, the Foundation’s general investment portfolio shall be allocated among a number of asset classes. These asset classes may include: domestic and international equity, domestic and international fixed income, cash, real assets, real estate and alternative investments. The purpose of allocating among asset classes is to ensure the proper level of diversification within the Foundation’s general investment portfolio. It is understood that assets may temporarily be placed in a cash equivalent account prior to investing in longer term instruments.
120

Policy No. Subject: Page 7
131 General Investment Policy
The following Target Asset Mix Table defines the Foundation’s general investment portfolio target asset allocation.
Target Asset Mix Table
Asset Class Equities
Range 10-65%
Target Wt. 23%
Representative Index
Domestic Russell 3000 International (Developed and Emerging) MSCI EAFE/Emerging Index
Fixed Income 40-85% 65% Barclays Intermediate Gov’t/Credit
Cash Equivalents 0-20% 0% 90-Day Treasury Rate Real Assets 0-10% 2% Comparable Index Real Estate 0-10% 0% Comparable REIT IndexAlternative Investments 0-25% 10% Authorized investment vehicle
No more than 5 percent of the asset class may be invested in any single equity or fixed income issuer, excluding U.S. Treasury Securities, U. S. Government Agency Securities and Mortgage Back Securities, at time of purchase.
Exposure to any industry sector shall generally be limited to 20 percent of the asset class, excluding U.S. Treasury Securities, U.S. Government Agency Securities and Mortgage Back Securities, at time of purchase. This sector limitation is applicable to both debt and equity.
All limitations expressed on a market value basis.
The general investment policy shall be to diversify investments among both assets classes so as to provide a balance that will enhance total return while avoiding undue risk concentration in any single asset class or investment category.
Investments in international issues shall be U.S. dollar denominated or appropriately hedged so as to eliminate fluctuations in value attributable to changes in currency exchange rates.
ACCEPTABLE INSTRUMENTS
1. Money Market Funds 2. Certificates of Deposit 3. U.S. Government or Government Agency Obligations, 4. International Bonds 5. Mortgage Backed Securities – Agency 6. Mortgage Backed Securities – Non-Agency 7. Corporate Debt 8. Repurchase Agreements 9. Mutual Funds (Debt or Equity) 10. Real Estate 11. Real Assets 12. Alternative Investments
With respect to the above listed investments, the following limitations will apply:
121

Policy No. Subject: Page 8
131 General Investment Policy
• Money Market Funds including the Local Agency Investment Fund (LAIF). No more than 5% of the market value of the total portfolio may be invested in any fund. All funds utilized must be pre-approved by the Finance Committee.
• Certificates of Deposit. Investments in certificates of deposit in any insured bank
or savings institution shall be limited to the FDIC insurance maximum.
• U.S. Government or U.S. Government Agency Obligations. There is no limitation within the asset class as to the percentage of the portfolio, which can be invested in U.S. Government obligations.
• International Bonds. These are debt securities issued by non-U.S. governments
and corporations.
• Mortgage Backed Securities – Agency. These are mortgage backed securities guaranteed by GNMA, FNMA and FHLMC. There is no limitation within the asset class as to the percentage of the portfolio, which can be invested in MBS.
• Mortgage Backed Securities – Non-Agency. These are issued by private
institutions (not by government or quasi-government agencies); their underlying collateral generally consists of mortgages which do not conform to the requirements for inclusion in mortgage-backed securities issued by agencies such as Ginnie Mae, Fannie Mae or Freddie Mac. Types of non-agency MBS include: Prime, Alternative-A, Option ARMs & Subprime.
• Corporate Debt, including Commercial Paper. No more than 5% of the market
value of the asset class may be invested in debt issued by any domestic or international corporation. Corporate debt must carry an investment grade rating by at least two of three rating agencies (i.e. Moody, S&P and Fitch) at time of purchase. In the case of securities where the rating is split between investment grade and non-investment grade, the higher rating shall define the quality of the security. Rating downgrades subsequent to purchase shall be managed on a case-by-case basis. This policy authorizes investment of up to 10% of the market value of the asset class in non-investment grade debt provided that all such investments shall be made through mutual funds so as to diversify risk. The average credit rating of the total asset class shall be maintained at AA or above.
• Repurchase Agreements. The Foundation may invest in repurchase agreements
with banks and Primary Dealers in U.S. Government Securities with which the Foundation has entered into a Public Securities Association (PSA) repurchase contract, which specifies terms and conditions of repurchase agreements. The maturity of repurchase agreements shall not exceed 30 days. The market value of securities used as collateral for repurchase agreements shall be monitored daily by the Foundation's staff and will not be allowed to fall below 102% of the value of the repurchase agreement. Repurchase agreements cannot exceed 20 percent of the total market value of the asset class.
• Mutual Funds. For purposes of this Policy, mutual funds shall be considered and
treated as investments in common and preferred stocks and therefore subject to the same limitations.
• Real Estate. I n v e s t m e n t s i n r e a l e s t a t e s h a l l b e l i m i t e d t o
s e c u r i t i e s ( e . g . R E I T s ) f o r w h i c h t h e r e i s a r e a d y a n d a c t i v e m a r k e t .
122

Policy No. Subject: Page 9
131 General Investment Policy
• Real Assets. Investments in public/private real estate, natural resources,
commodities, infrastructure, timber and inflation-linked securities (TIPS).
• Alternative Investments that meet the “mission of the University” for the benefit of the University and are authorized by Foundation Board resolution and supported by appropriate and documented “due diligence” analysis. The value of these alternative investments shall be benchmarked against an authorized investment vehicle of the Foundation. The target value of these investments will be 10% to 15% and the total value shall not exceed 25% of the portfolio. The alternative investments will diversify and reduce volatility of the portfolio.
• The Foundation will not directly invest in stocks of the top 200 fossil fuel companies,
by carbon in proven oil, gas and coal reserves, although it may hold some fossil fuel stocks in commingled funds or mutual funds.
XI. REBALANCING
The portfolio shall be rebalanced at least annually in accordance with market fluctuations, so it remains within ten (10) percentage points of the ranges of targeted asset allocations and the planned distribution among investment managers, keeping in mind that rebalancing is a function of expected returns, volatility, and return correlations of the portfolio. Rebalancing should also be weighed against the additional costs of frequent trading and internal resources.
Formal asset allocation studies will be conducted at least every three years, with evaluations of the validity of the adopted asset allocation.
XII. SAFEKEEPING AND CUSTODY AGREEMENTS
To protect against potential losses caused by collapse of individual securities dealers, all securities owned by the Foundation shall be kept in safekeeping by a third party bank trust department, acting as agent for the Foundation under the terms of a custody agreement or PSA agreement (Purchase Service Agreement). All securities will be received and delivered using standard delivery versus payment procedures with the Foundation's custodial bank and evidenced by safekeeping receipts. Custodial statements are reconciled monthly to transaction schedules.
XIII. INTERNAL CONTROLS
The CFO has developed a system of internal investment and accounting controls while establishing a segregation of responsibilities of investment functions to ensure an adequate system of internal controls over the investment function. The internal controls are identified in a separate document entitled "Investment Practices and Procedures" that identifies the responsibilities for safekeeping, record keeping and reconciliation of the investments and is reviewed annually by the Foundation’s independent accountants.
XIV. INVESTMENT POLICY REVIEW
This General Investment Policy shall be reviewed by the Investment Committee at least every three (3) years to ensure consistency with the overall objectives of the preservation of capital, liquidity and return of the investment portfolio. The General Investment Policy shall also be reviewed to ensure its compliance and relevance to the current law, financial and economic trends, and to meet the cash flow requirements of the Foundation. The general investment portfolio is audited annually by the Foundation's independent accountants for internal controls and balances.
123

Policy No. Subject: Page 10
131 General Investment Policy
Cal Poly Pomona Foundation
Investment Practices and Procedures
1. Is authorization for purchases and sales of investments and derivatives
vested with the governing board or other responsible committee or official? Are all investment and derivative transactions reviewed and approved
by the governing board? 2. Does a responsible official or investment committee determine that
investments and derivatives are of the type permitted by funding sources or donors and that the investment income and gains are used only for purposes authorized by laws, donors, or the governing board?
3. Are employees with investment responsibilities required to take vacations and are other employees required to perform those functions when an employee is absent?
Safekeeping 4. Are securities adequately protected, preferably in a safe, safety deposit
box, or on deposit with a trustee or financial institution? 5. Is it necessary for more than one person to authorize their release from
safekeeping or to have access to the safety deposit box? 6. Are such persons authorized by the governing board? 7. Are such persons bonded? 8. Are such persons prohibited from having access to the accounting
records? 9. Is access to computerized investment records limited to those with a
logical need for such access? 10. Are all securities held in the name of the nonprofit organization? Recordkeeping
11. Are detail records maintained that include the following information: Description of investment or derivative? Date of acquisition and purchase price (or fair market value at date of
donation)? Physical location of item; for example, safety deposit box, etc.? Interest/dividend/income rates and accrual/receipt dates? Restrictions on segregation or pooling and on disposition or use of
income or proceeds? Lapse date of any restrictions?
Yes No N/A CommentsX
X
X
X
X X
X
X
X X
X X
X
X
X
X
X
124

Policy No. Subject: Page 11
131 General Investment Policy
12. Are recordkeeping functions for securities and investment income
performed by employees who have no access to the securities, cannot authorize security transactions, and have no duties in the cash area?
13. As investment income is received, is it deposited in the proper bank
account, completely and accurately posted to the investment records, and posted on a timely basis?
14. Are schedules of investments showing all income received prepared monthly and reviewed by a responsible person?
15. Are investment earnings recorded in the proper class of net assets? 16. W ith respect to restricted investments:
Is physical segregation of any securities required? Are all acquisitions and disposals reviewed by the governing board and
approved for compliance with restrictions? Does the governing board review and determine the use of income
from investments and proceeds in compliance with any restrictions?
17. Are procedures adequate to identify, record, and segregate investments received under split-interest agreements?
Reconciliation
18. Are periodic surprise counts of evidence of ownership made and reconciled to detail records and other controls? Not really applicable – all investments held with brokers
19. Are periodic statements from outsiders or data resulting from
independent request by the governing board (such as broker’s position listing, etc.) promptly reconciled to detail records?
20. Is adequate physical control exercised over securities written down to zero?
Yes No N/A Comments
X
X
X
X X
X
X
X
X
X
X
ExecutiveDirector and Senior Managing Director/CFO both have to agree and sign for security decisions. This is done through the brokers. Senior Managing Director/CFO has access to the accounting records.
Investments are reconciled on a monthly basis and the Senior Managing Director/CFO reviews and the Executive Director approves them. There are no surprise counts.
125

11=
1
First Eagle - Global Fund - Manager AnalysisManager vs Benchmark: ReturnJuly 2004 - June 2014 (not annualized if less than 1 year)
251
20-
15
10
5-
o-YTD 1 year 3 years 5 years
First Eagle Global I MSCI ACWI
7 years 10 years
10-Year StatisticsJuly 2004 - June 2014: Summary Statistics
Return Excess Return StandardDeviation
SharpeRatio
First Eagle Global I 10.70% 2.68% 11.66% 0.79
MSCI ACWI 8.02% 0.00% 18.37% 0.35
Calendar Year Return
YTD 2013 2012 2011 2010 2009 2008
Growth of $100July 2004 - June 2014 (Single Computation)
300:
250-
200-
150 -
100
50
-First Eagle Global I
100%
50%1
1
87°2004
-7'0% S&P 500/30% BC Aggregate
04 2005 04 2009 04 200/ 04 2008 04 2009 04 2010 04 2011 04 2012 02 2014
Information Maximum Up DownAlpha BetaDrawdown Capture CaptureRatio
0.35 5.23% 0.61 -27.38% 77.01% 45.30%
0.00 0.00% 1.00 -48.88% 100.00% 100.00%
First Eagle Global I 6.43% 15.79% 12.73% 0.06% 17.87% 23.22% -20.87%
MSCI ACWI 6.50% 23.44% 16.80% -6.86% 13.21% 35.41% -41.85%
2007 2006 2005
10.19% 20.78% 15.22%
12.18% 21.53% 11.37%
Manager vs Benchmark: Return
YTD 1 year
6.43% 17.94%
6.50% 23.58%
3 years 5 years 7 years 10 years
9.69% 13.94% 7.36% 10.70%
10.85% 14.88% 3.80% 8.02%

Delaware Focus Global Growth - Manager AnalysisManager vs Benchmark: ReturnJanuary 2009 - June 2014 (not annualized if less than 1 year)
20-
41,
15-
10-
50] 11111YTD 1 year 3 years
0 Delaware Focus Global Growth Instl MSCI World Index
ir-
5 years
5-Year StatisticsJuly 2009 - June 2014: Summary Statistics
Growth of $100January 2009 - June 2014 (Single Computation)
3007
250-
200.
150-
100-
50_
Delaware Focus Global Growth Ins0 -MSCI World Index
60%
40%
20%
0%04 2008 04 2009 04 2010 04 2011 04 2012 04 2013 02 2014
Return Excess Return StandardDeviation
SharpeRatio
InformationRatio Alpha
Delaware Focus Global Growth Instl 17.59% 1.97% 16.56% 1.06 0.39 2.17%
MSCI World Index 15.62% 0.00% 16.18% 0.96 0.00 0.00%
Calendar Year Return
YTD 2013 2012 2011 2010 2009
Delaware Focus Global Growth Instl 2.87% 23.67% 17.90% -2.20% 22.53% 51.36%
MSCI World Index 6.52% 27.36% 16.54% -5.02% 12.34% 30.79%
Maximum Up DownBetaDrawdown Capture Capture
0.98 -15.32% 104.34% 90.03%
1.00 -16.52% 100.00% 100.00%
Manager vs Benchmark: Return
YTD 1 year 3 years 5 years
2.87% 22.57% 10.83% 17.59%
6.52% 24.71% 12.45% 15.62%

Dupont Emerging Markets - Manager AnalysisManager vs Benchmark: ReturnJuly 2004 - June 2014 (not annuazed if less than 1 year)
16
14 -
12 -
10-
8-
6
4
2
o-
-2-
YTD 1 year 3 years 5 years 7 years 10 years
0 Dupont Emerging Markets MF/SMA MSCI EM (EMERGING MARKETS) (Net)
Growth of $100July 2004 - June 2014 (Single Computation)
350-
300 -
250-
200 -
150
100
Dupont Emerging Matkets MF/SMA
100%
0%
-100%
-"V2004
-MSCI EM (EMERGING MARKETS) (Net)
04 2005 04 2006 04 2007 04 200(3 04 2009 04 2010 04 2011 04 2012 02 2014
10-Year StatisticsJuly 2004 - June 2014: Summary Statistics
Standard Sharpe Information Maximum Up DownReturn Excess Return Alpha BetaDeviation Ratio Ratio Drawdown Capture Capture
Dupont Emerging Markets MF/SMA 7.74% -4.21% 16.67% 0.37
MSCI EM (EMERGING MARKETS) (Net) 11.94% 0.00% 24.82% 0.42
-0.30 0.62%
0.00 0.00%
0.57 -23.86% 58.77% 65.72%
1.00 -53.33% 100.00% 100.00%
Calendar Year Return
YTD 2013 2012 2011 2010 2009 2008
Dupont Emerging Markets MF/SMA 0.66% -5.35% 19.48% -18.73% 20.45% 65.19% -23.86%
MSCI EM (EMERGING MARKETS) 6.14% -2.60% 18.22% -18.42% 18.88% 78.51% -53.33%
2007 2006 2005
6.61% 10.71% 11.89%
39.39% 32.17% 34.00%
Manager vs Benchmark: Return
YTD 1 year 3 years 5 years 7 years 10 years
0.66% 10.91% -2.27% 6.58% 5.53% 7.74%
6.14% 14.31% -0.39% 9.24% 2.28% 11.94%

PIMCO - All Asset All Authority - Manager AnalysisManager vs Benchmark: ReturnJuly 2004 - June 2014 (not annualized if less than 1 year)
25 1
20-
15-
10-
o-YTD 1 year 3 years 5 years
PIMCO All Asset All Authority lost S&P 500
7 years 10 years
Growth of $100July 2004 - June 2014 (Single Computation)
220 1
2004
160 I
160-
140-
120-
100
80
-PIMCO All Asset All Authority Inst - 70% S&P 500/30% BC Aggiefiato
60%AO%
20%
0%
02 2004 04 2005 04 2006 04 2001 04 2008 04 2009 Q4 2010 Q4 2011 04 2012 02 2014
10-Year StatisticsJuly 2004 - June 2014: Summary Statistics
Standard SharpeReturn Excess Returneviation Ratio
PIMCO All Asset All Authority Inst 7.19% -0.59% 7.62%
S&P 500 7.78% 0.00% 16.44%
0.74
0.38
Calendar Year Return
YTD 2013 2012 2011 2010 2009 2008
PIMCO NI Asset M Authority Inst 6.31% -5.47% 17.66% 3.01% 10.67% 19.35% -6.93%
S&P 500 7.14% 32.39% 16.00% 2.11% 15.06% 26.46% -37.00%
2007 2006 2005
InformationD Ratio Alpha
-0.04 5.19%
0.00 0.00%
9.99% 3.09% 6.72%
5.49% 15.79% 4.91%
Maximum Up DownBetaDrawdown Capture Capture
0.25 -11.74% 39.08% 3.61%
1.00 -45.80% 100.00% 100.00%
Manager vs Benchmark: Return
YTD 1 year 3 years 5 years 7 years 10 years
6.31% 7.22% 5.23% 7.93% 7.06% 7.19%
7.14% 24.61% 16.58% 18.83% 6.16% 7.78%

Quarterly Investment Report
PIMCO
650 Newport Center Drive
Newport Beach
California 92660
(888) 87-PIMCO
www.pimco.com/investments
June 30, 2014
PIMCO Low Duration Fund

Low Duration Fund Second Quarter 2014
1 Risk Disclosures and Index Descriptions are located in the Important Information section of the Appendix
PIMCO Low Duration Fund
Market Commentary Market Outlook Bond markets rallied as central banks remained
accommodative – emerging markets led gains, and developed market yields fell to 12-month lows
After a weak first quarter, U.S. economic data ended the quarter strong. Job gains stabilized above 200,000/month and business investment showed signs of improving
The European Central Bank (ECB) announced new easing measures, including the introduction of a negative deposit rate and a program to promote business lending
PIMCO’s The New Neutral reflects our expectations for low real policy rates given subpar growth and high debt levels
After a weak first quarter, measures of economic activity point toward a brighter outlook for the remainder of the year
In Europe, we expect growth to increase 1.25-1.75% as we expect aggregate demand to assist growth; differentiation between countries will persist
Beyond China, emerging market (EM) growth will improve over the secular horizon – although it will be a gradual recovery
Fund Recap Fund Strategy The Fund outperformed its benchmark for the quarter Most sectors that trade at a spread to U.S. Treasuries
outperformed amid a return of risk appetite and an easing of global political risks
The following strategies were positive for the quarter: Active management of U.S. interest rate positioning,
including roll-down1 strategies An overweight to investment-grade corporate bonds,
which outperformed like-duration Treasuries An allocation to non-Agency mortgages, which benefited
from limited supply and a recovery in the housing sector Modest exposure to high yield corporate bonds as
spreads narrowed Tactical exposures to Italian and Spanish debt, which
rallied on further monetary accommodations Exposures to local rates in Mexico and Brazil as rates
declined in these regions The following strategies were negative or neutral for returns:
Underweight Japanese yen and euro positions as the currencies appreciated against the U.S. dollar
1 Roll-down is a form of return that is realized as a bond approaches maturity, assuming an upward sloping yield curve.
Concentrate exposure on short-to-intermediate maturities while maintaining a curve steepening position
Focus Treasury Inflation Protected Securities exposure on the intermediate segment of the real yield curve as we believe inflation protection is attractively priced at these maturities
Gradually add exposure to short-dated credit; focus on issuers within housing, finance, and energy
De-emphasize Agency mortgage-backed securities (MBS) broadly; focus on security selection to capitalize on relative value opportunities within the coupon stack
Hold non-Agency MBS positions which continue to offer attractive value to other spread sectors
Within non-U.S. developed, focus on Italy and Spain as the ECB will remain accommodative
Within emerging markets, focus on Mexico and Brazil which have stronger fundamentals and high real interest rates
Maintain an overall neutral currency stance as long as central bank actions continue to drive high levels of currency volatility; remain short the Japanese yen and the euro while favoring the Mexican peso

Summary of Performance Data and Portfolio Statistics PIMCO Low Duration Fund
Institutional Class
Performance Since
Periods Ended 6/30/2014 Inception 10 yrs 5 yrs 3 yrs 1 yr 6 mos 3 mos
Total Portfolio1
Before Fees (%) 6.59 4.52 4.51 2.77 3.28 1.46 0.94
After Fees (%) 6.10 4.06 4.03 2.30 2.81 1.23 0.83
(Inception 05/11/87)
BofA Merrill Lynch 1-3 Year U.S. Treasury Index (%) 5.07 2.62 1.18 0.63 0.76 0.41 0.27
BofA Merrill Lynch 1-3 Yr Treasury Index (%)3
The Fund's Total Annual Operating Expenses 0.46%
Summary Information 3/31/2014 6/30/2014 Sector Allocation 3/31/2014 6/30/2014 3/31/2014 6/30/2014
Total Net Assets (USD in millions) 23,583.1 23,383.8 Government-Related5 15 19 -16 2
SEC 30-Day Ann. Yield (%) 1.39 1.13 Government-Treasury 22 12 28 16
Distribution Yield (%)3 1.77 1.60 Government-Agency 1 11 1 15
Effective Duration (yrs) 2.5 2.8 Swaps and Liquid Rates -8 -4 -45 -29
Benchmark Duration - Provider* (yrs) 1.9 1.9 Mortgage 26 12 25 10
Benchmark Duration - PIMCO** (yrs) 1.9 1.9 Invest. Grade Credit 10 10 5 4
Effective Maturity (yrs) 2.9 3.5 High Yield Credit 7 8 2 2
Average Coupon (%) 2.5 2.5 Non U.S. Developed 8 15 4 9
Net Currency Exposure (%) -1.0 -1.3 Emerging Markets 8 10 6 7
Tracking Error (10 yrs, %)4 3.0 3.0 Other6 2 3 1 1
Information Ratio (10 yrs)4 0.5 0.5 Net Cash Equivalents:7 24 23 73 65 Commercial Paper / STIF 0 0 0 0 ST Government-Related 19 21 7 7 ST Mortgage 5 4 0 0 ST Credit 20 24 1 1 Money Market Futures/Options 156 147 62 53 Other 17 32 3 4 Less: Liabilities -193 -205 0 0Total 115 119 84 102
Expense Ratio
% of Market Value % of Duration
See example of tracking error / information ratio in Important Information section of the Appendix.
Portfolio
Index
Barclays U.S.
Aggregate
CitiGroup 3-Mo
0
2
4
6
8
0 2 4 6 8
Ann
ualiz
ed R
etur
n (%
)
Standard Deviation of Return2 (%)
10-Year Return vs. Standard Deviation
Government-Related may include nominal and inflation-protected Treasuries, agencies, interest rate swaps, Treasury futures and options, and FDIC-guaranteed corporate securities.
Performance quoted represents past performance. Past performance is not a guarantee or a reliable indicator of future results. Investment return and the principal value of an investment will fluctuate. Shares may be worth more or less than original cost when redeemed. Current performance may be lower or higher than performance shown. For performance current to the most recent month-end, visit www.PIMCO.com/investments or call (888) 87-PIMCO.
**Benchmark duration as calculated by PIMCO. *The benchmark duration as provided by Benchmark Provider
2

Additional Share Class PerformancePIMCO Low Duration Fund
Net of Fees Performance Gross Net NAV Inception Since 10 5 3 1 6 3Expense Expense Currency Date Inception Year Year Year Year Month Month
Ratio Ratio
ADMINISTRATIVE Class:Low Duration Fund, Administrative 0.71 - USD Jan-03-95 5.84 3.80 3.77 2.04 2.55 1.11 0.76BofA Merrill Lynch 1-3 Year U.S. Treasury Index - 5.07 2.62 1.18 0.63 0.76 0.41 0.27
Class D:Low Duration Fund, Class D 0.75 - USD Apr-08-98 5.80 3.75 3.73 2.00 2.51 1.09 0.75BofA Merrill Lynch 1-3 Year U.S. Treasury Index - 5.07 2.62 1.18 0.63 0.76 0.41 0.27
Class P:Low Duration Fund, Class P 0.56 - USD Apr-30-08 6.02 3.96 3.93 2.20 2.71 1.18 0.80BofA Merrill Lynch 1-3 Year U.S. Treasury Index - 5.07 2.62 1.18 0.63 0.76 0.41 0.27
June 30, 2014
Performance quoted represents past performance. Past performance is not a guarantee or a reliable indicator of future results. Investment return and the principal value of an investment will fluctuate. Shares may be worth more or less than original cost when redeemed. Current performance may be lower or higher than performance shown. For performance current to the most recent month-end, visit www.PIMCO.com/investments or call (888) 87-PIMCO.
3

Market Commentary Second Quarter 2014
4
Unlike this time last year when the Federal Reserve’s (Fed) “taper talk” caused market turmoil, the second quarter of 2014 saw the return of risk appetite and an easing of global political risks. Bond markets rallied as central banks remained accommodative – emerging markets (EM) led gains, and developed market yields fell to 12-month lows during the quarter. Global equity markets posted sizeable gains overall as the S&P 500 Index rose to an all-time high and EM stocks rebounded on reduced political risks.
While first quarter GDP growth (-2.9%) in the U.S. suggested that the winter chill was even worse than feared, the outlook improved as job gains stabilized above 200,000/month and business investment showed signs of improving. In its June meeting, even while stating that the economy has “rebounded,” the Fed reiterated that the economy still had some distance to go to meet its employment and inflation targets. Similar to the previous quarter, the U.S. Treasury yield curve flattened as investors began to embrace the view that policy rates will remain lower than historical norms suggest.
Contrary to the Fed’s status-quo policies, the European Central Bank announced new easing measures, including a historic negative rate on deposits, policy rate cut, and targeted long-term refinancing operations to spur business lending. Surpassing already high market expectations, the move was supportive for European credit risk. Consequently, yields on Spanish and Italian bonds ended the quarter close to their 10-year U.S. Treasury counterparts.
At the start of the quarter, Japan implemented its consumption tax hike, causing household spending and retail sales to fall as expected. While survey data on Japan’s economic outlook and business confidence was surprisingly upbeat, more data will be needed to determine the real impact of the tax hike on its economy. China, also facing a more challenging growth outlook, launched a mini-stimulus program and continued to finely tune its monetary policies amid lingering concerns regarding shadow banking-related defaults.
Despite ongoing violence in eastern Ukraine and a still-uncertain outcome for gas negotiations, geopolitical risks receded in this region as Russia acknowledged the legitimacy of the newly elected Ukrainian President and continued to engage in cease-fire negotiations. In India, the resounding electoral win for Prime Minister Narendra Modi and his reform-oriented Bharatiya Janata Party propelled its stock market to a gain of just over 15% for the quarter. In addition to market-friendly election results (which included South Africa and Egypt), low volatility and attractive "carry" led to strong inflows into EM bond funds and a reversal of last year’s losses.
Bonds Posted Strong Returns as Yields Declined
The following summarizes fixed income sector returns during the second quarter of 2014:
U.S. Treasuries returned 1.35% for the quarter and 2.72% year to date (Barclays U.S. Treasury Index). The Treasury yield curve flattened during the quarter with 10-year yields falling 19 basis points to 2.53% and two-year yields rising slightly to 0.46%, as the Fed signaled that it was in no hurry to start raising rates. Investors continued pricing in a New Neutral for low policy rates and lower long-term yields.
Agency mortgage-backed securities (MBS) returned 2.44% for the quarter and 4.08% year to date (Barclays Agency Fixed-Rate MBS Index). Agency MBS outperformed like-duration Treasuries, despite continued tapering by the Federal Reserve. Lack of new issuance was the primary driver of performance in the sector, as limited refinancing activity, slow housing turnover and winter weather-related weakness in much of the U.S. contributed to lower than expected mortgage originations. Non-Agency MBS continued to benefit from the ongoing recovery in housing, demand for spread assets and limited new issue supply.
U.S. investment grade credit returned 2.71% during the second quarter and 5.70% year to date, as measured by the

Market Commentary, (cont’d) Second Quarter 2014
5
Barclays U.S. Credit Index. The sector outperformed like-duration Treasuries by 0.81% as spreads narrowed by 7 basis points to 0.96%. The high yield corporate bond sector returned 2.41%, benefitting from a strong equity market, lower Treasury yields, and robust inflows. With declining yields that outpaced the drop in rates, spreads compressed to levels not seen since mid-2007. Bank loans posted relatively healthy returns, despite headwinds in the form of lower government rates and diminishing retail demand as reflected by material outflows from mutual funds during the quarter.
Treasury Inflation-Protected Securities (TIPS) returned 3.81% for the second quarter (based on the Barclays U.S. TIPS Index) and 5.83% year to date. TIPS outperformed nominal Treasuries as the level and expectations of inflation increased. Higher heating costs and the conflict in Iraq raised energy prices, which impacted near-term headline inflation while increasing rent prices continue to contribute to core inflation. The Consumer Price Index is now hovering around 2% for both core and headline inflation. Inflation-linked bonds (ILB) rallied globally with EM ILBs showing significant strength.
EM external debt, as measured by the JPMorgan EMBI Global, returned 5.6% for the quarter and 9.1% year to date as spreads for EM external debt narrowed by 42 basis points. EM local bonds returned 3.9% for the quarter and 5.9% year to date as measured by the JPMorgan GBI – EM Global Diversified Index. EM external debt outperformed, though local debt rebounded as investors sought the relatively high yields of the asset class. Inflows have returned across EM asset classes due to attractive valuations, modest relief over Chinese growth concerns, market-friendly election results, and renewed appetite for higher yields.
Tax-exempt municipals returned 2.59% during the quarter and 6.00% year to date, based on the Barclays Municipal
Bond Index. Taxable municipals also posted positive returns of 4.61% in the second quarter and 10.86% year to date, according to the Barclays Taxable Municipal Index. Primary market supply remained low – a factor that was exacerbated by accelerated net inflows into municipal mutual funds, which were concentrated in the long duration and high yield segments and drove credit spreads tighter. The municipal market rallied despite negative credit headlines surrounding select issuers, including the Commonwealth of Puerto Rico, Illinois and New Jersey.

Market Outlook Third Quarter 2014
6
PIMCO’s New Neutral Secular Outlook
The key output from our annual secular forum is an economic framework we call The New Neutral, which reflects our expectations for low real policy rates and has important implications for global financial markets.
The New Neutral reflects global aggregate demand that is still insufficient to absorb bountiful aggregate supply, five years after the financial crisis and despite extraordinary monetary policies. Total global debt outstanding remains at peak levels around the globe, and this combined with subpar growth is constraining central bankers and the process of policy normalization. While we anticipate an upward path for interest rates, the market (and the Federal Reserve’s (Fed)) expectations for future interest rates are likely too aggressive.
United States: Emerging from a Deep Freeze
While first quarter GDP growth in the U.S. was revised down to a dismal -2.9%, we believe much of the slowdown was due to transitory factors, including an unusually harsh winter and a temporary decrease in healthcare spending stemming from the implementation of the Affordable Care Act.
However, measures of economic activity in the second quarter point toward a much brighter outlook. Aggregate hours worked climbed, while jobless claims remain near cycle lows and consumer confidence reached a cyclical high. Industrial production, core capital goods orders, and other measures of industrial activity increased as well. These positive signs lead us to expect growth in the U.S. to accelerate toward 2.5-3.0% over the next twelve months.
Inflation in the U.S. is bottoming and poised to move up modestly. We expect inflation in the U.S. to move close to the Fed’s 2% target by the end of the year. While inflation is likely to increase, we expect inflation expectations will remain well-anchored. Indeed, we view a modest increase in inflation as a welcome sign of the durability of the U.S. economic recovery.
Europe: European Central Bank (ECB) Remains Ready
We expect the eurozone economy to expand by 1.25-1.75% over the next year, but country-level differences will persist. Spain should benefit from recent reform efforts and Germany’s economy faces fewer structural headwinds. Italy and France, on the other hand, have yet to enact the types of reforms necessary to raise potential growth rates.
The ECB will likely keep monetary policy exceptionally accommodative for an extended period of time as it combats deflationary forces arising from a combination of ongoing fiscal tightening and still-constrained credit conditions (particularly in periphery countries). The ECB recently cut its benchmark rate to a record low of 0.15 percent and introduced a negative deposit rate for the first time in its history. While these actions are likely to have a stimulative effect on growth and inflation, the ECB is biased to do more to the extent inflation continues to fall short of its 2% target which touched 0.5% in May. In this instance, we believe the introduction of a large-scale quantitative easing program should not be ruled out.
Japan: Tax Debate Continues
In Japan, we expect growth of 0.5-1.0%, while the debate continues on how the economy will withstand the value added tax hike. We see mixed signals coming out of Japan, with business confidence improving, but real wages remaining challenged. In spite of some near term successes, such as generating an uptick in Consumer Price Index, significant long-term challenges related to debt overhangs and demographics remain.
Emerging Markets (EM) and Develop Markets Converge
We see a more balanced global economy in the years ahead. The baton is being passed in part from China to the developed world, where China had been an important driver of global growth in the wake of the financial crisis. While much of the

Market Outlook, (cont’d) Third Quarter 2014
7
world was deleveraging, China was re-leveraging both in the official banking system and outside of it, in the so-called shadow banking system. Recently this has begun to change. As China tries to transform its economy into one that depends less on credit expansion, economic growth will slow − just as growth slowed in the developed world amid deleveraging after the financial crisis.
Beyond China, EM growth will improve over the secular horizon – although it will be a slow trip back to potential levels – and sovereign debt metrics look very good in several countries, including Brazil and Mexico.
Investment Strategies: Diversified Total Carry1 for Low Duration
PIMCO Low Duration strategies will emphasize diverse sources of potential return, beyond traditional interest rate duration.
Interest Rate Strategies – Low Duration strategies will maintain a low overall duration, as the bulk of portfolio duration will be sourced from short-to-intermediate maturity bonds. In the U.S., duration positioning has evolved with our cyclical outlook for the Fed’s first rate hike and our secular outlook for the “neutral” policy rate that we believe the U.S. economy can support. Cyclically, short-end rates could become more susceptible to volatility as the Fed prepares to hike its overnight rate sometime in the second half of 2015. Secularly, we believe long-run debt and demographic dynamics will cause yields to remain lower than projections based on prior tightening cycles would suggest. Thus, we anticipate reducing the degree by which portfolios are positioned for the yield curve to steepen over time.
1 Carry is the rate of interest earned by holding the respective securities
Diversification does not ensure against loss.
In Europe, we see opportunities in short-dated duration, primarily in sovereign debt in peripheral countries like Italy and Spain. We believe the ECB will keep monetary policy accommodative for an extended period of time as it combats deflationary forces arising from ongoing fiscal tightening and still-constrained credit conditions.
Mortgages – We maintain an underweight to Agency mortgage-backed securities, due to concerns about high valuation levels and anticipated effects of Fed tapering. We will hold and selectively add non-Agency mortgages, as mortgage credit continues to offer attractive loss-adjusted yields relative to other spread sectors.
Corporate Bonds – The strategy will gradually add exposure to short-dated corporate credit, as market conditions permit. We continue to prefer credits linked to industries with high growth potential, such as housing, finance, and energy. Individual credits may be added opportunistically and based on issue-specific considerations.
Emerging Markets – As the pace of economic growth in the developing world slows, we will become increasingly selective in EM allocations. We currently see Mexico as the most attractive opportunity, with solid fundamentals and high real interest rates.
Currency – Low Duration strategies will make modest use of currency strategies. We currently favor the Mexican peso, but remain short the euro and Japanese yen, two currencies that face downward pressure related to easy monetary policy.
Treasury Inflation-Protected Securities (TIPS) – PIMCO continues to hold a position in intermediate TIPS, as we believe inflation protection is attractively priced at these maturities.

Mortgage Commentary and Outlook Second Quarter 2014
8
Market Commentary
Agency mortgage-backed securities (MBS) outperformed like-duration Treasuries during the quarter driven primarily by weaker than expected new issuance and continued Federal Reserve (Fed) intervention
The Fed continued to taper Agency MBS purchases at a pace of $5 billion per meeting. However, they retained their dominant market share, as issuance averaged just $74 billion per month during the quarter. In 2013, issuance averaged almost $135 billion a month.
Higher coupons outperformed, with the conventional 4.5% coupon the best performing liquid Agency MBS.
15-year bonds underperformed 30-year MBS, as rates fell and mortgage real estate investment trusts sold shorter bonds in favor of longer bonds that offer greater current income. Ginnie Mae securities also underperformed, with high dollar prices deterring banks and foreign investors.
The Federal Housing Finance Agency (FHFA) released its 2014 objectives, signaling a new focus on credit expansion and reduced emphasis on shrinking Fannie Mae and Freddie Mac. The FHFA eased representation and warranty obligations on new loans, while also reversing course on its previous plan to reduce conforming loan limits and raise guarantee fees.
Market Outlook
PIMCO views Agency MBS as expensive and we prefer holding Treasuries.
We expect the trend of net Fed purchases exceeding net issuance to end around August, as tapering continues and supply increases due to the impacts of seasonal housing activity, historically low mortgage rates and a gradual expansion of credit.
Source: PIMCO, Mortgage Bankers Association, Nomura Securities MBS is represented by the Barclays MBS Fixed Rate Index
Past performance is no guarantee of future results. Graphs are for illustrative purposes only and are not indicative of the performance of any particular investment.
-400
-200
0
200
400
600
800
1,000
FederalReserve
Banks /Savings
Institutions
GSEs OverseasInvestors
MortgageREITs
MoneyManagers
Chan
ge in
MBS
hol
ding
s ($
bn)
Changes in Agency MBS holdings by investor type
1H 2014 Since Sep 2012
020406080
100120140160180
Jan-
13
Feb-
13
Mar
-13
Apr-
13
May
-13
Jun-
13
Jul-1
3
Aug-
13
Sep-
13
Oct
-13
Nov
-13
Dec-
13
Jan-
14
Feb-
14
Mar
-14
Apr-
14
May
-14
Jun-
14
Issu
ance
($ b
n)
Monthly MBS gross issuance since 2013

U.S. credit yields
and spreads 4.0
R 3.6
-U.S. credit yield to maturity (LHS)
-U.S. credit OAS (RHS)
240
210
49 2.8 -o .a.)
>- 2.4 120
2.0 90
Jun '11 Dec '11 Jun '12 Dec '12 Jun '13 Dec '13 Jun '14
8
7
6
5
4
3
2
1
0 -1
-2 -3
U.S. credit excess returns by sector Q2 14 YTD 2014
Key outperformers Key underperformers
?X., t..e . ces . (Os %es oic 420 ,j.N- 00
0\e ,00 e vc.
Investment Grade Credit Commentary and Outlook Second Quarter 2014
9
Unless otherwise noted, graph data and text references represent the excess return performance of the Barclays U.S. Credit Index and its sub-indices. The corporate sectors shown are not equally weighted in the index but instead are market weighted. The sectors shown represent the broad components of the index. Excess Return is a duration-adjusted measure of performance relative to a term structure-matched position. The predominate method for calculating excess return uses U.S. Treasuries and key rate durations. It measures the amount by which the return on an investment credit exceeds the equivalent risk free rate of return.
EBITDA is Earnings Before Interest, Tax, Depreciation and Amortization
Past performance is no guarantee of future results. Graphs are for illustrative purposes only and are not indicative of the performance of any particular investment.
Market Commentary
The U.S. investment grade credit market, as represented by the Barclays U.S. Credit Index, returned 2.71% in the second quarter. U.S. credit outperformed like-duration Treasuries by 0.81%, as spreads tightened 7 basis points and credit yields fell 0.20% to 2.83%.
Credit spreads tightened alongside generally improving high frequency economic data, solid corporate fundamentals, and low credit spread volatility, as global central bank policy remained accomodative, lending support to risk assets broadly.
Demand for credit remained strong as high grade retail funds saw inflows of $28.7 billion. Additionally, new issue concessions remained low, even in the face of record issuance for the first half of the year.
Sectors that performed well were generally characterized by strong growth trends (home construction) and improved pricing power due to industry consolidation (cable satellite).
Market Outlook
The secular outlook for credit remains constructive, with healing underway in developed markets balanced against slowing growth in emerging markets. There is a secular convergence toward modest real growth rates across the global economy, which has many investors searching for yield and considering credit to help them reach their longer term goals.
We continue to see the benefits of active management, and our investment strategy remains consistent: to find companies with robust long-term growth potential, superior asset quality and pricing power.

Real Return Commentary and Outlook Second Quarter 2014
10
Market Commentary
Treasury Inflation-Protected Securities (TIPS) returned 3.81% during the second quarter, as represented by the Barclays U.S. TIPS Index. Year-to-date, TIPS returned 5.83%.
Real rates decreased across most maturities during the quarter, with the 10-year real rate dropping by 33 basis points. In general, TIPS returns were underpinned by more supportive inflationary data and continued investor demand.
Inflation accruals were strong at 1.34% for the quarter. The largest increases came from energy prices, specifically in the transportation sector. Higher shelter, food and beverages, and apparel prices also contributed to this notable inflation print.
TIPS outperformed like-duration nominal Treasuries as breakeven inflation levels (the difference between nominal and real yields and a measure of market inflation expectations) widened across the curve given constructive inflation prints that exceeded market expectations.
Market Outlook
Given the elevated unemployment rate and the core inflation rate below the Federal Reserve’s (Fed) target, we believe the Fed is not achieving its dual mandate and therefore has capacity and reason to maintain exceptionally low rates for longer than the market expects.
While we believe inflation will increase in 2014 relative to 2013, we still foresee subdued inflation in the shorter-term given excess capacity and restrained wage growth. However, longer-term we expect inflation to trend higher on the back of poor fiscal conditions and heavy debt loads in the U.S. and other developed countries, and prolonged accommodative and unconventional monetary policies.
Past performance is no guarantee of future results. Graphs are for illustrative purposes only and are not indicative of the performance of any particular investment.
The negative real rates in U.S. TIPS Yield Curve chart are directly observable in market traded TIPS. The yield curves represent TIPS yields at specific points in time as referenced in the chart.
Data Sources: Barclays, Bloomberg
-2
-1
0
1
2
2 3 4 5 6 7 8 9 10 20 30
Yiel
d (%
)
Years to maturity
U.S. real yields 31 Dec '13 31 Mar '14 30 Jun '14
-6-5-4-3-2-101234
'04 '05 '06 '07 '08 '09 '10 '11 '12 '13
Yiel
d (%
)
Breakeven inflation (BEI) rates2-year BEI 5-year BEI30-year BEI 10-year BEI
Pre-crisis avg. 10-yr. breakeven:
Post-crisis avg. 10-yr. breakeven: 2.17%

Municipal Bond Commentary and Outlook Second Quarter 2014
11
Market Commentary
Municipal yields moved lower across the curve in the second quarter. AAA Municipal Market Data (MMD) municipal yields fell 11 basis points to 1.20% in 5-year maturities, 23 basis points to 2.26% in 10-year maturities, and 37 basis points to 3.28% in 30-year maturities. Municipals posted positive returns of 2.59%, as measured by the Barclays Municipal Bond Index.
The firm tone in the municipal market was driven by lower Treasury rates, modest new issue supply, and improved demand which offset negative credit headlines surrounding several large issuers. Second quarter issuance of $88 billion was 7% lower year-over-year, and year-to-date new issue supply of $151 billion was down 16% year-over-year, according to the Bond Buyer. Municipal mutual funds indicated $7 billion of net inflows, compared to $1.2 billion of net outflows in the first quarter. Demand was concentrated in longer duration and higher yielding segments.
Market Outlook
PIMCO anticipates near-term municipal market volatility to be driven by interest rate uncertainty and negative credit headlines that could weigh on a seasonally high reinvestment period. Therefore, we remain defensively positioned, favoring higher quality, more liquid securities that would be more resilient under adverse market conditions.
We expect a bifurcated credit landscape between state and local governments. Many states have shown improving credit fundamentals following 15 consecutive quarters of rising state tax receipts. However, many local government obligation bonds face headwinds due to slow growth in property tax receipts and limited pension reform. PIMCO remains underweight local general obligation debt, investing in select general obligation credit in geographies tied to a continued recovery to U.S. housing and less vulnerable to unfunded pension issues.
Top Chart Source: Thompson Reuters MMD Bottom Chart Source: Flows: Lipper, Yield: Thompson Reuters MMD
The 30-Year AAA G.O. Yield is proprietary data from Thompson Reuter’s Municipal Market Data (MMD). The yield consists of all general obligation municipal bonds issued in the United States with 30 years remaining to maturity, which have been rated in the highest rating category by a Nationally Recognized Statistical Rating Organization.
50
70
90
110
130
150
170
190
210
230
'07 '08 '09 '10 '11 '12 '13 '1430-y
ear A
AA M
uni/T
reas
ury
yiel
d ra
tio (%
)
30-year AAA General Obligation (G.O.) as a percentage of 30-year Treasury yield
Yield ratio
1-year rolling average
0.0
1.0
2.0
3.0
4.0
5.0
6.0
7.0
-5,000
-4,000
-3,000
-2,000
-1,000
0
1,000
2,000
3,000
Jan
'08
Aug
'08
Mar
'09
Oct
'09
May
'10
Dec
'10
Jul '
11
Feb
'12
Sep
'12
Apr
'13
Nov
'13
Jun
'14
30-year AA
A M
MD
yield (%)
Mill
ions
($)
Municipal mutual fund flows –Weekly reporters
Weekly municipal fund flows (LHS)30-year AAA MMD yield (RHS)

Developed Non-U.S. Commentary and Outlook Second Quarter 2014
12
Market Commentary
Economic data was mixed and monetary policy expectations diverged across countries.
Japan’s economy proved more resilient to the consumption tax hike than expected; the U.K. economy showed surprising strength, while the eurozone saw weaker growth and worrying disinflation.
The European Central Bank (ECB) launched a multi-pronged easing package intended to spur inflation and boost lending to the private sector, while the Bank of England suggested rate hikes could come sooner than the market had been expecting.
Despite a fluid situation in Iraq, geopolitical concerns abated as did the flight to quality.
Risk assets, government bonds and commodities all rallied smartly on the quarter.
Market Outlook
PIMCO is optimistic about global growth in the year ahead, but country differentiation will continue to diverge.
U.S. growth will rebound from the first quarter’s weather-induced weakness, as the labor market strengthens, wealth effects boost consumer spending and business investment rises.
In the eurozone, the ECB’s accommodative policies support risk assets and the cyclical recovery will continue to broaden; however, structural impediments will keep growth rates below potential for years.
In Japan, monetary easing will pressure real rates and the yen down, but progress on structural reform is critical.
Emerging markets will continue to face bouts of market volatility as they confront reduced investor flows, concerns over Chinese growth and elections in various countries.
6/30 % ChangeSpot Q2 YTD
euro 1.3692 -0.6 -0.4
yen 101.33 +1.9 +3.9
Australian $ 0.9433 +1.8 +5.8
Canadian $ 1.0671 +3.6 -0.4
British pound 1.7106 +2.7 +3.3
SOURCE: Bloomberg
-10-505
2 Yr. 5 Yr. 10 Yr. 30 Yr.06/30/2014 (%) 0.07 0.17 0.57 1.69
QTD Change (bps) -2 -3 -8 -3
Bas
is P
oint
s
Q2 Change in Japanese Yields
-40-30-20-10
010
2 Yr. 5 Yr. 10 Yr. 30 Yr.06/30/2014 (%) 0.03 0.34 1.25 2.19
QTD Change (bps) -13 -29 -32 -26
Bas
is P
oint
s
Q2 Change in Euroland Yields
-20-10
01020
2 Yr. 5 Yr. 10 Yr. 30 Yr.06/30/2014 (%) 0.87 2.03 2.67 3.42
QTD Change (bps) +16 +6 -7 -9
Bas
is P
oint
s
Q2 Change in U.K. Yields

3.5
3.0
2.5
2.0
1.5
1.0
0.5
0.0
EM index returns* External Corp Local Currency
3.20
Apr 14
2.45
1 2.08
0.99 1.00
0.59 0'67
May '14 Jun '14
0.54
I
8
6
EM flows Local External
Apr '14 May '14 Jun '14
Emerging Markets Commentary and Outlook Second Quarter 2014
13
Market Commentary
Emerging markets (EM) debt maintained positive momentum throughout the second quarter as investors favored the comparatively high yields of EM in a low volatility market environment. Inflows have returned to the asset class amid low developed market (DM) yields stabilization in China, positive economic adjustments, and market acknowledgment that headline events remain isolated in scope.
Declining Treasury yields and tightening spreads drove positive returns for external debt while lower local currency yields and carry1 propelled local debt gains.
Market Outlook
As global liquidity and stimulus is gradually withdrawn, we expect country and corporate differentiation to drive EM debt performance as investors become more discriminating in valuing each issuer’s fundamental strengths and vulnerabilities. Differentiation is likely given the variation in initial conditions related to issuer balance sheet strength, growth and inflation trajectories, and the flexibility of fiscal and monetary policies.
In EM external debt markets, we favor quasi-sovereign and corporate names within higher quality countries which provide additional yield at shorter durations versus the sovereign without a meaningful reduction in creditworthiness.
In EM local markets, we favor countries that can offer positive real rates, attractive carry and yield curve roll down2. We are more constructive on EM currencies in aggregate and particularly favor higher carry currencies, but remain cautious on future bouts of volatility.
1Carry is the rate of interest earned by holding the respective securities. 2Roll-down is a form of return that is realized as a bond approaches maturity, assuming an upward sloping yield curve.

Portfolio Characteristics and Benchmark VariancePIMCO Low Duration Fund
Sector Exposure*
Curve Exposure
Other may include municipals, convertibles, preferreds, and yankee bonds.
Gov't-Related may include nominal and inflation-protected Treasuries, agencies, interest rate swaps, Treasury futures and options, and FDIC-guaranteed corporate securities.
* Net cash equivalents include U.S. and non-U.S. money market futures, where permitted. See Sector Allocation on Summary of Performance Data and Portfolio Statistics Page.
66
-47
178
0
-44
57
-66
30
5 0
-26
-100
-80
-60
-40
-20
0
20
40
60
80
100
0-1 yrs 1-3 yrs 3-5 yrs 5-7 yrs 7-8 yrs 8+ yrs
-116
255 2 4 6 1
73
-98
10 4 2 9 7 1
65
-200
-150
-100
-50
0
50
100
150
200
Gov't-Related
Mtg IG Credit HY Credit Non USDevelop
EM Other Net CashEquiv
3/31/2014
6/30/2014
Portfolio vs. Benchmark (%)1
-16
255 2 4 6 1
73
2 10 4 2 9 7 1
65
-100
-50
0
50
100
150
200
Gov't-Related
Mtg IG Credit HY Credit Non USDevelop
EM Other Net CashEquiv
% o
f Dur
atio
n
3/31/2014
6/30/2014
Portfolio (%)1
68
51
178
0
-44
61
30 30
5 0
-26
-80
-60
-40
-20
0
20
40
60
80
100
0-1 yrs 1-3 yrs 3-5 yrs 5-7 yrs 7-8 yrs 8+ yrs
% o
f Dur
atio
n
14

Direct Country and Currency ExposurePIMCO Low Duration Fund
Country Exposure (by currency of settlement)1
Portfolio Portfolio03/31/2014 06/30/2014
Market Value Weighted (%) Market Value Weighted (%)
% of Cash Currency % of Cash Currency
(settlement currency) Duration Bonds Equiv. Exposure2 (%) Duration Bonds Equiv. Exposure2 (%)
North America 92.8 64.3 212.8 0.0 89.1 54.6 223.2 0.0
Canada 0.1 0.1 0.0 0.0 0.1 0.1 0.0 0.0
United States 92.7 64.2 212.8 0.0 89.0 54.5 223.2 0.0
Europe - EMU 3.9 7.9 3.6 0.1 4.3 14.7 3.8 -0.9
France 0.1 0.1 0.4 - 0.0 0.1 0.4 -
Germany 0.0 0.0 0.0 - 0.0 0.1 0.0 -
Italy 2.4 4.5 0.0 - 5.5 9.2 0.0 -
Spain 1.6 3.0 0.0 - 2.6 5.1 0.0 -
Other3 -0.2 0.3 3.2 - -3.8 0.2 3.4 -
United Kingdom 0.2 0.4 0.5 0.0 0.2 0.7 0.5 0.0
Europe - Non-EMU 0.0 0.0 0.5 0.0 0.0 0.1 0.0 0.0
Denmark 0.0 0.0 0.5 0.0 0.0 0.0 0.0 0.0
Switzerland 0.0 0.0 0.0 0.0 0.0 0.1 0.0 0.0
Japan -0.3 0.0 0.0 -1.1 0.0 0.1 0.0 -1.2
Asia Pacific ex-Japan 0.0 0.0 0.0 0.0 0.0 0.0 0.0 0.0
Emerging Markets 3.4 3.4 0.0 0.0 6.4 6.8 0.7 0.8
Brazil 0.5 0.5 0.0 0.0 1.2 2.1 0.7 0.0
Mexico 2.9 2.9 0.0 0.0 5.2 4.7 0.0 0.8
Turkey 0.0 0.0 0.0 0.0 0.0 0.0 0.0 0.0
Net Liabilities4 0.0 0.0 -193.4 0.0 0.0 0.0 -205.2 0.0Total Direct Exposure 100.0 76.0 24.0 -1.0 100.0 77.0 23.0 -1.3
Small allocations may round to zero.
See foonotes in Appendix.
15

Direct Emerging Markets Bond ExposurePIMCO Low Duration Fund
Emerging Markets Exposure (by country of issuer)
3/31/2014 6/30/2014% of MV % of MV % of % of MV % of MV % of
Cash Equiv. Bonds Duration Cash Equiv. Bonds DurationBrazil 1.99 1.86 0.72 2.72 3.30 1.30China 0.83 0.26 0.31 1.28 0.26 0.28Colombia 0.16 0.00 0.00 0.17 0.00 0.00EM Index Products 0.00 1.13 0.01 0.00 1.14 0.01India 0.00 0.01 0.00 0.00 0.01 0.00Indonesia 0.00 0.01 0.00 0.00 0.15 0.00Mexico 1.14 2.98 2.99 1.18 4.70 5.21Russia 0.16 0.00 -0.01 0.19 0.00 0.00Turkey 0.00 0.00 0.00 0.00 0.00 0.00
Total Direct Emerging Markets 4.28 6.25 4.02 5.54 9.56 6.80
Small allocations may round to zero.
16

PIMCO Proprietary Portfolio Level Risk MeasuresPIMCO Low Duration Fund
Risk Measures (yrs) 3/31/2014 6/30/2014 Definitions of Risk Measures:
Interest Rate Exposures:
Effective Duration Portfolio 2.5 2.8 Benchmark** 1.9 1.9
Bull Market Duration Portfolio 2.3 2.6 Benchmark** 1.9 1.9
Bear Market Duration Portfolio 2.8 2.9 Benchmark** 1.9 1.9
Sector Exposures*:Mortgage Spread Duration Portfolio 1.0 0.5 Benchmark 0.0 0.0
Corporate Spread Duration Portfolio 0.9 1.0 Benchmark 0.0 0.0
Emerging Markets Spread Duration Portfolio 0.3 0.4
Benchmark 0.0 0.0
Swap Spread Duration Portfolio 0.5 0.9
Benchmark 0.0 0.0
**Benchmark duration is calculated by PIMCO.
The contribution of swaps to spread duration. For every 1 bp of swap spread tightening (widening), a portfolio with swap spread duration of 1 year will rise (fall) in price by 1 bp. A negative swap spread duration indicates that the portfolio will benefit from widening swap spreads.
The contribution of emerging market bonds to spread duration. For every 1 bp of emerging market spread tightening (widening), a portfolio with an emerging market spread duration of 1 year will rise (fall) in price by 1 bp.
A portfolio's price sensitivity to changes in interest rates. An accurate predictor of price changes only for small, parallel shifts of the yield curve. For every 1 basis point fall (rise) in interest rates, a portfolio with duration of 1 year will rise (fall) in price by 1 bp.
A portfolio's effective duration after a 50 bp decline in rates. The extent to which a portfolio's duration exceeds its bull market duration is a gauge of contraction risk.
A portfolio's effective duration after a 50 bp rise in rates. The extent to which a portfolio's bear market duration exceeds its duration is a gauge of extension risk.
The contribution of corporate bonds to spread duration. For every 1 bp of corporate spread tightening (widening), a portfolio with corporate spread duration of 1 year will rise (fall) in price by 1 bp.
The contribution of mortgages to spread duration. For every 1 bp of mortgage spread tightening (widening), a portfolio with mortgage spread duration of 1 year will rise (fall) in price by 1 bp.
* As measured by spread duration, which represents a portfolio's price sensitivity to changes in spreads, or yield premiums, that affect the value of bonds that trade at a spread to Governments. These include mortgage-backed, corporate and emerging market bonds, as well as swaps.
17

Summary of DerivativesPIMCO Low Duration Fund
Derivatives1
(% of Duration) 3/31/2014 6/30/2014 Characteristics of Derivatives: Control MeasuresGovernment Futures 0.0 14.5 Bond-equivalent exposure included in portfolio
duration. Back long futures positions with high grade, liquid debt securities.
Other Futures 0.0 0.0 See Government Futures.
Interest Rate Swaps -45.0 -22.8 Bond-equivalent exposure included in portfolio duration. Back long swaps positions with high grade, liquid debt securities.
Credit Default Swaps* 21.4 25.4
Written 21.4 25.4
Purchased 0.0 0.0
Options 2.6 0.0
Written 2.6 0.0
Purchased 0.0 0.0
Mortgage Derivatives 3.5 2.8 Bond exposure included in portfolio duration, convexity, and prepayment risk measures. Use IO's and PO's in moderation and in an overall portfolio context.
Money Market Derivatives 69.2 59.8
Futures 62.1 53.3
Interest Rate Swaps 7.1 6.5
* Credit default swaps are shown as percentage of market value to reflect potential default risk.
Credit default swaps are used to manage credit exposure without buying or selling securities outright. Written CDS increase credit exposure ("selling protection"), obligating the portfolio to buy bonds from counterparties in the event of a default. Purchased CDS decrease exposure ("buying protection"), providing the right to "put" bonds to the counterparty in the event of a default.
Bond-equivalent exposure included in portfolio credit risk measures. Back long exposures with high grade, liquid debt securities. Continually monitor underlying credit exposure.
Written options generate income in expected rate scenarios and may generate capital losses if unexpected interest rate environments are realized. Purchased options are used to manage interest rate and volatility exposures. Both written and purchased options will become worthless at expiration if the underlying instrument does not reach the strike price of the option.
Bond-equivalent exposure (weighted by probability of exercise) included in portfolio duration. Back underlying exposure with high grade, liquid debt securities.
Bond-equivalent exposure included in portfolio duration. MM derivatives are not backed by other assets as they represent short-maturity exposures and have no deliverable at expiration.
Used to adjust interest rate exposures and to replicate government bond positions. Frequently offers the opportunity to outperform government securities due to cheapness of futures contracts and active management of the liquid, short duration securities backing the futures.
Used to manage exposures at the short end of the yield curve and express PIMCO's expectations for future short-term rates. Includes swaps with duration of 1 year or less, and Eurodollar, Euribor and other futures based on short-term interest rates.
Includes municipal, mortgage-backed and interest rate swap futures.
Used to manage portfolio duration and/or enhance yield. Includes securities determined by PIMCO to have potentially less stable duration characteristics, such as Interest Only strips (IOs), Principal Only strips (POs), Support Class CMOs and Inverse Floaters. Value will fluctuate as prepayment speeds respond to rising and falling interest rates.
Includes swaps with duration greater than 1 year. Used to adjust interest rate and yield curve exposures and substitute for physical securities. Long swap positions ("receive fixed") increase exposure to long-term interest rates; short positions ("pay fixed") decrease exposure.
18

June 30, 2014
Risk DisclosuresSummary of Performance Data and Portfolio Statistics1
234
5
67
Market Commentary and Market Outlook
Tracking error, a measure of risk, is defined as the standard deviation of the portfolio's excess return vs.the benchmark expressed in percent. The information ratio is defined as theportfolio's excess return per unit of risk, or tracking error. For example, an information ratio of 1 means that a portfolio manager generates 100 basis points, or one percent of excessreturn for every 100 basis points of risk taken.
Amounts previously reported as Government Related are now disaggregated and reflected as Treasury, Agency, and Swaps and Liquid Rates. Government – Treasury includes US Treasury notes, bonds, futures, and inflation-protected securities. Government – Agency includes US agencies, FDIC-guaranteed and government-guaranteed corporate securities, and supranationals. Swaps and Liquid Rates includes US dollar denominated interest rate swaps, swaptions, options, and other rate related derivatives. Other portfolio derivatives, where applicable, may be included as part of other sectors based upon their underlying risk characteristics.
Net cash equivalents includes STIF, CP, ST Government, BAs and CDs, less the amount used to back liabilities such as futures, forwards and unsettled trades. Money MarketFutures/Options include Eurodollar and Euribor futures that are based on short term interest rates and represent short maturity exposures. They are not backed by other assets and haveno deliverable at expiration as they are cash settled. The notional amount of money market futures, captured in the column labeled "% of Market Value", is based on an annualized 3-month interest rate and follows the industry convention of dividing the notional amount by 4 to reflect the underlying 3-month rate exposure. Money market futures' contribution to overallportfolio duration is captured in the column labeled "Duration in Yrs" Other includes repurchase agreements, accrued interest and bankers acceptances.
Mortgage bonds are susceptible to risks such as default and prepayment of principal, and taxable at the state and federal levels, while Treasuries are guaranteed by the United Statesgovernment and are only taxable at the Federal level. Guarantee does not eliminate market risk. It is important to note that longer maturity bonds have greater volatility and risk whencompared to shorter maturity bonds.
Investment grade corporate bonds are considered among the higher rated in the corporate bond sector. These securities are not guaranteed by the federal government and are thusmore susceptible to default risk. Generally most corporate bonds are taxable at the state and federal level.
Real Return bonds, more commonly known as Treasury Inflation Protected Securities or TIPS, are issued and guaranteed by the U.S. government at a fixed rate that is adjusted basedon the change of the Non-Seasonally Adjusted Consumer Price Index. Guarantee does not eliminate market risk. TIPS sacrifice some yield for the benefit of inflation protection. It isimportant to note that longer maturity bonds have greater volatility and risk when compared to shorter maturity bonds. TIPS are only taxable at the Federal level. Nominal Bonds are anysecurity issued, both domestic and foreign, that do not have inflation protection. The risks of nominal bonds fluctuate with the characteristics and credit rating of the issuing entity orgovernment.
Continued
Standard deviation is a statistical measure of dispersion about an average, which for a mutual fund, depicts how widely the returns varied over a certain period of time.Distribution yield is calculated by annualizing actual dividends for the month ended on the date shown and dividing by net asset value per share on the last business day of the same period.
Important Information - PIMCO Low Duration Fund Past performance is no guarantee of future results. Forecasts are based on proprietary research and should not be interpreted as investment advice or as an offer or solicitation for the purchase or sale of any financial instrument.
The performance figures presented reflect the total return performance for the stated share class (after fees) and reflect changes in share price and reinvestment of dividend and capital gain distributions. All periods longer than one year are annualized. The Before Fees performance figures presented herein do not reflect the deduction of the Fund’s total annual operating expenses, which includes, but is not necessarily limited to, advisory fees, administrative fees, and 12b-1 fees (where applicable). The After Fees performance figures reflect the deduction of all such fees. Neither Before nor After Fees performance figures reflect any applicable redemption fees, the performance figures would be lower if the fee was applied.
All time periods longer than one year are annualized and returns include reinvestment of dividends, income and capital gains, if any. The Fund can invest a portion of its assets in non-U.S. securities, which can entail greater risks due to non-U.S. economic and political developments. This risk may be enhanced when investing in Emerging Markets. Investment in aFund that invests in high-yield, lower-rated securities, will generally involve greater volatility and risk to principal than investments in higher-rated securities. In an environment whereinterest rates may trend upward, rising rates will negatively impact the performance of most bond funds, and fixed income securities held by a fund are likely to decrease in value. Bondfunds and individual bonds with a longer duration (a measure of the expected life of a security) tend to be more sensitive to changes in interest rates, usually making them more volatilethan securities with shorter durations.
Statements concerning financial market trends or portfolio strategies are based on current market conditions, which will fluctuate. There is no guarantee that these investment strategies willwork under all market conditions or are suitable for all investors and each investor should evaluate their ability to invest for the longer term, especially during periods of downturn in themarket. Outlook and strategies are subject to change without notice.
Other may include municipals, convertibles, preferreds, and yankee bonds.

June 30, 2014Market Commentary and Market Outlook, (cont'd)
Portfolio Characteristics and Benchmark Variance1
Direct Country and Currency Exposure1 Country exposures reflect the portfolio's effective exposure to non-U.S. markets, inclusive of forward settled holdings. Small allocations may round to zero.2
3 Other includes swaps and securities issued in euros by issuers outside of core Europe. 4 Includes liabilities associated with futures, forwards and unsettled trades.
Summary of Derivatives1
Index Descriptions
Treasuries are guaranteed by the United States government and are only taxable at the Federal level. Guarantee does not eliminate market risk. It is important to note that longermaturity bonds have greater volatility and risk when compared to shorter maturity bonds.
Bonds issued by a government outside of the United States that are guaranteed by the issuing government. Guarantee does not eliminate market risk. It is important to note that longermaturity bonds have greater volatility and risk when compared to shorter maturity bonds. Also, governments outside of the United States have different credit ratings which directlycorrelate to the risks associated with securities.
Market value data based on percentage of net assets of the mutual fund. Data differs from compliance calculations based on total assets of the mutual fund. All mutual funds areseparately monitored for compliance with prospectus and regulatory requirements. Other includes Yankee/Euro bonds, convertibles and municipal bonds. Net cash equivalents equalcash equivalents less the amount used to back liabilities such as futures, forwards and unsettled trades.
Includes currency exposure due to non-U.S. holdings, hedging transactions and outright currency transactions. Positive numbers reflect long currency positions relative to base currency. Allocations may not add to totals due to rounding.
This Fund may use derivative instruments for hedging purposes or as part of its investment strategy. Use of these instruments may involve certain costs and risks such as liquidity risk,interest rate risk, market risk, credit risk, management risk and the risk that a fund could not close out a position when it would be most advantageous to do so. Portfolios investing inderivatives could lose more than the principal amount invested.
Continued
Important Information - PIMCO Low Duration Fund
High Yield bonds involve greater volatility and risk to principal than investments in higher-rated securities as the issuing entity has a lower credit rating possibly making the security moresusceptible to default. Generally these types of bonds are taxable at the state and federal level.
Consumer Price Index (CPI) is an unmanaged index representing the rate of inflation of the U. S. consumer prices as determined by the US Department of Labor Statistics. There can beno guarantee that the CPI or other indexes will reflect the exact level of inflation at any given time. It is not possible to invest directly in an unmanaged index.
JPMorgan EMBI Global Index is an index that tracks total returns for United States Dollar denominated debt instruments issued by emerging market sovereign and quasi-sovereignentities. Brady bonds, loans, Eurobonds and local market instruments. This index only tracks the particular region or country. It is not possible to invest directly in this index. (Thebenchmark for Emerging Markets Bond Fund was changed from the JPMorgan EMBI + to the JPMorgan EMBI Global on January 1, 2003.)
JPMorgan Emerging Local Markets Index Plus (Unhedged) tracks total returns for local-currency-denominated money market instruments in 22 emerging markets countries with at leastUS$10 billion of external trade. It is not possible to invest directly in an unmanaged index.
Citigroup 3-Month Treasury Bill Index is an unmanaged index representing monthly return equivalents of yield averages of the last 3 month Treasury Bill issues. It is not possible to investdirectly in an unmanaged index.
Municipal bonds are guaranteed by the states in which they are issued. Guarantee does not eliminate market risk. Municipal bonds are not taxable at the Federal level and the issuing state has the right to demand tax; however, many states forgo tax on municipal bonds to entice investment.
Corporate bonds are debt securities issued by a corporation. These securities are not guaranteed by the federal government and are thus more susceptible to default risk. Generallymost corporate bonds are taxable at the state and federal level.
Emerging Market bonds are susceptible to market, credit, currency, liquidity, legal, political, technical and other risks different from, or greater than, the risks of investing in developedforeign countries.

June 30, 2014
Index Descriptions, (cont'd)
JPMorgan Government Bond Index-Emerging Markets Global Diversified Index (Unhedged) is a comprehensive global local emerging markets index, and consists of regularly traded,liquid fixed-rate, domestic currency government bonds to which international investors can gain exposure. It is not possible to invest directly in an unmanaged index.
Barclays Long Municipal Bond Index is a rules-based, market-value-weighted index engineered for the long-term tax-exempt bond market. It is not possible to invest directly in an unmanaged index.
Barclays Treasury Index consists of public obligations of the U. S. Treasury with a remaining maturity of one year or more. It is not possible to invest directly in an unmanaged index.
The BofA Merrill Lynch 1-3 Year U.S. Treasury Index is an unmanaged index that tracks the performance of the direct Sovereign debt of the US Government having a maturity of at least1 year and less than 3 years. It is not possible to invest directly in an unmanaged index.
Important Information - PIMCO Low Duration Fund
Barclays Long-Term Treasury Index consists of U.S. Treasury issues with maturities of 10 or more years. It is not possible to invest directly in an unmanaged index.
Barclays Municipal Bond Index consists of a broad selection of investment-grade general obligation and revenue bonds of maturities ranging from one year to 30 years. It is anunmanaged index representative of the tax-exempt bond market. The index is made up of all investment grade municipal bonds issued after 12/31/90 having a remaining maturity of atleast one year. It is not possible to invest directly in an unmanaged index.
Barclays U.S. Aggregate Index represents securities that are SEC-registered, taxable, and dollar denominated. The index covers the U.S. investment grade fixed rate bond market, withindex components for government and corporate securities, mortgage pass-through securities, and asset-backed securities. These major sectors are subdivided into more specificindices that are calculated and reported on a regular basis. It is not possible to invest directly in an unmanaged index.
Barclays U.S. Credit Index is an unmanaged index comprised of publicly issued U. S. corporate and specified foreign debentures and secured notes that meet the specified maturity,liquidity, and quality requirements. The index includes both corporate and non- corporate sectors. The corporate sectors are Industrial, Utility, and Finance, which include both U.S. andnon- U.S. corporations. The non- corporate sectors are Sovereign, Supranational, Foreign Agency, and Foreign Local Government. To qualify, bonds must be SEC- registered. It is notpossible to invest directly in an unmanaged index.
Barclays U.S. TIPS Index is an unmanaged market index comprised of all U.S. Treasury Inflation Protected Securities rated investment grade (Baa3 or better), have at least one year to final maturity, and at least $250 million par amount outstanding. Performance data for this index prior to 10/97 represents returns of the Lehman Inflation Notes Index. It is not possible to invest directly in an unmanaged index.
JPMorgan GBI Global ex-US FX NY Index Unhedged in USD is an unmanaged index market representative of the total return performance in U.S. dollars on an unhedged basis of majornon-U.S. bond markets. It is not possible to invest directly in an unmanaged index.

This report includes information as of 06/30/2014 and contains the current opinions of the manager and such opinions are subject to change. This report is distributed for informational purposes only and should not be considered as investment advice or a recommendation of any particular security, strategy or investment product. The fund offers different share classes, which are subject to different fees & expenses (which may affect performance), have different minimum investment requirements and are entitled to different services. PIMCO is a trademark or registered trademark of Allianz Asset Management of America L.P. in the United States and throughout the world. THE NEW NEUTRAL and YOUR GLOBAL INVESTMENT AUTHORITY are trademarks or registered trademarks of Pacific Investment Management Company LLC in the United States and throughout the world. PIMCO Investments LLC, distributor, 1633 Broadway, New York, NY, 10019 is a company of PIMCO. No part of this report may be reproduced in any form, or referred to in any other publication, without express written permission. ©2014, PIMCO.
This material is authorized for use only when preceded or accompanied by the current PIMCO funds prospectus.