Analysis and optimization of a debug post-silicon hardware ...
Upload
khangminh22Category
view
0download
0
Application NoteC2000 MCU JTAG Connectivity Debug
Matthew Pate and Nabil Saheb
ABSTRACT
The Joint Test Action Group (JTAG) protocol is a primary means of communicating with a microcontroller (MCU) during product development, emulation, and application debug. All of Texas Instruments (TI) C2000™
devices support JTAG emulation and the C2000 evaluation products, such as controlCARDs and LaunchPads, incorporate on-board JTAG Emulation. The purpose of this application report is to provide a brief overview of JTAG implementation and explain the steps used to resolve common JTAG connectivity errors when using Code Composer Studio™ software.
Table of Contents1 What Is JTAG?.........................................................................................................................................................................22 Common JTAG Debug Probes...............................................................................................................................................23 JTAG Connectivity Debug Flows...........................................................................................................................................2
3.1 Overall Debug Flow............................................................................................................................................................23.2 High Voltage Isolation Check Flow.....................................................................................................................................33.3 Main JTAG Debug Flow..................................................................................................................................................... 4
4 Detailed Flow Step Information............................................................................................................................................. 54.1 Isolation Pre-Check Flow................................................................................................................................................... 54.2 JTAG Debug Flow.............................................................................................................................................................. 5
5 References.............................................................................................................................................................................. 96 Revision History......................................................................................................................................................................9
TrademarksC2000™, Code Composer Studio™, and Piccolo™ are trademarks of Texas Instruments.Windows 10™ is a trademark of Microsoft.All trademarks are the property of their respective owners.
www.ti.com Table of Contents
SPRACF0A – MAY 2018 – REVISED JANUARY 2022Submit Document Feedback
C2000 MCU JTAG Connectivity Debug 1
Copyright © 2022 Texas Instruments Incorporated

1 What Is JTAG?JTAG is named after the group that formed the industry standard for boundary scan testing of printed circuit boards (PCBs). It was later standardized as Institute of Electrical and Electronics Engineers (IEEE) IEEE Std 1149.1. Soon after its introduction, the standard became very widely used, which resulted in several additional standards, including the implementation of the on-chip Test Access Port (TAP) on-chip. This made JTAG the most adapted means for embedded systems development, debug, and testing. JTAG uses a 5-pin implementation in most systems:
• TDI (Test Data In)• TDO (Test Data Out)• TCK (Test Clock)• TMS (Test Mode Select)• TRSTn (Test Reset)
The necessary biasing of these pins on custom board designs is found in the device-specific data sheet or from reference designs from TI.
2 Common JTAG Debug ProbesTable 2-1 lists some common debug probes for the C2000 ecosystem.
Table 2-1. Common JTAG Debug Probes Used With C2000 MCUsXDS100v1 and
XDS100v2 XDS110 XDS200 XDS560Price/Speed + + ++ +++
Features
• USB Interface• Flash Programming• Built in Debug Probe
on many C2000 EVMs
• USB Interface• Flash Programming• Built in Debug Probe
for many new TIC2000 EVMs
• USB Interface• Flash Programming
• USB Interface• Flash Programming• Code Trace Options
Manufactures• Texas Instruments• Blackhawk
• Texas Instruments • Blackhawk• Texas Instruments• Blackhawk
Additional Information can be found at the TI C2000 Development Page.
3 JTAG Connectivity Debug FlowsThe following flowcharts provide step-by-step guidance for isolating and performing common troubleshooting advice to resolve JTAG connectivity issues. If at the end of the flow there are still issues, submit questions to the TI Engineer to Engineer C2000 Support Forum for support.
3.1 Overall Debug FlowHow to use these flow charts:1. Review the steps in Figure 3-1 and go through the High Voltage Isolation Flow first. This is important even if
isolation is not a main concern, since it can have an impact on the emulation aspect of the PCB.2. Follow the Main JTAG Debug flow chart. Once you have completed an intermediary step, return to the Main
flow and continue if there are remaining issues.3. If the problem cannot be solved after using all flow elements, submit a question to the TI E2E support
forums. A list at the end of Section 4 provides information on what to include in your question for the mostefficient response from TI.
What Is JTAG? www.ti.com
2 C2000 MCU JTAG Connectivity Debug SPRACF0A – MAY 2018 – REVISED JANUARY 2022Submit Document Feedback
Copyright © 2022 Texas Instruments Incorporated
StartGo Through
Isolation Pre-Checks
Post Question on TI Support Forum
EndFollow General
Debug Flow
JTAG Issue solved?
No
Yes
Figure 3-1. Overall Debug Flow
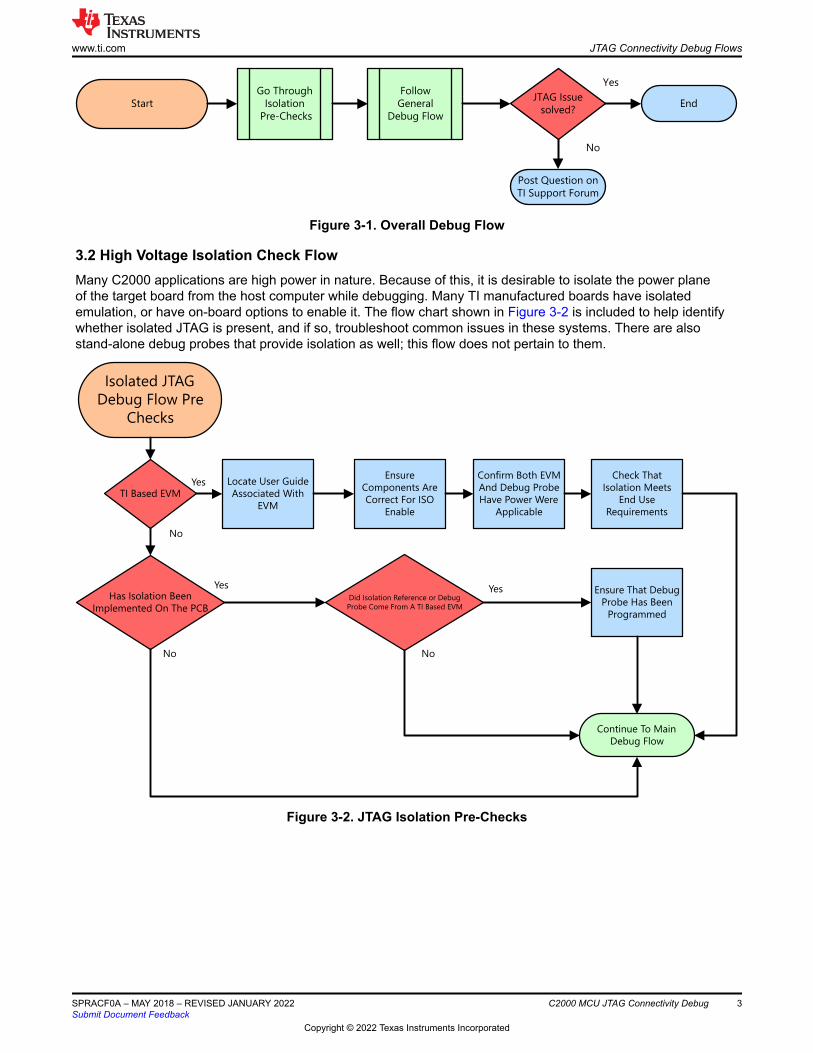
3.2 High Voltage Isolation Check FlowMany C2000 applications are high power in nature. Because of this, it is desirable to isolate the power plane of the target board from the host computer while debugging. Many TI manufactured boards have isolated emulation, or have on-board options to enable it. The flow chart shown in Figure 3-2 is included to help identify whether isolated JTAG is present, and if so, troubleshoot common issues in these systems. There are also stand-alone debug probes that provide isolation as well; this flow does not pertain to them.
Isolated JTAG Debug Flow Pre
Checks
TI Based EVM
No
YesEnsure
Components Are Correct For ISO
Enable
Confirm Both EVMAnd Debug Probe Have Power Were
Applicable
Check ThatIsolation Meets
End Use Requirements
Continue To Main Debug Flow
Locate User Guide Associated With
EVM
Has Isolation Been Implemented On The PCB
Did Isolation Reference or Debug Probe Come From A TI Based EVM
Yes
No
Ensure That Debug Probe Has Been
Programmed
Yes
No
Figure 3-2. JTAG Isolation Pre-Checks
www.ti.com JTAG Connectivity Debug Flows
SPRACF0A – MAY 2018 – REVISED JANUARY 2022Submit Document Feedback
C2000 MCU JTAG Connectivity Debug 3
Copyright © 2022 Texas Instruments Incorporated

3.3 Main JTAG Debug Flow
Non-IsolatedJTAG Debug Flow
Present on Device Manager(WIN)/System
Information(OSX)Fixed
Check Target Configuration/
Generate New One/Run Integrity Test
Fixed?Modify CCS
“On Connect” Action
Start Return Process With TI or Distributor
Post Question on ForumMention:
1. CCS Version2. Debug Probe
3. Custom or EVM4. If EVM, has it ever worked
5. Is there any board that has ever worked
XRSn Stable High
Clock Good?
Change Bootmode Pin Config/ Wait Boot
Mode
Voltages Good?
Check Output of On Board Voltage
Regulators
Check Clock amplitude and
frequency correct
Yes
Power Good LED on?
Check Power Supply Replace USB Cable, Different USB Port
No
Yes
No
No
YesNo
If secondary EVM to checkout, does that work?
No
Is TRSTn Signal Active?
Fixed?Switch to an External Supply and Check if
able to Connect
Using On Board Debug
Probe
Install Device DriverReprogram Emula�on
Controller
Password All 0xFFFF?
Yes
Yes
Fixed?
Disconnecting During/After Run
Check Flash Password Locations
Yes
Yes
For Debug Remove Code
Security Make Passwords all
0xFFFF
No
No
No
No
No
No
No
Yes
Yes
Yes
No
Yes
Check Datasheet:1. XRSN Pull Value
2. TRSTn Pull Value3. JTAG Connector
Distance
Fixed?
No
“Debug State Lost”Message
Figure 3-3. JTAG Debug Flow
JTAG Connectivity Debug Flows www.ti.com
4 C2000 MCU JTAG Connectivity Debug SPRACF0A – MAY 2018 – REVISED JANUARY 2022Submit Document Feedback
Copyright © 2022 Texas Instruments Incorporated

4 Detailed Flow Step InformationBeginning with the Overall Debug Flow (Figure 3-1), decide if the High Voltage Isolation Check Flow (Figure 3-2) is needed or not. Once complete, go through the Main JTAG Debug Flow (Figure 3-3) step by step.
This is a supplement list to the flow charts. This list provides more background on the directive for each step to help better understand what is to be accomplished.
4.1 Isolation Pre-Check Flow1. TI Based EVM: If the EVM under debug is TI based then the flow will follow this branch in the flow chart.2. Locate User Guide Associated With EVM: All TI based EVMs will have a User's Guide or Quick Start
Guide that detail the features of the EVM as well as components that are critical to the correct operation of the EVM. Reviewing these up front will assist in the debug process explained in this document.
3. Board Has Isolation Implemented: Using the reference guide from the previous step, or other documentation if not a TI produced EVM determine if the board under debug has isolation circuitry implemented or not.
4. Ensure Components Are Correct For ISO Enable:Referring back to the documentation for the EVM ensure that any switches, jumpers, or shunts are correctly populated to achieve the desired isolation state for the EVM.
5. Confirm Both EVM And Emulation Have Power Where Applicable:In order to achieve proper isolation of the power planes between the local and high power domains isolators are used to connect the two planes and allow the emulation signals to get to the MCU. Since there are separate power planes there must be two paths for powering each plane. Ensure both planes have power to connect to your device through emulation.
6. Check That Isolation Meets End Use Requirements:While not an essential check for initial system debug, it is important to be familiar with the isolation devices that are used such that it is understood if they will meet the requirements of the end system. While TI EVMs will comprehend this to their end application, if there are TI EVMs mixed with custom EVMs this can still be a necessary check.
7. Did Isolation\Emulation Reference Come From A TI Based EVM:Many times the isolation and emulation circuits from a TI EVM are re-used for a custom design. While electrically sound what is often overlooked is that the emulation chipset itself still needs to be programmed. For a TI based EVM this would occur before the EVM is sold, on a custom board, however, this process still needs to be comprehended in the production flow.
4.2 JTAG Debug Flow1. Using On-Board Debug Probe:
a. Yes: Many C2000 MCU boards have a JTAG debug probe implemented on the PCB. Unless there is an application requirement, TI suggests using the on-board debug probe for development purposes. The XDS100 and the XDS110 are two target debug probes that are found on TI C2000 Evaluation Modules (EVMs).
b. No: If a stand-alone debug probe is used, where the board design is custom, the implementation of the JTAG header and passives need to be verified before continuing the debug process. The device-specific data sheet contains the reference schematic for the proper pull-up/pull-down values to ensure proper behavior. If the PCB is manufactured by TI, this step can be skipped.
2. Power Good LED On: This step is meant to verify that the target is powered correctly from a power source without the use of any external equipment like a volt meter. All of TI C2000 development boards have LED(s) to indicate power is being supplied to the MCU. Other LEDs can be used to indicate some out-of-box code is successfully running. For the location and function of these LEDs, consult the device-specific user's guide for the EVM under debug.
www.ti.com Detailed Flow Step Information
SPRACF0A – MAY 2018 – REVISED JANUARY 2022Submit Document Feedback
C2000 MCU JTAG Connectivity Debug 5
Copyright © 2022 Texas Instruments Incorporated

3. Replace Cables: If the Power Good LEDs are not observed, there is likely a problem with the power source supplied to the EVM. Many TI EVMs use the USB connection not only to provide a debug path from the host to the target, but also use the 5 V from the USB to power the EVM. A simple check can be to change the USB cable to ensure this is not the issue. If there is insufficient power from the host, a powered USB hub can help as well.
4. Switch to an External Power Supply: If the on-board power supply of the TI built board is not providing power at the appropriate level and the USB cables are known good, it may be possible to switch to an external power supply for the EVM. Please refer to the user's guide for your EVM to understand if this is supported. In this case, some probing of the voltages on the board is necessary to determine if the power supply is the issue or something on the PCB is inhibiting the voltage to the MCU.
5. Present in Device Manger: For the JTAG debug probe to communicate the PC, the driver files need to be installed. This typically occurs co-incident to the installation of the Code Composer Studio (CCS). To verify that the drivers are successfully installed, connect the PC to the JTAG debug probe and power up. Then go to Control Panel → Device Manager (Figure 4-1) and locate the associated debug probe.
Figure 4-1. Windows 10™ Device Manager Showing Successful Detection of XDS110 Debug Probe6. Reprogram Emulation Controller: This step ensures that the device that functions as the emulation
controller has the correct firmware.a. XDS100v1: The host device is the FTDI FT2232 following guide on re-programmingb. XDS100v2: The host device is the FTDI FT2232following guide on re-programmingc. XDS110: The host device is a TI MCU TM4C1294NCPDRI3R following guide for re-programming.
7. Install Device Driver:Another possible reason for the debug probe not showing up in the host PC/MAC system is the driver is not installed. Typically this occurs with the installation of CCS, but please consult the debug probe product page for possible drivers.
8. Is TRSTn Signal High At the MCU: This step is checking for a certain behavior when CCS is trying to connect to the target. One of the first actions is that Test Reset (TRSTn) will go inactive high, activating the core debug connection to the external debug probe. If TRSTn does not change state during a CCS Connect Target operation, then the debug probe needs to be checked for proper configuration correctly both at the device level and inside the host's operating system.
Detailed Flow Step Information www.ti.com
6 C2000 MCU JTAG Connectivity Debug SPRACF0A – MAY 2018 – REVISED JANUARY 2022Submit Document Feedback
Copyright © 2022 Texas Instruments Incorporated
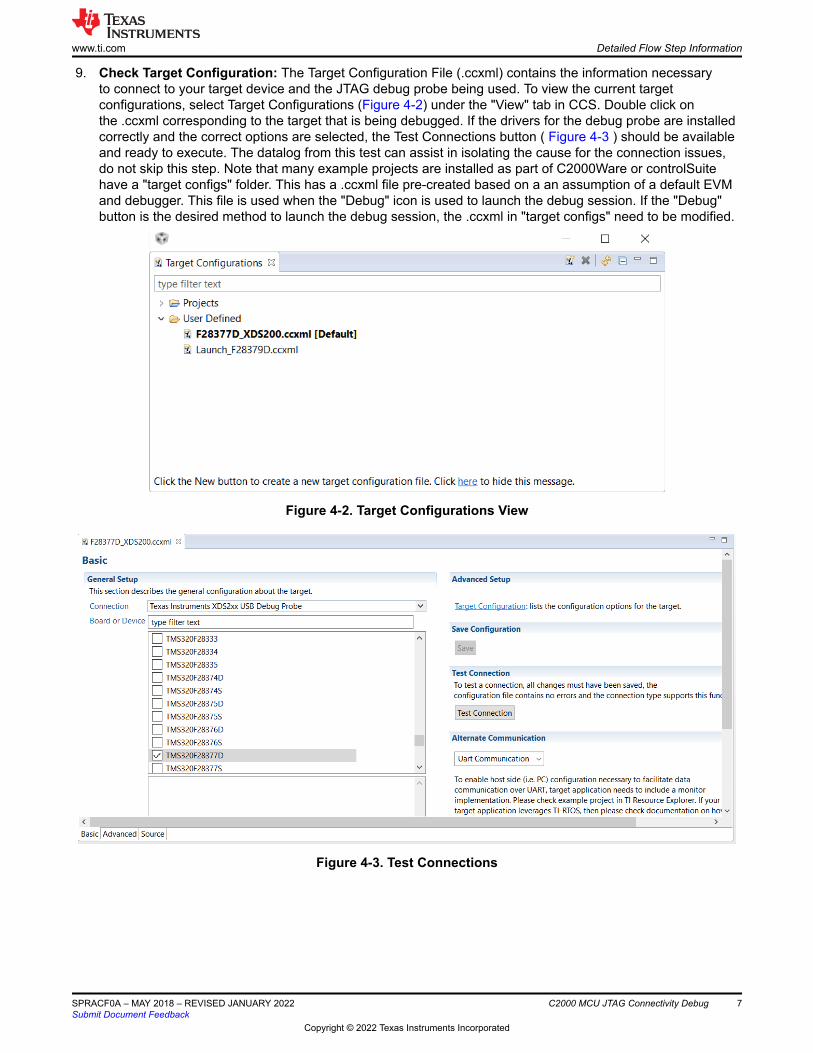
9. Check Target Configuration: The Target Configuration File (.ccxml) contains the information necessary to connect to your target device and the JTAG debug probe being used. To view the current target configurations, select Target Configurations (Figure 4-2) under the "View" tab in CCS. Double click on the .ccxml corresponding to the target that is being debugged. If the drivers for the debug probe are installed correctly and the correct options are selected, the Test Connections button ( Figure 4-3 ) should be available and ready to execute. The datalog from this test can assist in isolating the cause for the connection issues, do not skip this step. Note that many example projects are installed as part of C2000Ware or controlSuite have a "target configs" folder. This has a .ccxml file pre-created based on a an assumption of a default EVM and debugger. This file is used when the "Debug" icon is used to launch the debug session. If the "Debug" button is the desired method to launch the debug session, the .ccxml in "target configs" need to be modified.
Figure 4-2. Target Configurations View
Figure 4-3. Test Connections
www.ti.com Detailed Flow Step Information
SPRACF0A – MAY 2018 – REVISED JANUARY 2022Submit Document Feedback
C2000 MCU JTAG Connectivity Debug 7
Copyright © 2022 Texas Instruments Incorporated

10. Modify the CCS "On Connect" Action: There are two ways to launch the debug session from CCS. One way is to right click the desired target configuration from the previous step and select "Launch Selected Configuration". Once this is done the target CPU can be connected by right clicking on the CPU core(s) and select "Connect Target". The other way is to use the Debug Button (Figure 4-4), which not only launches the configuration, but also connects, loads the target program file into memory, and executes to "main". These settings can be modified but this is the default operation. The default actions can be modified by either right clicking on the .ccxml file being used or selecting "Debug Options" from the arrow dropdown next to the Debug button and changing the auto run and launch options in the Target sub-menu. During the troubleshooting phase of this document, it is recommended to use the former method of "Connect Target". This helps to isolate any issues that are not purely JTAG related, but caused by code execution or other system interactions. Once the system is verified to be stable for launching and connecting the target, use the Debug button to handle these steps.
Figure 4-4. Code Composer "Debug" Button11. XRSn State: Looking at XRSn on an oscilloscope, XRSn should be inactive high when the device is
operational. If XRSn is low or pulsing from low to high to low, it could indicate one of several issues. If the pulses are periodic, it is likely the watchdog (WD) on the MCU that is causing the reset because it is not being serviced or is not disabled. This toggle behaivor is not in itself a bad thing, as it indicates that the MCU is powering up, and executing code, but this can cause instability in the debug flow. If there is non-determinate pulsing or XRSn is always low, it could indicate that the internal Brown Out Reset (BOR) is being triggered due to a supply voltage issue or some issue on the PCB itself. Note that this is different than the static supply checks mentioned earlier. Both of these potential issues can also happen during code execution. They can either disconnect the debug session or prevent it from reliably connecting.
12. Change BootMode: Check the hardware files to ensure BootMode pins are in the correct state for the mode expected. If the XRSn pin shows the behavior mentioned above, or if the state of the Flash memory is unknown, going into Wait Boot Mode will put the device into a safe state allowing for reads of memory and registers. For more details on the boot pins and the selection required for Wait Boot Mode, check the Boot section of the device-specific data sheet.
13. "Debug State Lost" CCS Message: Even if XRSn is in the desired inactive high state, there still can be issues that prevent or end the debug connection. Often this behavior is related to the code that is executing on the device. For this reason it is also advisable to but the device in Wait Boot Mode.
14. Check VREG Setting: Any voltage supplied to the device outside the recommended operating conditions can cause a brown out reset (BOR) event to occur. In these situations, it can be helpful to measure the voltage rails of the device. Using the schematic files located in either C2000Ware or controlSuite, the probe points for the rails of the device can be verified. If this issue is happening during code execution, there can be an issue with the amount of current the source can provide to the device. If the EVM under debug is a TI manufactured device, any rails generated from the external supply should by design be OK, and at this point the checks are being done to verify the board integrity is good.
15. Check Clocks (JTAG Clock/System Clock): Measure and confirm the JTAG clock and crystal or external clock source are as per data sheet defined levels. Check the manufacturer’s data sheet for the debug probe. This is the final step to ensure that the device is supplied with the inputs it needs to function correctly. Many Piccolo™ class devices have a built in, zero pin oscillator. It can be helpful to use this as the functional clock in case of external clock uncertainty. For the available clock sources and their tolerances, see the device-specific data sheet. While the JTAG clock is typically maintained at its default speed from the initial setup file, it can be helpful to slow down the clock rate to see if this improves the initial connection or connection stability. This may be especially helpful on custom designed PCBs.
16. Second Device Check: If after all the above steps do not fix the issue, it is possible a second PCB/EVM can be used to determine whether the issue is local to one EVM. If a second device fails in the same manner there is likely either a setup issue or issue external to the EVM at play.
Detailed Flow Step Information www.ti.com
8 C2000 MCU JTAG Connectivity Debug SPRACF0A – MAY 2018 – REVISED JANUARY 2022Submit Document Feedback
Copyright © 2022 Texas Instruments Incorporated

17. Disconnecting During\After Run: If a device is password locked, the Emulation Code Security Logic (ECSL) in the Code Security Module (CSM) disables JTAG emulation to the device, resulting in JTAG connection issues. This can occur before connection per above, but can also occur during debug if a secure region of memory is accessed while the debugger is connected. While Wait Boot Mode allows connections, it will not correct the issue of access to secure memory while debugging. In order to correct this, the CSM must be unlocked through use of a known password. For locking and unlocking a device, see the device specific data sheet on the CSM module and the associated steps. If the password is unknown, it will not be possible to unlock the device. Debug will be limited to unsecured regions.
18. Post question on E2E.ti.com: If, at the end of this flow, there are still issues connecting or maintaining connection with the device through JTAG, it is encouraged to post your questions or issues to our TI C2000 Engineer To Engineer Forum. When posting, please provide the following information in addition to your issue:a. Subject/Title of the Post: "JTAG Connectivity Issue - (Insert Part Number here)b. CCS Versionc. Debug Probe Usedd. Type of target: TI made EVM or custome. Confirmation of which steps in this guide were takenf. Custom board schematics of the JTAG connection, if possible, if not a TI EVM
5 ReferencesThese are specific support pages that can be helpful in either the debug of a JTAG issue or the selection of the appropriate JTAG emulation device for the end system
• TI Guide to Debugging Common JTAG issues• Texas Instruments: Getting Started With C2000™ Real-Time ControlMicrocontrollers (MCUs)• C2000 MCU Reference Designs
6 Revision HistoryNOTE: Page numbers for previous revisions may differ from page numbers in the current version.
Changes from Revision * (May 2018) to Revision A (December 2021) Page• Updated the numbering format for tables, figures and cross-references throughout the document...................2• Replaced the term “emulator(s)” with “debug probe(s) throughout the document..............................................2• Updates were made in Section 3.2.....................................................................................................................3• Updates were made in Section 3.3.....................................................................................................................4• Updates were made in Section 4.2.....................................................................................................................5• Updates were made in Section 5........................................................................................................................9
www.ti.com References
SPRACF0A – MAY 2018 – REVISED JANUARY 2022Submit Document Feedback
C2000 MCU JTAG Connectivity Debug 9
Copyright © 2022 Texas Instruments Incorporated

IMPORTANT NOTICE AND DISCLAIMERTI PROVIDES TECHNICAL AND RELIABILITY DATA (INCLUDING DATA SHEETS), DESIGN RESOURCES (INCLUDING REFERENCE DESIGNS), APPLICATION OR OTHER DESIGN ADVICE, WEB TOOLS, SAFETY INFORMATION, AND OTHER RESOURCES “AS IS” AND WITH ALL FAULTS, AND DISCLAIMS ALL WARRANTIES, EXPRESS AND IMPLIED, INCLUDING WITHOUT LIMITATION ANY IMPLIED WARRANTIES OF MERCHANTABILITY, FITNESS FOR A PARTICULAR PURPOSE OR NON-INFRINGEMENT OF THIRD PARTY INTELLECTUAL PROPERTY RIGHTS.These resources are intended for skilled developers designing with TI products. You are solely responsible for (1) selecting the appropriate TI products for your application, (2) designing, validating and testing your application, and (3) ensuring your application meets applicable standards, and any other safety, security, regulatory or other requirements.These resources are subject to change without notice. TI grants you permission to use these resources only for development of an application that uses the TI products described in the resource. Other reproduction and display of these resources is prohibited. No license is granted to any other TI intellectual property right or to any third party intellectual property right. TI disclaims responsibility for, and you will fully indemnify TI and its representatives against, any claims, damages, costs, losses, and liabilities arising out of your use of these resources.TI’s products are provided subject to TI’s Terms of Sale or other applicable terms available either on ti.com or provided in conjunction with such TI products. TI’s provision of these resources does not expand or otherwise alter TI’s applicable warranties or warranty disclaimers for TI products.TI objects to and rejects any additional or different terms you may have proposed. IMPORTANT NOTICE
Mailing Address: Texas Instruments, Post Office Box 655303, Dallas, Texas 75265Copyright © 2022, Texas Instruments Incorporated
Copyright © 2022 FDOKUMEN