C0(' Y - ECA Repository
77
_-->,,,,""">-·_1.) Z! ·1 Q: E' TGLISH DOCUMENTS OFFICE C 0 (' Y Di s tr-, LIlIIT='D E/GN • 14/LU/rcCOP/5 &p't0mbcr 1965 EcmT01HC COElUSSION FOR ;,FRICA on Economic Co-iopcr-a t i.on in Ea"t ,cfricJ, LUElakQ, 26 October - 6 Novcmbc r 1965 UMITE!D NATIONS ECONOM IC AND SOCIAL COUNCIL EAST ,1.FRICA: TRJ:NDS AND PROBLEMS
-
Upload
khangminh22 -
Category
Documents
-
view
3 -
download
0
Transcript of C0(' Y - ECA Repository

_-->,,,,""">-·_1.) Z! ·1
Q: E' TGLISH
DOCUMENTS OFFICE
C0 (' Y
Di s tr-,LIlIIT='D
E/GN • 14/LU/rcCOP/5&p't0mbcr 1965
EcmT01HC COElUSSION FOR ;,FRICASUb-RGgion~l M~cting on EconomicCo-iopcr-a t i.on in Ea"t ,cfricJ,LUElakQ, 26 October - 6 Novcmbcr 1965
UMITE!D NATIONS
ECONOM I CANDSOCIAL COUNCIL
EAST ,1.FRICA: DVELOPIt~T!T TRJ:NDS AND PROBLEMS
6~2940

----I ,--------------------------'•
• E/CN.14/~Vl~COP/5
FAG'; NO.
1- 2
B. c,.o"Q •• ", .
Popula han"
Pa~+crn of lc1nd.. utiLi za t i on .• ~ ..• 00. G, ......... d ........ o.o. ..
3
1
nv. ..C(;l<:Gl',IIG liED SCCi.1L lJ.;..,V "J- ~). o. ••• , o.o. .o. •••• '''o.o.o. .'o.
Per capu t. GDj' 12vEIE~o,_co ••• 'co.Q." •• o •••••••••••• 11
~"Jage and cmp Lc ym-vn« 1>.'vcls •• ~ •• ".~ ••'~ •• 4 •••••• ".... 11
~.:norgy cons"L~mp+:ion.o.o.,- •. 'o. ••• o. "o.o. b" Q < o. o.o.. 18
'F"d ' ' 't00 con sumov i cn pa" .GEns •• ~ .••• o. ~"o. ~ .... o. .. o.,o. ..... ~,'.
-ducation and hcaLr.h ~ . ,~ ... ~ ~
0\l:tpu+ s+ruc+,ure~. _, .. ' ...... ~o. ••• _ 0" o •• ~ ..... o. •• o. .......... o.
Subs i s t cnce ou-t pu-: , . • ~.o.o. ,'o. •• o., .. o. ~"" .o. .
~uropcan and Africau agriculture, .. ,0.0.Q •• O •• o. 00.
Lane. conc ent r-atl on , ~ < ~ ~ ~., .,','. ~,., •••••• ~ ~ ••• ~ ~' •• _
Fertilizer i~"}p1.J.ts~. u', 0 ••••• ' •• ' ••• , ••••••••••• " ••
Changes in agr-J.c"l'cU1'a2. output •. ', •..•....... , ...•
Indus-t;rial a c-ci v i. +:i.es •••. ~" , . p • 6 ••••••••
Lndue t.r-La L po Leri za+ion and oi.nc r sha p .• 0 • " 6 ••••• " '.
Indu2'.tri_~l i"c!}JIJJ"'kn't, ~ '0 <"" 6 u •• " 6.0" ~ ,~ •••• ~. <' o.
fJ.1urti\:,-:..f·Y 2..ctl. Vl 't i __ L. ~, o. _' • .J""" ~ '0 0 ~ 0 ~
FUR-iIGN T'R.AJ):=;. . • 0 , ••••• < 0 • 0 ••••••••• " ••
o~~~··""·.·.·.~o~,,.~ .Destination nf' ~ecordad cxports.~ ..••••.. < • • • • • • • •
St.ructure of impor+ by c ommod i, +,y br-eakdown ~ ••• < ~
Or i gf.n of rt',Doru£'d -lmpori p •••••••• ~ ...
Intra-sub-regional +rade •• ~ ••...•• 0 ~ •••• ~ •• " •••• ,;
i -
20
22
26
21 .~
28
29
33
3536
424445
52
54585861
64 - 13

£1Cl1.14/LU/ECOp/s
F8rtilizc;r and i c.i tor-s
' ..'.,popuiut i.on and pJrcent=r,geProportion of Eu-r'OpcCll1S to total
or Lqnd ·re-sorvsd for Europeans
Componc n ts of industri .11 :1C tivi tios .rr-ound 1963
Size' of J;Urop('<111 farm in se Le o t.cd countries
Evolution of ,'J.cr."icul tur i l. output
Str~~~urc ~f G~P ~rouDd 1960
1"" .-" ,Subsistuncd" ;~nd "m'::r.,rk0t Clg'rlcul tUl"'e' in selLctGQ c oun tr-i e s
B~sio h ~lth indic~tors ~round 1960
Pro scn t Lc vc Ls _,L"}l~ t~r';;:;'tsC-of c8t-im:.~tGd food sup 1ic.:.8 ford.ri Iy .IJq:t;' c'_~pu1' _C:Jn;)tl!:::I)tion~ ],round 1960
PurC"-_Llt~.t'~( '.:;1' t:"'Jt ~l I~OI}ul-"tion in 1.1::,:,1>:n Lru(1S of20':; 000' .rid i:'·jI'C
Zambi0g. ~QJ!P9 qrpP+oY:::Ylf}, .\'r8.g2~ 'by ~<..Oct(j)r.s.J,.i1d c thrri ccroups in 1962
KG~lY€1 g . f9:r9<.Jrl tag'.,; of t~q: payc r-s in i..,J,ch i ncome groupof r~c8, in 1962
T~ii-~l',~~:<yi1jJ,F. rot ..;;,+ nunb..r- ()f Af r i can paid cmpl.oycc.s ~
skill,~cl ,111CL unskilled
Kc.nya ; Per o apu t GDP by pr-ovince in 1962
'I'o t.aI : __nc pl;r c.rput ou t.put .aid coricump t i on ofolGct~ic~ty.in 1962
TABLE 1
TABLi: 2
TAIlLic 3
TABLE 4
TABLE S.
'PAlLii: 6
TABLE 7
TABLE 8
TABLE 9
TABLE 10
T"BLE 11
TABLE 12:' +
TABLE 13-'If
TA13Ll:; 14
T.BC; 15
TllBLE 16
TABL}~ 17
TABLE 18
TABLE 19
TABLE 20
1'ABLE 21
ii

•
•
TA"3~E 22
TABLE 23
TILLE 24
TA'3:,E 25
Tjd3=.J;'~ 26
TAf31~E 27
TAI3LE 28
TAI3LB 29
TAllLE 30
TAllLE 31
TABLE 32
TA:JLE 33
TKi~LE 34
TA:.:JLiS 35
TA3LE 36
TMILE 37
TA:'n.E 38
E/CN .14/LU/ECOp/5
LIST OF TABLES (continued)
Level of industri~l activities around 1963
Evolution of inclustrial activities
Structural changes in industrial activities, 1955 _ 1963
Total omployment in industrial activities in 1963
Pattern of terti:1ry activities in GDP, in 1962
Evolution of terti_cry sectors
Balance of trade in million US $
Foreign trade balance
The average unit value of exports f.o.b. per ton
Structural characteristics of exports in 1963
Exports of selected commodities as percentage of totalsub-regional eA~orts
Destination of recorded exports
Imports by end use in percentage
Origin of recorded imports
Value of recorded interterritorial exports in millions of ~
Interterritorial trade balance
Trade b a Lunce ld th th8 e x t.e r-n a.j world
iii

•
,f'., ,
'E!CN ,14!LU!ECOP!5
co INTRODUCTION
1. The E~st Afric~ sub-region cnglobus a tot~l ar8~ of ~bout
5.". million square kilometres or about 18 pc r cent of the continent's
ar-oa, It Li cs appro ximato l y botwounJ:.~~_tt:.do_s BON to 2~o_~~a?d is
bClu,tLd on the west by the ~1fdan, tho Congo and Angola," on tho south by
Mozambique and South Africa. Its coast is w~shed by the Indian (cean,
th,u Red Sea and th" Gulf of Ad,e", It forms abel t approximately
1,:200 kms, wide and 4.,250 kms long, embracing 10 independent nations
and two territories)! Total population in about 1960 was estimated
at 68 million, or one forth of the toti11 of the African ccntinent,:.f, 1.
2. The sub-region can be divided into several natural zones bdsed
mo:~tly on a variety of relief and climatic conditions, which provide a
ke;~ to the understanding of the pattern of population distribution and
economic activities. According to the FAO Africa Survey, the sub-region
can be sub-divided into the six following zones:
(a)
(b)
(c)
(d)
(e)
(f)
Eastern equatorial desert anu sub-desert zone
Eastern equatorial savannah zone
Eastern coastal zone
Lake Victoria
Eastern and Central Plateau
East African Highlands
th" Laa f three are ,the most important zones for rapid economic
d.eveLopmeri t.
The Lake Victoria Zone
3. This area comprises mainly the Lake Victoria depression and areas
to the north and west of the Lake. The western part has a relatively
high rainfall of more than 1,000 mm. annu411y. This is the most fertile
and. densely populaterl area of former Bri t i s h East Africa; its major
It includes the following ccuntries: Ethiopia, Somalia, Uganda,Kenya, Tanzania (which includes the off-shore island", of Zanzibarand Pemba), Rwanda, Burundi, Zambia, Malawi, Rhodesia, MadagascarCi"d ~Iauri tius.

E/CN.14/LU/ECOp/5Page 2
export crops are cotton, coffee, sugar cane and groundnuts. Food crops
include maize, millet and sorghum; plantains, bananas and pulses.
Eastern and Central Plateau
4., This is a vast tablelund straddling the eastern and central parts
o~ former British East Africa, attaining heights fre~uently exceoding
1,200 me tres and ri sidg to even high a1 ti tudes in certain locations.
This zone which is' divided by the two arms cf the E,ast African Rift
Valley possesses great ecoldg'ical variations. Rainfall and' temperatures
also differ widely because of' the' great variations in aiti tude with
precipitation oscillating between 2,:540 mm. ye2xly in the'highlands,
to about one-tenth of this, or even less in some parts of Tanzania.
Similarly, as a result of marked differences in temperature and
altitUde, the soil r~v~a~s_.~ubstantialpedological variations. Major
zonal export crops are groundnuts, tobacco and sisal; food crops
include maize, sorghum and cas;ava.,
East African Highlands
5. This area embraces a substantial part of Ethiopia, Kenya, as well
as Rwanda, Burundi, and some parts of Rhodesia. It reaches its
greatest altitude in Ethiopia and Kenya, but generally ranges about
1,500 metres above sea level and is characterized by high rainfall and
mild temperatures. Where de ep and fertile soils prevail, oombined
with adequate rainfall, permanent and dense settlements can be found.
Maize, scrghum, plantains and bananas, are the principal food,crops, .._. -'" ._. --_... -..- .-_ ...
while the most impcrtant export crops are coffee, tea and pyrethrum•
. r.· . i [. -,

•
__________, ._.,;..P;...,_,_~""""'·....',·~'~,.,....<--"-.c··".-
E/CN.14/LU/ECOP/5Page 3 '",.
:S. !lill'UlN MID LAND R 20:mCIGS
Population
6. 'Ihe su"..'.region l s human and land resources held the keys to its
s o c i a.I and e conoru c contours. An overwhelming proportion of the people. 1
stiLi live in rural areas vi th more than four-fourths whoLl.y dependent on
agr-a cul tur o for their li'idihood. In many areas they eke out a bare,
subeostence from a nomadic and s em'iv-nomadi,c way of Li f'e , This is
strikingly sa in Somalia where about two-thirds of its inhabi tants are
nomadic, directly dependent on stock raising.
7. hS ahovn in Table 1, the' po'puLa tion of the East African sub...,reg.i,on,
in anou t 1965 was estimated at 75 million. 'Within it there are of course
cons:'clerable demographic in'ter-country variations and only two have
popuLa.to.ons whi ch exceed' 10 million, namely Ethiopia and Tanzania.
Behi ud the average over-all densi ty of some 14 persons per square
k'i.Lome t.r-e for the sub-region as a whoLe , there are great inter-country
d.i f'f'nr-encea , ranl,lng from about 3 persons per square kilometre in Somalia,
to ml)l'ethan 100 for Rwanda and Burundi and risin", to 350 for Haur-i, t i ua,'
8. :~oreover, popuj a t i on densities vary Dot only between oountries, but
equally Vii thin each cou.i t.r-y s In Kenya, for example,' the over-all densi ty
is a'oou t 15 per squar-e kmj but in the Centred ,province this rises to,
about 67, whereas in the Northerilfrontier province, there is a.n
esti~ated density of 2 only. Equally in Somalia, ',hich has one of Africa',;;
lowest over-all densities, regional differences are striking, ',i th a
varying densi ty r-a't i.o of I to 14. In Madagascar, the greatest,
population conocn t.r-a t i on occur's in the eastern seaboard, in the
Tana.narive region and. in the Lcver' Be t s.ibaka river valley; in
Tanea.ayika there, are enormous tracts mainly in the Western region which
are sparse~y ~Dpulated, Vlhile certain highland areas betray symptoms
of population pressure.
9. For the d~cruie 1950-1960, the average SUb-regional population
growth rate was some 1.8 per cent. In the last five years this rate
exceeded 2 per c<;~t, whi oh waQ somewhat 101<er than that of the West and

E/CN.14/LU/ECOp!5Page 4
North African sub-cregi.on ,
rates exceed 3 pe~ cent,
(3.3) and M~Jritius (3.1).
There are four countries whose growth
Burundi (4.9), Somalia (3.2), Rhcdesia
The major reason for differenoes in these
rates would appear- to stew from o.e oLine s in mor tali ty and varying rates
of net migration.
10. Emigration has also played RYl important role in the region's
economic de7elopmento Trao.itionLl emigration to nnne s and urban
centres seen in Malawi and Rhodesia in recent years has led to a fall
in their rural labqur fOrce, It has been estimated that, (aocording to
the 1961 cenous) ,over o'l8.-half1;{f tJ:1e Malawian >fage-earners are engaged
in the copper belt mines of Zambia or Witsvatersrand mines in South
Africa. . They remi t J52milliotl home annually, Malawi is budget is
hl5! million.
11. There are consider'able variations in the percentage of total
population in tOlins of 20,000 and more inhabitants, ranging from around
1 per cera for Uganda to 27 pel' cent· for Mauritius. It appears that
there ar-e only eLe ven ci ties >fitll populations exceeding 100,000 and no
urban centres. exceeding half a million. Judging by the record of other
developing couut:ries, the sub-regionh<s yet to experience a s~rious
wave of ur-bana sat i on with its resultant increase in variations and
sophistications in diete This phenomenon would then lead to larger
food import bills; if ,as is so often the case, agriculture and
industry fail to meet the ohallenge from internal resources. This wa;[
lie balance of payments difficulties that obstruct development in many
countries today;
12. Another Lmportan t demographic feature is the prevalence of
relatively large and economically powerful non-African groups, i.e.
Europeans and As i ans, In
in agriculture, mining and
some areas, Europeans playa pivotal role
industry, domestic and foreign trade, with
their share in total population varying from 5 per cent in Rhodesia in
1963 to 0.2 per cent in Tanganyika and Uganda around 1958. Al though a
segment of the European population has been settled for one or two
y 71,s Ecor,omist, 7-13 Augus t , 1965, Southern Africa SurveySupplement, page xvii

r ,.,;
I i
'00 4Re cord.e "" j - ,,I
Cent : Jf Poou.Letri on I, .JenSl ty
II . .
I:I GLJwthI . Pericd Hate f
\ 'I I28·9 jT{S:J7-6:-'- 1.6 18.4 I14.,0 I 1948-37/ 1.8 11.2 I
58I
It~1 j19 )tl-52 2.8 4·919~J-6) 3.2 3.4
7.7 I j,°58-62 2.8 9.7II12.2 I 19~q-62 2·9
I
15.8I,I
5·7 I 1958-62 .. 3.3 11.0 ' .
9·& I 1943-59 2·5 30.6 1
i I . ,503 1958-62 2.1 I 33.63.8 i 19>8-62 ,\ 2.6
1
109•6
,I'
1.8 i 1958-:>2 4.~ 101.81.0 I 1"58-64.3.1 i 351. 4i
10).0
UKR, Sud~n, Morocco, Alberi~, Tunisia, LibyaNigeria, Chana, \Ji:!!Br Volta, M'11i, Ivory Co-is t , Seneg,11, Gui.ne a , ll i.g e r , Simxa Leone,Dahomey, Togo, Liberia, Mauritania, Gambia.G~bon, Centra.l African Republic, Chc,d, Cameroun, Congo (Br",,"z a.), C01(1:'O (Leo.)South Afric~, Basut.ol and , Scuth-West Afric2., Beohuanal and and S;.a.zi1~r,d.
Spanish possessions in North Afric'l., Portuguese Gui nea , C"pe Ver~e Ls Lc.nds , St. He1eri-li,inc1ud;i'ng dependencies,·.Spanish Equatorial regions, S'.l.otomeJ.nd Pri"'.cipe, Reunion,. Comor-oLn.Lands , French SomaliLmd, Seychelleei; Angola and Mozambique.Study on Recent Demograph i.c Levels and Tr;'nds in AfriyaECA Estimetes.
i'. LE3,st AfricayJ''a. ". -IiI North Africi5 '
I West Africg; . "I ' y'I. I Central Africa W
I SoutheryAfricaOthers· ".. .,. _. .Total Africa
TABLE IEAST AFRICA; AREA, POPUL.'.TION AND DEIISUY
., t .
•
•
13.79·1
15.84.72·75·2
10.0
'. '"' '. t:.1','(1 .? 7'2.7
1.62·51.2
J, .2.3
E/CN.14/LU/ECOP/SPage 5
1960-65J;>60-651;,0-65l'J6G-6s1~60-65
19';0-65:"-;1.0-6
J.,4'"1 18.0 75,113 I 25. 7
, 8,217 27.:2,75,125: 21.16,124 20.6 9<;,894 I 32.8
I.5,330 17.9' 25,070 1 8.S2,668 8.8 19,940 6.3
1,
1 2,3:7 7.9 13,809 4. fl30,227 100.-6 305,981·· .. 100.).-..
1 ~ • ,
) i: ' : Area ~.]I D'I. te iiilla. Year- .r 2 I Per 'roDul,tion II
'of In~ependE\n_Ce (000 km Cent (mid-196S)
,~ -h' Population/--- ~ --~- - - I .'.
l i -e-stima-teI i ('ODD)
I" ;Ages 1,184 I 21.6 I 21,750~Dec. ~ 1961 I 940 I 17.1 10,490
IOct.24 1964 I 746 13.6! 3,675IJ u L 1 1960 638 lL6 2,190IJUn.2~ 1960 I' 596 10.8 5,775IDec.l~ 1963 :583 10.6 9,200I! 389 7.1 4,275Oct. 1962240 4.4 7,350
,'JuL 1964'119 2.2 4,000Jul. 1962 26 0.5 2,850Jul. ~ 1962 28 0.5 2,85 0
! - 2 O.o! 738I 1CO.0
I
II
Countriee andsUb-r,egions
Notes: !!:Iyy'y~.
Sources·g
"j c
1. Ethiopia2. Tanz arri, a , '
3. Zambia4· Sorn a.Li a
5· Mad"gasc3,r6. Kenyi7· Rhodesi:;l.
I 8. Ug"nd",
I 9· Mal'1wi, ", '
110. R\f3.nrhy' . 11. Burundi
12. Maur i, tius
j .. - .- - .-

Percentage of Total Pop' letion i~ Urban Areas of 20,000 a~d moreIC~.14/LU/ECOp/5
,9.">1' 6
"-. ' ,, ,TABLE 2
Population of Capital Citiesand other Cities over 100,000
J.ntry YearTotal
PopulationTotal UrbanPopulation~ Cities Population
-
119,900
57,900
2l5,500~154,800~100,20~,101 600"ij,
90,600
254,300
266,800179,600
. 448,500128,000
22 OOO~,128,700
47,0#
10,900
Dar-es-Sa.laam
Zomba
Port Louis
Zanzibar
Bujumbura
Entebbe
Salisbury
EulawayoLusakaKitwe
Mogadiscio
Tananarive
. NairObi
. Mombassa
. Addis AbabaAsmara
60
77 .2
86.4
41,0
-, ~
1
'-
6.0 75.0
4.7 59.0•
5~2 · 87.9
( , '
2.8 • 72.0·
1,5
17.6P.!
12.e2I
5.8sY
•
20,000
2.0
3.8
8.0
7.9:
5.9· .
1.9
1.9
1,2•
0:;
27.4
19.4
14.s2I14.1sY,
1958
• 1958
• 1964
• 1963
2962-1963
:1959
• .1962·j • ~ •
i962-1963•
~
malia
-mb i.a
~hiop1a
.any a
}tes: ~ Inhabitants in cities over~ for 1962£I including nearby suburbs~ urban population only~ urban agglomeration!I estimates
.rur-cee e UN Demographic Yearbook, 1960, 1963; ECA, Demogr"phic Levels and Trends; Rhodesia, Monthly Digest of Statistics,November 1964; Northern Rhodesia, Preliminary Re~?rt of the May/June 1963 Cene,us of Africans in Northern Rhodesia1964; Compendio Statistico della SO:r:21:.!§:., No.1, 1964; Population de Madagascar au ler Janvier, 196Q; Kenya,Statistical Digest, September 1964; Ethiopia, Statistical Abstract, 1964; Tanganyika, Statistical Abstract, 1962;Uganda, 1963; Statistical Abstract.
11awi .1962
'2lgaqyika 1957
·U'undi .1960
~anda . 1959'. !/.
>tal.East ,Africa 1960
"lri tius.~~zibar and
mba
·.odesia
',dagascar
•
•
E/eN . l4/w/EOopl5Page "7
1-' _..__...
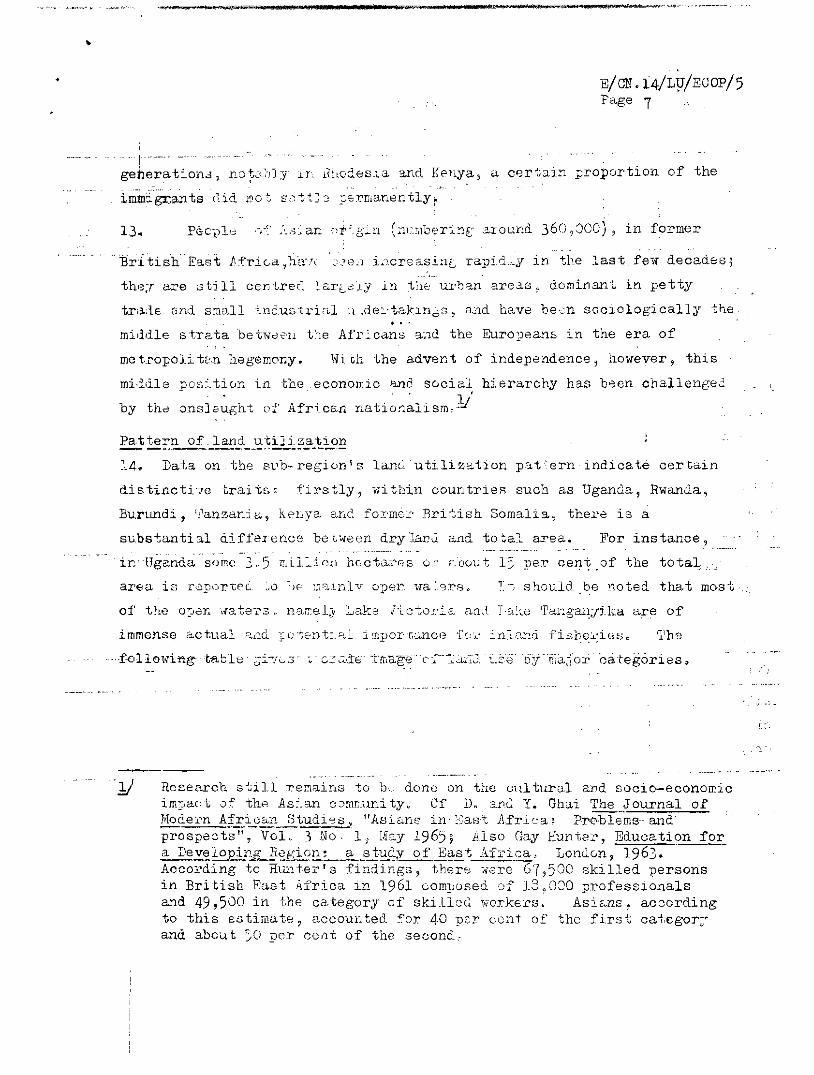
genez-a t i.on.s J nO~3'~'J] y' r r. iEtc,des.'..a and Kenya 5 a certain ;JI'o!,0I'tion of the
imm::'gT;ants (lid ],)G~ 8,~t"t~ -:: ]s.l:·maYlentlyr
13. ~ -,', •....
-"'British" Ea8t 1J:friGa1a 'u:I ( ~;~~8~J L1creas111t rapid ...s in the last few decades;
thl~;r are atj 11 ce n t.r-er. laI'[c'l~\t i~ t he ur1J~n?.rea.s, dominant in petty
tri3.~l€ and srno.Tl inc.u8tri['~1 :i Ide:::takin6s, and have b e e n soc i.o Loga caj.Ly the
middle s tra.ta bet1-l001l t:le Afr~cans and the Euz-opeans in the era of
met.r-opo Li. t2n hegemony. Hi Gil the advent of independenc"J, however, this
middLe POs~_ti0n in the .e conorm c and. social hierarchy has be en challenged.
n a't i Q' oa'i L sm. y'by the ons l eugu t o f Af'r-i can .~ --
~teo:~L!~..d_.~~i}i,,,,~.i:..~~
14.. Data on the svb-regi0n ls Land u t i Lt z a t i on p a tre r-n indicate certain
di s tincti7e trai ts s firs t Ly , v,i tbin COUl1 trieR such as Uganda, Rwand.a ~
Bur-unda , 'i'anzan i a , 1\.pl:iya and f'o rmc r- Bri ~ish Soma.Laa , there is a
su,bs~anti:a.l differ-ence be tween dry J~u and to ca.l. area. For ins tance ,
T -t should .be noted that most·
"1/ Research s t i Ll, r-e na.ins to b., dono on the cultural and socia-economicim]act of th~ As~.an o omnun i ty" Cf D" 3.Y1_G. Y. Gha'i The Journal ofMode:f'n AfricfL.H Studi~s ~ "As i aris in' ~,:~a8-t jl,J'riea ~ P-r0-bleme-- and'prospect;"':Vo-CT~l,[hy 1965; Also Gay Hun t.e.c , Education for~ Dev~l0l2..:hF~g_B-£k~iG!2.!.-_~_st~s;vof ~ast Afl"'~~; Londcn , 1963. ,--Accor-d i ng to Hun tel" 3 finiings, there ;;ere 67,500 ski Lle d personsin British East Africa In 1961 composed of 13,000 professionalsand 49,500 in the category of skilleC: ",orke:L's. As Lans , accordingto this estimate, accounted. :'01:' 40 p8!, cent of the first cat.e gor-yand abcut ';0 per cei1t of the second.-
.: -

E/CK.14/LU/ECOp/5~8 TABLE 3
•
East ~frica: LanQ Utili~ation by Major Categories
A/!ricultural Land OtherCountry -, , T_vtal .cra oLe Land Permanent Unused but Built 0;'1
3ub-region Total Land c Land under foIeado';! & Forested Po tentia11y on area"Continent Area .crea pe rranent pastures Land productive wasteland. crODs & other
in per cent
Mauritius 100 (95) 5(; 17 23 11
Zambia 100 (99) 41 ... 50 10
Rwanda-Burundi 100 (93) 39 32 4 25
l.ialawi 100 ... 25 5 19 5=-Uganda 100 (87) 12 7 ... 81
Ethiopia 100 10' 50 4 37
'I'anzarri.a 100 (94) 10 35 38 17
Rhodesia 100 5 13 G1 2,e,
1~adagasc8cr 100 (99) 5 57 21 9 8
Kenya 100 (98) 3 7 3 87
Somalia 100 (98 ) 2 32 23 26Y 17'-----, :?
East Africa 100 11 32 24 33
North Africa 100 4 10 12 74
"est Africa 100 ... 12 6 18 64
Central Africa. 100 13 11 29 47
Africa 100 C 20 24 42
Latin America 100 5 19 47 2Q
Asia 100 l"r 12 24 4 8
Europe 100 31 18 28 23
Source: FAO, Production Yearbook, 1963.
V .30uthern rcglons· on l y

-->«---1 ,_.-------------------.
E/ CN .14/:LU/';;COF/5Page 9
15,. This data should be treated. Gnly e.s illustrating or-doz-e of! I:ll1gnitude since it
.involves yery broad oategories. Arable land and land under permanent
Ol!OPS is the mas t importan t economic category, For the East Afrioan
.sub-region , tle percentage share of arable l<;>.nd in total area is around
11 per cent compared to 10 per cent for Africa. Sub-regional average
shares, hOj<ever,ecnceal important inter-country differences ranging
f'nom 2pe:r:;.cent 1'01' Somalia, to aboct 50 per cent for Mauritius.·
In Somalia, Kenya, Rhodesia and.Madagasoar, the portion of arable land
and land under permanent orops, in general, is a relatively small fraction
of' the total area.
16. Account should also be taken of forested land, although here again
this broad category oan be very misleading siuve it is extremely arduous
to make a cl ear-cu t distinotion between thinly stocked forests and
wclSteland.Further, the actual data do not reveal the genuine forest
potentialities in separate countries,
1~1. Unfortunately, there is only fragmentary data on unused but
potentially productive areas, save. for a part of Somalia, Zanzibar and
Pemba. In Madagascar, where only about 5 per cent of the total area
is clascified as arable land and land under permanent crops, it is
balieved that the arable area can be doubl~d, There are also some
estimates for Uganda, which put the cultivable area'at 14.2 million
hectares, 1/a figure which is much higher than the FAO's estimate for
total agricultural area. To 0-2 sure, a large part of the area now
currently classified as non-arable could be brought under cultivation
bJ' land rehabili tatiol: measures and. irrigation, As an illustration,
i 1: may be cited that sugar cane and citrus fruit are now being grown on
iITigated land in the low veld of Rhod.esia, a region that was hitherto
Classified as unproductive.
Y IBRD, Th~conomic_D~~~.l012.ipent 0:f--.!!g~~a., The John Hopkins Press,1961, page 99.

i;/ IN.14/U::j::OOp/SPage 10
18. Hi thin the c ategor-y 01 arable Land and land under per-manent
crops, there.is considerable scope for raisint,c yields and 'boost'ing farm
productivi ty. Change~ in'the indigenous pattern of land cultivation
wh-icll. is still technically prim'i tiV8 9 'subsistence <1{2,'riculture ~ri th 'very
low yields could defi"itely revolutionize farm output. ~his Hould
entall not merely' a metamorphosis of present land tenure systems but
eQ.uallya,nd more cr-uo i a.I tho utilization of more rr; :farming techniques,
fertili'zers' and other t.e chn i c a.L inputs.
19. It ohould be s t r-e s s ed that there arc f ac tore bo t r, physica.l and
environmental, albeit trmlsitory, that inhibit a :further extensioL of
. tho cul t i vated area; -oheprescnc8 of the tsetse-fly severely
··;····ciTcums·crib·~s cattle raising and general human productivity. In forn:er
British East Airicatset~~~flY infestation encompasses approximately
forty per cent of the land a.rea and COIncideS l~rgely with those ar~as, ~.,." ')c
WhICh offer good proS,-'Bcts of mixed farming. Vigorous and concerted
measur-es are .oc i.ng taken by· the g-overmtehts o f Rhodesia, Tanzania
and Pa1ll.bilJ. for eliminating this scourge.
".. l':'" '.'
,~ .
,','.-

• I--..,-----
E/CN .l4/LU/ECOP/SPage 11
C. ECONOMIC MID SOCIAL LEVELS
20. The sUb-region includes countries with heterogeneous economic
structures, differing econom"c and social levels and rates of development,
for instance in the countries of the former Federati9_n__of Rhodesia and
Nyasaland, which operated for many years under a common development
policy. Malawic's economy is exclusively agricultural l. Zambia's is
dominated by mining, while that of Rhodesia is more diversified. Uneven
devs Lopmerrt of the productive forces is reflected in divergent per
cali'i ta income s.
Per caput GDP levels
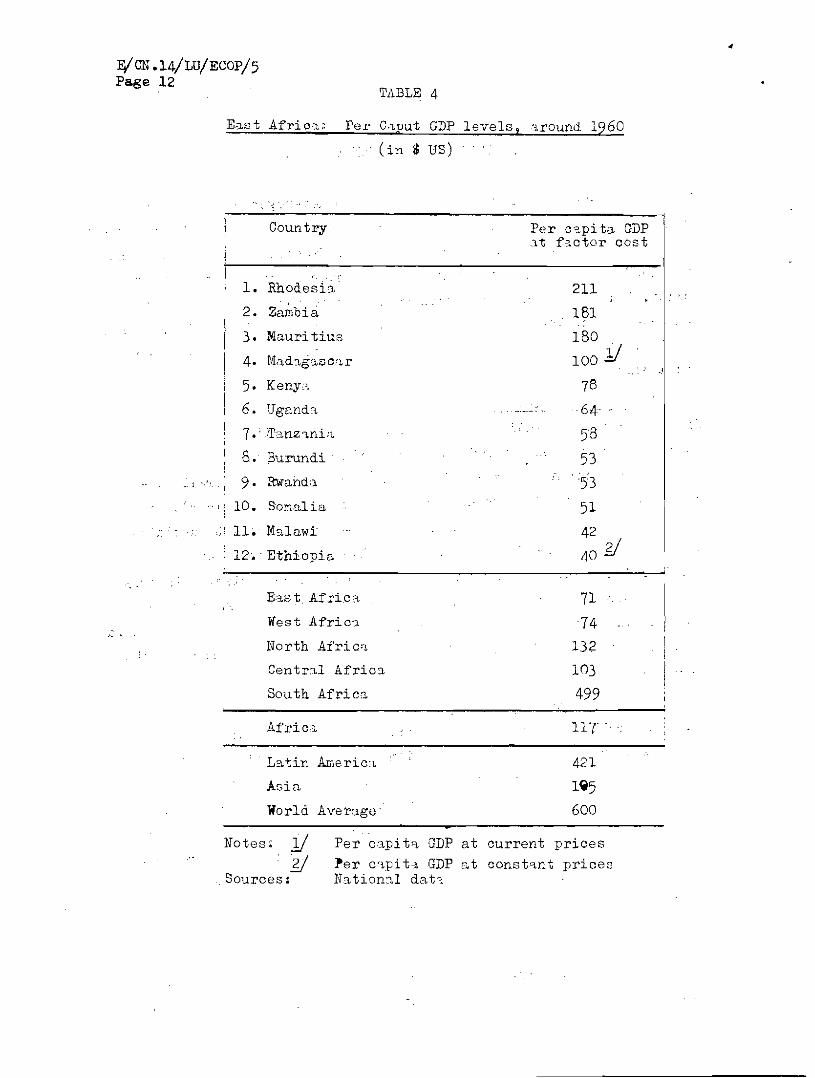
21 Per caput GDP indicators should be handled cautiously and allowance
made for the very wide margin of error inherent in population and
national accounting estimates in the African region. Overall sub
rElgional per caput GDP around 1960 was about $71 (see 'table 4), or
appz-oxama'teIy that of the West African sub-z-eg.ion , but SUbstantially
lower than the all-African average of Hl 7. However, there is
considerable-variation of a-~crage income between countries. In only
four (Rhodesia, Zambia, Mauritius and Madagascar) did per caput gross
dClmestic product exceed $100 in 1960. Thus, Ethiopia, Malawi., Somalia,
Rwanda, Burundi and Tanzania find themselves among the poorest in the
sub-region.
Wage and employment levels
2'!. The problem of employment of African man.power remaine one of the
most vexing confronting the sub-region as a whole', with unemployment
rEi aching omin0Uj' proportions in some of them. In some countries the
absolute number of wage-employed Africans has dropped over the past
decade , There were 'probably many causative factors behind this trend,
of which one of the most important is the te»dency for entrepreneurs
to react to governmental introduction of minimum wages by raising
technical productivity and correspondingly reducing their labour force.
This is partiCUlarly the case with some of the newer industries which
require larger capi tal inputs and a small labour force. I t can therefore
be seen that in many countries of the SUb-region job opportunities have
f~iled to keep in step with the growth of the overall labour force.
F/CN •14/W/ECOP/5Page 12
TABLE 4
Ec18t AfricO-' Per C',put GDP levels,~round 1960
. (in $ US)
Country
1- Rhodesb
2. Zambia
3. Mauritius
4. Mad'1g!.1Sc:'1r
5. Keny"
6. Ugand'1-
7. ' :Tanz l.ni;1,
8. Burundi
.._ 1. -.'.'. 9· Rwanda
.-, I! 10. Somalia
n. Malawi
12•. Ethiopia
E"" t Afri.c't
West Afric',
North Afric'l
Cen t r-i I Afric'1
South Africa
Africa.
L"tir. Arner-i.c.i
Asia
World Average
Per cap i to' GDP.1t f'a c t or- cost
211>
181
180
100 Y..'
7864-
58
53..53
51
4240 Y
71
74
132
103
499
117
421
lQ5
600
Notes; l!y
Sources:
Per c~pitq GDP at current prices
l'er cap i tel GDP 0, t cons t an t pricesNa t i onn.I d a t-.
E/CN.~4fLU/BCOP/5Page 13 ..
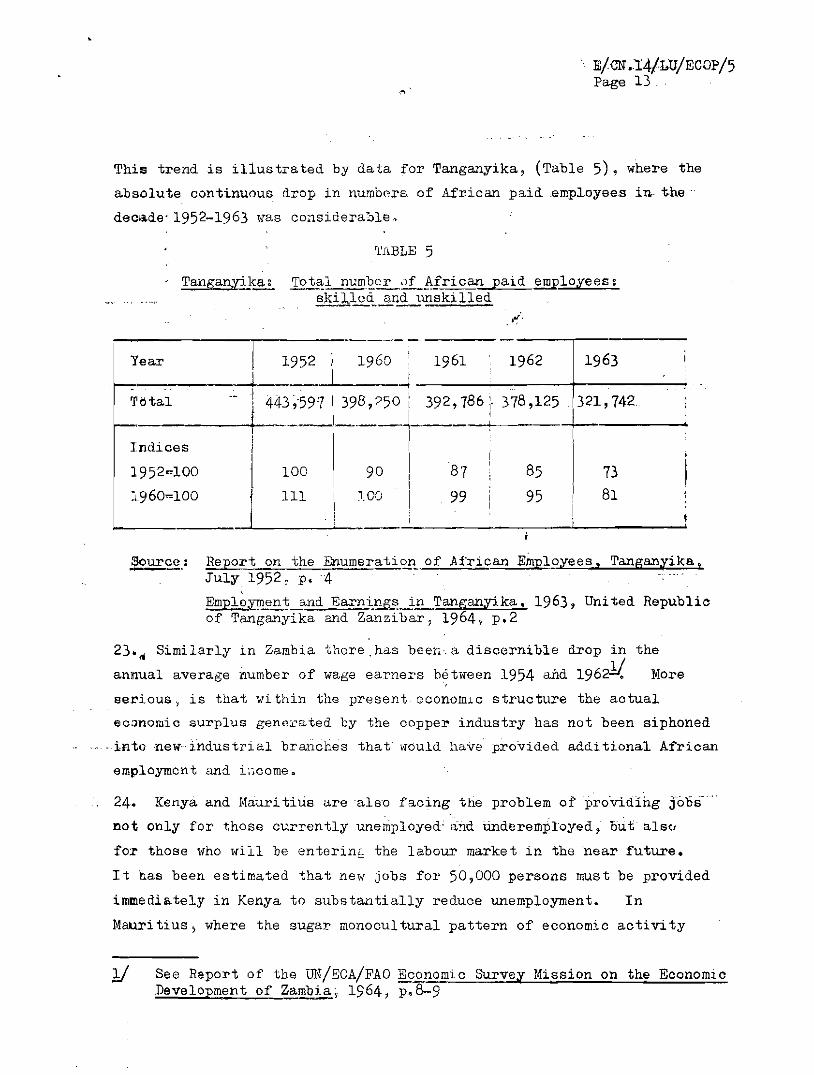
This trend is illustrated by data for Tanganyika, (Table 5), where the
absolute continuous drop in numbers of African paid employees. Ln. i>he .
decade' 1952-1963 was considera:Ole,
'l'ABLE 5
Tanganyika, Tot,,} numQ'2.'£....of African paid employees:skille~JLnd ~ryskil1ed
Year I 1952 I 1960 1961 1962 1963I -~ -4I 392,786:. 378,125~'(:)tal , 443 ;597 I 398, ?50 I 321,742.
! ,I ,~ I II -+-
I !Indices I I
1952~100 I 100 90 I 87 85 73I
:'960=100 J 111 1,00I
99 95 81
!£E~.: Report on the Enumeration of African Employees, Tanganyika,JUly 1952, p.4
Employment and Earn~£E~-!E-~anganyika, 1963, United Republicof Tanganyika and Zanzibar, 1964, p,2
23,,, Similarly in Zambia there, has be en. a discernible
annual average number of wage earners between 1954 and
drop in
196~the
More
serious, is that within the present econom"c structure the actual
economic surplus gene~ated by the copper industry has not been siphoned
, into nes indus trial br-ancne s that wouLd have provided addi tional African
employmen t and i:wome.
24. Kenya and Mauri tillS are also facing the problem of pro'viding JObS·
not only for those currently unemployed' and tinderemployed, but als"
fox those who \fill be entering the labour market in the near future.
It has been estimated that new jobs for 50,000 persons must be provided
immediately in Kenya to substantially reduce unemployment. In
Mauritius, where the sugar monooultural pattern of economic activity
11 See Report of the m,/ECA/FAO Economic Survey Mission on the EconomicDevelopment of Zambia, 1964, p,8-9

-----_...._-------------------------F/eN.14/LU/ECOp/5
'Page 14
Kenya:
TJ,BLE ~
Percentags of taxp~yers in eachLncome group by raoe in 1962
Inoome group
£120 and under£120 - 159£160 - 199£200 - 399£400 and over
Total
Afric,-;,ns
91.44.71·71,70·5
100.0
Arabs and Asians Eur-cper.nsSomalis
86.0 H.O 1·57.2 403 3.21·9 3.3 0.62.0 13.0 2·52·9 68.4 92.2
100.0 100.0 100.0
Average .annua.le".rnings in £ 80 529 1399
Source: Development Phn1 1964-1970, p.34 ocnd Reported. Employment and-_. Earnings in Kenya, 1962, June 1963, pp.4-5
TABLE 7
Kenya: Per occput GDP by province
1962Provinoe Monetary Per Population Per Per o2pita
product Cent ( thousands) Gent -mene naey pro-n,ooo. duct -( s: )
Nairobl"'j)j;P;D. 79,494 44·2 11 :315 3.6 253Goast 28,224 1)·7 _ 728 8·4 39Rift VaHey 23,691 13.2 1,049 12.1 23Oentr8.1 23,404 13.0 1,925 22.3 12Nyanza 17,885 9.9 3,013 34.9 ,Southern 5,481 3.0 1,014 11·7 5NorJilhern 1,834 1.0 590 6.8 3
Total: 180,013 100.0 8,634 100.0 21
Tot".l exolud-ing N~irobi 76,618 42.6 8,139 94.3 9and Mombasa
Souroe:
Notesl
Development Plan 1964-1970,p.35
11 13.2 per oent lIoGlbasa only.
44 Q'

~-~----~
Ii OF .14!W/:CO?/5Page 15
and fluctuatinc world prices have led to a -fall in per caput income~
du.r i.ng the iast decade, unempl oymen t has increased because of the sugar
industry's inability to absorb widitional labour, despite a marked
increase in output.
2~5. Besides the wide divergenoes in inter-country' averages, there
are huge imbalances in income by both ethnic and geographical origin,
revealed by Kenya's data. (See Tables 6 and 7). Data on the
distribution of taxpayers Sh01' 'that more than 91 per cent of African"
and 8t; percemof Arabs and Somalis earn less than ~140 ye~JY",,,hereas
more than 68 P~I'"c:.ent of Asians and more than 92 per cent of Europeans
have average annual earninGs of ~400. and above. Further, there are
In
of income imbalance is seen in Zambia:
very conspicuous differences in average annual earnings.
avi,rageannual e'arnlngs' cttheEtrn>pean"in- Kenya' is -ai.'Ound
acu be-vand
','" '- .."j:act, the
hl,400." Another illustration
TABLE 8
,yamJ:>ia: ,GDP, Employment. Wages by sectors and bl ..ethn.ic, groug~: (1262)
GDP,', ' - - I
ann~ni~sEmploytnEln't',----'..j,
Sector'European ' African EUropes.n IB million Per African I
Cent" I I
i
African rural :(2.5~ !
sectf'\r , 29.5 14.4 - , - (12), European
I Iagriculture 4.9 2.4 - 600 38,000 1,057 54Mining , 93.8 45.8 8,330 41,000 I 2,526 289
1-, . I i
I Other monetary I i
Isectors 76.4 37.3 23,740 150,000 , 1,240 131
Total 204.6 , 100.0 32,770 229,300 ! 1,563 146I i,
Source: Compiled from data in UNESCO, Education Planning Group, NorthernRhodesia.. Report of the -first mission. ),5 September - ).5December 1993
!I 2.5 million

---------------------------_..
•
E/cN .14/wIEcop/5Page 16"
acccunted for arcund 2 per cent cf total pcpulation
cent" cf total wage-earning employment. Another measure,cf the relative cpportunities cf ethnic grcups f~r wage employment is
,'-'
also indioated in t e t.ab l e below, where 40 per cent of the European
popu'Lat.ion were engaged in wage emplo;y1niin't as against a "mere 6 per
cent of1d'ricans.
TABLE 9
Zamb;i. a", JV'ElSeHlinployment (1962)
", ",
", i" Etbni C. '1 i
i GrcupsI • ,.('.'[f;
I,
,., h: ': . j ,c "/ 'I
Tb'tal ,,"Populai:i-on;" 1"
" (In. 1;erthotisarids) Cent
f"" ,jWage,,;,EmplQYJllent
Per,".Units" ; ··"Ceni"
Africans
Europeans
3,595
80
( -\ 'I~ 1°~!tl~~:·~..::..~~L;~::2.. ..2{.~~ ._._ ~!. _§!~ ;L...
229,300 77,6. .! -';'-L,; .
33,770 22.4
100.0" 2,9,l,91P.J:,,100.})............;:.... -_ ........:.;.:....;,. ,......:....-.......:..,_.. ::..
"._,, ""~-= __o.__o. _'___ _
1".'_ '
·"'~-2'f;r'Thedata.indicaiJj~"'i£f.'~ dfffere1;:ti~lJi i'h average annual wage income,, -"
"" -"·--'R~-"On"ly bye thnic g'rouPS---but' alsa"-~e"1r'va;rroWsec..tors-.- -- TrTs true
that t~e average monetary income of the African is one~'tenth that of the
European. BU~~S between African mone~a~Y incomes in the"European,,", "" r'. ;.!,' . 0 :' ?, i fr' "''<' • ': ':
agricul'tUral"sectbr and mining, a five-fold difference (from i;54 to
i;289)Si!l·recO;ded.~ Thi~ data however ~e'r~rs exclusively to wage
emplc¥ment. It should be noted t)lat in,tl1e rural sector '';hich accounts'\', , J l' • (-
for ~o~t "of the African labour fcroe, t4ere are 2.5 million personst., " .... .. ',: 'J,. ,I ,-
de pend.en ~"...:'":,-_",,gr;Lculture whose .,,:puu.il;l a..YElrage_~"n.Q.om'L:!&..§.§"tj ..matefl. ,i1tabout "i;12. 'C"; U:c ,,"" , ""~
_~ _ ....__ . " . ,- ',I~..,.2£'-..",. ., -' - ~':~.,~.".,-~.. '~.,,2.:;.l-2" . _-...:-__...::...-:..:. "'::, .... ~.~~, :.,":(,,hl28. "lJespi te the extraordinary income inequaI:ttie.!l"c~tjlja.1i-oharacterize the
sub-region, little )las been done by African governmsnts in t~ way of
deliberate redistributional reforms through taxation and other means.
Most African governments still continue to rely heavily on indirect
E/CN.14/LU/BCOP/5Page 17
taxation which affeots the lower income groups toa much greater extent
thartthe wealthy. Personal income tax, of course, exists in all
countries of the sub-region, but tax evasion by all higher income groups,
:lneluding Africans, seems to be the rule rather than the exception.
:29. Political independence has raised the expe otations of the masses,
partioularly those who have been so far deprived of a major share in
the fruits of their labour. If the rise in total output is to make
only a marginal difference in the level of living of most people, it
nIl be well nigh impossible to obtain their unstinted enthusiasm, which
lS crucially needed in carrying out a major social and economic
revolu t i.on, Primarily for this reason it is important to pursue in the
sub-region a dymamio development policy which includes as a major
objective, that of scaling down present ine~ualities in inoome
liistribution and in the ooncentration of economic power, as has often
'ceen urged for Asia and Latin America. But the real significance of a
policy of income redistribution far transoends the consideration of social
equity and justice; it would also by curbing conspicuous luxury
~onsumption, ourtail pressures on exte~nal, and internal acoounts, and would
siphon a major part of future increments in income towards developmental
pllrposes,.'. '..
30. There is no positiv~ oorrelation between income ~evels of land
locked and coastal countries as witnessed in West and Central Africa.
To the eontrary, the highest incolDe countries (Rhodesia and Zambia) are
landlocked, whereas Somalia and Tanzania are among the poorest •.".Geographical locatlon is not, therefore, the decisive factor in income
',levels; income differentials have in fact stemmed net only from the
degree of exploitation of mineral resou~ces, the extent of utilization
of arable lar~ and other resource endowments, but also from those
historical forces gene~ated by European colonization, which itself played
a pioneer role in the general economic and social transiti~n of some,countries.

:. '- .
E/CN.14/W/ECOP/5Page 18
31. East African colonization has differed from that in West Africa:
, in .the., latter, Europe ana WeJ::" primari.1y oriented towarde tradE". and. . - ",.,.' . ." - '.'" '_ c:; ': - , • , . -' _'. .-J
t~.1;i~ry ,activi tieSl",whereas_},n ..:tlte"lormer ,."EuroPean agricul tu;I;al- ,-, . _. • • i ._. , ' .
'y setHement ha"\Cleft, iti3 Apwrim,~:tu~,~' In .the" unfolding oftLis
bJ,s-i;oric procefiismorecon/::enialoJ.il1laticcondi tiQ~s in Eas tAfri,qa
may have played their part. However, a by-product of European
'colonization in both sUb-re~io~s haa bee'~' 'the 0xpans,LOn"of.';": '1 '. .::;," ' .... ' .
an exchange economy•
.c ' Energy consumption
320·; Ailthough the energy:.posi tion differa.!rom country to country, pe,r
capUt,.output andi.'.oclnsumption is Vevry Lev inmoct,: ev:x:cevpt,ip,Jlj:l.o.d;Gsia
.:: and- ,Zambia, ''1h''N, JJt ,i.o v,;ry.Jll1J.oh "boy.' th" Clll-Afr·ic'm, ..).V../lX';.J!/;:.,e-
In the former BritilshEaist ,j!.fJ:lican terri toriesene-rgy conaumptaon was
unequally distributed. :A11 present, Ugapd;1l,'eXports elect,rii-o pow~r to
'Kenya whose' weatern':hal! requ,ixes mor,e"power than -is atpre.s:ent.,locally
a;ra.ilable~ .Tanganyika 'wi th i t.s •. ccmside,rable w!l>ter resources possesses
"'Wdrooloctric poi>..:mtiCll which f;;.r outstripo its iIl'J!lL.diak
re'quirements.' r Ethiopia's eleotric generating capaci ty Ls .much:,gw!3ater
than, its' actual·consumption. '
The faot 'that Zambia's per 'caput'ehergy coneump tdon is six times
the all-African average is due to the vory large quan td, ti"b of i;norgy
consumed by the mining sector, .ano consumption in ,urban ar-oaa , while the
c.ountrys·ide is largely bereft ofelectri"lty.
output accoun.ted for only slightly more than a
Zambia's electricity
f'cur-sh of·' i ts !
consumption with the bulk of commercial energy supplied by the Kariba
hydruelectric ,power plant, jointly owned by the governments .of'Rhodesia
and Zambia. Inl962, Zambia also imported about 500 millionk-WH from
the Democratic Republic of the Congo.'
34. According to present geological surveys, the sub-region 'possesses
very limited petroleum 'resources'. However, work is underway ill some
countri'3~," arid'th-:"'oL"i~ome ofth,,'se exploratory ihvestigati6ns are yet
to be sec n, What is discernible is that the imports of' liqUid' fuels
have risen markedly over the past decade, and given the oxpected tempo of
industrialization, an upward trend in fuel imports which is likely to

'l'ABLE 10, l :
East Jlj'l'ica,_ Total ana. ,Per Caput O~~l'_ut and ConsumEion of Electricity
I 'fo Total outpu"tC0un1ries (in mil.kWH)
l',~
T'j J If· f, , ;'.-
h
iT! 1962
TotalIlliport Export'(in mil. kW11 )
I, I
E/CN.14/LD/ECOr/5 'Page 19
~
Per capiia IOutput Consumption
(in kWH)
/,-.1'011. documc.n t" tior.., d ; tIC of p opul a tiOl' arb kken from UNY(moll..r'l.p~.i~B~o::t2OOk1962
Total sub-region
Africai
RHOI)ESIAZAlf!llIAUGAlIDAKENYA'·TAlIZArJIAMADAGASCARMAURITIUSMALAWIETHIOP;I:ASOMALIABURUN:DI
!,
766.7 454·923e. § 918.1
67.1 40.127·8 52.118.8 -16·721.1 21.124·9 24·913.2, 13.2
7·1 7·15·4 5· 43.e 3.8
74·4 ':>2·(:
Ip5 165
t,,ILl i'rt---Jl:. t~l'-' C')~1g0 (:-J:~o), 470
million lcVlH
20
189
1,29641
1,505
and )0;3.S88.
:::illian kWH
i" 81~1,7660
:2~oY
~~,
!
, 2,057'-,:!;- -
use anCi les esto stations use,
1,7742,387
281 :
45~ "
i~l# '17(Yf1;g'6,
37ii1 '15~/
i~
5,559
43,050
I \ jfrom Mozambique ' i 'from Rhodesia (Kari ba Dami"l,296from Uganda and Tanganyikato Zambiapower stations'6 mj,l. kWH went
43,060
5,6, 5
2, 'J90621
t" : 0 0 "" [I::, ~~ ~. .
24018G121170
39153
lIl110
ImportedImportedImportedExportedlncludes\:l'f which
1.1y11~fI:
·,1• i
Source::
!No t e as
. !
L
j~:i,

E/CN.14/LU/2COP/5Page 20
,continue. The sub-region ,_l;:;~ per..cv~,.-':8 'cri,D.· r~8ourcus, found ma'i n Ly
in Tanganyika, Zambia,Ehodvci:, ""Q M:cQagasc",r. For vvr i ous "cono~ic reasons
these resources have not yet been fully exploited, the exception being
Rhodesia's high grade coal reserves at Wankie.,-
Food consumption patterns
35. It is recognised that food co~sumption data are often unreliable
and there is a dearth of information on the nutritive values of local
foods which play such a crucial dietary role. Bearing in mind this"
limitation, the following table, v~ntuFvs ~ co,p .ricon of pur
caput quantities of existing calorie and protein levels with desirable
nutritional targets.
TABLE 11
Present levelsu
lies for dai
Countries/Continents Calories lvegetable protein Animal pro~ein
Present; Target !Present Target Present TargetPer caput, per' day
Ethiopia 2,295 49Kenya 2,240 51Tanganyika 2,175 \ 51Madagasoar 2,230 , 38Former Federation of IRhodesia & Nyasaland 2,450 I 60 16Africa 2,360 i~ 2,420 50 ~ 49 11 ~ 15
I 21. 2.460 21. 48 21. 20Far East \ 2,070 I"y' 2,"300 48 "y. 55 "8 illO
!Et: 2,300 t y 54 Et: 15I ear East 2,470 121 2,400 21 55 21 20
Pi I 2,470 62 67 14 20,Latin America 2,370 ! 2,410 \ 42 42 19 20
Notes: ~Short-term target EI Intermediate target E! Long-term target~ Excluding River Plate countries
Sources: FAO, Africa Survey, 1962, p. 27 and p.5.P·Sukha t me , The Journal ofthe Royal Statistical Society, Series A/ General / - 1961.vol. 124, p. 477.
L,"",",,''''"''---'~.---------------------------
"/cr .14/LU/'COP!5Page 21
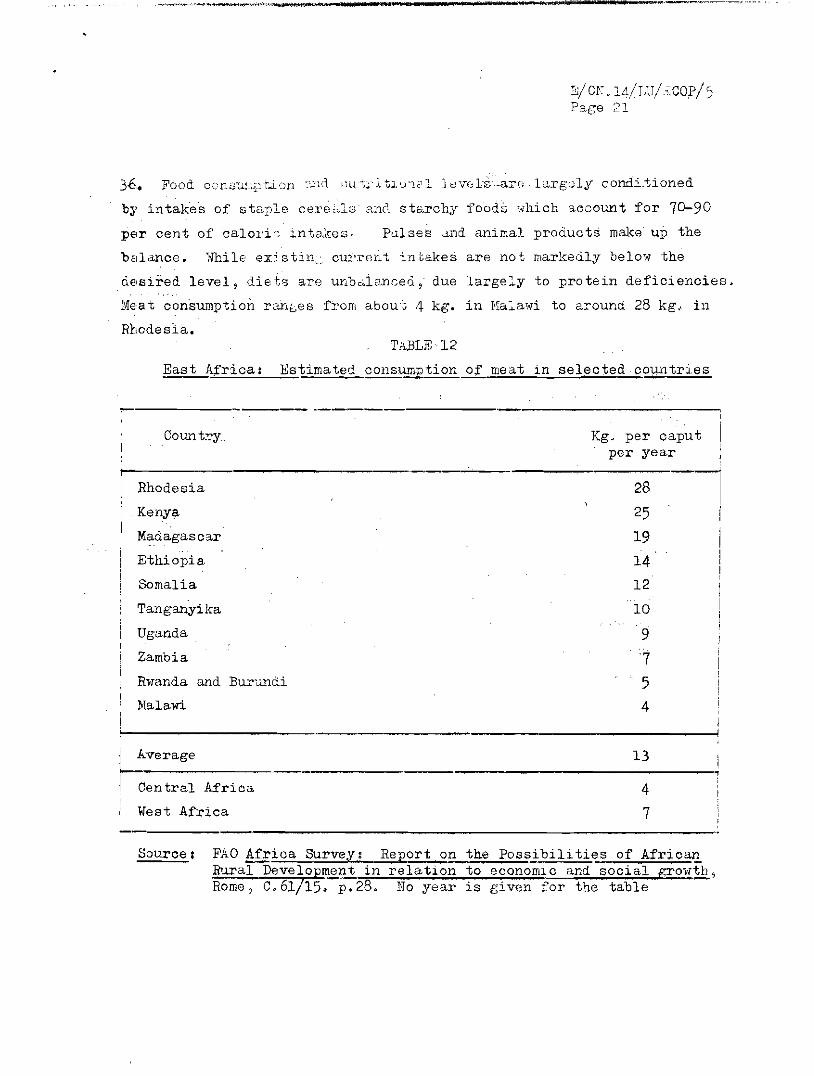
).6,. Food conBa1.-;~_"'Jt~on ':'.!ld Ilu.'~;·i tJ.'Y1cl l 1dv(;b6::'-ar.8 largely coruli.tioned
bJ' intakes of staple cere,.ls "ne'. starchy foods ',hich account for 70-90
per cent of caLoi-Lc intakes, Pulses &1d animal products mcl<e up the
'baLance , 1fuile exj stil!.,.~ cua-r-e n t in bakes are not markedly below' the
dEisired level, diets are unbalanceci, due large::'y to protein deficiencies.
Meat consumption rarlLes from about 4- kg. in Ha::"'atrfi to ar-ound 28 kg .. in
Rhodesia.T.'03LE 12
East Africa: Estimated consumption of meat in selecte~olll1tries
~. -----
Count:>:-y Kg. per caputper year
Rhodesia 28 IKenya 25Madagasoar 19Ethiopia 14Somalia 12
Tanganyika 10
Uganda 9
Zambia 1Rwanda and Burundi 5Malawi 4
Average 13 if- ;! Central Africa 4
West Africa 7
Source: FAO !f£ioa Survey, Report on the Possibilities of Afrioan~xral Development in relation to economic and social growtb,Rome, 0.61/15. p.28. No year is given for the table
E/CN.14/LU/LCOp/5Page 22
Education and health
37 In social infrastructure, the major ccnstituents, education, health
services and housing' are wcefully inadequate. Wid~spr~ad illiteracy
>lhich girdles the ent i r-e sub-region and Lack of balance in the
educational system, reflected :itn the t;ragic absence of technical skills,
is a heritage bequeathed by previous administratio~s. This critical
shcrtage of highly traine,! persons is one of the major s tumbLi.ng blocks
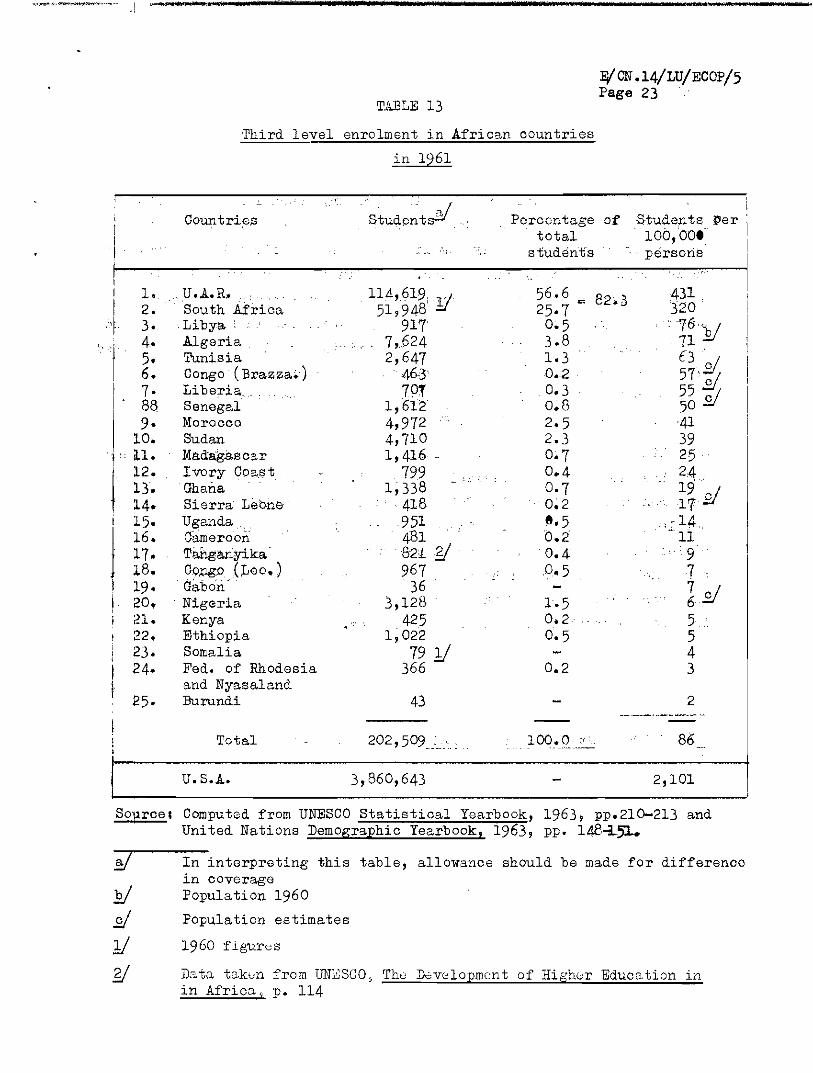
to economic expansion in all oountries. Data (table 13) indicate that
'"third' imre'l enrolment· in· the· sUb---'I>egiot;l.is.grOSsly.. Lnadaqua'te ..to
conf-.:o~nt.,the challenge of modern.i.aa taon , With the exception of Uganda,..- " -" . -, "." .~, "-"~' '- .which, in 1961 registered 14 students per 100,000 persons, the .oountries
of the sub-region had the lowest third level enrolment ratio in Africa
oy the beginning iifthe'pt'e'sen t· decade. ' ..
38; The l'rco for "dl1c'1-:ion io be i ng frustrated by the
acute shortage of trained teachers, (mainly at the secondary level),
cri-tically so in the field of science and mathematics. Unfortunately,
the present number of school leavers from Standard XII, from which
teachers are recruited, is totally insufficien"t. Because the number
of seccndary schocl pupils cannot be increased until more teachers are
produced, the ccntinued inflow of expatriate teachers is likely to
continue.
, ... :II
F/CN.14/LU/ECOp/5Page 23
TABLE 13
Third level enrolment in African countries
in 1961
2
431,320
'i~Ycs:57':y55 of50 :::2
4139252419' ~f17£1
·:tf97
~E!5543
of Students Per i100,001 I
.. persons I
56.6 '" 82.325·70·53.81-30 •.20,3o.G2·52.30·70.40·70.21l.50.2
'0.40.5
1·50.2·0·5
0.2
Percentagetotal
s-tudents
11,4,,619. ,,;51,948 1i
9177,6242,647
463701
1,6124,9724,7101,416
7991;338
4189514Bl '821. ?J967
363,128
4251,022
7911366
43
Countrie.s
.U.A.R.South AfricaLibya'Alge;L'iaTunisiaCongo' (Brazza.)Liberia.SenegalMoroccoSudanMadagsscarIvory Ooas tGhanaSierra LabneUganda, ,CameroonTanga.nyika·COXlgo (;Leo.)Gabon
, NigeriaKenyaEthiopiaSomaliaFed. of Rhodesiaand NyasalandBurundi
I 1.I 2.
"f' 3.4.5.6.7·889·
10.
j' g:
l3.14.15·
11 16.. 17.
18.I 19.! 20.
21.22.23.24·
'.-,
Total 202,509 100.0 ,:.' 86
U. S.A. 3,860,643 2,101
Soprcel Computed from UNESCO Statistical Yearbook, 1963, pp.210-213 andUnited Nations Demographic Yearbook. 1963, pp. 148~5l.
In interpreting this table, allowance should be made for differenoein ooveragePopulation 1960
Population estimates
1960 figures
Data takvn from UN~SC05 The D0v81opmont of Higher Education inin Africa, p. 114
E/C;: ~41W/ECOPIsPage 24
39~- It should, however,be noted that prima.ry 'edticiftion in thesu~
region did make certain strides in the decade of the fifties', although. -in certain countries, mainly Somalia and Ethiopia, first level enrolment
ratios -re-gistered very small gains, Yet in these--'twbcotiiltries the·'
absolute numbers of children enrolled· in primary schools increased
substantially. There are also striking dispari ties in first and second
level enrolment. In 1960, while for'Mauritius and Rhodesia the combined
-first and second level enrolment ratios were 63 and 62 per cent
respectively; in Somalia and Ethibpia the corresponding figures were- 115 and 4 per cent respectively.
40. With regard to health facili ties_, the numbers of health technicians
and physicians are- at a pitiably low level. In the case of physihians
-this ranges from 22- per 100,000 inhabi tants for '~auritius to about. one
per 100,000 for Et~opia. These figures, of course, are entirely
misleading, since. the urban areas account for the bulk of medical .
personnel and numbers of hospital beds, whereas in the countryside, where
.the overwhelming mass of the countries' inhabitants live and work,_ there
is almost a total lack of health faoilities.
11 liNE.SCO, Statistical Yearbook, 1963, pp. 96-99
...

E/CN.14/LU/ECOP/SPage 25
TABLE 14
East Africa, Basic Health Indicators arcund 1960
1
1 42, 1 /1
37~1f1 ~7'?/563l-.i,,2 133~.3 2,79S#r3
,40'Y 4~ 19 V', , 2 ' 2 " 2 ,593
j / 4~~ [, 147 /7l}~ 5cJ; i 1,35424531 / 2/ 101 Iy ~,33y23O=;r 3r' d6,5242.1 31 I 325
~W~/ ~l!iJl!' ?J'9°;/" '6~ 1 42?1 '
230St ' 14~ 37&S'
5..1 5J '" I445,U63(/'J 34,67~}j60,0°0i'1
3,581- 1,12~3 9,55~/244,-79'1 105,25 1 550,000"'-,5,65~ 2,38~/: 17,270c/
58,000"- , 14, 30()-'=-l 1107,OO~
I
I
I
492427297232128146308149190178152
32
8331,134
9°51,007
106
212
17463
]
17373
I
298385295
I ~6~
(
II
1
64111
164556
~7
22,
151311
97753321
201144131
Ed
I'nyaa c i ans , Dcnt a at s , :tJurses s , Iio s p i tal Led.spGr 100,000 inhabitants
I
Hcspitalbeds
1
3,1442T/ "16,055,S! ,
918~ 112,y14~ I 'lQ,419 I
9,71710,148 I14.264 I
, I
~,822y i5,15;1 i7,437 2 16 ,80()-'=-l
1,84~,001/20,174~
1, 689',4146'146,11~
55,3,937 I
I
?e~tis,ts Fully- I'
qualifiedNurs\3s(excludingmidwives)
~:..."...... 4
Physici"n~ 1Country
MauritiusRhodGsiaZanzibarMadagascarKenyaUgandaZambiaTanganyika.SomaliaMalalnRwanda-BurundiEthiopia
U.S.S.R.Now ZealandU. S. A.DenmarkUnited Kingdom
Sources: Compiled from basic data in Annual Epidemiolo.€Q-cal and Vital Statistios 1960 and 1961 WHO, Genevaand UN Demogr(l.phic Yearbobk 1962
l/
~~'y
Persons known to be active in their professionFigures quoted are for 1961Figures ar3 for registered perscns who are not necessarily rosid0nt or aotivePerson~el 'employed in government s8rvic~ onlyFigures quoted are for 1962Figures quoted are for 1959
-----
E/CN.14/LU/~COP/5Page 26
-'
D. MAJOR STRUCTURAL CHARACTERISTICS AND TRENDS
Output Structure
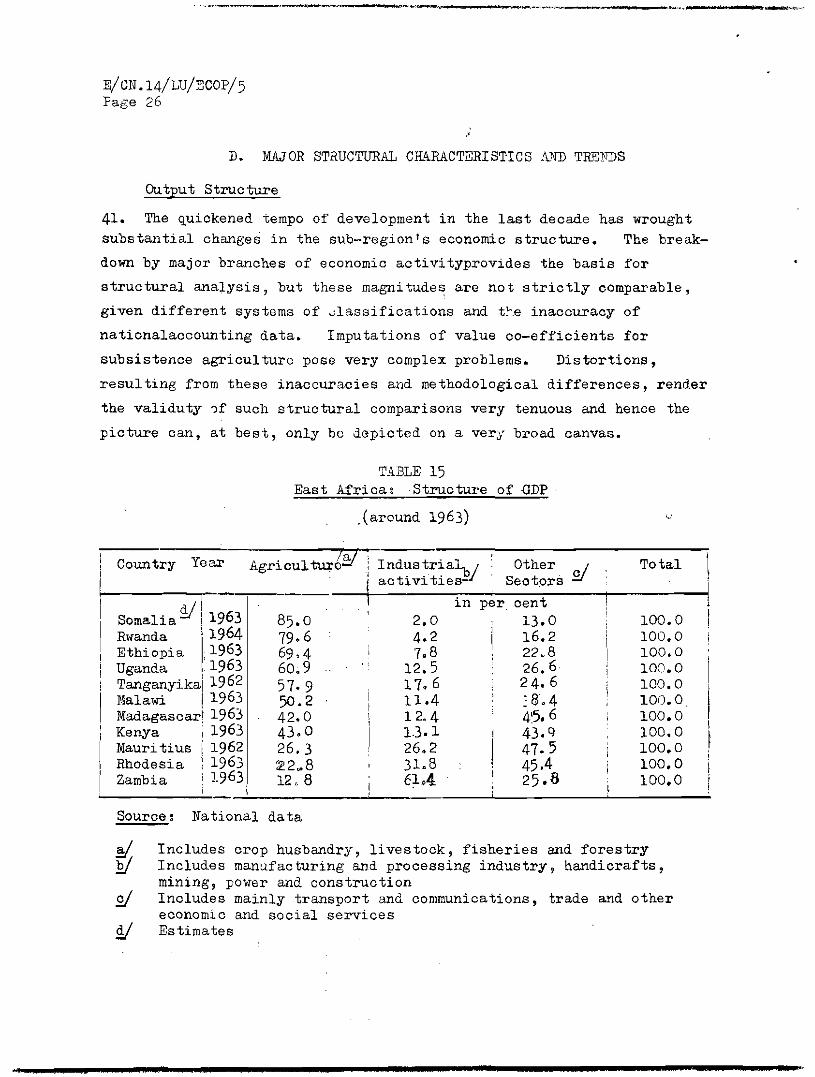
41. The quickened -tempo of development in the last decade has wroughtsubstantial changes in the sUb-region's economic structure. The break
down by major branches of economic activityprovides the basis for
structural analysis, but these magnitude~ are not strictly comparable,
given different systems of classifications and t'"e inaccuracy of
nationalaccounting data. Imputations of value co-efficients for
subsistence agriculture pose very complex problems. Distortions,
resulting from these inaccuracies and methodological differences, render
the validuty ~f such structural comparisons very tenuous and hence the
picture can, at best, only be depicted on a very broad canvas.
TABLE 15East Africa: Structure of {lDP
.(around 1963)
Country Year 7§J Industrialy OtherAgriculturo; 5d~
activities Sectors
:vI -- in per oentSomalia I 1963 85.0 2.0 13.0Rwanda i 1964 79.6 4.2 16.2Ethiopia 11963 69,4 7.8 22.8Uganda [1963 60.9 12.5 26.6Tanganyikaj 1962 57·9 17.6 24.6Malawi I 1963 50.2 11.4 :8.4Madagascar! 1963 42.0 12.4 4~5. 6Kenya 11963 43.0 1.3.1 43.gMauri tius i 1962 26.3 26.2 47.5Rhodesia : 1963 :22~8 31.8 45.4Zambia i J.963. 12.8 El.4 25.8
I
Source: National data
Total
100.0100.0100.0100.0100.0100.0100.0100.0100.0100.0100.0
InCludes orop husbandry, livestock, fisheries and forestryIncludes manufacturing and processing industry, handicrafts,mining, power and constructionIncludes mainly transport and communications, trade and othereconomic and social servicesEstimates

E/CN.14!LU/ECOP/5Page 27
42. Agriculture and related sectors are the major commodity sectors
in molOit countries, with agriculture's share inGDP oscillating between
85 per cent for Somalia to about 13 per cent in Zambia, with a sub
regional averagecof around 45 per cent.· Within agriculture, crop
production, (su1;J!iistence and marketed), accounts for most of the
agricUltural GDP, with the exception of Somalia, where animal husbandry
is paramoun t.
Subsistence Output
43. Another conspicuous trait of agricultural output is the importance
of subsistence agriculture in total a,gricul tural GDP. African agriculture
io ovorwhelmingly Gubsistonco.oriented, although in recent years, it has
. become increasingly market oriented, under the impact of cash crop
agri culture.TABLE 16
East Africa: Subsistence and Market AgricUlturein selected countries
I , 1Country I Year Subsistence Marketed Total
I
Ethiopia 1958/60 85.0 15.0 100.0
I
Zambia 1963 .71.6 28.4 100.0I (Africans only) (90.0) (10.0) (100.0)I Malawi 1963 70.1 29.9 100.0I (Africans .only) (82.0) (18.0) (100.0) ,
Madagascar 1.966 I 60.7 39.3 100.0IKenya 1963 I 60.1 39.9 100.0,
IUganda 1960 ! 44,) 55.7 100.0 i
IRhodesia 1963
,.24.2 75.8 100.0 I
1I
(Africans only) (75.0) (25.0) (100.0) I
I iI
Source: Computed from National data.

E/CN.14/LU/ECOp/5Page 28
44. In those countries of the sub-region(e.g. Rhodesia, Kenya), where
European colonization has lefXits imprint, the share of subsistence
output in total agricul t1.1Xal.p:r;'oduction is much smaller. However,.I,. ". • ••• ~.
·taking African agriculture as a whole, the share of farm products
consumed directly by Africans is still ~ry high. If !!''uropean
agricUlture were e~cluded, ~he:r;e would not be any marked inter
country differences with the possible e~ception of Uganda.
European and Africa~iculture
45. The processec of economic dualism are operative not only in the
overall sUb,-regional economy, bu t equally'~iid'-gra:plii6aiTY so in
agricul ture .• The two fiJ,1Jliliar and con;rentional types of agrJ.culture
!!''uropean and African canno~ be exclusively categorized as subsistence. :'.,"
and market oriented, since the former is now i~creasingly responding
to the stimuli of market forces.
46. .There ar-e t"70 :"lajor apsc i.e s of European agricul ture I plantation
and settler -rarnIS; 'tar'g'e ·e,:e2.s ,6Ultivatedunder the plantation system
oan be found in ~i~d~gasca:r (ri'c~T;iVJauritius (sugar cane), Tanganyika
--(sisal) i'and in S6-inaU" (bananas)'. In addition to pJ.~ta.tian..
-'_.~t":t!,;J.:t;ure,, . there are large-scale intensive farms andvcattle ranches
in areas under Eur-opean se t t.Lemen t , In former' Bri iishEast'Xf'rica,
'.European agricultu~e 'is focused on such export crops as ooffee, tobacco,." tea, sisal, bananas, ~ugar cane, p~ethrum and palm oil.
47. Th~se former British colonies differ notioeably with regard to
European settlement and in the distribution of economic activities
between. Africans and Europeans. In Uganda and Tanzania, there is almost
no permanent European' settlement. In the former, the agrarian sector
was characterized by smalT~scaLeAfrioan farming'produeing two major
cash crops: cotton and coffe0. Indeed, a vigorous group of
independent African farmers producing for the market has emerged in
Uganda. On the Tanzanian mainland, European agriculture was confined
almost exclusively to sisal production. In Zanzibar agriculture was
dependent on two major commodities: cloves and coconuts. Although
land ownership was in the hands of a small mlnority of absentee

--·----""1
E/CH.14/LU/ECOp/5Page 29
landlords, ag"icultural holdings which were generally.~~a~l and~.- .. -,. ... - -", ...., -
f'rag.nented were operated .beg. chr-om.ca.ILy indebted tenant farmers. The
posi:toAoll ill that .Qo1;ntry at the beginning of the sixties is summed-up
thus by an official government report, "a high proportion of the best. 1/
land in Zanzibar is held by absentee owners. ,,;!=! This pattern .o f land
ownership was one of the causes that led to the recent political
o~.a.n,g;,,_s.~_ Li ttle wonder th", t the reform measures included a. dz-as tic
overhaul of traditional landowning systems. In Kenya,where on the eve
of independence, less than one per cent of all farmers were Europeans,
but held less than one fifth of good farm land, land pressure has up to
now been acute. As in Kenya, Rhodesia's agriculture owes its dynamism
E~d important place in the economy to European enterprise, producing
a "ide variety of crops as well as livestock" In Zambia, European
i'armin[, which commands less prominence, is focused on maize and tobacco,
as. --well asvon meat- -and dairy Qut.put.--
Land concentration
L~8. European agricul tural colonization led to a d.i e.Loca.ta on of
traditional agrarian social relatiorts, "hich at present is undergoing
;:'urther signi ficant changes. In the sub-region, the pat1;ern of land
ovner-sh i p differs greatly from country to country, from the clan-communal
tenure, through semi-feud8-1 structures in Ethiopi.. and in some areas of
Uganda, to modern capitalist social relations of production which
pr-e vai L in some parts of Kenya and Rhodesia.
P. Selwyn and T. Watson, R8port on tho Economic D8vvlopment of thGZanzibar Pro t"ctor(1te, prin t"d by the Government Printer, 1962, p , 2

-----
E/C~.14/~/ECOp/5Page 30., <-
Tl\BLE 17Proportion of Europeans to total population and percentage
of land reserved for Europeans
Country
~,ropean populationas percentage of tbetotal population ~
IYear i per-cent
Land alienated for. European occup~tion
as percentt~e ofthe to tal !:!/
Rhodesia I 1963 5.3 49·0
Zambia 1963 2.1 3.0
Malawi 1962 0.3 5·0
Kenya 1962 0., 7.0
Tanganyika 1957 0.2 0.9
Uganda 1957 0.2 :Lessthan 0.5
Source: ECA population estimatesMon tague YudeIman , A~f.::r-=i"c,-,a::;n",s"-o",n~-,,t:::h::::e,--;L;;and , HarvardUniversity Press, 1964, p.9. These figures refer tothe year 1958.
49. An analysis of farm holdings around the dates indicated in
Tablg 17 brings out not merely the importance of European agricultural
colo~ization, but equally the extent of land concentration within the
European farming community. In Rhodesia, Europeans, who accounted for
slightly more than 5 per cent of the total population control about
50 per cent of the land, Moreover European farms below 5,000 acres
accounted for about· 80 per cent of total European holdings, but only'
28 per cent of the ownership of total acreage. In oontrast, the
remaining one-fifth of farm units which w~re above55,OOO acres each held
about 72 per cent of the cultivated area.
50. Most strikingly, 4 per cent offa.rms with an acreage exceeding
20,OOQ:occupied 41 per cent of the European holdings. The median range
of European farms was between 1,000-5,000 acres, which accounted for
more than half of the total number. In Zambia, there are also certain
similarities in distribution of farms by size. In Kenya, an even higher

E/CN.14/W/BCOPI5Page 31
incidence of concentrat on is observed with 275 farms of over 5,000
acr-es or 8 per cent of : the total number of farms, acoounting for
around 55 per cent of European ho Ld i.ngs ,
51. Although European farm units are v~stly outnumbered by African
f'ar-mu, the land area occupied by Europeans is disproportionately large.
Notwcthstanding that m~ of th~se are worked by settlers, many of the
larger units areccrporate holdings managed by Europeans employing a
largll African labour force. Land hunger combi 1ed wi th large scale land
alienation in some countries has led to social hardships which foundpolitical
expr-e as i on in the ye a.r s before L1denendence;· these have been accentuated
in the post-independence period.i
52. The genesis of agrarian reforrrsis already seen in the sub-region,
especially in the former British ~er~itaries. For example, in Tanganyika
Eura'pean freehold has been converted into leasehold, on the grounds
that the former was. ,incompatible wi th African aspirations. 11:
A further step in land policy has· ;ec8ntly been charted.· The Minister
for land" Setqement, and Ilater Development recently noted t:'.at, in
accordance wi th igorernment policy, aJll larj.d bo Lon.;c tb the nation and
':.la 11, the govez-nment- reserves the prerogative of taking over anyi
und.ave Lcped land•• : He added that land take-over would not be confined
to the Dar-es-Salaam area but would 'apply to all idle· land throughout2/
the country.=t :It appears that land policy in Zanzibar has gone even
fur ,her, since it is announced thdt'the government will take over land
owned by foreigners irrespective of ·race, and divide it among Zanzibaris.l!
53. In the case cf Rhodesia, where land policy is beset with the most
eerlOUS problems, and where concent:z:ation.has reached its highest pitch,
certain formi'll ges tures 'were made in 1961. in an a ttempt to reduce racial
bar~iers by granting Af:z:ican farmers access to unused land, earmarked
for :'mropeans. By the,Land Apportionment Act, five million acres were
Proposals of the Tanganyika
Africa Research Bulletin,
Government for' Land Tenure Reform,
I iVol. '2•.fTo. 3, April 30, 1965, p. 268
Vol. 2 No.1, February 28,1965

E/CN.14/LU/ECOp/5Page 32T,\BLE 18
~~~~E~!S~;~~~~~~=~!=~~~g~~~~E~~~~=£~~~g~~~~~~~~)
~. COUTI. t.ry· ,-_. Rhodes ia 1) I . .. . za.mbia 1) I'. Kenya 2) i. ".:\J.n.gany1ka 3) ..lI ~ I (196,1) I . (J9 63) ,(1960) I (1960)~ize 0;' holdin . Number I .' _.. Number-""---'~-liumb9r-li Nu;b8r--'r-' I!-.in :_"..~:s ~f f:'~~~_.J Acrea
g:~f...:arms._I_AcreaGe~_~f•farms _~_ A~=~age_!_ o:~ ~Erms_--'._p:re~gel,I , I I I I ! ..; . I . I :I ", - 500 I 14.4 L 0.6! 21.6 i 1.2j 32.8. I 2.8 J 36.4 I 2.5 I
; I· - _/ !~-------~-"-+--'-'---I ---._1. --..------.c-----r:--r-----l--------t-------II 501 .. 5000" 63.8 ~, 27·5 I 59·0 I 41.1 I 59.6' i 42. 2. i 5L4 ! 30 . 4 1
I-;~~ +:, :r--2~~-8--i---;~~;-l-··-l~~ I 57.7- 1 7-.6 I ~'~~r-~~,~--l-"~-;~'I
I~ ~ T A ~--'I 10;.0 loo·~-"I--·- 100.0 ! 100.0 I 100.0 -l 100.0 ~.o _100~~
~ . 1 . l ~'I~ apsolute 624la)' 33 092b) 1 026a) 3 680b) 3 609a) 7 73lb) 906a) 2409b)
:~~~::~=~~=~==== _~~==~~=====~J==~~~~~~~~==~~~=~===~==J=~~~~~~~======~~======= ===~====== ===========~c ===~~c=~=,.
.<
Computed from: 1) Atjricul tural Production in Southern and 1Torthern Rhodesia and Nyasaland CentralStatistical Office p. 6, 17.
2) Kenya, African Atjricu1tural Sample Census, Part I 1960/61 p.3
3) Census of Large Seale Commercial Farming in Tanganyika October 1960, p.6
NOTE1 a) 'Number of farms., .b) Acres in thousands
,. "..
II
3/CN.14/LU/:::COp/5Page 33
declared as unre.serve.d..area available·-'tGc·pla'ehase or lease to all
races. This legislation largely
or-Lind
remained a dead letter and, up to
reiiistributIon nasnof been tackled.
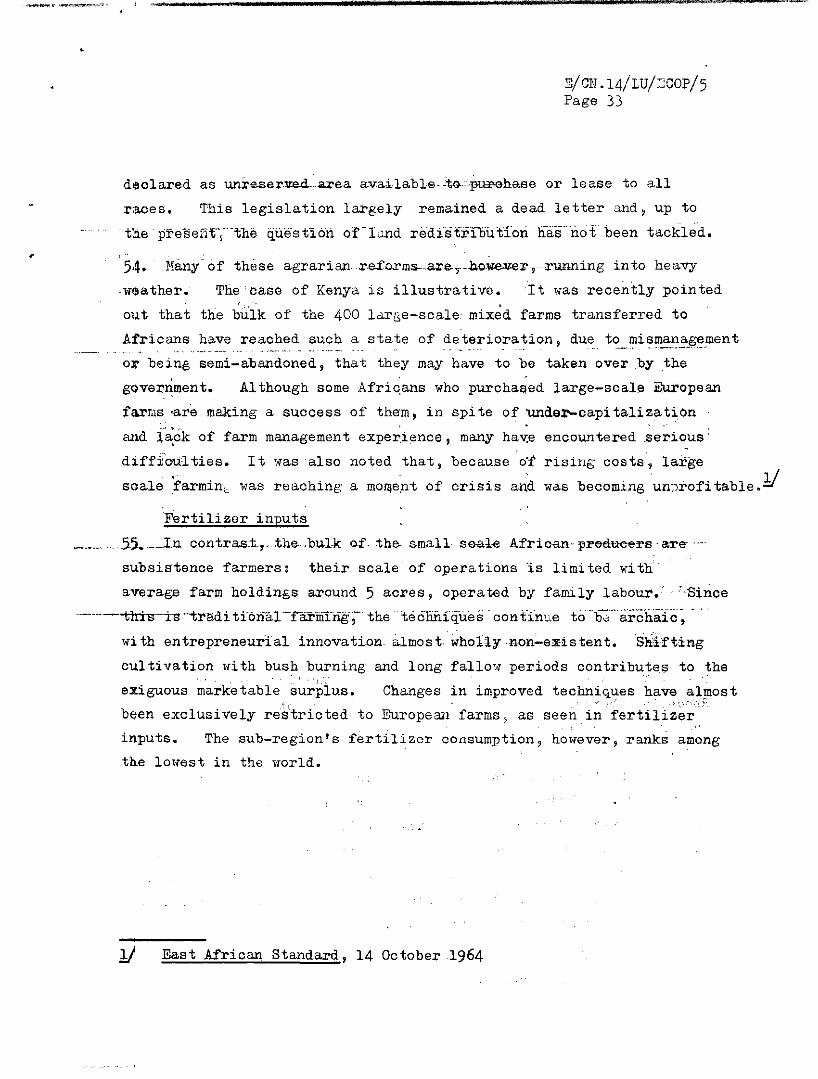
54. llany of these agrarian.r.e£orlllS-_are-,..J:l.owe-v:er,running in to heavy
,w$ather. The case of Kenya is illustrative.-It ,,,as recently pointed
ou t that the bulk of the 400 large-scale mixed farms transferred to
Africans have reac:h.ed. ~u~~ a state of de.terioration, due t~mis!llall?_g~ment
or being semi-abandoned, that they may have to be taken overby the, ,
gQvernment. Although some Africans who purchased large-scale European
far~s ~re making a success of them, in spite of under-capitalization
and la;c'k of farm management expez-i ence , many hav;e encountered .serious·
diffieulties. It was also noted that, because of
scale farmin e was reaching a mOmept of crisis and
rising costs, lar~e
was becomingUn)I'ofitable.1i
Fertilizer inputs
... 5.5. _ .In contras.t·r·the..bulk of'. the small so-al-e African- predueers .are- ..
subsistence farmers: their scale of operations is limited with
average farm holdings around 5 acres, operated by family labour•. ;'Since
this is-;;radi tibrfarr8.I'rii1.rig,-the tecliiliquescontinue tob0·-archaic~··
with entrepreneurial innovation almost who1ly.non~existent. S~ifting
cUltivation with bush burning and long fallow periods contributes to the" . . ".,'
exiguous marketable surpius. Changes in improved techniques have almost'f" ,. . ,. ,~, ,-\ _-! C'
been exclusively rektricted to European farms, as seen in fertilizer
inputs. The sub-region's fertilizer consumption, however, ranks among
the lowest in the world.
11 East African Standard, 14 October 1964

E/C~.l4/LU/ECOP/5Page 34
TABLE 19East Africa: Fertilizer i~dicators
,.."
Per caput consumptionof
fertilizers in kgs. ofpure nutrients 1960
I Fertilizer consum~tioni 1963/64
j- .
Country Total , \Cg., of MPK
I1000 kg.
tper" hec tare
of pure ·of arableI nutrients land
,
fMauritius 21.0 233.0,Reunion, 6.3 105.0Rhodesia 60.0 33.3Kenya
' ,.".11.2 6.6
,Mal.awi ' 3.5 1.2 -Zambia 7·9 1,1Ugolnda 2.7 1.0,Madagascar 1,8 0.7Tanzania 3.3 , 0.5Ethiopia 0.4 0.04
.
Total I 121, 5I -, ' ,
Average ! i J.5I
, ':',
: 0· ... 1
25.9-' 20.3
14.21.20.92:·70.40.3'0.3
<'0.02
Source: ,.FAO,Fertilizer World Survey, 1963 and country data
56. Fertilizer consumption was largest in Mauritius, Reunion, and
R~odesia,'whereas in' the 'remainder, with the exception of' Kenya, it
was around one kilogramme of NPK or even less, per hectare of arable
a close correlation exista between the size of
land..' ,
Most fertilizer inputs are absorbed on European
holdings
holdings where
and fertilizer
consumption. Although a minute, hut increasing number of market
oriented African farmers are applying fertilizers, yet, for
financial ill1d marketing reasons, the majority are not in a position to
do so. The use of fertilizers and other technical inputs making for
increased farm productivity accounts for a SUbstantial proportion of the
total annual investment in agriculture.
57. To a certain extent, the widely divergent :t:<'-!:ID p;ro!i1o&d'h:ll:ities v.,
between African and non-African farmers have been accentuated by an
IIIIiIit-----------------_..._......--~._----
B/C!! .14/LU/J::COP!sPage 35
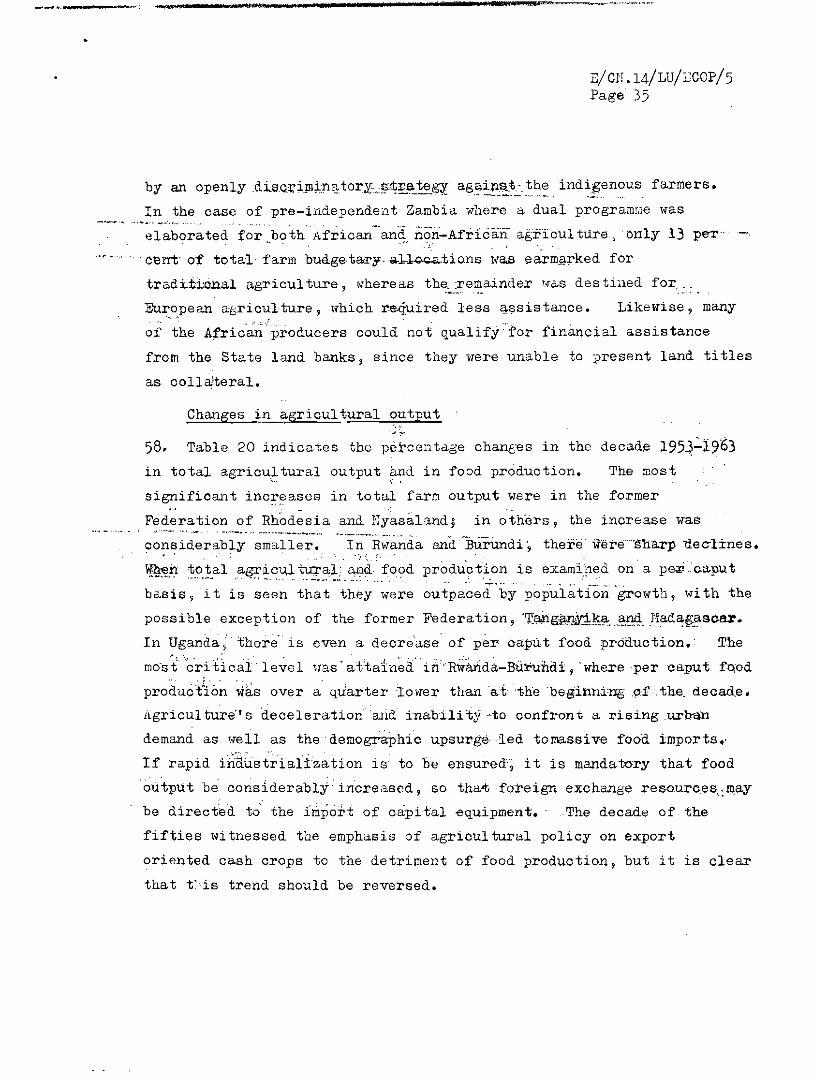
by an openlydiaQ.t'i.!Jlj,n"tor;Y,.(3j;!'.e,teg~ againl:l.t·.the indigenous farmers •. ,.- --_._,.. - .._. _......".
In the case of pre-independent Zambia where a dual programme was
'~l~b;;~ted for both African-and' non-Af:dcan agi'icul ture, .orrLy 13 per• . "', ."., ,':' I
..... cerrt of total'I'arm budge·tarif·a-1-1-o-c.ations was eaz-mar-ked for
tradi.ti:onal agriculture, whereas the"~Eem..ainder 1;as des tined for ..
Eu~opean agraouL'tur-e , which re.quired less aas i s t ance , Likewise, many
of the Afric'a:n producers could not qualify for financial assistance
from the State land banks, since they were unable to present land titles
as col La'tez-a.I ,
Changes in agricultural output'"
' .. :-58. Table 20 indicates the percentage changes in the decade 195~~1963
in total farm output were in the former
in total agriculturalv..
significant inc~eases
output ,~d in food production. The most
Federation of Rhodesia and Nyasaland, in others, the increase was
c~~~id~rabi;:~~~ll~;-~' '"I;;"il;anda and'Burundi , . therewere'~l1arp 'dec-Hnes.. .' " "1',
~~!l ~.o,~.ala~~.cu.ltu.::~La,l1d.food pr-oduc t.ion is examined, on a pe;i:caput
basis, it is seen that they were outpa~~d"by'popuiation-growth,with the
possible exception of the former Federation, -'r:[email protected]).h!s.ll:_.~. .!'ad,,:~.asoar.
In Uganda, there' is even a decrease of per caput f'ood production.' The;.. . .
mO'st'cri ticalle';-el iras ' ati;ain~a.' il1-R~;:-anda-BUl:'uildi, 'where per caput f'ood
proiluct1on wil.s over a 'luarterlower than at thebegiuni:n:g .of' the. de cade ,
Agriculture"s 'deceleration :alid inabili ty'to confront a risingurlran
demand as well as the demographic upsurge led tomassive food imports"
If rapid iriiliistrialization is to be ensured'; it is mandatory that food
output be considerably' increased, so tha-tforeign exchange r-esour-cesunay
be directed to the :itirpciH of capital equi.pmen t , The decade of the
fifties witnessed the emphasis of agriCUltural policy on export
oriented cash crops to the detriment of food production, but it is clear
that t"is trend should be reversed.

~~-----'~._~-----'--------~,----,-
•\
E/CN.14/LU/~COP/5Page 36
TARLT; 20
E,ast Africa: Evaluation of agricultural output
Foodproduction
,pe):' caput
Agriculturalproduction
foodproduction
Percentage change between 1952/53 - 1954/55 and 1963/64 1
1--,..-- ----r-~~~-,---'-'~-~____,-'--~~___1I
Country,
Former Fed. ofRhodesia &Nyasaland 80 62 37 24Tanganyika 60 58 33 32Kenya 51 40 '11 3
•,14a.!J4gas_car 40 37 7 5Uganda 38 27 8 - 1Ethiopia. 20 19 3 3Rwanda and, IBurundi
I- 7 - 9 , 27 29
1
Source: US Dept. of Agriculture. Economic Research Service, Dec. 1963Indices cfagTicultural production in 28 African countries
Industrial activities• -::: ~" .: f.
59. Output of ,total industrial activi ties for the sub-region in, ,
,1960 accounted for abou t one fifth of total GDPlrhis average , however,
conceals very important differences. Whereas in Zambia, Rhodesia and
Maur.itius the share o,f,t.C(tal industrial activities in GDP accounts for, '
61, 32 and 2,6 per cent, respectively, i(l five countries it is abou t 10
per .cerrt , Among these five ,Tangany.ika, has a ,~hare of some
18 and" Rwanda only" 4 p~r c..nt. Within" the category of sub-
regional Industrial activities, the share of individual branches varied:

4,1f CJ.
E!CN.14!LU!tCOP!5Page 37
TAJ31E 21
East Africa:Componentf! of industrial activitiesaround 1963 • ",
:Branc;hes
I ,
Mining and querrying
Manufactur,ing
Cons tructi'on
Power
Other (handicraft)Tot"l, iJ;ldustTialact~V1. t~es
Share in total Share in GI)l!, >.:) -,
.indus triai" ,: • "'i'
output
(in per cents) i ,. r"
• ~ J34.8
I7.~
36.J.I
'.417~2 3~5
1~5 t ._._,._-_. -_..- "lJ~54.4
,;••• 1>
100.0 20.4I
Source: National Data
pol~s.of growth.
for "four fifthsaccounted
specific
,60. .For the S1.IIr-l'.e.gion '<3.«1"-" ,lh6'1e,lllining, occupaes the-largest share;
(as well as in GDP) , dUe mainly 'to Zambi\l-,' s cons i der-abLe production in'>
inaustrialoutput. M?nufacturint in cohtrast, which accounts fora'
slightly lower share,. is fairly widely diffused, al th,ough there' are, , .
Zambia's minil).g and quarrying output
of the· sub-rugion l S ou tput , Its share in that
cOUntry~s total GDP al~o amounteq to more.than.one-half, with copper
mining ~counting for 90 per cent of total mining. Second to Zambia
is Rhodesia, ::hic~ has. ~ milch more ~~ver13.i:.fie<l_,mini,ng basll."incl..ding
asbestos, gold, coal, chromite, copper, tin metal and iron ore, followed
by a broad range of other metallic and non-metallic industrially important
minez-a.L products. In Rhodesia, mining provides around" per cent of
GDP; in other countries, mining and quarrying are of negligible
importance, with the possible exception of Tanganyika, where it prOVides
4 per cent of GDP.
61. Taking the sub-region as a whole, there is an obvious polari~ation
of manufacturing in the former Federation of Rhodesia and Nyasaland,
the concentration is in Rhodesia, while in former British East Africa,
the focus is still largely in Kenya. In the offshore island of

~/CN.14/LU/~COP/5Page 38 TABLE 22
East Africa: Level of Industrial Activities{ar-ound 1963)
I- I i,.- I ...... .~c:...c_
, Country Year facturing
1 _.-- .. ~. ... - -... _.-- .~_.
!RhOdoBia 1963 140.6iMauri tius 1962 18.5'Kenya 1963 6[;.3Mala.wi···-·· '1*3 ... "",.fl--- ..
I 1963'Uganda 33,7iMadagascar 1,960 25.1jZambia 1,63 35.3'.Tanzania 1.962 19.4Rwanda 1964 3.3Ethiopia 1963 15.0
-r-- I. In millions·of Up $ l '-Mim:tg "--Construe Total. 'l'otal iand',. . j Power ti on I ndus tri cs GDP I
ClU:~:Wg, 36.~ ... '39.5 25~.5 8[fi7'60.2 2.3 6.9 27.9 115.32.5 10.1 13.7 94.6 .722.3---- '1;1' .... --. 5;3 14.0 123.28.1 6.9 9.2 57.}! 459.79.1,. ,,[ - 22.1 70. 57D.3
269.9 U.8 23.2 340.2g'1554.719.1 " 4.3 35.5 78.3 569.21.4 .. ' 0.2 0.8 5.7.1 135.70.6 ,. 3.0 17.8 66.2eJ 1.852.2
". ~.
353.2 _ 76.4-_... ...... . ....
174.0.._.......
1013.5 4960.2
Percentage of GDP..
Rhodesia 1963 16.4 4.9. L 4.2. 4.6 30.1 100.0Mauri tius 1962 16.0 0.2 2.0 6.0 2.4.2 .100.0Kenya 1963 9.5 0.3 1.4 1.9 13;1 100.0)·laBri. 1963 5.7 - 1.4 4.3 11.4 . 100.0p'ganda . 1963 I 7.3 1.8 1.5 2.0 12.5 100.0Madagascar 1960 4.4 1.6 - 3.9 10.1 100.0ZalIlbi a.. 1963 I 6•.4 48.6 .' . 2.1 .: 4.2 . 61. 3 100.0
r".,,;.· "" 3.4 303 0.8 6.2 13.8 100.0wanda, .' 1964 2.4 1.0 0.1 0.6 4.2 100.0thiopia 1963 1.;1 0.1 0.4 2.1 7.8
\100.0
! i I !..: I i
~
Source: National data
eI Including handicrafts
./en. 14/LU/-,~OP/5Page 39
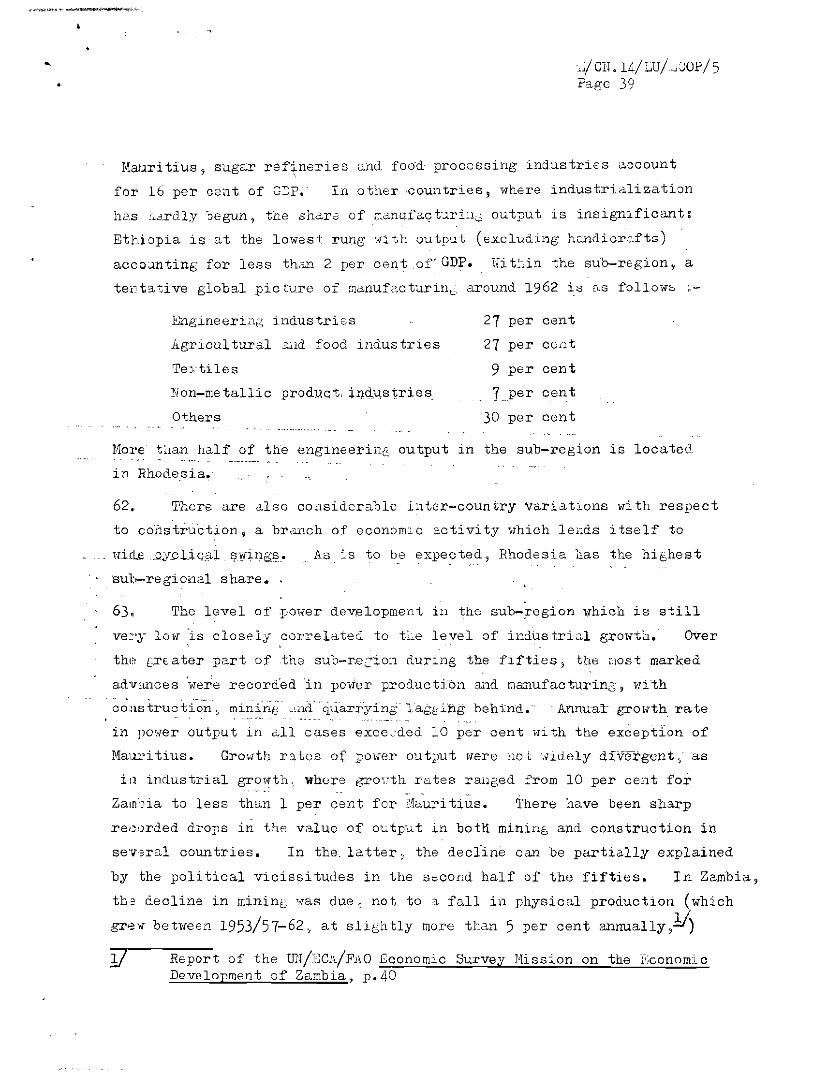
Mauritius, sugar reftneries and fo~d processing industries account
for L6 per cen t of GJP. In other -countries 9 where industrialization
has (la-Tdly -:)egun j the sha.ra of :r.anufaQt-J.riuG output is insignificant:
Ethiopia is at the lowest rung wi th output (excluding hc.ndd cr-ef t.s ]
accoxnting for less than 2 per cent of'CDP. Witjin the sub-region, a
tent3.tive global picture of manutac tur m., around 1962 ~::.3 as f'o Ll.cwe ;:-
EngineeriYlb industries 27 per cent
Agricul tural CLild food industries 27 per cent
'I'exti Le s 9 per cent
Non-metallic product. indlJ,stries ] ,per cent
Others 30 per cent... ---.-,._-_...
More t aan half of the engineel'in(, output in the sub-region is locatee,
in Rhodesia,
62, There are also considerable inter-country variatlons with respect
to cohstruction, a brw~ch of economec activity which lends itself to
,ricle.cy,cUGi11 '?Wing,? "As, '.s to be expected, Rhodesia has the highest
sul:-regiol12.l share.
63. The level of ,power development in the sub-region which is still
ve::',)" low 'is closely correlateli to t~,e level of Lndua tr i c.L growti1. OVer
th,:, crtate:r part of the sub-r,ecion dur-rng the fifties, the ruo s t marked
advance s 'YJere r-eco rded in po;ier production and manufacturing ~ ~'li-th
construction ~ mini"ng <.cnd.'··'citiari'Ying· l'agt'.ihg behind. - Annual" grOlith. rate
in )lmler output in all cases e xce cded 10 per cent Hi th the exceptlon of
Ilau],i tius. Growth r a t.e s of power output were '10 t,nctely divergent ,as
ill industrial growth, whore g-.co"th Tates ranged :rom 10 per cent for
Zamo i a to less than 1 per cent for llauri tius. There have been sh~rp
re,o,)rded drops in the val.ue of ou tpu t in hotl1 mf.ni ng and construction in
sever a.l countries. In the, latter, the decline can be partially explained
by the political vicissitudes in the second half of the fifties. In Z2.mbia,
tho Qecline in rr.ininG was due, not to a fall in physical production (which
gr8" be twe eri 1953/57-62, at slightly more tlean 5 per cent annually,lI)
iJ Report of the Ull/"CA/FAO Bconomic Survey Hission on the l':conom:LCDevelopment of Zambia, p.40

E/en, 14/LU;'~COP/5Page 40
but to a price slump of 31 per cent within the s~me period, which explains
the decline of mining output in monetary terms. lI
64. Within the ;oeriod 1955/1963, despite hith growth rates in certclin
branches, the share of tot.ll industrial ac tav; ties in GDP did not
appr-e c i ab Ly al t er ; in Ugunda , Zambia, Kenya and Rhodesia, the share of
industrial .rc t i vi ties even declined, although in absolute monetary terms
there has been a recorded increase.
East Africa' Evolution of industrial activities (Index 1963,
1955 100)
act i v i tie s
•
93.7101. 3135.1
COWl try
Zarnb i a
Rhodesia ?JTanganyika11alawiKenyaUgand.a ?JMa.uri tius
~lanufac':urlng
iI
213.6198.4
~ 156.5i 156.2139.8115.1103.4
Mining I'
andquarrY-I
a ng I
II,
69.5242.3
300.0286.7202.7
247.6273. 0188.9
,,
Cons truc t- :ion
76.8 '92.8
155.6146.2
60·957.4
196.2
TotalIndustrialactivities
100.0154.1153.0172.8119.7113.2124.8
GDP
. 119.6167.2,138.5145· 7145.0129.7125.7
'-----------------''-------'-,-- :Source, N",t.lcL·',l d: tee & illl Yearbook of National Accounts, 1963
Copper prices fluctuated over a ten-year period a' follows,
1953/57 1958 1962 1963US per
100 lb. 42.59 21..79 29. 25 29.27
For the period 1955-1962

•E!CN.14!LU!ECOP!SPage 41
TABLE' 24
East Africa: Structurai ChttrW,tlb irl inuuatri.::o.l ~ct~vitise
}.6 6.4 I
1955 1'.)63
8.2 7.27.26.4
'I'ar.gariy i ka T Uganda I Zambia. I
1955 1962! 1955.1963
Rhodesia
14.6 IT. 3
1955 1963
(in per.' ccn t )
20-316~7
Maur:Ltius
19551962
Malawi
5-3 5·7
1955 1963
II
o
'Kenya
~.IJ 9.5
1955 1963
'"
Countries
I "':'I
0.3 . 0.1' . 8.6 5;2,
3.4 ... 3.4 0·9 1.8 62.1 48.7Min~ng & quarrying 0·7 - - -. ,)
I jrowerI .' ..
c.8 1.4 - 1.4 1.6 2-3 2.6 4;4 0·5 0.8 0·7 ~·5 0.8 2.1
1I
' .I
Construction 4·5 1.9 4-3 403 4·5 7·( ,6.7 4.j 5·5 6.2 4.5- '2.0 6·5 4.2
1i . I
Per cent 15.1' 13.11 9A6-1114 <}J.r)/'. ,I Total indust- 26.426.2. 34.5 31.8 73.0 61.4 !I 15. ·17. .i 14.3 12.5i rial activities mil.tIS s 7910 94.5 8_1 14.0 32.1 40.1 .' 167'723 84 65·3 99.9 i 50.9 5
17. 6 338• 8340.21,
i. .•
1 o.e 100.~GDP Per cent rco.o 100.0, 100.010(.0 100.0100.0 100.0 100.e 100.0 100.0 ,100.01000mil.US t 4-98.( 722,) 84.51;:>3.2 121.8 153.1 I 486.4813.4 410.9 569.2.354.4459-2 464.0 554.7
!
i,
I'. I•-'
1 " ,--
I'"I IndustrialI activities1-----, Manufacturing
Source:
Note:
National data and United Nations reartock cf National Accounts, 1961 and 1963
11 Including handioraft which acc~unted for ).6 per cent in 1955 andf~r 3.0
!!··,per qent in 1962.
i
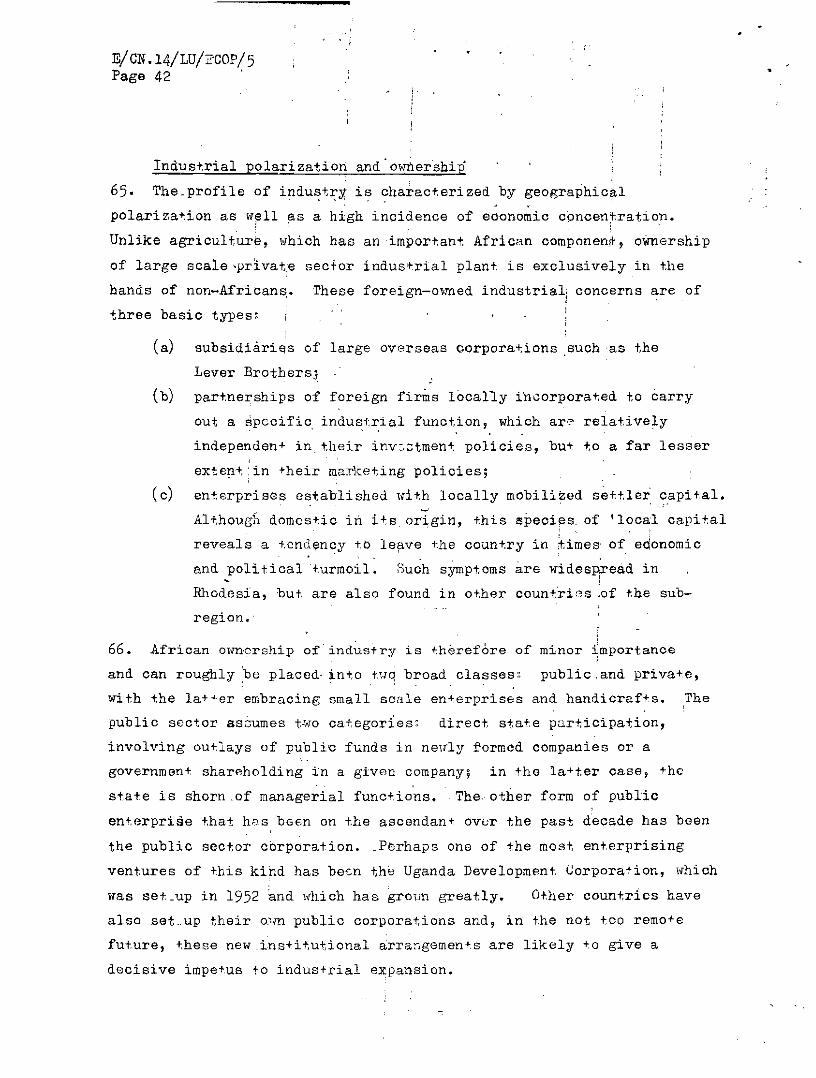
B/CN.14/LU/?COp/5Page 42 '
Indus~rial polarization and'ownership
65. The_profile of indust~~ is ?harac~erized by geographical
poLar-t ea-d.on as w~l1 as a high inoidence of economac concentration.
Unlike agriculture, which has animpor~ant African componen~, ownership
of large scale -prLva-te sedor induMrial pLan-t is exclusively in the
hands of ncn-Af'r-Lcan a, These foreign-o,med industrial: concerns are of
three basic types:
(a) subsidiaries of large overseas oorpora~ions .suchas the
Lever Br-others;
(b) partnerships of foreign firms locally Lncoz-poz-a-ied to carry
out a specific Lndustri a L function, which are relatively
independent in their invc~tment policies, bu~ to a far lesser
exten~;in their marke~ing policies;
(c) enterprises established wi~h locally mobilized se~tlei capital.
Al+.hough domcs ti c in Hs, origin, ~his specf e s of 'local capital
reveals a t.cnl'l'mcy tb Leave ~he counrry in times' of edonomic, . .
and political~urmoil. Such symptoms are widesp~ead in,Rhodesia, bu~ are also found in o~her coun~riGs ;of the sub
region~
66. African ownership of industry is t.herefore of minor importancei
and can roughly.be placed· in~o tllq broad classes' public.and private,
wi~h ~he latter embracing small scale en~erprises and handicrafts. The
public sector aszumes two ca~egories; direc~ state pur~icipa~ion,
involving out.Lays of public funds in ne\Tly formed companies or a
governmen~ shareholding in a given company; in the latter case, the
state is shorn .of managerial f'unc t i.one•. The other form of public
enterprise that has been on the ascendant Over the past decade has been
the public sector corporation. _Perhaps one of the most en~erprising
ventures of this kind has beGn the Uganda Development Gorporation, which
was set-up in 1952 and which has grorm greatly. O~her countries have
also setup their 0.1m public corporations and, in r.he not too remote
future, these new.insti~utional arra~gements are likely to give a
decisive impetus to industrial expansion.

yCN .14/LU/LeGp/5Page 43
TABL; 25
East Africa' Total EmPloyment in Industrial Activities, 1963
(in thousandS)
CountriesRhodesia Zambia T,anganyika/Uganda Kenya ~lalawib)
J~ranches
Nanufactur:l.ng 00.2 18.9 22.7 27.3 40.7 12.9IHningand quarrying 43.1 49.0 7.4 5·2 3.1 G.6Construction 35·9 25·3 28.3 26.7 10.4 15·4:,;lectri'City and water 5·7 2.3 3.9 ... 2·4 1.5
TOT A L 165.9 95·5 . 62.3 59.2 ,515·6 30.4
~~.otal recorded emPlo;l'1'l~in , :-.-
tndustria"j. activi ties a 696.2 257·5 340·5, 221.6 535·1 140.8
(in per
48.3·26.021.6
3.4
manufacturingIhning and quarryingGonstruction·Dlectricity and water
TOT A L
Industrial·' activi ties'is %of total recorded,paid employmen t
100.0
23.8
cent)
19.851.326.52.4
100.0
37.1
36.4 46.1 71.9 42.411.9 8.9 5·5 2.045·4 45·1 18.4 'j).76.3 4.2 4.9
100.0 100.0 100.0 100.0
18.3 10.6 21.6
a) Both African and non-African paid employment
10) For 1962.
igource, National data.

--------._--------------
E/CN.14/LU/RCOp/5P1g" 44
67. One of the gr,,,,t Lmpcd.i mantu to AfricClll Lndue tr-La'l cn tc.r-pr-i.co.:" '
lies in thiJalr,?0stcompl"t"o,bsiJnoeof ,hil/t1iJvc:l Afrioan tc:ohni,cal
manpowc.r;~-co~r;ii1GC1ifiill ti:;c-Emi"t~(CAfri~;;,~'~;;.r;;;:g~r;~lst;"ff.- 'Thuse
hav".,r~..~.:"~t()..d in bo th...()~~r'.'.hip. :11ld mJ.nil.!;er~J.~, ful1C:t.i()l1s o.-0'luiriniL
. , ,a w.ho,l.ly"non-Afrio=~p,¥,o,cter. Inth# year-s ahead, wi tic tho "'rpe.rg"nce
oT-:--fi--Vigor6\is-imblic"siJc'1;'or ;":incf'thi: hiining-C;i:' effici~n t ;.ni4~i~·;~ci. . . .' ' .'.,' ,,' ~ .
hig~er executive manpove r , i;h0SiJ shor-tcomingo will,.·iim.evi.t~bly,'disapp"ar.
Already some advancus have 1188n mJ.de' .in trJ.ining such mEm:pc?~e-;'~ 'c·: '.'.. I ,;, . " ""'-",J "'.\ •• ': ,.1: .. -,
_, ...J.l.though..bJ!', ..311d ...large" •.s="··"f·forte· -P<HIl--3fi·n ·lM'gely·-p-erfime·tiolWr;r.·· .
In 'ht,i'tain -expatriate industri0S, th'ose in Rhode s i a~,:,~nJi:,.t.he . m,?."'.t ..out;t-;;'-;;d;:':;~~;;;~~~l~~O~:"th-;;:"'j~b m~;;~~e~~~t';;;i~j'~g'M Air.i ;':an~ is ..!'lot
. l' . \," J..
being'TresBed with 2tiy visibl~ urg8ncy.
68. ErnpLoymun t, in industrial,.,ctivities aeo oun t s for a minusoule
proportion, of thet?t:al Laborr- force.,' emphasizing th" ove~whelmin;gly
non-industrial anatoiny of t.he se ~oontl!!1ies. Figures fbr'the"ciOiv~
working popUlation and its br-eakdovn .are not uv i i LabLe for all' the'
countrieS'·oI't1iG"su:o:"region." Ta'fife"~5-:pr-o-s'eri-ts-datafor six countries." '.',
.J ..

-_·~·---·-·I .-----------------------------
~/CN.14/LU/~COp/5Page 45
69. Data on ~he total labour force (including_subs~stencefarming)· is
rather fragmented, wi thin the su~region and it, appears, however, that.
industrial activities a a a pez-cent.age o1"t'otall recorded paid employment
is highest in· Zamb i e f'o LLowed by Rhodesia."'1
Manufacturing employment,role in Rhodesia, Kenya and Uganda, whereas_in
construction accounts fdr about, 50 per cent of_
occupies the ~eadirg
Tanganyika and Malawi, r _ • ! _
total employm",nt. : In Zambia, mining alone; als,o provides about half the:! ;
total employment in industrial activities.i
I Tertiary iactivitiesii : !
'70. Thid see-t.ori~.ext,r.eme1.¥het.erogeneousand includes a wide variety
of econoll\ic arjd sO'!lial services. Definitions and systems of classifica-: j,
tioo dif~er f~om c$untry to.coun~ry and hence int.er-country comparisons
within the sub"r,elSioncan,at be s-t .be ,nothing more than a crude': ; f
apprOxim~tion; The share of the tertiary sect,or in GDP ranges from
around 4'7i per 'cent in the case of Mauritius to about 16 pe.r cent forI
Rwanda. As is to bo expected·,..·-there isaposi·j;ive rela'\ionship betweeri
~he size 'and composa tion of the tertiary sector and the stage of
indl.st,ria:l grow~h., T"ansport and cornmund caf.a cna , as well as ~rade are. '
important: components within this group..,
Dospi+e thc widespread importahce
of these .compononrs , there are wide ~isparj+ie~ between count.r-i as whi ch
reflect their ,level of trans~ort development and also th8ir over-all
level of econo~ic grOl;th. '.'-
'71. In fprmer Bri+,ish ~ast Africa, where rail"ays still form the back-:1 .
bone of the transP9rtcomp·lex,-Ugalida'hasa. >Tell developed t,ransport
and communications 'net,l;nrk in relation to the ,pconomy's present needs,
whe~eas the in~dequacies of th'- transport and communications networks
in Kenya and Tanganyika pose serious'problems. The main pillar of the
tra~sport syst~~ i~ Zambia and Rhodesia is the!railway, paralleled by ~he
trunk road s",s;tem. -Bu:; t.h~re i s gr~~ i; need f'o* improvement in these
areas. In ,t.hiopia, road construction is p~Ob~blY the most vital
contribution now be.ing made to the country's devel opmenrj Madagascar
has a fragment~it roia-d and "r-ai L nefworlc but, these shortfalls are now being

I •
'rABLE, 26East Afrlc81' Pattern of Tertiary Activities in CDP in 1963
(in por cent)
------- _____ CountriesMadagasc~:r-' TanganyikaQ!
.
Rwanda£!--------- '~:auri tius Rhod es Ls Ke!1¥a Malawi l'gD.ndD. Zambia EthiopiaBranches -~-
Tertiary sector 47.5 . 45.6' 45.4 43.9 38.4 26.6 25.8 24.6 22'.8 16.2
of which: ,Transport and
communications 13 .3 6.0 9.4 9.6 6.3 3.7 5.2 7.0 5.1 0.4
Trade 10.3 16.6 14.1 92.4 13·9 10.8 7.9 4.1 6.4 8.1
Public Administration(defense) 4.1 13.6 10.4 3.4 8.5 4.5 I· 6.5... ...
Real Estate, ownershiof dwelline;s 7.3 ... 5.9 3.6 1.8 2.1 2.3 2.0 1.2 ...
Other services~ 10.6 9.4 8.8 6.0 4.3 6.6 4.6 3.0 1.7 1.2
ir-,
"2;-(:>':>1
~H
. ""--"'0rl"::. <DU""?1-~
Notes: y 1960
£I 196,2
£! 1964
£! Including domestic and other services
Source, National data.

~/CN.14/LU/~COP/5Page 47
i~ ' ..
compensated for by .aj:li.ghl;)( deveLoped air transport, .
system.
72. In addHicn to the rail and road .system"inland "ater transport
offers immense possibilities whi ch , a s yet,. have only begun to be
eXIl1oited•. In the sub-region, there are three large Lake a i Victoria,
Tarcganyika alid'Nyasa'j whose shores are bounded by many count.r t e e and
whj: eh offer (>lith a eo·-ordinatod··rail and' road nervork}, enormous
oPlPortuni+.ies for enhancing sub~regional traEie· andtranspcrt connexions.
Th',sub-regional river systems also represent a transport potential,. but
fe,i of them are used for navigation., Improvement in river transport is
pr-ed.Lcat.ed, not..merely
. ·ext."nt· on, sUIl-regional
on the level of investment, but also to a larger
river utilization agreements and co-ordination •. . .
73•. tlithinthesub-region, ·there are' five count.ries wi.th access to the
sea, ,,.hile· six 60uh+.ries ar-c landlocked•. East Africa has the longest
cOllsflfne o{i3.ll·African' sub-cregd on s , and the, scope f·o.r .deve-Lopd.ng _
pl:esent". ",'ccaan-cgo i ng commerc-e is ·considerable. ·Unfort\lnately, 'at the
In'OlDent there are only a small number of port~ many of them. unab.Ie .to
accommodate l"rge ships. Som"lia with the longest coas+1in6 ot any
African coun+.ry, does not possess,as yet, any deep sea ports. Moreover,
certain landlocked.'cliU13,tr;L!i.§.. fi:,,:e...ci~endent on . ports located in
..n-&i,ghhour.iJ:lg..c-oun:,riQs-Y.'qgm.eoJ__ WjJ.i.Cll":a;r: Por-tuguese possessions •
.. 1/ Massawa, Assab, (Ahiopfa);. Djibouti (French Somali1and); Berber~;Moga.d.,iscio,Mcrca.J(i.~iJ!)p.J""-CSoffiiollia}; J.lornl;>assa,.(Kenya);. Tanga,Dar-es-Salp..am, Lindi, Mt""ra (Tanzania)." -' ....... ' ..
~~~.~~ ;:~~:iude B~i~a ~nd'iou~enco-M~rque8i~liozanibidus';Lobitd1h":'Angola; Durban and Port ;;lizabeth in Sout.h·Mric,,' the t>1o"last .mentionsd serying Rhodosd a , Zanb i a and Malawi. "A large !,art ofcommodity trade from R\;anda 'end· Burundi paSS<iS through the portof Matadi, in the Dembcratic Republic of the Congo.
_.."._", . . .- .. ~. _. '~'-. '--"' ..

-------------------------,""•
E!CN .14!W!:"COP!sPage 48 "
74. Undoubtedly, modernization and expansion of the transport system
could playa large role in the opening up of new markets and thus
encour-age trade, stimulate farm output, and give 'afiIlip to other
economic activities in, the rcmotpr areas. There 'are, huge mineral
resources that have not been t.apped due mainly to inadequate transport
systems. For instance, in Tanzania large deposi ts of phosphate,' coal
and iron are have been located in areas that are' as yct inaccessible.
Madagascar,;rith its vast coal and oxygenated oil depcsits faces much
the same probLem;. In this scnse"much of the East Afric"an sub-..region is
like the United States in the XIXth century, a region of open frontiers.
75., GrO\Hh in tert,iary activities has outstripped the growth,in
industrial activities, as vreLl, as agr-i cufrure , largely reflecting ''''he need
to build up economic and, social infrastruct,ure. There' is, of .cour se ,
another 'aspeCt "hich is less 'salutary from' a national angle, that is
local capital 'has drifted into real es+,a;t,e speculation and high priced
prestige construction instead of commodity production.' In certain
countries, no measures have been taken tc check the proliferation of, this
type of investment.
~astAfrica: Evolution of tertiary seCtors(Index 1963, 1955 = lOO) : - . .-, .
I
, I ' RealIndicators Transport ' Public l'Estate &
" 'TerH~ , and "" Administrationldwelling Ot,her. , sectors' Commund ca-td on]: Trade ,anp. dc f'c.ncc ownershi P Services
Countries Index _ Index Index Index I Index Index,.
I,Rhodesia 177, 183 162 • • iii
188 164
Zambia. ' 177 176 ' :' 157 ·.. 281 163
Mala1fi ~64 187,
:+74 267 146·..Tanganyika 158 166 109 199 15J 152
Kenya 152 163 126 166 178 153
Mauritius 141 133 127 158 133 171
Uganda 132 137 166 86 133 123

____I
,"
E/ ClI.J4/LU/ECOp/5P3-ge 49
...;-
"16. The external trade sector e:lCl1iJJ.it S many of thec,<:Jn'!r'<3,nt:j,onal ..
:Lnfirmities of other African sub-regions' export dependence on a very
. 'narrow' r1l.nge of primary commod i ti.es whi ch are extremely vulnerable to
• i,', fJ.uctu"tions in their liOrld, market pr-i ces as, well as. being bedevilled
Ln some cases by the constant threat of competition from synthetic
Isubstitutes. Recent successful experiments in finding a, synthetic [pi
sisal now pose an implacable challenge to four producers ·in the sub-
·~··"~l'~gfOii'Who·a.cc·<5untfor ''OOpor"cenFaf 1larla.: output:"Ftardesr=hi+ 'Wiil ..
undoubtedly'be .. Tanganyika;;w-i,ethsisal ~aecouriting for 'more-than::a/2ilifrd
. '17. This most recent scientif~c breakthrough is merely one 9:~9ng'.:': .......__ •• ~.~._-..:.. •• __ .~••" •• - • .:.. _,0 •• " ..._ •• _ ... ~.,_.,. " .... !-~. -. ,'., -_.:~.-,;"" ....~,,:.::.;:.._..-..-, ..... ,.,-.-,.,..----'-----.,-_~
... ~"veral that have sounded t,he death knell of a large number of pr~mary:..... ·c:.
comrnodi t Lea and is'a galling 'reminder of the precarious posture of
primary producers the world·· over "hen confronted "i th the proctigious
pace of·advance of :the chemical revo~ution of 'our timesl(Thfs is one •.', :'
of the harsh but i~oidental costs of progress. This latest aqhievement'
which is bound to have an adverse effect on price and 'output of sisal,
is a reminder that industrialisation 'and econpmic diversification are
. 00'1d:"illlpe:=;t.ives:for·..·ml:t;i onal·:su:tv.iva.l~··:::11'hr-s'·poi nt . ie, 6f· :part i eu-lar .eigni.fioenee""to- +,he sub-region,',whBr'e ;'PGlI!rt-:rie-s- are 'oha::ract'erized by
_.: ..:::_. --;_.:....:.:..:.:.ieperrderrce .orr ·a;'na.rrow .range' ,of expCir"Cc6rrimoai+ies; .
. ),
'78. The foreign trade se c t or has played a s+rat.egic 1'01.6 Lnjnakd.ng
available foreign exchange earnings, although the persistently
• e,.!
b/ The case of synthetic rubber is indicative. .At the b('jginning of thefifties the share of synthetic rubber amounted to only 25 per centof world rubber consumption; but by 1963 the syntheti~'product
outworked natural rubber with a share of 51 "ercent. According to:present trends, this share may rise tc two-thirds by 1970.
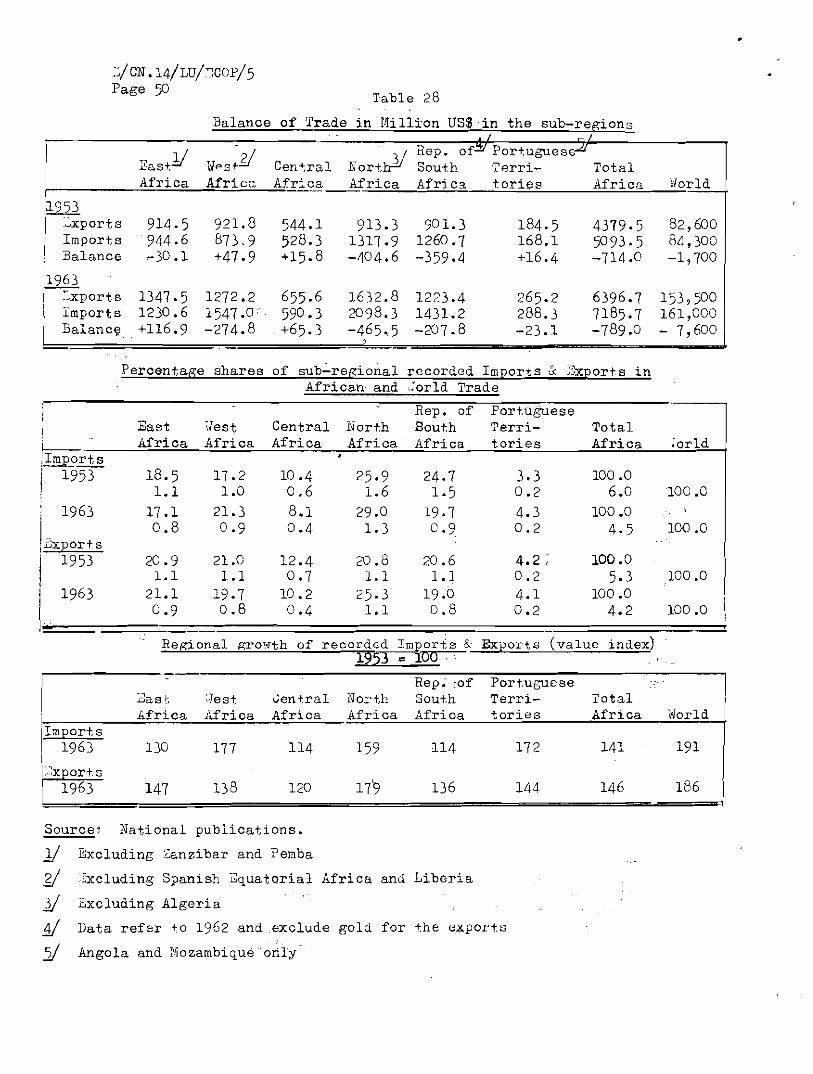
~/CN.14/LU/~COP/5Page 50
Table 28
Balance of Trade in [-Ii llion US$ ,in the sub-regions
n 11 yNorthl!
Rep. of!:U Portugue se-"~as+. TJps+ Central South Terri- TotalAfrica Africa Africa Africa Africa tories Africa ~Iorld
r9~;ports 914·5 921.8 544.1 913.3 901.3 184.5 4379.5 82,600, Imports 944.6 En3.9 528.3 1317.9 1260.7 168.1 5093·5 84,300I Balance -30.1 +47.9 +15.8 -404.6 -359.4 +16.4 -714.0 -1,700
1
1963::xports 1347·5 1272.2 655.6 1632.8 1223.4 265.2 6396.7 153,500
I Imports 1230.6 1547.0 590.3 2098.3 1431.2 288.3 7185.7 161,000
i Bal an ce ,+116.9 -2'74.8 " +65.3 -465.5 -207.8 -23.1 -789.0 - 7,600
Percentage shares of sub':'regional recorded Imports ~ :Exports inAfrican and .:orld Trade
Rep. of Portuguese
I "East \lest Central North South Terri- Total
!;i:mportsAfrica Africa Africa Africa Africa tories Africa .or-Ld
i 1953 18.5 17 .2 10.4 25.9 24.7 3.3 100.0I 1.1 1.0 0.6 1.6 1.5 0.2 6.0 100 .0I 1963 17 .1 21.3 8.1 29.0 19.7 4.3 100.0
!2xports0.8 0.9 0.4 1.3 0.9 0.2 4·5 100.0
I1953 20 .9 21.0 12.4 20.8 20.6 4.2, 100.0
1.1 1.1 0.7 1.1 1.1 0.2 5.3 100.0I 1963 21.1 19.7 10.2 25·3 19.0 4.1 100.0I 0.9 0.8 0.4 1.1 0.8 0.2 4.2 100.0I.
Reg-ional gro\-rth of recorded Imt°ris & Expor+,s (value index)1953 = 00""
Rep; -of Portuguese~ast ~lest vent.ral North South Terri- lotal
Ib.frica Afrioa Africa Africa Africa tories Africa ],orld
IImports1963 130 177 114 159 114 172 141 191
I::~x arts
1963 147 138 120 179 136 144 146 186
Source, National publications.
11 Bxcluding Zanzibar and Pemba
yExcluding Spanish iZquatorial Africa and Liberia
l! 2xcluding Algeria
1/ Data refer to 1962 and ,exclude gold for the exports
51 Angola and Mozambique 'only

•
E!CN.14/LU!ECOP!5Page 51
Un:t.'avdurableterms of trade have jeopardized :thes~' earningJ!. " In
trams ofilnports the Bub-regfon as' a whole :con:tinue~ to be the '
traditional importe:t- of manufa'ctu.red g06d~; an 'increasing range of., >c
Which can be produced domestically.
79. There was a substantial grouth in both expor+s~"~tl'imp6itsduring
t:he last decade with exports growing by more than'"SO,: p&r cent:' and.
i.po.r,1;s,b;r 34 per cent. These developments, of COltt$(lj reflect not
Illerel! changes in quantities,. )mt also in prices of imports and exports.
In. :j.~?3 c~mports exceeded exports, resultingina negative 'trade balance
for the sub-region as a whole." However, by 1963 this negative trade
~,,:l;ance vas ,.transformed into a surplus •. lilesides the East, Arrica sub
region only Central Africa recorded a positive::trade'balanoe in 1963:
.:.' '
",- ._.-.'.-'
iI Prospects are slim fair Ii. sigtlificant rise in prices of most majoreiportS from Arnea sbuth' of the Sahara fOr the remainder .01;' 'Ul.edecade. For most com~oditisl!l, consumption is more likely' to rise.in the producing coun~ries, thus reducing the possibilit1 of "increased export earnings. The best prospects for raising export
"income are thro1igh in"reaos19dproceasing of primary..~omlI!ocj,iti.esin the"producing countries. : cr. TAO,' Morithly:BliUet1nof Agricultural
Economics and Statist~.£§.j·Vol. 13, Sept. 1964•.AlsoFAO, C6mmod,ityReview, SpeoielSUpplement, AgriCUltural Commodities Projectionsfor 1970, Rome 1962; Trade in Agricultural .commodities in the. UnitedNations Development Decade, Volume 1, Rome, 1964•.

•
E/CN.14/L.U/~COP/5Page 52
West Africa, North Africa and Africa as a whole were con£rontsd w~th. .,' . ,.' ,
serious deficits in their balance of tr~~e, By ,the decade's end the
sub-region's share in total,African ~mpo~ts were 11 per cent. and ,that
of exports about 21 per cent.
Export sector::.-,
80. The switch from negative to posiHve"trade balanoes for' the sub
region as a who:ls was due' to the hugecstrides'made by the Fe'd.eration
of Rhodesia and, Nyasa:land (specifically RhOdesia, and Zambia) as well
as to the pcsiH ve balances oLUganda"Tlinganyika:; 'and Mauritius. In
Kenya the negative balance in the initial year had SUbstantially risen
",!>y the deoade's end; in others thsre !lave beeri :-persHtenttstldifflJ:f~s
towards ,negative balances;' (See ta1l1e '29.) " '
+ 61.3
+ 51.6
- 45·3
-- '21'.1
TABLE 29
East Africa: Foreign trade balance
(in US$ mil1i on)
;
i 1953 1963,,
ExportS' Imports Balance Exports I Imports Balance
!! 381.6 335.8 +45.8 601.1 311.5 +224.2:1:1
Tanganyika
Uganda
Madagascar
Ethiopia
Federation ofRhodesia andNyasa1and
Countries
:1 100.6 19.6 +21.0 114.4 113.1
'II 94.1 11.9 +22.2 144.1 86.5
1\ 84.1 129.3 -44.6 82.1 121.4
I 11.1 55.1 +15.4 89.4·-Hf:try,-I
Kenya - ,\il, 64.2 144.8 ..;00.6 122;5 206.3.,.::' 83-:-8
Mauritius 1\ 51.5 ,s,?1 + 4.8 88.6,,10.0' ,of- 18.6
Rwanda-Burundi'!1 19.3 , ... ';' " 12.9'30.9, -18.0
Somalia ,! 1.1 ,,16.;1.. -,~;4, 31.8 44.1,c- 12.9
!:=~~:~t=:~==~=~~~~~~~~~~~:~~~::~2=~:~~:~~;_~i~~i~~~~:~!~~~=~~:~~:~=.,\. -._.. ,-" ......'~-_. __."~ _ .._-~-

•
± E _ ,.g • . s__!!! it .n . U 4 ; --- .~, Ciii .,'±l!
EI CN .14/Lu/ECOP15Page 53
81. In most countries the volume index of exports rose substantially
whUe export value did not alt'ersi'gnificantly, and in certain counez-Le s
even declined, thus reflect~ng the highly fluctuating character of
prj,mary'commodity prices. Behind these pric,evariations there was .av.:
pel~ceptible downward trend in 'prices of mos-t primary export commodi'ties.
Thl' priQ-e of copper, for instance, fell by one third between 1953/57--"'" ,,"': ..' r
19/',3. _Similar trends are discerned for agricultural primary commodities.
(S"e taqle 30).
TABLI; 30 .
Average Unit Value of Exports (f.o.b) per Ton
,,(in USS),
t 1 ---,i9~ 1955 1960 1962' '1963 ,
SomaliaBananas' 56.1 143.6' 141.2 148.0 150.0
Uga.nda I
tCoffee 720.1 666.3 400·7 424·1 516.0Cotton 739.8 825.2 698.2 705.9 672.1
:Madagascar'.
j' , Cof-fee I 828.8 ' " ,,746 .5 , 585.8" 536.0 535.2-,Sugar
294:0..0/'88.,1 135·1 , 103.7 124.0
I
Sisal 191.4 219.2 ' 206.3 321.2! Rice 287.6 ' ", 156.8 201.7 100.8 196.5IiKen:ra I· ,I Coffee 955.5 1,265.5 1,018.8 9690° 824.6 I,
I"i ' Sisal 312.4!j,/ ' '161.}' " 220.6 ," 212.6 .i Tea 88.9a 131.0.!!l ,113.& 101'~ 325'~1106.Ethiopia
Coffee 617.8 889.0 849.0 . ' ,,685·8 668.0
Tanganyika ",
Sisal 274.6 157.9 205.4 197·5 291.4Cotton 569.0 748.6 625.7 625.1 '617.4 I
ICoffee" ' 639.6 ' 1,028.4
, 004·4 722.7 I, ,-
Source: ECA, African Statistics, (Annex to the Economic Bulletin forAfrica); Vol.II, No.1, January 1962; and UN Yearbook ofInternational Trade Statistics, 1955, 1963 •
.!!I In US cents per Kg.
11 Sisal fabrics.

-----------------------•
E/CN,14/LU/ECOp/5Page 54
82. The steady decline in average unit values of exports is dramatically
i llust,ratedin'J'anganyika, where si sal export s rosefrour ,J:42 'thousand
tons in1951'to,209 thousand tons in 1959 (i.e. an increas9~of 47 per
cent), whereas export earnings drastically dropped from lO24 'million to' ,
lO13mi}lion; (i;e. a decline of 45 per cent).'
83. As is indicated in 't'able 31, total exports as a share 'of GDP~range
from 75 per cent for'Zambia to around 7 per cent for Uganda. In the,
Case of 5 countries (Mauritius, RWanda, Zambia, Somalia and Uganda)' two
to three major commodities account.ed for bet.ween 87 and 98 per cent of" i ,"' "F •
their t.otal exporT,s';"In' 'all 'Countri'e-s';"save' Zambia, th1'l"'eXIYort pat t.ern
is dominated by agricultural commodities 'with coffee the leading export.~-_.__. '-'-'-~-"_--- ... - - ---.-._ .._....•
produot for ,:(ive C?f,them. In Zambia copper pr-ovtded 91 per cent of'
tota'l"export'-reuail"ts, -and sugar and it.'s'by'"produ'cts provided 98 per cent
of Mau;ritius' s export earnings. This is a remarkable trait 01' uri~~'I'
development and underlies the vulnerability of the economies conoerned
to external forces~
84. Six major export commodities (copper, coffee, .co-e-ton, sisal, sugar
and tobacco) account: for about 70 per cent of the total exports of the
sub-r~gion. This s:hare remaine4,virtually .unchanged during' th~ decade,
and mirrored the absence of any 's:ignificant 'st;uctural changes in the
pattern of exports. Within this group of six commodities there ,were," '
'howe"1<>r, 'appreciabJ,e percentage .shifts due tq differential growth rates, ,of output as weUas price changes.
:,:Destination qA, recorded export s
85. 1iestern Europe as a whole w90s the destination for abO:ut ,58 "per, cent
" of tqi;al .sub-regional recorded exports; the Una r ed Kingdom absorbed 38
per cent .and France 8 per cent of total sub-regional exports in'1953,
whereas the share of other "developed areas" was around 17 per,cent in. ,. ," "

•
,,
East Afrioa:
D/CN.14/i~/ECOP/5
TABLE: 31 Page 55
Structural oharacteristics c~orts. 196~
-II
"I
·1
0.2 I 5.6)pyreth;oru~!ffi~_~'-=-__~L- _
"I
ort"'s'_________ Main exp~o-"-rt~s~pc:.r::cod~ucc:.:t:c::s'_____I
In million as %of totalUS $ eA~ortsas uf GDP
Total e
In minionUS ~
Zambi .. " " 457·6_ I 75·6 copper 415· 4 ! 90.8 93.8,zinc i 3·0I iI .:
'Mauritius 88.4 58.2 sugar and 86.8I
98.2 98.2Ii .. bY-pI'oducts ,I " I' -~1--Ilfuodesia.:l 334·5
I36.0 tobacco 109•8 . 32. 8), hides & I ) 51.6
jskins 34· 7 I 10.4)
I i sisal 28.0 "~1)I IITanganyik a 174·4 34·1 sis1l,l 63.5 I 36·4)
cotton 30.0 117.2) 64.6
Icoffee 19·2 i 11.0)
ISomal i "s 31.8 30.3 bananas 14.2 i 44· 7)I, live animals 12·7 I 39·9 ) 90.6I
II hides"~skins ~.O)
IUganda 144·1 I 29·2 coffee 76.1 , 52.8)
IMadagaSO~ Icotton 40.1 I 27.~\ 87·7conner 10.2 ! 7.1
82.1,
23.8 I 30.0)I
19·2 I "ocf'f'ec ,I
Eilt~ar 9·0 , 11.0),
55·6I
sisal 7-3 i 9.0)I
r10e 5·4 I 6.6)I -MalawiY 32.2 i 18.1 to"bacco n.8 ! 36.6)
itea 9·3 I 28.9) 75·1
. ",Q'roundnuts"30-i 9·6)
I""
Kenya
!
122·5 16.8 coffee jO·9, 25·2)
I
sisal 21.1! 17-2) 55·4I
tea 15·9 I 13.0):Burundi~/ I
I
I
46·9 )23·9 16.8 oof'f'ee 11.2 I65-3
,
,
minerals 4·4i18~
I
I
Ethiopia \ 88·3 10.0 oo:'f'ee 44·5 ! 50.4)I
oil seeds 11.4 I 12·9 ) 74·110.8)hides & skin~ ~
Rwanda 9.oY 6·9,
2.8 , (7.8)I i oassiteriteI I i
11.1)coffee 0·4,
95·I
, ,
!Countries
y. In 1964.]I. Estimated on the data for the first 9 months in 1962.11 Inoluding estimated non-recorded exports.l' As EI. percentage of the recorded exports / 3" 6 mil. US ~,/Scurce, National data. "

•
E/CN .14/LU/ECOp/5Page 56
T1I13LiJ 32
East Africa' ~ports of selected commodities.
(.!!!!.:.1?§.rcan·'ase of t.£.i;~_!.-"_",1).:_r.:.~@:ona1 e"port il) .
-. 24.4.
14.1
5·76.1
6.6
-9.2
25·1
12.6
6.2.
4.98.1
9,'3
---+--~'--f-------j
Copper
Coffee
Cot ton (ra\,)
Sisal
Sugar
. Tobacco (raw)
_~if-: -+-' _
1
1 ' 20·518.1
rll.l 8.4
10.2 3.8
. 7.8 9.8
1 7 5 7.81_______ _ ~-----J---------l..----...;..-.----
...
335·2193;3
78.1
83.7
91.1
12505
II
216.9
191.3. 88.7
104,2
81. 9
74.9
Cotton (raw)
Copper
Coffee
Sugar
Sisal
1323;3
I 162.9
I 80.2
i 62.8
1 57 •3 I 104.0 104.2
TOb=~_~:":__ -l---~~ __±I 8~~ t__J.l_9_._8-+_.__TOT A L t 511.2' 724.1 853.2 906.9
T=ot=a~_e_x~o_r_ts ·-~~--~;~-.~---- 1-1,0 58 . 8 J 1,~~9-_~.--,_Selectedcommodities aspercentage oftotal expori;s
68.1 . 66.2
,------'-------Source, National data, includes'Mozambique
that year with the United S'Eates accounting for _the bulk. At the
inception of the decade exports to the cen-,rally planned economies are
negligible.
86. By -c.he end of the period. under review there were (,0 drama.1ic

___'~" ","'....,..,-_...,.,,--------------------------'•
E/ ~~,~ , 14/~ ;;/E~C":-/ 5,Page 57
export char~gG r.:; -'~ 0 ,k 3-1, _- r n ;....1'0;:2) a L'th au g~:. Hi thi:Cl t::·~ t-'tiC maj or we s:
European -I:rading .b Lo cr (-'.... C «h.1 ,}'l'A) the.!'c 1'.r".:31'8 _3(j:r,f~ p,:-r'e.;;:ptible shif+'s;
the: Gunman marke..l· noui.1-:.~!'ie2 ,10ub:iGQ -their imp'..;y·ts f rorn t.he sub-region
incroaasing -I:.heir Flha:-8 of ~~,u"b··r~;gionaJ. sxpcr , s frcl!l_18 -i,v 25 per emit.
ThEI E?TA area , 2,+~jhoug:~ Lo s; ng gr01L'lcl, stiTl accounted for one-third oftOi:al sub-~r8gion~1 expor-e s hy tl,'~ end of ~h2 periaj', wit'.l -",he United.
Kdngdom e.cc oun-n ng f or 'nearl'y aJ 1 expor r s to this group of countries.
Likevlise ',dthin the o-her- "deve Lap od areas" -:-:lE:re H3I'8 ehif+,s In favour
of Japan which "inc-~8::u:2d- its imports tViF'"lvefold 5 raising :-ts share of
total sub-regionAl expert,seo 4 pc r cent. AIEO the c en t r-aLly planned
economies vli tnessed a sharp rise in their ::Lr.l1port, S which started, howevs r ,
from a :1 3'J.igible 1'3701 ~
4.10.2
2'8.7
31.2
3.8,
8.7
per cent250 i
'I5·233,8
51.6
E7.1
70.7
4')6.4
55·93.3
3%.8
i~20 , 5
0.131.0
10·5
[.740.1
68.2
46·41.2
272.8
U5.84.1
16.515.80.8
TABLI: 33~~_~~~2-ca~ Des~ination of reco~~ed exports
t~_' ~, -.=-_, Expo·r:~s ----;1953 1963
--- 'rotal-----------~·fot-aJ ---'-''''''-----;
i-i~ilJ..lon US$ per cent' lJIilli on US$'--'.62.2.--·--' 3:-z---' 33:';6:':.;8"::':''''-+-'='-:::-;:-:::;~----,----
of ;,hichPranGe
deve1-oped areasUSA
Japan
Canada
Australia
Ne;/ Zealand
IJF'i'Aof wid c..U.K.
Cen~rB~ly Plannef. ~ccno~:les
African countries(sf whi chaouth Africa
}crtuguese territories
Others
I13.1 144.5 I 10.7
0·5 53.7 I 40
1.9 33.4 I 2,5L8 13.3, 1.00.1 3.8 0.3
1 .....,,!IRest 1J,9.8 13.6 138,1 I l'v.c: I
IGr~nd Total . 88LO : 100.0 \1,348.71100.0:t=~9========~=======~~====~~~~==~=~==~==========~~=~==h~==~==~=~==~===~==~d
S013rce: National d a t a

81~' The da-ta or: lmpo,:·',;l..J 0,;' en::~ u s s ShtEi~.lS r:ha-+; macllin2ry and t.ransport
equipment aC,JoUl1't;8\-: fnr the .hie.:hcs-;:; Cl10.Ta cf imports in the majority 01:
countries, thus 1'2flecting 8r.lphasis on i.ncipient industrialization and
•
the deveLoprr.en-t of infrastructur e Somalia, Zanzioar and Mauritius
deviated from -hhe ae +,rarids, s i.nc e tl1e~'r v'Jere heava Ly dependent on impor:i;s
of f'ocd , beverages and to1,:-,acco~ lJotvd thstar-ding variations in food
import S 0781' fhe d e c ad 8, the f3113.1:"8 of this grou'p of oommodi tibS in total
imports st:.i..ll reme.ins high, III Scmalia and I\la-uri ~:ius it hovered ar-ound
one~third of -:;otai j.[IPort s 9 in Za...z:'.bar 1_7: acc oun ~Bd for Co s high a e half
of -total- imports. In 2ar~zibar and l\lo.ur::_-l;ius ",:,his wa c Que to the use of
land mainly fo:,:, "the production of -two oo.amcdr +.ies --- cloves and sugar,
whereas in Somalia -th} s.. , ~.I!1PCL't pat,~;ern h ac ?f;en dic,tated !J,Y t.he scar-ca s.y
ofoultivable' land: ?(,1TJC; ,ed witr. the en.phas i o on mono·.produ·diOri, Le~'
ban an·a:s~..-88. Within thE> <'eaade sharp ab so lute.. in.crea.scCl,ce:ce register.eei mainly
in ch emi cal.s , machc n e.r-y and -t r-c.n epo.r-L equa pmen-. , vh i Le imp:>rts at the
remaining grOF}'G of comrrod a +iss inGT'3ased sligh+.ly I and :Ll1 some case s ,
'(lere 13">1..:'11 CE:l}.l',t +.he i:'_i ~.i_5.1 yeal' by :·,he one; of {h e pe,;:·j.ori... The data'
present.ec. docs I~C-t-, gang,:::: r n c BLt6i.1-;; ar.d 8('(,pe of import aubs t i.ru-i i oc ,
since t,his wculci J:'2Qljj.r? a f'a r .:101'0 detailed a mpcr t br-eakdown than ,t,hai::
gf.ven , However, dur:L'1g -J~,hj_3 p ari.ou the pr-ooe.ss of import eub s.t i t u-t i on
has been rnak i ng h8aJI;·ay In some count.rLe s , a Lb s i.f slowly, in ite light
and consumer goods .indu e tr i e s ..
substitu+.ion are still immense,
Fossibili+ies of further import- , '"" '. ',"
sinoe there are certain intermediate.
products "'hich conld be manufactured domesti-:ally,
O~igin of recorded imports
89. About (,) iJer c errt of ~;ctfll imports into +11" sub-region originated
from!est.Grn '::;urope in 1953 "ith the U.K. absorbing tela-thirds of these.
Import.s fr'JiTI 'o-i",her "dev'eloped areas" absorbed 6 per cent .li-i:h those fi-om
the'~iJnitedSta,esbeing eight-tenths of this total. Imports from the
. oentrally planned 'i)COl'bfn~ ""a:·t the opoYiihgof t,hedecad,,'iorer'e

I'ABLE 34East Africa: Imports by End-Use in Percent
j
~ s, .; ~
C{Ul'lt£5 ,-Year r , T"tal··· Food ,.- »
Lnport s Beverages :Basic -~i.n0~?~ ChemirialB - Text±1es Metals . MaChinery& Tobaccc !~aterials Fuels & Tran3pcrt
Equipment
-- '
SOMALIA 1954 100.0 33·2 2.2 '9·5 ' 5·3 19.6 3,6, 12031963' 100.0 33·1 2·5 8.4 ' 5·1 i:6.7 4.1 15·7
MA1>AGASCAR 1954, 100.0 16.6 2.1 '5.4: 5.6 20·7 10·9 20·71963 : 100.0 13.1 1.8 '5.3 8.6 15·7 .10.0 24·(,
t:GANDA1954' 100.0 6.'5 0·7 :6.4 ' 3.3 19.2 10.( 24.51963 : 100.0 4·2 2.0 7·7 7·0 19·2 7.8 30.2
KE;TYA 1954, 100.0 9·0 1.0 11.4 . , 3·7 13·5 .11.7 26.81963, 100.0 7·9 2.0 11.3 ' 8.3 :11.6 1l.2 25.8
FEJ. RHODESIA& 'JYASALANJl 1954 100.0 10.1 4.1 4·7 609 11·7 8.7 3203
19)63 100.0 9·7 3.8 6.8. : 9·9 lO.b 8.4 32.8,MIURITIUS 1954 ; 100.0 33-3 6.7 5· 7 ' 9·7 10.1 8.9 , n.7
1963 ! 100.0 30.8 5-3 ~-3 n.S! 7·0 7.0 16·7TAlWANYIKA.
1954, 100.0 8.6 0.6 8-3 4. 0 23.1 8.3 23.2' ,, ,1963, 100.0 7·5 1.4 9-3
; ;
6·5 20·4 8;8 28.6' .
TOTAL <..: ,: .
1954 ' 100.0 12.1 2.7 6·7 : . 5.6 15-3 ' 9.:6 26.41963 : 100.0 10. 5 2.9 7·4 8·7,· 133 9·5 28.1
,!
g)urco: }TE. ti on .11 d", ta: . .
'J'
;. ~--1
IOther iManu-
factUI1
14·414·5
18.020·7
29·4?1.8
22·921.9
21.518.6
13.917.0
23.217·5
21.519·5
~~'<ilg.VI >-''" .p,.<,
S<;le'oo'u<,VI

II
Per cen~24.3
•
E/CN.~4/LJ/ECOp/5Page 60
insignificant. At the end of t,he period the percentage share.of the two
major west European trading blocs fell from aroung 60 per cent to about
half of total sub~regional imp?rts. However, the~share of ~FTA in both
absolute and relative terms_declined, whereas that of the common market
group rose. By the end of the decade the share of the other "developed
areas" moved trom,6 to. l6.PIlI' cent, which was 'largely due .to the.upsurge
of Japanese exports into the sub-region. As a result of a seventeen
fold increase in Japan's exports to the sub-region during the decade,
its share in the sub-region's total imports rose to around 8 per cent.
The exports of the centrally planned economies also experienced a marked
expansion in this'per-Lod',
TABL:!: 35East Africa: Origin of recorded imports
: 1963, Total
Per cent i' }lil1ion US$19.3 I 284.3
Centrally Planned .oconomies
African Countriesof whichSouth Africa
-Portuguese Territories,Others
Developed areasUSA
.zFTAof whichU.K.
Japan
Canada
Australia
i·
45.4
5·40·5
5·4
12.1 121.5
39,6 32304 '
38.4 2<;(1.1
0.3 28.1
17.3 157.0
1.5 120 .0
0.1 5·323.4 374.8
5·1 67.60.6 91.0
- 6.80.6 11.7
"
10.4
27.7
24.92.4
13.4-
10.30·5
32.1
5·87.80.61.5
New Zealand - - 1.0
~est 150.9 17.0 190. '7
Source, National data
16.3
100.0~~~~~~~.

••
E/CN .14/LU/'jCOp/5Page 61 ' "
Intra-sub-regionaltrade
90. As is well known, intra-African trade is an insignificant proportion
of total African world trade." :;Jt",tistical coverag~ is extremely
fra@~entary, and the bulk of this trade is ,unrecorded. Data are not,
available :,for the, enhre sub-z-egi on, and hence only avery
imprBss,ionistic picture car: be given for.select<;d countries. It appears
that in"tra-African expor,ts, as a par cent .of total African world exports,
has remained constant at around 5 per ,cent since t~e end of tbe'warlZ', '
The flow of the little trade there is among African countries is also
uneven' the concentration is largely in areas belonging to' the same'
monstar-y zone, or :whe~e countries share the same boundaries. EXamples
of the former are countries' of the former !';est, AfricarJ! and I:quatorialYcust:oms unions, the former Federation of Rh~d6sia and NyasaLand , and the
coun+riesof the ']['8;; African Common Market, whose intra-area' trade was'
conuf dorabLe , r cachang tJ:!re0-quaI·tr:?rs· of tho total export.s of some of
the countries. 'Tile secorfdi~portmlt ca'tegory of intra-Afrlean~rede
has bflen mostly in evid1>nc1>arn1)ug 'thell'ortb"African -oountri-atl (particularly
Morocco an~ Algeria) andb~t;lee~t:hc~oun~riesof the 'lie s t M r i ca n and
.Gquatprial customs unions 'ahd thdr immediate nei?hbours, mainly lmgl:i.sh
speaking countrios.
91. From the data in Tablc 33 it is seen that sub-regional<exports to
othlllT Ai'rican countries accounted for:~bout lO.per cent of total exports"- __.- - -- .
in 1953; ten years later this figur~ had ,slightly dropped. Of these
tot,,} sub-regional "zport,sto ot.hEr', Aft·i,b~n,qoun.ries South Africa alone
ahsCi'Z'bed mar" th"n one-half. The .share of. the"sub-l'egi"on' s tQt.al,
finp'!'rtsoi'iginat,ing in" South',AfriC"; ell the 'other 'hand rose mark;ldly
fr0!ll,around 10 t015 per cent. ',Imp,ortselllan"t.iug :t:rom"cMri.c'!,!1,.<::g~nt~es
,11 $ni ted Nations- Conference on Trade and Development: Int,ra-African Trade~/CONF .46/83 ..' 10 March 1964.
,Y .*ali, /J!auritan),a" Senegal, Ivory Coast,' Dahomey, Niger, Upper Volta •.."~ ~I· _'~'_ ..... __ - ~. .. ,~_. - ',. - - .'. _. , ,', -', •.
Y ~abon, Congo (Brazzaville), Cent;ai-Airio~';'R~pU:blic;;;'dCh~d."· .,

•
E/CN.14/LU/ECOp/5Page 62
outside the sub-region fell from 17 to 13 poz- -oen-t -of ,tot~1-,impol'ts by
th~ end. of 1963 (see 'Table 35). ,
•
92. The salient trait of intra-African trade is the very high share of
agricultu;al commodities. Intra-African trade within the sub-region,
hae.been characterized by certain specific ccmmodity flows indicating a
6ertain:p~tt,Qrn of territorial specialization. Some of the dominant. . ':', .',',
commodities'in this trade floll tlere live animals, cereals (rice, wheat and
maize)' sugaz , tobacco, textile fibres and, to a minor extentj,.manufactured gocds,- -
93. lIithin the. East African Common Market, inter-territorial.trade flows
and balances (tables 36 & 37) reflect Kenya's superiority in the export
t~ad!l,which ha:>thrived on her advantage in industrial allocation and a
modem agri~ulture that enjoys a substantial intra-territorial market.
The,)Ilounting c~ncern of Uganda and Tanzania about Kenya's advantage in
TABLE 36East, Africa: Value of Recorded Inter-territorial Ex orts,
~ million
I Kenva U<randa Tari<ranVika,':'to to to to' to ' !
Year Usranda Tanganyika Kenya Tanganyika Kenva I Uganda195B 5~1 5.6 3.4 1:5 1.5 1.11959 5.8 6.5 3.6 1.6 1.8 0.71960 6.2 7.6 5.1 1.6 1.9 0.51961 " 7.0 8.9 5·1 1.7 1.8 0.41962 7.3 10.0 5.4 1.7 2.0 0.4
11.963 9.4 10.3 6.2 2.0 2.9' 0.')
TABLE 37East Africa: Inter-territorial.TradeBalanoe
(;>, miIlion)i , Kenya f Uganda 'Tanganvika
l' With i With i II With : With ! . Wi th ',Ifith . iI
Kenva U<rand~ TotaYear' :U""nda Tanganyika I Total Kenya ' Tanganyika Total1958 +1.7 +4.1
,+"9'. d -1.7 +0 .4 1.3 4.1 -0.4' -4.5
1959 +2.1 +4.7 + 6.8 -2.1 +0 .9 -1.3 ·-4.7 ..,Q .9 -5·611960 +1.0. +5.0 +·6·9 -1.0 +1.). ' +0 .1 ,..5·7 _1.1 -6.8 i1961'
_.. , -- -0.6 -7.0 -1.3+1.9 +7.2 + 9·1 -1.9 +1.3 -8.3j1962 i +1.9 I +8.3 +10.'2 -1.9 +1.3 -0.6 -8.0 -1.3 -9.3:
. .9 11963 i +3.2 +R.4 +11.6 -3.2 -fl.') -'1.7 -7.4 1.'5 _8. '
,
Source: EACSC, Economic and Statistical Review, June 1964.

•
-----_.,,-,---------•
EjCN.14/LU/ECOP/SPage 63
this regard culminated in April 1964 in the aVRointment of an Emergency
Committee by the three countries to draw up proposals for redressing.
the imbalance of trade be tween them •. The Commit,ee, made up of Ministers
of Finance and of Commerce and Industry in the three countries,
submitted its recommendations in the Kampala Agreement. As far as. trade
was concerned, a new pattern of industrial allocation, which sought
largely to duplicate certain lines' of production in all the coun-z-a e s
in order to reduce imports'from one another was expected to have the
foHewing results.
(a) As bet~een Kenya and T~nganyika - an improvement of Uganda's
trade balance by 24 per cent of the 1963 net trade balance;
(b) As regards the favourable Uganda trade balance with
Tanganyika - a total reduction of 17 per cent of the 1963 .
balance;
Cc) A reduction of 23 per cent of Uganda's overall deficit balance
';ith,Kenya.
A s:ystem of quotas and "suspended quotas was a I so to be used to limit
exports from surpluscountri~s to deficit countries.

-------,•
••B/~T.14/LU/ECOP/5.
Page 64
F OUTLOOK FOR ECONO~~C CO-OPERATION IN EAST AFRICA
94. The East African sub-region as a whole is composed of a heterogeneous
number of countries at different stages of economic growth, with a very
limited, degree of interdependence among them, as distinct from their
constituent national parts. These 'observations have become even more
true in the era immediately follOWing independence, when co-operative
insti tutions have weakened in anglophonic ,lest },frica and among ~he countries
of the franc zone customs unions in former French West and Equatorial Africa.
The dissolution of the former Federation of Rhodesia and Nyasaland further
illustrates the move away from economic co-operation. And yet there are
many reasons that justify even firmer bonds and-larger associations. Among
these, .may be mentioned the small demographic base of' the individual countries,
associated with very low i~com~ levels and the restricted size of national
markets, the emergent polarization of industrial development, unequal distribu
tion of natural resources, and uneven de€rees of development in small enclaves
in different countries and a lack of harmonization of transp~rt policies.
95. The need for economic co-operation in the sub-region is mandatory.
EverY1ihere the very use of modern technologies, linked as it is to the
procesaes of automation, requires large national units, small labour inputs
and massive ca~italization. If the present autarchic drift continues, it
would lead inevitably in the forthcoming years to excess capacities and a
general stagnation of industrial expansion. In a world in which technical
and managerial skills and investment capital are in critically short supply,
this trend can be disastrous indeed. The history of Latin American industrial
experience serves as a useful precedent. In Latin America, each of the States
has over the last fifty years been attempting to set up independently its own
manufacturing enterprises, without regard to the obvious necessity to co
ordinate their efforts with their neighbours. However, due mainly to the
smallness of the national markets and often of small production units,
progress has been hindered, and this in a continent where per caput GDP
and size of countries units are on the whole larger than in Africa. In

- ...
~/CN.14/LU/~COP/5Page 65 "
most cases excess plant, oapac i, ty in industry ,!las continued to, plagues
Lati~' American' indust~Y')/ This tendency which has already begun to"\., , .
develop in the East African s.lb-region, no, less thall the rest of the, "",' ,'" .
continent, lends weight to, the, need for harmonized inve~tme(lt decisions
and development policies, preferab!y through,centralized planning for
the entire Sub-region.
96.. Appreciation of these facts has led to the determined efforts of the
Beads of 'Government of kenya, Tanzania and Uganda in'recent weeks to save
the common economic links 'binding their countries from threaterie~'break-uP.
E~sewhere in the eub-z-ega on (Federation of Rhodesi~ and Nyasalahd) where
tbese bonds were -permi tted to snap, no effort is being spared'to salvage
.aa much as possfble from the wreckage. Thus, a strong l1nk:st'i1l exists
between Zambia and Rhodesia, with the former's copper 'industry largely
d.ependen't on Rhodesill's 'coal deposits. Zambia' s largestsourc~' of imports"
is also Rhodesia', and the latter's trade surplus of over ..34 million in
1964 was almost'entir~iy accounted foi by the surplus of visible trade
w'i th Zambia 'and Malaw:L In thi s ccnnexa on the transport links are note
w'orthy. This complementarity can also' be evidenced in the field of energy
u~tilization and consumption', with the iariba dam offering vi tal important
inter~oountry links.£! Moreover, Rhodesia industries and Zambias copperbelt
mines depend heavily on, labour from Malawi.
97. To understand fully the main issues to be contended with a move
towards wider co';'operatiori,' the history andf';rtu~es of the East African
Common Market must be studied.' Economicintegr~tiori'informerBritish
E:ast AfricaJ.!assumed three distinct forms,' custQnis~riion,commonservices
if Sidney Dell, Trade Blocks and Common Markets, London, 1963, p. 198.
1/ Notwithstanding the political altercations between, Rhcde sd a and Zambia,I plans are under way for further, .devel opme n t of theZambesi-K....i-ba hydro-
I'~~~:=~~ ~~;:~~ch;m~c~~~e~\~~;~of I.2.8 million by the Ylo:t'J.d ~ank.
f7~; ~~i~6:~~m~~!~~ ~~;~:~n~!:~~~~i~~~1~~~~~.~g~~~~~e~~=r~f~~6i) :R~h~rtcommon market in East Africa was initiated in 1917 with the institution offree trade between Uganda and Kenya. Tanganyika became part of the marketby stages; a common external tariff was adopted in 1922, free trade ofdomestic products with Kenya and Uganda was introduced in 1923 and freetransfer of imported goods followed in 1927. The East African CommonServices Organization (BACSO) came in~o being in 1961 as the successorto the East Africa Bigh Commission that had been set up in 1948.

E/cN .14/11J!fJCOP/5Page 66
-----------------,-
. '
(sudi as transport, harbours; teleoommunioations, eto.) and a common
Although, .undoubtedly, there was ~ relatively free movementcurrency.
of,the faotors of production, the',-.-
common market. as the Raisman Report
' ...
noted, was.restriot.ed by a nu~ber of artificial impediments. For
instanoe, the mOvement of agricultural'and livest.ock product!1 betileen
Kenya and Uganda was controlled, and there was.some measure of import
and export prohibition .. in the individual territories, as 'veIl as
concentration of marketing in the hands. o:f':..\lt.atutory marketing autho
ri.ties. In this ,respect t.he markqt "as not in the real sense I common'
for .all domestically produced commodities •. ,,/hatevcr the common links
that had been forged during the era of British rule, there WaS never a
oent~a~ bind~ng planning polic~, and overall economic .planning organiza
tions and institutions w.ere never established. Indeed, .the automaticity
of the.price mechanism, con t.Lnued to be the. paramount. economic co
ordinator1( The upshot Was that once British authority .which had provided
a coherive force was removed with the advent of independence, any.issues
that made fo!' differenoes that had been given only perfunctory attention,. - -, '
"culd come up for settlement with the inevitable assertion of indepen.,.
dence by the new states. And there were several such issues, inherent
mostly in the operatiol)s of. the common market atid.common ourrenoy.
98. Firstly, the common ~arket did not provide equal benefits to its
member coun+'ries. The restrictions placed on the'movementof agric\lltural
and livestook products favoured Kenya. In the case of maize, Kenya's
high cost producers w,ere shelt.ered from Uganda'!'l 10m-cost produot, which
was completely excluded from the Kenya market immediately the oontrol
agreement was signed •.?! ..
.1/ This should, however, be qualified, since there was interventionismthrough tIie office of tlie High Commission, statutory'marketing authorities, state particiPation in production, and industrial licenSing.
y The IBRD- jj}conomic Development of Uganda, .Government Printer, Entebbe,Uganda, p , 151. Uganda" smaize export s ·to Kenya which reached peak
.- inl,954 (valueLat ;\,c.l.l.. mi11i.on}' almo';tceaa-ed: tn1955. .
•.,

, •
E/CN.14/LU/ECOp/5Page 67
99.. Second.ly, t,be indus'q,ial La cenai.ng "ystem, intended to control. the
disl:ribut,iol]. of induF~r,ry among the me.;l·oer count.ries, soon fell into;·
disuse, and .Ken ya , er.j(\\·ing 10cntionaf advan-cages from the begInning,
became a na-cur-aL magnet for inda3t~!..'ios" Ho:: .Lar-ge }Juropean- and Asian
comrllU,:ity "Hh "qnsi¢,crable pur-cnas i ng povrer- conf'er-r-ed ou it by high
Lncome levels, "aa a substafJtial initial advan-s age , '<ith the Industrial
Lic$nsing Council faili~g to take the required decisions to prevent
dis]}ara·fe deveIopmenc, "e· have an out at endi ng example of.a disinclination
t'O"llse authorHy to con:ect ihlperfections "i:,;ought about by the
operat10n'of t~ee market forces. This cont~asts with int.erventionism
in agricult.ure, Hllich prevented what would have been a more rational
result of tho·fre8 operation of th~'price'1TIechanism in the common
market,
i~i' :::aiI'd.ly~. !:O;'J~l.l c 8-~i"OJ.l[; ~_r' :!JJ.:-J+r 1.,-\1 posi.T,ion ,,?nd the
prcltection accorded. to her agricu.ltu2e cont.ributed to, the disequilibrium
in trade meniioned earlier, T4e recommendations of the Kampala Agreement.
as regards industria,l aliocationJJ are not J.ifficult to .understand in. _
this light; U'ge,ncla"r:ioh li:i~ m~.d" a vigorous push on the industrializat~on
frQnt through the. Ug";r;,,,,;Devalopment c.;orporaLon, aided by p,:ofits of ,'.'
marke t i.ng boards du.c'i.ng the coffee 'uoom of tho 1950' sand some degree qf
f'or-ea gn aid, does '-n:~'t' ."i::.e.ve 0.3 much ] se-~,m,~" to make up as Tan,zania,~ and
it is to be expected ·'h"t f'u i.ur-e ",Focatj.ons "rlll also be gua ded by
thls fact.
y The distribution vee &.~ i'ol:_c,',TSg
Tanzania -. radio manufactur-a and asaemb Ly , manufacture of motorv eb-c c La "iijl"J:'~S and ,tubes 9 manuf'ac tur-e arid assembly' ofland C'Q\fdrs and. moe type of lor:;oy and truck.
Uganda - uanuf'ac-tur e of nit.r-ogenouu fertilizers and biC~~._~~~_~
Kenya .- manufacture of electric 1ight bu'Lbs ,
NOT:;;;: In the case of lorries and +,rucks, no coun+,ry may be acoibrdedmonopoly rights ~n the entireccmmon market area.

E/CN.14/LU/~CO?/5Page 68
101 Fourthly t.he free move.ient of labour
economic activity resulted in a net gain of
favoured Kenya, where great~r_
immigrants at the expense of the
other two countries. With more attractive job cpportuniti0s, the
immigrants stayed on to strengthen Kenya's labour force in terms of both
numbers and skills, and it is estimated tbat not even their remittances
home resulted in a reduction of Kenya's overall gain.
102. Fifthly, the .conoen-tration of industrial aotivity in Kenya,
and r.he substitution of Kenya-made goods for extra-common market imports
entailed a loss of cus+omsrevenue for Tanzania and Uganda. Un the
other hand, increased economic ac+.i vi ty in Kenya enhanced that country's
budgetary resources largely through oorporatc taxation. The
distributable pool of revenue1/ to be derived from revenue from economic
undertakings benefitting from the existence of the oommon market
enabled Kenya to compensat.ethc other tlfO to a great. ext en-. , Howev ar ,
the relatively und er-deveIoped state of the eCCnOmiES of these t,;o
countries loft them "lith a sense of frus+ra+.ion.
lO~. Lastly, is,the common currency system. It. did not t.ake
independence to recognize' .the inhibit.ing effects of the ~ast African
Currency ~oard's mechanism. ·A monetary system, backed almost
rully by foreign exchange earnings held in another country, cannot
lend itself to a·flexible econcmic policy. This is particularly
serious in a p~rlod "hen balance of payments deficits are becoming more
frequent and chronic. .ven if a common cen-tr-a I bank were se r up for all
three coun'\ri~s, the point should be borne in mind tha'\, in the absence
of a common economic policy, the fear would be real that capital would,
like labour, flo~ in excessive amounts to Kenya to add to that country's
disproportiona+.e ben"fi -.s , ~ioreov-cr, .rith '\he restrictive effects of
)) Reisman neport, op.cit. The revenue Has composed thus'40 per cent from annual proceeds of income tax chargEJd on companyprofits r6alized from manufacturing and finance in the states;
6 per cent of annual revenue accruing from customs and exoiseduUcs levied in the states.
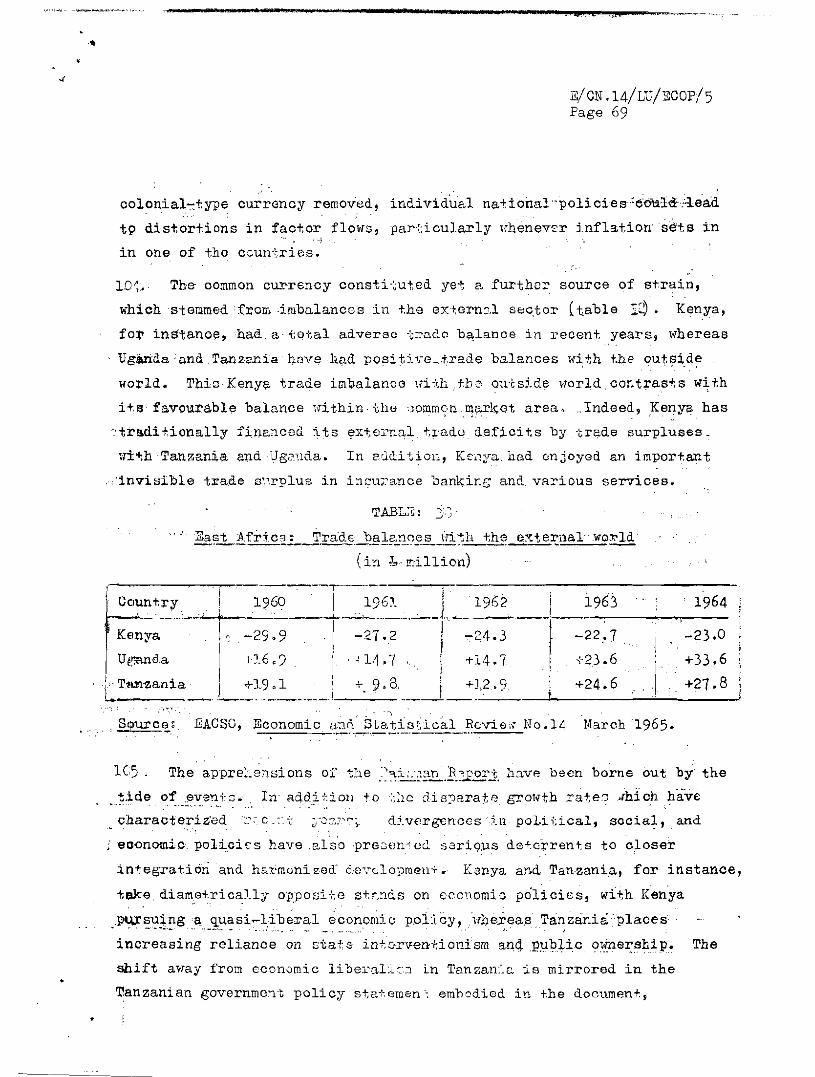
.. c ..c _ ,..
•
E/CN.14/LU/ECOP!5Page 69
colonial."ty:pe currency removed, indiv i dua'l naHona1'"policies"eo'tlld':'iead
t9 distortions in factor flows, particularly Hhenever jnflationse'ts in, 1 •
in one of the ccun'ries.
lD~, Thee common currency consti 'cuted yet c. furthcr source of strain,
which stemmed f:rom .imbalances in t.he 8X\8rn~,1 sec,-Gar (table :2). Kenya,
fo~ instanOe, had,a;;otal adverse t~aQo balance in recent years, whereas
Uganda 'and Tanzania have had positive_trade balances with the outside,
world. This Kenya trade LmbaLance \ii i\h tb e ouc sxde Ilorld contrast, s wi t,h
He favoura,ble baLance "ithin· -hhe commonunarkct area. .Tndeed , Kenya has
': tr!>di tionally finan.ccd its ext erna L i;r'adc defici i;s by trade surpluses,
';l±+.h '·Tan,r.ania and -Ug2.·~lda. In c.. uclit~on, Kenya had enjoyed an important
.,;·invisible trad.e B~;.rplu8 in Lncuzan ce bank i ng and var-a ous services.
TABL2: -r " ..,j" )
(in b !!lillian)
1964
-23.0
+33.6
+27.8
II
iI+24.6
i 1963
-1,1-=;2.7+23.6,
1962
-24.3
+14.7
i
-I!'+M .7
+.9.8
Count,r;\,-------7,-- --.,..--,--
i 1960 I 1961\, ~
I'. -29.9 -. I . -27. z
1_ :~:: ~ 1 1_+:.,2.9
Kenya
U/cano a
;' T1Ln-zania-EACSO, Economic 1;:1(1 Statistical Rov-io. No.14 March 1965.
'_~".~_'_' h"
lC5. The appr-el.en s.i on s of the ":"'i:;"~..!.l.2forJ, h ave been borne out by the
t.l.de 01' ,eveni:c. In acldHioll to :;;'" ,lis'2rate grot,th :rate,~ .hioh have
di.vergenccs .in po1i l:ical, aoc i a l , and
·eoonomic:. pcLti.ci.c s have .aIso ,pre3en.-iuG. s ar i ous de+.c~rents to cloae'r
integration and har-mcna zed' devclopmell+,. Kenya and Tanzania, for instance,
tlilke, diame+rically oppo site s+,t.'lCis on cc.o-icmt c policies, with Kenya
PlU"su~nga. 'luasi-lib~ral e conoma c polIcy,uhsieas, Tanzania:places '• _. 'h··h~h·_·· ."" .•. _ ••~, __ '." • .' ..... _.. _. ._,,,' . _ ,,' . ,
increasing reliance on state in~or"eni:ionism ana,p)llJlic ow.nershi!'. The
shift away from economic liberallc~ in Tanzan~~ is mirrored in the
Tanzanian gove rnmc-re policy sta"c,emen '; embodied in +he documen+,

..E/CN.14/LU/ECOp/5Page 70
'Mricanizing the Economy of March 14, 1965, which declared that "the,
monopoly of business and commerco at presen+ held by foreign firms and
minori ty communities in Tanzanian must be broken".11' '.
10& Economic policy of the Kenya government is on tho other hand,
basically one of'dependence on and accommodation with the private
investor and entrepreneur "ho is still largely a non-Mrican. As the
Kenya plan.notes: "Close co-operation between Government and the pr i va-te
seotor is the key e'l emene of development-planning."Y It is significant
that one of the critics of Kenya's recent manifes'/;o of national aims
(African Socialism) is Tanzania, which regards Kenya's conciliatory
attitude to private en'/;erprise as anathema. Little wonder '/;hai~ major
complaint of many decision makers in Uganda and. Tanzania is that their
countries are subsidizing incomes and employment in Kenya as well as' the
profit margins of Kenya's non-African entrepreneurial.elite. These
different economic policies have also led '/;0 divergent attitudes towards
the socialist and non-socialist blocs.
'107. Difficulties in co-operation have been further accen-tuat ed by the
....opposed viewif'that the three countries have on political federation.
Kenya's political independence was accorded in 1963 on pressure from
Uganda and Tanzania, who argued that Kenya's independence was a pre
requisite for early polit:j.cal fGderation. In the event, however, Dot all
three countries have exhibited equal enthusiasm for a speedy move towards.
this goal •. Tanzania has been the most enthusiastic, and its disappointment
with the retarded progress is illustrated by President Nyerere's
11 Quoted in Africa Research Bulletin: Economic Financial and Technical'Series, Vol.2 No.3, March 15-April 14, 1965, pp.267-268. Such aneconomic transition is to be achieved through such state bodies as theNational Development Corporation, the Intrata and various co-operatives.There-is, however, clear recognition of the need for foreignmanagerial skills.
Y The Plan, p.38. To understand the doc'/;rinal impulses behind the Kenyaplan see also, Republic of Kenya, African Socialism and its AppliOationto Planning in Kenya, Nairobi, 1965.
•

.GleN •141 LUI .2COP/SPage 71 .
statemen~at the ceremony for laying th8 foundation stone of the £ast-':1
1lfrican Common Services R.,gimul Headquarters in Jar-es-salaam on 15 July 1965'-. . .~'~,'. . " ."' .;. " .. .
"The t end ency to co-oper-a-.c in ;:iast Africi' must be nur-sed byall of us •.•••• Tanzania argues patiently and for years that,111{'longas we failt6 federate, it,'is ineVitable for"the'-"
, Past, .Afr!i,cal! St,<l.t.,e\3to. have separat e cuz-r-encaes and, ,::1;0 workout some adjustments in the working of the common market".'._ r,., ~ L' ',1 . . ,
'ti" j"
any mutual consultation.." .:., .. ".. ~ -' , ,. - ',~ :-.
directly interested" ,- . f . .
from different sources with hardly. ) -.
108. These fundameq-tal,cotltradictionsin polioil3s,@aveaccelera.ted .tpe
,pace of disintegration. ~he decisions to set. up separate natjonal ,.. ': t' .,r~...' "- - ,.' ., ". ,-,'. ;
banks to issue independant currencies are examples. Moreover, foreign", '. .- .... ' .. " .- , ,- - .-:- .",".
exchange control is being introduced to prevent capi;,al flights and. i ' _ . '_' ' .. ,.. ,',' ~ ". -'J~ " .
speculation, while for the first time, increased and new taxes_have been, "- '. ",:' - ,- -., - .-.: ' '. ;' ~. .' ( - :.:.~ .
imposed by all three without much effort. to reach agreement with their. ' '. . ,r ," .-; :-'. • .. ,_-~. ' _, •
neighbours. Negotiations for the construction. of the Tanzania-Zambia,. .~ .v.
rail link have also not dra'm forth the required unanimity from the two. ....-, ~': ,_\ 0; ..
countrius, who have for some time sought extsrnal aid
109. The accord of temporary lanilingrigh+, s by' :th8',~(-eniVa' governmeM',to
6 foreign airline has ",lso Led t:o misund.eretandi.ng, '/lstbls is deellled
to be inimical to the liast ,Afri can J).ir.'ays, ,while.: redounding mo:st.ly to the
benefit of Kenya's tourist industry5!. Finally, a blow has been dealt; . . . . - [ .:~ ..
to the unified university system, which appears t.o be uell on the 1<a;y
to disint.egration. This, is "ithout doubt an unf'cr-tunare devel opment ,,'- ,.
not, only because of the colossal capital outlays entailed in duplioating
bUildings, equipment, staff, and other teaching facilities, but. also,on
a.coount of' the f'aet t,hat no single ..African countrY.,+,o-day c~n vent.ure
alone into all the, complex ,and costly scient,ificSi'eoialisms, whioh are
indispensable to rapid eoonooio growth.,.. , - ' ,
110. Ash~s:been .stated in paragraph 106. the Heads:of government of
the three countries,have indicated that they intend ·to,m~intain economic
'iJ Africa Research Eullet,in:" r· .
Political. Sooial and Cultural §cries,
,
Vol. 2 No.7,
y'~fric0965,
July 1 - 31, 1965, p.330.
No.1?, August 27, 1965, p.2.
•

~CN.14/LU/ECOp/5Page 12
---'--------------_._------•
''':':-. ',, unit.y among themselves,'and, in particular t.o 'preserve t,he common market
and common services. It is too early to saY_if_they will agree to
reverse some of the decisions already taken that undermine economic
co-operation. But thisshoulA not. be require~in,~vGry case. For
instance, n is possd.b'Le to achieve harmoniza:t,ion cO! economic policies
with separat.e nat.ional banks, thoug~ t.he task sh~uld of course be
easier wit.h a common central bank issuing common 'ourrency.: "-'"
Dl. Political Federation should of course facilitat.e the adoption of
a common development policy and general development.. This ~uestion, '
should, however, be viewnd aga~nst. the background of t.he larger number. i"'
of countz-f es that. st.a~d t.o ben,efi t. by economic p0.,.operation in the
sub-region., Desirable as it. is t.o rescue t.heJast African Common
Market from disint.egrat.ion, it. should lie recognized at. the same_time t.hat
it would be more worthwhile and in keeping 'nth current trends to aim
at a larger economic grouping t.hat could secure even, ,gr'eater bemetits
for its constituent members. Such a large ,association would, among
other benofHs, provide a bigger forum in which to 'sett.leissuesi and'
it is not unlikely "tha+, in' such a forum,: the'irritantstliai;' are apt to
lead to discord in the smaller group might lose some of their"sting.
112.. A wider co-operation embracing the entire sub-region, and reaching
beyond its borders should, for instance, get Kenya, Tan~ania and Uganda
away from the nresent. narrow bilateralism that characterizes the trade
pattern laid down in .the Kampala Agreemen+. A payments agreement .to..
take care of imbalances in t.rade should assist this pr ooe sa , For the
time being, however, the ,present compulsion that Kenya feels to, find.. , ..
markets to replace those lost in the new scheme of things will result in
a Widening of her horizons. The experience of nations with large export
markets proves that. it is possibl~ to enlarge +,he scope of business
acti1Tities (e~g.· in fields of" invest.ment. arid output) t.hrough t.he
acqud af t Lon offresh t.rade part.ners. The Kenya economic . mission -recently. . -
sent to!ladagascar, Ghana and ·Lib"iJ.a t6explore trade possibilities·
wit.h those count.ries are therefore, moves in the right direction.
E~ually, existing trade links should be strengthened considerably both
within and beyond the sub-region.•
•
-_._---- -----------------~--~"--._"..
E/CN.14/LUj;:.COp/5Page 73
113. It need hardly be stressed that the time has alRo now come for
countries within the sub-region to forge new trade links. New export
products will emerge ,Ii+.h economic growth, and these and the +.raditional
onss will demand new trading par<ners, not only inside the sub-region,
but also in the rest of the African region as ~ell as beyond. .If this
new sense of urgency.animates economic policies, it will lead to a
faster economic growth than the efforts +.hat are now being made to
limit trade.
ll~ The case of trade has been dealt with in some detail; but economic
co-"peration should embrace all the other sectors of national economies'
agr~culture, industry, economic and social infrastructure, including
transport, monetary and fiscal relations, factor development and movement-
in ehort, general economic poLacy , The experience of thej;ast African
Common Market ijnd other similar economic groupings illustrates abundantly
t.he difficulty of working such arrangements without .. adequate central
pow'erto enforce decisions. Short of complete political federation, a
variety of formulae exist for ensuring that the required decisions on all
mattors are implementcd by the member countries. It .is refreshing to
not:e"in this regard that Tanzania does no t nov insist: on immediate
political federation as a precondition for continued economic co-operation,
and ur-ge-s instead that "realisHc arrangements for co-operation and.
joint activity, short of federation, must be worked out to compensate
for existing defioiencies •• •"Y In any such economic grouping it goes
without saying that the success of the union is directly dependent on
the devotion with which the members fulfil their commitments, no less
than the courage with which they formulate decisions and execute them.
It also requires a high degree of stat0smanship, particularly in all
matters relating to national sovereignty.
,
•
1/: AfricaVo1.2.
ReSearch BUlletin, .icononac , Financial and 'i'echnical Series,No.7, p.332.