C C LAND HOLDINGS LIMITED 中 渝 置 地 控 股 有 限 公 司
27
- 1 - Hong Kong Exchanges and Clearing Limited and The Stock Exchange of Hong Kong Limited take no responsibility for the contents of this announcement, make no representation as to its accuracy or completeness and expressly disclaim any liability whatsoever for any loss howsoever arising from or in reliance upon the whole or any part of the contents of this announcement. C C LAND HOLDINGS LIMITED 中 渝 置 地 控 股 有 限 公 司 (Incorporated in Bermuda with limited liability) Website: www.ccland.com.hk (Stock Code: 1224) ANNUAL RESULTS FOR THE YEAR ENDED 31 DECEMBER 2009 The board of directors (the “Board”) of C C Land Holdings Limited (the “Company”) announces the consolidated results of the Company and its subsidiaries (collectively, the “Group”) for the year ended 31 December 2009 together with comparative figures for the previous year as follows: CONSOLIDATED INCOME STATEMENT 2009 2008 Notes HK$’000 HK$’000 REVENUE 3, 4 1,080,638 1,395,643 Cost of sales (875,441) (1,277,237) Gross profit 205,197 118,406 Other income and gains 4 80,212 244,436 Selling and distribution costs (55,781) (65,247) Administrative expenses (247,475) (248,741) Other expenses 56,117 (1,298,468) Finance costs 5 (27,949) (40,584) Share of profits and losses of: Jointly-controlled entities (16,592) (14,569) Associates (1,004) (1,707) LOSS BEFORE TAX 6 (7,275) (1,306,474) Income tax expense 7 (35,651) 227,837 LOSS FOR THE YEAR (42,926) (1,078,637) For identification purposes only
-
Upload
khangminh22 -
Category
Documents
-
view
4 -
download
0
Transcript of C C LAND HOLDINGS LIMITED 中 渝 置 地 控 股 有 限 公 司

- 1 -
Hong Kong Exchanges and Clearing Limited and The Stock Exchange of Hong Kong Limited take no
responsibility for the contents of this announcement, make no representation as to its accuracy or
completeness and expressly disclaim any liability whatsoever for any loss howsoever arising from or in
reliance upon the whole or any part of the contents of this announcement.
C C LAND HOLDINGS LIMITED 中中中中 渝渝渝渝 置置置置 地地地地 控控控控 股股股股 有有有有 限限限限 公公公公 司司司司
****
(Incorporated in Bermuda with limited liability)
Website: www.ccland.com.hk (Stock Code: 1224)
ANNUAL RESULTS
FOR THE YEAR ENDED 31 DECEMBER 2009
The board of directors (the “Board”) of C C Land Holdings Limited (the “Company”) announces the consolidated results of the Company and its subsidiaries (collectively, the “Group”) for the year ended 31 December 2009 together with comparative figures for the previous year as follows:
CONSOLIDATED INCOME STATEMENT
2009 2008 Notes HK$’000 HK$’000
REVENUE 3, 4 1,080,638 1,395,643
Cost of sales (875,441) (1,277,237)
Gross profit 205,197 118,406
Other income and gains 4 80,212 244,436 Selling and distribution costs (55,781) (65,247)
Administrative expenses (247,475) (248,741) Other expenses 56,117 (1,298,468) Finance costs 5 (27,949) (40,584)
Share of profits and losses of: Jointly-controlled entities (16,592) (14,569) Associates (1,004) (1,707)
LOSS BEFORE TAX 6 (7,275) (1,306,474)
Income tax expense 7 (35,651) 227,837
LOSS FOR THE YEAR (42,926) (1,078,637)
* For identification purposes only

- 2 -
Attributable to: Owners of the parent (58,358) (837,145) Minority interests 15,432 (241,492)
(42,926) (1,078,637)
DIVIDENDS
Proposed final 8 77,054 42,893
LOSS PER SHARE ATTRIBUTABLE TO
ORDINARY EQUITY HOLDERS OF THE PARENT
9
Basic and diluted HK(2.51) cents HK(38.70) cents
CONSOLIDATED STATEMENT OF COMPREHENSIVE INCOME
2009 2008 HK$’000 HK$’000
LOSS FOR THE YEAR (42,926) (1,078,637)
Available-for-sale equity investments: Changes in fair value 128,351 (302,435) Deferred tax (32,088) 75,609
96,263 (226,826) Exchange differences on translation of foreign
operations 16,101 608,522
OTHER COMPREHENSIVE INCOME FOR
THE YEAR, NET OF TAX 112,364 381,696
TOTAL COMPREHENSIVE INCOME/(LOSS)
FOR THE YEAR 69,438 (696,941)
Attributable to: Owners of the parent 53,153 (503,538) Minority interests 16,285 (193,403)
69,438 (696,941)

- 3 -
CONSOLIDATED STATEMENT OF FINANCIAL POSITION
2009 2008 HK$’000 HK$’000 NON-CURRENT ASSETS
Property, plant and equipment 269,971 286,668 Investment properties 297,094 250,294 Prepaid land lease payments 2,258,873 2,222,536 Interests in jointly-controlled entities 726,268 1,210,921 Interests in associates 1,743 2,747 Convertible note receivable - loan portion 35,650 34,212 Available-for-sale investments 900,599 150,757 Properties under development 5,920,718 6,901,012 Interests in land use rights for property development 986,864 389,098
Total non-current assets 11,397,780 11,448,245
CURRENT ASSETS Properties under development 4,486,862 851,486 Completed properties held for sale 233,011 352,682 Land development rights - 166,270 Prepaid land lease payments 49,839 58,066 Inventories 51,410 74,941 Trade and bills receivables 10 72,902 116,126 Prepayments, deposits and other receivables 338,575 551,522 Equity investments at fair value through profit or loss 11,632 5,855 Conversion option derivative - 31 Tax recoverable 8,325 20,140 Deposits with brokerage companies 6,420 906 Pledged deposits 1,000 328,167 Restricted bank balances 533,237 11,940 Time deposits with original maturity over three months 993,913 - Cash and cash equivalents 2,256,445 1,665,469
9,043,571 4,203,601 Non-current asset classified as held for sale 102,539 -
Total current assets 9,146,110 4,203,601
CURRENT LIABILITIES Trade payables 11 919,911 521,135 Other payables and accruals 1,660,390 478,630 Call option liability 68,297 - Due to a related party 20,000 20,000 Loans from minority shareholders of subsidiaries 608,144 48,463 Interest-bearing bank and other borrowings 576,057 940,566 Tax payable 59,802 25,648 Consideration payable on acquisition of subsidiaries 1,100 3,100
Total current liabilities 3,913,701 2,037,542
NET CURRENT ASSETS 5,232,409 2,166,059
TOTAL ASSETS LESS CURRENT LIABILITIES 16,630,189 13,614,304

- 4 -
2009 2008 HK$’000 HK$’000 NON-CURRENT LIABILITIES Interest-bearing bank and other borrowings 2,166,437 1,828,646 Deferred tax liabilities 1,908,095 1,898,014
Total non-current liabilities 4,074,532 3,726,660
Net assets 12,555,657 9,887,644
EQUITY Equity attributable to owners of the parent Issued capital 12 257,263 214,463 Reserves 11,550,372 9,061,147
11,807,635 9,275,610 Minority interests 748,022 612,034
Total equity 12,555,657 9,887,644

- 5 -
Notes: 1. BASIS OF PREPARATION These financial statements have been prepared in accordance with Hong Kong Financial
Reporting Standards (“HKFRSs”) (which include all Hong Kong Financial Reporting Standards, Hong Kong Accounting Standards (“HKASs”) and Interpretations) issued by the Hong Kong Institute of Certified Public Accountants, accounting principles generally accepted in Hong Kong and the disclosure requirements of the Hong Kong Companies Ordinance. They have been prepared under the historical cost convention, except for investment properties, derivative financial instruments and certain equity investments, which have been measured at fair value. These financial statements are presented in Hong Kong dollars (“HK$”) and all values are rounded to the nearest thousand except when otherwise indicated.
2. CHANGES IN ACCOUNTING POLICY AND DISCLOSURES The Group has adopted the following new and revised HKFRSs for the first time for the current
year’s financial statements.
* Included in Improvements to HKFRSs 2009 (as issued in May 2009). ** The Group adopted all improvements to HKFRSs issued in October 2008 except for the
amendments to HKFRS 5 Non-current assets held for Sale and Discontinued Operations –
Plan to sell the controlling interest in a subsidiary, which are effective for annual periods beginning on or after 1 July 2009.
HKFRS 1 and HKAS 27 Amendments
Amendments to HKFRS 1 First-time Adoption of HKFRSs and HKAS 27 Consolidated and Separate Financial
Statements – Cost of an Investment in a Subsidiary, Jointly
Controlled Entity or Associate HKFRS 2 Amendments Amendments to HKFRS 2 Share-based Payment – Vesting
Conditions and Cancellations HKFRS 7 Amendments Amendments to HKFRS 7 Financial Instruments:
Disclosures – Improving Disclosures about Financial
Instruments HKFRS 8 Operating Segments HKFRS 8 Amendment* Amendment to HKFRS 8 Operating Segments – Disclosure of
information about segment assets (early adopted) HKAS 1 (Revised) Presentation of Financial Statements HKAS 18 Amendment* Amendment to Appendix to HKAS 18 Revenue – Determining
whether an entity is acting as a principal or as an agent HKAS 23 (Revised) Borrowing Costs HKAS 32 and HKAS 1
Amendments Amendments to HKAS 32 Financial Instruments: Presentation
and HKAS 1 Presentation of Financial Statements –
Puttable Financial Instruments and Obligations Arising on
Liquidation HK(IFRIC)-Int 9 and
HKAS 39 Amendments Amendments to HK(IFRIC)-Int 9 Reassessment of Embedded
Derivatives and HKAS 39 Financial Instruments:
Recognition and Measurement – Embedded Derivatives HK(IFRIC)-Int 13 Customer Loyalty Programmes HK(IFRIC)-Int 15 Agreements for the Construction of Real Estate HK(IFRIC)-Int 16 Hedges of a Net Investment in a Foreign Operation HK(IFRIC)-Int 18 Transfers of Assets from Customers (adopted from 1 July 2009) Improvements to HKFRSs
(October 2008)** Amendments to a number of HKFRSs

- 6 -
Other than as further explained below regarding the impact of the HKFRS 7 Amendments, HKFRS 8, the HKFRS 8 Amendment and HKAS 1 (Revised), the adoption of these new and revised HKFRSs has had no significant changes to the accounting policies applied in these financial statements. The principal effects of adopting the HKFRS 7 Amendments, HKFRS 8, the HKFRS 8 Amendment and HKAS 1 (Revised) are as follows: (a) Amendments to HKFRS 7 Financial Instruments: Disclosures – Improving Disclosures
about Financial Instruments
The HKFRS 7 Amendments require additional disclosures about fair value measurement and liquidity risk. Fair value measurements related to items recorded at fair value are to be disclosed by sources of inputs using a three-level fair value hierarchy, by class, for all financial instruments recognised at fair value. In addition, a reconciliation between the beginning and ending balance is now required for level 3 fair value measurements, as well as significant transfers between levels in the fair value hierarchy. The amendments also clarify the requirements for liquidity risk disclosures with respect to derivative transactions and assets used for liquidity management.
(b) HKFRS 8 Operating Segments and Amendment to HKFRS 8 Operating Segments –
Disclosure of information about segment assets
HKFRS 8, which replaces HKAS 14 Segment Reporting, specifies how an entity should report information about its operating segments, based on information about the components of the entity that is available to the chief operating decision maker for the purposes of allocating resources to the segments and assessing their performance. The standard also requires the disclosure of information about the products and services provided by the segments, the geographical areas in which the Group operates, and revenue from the Group's major customers. The Group concluded that the operating segments determined in accordance with HKFRS 8 are the same as the business segments previously identified under HKAS 14. These revised disclosures, including the related revised comparative information, are shown in note 3 below.
The Group has early adopted in these financial statements the Amendments to HKFRS 8 issued in Improvements to HKFRS 2009 which clarifies that segment assets need only to be reported when those assets are included in measures that are used by the chief operating decision maker.
(c) HKAS 1 (Revised) Presentation of Financial Statements
HKAS 1 (Revised) introduces changes in the presentation and disclosures of financial statements. The revised standard separates owner and non-owner changes in equity. The statement of changes in equity includes only details of transactions with owners, with all non-owner changes in equity presented as a single line. In addition, this standard introduces the statement of comprehensive income, with all items of income and expense recognised in profit or loss, together with all other items of recognised income and expense recognised directly in equity, either in one single statement, or in two linked statements. The Group has elected to present two statements.
3. OPERATING SEGMENT INFORMATION
For management purposes, the Group is organised into business units based on their products and services and has four reportable operating segments as follows: Sale of packaging products
segment
– Manufacture and trading of watch boxes, gift boxes, spectacles cases, bags and pouches, and display units
Sale of travel bags segment – Manufacture and trading of soft luggage, travel bags, backpacks and briefcases
Treasury investment segment – Investments in securities and convertible notes, and provision of financial services
Property development and investment segment
– Development and investment of properties located in Mainland China

- 7 -
Management monitors the results of its operating segments separately for the purpose of making decisions about resources allocation and performance assessment. Segment performance is evaluated based on reportable segment profit/(loss), which is a measure of adjusted profit/(loss) before tax. The adjusted profit/(loss) before tax is measured consistently with the Group’s profit/(loss) before tax except that finance costs and head office and corporate income and expenses are excluded from such measurement. Intersegment sales and transfers are transacted with reference to the selling prices used for sales made to third parties at the then prevailing market prices. Information regarding these reportable segments, together with their related revised comparative information, is presented below.
Reportable segment information
Year ended 31 December 2009
Sale of
packaging products
Sale of travel bags
Treasury investment
Property development
and investment Total
HK$’000 HK$’000 HK$’000 HK$’000 HK$’000 Segment revenue Sales to external customers 294,671 132,438 6,392 647,137 1,080,638
Segment results 21,324 (4,086) 7,655 37,841 62,734
Corporate and unallocated income 43,554 Corporate and unallocated expenses (85,614) Finance costs (27,949) Loss before tax (7,275)
Other segment information: Share of profits and losses of: Jointly-controlled entities - - - (16,592) (16,592)
Associates (1,004) - - - (1,004) Capital expenditure in respect of items of property, plant and equipment 462 173 - 9,207 9,842 Depreciation 7,462 1,769 73 10,979 20,283 Amortisation of prepaid land lease
payments 573 75 - 47,268 47,916 Fair value gains on investment
properties - - - 47,557 47,557 Fair value gains on equity
investments at fair value through profit or loss, net - - 3,196 - 3,196
Fair value loss on a conversion option derivative - - 31 - 31 Fair value loss on a call option
liability - - - 8,073 8,073 Impairment/(write-back of
impairment) of trade receivables (541) 49 - - (492)
Write-back of impairment losses recognised in respect of the Group’s properties portfolio - - - 146,871 146,871 Interests in jointly-controlled
entities - - - 726,268 726,268 Interests in associates 1,743 - - - 1,743

- 8 -
Year ended 31 December 2008
Sale of
packaging products
Sale of travel bags
Treasury investment
Property development
and investment Total
HK$’000 HK$’000 HK$’000 HK$’000 HK$’000 Segment revenue Sales to external customers 434,953 229,285 (581) 731,986 1,395,643
Segment results 17,088 (32,520) (9,004) (1,142,834) (1,167,270)
Corporate and unallocated income 74,246 Corporate and unallocated expenses (172,866) Finance costs (40,584)
Loss before tax (1,306,474)
Other segment information: Share of profits and losses of: Jointly-controlled entities - - - (14,569) (14,569) Associates (1,707) - - - (1,707) Capital expenditure in respect of items of property, plant and equipment 2,549 972 - 15,636 19,157 Depreciation 7,867 2,115 73 10,097 20,152 Amortisation of prepaid land lease
payments 573 74 - 56,385 57,032 Fair value gains on investment properties - - - 22,337 22,337 Fair value losses on equity
investments at fair value through profit or loss, net - - 4,684 - 4,684
Fair value loss on a conversion option derivative - - 1,827 - 1,827 Impairment/(write-back of impairment) of trade receivables 627 (1,093) - (49) (515) Write-back of impairment of other receivables - - - 31,360 31,360 Impairment of goodwill 8,968 23,818 - - 32,786 Impairment of interests in associates 29,538 - - - 29,538 Impairment losses recognised in
respect of the Group’s properties portfolio - - - 1,120,255 1,120,255
Interests in jointly-controlled entities - - - 1,210,921 1,210,921 Interests in associates 2,747 - - - 2,747
Geographical information
(a) Revenue from external customers 2009 2008 HK$’000 HK$’000
Mainland China 669,533 757,346 Hong Kong 97,719 151,848 Europe 170,407 237,306 North and South America 97,106 191,325 Others 45,873 57,818
1,080,638 1,395,643
The revenue information above is based on the location of the customers. (b) Non-current assets Over 90% of the Group’s non-current assets are located in Mainland China.

- 9 -
Information about a major customer Revenue of approximately HK$120,123,000 (2008: HK$195,148,000) was derived from sales
by sale of travel bags segment to a single customer, including sales to a group of entities which are known to be under common control with that customer.
4. REVENUE, OTHER INCOME AND GAINS Revenue, which is also the Group’s turnover, represents the aggregate of the net invoiced value
of goods sold, after allowances for returns and trade discounts; gross proceeds from sale of properties, net of business tax; net gains/(losses) on disposal of equity investments at fair value through profit or loss; gross rental income received and receivable from investment properties and dividend income from listed and unlisted investments during the year.
An analysis of the Group’s revenue, other income and gains is as follows:
2009 2008 HK$’000 HK$’000 Revenue Sale of goods 427,109 664,237 Sale of properties 626,899 712,315 Rental income 13,458 12,019 Gains/(losses) on disposal of equity investments at fair
value through profit or loss, net 4,217
(3,252) Dividend income from listed investments 5,926 8,221 Dividend income from unlisted investments 841 - Interest income from a convertible note receivable 2,188 2,103
1,080,638 1,395,643
Other income and gains Bank interest income 8,434 32,151 Other interest income 698 6,024 Exchange gains, net 1,629 - Excess over the cost of a deemed acquisition of
subsidiaries
4,614
- Excess over the cost of an acquisition of minority interests 6,544 - Fair value gains on equity investments at fair value
through profit or loss, net
3,196
- Gain on disposal of interests in land use rights 2,736 - Gain on partial disposal of an interest in a subsidiary - 138,392 Gain on disposal of investment properties - 1,966 Gain on disposal of items of property, plant and equipment - 111 Write-back of impairment of trade receivables 492 515 Write-back of impairment of other receivables - 31,360 Fair value gains on investment properties 47,557 22,337 Others 4,312 11,580
80,212 244,436
5. FINANCE COSTS
2009 2008 HK$’000 HK$’000 Interest on bank loans, overdrafts and other loans
wholly repayable within five years 94,711 143,990 Less: Interest capitalised (66,762) (103,406)
27,949 40,584

- 10 -
6. LOSS BEFORE TAX The Group’s loss before tax is arrived at after charging/(crediting) the following:
2009 2008 HK$’000 HK$’000 Cost of inventories sold 354,745 582,388 Cost of properties sold 516,266 691,512 Allowance/(write-back of allowance) for obsolete
inventories (488) 2,880 Depreciation 20,283 20,152 Less: Amount capitalised (321) (376) 19,962 19,776 Amortisation of prepaid land lease payments 47,916 57,032 Minimum lease payments under operating leases
in respect of land and buildings 5,089 4,967 Auditors’ remuneration 3,760 3,400 Employee benefits expense (including directors’
remuneration): Wages and salaries 192,473 224,435 Equity-settled share option expense 43,379 59,556 Pension scheme contributions 2,733 2,561 Less: Amount capitalised (12,030) (12,861)
226,555 273,691 Foreign exchange differences, net (1,629) 38,537 Gross rental income, net of business tax (13,458) (12,019) Direct operating expenses (including repairs and
maintenance) arising on rental-earning investment properties 4,430 3,337
Net rental income (9,028) (8,682) Interest income from a convertible note receivable (2,188) (2,103)
7. INCOME TAX
Hong Kong profits tax has been provided at the rate of 16.5% (2008: 16.5%) on the estimated assessable profits arising in Hong Kong during the year. Taxes on profits assessable in Mainland China have been calculated at the rates of tax prevailing in Mainland China.
2009 2008 HK$’000 HK$’000 Group:
Current charge for the year Hong Kong 3,689 4,000 Mainland China 39,484 2,546 43,173 6,546
Underprovision/(overprovision) in prior years Hong Kong (7,702) (1,243) Mainland China 4,605 (3,899) (3,097) (5,142)
Land appreciation tax charge for the year 28,523 17,964 Deferred tax (32,948) (247,205) 35,651 (227,837)

- 11 -
8. DIVIDENDS 2009 2008 HK$’000 HK$’000 Proposed final – HK$0.03 (2008: HK$0.02)
per ordinary share 77,054 42,893
The proposed final dividend for the year is subject to the approval of the Company’s shareholders at the forthcoming annual general meeting. No interim dividend was declared in respect of the current and prior years.
9. LOSS PER SHARE ATTRIBUTABLE TO ORDINARY EQUITY HOLDERS OF THE PARENT The calculation of basic loss per share amounts is based on the loss for the year attributable to ordinary equity holders of the parent, and the weighted average number of ordinary shares of 2,328,731,888 (2008: 2,162,913,430) in issue during the year. No adjustment has been made to the basic loss per share amount presented for the years ended 31 December 2009 and 2008 in respect of a dilution as the impact of the share options outstanding had an anti-dilutive effect on the basic loss per share amounts presented.
10. TRADE AND BILLS RECEIVABLES An aged analysis of the trade and bills receivables as at the end of the reporting period, based on the due date and net of provisions, is as follows: 2009 2008
Neither Past due Neither Past due past due but not past due but not nor impaired impaired Total nor impaired impaired Total HK$’000 HK$’000 HK$’000 HK$’000 HK$’000 HK$’000 Less than 1 month 59,367 9,425 68,792 83,738 20,453 104,191
1 to 2 months - 1,315 1,315 - 3,528 3,528
2 to 3 months - 1,717 1,717 - 1,572 1,572
Over 3 months - 1,078 1,078 - 6,835 6,835
59,367 13,535 72,902 83,738 32,388 116,126
11. TRADE PAYABLES
An aged analysis of the trade payables as at the end of the reporting period is as follows:
2009 2008 HK$’000 HK$’000 Within 1 month 120,790 278,246 1 to 2 months 28,727 15,299 2 to 3 months 61,727 6,572 Over 3 months 708,667 221,018
919,911 521,135
The trade payables are non-interest-bearing and are normally settled on terms of 30 to 60 days, except for HK$254,554,000 (2008: Nil) arising from the acquisition of a parcel of land and which is repayable in June 2010, interest-bearing at 5.31% per annum and secured by the pledge of the Group’s equity interests in Chengdu Zhongyi Property Development Company Limited.

- 12 -
12. SHARE CAPITAL 2009 2008 HK$’000 HK$’000 Shares Authorised: 5,000,000,000 (2008: 5,000,000,000) ordinary shares
of HK$0.10 (2008: HK$0.10) each 500,000 500,000
Issued and fully paid: 2,572,633,258 (2008: 2,144,633,258) ordinary shares
of HK$0.10 (2008: HK$0.10) each 257,263 214,463
On 28 July 2009, the Company and Thrivetrade Limited (“Thrivetrade”), a substantial shareholder of the Company and wholly-owned by Mr. Cheung Chung Kiu, entered into a Top-up Placing and Subscription Agreement with J.P. Morgan Securities (Asia Pacific) Limited and Citigroup Global Markets Asia Limited (collectively the “Placing Agents”) and pursuant to which, Thrivetrade agreed to place, through the Placing Agents, an aggregate of 428 million existing ordinary shares of the Company to certain private investors at a price of HK$5.92 each and subscribe for an aggregate of 428 million new ordinary shares of the Company at a price of HK$5.92 each. The Top-up Placing and Subscription Agreement was completed on 6 August 2009 and the net proceeds raised by the Group was approximately HK$2,478 million.
RESULTS The Group achieved a turnover of HK$1,080.6 million for the year ended 31 December 2009, a 22.6% decrease from HK$1,395.6 million of 2008. The property business recorded a turnover of HK$647.1 million (2008: HK$732.0 million). The turnover of the packaging and luggage business were HK$294.7 million (2008: HK$434.9 million) and HK$132.4 million (2008: HK$229.3 million) respectively, with the treasury investment business accounting for the remaining turnover balance of HK$6.4 million (2008: HK$(0.6) million). The loss attributable to shareholders for the year ended 31 December 2009 was HK$58.4 million, a decrease of HK$778.7 million from HK$837.1 million of last year. The loss per share for the year was 2.51HK cents, compared to the loss per share of 38.7HK cents in 2008. A diluted loss per share has not been disclosed as no diluted events existed during 2008 and 2009. FINAL DIVIDEND
The Directors are pleased to recommend a final dividend of HK$0.03 (2008: HK$0.02) per share to our shareholders whose names appear on the Register of Members of the Company on 24 May 2010. Subject to approval at the forthcoming Annual General Meeting, dividend warrants will be sent to shareholders on or about 3 June 2010. CLOSURE OF REGISTER OF MEMBERS The Register of Members will be closed from 19 May 2010 to 24 May 2010 (both days inclusive), during this period no share transfers will be registered. In order to be eligible to attend and vote at the Annual General Meeting of the Company to be held on 24 May 2010 and to qualify for the proposed final dividend, all transfers of shares accompanied by the relevant share certificates must be lodged with Tricor Secretaries Limited, the branch share registrar of the Company in Hong Kong, at 26th Floor, Tesbury Centre, 28 Queen’s Road East, Wanchai, Hong Kong, not later than 4:30 p.m. on 18 May 2010.

- 13 -
MANAGEMENT DISCUSSION AND ANALYSIS BUSINESS REVIEW The turnover of the property business decreased by 11.6% to HK$647.1 million from HK$732.0 million of 2008, primarily due to the drop in completion and delivery of properties in the year as the Group slowed down its pace of developments in 2008 due to market uncertainty. Nevertheless, the property business accounted for 59.9% (2008: 52.5%) of the Group’s total revenue, signalling the Group’s successful transformation into a property company since it’s reorganization in late 2006. There was only one project completion in 2009, namely, the residential portion of Verakin New Park City Zone G, with a GFA of 120,000 sqm. The revenue for the year was also affected by the deferment of the recognition of the gain of about RMB143 million from the disposal of the Group’s 50% interest in the Wen Jiang Project to 2010. With only one project completion, the total revenue was insufficient to cover all expenses outlay. As a result, the property business recorded a loss attributable to the Group of HK$29.4 million (2008: HK$960.1 million after taking into account an impairment in value of the Group’s interest in land, net of deferred taxation, of HK$885.1 million). The loss also included HK$47.9 million amortization of prepaid land lease payments (2008: HK$57.0 million) and write-back of impairment in value of the Group’s interest in land, net of deferred taxation, of HK$116.6 million. The booked gross profit margin of the property business improved to 18% which sees a 15% increase when compared with that of the previous year. Excluding the effect of the fair value adjustment on the acquisition of land use rights through the acquisition of the land bank in Yubei and Verakin New Park City, the gross profit margin would have been 31% in the year ended 31 December 2009 (2008: 22%). The global financial crisis resulted in a fall in consumer confidence and demand, which affected the manufacturing business. Despite the difficult market conditions leading to the drastic fall in revenue, the manufacturing business managed to record a profit of HK$14.2 million (2008: a loss of HK$49.8 million including a written off of goodwill of HK$62.3 million arising from the acquisition of subsidiaries and an associate business operation in previous years). We responded to the economic slowdown by further tightening cost controls, rationalizing operations and raising productivity to secure the profit for the manufacturing business. The treasury investment business reported a gain of HK$14.8 million (2008: a loss of HK$9.1 million). This was mainly attributable to realized and unrealized gains on listed securities reflected during the year amounting to HK$3.8 million and HK$3.2 million respectively (2008: a total realized and unrealized loss of HK$8.2 million), and recording a tax credit of HK$7.7 million from a successful appeal to claim as non-taxable certain investment transactions from previous years. Other incomes recorded a fair value gain on investment properties of HK$47.6 million and a gain on disposal of interests in land use rights of HK$2.7 million (2008: HK$192.6 million from the gain on disposal of partial interest in a subsidiary, recovery of receivables and fair value gains on investment properties). Other expenses recorded an equity-settled share option expense which was non-operational and non-cash in nature amounting to HK$44.0 million (2008: HK$63.1 million) in respect of share options granted to certain directors, eligible employees of the Group and those who had served the Group and the write-back of HK$146.9 million of impairment in value of the Group’s interest in land. These led to a decrease in other expenses from HK$1,298.5 million in the previous financial year to a credit of HK$56.1 million in the current year. Marketing and distribution costs decreased by 14.4% to HK$55.8 million (2008: HK$65.2 million) due to the decrease in turnover of the manufacturing business in the year. The administrative expenses decreased by 0.5% to HK$247.5 million (2008: HK$248.7 million) as the decrease of amortization of prepaid land lease payments to HK$47.9 million (2008: HK$57.0 million) in the year was offset by the increase in employee benefits expenses as a result of the increased headcount for the property department.

- 14 -
The PRC Property Development and Investment Business China’s economic stimulus plan has produced positive results. Buyers’ confidence was restored and property sales have been picking up since early 2009. In China, property prices rose by an average of 7.8% in December 2009 compared to those of the same period in 2008. According to the statistical information on Chongqing and Chengdu, the GDP growth of Chongqing and Chengdu for 2009 were 14.9% and 14.7% respectively, ranking No. 3 and 4 respectively in China to outperform the national average of 8.7%. The outlook of economic developments in this region is expected to be ever promising. In terms of residential area sold, Chongqing ranked number two in China for 2009. The residential area sold in Chongqing and Chengdu in 2009 were 37.71 million sqm and 25.32 million sqm, representing an increase of 41.2% and 112.5% respectively. The demand for housing is massive and end-user driven. Speculation is not rife in the region. Recognized Turnover During the year ended 31 December 2009, the Group recognized a turnover of approximately 124,800 sqm of GFA, contributing to a turnover revenue from property sales of HK$626.9 million or RMB552.3 million (2008: 188,030 sqm and HK$712.3 million or RMB628.5 million respectively). An analysis of the GFA recognized as revenue and the average selling prices for the year ended 31 December 2009 is set out below:
Project Usage
Gross Floor Area
(sqm)
Sales Revenue Net of
Business Tax (RMB’000)
Average Selling
Price Net ofBusiness Tax
(RMB)
The Group’sInterest
No.1 Peak Road Residential
Car Park
40,090 1,570
223,0003,400
5,560/sqm86,100/unit
100%
Verakin New Park City – Zones A & B
Residential Commercial Car Park
430 390 120
2,0004,400
200
4,670/sqm11,270/sqm77,300/unit
61%
– Zone G Residential 82,200 319,300 3,880/sqm
TOTAL 124,800 552,300 No. 1 Peak Road – A high-end residential development, in which 76,300 sqm were sold as at 31 December 2009, achieved an average selling price of RMB5,300 per sqm of GFA. During the year, 41,660 sqm were delivered and recognized as turnover. While a total GFA of 33,400 sqm was delivered and recognized as turnover in year 2008, the remaining 2,800 sqm which have been sold will be delivered and recognized when the buyers collect the units in 2010. Verakin New Park City – A high-end multi-phased residential and commercial project. Zone A and B were completed in 2008 and were almost completely sold. About 700 sqm are still pending delivery to the buyers in 2010. The residential portion of Zone G was completed in the year. At 31 December 2009, a total of 82,200 sqm were recognized as turnover, with 20,500 sqm pre-sold GFA awaiting for collection and recognition as turnover in 2010. About 5,300 sqm are still in the inventory which represents only about 4.9% of the total residential area of Zone G. Contracted Sales The Group’s residential projects are located in prime locations in respective districts/towns/cities and are in the mid to high-end of the market. Due to their prime location and high quality finish, most of the units were sold during the first week of launch and at a price premium of 10-15% to projects in the neighbourhood. During the year, the Group’s contracted sales reached a total of approximately 299,500 sqm of GFA, which generated sales of RMB1,702.0 million (2008: 86,900 sqm and RMB454.9 million). It represented an increase of 245% and 274% respectively over those in previous year and about 40% above the 2009 targeted sales area of 213,200 sqm. As at 31 December 2009, the contracted but unrecognized sales amount was about RMB1,499.6 million. The recognition of these sales will depend on the time of completion of construction, the issuance of

- 15 -
occupation permits and delivery to the buyers. The average property selling price of the Group in the year increased by about 15-20% from the end of 2008. The breakdown for the contracted sales in 2009 is as follows:
Project Usage
Approximate Contracted Sales Area
(sqm)
Approximate Contracted
Sales Revenue (RMB’000)
Approximate Contracted ASP Before
Business Tax (RMB)
Chongqing
No.1 Peak Road
Residential Car Park
38,800 1,600
237,000 3,500
6,100/sqm90,600/unit
Verakin New Park City – Zone G, H & I
Residential
86,100
388,400
4,500/sqm
i-City Phases I & II Residential 71,700 299,300 4,200/sqm
Riverside, Wanzhou Phase I Residential 48,800 163,800 3,400/sqm
247,000 1,092,000
Chengdu
Sky Villa Phase I
Residential Car Park
49,200 3,300
603,600 6,400
12,300/sqm 70,000/unit
52,500 610,000
TOTAL 299,500 1,702,000 All the residential units of No. 1 Peak Road were sold as at 31 December 2009. The average selling price in 2009 was RMB6,100 per sqm which was 24% higher than that of previous year. Almost all units were delivered to the buyers during the year. The sales of the Verakin New Park City Zone G and Zone H progressed well during the year. Zone I has 948 units or 121,300 sqm. The first batch of 528 units or 61,800 sqm was first launched for pre-sale in November 2009. Out of this batch, 221 units or 26,200 sqm, or 42% were contracted for sale at an average selling price of RMB4,900 per sqm within the first month. During the year, almost all the residential units of i-City Phase I were pre-sold. i-City Phase II was launched for pre-sales in August 2009. It continued to be well received by the Chongqing market. Altogether 521 residential units or 60,200 sqm of Phase II were first released to the market. As at 31 December 2009, 232 units or 26,600 sqm of Phase II were contracted for sale at an average price of RMB4,800 per sqm which was 28% higher than that of Phase I. Sales of Riverside, Wanzhou Phase I commenced in September 2009, drawing considerable market interest. Phase I has 383 units or 50,100 sqm. All units were launched during the year. As at 31 December 2009, 374 units or 48,800 sqm, representing 97% of Phase I, were contracted for sale at an average price of RMB3,400 per sqm. Sky Villa Phase I with three towers, an aggregate of 682 residential units or 66,000 sqm, has been launched for pre-sale. The property sales of Sky Villa Phase I picked up remarkably in the year. A total of 623 units or 59,900 sqm, representing 91%, were contracted for sale at an average price of RMB12,000 per sqm as at 31 December 2009. Currently, the average selling price has increased to RMB16,000 per sqm which is over 50% up from the initial launch price of RMB10,500 per sqm.
- 16 -
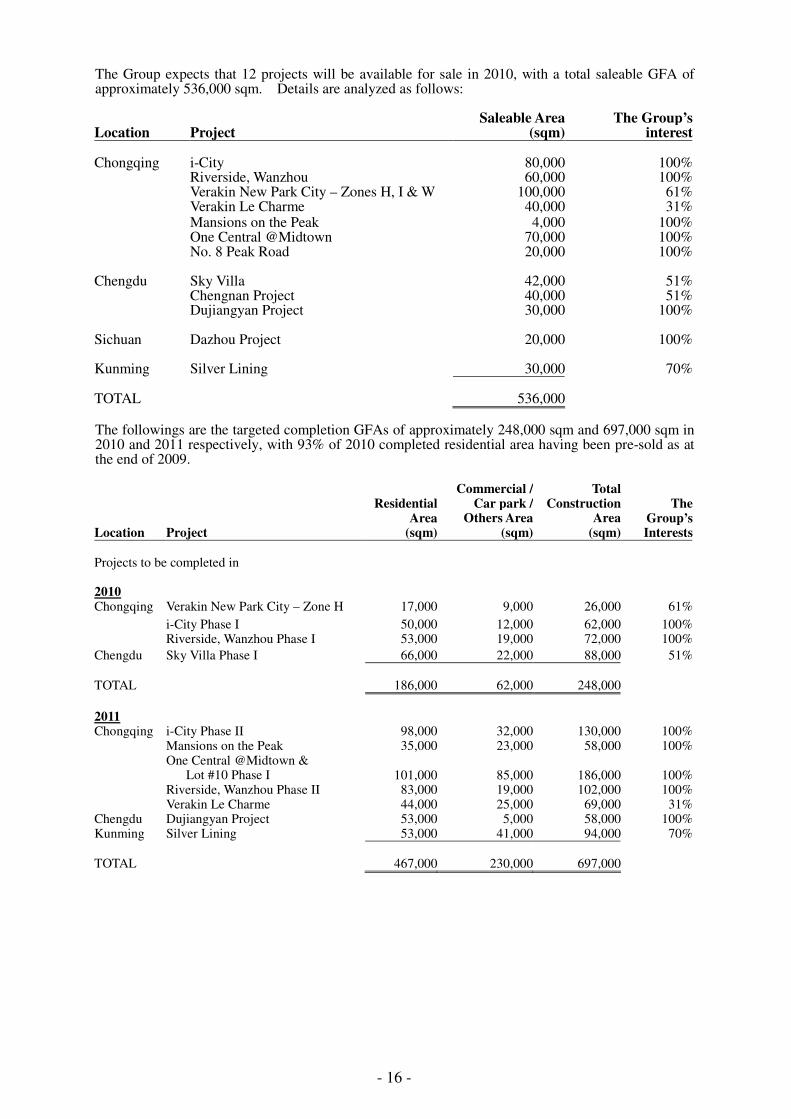
The Group expects that 12 projects will be available for sale in 2010, with a total saleable GFA of approximately 536,000 sqm. Details are analyzed as follows: Location Project
Saleable Area (sqm)
The Group’s interest
Chongqing i-City 80,000 100% Riverside, Wanzhou 60,000 100% Verakin New Park City – Zones H, I & W 100,000 61% Verakin Le Charme 40,000 31% Mansions on the Peak 4,000 100% One Central @Midtown 70,000 100% No. 8 Peak Road 20,000 100% Chengdu Sky Villa 42,000 51% Chengnan Project 40,000 51% Dujiangyan Project 30,000 100% Sichuan Dazhou Project 20,000 100% Kunming Silver Lining 30,000 70% TOTAL 536,000 The followings are the targeted completion GFAs of approximately 248,000 sqm and 697,000 sqm in 2010 and 2011 respectively, with 93% of 2010 completed residential area having been pre-sold as at the end of 2009.
Location Project
ResidentialArea
(sqm)
Commercial / Car park /
Others Area (sqm)
Total Construction
Area (sqm)
The Group’sInterests
Projects to be completed in 2010 Chongqing Verakin New Park City – Zone H 17,000 9,000 26,000 61%
i-City Phase I 50,000 12,000 62,000 100% Riverside, Wanzhou Phase I 53,000 19,000 72,000 100%
Chengdu Sky Villa Phase I 66,000 22,000 88,000 51% TOTAL 186,000 62,000 248,000
2011 Chongqing i-City Phase II 98,000 32,000 130,000 100% Mansions on the Peak 35,000 23,000 58,000 100% One Central @Midtown &
Lot #10 Phase I 101,000 85,000 186,000 100% Riverside, Wanzhou Phase II 83,000 19,000 102,000 100% Verakin Le Charme 44,000 25,000 69,000 31%Chengdu Dujiangyan Project 53,000 5,000 58,000 100%Kunming Silver Lining 53,000 41,000 94,000 70% TOTAL
467,000 230,000 697,000

- 17 -
Property Development There were 16 projects in different stages of development during the year. The total area under construction as at 31 December 2009 was 1,100,000 sqm which is about 3.7 times of the contracted area in 2009. Chongqing Projects Verakin New Park City (同景國際城同景國際城同景國際城同景國際城) – A high-end multi-phased residential and commercial project with a total GFA of about 1.6 million sqm. The residential portion of Zone G with a GFA of about 120,000 sqm was completed during the year and delivery started in September 2009. Zone H and Zone I are under construction. Zone H is a town-house development with a GFA of about 26,000 sqm. Zone I will provide about 150,000 sqm of residential and commercial property. About 98% of Zone G’s residential properties have been sold. Zone H is expected to be completed in the first half of 2010. Zone I commenced construction in September 2009 and was launched for pre-sale in November 2009. The foundation work for Zone W with a GFA of about 241,000 sqm has been completed and this zone is expected to be launched to the market in early 2010. Mansions on the Peak (御府御府御府御府) – The foundation work has been completed. Construction work of the super-structure started in the second half of 2009. The development consists of 46 villas with a total GFA of about 58,000 sqm and is expected to be completed in the second half of 2011. No. 8 Peak Road (山頂道山頂道山頂道山頂道 8號號號號) – The development would provide a planned GFA of about 51,000 sqm made up of 8 low-rise condominiums blocks and a few commercial units. The design plan has been revised to comply with the local government’s requirement. Construction work commenced in November 2009 and the project is expected to be completed by 2012. Sky Towers on the Peak (山頂道國賓城山頂道國賓城山頂道國賓城山頂道國賓城) – A four-phased development project of high-rise apartments with a total GFA of about 495,000 sqm. Construction work of the first phase commenced in January 2010. One Central @Midtown (都會首站都會首站都會首站都會首站) & Lot #10 – A landmark development in our Yubei main land bank that provides a planned GFA of about 588,000 sqm, comprising an investment-grade shopping mall, a 5-star hotel with an associated serviced apartment block, several office towers, residential units and retail spaces. The master plan has been approved by the local authority. Construction of Phase I comprised of 4 residential towers (One Central @Midtown), an office building, retail spaces and car parking spaces with a total GFA of about 186,000 sqm commenced in the second quarter of 2009. Presales of the first residential tower started in January 2010, and 92% of the units were sold on the first day. The first phase of the project is expected to be completed in 2011. i-City (愛都會愛都會愛都會愛都會) – A three-phased development project near the new Yubei train terminal, providing a GFA of about 304,000 sqm of mixed residential and commercial property. The superstructure of the first phase with a GFA of about 62,000 sqm is nearly topping out, and internal and external finishing work is now in progress. All residential units of Phase I have been sold. Construction of the second phase with a GFA of about 130,000 sqm commenced in the second quarter of 2009, pre-sale of which was launched in August 2009. The first phase and the second phase of the project are expected to be completed in 2010 and 2011 respectively. Phoenix County (梧桐郡梧桐郡梧桐郡梧桐郡) – A high-end residential townhouse and high-rise apartments project near the new Yubei train terminal with a total GFA of about 399,000 sqm. The construction of the first phase with a GFA of about 79,000 sqm will commence in the first half of 2010 and is expected to be completed in 2012. Riverside, Wanzhou (濱江壹號濱江壹號濱江壹號濱江壹號) – Located in the Jiangnan New District in Wanzhou, the project will be developed into an integrated complex, consisting of high-end residential property, retail facilities, and an office building with a total GFA of about 408,000 sqm. Construction work for the first phase of the residential property with a GFA of about 72,000 sqm started in the second quarter of 2009. Phase I pre-sales was launched in September 2009 and is planned to be delivered in the second half of 2010. Phase II with a GFA of about 102,000 sqm is planned to commence construction in the first half of 2010 and is scheduled for completion in the second half of 2011. Verakin Le Charme (同景同景同景同景·南門金階南門金階南門金階南門金階) – A residential project located in the Fuling District of Chongqing with a total GFA of about 69,000 sqm for residential and commercial development. The residential units were launched in early March 2010 and about 83% were pre-sold with the first week. It is expected to be completed in 2011.

- 18 -
Jiangbei Project – A 25% equity interest joint venture project along the north bank of the city center section of the Jialing River, with a total GFA of about 1,020,000 sqm which is planned to be developed into a high-end residential and commercial complex. The preliminary plans of the project are in the process of revision. Chengdu Projects Sky Villa (四海逸家四海逸家四海逸家四海逸家) – A residential project located in the Jinjiang District with a total GFA of about 557,000 sqm. Construction of the first phase with a GFA of about 88,000 sqm consisting of three towers is in progress. The superstructure of Phase I is nearly topped out. Internal and external finishing work is now in progress. Over 90% of the Phase I residential units have been pre-sold and the current ASP has increased to RMB16,000 per sqm from the initial RMB10,500 per sqm. Phase I is scheduled for delivery in the second half of 2010. Construction of the second phase commenced in December 2009 and is expected to be completed in 2012, pre-sales of which was launched in February 2010. Chengnan Project (城南逸家城南逸家城南逸家城南逸家) – A villa and townhouse project with a total GFA of about 312,000 sqm in Shuangliu County, Chengdu. The project is just 8 minutes away from the southern extension of the Chengdu South Renmin Road. Shuangliu County is a highly developed transportation hub and presently the sole aviation hub in Chengdu. It is the largest air traffic centre in Western China. The project is opposite to the Sichuan University campus along a river bank and will be developed in phases. Construction work for Phase I has started and pre-sales is expected to take place in the first half of 2010 and expected to be completed in 2012. Mumashan Project (牧牧牧牧山山山山逸家逸家逸家逸家) – A high-end villa and townhouse project with a total GFA of about 344,000 sqm in Huayuan Town, Xinjin County, Chengdu, a suburban district approximately 15 kilometers south-west of Chengdu. The project is close to the Shuangliu International Airport and the site has been cleared and upgraded by the local government from rural land into land for low-density residential property development. The construction is planned to commence in the first half of 2010 and expected to be completed in 2012. Dujianyan Projects (都江逸家都江逸家都江逸家都江逸家) – A low-rise residential project with GFA of about 58,000 sqm in Dujianyan district which is a famous tourist spot. Construction work is planned to be started in the first half of 2010 and will be completed in 2011. Other Projects Dazhou Project (雍雍雍雍河灣河灣河灣河灣) – A residential project located in the Tongchuan District with a total GFA of about 413,000 sqm. Foundation work for Phase I with a construction area of about 150,000 sqm has started. Construction will commence in the first half of 2010. Silver Lining (雲都國際雲都國際雲都國際雲都國際) – This pilot project in Kunming has a total GFA of about 94,000 sqm, comprising of residential, serviced apartments and commercial property. The foundation work has been completed. The construction work is planned to commence in the first half of 2010 and is expected to be completed in 2011.

- 19 -
As at date of this report, details of the projects held for development are as follows:
Locations/Project Names Expected
Completion DateGFA (sqm)
The Group’s Interest
Chongqing, Yubei District -Phoenix County -i-City -Mansions on the Peak -One Central @Midtown & Lot #10 -No. 8 Peak Road
-Sky Towers on the Peak -17-1
-9 -19 -4 -3-1 -Others Chongqing, Jiangbei District Chongqing, Nan’an District -Verakin New Park City Chongqing, Wanzhou District -Riverside, Wanzhou Chongqing, Tongnanxian Chongqing, Shapingba District, U-City Chongqing, Fuling District, Nanmenshan -Verakin Le Charme Chengdu, Dujiangyan District, Xujia Town Chengdu, Dujiangyan District, Yutang Town Chengdu, Jinjiang District -Sky Villa Chengdu, Shuangliu County,
Chengnan Project Chengdu, Xinjin County, Mumashan Project
Meishan, Pengshan County -Binjiang New Town Sichuan, Dazhou, Tongchuan District Kunming -Silver Lining
2012 or after2010 or after
20112011 or after
20122012 or after2012 or after2012 or after2012 or after2012 or after2012 or after2012 or after2012 or after
2010 - 2017
2010 or after2012 or after2012 or after
2011 2011
2012 or after
2010 - 2012
2012 or after
2012 or after
2012 or after2012 or after
2011
399,000304,000
58,000588,000
51,000495,000217,000365,000383,000597,000301,000109,000
1,020,000
1,357,000
408,000867,000423,000
69,00058,000
187,000
557,000
312,000
344,000
1,000,000
413,00094,000
100%100%100%100%100%100%100%100%100%100%100%100%
25%
61%
100%100%100%
31%100%
60%
51%
51%
51%
60%100%
70% TOTAL
10,976,000
Land Bank The Group continues to identify and acquire selectively quality land banks with great development potentials and good profit margins. The land bank strategy is to keep a land bank portfolio sufficient for 7 to 8 years of development. As at the report date, the Group had 16 land lots in our land bank portfolio of approximately 11.0 million sqm GFA (attributable GFA amounted to about 8.5 million sqm) held for development. The average land cost is about RMB1,680 per sqm. The Group’s land bank covers Chongqing, Chengdu, the Sichuan Province, and Kunming. Within our portfolio, the land lots located at the Yubei District, Chongqing, are of the utmost importance due to their excellent location, and the maturity of the neighbourhood. A large portion of our trophy investments properties will be developed on these land lots.

- 20 -
During the year, the Group acquired the following parcels of land with an additional total construction area of about 1,266,000 sqm: 1. Yutang Town, Dujiangyan District, Chengdu – In January 2009, the Group secured at auction a land lot with a GFA of about 187,000 sqm at a total consideration of RMB126 million with an average price of RMB678 per sqm in Yutang Town, Dujiangyan District, Chengdu. The acquired site is part of the land lots put up for sale in land auctions by the PRC authority associated with the land development rights assigned to the Group in 2007. The Group has a 60% equity interest in this land site. 2. Chengnan, Chengdu – In May 2009, the Group acquired a 100% interest in a company which owns a piece of land in Wenxing Town, Shuangliu County, Chengdu, at a consideration of RMB474 million through its then 50% owned joint-venture entity which owns the Sky Villa Project. During the process, after capital contribution to the joint-venture entity, the entity has become a 51% owned subsidiary of the Group. The land lot has a GFA of about 312,000 sqm at a value of RMB1,519 per sqm GFA and has been approved for villa and townhouse development. 3. U-City, Sapingba District, Chongqing – In June 2009, the Group acquired through auction 3 new land lots in the Xiyong University City area, Sapingba District, Chongqing with a GFA of approximately 423,000 sqm, at a consideration of RMB234 million with RMB553 per sqm GFA. 4. Mumashan District, Xinjin County, Chengdu – In December 2009, the Group acquired a 96.5% interest in a company through its 51% owned indirect subsidiary. The company owns three land parcels located at the Baiyun Village, Huayuan Town, Xinjin County, Chengdu with a GFA of approximately 344,000 sqm at a value of RMB1,775 per sqm GFA for villa and town-house development. Subsequent to 31 December 2009, the Group acquired a 51% equity interest and the shareholder’s loan in a company which owns a piece of land in Nanmenshan, Fuling District, Chongqing, known as Verakin Le Charme, at a total consideration of RMB43.4 million through its 61% owned subsidiary which owns the Verakin New Park City Project. The land site has a GFA of about 69,000 sqm for residential and commercial development. The GFA cost was about RMB712 per sqm. To refine our land bank, the Group disposed of its 50% interest in the Wen Jiang Project, Chengdu, at a consideration of RMB234 million, with an estimated profit before tax of RMB143 million. The Wen Jiang Project has a GFA of about 865,000 sqm. In February 2010, the Group further disposed of all its 60% interests in the Jintang Project. As a result of the profit achieved on the disposal, the impairment loss amounting to HK$86 million provided for the land interests in 2008 was written back in the current year, with the remaining estimated profit before tax of HK$21 million to be accounted for on completion. The proceeds will be used to support quality land bank acquisition in the future.
For projects without controlling interests, the Group will consider to dispose of or to increase its position. The Group has increased its equity holding in the indirect subsidiary of the Company, Chongqing Verakin Real Estate Company Limited, from 51% to 61% at a consideration of RMB25 million. The Group has also increased its equity stake in the joint-venture company with Guojia Property from 50% to 51% controlling interests. The joint-venture company holds the Sky Villa Project, the Chengnan Project and the Mumashan Project in Chengdu. For the Dazhou project, the Group increased its stake from 95% to 100% during the year.

- 21 -
As at the report date, the Group’s land bank has a well-diversified portfolio. The breakdown by usage is as follows:
Usage
Completed Properties
held for Investment
GFA
Properties held for
Own Use GFA
Completed Properties
held for Sale
GFA
Land held for Development
GFA Total GFA Percentage
(sqm) (sqm) (sqm) (sqm) (sqm)
Total Attributable
Commercial 28,000 9,000 4,000 812,000 675,000 853,000 7.6
Residential 3,000 30,000 6,025,000 4,542,000 6,058,000 54.3
Office 763,000 748,000 763,000 6.8 Hotel & serviced apartment 590,000 460,000 590,000 5.3
Townhouse & villa 1,342,000 919,000 1,342,000 12.0
Others (Car-park
spaces and other
auxiliary facilities) 53,000 11,000 38,000 1,444,000 1,192,000 1,546,000 14.0 TOTAL 84,000 20,000 72,000 10,976,000 8,536,000 11,152,000 100.0
The Group has a very low inventory. Completed properties held for sale is only 0.65% of the total land bank. Out of the 30,000 sqm completed residential properties held for sale, about 79% have been sold and are pending delivery. This confirms the desirability of the Group’s projects due to its high quality and the excellent responses from the buyers. The breakdown of the land bank held for development by location is as follows:
Locations Total GFA
(sqm) Attributable GFA
(sqm) Percentage Chongqing 8,011,000 6,668,000 72.9 Sichuan
- Chengdu 1,458,000 789,000 13.3 - Pengshan 1,000,000 600,000 9.1 - Dazhou 413,000 413,000 3.8
Yunnan
- Kunming 94,000 66,000 0.9 TOTAL 10,976,000 8,536,000 100.0 Investment Properties The Group’s investment property portfolio as at 31 December 2009 amounted to approximately 83,982 sqm GFA (31 December 2008: 84,467 sqm), comprising approximately 33.7% in commercial properties, 4.0% in residential properties, 62.3% in car parks and auxiliary facilities. During the year, the portfolio’s fair value appreciated by approximately HK$47.6 million to HK$297.1 million, the majority of which was the revaluation gain recognized in relation to the commercial properties. The rental income from the investment properties amounted to approximately HK$13.5 million (2008: HK$12.0 million), representing an increase of 12.5%.

- 22 -
Investment Properties Under Development With the recently awarded Special Economic Zone status for Chongqing and Chengdu, which translates into massive Central Government’s spending in Chongqing’s infrastructures, preferential tax policies, and other supportive measures, many large overseas corporations are expected to be attracted to the region. A new Third New District is expected to be created in the Chongqing’s New North Zone immediately next to the Group’s main land bank. This district will enjoy the same privileges which have been accorded to Pudong of Shanghai, and the Binhai District of Tianjin. In addition, in early 2009, Chongqing was chosen as the first and only inland free-trade zone where enterprises can enjoy many tax privileges both for import and export. In the 11th Five Year Plan, the Chongqing Municipal Government encouraged intensive development in the urban areas, and the northern part of Chongqing is the ideal site for the new city centre. Being the “North Window” of Chongqing, the Yubei District is strategically important in the whole development blueprint of Chongqing. The Group’s core land bank in the Yubei District is situated right at the heart of the Yubei District of Chongqing, a district where the regional government administration offices, major highway junctions and a new rail transportation hub are located. It takes only 20 minutes by car from the Chongqing Airport to the Yubei District. The airport is under an expansion programme with a budget of RMB20 billion to build more runways in anticipation of the rising status of Chongqing to lead Western China into the future. The Group’s core land bank in the Yubei District has been earmarked for development as separate but interlinked projects, consisting of hotels, commercial and residential complexes. Internationally renowned architects and designers have been enlisted to take care of these projects. In view of the prime location of these projects, the Group intends to keep the trophy commercial properties for rental purposes and is expected to build up the investment property portfolio in the coming four years. Once completed, this portfolio will form a solid base of recurrent rental income and cash flow for the Group. There are four commercial land lots at the Group’s core land bank in the Yubei District, namely, Lot No. 3, 4, 9 and 10. Construction on the first commercial land lot, No. 10, started in May 2009, and the pre-sale for the residential project (One Central @Midtown) on this land lot was launched in January 2010. The pre-sale response was overwhelming with 92% of the first batch sold on the first day of launch. The Group also formed a strategic partnership with the New World China Land Limited (“NWCL”), a leading property developer and hotel operator in China, in jointly developing the five-star luxury hotel and serviced apartment project on this lot. The equity interest of this jointly-developed project will be held as to 80% by the Group and 20% by NWCL. The hotel and serviced apartment project has an aggregate GFA of approximately 90,000 sqm and is scheduled to be completed by the year 2013. Investor Relations After the financial tsunami in late 2008, investors revised their portfolios and began to look for investment opportunities in 2009. The stock market was still very volatile which provided both challenges and opportunities for the investors. The Group is committed to continuous communications with our shareholders and potential investors both in good and bad times. As the Group’s property business is in China, which is very much policy-related, any new government policies related to the property market in China would affect the stock market sentiment and investors’ decisions. Detailed interpretation and explanation on the government policies and how they will affect the Group’s business is important for investors to have a better understanding on the future outlook of the Group. In addition to the Company’s global roadshows after the results announcement, the management of the Company also actively participated in investment forums organized by leading international investment banks. Conference calls were conducted when necessary. Site visits and property tours were arranged to give investors a better understanding of the Group’s development projects. In order to give timely updates to the investors, the Group has a column under “Investor Relations” in its corporate website, www.ccland.com.hk. All investor-related information may be found in the column. The Group also maintains an updated distribution list of investors to provide them with information on the Group’s latest development. From January 2010 onwards, the Group would release monthly update on its sales performance to keep investors timely informed on the business progress of the Group.

- 23 -
Good corporate governance also enhances corporate value and increases returns to shareholders. The Company was honored to be the Lead Sponsor of the 2009 Directors of the Year Awards organized by The Hong Kong Institute of Directors in support of the promotion of the practice of good corporate governance in Hong Kong. Manufacturing Business The financial year 2009 was challenging for our packaging and luggage products business. When the global economy started to deteriorate dramatically in September 2008, the packaging and luggage business suffered steep declines in sales. Revenues for the first six months decreased by 36.5% and 39.9% respectively from the same period of 2008 for the packaging and luggage business. To respond to the sudden change in market conditions, both operations completed the process of streamlining and rationalization to counter demand declines. For the packaging business, we are seeing signs of recovery as the US and the European economies stabilize. Sales in these markets picked up in the second half, representing an increase of 16% compared to the first half of year 2009. The rise in revenue in the second half year was largely driven by stronger demands from the North American market. Many new orders for 2010 have already come through from existing customers. The revenue from the Asian market was also stable throughout 2009. The revenue for the year, however, declined by 32.3% over that of 2008 to HK$294.7 million. Europe is still the largest market for our packaging business. As a result of the increase in sales in the second half year, coupled with the Group’s ability to control costs and higher operational efficiency, a net profit for the year of HK$19.7 million was achieved, an increase of 28.8% over that of the previous financial year. This was in essence an outstanding performance. The revenue for the luggage business fell by 42.3% to HK$132.4 million for the financial year 2009. For this business, the financial year 2009 was very much a year of two halves. In the first half, with the rapid actions taken by management to cut costs and resizing the operations to match demand declines, the Group recorded an operating profit of HK$0.6 million and a net loss of HK$2.9 million after accounting for the impact of a customer claim. However, in the second half, sales from the United States and Asia declined further as compared to the first half as customers reduced their orders in light of softening consumer demands. As a result of this decline in sales and related profit contribution, the operating profit as achieved in the first half could not be similarly sustained in the second half year. This resulted in an operating loss of HK$1.6 million in the second half of year 2009. During the year, progress was made in developing and broadening the customer base. The China domestic market remains under development, and sales were doing well for the luggage products. The initial sales were small but encouraging and the Group is expecting a 20% growth next year. The sales of suitcases and backpacks to the Asian market picked up in the last quarter. Gross operating profit margin improved by 3.9% from that of last year after revamping operating procedures and strict cost control. This significantly minimised the loss for the year amid reduction in sales. The loss for the year ended 31 December 2009 was HK$4.5 million (including a customer claim amounting to HK$3.5 million), a decrease of HK$29.3 million or 86.7% over that of the previous financial year. Based on current orders on hand, the Group is optimistic that performance will improve in the financial year 2010. Other Business The share of loss from the 30% owned associated company, Technical International Holdings Limited, amounted to HK$1.0 million (2008: HK$1.7 million). Its business had been affected by the slowing major economies. Consumer demand was weak though improved order flows from existing customers are expected in 2010. The performance will be enhanced by the introduction of new products categories through R&D. Treasury Investment Business The treasury investment business reported a gain of HK$14.8 million (2008: a loss of HK$9.1 million). This was mainly attributable to realized and unrealized gain on listed securities reflected during the year amounting to HK$3.8 million and HK$3.2 million respectively (2008: a total realized and unrealized loss of HK$8.2 million), and recording a tax credit of HK$7.7 million from a successful appeal to claim as non-taxable certain investment transactions from previous years. In view of the shrinking interest returns on deposits, the Group identified certain investments and invested in a portfolio of listed securities and unlisted investment funds.

- 24 -
PROSPECTS The PRC Property Development and Investment Business Year 2010 is a challenging year for the PRC property developers. To help stimulate economic growth, the government put in place supportive policies and a loose monetary policy in 2009. Property transaction volumes and prices across the country have followed a rising trend in 2009. To combat to rapid rises in property prices and speculation, the government announced a series of tighter land-sale regulations for developers and dispensed with a tax break on home sales it introduced earlier this year. The Group believes these policies are for the healthy development of China’s real estate industry. Western China is less affected by these control policies as the housing demand is mainly end-user driven and the affordability is still high. Fundamental factors such as an accelerated urbanization rate, higher income growth and preferences for private home ownership will support the property market in Western China. The Group believes that there is no change in these fundamental factors underlying the long term development prospects of the industry in Western China. It is believed that the macro-economic policies will continue to be fine-tuned to maintain a balanced economic growth and a healthy property market. Uncertainties and complexities are still present as the global economic recovery is still weak and the unemployment rate remained high. The Group will not underestimate the challenges ahead. The Group has always maintained a healthy liquidity position which supports business expansion and growth. We will be very selective in our land bank replenishment while maintaining the financial soundness and stability of the Group. The Group will endeavor to deliver quality projects, adjust the pace of development in line with market conditions and demands in order to increase our market share. The area under construction as at 31 December 2009 was 1,100,000 sqm which is about 3.7 times of the contracted sales area in 2009. The Group is ready for exponential growth. Manufacturing Business The major economies have suffered severe damages from the downturn. Unemployment is expected to continue to rise although at a slower pace. Recently, the G20 nations agreed to maintain the fiscal stimulus for the economy until the recovery from recession is firmly established. Secured orders in late 2009 showed that the confidence of customers was increasing. Businesses that have consumed their stocks will raise output cautiously to meet rising demands. The Group will continue to monitor the market conditions closely to take the best action while the economy is on the way to recovery. The packaging business is expected to perform better in 2010 as industry consolidation has strengthened further our market lead. This is based on our ability to deliver quality products with a rapid turn around time. We expect the profitability of the packaging business to improve following new measures to trim operational costs. While there is still a problem of over-supply in the luggage industry after the downturn, it is difficult to predict whether sales could attain growth in 2010. The orders from the US customers may continue to drop as consumer demand remains weak. The European market appears to be more stable than that in North America. We expect growth in revenue from this market segment in 2010. The luggage business is looking to create new revenue streams following the economic downturn, turning also to the Chinese domestic market. Design and development activities are vital for generating orders from existing customers and for establishing a long-termed relationship with new customers. Resources have been allocated to strengthen both the sales and development teams to develop business in China, which would enable us to have a greater understanding of customer’s needs. Results so far have been encouraging. The revenues generated from the mainland market have compensated for the shortfall in revenues from the US customers during the period of downturn. Given the overall improvements in the luggage business, and the widening of our customer base from our marketing efforts, the luggage business should achieve a better performance in line with the recovery of the world economy.

- 25 -
FINANCIAL REVIEW Liquidity and Financial Resources As of 31 December 2009, the Group’s utilized bank borrowings amounted to approximately HK$2,742.5 million (31 December 2008: HK$2,769.2 million). The structure of the Group’s bank borrowings as of 31 December 2009 is summarized below:
Currency of Bank Loans Total
Due within One Year
Due more than One Year
but not exceeding Two Years
Due more than Two Years
but not exceeding Five Years
HK$’M HK$’M HK$’M HK$’M
RMB 979.0 372.5 282.8 323.7 HK$ 1,749.1 189.1 1,560.0 - US$ 14.4 14.4 - -
2,742.5 576.0 1,842.8 323.7 Secured debt accounted for approximately 35.7% of total borrowings as at 31 December 2009 (31 December 2008: 29.0%). Total cash and bank balances and time deposits amounted to HK$3,784.6 million as of 31 December 2009 (2008: HK$2,005.6 million), which included HK$1.0 million (2008: HK$328.2 million) of deposits pledged to banks. The increase in the cash balance was the result of the net proceeds amounting to approximately HK$2,478 million received from the placement of 428 million new shares in July 2009 to independent investors at a price of HK$5.92 per share, and the proceeds from property sales. As of 31 December 2009, the Group’s net cash balance was HK$1,042.1 million (31 December 2008: net borrowings of HK$763.6 million). Details were: 2009 2008 HK$ million HK$ million Cash and bank balances and time deposits 3,784.6 2,005.6 Less: Total bank and other borrowings (2,742.5) (2,769.2)Net cash/(net borrowings) position 1,042.1 (763.6) Owners’ equity was HK$11,807.6 million (31 December 2008: HK$9,275.6 million). The Group is at net cash position as at 31 December 2009, after netting off total bank and other borrowings against cash and bank balances and time deposits. (31 December 2008: a net gearing ratio of approximately 8.2%, calculated by net borrowings of HK$763.6 million divided by total equity). This liquidity gives the Group flexibility to make rapid responses to market conditions and to maintain sufficient liquid funds to meet strategic initiatives in the future. Investment At 31 December 2009, the Group held a portfolio of listed and unlisted equity securities and a convertible note (issued by a company listed on the Stock Exchange) with a carrying value of HK$947.9 million (31 December 2008: HK$190.8 million). The amount of dividends, interest and other income from investments for the year was HK$9.0 million (2008: HK$10.3 million).

- 26 -
Contingent Liabilities / Financial Guarantees At 31 December 2009, the Group had the following contingent liabilities/financial guarantees: a. Guarantees given to banks in connection with facilities granted to an associate in the amount of
HK$13.5 million (2008: HK$13.5 million). b. Guarantees given to banks in respect of mortgage facilities granted to certain purchasers of the
Group and its jointly-controlled entity’s property units in the amount of HK$614.9 million (2008: HK$343.7 million) and nil (2008: HK$8.3 million) respectively.
Pledge of Assets At 31 December 2009, the Group has pledged the followings: a. Leasehold properties as security for general banking facilities
granted to the Group.
HK$5.7 million
b. Fixed deposits as security for general banking facilities granted to the Group.
HK$1.0 million
c. Properties under development, prepaid land lease payments, completed properties held for sale and investment properties pledged to secure banking facilities granted to the Group and a former shareholder of a subsidiary acquired by the Group during the year.
RMB3,939.7 million
Exchange Risks The sales and purchase transactions of the Group’s manufacturing business are primarily conducted in US dollars, Hong Kong dollars and/or RMB. The Group does not carry out currency hedging for these transactions but includes potential exchange fluctuations as an element in product costing. On account of the relatively short time required for revenue recognition for this business, the foreign exchange exposure is considered minimal. For the Group’s property business, sales transactions and all major cost items are denominated in RMB. Therefore the foreign exchange exposure for the property business is minimal. EVENTS AFTER THE REPORTING PERIOD a. In February 2010, the Group acquired a 51% interest and the shareholder’s loan in a company
which owns a piece of land in Nanmenshan, Fuling District, Chongqing, at a total consideration of RMB43.4 million through its 61% owned subsidiary which owns the Verakin New Park City Project. The land site has a GFA of about 69,000 sqm for residential and commercial development.
b. In February 2010, the Group disposed of its remaining 60% interest in Wisdom Gain Group
Limited, a company holding the Jintang Project, together with the related loan and receivables at a total consideration of HK$340 million. The gain on disposal is expected to be about HK$21.0 million.
c. In March 2010, the Group acquired the remaining 3.5% interest in Chengdu Shengshi Jingwei
Real Estate Investment Company Limited (“Chengdu Shengshi”) from the minority shareholder at a total consideration of RMB21,546,000 through its 51% owned subsidiary, Chengdu Guojia Cheer Gain Property Company Limited. After completion of the transaction, the Group has effectively 51% interest in Chengdu Shengshi.

- 27 -
EMPLOYEES At 31 December 2009, the Group had approximately 4,210 employees. The Group remunerates its staff based on their merit, qualification and competence. The Group has also established an incentive bonus scheme to reward individual employees based on their performance. Employees are also eligible to be granted share options under the Company’s share option scheme at the discretion of the Board. Other benefits include contributions to a provident fund scheme, mandatory provident fund, and medical insurance. During the year, option to subscribe for 17,500,000 shares at the exercise price of HK$3.27 per share was granted under the share option scheme to a director of the Company. Total fair value of the share option granted was approximately HK$26 million. For the year ended 31 December 2009, an amount of HK$43.4 million (2008: HK$59.6 million) was charged off as equity-settled share option expense to the income statement. CORPORATE GOVERNANCE During the year under review, the Company has complied with the code provisions set out in the Code on Corporate Governance Practices (the “Code”) contained in Appendix 14 of the Rules Governing the Listing of Securities on The Stock Exchange of Hong Kong Limited (the “Listing Rules”), save for a slight deviation from Code Provision A.4.1 of the Code, which stipulates that non-executive directors should be appointed for a specific term, subject to re-election. None of the existing non-executive directors of the Company are appointed for a specific term. Nevertheless, the length of tenure of non-executive directors is governed by the Company’s Bye-laws which require every director to retire by rotation at the annual general meeting at least once every three years. A retiring director is eligible for re-election. This stipulation is consistent with the requirements of Code Provision A.4.1 of the Code. As such, the Board considers that sufficient measures have been taken to ensure that the Company’s corporate governance practices are on terms no less exacting than the required standard set out in the Code. MODEL CODE FOR SECURITIES TRANSACTIONS BY DIRECTORS The Company has adopted the Model Code for Securities Transactions by Directors of Listed Issuers (the “Model Code”) set out in Appendix 10 of the Listing Rules (as amended from time to time) as its own codes of conduct regarding securities transactions by directors. Following specific enquiries made, all directors have confirmed that they have complied with the required standard set out in the Model Code throughout the year. PURCHASE, SALE OR REDEMPTION OF THE COMPANY’S LISTED SECURITIES Neither the Company nor any of its subsidiaries purchased, sold or redeemed any of the Company’s listed securities during the year ended 31 December 2009. AUDIT COMMITTEE The Audit Committee has discussed with the management and external auditors the accounting principles and policies adopted by the Group, and has reviewed the Group’s consolidated results for the year ended 31 December 2009. PUBLICATION OF THE RESULTS AND ANNUAL REPORT This results announcement is published on the Company’s website at www.ccland.com.hk and the HKExnews website at www.hkexnews.hk. The 2009 Annual Report will also be available on both websites and despatched to the shareholders of the Company in due course. By order of the Board Lam How Mun Peter Deputy Chairman and Managing Director Hong Kong, 26 March 2010 As at the date of this announcement, the Board comprises Mr. Cheung Chung Kiu, Dr. Lam How Mun Peter, Mr. Tsang Wai Choi, Mr. Lam Hiu Lo, Mr. Leung Chun Cheong, Mr. Leung Wai Fai, Ms. Poon Ho Yee Agnes, Dr. Wong Kim Wing and Mr. Wu Hong Cho as Executive Directors; Mr. Wong Yat Fai as Non-executive Director; and Mr. Lam Kin Fung Jeffrey, Mr. Leung Yu Ming Steven and Dr. Wong Lung Tak Patrick as Independent Non-executive Directors.