By: RMSC 9th grade Forensic Science Class - Frostburg State ...
46
By: RMSC 9 th grade Forensic Science Class
-
Upload
khangminh22 -
Category
Documents
-
view
1 -
download
0
Transcript of By: RMSC 9th grade Forensic Science Class - Frostburg State ...

By: RMSC 9th grade Forensic Science Class


How Fingerprints are used?
Natural Disasters
Identification
Missing Persons
Criminal Records

What are Fingerprints?
Fingerprints are valleys and ridges on the skin
that form patterns.
Valleys
Ridges
Facts about fingerprints
Permanent
Unique
Persistence
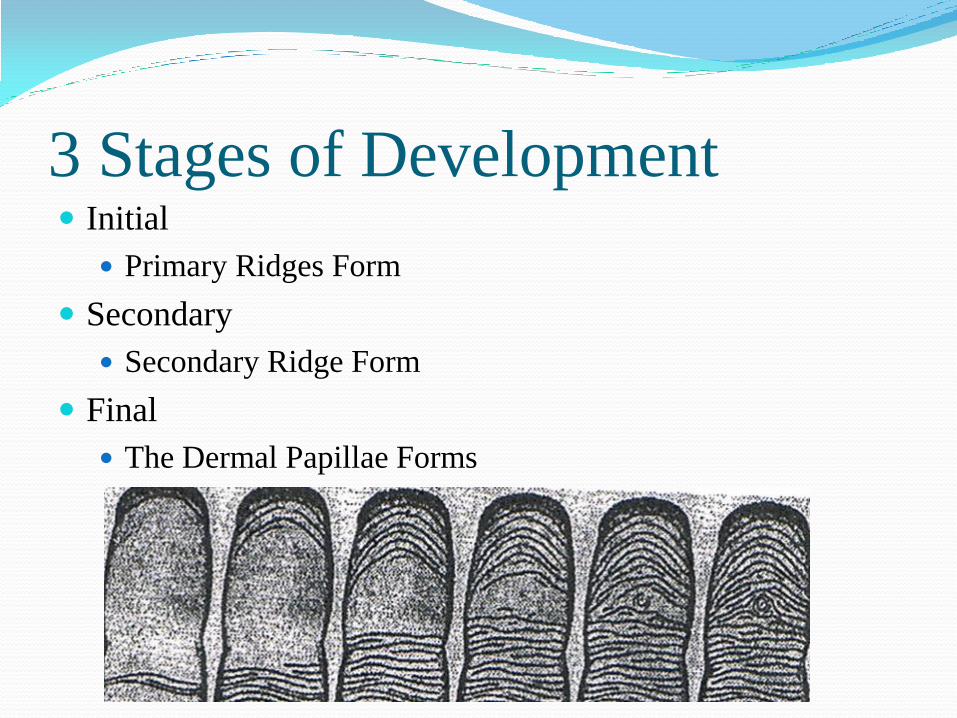
3 Stages of Development Initial
Primary Ridges Form
Secondary
Secondary Ridge Form
Final
The Dermal Papillae Forms

Timeline for Development
Weeks 5-7
Fingers separate
Weeks 7-11
Volar Pads form
Weeks 10-17
Primary Ridges form
Weeks 24-27
Formation stops

Movement in the Womb Cause different characteristics within the fingerprint
pattern
Causes dots, short ridges, enclosures, ending ridges and
bifurcation.

Heredity
Patterns are passed on from parents to
offspring

Types of Patterns
Loops
Whorls
Arches

Definition of Loops
o Loops are Fingerprints that have:
• One delta
• Recurve
• A core

Types of Loops Radial- delta on Left
Ulnar- delta on Right

Definition of A Delta
A delta is a “V” shaped design in the pattern.

Definition of Whorls Whorls are fingerprints that have:
Two Deltas
Repeated circles
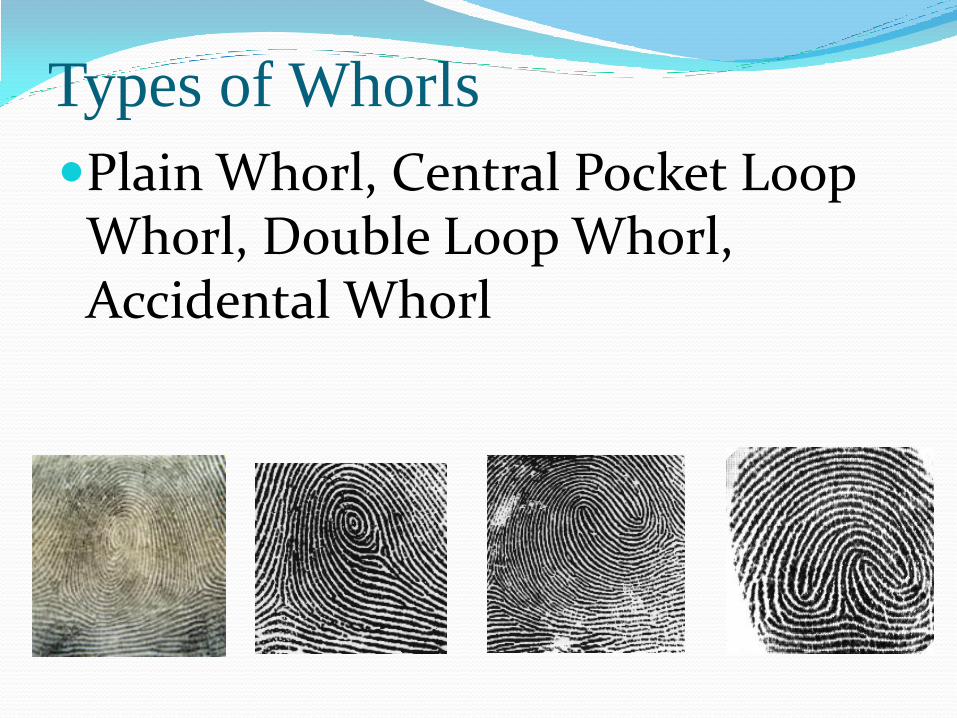
Types of Whorls Plain Whorl, Central Pocket Loop
Whorl, Double Loop Whorl, Accidental Whorl
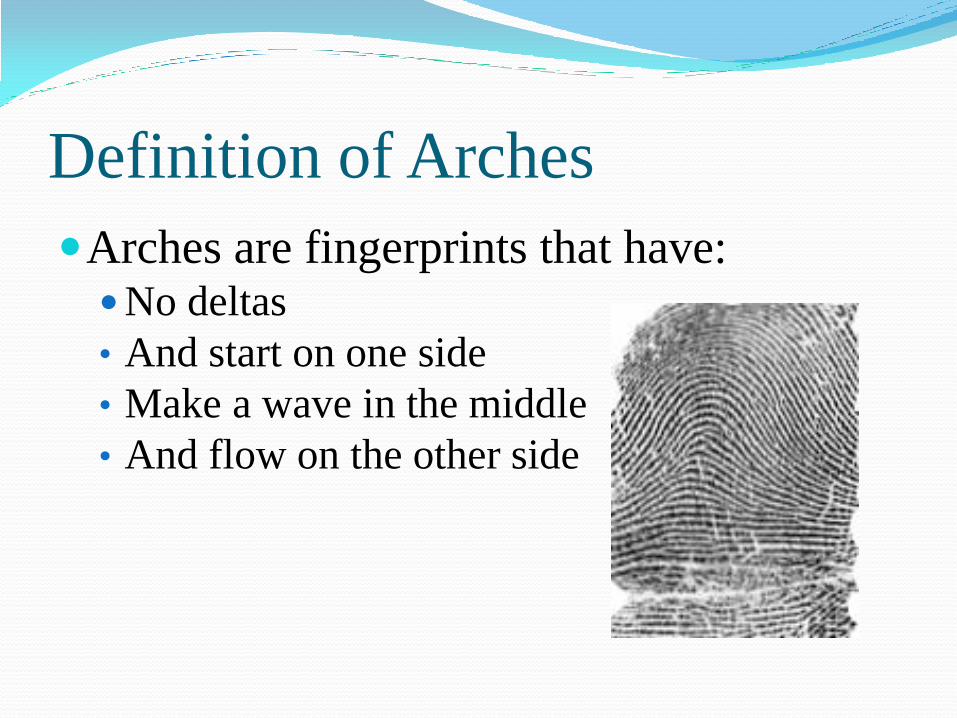
Definition of Arches
Arches are fingerprints that have: No deltas
• And start on one side
• Make a wave in the middle
• And flow on the other side

Types of Arches • Tented
• Plain

ACE-V Method The ACE-V is a method used for classifying
fingerprints
It stands for:
Analysis
Comparison
Evaluation
Verification
Known Percentages Of
Fingerprints
The known percentages of the population are:
Loops 65%
Whorls 30%
Arches 5 %

Purpose
The purpose of this project is to compare the
percentages of the fingerprints from the 9th
grade Forensics class with the known
percentages of the population.

Rationale
Ethnic diversity
Different genders
ACE-V method
Hypothesis
Out of 140 fingerprints taken from the
RMSC 9th grade Forensics group 65% of
the fingerprints will be loops, 30% will be
whorls, and 5% will be arches.


Location Frostburg State University : Compton Science
Center Room 135
June 29, 2010
From 1:30 pm – 2:30 pm

Materials
Vinyl gloves
Two ink pads
Ten print cards (01-14)
14 RMSC 9th grade Forensics Students
digits 1-10

Ten Print Card

Procedures Assigned numbers to ten-print cards labeled one
though fourteen.
Split up into groups of 8 and 6.
The group handed out the materials
Students split into partners of two to start fingerprinting.
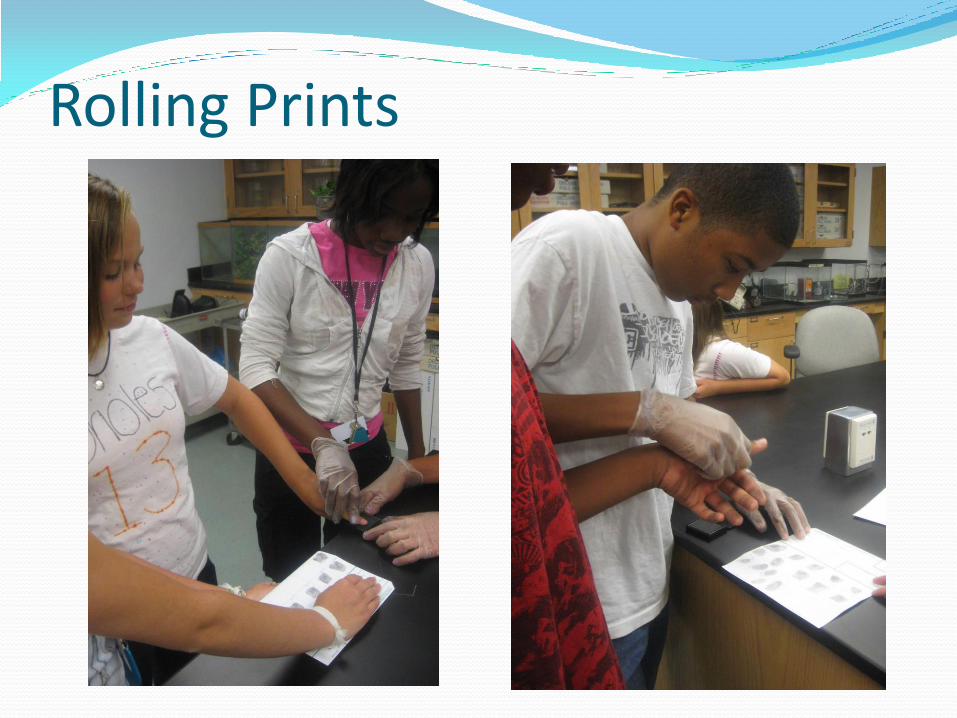
To take the rolled impressions of fingerprints using the FATT method
Fingers Away Thumbs Toward

Procedures continued Plain impressions of fingerprints were
taken
Ten print cards were collected
Ten-print cards were handed out randomly to students to be classified
Fingerprints were analyzed by using ACE-V method
Rolling Prints

ACE-V Method Analysis-look at characteristics of pattern
Comparison-compare the students’ patterns to the known patterns on back on Ten Print cards
Evaluation-assigned pattern
Verification-checked pattern

Classifying Prints
Blind Verification When another person verifies the
fingerprint without knowing the answer
If any fingerprints were disagreed upon, a third person checks the pattern and verifies the pattern.


Card
#
R.
Thumb
R.
Index
R.
Middle
R.
Ring
R.
Little
L.
Thumb
L.
Index
L.
Middle
L. Ring L. Little
01 L L AA L L AA AA L AA AA
02 W L L L L W L L L L
03 L W L L L L W L AA L
04 W W W L L L W L L L
05 W L AA L L W L L L L
06 L AA AA L L L L AA L L
07 L L L L L W L L L L
08 W L L L L W W L L L
09 W W W W W L W W L W
10 W W L L L W W L L L
11 L W L L L L L W W L
12 W L W L L W L L W L
13 W L L W W W W L L L
14 L W L L L L L W W W
Table 1. Classification of
patterns on the fingerprinting cards

Pattern # %
Loops 82 59
Whorls 48 34
Arches 10 7
Table 2. Numbers and percentages of RMSC 9th grade
Forensics class fingerprints

0%
10%
20%
30%
40%
50%
60%
70%
Loops Arches Whorls
Per
cen
tag
es
Patterns
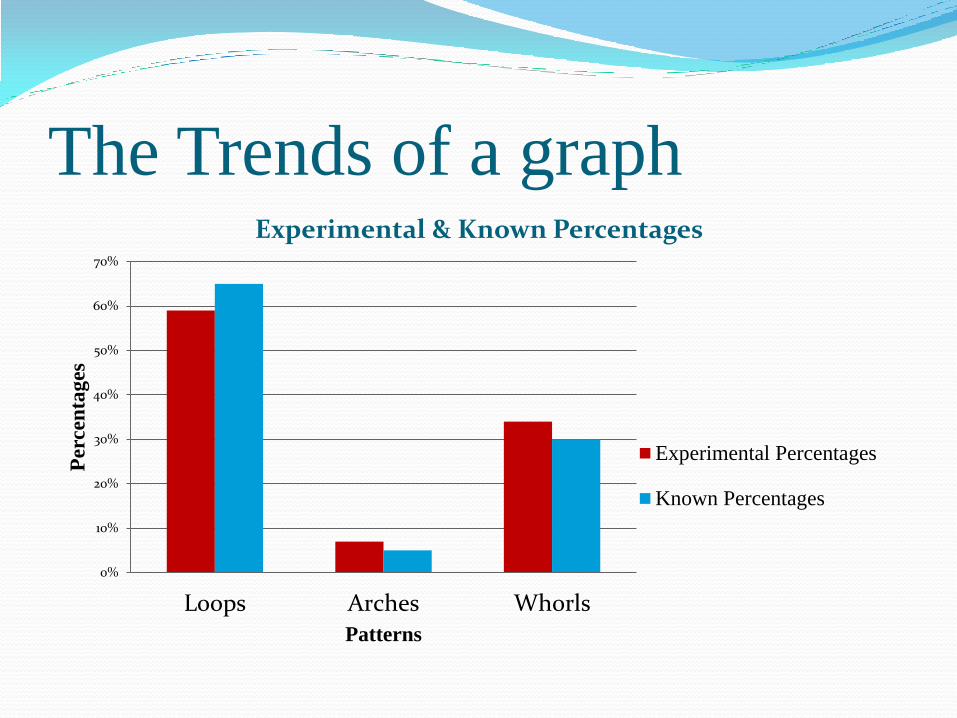
Experimental & Known Percentages
Experimental Percentages
Known Percentages
Figure 1: Experimental and Known Percentages of Fingerprint patterns

Pattern (o)
Observed
(e)
Expected
(o-e) (o-e)2 (o-e)2 Decimal
form
Arch 10 7 3 9 9/7 1.286
Loop 82 91 -9 81 81/91 0.890
Whorl 48 42 6 36 36/42 0.851
3.033
Table 3: Chi Square Table of Observed and
Expected Percentages of Fingerprint
Patterns


The Chi Square
Patterns Observed
(O)
Expected
(E)
(O-E) (O-E)2 (O-E)2/E Decimal
Arches 10 7 3 9 9/7 1.286
Whorls 48 42 6 36 6/7 0.857
Loops 82 91 -9 81 81/91 0.890
Total 3.033
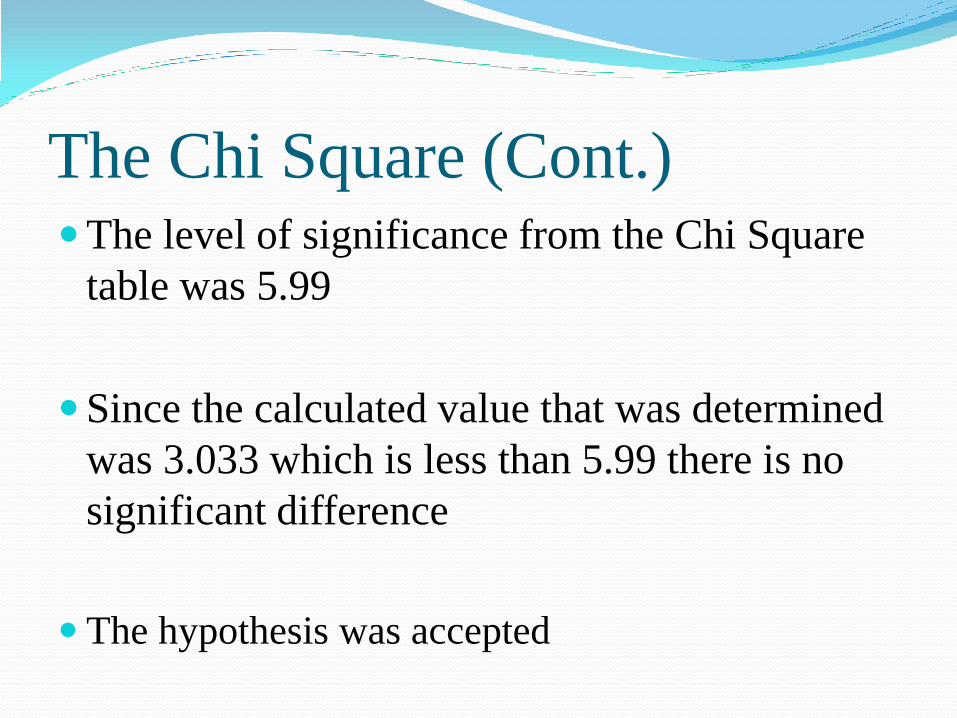
The Chi Square (Cont.) The level of significance from the Chi Square
table was 5.99
Since the calculated value that was determined
was 3.033 which is less than 5.99 there is no
significant difference
The hypothesis was accepted
The Trends of a graph
0%
10%
20%
30%
40%
50%
60%
70%
Loops Arches Whorls
Per
cen
tag
es
Patterns
Experimental & Known Percentages
Experimental Percentages
Known Percentages

Purpose
The purpose of this experiment is to compare the 9th grade forensics class of RMSC fingerprints to the worlds known percentages of fingerprint patterns

The Significance of the Purpose
The significance of the purpose is whether the purpose of the experiment was achieved

Limitations Number of fingerprints
Limited resources and time to print and analyze fingerprints
Type of Ink
Inexperience in classification

Suggestions More time to do the experiment
Testers with more experience rolling
fingerprints
Testers with more experience classifying
fingerprints
Use a better type of ink
A larger amount of people should be tested

Questions Raised
• What is the percentage of different
subgroups of loops, whorls, and arches on
a fingerprint?
• What kind of fingerprint pattern is on
each specific finger?