By MUHAMMAD ESSA KAKAR 2005-va-229 - Pakistan ...
210
77 CLINICO-EPIDEMIOLOGICAL AND THERAPEUTIC STUDY ON BABESIOSIS IN DIFFERENT BREEDS OF CATTLE IN BALOCHISTAN By MUHAMMAD ESSA KAKAR 2005-va-229 A THESIS SUBMITTED IN THE PARTIAL FULFILLMENT OF THE REQUIREMENT FOR THE DEGREE OF THE DOCTOR OF PHILOSOPHY IN CLINICAL MEDICINE UNIVERSITY OF VETERINARY AND ANIMAL SCIENCES LAHORE 2013
-
Upload
khangminh22 -
Category
Documents
-
view
1 -
download
0
Transcript of By MUHAMMAD ESSA KAKAR 2005-va-229 - Pakistan ...

77
CLINICO-EPIDEMIOLOGICAL AND THERAPEUTIC STUDY
ON BABESIOSIS IN DIFFERENT BREEDS OF CATTLE IN
BALOCHISTAN
By
MUHAMMAD ESSA KAKAR
2005-va-229
A THESIS SUBMITTED IN THE PARTIAL FULFILLMENT
OF THE REQUIREMENT FOR THE DEGREE OF
THE DOCTOR OF PHILOSOPHY IN
CLINICAL MEDICINE
UNIVERSITY OF VETERINARY AND ANIMAL SCIENCES
LAHORE
2013

78
To,
The Controller of Examinations,
University of Veterinary and Animal Sciences,
Lahore.
We, the Supervisory Committee, certify that the contents and form of the thesis,
submitted by Muhammad Essa Kakar, Reg. No. 2005-VA-229, have been found satisfactory
and recommend that it be processed for the evaluation by the External Examination (s) for award
of the Degree.
Supervisory Committee:
Supervisor: Prof. Dr. Muhammad Arif Khan
Co-Supervisor: Prof. Dr. Muhammad Azam Kakar
Member: Prof. Dr. Muhammad Sarwar Khan
Member: Prof. Dr. Kamran Ashraf

79
(i)

80
ACKNOWLEDGEMENTS
In the name of Allah, Most Gracious, Most Merciful. All thanks and precise are to
Allah and peace and blessing be upon His Messenger.
There are lots of respected personalities I would like to thank for a huge variety of
reasons. Foremost, I would like to thank my worthy supervisor Prof. Dr. Muhammad Arif
Khan, Department of Clinical Medicine and Surgery, University of Veterinary and Animal
Sciences (UVAS), Lahore, because this work would not have been possible without his support
and encouragement. He deeply monitored my research work and has supported me at every step
with friendly atmosphere. My supervisor is special because he is an example of hard work and
dedication can achieve.
I have the honor to express my deep sense of gratitude and indebtedness to ever-
affectionate Prof. Dr. Muhammad Azam Kakar, Dean, Faculty of Veterinary and Animals
Sciences, Lasbela University of Agriculture, Water and Marine Sciences, Balochistan, for his
technical guidance, encouragement and support during the course of study. He was always
available when I needed his help.
I would like to say a big “thank you” to Prof. Dr. Muhammad Sarwar Khan, Professor
of Medicine and Dean, Faculty of Veterinary Sciences, University of Veterinary and Animal
Sciences, Lahore. I could not have imagined having a better advisor for my Ph.D. and without
his guidance, knowledge, and perceptiveness I would never have finished.
I also express my deep sense of appreciation to Prof. Dr. Kamran Ashraf, Department
of Parasitology, (UVAS), Lahore, for providing numerous ideas, useful discussions, valuable
instructions and suggestion throughout the study period.
Special thanks to Provincial Secretary, and Director General, Livestock and Dairy
Development Department, Balochistan for their kind permission and support to complete my
study.
I would like to thanks to Dr. Nazeer Ahmed, Assistant Prof. BUITEMS, Quetta & Mr.
Asif for their full cooperation & utilization of laboratory during the period of my research work.
(ii)

81
I wish to express my heartiest thanks to my close friends, Zia khan kakar, Abdul Hadi,
Sadam, Asif, Idrees, Adnan, Azam, Choudhri Akram (Ajam), Umair pathoki and Ustad Boota
for their kindness and affection, and for never letting me feel that I am away from my home.
Special gratitude to all my colleagues, Dr. Abdul Razzaq, Dr. Masood-ul-Haq Kakar, Dr.
Saadullah Jan, Dr. Ziauddin, Dr. Ejaz Ahmed (Assistant Prof. Department of CMS, UVAS,
Lahore), Dr. Asad (UDL), Dr. Mir Ahmed, Dr Ihsanullah kakar, Dr. Ramzan, Dr. Hamdullah
Khan, Dr. Saeed and Dr. Imtaiz Rawlakot for their good company during the course of my study,
and also thankful to all the students of UVAS, particularly, Tariq khan, Salman Arshad,
Muhammad Faiz Rasool and Noman Shah, and also Mr. Abdul Khaliq (DI Lab, Quetta,
Balochistan) and Mr. Shahid, Laboratory Assistant, Department of Clinical Medicine and
Surgery, UVAS, Lahore, who voluntarily worked with me during the collection and processing
of the samples.
I cannot end without thanking my respected teachers, Dr. Aneela Zameer Durani, Dr.
Jaweria Ali khan and Dr. Muhammad Awais, Department of Clinical Medicine and Surgery,
UVAS, Lahore, for their constructive and valuable suggestions during the whole period of my
study.
Finally, my special appreciation goes to my elder brothers, Muhammad Farooq,
Muhammad Rauf and Dr. Naseebullah and all family members, particularly my Mother who
always kept me away from family responsibilities and encouraged me to concentrate only on
study.
MUHAMMAD ESSA KAKAR
82
(iii)
TABLE OF CONTENTS
DEDICAT ION (i)
ACKNOWLEDGEMENTS (ii)
LIST OF TABLES (v)
LIST OF FIGURES (xii)
LIST OF ANNEXURE (xviii)
S. N0. CHAPTERS PAGE NO.
1. INTRODUCTION……………………………………………………….1
2. REVIEW OF LITERATURE……………………………….…............10
3. MATERIALS AND METHODS………………………………………56
4. RESULTS……………………………………………………….............77
5. DISCUSSION………………………………………………………….162
6. SUMMARY……………………………………………………………176
7. LITERATURE CITED……………………………………………….178
83
(iv)
LIST OF TABLES
TABLE NO. TITLE PAGE NO.
Table 2.1.1.1. Prevalence % of hemoprotozoans in different groups of cattle and
buffaloes at ASI and BLPRI……………….…………………………….11
Table 2.1.1.2. Prevalence % of hemoprotozoans in different breeds of cattle at
BLPRI……………………………………………………………………11
Table 2.1.1.3. Prevalence % of hemoprotozoans species in different breeds of cattle and
buffaloes at ASI and BLPRI……………………………………………..11
Table 2.1.1.4. District wise prevalence of b. bovis in cattle and buffaloes……………..18
Table 2.1.4. Prevalence of hemoprotozoan in Jersey Holstein Friesian cattle………...23
Table 3.5.1.1. Breed and age wise distribution of Bhag Nari, Holstein Friesian and
Crossbred Cattle in each District……………………...............................64
Table 3.5.1.2. Sex wise distribution of Bhag Nari, Holstein Friesian and Crossbred Cattle
in each District……………………………..............................................65
Table 3.5.1.3. Season wise distribution of BhagNari, Holstein Friesian and Crossbred
Cattle in each District…............................................................................65
Table 3.5.2. Distribution of experimental animal groups………………………..……66
Table 3.9.2.1. Sets of primers used to amplify Babesia bigemina and Babesia bovis
SSU rRNA gene sequences…………………………...………………….71
(v)

84
Table 4.1.1. Overall Prevalence of babesiosis in District Quetta…………………..…78
Table 4.1.1.1. Breed wise prevalence of babesiosis in District Quetta…………….……79
Table 4.1.1.2. Overall Age wise prevalence of babesiosis in BhagNari, Holstein Friesian
and Crossbred in District Quetta………………………………………....81
Table 4.1.1.3. Age wise prevalence of babesiosis in BhagNari in District Quetta…......82
Table 4.1.1.4 Age wise prevalence of babesiosis in Holstein Friesian in District
Quetta…………………………………………………………………….84
Table 4.1.1.5. Age wise prevalence of babesiosis in Crossbred in District Quetta……..86
Table 4.1.1.6. Overall sex wise Prevalence of babesiosis in BhagNari, Holstein Friesian
and Crossbred in District Quetta…………………………………………87
Table 4.1.1.7. Sex wise prevalence of babesiosis in BhagNari Cattle in District
Quetta…………………………………………………………………….88
Table 4.1.1.8. Sex wise prevalence of babesiosis in Holstein Friesian in District
Quetta…………………………………………………………………….89
Table 4.1.1.9. Sex wise prevalence of babesiosis in Crossbred cattle in District
Quetta…………………………………………………………………….90
Table 4.1.1.10. Overall Season wise prevalence of babesiosis in BhagNari, Holstein
Friesian and Crossbred in District Quetta………………………………..92
(vi)

85
Table 4.1.1.11 Season wise prevalence of babesiosis in BhagNari Cattle in District
Quetta…………………………………………………………………….93
Table 4.1.1.12. Season wise prevalence of babesiosis in Holstein Friesian in District
Quetta…………………………………………………………………….95
Table 4.1.1.13. Season wise prevalence of babesiosis in Crossbred in District Quetta…..96
Table 4.1.2. Overall prevalence of babesiosis in District Sibi………………………...97
Table 4.1.2.1. Breed wise prevalence of babesiosis in District Sibi………………….....98
Table 4.1.2.2. Overall age wise prevalence of Babesiosis in District Sibi…………….100
Table 4.1.2.3. Age wise prevalence of babesiosis in BhagNari in District Sibi…….…101
Table 4.1.2.4. Age wise prevalence of babesiosis in Holstein Friesian in District
Sibi……………………………………………………………………...103
Table 4.1.2.5. Age wise prevalence of babesiosis in Crossbred in District Sibi…….…104
Table 4.1.2.6. Overall sex wise prevalence of babesiosis in BhagNari, Holstein Friesian
and Crossbred in District Sibi…………………………………………..105
Table 4.1.2.7. Sex wise prevalence of babesiosis in BhagNari Cattle in District
Sibi……………………………………………………………………...106
Table 4.1.2.8. Sex wise prevalence of babesiosis in Holstein Friesian in District
Sibi……………………………………………………………………...107
(vii)

86
Table 4.1.2.9. Sex wise prevalence of babesiosis in Crossbred cattle in District
Sibi……………………………………………………………………...108
Table 4.1.2.10. Overall season wise prevalence of babesiosis in District Sibi…………109
Table 4.1.2.11. Season wise prevalence of babesiosis in BhagNari cattle in District
Sibi……………………………………………………………………...110
Table 4.1.2.12. Season wise prevalence of babesiosis in Holstein Friesian in District
Sibi……………………………………………………………………...111
Table 4.1.2.13. Season wise prevalence of babesiosis in Crossbred in District in Sibi…112
Table 4.1.2.14 Cumulative prevalence of Babesiosis in both Districts Quetta and
Sibi……………………………………………………………………...114
Table 4.1.3.1 Overall prevalence of mixed hemoprotozoan infection in both Districts
Quetta and Sibi………………………………………………………….117
Table 4.1.3.2.1. Prevalence of mixed hemoprotozoan infection in District Quetta……...118
Table 4.1.3.2.2. Prevalence of mixed hemoprotozoan infection in District Sibi……...…119
Table 4.1.4.1. Comparative efficiency of conventional method versus PCR in different
seasons in Districts Quetta and Sibi…………………………………….121
Table 4.1.4.2. Comparative efficiency of conventional method versus PCR in different
age group of cattle in Districts Quetta and Sibi………………………...122
Table 4.1.4.3. Comparative efficiency of conventional method versus PCR in different
breeds of cattle in Districts Quetta and Sibi…………………………….123
Table 4.1.5.1. Age wise prevalence of tick infestation in District Quetta……………..124
Table 4.1.5.2. Breed wise prevalence of tick infestation in District Quetta…………...126
(viii)

87
Table 4.1.5.3. Sex wise prevalence of tick infestation in District Quetta……………...127
Table 4.1.5.4. Season wise prevalence of tick infestation in District Quetta…………..128
Table 4.1.5.5. Prevalence of most dominant tick species with predilection sites identified
during field study in District Quetta…………………………………....130
Table 4.1.5.6. Age wise prevalence of tick infestation in District Sibi……………..…132
Table 4.1.5.7. Breed wise prevalence of tick infestation in District Sibi………………133
Table 4.1.5.8. Sex wise prevalence of tick infestation in District Sibi………………...134
Table 4.1.5.9. Season wise prevalence of tick infestation in District Sibi……………..135
Table 4.1.5.10: Prevalence of most dominant tick species with predilection sites identified
during field study in District Sibi…………………………………..…...136
Table 4.2.2. Prevalence of babesia infection in experimental BhagNari cattle by
PCR…………………………………………………………………......140
Table.4.2.3. Prevalence of babesia infection in experimental BhagNari cattle by blood
smears…………………………………………………………………..141
Table 4.2.4. Prevalence of babesia infection in experimental Holstein Friesian cattle by
PCR……………………………………………………………………..143
Table 4.2.5. Prevalence of babesia infection in experimental Holstein Friesian cattle by
Blood Smears…………………………………………………………...145
(ix)

88
Table 4.2.6. Prevalence of babesia infection in experimental Crossbred cattle by
PCR………………………………………………………..……………147
Table 4.2.7. Prevalence of babesiosis in experimental Crossbred cattle by Blood
Smears………………………………………………………………….149
Table 4.2.8. Comparison between the capability of PCR and Blood smears………..151
Table 4.4. Effect of babesiosis on mean values of different blood parameters and
differential leukocyte count in different groups of cattle……………….157
Table 4.5. The medication protocol for therapeutic study…………………………159
Table 4.5.1. Result of efficacy of Imidocarb dipropionate and Neem against babesiosis
in different groups of cattle……………………………………………..160
Table 4.5.2. Results of No. of cattle recovered/ no recovered from babesiosis……...161
Table 4.4.1. ANOVA table showing P-values of TLC among different groups of
cattle………………………………………………….…………………195
Table 4.4.2. ANOVA table showing P-values of TEC among different groups of
cattle…………………………………………………………………….195
Table 4.4.3. ANOVA table showing P-values of PCV among different groups of
cattle…………………………………………………………………….196
(x)

89
Table 4.4.4. ANOVA table showing P-values of Hemoglobin among different groups
of cattle………………………………………………………………….196
Table 4.4.5.1. ANOVA table showing P-values of Neutrophils among different groups of
cattle..................................................................................................…...197
Table 4.4.5.2. ANOVA table showing P-values of Lymphocyte among different groups
of cattle……………………………………………………………….....197
Table 4.4.5.3. ANOVA table showing P-values of Monocytes among different groups of
cattle…………………………………………………………………….197
Table 4.4.5.4. ANOVA table showing P-values of Eosinophil among different groups of
cattle…………………………………………………………………….198
Table 4.4.5.5. ANOVA table showing P-values of Basophils among different groups of
cattle…………………………………………………………………….198
(xi)

90
LIST OF FIGURES
FIGURES NO. TITLE PAGE NO.
Fig. 3.1.1. Map of Pakistan……………………………………………………..…...57
Fig. 3.1.2. Map of Balochistan Province………………………………………….....58
Fig. 3.2. Map of District Quetta……………………………………………...…....59
Fig. 3.3 Map of District Sibi……….……………………………………..............61
Fig. 3.4 Sample collection flow chart…………………….……………………....63
Fig. 3.11.2. Neem Leaves…………………………………………………………….76
Fig. 4.1.1. Overall Prevalence of babesiosis in District Quetta………………….….78
Fig. 4.1.1.1. Breed wise prevalence of babesiosis in District Quetta…………………79
Fig. 4.1.1.2. Overall Age wise prevalence of babesiosis in BhagNari, Holstein Friesian
and Crossbred in District Quetta…………………………………………80
Fig. 4.1.1.3. Age wise prevalence of babesiosis in BhagNari in District Quetta……...82
Fig. 4.1.1.4. Age wise prevalence of babesiosis in Holstein Friesian in District
Quetta…………………………………………………………………….83
Fig. 4.1.1.5. Age wise prevalence of babesiosis in Crossbred in District Quetta……..85
Fig. 4.1.1.6. Overall sex wise Prevalence of babesiosis in BhagNari, Holstein Friesian
and Crossbred in District Quetta…………………………………………87
(xii)

91
Fig. 4.1.1.7. Sex wise prevalence of babesiosis in BhagNari Cattle in District
Quetta…………………………………………………………………….88
Fig. 4.1.1.8. Sex wise prevalence of babesiosis in Holstein Friesian in District
Quetta…………………………………………………………………….89
Fig. 4.1.1.9 Sex wise prevalence of babesiosis in Crossbred cattle in District
Quetta…………………………………………………………………….90
Fig. 4.1.1.10. Overall Season wise prevalence of babesiosis in BhagNari, Holstein
Friesian and Crossbred in District Quetta………………………………..91
Fig. 4.1.1.11. Season wise prevalence of babesiosis in BhagNari Cattle in District
Quetta…………………………………………………………………….93
Fig. 4.1.1.12. Season wise prevalence of babesiosis in Holstein Friesian in District
Quetta…………………………………………………………………….94
Fig. 4.1.1.13. Season wise prevalence of babesiosis in Crossbred in District
Quetta………………………………………………………………….....96
Fig. 4.1.2. Overall prevalence of babesiosis in District Sibi………………………...97
Fig. 4.1.2.1. Breed wise prevalence of babesiosis in District Sibi….............................98
Fig. 4.1.2.2. Overall age wise prevalence of Babesiosis in District Sibi………….…..99
Fig. 4.1.2.3. Age wise prevalence of babesiosis in Bhag Nari in District Sibi………101
(xiii)
92
Fig. 4.1.2.4. Age wise prevalence of babesiosis in Holstein Friesian in District
Sibi……………………………………………………………………...102
Fig. 4.1.2.5. Age wise prevalence of babesiosis in Crossbred in District Sibi….……104
Fig. 4.1.2.6. Overall sex wise prevalence of babesiosis in BhagNari, Holstein Friesian
and Crossbred in District Sibi…………………………………………..105
Fig. 4.1.2.7. Sex wise prevalence of babesiosis in BhagNari Cattle in District
Sibi……………………………………………………………...……....106
Fig. 4.1.2.8. Sex wise prevalence of babesiosis in Holstein Friesian in District
Sibi……………………………………………………………………...107
Fig. 4.1.2.9. Sex wise prevalence of babesiosis in Crossbred cattle in District Sibi…108
Fig. 4.1.2.10. Overall season wise prevalence of babesiosis in District Sibi………….109
Fig. 4.1.2.11. Season wise prevalence of babesiosis in BhagNari cattle in District
Sibi…………………………………………………………………...…110
Fig. 4.1.2.12. Season wise prevalence of babesiosis in Holstein Friesian in District
Sibi……………………………………………………………………...111
Fig. 4.1.2.13. Season wise prevalence of babesiosis in Crossbred in District in
Sibi…………………………………………………………………...…112
Fig. 4.1.2.14 Cumulative prevalence of Babesiosis in both Districts Quetta and
Sibi……………………………………………………………………...113
Fig. 4.1.3. Microscopic slide showing mixed Hemoprotozoan infection…………..116
Fig. 4.1.3.1 Overall prevalence of mixed hemoprotozoan infection in both Districts
Quetta and Sibi……………………………………………………….…116
Fig. 4.1.3.2.1. Prevalence of mixed hemoprotozoan infection in District Quetta……...118
(xiv)

93
Fig. 4.1.3.2.2. Prevalence of mixed hemoprotozoan infection in District Sibi………...120
Fig. 4.1.4.1. Comparative efficiency of conventional method versus PCR in different
seasons in Districts Quetta and Sibi…………………………………….121
Fig. 4.1.4.2. Comparative efficiency of conventional method versus PCR in different
age group of cattle in Districts Quetta and Sibi………………………...122
Fig. 4.1.4.3. Comparative efficiency of conventional method versus PCR in different
breedsof cattle in Districts Quetta and Sibi…………………………….123
Fig. 4.1.5.1. Age wise prevalence of tick infestation in District Quetta……………..125
Fig. 4.1.5.2. Breed wise prevalence of tick infestation in District Quetta…………...126
Fig. 4.1.5.3. Sex wise prevalence of tick infestation in District Quetta……………...127
Fig. 4.1.5.4. Season wise prevalence of tick infestation in District Quetta…………..128
Fig. 4.1.5.5. Prevalence of most dominant tick species with predilection sites identified
during field study in District Quetta……………………………………131
Fig. 4.1.5.5.1. Predilection site (External genitalia) of ticks...………...……………….131
Fig. 4.1.5.6. Age wise prevalence of tick infestation in District Sibi………………..133
Fig. 4.1.5.7. Breed wise prevalence of tick infestation in District Sibi………………134
Fig. 4.1.5.8. Sex wise prevalence of tick infestation in District Sibi………………...135
Fig. 4.1.5.9. Season wise prevalence of tick infestation in District Sibi……………..136
(xiv)

94
Fig. 4.1.5.10. Prevalence of most dominant tick species identified during field study in
District Sibi………………………………………….………………….137
Fig. 4.1.5.11. Ticks specimen stained with Acid Fuchsine Method…………………...137
Fig. 4.2.2. Prevalence of babesia infection in experimental BhagNari cattle by
PCR…………………………………………………………………......140
Fig. 4.2.3. Prevalence of babesia infection in experimental BhagNari cattle by blood
smears…………………………………………………………………..142
Fig. 4.2.4. Prevalence of babesia infection in experimental Holstein Friesian cattle by
PCR……………………………………………………………………..144
Fig. 4.2.5. Prevalence of babesia infection in experimental Holstein Friesian cattle by
Blood Smears…………………………………………………………...146
Fig. 4.2.6. Prevalence of babesia infection in experimental Crossbred cattle by
PCR………………………………………………………..……………148
Fig. 4.2.7. Prevalence of babesiosis in experimental Crossbred cattle by Blood
Smears…………………………………………………………………..150
Fig. 4.2.8. Comparison between the capability of PCR and Blood
smears…………………………………………………………………..151
Fig. 4.3.3.1. DNA extracted from blood samples…………………………………….153
(xvi)
95
Fig. 4.3.3.2. Detection of Babesia bovis in cattle blood by PCR…………………….154
Fig 4.3.3.2.1. Detection of Babesia bigemina in cattle blood by PCR…………..……155
Fig. 4.5.1. Graph showing the efficacy of Imidocarb dipropionate and Neem against
babesiosis in different groups of cattle…………………………………160
Fig 4.5.2. Graph showing No. of cattle recovered/ no recovered from babesiosis..161
(xvii)

96
LIST OF ANNEXURES
ANNEXURE NO. TITLE PAGE NO.
Annexure 3.4. Questionnaire for field study…………………………………………...189
Annexure 3.8.3.1. Chemicals and equipment used for Acid fuchsine method for permanent
mounting of ticks……………………………………………………….192
Annexure 3.8.3.2. Acid Fuchsine Method for permanent mounting of ticks……………....192
Annexure 3.8.3.3. The main characteristics of hard and soft ticks…………………………193
Annexure 3.9.1.1. Procedure for Giemsa Staining…………………………………….…...193
Annexure 3.9.1.2. Morphological characteristics of different babesia species………….…194
Annexure 4.4. Results of ANOVA showing P-values of different blood parameters
among different groups of cattle……………………………………..…192
(xviii)

97
Chapter- 1
INTRODUCTION
Pakistan is an agriculture based country blessed with rich livestock population for
keeping and marketing. According to Livestock Census (2006) 34.3 million cattle, 30.8 buffalo,
27.8 sheep, 59.9 goats, 1.0 camels, 0.4 horses, 4.6 asses and mules 0.2 were estimated in the
country. The contribution of livestock in the national economy was about 53.2 % of the
agriculture value added and 11.4 % to national GDP during 2009-10. Gross value addition of
livestock at current factor cost has increased from Rs. 1304.6 billion (2008-
09) to Rs.1537.5 billion (2009-10). The cattle industry is economically important in Pakistan.
Pakistan is the home tract of best cattle breeds with known resistant to extremely hot and tough
weather. Presently there are 15 recognized cattle breeds in the country i.e. Cholistani, Dajal,
Dhanni or Pothwari, Hariana, Hissar, Kankraj, Lohani, Rojhan, Sahiwal and Thari (Punjab),
Achai, Gabrali and Lohani (Khyber Pushtoonkhwa), Red Sindhi or Malir or Sindhi, Kankraj
(Sindh) Bhagnari or Nari, Red Sindhi (Balochistan) and Desi or Non-descript (All over Pakistan)
and all are belong to zebu (humped type) cattle (Bos indicus) which are believed to have been
domesticated 4000 BC (Sajjad et al. 2008). During the last few decades demand for exotic breeds
and crossbreeding program for maximizing the production have increased the interest of farmers.
That’s why today large numbers of farmers are engaged in this profitable business while the
Government is also taking keen interest in this potential sector having good business relations
with international organizations. In this connection Balochistan Nari Master, the first Pakistani
beef breed was evolved locally by crossing Australian Droughtrnaster bull with a well-known
local cattle breed (Bhagnari) in late nineties at Beef Production Research Center, Sibi, which is

98
now ready for local as well for global marketing (Shafiq and Kakar 2006). Apart from this exotic
breeds like Holsteins Friesian, Jersey and other cross bred cattle are commonly found in different
parts of the country but different threats and fatal diseases cannot be neglected, disturbing the
health of animals. Among these, “babesiosis” is one of the most important and fatal parasitic
diseases caused by intraerythrocytic parasites of the genus Babesia having considerable
worldwide economic, medical, and veterinary impact. The disease is also called piroplasmosis,
Texas fever, red water or tick fever widely distributed in Africa, Central and South America,
Australia and Asia (OIE Manual, 2010) but is most important in tropical and sub-tropical
countries. Victor Babes was the first scientist who described babesiosis in Romanian cattle in
1888 where as Skrabalo identified a human infection caused by Babesia in 1957 in Yugoslavia
(Vinod, 2008). The parasites are commonly called as piroplasms because of having pear-shape,
found within infected red blood cells. The piroplasms are transmitted by a vector Ixodidea tick
which is capable of infecting a wide variety of vertebrate hosts (Homer et al. 2000) characterized
by fever, anaemia, jaundice and haemoglobinuria. Cases of red water fever are usually indicated
by clinical symptoms, epidemiological season, herd/farm circumstances, and history of animals
(Zintl et al. 2003) which results from infection of protozoa in the genus Babesia, family
Babesidae and order Piroplasmida and can be found wherever the tick vectors exist, but is most
common in tropical and subtropical areas. More than 100 species of babesia have been
documented which infect wide range of animals but two species, Babesia bovis and B. bigemina
are most often found in cattle, however some additional species can also infect cattle, including
B. divergens, B. major, B. ovata, B. occultans and B. jakimovi. Organisms that are very closely
related to B. divergens, but do not seem to affect cattle, have recently been discovered in wildlife
and humans (Anonymous, 2008). It is generally believed that Babesia species attacks red blood

99
cells directly (Zintl et al. 2003) and do not invade any other blood cells except erythrocytes. The
babesia parasite has a life cycle in the ticks which usually go through at least three stages of
reproduction i.e. gamogony; formation and fusion of gametes inside the tick gut, sporogony;
asexual reproduction in salivary glands and merogony; asexual reproduction in the vertebrate
host (Homer et al. 2000). The lifecycle of b. bovis and b. bigemina are analytically well
presented by Bock et al. (2004). During tick bite, babesia sporoziotes (merozoite) are inoculated
into the vertebrate host and enters directly in erythrocyte, converts into trophozoite from which
two merozoites develops by a process of merogony (binary fission). Oval type merozoite
(gamont) progresses further until they are taken up by the tick. In tick midgut two ray bodies
develops from the gamonts (gametocytes) which further multiply and form a spherical cell
(zygote). The zygote infects the tick gut and multiplies as kinetes (vermicules) which invade
many of the tick’s organs including ovaries. Babesia species are readily passed to the next
generation of ticks in the egg and can be transmitted transovarially though several generations.
Similarly these protozoan species can also be transmitted from one animal to another by blood
inoculation while the role of infected biting flies and fomites cannot be neglected which may act
as mechanical vectors. Usually b. bigemina and b. bovis are found within infected red blood cells
in pair (Chaudhry et al. 2010) while B. bovis is smaller in size with an obtuse angle to each other
but b. bigemina is bigger in size and both the angles are acute to each other (Urquhart et al.,
1996). In affected animal, the symptoms of babesia infection usually appear 2-3 weeks after tick
infestation but direct inoculation of infected blood may decrease the incubation period e.g. b.
bigemina 4-5 days while 10-12 for b. bovis. The clinical signs of the disease may vary with age
of animal and species of the parasites. The disease is more likely to affect older animals than
younger animals. Strains vary considerably in pathogenicity; however, B. bovis is usually more

100
virulent than B. bigemina or B. divergens. Generally the clinical signs include high fever,
depression, anorexia, weakness, muscular tremor, rapid heart and respiration rate, reluctant to
move, isolation from the herd, anemia accompanied by hemoglobinemia and hemoglobinuria,
pale mucous membrane, jaundice, diarrhea, constipation and nervous signs such as
incoordination and grinding of teeth (Anonymous, 2008). The presence of Babesia in live
animals can be identified with the help of blood smears while in dead animals it can be identified
by microscopic examination of smears prepared from the fresh peripheral blood, heart muscle,
spleen, kidney, liver and brain but Polymerase Chain Reaction (PCR) is more sensitive and
modern diagnostic technique for confirmation of Babesia parasites. Other laboratory serological
techniques like, Enzyme-linked immunosorbent Assays (ELISA), Indirect Fluorescent Antibody
(IFA), Complement Fixation (CF) tests have also been used for the detection of Babesia species
(OIE Manual, 2010). The importance of babesiosis in livestock is due to severe economic losses
(Urquhart et al., 1996) falls into; direct losses and indirect losses. Direct losses includes mortality
and low production while indirect losses; tick control, quarantine measures and vaccination
(Zwart 1985). Globally the economic importance and losses caused by ticks and tick-borne
diseases have been recorded by number of researchers. Most of the 1.2 billion cattle are at the
risk (McCosker, 1981) while losses has been estimated in several billion (109) US $ annually.
Similarly McLeod and Kristjanson (1999) revealed some statistics about the cost and losses
caused by babesia and anaplasma infection i.e. US$16.9m/annum in Australian cattle, Kenya
(5.1), Zimbabwe (5.4), Tanzania (6.8), South Africa (21.6), China (19.4), India (57.2), Indonesia
(3.1) and in Philippines 0.6 million US dollars annually. In Pakistan a big part of livestock
industry comprises on cattle and buffaloes, but cattle are considered to be more susceptible to
tick and tick-borne diseases than buffaloes. Most of the researchers concentrated their studies on

101
tick prevalence that’s why the precise data regarding economic losses caused by tick and tick
borne diseases are still scanty. However studies have indicated the significant economic
importance of tick and tick-borne diseases in the country. In an economic based study conducted
by Sajid et al. (2007) it was calculated that Rupees 283.3 (US $ 4.9) as a treatment cost due to
tick infestation in dairy buffaloes of Punjab, Pakistan. They also reported high milk production
(1.15 L) per animal per day and extra butter fat (1.31%) in tick free buffaloes than tick infested
animals. They observed weak body conditions, tick bite wounds, sever irritation, and alopecia in
tick infested animals.
The zoonotic importance of Babesia parasites cannot be ignored. During the last few decades the
prevalence of human babesiois become increased in endemic areas of the United States where as
episodic cases are reported in Asia, South America, Europe and Africa. Sever infection may
cause death especially of patients over the age of 50 years and immunocompromised individuals,
including malignancy, HIV, lacking a spleen, or receiving immunosuppressive drugs. There are
some Babesia species such as B. duncani (previously designated WA1 Babesia) and B.
venatorum (Originally referred to as EU1) are capable to transmit the disease in humans
(Vannier and Krause, 2009) but Babesia microti, a rodent-borne piroplasm being the most
prevalent with many clinical features similar to those of malaria which may cause death. (Homer
et al. 2000). Similarly B. divergens (the causative agent of bovine babesiosis) is also of zoonotic
importance in Europe confusing with malaria with high fever 40 to 41°C, headaches, jaundice,
shivering, sweats, Fall in total hemoglobin levels 70 to 80 g/liter, liver enlarged and painful
while in the most severe cases, patients develop shock-like symptoms, with renal failure induced
by intravascular hemolysis and pulmonary edema (Zintl et al. 2003). The diagnostic confirmation
can be obtained from microscopic examination using Giemsa stains of thin and thick blood

102
smears (Vannier and Krause, 2009) but PCR and serological tests are considered to be the most
valuable diagnostic techniques (Homer et al. 2000) In bovine babesiosis Imidocarb dipropionate
can be used prophylactically against babesia infection but no specific drug and/or vaccines are
available for humans babesiosis (Gray et al. 2010) however combination of atovaquone and
azithromycin administered intravenously for 7 to 10 are used in the treatment of babesiosis.
(Vannier and Krause, 2009). Ticks are the vectors responsible for the spread of babesia species
in vertebrates (Bock et al. 2008). Ticks are obligate ectoparasites categorized in the order Acari.
There are about 840 tick species divided into two major families, i.e. the Ixodidae (hard ticks)
and the Argasidae (soft ticks). Among these, hard ticks are believed to be the most important
species which covers about 80% of all tick species with significant economic importance in
livestock (Jongejan F and Uilenberg,1994) some of them are also harmful to human health
(Walker, 2007) while soft ticks can cause serious problems in avian species (Jongejan and
Uilenberg, 1994). Ticks can also create serious problems in cattle particularly exotic and
crossbred cattle are more susceptible to tick infestation (Atif et al. 2012). Ticks not only effects
on animals body but also responsible for the spread of different pathogens i.e. protozoans,
viruses and rickettsiae spirochetes and bacilli (Kakarsulemankhel 2010). In addition to
production losses ticks are also responsible for the spread of different protozoan diseases like
babesiosis, anaplasmosis, and theileriosis which increased its global importance because of
heavy losses in livestock particularly of cattle industry. The Global cost of tick and tick-borne
diseases have been estimated US$ 7 milliard (=7r109) by McCosker (1979), in Zimbabwe US$
5.6 million (Mukhebi et al. 1999), Brazil US$ 800 million/year (Martinez et al. 2006) and in
India US$ 498.7 million (Minjauw and McLeod, 2003) but unfortunately in Pakistan information
about economic losses due to ticks is scanty and majority of the Pakistani researchers have

103
concentrated on the prevalence of ticks (Kakarsulemankhel 2010) however several control
strategies are available in order to reduce the economic losses caused by tick infestation. The use
of chemical acaricides including arsenic such as As2O3, chlorinated hydrocarbons,
organophosphates, carbamates and synthetic pyrethroids by means of spraying, dipping, pour on
and ear tagging are considered to be the main weapon for the control of ticks (Rajput et al. 2006).
Similarly all animals moving out of the quarantine zone must be free from tick infestation, well
scratched, and dipped in recommended acaricide i.e. coumaphos or organophosphate (Angela
(2005). Tick identification is one of the sensible supportive tactics for vector control. The best
known technique for tick identification is; the dichotomous key, multiple entry keys and pictorial
guides as prescribed by (Souls by, 1982) and (Walker, 2007). It is true that only one infected tick
could be sufficient to transmit the disease. Generally British and European breeds are more
susceptible with high mortality as compare to Bos indicus breeds such as Brahman, Sahiwal and
to a lesser extent crossbred cattle show resistance to the disease and nearly 1 in 5 outbreaks of
tick fever involves these breeds (Carter, 2011). In Pakistan, babesiosis is considering being the
most important disease of cattle and recorded in different areas the country. In this connection
prevalence of different species of Babesia have been documented, in livestock i.e B. bigemina
(6.6 %) and (1.75%) in Malakand Agency by Ahmed and Hashmi (2007) and Afridi et al. (2005)
respectively. Also Zahid et al. (2005) recorded babesia spp. (5%) in cattle from district Kasur
while (4.76%) from Sargodha, Khushab, and Rawlanpindi distrcits of Punjab Province Atif et al.
(2012). Khan et al. (2004) reported prevalence of babesia spp. (5.55%) in cattle and buffaloes in
National Agriculture Research Centre, Islamabad while (1.85%) from Barani Livestock
Production Research Institute Kherimurat, district Attok, Pakistan. Similarly Bhutto et al. (2012)
reported b. bovis (21.42) in buffaloes of Landhi dairy colony Karachi.

104
The empirical use of plants as medicine can be traced back over five millennia to ancient
documents of early civilizations such as in China, Egypt, India, and the Near East, but is
certainly as old as mankind. These medicines initially took the form of crude drugs such as
tinctures, teas, poultices, powders, and other herbal formulations. The World Health
Organization (WHO) estimates that even today 80% of the world’s populations exclusively rely
on traditional medicine, especially in developing countries (Gesine, 2008).
The traditional knowledge about animal health care (ethno veterinary medicine) can be
considered as a treasure of information and easy approach to treat the infectious and non-
infectious diseases which unfortunately losing its value due to rapid modernization and
urbanization. The knowledge need to be maintained forever because of its valuable properties.
Neem (Azadirichta Indica) which belongs to family Meliaceae, claims to be the most affective
and cheapest herbal drug used as dewarmer, antiprotozoal, acaricidal, insecticidal, antifungal,
antibacterial, antiviral and antiseptic. Almost all parts of the neem with different preparations are
used but are best administered in the form of decoction (Chousalkar, 2000). Many researchers
globally worked successfully on the medicinal properties of neem against protozoan diseases
such as malaria. Neem is widely used for tropical application against ectoparasites but
unfortunately it has not been studied in decoction form against bovine babesiosis particularly in
Balochistan region. Thus local people related to natural medicine may recommend neem based
on their traditional experience. As a result very limited information is available about the
effectiveness of neem against bovine babesiosis.
Balochistan is the largest province of Pakistan, spreads over an area of 347,190 Sq, Kms.
forming 43.6 per cent of the total area of Pakistan. Livestock is the main component constitutes
more than 40% to the economy of the province and 52% share in province GDP. Small

105
ruminants are the major source of production i.e. sheep constitute 46% and goats 23% of the total
national population of sheep and goats, and about 80% of human population (mostly in rural
area) are directly/indirectly involved in livestock keeping, contributes about Rs. 20 billion i.e.
meat 40 %, milk 35 %, eggs 13 %, skin, hides and wool 10 % and other production 2%
(Anonymous, 2008) but 2.3 million cattle and 300,000 buffaloes (Economic Survey 2008-09)
cannot be ignored. Mostly mixed farming system; sedentary, nomadic and transhumant systems
are traditionally practiced in Balochistan. Different breeds of cattle including Holsteins Friesian,
Bhag Nari are commonly found in different parts of the province, but different threats and fatal
diseases cannot be neglected, disturbing the health of the animals, among these babesiosis is one
of the most important tick-transmitted disease having considerable economic, medical, and
veterinary impact.
Keeping in view the importance of babesiosis under the local conditions of Balochistan,
the present study was designed to achieve the following goals;
1. to study the effects of babesiosis on the performance of Holsteins Friesian and Bhag Nari
and Crossbred cattle.
2. to study the epidemiological status of babesiosis in the area
3. to study the effects of babesiosis on different blood parameters
4. to study the efficacy of local herbal drug and modern antiprotozoal drug against
babesiosis
5. to apply the PCR and clinical based diagnostic tools for the diagnosis of disease.

106
Chapter- 2
REVIEW OF LITERATURE
2.1: EPIDEMIOLOGY OF BABESIOSIS
2.1.1: Prevalence of Babesiosis
Livestock play key role in the national economy especially of under developing countries
and provides the basic needs of life such as food, energy and money etc. but threats cannot be
ignored troubling the industry such as babesiosis which is one of the most important
hemoprotozoan diseases causing heavy losses in cattle. These threats can be reduced and /or
controlled by a comprehensive plan with good management, early diagnosis of the problem,
proper treatment, quarantine measures and systemic epidemiological surveys/studies in the area.
Keeping in view the importance of livestock in Pakistan, Khan et al. (2004) studied the
prevalence of hemoprotozoans in 307 cattle and 155 buffaloes. Among these 65 cattle and 155
buffaloes were kept at Animal Science Institute (ASI), National Agriculture Research Council
(NARC), Islamabad while 242 cattle were maintained at Barani Livestock Production Research
Institute (BLPRI) Kherimurat, Pakistan. They analyzed the data by using chi-square test and
recorded the prevalence of hemoprotozoans in both cattle and buffaloes. The results are
presented in Table 2.1.1.1. They also noted the uppermost breed wise prevalence 36.84% in
Lohani cattle breed at BLPRI. Details are summarized in Table 2.1.1.2. According to their
observations Anaplasma marginale protozoan was found more prevalent in both buffaloes and
cattle. Mixed infection was also recorded in both animal species. Details about the prevalence of
hemoprotozoans in cattle and buffaloes are summarized in Table 2.1.1.3.

107
Table 2.1.1.1: Prevalence % of hemoprotozoans in different groups of cattle and buffaloes
at ASI and BLPRI
Animal
Species
Age wise Prevalence % noted at ASI and
BLPRI
Overall Prevalence % noted at
ASI and BLPRI
Adult animals Young animals
ASI BLPRI ASI BLPRI ASI BLPRI
Cattle 30.76 25.83 23.07 18.85 27.69 22.31
Buffalo 23.07 - 11.11 - 16.12 -
Table 2.1.1.2: Prevalence % of hemoprotozoans in different breeds of cattle at BLPRI
Breeds of cattle Age of cattle Overall Prevalence
Adult cattle Young cattle
Lohani 50.00 27.27 36.84
Red Sindhi 17.07 16.66 16.94
Crossbred 38.10 10.86 19.40
Dhanni 14.81 24.00 19.23
Table 2.1.1.3: Prevalence % of hemoprotozoans species in different breeds of cattle and
buffaloes at ASI and BLPRI
Species Anaplasma
marginale Babesia spp. Theileria spp.
Mixed
infection
Cattle ASI 66.66 5.55 5.55 22.22
BLPRI 75.92 1.85 3.70 18.5
Overall prevalence % 75.71 2.85 1.42 20.00
Buffalo ASI 80.00 - 4.00 16.00

108
Similarly 12 months study on the prevalence of different blood parasites in Friesian & Jersey
was conducted by Zahid et al. (2005). They recorded the overall incidence of Theileria species
(24%) & (15%) in Holstein Friesian and Jersey cattle respectively whereas Babesia (2.5%) was
noted in both the cattle breeds. The highest incidence of Theileria spp. (38%) was observed in
Holstein-Friesian during the months of January, February and March followed by (30%) in
Jersey cattle in April, May and June, while the lowermost rate (16%) in Holstein-Friesian and
(8%) in Jersey cattle was noticed during the months of July, August and September. The
incidence of Theileria spp. in Holstein-Friesian was observed (20%) and (22%) from October to
December and April to June respectively. Similarly during July to September, and October to
December, the incidence of Theileria (8%) was noted in Jersey cattle but no signs of Babesia
species were detected, however in January, February and March, 10% was noticed in both the
breeds of cattle. Historically troubles caused by protozoan can be found in past. In 1868, in
Illinois and Indiana, the babesiosis was broken out as a disaster in local cattle population and
destroyed 15,000 cattle even though these native cattle were relatively immune to this newly
introduced disease but due to continuous and prolong attachment of infected ticks, broken down
the protective immunity and developed the disease. According to Angela (2005) complete tick
eradication program was introduced in 1906 in 14 targeted southern States (Texas, Oklahoma,
Arkansas, Louisiana, Mississippi, Alabama, Georgia, Florida, South Carolina, North Carolina,
Virginia, Tennessee, Kentucky, Missouri, and southern California). Permanent quarantine zone
was maintained with proper tick eradication programs and activities which are now maintained
under the supervision of United State Department of Agriculture, Animal Health and Plant
Inspection Service and Veterinary Services. In Peten region, Guatemala, during 15 June to 29
June, 2003, the prevalence of tick borne diseases and vector identification was studied by Teglas

109
et al. (2005). For this purpose (48) cattle and (74) horses were selected from (7) villages for
different study factors; age, sex, scoring of body condition, condition of mucous membrane and
capillary refill time. They collected blood samples from each animal and processed for
serological and Polymerase chain reaction analysis and observed that the horses attained higher
tick infestation with poor body condition than cattle. On a scale of 1-10, the mean body condition
score for horses were (3.6 ± 0.54 S.E) while (4.8± 0.1 S.E) in cattle but no significant Capillary
Refill Times were noticed between both the animals species i.e. cattle (mean 1.8 s) while and
horses (mean 1.9 s). In cattle, total (291) ticks were identified with the ratio; Boophilus
microplus (56%), Amblyomma cajennense (42%), Anocentor nitens (0.7%) and others (1.3%)
whereas in horses out of total 2080 ticks; A. cajennense (59%), A. nitens (28.5%), B. microplus
(0.5%) and others (12%) were identified. Cattle antibodies were tested for seroprevalence against
A. marginale, B. bovis and B. bigemina and found positive as; (87.5%) (95.8%) and (89.6%)
respectively. Similarly Babesia spp. (92.7%) was also found positive in horses samples. The
results of blood samples processed through PCR revealed the prevalence of babesia species in
horse; b. caballi (48%), b. equi (52%) and in cattle; (66.7%) (46.9%) jointly infected with b.
bigemina (43.7%) and b. bovis (9.4%). In another study, the prevalence of bovine babesiosis
among (415) crossbred calves kept under different climatic conditions was analyzed by Niazi et
al. (2008) at LESQ, Sahiwal, Pakistan. With the help of thin blood smear examination, the
overall prevalence of hemoprotozoan infection was noted as 7.2% whereas month-wise
prevalence were; May (1.6%), June (5.03%) and July (13.8%). Bovine blood protozoans
particularly Babesia and Theileria species causes direct losses of production in India which has
been estimated as annual loss up to US $800 million due to Theileria spp. but it can be
minimized with early detection and efficient treatment. In this connection Ananda et al. (2009)

110
analyzed the prevalence of different blood protozoans in 132 crossbred cattle, clinically
confirmed and presented for therapeutic trial to find out the drug of choice against the diseases.
Hematology, age and seasonal wise prevalence were also studied. They recorded total 57
samples positive for blood protozoans; T. annulata (41) and B. bigemina (16). They observed the
seasonal variation during the course of study and summarized the highest prevalence during the
months of monsoon which is thought to be increased vector tick population in summer. The
screening of positive cases was recorded by clinical signs and also with the help of blood smears.
The clinical signs include; anorexia, pyrexia, enlarged superficial lymph nodes, trembling in
standing, pale conjunctival mucus membrane, haemoglobinuria, nasal discharge, coughing and
grinding of teeth. They treated the theileriosis with Buparvoquone @ 2.5mg/kg b. wt. I/M
combined with Oxytetracyclin @ 20 mg/kg b. wt. as a single dose whereas the babesiosis was
treated with diminazene aceturate @ 1gm/100kg b.wt. I/M. Similarly Imferon-10ml, Belamyl-
12ml and stadren-10ml I/M were used as supportive therapy against both the diseases. After the
one weak therapy successful improvement was noted in diseased animals. In continuation with
epidemiological studies, Durrani et al. (2010) studied the prevalence of babesiosis in two
different cattle breeds i.e. Sahiwal (native breed) and Friesian (exotic breed) for age, sex, season
and areas wise parameters at districts Rawalpindi, Lahore and Multan. The screening of samples
was confirmed by Polymerase Chain Reaction test. Total 41.2% samples were found positive for
hemoparasites i.e. T. annulata (76.9%) whereas Babesia species (23%). Among these B.
bigemina (79%) and B. bovis was (21%). They concluded that the prevalence of b. bigemina was
higher than b. bovis. Similarly in Sahiwal cattle lower prevalence of hemoprotozoan infection
(23%) whereas higher prevalence (40.4%) was recorded in Friesian cattle. The presence of these
parasites in the livestock of Bangladesh are also considered to be a great threat to the economy of

111
the country and many workers highlighted the B. microplus as the most prevalent tick species
causing problem in cattle population. Similar report was presented by (Kabir et al. 2011) in a
study conducted during the period of November, 2008 to May, 2009. They studied (380) cattle of
different topographical condition from Chittagong District, Bangladesh to evaluate the
epidemiological status of tick infestation. They focused on different parameters such as age, sex,
breed, management, seasons, topography and body parts of the experimental animals. The
overall prevalence of tick infestation was found in 138 cattle (36.31%). Of these, Boophilus
microplus (25%), Rhipicephaluss sanguineus (13.68%) and Haemaphysalis bispinosa was
recorded as (12.63%). The individual tick burden (range between 1-7/sq) were; B. microplus (1-
7), H. bispinosa (1-5) and Rh. sanguineus (1-4). Age wise prevalence revealed (46.28%) ticks
among young animal while (27.80%) among adult cattle. Young animals were found more
susceptible (2.23) times than adult animals. Ticks species infested young animals aged ≤ 1.5
year; B. microplus (35.42%), Rh. sanguineus (17.71%) and H. bispinosa (16.57%) and adult
cattle >1.5 years; B. microplus (16.09%), Rh. sanguineus (10.24%) and H. bispinosa (9.26%).
Higher prevalence (59.37%) was noted in female and found (2.61) times more susceptible than
male. In male animals it was noted as (35.83%). Similarly higher prevalence of tick infestation
(43.82%) was recorded in local cattle breed. Of these, B. microplus (31.06%), Rh. sanguineus
(17.02%) and H. bispinosa (15.74%) and found (2.45) times more susceptible than crossbred
animals. In crossbred cattle the prevalence of tick infestation was recorded as (24.13%). Of these
B. microplus (15.17%), Rh. sanguineus (8.27%) and H. bispinosa (7.58%) were found positive
for tick infestation. Comparatively higher prevalence of tick infestation (44.44%) was reported in
hilly area. Among these B. microplus (33.95%), Rh. sanguineus (17.90%) and H. bispinosa
(16.04%). In plain area it was noted (30.27%). Of these, B. microplus (18.34%), Rh. sanguineus

112
(10.55%) and H. bispinosa (10.09%). The reason behind difference between hilly and plain areas
assumed by (MacLeod, 1970) that the higher severity might be because of the production of
species of plants, herbs, shrubs and grasses that provides good shelter to vector’s eggs and their
hatching throughout the year. This statement correlates with the work of Kamal et al. (1996) who
reported higher prevalence of ticks (65.5%) in cattle of hilly area because the animals were not
generally washed regularly for want of water. Thus the lack of trends of regular bath and rubbing
practice and also the scarcity of water is thought to be causes heavy infestation in cattle of hilly
areas. Highest prevalence of tick infestation (41.66%) was noticed during the months of summer
with the ratio; B. microplus (31.11%), Rh. sanguineus (17.22%) and H. bispinosa (15.55%).
Similarly (31.5%) was noticed in winter with ratio; B. microplus (19.05%) Rh. sanguineus
(10.5%) and H. bispinosa (10%). The grazing cattle showed higher prevalence (41.96%) with the
ratio; B. microplus (14.4%), Rh. sanguineus (8.8%) and H. bispinosa (8%). Similarly in cattle on
stall feeding showed (24.8%) tick infestation with the ratio; B. microplus (30.19%), R.
sanguineus (16.07%) and H. bispinosa (14.90%). It was also noticed that the grazing cattle was
(2.19) times more susceptible to tick infestations than cattle on stall feeding. In continuation
Alim et al. (2012) designed a study on hemo-parasitic diseases to find out the status of different
hemoprotozoans in (432) native and (216) crossbred cattle of different areas of Chittagong
division, Bangladesh. They evaluated the role of age, sex, breed, geographical location and
climate parameters in the occurrence and severity of diseases. They observed the overall
prevalence (16.18%) in crossbred and (12.02%) in indigenous cattle. The highest hemoparasitic
infection (12.5%) was recorded in summer whereas the lowest prevalence (theileriosis 0.70%)
was noticed in winter. Similarly the highest prevalence of babesiosis (17.78%) was observed in
adult animals. Tick-borne pathogens categorically effect the national economy throughout the
113
world, also in Pakistan causes heavy losses, thus proper eradication programs and research based
theories needs to be promoted. In this connection 12 months study from September 2009 -
August 2010 was conducted by Atif et al. (2012) to evaluate the prevalence of different Tick-
borne diseases in 1050 cattle. They confirmed (222) samples for tick-borne pathogens i.e.
Anaplasma marginale (21.14%), Theileria spp. (5.14%), Babesia bigemina (4.76%) and mixed
infection (5.43) with the ratio; A. marginale and B. bigemina (1.62%), A. marginale and
Theileria spp. (2.67%) while B. bigemina and Theileria spp. (1.14%) was noticed. District wise
prevalence revealed highest prevalence in Sargodha (24.86%) and lowest in Rawalpindi district
(17.14%) during summer season. More prevalent hemoprotozoan parasites were; Theileria spp.
in Sargodha, A. marginale in Khushab and Rawalpindi districts. Similarly A. marginale was
found more prevalent (9.52%) & B. bigemina (6.19%) in 2-4 years age group of animals whereas
Theileria spp. (8.08%) was noticed among 1-2 years of age. The highest prevalence of A.
marginale & Theileria spp. was noted in female whereas B. bigemina was noticed in male
animals. Crossbred animals were found more susceptible than indigenous cattle and the highest
prevalence was noted among the animals of small holders (23.33%) whereas livestock farms
revealed (10.00%). Another study was conducted by Samreen-Zulfiqar et al. (2012) to find the
prevalence of babesia bovis parasite in 144 large ruminants (105 cattle and 39 buffaloes) in six
districts of Punjab Province, Pakistan. All the blood samples were processed through blood
smears and PCR. The PCR showed higher prevalence of b. bovis in all 6 districts. Out of (144)
samples, (27) samples (18%) were found positive by PCR while the blood smear revealed only 4
samples (3%) positive for babesia parasite. The 27 babesia positive samples comprised (9)
buffalo and (18) cattle samples). District wise prevalence of b. bovis is summarized in Table
2.1.1.4.

114
Table 2.1.1.4: District wise prevalence of b. bovis in cattle and buffaloes.
Parameters No of
samples
positive for
B. bovis
Prevalence
% for
positive
cases
No of samples
negative for B.
bovis
% for
negative
cases
Total
Type of
Animal
District
Vehari 0 0 20 100 20
Multan 17 30 39 70 56
Muzaffar Garh 3 50 3 50 6
Bahawalnagar 1 10 9 90 10
Bhakar 3 14 19 86 22
Layyah 3 10 27 90 30
Cattle 18 17 87 83 105
Buffaloes 9 23 30 77 39
They also reordered highest prevalence of b. bovis infection (28%) in calves whereas low
prevalence rate (15 %) in adult animals. Furthermore buffalo’s calves were observed more prone
to babesia infection (50%) than adults (0%). Similarly Nayel et al. (2012) observed (2.2%)
mixed hemoprotozoan infection, Babesia and Theileria spp. in samples processed through blood
smears examination while Nasir et al. (2000) also recorded mixed hemoprotozoan parasites
infection; Babesia and Theileria (12.5%) cow samples, Trypanosama with Theileria (20.8%)
while triple mixed infection with theileria, babesia and trypanosoma was observed in 8.3%
samples of jersey cattle. Furthermore they recorded double mixed infection i.e. Babesia and
Theileria (11.9%) while triple mixed infection with babesia, theileria and trypanosoma in
(8.9%) Holstein Friesian cattle.

115
2.1.2: Age-wise Prevalence
Babesiosis may affect animals belongs to both tropical and sub-tropical regions and
animals presented 1st time for babesia infection may cause problem. Generally it is believed that
the prevalence of babesiosis is more sever in mature cattle over 9 months of age but it may cause
serious problems in calves less than 9 months (Alonso et al. 1992). Age resistance mechanism in
young animals is difficult to determine because of occurrence of different physiological,
immunological and biochemical changes in animal body but colostrum play an important role in
the immune system of calves, that’s why cattle shows high resistance against the disease but
sever problems like stresses, starvation or inter-current disease may develop the problem (Garry,
1998). The statement was endorsed by Khan et al. (2004) who reported higher prevalence of
hemoprotozoan infection in adult cattle (50%), (17.07%), (38.10%) and (14.81%) than young
cattle (27.27%), (16.66%), (10.86) and (24%) in Lohani, Red Sindhi, Crossbred and Dhanni
cattle breeds respectively). In the same way Ananda et al. (2009) studied the prevalence of
hemoprotozoans in 132 crossbred cattle of different age groups, They recorded (57) samples
positive for blood protozoans; The age wise prevalence revealed; 4-6 years (63.15%), 1-2 years
(21.05%) and less than six months (15.79%). Similarly highest prevalence was observed among
adult animals over 3 years while the lowest prevalence was noted in animals less than 12 months.
Bock et al. (2004) reviewed comparative epidemiological features of B. bovis and B. bigemina
and discussed about the severity of babesiosis among different age groups of animals. They
stated that the ratio of occurrence of disease in young calves (3-9 months) are smaller and are
less affected to babesial infection because of having strong passive immunity followed by innate
immunity, resulting solid long-lasting immunity. Infection rate caused by B. bigemina is usually
higher (0.23%) than B. bovis. Two important models i.e. Simple Mathematical Model (only for

116
European cattle) and Spreadsheet Model are used to estimate the status B. bovis infections in
cattle herd. The second model is more accurate to highlight the severity of babesia species
among different age, sex and class of animals. The researchers also stated that the innate and
acquired immune mechanisms are involved against babesia infection. A young animal produces
a stronger innate immunity than mature animal. Similarly Kabir et al. (2011) analyzed the
prevalence of tick infestation in 380 cattle of different age group in district Chittagong,
Bangaldesh. Some other factors i.e. sex, breed, management, seasons, topography and parts of
animal body related to tick infestation were also studied. The results of study showed high
prevalence among young animals 46.28% (2.23 times more susceptible as compare to adult
animals) while 27.80 % among adult cattle. Ticks were found more prevalent among young
animals ≤ 1.5 year; B. microplus (35.42%), Rh. sanguineus (17.71%) and H. bispinosa (16.57%).
In adult cattle >1.5 years; B. microplus (16.09%), Rh. sanguineus (10.24%) and H. bispinosa was
noted as (9.26%).
2.1.3: Sex wise Prevalence
Majority of the researchers believed that the female animals are more prone to
hemoparasitic infection than male, particularly pregnant cattle are more susceptible to infection.
This statement is in agreement with Alim et al. (2012) who recorded higher prevalence of
babesia infection (12.17%) in female cattle than male, possible due to the fact that female
animals were kept much longer for milking and breeding purposes, provided inadequate feed
against their high demand. Similarly Kamani et al. (2010) also recorded higher prevalence of
hemoparasitic infection (62.2%) in female than male (37.8%). In the same way Atif et al. (2012)
investigated the prevalence of tick-borne disease in cattle in Sargodha district Pakistan. They
reported higher prevalence of tick-borne diseases in female cattle (26%) than male (17%). The

117
reason behind this difference might be due to the fact immunosuppression in advanced
pregnancy and/or lactation in high producing study female animal and also be due to
contaminated needles commonly used for introducing drugs for milk let down. Their findings are
also in accordance with Rajput et al. (2005) and Durani et al (2008) who reported higher
prevalence of A. marginale and T. annulata in female cattle respectively.
2.1.4: Breed wise Prevalence
Bos indicus cattle have better ability of resistance against tropical environmental threats
whereas cross bred zebu cattle has better tolerance against hot weather and best Feed Conversion
Ratio than exotic purebred animals. Bock et al. (2004) stated that the Bos taurus breeds is
comparatively less resistant to babesiosis than bos indicus and may prevent the population of
ticks but the movement of indigenous Bos indicus animals towards high tick populated area may
increase the chance of babesiosis. They further stated that in Australia b. bovis is more
pathogenic than b. bigemina. Study on adaptation of tropical condition and cattle breeds resistant
to tick and tick borne diseases were presented by Regitano et al. (2006). They mentioned that all
the modern cattle are the resultant of Bos primigenius and propagated three important races in
the continents; Asia (Bos primigenius namadicus), North Africa (Bos primigenius opisthonomus)
and Europe (Bos primigenius primigenius). Historically the early Neolithic in different areas of
Balochistan, Pakistan and a study of mtDNA hypothesized a separate cattle breed for Indian
subcontinent. The cattle breeds domesticating in this region are of Bos indicus (humped type)
while European (Bos taurus) are hump-less type. The zebu cattle have strong thermo-tolerance
against temperature than B. Taurus cattle which might be due to density of skin/structure of
sweat glands, vascularization, coat color and length of hair length. Antibodies response and tick
saliva are closely related tick resistance. High levels of IgG anti-tick saliva antibodies were noted

118
in resistant cattle whereas low levels of IgG1 and IgG2 saliva-specific antibodies were noticed in
animals susceptible to tick infestation. Exotic cattle breeds are considered to be high producing
animals imported for cross breeding and genetic improvement. Majority of the researchers
believed that the exotic cattle are more prone to hemoparasitic infection and also more
susceptible to tick infestation. In this connection a study was conducted by (Nasir et al. 2000) to
evaluate the prevalence of blood protozoan in different exotic cattle breeds. They analyzed 347
Holstein Friesian and Jersey cattle at livestock experiment station, Pattoki, Pakistan. Total 177
(51%) cattle were found positive for protozoan infection. Comparative result of prevalence of
blood parasites in both the breeds are presented in Table 2.1.4). Similarly an epidemiological
survey was conducted by Atif et al. (2012) in different breeds of cattle (indigenous and
crossbred) in districts Sargodha, Khushab and Rawalpindi of Punjab province, Pakistan. Total
(1050) tick samples were collected randomly from small holders (90) and (12) from private
farms. They recorded the overall prevalence of tick infestation in 575 (54.76%) i.e. Hyalomma
Anatolicum anatolicum (22.86%), B. microplus (21.33%), Rh. Anguineus (7.52%) and B.
annulatus (1.43%) and Haemaphysalis (1.62%). In Sargodha, Khushab and Rawalpindi districts
the prevalence of tick infestation was (57.71%), (54.00%) and (52.57%) respectively.
Table 2.1.4 Prevalence of hemoprotozoan in Jersey Holstein Friesian cattle
Cattle
Single Hemprotozoan infection Mixed Hemprotozoan infection
Babesia
(B)
Theileria
(T)
Trypanosoma
(Tr)
B+Tr
B+T
T+Tr
B+T+Tr
Jersey
Cow 1 23 - - 6 10 4
Young
stock
- 12 - - 2 - -

119
Sucklers 5 10 - - 4 - -
Holstein
Friesian
Cow - 42 - - 8 5 5
Young
stock
12 7 1 - 5 - -
Sucklers 7 6 - - 1 - -
2.1.5: Seasons wise Prevalence
An intensive study of babesiosis, caused by Babesia divergens transmitted by a tick
species Ixodes ricinus was conducted in Tavistock area of South Devon, Britain by (Donnelly,
1973) to find out the epidemiological status of disease in the area. Ten areas were selected for
ticks population and analyzed regularly once a month (March to November) for 2 years. The
blanket dragging technique was applied. Complete information about the presence of babesiosis
was collected from the local veterinary resources. He observed high prevalence during two
seasons i.e. late April-early June (spring rise 70 %) & August-late October (autumn rise 50 %)
but fall down during midsummer. Nicola et al. (1998) also evaluated the seroprevalance of
Ehrlichia phagocytephilia in (1996-1997) in cows and pregnant heifers. Initially they recorded
the seroprevalence (16%) but after two weeks of pasturing jumped up to (43%) and gradually
increased up to (63%) in September while after the end of pasturing the seroprevalence gradually
declined to low proportion of (23%). Comparatively nested PCR noted large number of E.
phagocytophilia organism (12 samples) than blood smear examination (7 samples).
The seasonal prevalence of different hemoprotozoans were studied by Durrani et al.
(2010). They evaluated the effects of protozoans on Sahiwal and Friesian cattle breeds during

120
different seasons i.e. summer, winter, autumn and spring (2006 to 2007). Microscopic
examination and PCR tests were used to detect the pathogens. According to their observations,
infection was more prevalent during the months of summer (44.8%) in Sahiwal while (97.6%) in
Friesian breed. Similarly (17.6%) in Sahiwal and (20.8%) in Friesian breed was noticed during
the months of winter. Moreover during the months of autumn season the infection was recorded
as (20%) in Shaiwal while (30.4%) in Friesian cattle. Similarly in spring season it was noted as
(9.6%) in Sahiwal and (12.8%) in Friesian cattle. The overall prevalence of hemoprotozoan in
Lahore, Multan and Rawalpindi was recorded as (13.1%), (10.8%) and (7.8%) respectively.
Microscopic examination revealed different species of protozoan in blood samples i.e. Theileria,
(5%) and (7%) in Sahiwal and Friesian respectively whereas Babesia spp. (1.58%) was detected
among both Sahiwal and Friesian cattle. The PCR detected mixed protozoan infection i.e. T.
annulata (23%) in Sahiwal and (40.4%) in Friesian whereas Babesia (19%) was noticed among
both Sahiwal and Friesian breeds during the whole period of seasonal study and finally they
concluded the results of Indirect Fluorescent Antibody (IFA) test with the prevalence of T.
annulata (19%) in Sahiwal and (20%) in Friesian while mixed infection (8%) was observed
among both Sahiwal and Friesian breeds during the months of spring & summer seasons.
2.2: TICK STUDY
Role of vector in the spread of diseases, its biology, taxonomy, pathogenicity and control
was reviewed by Jongejan and Uilenberg (1994). They discussed about the major features of 7
most important genera of hard ticks such as (Boophilus), (Dermacentor), (Haemaphysalis),
(Hyalomma), (Ixodes), (Rhipicephalus) and (Amblyomma). Ticks are obligate parasites
commonly found on external parts of the host causing huge losses worldwide. Ticks have 8 legs
with nymphs and adults, and the body consists of the capitulum (mouthparts) and the

121
opisthosoma. About 840 tick species have been recognized to infect their hosts. Two families i.e.
“Ixodidae” also called hard ticks (comprises on 80% of the total tick species) is considered to be
the most common and lethal parasites to livestock production, and the “Argasidae” also called
soft ticks surviving with importance in livestock but commonly in poultry. The life cycle of hard
ticks comprises on larvae› nymph› adult stages whereas three types of ticks have been
recognized according to their hosts i.e. one host ticks, two hosts ticks and three hosts ticks. In
case of “one host tick” such as Boophilus spp., the nymphs-adult stages feed once from the same
host, the “two host ticks” such as Hyalomma require 2 different hosts for the completion of
lifecycle whereas the “three host ticks” like Amblyomma need three different host for the
completion of their life cycle. Among 7 genera of hard ticks the Boophilus spp. such as; b.
microplus, b. annulatus, b. decoloratus and b. geigyi considered being the most important
vectors causing babesiosis in cattle. These species causes direct heavy losses in cattle particularly
in low resistance herd because of excessive/continuous blood loss and disturbed metabolism.
These are single host parasites which require (3 weeks) to complete the food (blood meal) they
receive from the host. Conventionally staining techniques are used to detect the presence of
parasites infection in ticks but today PCR is considered to be the most sensitive, quick and
reliable technique with ability to synthesize a huge quantity of DNA and its amplification, even
can be used for differentiation of protozoans, also for the prevalence and severity of infection.
PCR is more efficient in field study and also used against the samples preserved in ethanol.
Ticks and tick-borne piroplasmosis is the most serious problems of cattle of the South
mountain pasture of Hunan province (Xicheng et al. 1997). In this connection a study was
carried out from 1992 to 1995, where theileria sergenti was found in the blood of disease
stricken cows. Ticks were collected from cattle and four species of ticks; H. vietuamensis, H.

122
longicornis, I. sinensis and B. microplus) were identified by microscopy and their numbers were
also recorded every month. H. longicornisis a three-host tick, with the larvae, nymphs and adults,
all infesting cows and seasonal fluctuations in nymphs and adults correlating with theileriosis
outbreaks. This tick spp. was a potential vector of T. sergenti. Epidemiological studies indicated
that theileriosis usually occurred in summer or autumn. The disease attacked calves from May to
August reaching a peak in June or July (as happened from 1992-1994). In cattle, the disease
occurred from June to September with a peak in September.
Similarly Sohail et al. (2009) conducted an epidemiological survey (questionnaire-based)
in two districts Layyah & Muzaffargarh of the Punjab province, Pakistan. They stated that tick
infestation is still a great threat to livestock and dairy industry of Pakistan. The objective of the
study was to find out the prevalence of ticks and their interaction with the host age, species, sex,
breed and environment. Total 3500 animals (cattle and buffaloes) were selected. They noticed
highest prevalence of tick infestation in cattle in the sense that out of 1475 cattle, 1076 (72.9%)
samples was found positive for tick infestation. In buffaloes, out of 2025 the prevalence rate of
tick infestation was 957 (47.3%). Among tick species; Hyalomma anatolicum anatolicum was
found the more prevalent among 3500 animals out of which 1173 (33.5 %) were found infested
with Hy. anatolicum anatolicum followed by Rh. sanguineus 456 (13%). The overall high
seasonal prevalence was noted in the month of July but no prevalence in January, February,
March, November and December in District Layyah and December, January, February, March in
District Muzaffargarh. Similarly Sex wise prevalence of tick infestation was analyzed by Kabir
et al. (2011) in 380 indigenous and crossbred cattle of Chittagong District, Bangladesh. They
observed peak prevalence among female cattle 59.37 % (2.61 times more susceptible than male)
whereas 35.83 % was identified in male animals. In male animals B. microplus (21.66%) was

123
found more prevalent than Rh. sanguineus (12.05%) and H. bispinosa (11.66%) while in female
cattle, B. microplus (43.12%) was noted more prevalent than Rh. sanguineus (23.12%) and H.
bispinosa (21.25 %). The reason behind higher prevalence in female animal might be due to
hormonal influences, also endorsed by Lloyd (1983) that an elevation of progesterone &
prolactin hormones make the animal more susceptible against any infection. Other associated
reasons hypothesized the stresses caused by pregnancy, lactation and diseases etc.
2.3: MORPHOLOGY OF BABESIA
Many workers recommended the accurate and early detection of babesiosis which may help to
decrease the heavy losses in affected animals. Chaudhry et al. (2010) analyzed different methods
of identification used for babesia species. They stated that, globally babesiosis is considered to
be one of the most lethal protozoan diseases causing losses in 1.2 x 10⁹ cattle and estimated that
more than “500 million” are exposed to babesiosis. For this purpose blood samples from 100
cross-bred cattle maintained at LES, Qadirabad, Punjab, Pakistan were collected and processed
for PCR and microscopic examination (Giemsa stained blood film). They concluded the results
of blood smears positive for hemoparasites (18%) 18/100 whereas PCR detected (29%) 29/100
samples i.e. (b. bigemina= 18 and b. bovis= 11). Morphologically, B. bovis was identified as a
smaller protozoan whereas b. bigemina as bigger in size. Both the parasites were seen in pair
form; b. bovis with an obtuse angle to each other while in case of b. bigemina both the angle
were acute to each other but with the help of smear examination it is very difficult to
differentiate between these two spp. Micrometry was used to measure the protozoan parasites
while “tri-ocular microscope” of Micros, Austria was used for the fine pictures of parasites. In
acute form of the disease, the maximum parasitemia caused by B. bovis less than1% whereas in B.
bigemina may develop up to (10.30%). Maximum parasitemia mean percentage % of RBCs infected in

124
circulating blood system. In this study the PCR was considered to be the more authentic/sensitive
and reliable method than Microscopic slides method.
2.4: TREDITIONAL MEDICINE KNOWLEDGE
Traditional medicine knowledge is considered to be the most important part of life
particularly in developing countries. In this connection Sindhu et al. (2010) carried out a study to
compile the most frequent and existing Ethno veterinary practices among different ethnic groups
of the Districts “Balakot” “Kaghan” and “Mansehra” of Khyber Pushtoonkhwa Province
(formerly North West Frontier Province). They stated that the Ethno-veterinary medicine is the
extract of knowledge and practical experience of traditional people (such as pastoralists, and
nomads) applied to rise up the production/status and health of their animals. These people have
their own customs/rules of life which bifurcate them as a specific community. The way of flow
of knowledge from one generation to next is totally based on verbal conversation. Sharing of
Ethno-veterinary knowledge can be useful in the designing of projects on animal health care.
Today medicinal plants are widely used in majority of the countries worldwide, like African
countries alone uses (95%) local medicines belong to plant kingdom. Pakistan is also blessed
with a long list of traditional veterinary medicine and majority of the livestock owners are belong
to poor families with the total livestock assets of 5-6 animals/family. As they have no purchasing
power for modern medicine, thus may lead to loss of production. Therefore traditional veterinary
medicines need to be compiled/preserved scientifically and propagated. The workers compiled
35 plant spp. (25 families). Among these “Apiaceae” “Brassicaceae”, “Compositae”,
“Pinaceae”, “Poaceae & “Verbenaceae” were observed as the most frequent plant families
whereas some materials such as butter, mineral salt, lasi, yogurt, kafor, engine oil, buffalo’s urine
and milk were also noticed used against their problems. Similarly some more plants species

125
including Allium sativum, Trachyspermum ammi, Sprague, Brassica campestris, Eclipta
prostrate, Cedrus deodara, Zea mays, Vitexnegundo, Prunus persica, Daphne mucronata and
Zingiber zerumbet were noticed and used as Ethno-veterinary medicine. These plants are used in
different preparation and form i.e. “leaf, Seed, roots, decoction, oil extracts, fruits and barks etc.
The traditional medicines are prepared/used for the following ten most common animal
diseases/condition noticed during the course of study i.e. (tick infestation, FMD, helminthes
parasites, mange, myiasis, pain, pediculosis, pneumonia, bleeding and prolapse of uterine).
Farmers particularly pastorals are the key community closely related to livestock industry
and rich in practical indigenous/veterinary knowledge. The sharing of ideas about traditional or
ethno-veterinary knowledge can be helpful in animal health projects and also provides all the
necessary information required for the strengthening of traditional/modern livestock systems.
There are so many techniques used for the collection of data about the lifestyle of the targeted
areas. In this connection Bolajoko et al. (2011) designed a study to evaluate the animal health
status of Fulani community at Barkin Ladi Local Government Area, Plateau State, Nigeria. The
participatory rural appraisal tools i.e. open-ended question/interview, probing, triangulation,
transect and proportional piling with key informant/translator were used to find out the status
diseases in targeted area. For this purpose a team was arranged comprising a key
informant/translator (the son of the chief of Fulani settlements and a veterinarian introduced the
team), an epidemiologist/researcher, sociologist and economist. A checklist was also kept in
mind to make sure the flow of accurate information. The results of the study revealed the
awareness of respondents regarding the veterinary services available in the area. Mostly
extensive farm management, mixed livestock spp. (ovine and avian) but no specific grazing area
was noticed. The farmers claimed high production and more income during the months of

126
March, April, August & December because of local festivals but decreased in rainy seasons
because of the spread of diseases particularly of tick infestation. The team noticed that the people
of Fulani community were well aware about the names of each disease. Samples from suspected
animals were collected and dispatched for laboratory analysis. Similarly Ogbuewu et al. (2011)
reviewed the importance of neem (Azadirachta indica) in agriculture/livestock industries and
biomedicine. Almost all parts of the neem, leaves, roots, barks, seeds, and fruits are claimed to
be more effective against several diseases caused by parasites, viruses, fungi and can also be
used as an antiseptic, anti-inflammatory and many more. Neem is a tree belongs to family
“Meliaceae” native to Indian sub-continents with the history of 4000 years. It grows naturally,
attains height (23-50 feet) on an altitude up to (1500 meters) and is capable to survive in
hard/tough weather but more efficiently in areas with the rainfall ranges from 450- 1200mm. The
isolated components/derivatives of neem consist of “nimbin”, “azadirachtin” , “gedonin”,
“meliacin”, “salanin” and “valassin” etc. Two species of neem i.e. Azadirachta indica A. Juss
(Indian sub-continent i.e. Pakistan, Bangladesh, Malaysia, Indonesia, Thailand and Sri Lanka)
and azadirachta excellsa (Philipine and Indonesia) have been documented but due to its high
profile benefits the plantation of neem can be seen in other parts of the world (about 72
countries) including Australia, Central/North and South America. Therefore neem is also called
as “Village Pharmacy” and many international organizations such as NRC (National Research
Council, Washington, USA) also considered as the most effective and beneficial plant with
remarkable properties. The Taxonomy of neem revealed as Order (Rutales), Suborder (Rutinae),
Family (Meliaceae), Subfamily (Melioideae), Tribe (Melieae), Gens (Azadirachta) and Specie
(Indica). The chemistry of neem detected the two most important constituents i.e. Terpenes and
Limonoids and similarly Azadirachtin (3-deacetyl-3- cinnamoylazadirachtin, I-tigloyl-3-acatyl-
127
II-methoxazadirachtin, 22, 23-dihydro-23β-methoxazadirachtin, nimbanal, 3-tigloylazadirachtol,
3-acatyl-salannoV margocin, margocilin and others) is considered to be a most active component
in Terpenes whereas Terpenoids are “isoazadirolide”, 6 nimbocinolide, nibonolone,
methylgrevillate & margosinone. The neem tree is blessed naturally with so many bio properties.
In livestock and agriculture the properties of neem are highly appreciable. The cost of feedstuff
play an important role in the production of livestock, particularly produced conventionally may
cause high cost of production. In this connection some researchers tried to introduce a new
feedstuff with proximate composition of “neem seed cake” & “leaf meal” for rabbits/poultry.
The result showed that the leaf meal had; dry matter (92.42%), moisture (7.58%), crude protein
(20.68%), crude fiber (16.60%), ether extract (4.13%), ash (7.10) and nitrogen free extract
(43.91%). In animals the neem cakes are most commonly used as livestock feed whereas the
bitter taeste can be removed by alikali treatment, caustic soda (removed the toxicant
triepennoids) make possibel a palatble food. These cackes were found more effeciant with
improved feeding value/growth rate. Neem products provide best results to livestock and
agriculture industries in the sense that today a large number of neem formulation
pesticides/insecticides/antifungle are commercialy available such as @ Achook =0.15 E.C.,
Bioneem=0.03%, Nimbicidine=0.03% E.C. and Neemark=0.03% are used against different
species of fungi. Neem oil contain “long chain fatty acids” are utalized in poultry feed. Neem
leaves/bark extract of both alcohol/water are widely used as antimalarial in India/Burma and
West Africa etc. especially gedunin (active component of neem) as an alternative to quinin an
Chloroquine. The machnasim is possibly redox status of RBCs. The phenomina for the control of
malerial parasites is; the plasmodium produces oxidents whereas neem acts as an antioxident and
reduced the oxidised cells and thus destroye the plasmodium. The history advantages and uses of

128
different parts of neem was analyzed by Chousalkar (2000) and stated that the use of neem in
veterinary medicine in India dates back to the times of the epic Mahabharata (300 B.C).
The benefits of Neem were highlighted by Dhaliwal (2004). He stated that there are about
2,50,000 to 5,00,000 different plant species in the world today. Only 10 per cent of these have
been examined chemically indicating a vast resource, which still remains untapped. One of the
most useful of these trees is the neem, Azadirachta indica A. Juss., which has been credited as a
tree for solving global problems in view of its potential of improving pest control, bettering
health, assisting reforestation and perhaps checking over-population (NRC, 1992). Gesine
Bradacs (2008) conducted an ethno-botanical research based survey at Vanuatu (Republic of
Vanuatu). During five months of fieldwork 130 plant species used in traditional medicine were
documented together with 420 individual use reports. Along with the voucher specimen,
information on treatment methods, healing concepts and diseases was collected, and
subsequently qualitatively and quantitatively analyzed. Dermatological and gastrointestinal
complaints, followed by respiratory ailments and diseases related to the urogenital system were
the categories most commonly indicated, reflecting a prevalence of these illnesses in the study
areas. 18 plants with indications towards immunomodulatory effects were selected on site and
material of 21 plant parts was collected and subsequently screened for antibacterial, antifungal,
and antiprotozoal activities. In addition the extracts were subjected to a detailed analysis on
cytotoxic effects towards human cancer cell lines, designed as a smaller version of the NCI60
screen. Patterns of relative drug sensitivity and resistance reflect possible mechanisms of drug
action, which gives the opportunity for molecular-targeted anticancer drug discovery. In total the
screenings yielded moderate antibacterial activity for one and antifungal for four extracts, five
extracts were shown to be moderately active against trypanosoma brucei, three extracts have

129
displayed good and specific activities against trypanosoma cruzi, and three extracts significantly
killed plasmodium falciparum. Intriguingly 15 plant extracts exhibited strong cytotoxic effects
specific for only one cancer cell line. Also a phytochemical investigation was carried out for
Baccaurea stylaris MUELL. ARG. (Phyllanthaceae) leading to the discovery of seven pure
compounds, one of them a new diterpenoid with neoclerodane-skeleton. Masika and Afolayan
(2003) collected information about medicinal plants used by the people of the Eastern Cape for
the treatment of animal diseases by using rapid rural appraisal techniques, including ranking,
stories, transect walking, seasonal calendars and semi-structured interviews. A total of 38 species
belonging to 31 families was found to be commonly used in herbal remedies against various
diseases of farm animals. Out of these, 21 plant species from 17 families are used to treat
gallsickness, while 13 species from 13 families are used to treat redwater disease. In the majority
of preparations, 78% of the remedies are decoctions: 13% as infusions, 5% by just squeezing the
plant parts, and 4% of the preparations are either prepared as infusions, or as decoctions. Leaves
are the most frequently used plant part. A total of nine livestock disease conditions, namely
gallsickness, redwater, heartwater, eye inflammation, retained placenta, foot rot, hastening of
estrus, three-day-stiff sickness and internal parasites (helminthiasis) were reported to be treated
using the plants recorded during the investigation. Generally, more than one plant species are
combined for the treatment of livestock by the rural farmers of the Eastern Cape province. In
most cases, the plants used are reported, in literature, to possess some pharmacological activity.
The prevalence and chemotherapy of babesiosis in crossbred calves was studied by Niazi
et al. (2008) at the Livestock Experimental Station Qadirabad, District Sahiwal, Pakistan. The
effect of babesiosis on different blood parameters was also studied. Out of 415 calves, 30 calves
were found positive with prevalence rate (7.2%). For chemotherapeutic trials, 30 infected calves

130
and 10 healthy animals were divided into 4 groups viz. A, B, C and D with 10 animals in each
group. The animals of group A and B were treated with diminazene aceturate (Fa-try-banil, Prix,
Pharma, Pakistan) and imidocarb dipropionate (Imizol, ICI, Pakistan) @ 3.5 mg/kg BW 1Mand
1ml/1 00 kg BW 1M, respectively. Similarly the animals of group C and D served as positive
control and negative control, respectively. The results of the study revealed the efficacy of
diminazene aceturate (90%) and imidocarb dipropionate (100%). Haematological studies
revealed a significant decrease in haemoglobin concentration and total erythrocyte count in
Babesia positive animals than negative control. Finally they concluded that the imidocarb
dipropionate is a drug of choice to treat babesiosis in calves followed by diminazene aceturate.
Similarly Rahul et al (2008) prepared extracts from the leaf, bark, and seed of Azadirachta
indica; leaf and seed of Prunus persica; bark of Mangifera indica, and leaf of Psidium guajava
and evaluated against Boophilus microplus. Of the eight extracts screened, the extracts prepared
from the A. indica seed showed very high level of efficacy (80%) after 5 h of treatment. Besides
the immediate effect on adult ticks, the egg-laying properties of the survived ticks was also
assessed, and a significant reduction (P < 0.01) in the reproductive index of ticks fed on animals
treated with A. indica seed extracts was noted in comparison to control. Rajput (2006) reviewed
the importance of ticks, their control, medical and economic importance due to their ability to
transmit diseases to humans and animals. Ticks causes great economic losses in livestock, and
adversely affect livestock in several ways. Loss of blood is a direct effect of ticks acting as
potential vector for haemo-protozoa and helminth parasites. Blood sucking by large numbers of
ticks causes reduction in live weight and anemia in domestic animals, while their bite also
reduces the quality of hides. However, major losses caused by ticks are due to their ability to
transmit protozoan, rickettsial and viral diseases in livestock, which are of great economic

131
importance world-wide. Furthermore Shafy and Zayed (2002) studied the effects of the plant
extract of neem seed (Azadirachta indica) on eggs, immature, and adult stages of Hyalomma
anatolicum excavatum at concentrations of 1.6, 3.2, 6.4, and 12.8%. The extract was found to
have a significant effect on the hatching rate of eggs. It significantly increased the hatching rate
during the first 7 days post-treatment (DPT) giving incompletely developed and dead larvae;
however, it cause hatching failure at DPT 15. Neem Azal F induced a significant increased in
mortality rates of newly hatched larvae, unfed larvae, and unfed adults reaching 100% on 15th,
3rd, and 15th DPT, respectively. The mortality rates increased with the extract concentrations.
Although, it had no significant effect on the molting rates of fed nymphs, it caused malformation
or deformities in 4% of adults molted. It was concluded that the concentration of Neem Azal F
which may be used for commercial control of this tick species were 1.6 and 3.2%. Shivan et al.
(2009) screened out eight medicinal plants for their efficacy against Boophilus microplus, the
widely distributed tick species in India. Of the seven extracts screened, the extracts prepared
from the Annona squamosa seed showed very high level of efficacy (70.8%) after 24 h of the
treatment. The effect of treatment on oviposition of the survived ticks was also assessed, and a
significant reduction (P < 0.05) in the reproductive index was noted in comparison to control.
When efficacy of the in vitro optimized concentration of A. squamosa was compared with
previously tested extract of Azadirachta indica in in vivo model, it was observed that the extracts
prepared from A. indica is more efficacious than the extracts of A. squamosa. A comparable
efficacy against B. microplus fed on animals treated with herbal extracts and commonly used
synthetic acaricide was noted. Waal and Combrink (2006) stated that bovine babesiosis is an
important tick-borne disease caused by B. bovis, B. bigemina and B. divergens. The first step
taken in the development of an effective vaccination strategy against bovine babesiosis followed

132
the observations that animals, recovered from natural infection with Babesia were strongly
protected against subsequent challenge. Further investigation indicated that the use of donor
blood from recovered animals to infect recipient animals did not produce the severe form of the
disease. The past century has seen a refinement of this original carrier-donor system to one using
attenuated less virulent strains with standardized doses of known parasite concentration to ensure
reliability. With the implementation of good manufacturing practices further changes were
necessary in the production of these vaccines, such as freezing for long-term storage to allow
sufficient time for pre-release safety and effectively testing. Regardless of these improvements
the vaccines are not without problems and breakdowns and breakthroughs occur from time to
time. Despite considerable research efforts into the development of alternative more consumer
friendly vaccines, none is immediately forthcoming and the live attenuated babesiosis vaccines
are still used in many countries.
2.5: DIAGNOSIS
Thin and thick blood films for the diagnosis of bovine babesiosis were analyzed by
Bishop and Garry (1973). For this purpose bovine blood samples were collected from the jugular
vein and added anticoagulant (Disodium Ethylenediamine-tetraacetate = 1 gm/Ltr.). For thin
blood smear preparation, a small drop of sample was placed on the end and stretched over the
half of the length of the microscopic glass slide and air-dried whereas for Thick blood film a
loop (prepared manually) of 2.5 mm was used to place a standard blood drop over the one end of
microscopic glass slide and spread with the help of loop and dried. Thin smears were fixed with
Absolute Methyl Alcohol and processed for Giemsa staining for 45 minutes. The results of the
study revealed that the Giemsa staining solution (ratio 1:50) develop osmotic pressure during the
45 minutes staining process, may lead to unfixed RBC lysis causes difficulty to detect the size,

133
position and morphological characteristics. It was also noticed that the buffered solution with a
pH 7-7.1 made possible the Giemsa staining solution to develop some differential colors of
protozoans organelles such as “deep blue cytoplasm and a brilliant red nucleus”, e.g. Babesia
spp. The number of protozoan/mm³ of blood was calculated by the presence of number of
protozoans and WBCs detected in 20 microscopic fields under ocular10X and 100Xoil-objective
and converted to the % age of RBCs from the No. of RBCs/mm³ of blood.
Bovine babesiosis causes heavy losses in Thailand and b. bovis is considered to be the
key protozoan which is more prevalent/virulent as compare to b. bigemina (synonym = b.
bigermina) and other co-species. The early diagnosis of theses parasites can be beneficial to
decrease the losses, and generally conventional/standard procedures i.e. microscopic thin blood
films (Giemsa stained) are used with drawback of less effective against babesiosis with low
parasitemia, Therefore an alternative method need to be adopted in case of extremely low
parasitic infection. In this connection, Sompong et al. (2003) evaluated the comparative efficacy
of PCR-ELISA and microscopic blood slide method to find out the status of babesia spp. among
babesiosis carriers cattle. For this purpose some species of protozoans i.e. “b. bigermina”,
“Anaplasma centrale”, “A. marginale” and “T. evansi” were collected from naturally infected
cattle whereas for B. bovis, splenectomized calves were selected and induced the parasites
according to standard procedure prescribed by Callow & Mellors (1966). The DNA of all
protozoans was extracted by PCR kit “Boehringer Mannheim Co, Germany”. The pair nucleotide
primers (5ꞌ GGGTTTATAGTCGGTTTTGT-3′ and 5′- ACCATTCTGGTACTATATGC-3ꞌ)
were used. The results of study revealed that the PCR-ELISA test was found more sensitive and
detected protozoans (among inoculated/splenectomized calf) at day 3 after inoculation whereas
the microscopic examination (thin blood film method) highlighted the hemoparasites on day 12.

134
The results of “PCR-ELISA species specificity” highlighted few A. marginale signals in
“ELISA” with more intensity in B. bovis and also cross reaction of A. marginale was noticed in
PCR-ELISA. The PCR-ELISA method was found more specific and highly sensitive technique
against carrier animals, because the results of blood films/PCR-gel electrophoresis declared 6
samples negative for hemoparasites but PCR-ELISA method highlighted the same sample as
positive (2/6). Another comparative study was conducted by Oliveira et al. (2008) to analyze the
severity of B. bigemina in different breeds of cattle. For this purpose they selected 120 beef
cattle; cows=15 over 3 years, and calves=15 less than 1 year (8–12 months). Other groups, 1
group “N” was B. indicus = Nelore (pure breed) whereas other three breeds were (Angus x
Nelore), (Canchim x Nelore), and (Simmental x Nelore) for tick specimen (10 standard-sized
female engorged ticks i.e. ≥4.5 mm from each experimental cattle) and blood collection (from
jugular vein while 1=auricular vessels for DNA extraction). Microscopic examinations for
Babesia species was carried out by thin blood smear which was prepared, air dried, fixed in
absolute methyl-alcohol and stained with Geimsa whereas DNA extraction Kit (GFXTM)
“Genomic Blood DNA Purification kit, GE Health Care”. For this purpose 300 µL blood sample
from each cattle was processed. Vector (B. microplus female) DNA was also extracted according
to method illustrated by Oliveira-Sequeira et al. (2005). PCR/nPCR was used against the DNA
extracted both from b. bigemina and b. microplus female vector. The results of the microscopic
study detected b. bigemina merozoites among six calves comprises on (4 = pure Nelore breed
while 2 = Angus X Nelore). Although PCR/nPCR highlighted the b. bigemina DNA among all
targeted cattle but PCR detected total 51/60 samples (calves) while 9/60 samples (cow) positive
for b. bigemina infection but the application of nPCR (more sensitive than PCR). Vector study
revealed total 9/549 engorged R. microplus (on calves i.e. 4 = pure Nelore, 1 = Canchim x

135
Nelore, 1 Angus x Nelore and 3 = Simmental x Nelore) carried Babesia Kinetes. Similarly the
results of nPCR showed the highest rate of infection (caused by B. bigemina) in R. microplus,
nourished on calves i.e. 24.4% whereas 9.40% in adult cow.
The comparative efficacy of Molecular tests is considered to be more efficient, highly
sensitive and more specific detective methods used against piroplasmosis than serological and
microscopic tests. The García-Sanmartín et al. (2006) tested an advanced diagnostic test the
“RLB” (Reverse Line Blot) to analyze the status of bovine piroplasmosis in Northern Spain. The
study was conducted among 263 bovine blood samples collected in sterilized tubes containing
anticoagulant (ETDA) for hematological study; WBC, RBC counts by electric counter (Iber-cell,
Barcelona Spain), PCV (Standard Microhaematocrit method), Hb concentration (Colorimetric
assay in a spectrophotometer), Leukocyte Differential Count (Thin Giemsa stained blood
smears), Morphology of Theileria/Babesia within RBCs (Giemsa stained blood smears under
oil-immersion 100 × objective), whereas DNA was extracted by (QIAamp DNA Mini kit of
Qiagen, Hilden, Germany) and yield determination by (NanoDrop® ND-1000 Spectrophotometer
of NanoDrop Technologies, DE, USA). For Theileria and Babesia gene amplification PCR
primers set used; RLB-F = 5'-GACACAGGGAGGTAGTGACAAG-3' and RLB-R = biotin-5'-
CTAAGAATTTCACCTCTGACAGT-3' by MWG Biotech AG, Germany. The results of
microscopic study highlighted Theileria species (82.5%) while Babesia species (17.5%) and
overall (37.8 %) piroplasms was detected among bovines group, showed clinical signs i.e.
anaemia, haemoglobinuria, hyperthermia and icterus whereas (24.6%) among those showed
unspecific signs i.e. loss of body weight loss and milk production, anorexia, abortion and
reproductive failure. The results of different blood parameters, revealed babesia and Theileria
infection in RBCs; RBC count (4.18 ± 1.19 × 106 mm-3), PCV (0.19 ± 0.039 l/l) & Hb

136
concentration (5.9 ± 1.54 g/dl) while for Theileria species, RBC count (5.58 ± 0.50 X 106 mm-3),
PCV (0.27 ± 0.023 l/l) & Hb concentration (9.7 ± 0.79 g/dl). The results of negative samples for
piroplasmosis revealed i.e. RBC count (5.85 ± 1.41 ×106 mm-3) PCV (0.30 ± 0.096 l/l) & Hb
concenteration (10.4 ± 1.78 g/dl) and was found significantly higher than samples with Theileria
and Babesia infection. Blood samples also highlighted mixed Babesia + Theileria species
infection with different blood parameter values i.e. RBC count (5.01 ± 1.53 × 106 mm-3), PCV
(0.25 ± 0.065 l/l) & Hb concentration (8.4 ± 2.11 g/dl). The value of PCV was found
significantly lower than negative samples. Similarly the Leukocyte counts of samples infected
with Babesia, Theileria and negative were noticed as; 4.46 ± 0.96 × 103 mm-3, 7.38 ± 0.77 × 10³
mm-3 and 7.18 ± 0.56 × 103 mm-3 respectively. The results of overall samples processed for RLB
detected increased number of positive samples (54.0%). Similarly 60.9% among showed clinical
signs whereas 50.0% among bovines, showed unspecific clinical signs. The most
common/frequent protozoan was noted as T. buffeli (112/263 = 42.6%, single 101/112 = 90.2%
while mixed infection 11/112 = 9.8%) followed by T. annulata (22/263 = 8.4%), single 15/22 =
68.2% whereas mixed infection 7/22 = 31.8% was observed. Similarly babesia species were also
detected among experimental animal blood samples, but found less frequent as compare to the
Theileria species i.e. 24/263 (9.1%) whereas babesia major was found 8/263 (3%) among
samples collected from three farms i.e. (5/8 samples as single infection and 3/8 samples jointly
with T. buffeli). Similarly b. bigemina was noted among 7/263 (2.7%) in five farms always
noticed jointly with Theileria species whereas b. divergens was recorded only among 3 samples
collected from three farms.
Comparative study between conventional and modern diagnostic techniques was
conducted by Mervat et al. (2010) to highlight an efficient diagnostic method for bovine

137
babesiosis. For this purpose 100 cattle and buffaloes (age 1-3 years) naturally infected with
babesia spp. infection with clinical signs, fever, depression, Anorexia, weakness, pale mucos
membrane, emaciation, weight loss, hemoglobin urea, increased heart & respiratory rates were
selected from different non-governmental farm maintained around the Kaliobia Governorate
area. Blood samples (two times from each animal) were collected from the jugular vein in clean
and sterilized test tubes. For microscopic examination thin blood films (3) were prepared, air
dried and fixed in absolute methyl-alcohol for one to two minutes, Stained with Giemsa stain for
30-45 min. Three continuously negatives samples were kept in mind as the criteria for negative
samples. Each sample was presented to DNA extraction by “chloroform- isoamyl extraction
method”. For PCR the following forward and reverse primers were designed/sequenced for
Babesia bigemina i.e. “Forward: GAGAAACGGCTACCACAT whereas “Reverse:
CATTACCAAGGCTCAAAA”. The results of PCR revealed 11/15 (73%) samples positive for
b. bigemina whereas microscopic examination detected 38/100 (38%). They concluded that
clinical cases with higher paracitemia can possibly be diagnosed by microscopic examination but
sub-clinical cases with low paracitemia are difficult to diagnose which need more efficient
diagnostic technique and the PCR was considered to be the most efficient and reliable technique
even in extremely low babesia infection. Microscopic examination of blood film confirmed the
appearance of B. bigemina inside the erythrocytes resemble to pear shaped. Similarly the OIE
Terrestrial Manual (2010) published a comprehensive technical note about the latest diagnostic
techniques used against babesiosis, a protozoan disease caused by Genus = Babesia, Order =
Piroplasmida, Phylum = Apicomplexa and species Babesia bovis, b. bigemina and others are
responsible for the spread of disease in Australia, Asia, Africa, Central/South America. It is a
vector-borne disease. Rhipicephalus microplus also called Boophilus microplus is the major tick

138
species causing problem in tropical/subtropical regions. Traditionally, Giemsa stained thin and
thick blood smears were widely used for the identification of babesia species. Thick blood
smears have the ability to detect low parasitaemia (1 parasite in 106 RBC) in blood circulation
while thin blood films give good results against species differentiation. For this purpose fresh
blood samples should be collected from the tip of tail/ear (B. bovis commonly found in blood
capillaries while B. bigemina/B. divergens in vasculatures) but can be taken from the jugular vein
by adding anticoagulants (EDTA/Lithium Heparin) and stored in cool environment (5°C is
recommended). Procedure for thin blood film was descried as, placed a drop of blood on the
plain side of a clean microscope slide and spread over the slide, air dried/fixed in (Absolute
Methanol) for 10 second to 1 minute and then presented to Giemsa stain for 15 minutes to half
hour. Similarly thick films can also be prepared by taking a drop of blood sample (50 μl), placed
on a microscopic slide and spread with the help of another slide (with circular motion) but not
fixed in Absolute methanol. The slide let then to dry in air and Heat-fixed (at 80°C) for about 5
min, and presented to Giemsa (10%) staining. It is true that this technique is more sensitive and
show quick response to babesia protozoan but found less effective against carrier/chronic cases
(because of very low parasitaemia) and species differentiation, which need more effective and
sensitive technique i.e. “florescent dye” (Acridine-0range) instead of Giemsa stain, Bose et al.
(1995). According to Bock et al. (2006) and De Vos et al. (2004) thin blood films/smears can
also be prepared from samples collected from different visceral organs/muscles of dead animals
such as lungs, liver, kidneys (in case of fresh carcass), spleen (in case of decomposed carcass)
and heart muscles. DNA play an important role in the detection of certain diseases. Today
“Nucleic acid-based diagnostic assays” are widely used in the diagnosis of babesia species
particularly babesia bovis/ b. bigemina and considered to be more sensitive in chronic

139
babesiosis/carrier animals, Buling et al. (2007), Costa-Junior et al. (2006) and Criado-Fornelio
(2007). The evolution of PCR is a great achievement of this era which is widely used in different
fields particularly in the fields concerned with human life and veterinary sciences and considered
to be an authentic, reliable and more sensitive diagnostic test used against babesia species (1000
times than microscopic examination) even in cases with low level of parasitaemia ranging from
0.001- 0.0000001 percent i.e.1 parasite in 109 Red Blood Cells (Criado-Fornelio, 2007) and can
also be used for the differentiation of species. It is hypothesized that the PCR assays is less
effective in large-scale study and serological tests are considered to be the best choice.
The presence of b. bovis and b. bigemina protozoan in 105 cattle and 39 buffaloes
naturally infected with babesiosis in Districts, Multan, Bhakar, Muzaffar Garh, Bahawalnagar,
Vehari, and Layyah, Southern Punjab Pakistan was studied by Samreen Zulfiqar (et al. 2012)
with the objectives to highlight the more specific/authentic and highly sensitive diagnostic
techniques. For this purpose blood samples were collected from the jugular vein of experimental
ruminants and rapidly saved in Eppendorf tubes (10ml) by mixing anticoagulant “400µL of 0.5
M EDTA”. The workers also presented a questionnaire to collect complete information about the
characteristics of experimental animals such as age, sex, breed, species, location and tick
population etc. Blood samples were processed for PCR and blood Films. The results of PCR and
microscopic examinations highlighted 18% 27/144 (18 cattle and 9 buffalo) with 541-bp for b.
bovi, and 4/144 (3%) respectively whereas the highest prevalence of b. bovis (83%) was
observed in 5 districts (out of 6 districts). Mosqueda et al. (2012) reviewed the current status of
babesiosis and declared the disease as a global problem having great impact on livestock industry
particularly beef and meat industry in the sense i.e. costs of treatment, vector control, mortality,
detection of disease and prevention. They stated that in 1888 Viktor Babes was the pioneer of

140
Babesia bovis who reported 1st time in Romanian cattle with the help of thin blood smears where
as in 1893, Theobald Smith & Frederick Kilborne identified the vector responsible for the
transmission of babesiosis as a tick species Boophilus (Rhipicephalus) annulatus. The numbers
of protozoan increases during acute phase of babesiosis which can be easily observed easily by
blood smears but chronic cases with low level parasitemia are problematic and required more
advanced techniques. They described briefly the different methods used for the detection of
disease includes Microscopic examination (thin/thick Blood Smears, haemolymph Smears and
brain smears), immunological techniques (Indirect Fluorescent Antibody Test,
immunochromatography test, Enzyme-Linked Immunosorbent Assay,) molecular techniques
(DNA Probes, Polymeraze Chain Reaction, Reverse Line Blot Hybridization, Real Time PCR,
Loop Mediated Isothermal Amplification) Biological/serological/immunological tests used for
DNA identification/amplification are great achievements & claimed to be the fastest, sensitive
and more authentic. Chulmin et al. (2007) studied two TaqMan-based real-time polymerase
chain reaction (PCR) assays devised for the detection of two bovine Babesia parasites, B. bovis
and B. bigemina, for their diagnostic utility using cultured parasites and 92 field bovine blood
samples collected from cattle living in Brazil. The real-time PCR assays were compared with
previously established nested-PCR assays. The detection limits of both B. bovis and B. bigemina
real-time PCR assays were identical at the value of 2.5 parasites/µL of the infected blood. When
92 field bovine blood samples were tested using the real-time assays, B. bovis positive signals
were observed in 30 samples among 31 B. bovis positive blood samples in the nested-PCR assay
(96.9% sensitivity and 100% specificity), whereas the B. bigemina real-time PCR assay could
detect the parasite from all of 45 B. bigemina positive blood samples in the nested PCR assay
(100% sensitivity and specificity). The real-time assays using the TaqMan-system can therefore

141
be practically implemented in the epidemiologic survey for bovine babesiosis. Further studies
will be necessary to investigate the clinical value of this technique, especially for the quantitative
detections of the parasites.
A comparative study was conducted by Durrani and Kamal (2008) to highlight the
efficacy of microscopic examination and PCR among 100 Frisian cattle effected with protozoan
diseases i.e. Theileriosis, and Babesiosis. For this purposes they collected 100 blood samples
from Frisian cattle kept under different management conditions at Pattoki, Pakistan. All the
experimental animals were kept in close observation and recorded the following abnormalities;
temperature, fall down of milk production, tick population/infestation, sub mandibular/sub
scapular lymph nodes swelling, haemoglobinuria & sudden death. This group of animals was
declared as diseased-animals whereas 20 animals additionally selected were kept as non-diseased
animals. For microscopic examinations slides were prepared, fixed and stained with Giemsa
according to procedure prescribed by Benjamin (1986) whereas for PCR, blood samples (3ml)
were taken from the jugular vein of all experimental animals in containers with EDTA
anticoagulant. The DNA Extraction Kit “PUREGENE® USA, GENTRA” was used for the DNA
extraction of targeted animals and processed for further analysis with the help of “Agarose gel
electrophoresis” & “spectrophotometer”. The following primers sets were used; Primer set A
(Theileria annulata specific) = N516 (Forward) GTAACCTTTAAAAACGT whereas N517
(Revers) = GTTACGAACATGGGTTT. Primer set B (Theileria specific) = 989 (Forward)
AGTTTCTGACCTATCAG while 990 (Reverse) TTGCCTTAAACTTCCTTG. Primer set C
(Babesia bovis specific) = GAU9 (F) CTGTCGTACCGTTGGTTGAC and GAU10 (Reverse)
CGCACGGACGGAGACCGA. Primer set D (Babesia bigemina specific) = GFU5 (Forward)
TGGCGGCGTTTATTAGTTCG while GFU6 (Revers) = CCACGCTTGAAGCACAGGA. For

142
vector study 100 ticks (5 ticks/cattle farm) were collected from targeted animals and processed
for further identification according to standard procedure prescribed by Soulsby 1982. The
results of microscopic study pointed out total 21/100 (21%) positive samples for
hemoprotozoanz i.e theileria 14/ 21 (66.6%), babesia 9/21 (42.8%), b. bigemina 6/9 (66.66%), b.
bovis 3/9 (33.33%). The sensitivity and specificity of microscopic blood slides were noted as
21% and 75% respectively. Blood parameters of effected animals revealed anemia, abnormality
of lymphocytes and monocytes. Increased values of MCV/MCH whereas decreased value of
MCHC value was noticed among blood samples taken after 20 days. Similarly decreased values
of total RBC/WBC counts, PCV & Hb concentration was also observed. Samples processed for
PCR revealed 60/100 (60%) positive for hemoparasites (T. annulata 36/60=60%, babesia species
20/60=33.33 % out of which b. bigemina 13/20=65% and b. bovis 7/20=35%) whereas the
specificity and sensitivity was observed 85% and 60% respectively. Among 100 collected vector
samples Hyalomma was found the most prevalent tick (15%) while other vectors identified;
Boophilus, Haemaphysalis and Rhipicephalus with prevalence rate 12%, 5% and 3%
respectively. Similarly in another study about 43 field cases of cattle of both sexes for clinical
and laboratory investigation of parasites in cattle was studied Hussein et al. (2007). Clinical and
laboratory examination revealed about 20 animals were suffering from theileriosis and 8 animals
from babesiosis. Blood smears were prepared directly from the ear vein of all animals and lymph
smears were prepared from suspected cases of theileriosis. The blood smears were used for
differential leukocyte count, while lymph smears were used for observation of Koch’s blue
bodies. Two blood samples from both clinically healthy and diseased cattle were collected from
jugular vein, one with anticoagulant for examination of haematological picture and the other
without anticoagulant for the separation of serum which used for biochemical analysis. Clinical

143
examination revealed enlargement of superficial lymph nodes, fever, congested mucous
membranes, corneal opacity and emaciation in cases of theileriosis, while fever, paleness of
mucous membranes and brown coffee urine were common clinical findings in cases of
babesiosis. Haematological findings revealed that cattle suffered from theileriosis showed
normocytic hypochromic anemia, while those suffered from babesiosis showed normocytic
normochromic anemia. Biochemical findings revealed that cattle infected with theileriosis and
babesiosis showed decreased serum levels of albumin and total proteins with increased serum
globulins. The serum level of glucose was significantly decreased in cattle suffered from
theileriosis and babesiosis. Serum level of aspartate aminotransferase (AST) showed significant
increase in both theileriosis and babesiosis, while the Serum level of alanine aminotransferase
(ALT) was significantly increased only in case of babesiosis. Serum level of gamma glutamyl
transferase (GGT) was significantly increased in both theileriosis and babesiosis. Cattle infected
with theileriosis showed significant decrease in serum level of iron only, while those suffered
from babesiosis showed significant increase of both iron and copper serum levels. The serum
level of total iron binding capacity was significantly decreased in theileriosis. They concluded
that theileriosis and babesiosis are associated with impairment and alteration of liver function.
2.6: HEMATOLOGICAL STUDY
The effect of babesoisis on different blood parameters among 144 animals (105 cattle)
and (39 buffaloes) at Districts, Multan, Layyah, Muzaffar Garh, Bhakar, Bahawalnagar and
Vehari, Pakistan was measured by Samreen Zulfiqar et al. (2012). The blood parameters were
analyzed with the help of i.e. glucose concentration (ACCU-CHEK® Active blood glucose
meter, Roche, Germany), Hemoglobin (Metertek SP- 8SO spectrophotometer, Korea & Randox

144
Ltd. Laboratories diagnostic kit UK. Whereas for serum biochemistry (cholesterol, aspartate
transaminase (AST), alanine transaminase (ALT) and lactate dehydrogenase (LDH)) APEL PD-
303S spectrophotometer, Japan) & diagnostic kits by Spinreact was used to find out the required
data. The results of the study highlighted a decreased amount of hemoglobin & glucose values
among diseased calves. Similar statement was also presented by Durrani et al. (2006), Yuksek et
al. (2006) and Col & Uslu (2007) and hypothesized that, this might be because of the excessive
consumption of glucose by parasites and also damages to liver caused by babesiosis. It is true
that the serum Aspartate Transaminase (AST) and Alanine Transaminase (ALT) concentrations
are closely related to liver function and an elevation in serum Aspartate Transaminase
concentration may lead to babesiosis in cattle. They observed Low serum ALT concentration in
diseased calf whereas an increased in serum ALT concentration was observed in non-infected
calf group. Similarly higher serum ALT concentration was noticed among infected cattle while
low serum ALT concentration was observed in cattle negative for parasitic infection.
Comparatively a clear rise in serum Aspartate Transaminase (AST) level was detected in cattle
and calves infected with parasites than in non-infected cattle and calves. The rise in serum
Aspartate Transaminase and Alanine Transaminase level among infected cattle and calves is the
indicator of liver dysfunction. The increased level of serum Lactate Dehydrogenase
concentration (a cytosolic enzyme produced in all the body tissues active in glycolysis) was
detected in calves infected with parasites which is the indicator of liver dysfunction. Sajjad &
Musarrat (2001) estimated heritability in Bhagnari, Droughtmaster and their crossbreeds using
25 years data on birth weight records (1317 records from 27 sires) from Beef Production
Research Center, Sibi, Balochistan Pakistan. Birth weight averaged 24.52 ± 4.40 kg. The trait
was moderately heritable when analysis was performed using data from all the genetic groups.

145
The estimate varied from 0.257 to 0.381 with model used. When separate analyses were
performed for different genetic groups such as Bhagnari (BN), Droughtmaster (DM), BN x DM
(Cl)' Cl x BN (C 2) and C2x Droughtmaster (Cl)' maximum heritability was observed for
Droughtmaster (0.75) while it was minimum (0.08) for Cl animals. In purebred Bhagnari, birth
weight was only 13% heritable. Improper recording of birth weight, sire for the calf, and
environmental factors such as feed and fodder availability could be some of the reasons for such
an estimate. Key words: Bhagnari cattle, birth weight, Droughtmaster, heritability.
2.7: THERAPEUTIC TRIALS
Ticks are the most common/important ectoparasites act as vectors for a series of diseases
such as babesiosis and theileriosis, causing heavy losses in livestock production particularly in
developing countries where control measures are not practiced regularly. There are so many
drugs available in the market used against the tick and borne diseases, but because of the high
cost and toxic effects convinced the researchers to find out another cheapest and safe alternative
products. In this connection Webb and David (2002) investigated the extract of neem
(Azadirachta indica) seed against tick infestation in 18 cattle of Tswana/Brahman/ Simmentaler
breeds in cattle farms at Serowe village, Gaborone, Botswana (November 1998 to December
1999). Neem seed kernels (collected from ripe seeds) dried in the sun, crushed with the help of a
wooden mortar & pestle to make sure the dried seeds in powder form and finally sieved (through
a 30 mm mesh) and mixed well in water. Apart from this “oil-extraction apparatus” technique
was also used. Different parts of the body; perineal area, sternum, udder belly, external ear and
scrotum were studied and treated with 5% water extract (tropically applied) @ 5 g/kg while the
control group was sprayed with simple tap water. They highlighted a marked lower tick counts
among cattle presented to neem extract than in animals treated with tap water. Higher tick

146
infestation was noticed during the months of summer particularly in rainy season while
Amblyomma hebreaum was found as the most common tick species among all three breeds
during the months of summer than dry seasons. Lower population of R. evertsi was seen among
neem treated group summer i.e. Dec 1998, March 1999 and Dec 1999 as compare to control
group. A large population H. truncatum was detected in Simmentaler cattle (February and
October 1999) Brahman/Tswana breeds. The presence of B. decoloratus sults was noticed during
the whole study period on both the Simmentaler/Brahman breeds but higher population was
observed during the months of March and September. Neem decreased the population of
engorged ticks. Less number of ticks was noted in indigenous Tswana cattle might be because of
naturally tick resistance than the Brahman/Simmentaler cattle. Generally the ticks were noted on
the whole body regions but most commonly on long hair followed by sternum, perineal region,
belly and udder area. As the Simmentaler breed had also the longer hairs, hypothesized that the
cattle with long hair are more susceptible to tick infestation. The tick population was noticed
among both the sexes of targeted cattle with no difference, however Tswana bulls showed high
resistance as compare to cows. Henri and Gorenflot (2006) reviewed comprehensively the
epidemiology and uses of drugs against babesiosis and stated that more than 100 babesia species
have been recognized causing problems in of vertebrate/invertebrate hosts. These protozoans are
distributed into two groups small and large size babesia i.e. b. bovis, b.divergens & b.microti
(1.0–2.5 μm) are small whereas b. bigemina (2.5–5 μm) are the examples of large babesia spp.
During the last few decades a series of drugs were used against the treatment of babesiosis but
quinuronium sulpha, amicarbalide isothionate and diminazene aceturate were most commonly
used in Europe. After long struggle (1970s) another efficient drug “imidocarb dipropionate” with
trade name “Imizol” of Schering-Plough was launched and get rapidly the top ranking in terms

147
of best drug of choice for the treatment as well as for prophylaxis (3 to 6 weeks) (repeat dose) of
babesiosis. The rout of administration for “imidocarb dipropionate” is I/M or S/C but not I/V.
The top ranking compounds used against bovine babesiosis are, Diminazene diaceturate,
imidocarb and amicarbalide with dose rate, 3–5 mg/kg, 1–3 mg/kg, and 5–10 mg/kg respectably.
Initially Trypan blue was considered to be the more effective drug used against bovine babesiosis
(caused by b. bigemina) but less effective against babesia bovis whereas Imidocarb was found
more effective against both the species. It can also be used as chemo-prophylactic which has the
ability to control babesiosis for two months.
The efficacy of Neem (Azadirachta indica) leaves (soaked in 3-4 Liters of water for 2
days and then used topically) was compared with modern antiparasitic drugs Ivermectin and
doramectin against cattle tick infestation by Ramzan et al. (2008). The study was conducted
among 300 cattle (regardless of breed, age and sex) randomly selected from different areas of
Dera Ghazi Khan Pakistan. All the cattle were screened out for tick infestation and finally
selected 40 cattle for therapeutic trial and equally distributed into 5 groups (A, B, C, D and E).
Group ‘A’ was given Ivermectin 1% (Ivomac of Marial private Ltd, s/c @ 0.2 mg/Kg b. wt.),
Group “B” was treated with doramectin 1% (Dectomax of Pfizer, Ltd. Pakistan, s/c @ 0.2 mg/Kg
b.wt.), Group ‘C’ was given Neem (Azadirachta indica) leaves (in powder form) @ 40
gm/100Kg b. wt.) Group D was kept as positive control (no treatment given) whereas Group E
was kept as negative control (healthy). The efficacy of drugs was analyzed at day 7 and 14 by the
formula.
Percentage efficacy = No. of animals recovered x100
No. of Animals treated
The overall prevalence of tick infestation was noted as 108/300 (36%) with most prevalent tick
species, Boophilus microplus, Boophilus annulatus, and Hyalomma aegyptium. The prevalence

148
of mites (Psorcoptes bovis, and Sarcoptes scabies vor bovis) was 24/300 (8%) while lice
(Haematopinus tuberculates and Linognathus vituli) infestation was 15 (5%). The results of
therapeutic trial (at day14) declared ivermectin as the most effective drugs against tick
infestation in cattle and showed 100% efficacy followed by doramectin (60%) and Neem (0%).
In Hausa language Nigeria, invitro toxicity of neem (Azadirachta indica A. Juss, family:
Meliaceae, Dogon yaro) seed oil was tested by Choudhury (2009) against the larvae of a single-
host tick, Boophilus decoloratus (synonym = blue tick). The 20, 40, 60, 80 and 100%
concentrations of neem seed oil were found to kill all the larvae (100% mortality) after 27, 27,
27, 27 and 24 h respectively. Similarly, Nasreen et al. (2010) conducted a Therapeutic trail in 38
buffaloes naturally infected with babesiosis, anaplasmosis and theileriosis. The experimental
animals were distributed into 4 groups A=10, B=10, C=10, and D=10 with babesia, anaplasma
and theileria infection while infected control i.e. anaplasmosis =4, babesiiosis and anaplasmosis
= I each, babesiosis = 2, and theileriosis = 2 respectively. Group (A) was further distributed into
two groups, A1=5 animals infected with anaplasmosis while Group A2=5 animals
anaplasmosis+babesiosis (mixed infection).
Categorization of infection: Thick blood films were categorized by plus system suggested in
Basic Laboratory Methods in Medical Parasitology, by WHO.
+ (Light) 1-10 parasites per 100 thick blood film fields.
++ (Moderate) 11- 100 parasites per 100 thick blood film fields
+++ (Heavy) 1-10 parasites per thick blood film field
++++ (Severe) more than 10 parasites per thick blood film field.
2.8: ECONOMIC LOSSES

149
A study was designed by Taylor (1983) to collect data about babesiosis clinically
observed from different sources i.e. farms, veterinary practices and the drug companies involved
in babesicide and showed 4520, 3923 and 5600 clinical cases/ year respectively. The overall
mortality rate was noted as 17.4%. Annual costs for treatment i.e. 31,000 pounds / annum, loss of
production and labor costs were calculated as 250,000 pounds / annum.
Globally the importance of ticks cannot be neglected because of their disease
transmission ability which causes heavy economic losses, sucking a huge amount of blood and
loss of production in livestock and wild animals. In Australia (1974) losses caused by cattle tick
(Boophilus microplus) were calculated as USD 62 million while in Brazil, USD 2 billion/ year
(Springell, 1983 and Grisi et al. 2002) but it can be controlled by an efficient management
program. Rajput et al. (2006) presented two types of losses caused by tick;
a. Ticks directly effect on the host body
Tick infestation in domestic animals may create problem and allow to suck a huge
amount of blood that may cause weight loss and reduced milk production followed by anemia
whereas tick bites may effect on the quality of hides.
i. Tick-bite causes paralysis
It is characterized by an acute ascending flaccid motor paralysis caused by the insertion
of toxin by certain ticks while feeding such as (paralysis caused by Dermacentor andersoni)
(sweating sickness by Hyalomma truncatum) (Australian tick paralysis by Ixodes holocylus) and
(tick toxicosis caused by Rhipicephalus species). It causes severe problem during the months of
late winter and spring when adult ticks become more active, but can cause problem at any time
with favorable warm and humid environment. Tick species i.e. Ixodes holocyclus and
Dermacentor andersoni has been identified as the causative agents for tick paralysis in cattle.

150
ii. Physical damages to host body
The main mission of tick attachment to the host is to get food. This struggle causes tick
worry which may leads to restlessness, body irritation and decreases weight gain. Their bites
causes hide injury which decreases commercially the value of hides.
b. Carrier of pathogens
Ticks are the vector of different pathogens which make possible transfer of different
diseases from one host to another during feeding meal. The most common pathogens causing
serious diseases in animals are Babesia, Anaplasma and Theileria etc.
The importance of babesiosis and economic losses was reviewed by Bock et al. (2004)
the global importance of baesiosis causing heavy losses to cattle industry. Among babesia
species, Babesia bovis (synonym= b. argentina, b. berbera, b. colchica) and B. bigemina
followed by b. divergens (synonym= b. caucasica, b. occidentalis, b. karelica) and B. major
have been recognized as the most common protozoan causing bovine babesiosis mos common
pathogens for commonly found throughout the world. Many workers studied the economic value
of babesiosis and assumed about1.2 billion cattle are exposed to babesia infection. Cattle breeds
play an important role in the severity of babesiosis. The severity of babesiosis in Indigenous
cattle (because of naturally resistant to babesiosis) is not as severe as in exotic cattle. Babesiosis
may increase the cost of production in terms of international trade, mortality, abortions in
female, decreased meat/milk production, purchase of drugs/acaricide and vaccines. By using a
spreadsheet model, McLeod and Kristjanson (1999) calculated the cost against babesia and
anaplasma infection in term of losses & control i.e. US$16.9m/annum in Australian cattle
industry (annual tick worry cost is about US$6.4m) whereas in Kenya (5.1), Zimbabwe (5.4),

151
Tanzania (6.8), South Africa (21.6), China (19.4), India (57.2), Indonesia (3.1) and in Philippines
0.6 million US dollars annually.

152
Chapter- 3
MATERIALS AND METHODS
The present study was planned to evaluate the epidemiological, therapeutical, and
hematological aspects of babesiosis in cattle in Balochistan Province. The study was scheduled
for a period of 12 months (September 2011 to August 2012) in two districts of Balochistan i.e.
District Quetta and District Sibi.
3.1: BALOCHISTAN PROVINCE
Pakistan comprises on four provinces, Punjab, Sindh, Khyber Pakhtoonkhwa and
Balochistan (figure 3.1.1). Among these Balochistan is the biggest province over an area of
347,190 Sq. Km. forming 43.6 % of the total area of Pakistan (Figure 3.1.2). Livestock is the
leading component and creates more than 40% to the economy of the province and 52% share in
province GDP. small ruminants are the major source of production i.e. sheep constitute 46% and
goats 23% of Pakistan’s population of sheep and goats, respectively and about 80% population
(mostly in rural area) directly or indirectly involved in livestock rearing activities, contributes
about Rs. 20 billion i.e. meat 40 %, milk 35 %, eggs 13 %, skin, hides and wool 10 % and other
production 2% (Anonymous, 2008) but 2.3 million cattle and 300,000 buffaloes (Economic
Survey, 2008-09) cannot be neglected which is increasing at the rate of 1 percent/year (Shafiq
and Kakar, 2006). Mostly mixed farming system i.e. sedentary, nomadic and transhumant
systems are traditionally practiced in the province.

154
Figure 3.1.2: Map of Balochistan province showing the targeted districts.
References:
1 = QUETTA 2 = Nushki 3 = Chaghi 4 = Killa Abdullah
5 = Pishin 6 = KillaSaifullah 7 = Zhob 8 = Sherani
9 = Musakhail 10 = Loralai 11 = Ziarat 12 = Harnai
13 = SIBI 14 = Kohlu 15 = Bakhan 16 = DeraBugti
17 = Jaffarabad 18 = Naseerabad 19 = JhalMagsi 20 = Kachhi
21 = Mastung 22 = Kalat 23 = Kharan 24 = Washuk
25 = Khuzdar 26 = Pangur 27 = Awaran 28 = Lasbela
29= Kech 30 = Gwadar
MAP OF BALOCHISTAN PROVINCE
SHOWING TARGETED DISTRICTS
30
29 28
27
26
25
24
19 23
20 16
12 15
10
9 6
17
3
2
22
21
18
14 13
11
8 7
5 4
1
▲▲
▲▲
▲▲
▲▲
▲
DISTRICT QUETTA ►►►►►►►►►►►
DISTRICT SIBI

155
3.2: PROFILE OF DISTRICT QUETTA
The word “Quetta” derived from the “Pashtoo word Kwatta” mean “a fort” because of
close attachment with an
historical fort known as
“Miri”. During the period
of British Government,
Quetta valley gets more
attention because of its
excellent geo-strategic
importance and beautiful
locations. They kept the
valley very clean,
established a garrison
town and extended the
roads/railway network to
neighboring countries i.e. Iran & Afghanistan but unfortunately on the 31st May, 1935 an
earthquake destroyed the Quetta city completely. However today Quetta is the Headquarter of
Balochistan province bounded on different districts i.e. North = district Pishin, East = Ziarat,
South = Mastung while East = district Killa Abdullah. Topographically it lies between (300 - 03’
& 300 -27’ North) and (660 - 44’ & 670 - 18’ East) with an altitude of 1700 Meters (Figure 3.1.3).
The total geographical area of the District is about 2653 Km2 which is generally covered with
different mountain i.e. (Mashlakh), (Chiltan), (Murdar) and the Zarghoon. The elevation of hills
may vary from about 1254-3500 Meters. Because of its natural beauty the people used to call it
Figure 3.2:
Map of
District
Quetta
DISTRICT QUETTA

156
little Paris/small London, but due to rapid increase in human population/urbanization and influx
of Afghan/Indian refugees converted into an over-populated city. Generally the climate is dry
with cold winter whereas summer ranges (32 to 35 ºC) and “July” is considered to be the hottest
month of the year. It is situated outside the range of the monsoon with scanty and irregular
rainfall region (Anonymous, 1999). The breeds of cattle i.e. Holestien Friesian, Bhagnari, Red
Sindhi, Lohani, Sahiwal, Thari, and Crossbred while Buffalo breeds i.e. Kundi and Nili Ravi are
commonly found in the area. Similarly some important species of plants are also found in the
area i.e. Astragalus stocksic, Artimisia maritime, Crysopogoneri aucheri, Cymbopogonjawar
ancusa & Nepetajuncea etc. (Islam et al. 2008).
3.3: PROFILE OF DISTRICT SIBI
Sibi (Figure 3.1.4) is the
divisional headquarter of the Sibi
division which was established in
October 1903 stretched about 7,796Sq
Km, bounded on different districts i.e.
North = Ziarat, North-east = Loralai,
East & South-east = Kohlu, South &
South-west = Bolan whereas North-
west = Mastung & Quetta districts.
Topographically Sibi lies from (29°-
19° to 30° to 36' North latitudes) and (67° - 12' to 68° - 34' East longitudes). A major part of the
Sibi falls in the agriculture-ecological zone-I and plain areas is no higher than 150 Meters above sea
level and considered to be one of the hottest areas of the Indo-Pak sub-continent. Agriculture and
Figure
3.3:
Map of
District
Sibi

157
livestock are the main assets of the district. In this connection an historical and cultural festival “Sibi
Mella” is being celebrated every year where livestock owners from throughout the country
participate with full excitement. Other events include, cultural/horse & cattle shows/livestock market
and folk songs are arranged during the week of festival (Anonymous 1999). The following steps
were taken for the success of the study.
3.4: Phase 1. EPIDEMIOLOGICAL STUDY
Epidemiological study was carried out in two Districts Quetta and Sibi to find out the
status of babesiosis among different groups of Bhag Nari, Holstein Friesian and Crossbred cattle.
For this purpose field and experimental studies were designed and distributed into four seasons
i.e. summer (May, June, July, and August), winter (November, December, January and
February), autumn (September and October) and spring (March and April) (Figure 3.4).
Conducted meetings with local farmers and interviewed through questionnaire (Annexure 3.4) to
find out the up-to-date situation of livestock in the area.
The following epidemiological parameters were studied during the course of study.
3.4.1: PREVALENCE
The rate of prevalence of disease regardless of new or old cases in each targeted area for
a period of one year was calculated with the help of following formula as described by
Thrusfield (1986).
Prevalence = Number of cases of disease present in the population at a specific time x 100
Total population at the specified time period and in the same area

158
Figure 3.4: SAMPLE COLLECTION FLOW CHART
Total Samples Size=
1200
District Quetta = 600 District Sibi= 600
Winter = 150
50 sample per breed
Autumn = 150
50 sample per breed
Summer= 150
50 sample per breed
Spring = 150
50 sample per breed
BhagNari, Holstein Friesian and Crossbred cattle =
200 samples per breed
159
3.4.2: Morbidity Rate
The total number of diseased animal among each group was noted in each district with
the help of formula given below;
Total number of diseased animals due to babesiosis______________ x 100
Total No of cattle population during the specific time interval in area
3.4.3: Mortality Rate
The number of deaths among animals groups in each district was calculated by using the
following formula;
Total number of deaths due to babesiosis x100
Total No of cases of babesiosis
3.5: SELECTION OF ANIMALS
3.5.1: Field Study
Field study was carried out in two districts of Balochistan province i.e. District Quetta
and District Sibi to evaluate the status of babesiosis among different groups of cattle kept under
different management and environmental conditions. For this purpose 600 cattle from each
district (200 Bhag Nari, 200 Holstein Friesian, and 200 Cross bred) were selected randomly for
breed, age, sex and seasonal study factors (Tables 3.5.1.1, 3.5.1.2 and 3.5.1.3). The study was
carried out in 20 villages, 10 villages in each district (randomly selected). Farmers/related
persons were interviewed through Questionnaire. Conducted meetings with local farmers,
livestock traders and villagers at different places of the targeted villages by applying different
“Participatory Rural Appraisal” techniques as applied by Bolajoko (2011) i.e. semi structured
interview, open ended questions, probing etc. to make sure the flow of additional information

160
about the current situation of livestock in the area. Screening of cattle was concluded on the basis
of clinical signs and blood smears examination while PCR was used for further confirmation of
babesia species. Vector study was also carried out to find out the status foremost disease vector
in the area.
Table 3.5.1.1: Breed and age wise distribution of BhagNari, Holstein Friesian and
Crossbred Cattle in each District.
Group of
animals
Sub-group of
animals
No. of Samples examined Total
BhagNari Holstein
Friesian
Crossbred
Young
animals less
than 12
months
Less than 6
months
42 42 42 126
Up to 9 months 40 40 40 120
Up to 12
months
40 40 40 120
Adult group
of animals
(Over 12
months to
onward)
Up to 2 years 26 26 26 78
Up to 3 years 26 26 26 78
Over 3 years 26 26 26 78
Grand Total 200 200 200 600

161
Table 3.5.1.2: Sex wise distribution of Bhag Nari, Holstein Friesian and Crossbred Cattle in
each District.
Group of animals Sub-group of
animals
No. of Samples examined
Male Female
Young animals less than 12
months
Less than 6 months 12 30
Up to 9 months 10 30
Up to 12 months 10 30
Adult group of animals (Over 12
months to onward)
Up to 2 years 6 20
Up to 3 years 6 20
Over 3 years 6 20
Grand Total 50 150
Table 3.5.1.3: Season wise distribution of Bhag Nari, Holstein Friesian and Crossbred
Cattle in each District.
Seasons No. of samples examined
Spring 150
Summer 150
Autumn 150
Winter 150
Grand Total 600

162
3.5.2: Experimental Study
Experimental study was carried out in summer season (May, June, July, and August) at
Quetta cattle farm, District Quetta. For this purpose 148 (babesia free) cattle were selected with
the help of clinical signs, blood smears examination and PCR. After confirmation, 108 disease
free animals (36 from each breed) were separated, maintained and then presented to infected
ticks by “ear bag method for experimental infection. This group of animals was labeled as
“infected-group”. The group was further distributed into sub-groups i.e. Young animals (less
than 6 months, 9 months and 12 months) and adult animals (up to 2 years, 3 years and above 3
years of age) (Table 3.5.2). Blood samples were collected on weekly basis during the months of
May, June, July, and August both pre and post infection. The remaining 40 animals free from
babesia infection were recollected and maintained for therapeutic trial. This group of animals
was named as “non-infected group”.
Table 3.5.2: Distribution of experimental animal groups.
Group of
animals
Sub-group of
animals
No. of Samples examined Total
Bhag Nari Holstein Friesian Crossbred
Young animals
less than 12
months
Less than 6
months
6 6 6 18
Up to 9 months 6 6 6 18
Up to 12 months 6 6 6 18
Adult group of
animals (Over
12 months to
onward)
Up to 2 years 6 6 6 18
Up to 3 years 6 6 6 18
Over 3 years 6 6 6 18
Grand Total 36 36 36 108

163
3.6: SAMPLES COLLECTION
Blood samples were collected aseptically from the jugular vein of targeted animals
following the procedures by Colse (1986). For this purpose 10 ml disposable syringes were used
and transferred immediately to Vacutainers tubes containing anticoagulant Ethylene diamine
tetra acetic acid (EDTA) and dispatched immediately to laboratory under refrigeration condition
for further process. During field study 400 tick specimens (200 from each District) were
collected randomly during the months of summer season from the selected animals to find out
the most prevalent tick species in the area, their predilection sites and identification of species in
the area. Blood smears were prepared both from healthy and infected animals, while 3 ml blood
from each samples were processed for PCR analysis.
3.7: STORAGE OF SAMPLES
Provincial Disease Investigation laboratory, Quetta was primarily used for the storage of
all the samples collected during field and experimental studies which were then transferred to the
Laboratory of Department of Clinical Medicine & Surgery, University of Veterinary and Animal
Sciences, Lahore, following the standard laboratory precautions for further process.
3.8: TICKS STUDY
All the tick specimens were kept under keen observation for taxonomy, tick
counts/density and economic losses in the targeted area. For this purpose the body conditions of
the targeted animals were properly checked for any kind of wound and abnormalities and also for
the presence of vectors on the body particularly on the head, neck, bally, legs, tail and udder
regions. Tick specimens were removed/collected carefully from all selected cattle (prior to
dipping of animals) in clean tubes and covered with cotton wool and shifted immediately to the

164
laboratory for further examination. For this purpose forceps method was used as described by
Walker et al. (2003) by gripping the capitulum firmly/lightly with the help of a steel forceps and
turned the vector over on its back and then pulled out. The precautionary measures were
followed as described by Soulsby (1982), Teglas et al. (2005) and Zafar et al. (2006) to avoid
damages to vector body parts. All the specimens were properly labeled with their respective
regions, host breeds and date and preserved in 70% formalin with 5% glycerol for further
process.
3.8.1: The Prevalence of tick infestation
The prevalence of tick infestation in both districts was calculated according to formula
presented by Thursfield (1995).
Prevalence = Number of animals found positive x100
Total Number of animals sampled
3.8.2: Severity of tick infestation
To evaluate the density of tick, the whole body of selected animals were examined for
tick infestation and scored as described by Pusterla et al. (1998) i.e. mild (<10 ticks/animal),
moderate (10 to 30 ticks/animal), or severe (>30 ticks/animal). The animals found positive for
tick infestation were separated and tagged for further examination.
3.8.3: Identification of tick vector
The tick samples were processed for permanent mounting over clean microscope slides
and stained by Acid Fuchsine Method (Annexure 3.8.3.1 and 3.8.3.2). The Identification of
vectors was made with the help of Pictorial Key as describe by Keirans and Litwak (1989),
Jongejan and Uilenberg (1994), Bock et al. (2006) and Walker et al. (2007). The difference
between hard and soft ticks (Annexure 3.8.3.3) was kept in mind as mentioned by Urquhart et al.
(1996) and Kakarsulemankhel (2010).
165
3.8.4: Rearing of live ticks on rabbits for experimental animals
Among laboratory animals, rabbits are considered to be the most important and valuable
animals widely used for the rearing of ticks for research purposes because of having king-size
ears along with superficial veins providing favorable condition to blood meal (Ogunji and
Dipeolu 1977). In present study white rabbits were used for the rearing of live infected hard
ticks. The presence of babesia within the tick body was confirmed by PCR as previously
described by Durrani et al. (2008). The ticks were attached to the body of rabbits by “ear bag
method” and permitted to nourish for four days. The purpose of method was to motivate the
development of babesia infection within the tick body. These infected ticks were then used for
experimental infection.
3.9: DIAGNOSIS OF BABESIA
The appearance of babesia infection was primarily observed on the basis of presence of
vectors, clinical signs and blood smear examination under oil immersion lens (100X)
recommended by Soulsby (1982). The samples were also processed through Polymerase Chain
Reaction as described by Chulmin et al. (2007) and Durrani et al. (2010) for further confirmation
of babesia species.
3.9.1: Smear preparation
Clean microscopic glass slides were used for smear preparation as advised by Soulsby
(1982), Zafar et al. (2006) and kept as clean as possible to avoid any type of contamination. For
this purpose slides were rinsed in 95% methyl alcohol and clean with the help of cloth to make
sure the transparency of slide. A small drop of fresh whole blood was placed on the smooth
surface, near the short end of a clean slide. Placed the short end of second slide (used as a
166
spreader slide) and hold it near the blood drop at an angle of 45˚ until the drop is contacted,
pulled quickly the end of second slide and spread the blood on first slide, thus formed a smear.
Slides were finally allowed to air dry and processed for Giemsa staining (Annexure 3.9.1.1). The
organisms were identified on the basis of morphological characteristics (Annexure 3.9.1.2) as
described by Urquhart et al. (1996), Asif (2005) and Bock et al. (2006).
3.9.2: Polymerase Chain Reaction
All the blood samples collected from field and experimental animals were processed through
PCR for further confirmation of protozoan parasites following the procedure presented by Chulmin et al.
(2007), Durrani and Kamal (2008) and Chaudhry et al. (2010).
The total DNA was extracted from the blood samples collected from all group of animals
Genomic DNA of babesia was quantified from whole blood by gel electrophoresis
Primers optimization
Amplification of DNA
Gel electrophoresis for the detection of PCR band.
3.9.2.1: Primers set
Two sets of primers for B. bigemina and B. bovis were used (Table 3.9.2.1) as formerly
described by Durani et al. (2010) and Chaudhry et al. (2010).

167
Table 3.9.2.1: Sets of primers used to amplify Babesia bigemina and Babesia bovis SSUrRNA
gene sequences.
Primers Primers Sequence Target
position
on
genome
Target region Predicted
Amplicon
Size
Set A Babesia bigemina
GAU5 (F)
GAU6 (R)
5'- TGGCGGCGTTTATTAGTTCG- 3'
5'- CCACGCTTGAAGCACAGGA- 3'
409-428
1532-1515
SSr RNA gene 1,124 bp
Set B Babesia Bovis
GAU9 (F)
GAU 10
(R)
5'- CTGTCGTACCGTTGGTTGAC-3'
5'- CGCACGGACGGAGACCGA-3'
675-694
1215-1198
SSr RNA gene 541 bp
3.9.2.2: Total DNA extraction from samples
For total DNA extraction UltraClean® Blood DNA Isolation Kit (Non-Spin) by MO BIO
Laboratories, Inc. Carlsbad, USA was used.
3.9.2.2.1: Procedure for DNA Extraction
Collected 300 μl blood samples and mixed with 900 μl of Solution G1
Inverted the samples two times and allowed to incubate for 5 minutes at room
temperature

168
During incubation inverted the samples twice
The samples were then centrifuged at 13,000 x g. for 30 seconds. Supernatant was
discarded without disturbing white pellet
Used vortex and resuspended the pellet completely
Added 300 μl of Solution G2
Vigorous pipetting was done to help in the lysis of cells
Added 1.5 μl of RNase A
Inverted the tubes 5 times and then presented to vertex on slow speed for 5 seconds
Added 100 μl of Solution G3
Immediately vertex on high speed for 15 seconds and centrifuged at 13,000 x g. for 3
minutes
Shifted the supernatant in new and clean 2.0 ml collection tube.
Added 300 μl of 100% Isopropanol
Inverted about 15 times and incubated at room temperature for 3 minutes
Centrifuged at 13,000 x g. for I minute
Supernatant was discarded without disturbing pellet
Added 300 μl of 70% Ethanol
Inverted the tube for 5 minutes to wash the pellet
Centrifuged at 13,000 x g. for 30 seconds
Supernatant was discarded without disturbing pellet
Centrifuged for 30 seconds and removed residual supernatant without disturbing pellet
Added 100 μl of Solution G4
Incubated in a 65°C water bath for 40 minutes

169
Genomic DNA in tube was ready and used for further process
3.9.2.3: Preparation of Reaction Mixture
PCR was implemented by producing reaction mixture i.e. 50 mM KCl, 10 mM Tris-HCl,
1.5 mM MgCL2, 200 µM dNTPs, 2.5 U of Taq Polymerase, 20 pmol of each primer, 5 µl of
DNA sample
3.9.2.4: Thermal Cycler Conditions
DNA amplification was carried out in Esco’s Swift Mini Thermal Cycler by Esco
Technologies, Inc. USA. The amplification program was as follows; a first round of 40 cycles
consisting of three steps (30s denaturation at 94°C, 45s annealing at 55°C and 60s
polymerization at 72°C).
3.9.2.5: Gel Electrophoresis
The amplified DNA product was separated by gel electrophoresis on 1% agarose gel by
the protocol given below;
3.9.2.5.1: Gel Preparation
1.35 g of agarose was mixed well in 135 ml of TBE buffer and heated in oven until
the whole agarose was dissolved. The gel was allowed to cool at room temperature
and added 7.5 µl of ethidium bromide.
Shaken vigorously
Transferred the gel into the casting tray, inserted the comb and allowed to cool for 30
minutes
After solidification of gel the comb was removed and the tray was placed properly in
electrophoresis tank filled with TBE buffer.

170
3.9.2.5.2: Sample Loading and running the gel
Mixed 5µl of PCR product with 3µl of DNA loading dye.
The samples were carefully loaded with loading pipette into the wells.
The gel was allowed to run for about 45 minutes at 80 Volts.
3.9.2.5.3: Checking the result
The Gel Doc™ XR+ system by Biorad USA was used to detect the DNA bands.
3.10: Phase 2. HAEMATOLOGICAL EXAMINATION
To evaluate the effect of babesiosis on the haemotology of experimental Bhag Nari,
Holstein Friesian and Crossbred cattle. The blood samples were collected and analyzed for
different blood parameters i.e. hemoglobin concentration, Total Erythrocytes Count, Total
Leucocytes Count, Packed Cell Volume, Mean Capsular Volume, Mean Capsular Hemoglobin
Concentration, For this purpose blood analyzer was used to find out the values of blood
parameters.
3.11: Phase 3. THERAPEUTIC STUDY
The purpose of present study was to find out the cheapest and easily available veterinary
medicines used as substitute to control bovine babesiosis because in Pakistan modern veterinary
medicine used against bovine babesiosis is unaffordable for majority of the livestock owners.
Thus attempt was made to check the efficacy of herbal medicine against bovine babesiosis.
Imidocarb dipropionate was used as standard drug treatment control (Farahna et al 2010). For
this purpose 40 experimental animals (maintained as non-infected group and declared free from
babesia infection) was selected and distributed randomly into four groups A, B, C and D. Each
group comprises on 10 animals. The animals of groups A, B and C were presented to ticks
(infected with babesia species) by “ear bag method” while Group D was kept as negative

171
control. The cattle of Groups A and B were treated with Imidocarb dipropionate (Imizole, ICI
Pakistan Ltd. @1 ml/100 kg body weight I/M once (single dose) and Azadirachta indica (Neem)
decoction @ 56.6 ml/100kg body weight once (single dose) respectively. The cattle of Group C
were kept as positive control (infected non-medicated) while Group D was kept as negative
control (non-infected, non-medicated). The efficacy of drugs was analyzed on the basis of
number of animals recovered, reversal of clinical signs and disappearance of babesia parasites in
the blood smears and PCR on day 3rd, 7th and 10th post medication. The clinical signs of
babesiosis described by Bock et al. (2006) were kept in mind;
Fever up to 42˚C
Increased respiration rate
Muscle tremor low
Anorexia
Unwillingness to move
Anaemia
Jaundice
Depression
Haemoglobinuria
Abortion in female and reduced fertility in bulls (lasting from 6 to 8 weeks) may be seen
because of high fever
Animals may reveal nervous signs i.e. convulsions, head pressing, circling and mania.
3.11.1: The percent (%) efficacy of drugs
The percent (%) efficacy of Imidocarb dipropionate and Neem among different cattle
groups were calculated by using the formula as previously used by (Ramzan et al.2008)
Percent efficacy = No. of animals Cured x 100
No. of Animals treated

172
3.11.2: Preparation of Neem Decoction
About 1 kg fresh leaves (Figure 3.11.2) were measured by electric weighing machine,
placed in a tray and sundried. The leaves were
then grounded into powder form and mixed
well with 1 liter of distilled water. The
mixture was then allowed to stay for about ten
minutes to make sure well absorption of water
with Neem leaves particles. After 10 minutes
the mixture was ready and filtered with the help of a clean cloth for further use.
3.12: STATISTICAL ANALYSIS
The data collected during the course of study was presented to statistical analysis. For
this purpose, computer software program “SPSS version” 16 were used and calculated the results
of data by applying chi square test, ANOVA, Mean, Standard Deviation.
Figure 3.11.2

173
Chapter- 4
RESULTS
The present study was planned for a period of 12 months to highlight the importance of
babesiosis causing heavy losses in livestock. The results of different phases of the study were as
below.
4.1: Phase 1. EPIDEMIOLOGICAL STUDY
Field study was carried out in two Districts, Quetta and Sibi of Balochistan province to
find out the status of babesiosis in different groups of Bhag Nari, Holstein Friesian and
Crossbred cattle.
4.1.1: PREVALENCE OF BABESIOSIS IN DISTRICT QUETTA
The results of this study revealed the prevalence of babesiosis in District Quetta. Cattle
infected with babesia species showed high fever, anorexia, increased respiration, anemia,
jaundice, red urine and weakness. The clinical signs, blood smear examination and PCR showed
the overall prevalence of babesiosis 20.5% (123/600) in District Quetta (Figure 4.1.1 and Table
4.1.1).
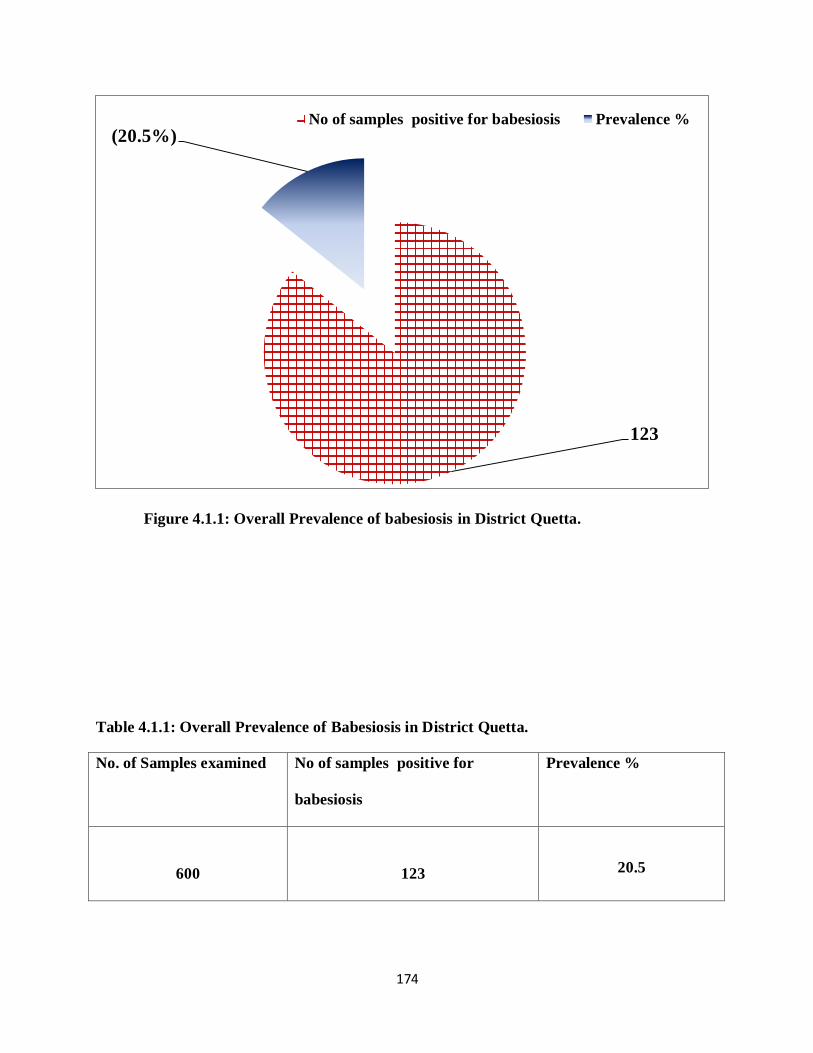
174
Figure 4.1.1: Overall Prevalence of babesiosis in District Quetta.
Table 4.1.1: Overall Prevalence of Babesiosis in District Quetta.
No. of Samples examined No of samples positive for
babesiosis
Prevalence %
600
123
20.5
123
(20.5%)No of samples positive for babesiosis Prevalence %

175
4.1.1.1: Breed wise prevalence of babesiosis in District Quetta
The breed wise prevalence of Babesiosis was noticed higher in Holstein Friesian 34.5%
(69/200) followed by Crossbred cattle 15.5% (31/200) while the lowest prevalence rate 11.5%
(23/200) was recorded in Bhag Nari cattle breed (Figure 4.1.1.1 and Table 4.1.1.1). Statistically
highly significant difference (P<0.05) was observed in the prevalence of babesia infection in
different breeds of cattle.
Figure 4.1.1.1: Breed wise prevalence of babesiosis in District Quetta.
Table 4.1.1.1: Breed wise prevalence of babesiosis in District Quetta.
Breeds No. of
Samples
examined
No of samples
positive for
babesiosis
Prevalence
%
P value
Bhag Nari 200 23 11.5
0.00001* Holstein Friesian 200 69 34.5
Crossbred 200 31 15.5
200 200 200
23
69
31(11.5)
(34.5)(15.5)
0
50
100
150
200
250
Bhag Nari Holstien Friesian Crossbred
No. of Samples examined No of samples positive for babesiosis
Prevalence %

176
4.1.1.2: Overall Age wise prevalence of babesiosis in Bhag Nari, Holstein Friesian and
Crossbred in District Quetta.
To study the age wise prevalence of babesia infection in Bhag Nari, Holstein Friesian
and Crossbred cattle, the selected animals were distributed in two major groups i.e. animals less
than 12 months and above 12 months of age which were further divided into sub-groups i.e. less
than 6 months, up to 9 months, 12 months, 2 years, 3 years and over 3 years. Among these, the
highest prevalence of babesia infection was documented in adult cattle over 3 years of age
whereas the lower most was detected in animals less than 6 months of age (Figure 4.1.1.2 and
Table 4.1.1.2). The statistical analysis showed highly significant (P<0.05) difference of
babesiosis in different age groups of Bhag Nari, Holstein Friesian and Crossbred in District
Quetta.
Figure 4.1.1.2: Overall Age wise prevalence of babesiosis in Bhag Nari, Holstein Friesian
and Crossbred in District Quetta.
126120 120
78 78 78
2 38
2536
49
(1.5
8)
(2.5
)
(6.6
6) (3
2.0
5)
(46
.15
)
(62
.82
)
0
20
40
60
80
100
120
140
Less than 6months
Up to 9months
Up to 12months
Up to 2years
Up to 3years
Over 3years
No. of Samples examined No of samples positive for babesiosis
Prevalence %

177
Table 4.1.1.2: Overall Age wise Prevalence of babesiosis in Bhag Nari, Holstein Friesian
and Crossbred in District Quetta.
Group of
animals
Sub-group of
animals
No. of
Samples
examined
No of samples
positive for
babesiosis
Prevalence
%
P Value
Young animals
less than 12
months
Less than 6
months
126 2 1.58
<0.00001*
Up to 9
months
120 3 2.5
Up to 12
months
120 8 6.66
Adult group of
animals (Over
12 months to
onward)
Up to 2 years 78 25 32.05
Up to 3 years 78 36 46.15
Over 3 years 78 49 62.82
4.1.1.3: Age wise prevalence of babesiosis in Bhag Nari in District Quetta
Among Bhag Nari cattle, the highest prevalence of babesiosis 50% (13/26) was recorded
in animals group over 3 years of age followed by 3 years 30.76% (8/26), 2 years 3.8.4% (1/26),
12 months 2.5 (1/40), 9 months 0% and less than 6 months of age 0% respectively (Figure
4.1.1.3 and Table 4.1.1.3). There was statistically highly significant (P<0.05) difference of
babesiosis among different age groups of Bhag Nari cattle in District Quetta.

178
Figure 4.1.1.3: Age wise prevalence of babesiosis in Bhag Nari in District Quetta.
Table 4.1.1.3: Age wise prevalence of babesiosis in Bhag Nari in District Quetta.
Group of animals No. of Samples
examined
No of samples
positive for babesiosis
Prevalence
%
P Value
Less than 6 months 42 0 0
<0.00001*
Up to 9 months 40 0 0
Up to 12 months 40 1 2.5
Up to 2 years 26 1 3.84
Up to 3 years 26 8 30.76
Over 3 years 26 13 50
42 40 40
26 26 26
0 0 1 18
13
(0) (0) (2.5) (3.84)
(30.76)
(50)
0
10
20
30
40
50
60
Less than 6months
Up to 9months
Up to 12months
Up to 2years
Up to 3years
Over 3years
No. of Samples examined No of samples positive for babesiosis
Prevalence %

179
4.1.1.4: Age wise prevalence of babesiosis in Holstein Friesian in District Quetta.
In Holstein Friesian the severity of babesiosis was noted higher than in other two breeds
of cattle. Among different age groups the higher prevalence was recorded in cattle over 3 years
of age followed by 3 years, 2 years, 12 months, 9 months and animals less than 6 months of age
respectively (Figure 4.1.1.4 and Table 4.1.1.4). The statistical analysis showed highly significant
(P<0.05) difference of babesiosis among different age groups of Holstein Friesian in District
Quetta.
Figure 4.1.1.4: Age wise prevalence of babesiosis in Holstein Friesian in District Quetta.
42 40 40
26 26 26
2 36
17 1922
(4.76)(7.5)
(15)
(65.38)
(73.07)
(84.61)
0
10
20
30
40
50
60
70
80
90
Less than 6months
Up to 9months
Up to 12months
Up to 2years
Up to 3years
Over 3years
No. of Samples examined No of samples positive for babesiosis
Prevalence %

180
Table 4.1.1.4: Age wise prevalence of babesiosis in Holstein Friesian in District Quetta.
Group of animals No. of Samples
examined
No of samples
positive for
babesiosis
Prevalence % P Value
Less than 6 months
42 2 4.76
<0.00001*
Up to 9 months
40 3 7.5
Up to 12 months
40 6 15
Up to 2 years
26 17 65.38
Up to 3 years
26 19 73.07
Over 3 years
26 22 84.61

181
4.1.1.5: Age wise prevalence of babesiosis in Crossbred in District Quetta
Age wise prevalence of babesiosis in crossbred cattle was recorded higher in age group
over 3 years followed by 3 years, 2 years, 12 months while no signs of babesia infection were
seen in both age groups of 9 months and less than 6 months respectively (Figure 4.1.1.5 and
Table 4.1.1.5). There was statistically highly significant (P<0.05) difference of babesiosis among
different age groups of Bhag Nari cattle in District Quetta.
Figure 4.1.1.5: Age wise prevalence of babesiosis in Crossbred in District Quetta
4240 40
26 26 26
0 0 1
79
14
(0)
(0) (2
.5)
(26
.92
) (34
.61
)
(53
.84
)
0
10
20
30
40
50
60
Less than 6months
Up to 9months
Up to 12months
Up to 2years
Up to 3years
Over 3years
No. of Samples examined No of samples positive for babesiosis
Prevalence %

182
Table 4.1.1.5: Age wise prevalence of babesiosis in Crossbred in District Quetta
Group of animals No. of Samples
examined
No of samples
positive for
babesiosis
Prevalence % P Value
Less than 6 months 42 0 0
<0.00001*
Up to 9 months 40 0 0
Up to 12 months 40 1 2.5
Up to 2 years 26 7 26.92
Up to 3 years 26 9 34.61
Over 3 years 26 14 53.84
4.1.1.6: Overall sex wise prevalence of babesiosis in Bhag Nari, Holstein Friesian and
Crossbred in District Quetta
The prevalence of babesia infection in either sex was recorded during the course of
study. Out of 600 cattle 450 female and 150 male animals were examined. Comparatively female
cattle showed higher prevalence of babesiosis 22.66 (102/450) than male animals 14% (21/150).
Similarly the majority of cases were observed in females adult animals over 3 years as compare
to cattle groups less than 3 years, up to 2 years, 12 months, 9 months and less than 6 months of
age respectively (Figure 4.1.1.6 and Table 4.1.1.6). The statistical analysis showed significant
(P<0.05) difference of babesiosis in either sex of Bhag Nari, Holstein Friesian and Crossbred in
District Quetta.

183
Figure 4.1.1.6: Overall sex wise prevalence of babesiosis in Bhag Nari, Holstein Friesian
and Crossbred in District Quetta.
Table 4.1.1.6: Overall sex wise Prevalence of babesiosis in Bhag Nari, Holstein Friesian and
Crossbred in District Quetta.
Sex No. of Samples
examined
No. of positive samples
for babesiosis
Prevalence % P value
Male
150 21 14
0.02279*
Female
450 102 22.66
150
21 (14)
450
102
(22.66)
0
50
100
150
200
250
300
350
400
450
500
No. of Samplesexamined
No. of positive samplesfor babesiosis
Prevalence %
Male Female

184
4.1.1.7: Sex wise prevalence of babesiosis in Bhag Nari in District Quetta
In Bhag Nari cattle total 200 animals were examined out of which 50 were male and 150
were female. About 11.5 (23/200) animals were declared positive for babesiosis. Among these
babesia infection was noted higher in female 13.33% (20/150) than male 6% (3/50). Similarly
adult females over 3 years exhibited high prevalence as compare to cattle groups less than 3
years, up to 2 years, 12 months, 9 months and less than 6 months of age respectively (Figure
4.1.1.7 and Table 4.1.1.7). The difference of babesiosis prevalence in either sex groups of Bhag
Nari cattle was not statistically significant (P<0.05).
Figure 4.1.1.7: Sex wise prevalence of babesiosis in Bhag Nari in District Quetta.
Table 4.1.1.7: Sex wise prevalence of babesiosis in Bhag Nari Cattle in District Quetta.
Sex No. of Samples
examined
No. of positive
samples for babesiosis
Prevalence % P value
Male 50 3 6
0.1594
Female 150 20 13.33
50
3 (6)
150
20 (13.33)
0
20
40
60
80
100
120
140
160
No. of Samples examined No. of positive samples forbabesiosis
Prevalence %
Male Female
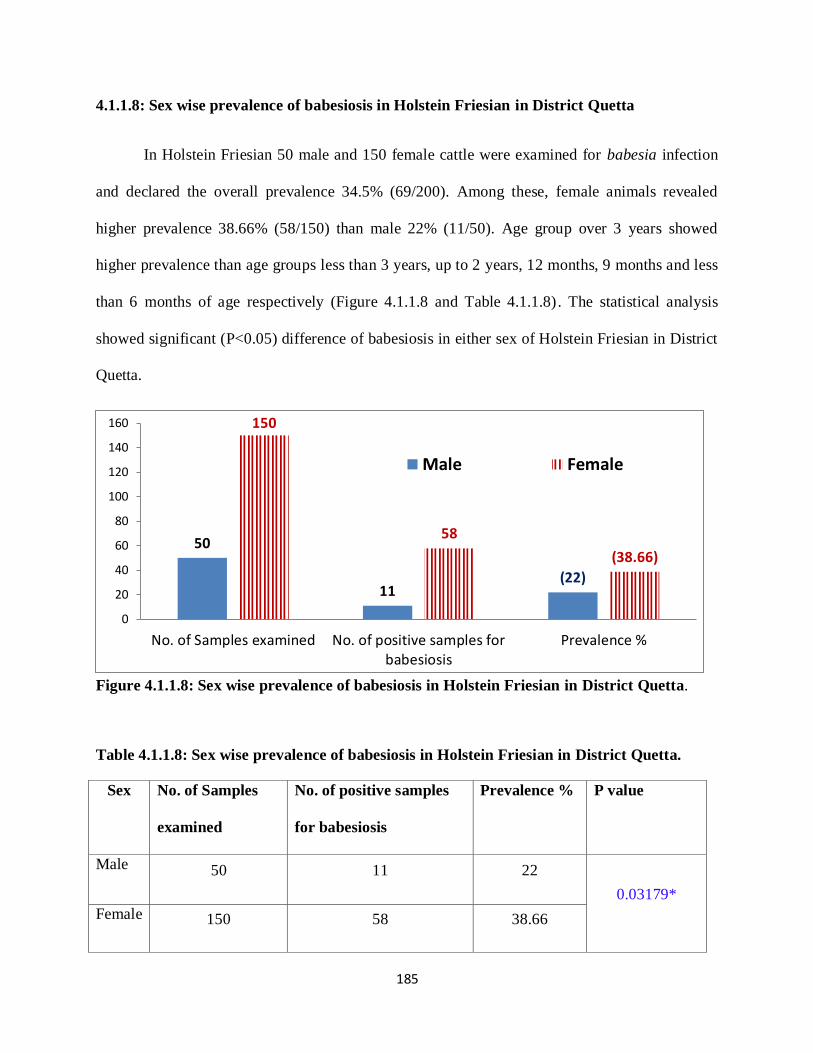
185
4.1.1.8: Sex wise prevalence of babesiosis in Holstein Friesian in District Quetta
In Holstein Friesian 50 male and 150 female cattle were examined for babesia infection
and declared the overall prevalence 34.5% (69/200). Among these, female animals revealed
higher prevalence 38.66% (58/150) than male 22% (11/50). Age group over 3 years showed
higher prevalence than age groups less than 3 years, up to 2 years, 12 months, 9 months and less
than 6 months of age respectively (Figure 4.1.1.8 and Table 4.1.1.8). The statistical analysis
showed significant (P<0.05) difference of babesiosis in either sex of Holstein Friesian in District
Quetta.
Figure 4.1.1.8: Sex wise prevalence of babesiosis in Holstein Friesian in District Quetta.
Table 4.1.1.8: Sex wise prevalence of babesiosis in Holstein Friesian in District Quetta.
Sex No. of Samples
examined
No. of positive samples
for babesiosis
Prevalence % P value
Male 50 11 22
0.03179*
Female 150 58 38.66
50
11(22)
150
58
(38.66)
0
20
40
60
80
100
120
140
160
No. of Samples examined No. of positive samples forbabesiosis
Prevalence %
Male Female

186
4.1.1.9: Sex wise prevalence of babesiosis in Crossbred in District Quetta
Among Crossbred cattle overall prevalence of babesia infection was noted 5.16%
(31/200). Of these female animals revealed higher prevalence 16% (24/150) than male 14%
(7/50). Similarly higher prevalence was identified in age group over 3 years followed by age
groups less than 3 years, up to 2 years, 12 months, 9 months and less than 6 months of age
respectively (Figure 4.1.1.9 and Table 4.1.1.9). The difference of prevalence of babesiosis in
either sex groups of Crossbred cattle was not statistically significant (P<0.05).
Figure 4.1.1.9: Sex wise prevalence of babesiosis in Crossbred in District Quetta.
Table 4.1.1.9: Sex wise prevalence of babesiosis in Crossbred cattle in District Quetta.
Sex No. of Samples
examined
No. of positive
samples for babesiosis
Prevalence % P value
Male 50 7 14
0.7350 Female 150 24 16
50
7(14)
150
24(16)
0
20
40
60
80
100
120
140
160
No. of Samples examined No. of positive samples forbabesiosis
Prevalence %
Male Female

187
4.1.1.10: Overall season wise prevalence of babesiosis in Bhag Nari, Holstein Friesian and
Crossbred in District Quetta
The season wise prevalence of babesiosis in Bhag Nari, Holstein Friesian and Crossbred
in District Quetta was noted higher during the months of summer 50% (75/150) followed by
spring 20.66% (31/150), autumn 7.33 (11/150) and winter 4% (6/150) respectively (Figure
4.1.1.10 and Table 4.1.1.10). There was statistically highly significant (P<0.05) difference of
prevalence of babesiosis during the four seasons of the year in different groups of Bhag Nari,
Holstein Friesian and Crossbred cattle in District Quetta.
Figure 4.1.1.10: Overall season wise prevalence of babesiosis in Bhag Nari, Holstein
Friesian and Crossbred in District Quetta.
150 150 150 150
31
75
11 6(20.66)
(50)
(7.33) (4)0
20
40
60
80
100
120
140
160
Spring Summer Autumn Winter
No. of samples examined No. of Samples positive for babesiosis
Prevalence %

188
Table 4.1.1.10: Overall Season wise prevalence of babesiosis in Bhag Nari, Holstein
Friesian and Crossbred in District Quetta.
Seasons No. of samples
examined
No. of Samples positive
for babesiosis
Prevalence % P value
Spring 150 31 20.66
0.00001*
Summer 150 75 50
Autumn 150 11 7.33
Winter 150 6 4
4.1.1.11: Season wise prevalence of babesiosis in Bhag Nari in District Quetta
In Bhag Nari cattle the overall prevalence of babesiosis was recorded 11.5% (23/200)
while the highest prevalence 32 % (16/50) was noted during the months of summer season.
Similarly in spring 8% (4/50), autumn 4% (2/50) and in winter it was 2% (1/50) (Figure 4.1.1.11
and Table 4.1.1.11). The statistical analysis revealed significant (P<0.05) difference of
prevalence of babesiosis during the four seasons of the year in Bhag Nari cattle in District
Quetta.

189
Figure 4.1.1.11: Season wise prevalence of babesiosis in Bhag Nari in District Quetta.
Table 4.1.1.11: Season wise prevalence of babesiosis in Bhag Nari Cattle in District Quetta.
Seasons No. of samples
examined
No. of Samples
positive for babesiosis
Prevalence % P value
Spring 50 4 8
0.00002*
Summer 50 16 32
Autumn 50 2 4
Winter 50 1 2
5050 50 50
4
16
2 1
(8)
(32)
(4) (2)
0
10
20
30
40
50
60
Spring Summer Autumn Winter
No. of samples examined No. of Samples positive for babesiosis
Prevalence %

190
4.1.1.12: Season wise prevalence of babesiosis in Holstein Friesian in District Quetta
Holstein Friesian was highly affected than Crossbred and Bhag Nari cattle and the
highest prevalence of babesia infection was noted during season 82% (41/50) but the lowest rate
of infection was recorded during the months of winter 6% (3/50). In spring and autumn it was
36% (18/50) and 14% (7/50) respectively (Figure 4.1.1.12 and Table 4.1.1.12). Statistically
highly significant (P<0.05) difference of prevalence of babesiosis was noted during the four
seasons of the year in Holstein Friesian in District Quetta.
Figure 4.1.1.12: Season wise prevalence of babesiosis in Holstein Friesian in District
Quetta.
50 50 50 50
18
41
73
(36)
(82)
(14)
(6)
0
10
20
30
40
50
60
70
80
90
Spring Summer Autumn Winter
No. of samples examined No. of Samples positive for babesiosis
Prevalence %

191
Table 4.1.1.12: Season wise prevalence of babesiosis in Holstein Friesian in District Quetta.
4.1.1.13: Season wise prevalence of babesiosis in Crossbred in District Quetta
In Crossbred cattle total 62% (31/200) cases of babesiosis was noted during the study
period. The highest prevalence 38% (19/50) was recorded in summer season followed by spring,
autumn and winter respectively (Figure 4.1.1.13 and Table 4.1.1.13). Statistically highly
significant (P<0.05) difference in the prevalence of babesiosis was noted during the four seasons
of the year in Crossbred cattle in District Quetta.
Seasons No. of samples
examined
No. of Samples
positive for babesiosis
Prevalence % P value
Spring 50 18 36
0.00001*
Summer 50 41 82
Autumn 50 7 14
Winter 50 3 6

192
Figure 4.1.1.13: Season wise prevalence of babesiosis in Crossbred in District Quetta.
Table 4.1.1.13: Season wise prevalence of babesiosis in Crossbred at District Quetta.
Seasons No. of samples
examined
No. of Samples positive
for babesiosis
Prevalence % P value
Spring 50 8 16
0.00001*
Summer 50 19 38
Autumn 50 3 6
Winter 50 1 2
50 50 50 50
8
19
3 1
(16)
(38)
(6)(2)
0
10
20
30
40
50
60
Spring Summer Autumn Winter
No. of samples examined No. of Samples positive for babesiosis
Prevalence %

193
4.1.2: PREVALENCE OF BABESIOSIS IN DISTRICT SIBI
The prevalence of babesiosis irrespective of new or old cases was documented on the
basis of clinical signs, blood smears examination and PCR. The overall prevalence of babesiosis
15.16% (91/600) was recorded in District Sibi (Figure 4.1.2 and Table 4.1.2).
Figure 4.1.2: Overall prevalence of babesiosis in District Sibi.
Table 4.1.2: Overall prevalence of Babesiosis in District Sibi
No. of Samples examined No of samples positive for
babesiosis
Prevalence %
600 91 15.16
91
(15.16 %)
No of samples positive for babesiosis Prevalence (%)

194
4.1.2.1: Breed wise prevalence of babesiosis in District Sibi
Among 3 breeds of cattle, the upper most prevalence of babesia infection was noted in
Holstein Friesian 26% (52/200) followed by Crossbred 12% (24/200) and Bhag Nari cattle 7.5%
(15/200) respectively (Figure 4.1.2.1 and Table 4.1.2.1). Statistically highly significant
difference (P<0.05) was observed in the prevalence of babesia infection in different breeds of
cattle in District Sibi.
Figure 4.1.2.1: Breed wise prevalence of babesiosis in District Sibi.
Table 4.1.2.1: Breed wise prevalence of babesiosis in District Sibi.
Breeds No. of Samples
examined
No of samples positive
for babesiosis
Prevalence
%
P value
Bhag Nari 200 15 7.5
0.00005* Holstien Friesian 200 52 26
Crossbred 200 24 12
200 200 200
1552
24(7.5)
(26) (12)0
50
100
150
200
250
Bhag Nari Holstien Friesian Crossbred
No. of Samples examined No of samples positive for babesiosis
Prevalence %

195
4.1.2.2: Over all age wise prevalence of babesiosis in District Sibi
In District Sibi total 600 animals i.e. Bhag Nari (200), Holstein Friesian (200) and
Crossbred (200) were allocated into two main groups i.e. Young animals less than 12 months and
Adults over 12 months of age. These groups were further distributed into sub-groups i.e. animals
less than 6 months, up to 9 months, 12 months, 2 years, 3 years and above 3 years. In district Sibi
about 15.16% (91/600) animals were found positive for babesia infection. Among these, the
highest prevalence of babesia infection was documented in adult cattle over 3 years of age
whereas the lowermost was detected in animals less than 9 months of age, while no signs of
infection were noticed in age groups less than six months (Figure 4.1.2.2 and Table 4.1.2.2). The
statistical analysis showed highly significant (P<0.05) difference of babesiosis among different
age groups of Bhag Nari, Holstein Friesian and Crossbred in District Sibi.
Figure 4.1.2.2: Over all age wise prevalence of babesiosis in District Sibi.
126 120 120
78 78 78
0 2 517
2938
(0)
(1.6
6)
(4.1
6)
(21
.79
)
(37
.17
)
(48
.71
)
0
20
40
60
80
100
120
140
Less than 6months
Up to 9months
Up to 12months
Up to 2years
Up to 3years
Over 3years
No. of Samples examined No of samples positive for babesiosis
Prevalence %

196
Table 4.1.2.2: Overall age wise prevalence of Babesiosis in District Sibi.
Group of
animals
Sub-group of
animals
No. of
Samples
examined
No of samples
positive for
babesiosis
Prevalence
%
P value
Young animals
less than 12
months
Less than 6
months
126 0 0
0.00001*
Up to 9
months
120 2 1.66
Up to 12
months
120 5 4.16
Adult group of
animals (Over 12
months to
onward)
Up to 2 years 78 17 21.79
Up to 3 years 78 29 37.17
Over 3 years 78 38 48.71
4.1.2.3: Age wise prevalence of babesiosis in Bhag Nari in District Sibi
Babesia infection was detected in cattle distributed into different age groups.
Approximately 7.5% (15/200) animals were declared for babesiosis. Among these, adult group
of animals over 3 years exhibited higher prevalence followed by animals less than 3 years, 2
years respectively but no signs of babesia infection was noted in animals less than 12 months, 9
months and 6 months of age (Figure 4.1.2.3 and Table 4.1.2.3). There was statistically highly
significant (P<0.05) difference of babesiosis among different age groups of Bhag Nari cattle in
District Sibi.

197
4.1.2.3: Age wise prevalence of babesiosis in Bhag Nari in District Sibi.
Table 4.1.2.3: Age wise prevalence of babesiosis in Bhag Nari in District Sibi.
Group of animals No. of Samples
examined
No of samples
positive for
babesiosis
Prevalence % P value
Less than 6 months 42 0 0
0.00001*
Up to 9 months 40 0 0
Up to 12 months 40 0 0
Up to 2 years 26 1 3.84
Up to 3 years 26 5 19.23
Over 3 years 26 9 34.61
42 40 40
26 26 26
0 0 0 15
9
(0)
(0)
(0) (3
.84
)
(19
.23
)
(34
.61
)
0
5
10
15
20
25
30
35
40
45
Less than 6months
Up to 9months
Up to 12months
Up to 2years
Up to 3years
Over 3years
No. of Samples examined No of samples positive for babesiosis
Prevalence %

198
4.1.2.4: Age wise prevalence of babesiosis in Holstein Friesian in District Sibi
Among Holstein Friesian, adult age group over 3 years presented higher prevalence of
Babesia infection 73.07% (19/26) followed by animals less than 3 years, 2 years, 12 months, 9
months of age respectively while no signs of infection of recorded in animals less than 6 months
of age (Figure 4.1.2.4 and Table 4.1.2.4). The statistical analysis revealed highly significant
(P<0.05) difference of babesiosis among different age groups of Holstein Friesian in District
Sibi.
Figure 4.1.2.4: Age wise prevalence of babesiosis in Holstein Friesian in District Sibi.
42 40 40
26 26 26
0 2 4
1215
19
(0)
(5)(10)
(46.15)
(57.69)
(73.07)
0
10
20
30
40
50
60
70
80
Less than 6months
Up to 9months
Up to 12months
Up to 2years
Up to 3years
Over 3years
No. of Samples examined No of samples positive for babesiosis
Prevalence %

199
Table 4.1.2.4: Age wise prevalence of babesiosis in Holstein Friesian in District Sibi
Group of animals No. of Samples
examined
No of samples
positive for babesiosis
Prevalence
%
P value
Less than 6 months 42 0 0
0.00001*
Up to 9 months 40 2 5
Up to 12 months 40 4 10
Up to 2 years 26 12 46.15
Up to 3 years 26 15 57.69
Over 3 years 26 19 73.07
4.1.2.5: Age wise prevalence of babesiosis in Crossbred in District Sibi
About 12% (24/200) animals revealed babesa infection while the group of animals over 3
years showed higher prevalence followed by less than 3 years, 2 years, 12 months excluding age
group of 9 months and animals less than 6 months which showed no signs of infection (Table
4.1.2.5 and Figure 4.1.2.5). Statistically highly significant (P<0.05) difference of babesiosis was
observed in different age groups of Crossbred cattle in District Sibi.

200
Figure 4.1.2.5: Age wise prevalence of babesiosis in Crossbred in District Sibi.
Table 4.1.2.5: Age wise prevalence of babesiosis in Crossbred in District Sibi.
Group of animals No. of Samples
examined
No of samples
positive for babesiosis
Prevalence
%
P value
Less than 6 months 42 0 0
0.00001*
Up to 9 months 40 0 0
Up to 12 months 40 1 2.5
Up to 2 years 26 4 15.38
Up to 3 years 26 9 34.61
Over 3 years 26 10 38.46
42 40 40
26 26 26
0 0 14
9 10
(0) (0)(2.5)
(15.38)
(34.61)(38.46)
0
5
10
15
20
25
30
35
40
45
Less than 6months
Up to 9months
Up to 12months
Up to 2years
Up to 3years
Over 3years
No. of Samples examined No of samples positive for babesiosis
Prevalence %

201
4.1.2.6: Overall sex wise Prevalence of babesiosis in Bhag Nari, Holstein Friesian and
Crossbred in District Sibi.
Total 450 female and 150 male animals were examined for the analysis of prevalence of
babesia infection in District Sibi. Female cattle showed higher prevalence of babesiosis 16.4%
(74/450) than male animals 11.3% (17/150). Similarly the majority of cases were observed in
females adult animals over 3 years as compare to cattle groups less than 3 years, up to 2 years,
12 months, 9 months and less than 6 months of age respectively (Figure 4.1.2.6 and Table
4.1.2.6). The difference of prevalence of babesiosis in either sex groups of Bhag Nari, Holstein
Friesian and Crossbred cattle was not statistically significant (P<0.05).
Figure 4.1.2.6: Overall sex wise prevalence of babesiosis in Bhag Nari, Holstein Friesian
and Crossbred in District Sibi.
Table 4.1.2.6: Overall sex wise prevalence of babesiosis in Bhag Nari, Holstein Friesian and
Crossbred in District Sibi.
Sex No. of Samples examined No. of positive samples
for babesiosis
Prevalence
%
P value
Male 150 17 11.3
0.05213 Female
450 74 16.4
150
17 (11.3)
450
74
(16.4)0
100
200
300
400
500
No. of Samples examined No. of positive samples forbabesiosis
Prevalence %
Male Female

202
4.1.2.7: Sex wise prevalence of babesiosis in Bhag Nari in District Sibi
Total 200 animals were examined for babesiosis and 15 animals were found positive for
babesia infection. The highest prevalence 8.66% (13/150) was recorded in female while in male
it was 4 % (2/50). Comparatively majority of the cases were seen in adult females over 12
months than young cattle less than 12 months of age (Figure 4.1.2.7 and Table 4.1.2.7). The
difference of babesiosis prevalence in either sex groups was not statistically significant (P<0.05).
Figure 4.1.2.7: Sex wise prevalence of babesiosis in Bhag Nari in District Sibi.
Table 4.1.2.7: Sex wise prevalence of babesiosis in Bhag Nari Cattle in District Sibi.
Sex No. of Samples
examined
No. of positive samples
for babesiosis
Prevalence % P value
Male 50 2 4
0.4108 Female
150 13 8.66
50
2 4
150
13 8.66
0
20
40
60
80
100
120
140
160
No. of Samplesexamined
No. of positive samplesfor babesiosis
Prevalence %
Male Female

203
4.1.2.8: Sex wise prevalence of babesiosis in Holstein Friesian in District Sibi
The prevalence of babesiosis in Holstein Friesian was noted high than Bahg Nari and
Crossbred cattle. Total 65% (52/200) samples were declared positive for babesiosis. Among
these higher prevalence was noticed in female 41.49% (40/127) followed by male 16.43 (12/73).
Similarly adult female cattle over 12 months of age presented high prevalence than cattle less
than 12 months of age (Figure 4.1.2.8 and Table 4.1.2.8). The difference of babesiosis
prevalence in either sex groups Holstein Friesian was not statistically significant (P<0.05).
Figure 4.1.2.8: Sex wise prevalence of babesiosis in Holstein Friesian in District Sibi.
Interchange
Table 4.1.2.8: Sex wise prevalence of babesiosis in Holstein Friesian in District Sibi.
Sex No. of Samples
examined
No. of positive
samples for babesiosis
Prevalence % P value
Male 50 10 20
0.09543 Female 150 42 28
50
10(20)
150
42(28)
0
20
40
60
80
100
120
140
160
No. of Samples examined No. of positive samples forbabesiosis
Prevalence %
Male Female

204
4.1.2.9: Sex wise prevalence of babesiosis in Crossbred cattle in District Sibi
In Crossbred cattle approximately 12% (24/200) animals were found positive for
babesiosis. Among these higher prevalence was seen in female 15.74% (20/127) followed by
5.47% (4/37) in male animals respectively. Similarly adult group of animals over 12 months
displayed higher prevalence than animals less than 12 months of age (Figure 4.1.2.9 and Table
4.1.2.9). The difference of babesiosis prevalence in either sex groups of Crossbred cattle was not
statistically significant (P<0.05).
Figure 4.1.2.9: Sex wise prevalence of babesiosis in Crossbred cattle in District Sibi.
Table 4.1.2.9: Sex wise prevalence of babesiosis in Crossbred Cattle in District Sibi.
Sex No. of Samples examined No. of positive
samples for babesiosis
Prevalence
%
P value
Male 50 5 10
0.4263 Female
150 19 12.66
50
5 (10)
150
19(12.66)
0
20
40
60
80
100
120
140
160
No. of Samples examined No. of positive samples forbabesiosis
Prevalence %
Male Female

205
4.1.2.10: Overall season wise prevalence of babesiosis in District Sibi
The prevalence of babesiosis 40% (60/150) was noted higher during the months of
summer season followed by autumn, spring and winter respectively. The highest prevalence was
recorded in adult age group over 3 years while Holstien Friesian presented high prevalence than
Crossbred and Bhag Nari cattle (Figure 4.1.2.10 and Table 4.1.2.10). The statistical analysis
showed highly significant difference (P<0.05) of prevalence of babesiosis during the different
seasons of the year in District Sibi.
Figure 4.1.2.10: Overall season wise prevalence of babesiosis in District Sibi.
Table 4.1.2.10: Overall season wise prevalence of babesiosis in District Sibi.
Seasons No. of samples
examined
No. of Samples
positive for babesiosis
Prevalence
%
P value
Spring 150 21 14
0.00001* Summer 150 60 40
Autumn 150 7 4.66
Winter 150 3 2
150 150 150 150
21
60
7 3(14)
(40)
(4.66) (2)0
20
40
60
80
100
120
140
160
Spring Summer Autumn Winter
No. of samples examined No. of Samples positive for babesiosis Prevalence %

206
4.1.2.11: Season wise prevalence of babesiosis in Bhag Nari in District Sibi
The season wise prevalence of babesiosis in Bhag Nari was recorded higher 24% (12/50)
in summer followed by spring 6% (3/50) while no case of babesia infection was detected in
winter and autumn (Figure 4.1.2.11 and Table 4.1.2.11). There was statistically significant
difference (P<0.05) of babesiosis prevalence during different seasons of the year.
Figure 4.1.2.11: Season wise prevalence of babesiosis in Bhag Nari in District Sibi.
Table 4.1.2.11: Season wise prevalence of babesiosis in Bhag Nari cattle in District Sibi.
Seasons No. of samples
examined
No. of Samples positive for
babesiosis
Prevalence
%
P value
Spring 50 3 6
0.00003*
Summer 50 12 24
Autumn 50 0 0
Winter 50 0 0
Grand Total 200 15 7.5
50 50 50 50
200
3 120 0
15(6)(24)
(0) (0)(7.5)
0
50
100
150
200
250
Spring Summer Autumn Winter Grand Total
No. of samples examined No. of Samples positive for babesiosis
Prevalence %

207
4.1.2.12: Season wise prevalence of babesiosis in Holstein Friesian in District Sibi
In Holstein Frisian cases of babesiosis was detected during the entire 4 seasons. The
overall prevalence was noted 26% (52/200) with higher prevalence 66% (33/50) during the
months of summer followed by 24% (12/50), 10% (5/50) and 4% (2/50) in spring, autumn and
winter respectively (Figure 4.1.2.12 and Table 4.1.2.12). The statistical analysis showed highly
significant difference (P<0.05) of prevalence of babesiosis during the different seasons of the
year.
Figure 4.1.2.12: Season wise prevalence of babesiosis in Holstein Friesian in District Sibi.
Table 4.1.2.12: Season wise prevalence of babesiosis in Holstein Friesian in District Sibi.
Seasons No. of samples
examined
No. of Samples positive
for babesiosis
Prevalence
%
P value
Spring 50 12 24
0.00001*
Summer 50 33 66
Autumn 50 5 10
Winter 50 2 4
Grand Total 200 52 26
50 50 50 50
200
1233
5 2
52
(24)
(66)
(10) (4)(26)
0
50
100
150
200
250
Spring Summer Autumn Winter Grand Total
No. of samples examined No. of Samples positive for babesiosisPrevalence %

208
4.1.2.13: Season wise prevalence of babesiosis in Crossbred cattle in District Sibi
In case of Crossbred cattle total 12% (24/200) cases were diagnosed during the months of
spring, summer and autumn however no case of babesiosis was found in winter season. Similarly
the summer season caused highest prevalence of babesiosis 34% (17/50) followed by spring 10%
(5/50) and autumn 4% (2/50) respectively (Figure 4.1.2.13 and Table 4.1.2.13). There was
statistically significant difference (P<0.05) of babesiosis prevalence during different seasons of
the year.
Figure 4.1.2.13: Season wise prevalence of babesiosis in Crossbred cattle in District Sibi.
Table 4.1.2.13: Season wise prevalence of babesiosis in Crossbred in District in Sibi.
Seasons No. of samples examined No. of Samples
positive for
babesiosis
Prevalence % P value
Spring 50 5 10
0.00003*
Summer 50 17 34
Autumn 50 2 4
Winter 50 0 0
Grand Total 200 24 12
50 50 50 50
200
5 172 0
24(10)
(34)
(4) (0) (12)
0
50
100
150
200
250
Spring Summer Autumn Winter Grand Total
No. of samples examined No. of Samples positive for babesiosis
Prevalence %

209
4.1.2.14: Cumulative prevalence of babesiosis in both Districts Quetta and Sibi
The prevalence of babesiosis in Districts Quetta and Sibi, irrespective of new or old cases
among all selected animal was documented on the basis of clinical signs, blood smears
examination and PCR. The cumulative prevalence of babesiosis in both Districts was recorded
17.83% (214/1200) during the course of the study (Figure 4.1.2.14 and Table 4.1.2.14). There
was statistically highly significant difference (P<0.05) in cumulative prevalence of babesiosis in
both Districts Quetta and Sibi.
Figure 4.1.2.14: Cumulative prevalence of babesiosis in both Districts Quetta and Sibi.
252 240 240
156 156 156
1200
2 5 1342 65 87
214
(0.7
9)
(2.0
8)
(5.4
1)
(26
.92
)
(41
.66
)
(55
.76
)
(17
.83
)
0
200
400
600
800
1000
1200
1400
Less than 6months
Up to 9months
Up to 12months
Up to 2years
Up to 3years
Over 3years
Grand Total
No. of Samples examined No of samples positive for babesiosis
Prevalence %

210
Table 4.1.2.14: Cumulative prevalence of Babesiosis in both Districts Quetta and Sibi.
Group of
animals
Sub-group of
animals
No. of
Samples
examined
No of samples
positive for
babesiosis
Prevalence
%
P value
Young
animals
less than 12
months
Less than 6
months
252 2 0.79
0.00001*
Up to 9 months
240 5 2.08
Up to 12
months
240 13 5.41
Adult
group of
animals
(Over 12
months to
onward)
Up to 2 years
156 42 26.92
Up to 3 years
156 65 41.66
Over 3 years
156 87 55.76
Grand Total
1200 214 17.83

211
4.1.3: MIXED HEMOPROTOZOAN INFECTION
4.1.3.1: Overall prevalence of mixed hemoprotozoan infection in both Districts Quetta and
Sibi.
The blood smear examination of selected animals also detected mixed protozoan
infection of Babesia and theilaria (theileria annulata) species found within the RBC (Figure
4.1.3). Babesia bovis and b. bigemina were more common. Morphological characteristics of
theileria annulata revealed ring like structure but sometimes round oval shaped with 0.5 to 1.5
micrometer. The blood smear examination highlighted about 2.33% (28/1200) samples positive
for theileria infection, out of which higher prevalence 4.75% (19/400) was recorded in Holstein
Friesian followed by 1.75% (7/400) in Crossbred and 0.5% (2/400) was recorded in Bhag Nari
cattle respectively. Similarly 10.08% (121/1200) theileria species mixed with babesia species
was also noted. Among these 18.25% (73/400) Holstein Friesian, 9.5% (38/400) crossbred and
2.5% (10/400) was recorded in Bhag Nari breed (Figure 4.1.3.1 and Table 4.1.3.1). The
statistical analysis showed significant difference (P<0.05) of prevalence of mixed
hemoprotozoan infection of both theileria as well as theileria mixed with babesia species in
different breeds of cattle.

212
Figure 4.1.3.1: Overall prevalence of mixed hemoprotozoan infection in both Districts
Quetta and Sibi.
4002 10 0.5 2.5
400 19 734.75 18.25
400 7 38
1.75 9.51200 28 121
2.33 10.08
Theileria Theileria mixedwith babesia species
Theileria Theileria mixedwith babesia species
No. of samplesexamined
No. of Positive samples Prevalence %
Bhag Nari Holstien Friesian Crossbred Grand Total
Figure 4.1.3: Microscopic slide showing mixed hemoprotozoan infection

213
Table 4.1.3.1: Overall prevalence of mixed hemoprotozoan infection in Districts Quetta and
Sibi.
Breeds No. of
samples
examined
No. of Positive samples Prevalence % P value
Theileria Theileria
mixed with
babesia
species
Theileria Theileria
mixed
with
babesia
species
Theileria Theileria
mixed
with
babesia
species
Bhag Nari 400 2 10 0.5 2.5
0.00023* 0.00001*
Holstien
Friesian
400 19 73 4.75 18.25
Crossbred 400 7 38 1.75 9.5
Grand Total 1200 28 121 2.33 10.08
4.1.3.2: District wise prevalence of mixed hemoprotozoan infection in Bhag Nari, Holstein
Friesian and crossbred cattle
4.1.3.2.1: Prevalence of mixed hemoprotozoan infection in District Quetta
In District Quetta, the blood smears detected 3% (18/600) theileria protozoan. Among
these 6.5% (13/200), 2% (4/200) and 0.5% (1/200) was recorded in Holstein Friesian, Crossbred
and Bhag Nari respectively. Similarly the prevalence of theileria mixed with babesia species
were recorded about 11.5% (69/600). Among these 21.5% (43/200) in Holstein Friesian while in
crossbred and Bhag Nari it was recorded 10.5% (20/200) and 3% (6/200) respectively (Table
4.1.3.2.1 and Figure 4.1.3.2.1). Statistically significant difference (P<0.05) was observed in the
prevalence of mixed hemoprtozoan infection of both theileria as well as theileria mixed with
babesia species in different breeds of cattle in Quetta.

214
Figure 4.1.3.2.1: Prevalence of mixed hemoprotozoan infection in District Quetta.
Table 4.1.3.2.1: Prevalence of mixed hemoprotozoan infection in District Quetta.
Breeds No. of
samples
examined
No. of Positive
samples
Prevalence % P value
Theileria Theileria
mixed
with
babesia
species
Theileria Theileria
mixed
with
babesia
species
Theileria Theileria
mixed
with
babesia
species
Bhag Nari 200 1 6 0.5 3
0.00123* 0.00001* Holstein
Friesian
200 13 43 6.5 21.5
Crossbred 200 4 20 2 10.5
20
0
1 6 (0.5
)
(3)
20
0
13
43
(6.5
)
(21
.5)
20
0
4
20
(2) (10
.5)
0
50
100
150
200
250
Theileria Theileria mixedwith babesia
species
Theileria Theileria mixedwith babesia
species
No. of samplesexamined
No. of Positive samples Prevalence %
Bhag Nari Holstein Friesian Crossbred

215
4.1.3.2.2: Prevalence of mixed hemoprotozoan infection in District Sibi
In District Sibi blood smears detected total 1.66% (10/600) theileria protozoan. Among
these higher prevalence 3% (6/200) was recorded in Holstein Friesian followed by 1.5% (3/200)
in Crossbred and 0.5% (1/200) in Bhag Nari respectively. Similarly prevalence of theileria
mixed with babesia species were recorded about 8.66% (52/600). Among these 15% (30/200) in
Holstein Friesian while in crossbred and Bhag Nari breed it was 9% (18/200) and 2% (4/200)
respectively (Table 4.1.3.2.2 and Figure 4.1.3.2.2). There was statistically no significant
difference (P<0.05) in the prevalence of mixed hemoprtozoan infection of theileria species but
no difference in theileria mixed with babesia species in different breeds of cattle in Sibi.
Table 4.1.3.2.2: Prevalence of mixed hemoprotozoan infection in District Sibi.
Breeds No. of
samples
examined
No. of Positive
samples
Prevalence % P value
Theileria Theileria
mixed
with
babesia
species
Theileria Theileria
mixed
with
babesia
species
Theileria Theileria
mixed
with
babesia
species
Bhag Nari 200 1 4 0.5 2
0.1448 0.00002*
Holstein
Friesian 200 6 30 3 15
Crossbred 200 3 18 1.5 9

216
Figure 4.1.3.2.2: Prevalence of mixed hemoprotozoan infection in District Sibi.
4.1.4: COMPARATIVE EFFICIENCY OF CONVENTIONAL METHOD AND PCR IN
DISTRICTS QUETTA AND SIBI
The conventional method (blood smears) was compared with modern diagnostic
technique (PCR) to find out the most effective diagnostic technique. The results of the study
declared higher prevalence of babesiosis in samples processed through PCR during the entire 4
seasons (Table 4.1.4.1 and Figure 4.1.4.1) as well as in all age groups (Table 4.1.4.2 and Figure
4.1.4.2) whereas blood smears examination was capable to diagnose babesiosis in adult groups
(particularly in severe cases of babesiosis) and during the months of summer and spring season.
Breed wise prevalence was recorded higher in all 3 breeds of cattle samples treated with PCR as
compare to samples processed through blood smears examination and even samples that were
declared negative by blood smears examination were also found positive (Table 4.1.4.3 and
Figure 4.1.4.3). Statistically highly significant difference (P<0.05) was observed between blood
200
1 4 (0.5) (2)
200
630
(3)(15)
200
318
(1.5) (9)
0
50
100
150
200
250
Theileria Theileria mixedwith babesia
species
Theileria Theileria mixedwith babesia
species
No. of samplesexamined
No. of Positive samples Prevalence %
Bhag Nari Holstein Friesian Crossbred

217
smear examination and PCR in different seasons, different age groups and also in different
breeds of cattle.
Figure 4.1.4.1: Comparative efficiency of conventional method versus PCR in different
seasons in Districts Quetta and Sibi.
Table 4.1.4.1: Comparative efficiency of conventional method versus PCR in different
seasons in Districts Quetta and Sibi.
30
0
13
5
44 (45
)
(14
.66
)
30
0
9 0 (3)
(0)
30
0
18
0 (6)
(0)
30
0
52
9
(17
.33
)
(3)
0
50
100
150
200
250
300
350
PCR Blood Smear PCR Blood Smear
No. of Samplesexamined
No of positive samples detected Prevalence %
Summer Winter
Autumn Spring
Season Summer Winter Autumn Spring P value
No. of Samples examined 300 300 300 300
No. of positive
samples
detected
through
PCR 135 9 18 52 0.00001*
Blood
Smear 44 0 0 9
0.00001* Prevalence % PCR 45 3 6 17.33
Blood
Smear 14.66 0 0 3

218
Table 4.1.4.2: Comparative efficiency of conventional method versus PCR in different age
group of cattle in Districts Quetta and Sibi.
Group of animals No. of
Samples
examined
No of positive
samples detected
Prevalence % P value
PCR Blood
Smear
PCR Blood
Smear
PCR Blood
Smear
Young animals less
than 12 months
705 20 2 2.83 0.28
0.00001* 0.00001* Adult group of
animals (Over 12
months to onward)
495 194 51 39.19 10.30
Figure 4.1.4.2: Comparative efficiency of conventional method versus PCR in different age
group of cattle in Districts Quetta and Sibi.
705
20 0 (2.83) (0)
495
194
51 (39.19) (10.3)0
100
200
300
400
500
600
700
800
PCR Blood Smear PCR Blood Smear
No. of Samplesexamined
No of positive samples detected Prevalence %
Young animals less than 12 months
Adult group of animals (Over 12 months to onward)

219
Table 4.1.4.3: Comparative efficiency of conventional method versus PCR in different
breeds of cattle in Districts Quetta and Sibi.
Breeds No. of
Samples
examined
No. of positive
samples detected
through
Prevalence % P value
PCR Blood
Smear
PCR Blood
Smear
PCR Blood
smear
Bhag Nari 400 38 6 9.5 1.5
0.00001* 0.00001* Holstein
Friesian
400 121 39 30.25 9.75
Crossbred 400 55 8 13.75 2
Figure 4.1.4.3: Comparative efficiency of conventional method versus PCR in different
breeds in Districts Quetta and Sibi.
40
0
38
6 (9.5
)
(1.5
)
40
0
12
1
39
(30
.25
)
(9.7
5)
40
0
55
8 (13
.75
)
(2)
0
50
100
150
200
250
300
350
400
450
PCR Blood Smear PCR Blood Smear
No. of Samplesexamined
No. of positive samplesdetected
Prevalence %
Bhag Nari Holstein Friesian Crossbred
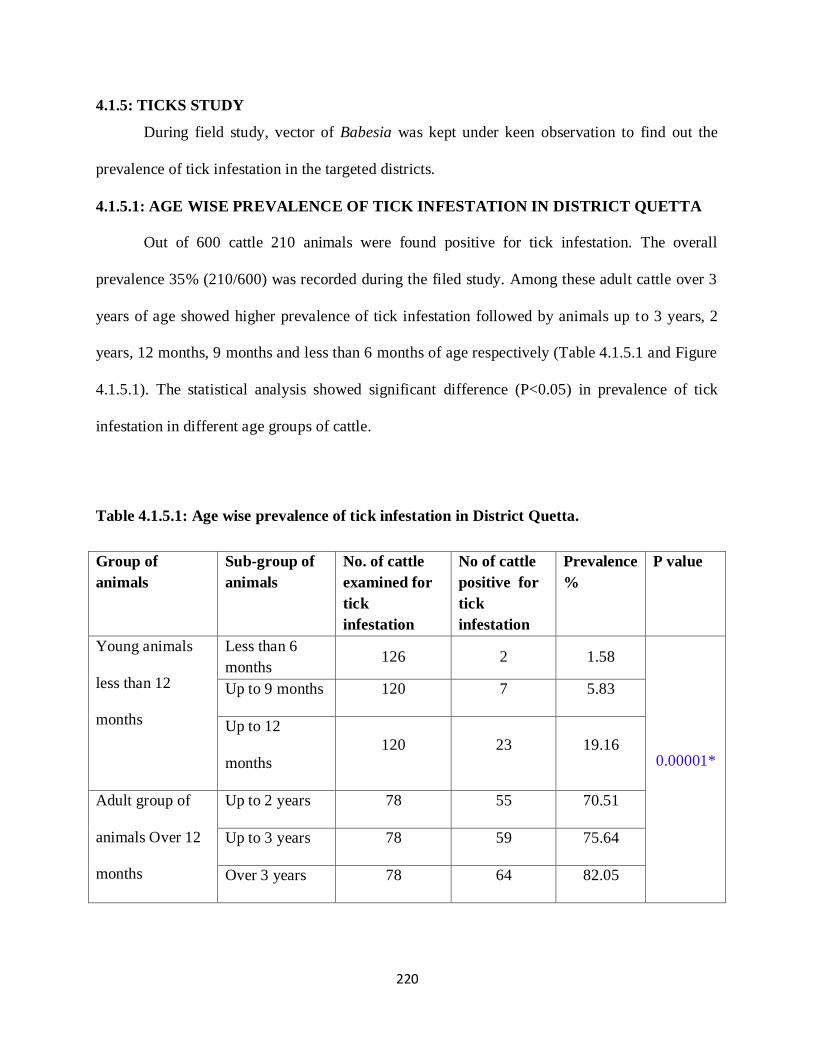
220
4.1.5: TICKS STUDY
During field study, vector of Babesia was kept under keen observation to find out the
prevalence of tick infestation in the targeted districts.
4.1.5.1: AGE WISE PREVALENCE OF TICK INFESTATION IN DISTRICT QUETTA
Out of 600 cattle 210 animals were found positive for tick infestation. The overall
prevalence 35% (210/600) was recorded during the filed study. Among these adult cattle over 3
years of age showed higher prevalence of tick infestation followed by animals up to 3 years, 2
years, 12 months, 9 months and less than 6 months of age respectively (Table 4.1.5.1 and Figure
4.1.5.1). The statistical analysis showed significant difference (P<0.05) in prevalence of tick
infestation in different age groups of cattle.
Table 4.1.5.1: Age wise prevalence of tick infestation in District Quetta.
Group of
animals
Sub-group of
animals
No. of cattle
examined for
tick
infestation
No of cattle
positive for
tick
infestation
Prevalence
%
P value
Young animals
less than 12
months
Less than 6
months 126 2 1.58
0.00001*
Up to 9 months 120 7 5.83
Up to 12
months
120 23 19.16
Adult group of
animals Over 12
months
Up to 2 years 78 55 70.51
Up to 3 years 78 59 75.64
Over 3 years 78 64 82.05

221
Figure 4.1.5.1: Age wise prevalence of tick infestation in District Quetta.
4.1.5.2: Breed wise prevalence of tick infestation in District Quetta
Higher prevalence of tick infestation was noted in Holstein Friesian cattle 59% (118/200)
followed by Crossbred cattle 28.5% (57/200) while the lowest prevalence of tick infestation was
recorded Bhag Nari cattle breed (Table 4.1.5.2 and Figure 4.1.5.2). The statistical analysis
showed significant difference (P<0.05) in prevalence of tick infestation in different breeds of
cattle.
126120 120
78 78 78
27
23
55 5964
(1.5
8)
(5.8
3) (1
9.1
6)
(70
.51
)
(75
.64
)
(82
.05
)
0
20
40
60
80
100
120
140
Less than 6months
Up to 9months
Up to 12months
Up to 2years
Up to 3years
Over 3years
No. of cattle examined for tick infestation No of cattle positive for tick infestation
Prevalence %

222
Table 4.1.5.2: Breed wise prevalence of tick infestation in District Quetta.
Breeds No. of cattle
examined for tick
infestation
No of cattle positive
for tick infestation
Prevalence
%
P value
Bhag Nari 200 35 17.5
0.00001*
Holstein
Friesian
200 118 59
Crossbred 200 57 28.5
Figure 4.1.5.2: Breed wise prevalence of tick infestation in District Quetta.
200
35(17.5)
200
118
(59)
200
57
(28.5)
0
50
100
150
200
250
No. of cattle examined No of cattle positive fortick infestation
Prevalence %
Bhag Nari Holstein Friesian Crossbred

223
4.1.5.3: Sex wise prevalence of tick infestation in District Quetta
In District Quetta the higher prevalence of tick infestation 36% (162/450) was recorded
in female than male 32% (48/150) (Table 4.1.5.3 and Figure 4.1.5.3). The difference of
prevalence tick infestation in either sex groups was not statistically significant (P<0.05).
Table 4.1.5.3: Sex wise prevalence of tick infestation in District Quetta
Sex No. of cattle examined
for tick infestation
No. of cattle positive
for tick infestation
Prevalence % P value
Male 150 48 32
0.3737
Female 450 162 36
Figure 4.1.5.3: Sex wise prevalence of tick infestation in District Quetta.
150
71(47.33)
450
139
(30.88)
0
50
100
150
200
250
300
350
400
450
500
No. of cattle examined fortick infestation
No. of cattle positive fortick infestation
Prevalence %
Male Female

224
4.1.5.4: Season wise prevalence of tick infestation in District Quetta
The appearance of ticks on animal body was noted in March in summer season and
increased the numbers till the end of August. Similarly the population of ticks was also recorded
during the months of September and October but decreased in November. However the highest
tick population was recorded during the months of June and July but no tick population was
noted during the months of December, January and February. The results of tick infestation
revealed higher tick infestation 84% (126/150) in summer season while the lowest infestation
4.66% (7/150) was recorded during winter season (Table 4.1.5.4 and Figure 4.1.5.4). The
statistical analysis showed highly significant difference (P<0.05) of prevalence of tick infestation
during different seasons of the year.
Table 4.1.5.4: Season wise prevalence of tick infestation in District Quetta.
Seasons No. of cattle examined
for tick infestation
No. of cattle
positive for tick
infestation
Prevalence
%
P value
Spring 150 54 36
0.00001*
Summer 150 126 84
Autumn 150 23 15.33
Winter 150 7 4.66

225
Figure 4.1.5.4: Season wise prevalence of tick infestation in District Quetta.
4.1.5.5: Prevalence of most dominant tick species in District Quetta
During field study 200 tick specimens were randomly collected during the months of
summer season from Bhag Nari, Holstein Friesian and Crossbred cattle to find out the most
prevalent tick species in the area. For predilection sites, the whole body of the animals was
properly checked for the presence of ticks. The results of the study showed the presence of ticks
with different proportions in different regions of the body. Among these the udder including
teats, perineum and external genitalia was found highly tick infested regions. The result of the
present study revealed the most dominant tick species; Rhipiciphalus (Boophilus) microplus
35.5% (71/200) with predilection sites i.e. dewlap, shoulder area, external genitalia and udder
150 150 150 150
54
126
23
7
(36)
(84)
(15.33)(4.66)
0
20
40
60
80
100
120
140
160
Spring Summer Autumn Winter
No. of cattle examined for tick infestation No. of cattle positive for tick infestation
Prevalence %

226
region followed by Rhipiciphalus (Boophilus) annulatus 28.5 (57/200) with predilection sites i.e.
dewlap, legs particularly hind legs, abdominal area and in some cases head regions particularly
neck. Similarly Hyalomma spp. 26.5% (53/200) was noted with predilection sites; external
genitalia, udder and perineum while Rhipiciphalus sanguineus was noted 9.5% (19/200) with
predilection sites; ear, shoulder and neck. (Table. 4.1.5.5 and Figure 4.1.5.5 and 4.1.5.5.1).
Table 4.1.5.5: Prevalence of most dominant tick species with predilection sites identified
during field study in District Quetta.
Ticks species
identified in the area
No. of ticks
species identified
in the area
Prevalence
%
Predilection sites of ticks noted
Rhipiciphalus
(Boophilus) microplus
71 35.5
Dewlap, shoulder area, external
genitalia and udder region.
Rhipiciphalus
(Boophilus) annulatus
57 28.5
Dewlap, legs particularly hind
legs, abdominal area and in some
cases head regions particularly
neck.
Hyaloma spp.
53 26.5
External genitalia, udder and
perineum
Rhipicephalus
sanguineus
19 9.5
Ear, shoulder and neck.

227
Figure 4.1.5.5: Prevalence of most dominant tick species identified during field study in
District Quetta.
71
5753
19
(35.5)(28.5) (26.5)
(9.5)
0
10
20
30
40
50
60
70
80
Rhipiciphalus
(Boophilus)
microplus
Rhipiciphalus
(Boophilus)
annulatus
Hyaloma spp. Rhipiciphalus
sanguineus
No. of ticks species detected in the area Prevalence %
Figure 4.1.5.5.1:
One of predilection sites (External genitalia of cattle) of tick

228
4.1.5.6: AGE WISE PREVALENCE OF TICK INFESTATION IN DISTRICT SIBI
In District Sibi out of 600 cattle 232 cattle were found positive for tick infestation. The
overall prevalence was noted 38.66% (232/600). Among these the adult animals over 3 years of
age showed higher prevalence of tick infestation than the group of animals up to 3 years, 2 years,
12 months, 9 months, and less than 6 months of age respectively (Table 4.1.5.6 and Figure
4.1.5.6). Statistically highly significant (P<0.05) difference of tick infestation was observed in
different age groups of cattle in District Sibi.
Table 4.1.5.6: Age wise prevalence of tick infestation in District Sibi.
Group of animals Sub-group of
animals
No. of
cattle
examined
for tick
infestation
No of cattle
positive for
tick
infestation
Prevalence
%
P value
Young animals less
than 12 months
Less than 6
months
126 7 5.55
0.00001*
Up to 9 months 120 13 10.83
Up to 12 months 120 25 18.33
Adult group of
animals (Over 12
months to onward)
Up to 2 years 78 57 73.07
Up to 3 years 78 61 78.20
Over 3 years 78 69 88.46
Grand Total 600 232 38.66

229
Figure 4.1.5.6: Age wise prevalence of tick infestation in District Sibi.
4.1.5.7: Breed wise prevalence of tick infestation in District Sibi
Among different breeds of cattle higher prevalence of tick infestation was noted in
Holstein Friesian cattle 66% (132/200) followed by Crossbred cattle 30.5% (61/200) while the
lowest tick infestation rate 19.5% (39/200) was observed in Bhag Nari cattle (Table 4.1.5.7 and
Figure 4.1.5.7). The statistical analysis showed significant difference (P<0.05) in prevalence of
tick infestation in different breeds of cattle District Sibi.
Table 4.1.5.7: Breed wise prevalence of tick infestation in District Sibi.
Breeds No. of cattle
examined for tick
infestation
No of cattle
positive for tick
infestation
Prevalence % P value
Bhag Nari 200 39 19.5
0.00001* Holstien Friesian 200 132 66
Crossbred 200 61 30.5
Grand Total 600 232 38.66
126 120 120
78 78 78
7 1325
57 6169
(5.5
5)
(10
.83
)
(18
.33
)
(73
.07
)
(78
.2)
(88
.46
)
0
20
40
60
80
100
120
140
Less than 6months
Up to 9months
Up to 12months
Up to 2years
Up to 3years
Over 3years
No. of cattle examined for tick infestation No of cattle positive for tick infestation
Prevalence %

230
Figure 4.1.5.7: Breed wise prevalence of tick infestation in District Sibi.
4.1.5.8: Sex wise prevalence of tick infestation in District Sibi.
In District Sibi higher prevalence of tick infestation 40.22% (181/450) was recorded in
female than in male 34% (51/150) (Table 4.1.5.8 and Figure 4.1.5.8). The difference of
prevalence of tick infestation in either sex groups of Crossbred cattle was statistically highly
significant (P<0.05).
Table 4.1.5.8: Sex wise prevalence of tick infestation in District Sibi.
Sex No. of cattle examined
for tick infestation
No. of cattle positive
for tick infestation
Prevalence
%
P value
Male 150 51 34
0.00001*
Female 450 181 40.22
200 200 200
39
132
61
(19.5)
(66)
(30.5)
0
50
100
150
200
250
Bhag Nari Holstien Friesian Crossbred
No. of Samples examined No of samples positive for babesiosis
Prevalence %
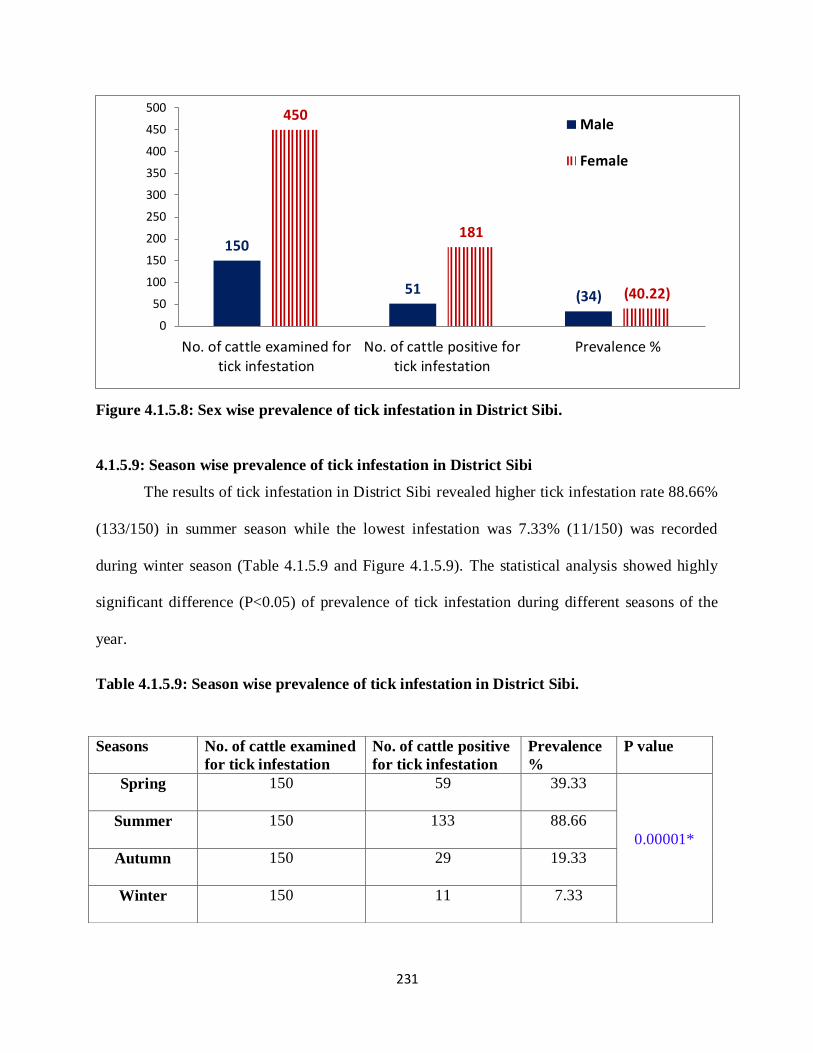
231
Figure 4.1.5.8: Sex wise prevalence of tick infestation in District Sibi.
4.1.5.9: Season wise prevalence of tick infestation in District Sibi
The results of tick infestation in District Sibi revealed higher tick infestation rate 88.66%
(133/150) in summer season while the lowest infestation was 7.33% (11/150) was recorded
during winter season (Table 4.1.5.9 and Figure 4.1.5.9). The statistical analysis showed highly
significant difference (P<0.05) of prevalence of tick infestation during different seasons of the
year.
Table 4.1.5.9: Season wise prevalence of tick infestation in District Sibi.
150
51 (34)
450
181
(40.22)
0
50
100
150
200
250
300
350
400
450
500
No. of cattle examined fortick infestation
No. of cattle positive fortick infestation
Prevalence %
Male
Female
Seasons No. of cattle examined
for tick infestation
No. of cattle positive
for tick infestation
Prevalence
%
P value
Spring 150 59 39.33
0.00001*
Summer 150 133 88.66
Autumn 150 29 19.33
Winter 150 11 7.33

232
Figure 4.1.5.9: Season wise prevalence of tick infestation in District Sibi.
4.1.5.10: Prevalence of most dominant tick species in District Sibi
For this purpose 200 tick specimens were randomly collected from the targeted animals
(in summer season) and processed for identification and their predilection sites. The results of
the study are summarized in table 4.1.5.10 and shown in figure 4.1.5.10.
Table 4.1.5.10: Prevalence of most dominant tick species with predilection sites identified
during field study in District Sibi.
Ticks species
identified in the area
No. of ticks
species identified
in the area
Prevalence
%
Predilection sites of ticks noted
Rhipiciphalus
(Boophilus) microplus 68 34
Dewlap, Shoulder area, external
genitalia and udder region.
Rhipiciphalus
(Boophilus) annulatus 54 27
Dewlap, Legs particularly hind
legs, abdominal area and in some
cases head regions particularly
neck.
Hyaloma spp. 47 23.5
External genitalia, udder and
perineum
Rhipiciphalus
sanguineus 31 15.5
Ear, shoulder and neck.
150 150 150 150
59
133
29
11
(39
.33
)
(88
.66
)
(19
.33
)
(7.3
3)
0
20
40
60
80
100
120
140
160
Spring Summer Autumn Winter
No. of cattle examined for tick infestation No. of cattle positive for tick infestation
Prevalence %

233
Figure 4.1.5.10: Prevalence of most dominant tick species identified during field study in
District Sibi.
4.1.5.11: IDENTIFICATION OF BABESIA VECTOR
During field study two tick species i.e. Rhipiciphalus (Boophilus) microplus and Rhipiciphalus
(Boophilus) annulatus (4.1.5.11) were identified as vector of babesia species in cattle. The
morphological characters were as under.
68
5447
3134
27 23.515.5
0
10
20
30
40
50
60
70
80
Rhipiciphalus(Boophilus) microplus
Rhipiciphalus(Boophilus)annulatus
Hyaloma spp. Rhipiciphalussanguineus
No. of ticks species identified in the area Prevalence %
Figure 4.1.5.11: Ticks specimen stained with Acid Fuchsine Method.

234
4.1.5.11.1: Rhipiciphalus (Boophilus) microplus
FEMALE: MALE:
Poros area: broad oval Poros area: Broad oval
Hypostomal teeth: 4+4columns Hypostomal teeth: 4+4 column
Palp articles 1: Distinctly concave and short Cornua: Distinct
Coxa 1 spurs: Distinct Coxa 1 spus: Long
Coxae 2 & Coxae 3 Spurs: present Ventral plate spurs: Indistinct
Genital aperture: wide U shaped Caudal appendages: Narrow
4.1.5.11.2: Rhipiciphalus (Boophilus) annulatus
FEMALE: MALE:
Hypostomal teeth: 4+4columns Poros area: Broad oval
Palp articles 1: Slightly concave & long Hypostomal teeth: 4+4 column
Coxa 1 spurs: Indistinct Cornua: Distinct
Coxae 2 & Coxae 3 Spurs: Absent Coxa 1 spus: Short
Genital aperture: Posterior lips wide U shaped Ventral plate spurs: Indistinct
Caudal appendages: Absent
SEVERITY OF TICK INFESTATION IN BOTH DISTRICTS QUETTA AND SIBI
To evaluate the severity/density of ticks infestation in different seasons, the whole body
of the selected animals were examined properly on monthly basis for tick infestation and scored
as described by Pusterla et al. (1998) i.e. mild (<10 ticks/animal), moderate (10 to 30
ticks/animal), or severe (>30 ticks/animal). The results of the present study revealed that; mild
tick infestation in March, April, October and November, moderate in August and September
while severe tick infestation was recorded in May, June and July.

235
4.2: EXPERIMENTAL STUDY
4.2.1: Introduction of babesia infection in experimental animals
Out of 148 cattle 108 animals 36 from each breed negative for Babesia spp. were selected
for experimental study and presented to Boophilus ticks (reared on rabbit) infected with babesia
by “ear bag technique”. The study was conducted during the months of summer season at Quetta
dairy farm, District Quetta. The appearance of babesia infection was recorded on the basis of
clinical signs, blood smear examination and Polymerase Chain Reaction.
4.2.2: Prevalence of babesia infection in experimental Bhag Nari cattle by PCR
In Bhag Nari cattle, PCR detected overall prevalence of babesia infection 50% (18/36).
Of these 30.55% (11/36) was recorded in female while 19.44% (7/36) was detected in male
cattle. Similarly the highest prevalence 83.33 % (5/6) was identified in adult group of cattle over
3 years of age while the lowest rate 33.33% (2/6) was noticed in young animals 6 months of age
(Table 4.2.2 and Figure 4.2.2). The difference of prevalence of babesia infection in both male
and female groups of experimental cattle was statistically not significant (P<0.05).

236
Table 4.2.2: Prevalence of babesia infection in experimental Bhag Nari cattle by PCR.
Group of
animals
Sub-group of
animals
No. of
Samples
examined
Positive
samples for
babesia
infection
Prevalence
Percent
(%)
P Value
M F/M M F/M M F/M
Young
animals less
than 12
months
Less than 6
months
3 3 1 1 33.33
0.9478 0.5532
Up to 9 months 3 3 1 1 33.33
Up to 12
months
3 3 1 2 50
Adult animals
over 12
months
Up to 2 years 3 3 1 2 50
Up to 3 years 3 3 1 2 50
Over 3 years 3 3 2 3 83.33
Figure 4.2.2: Prevalence of babesia infection in experimental Bhag Nari cattle by PCR.
(33.33) (33.33)
(50) (50) (50)
(83.33)
0
20
40
60
80
100
Animals lessthan 6 months
Up to 9months
Up to 12months
Up to 2 years Up to 3 years Over 3 years
Animals less than 6 months Up to 9 months Up to 12 months
Up to 2 years Up to 3 years Over 3 years

237
4.2.3: Prevalence of babesia infection in experimental Bhag Nari cattle by blood smears.
Blood smears examination revealed the overall prevalence of babesia infection in Bhag
Nari cattle 16.66% (6/36). Among these 11.11% (4/36) was found positive in female while
19.44% (2/36) were recorded in male. Adult animals over 3 years of age revealed highest
prevalence 50 % (3/6) followed by 33.33 (2/6) and 16.66% (1/6) in animal groups up to 3 years
and 2 years respectively but no case of infection was found in any young animals groups (Table
4.2.3 and Figure 4.2.3). The difference of prevalence of babesia infection in both male and
female groups of experimental Bhag Nari cattle was statistically not significant (P<0.05).
4.2.3 Table: Prevalence of babesia infection in experimental Bhag Nari cattle by blood
smears.
Group of
animals
Sub-group of
animals
No. of
Samples
examined
Positive
samples for
babesia
infection
Prevalence
(%)
P value
M F/M M F/M M F/M
Young animals
less than 12
months
Less than 6
months 3 3 0 0 0
0.4799 0.2667
Up to 9 months 3 3 0 0 0
Up to 12
months
3 3 0 0 0
Adult animals
over 12 months
Up to 2 years 3 3 0 1 16.66
Up to 3 years 3 3 1 1 33.33
Over 3 years 3 3 1 2 50
Grand Total 18 18 2 4 16.66

238
Figure 4.2.3: Prevalence of babesia infection in experimental Bhag Nari cattle by blood
smears.
4.2.4: Prevalence of babesia infection in experimental Holstein Friesian cattle by PCR
In Holstein Friesian the prevalence of babesia infection was noticed higher than Bhag
Nari and Crossbred cattle. The results of PCR exposed the overall prevalence 61.11% (22/36) out
of which 36.11% (13/36) were female whereas 25% (9/36) were male. The prevalence of
infection was recorded higher 100% (6/6) in adult animals group over 3 years of age followed by
animals less than 3 years, 2 years, 12 months, 9 months and 6 months of age respectively (Table
4.2.4 and Figure 4.2.4). Statically there was no significant difference (P<0.05) in prevalence of
babesia infection in both male and female groups of experimental Holstein Friesian cattle.
(0) (0) (0)
(16.66)
(33.33)
(50)
(16.66)
0
10
20
30
40
50
60
Less than 6months
Up to 9months
Up to 12months
Up to 2years
Up to 3years
Over 3years
OverallPrevelance
Prevalence Percent (%)

239
Table 4.2.4: Prevalence of babesia infection in experimental Holstein Friesian cattle by
PCR
Group of
animals
Sub-group
of animals
No. of
Samples
examined
Positive
samples for
babesia
infection
Prevalence
(%)
P value
M F/M M F/M M F/M
Young
animals less
than 12
months
Less than 6
months
3 3 1 1 33.33
0.4579 0.1545
Up to 9
months
3 3 1 1 33.33
Up to 12
months
3 3 1 2 50
Adult
animals over
12 months
Up to 2
years
3 3 1 3 66.66
Up to 3
years
3 3 2 3 83.33
Over 3
years
3 3 3 3 100
Grand Total
18 18 9 13 61.11

240
Figure 4.2.4: Prevalence of babesia infection in experimental Holstein Friesian cattle by
PCR.
4.2.5: Prevalence of babesia infection in experimental Holstein Friesian cattle by Blood
Smears
The blood smears examination revealed the overall prevalence 38.88% (14/36) in
Holstein Friesian cattle. Among these 27.77% (10/36) were female while the remaining 66.66%
(4/6) male animals. The adult group of animals over 3 years presented higher prevalence 83.33%
(5/6) followed by 66.66% (4/6) and 50% (3/6) in age group of animals up to 3 years and 2 years
respectively while equal prevalence 16.66% (1/6) and 16.66% (1/6) was recorded in age groups
of 12 months and 9 months respectively, however no case of infection was noted in animals
group less than 6 months (Table 4.2.5 and Figure 4.2.5). Statically there was no significant
difference (P<0.05) in prevalence of babesia infection in both male and female groups of
experimental Holstein Friesian cattle.
(33.33) (33.33)
(50)
(66.66)
(83.33)
(100)
0
20
40
60
80
100
120
Less than 6months
Up to 9months
Up to 12months
Up to 2years
Up to 3years
Over 3 years
Less than 6 months Up to 9 months Up to 12 months
Up to 2 years Up to 3 years Over 3 years

241
Table 4.2.5: Prevalence of babesia infection in experimental Holstein Friesian cattle by
Blood Smears.
Group of
animals
Sub-group
of animals
No. of
Samples
examined
Positive
samples for
babesia
infection
Prevalence
(%)
P value
M F/M M F/M M F/M
Young
animals less
than 12
months
Less than 6
months
3 3 0 0 0
0.2667 0.07812
Up to 9
months
3 3 0 1 16.66
Up to 12
months
3 3 0 1 16.66
Adult animals
over 12
months
Up to 2 years 3 3 1 2 50
Up to 3 years 3 3 1 3 66.66
Over 3 years 3 3 2 3 83.33
Grand Total 18 18 4 10 38.88

242
Figure 4.2.5: Prevalence of babesia infection in experimental Holstein Friesian cattle by
Blood Smears.
4.2.6: Prevalence of babesia infection in experimental Crossbred cattle by PCR
Among Cross bred cattle almost all group of animals exhibited the babesia infection. The
overall prevalence was recorded 52.77% (19/36). Among these the contribution of female and
male was 33.33% (12/36) and 19.44% (7/36) respectively. The adult group of animals over 3
years revealed higher prevalence 83.33% (5/6) followed by age group up to 3 years 66.66% (4/6)
while the group of animals up to 2 years, 12 months, 9 months and 6 months presented equal
prevalence rate i.e. 50% (3/6), 50% (3/6), 33.33 (2/6) and 33.33% (2/6) respectively. The
prevalence of babesia infection was noted higher than male animals (Table 4.2.6 and Figure
4.2.6). No significant difference (P<0.05) was noted in the prevalence of babesia infection in
both male and female groups of experimental Crossbred cattle.
(0)
(16.66) (16.66)
(50)
(66.66)
(83.33)
(38.88)
0
10
20
30
40
50
60
70
80
90
Less than 6months
Up to 9months
Up to 12months
Up to 2years
Up to 3years
Over 3years
OverallPrevalence
Prevalence Percent (%)
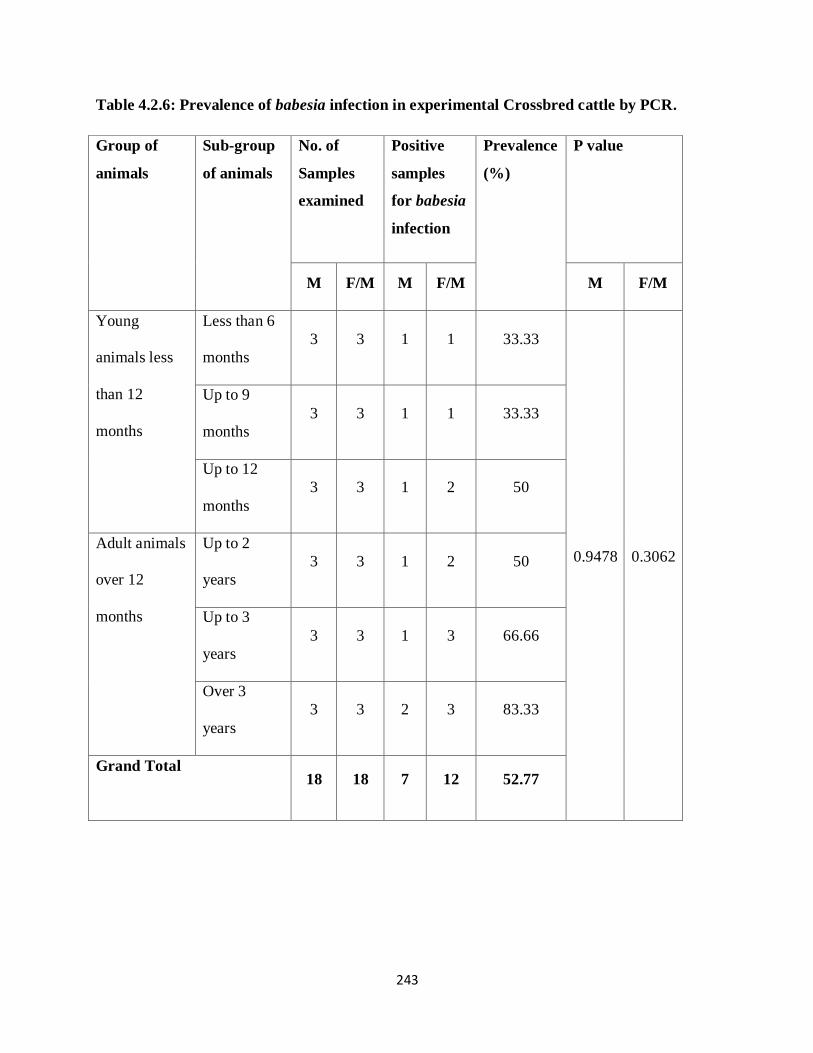
243
Table 4.2.6: Prevalence of babesia infection in experimental Crossbred cattle by PCR.
Group of
animals
Sub-group
of animals
No. of
Samples
examined
Positive
samples
for babesia
infection
Prevalence
(%)
P value
M F/M M F/M M F/M
Young
animals less
than 12
months
Less than 6
months
3 3 1 1 33.33
0.9478 0.3062
Up to 9
months
3 3 1 1 33.33
Up to 12
months
3 3 1 2 50
Adult animals
over 12
months
Up to 2
years
3 3 1 2 50
Up to 3
years
3 3 1 3 66.66
Over 3
years
3 3 2 3 83.33
Grand Total 18 18 7 12 52.77
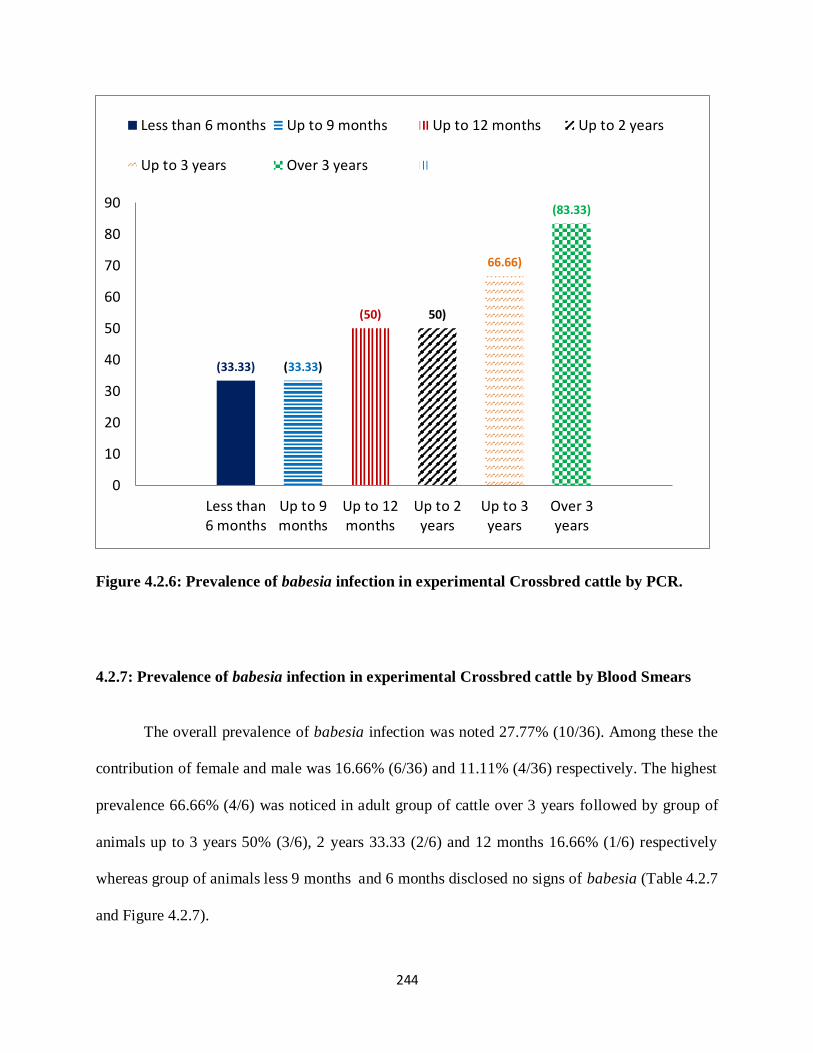
244
Figure 4.2.6: Prevalence of babesia infection in experimental Crossbred cattle by PCR.
4.2.7: Prevalence of babesia infection in experimental Crossbred cattle by Blood Smears
The overall prevalence of babesia infection was noted 27.77% (10/36). Among these the
contribution of female and male was 16.66% (6/36) and 11.11% (4/36) respectively. The highest
prevalence 66.66% (4/6) was noticed in adult group of cattle over 3 years followed by group of
animals up to 3 years 50% (3/6), 2 years 33.33 (2/6) and 12 months 16.66% (1/6) respectively
whereas group of animals less 9 months and 6 months disclosed no signs of babesia (Table 4.2.7
and Figure 4.2.7).
(33.33) (33.33)
(50) 50)
66.66)
(83.33)
0
10
20
30
40
50
60
70
80
90
Less than6 months
Up to 9months
Up to 12months
Up to 2years
Up to 3years
Over 3years
Less than 6 months Up to 9 months Up to 12 months Up to 2 years
Up to 3 years Over 3 years

245
Table 4.2.7: Prevalence of babesiosis in experimental Crossbred cattle by Blood Smears.
Group of
animals
Sub-group
of animals
No. of
Samples
examined
Positive
samples
for babesia
infection
Prevalence
(%)
P value
M F/M M F/M M F/M
Young
animals less
than 12
months
Less than 6
months
3 3 0 0 0
0.2667 0.3062
Up to 9
months
3 3 0 0 0
Up to 12
months 3 3 0 1 16.66
Adult animals
over 12
months
Up to 2
years 3 3 1 1 33.33
Up to 3
years 3 3 1 2 50
Over 3 years
3 3 2 2 66.66
Grand Total
18 18 4 6 27.77

246
Figure 4.2.7: Prevalence of babesiosis in experimental Crossbred cattle by Blood Smears.
4.2.8: Comparison between the capability of PCR and Blood smear examination of
experimental animal samples.
Out of 108 cattle 59 animals were found positive for babesia infection. Among these
blood smears examination detected only 27.77% (30/108) while PCR detected babesia parasites
in all 59 samples (54.62%) and even samples that were declared negative by blood smear
examination were also found positive (Table 4.2.8 and Figure 4.2.8). The statistical analysis
showed significant difference (P<0.05) between the capability of PCR and blood smears in
different age groups of cattle.
(0) (0)
(16.66)
(33.33)
(50)
(66.66)
0
10
20
30
40
50
60
70
Less than 6months
Up to 9months
Up to 12months
Up to 2years
Up to 3years
Over 3years
Prevalence Percent (%)
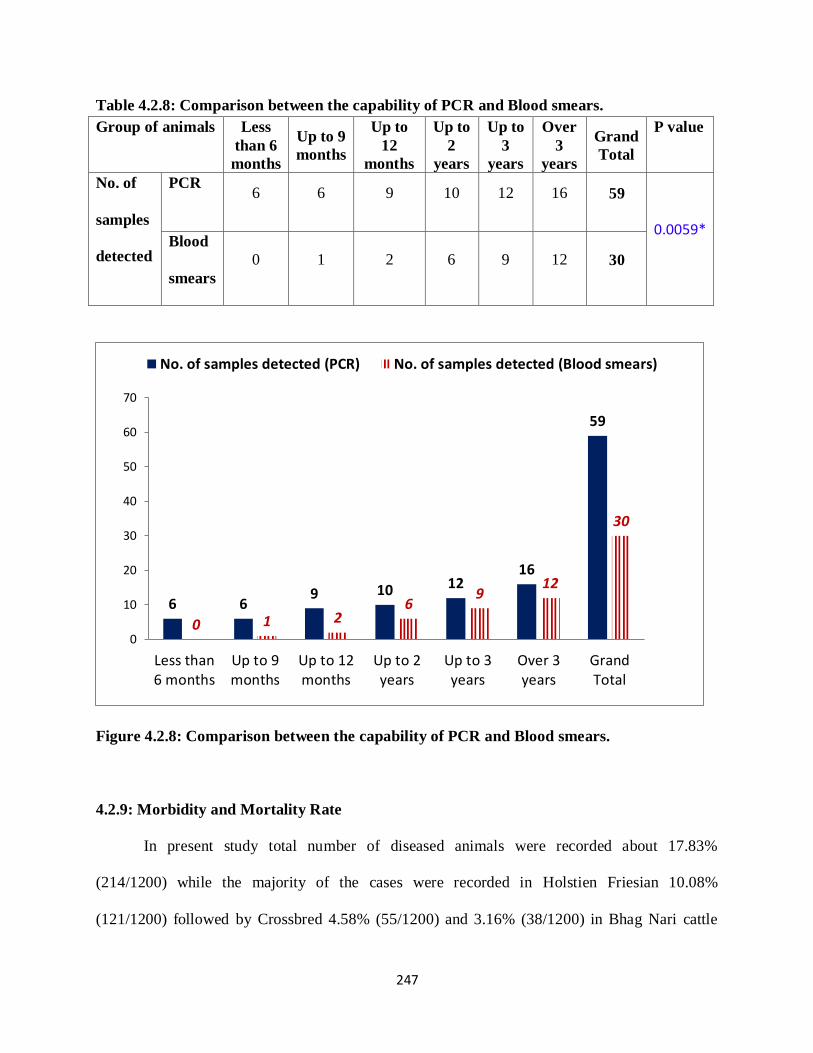
247
Table 4.2.8: Comparison between the capability of PCR and Blood smears.
Group of animals Less
than 6
months
Up to 9
months
Up to
12
months
Up to
2
years
Up to
3
years
Over
3
years
Grand
Total
P value
No. of
samples
detected
PCR 6 6 9 10 12 16 59
0.0059* Blood
smears
0 1 2 6 9 12 30
Figure 4.2.8: Comparison between the capability of PCR and Blood smears.
4.2.9: Morbidity and Mortality Rate
In present study total number of diseased animals were recorded about 17.83%
(214/1200) while the majority of the cases were recorded in Holstien Friesian 10.08%
(121/1200) followed by Crossbred 4.58% (55/1200) and 3.16% (38/1200) in Bhag Nari cattle
6 69 10 12
16
59
0 1 26
912
30
0
10
20
30
40
50
60
70
Less than6 months
Up to 9months
Up to 12months
Up to 2years
Up to 3years
Over 3years
GrandTotal
No. of samples detected (PCR) No. of samples detected (Blood smears)

248
respectively. Majority of the cases of Babesia infection were noticed in adults and females group
of animals. Mortality was recorded only in Holstien Friesian 0.41% (5/1200) in district Quetta.
Autopsy examination highlighted clear jaundice. Changes noted in shape and size of Kidney and
liver (darkened and enlarged) with swollen spleen of a soft spongy consistency. Hemorrhages
were present under the epicardium and the endocardium, and the pericardial sac contained a
large quantity of blood-stained fluid.
4.3: DIAGNOSIS OF BABESIA
4.3.1: Smear preparation
Microscopic glass slides were used for smear preparation and kept as clean as possible to
avoid any type of contamination. For this purpose slides were rinsed in 95% methyl alcohol and
clean with the help cloth to make sure the transparency of slide. A small drop of fresh whole
blood was placed on the smooth surface, near the short end of a clean slide. Placed the short end
of second slide (used as a spreader slide) and hold it near the blood drop at an angle of 45˚ until
the drop is contacted, pulled quickly the end of second slide and spread the blood on first slide,
thus formed a smear. Slides were finally allowed to air dry and processed for Giemsa staining.
4.3.2: Identification of Babesia species
The blood samples collected from selected animals were processed for the diagnosis of
pathogens responsible for bovine babesiosis. For this purpose blood smears were prepared and
examined under microscope as described by Soulsby (1982). The results of the laboratory tests
identified two babesia species i.e. babesia bigemina and babesia bovis as the causative agents of
bovine babesiosis in Districts Quetta and Sibi. However babesia bigemina was found in majority

249
of the samples collected during the course of study. The blood smears examination revealed the
same morphological characters of babesia species as previously described by Urquhart et al.
(1996) and the key presented by Bock et al. (2006). The b. bovis and b. bigemina were detected
within the red blood cells singly or in pair. Among these b. bovis were usually pear-shaped with
rounded distal ends and often found in pair separated at an obtuse angle to each other. Rounded,
elongated or cigar shaped babesia were also seen. Single b. bovis was found rounded and smaller
(length 1 to 1.5 µm, width 0.5 to 1 µm) than erythrocytes radius. Similarly b. bigemina was also
found in pair separated at an obtuse angle to each other while single b. bigemina showed
irregular shape. Comparatively b. bigemina was found longer (length= 3 to 3.5 µm and width= 1
to 1.5 µm) than b. bovis.
4.3.3: Polymerase Chain Reaction
4.3.3.1: Total DNA extraction from samples
Total DNA extracted from samples shown in Figure 4.3.3.1.
Figure 4.3.3.1: DNA extracted from blood samples.

250
4.3.3.2: The DNA Band
The Gel Doc™ XR+ system by Biorad USA was used to detect the DNA bands. (Fig
4.3.3.2 and 4.3.3.2.1)
Legend: Lane 1 Positive for babesia bovis, Lane M 1Kb ladder, Lane 2 negative sample
1 M 2
1000
400
600
500
~ 541
Fig 4.3.3.2: Detection of Babesia bovis
in cattle blood by PCR

251
Legend:
Lane 1 Positive for babesia bigemina
Lane M 1Kb ladder
Lane 2 positive sample
1000
bp
M 1 2
~1124 bp
500
bp
Fig 4.3.3.2.1: Detection of Babesia bigemina in cattle blood by PCR

252
4.4: Phase 2. HAEMATOLOGICAL EXAMINATION
All the blood samples collected during experimental study from experimental infected
and healthy animals were analyzed for different blood parameters i.e. erythrocyte count,
hemoglobin concentration, packed cell volume, total leucocytes count and differential leucocytes
count by using hematological analyzer and parameters were studied as described by Coles (1980.
The results of complete blood cell count from blood samples of infected experimental animal
showed regenerative, macrocytic hypochromic anemia. Blood smear examination showed
presence of many babesia with reticulocytes. Abnormalities in erythrocyte structure were seen.
The result of blood parameters of total erythrocyte count, total leukocyte count, packed cell
volume and hemoglobin showed significant decrease in all three affected Bhag Nari, Holstein
Friesian and Cross bred cattle babesiosis. The values of MCV and MCH were increased and
MCHC was slightly less than normal value (Table 4.4 and Annexure 4.4, 4.4.5 ).

253
Table 4.4: Effect of babesiosis on mean values of different blood parameters and
differential leukocyte count in different groups of cattle.
Blood
Parameters
Mean± Standard Error
Bhag Nari Holstein
Friesian
Crossbred Controlled Group
TLC/cmm
6.0600±3.01788
4.9400±.41061
5.8200±.08000
7.2400 ± .49153
TEC
6.7160±.43218
4.7640±.48440
5.8380±1.11926
7.9800± .18276
PCV %
27.9600±1.83782
21.6400±3.23985
25.3200±3.07155
32.2600 ±1.64274
Hb gm %
8.6000±1.19583
5.0200±.29563
6.7200±.77807
9.3000± 1.50233
Differential Leukocyte count
Neutriphils
%
27.9400±1.08885
21.1600±1.43059
26.8600±1.64152
28.7200±3.01121
Lymphocytes
%
61.7200±3.81004
64.5800±2.92855
62.9800±1.41082
61.1400±3.27271
Monocytes %
2.9000±.40866
1.1600±.18601
2.0200±.46195
3.3200±.67335
Eosinophils
%
5.3200±.69455
3.7800±.48518
4.4400±.36551
6.3800±.58086
Basophils %
1.6800±.08602
1.2200±.17720
1.3400±.18601
.7800±.28531

254
4.5: Phase 3. THERAPEUTIC STUDY
The therapeutic trial was done in 40 cattle equally distributed into 4 groups A, B, C and
D (10 animals in each group). The medication protocol is given in (Table 4.5). All the
experimental animals were kept under keen observation by taking daily rectal temperature,
appearance of clinical signs, blood smears examination and PCR. The cattle of group “A” treated
with Imidocarb dipropionate presented best results and recovered 6 animals with 60% efficacy at
day 3rd of post medication. Similarly at day 7th the numbers of recovered animals become
increased up to 8 and the efficacy was recorded as 80% while at day 10 th the drug recovered all
the 10 infected animals with 100% efficacy (Table 4.5.1 and figure 4.5.1). The cattle of group
“B” treated with Azadirachta indica (neem) showed no response to drug. As a result blood
smears and PCR detected babesia parasites in 6 samples at day 3rd while at the end of 7th day 4
more samples were declared positive for babesia infection. However at the end of day 10 th
Babeisa parasites were detected in all blood samples (Table 4.5.2 and Figure 4.5.2). The clinical
signs appeared with high fever, increased respiration and heartbeat, weakness, visible jugular
pulse, anorexia and depression but no death was seen in any age group. The cattle of group “C”
was kept as positive control (infected non-medicated) and presented the signs of infection.
Among these, two animals, one adult Holstein Friesian cattle over 3 years of age and one young
Cross bred cattle less than 6 months of age were found physically very weak at day 7 th. At the
end of day 10th the Holstein Friesian cattle was not survived furthermore. Before death the
animal exhibited high fever at day 3rd and continued till the end of trial, depression, increased
respiration and heart beats with audible sound, weakness, jugular pulse easily apparent,
constipation followed by diarrhea filled with mucous, white mucous membrane. The post
mortem revealed emaciated and dehydrated body. Enlarged soft and pulpy spleen observed.

255
Kidneys and liver found normal in size. Enlarged gall bladder with no changes in the bile was
seen. The cattle of group “D” was kept as Negative control (non-infected, non-medicated)
showed no sign of disease. All the animals were found healthy.
Table 4.5: The medication protocol for therapeutic study
Groups No. of animals Drug used (generic name) Trade name Dose
A 10 Imidocarb dipropionate Imizole of ICI,
Pakistan Ltd.
1 ml/100 kg body
weight I/M once
(single dose)
B 10 Azadirachta indica Neem
56.6 ml/ 100kg
body weight
Decoction once
(single dose)
C 10 Positive control (infected non-medicated)
D 10 Negative control (non-infected, non-medicated)
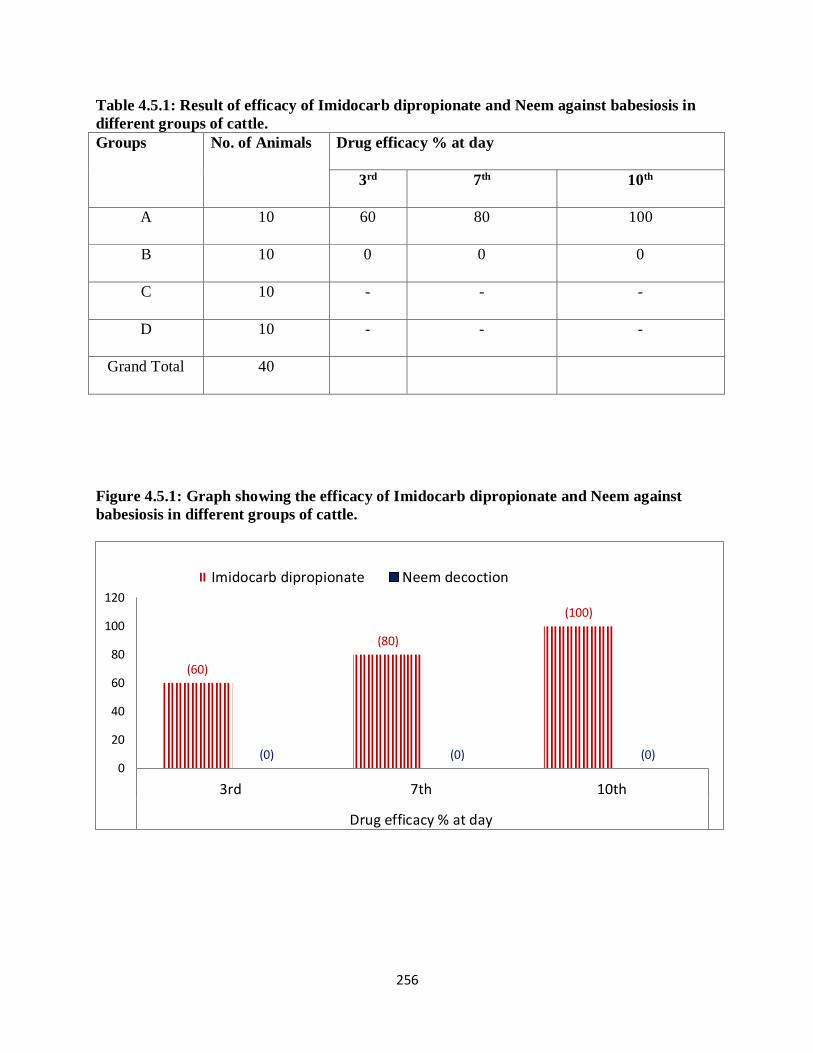
256
Table 4.5.1: Result of efficacy of Imidocarb dipropionate and Neem against babesiosis in
different groups of cattle.
Groups No. of Animals Drug efficacy % at day
3rd 7th 10th
A 10 60 80 100
B 10 0 0 0
C 10 - - -
D 10 - - -
Grand Total 40
Figure 4.5.1: Graph showing the efficacy of Imidocarb dipropionate and Neem against
babesiosis in different groups of cattle.
(60)
(80)
(100)
(0) (0) (0)0
20
40
60
80
100
120
3rd 7th 10th
Drug efficacy % at day
Imidocarb dipropionate Neem decoction

257
Table 4.5.2: Results of No. of cattle recovered/ no recovered from babesiosis
Figure 4.5.2: Graph showing No. of cattle recovered/no recovered from babesiosis
(6)
(8)
(10)
(0) (0) (0)0
2
4
6
8
10
12
3rd 7th 10th
Total No. of animals recovered at day
Imidocarb dipropionate Neem decoction
Groups of cattle No. of cattle Total No. of cattle recovered at day
3rd 7th 10th
A 10 6 8 10
B 10 0 0 0
C 10 - - -
D 10 - - -
Grand Total 40

258
Chapter- 5
DISCUSSION
5.1: EPIDEMIOLOGICAL STUDY
5.1.1: Prevalence of babesiosis and tick infestation
During field study, overall prevalence of babesiosis (20.5%) was recorded higher in all three
breeds of cattle in Quetta region than Sibi region (15.16%) while higher tick infestation rate
38.66% was noticed in Sibi region than Quetta region (35%). This difference might be due to
different topographic conditions, management practices, level of body immunity of animals or
dry hot environmental condition as drought is prevalent in the study area. The results are in
accordance with the findings of Alim et al. (2012) who reported the prevalence of babesiosis in
entire four study areas but higher prevalence (9.25%) was noticed in the hilly area of Rangunia
(Chittagong). Similar findings were made by Kabir et al. (2011) who reported that the cattle
maintained at hilly areas are 1.84 times more susceptible to tick infestation as compare to cattle
reared in plain areas. They highlighted higher tick infestation 44.44% in cattle of hilly areas
followed by 30.27% in plain areas. Hypothetically MacLeod (1970) described the reason of this
difference might be due to the presence of different herbs, shrubs and grasses that provides good
shelter to ticks eggs for hatching process. Similarly Kamal (1996) mentioned that this difference
may be due to shortage of water in hilly area, hence regular bath and rubbing practices are rarely
practiced in hilly areas. Radastits et al. (1994) mentioned that the out breaks are more likely to
occur under wet hot condition. This statement supports our study that higher prevalence of
babesiosis in Quetta and Sibi was recorded higher (50%) and 40% respectively during the

259
months of summer seasons in all three breeds of cattle. The findings of present study was also
correlated with the conclusions of Niazi et al. (2008) who reported the overall prevalence of
babesiosis 7.2% (30/415) in crossbred cow calves at the Livestock Experimental Station
Qadirabad, Sahiwal. Qamar et al. (2009) also recorded the same interpretations as presented in
present study. They detected total (45.2%) cases of protozoan parasites in buffalo blood samples.
Among these babesia spp. was found most prevalent (33%) followed by theileria (10.8%) and
trypanosoma (1.4%) respectively. In present study lower prevalence of babesiosis and lower tick
infestation rates were recorded in District Sibi particularly in Bhag Nari cattle which might be
due to good management practices and home tract of Bhag Nari cattle. The findings of present
study was in accordance with the statement of Bock et al. (2006) that dipping practices and use
of tick resistant breeds of cattle may helpful to control babesia infection for months or years.
Similar statement was presented by Adam (1998) that indigenous cattle are rarely affected by
babesia infection because of having powerful natural resistance/passive immunity however
stresses, hunger, parturition, diseases/parasitic infection may cause fail in the immunity. Another
reason of low prevalence of babesiosis in District Sibi might be due to the presence of less
number of babesia bigemina species in the area. The statement of Bock et al. (2006) supports our
findings that the rate of transmission of babesia bigemina is higher than b. bovis because more
ticks carry babesia bigemina rather than b. bovis. The results of present study are not in
agreement with Khan et al. (2004) who reported low prevalence of babesia infection in cattle
5.5% and 1.85% at National Agriculture Research Center and Barani Livestock Production
Research Institute, Islamabad respectively. The reason behind difference might be due to
availability of tick vectors or variation in study areas. In contrast with our observations Kabir et
al. (2011) noted significantly higher tick infestation 43.82% in local cattle than crossbred cattle

260
24.13%. They hypothetically mentioned that the reason behind this difference might be due to
lack of framers interest in local breeds while taking more interest/care to cross bred. The
statement of Atif et al. (2012) supports our observation that boophilous microplus tick is an
active vector responsible for the spread of hemoprotozoan parasites in Pakistan. Similar
observations were noted by Rony et al. (2010) who identified boophilus tick (45.63%) (By using
Key and permanent slides) followed by Rhipicephaluss anguineus (10.50%) as the most
prevalent tick species in cattle in Gazipur district, Bangladesh.
5.1.2: Prevalence of Mixed Hemoprotozoan in cattle
Mixed blood protozoan infection was observed during the course of study. About10.08%
theileria mixed with babesia species was noted in all three breeds of cattle. Among these highest
mixed infection 18.25% was noticed in Holstein Friesian, 9.5% in crossbred while 2.5% was
recorded in Bhag Nari breed. The results of present study are endorsed by the findings of
Duraniet al. (2010) who reported 1.5% theileria infection mixed with babesia species in both
Sahiwal and crossbred cattle during the months of summer and spring seasons in Punjab
Province. The result are also endorsed by Nasir et al. (2000) who reported three hemoprotozaon
parasites i.e. babesia, theileria and trypanosama in Jersey and Friesian cows. Among these
higher double mixed infection with trypanosama and theileiria was noticed in 20.8% Jersey
cows followed by 11.9% in Friesian cow samples while higher triple mixed infection with
babesia, theileiria and trypansoma (8.9%)was recorded in Holstein Friesian cows followed by
8.3% in jersey cow samples. Similar results were recorded by Alim et al. (2012) who evaluated
the prevalence of hemoprotozoan disease in indigenous and crossbred cattle in Chittagong
Bangladesh. They reported three major mixed hemoprotiozoan species in different age groups of
cattle i.e. babesia, theileiria and anaplasma. The same results were presented by García-

261
Sanmartín et al. (2006) who studied molecular diagnosis (Reverse Line Blot Macro arrays) of
babesia and theileria in Spain. They observed mixed infection in fourteen samples with six
different species combination. Among these five combinations were composed of two species
while the only one was included three species. Similarly theileria annulata was found jointly
with t. buffeli in four samples out of which two samples were detected together with b. bigemina.
Oliver et al. (1999) studied babesia and theileria parasites in cattle and concluded that both the
species often take place jointly in same host.
5.1.3: Severity/density of tick infestation in both districts
The severity/density of tick infestation in different seasons was analyzed on the basis of
guidelines described by Pusterla et al. (1998) i.e. mild (<10 ticks/animal), moderate (10 to 30
ticks/animal), or severe (>30 ticks/animal). The results of the present study revealed that; mild
tick infestation in March, April, October and November, moderate in August and September
while severe tick infestation was recorded in May, June and July. Similar observations were
made by Manan et al. (2007) who reported higher (ixodid) tick infestation in cattle (20.4%) than
sheep, goat, buffalo and donkey. They observed tick infestation during the months of August
25.8% followed by 21.3%, 15.8%, 10.5%, 8.4%, 6.7%, and 6.7% in September, October,
November, February, December and January respectively. In present study almost the same tick
species were identified as they identified in their study i.e. Boophilus (46.1%) Hyalomma
(31.25%) and Rhipicephalus (17.93%) respectively. Similar observations were presented by
Teglas et al. (2005) who reported higher prevalence of Boophilus microplus (54%) in cattle
during a study conducted in Guatemala. The present study showed the presence of ticks with
different proportions in different regions of the body. Among these udder including teats,
perineum and external genitalia was found highly tick infested regions. The result of the present

262
study revealed the most dominant tick species; Boophilus (35.5%) with predilection sites i.e.
dewlap, shoulder area, external genitalia and udder region legs particularly hind legs, abdominal
area and in some cases head regions particularly neck. Similarly Hyaloma (26.5%) was noted
with predilection sites; external genitalia, udder and perineum region. The findings of present
study correlated with the findings of Moges et al. (2012) who reported tick infestation in 169
native cattle in Chilga district, Ethiopia. They observed the highest tick infestation in June while
the lowest infestation was recorded during the month of February. Similarly they recorded
almost the same predilection sites of ticks as noticed in present study. They observed different
genera, namely Ambylomma, Boophilus, Rhipicephalus and Hyalomma. Amblyomma (53.35%)
was the most abundant and widely distributed genus followed by Rhipicephalus (35.35%) in all
study sites and Boophilus (3.57%) was the least. Ticks were widely distributed in different parts
of the host body such as ear, neck, tail, mammary gland, udder, groin and anal area region of
which udder, dewlap, anal area and tail regions were most infested parts of animal body and face
and neck was the least. However B. decolaratus was collected mostly from dewlap, head and
back but was also present on the rest of the body.
5.1.4: Breed wise Prevalence of Babesiosis
In present study in both areas the upper most prevalence of babesia infection was recorded in
Holstein Friesian followed by Crossbred cattle and Bhag Nari breed respectively. Statistically
highly significant difference (P<0.05) was observed in the prevalence of babesia infection in
different breeds of cattle in both districts. The higher prevalence of hemoprotozoan infection in
cross bred cattle than indigenous Bhag Nari cattle are in accordance with the PCR test results of
Durani et al. (2010) who reported higher prevalence of theileria infection (40.2%) followed by
23% in indigenous Sahiwal cattle. The findings of our study also correlated with the judgments
263
of Atif et al. (2012) who confirmed the higher prevalence of tick transmitted diseases in
Crossbred cattle than local breed. Similar observation were presented by Zahid et al.(2005) who
reported the higher incidence of theileria infection in Holstein Friesian 24% while 15% in Jersey
breed. They also observed the incidence of babesia 2.5% in both Holstein Friesian and Jersey
cattle. Similarly Neitz (1957) also noticed higher mortality 30-90% in Holstein Friesian than
local breed (5%). It was further coincided by Sohail et al. (2007) who recorded higher breed wise
prevalence of tick infestation in Holstein Friesian (86.16) followed by Crossbred (84.16%) while
the lowermost prevalence (23.16%) was recorded in local cattle breed (Sahiwal) while Alonso et
al. (1992) linked the reason with the genetic composition of cattle; that cattle having Bosin dicus
gene induce lower h value than Bos Taurus cattle because Boophilus microplus infestation is
inversely proportion of Bos Indicus genes and because parasitemia with Babesia bovis is lower in
Bos indicus cattle. Same opinion was presented by Muhanguzi et al. (2010) who reported the
uppermost prevalence (28%) of Babesia and theileria spp. in crossbred cattle against the
lowermost prevalence (8%) in exotic cattle breed.
5.1.5: Age wise Prevalence of Babesiosis
Higher prevalence of babesia infection was recorded in adult group of animals than young group
of animals in both districts. The present study was in accordance with the results of Alim et al.
(2012) who reported higher prevalence of hemoprotozoan in adult cattle (17.78%) than calves.
According to them babesia infection increased with the progress of cattle age. Similar findings
were made by Utech and Warton (1982) who confirmed young cattle more resistant than aged
animals. Supportive analyses were presented by Khan et al. (2004) who reported higher
prevalence of blood parasites infection in adult cattle (30.76%) than young group of cattle
923.07%). Similarly observations were noted by Atif et al. (2012) who studied 1050 cattle of

264
different breeds kept under changed menagmental condition and recorded higher prevalence of
hemoprotozoan in older cattle than young stock. They detected Anaplasma marginale and
Babesia bigemina infections with (9.52%) and (6.19%) respectively in age of animals between 2-
4 years whereas Theileria spp. was noticed (8.08%) in animal age groups between 1-2 years.
Similar judgment was presented by Alanso et al. (1992) who observed majority of the babesiosis
cases in cattle above 9 months of age while in Australia about 76% mortality was recorded in
cattle above 12 months of age. The statement of Barnett and Bailey (1955) also supports our
conclusions that young cattle have an age related resistance to most tick borne protozoan
parasites. Similarly Randuz (2008) admitted the role of colostrum feeding in calves that produces
immunity against diseases. In District Hyderabad, Memon (2001) collected 3000 buffaloes blood
samples and processed for blood smear examination to find out the prevalence of hemoprotozoan
infection in the area. He reported an overall prevalence of 39.0% with three genera of protozoan
i.e. Babesia, Theileria and Anaplasma. He also observed that the older animals over ten years
were found more susceptible than other age group. Supportive observations were presented by
Trueman and Bliht (1978) who conducted two experimental studies to analyze the effect of age
on resistance of cattle to babesia bovis. According to them older cows were found highly
susceptible to babesia bovis while innate resistance was found in calves from 5 to 6 months of
age.
5.1.6: Sex wise Prevalence of Babesiosis
In present study the prevalence of babesia infection in female cattle showed higher rate than
male animals in both regions. Similar results were reported by Atif et al. (2012) who identified
higher prevalence of theileria and anaplasma spp. in female group of cattle than male but in
contrary they recorded higher prevalence of babesia spp. in male than female cattle. The results

265
are correlated with the findings of Alim et al. (2012) who noticed the uppermost prevalence of
babesia infection (12.17%) in female cross bred cattle. They linked the reason behind this
phenomena might be because of keeping of female animals for long periods for milk production
and breeding purposes or may also be due to supply of insufficient feed. Similar findings were
made by Omer et al. (2012) who studied the prevalence of protozoan parasites in 229 indigenous
cattle in northern Iraq. They recorded 41.1% theileria spp. while 11.7% mixed with babesia spp.
while in another study conducted by Oliviera et al. (2005) identified babesia bovis and babesia
bigemina through PCR and Nested PCR techniques. They observed b. bovis in 25/25 (100%)
cow while b. bigemina in 21/25 (84%).
5.1.7: Season wise Prevalence of Babesiosis
Season wise prevalence of babesiosis in selected cattle in both regions was noted higher during
the months of summer (May, June, July, and August) followed by spring (March and April)
autumn (September and October) and winter (November, December, January and February),
respectively. The results are supported by Ananda et al. (2009) who noticed 57/132 samples
positive for blood parasites with significant seasonal differences. They observed the majority of
cases during the months of monsoon (summer months) might be because of increased in vector
population. Similar observations were noticed by Ibrahim (2012) who reported peak babesia
infection during the months of summer while the lowermost was recorded during the months of
winter, however our observations are not in agreement with their high prevalence of babesia
infection during the months of autumn. In India, Vehora et al. (2012) also recorded higher
incidence of blood protozoan in crossbred cattle during the months of June, July, August and
September which also coincide with the findings of Lempereur et al. (2012) who examined 65
different breeds of cattle i.e. Holstein, Montbeliard and Belgium White Blue for sero-prevalence

266
of babesiosis and anaplasmosis in Belgium. Their results showed higher sero-prevalences of
babesia spp. during summer (20%) followed by autumn (12.3%) and spring (10.75) respectively.
However minute difference might be due seasonal variation i.e. summer (July to August), spring
(May, June and July) while autumn (September) and breeds of cattle. Our observations disagree
with the findings of Safieldin et al (2011) who recorded no effect of seasons on the prevalence
protozoan parasites. However their justification about the uses of acaricides, antipiroplasmal
drugs and negligence by the farmers are to some extent acceptable.
5.1.8: Conventional Method and PCR
The results of present study confirmed higher prevalence of babesiosis in samples processed
through PCR during the entire 4 seasons in all age group of animals whereas blood smears
examination was capable to diagnose babesiosis in adult groups during the months of summer
and spring season. Similarly breed wise prevalence was also recorded higher in all 3 breeds of
cattle samples treated with PCR as compare to samples processed through blood smears
examination and even samples that were declared negative by blood smears examination were
also found positive. Thus on the basis of these observations we can declare the PCR as the more
sensitive and appropriate diagnostic technique even for the judgment of low grade infection.
These results are in relevance with Chaudhry et al. (2010) who conducted research based study
to highlight the best and/or more sensitive diagnostic technique against babesia spp. in cattle.
According to their observations blood smear examinations detected less number of samples
(18/100) positive for babesia bovis and b. bigemina while PCR detected large number of samples
(29/100) positive for babesia spp. Thus they declared the PCR as the more sensitive diagnostic
technique. Similar observations were noted by Durani et al. (2010) who compared three
diagnostic techniques i.e. Polymerase Chain Reaction test, Indirect Fluorescent Antibody test and
267
Blood Smear Examination. They noted the same characteristics of babesia spp. as observed in
present study i.e. Babesia bovis (1-1.5 X 0.5-1mm in size) with paired appearance at an obtuse
angle to each other while b. bigemina (3-3.5 X 1-1.5mm) which was found bigger in size than
babesia bovis with paired appearance at an acute angle to each other. According to their
conclusions higher prevalence of blood parasites (41.2%) was detected in samples processed
through PCR followed by (23.5%) and (6.8%) in samples processed through IFA and blood
smear examination. Today many researchers are in agreement with the fact that PCR is the most
reliable and sensitive diagnostic technique used in throughout the world. In this effort Mervat et
al. (2010) conducted a study to compare the performance of conventional and most modern
diagnostic techniques used in the diagnosis of bovine babesiosis in Kalubia, Egypt. Their results
are in line with the conclusions of present study as they also noted higher prevalence of
babesiosis in samples processed through PCR than the samples treated with blood smear
examination, however blood smear examination technique is helpful for the morphological
identification of babesia spp. particularly in acute cases but early diagnosis of babesiosis is an
essential control measure. PCR is capable to detect protozoan parasites even in long term carrier
animals. The diagnostic efficacy of PCR and blood smear examination against babesia parasites
were evaluated by Sumaira et al. (2013) who concluded PCR as an outstanding method for the
detection of blood parasites. Their results are in agreement with the results of present study.
According to their findings PCR detected higher prevalence of babesiosis (27.5%) in blood
samples collected from the targeted animals while only (9.8%) babesia infection was noted in
samples processed through blood smear examination. These results are in relevance with
Thammasirirak et al. (2003) who compared the efficacy of different diagnostic methods for the
detection of bovine babesia ptotozoan in Thialand. They made an effort to introduce a new

268
diagnostic technique i.e. PCR jointly with ELISA and compared its efficiency with blood smear
examination. According to their observations PCR-ELISA technique was found about 1000
times more efficient and more sensitive than blood smear examination. They also noted that
PCR-ELISA technique is less time consuming and also capable to examine a large number of
samples at one time even in animals with carrier status.
5.2: HAEMATOLOGICAL FINDINGS
The effect of babesiosis on different blood parameters of infected experimental animals are
described in (Table 4.4). The macrocytic hypocromic anaemia was noticed in animals affected
with babesiosis, possibly damaged bone marrow and erythropoiesis process. Similarly
regenerative changes and irregularities in RBC structure were observed in affected animals.
Significant decrease in Total Erythrocyte Count (TEC) and Hemoglobin (Hb) while with non-
significant decrease in Total Leukocyte Count (TLC) and PCV was noted in animals affected
with babesiosis (Annexure 4.4, Table 4.4.1, 4.4.2, 4.4.3, and 4.4.4). The results of statistical
analysis of differential leukocyte count, MCV, MCH, MCHC has been described in Annexure
4.4.5 (Table 4.4.5.1, 4.4.5.2, 4.4.5.3, 4.4.5.4 and 4.4.5.5). In the present study the comparison
between Holstein Friesian, Bhag Nari and Cross bred cattle showed significant difference in TEC
and Hemoglobin concentration while non-significant difference in TLC, and PCV. Similarly
significant difference was observed in neutrophils, monocytes and eosinophil while no
significant difference was recorded between lymphocytes and basophils. The Holstein Friesian
animals were infected more severely than BhagNari and Crossbred cattle. The results are in
agreement with the findings of Hussain et al. (2007) who reported normocytic hypochromic
anemia in cattle blood samples found positive for theileria infection. They also concluded the
same observation as noted in current study i.e. decrease in leukocyte count as well as in

269
neutrophils while increased in lymphocytes as compare to normal group of cattle. The findings
are validated by Ahmed and Hashmi (2007) who noticed significant decreased in TLC and TEC
in cattle affected with babesia infection. Similar interpretations were presented by Durani et al
(2010) who noted hematological changes in blood samples collected from infected cattle. They
observed structural defects in RBC and also decrease in PCV, TLC, TEC and Hemoglobin % in
affected cattle. Same observations were made by Ananda et al. (2009) who noticed declines in
different hematological values among cattle affected with hemoprotozoan infection. They
observed decrease level of hemoglobin (8gm/100ml), TEC (2.3million/cmm) and PCV (9%) in
cattle affected with hemoprtozoan infection while in severe cases fall in hemoglobin was
recorded to 3gm/100ml. Minor difference in the study might be due to variation in environmental
area and breeds of cattle.
5.3: Phase 3. THERAPEUTIC STUDY
Modern veterinary medicine used against bovine babesiosis is unaffordable for majority
of the livestock owners particularly in developing countries. Thus effort was made to assess the
effectiveness of herbal medicine “Neem” (Azadirachta indica) against bovine babesiosis while
Imidocarb dipropionate was used as standard drug treatment control. According to conclusions
of the study Imidocarb dipropionate revealed best results and recovered all the infected
experimental animals with 100% efficacy while cattle treated with neem showed no response to
drug till the end of trial. The reason behind the failure of neem might be due to low dose rate or
rout of administration of leaves in decoction form but further research is needed to find out the
exact cause of failure of neem against bovine babesiosis. The findings are endorsed by Sindu et
al. (2010) who stated that mode of preparation of Ethno Veterinary Medicine depends on rout of
administration. The findings are also correlated with the findings of Farahna et al (2010) who

270
reported no activity of neem against the P. berghei malaria parasite. They tested different
preparations of neem (300, 500 and 1000 mg/kg) in mouse to evaluate the efficacy of neem
extracts against malaria and concluded that all the mice treated with ethanol extracts of Neem
displayed increased parasitaemia gradually from day 0 of treatment (0 5%, 5.1% and 7.2%
respectively). The peak levels occurred at day 4, with a mean parasitaemia of 53% by day 4 of
treatment, and a decline to 21.9% by day 3 of treatment. They noticed the signs of cerebral
malaria in all Neem extract treated groups on day 3 of treatment. All of the mice were sacrificed
when they showed sign of terminal illness. In contrast, the chloroquine and artemether groups
showed no cerebral malaria symptoms and no deaths. These finding are in agreement with the
findings of present study that the Imidocarb dipropionate treated all the experimental animals
with no symptoms of babesia infection and noticed no deaths among the group of animals
treated with Imidocarb dipropionate. The results of present study are also in agreement with the
findings of Niazi et al. (2008) who reported the efficacy of Imidocarb dipropionate in calves
affected with babeisia infection. They concluded the 70% efficacy at 3rd, 90% at day 7th and
100% at day 10th. In another study conducted by Ramzan et al. (2008) who compared traditional
medicine neem (Azadirachta indica) leaves at the dose rate (40gm/100kg b.w) with modern
medicine i.e. doramectin (0.2mg/kg b.w) and ivermectin (0.2mg/kg b.w) to find out the efficacy
of best drug against tick infestation in cattle. According to them ivermectin showed best
performance with 100% efficacy followed by doramectin with 60% while neem showed no
response with 0% efficacy. Similar findings were noted by Zahid et al. (2005) who used
Imidicarb dipropionate against diseased Holstein Friesian and Jersey cattle and efficiently cured
the animals with 100% efficacy. The results are supported by Vial and Gorenflot (2006) who
described the effectiveness of Imidocarb dipropionate against babesia infection. According to

271
their assessments Imidocarb dipropionate replaced efficiently the three most familiar antibabsial
drugs i.e. amicarbalide isothionate, diaminazine aceturate and quinornium sulphate and can also
be used efficiently as chemoprophylactic drug. They further described its mode of action that; it
prevents the access of inositol into RBC containing babesia causing starvation of the parasite.

272
Chapter 6
SUMMARY
Babesiosis which is also called as piroplasmosisis, Texas fever, redwater or tick fever, is
an emerging, tick-transmitted (by a vector ixodidea) disease caused by intraerythrocytic parasites
of the genus babesia having considerable worldwide economic, medical, and veterinary impact.
Keeping in view the importance of babesiosis under local conditions, the present study was
designed to evaluate the status babesiosis in Balochistan. For this purpose field and experimental
studies were carried in two districts Quetta and Sibi of Balochistan Province to find out the status
of babesiosis in Bhag Nari, Holstein Friesian and Crossbred cattle. During field study
epidemiological status of babesiosis was highlighted by selecting 600 cattle randomly from each
district. The animals were distributed into 2 major groups i.e. Young animals less than 12 months
and adult over 12 months of age. These groups were further sub-divided into Young animals
(less than 6 months, up to 9 months and up to 12 months) while Adults animals (up to 2 years, 3
years and over 3 years). The vector of babesia was also kept under keen observation for the
prevalence/infestation rate, identification and economic losses caused during the course of study.
Blood samples were collected from each animal and processed for blood smears examination and
PCR for further confirmation of babesia infection. The blood samples were also processed for
hematological study to evaluate the effect of babesiosis on different blood parameters. For
experimental study 148 animals were selected through clinical signs of babesiosis, blood smear
examination and PCR. Out of theses 40 animals were maintained for therapeutic trail to find out
the cheapest and easily available drug against bovine babesiosis. For this purpose Neem leaves
were used in decoction form while Imidocarb dipopionate was kept as standard control. The

273
results of epidemiological study revealed higher prevalence of babesiosis (20.5%) in district
Quetta while 15.16% was recorded in District Sibi. Similarly higher prevalence was recorded in
Holstein Friesian than in Crossbred and Bhag Nari cattle respectively in both districts Quetta and
Sibi. Furthermore higher prevalence of babesiosis was recorded in adult groups of Holstein
Friesian than in Crossbred and Bhag Nari cattle. Similarly season wise higher prevalence of
babesia infection was noticed in summer followed by spring, autumn and winter respectively
while higher prevalence was noted in female group of animals than male animals. Blood smears
examination and PCR confirmed two babesia species i.e. babesia bigemina and babesia bovis.
Similarly Boophilus tick species were identified as the vector of babesia parasites. During
present study mixed hemoprotozaon infection of babesia mixed with theileria was recorded in
both districts. The results of conventional method and modern diagnostic technique (PCR)
revealed that PCR identified higher babesia infection during the entire 4 seasons as well as in all
age groups whereas blood smears examination was capable to diagnose babesiosis in adult
groups during the months of summer and spring season. Breed wise prevalence was also higher
in samples treated with PCR than blood smears examination and even samples that were declared
negative by blood smears examination were also found positive. The results of complete blood
cell count from blood samples of infected experimental animal showed regenerative, macrocytic
hypochromic anemia. Blood smear examination showed presence of many babesia with
reticulocytes. Abnormalities in erythrocyte structure were seen. The result of blood parameters of
total erythrocyte count, total leukocyte count, packed cell volume and hemoglobin showed
significant decrease in all three affected Bhag Nari, Holstein Friesian and Cross bred cattle. The
values of MCV and MCH were increased and MCHC was slightly less than normal value. No
efficacy of neem decoction was noted against bovine babesiosis.

274
Chapter- 7
LITERATURE CITED
Adams GL. 1998. Animal Health Issues in South Texas Cattle. Workshop on Beef Cattle
Production Systems & Natural Resources Conservation in Semi-Arid Lands of South
Texas & Northern México.
Afridi ZK, Ahmad I, Khattak GZ, Habibullah Q, Jamil M. 2005. Incidence of anaplasmosis,
babesiosis and theileriosis in dairy cattle in Peshawar. Sarhad J. Agri. 21: 311-316.
Ahmad N and Hashmi HA. 2007. A comparative study on the incidence of ticks and ticks borne
diseases on local and crossbred cattle in Malakand Agency. J. Anim. Pl. Sci., 17: 56-58
Alim MA, Shubhagata D, Krisna R, Masuduzzaman M, Sikder S, Mahmudul M, Hassan, Siddiki
AZ, Hossain AM. 2012. Prevalence of Hemoprotozoan Diseases in Cattle Population of
Chittagong Division, Bangladesh. Pak. Vet. J. 32:2:221-224.
Alonso M. 1992. Epidemiology of Bovine Anaplasmosis and Babesiosis in Latin America and
the Caribbean. Rev. Sci. Tech. Off. Intl. Epiz. 11:3:713 733.
Ananda KJ, Placid E, D’Souza, Puttalakshmamma GC. 2009. Prevalence of Haemoprotozoan
Diseases in Crossbred Cattle in Bangalore North. Vet. W. 2 :1:15-16.
Andrew WS. 2003. Animal Source Foods to Improve Micronutrient Nutrition in Developing
Countries: Global Production and Consumption of Animal Source Foods. J. Nutri.
133:4048–4053.
Anonymous 1999. Baluchistan District Database. P&D. Dept. Government of Balochistan.

275
Anonymous 2008. Bovine Babesiosis. Center for Food Security & Public Health and Institute for
International Cooperation in animal Biologics, College of Veterinary Medicine, Lowa
State University. Ames, Lowa. Pp. 1-6.
Anonymous 2008. Government of Balochistan Report.
Asif M. 2005. A Manual of Techniques Veterinary Parasitology. NVL, Min. FAL. Isd. Pk. Pp.
22-25, 29, 72-73.
Atif FA, Khan MS, Iqbal HJ, Ali Z. Ullah S. 2012. Prevalence of Cattle Tick Infestation in Three
Districts of the Punjab, Pakistan. Pak. J. Sci. 64:1.
Atif FA, Khan MS, Iqbal HJ, Roheen T. 2012. Prevalence of tick-borne diseases in Punjab
(Pakistan) and hematological profile of Anaplasma marginale infection in indigenous
and crossbred cattle. Pak. J. Sci. 64:1.
Benjamin MM. 1985. Outlines of veterinary clinical pathology. 3rd Ed. The lowa State Univ.
Press Amen Iowa, USA. Pp 48-52, 61-33, 70-73.
Bhutto B, Gadahi AJ, Khuhro A, Rajput HM, Bhutto F, Rajput MA, Talpur AR 2012. A Survey
on Haemo-protozoan parasites in buffaloes of Landhi Dairy Colony, Karachi-Pakistan.
IJAVMS 6:2:73-76.
Bishop JP and Garry AL. 1973. Combination Thin and Thick Blood Films for the Detection of
Babesia Parasitemia. Am. J. Vet. Res. 34:9.
Bock R, Jackson L, De VAJ. Jorgensen W. 2008. Babesiosis of cattle. In. Ticks Bio. Dis. Cont.
Bowman AS & Nuttall PA. eds. Camb. Uni. P. Cambridge, UK, 281–307.
Bock R, Jackson L, De-Vo A, Jorgensen W. 2004. Babesiosis of Cattle. Parasitol. 129:247–269.
Cambridge Uni. Press.

276
Bock RE, De-Vos AJ, Molloy JB. 2006. Tick-borne diseases. In. Australian New Zealand
Standard Diagnostic Procedures, Faragher J T, Ed. Subcommittee on Animal Health
Laboratory Standards.
Bolajoko MB, Moses GD, Gambari-Bolajok. 2011. Participatory Rural Appraisal of Livestock
Diseases among the Fulani Community of the BarkinLadi Local Government Area,
Plateau State, Nigeria. J. Vet. Med. Anim. Health 3:1:11-13.
Bose R, Jorgensen WK, Dalgliesh RJ, Friendhoff KT, DE-Vos AJ. 1995. Current state and future
trends in the diagnosis of babesiosis. Vet. Parasitol.57:61–74.
Callow LL, Mellors LT. 1966. A new vaccine for Babesia argentina infection produced in
Splenectomized calves. Aust. Vet. J. 42: 464-5.
Carter P. 2011. Department of Economic, Development and Innovation, the State of Queensland.
Center for Food Security and Public Health (CFSPH) 2008. Lowa State University.
Chaudhry ZI, Suleman M, Younus M, Aslim A. 2010. Molecular Detection of Babesia bigemina
and Babesia bovis in Crossbred Carrier Cattle through PCR. Pak. J. Zool. 42:2:201-204.
Chulmin K, Hiroshi I, Maria SH, Naoaki Y., Hiroshi S, Xuenan X, Kozo F, Ikuo I.
2007.Development of Taqman-based Real-time PCR assays for diagnostic detection of
Babesia bovis and Babesia bigemina. Am. J. Trop. Med. Hyg., 77:5:837-841.
Costa-Junior LM, Rabelo EML, Martins FOA, Ribeiro MFB. 2006. Comparison of different
direct diagnostic methods to identify Babesia bovis and Babesia bigemina in animals
vaccinated with live attenuated parasites. Vet. Parasitol. 139:231–236.
Criado-Fornelio A. 2007. A review of nucleic acid-based diagnostic tests for Babesia and
Theileria, with emphasis on bovine piroplasms. Para. Rome. 49:39–44.
De-Vos AJ, De Waal DT, Jackson LA. 2004. Bovine babesiosis.In.Infect. Dis. Lstk. 1:406–424.

277
Dhaliwal GS, Ramesh A, Opender K. 2004. Neem research in Asian continent: Present status
and future outlook. Depatt. Of Entomol., Punjab Agri. Uni., Ludhiana, India. Insect
Biopesticide Res. Cent., Jalandhar, India.
Donnelly J. 1973. Epidemiology of Babesia infection in cattle. Proc. Roy. Soc. Med. 66.
Durrani AZ, Kamal N. 2008. Identification of ticks and detection of blood protozoa in Friesian
cattle by polymerase chain reaction test and estimation of blood parameters in district
Kasur, Pakistan. Trop. Anim. H. Prod. 40:441–447.
Durrani AZ, Mehmood N, Shakoori AR. 2010.Comparison of Three Diagnostic Methods for
Theileria annulata in Sahiwal and Friesian Cattle in Pakistan. Pak. J. Zool. 42:4:467-472.
Economic Survey 2008-09, Government of Pakistan.
Emily K, Piper, Nicholas NJ, Cedric G, Ala E, Lew T, Paula M, Megan E, Vance, Louise AJ.
2009. Immunological Profiles of Bos taurus and Bos indicus Cattle Infested with the
Cattle Tick, Rhipicephalus (Boophilus) microplus. Clinic. and Vac. Immunol.16:7:1074-
1086.
FAO, 2009. http://faostat.fao.org/site/573/default.aspx.
Gesine B. 2008. Ethno botanical survey and biological screening of medicinal plants from
Vanuatu. University Library of Regensburg - 93042, Germany.
García-Sanmartín J, Nagore D, García-Pérez LA, Juste AR, Hurtado A. 2006. Molecular
Diagnosis of Theileria and Babesia pecies infecting Cattle in Northern Spain using
Reverse Line Blot Macroarrays.BMC. Vet. Res. 2: 16.
Gray J, Zintl A, Hildebrandt A, Hunfeld KP, Weiss L. 2010. Zoonotic babesiosis: Overview of
the disease and novel aspects of pathogen identity. Ticks and Tick-borne Diseases 1:3–
10.
Grisi, L, Massard, CL, Moya, BGE, Pereira, JB. 2002. Impacto econômico das principais
ectoparasitoses em bovinos no Brasil. A Hora Veterinária, 21:8-10.

278
Henri JV and Gorenflot A. 2006. Chemotherapy against Babesiosis. Vet. Parasitol.138:1-2:31.
Homer MJ, Irma AD, Sam RT, Peter JK, David HP. 2000. Babesiosis. Clin. Micro. Rev.13:3:
451–469.
Hunfeld KP. Hildebrandt A. Gray JS. 2008. Babesiosis: Recent insights into an ancient disease.
Intl. J. Parasitol. 38:1219–1237.
Hussein A, Mohammed N, Abdel S, Mohammed H, Karram, 2007. Theileriosis and Babesiosis
in cattle: Haemogram and some biochemical parameters. 13 th International Congress of
ISAH Tartu, Estonia.
Islam M, Ahmad S, Aslam S, Athar M. 2008. Mineral composition and anti-nutritional
components of shrubs: Rangeland species from the upland Baluchistan, Pakistan. Agri.
Consp. Sci. 73:1:27-35.
Jongejan F and Uilenberg G. 1994. Ticks and control methods. Rev. Sci. Tech. Off. Int. Epiz.
13:4:1201-1226.
Kabir MHB, Monda MMH, Eliyas M, Mannan MA, Hashem MA, Debnath NC, Miazi OF,
Mohiuddin C, Kashem MA, Islam MR, Elahi MF. 2011. An Epidemiological Survey on
Investigation of Tick Infestation in Cattle at Chittagong District, Bangladesh. Afri. J. O.
Micro. Res. 5:4:346-352.
Kakarsulemankhel JK. 2010. Re-description and new record of Argas (persicargas) persicus
(oken, 1881) (Acarina: Argasidae) from Balochistan, Pakistan. Pak. Entomol. 32:2.
Kamal AHM, Uddin KH, Mondal MMH. 1996. Prevalence of economically important ticks in
cattle and goat at Chittagong hilly areas of Bangladesh. Asian Aust. J. Sci. 9: 567-569.
Keirans EJ and Litwak RT. 1989. Pictorial Key to the Adults of Hard Ticks, Family Ixodidae
(Ixodida: Ixodoidea), East of the Mississippi River. J. Med. Entomol. 26:5:435-448.

279
Khan MQ, Zahoor A, Jahangir M and. Ashraf MM. 2004. Prevalence of blood parasites in cattle
and buffaloes. Pak. Vet. J., 24:4.
Kivaria FM.Estimated direct economic costs associated with tick-borne diseases on cattle in
Tanzania. Trop Anim Health Prod. 2006 May;38(4):291-9.
Lempereur L, Lebrun M, Cuvelier P, Sepult G, Caron Y, Saegerman C, Shiels B, Losson B.
2012. Longitudinal field study on bovine Babesia spp. and Anaplasma phagocytophilum
infections during a grazing season in Belgium. Parasitol. Res.110:1525–1530.
L'Hostis M. and Seegers H. (2002). Tick borne parasitic diseases in cattle: current knowledge
and prospective risk analysis related to the ongoing evolution in French cattle farming
systems. Vet. Res. 33:5:599-611.
Mackenstedt U., Gauer M., Fuchs P., Zapf F., Schein E., Mehlhorn H. (1995). DNA
measurements reveal differences in the life cycles of babesia bigemina and b. canis, two
typical members of the genus Babesia. Parasitol. Res. 81, 595–604.
MacLeod J 1970. Tick infestation patterns in the Southern Province of Zambia. Bull. Entomol.
Res. 60:2:253-274.
Manan A, Khan Z, Ahmad B, Abdullah. 2007. Prevalence and identification of ixodid tick
genera in frontier region Peshawar. J. Agri. Bio. Sci. 2:1.
Mary J. H., Irma A. D., Sam R. T., Peter J. K. and David H. P. (2000). Babesiosis. Clin Micro.
Rev.13:3: 451–469.
Masika PJ, Sonandi A, Van AW. 1997. Perceived causes, diagnosis and treatment of babesiosis
and anaplasmosis in cattle by livestock farmers in communal areas of the central Eastern
Cape Province, South Africa. J. S. Afr. Vet. Assoc. 68:2:40-4.

280
Masika PJ and Afolayan A J. 2003. An ethnobotanical study of plants used for the treatment of
livestock diseases in the Eastern Cape Province, South Africa. Pharm. Bio. 41:1:16-21.
McCosker PJ. 1979. Global aspects of the management and control of ticks of veterinary
importance. In Recent Advances in Acarology (ed. Rodriguez, J.) 2, pp. 45–53. New
York, Academic Press.
Memon, A.A. 2001. Prevalence of blood protozoa in buffaloes in district Hyderabad, Pakistan.
S.A.U. Tand. Pakistan.
Mervat, EI Talkhan OFA, Rdwan, Ali MA. 2010. Cattle babesiosis and associated biochemical
alteration in kalubyia governorate. Natu. & Sci. 0:8:3.
Minjauw B and Mc Leod A. 2003. Tick-borne diseases and poverty: the impact of ticks and tick-
borne diseases on the livelihood of small scale and marginal livestock owners in India
and eastern and southern Africa. Research report, DFID Animal Health Program.
Edinburg: Centre for Trop. Vet. Med., University of Edinburgh, UK.
Moges N, Bogale B, Fentahun T. 2012. Hard Ticks (Ixodidae): Species Composition, Seasonal
Dynamics and Body Site Distribution on Cattle in Chilga District, Northwest Ethiopia.
Asian Journal of Agricultural Sciences 4:5:341-345.
Mosqueda J, Olvera-Ramirez A, Aguilar-Tipacamu G, Canto GJ. 2012. Current advances in
detection and treatment of babesiosis. Curr. Med. Chem. 19:10:1504–1518.
Mukhebi AW., Chamboko T., O’Callaghan CJ., Peter TF., Kruska RL., Medley GF., Mahan,
SM., Perry BD. 1999. An assessment of the economic impact of heartwater (Cowdria
ruminantium infection) and its control in Zimbabwe. Prevent. Vet. Med. 39, 173–189.
Nasir AA, Hashmi HA, Afzal M. 2000. Prevalence of Haemoparasites in Exotic Cattle. Int. J.
Agri. Biol. 2:4.

281
Nasreen A, Chamon L, Javaid AG, Mirbahar KB, Memon MI. 2010. Efficacy of various
antiprotozoal drugs on bovine babesiosis, anaplasmosis and thileriosis. Vet. W. 3:6.
Nayel M, Mohamed K, El-Dakhly, Aboulaila M, Elsify A, Hassan H, Ibrahim E, Salama A,
Yanai T. 2012. The use of different diagnostic tools for Babesia and Theileria parasites
in cattle in Menofia, Egypt. Parasitol. Res. DOI 10.1007/s00436-012-2926-6.
Ndhlovu DN, Makaya PV, Penzhorn B. 2009. Tick infestation, and udder and teat damage in
selected cattle herds of Matabeleland South, Zimbabwe. Onderstepoort J. Vet.
Res.76:235–248.
Niazi N, Khan MS, Avais M, Khan JA, Pervez K, Ijaz M. 2008. A Study on Babesiosis in Calves
at Livestock Experimental Station Qadirabad and adjacent Areas, Sahiwal, Pakistan.
Pak. J. Agri. Sci. 45:2.
Nicola P, Jeannine BP, Ueli B, Hans L. 1998. Serological, Hematologic, and PCR studies of
cattle in an area of Switzerland in which tick-borne fever (caused by Ehrlichia
phagocytophila) is endemic. Clin Diagn Lab Immunol. 5:3: 325–327.
Ogbuewu IP, Odoemenam VU, Obikaonu HO, Opara MN, Emenalo OO, Uchegbu MC, Okoli
IC, Esonu BO, Iloeje MU. 2011. The Growing Importance of Neem (Azadirachtaindica
A. Juss) in Agriculture, Industry, Medicine and Environment: A review. Res. J. Med.
Plant, 5:3:230-245.
Ogunji FO and Dipeolu OO. 1977. The transmission of Theileria annulata to a rabbit by the
larvae of the tick Hyalomma rufipes. Lab. Ani. 11:39-40.
OIE Manual 2010.

282
Oliveira MCS, Oliveira TCG, Regitano LCA, Alencar MM, Neo TA, Silva AM, Oliveira H. N.
2008. Detection of Babesia bigemina in cattle of different genetic groups and in
Rhipicephalus (Boophilus) microplus tick Vet. Parasitol.155(3-4)281-286.
Oliveira-Sequeira, TCG, Oliveira MCS, AraujoJr, JP, Amar-ante, AFT. 2005. PCR-based
Detection of Babesia bovis and Babesia bigemina in their Natural Host Boophilus
microplus and Cattle. Int. J. Parasitol. 35:105–111.
Omer LT, Kadir MA, Ahmed JS. 2012. Seroprevalence of piroplasmosis with tick distribution in
northern Iraq. Ira. J. Vet. Sci. 26:3:105-108.
Pelzel MA. 2005. Cattle Fever Tick Surveillance in Texas. NAHSS,
www.aphis.usda.gov/vs/ceah/ncahs/nsu/outlook.
Pusterla N, Jeannine BP, Ueli B, Hans L. 1998. Serological, Hematologic, and PCR studies of
cattle in an area of Switzerland in which tick-borne fever (caused by Ehrlichia
phagocytophila) is endemic. Cl. Diag. Lab.Immunol.5:3:325–327.
Qamar M F, Sulehria AQK, RazaI, AbassS, MaqboolA. 2009. Prevalence of blood Protozoans in
buffaloes at Rahim Yar Khan, Pakistan. Bio. Pak. 55:1&2:73-77.
Radostits OM, Blood DC, Gay CC. 1994. Veterinary Medicine. A textbook of diseases of cattle,
sheep, pig, goat and horses. 7thEdition.Bath press Avon, Great Britain. Pp 38-106, 1311-
1367.
Rahul S, Ghosh S, Mandal DB, Azhahianambi P, Singhal PS, Pandey NN, Swarup D. 2008.
Efficacy of Azadirachta indica extracts against Boophilus microplus. Parasitol. Res.104:
149-153.
Rajput ZI, Song-hua HU, Wan-jun C, Abdullah AG, Chen-wen X. 2006. Importance of Ticks
and their Chemical and Immunological Control in Livestock. J. Zhejiang Univ. Sci. B.
7:11:912-921.

283
Ramzan M, Khan MS, Avais M, Khan JA, Pervez K, Shahzad W. 2008.Prevalence of
Ectoparasites and Comparative Efficacy of different Drugs against Tick Infestation in
Cattle. J. Anim. Pl. Sci. 18:1.
Regitano LCA, Martinez ML, Machado MA. 2006. Molecular aspects of bovine tropical
adaptation. 8th World Congress on Genetics Applied to Livestock Production, Belo
Horizonte, MG, Brasil.
Safieldin M, Gadir AA, Elmalik K. 2011. Factors affecting seasonal prevalence of blood
parasites in dairy cattle in Omdurman locality, Sudan. J. C. Ani. Bio. 5:1:17-19.
Sajid SM. 2007. Epidemiology and Acaricidal resistance of tick population infesting domestic
ruminants. PhD. Thesis, Dept. of Vet. Para.Uni. of Agri. Fsd. Pakistan.
Sajjad MK and Musarrat AK. 2001. Heritability of birth weight in Bhagnari and its crosses with
Droughtmaster in Pakistan. Pak. J. Agri. Sci.V:38:l-2.
Sajjad MK, Zia UR, Muqarrab AK, Ahmad S. Genetic Resources and Diversity in Pakistani
Cattle. Pakistan Vet. J., 2008, 28:2: 95-102.
Samreen Z, Shahnawaz S, Ali M, Bhutta MA, Iqbal S, Hayat S, Qadir S, Latif M, Kiran N,
Saeed A, Ali M, Iqbal F. 2012. Detection of Babesia bovis in blood samples and its
effect on the hematological and serum biochemical profile in large ruminants from
Southern Punjab. A.P.J. Trop. Biomed.104-108.
Shafiq M and Kakar MA. 2006. Review Current Livestock Marketing and its Future Prospects
for the Economic Development of Balochistan–Pakistan.Int. J. Agri. Biol. 8:6.
ShaikhR,Nazil S, Ramzan K, Raizuddin S, Sattar S, Khan SN 2005. A new locus for non
syndromic deafness DFNB51 maps to chromosomes. Am. J. Med. Genet. A. 138: 295-
392.
284
Shafy AS and Zayed AA. 2002. In vitro acaricidal effect of plant extract of neem seed oil
(Azadirachta indica) on egg, immature, and adult stages of Hyalomma anatolicum
excavatum (Ixodoidea: Ixodidae). Vet. Parasitol.106:1:89-96.
Shivan and M, Mondal DB, Ghosh S. 2009. Comparative efficacy of Annona squamosa and
Azadirachta indica extracts against Boophilus microplus Izatnagar isolate. Parasitol. Res.
(springerlink) pp.1085-1091.
Sindhu ZUD, Iqbal Z, Khan MN, Jonsson NN, Siddique M. 2010. Documentation of
ethnoveterinary practices used for treatment of different ailments in a selected hilly area
of pakistan. Int. J. Agric. Biol. 12:3:353–358.
Sohail S. M., Zafar I., Muhammad N. K., Ghulam M. and Muhammad K. K. (2009). Prevalence
and associated risk factors for bovine tick infestation in two districts of lower Punjab,
Pakistan. Pre. Vet. Med. 92:4:386-391.
Soulsby EJL. 1982. Helminths, Arthropods and Protozoa of domesticated animals. 7th Ed.
BaillierTindall and Cassel Ltd. London.
Springell, P.H., 1983. The Cattle tick in relation to animal production in Australia. Wld. Anim.
Rev., (FAO), 36:1-5.
Sumaira S, Ayaz S, Ali I, Khan S, Gul I, Gul N, Khan 2013. Sensitivity and Specificity of PCR
& Microscopy in detection of Babesiosis in domesticated cattle of Khyber Pakhtunkhwa,
Pakistan. Intl. J. Adv. Res. Technol. 2:5.
Taylor SM. 1983. Assessment of prevalence of clinical babesiosis in cattle in Northern Ireland.
Vet. Rec.112:247-250.
Teglas M, Matern E, Sarah L, Patrick F, Suman M, Mahan, Janet F. 2005. Ticks and tick-borne
disease in Guatemalan cattle and horses. Vet .Parasitol. 131:119–127.

285
Thammasirirak S, Siriteptawee J, Sattayasai N, Indrakamhang P. 2003. Detection of babesia
bovis in cattle by PCR-ELISA and Tomohiro Araki. 34:4.
Thrusfield M 2005. Vet. Epi. 3rdEd. Blackwell Science, London, UK, pp: 231-32-235
Thrusfield MV.1986. Describing disease occurrence In: Vet. Epi.1st Edi. Butterworth & Co. Ltd.
pp. 191–197.
Trueman KF, Blight GW.1978. The effect of age on resistance of cattle to Babesia bovis. Aust.
Vet. J. 54:6:301-5.
Urquhart GM, Armour J, Duncan JL, Jennings FW. 1996. Veterinary Parasitology. 2 nd Edi. The
Faculty of Veterinary Medicine, The University of Glasgow, Scotland. Pp181-189, 242-
246.
Vannier E and Krause PJ. 2009. Update on Babesiosis: Review Article. Interdis. Persp. O. Inf.
Dis. Article ID 984568, doi:10.1155/2009/984568.
Vehora SP, Patel JV, Patel BB, Patel SB, Umale RH. 2012. Seasonal incidence of
haemoprotozoal diseases in crossbred cattle and buffalo in Kaira and Anand districts of
Gujrat, India. Vet. World 5:4:223-225.
Vial HJ and Gorenflot A. 2006. Chemotherapy against babesiosis. Vet. Parasitol. 138:147–160.
Waal D. T. and Combrink M. P. (2006). Babesiosis, 1st International forum on Babesiosis. Vet.
Parasitol. 138:(1-2):88-96.
Walker AR, Bouattour A, Camicas JL, Estrada-Pena A, Horak IG, Latif AA, Pegram RG,
Preston PM. 2007. Ticks of Domestic Animals in Africa: A Guide to Identification of
Species. The University of Edinburgh; Bioscience Reports, 42 Comiston Drive,
Edinburgh EH10 5QR, Scotland, U.K.

286
ZafarI ,Sohail SM, Jabbar A, Zahid AR, Nisar KM. 2006. A text book of Techniques in
Parasitology. HEC, Isd. Pk. 1-104.
Zahid IA, Latif M, Baloch KB. 2005. Incidence and treatment of theileriasis and babesiasis. Pak.
Vet. J. 25:3.
Zintl A, Mulcahy G, Skerrett HE, Taylor MS, Gray S J. 2003. Babesia Divergens, a Bovine
Blood Parasite of Veterinary and Zoonotic Importance. Clin. Micro. Rev. 16:4:622–636.
Zwart D. 1985. Haemoparasitic diseases of bovines. Rev. Sci. Tech. Off. Int. Epiz. 4:3:447-458.