Buyback and Exchange Operations: Policies, Procedures and ...
44
OECD Working Papers on Sovereign Borrowing and Public Debt Management No. 5 Buyback and Exchange Operations: Policies, Procedures and Practices among OECD Public Debt Managers Hans J. Blommestein, Mehmet Emre Elmadag, Jacob Wellendorph Ejsing https://dx.doi.org/10.1787/5k92v18rh80v-en
-
Upload
khangminh22 -
Category
Documents
-
view
0 -
download
0
Transcript of Buyback and Exchange Operations: Policies, Procedures and ...
OECD Working Papers on Sovereign Borrowing and PublicDebt Management No. 5
Buyback and ExchangeOperations: Policies,
Procedures and Practicesamong OECD Public Debt
Managers
Hans J. Blommestein,Mehmet Emre Elmadag,
Jacob WellendorphEjsing
https://dx.doi.org/10.1787/5k92v18rh80v-en
2
OECD WORKING PAPERS ON SOVEREIGN BORROWING
AND PUBLIC DEBT MANAGEMENT OECD Working Papers on Sovereign Borrowing and Public Debt Management provide authoritative information on technical and policy issues in the area of public debt management (PDM) and government securities markets. Studies track closely structural issues, trends and challenges in government debt policies and markets. Topics include pressing government debt policy issues such as the measurement of sovereign risk; how to contain the cost of government borrowing operations; the use of electronic systems; sovereign asset and liability management (SALM); liquidity of markets in government debt; advances in risk management; the role of derivatives in PDM; linkages between PDM and monetary policy and the role of debt managers in pricing and managing contingent liabilities. These studies are prepared for dissemination among sovereign debt managers, financial policy makers, regulators, financial market participants, rating agencies, and academics. By providing information on this highly specialised field of government activity and policy, papers aim to stimulate discussions among a wider audience as well as further analysis. The series can be searched in chronological order or by theme.
OECD WORKING PAPERS ON SOVEREIGN BORROWING AND PUBLIC DEBT MANAGEMENT
are published on www.oecd.org/daf/publicdebtmanagement The statistical data for Israel are supplied by and under the responsibility of the relevant Israeli authorities. The use of such data by the OECD is without prejudice to the status of the Golan Heights, East Jerusalem and Israeli settlements in the West Bank under the terms of international law.
3
BUYBACK AND EXCHANGE OPERATIONS: POLICIES, PROCEDURES AND PRACTICES AMONG OECD PUBLIC DEBT MANAGERS
Hans J. Blommestein, Mehmet Emre Elmadag and Jacob Wellendorph Ejsing
*
Abstract This paper reports on a survey carried out among OECD government debt managers on the use of bond
buybacks and exchange operations. The survey shows that government debt managers use extensively
bond buybacks and exchanges (often referred to as "switches") as liability management tools.
Bond exchanges and buyback operations serve two main purposes. First, by reducing the outstanding
amounts of bonds close to maturity, exchanges and buybacks help in reducing roll-over peaks and thus
lowering refinancing risk. Second, exchanges and buybacks allow debt managers to increase the issuance
of on-the-run securities above and beyond what would otherwise have been possible. The resulting more
rapid build-up of new bonds enhances market liquidity of these securities. This in turn should eventually be
reflected in higher bond prices. Hence, bond exchanges and buybacks are aimed at lowering refinancing
risk. In addition these operations may also contribute to lower funding costs for governments.
JEL codes: H63, G28
Key words: sovereign debt management, liability management, debt buybacks, exchange operations, switches
* Hans J. Blommestein is Head of Public Debt Management and Bond Market Unit, OECD; Mehmet Emre
Elmadag (on leave from the Turkish Treasury) is a public debt specialist in OECD’s Public Debt Management and Bond Market Unit; Jacob Wellendorph Ejsing is an Advisor at Government Debt Management, Danmarks Nationalbank. The views expressed are personal ones and do not represent the views of the organisations with which the authors are affiliated.
4
BUYBACK AND EXCHANGE OPERATIONS: POLICIES, PROCEDURES AND PRACTICES AMONG OECD PUBLIC DEBT MANAGERS
Table of Contents
SECTION 1: Introduction on buyback and exchange operations....................................................... 6
1.1 Main reasons for using bond exchanges and buybacks ................................................................. 6
1.2 Other reasons for conducting bond exchanges and buybacks ....................................................... 8
1.3 Advantages and disadvantages of bond exchanges and buybacks ................................................ 9
1.4 The link between prefunding, liquidity buffers and buybacks ...................................................... 9
1.5 Accounting considerations related to buyback operations and switches ..................................... 10
SECTION 2: Practical challenges in conducting bond exchanges and buybacks ............................ 12
2.1 Measuring the cost effectiveness of buybacks and exchanges .................................................... 12
2.2 How much can realistically be bought back? .............................................................................. 14
SECTION 3: Survey Results on debt buybacks and exchange practices ......................................... 14
3.1. Debt buybacks ............................................................................................................................ 16
3.1.1 Countries that regularly conduct buyback operations ...................................................... 16
3.1.2 Countries that hold buyback operations on an irregular or ad hoc basis .......................... 20
3.1.3 Why do you conduct debt buybacks? ............................................................................... 22
3.1.4 Please specify the selection criteria for bond to be repurchased? .................................... 25
3.1.5 Please specify the methods used for buybacks ................................................................. 27
3.2 Bond exchanges (switches) ......................................................................................................... 31
3.2.1 Countries with regular exchange operations .................................................................... 31
3.2.2 Countries that hold exchange operations on an ad hoc basis ............................................ 33
3.2.3 Objectives of bond exchanges .......................................................................................... 36
3.2.4 Which costs are associated with exchanges (switches)? .................................................. 37
3.2.5 Selection criteria for source bonds in switch operations .................................................. 38
3.2.6 Methods for conducting exchange operations .................................................................. 40
5
Charts
Chart 1: Buybacks combined with increased on-the-run issuance .............................................................. 7
Chart 2: A bond exchange operation ........................................................................................................... 8
Chart 3: Relative value can strongly depend on the pricing metric used .................................................. 13
Chart 4: Effects of Buybacks on Outstanding Amounts (last 24 months of the lifespan of bonds) ......... 14
Chart 5: Canadian buyback operations ...................................................................................................... 18
Chart 6: Spain buyback program between 1999 – 2006 ............................................................................ 22
Chart 7: Canadian switch operations ......................................................................................................... 32
Chart 8: Reducing Polish refinancing risk via switch auctions (as of 29 February) in 2012..................... 33
Chart 9: The effect of the January 2012 switch operation on the Irish redemption profile ....................... 34
Chart 10: Exchange operations between 2007 and 2011 to smooth the redemption profile ..................... 35
Tables
Table 1: Use of exchanges and buybacks in OECD countries ................................................................. 15
Table 2: Regularity of the use of buybacks in OECD countries ............................................................... 16
Table 3: Buyback program of Kingdom of Belgium ................................................................................ 17
Table 4: French buyback operations between 2006 and 2011 .................................................................. 19
Table 5: Italy buyback operations for easing the redemption profile ....................................................... 20
Table 6: Reasons for buybacks in OECD countries ................................................................................. 23
Table 7: Selection criteria for buyback bonds .......................................................................................... 25
Table 8: Methods for buyback operations ................................................................................................ 27
Table 9: Auction versus Mandate for Italian buybacks ............................................................................. 29
Table 10: Regularity of the use of switches (exchanges) in OECD countries ........................................... 31
Table 11: Main objectives of switches (exchanges) in OECD countries .................................................. 36
Table 12: Costs related to exchanges (switches) ...................................................................................... 37
Table 13: Selection criteria for source bonds in switch operations ........................................................... 39
Table 14: Methods for conducting exchange operations ........................................................................... 40
Table 15: Switch procedures in Italy: auction (primary market) vs. electronic trading system (secondary market) ...................................................................................................................................................... 41
6
BUYBACK AND EXCHANGE OPERATIONS: POLICIES, PROCEDURES AND PRACTICES AMONG OECD PUBLIC DEBT MANAGERS
SECTION 1: Introduction on buyback and exchange operations
This paper reports on a survey carried out among OECD government debt managers on the use of
bond buybacks and exchange operations. The survey shows that government debt managers use
extensively bond buybacks and exchanges (often referred to as "switches") as liability management tools.
Before discussing the details of the survey results, this introductory section provides background on
the reasons for conducting these operations. It also discusses the practical challenges in using these
important liability management tools.
1.1 Main reasons for using bond exchanges and buybacks
Bond exchanges and buyback operations serve two main purposes. First, by reducing the outstanding
amounts of bonds close to maturity, exchanges and buybacks help in reducing roll-over peaks and thus
lowering refinancing risk.
Second, exchanges and buybacks allow debt managers to increase the issuance of on-the-run
securities above and beyond what would otherwise have been possible. The resulting more rapid build-up
of new bonds enhances market liquidity of these securities. This in turn should eventually be reflected in
higher bond prices. Hence, bond exchanges and buybacks are aimed at lowering refinancing risk. In
addition these operations may also contribute to lower funding costs for governments.
7
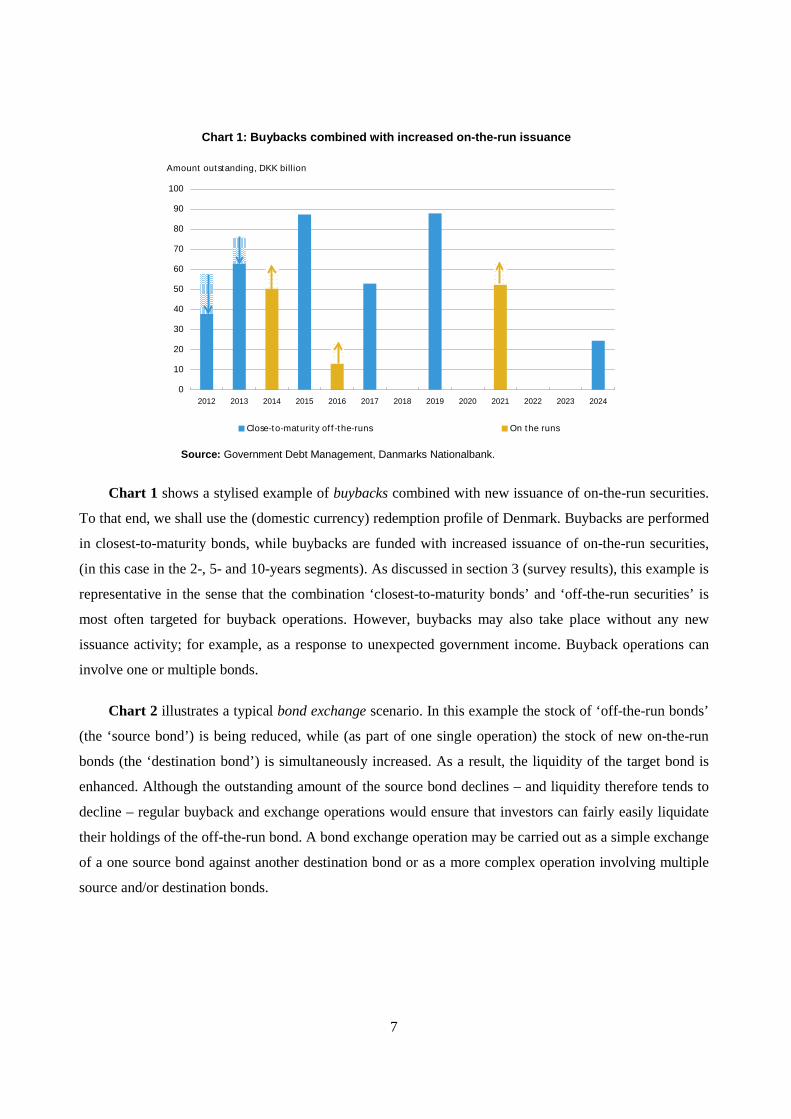
Chart 1: Buybacks combined with increased on-the-run issuance
Source: Government Debt Management, Danmarks Nationalbank.
Chart 1 shows a stylised example of buybacks combined with new issuance of on-the-run securities.
To that end, we shall use the (domestic currency) redemption profile of Denmark. Buybacks are performed
in closest-to-maturity bonds, while buybacks are funded with increased issuance of on-the-run securities,
(in this case in the 2-, 5- and 10-years segments). As discussed in section 3 (survey results), this example is
representative in the sense that the combination ‘closest-to-maturity bonds’ and ‘off-the-run securities’ is
most often targeted for buyback operations. However, buybacks may also take place without any new
issuance activity; for example, as a response to unexpected government income. Buyback operations can
involve one or multiple bonds.
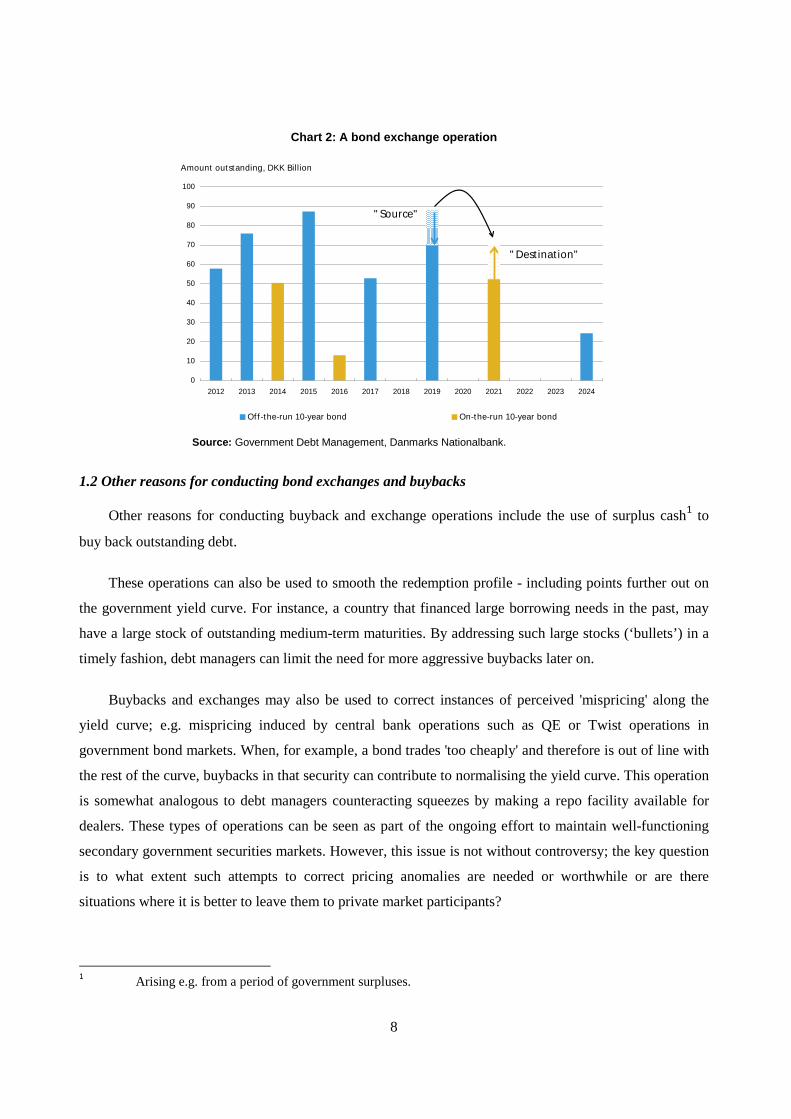
Chart 2 illustrates a typical bond exchange scenario. In this example the stock of ‘off-the-run bonds’
(the ‘source bond’) is being reduced, while (as part of one single operation) the stock of new on-the-run
bonds (the ‘destination bond’) is simultaneously increased. As a result, the liquidity of the target bond is
enhanced. Although the outstanding amount of the source bond declines – and liquidity therefore tends to
decline – regular buyback and exchange operations would ensure that investors can fairly easily liquidate
their holdings of the off-the-run bond. A bond exchange operation may be carried out as a simple exchange
of a one source bond against another destination bond or as a more complex operation involving multiple
source and/or destination bonds.
0
10
20
30
40
50
60
70
80
90
100
2012 2013 2014 2015 2016 2017 2018 2019 2020 2021 2022 2023 2024
Close-to-maturity of f -the-runs On the runs
Amount outstanding, DKK billion
8
Chart 2: A bond exchange operation
Source: Government Debt Management, Danmarks Nationalbank.
1.2 Other reasons for conducting bond exchanges and buybacks
Other reasons for conducting buyback and exchange operations include the use of surplus cash1 to
buy back outstanding debt.
These operations can also be used to smooth the redemption profile - including points further out on
the government yield curve. For instance, a country that financed large borrowing needs in the past, may
have a large stock of outstanding medium-term maturities. By addressing such large stocks (‘bullets’) in a
timely fashion, debt managers can limit the need for more aggressive buybacks later on.
Buybacks and exchanges may also be used to correct instances of perceived 'mispricing' along the
yield curve; e.g. mispricing induced by central bank operations such as QE or Twist operations in
government bond markets. When, for example, a bond trades 'too cheaply' and therefore is out of line with
the rest of the curve, buybacks in that security can contribute to normalising the yield curve. This operation
is somewhat analogous to debt managers counteracting squeezes by making a repo facility available for
dealers. These types of operations can be seen as part of the ongoing effort to maintain well-functioning
secondary government securities markets. However, this issue is not without controversy; the key question
is to what extent such attempts to correct pricing anomalies are needed or worthwhile or are there
situations where it is better to leave them to private market participants?
1 Arising e.g. from a period of government surpluses.
0
10
20
30
40
50
60
70
80
90
100
2012 2013 2014 2015 2016 2017 2018 2019 2020 2021 2022 2023 2024
Of f -the-run 10-year bond On-the-run 10-year bond
Amount outstanding, DKK Billion
" Source"
" Dest inat ion"
9
1.3 Advantages and disadvantages of bond exchanges and buybacks
As noted, bond exchanges combine buyback and issuance operations in a single operation, Not only
take issuance and buyback operations place at the exact same time, but they are also operationally linked in
the sense that a market participant must either take part in both operations or not at all. Bond exchanges
have advantages and disadvantages compared to the situation where issuance and buybacks are not strictly
linked.
Relative to buybacks, exchange operations allow investors to avoid interest rate and execution risk.
When an investor is allotted an amount in the buyback operation, he/she will also be allotted the
corresponding quantity in the issuance operation. In this way investors can avoid the interest rate and
execution risk that would arise when they would sell part of their holdings without simultaneously
acquiring replacement assets. This relative advantage is likely to be more pronounced in periods of market
turmoil, where high interest-rate volatility, wide bid-ask spreads and reduced market depth would tend to
make portfolio rebalancing via the secondary market more risky.
Similar advantages would accrue to government issuers who can buy back outstanding bonds while
simultaneously securing the funding of that buyback.
These advantages of exchanges relative to buybacks are, however, partly offset by the so-called
‘coincidence of needs’ problem: in order to participate in a specific bond exchange operation, investors
would of course need to have an interest to trade in the given direction in exactly those exchange bonds on
offer. This requirement may significantly dampen demand. Debt managers may try to alleviate this
problem by offering multiple source and/or destination bonds, although the operational complexity of
exchange operations will necessarily increase.
1.4 The link between prefunding, liquidity buffers and buybacks
Partly as a response to the funding pressures since the financial crisis erupted, there has been a
tendency among some government issuers to issue more than what is strictly needed in a given year. One
can distinguish between two different motives for such 'excess or extra issuance'.
The first motive is to prefund known future liabilities, most notably close-to-maturity government
bonds, in periods with high uncertainty about economic growth and high market volatility. In that situation,
governments, that enjoy currently good access to capital markets at relatively favourable borrowing costs,
may decide to prefund.
10
The second motive for excess issuance is to create a 'liquidity buffer'. Such a buffer could be used
against unforeseen shocks, such as unexpected financing needs related to bank rescue operations. Another
use of such a liquidity buffer is to redeem maturing debt in a (unexpected) situation with (much) higher
borrowing costs.
Hence, the 'liquidity buffer' approach encompasses the use of liquid assets to cover unforeseen
financing needs, whereas a 'prefunding' approach is focused on reducing future borrowing requirements.
This conceptual difference is important for understanding the interplay between exchanges/buybacks on
the one hand and prefunding and liquidity buffer on the other.
For example, if the purpose of excess issuance is the creation of a liquidity buffer, then there is little
or no room for buybacks. Clearly, buybacks would reduce or undermine extra issuance operations for
creating a liquidity buffer.
If, on the other hand, the purpose is to prefund (part of) future borrowing requirements, then the
question is how to invest the proceeds in the meantime (i.e. until future debt needs to be paid back). Such a
prefunding policy does not require that the proceeds are invested in (highly) liquid assets, but only that the
funds should be available to redeem bonds at a targeted point in time in the (near) future. Hence, a debt
manager can choose to hold the proceeds in either very liquid form or to invest it in some (credit-risk free)
instruments that match the maturity of the liabilities that are being pre-funded. Obviously, the closest
match possible between assets and liabilities is achieved simply by buying back the liabilities that are
being prefunded.
In practice, governments may choose a mixed strategy by both prefunding close-to-maturity liabilities
and by maintaining or creating a liquidity buffer of a specific preferred size. This combination of two 'pure'
strategies involves buybacks operations while at the same time leaving a specific amount of cash as liquid
buffer. Clearly, in such a 'mixed strategy' the debt manager faces a trade-off between the costs and benefits
of buybacks (further discussed below).
1.5 Accounting considerations related to buyback operations and exchanges
Buybacks can have a non-trivial impact on the reporting of government deficit and debt figures. In
some circumstances, buyback operations may involve a trade-off between the size of interest costs on the
one hand, and the size of the outstanding stock of debt on the other. For example, exchanging old, high
coupon bonds for on-the-run bonds with prices much closer to par, will lead to lower annual debt charges
in the following years. However, the nominal stock of debt will increase.
11
Take, as illustration, a government that has (i) a relatively large deficit, but (ii) a modest debt-to-GDP
ratio. By conducting massive buybacks in old, high-coupon bonds, the government could in principle
reduce deficits in the longer term at the expense of a higher nominal debt. In the short run, however,
buybacks may have an adverse impact on government deficits. For example, situations where DMOs are
buying back old, high-coupon bonds that are trading significantly above par. The entire associated capital
loss need then to be recorded in the public accounts in the year of the buyback. This, in turn, may lead to a
significant increase in the government deficit in the current (buyback) year. In extreme cases this can
amount to several percentage points of GDP.
Moreover, in countries where strict limits on deficits are in place, capital losses related to buybacks
would need to be offset by reductions in other government outlays. This may render buybacks and
exchanges less appealing. From this perspective it is important to assess the potential impact of the content
of fiscal rules on the use of buybacks (and switches). For example, strict fiscal rules for deficits could
induce governments to use buybacks (and bond exchanges) to comply with these rules.
When assessing the accounting effects of bond exchanges and buybacks, it is important to keep in
mind that they reflect essentially the notion that government balance sheets typically are not being marked-
to-market. In market-value terms, bond exchanges and buybacks would of course be wholly neutral with
respect to the debt level. The main rationale for reporting the government debt in nominal (as opposed to
market value) terms is that government debt is essentially a ‘hold-to-maturity’ portfolio. Arguably, from
this perspective at least, market value accounting would introduce (undesirable) volatility in government
deficits. Buybacks and switches inherently conflict with the notion of public debt being held to maturity,
and this is what is mirrored in the aforementioned accounting effects.
12
SECTION 2: Practical challenges in conducting bond exchanges and buybacks
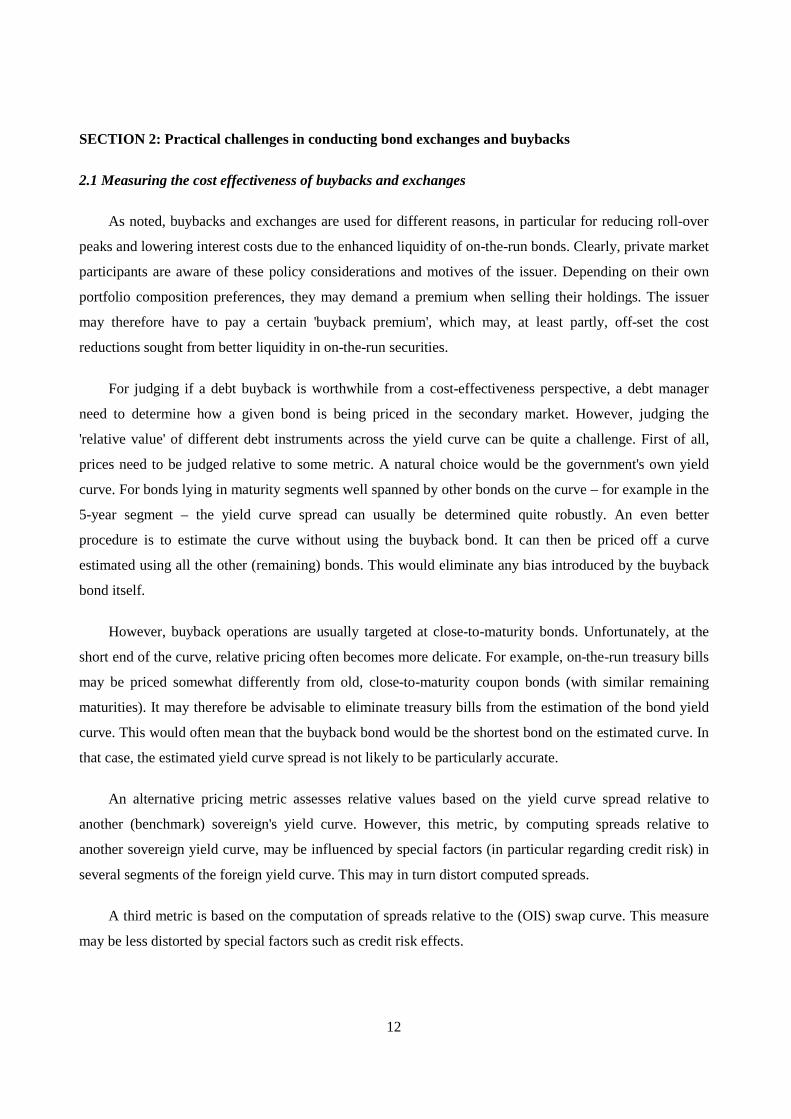
2.1 Measuring the cost effectiveness of buybacks and exchanges
As noted, buybacks and exchanges are used for different reasons, in particular for reducing roll-over
peaks and lowering interest costs due to the enhanced liquidity of on-the-run bonds. Clearly, private market
participants are aware of these policy considerations and motives of the issuer. Depending on their own
portfolio composition preferences, they may demand a premium when selling their holdings. The issuer
may therefore have to pay a certain 'buyback premium', which may, at least partly, off-set the cost
reductions sought from better liquidity in on-the-run securities.
For judging if a debt buyback is worthwhile from a cost-effectiveness perspective, a debt manager
need to determine how a given bond is being priced in the secondary market. However, judging the
'relative value' of different debt instruments across the yield curve can be quite a challenge. First of all,
prices need to be judged relative to some metric. A natural choice would be the government's own yield
curve. For bonds lying in maturity segments well spanned by other bonds on the curve – for example in the
5-year segment – the yield curve spread can usually be determined quite robustly. An even better
procedure is to estimate the curve without using the buyback bond. It can then be priced off a curve
estimated using all the other (remaining) bonds. This would eliminate any bias introduced by the buyback
bond itself.
However, buyback operations are usually targeted at close-to-maturity bonds. Unfortunately, at the
short end of the curve, relative pricing often becomes more delicate. For example, on-the-run treasury bills
may be priced somewhat differently from old, close-to-maturity coupon bonds (with similar remaining
maturities). It may therefore be advisable to eliminate treasury bills from the estimation of the bond yield
curve. This would often mean that the buyback bond would be the shortest bond on the estimated curve. In
that case, the estimated yield curve spread is not likely to be particularly accurate.
An alternative pricing metric assesses relative values based on the yield curve spread relative to
another (benchmark) sovereign's yield curve. However, this metric, by computing spreads relative to
another sovereign yield curve, may be influenced by special factors (in particular regarding credit risk) in
several segments of the foreign yield curve. This may in turn distort computed spreads.
A third metric is based on the computation of spreads relative to the (OIS) swap curve. This measure
may be less distorted by special factors such as credit risk effects.
13
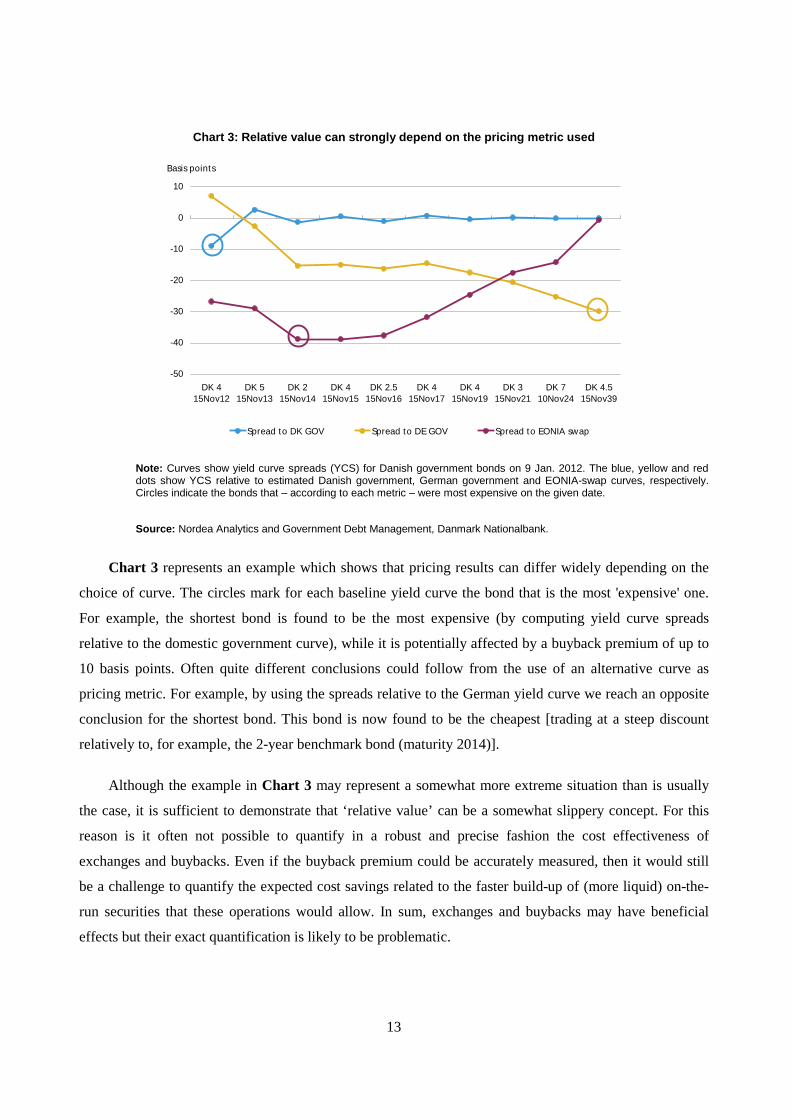
Chart 3: Relative value can strongly depend on the pricing metric used
Note: Curves show yield curve spreads (YCS) for Danish government bonds on 9 Jan. 2012. The blue, yellow and red dots show YCS relative to estimated Danish government, German government and EONIA-swap curves, respectively. Circles indicate the bonds that – according to each metric – were most expensive on the given date.
Source: Nordea Analytics and Government Debt Management, Danmark Nationalbank.
Chart 3 represents an example which shows that pricing results can differ widely depending on the
choice of curve. The circles mark for each baseline yield curve the bond that is the most 'expensive' one.
For example, the shortest bond is found to be the most expensive (by computing yield curve spreads
relative to the domestic government curve), while it is potentially affected by a buyback premium of up to
10 basis points. Often quite different conclusions could follow from the use of an alternative curve as
pricing metric. For example, by using the spreads relative to the German yield curve we reach an opposite
conclusion for the shortest bond. This bond is now found to be the cheapest [trading at a steep discount
relatively to, for example, the 2-year benchmark bond (maturity 2014)].
Although the example in Chart 3 may represent a somewhat more extreme situation than is usually
the case, it is sufficient to demonstrate that ‘relative value’ can be a somewhat slippery concept. For this
reason is it often not possible to quantify in a robust and precise fashion the cost effectiveness of
exchanges and buybacks. Even if the buyback premium could be accurately measured, then it would still
be a challenge to quantify the expected cost savings related to the faster build-up of (more liquid) on-the-
run securities that these operations would allow. In sum, exchanges and buybacks may have beneficial
effects but their exact quantification is likely to be problematic.
-50
-40
-30
-20
-10
0
10
DK 415Nov12
DK 515Nov13
DK 215Nov14
DK 415Nov15
DK 2.515Nov16
DK 415Nov17
DK 415Nov19
DK 315Nov21
DK 710Nov24
DK 4.515Nov39
Spread to DK GOV Spread to DE GOV Spread to EONIA swap
Basis points
14
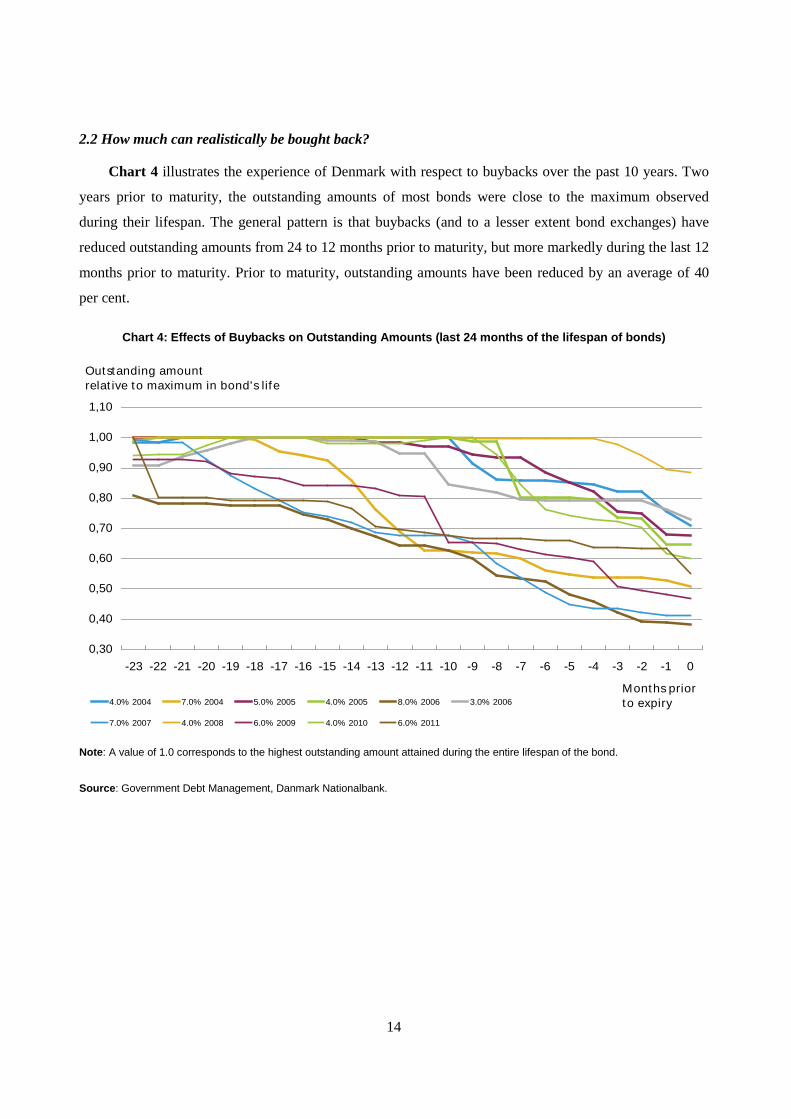
2.2 How much can realistically be bought back?
Chart 4 illustrates the experience of Denmark with respect to buybacks over the past 10 years. Two
years prior to maturity, the outstanding amounts of most bonds were close to the maximum observed
during their lifespan. The general pattern is that buybacks (and to a lesser extent bond exchanges) have
reduced outstanding amounts from 24 to 12 months prior to maturity, but more markedly during the last 12
months prior to maturity. Prior to maturity, outstanding amounts have been reduced by an average of 40
per cent.
Chart 4: Effects of Buybacks on Outstanding Amounts (last 24 months of the lifespan of bonds)
Note: A value of 1.0 corresponds to the highest outstanding amount attained during the entire lifespan of the bond.
Source: Government Debt Management, Danmark Nationalbank.
0,30
0,40
0,50
0,60
0,70
0,80
0,90
1,00
1,10
-23 -22 -21 -20 -19 -18 -17 -16 -15 -14 -13 -12 -11 -10 -9 -8 -7 -6 -5 -4 -3 -2 -1 0
4.0% 2004 7.0% 2004 5.0% 2005 4.0% 2005 8.0% 2006 3.0% 2006
7.0% 2007 4.0% 2008 6.0% 2009 4.0% 2010 6.0% 2011
Outstanding amountrelat ive to maximum in bond's life
Months prior to expiry
15
SECTION 3: Survey Results on debt buybacks and exchange practices
Bond exchanges and buyback operations have been used by debt managers for a long time. Earlier
surveys among OECD countries by the Working Party on Public Debt Management (WPDM) reported the
following findings:
• A 1996 survey led by the Italian WPDM delegation focused on bond buyback practices and their
impact on public debt management. Of the 22 responding countries, 14 used buybacks.
• A 2001 questionnaire among EU countries showed that of the 13 responding countries, 10 used
both bond exchanges and buybacks.
• A 2006 survey was led by the Hungarian and Italian WPDM delegations. Of the 23 responding
countries, 17 countries had either a bond exchange or a buyback programme in place.
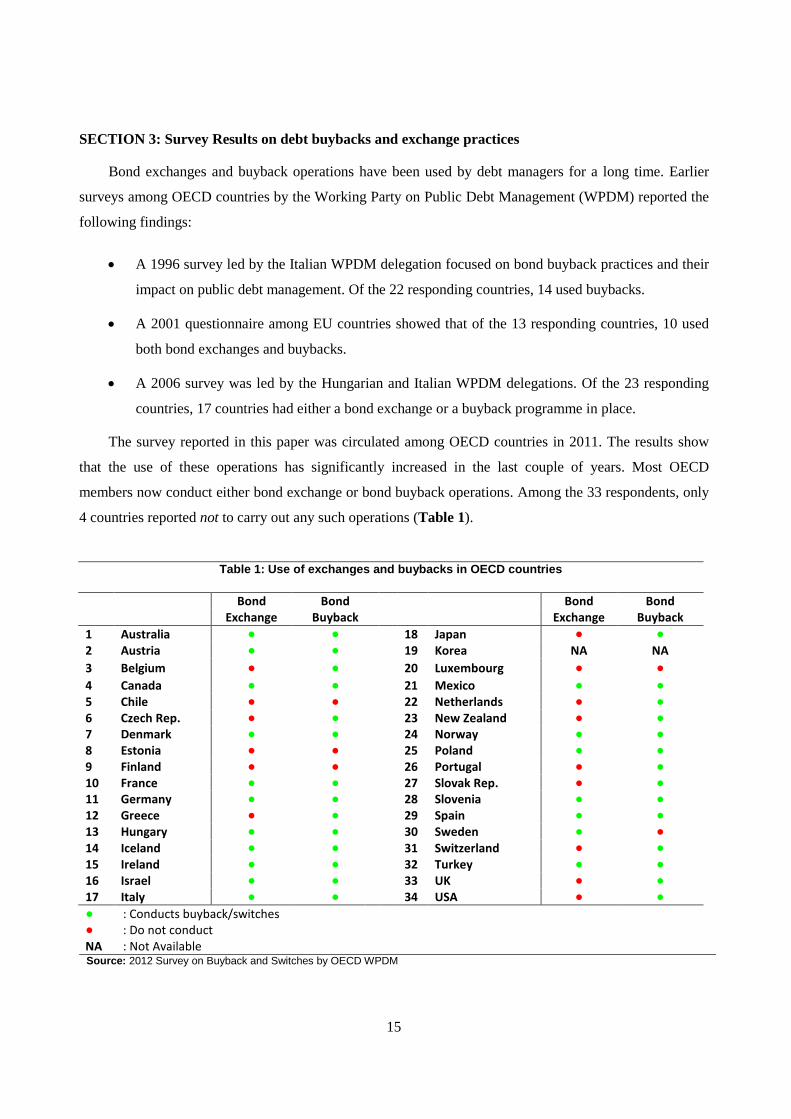
The survey reported in this paper was circulated among OECD countries in 2011. The results show
that the use of these operations has significantly increased in the last couple of years. Most OECD
members now conduct either bond exchange or bond buyback operations. Among the 33 respondents, only
4 countries reported not to carry out any such operations (Table 1).
Table 1: Use of exchanges and buybacks in OECD countries
Bond Bond Bond Bond Exchange Buyback Exchange Buyback 1 Australia ● ● 18 Japan ● ● 2 Austria ● ● 19 Korea NA NA 3 Belgium ● ● 20 Luxembourg ● ● 4 Canada ● ● 21 Mexico ● ● 5 Chile ● ● 22 Netherlands ● ● 6 Czech Rep. ● ● 23 New Zealand ● ● 7 Denmark ● ● 24 Norway ● ● 8 Estonia ● ● 25 Poland ● ● 9 Finland ● ● 26 Portugal ● ● 10 France ● ● 27 Slovak Rep. ● ● 11 Germany ● ● 28 Slovenia ● ● 12 Greece ● ● 29 Spain ● ● 13 Hungary ● ● 30 Sweden ● ● 14 Iceland ● ● 31 Switzerland ● ● 15 Ireland ● ● 32 Turkey ● ● 16 Israel ● ● 33 UK ● ● 17 Italy ● ● 34 USA ● ● ● : Conducts buyback/switches ● : Do not conduct NA : Not Available Source: 2012 Survey on Buyback and Switches by OECD WPDM
16
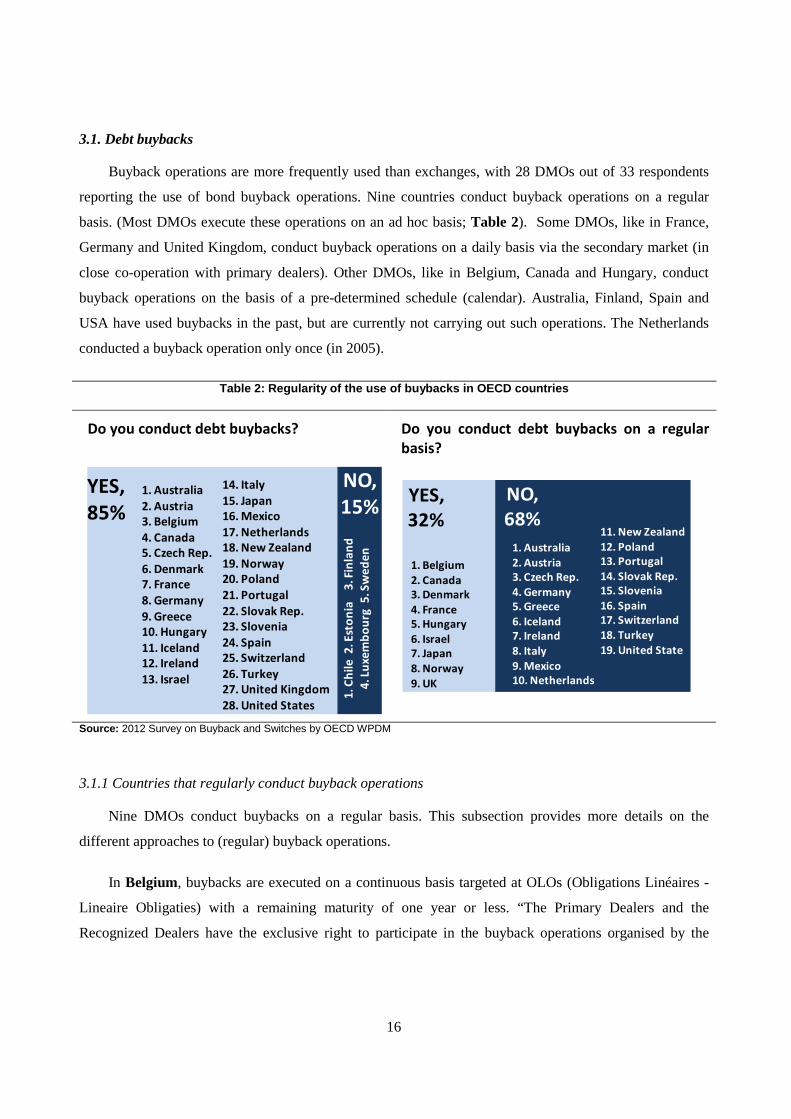
3.1. Debt buybacks
Buyback operations are more frequently used than exchanges, with 28 DMOs out of 33 respondents
reporting the use of bond buyback operations. Nine countries conduct buyback operations on a regular
basis. (Most DMOs execute these operations on an ad hoc basis; Table 2). Some DMOs, like in France,
Germany and United Kingdom, conduct buyback operations on a daily basis via the secondary market (in
close co-operation with primary dealers). Other DMOs, like in Belgium, Canada and Hungary, conduct
buyback operations on the basis of a pre-determined schedule (calendar). Australia, Finland, Spain and
USA have used buybacks in the past, but are currently not carrying out such operations. The Netherlands
conducted a buyback operation only once (in 2005).
Table 2: Regularity of the use of buybacks in OECD countries
Do you conduct debt buybacks?
Do you conduct debt buybacks on a regular basis?
Source: 2012 Survey on Buyback and Switches by OECD WPDM
3.1.1 Countries that regularly conduct buyback operations
Nine DMOs conduct buybacks on a regular basis. This subsection provides more details on the
different approaches to (regular) buyback operations.
In Belgium, buybacks are executed on a continuous basis targeted at OLOs (Obligations Linéaires -
Lineaire Obligaties) with a remaining maturity of one year or less. “The Primary Dealers and the
Recognized Dealers have the exclusive right to participate in the buyback operations organised by the
YES, 85%
NO, 15%
1. C
hile
2. E
ston
ia
3. Fi
nlan
d
4. Lu
xem
bour
g 5
. Sw
eden
14. Italy15. Japan16. Mexico 17. Netherlands18. New Zealand19. Norway20. Poland21. Portugal 22. Slovak Rep.23. Slovenia24. Spain25. Switzerland26. Turkey27. United Kingdom28. United States
1. Australia2. Austria3. Belgium4. Canada5. Czech Rep.6. Denmark7. France8. Germany 9. Greece10. Hungary11. Iceland12. Ireland13. Israel
YES, 32%
NO, 68%
1. Australia2. Austria3. Czech Rep.4. Germany5. Greece6. Iceland7. Ireland8. Italy9. Mexico10. Netherlands
1. Belgium2. Canada3. Denmark4. France5. Hungary6. Israel7. Japan8. Norway9. UK
11. New Zealand12. Poland13. Portugal14. Slovak Rep.15. Slovenia16. Spain17. Switzerland18. Turkey19. United State
17
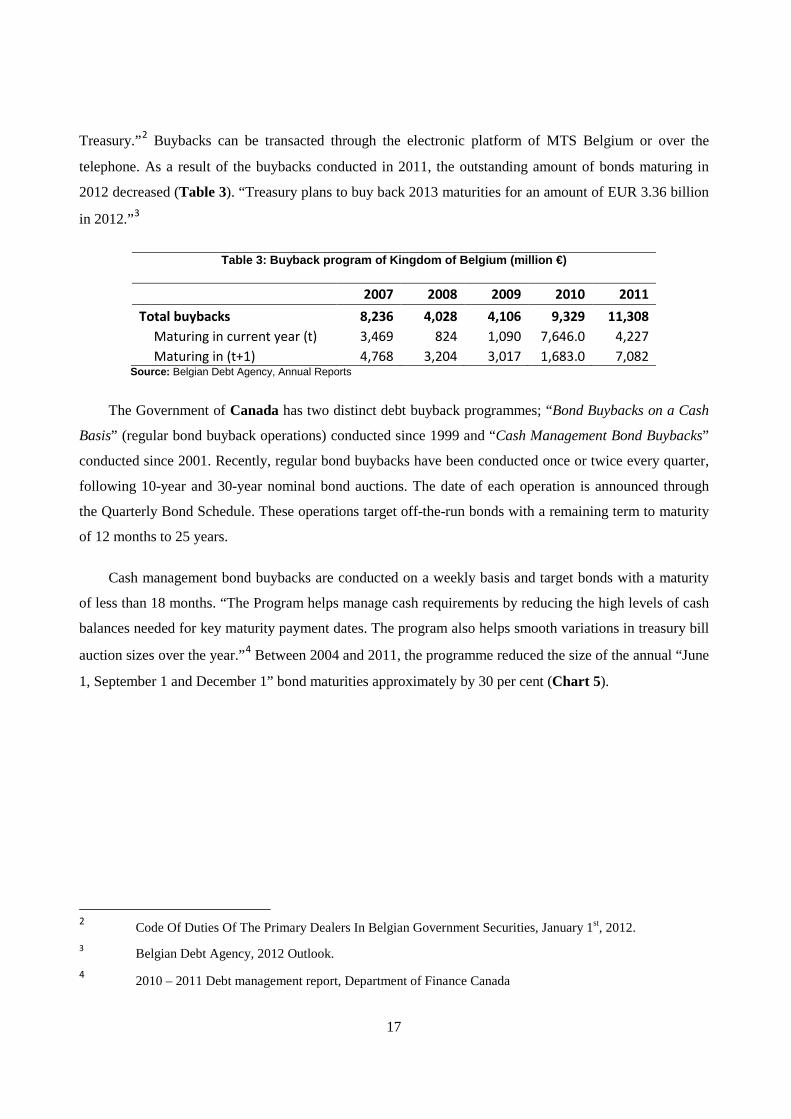
Treasury.”2 Buybacks can be transacted through the electronic platform of MTS Belgium or over the
telephone. As a result of the buybacks conducted in 2011, the outstanding amount of bonds maturing in
2012 decreased (Table 3). “Treasury plans to buy back 2013 maturities for an amount of EUR 3.36 billion
in 2012.”3
Table 3: Buyback program of Kingdom of Belgium (million €)
2007 2008 2009 2010 2011 Total buybacks 8,236 4,028 4,106 9,329 11,308
Maturing in current year (t) 3,469 824 1,090 7,646.0 4,227 Maturing in (t+1) 4,768 3,204 3,017 1,683.0 7,082
Source: Belgian Debt Agency, Annual Reports
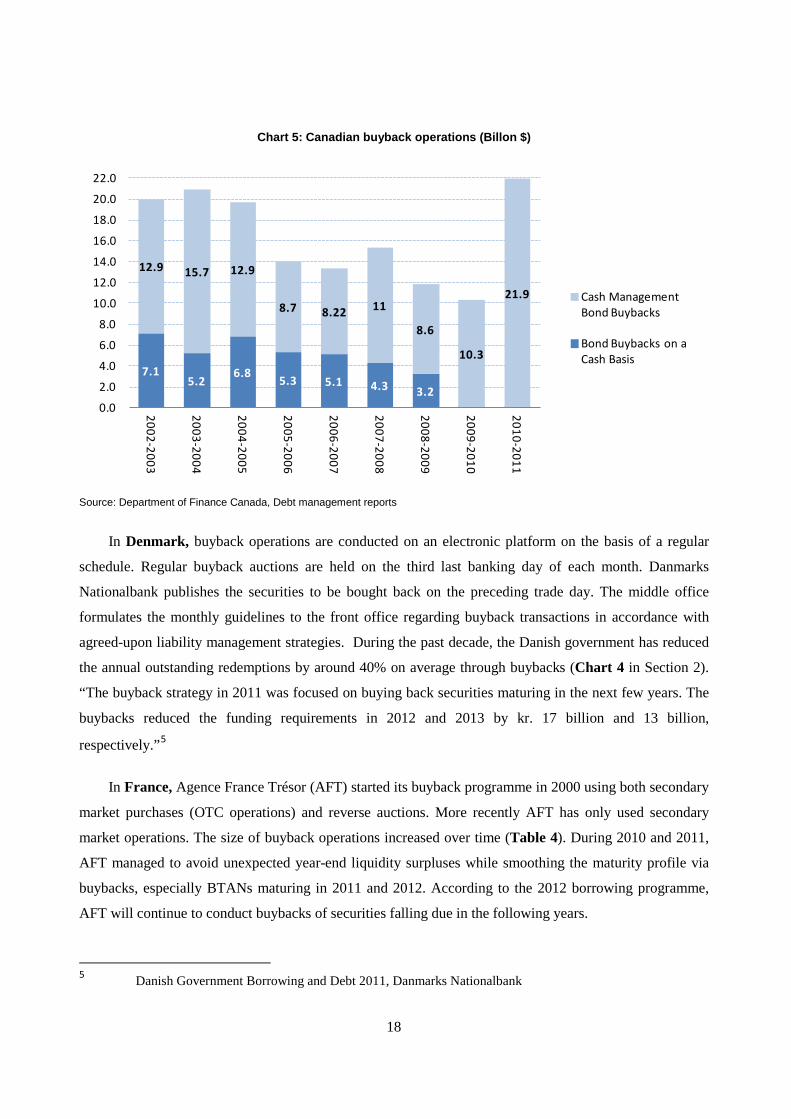
The Government of Canada has two distinct debt buyback programmes; “Bond Buybacks on a Cash
Basis” (regular bond buyback operations) conducted since 1999 and “Cash Management Bond Buybacks”
conducted since 2001. Recently, regular bond buybacks have been conducted once or twice every quarter,
following 10-year and 30-year nominal bond auctions. The date of each operation is announced through
the Quarterly Bond Schedule. These operations target off-the-run bonds with a remaining term to maturity
of 12 months to 25 years.
Cash management bond buybacks are conducted on a weekly basis and target bonds with a maturity
of less than 18 months. “The Program helps manage cash requirements by reducing the high levels of cash
balances needed for key maturity payment dates. The program also helps smooth variations in treasury bill
auction sizes over the year.”4 Between 2004 and 2011, the programme reduced the size of the annual “June
1, September 1 and December 1” bond maturities approximately by 30 per cent (Chart 5).
2 Code Of Duties Of The Primary Dealers In Belgian Government Securities, January 1st, 2012. 3 Belgian Debt Agency, 2012 Outlook. 4 2010 – 2011 Debt management report, Department of Finance Canada
18
Chart 5: Canadian buyback operations (Billon $)
Source: Department of Finance Canada, Debt management reports
In Denmark, buyback operations are conducted on an electronic platform on the basis of a regular
schedule. Regular buyback auctions are held on the third last banking day of each month. Danmarks
Nationalbank publishes the securities to be bought back on the preceding trade day. The middle office
formulates the monthly guidelines to the front office regarding buyback transactions in accordance with
agreed-upon liability management strategies. During the past decade, the Danish government has reduced
the annual outstanding redemptions by around 40% on average through buybacks (Chart 4 in Section 2).
“The buyback strategy in 2011 was focused on buying back securities maturing in the next few years. The
buybacks reduced the funding requirements in 2012 and 2013 by kr. 17 billion and 13 billion,
respectively.”5
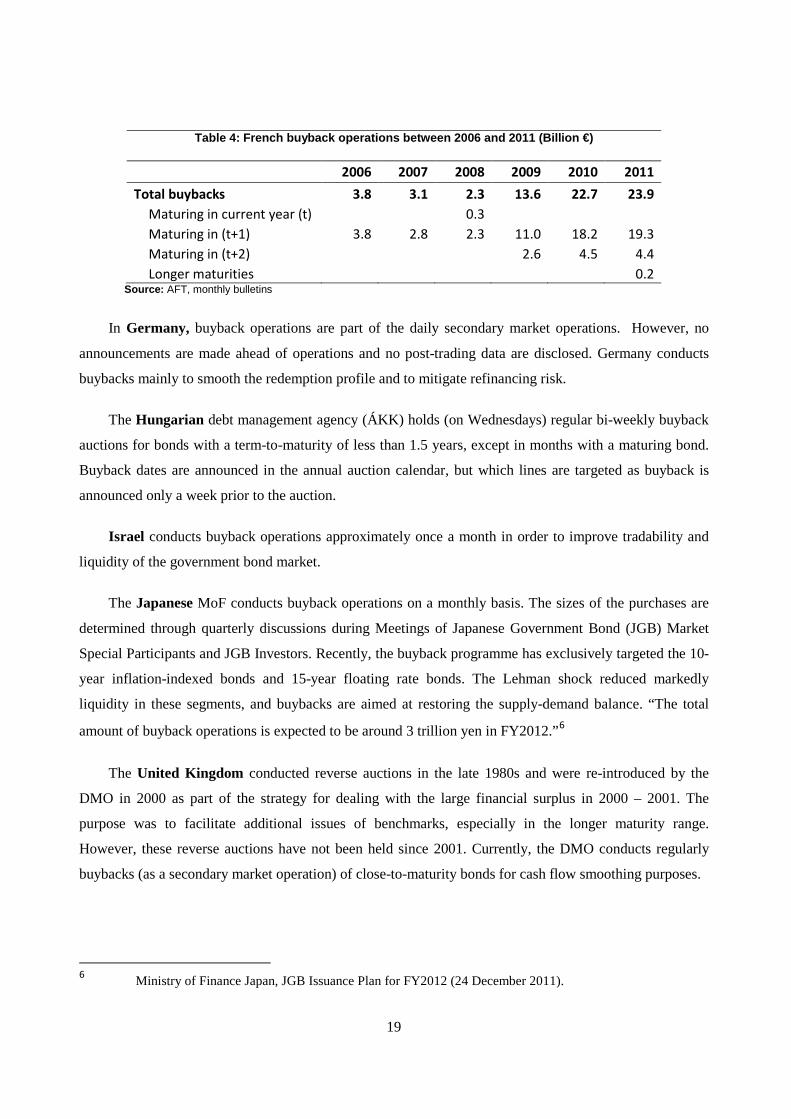
In France, Agence France Trésor (AFT) started its buyback programme in 2000 using both secondary
market purchases (OTC operations) and reverse auctions. More recently AFT has only used secondary
market operations. The size of buyback operations increased over time (Table 4). During 2010 and 2011,
AFT managed to avoid unexpected year-end liquidity surpluses while smoothing the maturity profile via
buybacks, especially BTANs maturing in 2011 and 2012. According to the 2012 borrowing programme,
AFT will continue to conduct buybacks of securities falling due in the following years.
5 Danish Government Borrowing and Debt 2011, Danmarks Nationalbank
7.15.2
6.8 5.3 5.1 4.3 3.2
12.9 15.7 12.9
8.7 8.22 11
8.6
10.3
21.9
0.0
2.0
4.0
6.0
8.0
10.0
12.0
14.0
16.0
18.0
20.0
22.0
2002-2003
2003-2004
2004-2005
2005-2006
2006-2007
2007-2008
2008-2009
2009 -2010
2010-2011
Cash Management Bond Buybacks
Bond Buybacks on a Cash Basis
19
Table 4: French buyback operations between 2006 and 2011 (Billion €)
2006 2007 2008 2009 2010 2011 Total buybacks 3.8 3.1 2.3 13.6 22.7 23.9
Maturing in current year (t) 0.3 Maturing in (t+1) 3.8 2.8 2.3 11.0 18.2 19.3 Maturing in (t+2) 2.6 4.5 4.4 Longer maturities 0.2
Source: AFT, monthly bulletins
In Germany, buyback operations are part of the daily secondary market operations. However, no
announcements are made ahead of operations and no post-trading data are disclosed. Germany conducts
buybacks mainly to smooth the redemption profile and to mitigate refinancing risk.
The Hungarian debt management agency (ÁKK) holds (on Wednesdays) regular bi-weekly buyback
auctions for bonds with a term-to-maturity of less than 1.5 years, except in months with a maturing bond.
Buyback dates are announced in the annual auction calendar, but which lines are targeted as buyback is
announced only a week prior to the auction.
Israel conducts buyback operations approximately once a month in order to improve tradability and
liquidity of the government bond market.
The Japanese MoF conducts buyback operations on a monthly basis. The sizes of the purchases are
determined through quarterly discussions during Meetings of Japanese Government Bond (JGB) Market
Special Participants and JGB Investors. Recently, the buyback programme has exclusively targeted the 10-
year inflation-indexed bonds and 15-year floating rate bonds. The Lehman shock reduced markedly
liquidity in these segments, and buybacks are aimed at restoring the supply-demand balance. “The total
amount of buyback operations is expected to be around 3 trillion yen in FY2012.”6
The United Kingdom conducted reverse auctions in the late 1980s and were re-introduced by the
DMO in 2000 as part of the strategy for dealing with the large financial surplus in 2000 – 2001. The
purpose was to facilitate additional issues of benchmarks, especially in the longer maturity range.
However, these reverse auctions have not been held since 2001. Currently, the DMO conducts regularly
buybacks (as a secondary market operation) of close-to-maturity bonds for cash flow smoothing purposes.
6 Ministry of Finance Japan, JGB Issuance Plan for FY2012 (24 December 2011).
20
3.1.2 Countries that hold buyback operations on an irregular or ad hoc basis
Many OECD countries carry out buyback operations on an ad-hoc basis. Austria organises buybacks
on a case by case basis, taking into account the overall strategy and risk-return profile. A buyback
operation is executed if it is judged that there is scope for an improvement in the maturity and risk profile
of the debt stock.
The Czech Republic debt management office (DMO CZ) conducts buyback operations in order to
manage refinancing risk. To that end, the DMO buys back bonds with a remaining maturity of one year.
Buybacks are conducted both as primary market operations and in the secondary market.
Greece carries out buybacks on a fairly irregular basis and for relatively small amounts. The
maximum amount of buybacks is approved annually and updated according to market conditions.
In the past, the Icelandic DMO conducted debt buybacks on a regular basis as part of the strategy to
reduce the non-marketable portion of the debt stock. The reverse auction was the most common method.
Currently, debt buybacks are carried out on an irregular basis. The initiative usually comes from the
holders of the debt. Buybacks are mainly executed as secondary market operations.
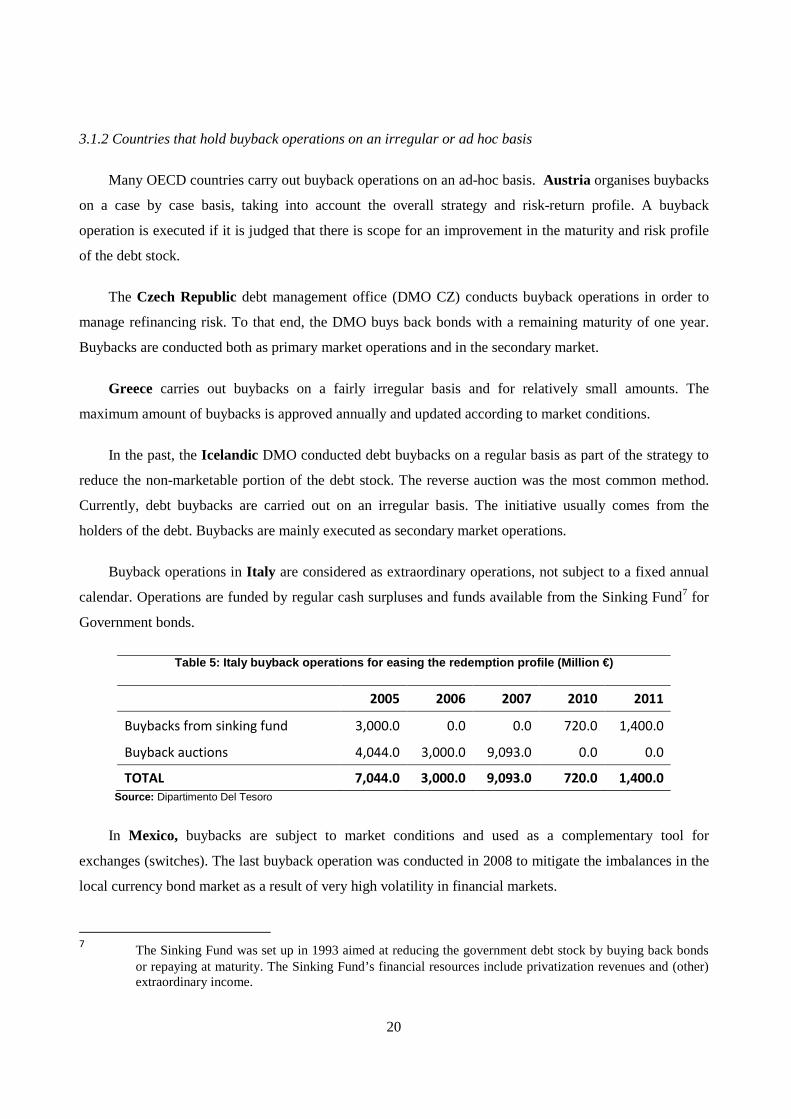
Buyback operations in Italy are considered as extraordinary operations, not subject to a fixed annual
calendar. Operations are funded by regular cash surpluses and funds available from the Sinking Fund7 for
Government bonds.
Table 5: Italy buyback operations for easing the redemption profile (Million €)
2005 2006 2007 2010 2011
Buybacks from sinking fund 3,000.0 0.0 0.0 720.0 1,400.0
Buyback auctions 4,044.0 3,000.0 9,093.0 0.0 0.0
TOTAL 7,044.0 3,000.0 9,093.0 720.0 1,400.0 Source: Dipartimento Del Tesoro
In Mexico, buybacks are subject to market conditions and used as a complementary tool for
exchanges (switches). The last buyback operation was conducted in 2008 to mitigate the imbalances in the
local currency bond market as a result of very high volatility in financial markets.
7 The Sinking Fund was set up in 1993 aimed at reducing the government debt stock by buying back bonds
or repaying at maturity. The Sinking Fund’s financial resources include privatization revenues and (other) extraordinary income.
21
New Zealand bought back bonds only once (in 2009) via a reverse tap tender. However, the Reserve
Bank of New Zealand (RBNZ) – after conferring with the New Zealand Debt Management Office
(NZDMO) - usually buys back bonds from the secondary market when a bond is close to its maturity.
In Poland, exchange and buyback auctions are executed since 2001. During the last five years, the
focus is on treasury bills on the basis of an irregular schedule.
The Portuguese Debt Management Office (IGCP) has been conducting buyback operations as a key
element of its financing strategy since January 2001. Via buybacks, the IGCP promotes liquidity in the
secondary market and manages refinancing risk associated with its market-oriented financing strategy.
Participation in buybacks is limited to primary dealers. Participation by non-primary dealers is limited to
bilateral buybacks conducted over the phone. The main guidelines of the debt buyback programme are
announced at the beginning of the year, while further details are provided on a quarterly basis.
Slovenia has conducted buybacks of illiquid government bonds (with a below benchmark size) in
2007 and 2008; this refers to debt issued before the introduction of the Euro in 2007. Since 2009, buybacks
are focused on benchmark bonds with a remaining maturity of less than 1.5 years, as well as on remaining
outstanding pre-euro bonds. However, operations under the latter buyback programmes have not taken
place because the criteria for buybacks set by the Slovenian Public Finance Act (SPFA) were not met since
2009.
Switzerland conducts buybacks in connection with cash management operations (maturities up to 12
months). Such buybacks are only being executed if the yields resulting from these operations are expected
to be favourable relative to alternative short-term investments.
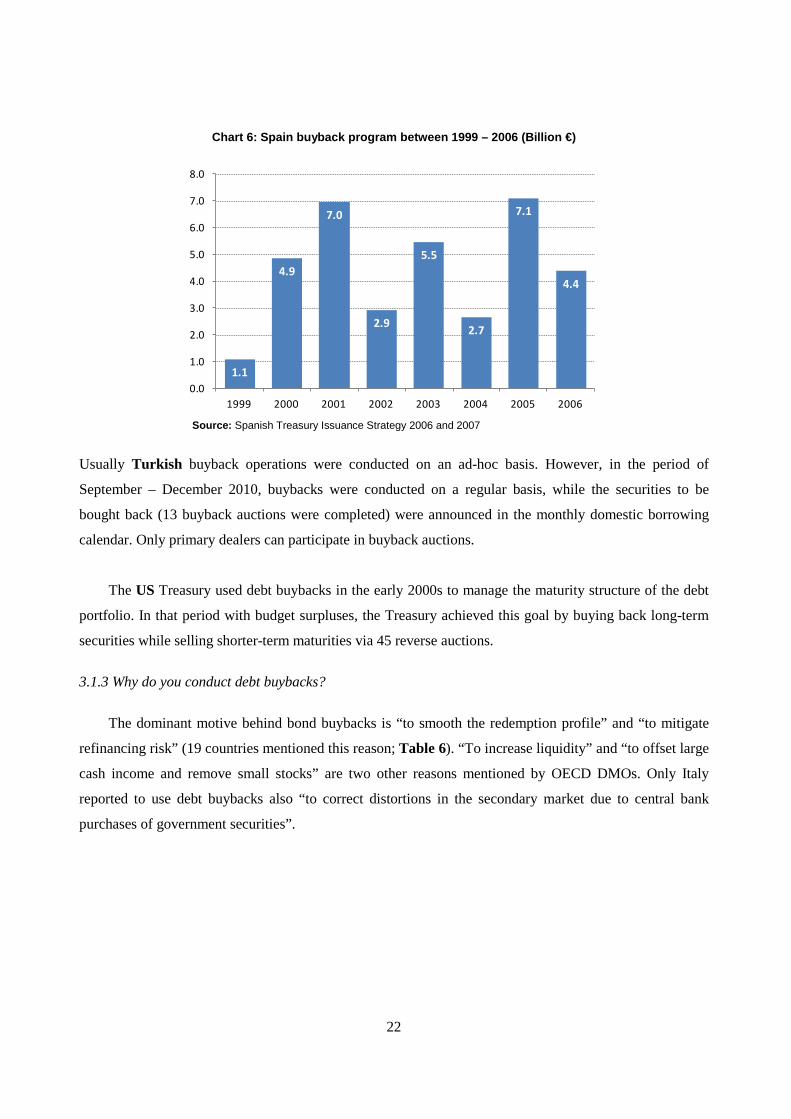
In Spain, a buyback programme was in place between 1999 and 2006. The size of the programme
amounted to more than €35 billion (Chart 6). Spain’s favourable cash position in that period allowed the
execution of these buyback operations. The programme was discontinued to avoid a liquidity drain at the
short end of the Spanish yield curve.
22
Chart 6: Spain buyback program between 1999 – 2006 (Billion €)
Source: Spanish Treasury Issuance Strategy 2006 and 2007
Usually Turkish buyback operations were conducted on an ad-hoc basis. However, in the period of
September – December 2010, buybacks were conducted on a regular basis, while the securities to be
bought back (13 buyback auctions were completed) were announced in the monthly domestic borrowing
calendar. Only primary dealers can participate in buyback auctions.
The US Treasury used debt buybacks in the early 2000s to manage the maturity structure of the debt
portfolio. In that period with budget surpluses, the Treasury achieved this goal by buying back long-term
securities while selling shorter-term maturities via 45 reverse auctions.
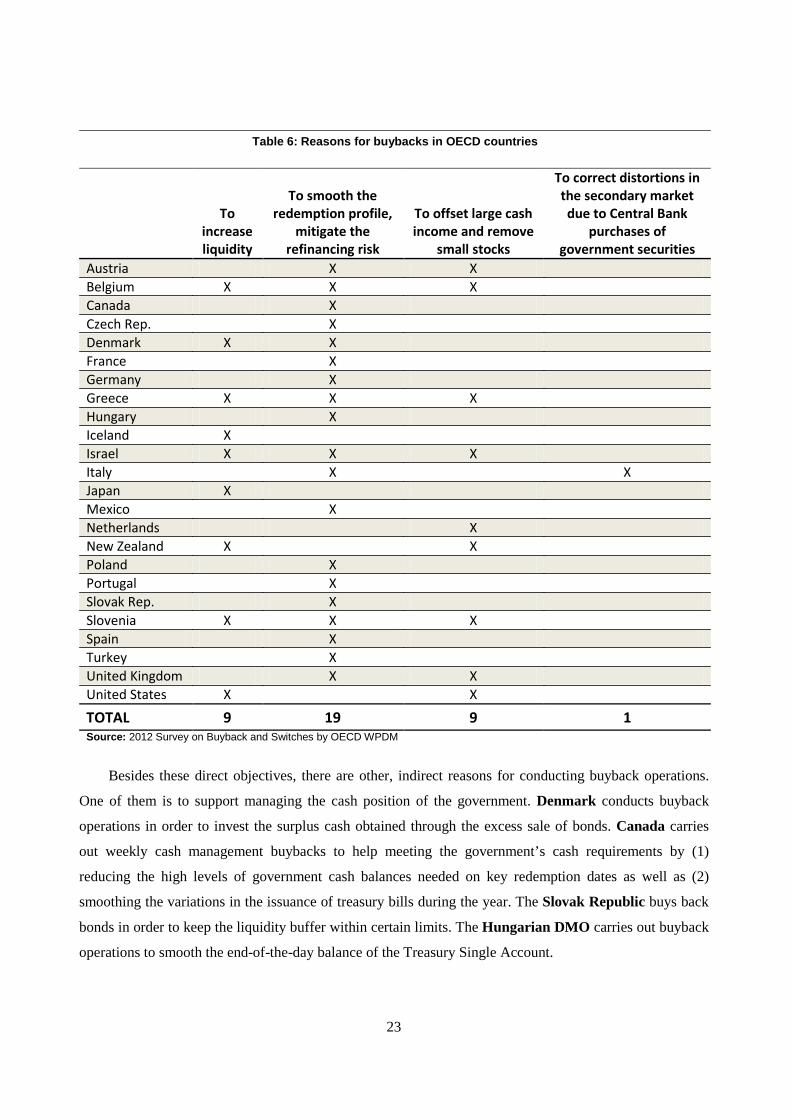
3.1.3 Why do you conduct debt buybacks?
The dominant motive behind bond buybacks is “to smooth the redemption profile” and “to mitigate
refinancing risk” (19 countries mentioned this reason; Table 6). “To increase liquidity” and “to offset large
cash income and remove small stocks” are two other reasons mentioned by OECD DMOs. Only Italy
reported to use debt buybacks also “to correct distortions in the secondary market due to central bank
purchases of government securities”.
1.1
4.9
7.0
2.9
5.5
2.7
7.1
4.4
0.0
1.0
2.0
3.0
4.0
5.0
6.0
7.0
8.0
1999 2000 2001 2002 2003 2004 2005 2006
23
Table 6: Reasons for buybacks in OECD countries
To increase liquidity
To smooth the redemption profile,
mitigate the refinancing risk
To offset large cash income and remove
small stocks
To correct distortions in the secondary market due to Central Bank
purchases of government securities
Austria X X Belgium X X X Canada X Czech Rep. X Denmark X X France X Germany X Greece X X X Hungary X Iceland X Israel X X X Italy X X Japan X Mexico X Netherlands X New Zealand X X Poland X Portugal X Slovak Rep. X Slovenia X X X Spain X Turkey X United Kingdom X X United States X X
TOTAL 9 19 9 1 Source: 2012 Survey on Buyback and Switches by OECD WPDM
Besides these direct objectives, there are other, indirect reasons for conducting buyback operations.
One of them is to support managing the cash position of the government. Denmark conducts buyback
operations in order to invest the surplus cash obtained through the excess sale of bonds. Canada carries
out weekly cash management buybacks to help meeting the government’s cash requirements by (1)
reducing the high levels of government cash balances needed on key redemption dates as well as (2)
smoothing the variations in the issuance of treasury bills during the year. The Slovak Republic buys back
bonds in order to keep the liquidity buffer within certain limits. The Hungarian DMO carries out buyback
operations to smooth the end-of-the-day balance of the Treasury Single Account.
24
Another indirect objective concerns the management of the yield curve. Mexico and Slovenia is
using buybacks to manage their yield curves. Mexico manages the short end of the yield curve with
buyback operations. Slovenia contributes to the building of a yield curve of the government securities and
supports an effective positioning of the central government debt in the financial market via buyback
operations.
At the beginning of 2000s, France’s AFT buyback programme was mainly aimed at increasing its
gross issuing programme so as to ensure sufficient liquidity for the new benchmarks while contributing to
the goal of reducing duration in the medium-term. However, in recent years, the motives for conducting
buybacks have shifted towards smoothing the redemption profile and cost of issuance.
Israel conducts buyback operations in order to improve the tradability and liquidity of the
government bond market and to upgrade the service to the organizations that operate in this market.
Norwegian buyback operations are done in response to market requirements and not because of the
needs of the issuer.
25
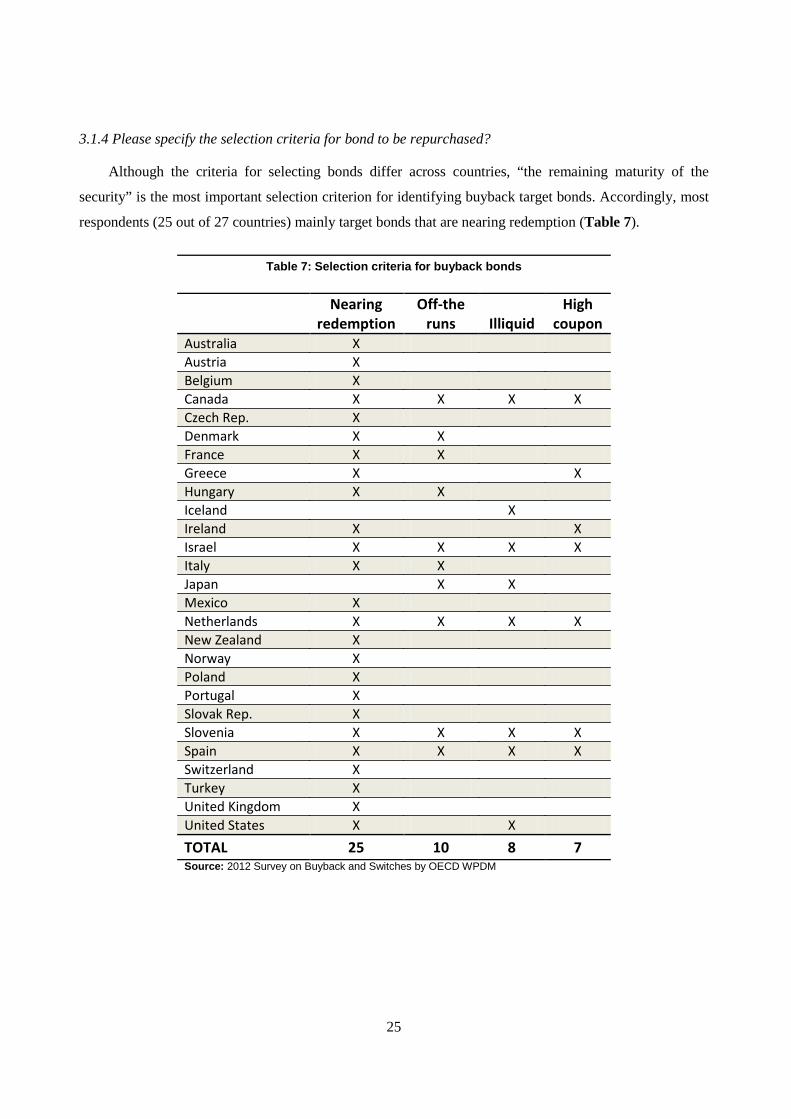
3.1.4 Please specify the selection criteria for bond to be repurchased?
Although the criteria for selecting bonds differ across countries, “the remaining maturity of the
security” is the most important selection criterion for identifying buyback target bonds. Accordingly, most
respondents (25 out of 27 countries) mainly target bonds that are nearing redemption (Table 7).
Table 7: Selection criteria for buyback bonds
Nearing
redemption Off-the
runs Illiquid High
coupon Australia X Austria X Belgium X Canada X X X X Czech Rep. X Denmark X X France X X Greece X X Hungary X X Iceland X Ireland X X Israel X X X X Italy X X Japan X X Mexico X Netherlands X X X X New Zealand X Norway X Poland X Portugal X Slovak Rep. X Slovenia X X X X Spain X X X X Switzerland X Turkey X United Kingdom X United States X X TOTAL 25 10 8 7 Source: 2012 Survey on Buyback and Switches by OECD WPDM
26
Canada buys back bonds for cash management purposes with a term to maturity of up to 18 months if
the total amount of maturing bonds is greater than $5 billion at the date of the operation. However, for
bond buybacks on a cash basis, eligibility criteria are wider and the bond buybacks target both illiquid
high-coupon bonds and certain large, off-the-run issues. Issues that are currently being built as benchmarks
as well as bonds with maturities greater than or equal to 25 years are excluded from the buyback program.
The decision on specific bonds to be included in buyback operations takes into account the views of market
participants and is announced at the Call for Tenders.
The Italian Treasury uses the following selection criteria. The first criterion is the shape of the
redemption profile whereby buyback bonds are selected that show reimbursement peaks at redemption
dates. The second criterion is liquidity whereby the Treasury selects off-the-runs aimed at avoiding a
negative impact on secondary market liquidity. The third criterion is the (potential) impact on outstanding
debt. In order to smooth the public debt redemption profile, the Italian Treasury traditionally repurchases
bonds with a residual maturity up to 18 months (taking into account market conditions). However, in order
to minimise the distortions observed in the secondary market due to the ECB bond-buying program
(expanded in August 2011) the Italian Treasury has also taken the opportunity to buy back government
securities with longer than 18 months residual maturity.
When asked by a primary dealer, the UKDMO is prepared to bid a price of its own choosing for any
gilt, including any strip, which has less than six months left before its maturity. Gilts with this residual
maturity function essentially as money market instruments. For this reason the bid price will be dictated by
the (needs of) DMO’s cash management operations at the time of request.
27
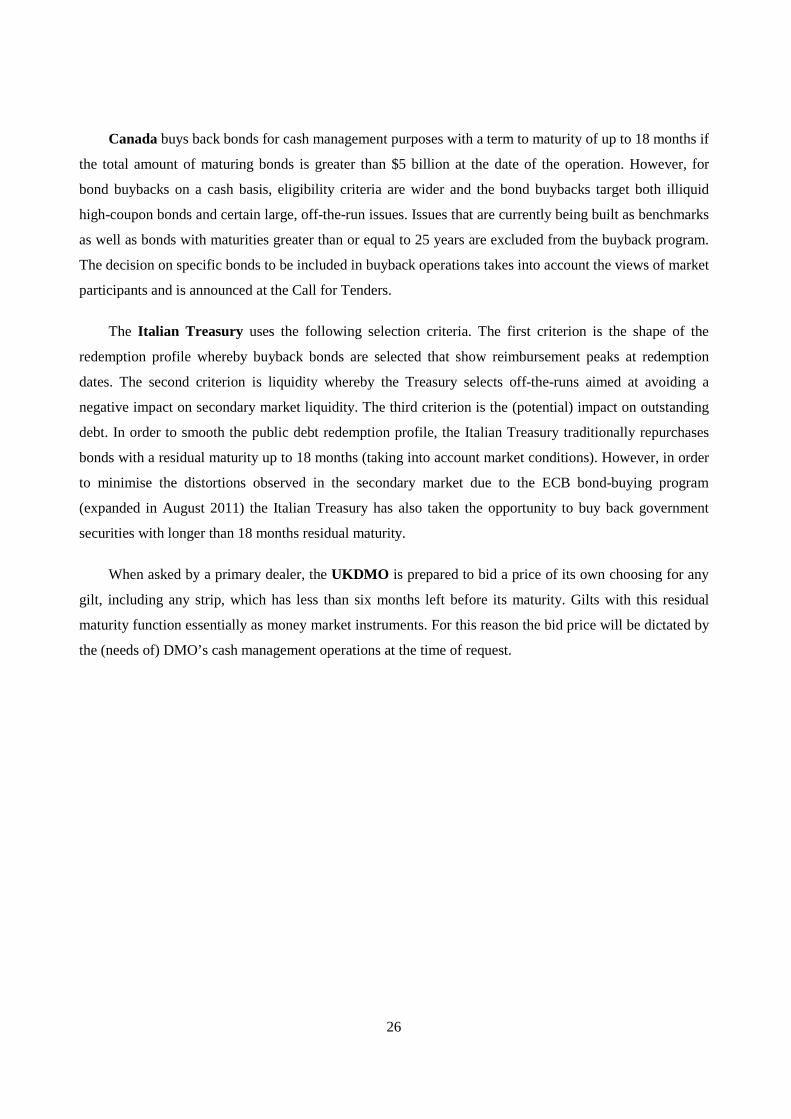
3.1.5 Please specify the methods used for buybacks
Table 8: Methods for buyback operations
Reverse auctions
Secondary market
purchases Other
methods Australia X Austria X Belgium X X Canada X Czech Rep. X Denmark X X France X Germany X Greece X Hungary X Iceland X X Ireland X Israel X Italy X X Japan X Mexico X Netherlands X New Zealand X Norway X Poland X Portugal X X Slovak Rep. X Slovenia X X Spain X Switzerland X Turkey X United Kingdom X X United States X TOTAL 18 14 3 Source: 2012 Survey on Buyback and Switches by OECD WPDM
Reverse auctions and secondary market purchases are the most widely used methods for buyback
operations among respondent countries. 18 of the respondents are found to be conducting reverse auctions
and 14 conducting secondary market purchases as the method for buyback operations. 7 of them use both
methods and only 3 countries carry out neither reverse auctions nor secondary market purchases.
28
Austria conducts buyback operations in the secondary market usually by bilateral negotiations.
The Australian central bank has holdings of near-to-maturity bonds that it has acquired through its
daily open-market operations. The central bank is prepared to sell these bonds to the Government at the
prevailing secondary market price.
The Belgian Treasury uses since July 2001 MTS Belgium (MTSB) for buybacks. This electronic
platform offers liquidity, efficiency and transparent pricing. Buybacks are carried out via a screen which
only the primary dealers and the Treasury can access, and on which the Treasury continuously displays the
purchase prices. When an OLO line reaches a date less than 12 months prior to its final maturity, the
Treasury offers it via a buyback.
In Canada, buyback operations are held 20 minutes after nominal bond auctions. Each quarterly bond
issuance calendar includes the targeted amount of bonds that the government intends to repurchase during
that quarter. Final details of each operation, including the maximum amount to be repurchased and the
basket of eligible bonds, are released the week prior to the operation. However, bond buybacks for cash
management purposes are held on an irregular basis to meet government cash management needs. These
“cash management bond buyback operations” target large bonds with less than 18 months to maturity.
They are held on almost each Tuesday morning after Treasury bill auctions. Details of the operations,
including the maximum amount to be repurchased and the basket of eligible bonds, are announced one
week in advance. Both type of buyback operation are settled on a cash basis and take place via multiple
yield reverse auctions. In all bond buyback operations, competitive offers are accepted in decreasing order
of yield (increasing order of price) until the maximum amount to repurchase (or the maximum replacement
amount) has been met.
The Czech DMO informs all primary dealers about the intention to conduct a transaction one
business day prior to the date on which the transaction is to occur. The primary dealers are notified about
the type of transaction, the targeted government bond, the maximum volume of the transaction, the time
when bids or offers from primary dealers can be submitted via the system and the date of settlement. At the
time when offers are accepted from primary dealers, the primary dealers may submit their prices and the
volume to the system. Afterwards, depending on the price and the volume, the DMO will either accept or
reject the offer. The submission of offers via the system is anonymous, and before each transaction the
DMO will not have any information about which primary dealer is participating in the submission of offers
or information about the price and volume offered by a particular primary dealer. The DMO publishes the
result of the transactions on its website by the date of settlement of the transactions.
29
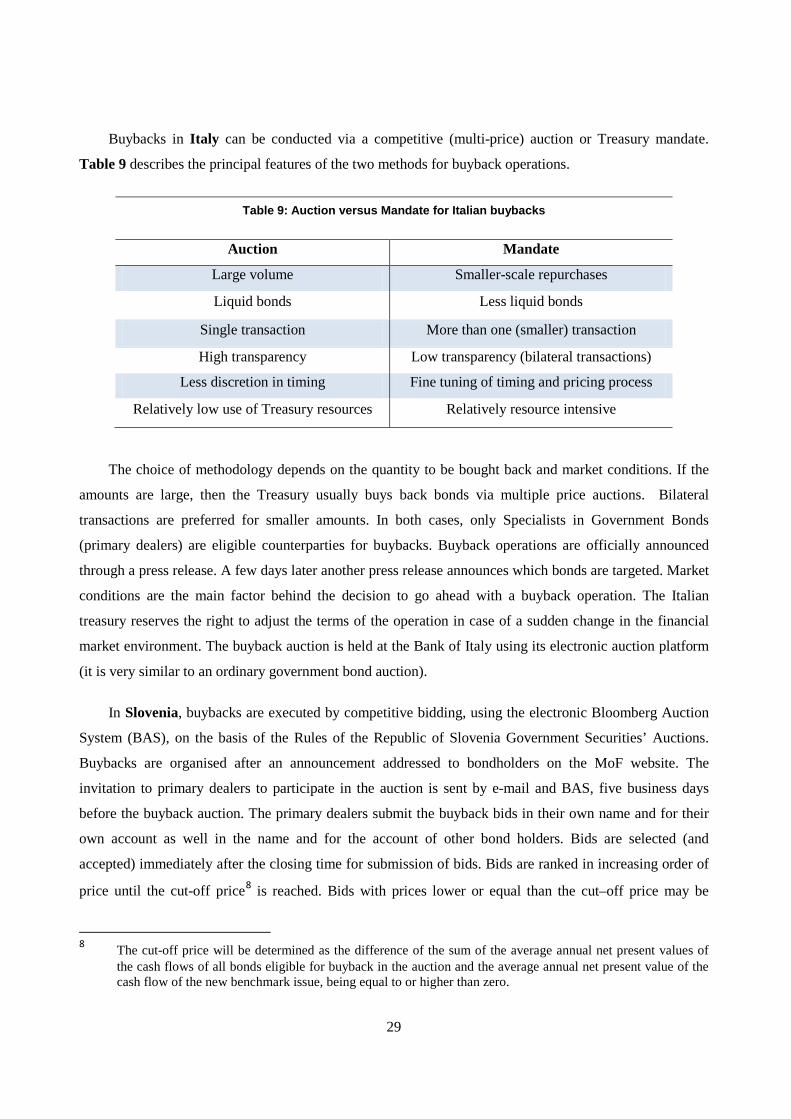
Buybacks in Italy can be conducted via a competitive (multi-price) auction or Treasury mandate.
Table 9 describes the principal features of the two methods for buyback operations.
Table 9: Auction versus Mandate for Italian buybacks
Auction Mandate
Large volume Smaller-scale repurchases
Liquid bonds Less liquid bonds
Single transaction More than one (smaller) transaction
High transparency Low transparency (bilateral transactions)
Less discretion in timing Fine tuning of timing and pricing process
Relatively low use of Treasury resources Relatively resource intensive
The choice of methodology depends on the quantity to be bought back and market conditions. If the
amounts are large, then the Treasury usually buys back bonds via multiple price auctions. Bilateral
transactions are preferred for smaller amounts. In both cases, only Specialists in Government Bonds
(primary dealers) are eligible counterparties for buybacks. Buyback operations are officially announced
through a press release. A few days later another press release announces which bonds are targeted. Market
conditions are the main factor behind the decision to go ahead with a buyback operation. The Italian
treasury reserves the right to adjust the terms of the operation in case of a sudden change in the financial
market environment. The buyback auction is held at the Bank of Italy using its electronic auction platform
(it is very similar to an ordinary government bond auction).
In Slovenia, buybacks are executed by competitive bidding, using the electronic Bloomberg Auction
System (BAS), on the basis of the Rules of the Republic of Slovenia Government Securities’ Auctions.
Buybacks are organised after an announcement addressed to bondholders on the MoF website. The
invitation to primary dealers to participate in the auction is sent by e-mail and BAS, five business days
before the buyback auction. The primary dealers submit the buyback bids in their own name and for their
own account as well in the name and for the account of other bond holders. Bids are selected (and
accepted) immediately after the closing time for submission of bids. Bids are ranked in increasing order of
price until the cut-off price8 is reached. Bids with prices lower or equal than the cut–off price may be
8 The cut-off price will be determined as the difference of the sum of the average annual net present values of
the cash flows of all bonds eligible for buyback in the auction and the average annual net present value of the cash flow of the new benchmark issue, being equal to or higher than zero.
30
allotted on a pro-rata basis. The auction results are published on the MoF website, as well as through
Reuters and Bloomberg. Secondary market purchases of government securities are also allowed by the
Slovenian Public Finance Act. However, thus far, due to budgetary constraints, this type of buyback
operation has not been executed.
In Portugal, the main guidelines of the debt buyback programme are announced at the beginning of
the year with further details on a quarterly basis. The methods used for buyback operations include reverse
auctions and bilateral transactions. The choice of buyback method depends importantly on the degree of
illiquidity of targeted bonds. Reverse auctions are primarily used to target OTs with a less than 15 months
residual maturity (which, thus far, were subject to market-making obligations in MEDIP/MTS Portugal).
Reverse auctions are organised by IGCP as multi-price competitive auctions (where participants submit the
amount of stock they are prepared to sell and the yield they are willing to accept), supported by the
electronic Bloomberg Auction System BAS. Bilateral operations are used to target securities that are
considered highly illiquid in the sense that the buyback offer must be maintained during a long period of
time in order to identify (sufficient) investors willing to sell their positions in these highly illiquid bonds,
including old and illiquid OTs (which were never under market making obligations on MTS Portugal),
foreign bonds, Eurobonds, loans or legacy loans. The price of the bonds being bought back in bilateral
operations is set against the swap curve (demanding a ‘premium’ over the cost of funding of the Republic
on relevant maturities). Thus far, bilateral operations have been done via the phone and Bloomberg.
As noted, Turkey used buybacks in the period September-December 2010 on a regular basis.
Buyback securities were announced one day prior to the auction day on the Treasury website. In that
period, auctions were held on Thursdays with settlement date on Friday. Investors submitted their bids in
terms of price and nominal amount until 01:30 pm. Securities were bought back through multiple price
auctions. The weekly maximum buyback amount was TRY 200 million. In case the price at the auction
was not judged to reflect market conditions, Treasury bought back less than the maximum amount or
nothing at all.
In New Zealand, buybacks are advertised daily between 10am - noon and 2pm - 4pm. Banks can
submit offers, although the central banks is not obliged to accept all or any bids. Buybacks in Denmark
can take place via switch auction or tap. The commonly used method In Greece for buybacks is over-the-
counter transactions with primary dealers. The Slovak Republic executes buybacks via bilateral
negotiations. Switzerland conducts buybacks as secondary market operations.
31
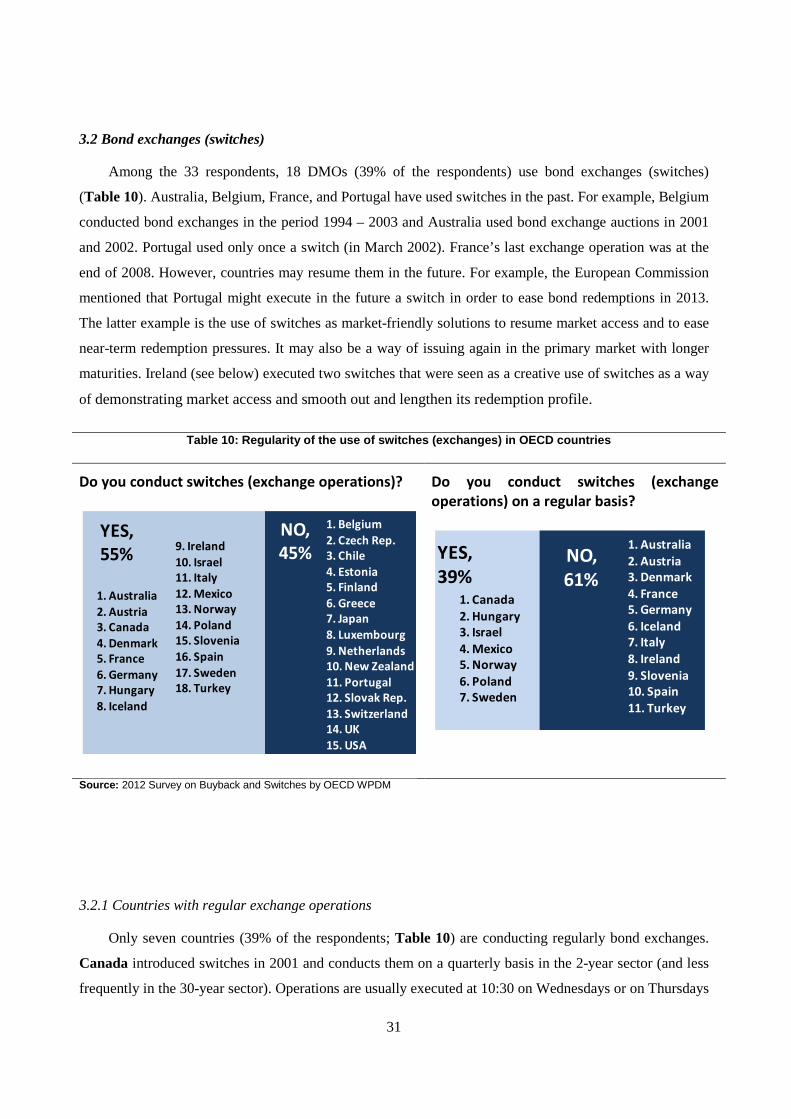
3.2 Bond exchanges (switches)
Among the 33 respondents, 18 DMOs (39% of the respondents) use bond exchanges (switches)
(Table 10). Australia, Belgium, France, and Portugal have used switches in the past. For example, Belgium
conducted bond exchanges in the period 1994 – 2003 and Australia used bond exchange auctions in 2001
and 2002. Portugal used only once a switch (in March 2002). France’s last exchange operation was at the
end of 2008. However, countries may resume them in the future. For example, the European Commission
mentioned that Portugal might execute in the future a switch in order to ease bond redemptions in 2013.
The latter example is the use of switches as market-friendly solutions to resume market access and to ease
near-term redemption pressures. It may also be a way of issuing again in the primary market with longer
maturities. Ireland (see below) executed two switches that were seen as a creative use of switches as a way
of demonstrating market access and smooth out and lengthen its redemption profile.
Table 10: Regularity of the use of switches (exchanges) in OECD countries
Do you conduct switches (exchange operations)?
Do you conduct switches (exchange operations) on a regular basis?
Source: 2012 Survey on Buyback and Switches by OECD WPDM
3.2.1 Countries with regular exchange operations
Only seven countries (39% of the respondents; Table 10) are conducting regularly bond exchanges.
Canada introduced switches in 2001 and conducts them on a quarterly basis in the 2-year sector (and less
frequently in the 30-year sector). Operations are usually executed at 10:30 on Wednesdays or on Thursdays
YES, 55%
NO, 45%
1. Australia2. Austria3. Canada4. Denmark5. France6. Germany 7. Hungary8. Iceland
1. Belgium2. Czech Rep.3. Chile 4. Estonia5. Finland6. Greece7. Japan8. Luxembourg9. Netherlands10. New Zealand11. Portugal 12. Slovak Rep.13. Switzerland14. UK15. USA
9. Ireland10. Israel11. Italy12. Mexico13. Norway14. Poland15. Slovenia16. Spain17. Sweden18. Turkey
YES, 39%
NO, 61%
1. Canada2. Hungary3. Israel4. Mexico 5. Norway6. Poland7. Sweden
1. Australia2. Austria3. Denmark4. France5. Germany6. Iceland7. Italy8. Ireland9. Slovenia10. Spain11. Turkey
32
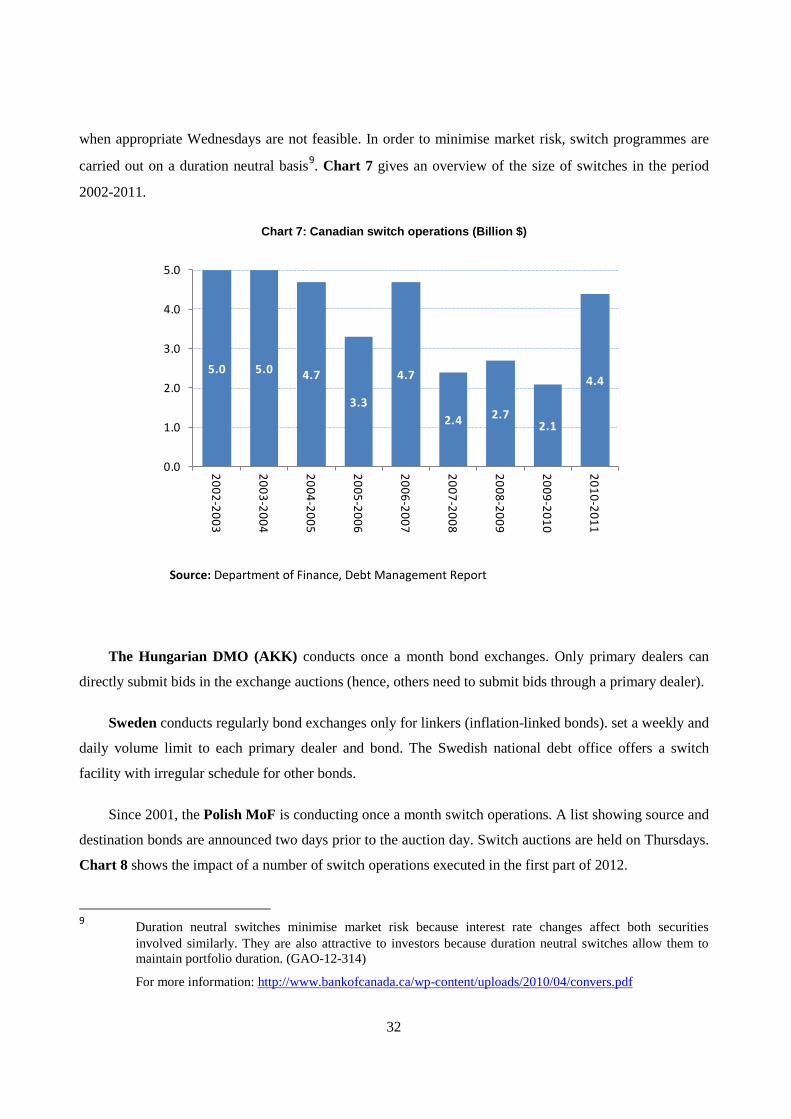
when appropriate Wednesdays are not feasible. In order to minimise market risk, switch programmes are
carried out on a duration neutral basis9. Chart 7 gives an overview of the size of switches in the period
2002-2011.
Chart 7: Canadian switch operations (Billion $)
Source: Department of Finance, Debt Management Report
The Hungarian DMO (AKK) conducts once a month bond exchanges. Only primary dealers can
directly submit bids in the exchange auctions (hence, others need to submit bids through a primary dealer).
Sweden conducts regularly bond exchanges only for linkers (inflation-linked bonds). set a weekly and
daily volume limit to each primary dealer and bond. The Swedish national debt office offers a switch
facility with irregular schedule for other bonds.
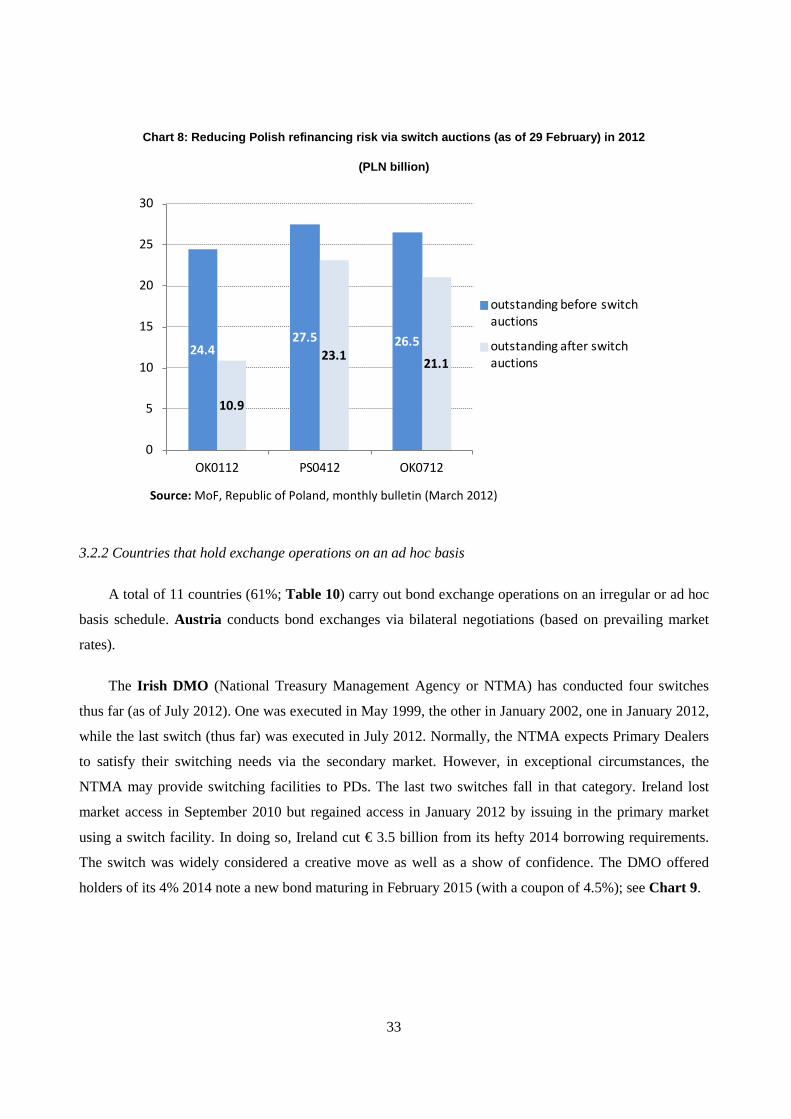
Since 2001, the Polish MoF is conducting once a month switch operations. A list showing source and
destination bonds are announced two days prior to the auction day. Switch auctions are held on Thursdays.
Chart 8 shows the impact of a number of switch operations executed in the first part of 2012.
9 Duration neutral switches minimise market risk because interest rate changes affect both securities
involved similarly. They are also attractive to investors because duration neutral switches allow them to maintain portfolio duration. (GAO-12-314)
For more information: http://www.bankofcanada.ca/wp-content/uploads/2010/04/convers.pdf
5.0 5.0 4.7
3.3
4.7
2.4 2.72.1
4.4
0.0
1.0
2.0
3.0
4.0
5.0
2002-2003
2003-2004
2004-2005
2005- 2006
2006-2007
2007-2008
2008-2009
2009-2010
2010-2011
33
Chart 8: Reducing Polish refinancing risk via switch auctions (as of 29 February) in 2012
(PLN billion)
Source: MoF, Republic of Poland, monthly bulletin (March 2012)
3.2.2 Countries that hold exchange operations on an ad hoc basis
A total of 11 countries (61%; Table 10) carry out bond exchange operations on an irregular or ad hoc
basis schedule. Austria conducts bond exchanges via bilateral negotiations (based on prevailing market
rates).
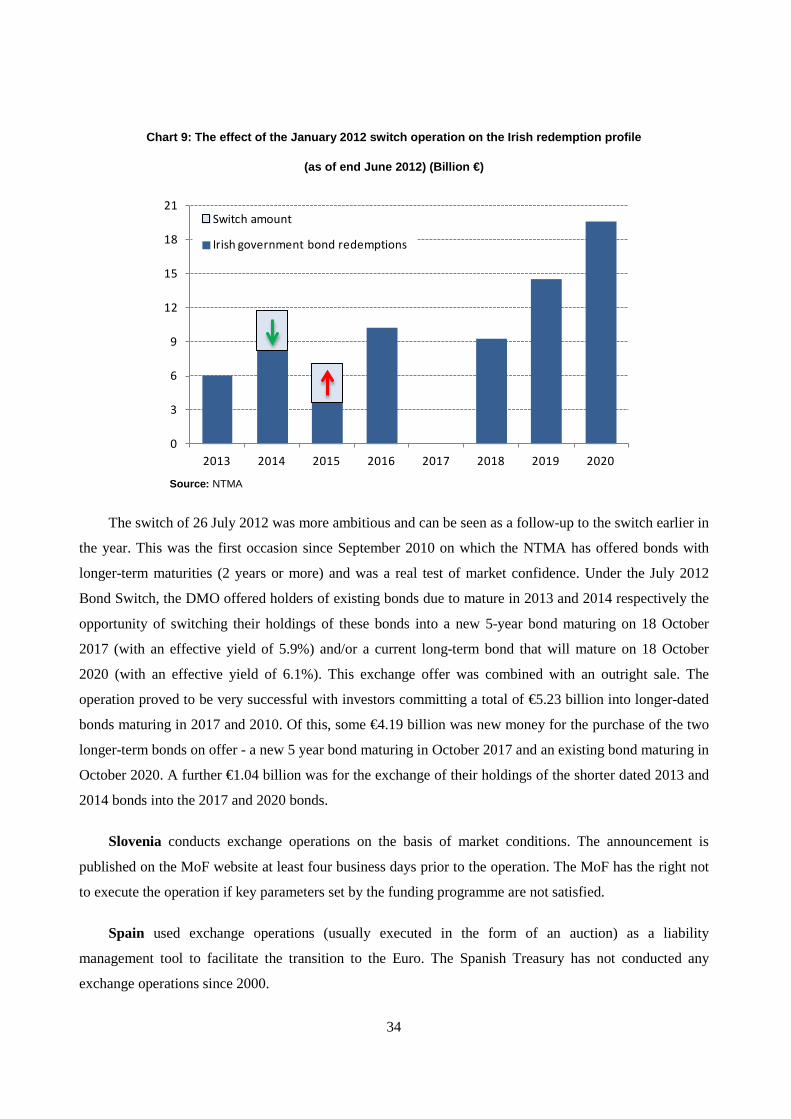
The Irish DMO (National Treasury Management Agency or NTMA) has conducted four switches
thus far (as of July 2012). One was executed in May 1999, the other in January 2002, one in January 2012,
while the last switch (thus far) was executed in July 2012. Normally, the NTMA expects Primary Dealers
to satisfy their switching needs via the secondary market. However, in exceptional circumstances, the
NTMA may provide switching facilities to PDs. The last two switches fall in that category. Ireland lost
market access in September 2010 but regained access in January 2012 by issuing in the primary market
using a switch facility. In doing so, Ireland cut € 3.5 billion from its hefty 2014 borrowing requirements.
The switch was widely considered a creative move as well as a show of confidence. The DMO offered
holders of its 4% 2014 note a new bond maturing in February 2015 (with a coupon of 4.5%); see Chart 9.
24.427.5 26.5
10.9
23.1 21.1
0
5
10
15
20
25
30
OK0112 PS0412 OK0712
outstanding before switch auctions
outstanding after switch auctions
34
Chart 9: The effect of the January 2012 switch operation on the Irish redemption profile
(as of end June 2012) (Billion €)
Source: NTMA
The switch of 26 July 2012 was more ambitious and can be seen as a follow-up to the switch earlier in
the year. This was the first occasion since September 2010 on which the NTMA has offered bonds with
longer-term maturities (2 years or more) and was a real test of market confidence. Under the July 2012
Bond Switch, the DMO offered holders of existing bonds due to mature in 2013 and 2014 respectively the
opportunity of switching their holdings of these bonds into a new 5-year bond maturing on 18 October
2017 (with an effective yield of 5.9%) and/or a current long-term bond that will mature on 18 October
2020 (with an effective yield of 6.1%). This exchange offer was combined with an outright sale. The
operation proved to be very successful with investors committing a total of €5.23 billion into longer-dated
bonds maturing in 2017 and 2010. Of this, some €4.19 billion was new money for the purchase of the two
longer-term bonds on offer - a new 5 year bond maturing in October 2017 and an existing bond maturing in
October 2020. A further €1.04 billion was for the exchange of their holdings of the shorter dated 2013 and
2014 bonds into the 2017 and 2020 bonds.
Slovenia conducts exchange operations on the basis of market conditions. The announcement is
published on the MoF website at least four business days prior to the operation. The MoF has the right not
to execute the operation if key parameters set by the funding programme are not satisfied.
Spain used exchange operations (usually executed in the form of an auction) as a liability
management tool to facilitate the transition to the Euro. The Spanish Treasury has not conducted any
exchange operations since 2000.
0
3
6
9
12
15
18
21
2013 2014 2015 2016 2017 2018 2019 2020
Switch amount
Irish government bond redemptions
35
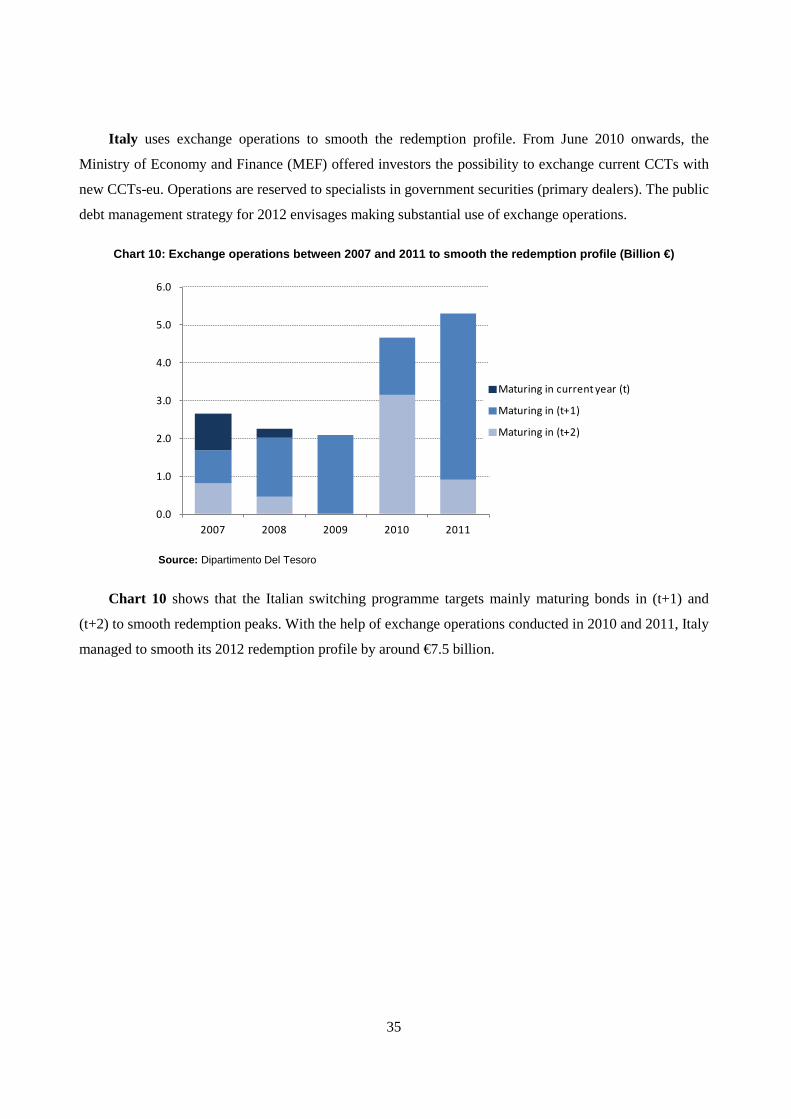
Italy uses exchange operations to smooth the redemption profile. From June 2010 onwards, the
Ministry of Economy and Finance (MEF) offered investors the possibility to exchange current CCTs with
new CCTs-eu. Operations are reserved to specialists in government securities (primary dealers). The public
debt management strategy for 2012 envisages making substantial use of exchange operations.
Chart 10: Exchange operations between 2007 and 2011 to smooth the redemption profile (Billion €)
Source: Dipartimento Del Tesoro
Chart 10 shows that the Italian switching programme targets mainly maturing bonds in (t+1) and
(t+2) to smooth redemption peaks. With the help of exchange operations conducted in 2010 and 2011, Italy
managed to smooth its 2012 redemption profile by around €7.5 billion.
0.0
1.0
2.0
3.0
4.0
5.0
6.0
2007 2008 2009 2010 2011
Maturing in current year (t)
Maturing in (t+1)
Maturing in (t+2)
36
3.2.3 Objectives of bond exchanges
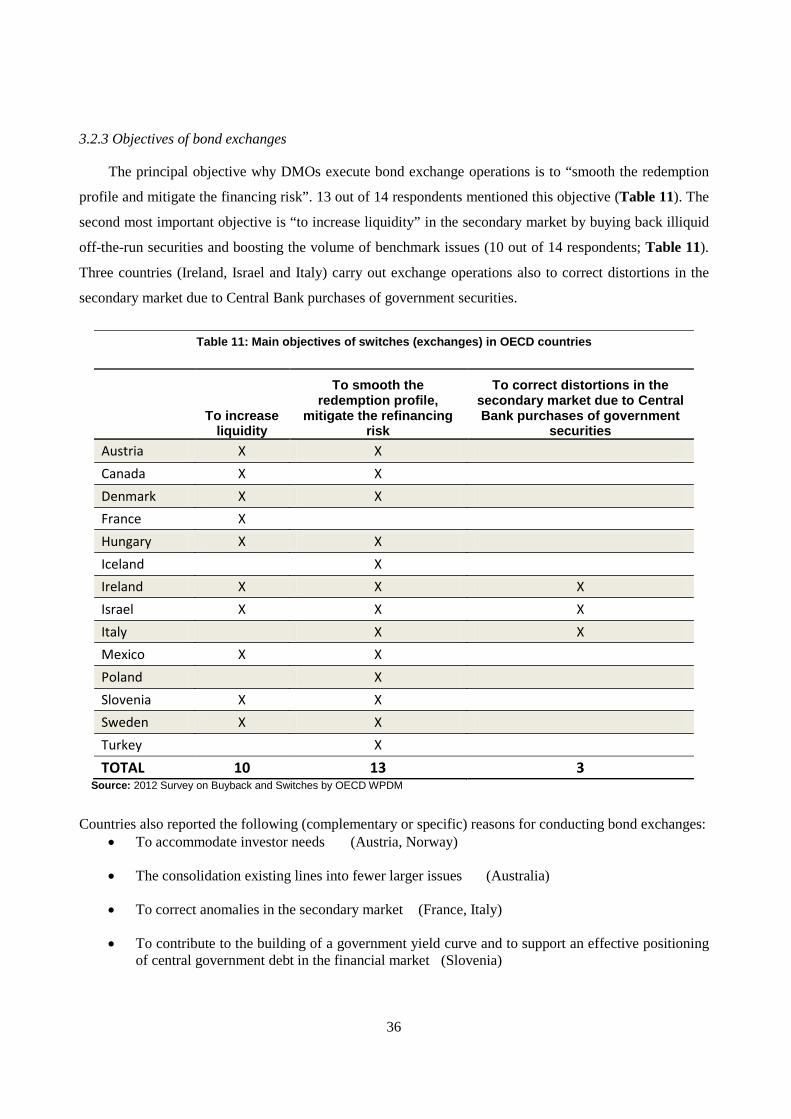
The principal objective why DMOs execute bond exchange operations is to “smooth the redemption
profile and mitigate the financing risk”. 13 out of 14 respondents mentioned this objective (Table 11). The
second most important objective is “to increase liquidity” in the secondary market by buying back illiquid
off-the-run securities and boosting the volume of benchmark issues (10 out of 14 respondents; Table 11).
Three countries (Ireland, Israel and Italy) carry out exchange operations also to correct distortions in the
secondary market due to Central Bank purchases of government securities.
Table 11: Main objectives of switches (exchanges) in OECD countries
To increase
liquidity
To smooth the redemption profile,
mitigate the refinancing risk
To correct distortions in the secondary market due to Central Bank purchases of government
securities Austria X X Canada X X Denmark X X France X Hungary X X Iceland X Ireland X X X Israel X X X Italy X X Mexico X X Poland X Slovenia X X Sweden X X Turkey X TOTAL 10 13 3
Source: 2012 Survey on Buyback and Switches by OECD WPDM
Countries also reported the following (complementary or specific) reasons for conducting bond exchanges: • To accommodate investor needs (Austria, Norway)
• The consolidation existing lines into fewer larger issues (Australia)
• To correct anomalies in the secondary market (France, Italy)
• To contribute to the building of a government yield curve and to support an effective positioning of central government debt in the financial market (Slovenia)
37
• As a structural operation tool (transition to the euro) (Spain)
• To increase maturity of the domestic debt stock (Turkey)
• To avoid possible price distortions due to high concentration in some securities (Mexico)
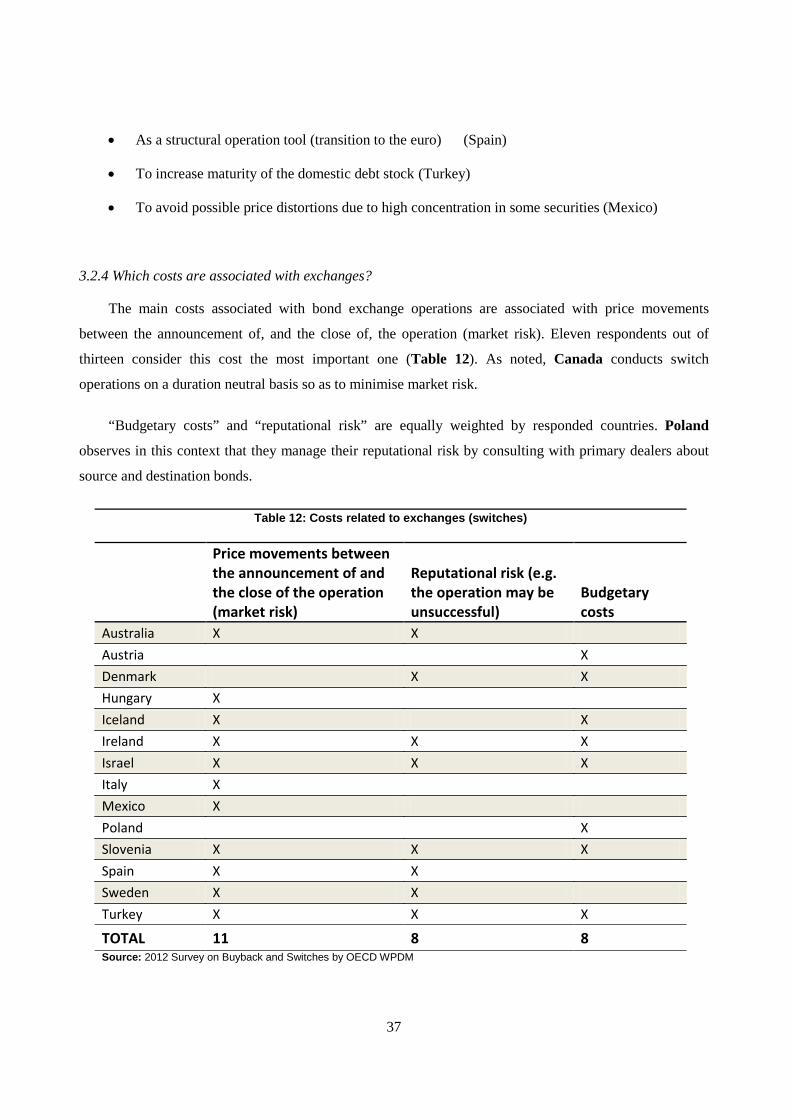
3.2.4 Which costs are associated with exchanges?
The main costs associated with bond exchange operations are associated with price movements
between the announcement of, and the close of, the operation (market risk). Eleven respondents out of
thirteen consider this cost the most important one (Table 12). As noted, Canada conducts switch
operations on a duration neutral basis so as to minimise market risk.
“Budgetary costs” and “reputational risk” are equally weighted by responded countries. Poland
observes in this context that they manage their reputational risk by consulting with primary dealers about
source and destination bonds.
Table 12: Costs related to exchanges (switches)
Price movements between the announcement of and the close of the operation (market risk)
Reputational risk (e.g. the operation may be unsuccessful)
Budgetary costs
Australia X X Austria X Denmark X X Hungary X Iceland X X Ireland X X X Israel X X X Italy X Mexico X Poland X Slovenia X X X Spain X X Sweden X X Turkey X X X
TOTAL 11 8 8 Source: 2012 Survey on Buyback and Switches by OECD WPDM
38
Clearly, an exchange above par has potentially a large budget impact. This is especially relevant for
long bonds with high coupons. Indeed, from the Survey it appears that countries normally refrain from
“locking in unattractive forward rates”.
Spain notes that during crisis periods, exchange operations might be interpreted by some market
participants as a signal that the issuer expects difficulties with future redemptions. In response, ‘the
market’ could ask a premium, thereby increasing the cost of the switch operation.
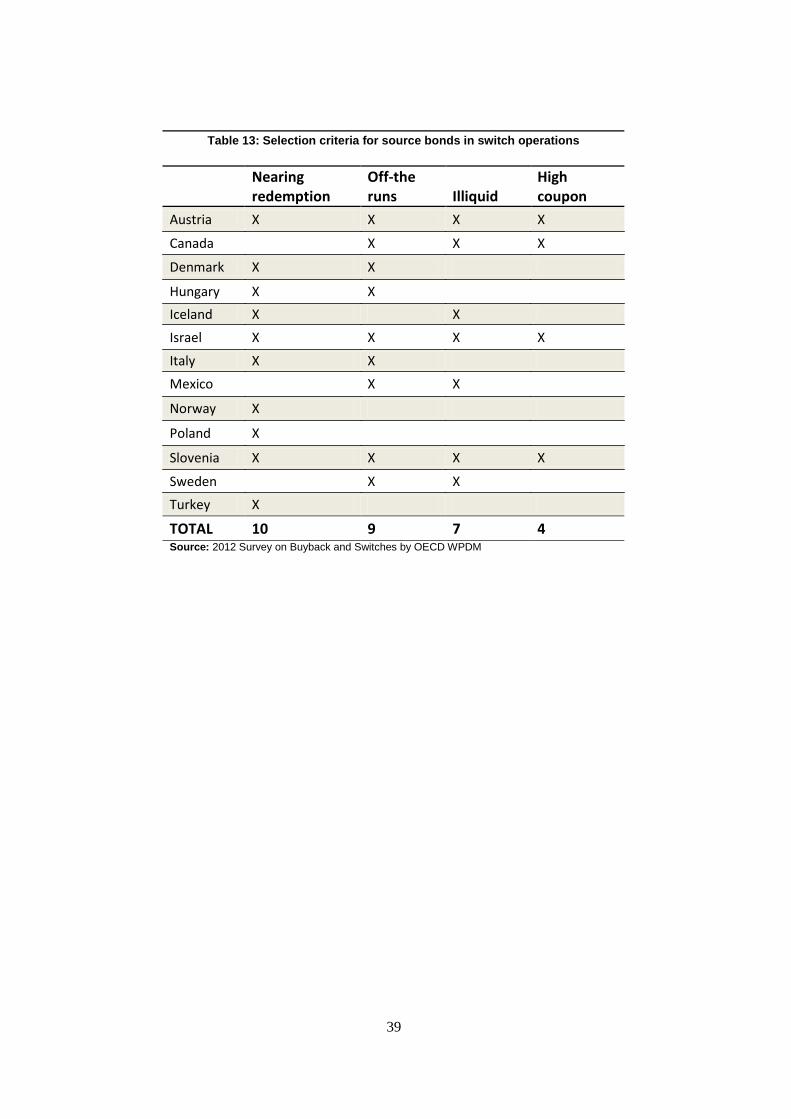
3.2.5 Selection criteria for source bonds in switch operations
The main criterion used by respondents for selecting source bonds (bond bought back in switch
operations) is the maturity profile. Almost all respondent countries (10 out of 13; Table 13) use “nearing
redemption” as the most relevant criterion for selecting the source bond. However, in practice this criterion
may have a wide meaning. For instance, in Canada, buyback operations on a switch basis involve the
exchange of less-liquid bonds with a remaining term to maturity of 12 months to 25 years. Hungary
exchanges bonds with a term-to-maturity of less than 2 years. Italy normally exchanges bonds with a
residual maturity of 18 months or less (but when it is judged that the switch may lead to an increase in the
efficiency of the market, also longer maturities can be switched).
Source bonds are usually off-the-runs and therefore fairly illiquid. Consequently, the second most
important criterion for exchanging bonds is whether they are off-the-run and have lost their liquidity in
secondary markets (Table 13). Austria, Canada, Israel and Slovenia also mention high coupon bonds as
a target for source bonds (Table 13). Canada specifically excludes the following bonds from switch
operations: issues currently being built as benchmarks in the 2-, 3-, 5-, or 10-year sectors, the current
benchmark issues in these sectors, the preceding benchmark issue in the 10-year sector, as well as bonds
with maturities greater than or equal to 25 years.
39
Table 13: Selection criteria for source bonds in switch operations
Nearing redemption
Off-the runs Illiquid
High coupon
Austria X X X X
Canada X X X
Denmark X X
Hungary X X Iceland X X Israel X X X X
Italy X X Mexico X X
Norway X
Poland X
Slovenia X X X X
Sweden X X Turkey X
TOTAL 10 9 7 4 Source: 2012 Survey on Buyback and Switches by OECD WPDM
40
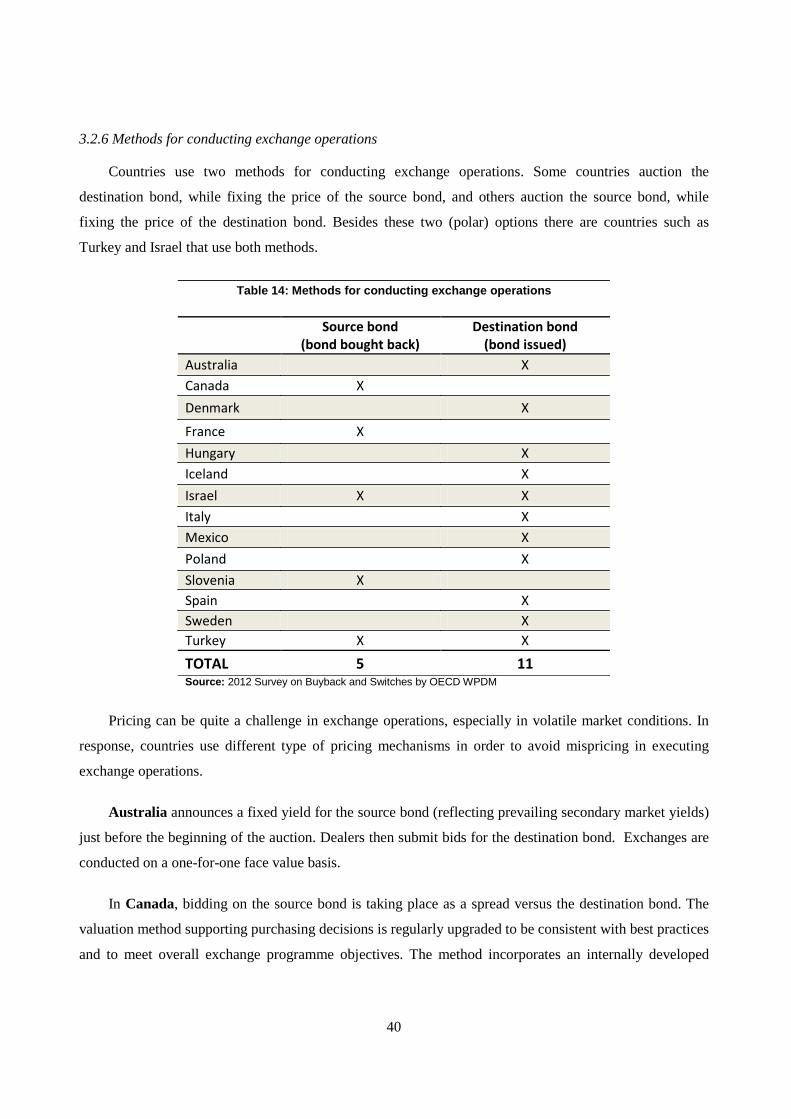
3.2.6 Methods for conducting exchange operations
Countries use two methods for conducting exchange operations. Some countries auction the
destination bond, while fixing the price of the source bond, and others auction the source bond, while
fixing the price of the destination bond. Besides these two (polar) options there are countries such as
Turkey and Israel that use both methods.
Table 14: Methods for conducting exchange operations
Source bond
(bond bought back) Destination bond
(bond issued) Australia X Canada X Denmark X
France X Hungary X Iceland X Israel X X Italy X Mexico X Poland X Slovenia X Spain X Sweden X Turkey X X
TOTAL 5 11 Source: 2012 Survey on Buyback and Switches by OECD WPDM
Pricing can be quite a challenge in exchange operations, especially in volatile market conditions. In
response, countries use different type of pricing mechanisms in order to avoid mispricing in executing
exchange operations.
Australia announces a fixed yield for the source bond (reflecting prevailing secondary market yields)
just before the beginning of the auction. Dealers then submit bids for the destination bond. Exchanges are
conducted on a one-for-one face value basis.
In Canada, bidding on the source bond is taking place as a spread versus the destination bond. The
valuation method supporting purchasing decisions is regularly upgraded to be consistent with best practices
and to meet overall exchange programme objectives. The method incorporates an internally developed
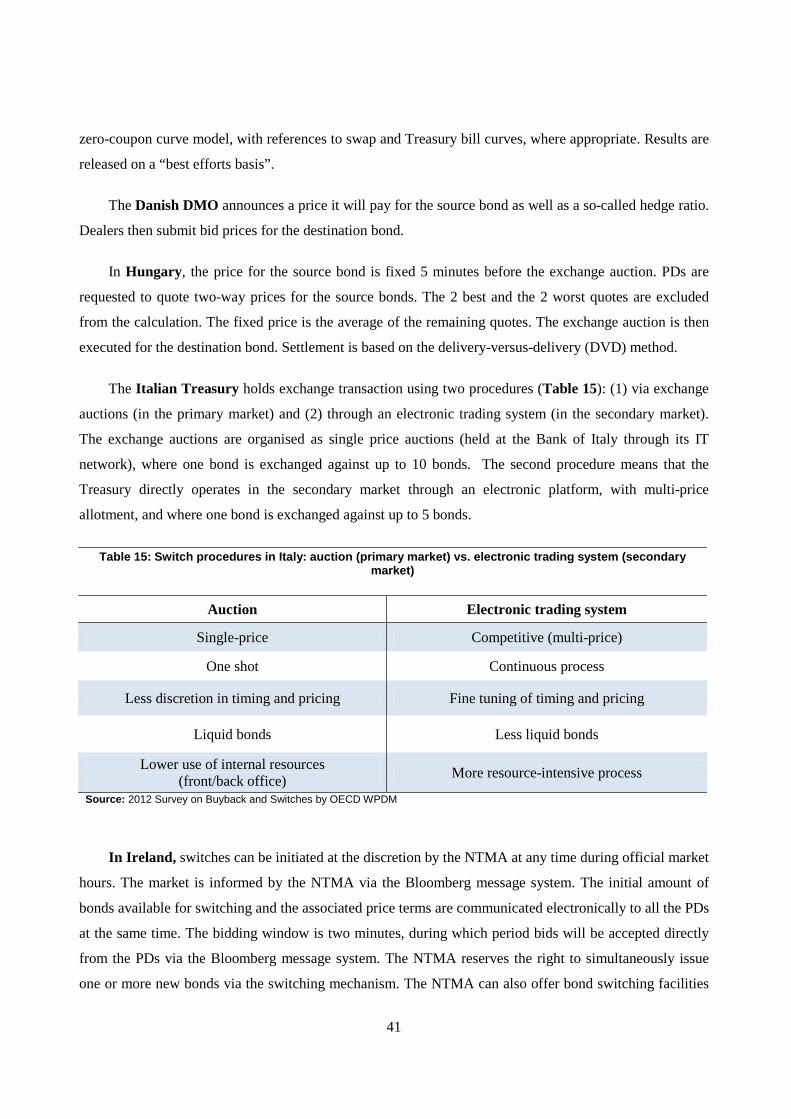
41
zero-coupon curve model, with references to swap and Treasury bill curves, where appropriate. Results are
released on a “best efforts basis”.
The Danish DMO announces a price it will pay for the source bond as well as a so-called hedge ratio.
Dealers then submit bid prices for the destination bond.
In Hungary, the price for the source bond is fixed 5 minutes before the exchange auction. PDs are
requested to quote two-way prices for the source bonds. The 2 best and the 2 worst quotes are excluded
from the calculation. The fixed price is the average of the remaining quotes. The exchange auction is then
executed for the destination bond. Settlement is based on the delivery-versus-delivery (DVD) method.
The Italian Treasury holds exchange transaction using two procedures (Table 15): (1) via exchange
auctions (in the primary market) and (2) through an electronic trading system (in the secondary market).
The exchange auctions are organised as single price auctions (held at the Bank of Italy through its IT
network), where one bond is exchanged against up to 10 bonds. The second procedure means that the
Treasury directly operates in the secondary market through an electronic platform, with multi-price
allotment, and where one bond is exchanged against up to 5 bonds.
Table 15: Switch procedures in Italy: auction (primary market) vs. electronic trading system (secondary market)
Auction Electronic trading system
Single-price Competitive (multi-price)
One shot Continuous process
Less discretion in timing and pricing Fine tuning of timing and pricing
Liquid bonds Less liquid bonds
Lower use of internal resources (front/back office) More resource-intensive process
Source: 2012 Survey on Buyback and Switches by OECD WPDM
In Ireland, switches can be initiated at the discretion by the NTMA at any time during official market
hours. The market is informed by the NTMA via the Bloomberg message system. The initial amount of
bonds available for switching and the associated price terms are communicated electronically to all the PDs
at the same time. The bidding window is two minutes, during which period bids will be accepted directly
from the PDs via the Bloomberg message system. The NTMA reserves the right to simultaneously issue
one or more new bonds via the switching mechanism. The NTMA can also offer bond switching facilities
42
in response to direct requests from PDs to help them in managing their positions. Switches dealt between a
PD and the NTMA will be priced, in the normal course, at the current bid or offer levels, as the case may
be, obtaining in the market.10
In Poland, switch operations are organised as multi-price auctions. The MoF announces the price for
the source bond on the last working day before the auction. Primary dealers submit then bids in terms of
nominal amount of source bonds and price for the destination bond. Finally, the MoF makes a decision
about the lowest accepted price (minimum or stop price) of the destination bond.
In Slovenia, a switch is executed following a public announcement with an offer, addressed to the
bondholders of the bonds to be exchanged, to participate in an exchange auction of the source bond. The
announcement is published on the MoF website at least four business days before the day of the auction.
Before each switch auction, the PDs receive an invitation to submit bids. The exchange ratio between the
source bond and the destination bond is determined based on the bid price of the source bond and the price
of the destination bond.
In Portugal, bond exchanges can be conducted via two procedures: (1) exchange offers (fixed price
exchanges) and (2) through reverse auctions immediately followed by regular auctions. Procedure one (an
exchange offer) has been conducted by the DMO (IGCP) only once. The exchange offer was based on a
fixed-price exchange between the new issue and the old one. IGCP has never conducted a pure exchange
auction. Instead, two separate back-to-back auctions are executed: (a) a multi-price reverse auction
followed one hour later by (b) a multi-price regular auction. In both auctions, the exchanged (bought back)
bonds and newly issued bonds are settled against cash.
The Spanish Treasury sets the price of the new bond (usually based on the secondary market price).
Investors state in their bids both the nominal value and the price at which they wish to exchange.
Exchanges use the competitive auction format, with the Treasury deciding the cut-off price. On the day of
the auction, the Bank of Spain gives the price of the new bonds exchangeable for the old one, and
participants enter their bids accordingly. Any individual or legal entity (both resident and non-resident), is
eligible to participate. The results of the auction are announced immediately after the operation.11
10 National, Treasury Management Agency, “Ireland’s Government Bond Issuance Procedures and Related
Debt Management Arrangements including the Primary Dealer System”, February 2010. 11 For more information: http://www.tesoro.es/en/deuda/mercados/mprimario/canjes.asp

43
The Turkish Treasury sets either the price of the source bond or the price of the destination bond.
The exchange ratio between these two securities is determined via an exchange auction (both fixed price
and multiple price options are available). Primary dealers have the exclusive right to participate in switch
auctions.
44
WORKING PAPERS PUBLISHED TO DATE
The full series is listed below in chronological order. All working papers can be accessed online at: www.oecd.org/daf/publicdebtmanagement
2012
WP 4. A Critical Analysis of the Technical Assumptions of the Standard Micro Portfolio Approach to Sovereign Debt Management
WP 3. Interactions Between Sovereign Debt Management and Monetary Policy Under Fiscal Dominance and Financial Instability
2011
WP 2. Principles and Trade-Offs when Making Issuance Choices in the UK WP 1. Regulatory Reform of OTC Derivatives and Its Implications for Sovereign Debt Management
Practices