Butterfly diversity in and around Budongo Forest Reserve, Western Uganda
67
BUTTERFLY ABUNDANCE AND DIVERSITY IN AND AROUND BUDONGO FOREST RESERVE, WESTERN UGANDA BY TUMWESIGYE GARD B Sc. FORESTRY 07/U/343 A RESEARCH DISSERTATION SUBMITTED TO THE SCHOOL OF FORESTRY ENVIRONMENTAL AND GEOGRAPHICAL SCIENCES IN PARTIAL FULFILLMENT OF THE DEGREE OF BACHELOR OF SCIENCE IN FORESTRY OF MAKERERE UNIVERSITY MAY 2011 20
Transcript of Butterfly diversity in and around Budongo Forest Reserve, Western Uganda
BUTTERFLY ABUNDANCE AND DIVERSITY IN AND AROUND BUDONGO
FOREST RESERVE, WESTERN UGANDA
BY
TUMWESIGYE GARD
B Sc. FORESTRY
07/U/343
A RESEARCH DISSERTATION SUBMITTED TO THE SCHOOL OF
FORESTRY ENVIRONMENTAL AND GEOGRAPHICAL SCIENCES IN
PARTIAL FULFILLMENT OF THE DEGREE OF BACHELOR OF SCIENCE IN
FORESTRY OF MAKERERE UNIVERSITY
MAY 2011
20
DECLARATION
I TUMWESIGYE GARD declare that this information is entirely original, genuinely done by myself and it
has never been presented or submitted at any university or academic institution for any award.
Signed ……………………………. Date………………………
TUMWESIGYE GARD
Student
This work has been submitted to the school of Forestry, Environmental and Geographical Sciences with
approval of the University supervisor
Signed………………….. Date…………………….
FRED BABWETEERA (PhD)
Supervisor
20

DEDICATION
I dedicate this work to my parents Mr. Johnathan Kambamu and Mrs. MaryR Kambamu and my nieces
Ms Sylia Tashobya and Ms Precious Komuhangi.
20

ACKNOWLEDGEMENTS
Great thanks to my Dad and Mom and my sibling especially Benard, Christine, Eldard, Augustine and
Monic for their support, prayers and financial assistance. Peace Natureeba (my Inlaw) and Dr. Richard
Nuwagaba (my cousin) have also been of great help. Special thanks to my supervisor, Dr. Fred
Babweteera. He has advised and supported me in the most commendable way throughout my study. I
take him as my role model. I am so grateful to the management of Budongo Conservation Field Station
(BCFS), and Dr. Fred Babweteera (the then Director) in particular for any assistance given to me
including accommodation, materials and the research assistant during my data collection.
Thanks to Ms Akite Perpetra who gave me a fundamental advice on which methods to use, Mr. Richard
Bagenda who helped me in butterfly identification and Denis who helped me during my data collection as
a research assistant. To all my friends who supported me morally and encouraged me throughout the
course, thank you. Charles Sabiiti, Simon Kaijuka, Benson Atuha, Julian Ahiira and Moses Tumwine have
been friends with a difference. Most of all I thank my The Lord God Almighty who has done the most
tremendous things in my life to reach this far.
20
TABLE OF CONTENTS
DECLARATION i
DEDICATION ii
ACKNOWLEDGEMENTS iii
TABLE OF CONTENTS iv
LIST OF TABLES vi
LIST OF FIGURES vii
LIST OF APPENDICES viii
LIST OF ACRONYMS ix
ABSTRACT x
CHAPTER ONE 1
INTRODUCTION 1
1.0 Background 1
1.2 Statement of a research problem3
1.3 Specific objectives 4
1.4 Research hypothesis 4
1.5 Justification 4
CHAPTER TWO 6
LITERATURE REVIEW 6
2.1 Classification of butterflies 6
2.2 Foods, food habitats and predators 8
2.3 Reproduction of butterflies 9
2.4 Importance of butterflies9
2.5 Budongo forest biodiversity 10
2.6 Previous work on butterflies of Budongo Forest Reserve11
2.7 Land use cover changes around Budongo Forest Reserve 11
2.8 Species diversity in landscapes around the forest12
20

2.9 Effect of forest vegetation structure on butterfly diversity14
2.10 Butterflies as indicator species14
CHAPTER THREE 17
STUDY AREA AND METHODS 17
3.1 Location17
3.2 Topography 17
3.3 Climate 17
3.3.1 Temperature 17
3.3.2 Rainfall 18
3.4 Data collection 18
3.4.1 Study sites 18
3.5 Data analysis 21
CHAPTER FOUR 23
RESULTS 23
4.1 Diversity and species richness among land use types 23
4.2 Similarity of butterfly assemblages between land use systems29
CHAPTER FIVE 33
DISCUSSION33
CHAPTER SIX 38
CONCLUSION AND RECOMMENDATIONS 38
6.1 Conclusion 38
6.2 Recommendations 38
REFERENCES 40
APPENDICES44
20
LIST OF TABLES
Table 1: Observed abundance of butterfly species and family composition in and around Budongo Forest Reserve. 23 Table 2: Diversity indices and abundance scores for butterfly communities across different land use systems in and around Budongo Forest Reserve. 24 Table 3: Pair wise Comparison of Shannon Weiner Diversity indices between habitats 24 Table 4: Percentage dissimilarity and ANOSIM pairwise comparisons of butterfly abundances between land use types in and around Budongo Forest Reserve 30 Table 5: Comparison of species between habitats in and around BFR 31
20

LIST OF FIGURES Figure 1: Map of Budongo forest reserve showing the area where research was conducted 19 Figure 2: Butterfly species richness (A) and abundance (B) in the five land use types in and around Budongo Forest Reserve 25 Figure 3: Butterfly species accumulation curves for (A) individual land use types; (B) all samples pooled in and around Budongo Forest Reserve 27 Figure 4: Rare faction curves for each land use system in and around Budongo Forest Reserve 28 Figure 5: Rarefaction curves for all land use systems pooled. 29 Figure 6: MDS ordinations of butterfly assemblages in different land use systems; forest edge (A), Pine plantation (B), Fallow land (C), Crop land (D) and forest interior (E). 32
20
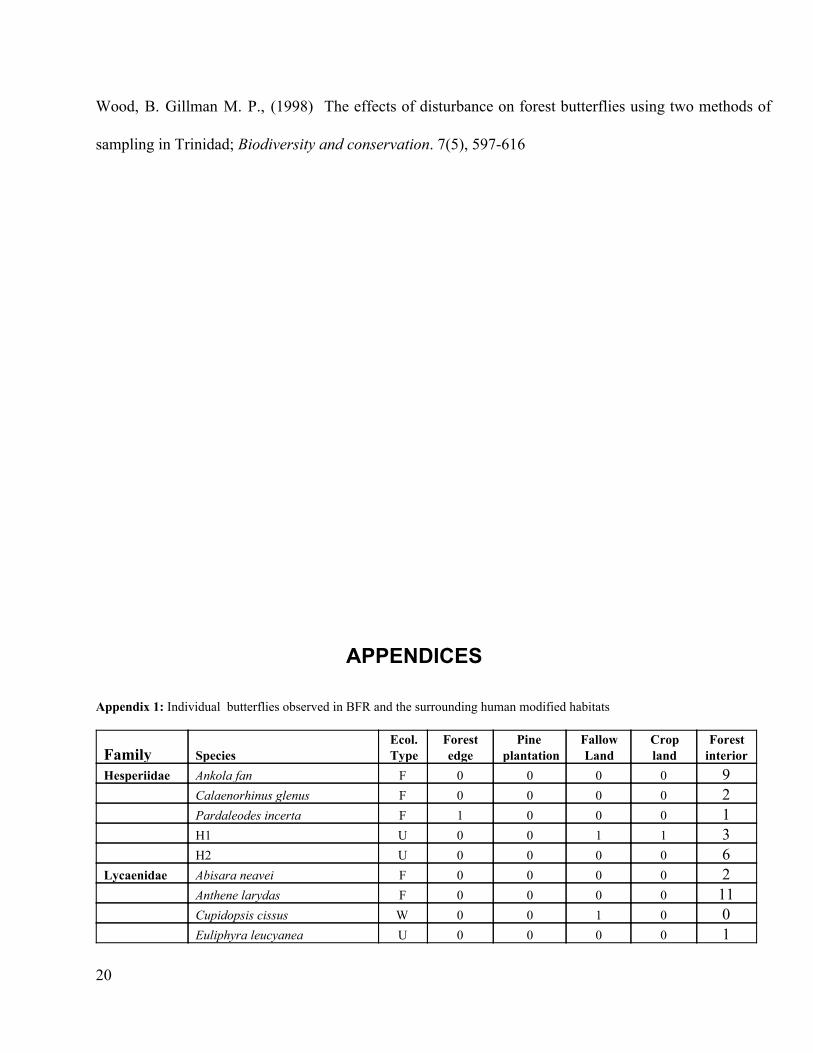
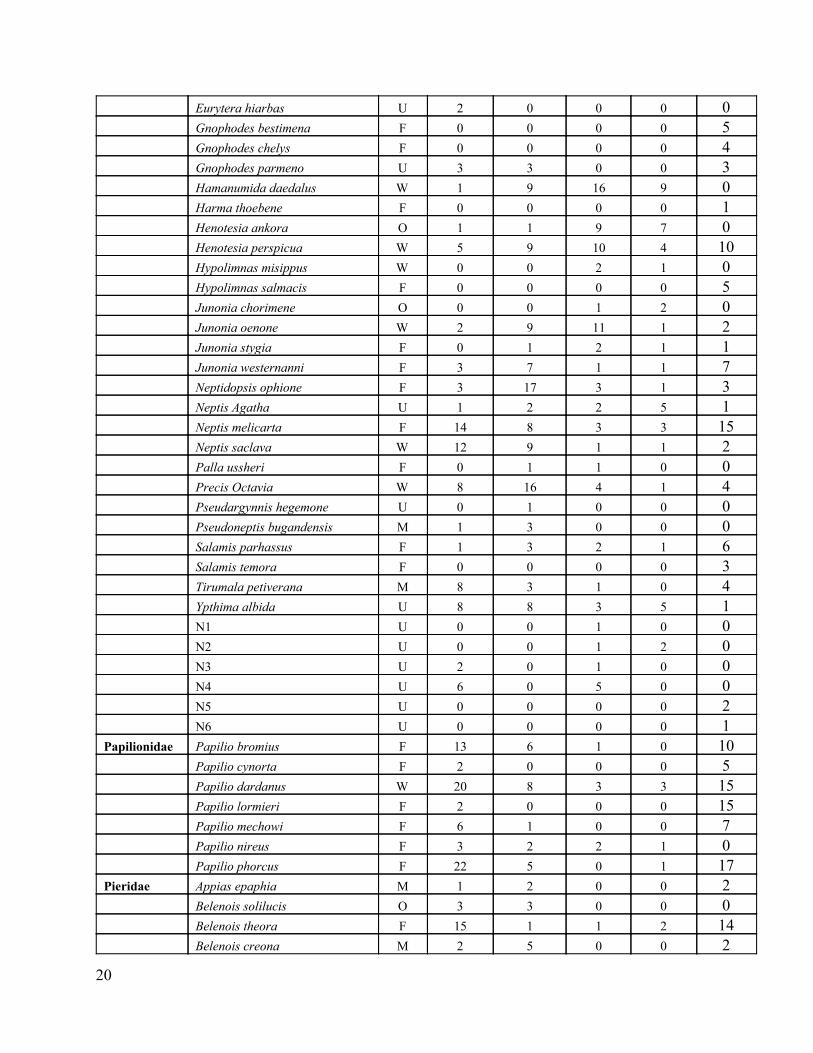
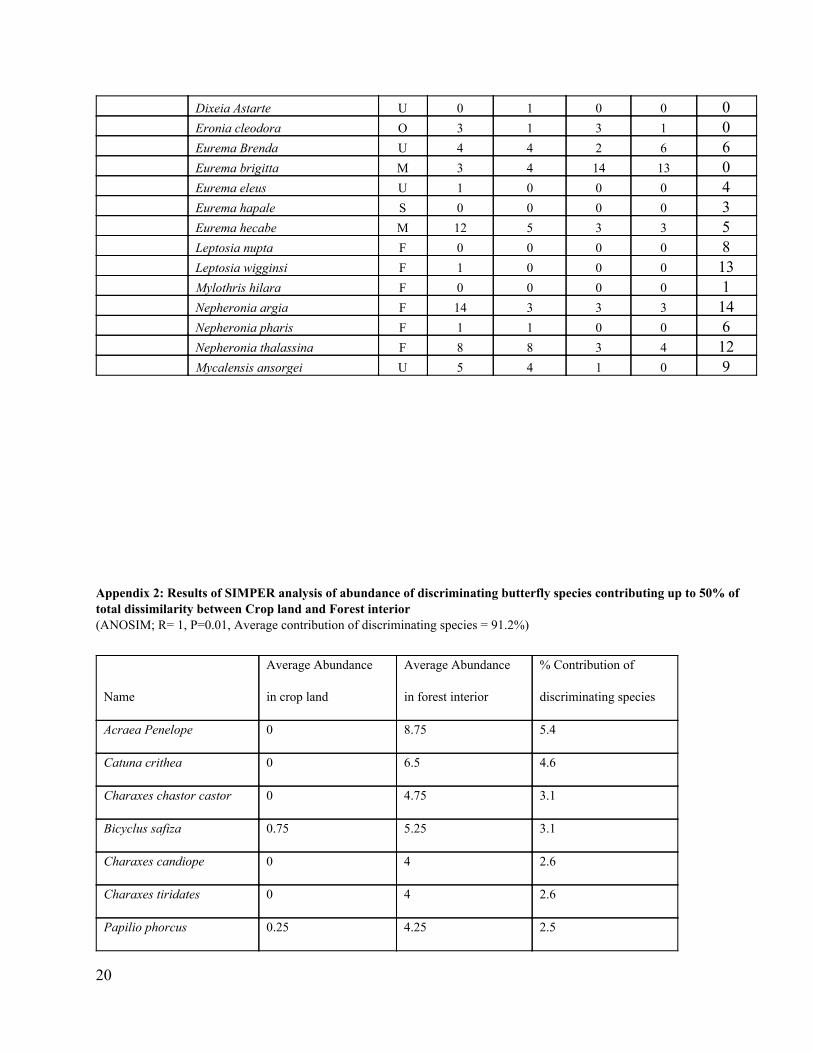
LIST OF APPENDICES Appendix 1: Individual butterflies observed in BFR and the surrounding human modified habitats45 Appendix 2: Results of SIMPER analysis of abundance of discriminating butterfly species contributing up to 50% of total dissimilarity between Crop land and Forest interior 48 Appendix 3: Results of SIMPER analysis of abundance of discriminating butterfly species contributing up to 50% of total dissimilarity between Fallow land and Forest interior 49 Appendix 4: Results of SIMPER analysis of abundance of discriminating butterfly species contributing up to 50% of total dissimilarity between Forest interior and Pine plantation 50 Appendix 5: Results of SIMPER analysis of abundance of discriminating butterfly species contributing up to 50% of total dissimilarity between Forest edge and interior 51 Appendix 6: Results of SIMPER analysis of abundance of discriminating butterfly species contributing up to 50% of total dissimilarity between Crop land and Forest edge 52 Appendix 7: Results of SIMPER analysis of abundance of discriminating butterfly species contributing up to 50% of total dissimilarity between Fallow land and Forest edge 53 Appendix 8: Results of SIMPER analysis of abundance of discriminating butterfly species contributing up to 50% of total dissimilarity between Crop land and Fallow land. 54 Appendix 9: Results of SIMPER analysis of abundance of discriminating butterfly species contributing up to 50% of total dissimilarity between Crop land and Pine plantation 55 Appendix 10: Results of SIMPER analysis of abundance of discriminating butterfly species contributing up to 50% of total dissimilarity between Fallow land and Pine plantation 56 Appendix 11: Results of SIMPER analysis of abundance of discriminating butterfly species contributing up to 50% of total dissimilarity between Forest edge and Pine plantation 57
20

LIST OF ACRONYMS
BFR Budongo Forest Reserve
SDR Species Diversity and Richness
CAP Community Analysis Package
ANOSIM Analysis of Similarity
SIMPER Similarity Percentages
GPS Global Positioning System
20
ABSTRACT
Human modified landscapes form a substantial and ever increasing amount of earth’s land surface at the
expense on natural forests and little is known how the diversity and abundance of butterflies might change
in human modified landscapes. Butterflies have been used as bioindicators for biodiversity monitoring and
are a major tourist attraction. The study identified the butterfly species found in habitats under different
land use systems and compared the abundance and diversity of butterfly species in and around Budongo
Forest Reserve. Butterflies were sampled on 20 sites from five land use systems using sweep netting and
baited trapping methods along the transects. A total of 1,425 butterflies belonging to 5 families and 109
species were captured. The family Nympharidae was the most abundant (64%). Butterfly assemblages in
the forest interior were significantly different from all other land use systems while the forest edge was the
transition between the forest interior and converted landscapes. I postulate that conversion of natural
forests to other land use systems severely influences butterfly abundance and diversity. Forest degradation
or clearing is likely to result in loss of species of conservation value.
20

CHAPTER ONE
INTRODUCTION
1. Background Tropical rain forests have a rich biodiversity, both in flora and fauna. These forests are refuge for a wide
variety of plant and animal species and are important centers of endemism for plants, mammals, birds,
reptiles, frogs, butterflies, snails and millipedes. (Burgess et al., 1998). The forests provide favorable
conditions such as canopy cover, camouflage, litter, moderate temperature and humidity, and food
resources for resident animals. The structural complexity of habitats and diversity of vegetation forms in
natural forest landscapes has been shown to be correlated with fauna diversity (Gardner et al., 1995).
However, forest destruction in favour of land for agriculture and urbanization has reduced habitat area
and living space for plants and animals. There is need to monitor the biodiversity of species that are
vulnerable to forest loss and degradation. It is noted that when extensive undisturbed ecosystems are
20
cleared, complex patterns emerge among new vegetation and the remnants with profound effects on
biodiversity (Schelhas & Greenberg, 1996; Laurance & Bierregaard, 1997). As a result, species richness
diminishes, abundance patterns change, patterns of endemism are disrupted and ecosystem structural
properties are modified. The maintenance of biodiversity under such conditions is a challenge for
conservation.
Budongo Forest Reserve (BFR) is among such forests where there could be changes in species richness
and abundance patterns due to conversion of its surrounding landscapes. The magnitude of flora and fauna
if BFR is particularly diverse as well as being of considerable conservation importance, although increasing
human activities may represent a threat to the forest integrity (Davenport et al., 1996).
The reserve is surrounded by different communities and the landscapes have been converted to different
land uses such as sugarcane growing, plantation forest, agricultural crop growing and human settlement.
This in turn influences the composition of species such as butterflies which utilize both habitats, in and
around the forest (Mwavu et l.,2008)
The methods of evaluating human induced effects on the environment are critical and the concept of using
certain species as bioindicators for identifying specific environmental disturbance is well established
(Humphries et al., 1995). It is increasingly recognized that smaller species are important for ecological
and conservation monitoring of forests and other converted landscapes because some are particularly
sensitive to environmental pollutions and climate changes in habitat structure. (Houlahan et al., 2000;
MacNally et al., 2004; Stuart et al., 2004).
Butterflies, like most forest dependent animals are good ecological indicators of the health of forests they
dwell. For instance according to (Nyamweya et al., 2010), butterfly species richness decreases after a
20
forest disturbance and fragmentation .They have been proven as replicate indicators of biodiversity and
functional integrity and can be used to monitor ecosystem responses to environmental changes. As species
are lost at an increasingly high rate from outside and with in protected areas, it becomes important to
establish baseline data on species abundance and distribution to which future surveys and conservation
efforts can be related. (Ehrenfeld, 1976).
In most parts of Africa including Uganda, there has been less attention given to small animal taxa in most
protected areas and surveys have focused on large animals (Caro et al., 1998). Also numerous studies
have dealt with consequences of forest degradation and fragmentation on fauna and flora and
comparatively few have studies focused on the biodiversity of human modified landscapes (Araujo et al.,
2007).
1.2 Statement of a research problem Butterflies have been identified as important bioindicators for assessing biodiversity and monitoring
ecosystem responses to environmental perturbations (Akite 2008). They have the ability to exploit
different habitats and some species are particularly sensitive to environmental pollution and changes in
habitat structure (e.g. Houlahan et al., 2000; MacNally et al., 2004; Stuart et al., 2004). How ever, few
studies have focused on diversity of such species outside protected areas and production landscapes such
as tree plantations are rarely considered as priority areas for conservation in tropics yet according to
Araujo et al. 2007, they have the potential to provide a conservation service for small taxa in much of the
20

humid tropics. We do not know how the diversity and abundance of butterflies might change in human
modified landscapes. There is therefore a need to obtain quantitative information on butterfly species
diversity and abundance in different land use systems as well as the native forest. This study assessed the
distribution and abundance of butterfly species in landscapes of varying anthropogenic influence.
The aim of this study was to gain knowledge about the spatial distribution of butterflies in Budongo Forest
Reserve and the surrounding human modified landscapes.
1.3 Specific objectives
i. To identify the butterfly species found in habitats under different land use systems.
ii. To compare the abundance and diversity of butterfly species in different land use systems.
1.4 Research hypothesis The abundance and diversity of butterfly species in BFR and the surrounding land use systems is the same.
1.5 Justification Human influenced landscapes form a substantial and ever increasing amount of earth’s land surface. These
modified habitats and often negatively influence butterfly species and their dynamics (Gascon et a., 1999,
Rickets et al., 2001). More to that, the countryside and abandoned fields have been relatively under
valued for their biodiversity and attention has focused on biodiversity of hot spots and protected areas.
The study will address the knowledge gap by providing quantitative information on the biodiversity status
in different landscapes around the forest compared to the forest interior. Butterfly inventories are needed
20

to provide information necessary as a useful tool for biodiversity monitoring and sustainable forest habitat
use.
The collection of butterfly data from different sites permits the compilation of species lists, which may be
used both quantitatively and qualitatively, to facilitate a broad comparison of sites and subsequently
identify conservation requirements. The study will address the potential of managed landscapes including
plantations and agricultural land to maintain the health of the environment, preserve and restore
biodiversity.
Since the area of disturbed habitats and converted landscapes is increasing in tropical countries which
contribute to climate change, the study will also provide base line data that can be used as a guide for
conservation and management programs on areas that are being converted from natural forests to other
land use systems.
Butterflies are also a major tourist attraction. Therefore knowing the diversity and abundance will aid in
identifying the suitable tourism sites.
20
CHAPTER TWO
LITERATURE REVIEW
2.1 Classification of butterflies Butterflies and moths belong to the taxonomic order Lepidoptera. They are distinguished from each other
by the presence of tiny scales covering their wings. Each butterfly or moth has a unique wing colour and
pattern that is determined by the arrangement of scales. The two can be distinguished from each other by
the presence of a structure that binds the fore wings to the hind wings (wing coupling apparatus ) and the
shape of their antenna when considered together. At rest, moths settle with their wings along their bodies
or held flat. Butterflies rest with their wings folded above their bodies. Butterflies have knobbed antennae
as opposed to moths which have quite variable antennae but never knobbed. Butterflies have less hairy
bodies in comparison with moths. The vast majority of butterflies are active during the day while most
20
moths are only active at night. Butterflies are categorized into five families, namely the Pailionadae,
Pieridae, Nympharidae, Lycaenidae and Hesperiidae (Davenport, 1993).
The butterflies in family Papilionidae are known as the swallowtails. They are among the largest African
butterflies and are usually considered as most beautiful butterflies. This comprises of two genera, the
Papilio and the Graphium. They are often brightly coloured with prominent tails on the hindwings.
Swallowtails are easily identified by their size and colour. They however display a great degree of sexual
dimorphism and may vary in form geographically. They usually flutter when feeding but they may be still
when feeding at damp patches.
The Pieridae family members are the yellows and whites and have medium to small. The yellow and white
colour and wing shape easily identify them. The yellow colour is associated with pigments rarely found
outside this family. Most of the species in this family are strong fliers and some are migratory. They usually
feed from roadside puddles. They also exhibit sexual dimorphism. They also vary in form with seasons.
During rainy season, they become with heavier pigmentation and become small and lighter coloured in dry
season.
The Lycaenidae family comprises of small sized species also known as Gossamer wings whish is derived
from a green, blue or violet sheen on many wings. These are the Blues, Coppers, Metalmarks and
Hairstreaks. The males and females usually differ in colour and pattern and the undersides of their wings
are different from their top sides. They often have long tails on their hind wings. A few species of
Lycaenidae are mimics of Acraeinae and Danianae subfamilies of Nympharidae.the spsecies of this family
are commonly seen feeding on damp patches, or fluttering from one flower to another in gardens. The
20

family Lycaenidae is subdivided into four subfamilies; the Theclinae, Polyomatinae, Lipteninae and
Riodininae.
The family Nymphalidae contains butterflies known as brush footed butterflies as the front pair of legs are
underdeveloped. It is the most diverse family. They are large to medium sized butterflies which appear in
myriad colours and shapes and displaying diverse habits. This family has six subfamilies; Libytheinae,
Danainae, Satyrinae, Charaxinae, Nympharinae and Acraeinae.
The Heperiidae is a family of butterflies with distinctive short, triangularshaped forewings. It has three
subfamilies; Coeliadinae, Pyrginae and Hesperiinae. They are small sized, elusive with a rapid, skittering
flight, known as grass skippers. They frequently dart from one flower to another while feeding. They are
generally dull in color, brown, grey or drab orange (Carder, et al., 2004).
2.2 Foods, food habitats and predators Butterflies feed on liquids and they use their proboscis as a sucking straw during feeding. The favorable
source of food for most butterflies is nectar. Other food sources include fruit juices and fermenting fruit,
tree sap, urine, salts, water and water rich in organic matter. The larvae are usually found feeding on a
single species or a few related species of plants. Other species have a more extensive range especially
those that lay their eggs on widely distributed or weedy plants (Carder, et al., 2004).
Butterflies are found in a wide variety of habitats ranging from tundra to rain forests and at all altitudes.
The highest diversity in tropics and butterflies fly throughout the year. The good weather conditions and
ample temperature allow rapid development of larvae and long adult life. (Sbordoni and Forestiero,
1985). Many butterflies are migrants and migrations usually involve a large number of individuals of single
or mixed species moving long distances, often coinciding with the onset of rainy seasons (Carder, et al.,
20
2004).
Almost every class of vertebrates contains some predators, which attack the Lepidoptera. Such
predators include lizards, birds, small rodents, spiders, bats, fish, amphibians, small snakes. Butterflies
have morphological, physiological and behavioral traits that reduce their vulnerability to predators during
feeding or resting (Marden and Chai, 1991). Some butterflies have evolved defenses such as tough
exoskeleton, flight, camouflage (using pattern and shape which merge with the background, trees, or
leaves) as well as chemical defenses. Some butterflies are toxic to predators, which are advertised by
characteristic wing patterns and slow, provocative flight. Mimicry, a special form of defense occurs in
many species of butterflies. Mimics which are palatable to predators have evolved the same wing patterns
as the toxic species (models) and even replicate their slow, deliberate fight (carder, et al., 2004).
2.3 Reproduction of butterflies Butterflies and moths undergo complete metamorphosis. Their life cycle has four stages, egg, larva
(caterpillar), pupa (chrysalis) and adult. The adult females after mating usually lay eggs on plant leaves
which act as food sources for the larvae when the eggs hatch. The development of eggs depends on the
temperatures and ranges in different species from 23 days up to 2 weeks. When the larvae is ready to
hatch, it bites its way out of the egg and immediately starts feeding on the food plants or in some species
eats first the remaining shell (carder, et al., 2004).
In a few species, the larvae are predators as some butterfly caterpillars can eat aphids and stored cereals.
Caterpillars feed continuously and vigorously, periodically shedding their skin as they undergo several
growth stages called instars, and finally reach the final stage where they spin cocoons and become pupae.
Being practically immobile, the pupa is protected by its colours and shape, resembling plant parts or
20
substance unpalatable to predators. The length of the papal stage varies for different species from several
days to months, after which the adult emerges. During pupation the structures of larvae are totally
transformed. The internal structured are reorganized and adult external structures develop (Royson,
1998).
2.4 Importance of butterflies Butterflies are easier to study and are better understood than other insects. They have been important in
evolution and genetic sciences such as discovery of Rhesus factor in man, in the shaping of Darwin’s
theories of evolution, in studies on mimicry and coevolution of insects with plants (Van Wright and
Ackery, 1994) and in studies of population dynamics.
To conservations and ecologists, butterflies have been identified among the few taxa as biogeographic and
ecological indicators (Howard et al., 198, 2000).
They form communities specific to geographical sub regions and different ecological conditions and thus
used as indicators of habitat condition.
Butterflies are valuable pollinators of flowering plants. Most butterfly species visit different flowers in
search for nectar and in turn enhance the process of cross pollination which is essential for genetic
variability of plants.
Butterflies and moths, especially their larvae are both enemies and allies of humans in biological pest
control, as target and a means to control pests. Some species are agricultural pests such as the larvae of
Papilio demodorcus which feeds on cultivated citrus,Colias electo which feeds on various legumes and
Acraea acerata which feeds on sweet potato leaves (Larsen, 1991). In the US for instance, biologists at
the University of Carolina have used soya bean looper caterpillars (Pseudoplusia includes) to devour
Kudzu, a plant introduced from Japan that proved to be invasive.
20
2.5 Budongo forest biodiversity Budongo Forest covers an area of 793 km of which only 53% is forest. The remaining 47% is grassland.
The altitudinal range is 7001270m. This forest type is classified as medium altitude semi deciduous moist
forest. Budongo has a high biodiversity with 24 species of small mammals; nine being primates; 465
species of trees and shrubs; 359 species of birds; 289 species of butterflies; and 130 species of moths
(Davenport et al., 1996).
Compared with other Ugandan forests, Budongo is particularly diverse, with total species diversity lying
with in the top 10% for butterflies and large moths and above average for birds. In terms of the
conservation value of the represented species basing on the knowledge of their worldwide distribution and
occurrence in Uganda frosts, Budongo is in the top 10% of sites for trees and shrubs and large mothers
and above average for butterflies and birds (Davenport et al., 1996).
2.6 Previous work on butterflies of Budongo Forest Reserve The butterflies of BFR were last surveyed in 1994 through a systematic use of sweep nets and baited
traps, for a total of 53 man days. A total of 254 species was registered, 12 Papilionidae, 29 Pieridae, 28
Lycaenidae, 148 Nymphalidae and 37 Hesperiidae. A large proportion of the total butterflies captured
were forestdependant butterflies. Of the species recorded from the reserve, 122 species are associated
with closed forest habitats and 45 species with forest edge ecology totaling to approximately 66% of the
sampled butterfly fauna. In addition, 45% of the Uganda’s migratory species were registered. Some 43
restricted range species were recorded in not more than five sites during the programme. The reserve
supports more than 20% of Uganda’s Rhopaloceran fauna, including 39% of the country’s Papilionidae,
33% of the Nymphalidae and 45% of the subfamily Charaxinae. Some recorded species were considered
20
to be globally rare and / or of restricted distribution (Davenport et al., 1996).
2.7 Land use cover changes around Budongo Forest Reserve Landuse and cover changes around BFR were analysed from multitemporal LandSat images (1988
2002) and associated fieldbased studies in 20032004. Major landuse and cover classes;
forest/woodland, sugarcane plantations and grassland/shiftingcultivation/settlements were clearly
discriminated. The area under sugarcane cultivation increased over 17fold, from 690 ha in 1988 to
12729 ha in 2002, with a concomitant loss of about 4680 ha (8∙2 per cent) of forest/woodland, mainly on
the southern boundary of BFR. Landuse and cover changes were a result of agricultural expansion,
increasing human population exacerbated by large influxes of refugees, conflicts of interest and political
interference in the management of BFR and unclear land tenure.
Agriculture is the main landuse practice and source of income to local people, with commercial sugarcane
and tobacco as the primary cash crops. Individual smallholder sugarcane plantations covered distances
ranging from 30 to 1440 m along the BFR edge, with no buffer zone, resulting in direct conflicts between
farmers and forest wild animals. There is an everincreasing need for more land for agricultural expansion,
resulting in continued loss of forest/woodland on private/communal lands and encroachment into BFR.
This unsustainable agricultural expansion and the local people's perception of BFR as an obstacle to
agriculture, threatens the conservation of its threatened wild plants. (Mwavu et al., 2008).
2.8 Species diversity in landscapes around the forest Production landscapes are rarely considered as priority areas for biodiversity conservation in the tropics
and comparatively few studies have been focused on the biodiversity of cleared and converted land of
20
formerly forested areas. In many regions of SE Asia, cultivated and degraded land outnumbers by far the
natural ecosystems. Therefore, managed landscapes comprising agricultural and fallow land need to be
included in the efforts to preserve and restore natural biodiversity (Goehring et al., 2002).
One of the few studies including both forest and agricultural systems was conducted by Ricketts et al.,
2001) who recorded moth species from forest fragments and from different surrounding agricultural
habitats including coffee, mixed crops and pasture in Costa Rica.
No significant difference in moth species richness between different agricultural habitats was evident, but
species richness decreased with increasing distance to the forest fragments. It was also found that the
majority of moth species frequently moved between forest and agricultural habitats.
An examination of the butterfly fauna of a garden in Siera Leone suggests that the garden is richer in
species than near by secondary and primary forest. Gardens established in areas that were once forest, if
properly developed, can provide a refuge for both forest and Savanna butterflies. Evidently many species
are becoming adapted to garden habitats, and in some species new larval food preferences seem to be
evolving (Owen, 1971).
Another study conducted in the Brazilian Amazon indicate that tree plantations have the potential to
provide a conservation service in much of the humid tropics since they are rapidly increasing in extent and
present less of a structural contrast with native vegetation than many more intensive agricultural landuses.
They used hierarchical partitioning to examine the factors that influence the value of largescale
Eucalyptus plantations for tropical fruitfeeding butterflies (Lepidoptera: Nymphalidae). Focus was put
on evaluating the importance of landscape versus standlevel factors in determining the diversity and
composition of butterfly assemblages, and how butterflyenvironment relationships vary within and
20
between subfamilies of Nymphalidae.
Native understory vegetation richness had the strongest independent effect on the richness, abundance
and composition of all fruitfeeding butterflies, as well as a subset of species that had been recorded in
nearby primary forests. The results suggest that plantations can help conserve a limited number of forest
species, and serve to highlight the research that is necessary to understand better the relationship between
fruitfeeding butterflies and environmental variables that are amenable to management. (Araujo et al.,
2007)
2.9 Effect of forest vegetation structure on butterfly diversity
Butterflies can occupy both canopy and understory habitats. A longterm trapping study of butterflies in
the understory and canopy of Kibale Forest in Uganda, to describe temporal and vertical patterns of
biodiversity yielded 32,308 individuals of 94 species over three years. About 14% of these species could
be categorized as canopy specialists and 68% as understory specialists (Molleman et al.,2007).
In Mt. Marsabit forest in Kenya, (Nyamweya et al.,2010), the study shows there was a strong forest
habitat preference shown by high butterfly species richness and abundance during both the dry and wet
seasons. Most likely there were resources that were associated with the habitat and were responsible for
the extended butterfly residence time in the forest in both seasons. The mountain vegetation structure and
zonation could be responsible for the differences in detailed butterfly species composition as indicated by
the strong correlation between butterfly diversity and plant diversity. The vegetation structure especially in
the forest habitats (probably the extent of canopy cover) probably affected the distribution of butterflies
and their daily flight activities.
20
2.10 Butterflies as indicator species Conservation actions require a measure of biodiversity such as spcies richness, but its assessment is very
difficult, even for small areas and this leads to a growing interest in the search for surrogates (indicators) of
biodiversity (Araujo et al., 2001; Prendergast and Eversham, 1997). Biodiversity indicators can be based
on species richness of one or several taxonomic groups, with the assumption that the diversity of such
group is correlated to that of other groups (Maes and Van Dyck, 2005)
As a taxon, butterflies are diverse enough to permit the collection of statistically quantifiable data, whist
remaining with in the parameters acceptable for relatively complete assessment to be made. Butterflies are
conspicuous, taxonomically tractable and diurnal in habitat, all factors which greatly facilitate their study,
and contribute to their status as one of the few taxa of invertebrates for which relatively complete data
may be obtainable. They comprise of distinct communities which may be specific to geographical sub
regions and even to disparate ecological conditions.
The explicit environmental requirements of many species of butterflies means that they can have
considerable value as indicators of community of habitat health. They have been the focus of both amateur
and professional interest for centuries and thus more is known about their biology. They are ubiquitous
insects as likely to be encountered in an arid desert environment as a wet tropical forest, and therefore
fulfill many of the conventional criteria used in the selection of indicator groups (Kremen, 1992 and
Sparrow et al., 1994).
According to (Dennis et al., 2003), butterflies are insects that form communities including species with
20
different habitat preferences and dispersal capacities and therefore contrasted response to landscape
composition and configuration. Most butterfly species which need complementary resources like host
plants (for larveae), nector plants (for adults) and sites for resting. Many species use resources in different
vegetation types may be more active along the edge. This shows direct and strong relationships between
butterfly community structure and richness and habitat characteristics, vegetation composition and
landscape. The study done in the Victoria Mayaro reserve of SouthEast Trinidad shows that within a
region of forest, butterflies were found to be more characteristic of a disturbance level than of a particular
forest type, lending weight to the belief that butterfly can be used as bio indicators of forest disturbance
(Wood and Gillman 1998).
Butterflies are therefore a very convenient group to study the relationships between landscape structure
and species richness and explore the potentials for biodiversity indicators. In Budongo forest reserve, 254
species of butterflies have been recorded (Davenport 1993) from a variety of habitats and it is thus
feasible to evaluate the butterfly fauna of the region, as well deriving reasonably accurate comparisons of
data between habitats of varying anthropogenic influence.
20

CHAPTER THREE
STUDY AREA AND METHODS
3.1 Location Budongo Forest Reserve (BFR), where the data was obtained is found in the districts of Masindi, Hoima
and Bulisa. It covers a total area of 793km2 with 53% of the total area being forested and the remaining
47% comprising of grasslands. The reserve is situated between 310 221 310 461 E and 103712003
(Plumptre, 1996). The land use/cover classes identified around BFR, are forest/woodland, sugarcane
plantations, pine plantations and grassland/shiftingcultivation/settlements. Permanent settlements are found
in the southern edge and the land use consists of cultivation of maize and other cereal crops, plantation
forestry, sugarcane and tobacco growing. (Davenport et al., 1996).
3.2 Topography The topography of Budongo is undulating with gentle NNW slope to the edge of the rift escarpment. It is
drained by two rivers, Sonso and Waisoko. The forest is found at an average altitude of 1100m (minimum
20
of 700m and maximum of 1270m) above sea level. Approximately 0.2km2 of the reserve lies below
750m, 385km2 at 7501000m, 408km2 at 10001250m and 0.1km2 above 1250m above sea level
(Davenport et al., 1996).
3.3 Climate 3.3.1 Temperature The temperatures of Budongo are relatively uniform with a small variation in monthly means of the diurnal
range. The smallest range is experienced between July –September and greatest range in the dry season
between the months of January and February.
The minimum annual temperature range is 17200C and the maximum is 28290C. (Davenport et al.,
1996).
3.3.2 Rainfall The rainfall of Budongo is of climatic peak type with a pronounced dry season from mid December to mid
February. It receives the total annual precipitation of 1150mm1500mm. The greatest rains are in
MarchMay and September –November. (Davenport et al., 1996).
3.4 Data collection
3.4.1 Study sites The study was stratified with respect to five habitats, the forest interior, forest edge, pine plantation, fallow
land and crop land. A total of 20 separate sites were sampled, 4 sites from each habitat type. Each site
was atleast 50m from the other. One transect (600m long) was established on each site. Traps were set
along the transects at a distance of 30m from the transects. This was done to avoid interferences from the
20

transects. The locations of all the sites and transect were marked by the GPS.
20

Figure 1: Map of Budongo forest reserve showing the area where research was conducted 3.4.2 Sampling procedure Two methods were used at each site, namely; baited trapping and sweep netting. These methods are
recommended for butterfly studies for starters (Rogo and Adulaja 2001). All sites were sampled for 20
consecutive days.
For trapping method, four baited traps (30 cm diameter, 50 cm high) were erected atleast 1m from the
ground, at each site. Traps were baited with fermenting bananas, laid in the morning and checked twice a
day after every five hours when all the butterflies were removed, identified and counted. Baited trapping
was used to capture fast flying and high canopy butterflies that can not be easily captured by the hand held
sweep nets.
The second method was use of sweep netting where the observer walked along the transect to capture
butterflies flying along and close to transects using hand held sweep nets (Pollard et al., 1995).
Sweep nets were used to catch butterflies along the transects. One manhour each trap day was used as
sampling effort. Sampling would be done at any hour between 10:00am and 4:00pm. Sweep netting along
20
the transect was done to capture as many ground butterfly species as possible, both fruit feeding and
others which feed on fluids and urine. Butterflies were then removed from the nets, identified and
recorded. Butterflies that were seen, identified but not caught were also recorded. Specimens that were
not identified there and then were preserved and brought to Makerere University Department of Zoology
lab for further identification. Sweep net data and trap data were combined and used in the determination
of species abundance and richness (Fitzherbert et al., 2006).
3.5 Data analysis The butterflies observed in individual samples (sweep nets and baited traps) in each habitat/land use were
pooled. This generated a list of species and number of individuals for each species and each land use.
Each species was assigned to one of the six ecological types (Davenport, 1993)based on habitat
preferences cited in the literature and personal observations made in the field (Davenport, et al. 1996,
Carder, et al., 2004). The ecological types used were;
Forest dependent species (Fspecies) are those characteristic of closed canopy forest habitats.
Forest nondependent species (fspecies) are those which may be recorded in closed canopy but are not
dependent on it and are more often encountered in a variety of forest edge, degraded forests and
woodland habitats.
Non forest (open habitat) species (O species) include those characteristic of range of open savanna,
grass land and arid habitats.
Swamp/wetland species (Sspecies) which prefer swamp/wetland habitats.
20

Widespread species (Wspecies) which occur in a wide range of habitats
Migratory species (Mspecies) are those known to be migratory.
Unknown (Uspecies) are butterflies that are insufficiently known to be able to assign them to any
particular ecological type.
Shannon Weiner diversity indices with in each habitat were computed using Species Diversity and
Richness version 4.0 program [SDR v4.0 (Seaby and Henderson 2006)]. Shannon weiner diversity index
was used because it incorporates both species richness and abundance into a simple value. Butterfly
species richness for each land use was computed using the non parametric Jacknife richness estimator,
based on 1000 randomizations with replacement (Colwell and Coddington 1994). This extrapolation
method was preferred because it estimates total species richness, including species not present in any
sample. This was also done by SDR v4.0.
Butterfly species richness with in each of the five land use types was determined using species
accumulation curves using the program EstimateS version 8.0 Colwell 2006)
Analysis of similarity (ANOSIM) was used to determine whether the butterfly assemblages in the different
habitats formed distinct groups. Similarity percentages (SIMPER) were used to show the percentage
contributions of species to the average dissimilarity between the forests [CAP v3.0 (Seaby and
Henderson 2004)]. A BrayCurtis rank similarity matrix (Clarke 1993) was the basis of these tests. The
test statistic R scales between 0 and 1. An R = 1 indicates complete separation between groups and R =
0 indicates no separation among the groups. To display relative differences between sampled sites in their
butterfly assemblages, nonmetric multidimensional scaling (NMDS) (CAP v3.0) was used. NMDS, a
nonparametric ordination method attempts to make the Euclidean distance between samples on a scatter
20

plot proportional to their dissimilarity.
CHAPTER FOUR
RESULTS
During 28 days of sampling, a total of 1425 individual butterflies were caught using both sweep nets and
baited traps. These were collected from the 20 samples selected in all the five land use types and
comprised 109 species belonging to the five families of the order Lepidoptera (Appendix 1). Of these,
species in the family Nymphalidae were the most common (64%), followed by Pieridae (17%),
Lycaenidae (8%), and Papilionidae (6%), the least common family being Hesperiidae (5%) (Table 1).
Table 1: Observed abundance of butterfly species and family composition in and around Budongo Forest Reserve. Family Number of species Number of individuals (%)
abundance
Nymphalidae 70 916 64
Pieridae 18 276 19
20
Papilionidae 7 170 12
Lycaenidae 9 39 3
Hesperiidae 5 24 2
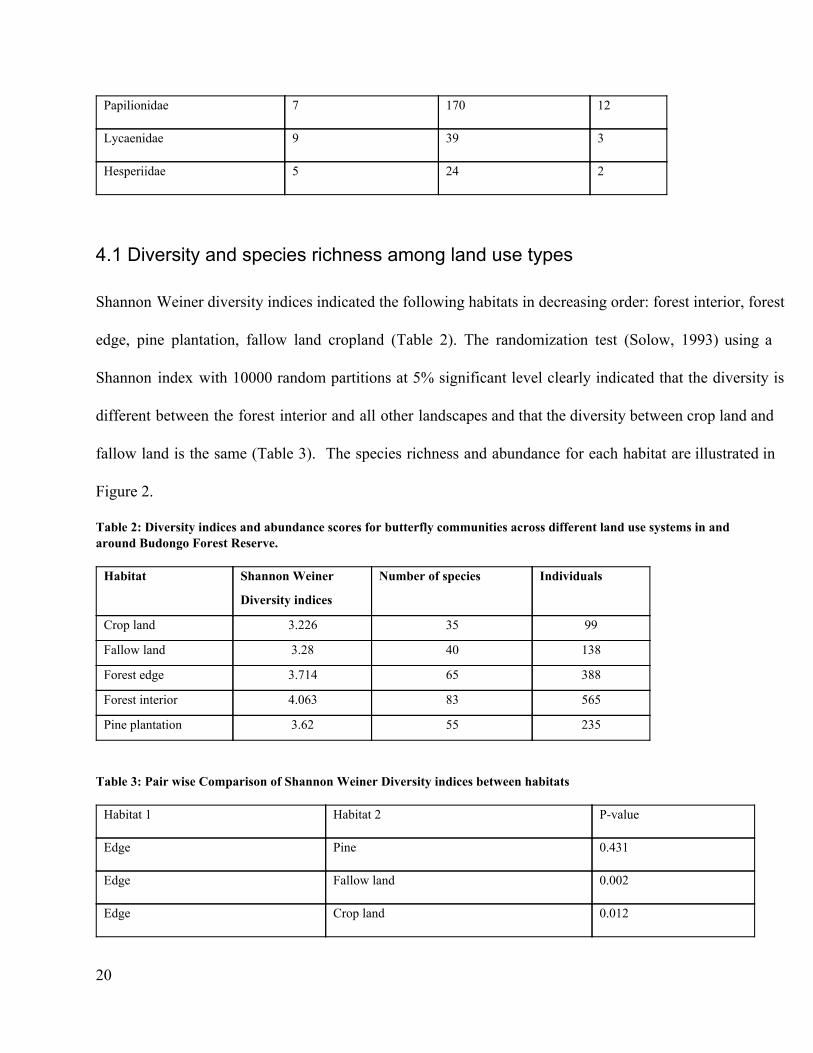
4.1 Diversity and species richness among land use types Shannon Weiner diversity indices indicated the following habitats in decreasing order: forest interior, forest
edge, pine plantation, fallow land cropland (Table 2). The randomization test (Solow, 1993) using a
Shannon index with 10000 random partitions at 5% significant level clearly indicated that the diversity is
different between the forest interior and all other landscapes and that the diversity between crop land and
fallow land is the same (Table 3). The species richness and abundance for each habitat are illustrated in
Figure 2.
Table 2: Diversity indices and abundance scores for butterfly communities across different land use systems in and around Budongo Forest Reserve. Habitat Shannon Weiner
Diversity indices
Number of species Individuals
Crop land 3.226 35 99
Fallow land 3.28 40 138
Forest edge 3.714 65 388
Forest interior 4.063 83 565
Pine plantation 3.62 55 235
Table 3: Pair wise Comparison of Shannon Weiner Diversity indices between habitats Habitat 1 Habitat 2 Pvalue
Edge Pine 0.431
Edge Fallow land 0.002
Edge Crop land 0.012
20
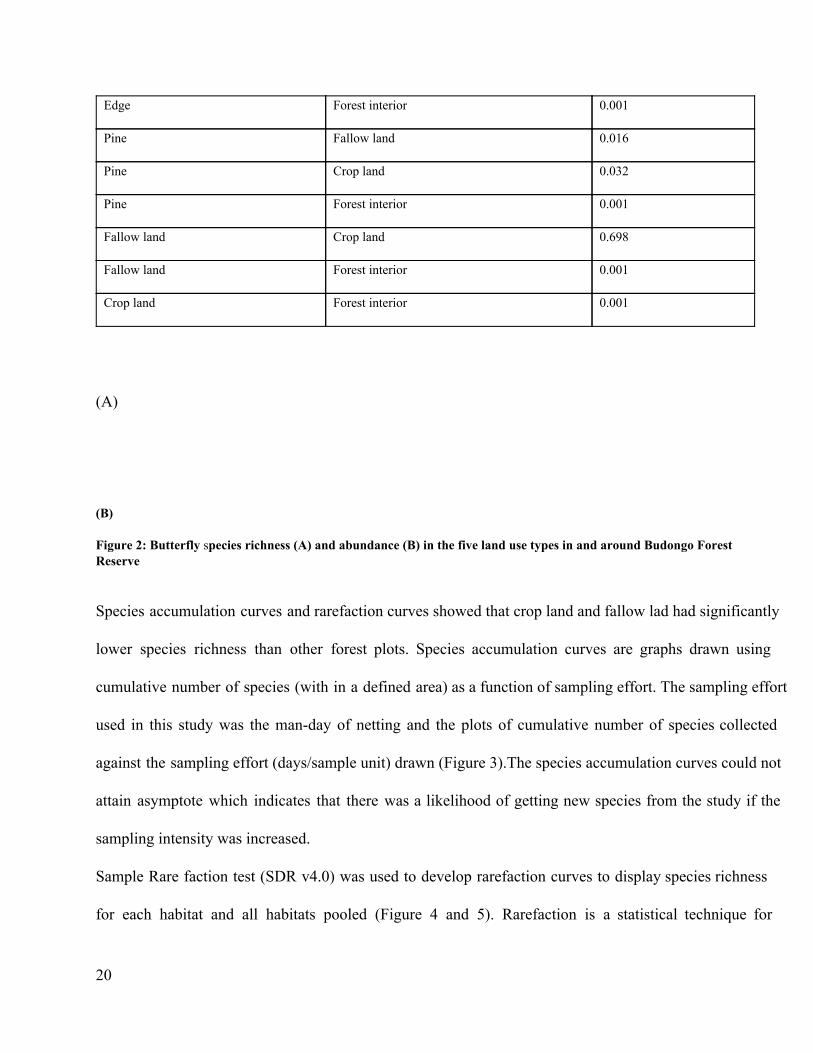
Edge Forest interior 0.001
Pine Fallow land 0.016
Pine Crop land 0.032
Pine Forest interior 0.001
Fallow land Crop land 0.698
Fallow land Forest interior 0.001
Crop land Forest interior 0.001
(A)
(B) Figure 2: Butterfly species richness (A) and abundance (B) in the five land use types in and around Budongo Forest Reserve
Species accumulation curves and rarefaction curves showed that crop land and fallow lad had significantly
lower species richness than other forest plots. Species accumulation curves are graphs drawn using
cumulative number of species (with in a defined area) as a function of sampling effort. The sampling effort
used in this study was the manday of netting and the plots of cumulative number of species collected
against the sampling effort (days/sample unit) drawn (Figure 3).The species accumulation curves could not
attain asymptote which indicates that there was a likelihood of getting new species from the study if the
sampling intensity was increased.
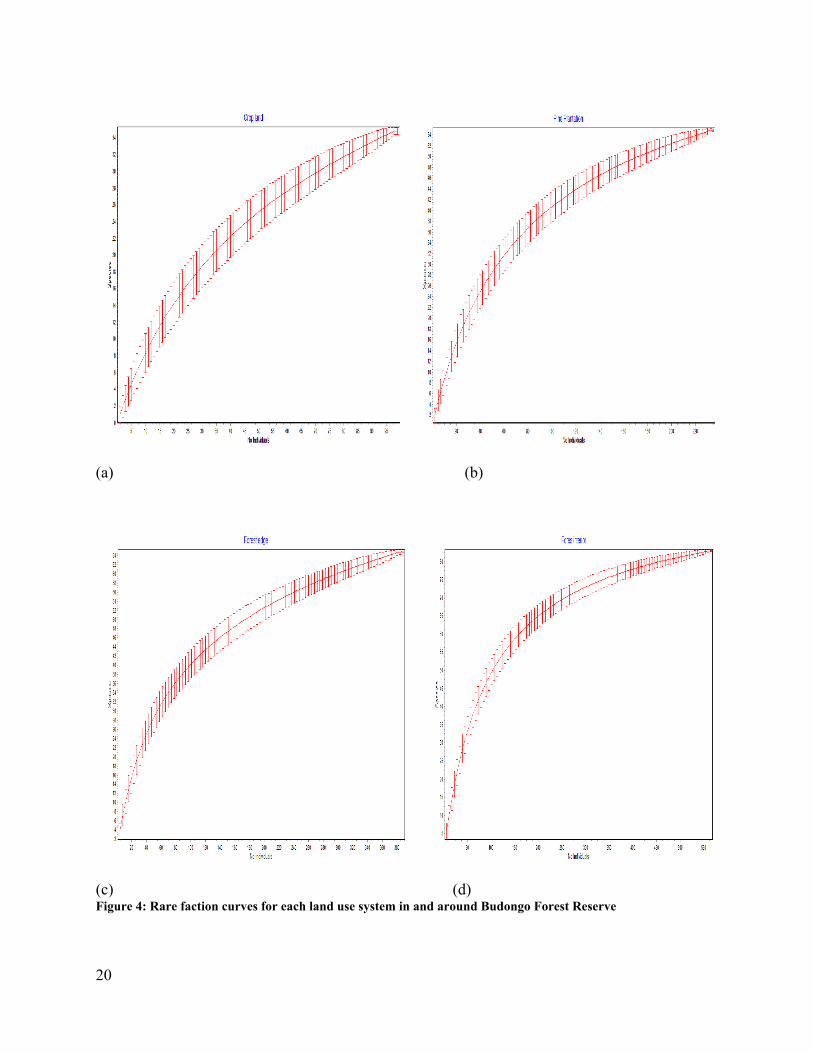
Sample Rare faction test (SDR v4.0) was used to develop rarefaction curves to display species richness
for each habitat and all habitats pooled (Figure 4 and 5). Rarefaction is a statistical technique for
20

estimating the number of species expected in a random sample of individuals taken from a collection
(Krebs 1989). It helps to standardize data from uneven sample sizes to common size.
(A) (B) Figure 3: Butterfly species accumulation curves for (A) individual land use types; (B) all samples pooled in and around Budongo Forest Reserve
20
(a) (b)
(c) (d) Figure 4: Rare faction curves for each land use system in and around Budongo Forest Reserve
20
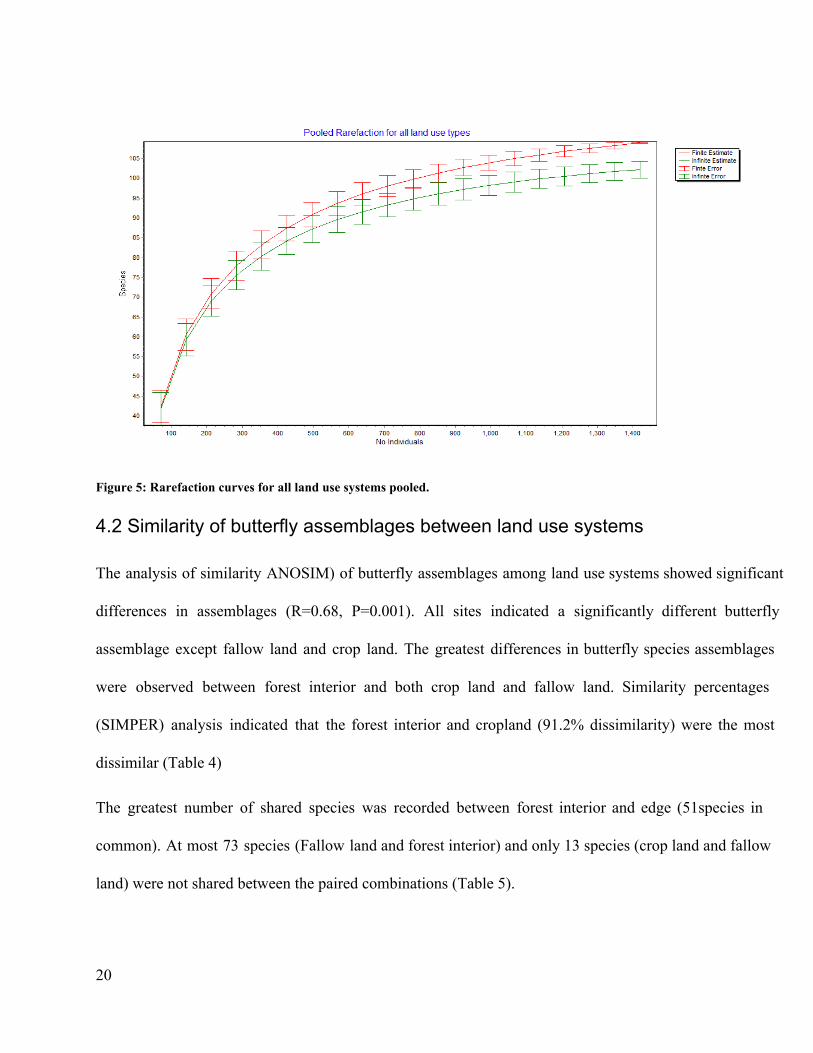
Figure 5: Rarefaction curves for all land use systems pooled.
4.2 Similarity of butterfly assemblages between land use systems The analysis of similarity ANOSIM) of butterfly assemblages among land use systems showed significant
differences in assemblages (R=0.68, P=0.001). All sites indicated a significantly different butterfly
assemblage except fallow land and crop land. The greatest differences in butterfly species assemblages
were observed between forest interior and both crop land and fallow land. Similarity percentages
(SIMPER) analysis indicated that the forest interior and cropland (91.2% dissimilarity) were the most
dissimilar (Table 4)
The greatest number of shared species was recorded between forest interior and edge (51species in
common). At most 73 species (Fallow land and forest interior) and only 13 species (crop land and fallow
land) were not shared between the paired combinations (Table 5).
20
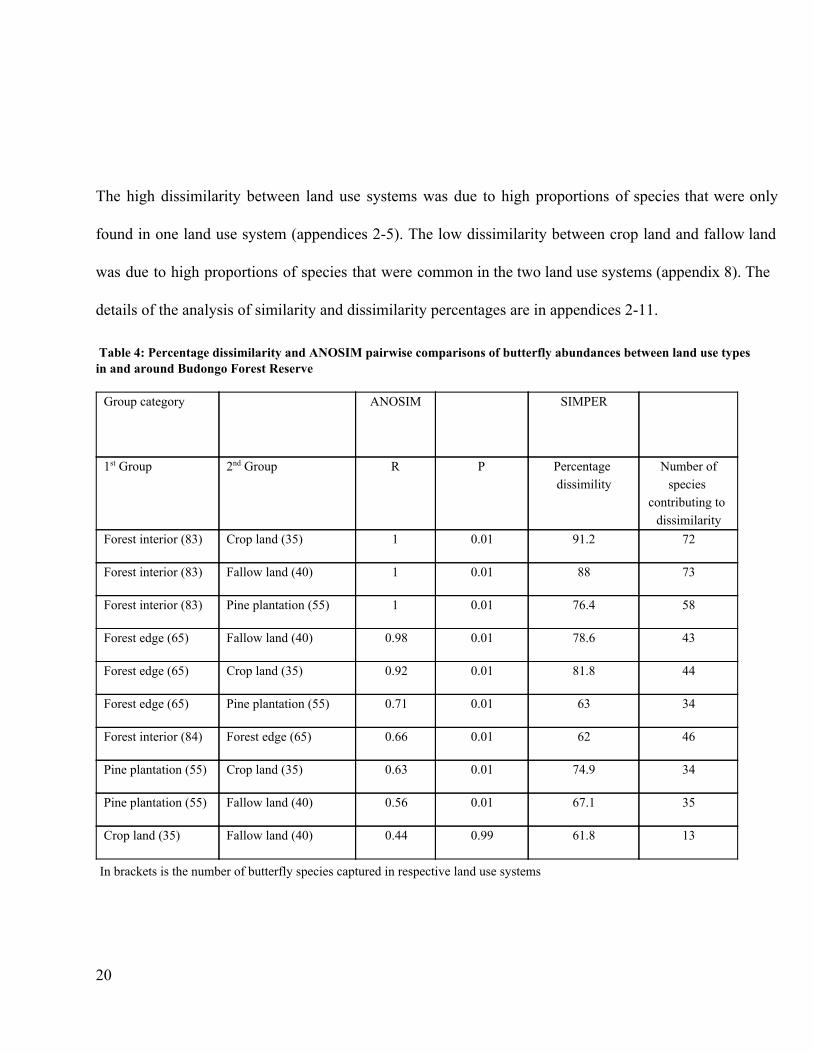
The high dissimilarity between land use systems was due to high proportions of species that were only
found in one land use system (appendices 25). The low dissimilarity between crop land and fallow land
was due to high proportions of species that were common in the two land use systems (appendix 8). The
details of the analysis of similarity and dissimilarity percentages are in appendices 211.
Table 4: Percentage dissimilarity and ANOSIM pairwise comparisons of butterfly abundances between land use types in and around Budongo Forest Reserve Group category
ANOSIM SIMPER
1st Group 2nd Group R P Percentage dissimility
Number of species
contributing to dissimilarity
Forest interior (83) Crop land (35) 1 0.01 91.2 72
Forest interior (83) Fallow land (40) 1 0.01 88 73
Forest interior (83) Pine plantation (55) 1 0.01 76.4 58
Forest edge (65) Fallow land (40) 0.98 0.01 78.6 43
Forest edge (65) Crop land (35) 0.92 0.01 81.8 44
Forest edge (65) Pine plantation (55) 0.71 0.01 63 34
Forest interior (84) Forest edge (65) 0.66 0.01 62 46
Pine plantation (55) Crop land (35) 0.63 0.01 74.9 34
Pine plantation (55) Fallow land (40) 0.56 0.01 67.1 35
Crop land (35) Fallow land (40) 0.44 0.99 61.8 13
In brackets is the number of butterfly species captured in respective land use systems
20

Table 5: Comparison of species between habitats in and around BFR Habitat
(A)
Habitat
(B)
No. of Species
In (A) only
No. of species
In (B)only
No. of species
In A and B
Forest edge Interior 14 32 51
Forest edge Pine plantation 22 12 43
Forest edge Fallow land 34 9 31
Forest edge Crop land 37 7 28
Forest interior Pine plantation 43 15 40
Forest interior Fallow land 58 15 25
Forest interior Crop land 60 12 23
Pine plantation Fallow land 25 10 30
Pine plantation Crop land 27 7 28
Fallow land Crop land 9 4 31
20
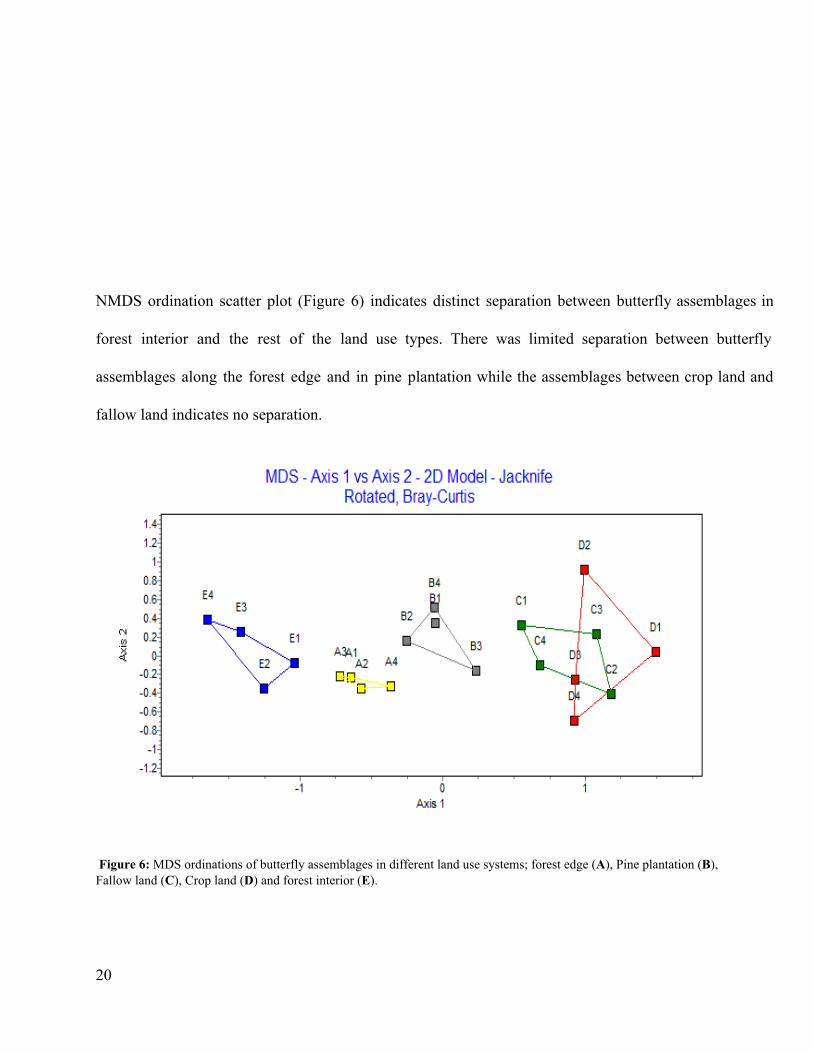
NMDS ordination scatter plot (Figure 6) indicates distinct separation between butterfly assemblages in
forest interior and the rest of the land use types. There was limited separation between butterfly
assemblages along the forest edge and in pine plantation while the assemblages between crop land and
fallow land indicates no separation.
Figure 6: MDS ordinations of butterfly assemblages in different land use systems; forest edge (A), Pine plantation (B), Fallow land (C), Crop land (D) and forest interior (E).
20
CHAPTER FIVE
DISCUSSION
The study showed a rich pool of butterfly species still existing in the forest interior. Forest habitats were
the richest and crop/fallow land the poorest in butterfly species. The higher number of butterfly species in
forest compared to other habitats studied suggests that the conversion of forest to other land use types
result in significant reduction in butterfly species. The forest species probably migrate to other favourable
habitats or utilize the remaining forest fragment or most likely are extinct. Other studies (e.g Nyamweya et
al., 2010 and Gudula et al., 2005) have supported the same view that forest dependent species become
extinct as the forest disappears with proceeding conversion to other land use types.
In the present study, the maximum number of species and individuals were observed in the forest interior
and forest edge habitats. This could be attributed to availability of diverse plants and access to host plants
hence promoting butterfly richness and diversity. Different plant species provide nectar and other food
resources to butterflies at different stages and in different seasons Gardner (et al., 1995). Successful
butterfly habitats must therefore include sufficient larval and adult food resources.
The complexity of the vegetation along vertical and horizontal dimensions of availability of food, good
breeding and climatic conditions possibly allows more butterfly species to cooccur in the forest interior.
Thirty nine percent (39%) of the butterfly species detected in the interior of the forest were not found at
20

the edge. Possibly these are the species most vulnerable to forest clearance (degradation).
This suggests that the abrupt transition of forest to other land use, coupled with a high exposure to wind
and solar radiation may result in temperature and humidity conditions not suitable for all butterfly species
survival.
Butterfly species found only in the forest interior include Acraea penelope, Catuna crithea, Athene
larydas, Akola fan, Leptosia nupta and Euriphene ribensis are categorized as forest dependant or
closed forest species according Davenport, et al., 1996 and Carder, et al., 2004.
The forest edge had the highest number of shared species with either of the land use systems implying that
it is the zone of transition from one habitat to the other. This suggests that forest edges are ecotones and
are therefore important for biodiversity conservation and tourism. Most species detected at the forest
edge were in ‘widespread and migrant’ ecological categories. Some forest specialists such as Charaxes
tiridates and Papilio mechowi were also recorded at the edge. The presence of both forest dependent
and open savanna species at the edge indicates that butterflies are not confined in one place but may visit
the nearby habitats.
Butterfly species detected in converted landscapes but absent in the forest accounted for 28%, 38% and
34% of the total species detected in Pine plantation, fallow land and crop land respectively. Species
contributing most to the dissimilarity include Eurema brigitta, Henotesia ankora, Hamanumida
daedalus, Junonia oenone,and Ypthima albida which are woodland/grass land species. This indicates
that human modified habitats have a conservation value in a sense that they can provide perfect habitats to
species non forest dependant species and in addition, they can still accommodate forest dependent
species. A case in point; 49% of butterfly species found in the forest interior were also found in Pine
20
plantation. It implies that although there is there is a significant difference between butterfly assemblages in
natural forest and pine plantation (P=0.014, R=1), pine plantation can help to conserve a limited number
of species. This is in line with the view that converted landscapes such as plantations should be included in
an effort to preserve and conserve biodiversity (Goehring et al., 2002, Araujo et al., 2007 and Owen
1971).
A good number of species categorized as forest dependant species (F) were found evenly distributed in
all the habitats. These included Nepheronia argia, Nepheronia pharis, papilio phorcas, Junonia
westernanni, and Neptis melicarta. Possibly these species frequently visited these habitats or might have
changed the richness and abundance patterns and adapted to live in human modified habitats. This may
also be explained in line with the fact that the diversity and biodiversity as whole at the local scale (eg the
habitat patch) depends primarily upon local habitat characteristics but also on communities across the
landscape (Ricklefs, 1987).
It is important to note that butterfly assemblages are also affected by seasonal changes and altitude in
addition to landscape/vegetation structure. In the current study, data collection was done in dry season
(during the month of July) and transects were laid in areas with relatively similar altitudes. Although the
butterfly abundance and richness may changes with season, the patterns of change the same for all the
habitats hence doe not strongly affect their comparisons in a given season. However, the observed low
diversity and abundance of butterflies in crop land could be attributed to the season. During the period of
data collection, it was harvesting period where crops had matured and there was hardly any flowers and
young crops that could have possibly attracted more butterflies in the fields. There was no significant
difference between crop land and fallow land habitats in all the tests. This is possibly because both
habitats had low vegetation density which could not favour the assemblage of different species. The
20

closeness of the two habitats could have also caused the coexistence of same species in either habitat.
I used two independent methods (sweep netting and baited trapping) simultaneously to assess butterfly
species diversity and abundance. Although fewer species were caught using baited traps than sweep nets
as expected, each method contributed to final species list because high flying species such as Charaxes
spp that could not be captured by sweep nets were attracted by the bait and trapped. However very few
species were captured by traps in crop land and fallow land habitats.
An important point to note here is that the use of single type of bait, such as fermenting bananas, to
determine butterfly availability may be inappropriate as it underestimates the overall food availability and
the preference of different species to different foods.
Although sampling was done for a relatively short period, some of the expected species were not
detected. For instance the Citrus Butterfly (Papilio demodocus), described as one of the Africa’s most
abundant and wide spread swallowtails was not found in any of the habitats throughout the sampling
period. Papilio demodocus is a frequent participant in mixed species migrations and is found in most
gardens feeding on flowers, and visits forest margins, cultivated and open areas often feeding from damp
patches along roads and paths (Carder, et al., 2004). Possibly this species could be locally extinct in
BFR and surrounding landscapes of could be extremely rare. This brings a serious concern to
conservation of this impressive species. On another note, a number of species that were not captured in
BFR during biodiversity inventories (Davenport et al., 1996) where captured during sampling. These
include Mylothris hilara, Belenois theora, Tirumala petiverana, Neptidopis ophione, Hypolimnas
misippus, Euphaedra harpalyce, Charaxes etheocles, Charaxes boueti and Acraea aganice. This
implies that new species have come in while others could have disappeared. Other studies such as
Schelhas & Greenberg, 1996, Laurance & Bierregaard, 1997 noted that when ecosystems are disturbed,
20

complex patterns emerge among new vegetation and the remnants with profound effects on biodiversity
which in turn changes species richness and abundance patterns, disrupts the patterns of endemism and
modifies ecosystem structural properties. However, the occurrence of new species is not exclusively as a
result of disturbance. Probably these species were locally unavailable in the area and eventually migrated
to and colonized the habitat.
20
CHAPTER SIX
CONCLUSION AND RECOMMENDATIONS
6.1 Conclusion
In conclusion, the results indicate that natural forests are rich in butterfly diversity and biodiversity
as whole compared to human modified habitats.
Forest edges are ecotones and are important for biodiversity conservation and tourism.
There is a significant change in butterfly assemblages as you move from the forest edge to the
outside landscapes. The vegetation structure has a strong influence on butterfly assemblages.
Therefore conversion of forests to other land use types result in significant decrements of butterfly
species.
Forest species may be seen outside the forest but they are still dependent on forests.
Human modified habitats such as plantation forests, if managed well have limited capacity to
conserve biodiversity. New species have colonized BFR and others could have disappeared.
6.2 Recommendations
These research findings are preliminary and require further verification.
An extensive inventory should be done to determine which species currently occupy Budongo
Forest and its surrounding landscapes to update the biodiversity inventory databases.
Further studies should also put in consideration the seasonal changes and the distance from the
forest to verify where forest dependent species found in outside landscapes have actually adapted
the habitat or are frequent visitors.
20
Rare species such as Papilio demodocus shuld be of particular concern to conservation because
of the likelihood that it could be locally distinct or threatened in the area.
REFERENCES
Akite, P. (2008) Effects of anthropogenic disturbances on the diversity and composition of the butterfly
fauna of sites in the Sango Bay and Iriiri areas, Uganda: implications for conservation; African Journal of
20
ecology. 46(1), 113.
Araujo, I. S., Overal, W. L. Gardner, T.A, Fernanda, M. Peres C.A, (2007) Diversity and composition
of fruitfeeding butterflies in tropical Eucalyptus plantations; Biological conservation. 17, 10871104.
Burgess, N.D., Clarke, G.P. & Rodgers, W.A, (1998) Coastal forests of east Africa: Status, and
endemism patterns and their potential causes; Biological Journal of Linnean Society London. 64,
337–367
Carder, N. Tindimubona, L., Twesigye, C. K. (2004). Butterflies of Uganda, second edition, The Uganda
society, Kampala.
Clarke, K. R., (1993) Non parametric multivariate analyses of changes in community structure; Journal of
Ecology 18, 117143
Colwell, R. K., (2006) EstimateS: Statistical estimation of species richness and shared species from
samples. Version 8.0.
Davenport, T. (1993). The butterflies of Uganda. An Annotated Checklist. Forest Department, Kampala
Uganda.
Davenport, T. Howard, P. Mathews, R., (1996) Budongo Forest Reserve; Biodiversity report; Budongo
forest reserve, Series Number 3; Forest department Kampala Uganda.
Dennis, R. L. H., Shreeve, T. G., Van Dyck, H., (2003) Towards a functional resource based concept
for habitat: a butterfly biology view point. Oikos, 417426
Fitzherbert, E. Gardener, T. Davenport, T. R.B. Caro, T, (2006) Butterfly species richness and
abundance in the Katavi ecosystem of western Tanzania; African journal of ecology. 44(3), 353362
Goehring, D.Daily, G.C. Sekercioglu, C. H, (2002) Distribution of grounddwelling arthropods in tropical
countryside habitats, Journal of Insect Conservation. 6, 8391
20
Gundula, S. Konrad, M. and Sauerborn, J. (2005) Abunance of selected insect species in natural and
agricultural habitats of a tropical upland (Leyte, Philippines); Agriculture, Ecosystems and Environment
111(4) 104110.
Howard, P. C., Davenport, T.R.B. and Kigenyi, F. W. (2000). Protected Area planning in the tropics|
Uganda,s ntional system of forest nature reserves, Journal of conservation Biology 14(3) 119.
Howard, P. C., Viskanic, P. and Davenport, T. R. B (1998). Complentality and the use of indicator
groups for reserve selection in Uganda, Nature 394 472475.
Hurlbert, S. H. (1971) The nonconcept of species diversity: a critique and alternative parameters.
Ecology 52, 57786.
Larsen, T. B., (1991), The butteflies of Kenya and their natural history, Oxford University press.
Maredn, H. J. and Chai, P., (1991), aerial Predation and Butterflies Design. How palatability, Mimicry
and the Need for evasive flight constrain mass allocation. The American Naturalist. 138(1), 1536
Molleman, F. Arjan, K. Brakefield, P. M. Devries, P. J. and Zwaan, B. J., (2007) Vertical and Temporal
Patterns of Biodiversity of FruitFeeding Butterflies in a Tropical Forest in Uganda; Biodiversity and
Conservation. 15, 107121
Mwavu, E. N. Witkowski, E. T. F, (2008) Landuse and cover changes (19882002) around Budongo
forest reserve, NW Uganda: implications for forest and woodland sustainability. Land degradation and
development; 19(6), 606622
Nyamweya, N. Humpden. G. Gichuki, N., (2010) Effects of plant structure on butterfly diversity in Mt.
Marsabit forest Northern Kenya; African Journal of Ecology. 999(999)
Owen, D. F., (1971) Species diversity in butterflies in a tropical garden; Journal of Biological
conservation. 3(3), 191198)
20
Patil, G. P. & Taillie, C. (1979) An overview of diversity. In Ecological Diversity in Theory and
Practice (ed. J. F. Grassle, G. P. Patil, W. Smith & C. Taillie), pp. 327. Fairland, MD: International
Cooperative Publishing House.
Plumptre, A. J., (1996) Changes following 60 years of selective timber in Budongo forest reserve,
Uganda; Forest Ecology and Management. 89: 101113
Pollard, E. Moss, D. and Yates, T. J., (1995) Population trends of common British butterflies at
monitored sites. Journal Applied Ecology. 32, 916.
Ricketts, T.H. Daily, G. Ehrlich, P. R., and Fay, P. J., (2001) Countryside biogeography of moths in a
fragmented landscape: biodiversity in native and agricultural habitats; Journal of Conservation Biology.
15, 378–388
Ricklefs, R. E., (1987) Community diversity: relative roles of local and regional processes. Science 235,
167171.
Rogo, L. and Adulaja, A, A., (2001) Butterfly populations in two forest fragments at the Kenya coast;
African Journal of Ecology. 39, 266–275
Royson, A., (1998), Life cycle of a butterfly. Heinemann Library page 32.
Sbordoni, V. and Foretiero, S., (1985), Butterflies of the world, Times Books, Michigan
Seaby, R. M. H. and Henderson, P. A., (2004) Community Analysis Package. 3.0. Pisces Conservation
Ltd
Seaby, R. M. H. and Henderson, P. A., (2006) Species Diversity and Richness 4.0. Pisces Conservation
Ltd
Tothmeresz, B. (1995) Comparison of different methods for diversity ordering. Journal of Vegetation
Science 6, 283290.
20
Wood, B. Gillman M. P., (1998) The effects of disturbance on forest butterflies using two methods of
sampling in Trinidad; Biodiversity and conservation. 7(5), 597616
APPENDICES
Appendix 1: Individual butterflies observed in BFR and the surrounding human modified habitats
Family Species Ecol. Type
Forest edge
Pine plantation
Fallow Land
Crop land
Forest interior
Hesperiidae Ankola fan F 0 0 0 0 9 Calaenorhinus glenus F 0 0 0 0 2 Pardaleodes incerta F 1 0 0 0 1 H1 U 0 0 1 1 3 H2 U 0 0 0 0 6 Lycaenidae Abisara neavei F 0 0 0 0 2 Anthene larydas F 0 0 0 0 11 Cupidopsis cissus W 0 0 1 0 0 Euliphyra leucyanea U 0 0 0 0 1
20

Hypolycaena hatita F 0 0 0 0 2 Uranothauma falkensteini W 0 0 0 2 0 Zizeeria knysna U 0 1 0 0 0 L1 U 0 0 3 1 12 L2 U 0 1 0 0 2 Nymphalidae Acraea acerata W 0 2 0 0 2 Acraea aganice F 1 0 0 0 7 Acraea caldarena U 0 2 0 0 0 Acraea esberia F 0 3 0 0 0 Acraea jodutta F 0 0 0 0 3 Acraea penelope F 0 0 0 0 35 Acraea servona F 0 0 0 0 1 Amauris niavius W 5 1 3 3 0 Amauris tartarea F 4 0 0 1 0 Ariadne albifascia F 2 0 0 0 4 Aterica galena F 0 0 0 0 1 Bebearia absolon F 0 0 0 0 1 Bebearia sophus F 1 0 0 0 7 Bicyclus anynana O 1 4 0 0 12 Bicyclus safiza W 19 22 8 3 21 Bicyclus sancaos U 0 2 0 0 1 Catuna crithea F 2 3 0 0 26 Charaxes Amelia F 22 2 0 0 6 Charaxes bipunctatus F 15 4 0 0 7 Charaxes boueti F 1 0 0 0 3 Charaxes brutus F 24 3 3 4 8 Charaxes candiope W 14 1 0 0 16 Charaxes chastor castor W 11 0 0 0 19 Charaxes Cynthia F 1 0 0 0 5 Charaxes etheocles F 2 0 0 0 12 Charaxes eupale F 12 0 2 0 12 Charaxes numenes U 6 0 0 0 7 Charaxes tiridates F 4 1 0 0 16 Charaxes zingha U 1 0 0 0 2 Cymothoe caenis F 0 1 0 0 4 Cymothoe herminia F 1 0 0 0 7 Cymothoe jodutta F 1 0 0 0 0 Danaus chrysippus f. alcippus M 6 3 1 1 0 Danaus chrysippus f. chrysippus M 8 4 0 1 1 Euphaedra harpalyce F 1 0 0 0 8 Euphaedra preussi F 0 0 0 0 4 Euphaedra ruspina F 0 1 0 0 2 Euriphene ribensis F 0 0 0 0 6
20
Eurytera hiarbas U 2 0 0 0 0 Gnophodes bestimena F 0 0 0 0 5 Gnophodes chelys F 0 0 0 0 4 Gnophodes parmeno U 3 3 0 0 3 Hamanumida daedalus W 1 9 16 9 0 Harma thoebene F 0 0 0 0 1 Henotesia ankora O 1 1 9 7 0 Henotesia perspicua W 5 9 10 4 10 Hypolimnas misippus W 0 0 2 1 0 Hypolimnas salmacis F 0 0 0 0 5 Junonia chorimene O 0 0 1 2 0 Junonia oenone W 2 9 11 1 2 Junonia stygia F 0 1 2 1 1 Junonia westernanni F 3 7 1 1 7 Neptidopsis ophione F 3 17 3 1 3 Neptis Agatha U 1 2 2 5 1 Neptis melicarta F 14 8 3 3 15 Neptis saclava W 12 9 1 1 2 Palla ussheri F 0 1 1 0 0 Precis Octavia W 8 16 4 1 4 Pseudargynnis hegemone U 0 1 0 0 0 Pseudoneptis bugandensis M 1 3 0 0 0 Salamis parhassus F 1 3 2 1 6 Salamis temora F 0 0 0 0 3 Tirumala petiverana M 8 3 1 0 4 Ypthima albida U 8 8 3 5 1 N1 U 0 0 1 0 0 N2 U 0 0 1 2 0 N3 U 2 0 1 0 0 N4 U 6 0 5 0 0 N5 U 0 0 0 0 2 N6 U 0 0 0 0 1 Papilionidae Papilio bromius F 13 6 1 0 10 Papilio cynorta F 2 0 0 0 5 Papilio dardanus W 20 8 3 3 15 Papilio lormieri F 2 0 0 0 15 Papilio mechowi F 6 1 0 0 7 Papilio nireus F 3 2 2 1 0 Papilio phorcus F 22 5 0 1 17 Pieridae Appias epaphia M 1 2 0 0 2 Belenois solilucis O 3 3 0 0 0 Belenois theora F 15 1 1 2 14 Belenois creona M 2 5 0 0 2
20
Dixeia Astarte U 0 1 0 0 0 Eronia cleodora O 3 1 3 1 0 Eurema Brenda U 4 4 2 6 6 Eurema brigitta M 3 4 14 13 0 Eurema eleus U 1 0 0 0 4 Eurema hapale S 0 0 0 0 3 Eurema hecabe M 12 5 3 3 5 Leptosia nupta F 0 0 0 0 8 Leptosia wigginsi F 1 0 0 0 13 Mylothris hilara F 0 0 0 0 1 Nepheronia argia F 14 3 3 3 14 Nepheronia pharis F 1 1 0 0 6 Nepheronia thalassina F 8 8 3 4 12 Mycalensis ansorgei U 5 4 1 0 9
Appendix 2: Results of SIMPER analysis of abundance of discriminating butterfly species contributing up to 50% of total dissimilarity between Crop land and Forest interior (ANOSIM; R= 1, P=0.01, Average contribution of discriminating species = 91.2%)
Name
Average Abundance
in crop land
Average Abundance
in forest interior
% Contribution of
discriminating species
Acraea Penelope 0 8.75 5.4
Catuna crithea 0 6.5 4.6
Charaxes chastor castor 0 4.75 3.1
Bicyclus safiza 0.75 5.25 3.1
Charaxes candiope 0 4 2.6
Charaxes tiridates 0 4 2.6
Papilio phorcus 0.25 4.25 2.5
20
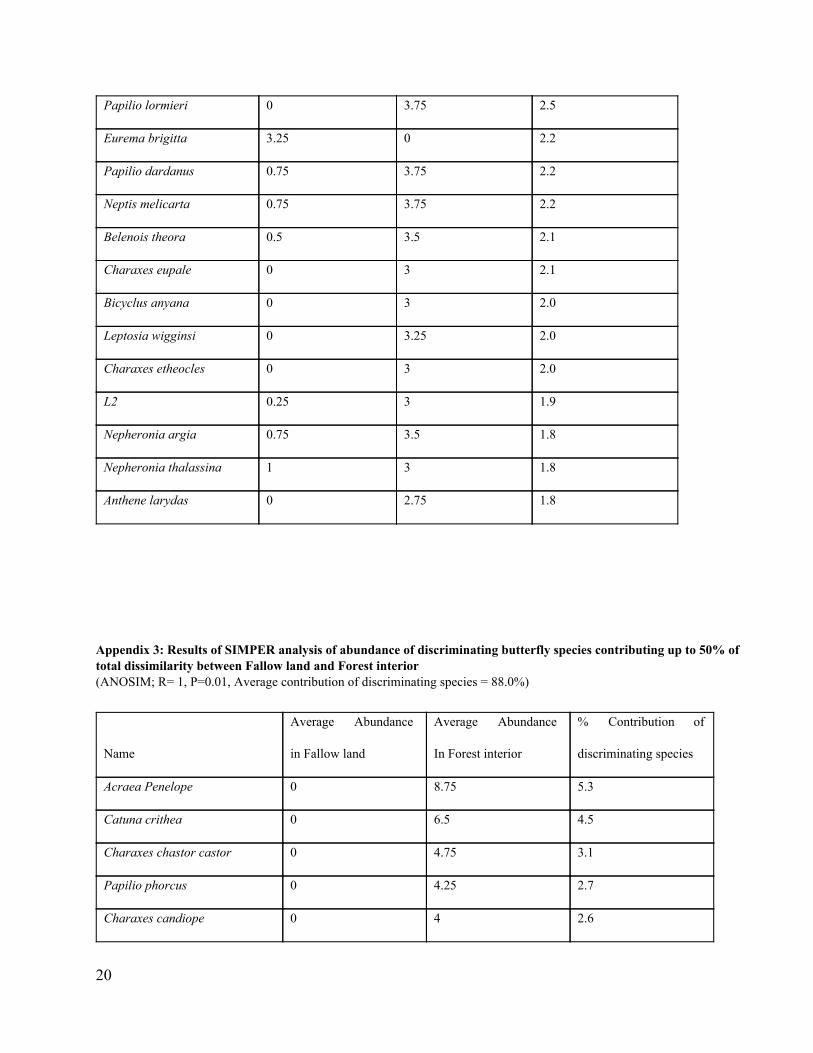
Papilio lormieri 0 3.75 2.5
Eurema brigitta 3.25 0 2.2
Papilio dardanus 0.75 3.75 2.2
Neptis melicarta 0.75 3.75 2.2
Belenois theora 0.5 3.5 2.1
Charaxes eupale 0 3 2.1
Bicyclus anyana 0 3 2.0
Leptosia wigginsi 0 3.25 2.0
Charaxes etheocles 0 3 2.0
L2 0.25 3 1.9
Nepheronia argia 0.75 3.5 1.8
Nepheronia thalassina 1 3 1.8
Anthene larydas 0 2.75 1.8
Appendix 3: Results of SIMPER analysis of abundance of discriminating butterfly species contributing up to 50% of total dissimilarity between Fallow land and Forest interior (ANOSIM; R= 1, P=0.01, Average contribution of discriminating species = 88.0%)
Name
Average Abundance
in Fallow land
Average Abundance
In Forest interior
% Contribution of
discriminating species
Acraea Penelope 0 8.75 5.3
Catuna crithea 0 6.5 4.5
Charaxes chastor castor 0 4.75 3.1
Papilio phorcus 0 4.25 2.7
Charaxes candiope 0 4 2.6
20
Charaxes tiridates 0 4 2.6
Hamanumida daedalus 4 0 2.6
Papilio lormieri 0 3.75 2.5
Bicyclus safiza 2 5.25 2.5
Eurema brigitta 3.5 0 2.3
Belenois theora 0.25 3.5 2.1
Papilio dardanus 0.75 3.75 2.1
Neptis melicarta 0.75 3.75 2.1
Bicyclus anyana 0 3 2.0
Leptosia wigginsi 0 3.25 2.0
Charaxes etheocles 0 3 1.9
Nepheronia argia 0.75 3.5 1.8
Anthene larydas 0 2.75 1.7
Charaxes eupale 0.5 3 1.7
L2 0.75 3 1.7
Nepheronia thalassina 0.75 3 1.7
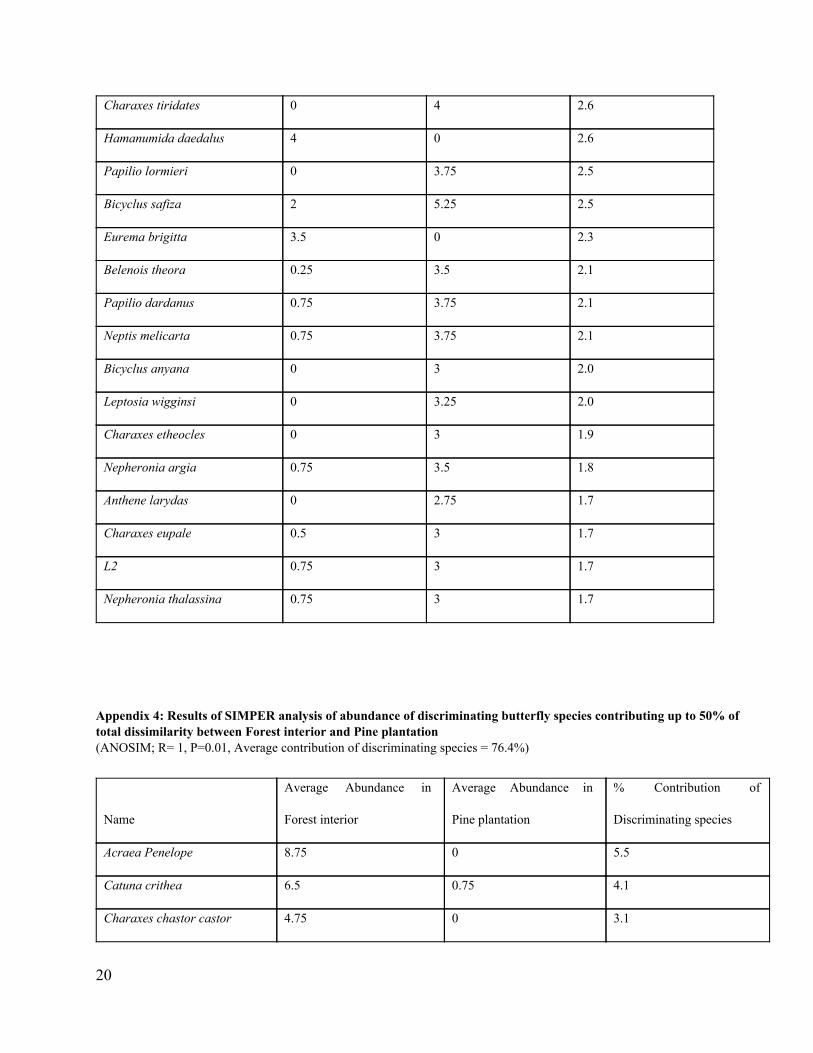
Appendix 4: Results of SIMPER analysis of abundance of discriminating butterfly species contributing up to 50% of total dissimilarity between Forest interior and Pine plantation (ANOSIM; R= 1, P=0.01, Average contribution of discriminating species = 76.4%)
Name
Average Abundance in
Forest interior
Average Abundance in
Pine plantation
% Contribution of
Discriminating species
Acraea Penelope 8.75 0 5.5
Catuna crithea 6.5 0.75 4.1
Charaxes chastor castor 4.75 0 3.1
20
Papilio lormieri 3.75 0 2.5
Charaxes candiope 4 0.25 2.4
Charaxes tiridates 4 0.25 2.4
Precis terea 1 4 2.4
Neptidopsis ophione 0.75 4.25 2.3
Belenois theora 3.5 0.25 2.1
Papilio phorcus 4.25 1.25 2.1
Leptosia wigginsi 3.25 0 2.0
Charaxes eupale 3 0 2.0
Bicyclus anyana 3 1 2.0
L2 3 0 2.0
Charaxes etheocles 3 0 2.0
Papilio dardanus 3.75 2 1.9
Neptis melicarta 3.75 2 1.9
Nepheronia argia 3.5 0.75 1.8
Anthene larydas 2.75 0 1.8
Bicyclus safiza 5.25 5.5 1.6
Nepheronia thalassina 3 2 1.5
Hamanumida daedalus 0 2.25 1.5
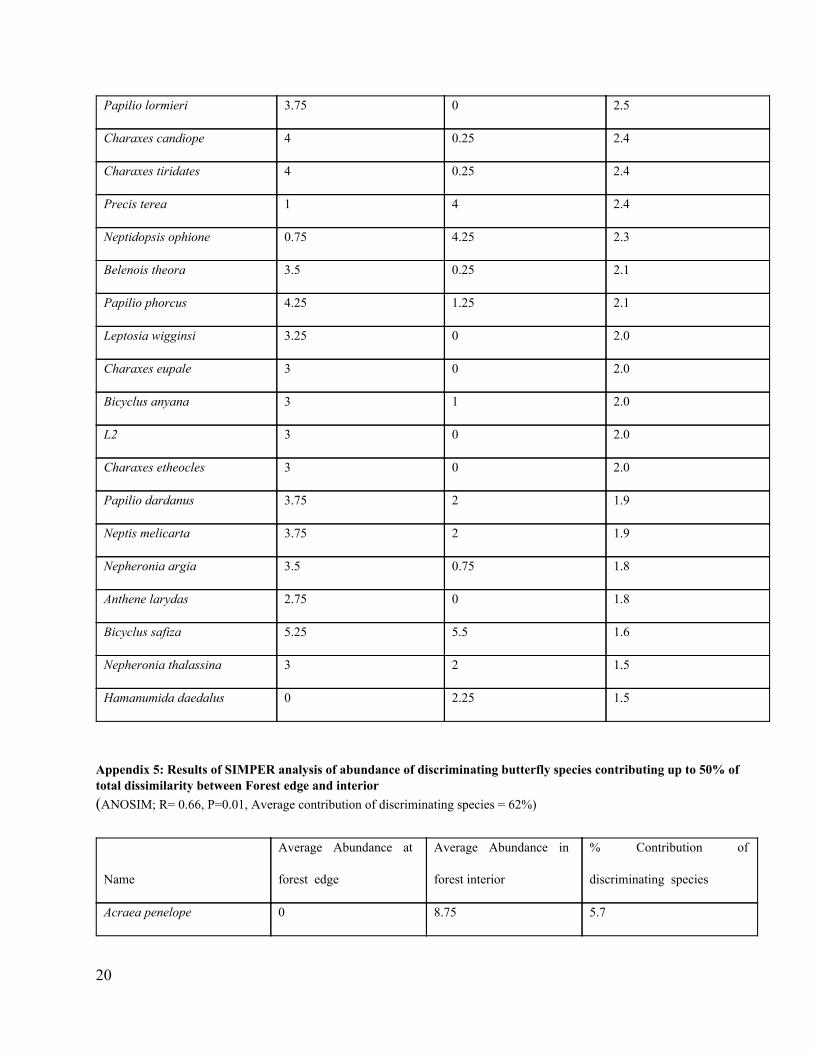
Appendix 5: Results of SIMPER analysis of abundance of discriminating butterfly species contributing up to 50% of total dissimilarity between Forest edge and interior (ANOSIM; R= 0.66, P=0.01, Average contribution of discriminating species = 62%)
Name
Average Abundance at
forest edge
Average Abundance in
forest interior
% Contribution of
discriminating species
Acraea penelope 0 8.75 5.7
20
Catuna crithea 0.5 6.5 4.3
Charaxes brutus 6 2 2.9
Charaxes Amelia 5.5 1.5 2.7
Bicyclus safiza 4.75 5.25 2.2
Papilio phorcus 5.5 4.25 2.2
Papilio lormieri 0.5 3.75 2.2
Papilio dardanus 5 3.75 2.2
Charaxes bipunctatus 3.75 1.75 2.2
Neptis melicarta 3.5 3.75 2.1
Leptosia wigginsi 0.25 3.25 2.1
Bicyclus anyana 0.25 3 2.1
L2 0 3 2.0
Charaxes tiridates 1 4 2.0
Belenois theora 3.75 3.5 2.0
Eurema hecabe 3 1.25 1.8
Anthene larydas 0 2.75 1.8
Neptis saclava 3 0.5 1.7
Nepheronia thalassina 2 3 1.7
Charaxes etheocles 0.5 3 1.7
Ankola fan 0 2.25 1.5
Euphaedra harpalyce 0.25 2 1.5
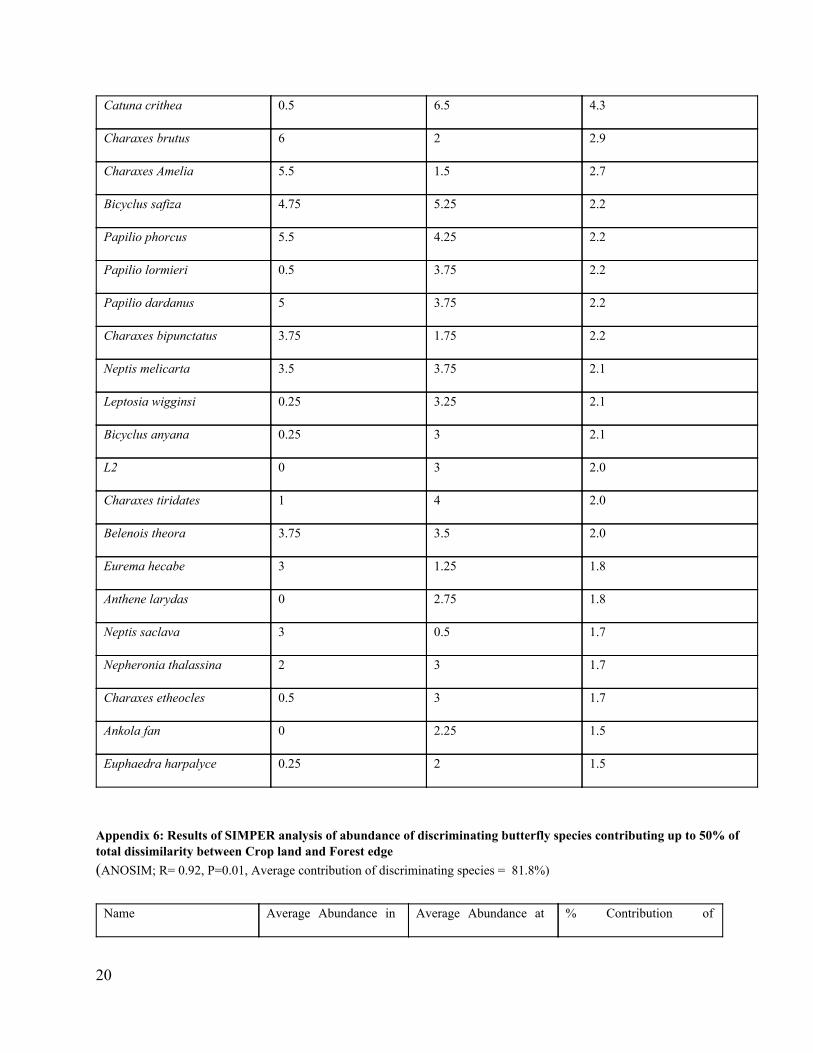
Appendix 6: Results of SIMPER analysis of abundance of discriminating butterfly species contributing up to 50% of total dissimilarity between Crop land and Forest edge (ANOSIM; R= 0.92, P=0.01, Average contribution of discriminating species = 81.8%)
Name Average Abundance in Average Abundance at % Contribution of
20
crop land forest edge discriminating species
Charaxes Amelia 0 5.5 5.5
Papilio phorcus 0.25 5.5 5.1
Charaxes brutus 1 6 5.1
Papilio dardanus 0.75 5 4.2
Charaxes bipunctatus 0 3.75 3.8
Bicyclus safiza 0.75 4.75 3.8
Charaxes candiope 0 3.5 3.6
Papilio bromius 0 3.25 3.2
Belenois theora 0.5 3.75 3.2
Charaxes eupale 0 3 3.1
Charaxes chastor castor 0 2.75 2.8
Neptis saclava 0.25 3 2.8
Nepheronia argia 0.75 3.5 2.8
Neptis melicarta 0.75 3.5 2.7
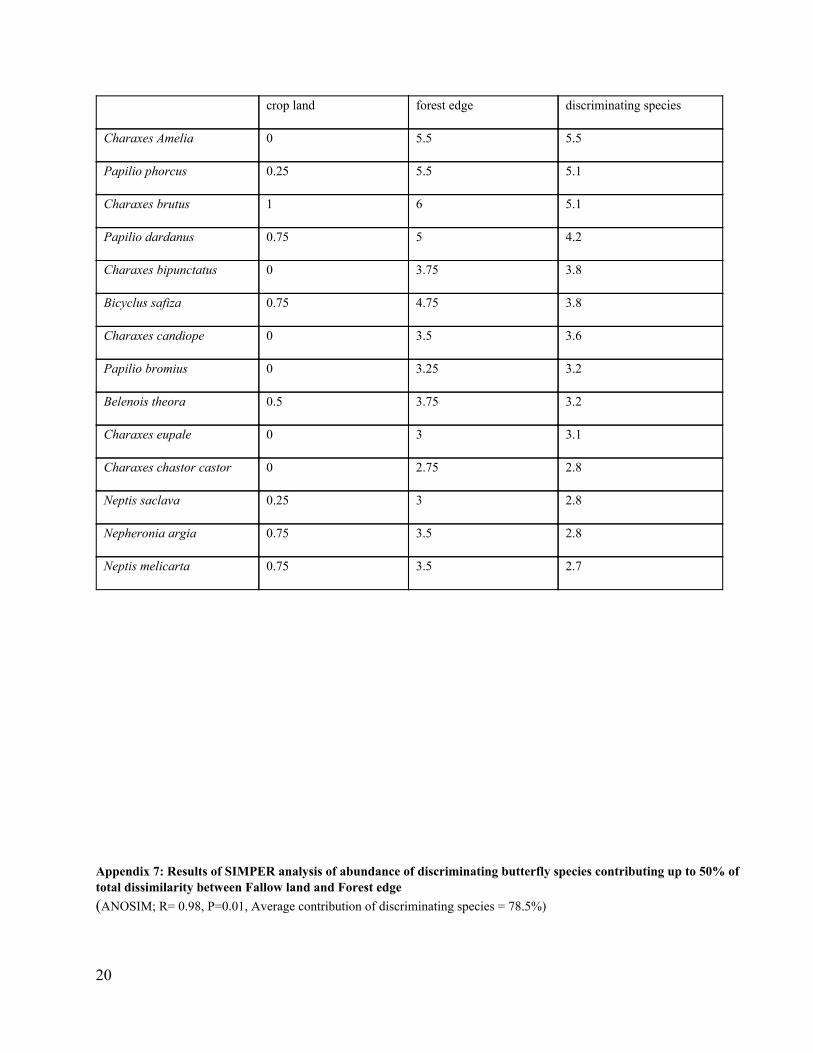
Appendix 7: Results of SIMPER analysis of abundance of discriminating butterfly species contributing up to 50% of total dissimilarity between Fallow land and Forest edge (ANOSIM; R= 0.98, P=0.01, Average contribution of discriminating species = 78.5%)
20
Name
Average Abundance in
Fallow land
Average Abundance at
forest edge
% Contribution of
discriminating species
Charaxes Amelia 0 5.5 5.4
Papilio phorcus 0 5.5 5.2
Charaxes brutus 0.75 6 5.1
Papilio dardanus 0.75 5 4.1
Charaxes bipunctatus 0 3.75 3.7
Hamanumida daedalus 4 0.25 3.6
Charaxes candiope 0 3.5 3.5
Belenois theora 0.25 3.75 3.2
Bicyclus safiza 2 4.75 3.1
Papilio bromius 0.25 3.25 2.9
Charaxes chastor castor 0 2.75 2.7
Neptis saclava 0.25 3 2.7
Eurema brigitta 3.5 0.75 2.7
Neptis melicarta 0.75 3.5 2.7
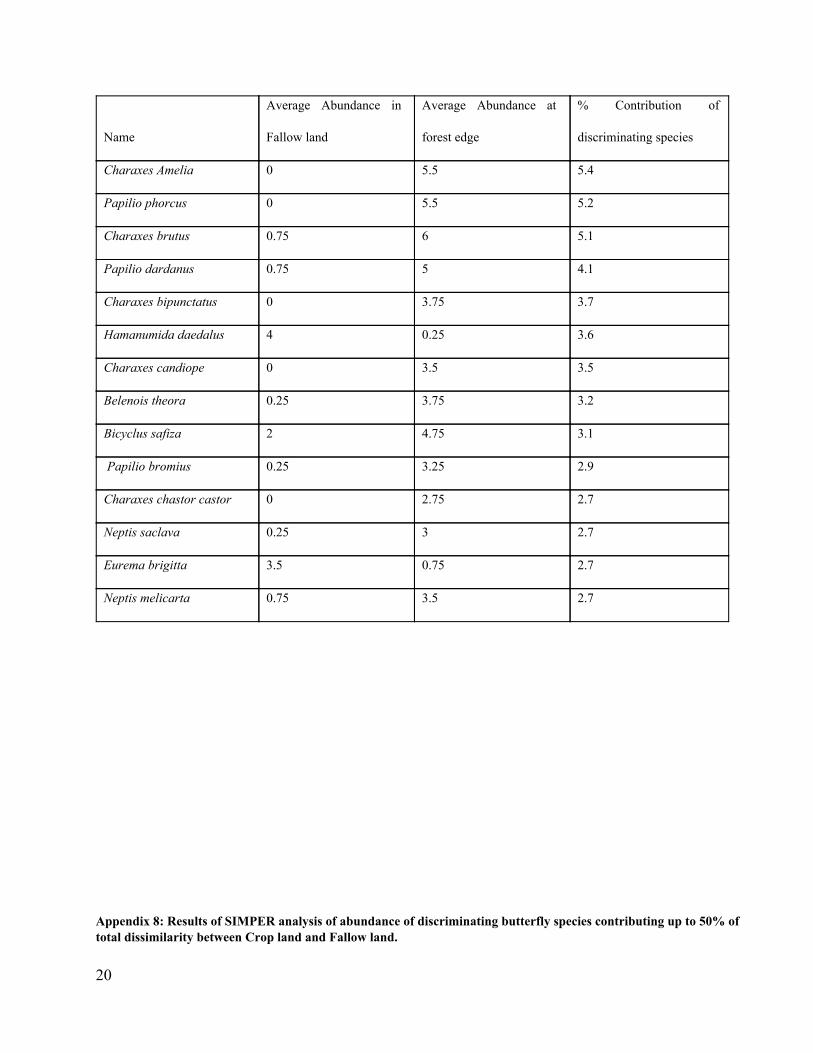
Appendix 8: Results of SIMPER analysis of abundance of discriminating butterfly species contributing up to 50% of total dissimilarity between Crop land and Fallow land.
20
(ANOSIM; R= 0.44, P=0.99, Average contribution of discriminating species = 61.8%)
Name
Average Abundance in
crop land
Average
Abundance in
fallow land
% Contribution of
discriminating
species
Junonia oenone 0.25 2.75 7.4
Henotesia ankora 1.75 2.25 5.6
Eurema brigitta 3.25 3.5 5.3
Henotesia perspicua 1 2.5 5.3
Hamanumida daedalus 2.25 4 5.0
Bicyclus safiza 0.75 2 4.5
Eurema Brenda 1.5 0.5 4.3
Ypthima albida 1.25 0.75 4.0
Neptis Agatha 1.25 0.5 3.6
Nepheronia thalassina 1 0.75 3.1
Charaxes brutus 1 0.75 3.1
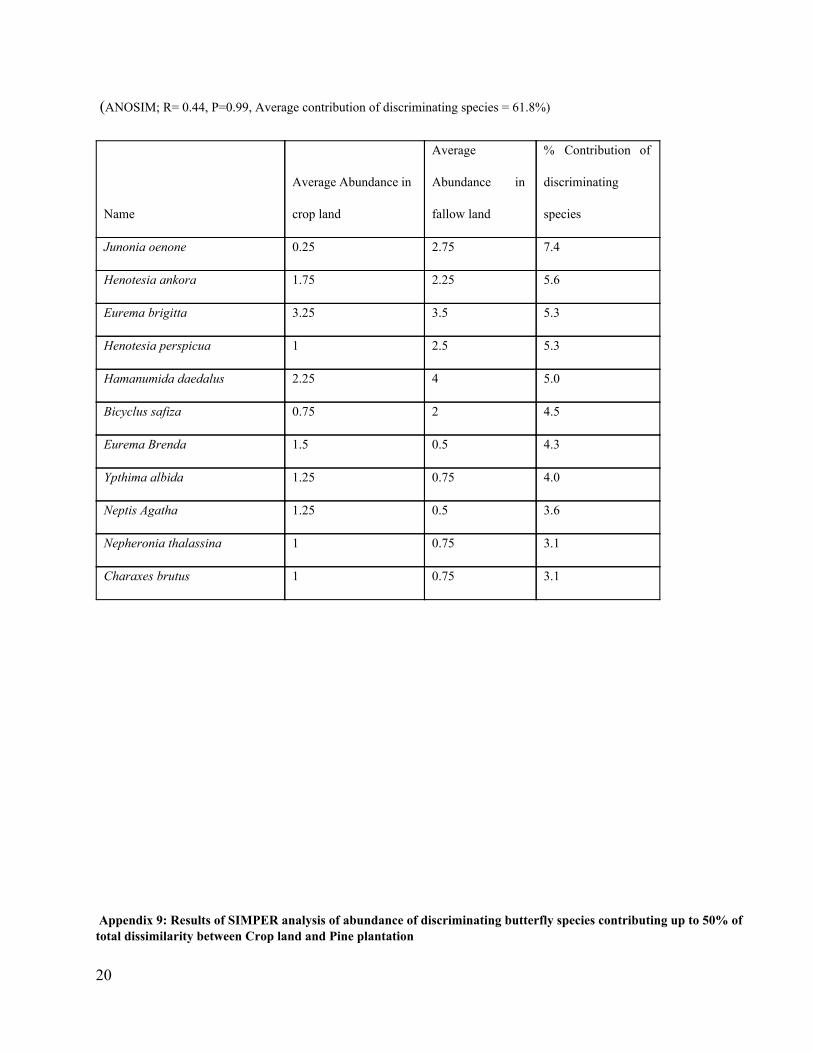
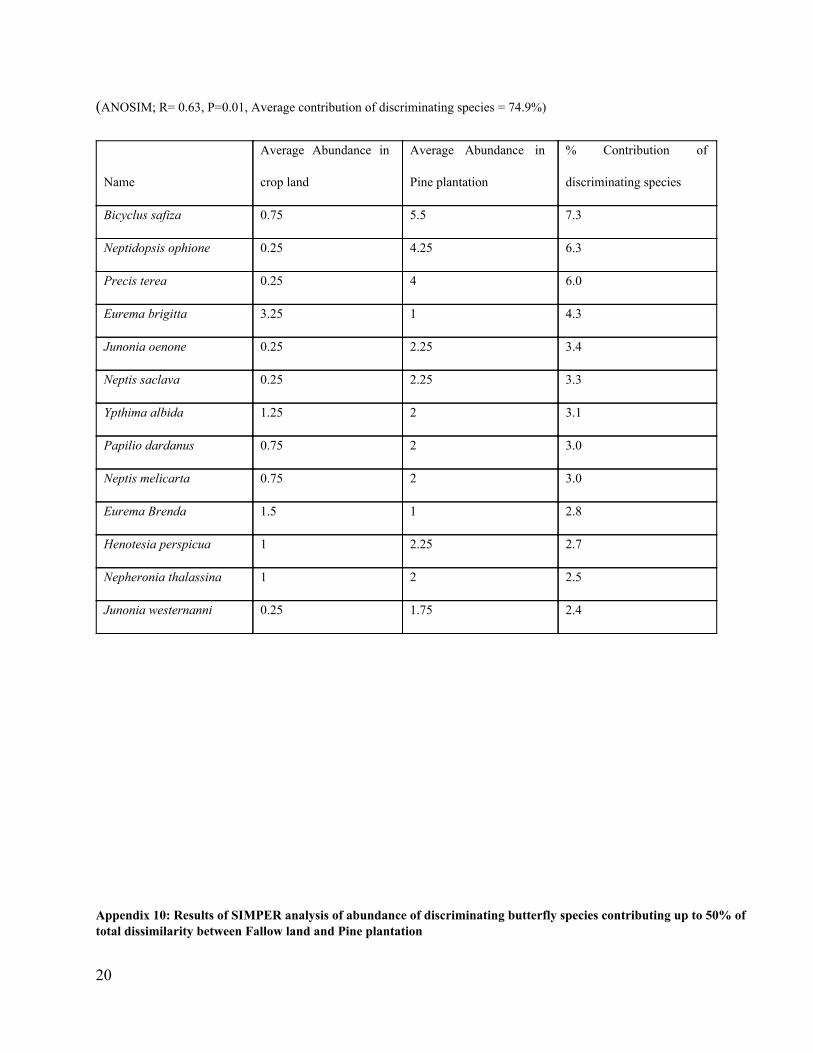
Appendix 9: Results of SIMPER analysis of abundance of discriminating butterfly species contributing up to 50% of total dissimilarity between Crop land and Pine plantation
20
(ANOSIM; R= 0.63, P=0.01, Average contribution of discriminating species = 74.9%)
Name
Average Abundance in
crop land
Average Abundance in
Pine plantation
% Contribution of
discriminating species
Bicyclus safiza 0.75 5.5 7.3
Neptidopsis ophione 0.25 4.25 6.3
Precis terea 0.25 4 6.0
Eurema brigitta 3.25 1 4.3
Junonia oenone 0.25 2.25 3.4
Neptis saclava 0.25 2.25 3.3
Ypthima albida 1.25 2 3.1
Papilio dardanus 0.75 2 3.0
Neptis melicarta 0.75 2 3.0
Eurema Brenda 1.5 1 2.8
Henotesia perspicua 1 2.25 2.7
Nepheronia thalassina 1 2 2.5
Junonia westernanni 0.25 1.75 2.4
Appendix 10: Results of SIMPER analysis of abundance of discriminating butterfly species contributing up to 50% of total dissimilarity between Fallow land and Pine plantation
20
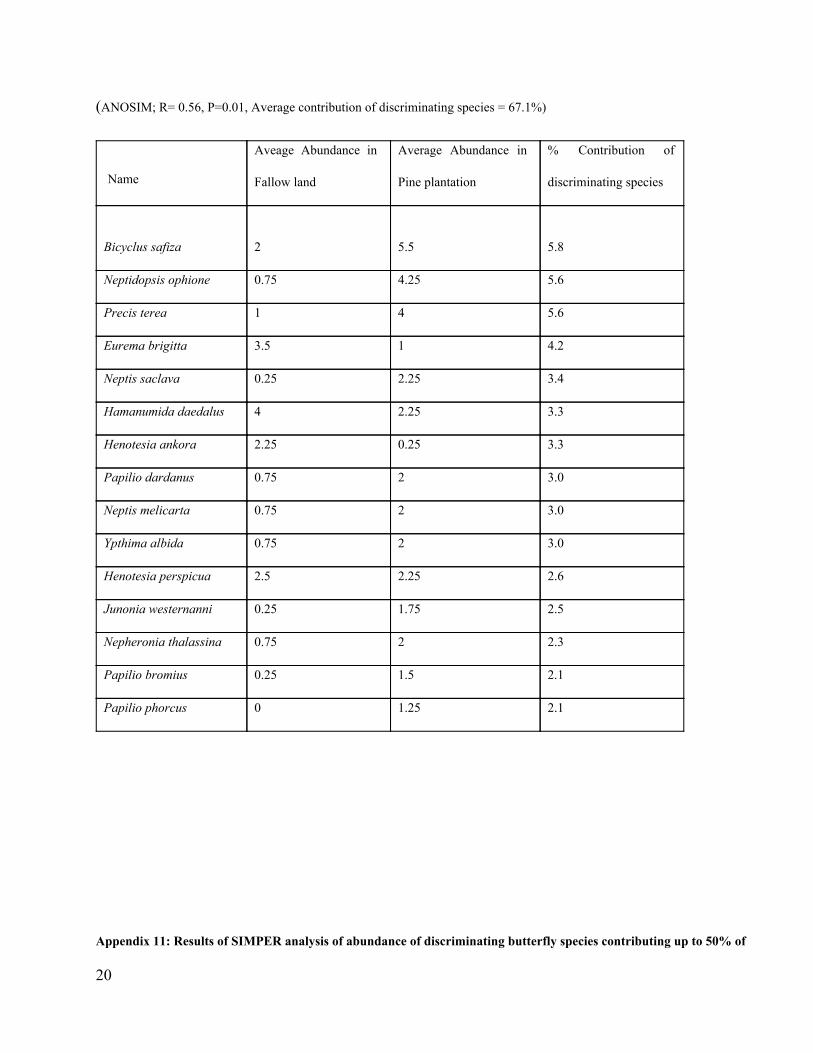
(ANOSIM; R= 0.56, P=0.01, Average contribution of discriminating species = 67.1%)
Name
Aveage Abundance in
Fallow land
Average Abundance in
Pine plantation
% Contribution of
discriminating species
Bicyclus safiza 2 5.5 5.8
Neptidopsis ophione 0.75 4.25 5.6
Precis terea 1 4 5.6
Eurema brigitta 3.5 1 4.2
Neptis saclava 0.25 2.25 3.4
Hamanumida daedalus 4 2.25 3.3
Henotesia ankora 2.25 0.25 3.3
Papilio dardanus 0.75 2 3.0
Neptis melicarta 0.75 2 3.0
Ypthima albida 0.75 2 3.0
Henotesia perspicua 2.5 2.25 2.6
Junonia westernanni 0.25 1.75 2.5
Nepheronia thalassina 0.75 2 2.3
Papilio bromius 0.25 1.5 2.1
Papilio phorcus 0 1.25 2.1
Appendix 11: Results of SIMPER analysis of abundance of discriminating butterfly species contributing up to 50% of
20
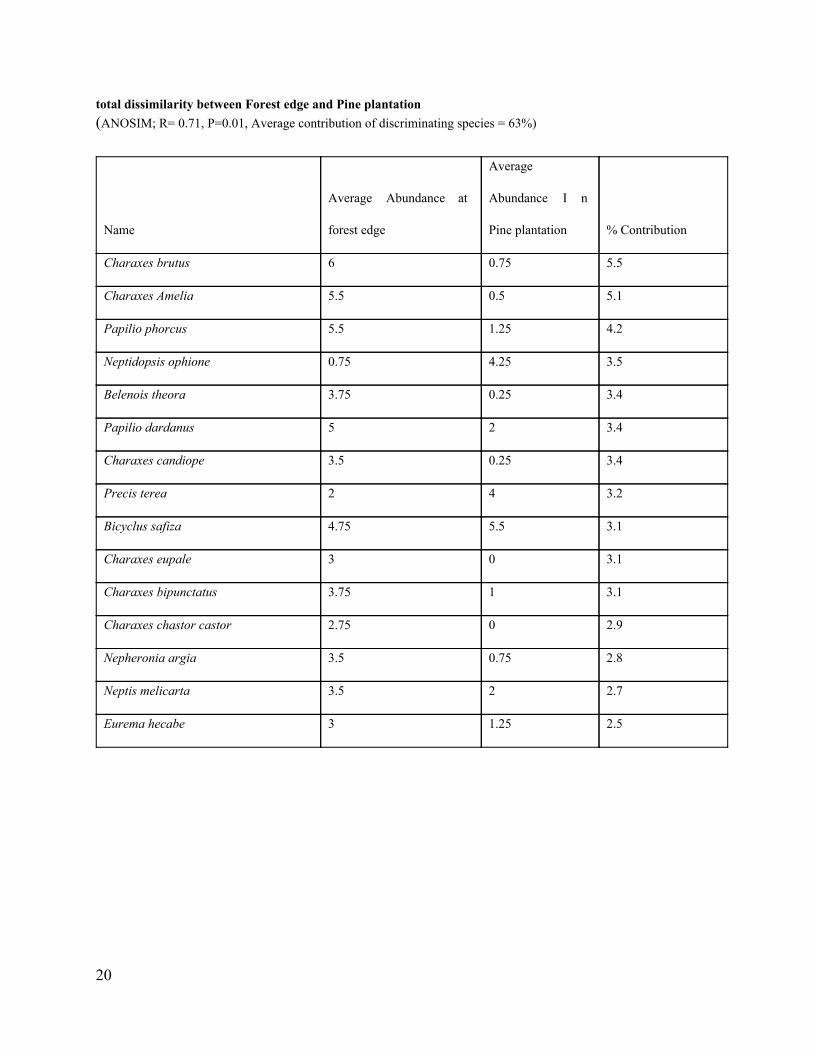
total dissimilarity between Forest edge and Pine plantation (ANOSIM; R= 0.71, P=0.01, Average contribution of discriminating species = 63%)
Name
Average Abundance at
forest edge
Average
Abundance I n
Pine plantation % Contribution
Charaxes brutus 6 0.75 5.5
Charaxes Amelia 5.5 0.5 5.1
Papilio phorcus 5.5 1.25 4.2
Neptidopsis ophione 0.75 4.25 3.5
Belenois theora 3.75 0.25 3.4
Papilio dardanus 5 2 3.4
Charaxes candiope 3.5 0.25 3.4
Precis terea 2 4 3.2
Bicyclus safiza 4.75 5.5 3.1
Charaxes eupale 3 0 3.1
Charaxes bipunctatus 3.75 1 3.1
Charaxes chastor castor 2.75 0 2.9
Nepheronia argia 3.5 0.75 2.8
Neptis melicarta 3.5 2 2.7
Eurema hecabe 3 1.25 2.5
20

20