Business cases - RoadToBio
92
Business cases Case studies on potentially attractive opportunities for bio-based chemicals in Europe Consortium: Authors: Mladen Crnomarković 1 , Yamini Panchaksharam 1, Jurjen Spekreijse 2 , Christopher vom Berg 3 , Ángel Puente 3 , Raj Chinthapalli 3 1) E4tech, United Kingdom 2) BTG Biomass Technology Group B.V., the Netherlands 3) nova-Institute GmbH, Germany This project has received funding from the Bio-Based Industries Joint Undertaking under the European Union's Horizon 2020 research and innovation programme under grant agreement No. 745623.
-
Upload
khangminh22 -
Category
Documents
-
view
0 -
download
0
Transcript of Business cases - RoadToBio

Business cases
Case studies on potentially attractive opportunities for bio-based chemicals in Europe
Consortium:
Authors:Mladen Crnomarković1, Yamini Panchaksharam1, Jurjen Spekreijse2, Christopher vom Berg3, Ángel Puente3, Raj Chinthapalli3
1) E4tech, United Kingdom2) BTG Biomass Technology Group B.V., the Netherlands3) nova-Institute GmbH, Germany
This project has received funding from the Bio-Based Industries Joint Undertaking under the European Union's Horizon 2020 research and innovation programme under grant agreement No. 745623.

Executive Summary
This report provides an analysis of nine potentially attractive business opportunities (“sweet spots”) for the European bio-biobased industry. The“sweet spots” have been chosen by analysing the current landscape of bio-based chemicals and those that have reached an advanced developmentstage, and hence may represent a potential business opportunity for the European chemical industry (more details in an upcoming Deliverable).The selected “sweet spots” cover a range of biogenic feedstocks and represent different categories of bio-based chemicals.
* C5 sugars
The case studies were analysed using an in-depth assessment of the value chains, markets, potential and barriers of nine potentially attractiveopportunities compared to their fossil-based equivalents.
The analyses show that there are a number of potentially viable opportunities to replace fossil with bio-based chemicals. Cost competitiveness,sustainability impact and advanced functionality are the key factors in determining the displacement of fossil derived chemicals.
The focus of future development will be on the production of bio-based chemicals from cheaper and more sustainable feedstock, economicallyviable commercial scale production and new and innovative products which outperform traditional fossil-based products.
The bio-based chemicals business case studies will be useful in informing and illustrating the 2030 target of the European bio-based industryRoadmap and its related opportunities and barriers.
2
Bio-based chemicals categories Feedstock
Sugar/Starch Vegetable oil Syngas & other
Drop-in Ethylene Methanol
Smart drop-in 1,4-ButanediolDedicated PHA, Lactic acid, PEF, Furfural* Dodecanedioic Acid, Glycerol

Approach to selecting “sweet spots” for business case studies
Ease
of
imp
lem
enta
tio
n
HIGH LOW
Opportunistic
Sweet spots
Lower Priority
Invest to improve
LOW HIGH
Criteria
Improvement in resource efficiency
Bio-based product has improved functionality
High margin can be obtained
Low risk for political or ethical disputes
Savings in GHG emissions
Availability of biomass in the EU
Decrease in use of toxic /harmful substances
Potential for green premium
EU has competitive advantages
Analysis of the bio-based opportunities for the chemical industryDel 1.1
Ranking for `market potential´ and `ease of implementation´
Workshop 02.07.17
Phone interviews
Workshop 19.06.18
9 business case studies
Priorities of the chemical industry for selection of business cases
Creating and ranking long list
For each kind of chemical group→ Sweet spots
A sweet spot in RoadToBio is defined as an attractive business opportunity. Nine sweet spots were selected by analysing a long list of bio-based chemicals across the product groups: Adhesives, Agrochemicals, Cosmetics, Lubricants, Man-made fibres, Paints/Coatings/Dyes, Plastics/Polymers, Solvents and Surfactants.The bio-based opportunities have been ranked by evaluating the market potential criteria (market volume, market price and market growth) and ease of implementation which is measured by the TRLs of bio-based chemicals. The sweet spots for business cases have then been chosen from the top of the list of the ranked bio-based opportunities by taking into consideration:a. Priorities of the chemical industry when selecting the
business casesb. Representation of each of the three classifications of bio-
based chemicals (drop-in, smart drop-in, and dedicated chemicals)
c. Representation of different product groupsIn this way, the selected sweet spots will represent a wide variety of bio-based chemicals which will provide learnings and inform the Roadmap about opportunities and issues of different types of bio-based within different product groups.You will find a detailed description of the approach in the upcoming Deliverable on the methodology of RoadToBio.
Market potential
3

Contents
1. Introduction………………………………………………………………………………………………………………………… 5
2. Framework for developing business cases……………………………………………………………………………. 6
3. Drop-in chemicals………………………………………………………………………………………………………………… 7
3.1: Ethylene…………………………………………………………………………………………………………………………. 8
3.2: Methanol……………………………………………………………………………………………………………………….. 16
4. Smart drop-in chemicals…………………………………………………………………………………………………….… 26
4.1: Dodecanedioic acid (DDDA)……………………………………………………………………………………………. 27
4.2: 1,4-Butanediol………………………………………………………………………………………………………………… 34
5. Dedicated chemicals……………………………………………………………………………………………………………… 41
5.1: Polyhydroxyalkanoates - PHA………………………………………………………………………………………..… 42
5.2: Polyethylene furanoate - PEF………………………………………………………………………………………….. 49
5.3: Lactic acid…………………………………………………………………………………………………………………….... 59
5.4: Furfural………………………………………………………………………………………………………………………….. 66
5.5: Glycerol………………………………………………………………………………………………………………………….. 73
6. Conclusions…………………………………………………………………………………………………………………………. 81
7. Acronyms……………………………………………………………………………………………………………………………… 82
References
4

1. Introduction
1. About RoadToBio
This report was prepared as part of RoadToBio, a European Union funded project to explore the opportunities to increase the share of bio-basedchemicals in the European chemicals industry. The project will deliver a roadmap and an action plan to exploit “sweet spots” (potentially attractivebusiness opportunities) for Europe’s chemical industry in the bioeconomy space from present day to 2030.1
The roadmap developed in RoadToBio will be based on an analysis of the most promising opportunities for the chemical industry to increase its bio-based portfolio as well as the technological, commercial, regulatory and public acceptance barriers to these opportunities. The roadmap will includean action plan and engagement guide to support the sustainable growth of the sector.
2. Goal and scope of this report
This report presents the business case studies for nine potentially attractive opportunities that were identified during the course of the RoadToBioproject. These opportunities are spread over three groups of chemicals (defined on subsequent pages), namely:
- Drop-in chemicals
- Smart drop-in chemicals
- Dedicated chemicals
Notes:1. More information about the project, its goals and plans, and how you can contribute to this roadmap for the chemical industry can be found on www.RoadToBio.eu
5

2. Framework for developing business case studies
The main objective of this task is to identify representative opportunities and barriersassociated with potentially attractive bio-based chemicals across different productgroups. The analysis of nine case studies was completed in three stages:
Stage 1. Development of case studies: for the nine “sweet spots” key informationabout the bio-based chemicals value chains, markets (supply & demand) andproduction costs was collected, analysed and benchmarked against the fossilequivalents.
Stage 2. SWOT analysis: the strength of the opportunity for the nine case studies wasillustrated by a SWOT analysis, which was discussed with industry stakeholders at adedicated workshop organized by the RoadToBio consortium.
Stage 3. Analysis of potential and barriers: the results of the case studies have beensummarized into opportunities and issues. Learnings from these opportunities andissues will provide valuable input for the 2030 RoadToBio roadmap and action planfor the European bio-based industry.
How is the chemical produced and where is it used?
Market outlook, trends and industry structure?
What drives the production costs?
Assessment of business opportunity of bio-based chemicals.
Results summary and key learnings from business cases.
6

3. Drop-in chemicals
Bio-based drop-in chemicals are bio-based versions of existing petrochemicals that already have established markets. They are chemically identicalto existing fossil-based chemicals and are produced using a similar pathway.1
Business case studies for the following drop-in chemicals are presented in this report:
1. Ethylene
2. MethanolNotes:1. Carus et al. (2017). Bio-based drop-in, smart drop-inand dedicated chemicals https://www.roadtobio.eu/uploads/publications/articles/17-12-18-RoadToBio-Drop-in-paper.pdf
7

3.1 Ethylene
Ethylene or ethene is a hydrocarbon that belongs to the family of alkenes (olefins), being the most simple one
(CH2=CH2). Ethylene is one of the basic organic chemicals serving as feedstock for a number of downstream
chemical products. With a current global production exceeding 150 million tonnes per year, it is by far the
largest bulk chemical used for the production of around half of the plastics. It is used for direct or indirect
production of most important synthetic polymers, including high- and low-density polyethylene (HDPE and
LDPE), polyvinyl chloride (PVC), polystyrene (PS) and polyethylene terephthalate (PET).
Today, almost all ethylene is produced from petroleum derivatives, including naphtha (mostly Europe and Asia),
ethane and, to a lesser extent, propane and butane in the Middle East and North America. However, increasing
concerns over greenhouse gas (GHG) emissions have now focused the attention on renewable feedstocks for
bio-ethylene production.
The first step in bio-ethylene production is the production of bio-ethanol, by the fermentation of a variety of
sucrose, starchy and lignocellulosic biomass, followed by the use of commercially available or demonstrated
technologies such as catalytic dehydration of ethanol or methanol-to-olefins. In Brazil, the availability of low-
cost sugarcane and bio-ethanol production has led to investments in facilities for production of bio-ethylene
and its downstream products (e.g. bio-PE) [11].
The potential for bio-ethylene production is large, but its implementation will depend on the future availability
and price of the biomass feedstocks, which are linked to developments in food demand and the use of biomass
for other industrial uses.
8

Direct gasification
Value chain
9
Fermentation
Catalytic dehydration
Anaerobic digestion
Crude oil, natural gas-----------------------------
Natural gas, coal
Ethylene
HDPE
LDPE
PVC
PS
MEG
Others
Sugarcane, corn, wheat, sugar beet----------------------Wood chips, corn
stover
22%
36%
13%
7%
11%
11%Municipal Solid
Waste
SyngasIndirect gasification
Gasification
Refining
Hydrolysis & fermentation
Reforming
Methanol synthesis
Steam cracking
Methanol to olefins
Fossil feedstock
Key chemicalBio-based feedstock
Feedstock ApplicationKey derivatives
Biogas
Naphtha Ethane
LPG
Ethanol
Methanol
Packaging, pipes, polywood
Packaging, containers, playground slides
Packaging, cards, pipes, construction, medical devices
CD/DVD cases, containers, lids, disposable cutlery
PETContainers, fibres for clothing, engineering resins

Demand
The current annual global production volume of ethylene is about 150 million tonnes, of which about 21million tonnes is produced in Europe. The global demand for ethylene is forecast to grow at a 1.05% rate(2016-2030). Growth in world ethylene consumption will be driven by growth in the use of polyethylene forconsumables; ethylene oxide/glycol for polyethylene (PET), resins for polyester fibre, bottles and otherpackaging; and ethylene dichloride for PVC uses in construction and pipes. Together, these end usesrepresent about 72% of world ethylene consumption.
The most important regions in terms of ethylene consumption are Asia (40%) and America (30%). WesternEurope is expected to consume and produce less ethylene in the next five years, as the regional markets aremature and the production is based on less-economic feedstock (naphtha), making it increasingly difficult tocompete in the global ethylene derivative export market [5].
*EU-15 + Norway + Turkey
Others: ethanol, acetaldehyde, ethylene propylenediene monomer (EPDM), ethylene-vinyl acetate(EVA), vinyl acetate monomer (VAM) and otherderivatives
Based on ref. [4]
0
60
120
180
2016 2018 2020 2030
Mill
ion
me
tric
to
nn
es
Market Volume
Global EU
Based on ref. [4 and 5]
10
30%
13%40%
17%
Regional Demand (2016)
America
Europe
Asia
Middle East
Based on ref. [5]
22%
14%
22%
7%(for PS)
11% (for MEG)
13% (for PVC)
11%
LDPE
LLDPE
HDPE
Ethylbenzene
Ethylene oxide
Ethylene dichloride
Others
Ethylene consumption by derivatives in EU-15* (2016)

Naphtha; 42.6%
Ethane; 36.3%
LPG ; 14.8%
Bio-ethanol;
<1%
Others; 6.3%
0%
20%
40%
60%
80%
100%
Ethylene global production by feedstock (2016)
Supply
Global production of ethylene in 2016 was dominated by fossil feedstock with naphtha making upthe highest share (>42%). Asia leads global ethylene production (31%), while 14% of the supply isEurope based.
Industrial plants based on ethanol dehydration have been developed by different companies andtechnology providers, including Braskem, Chematur, British Petroleum (BP), Dow, and Axens-Total-IFPEN. There are commercial facilities producing bio-ethylene located in Brazil and also severalproduction plants are under construction or planned (e.g. in China). Since 2010, Braskem (Brazil),the largest bio-ethylene producer, produces about 200 kta of ethylene from sugar-cane-basedfeedstock in an ethanol-to-ethylene plant [1]. There is no commercial bio-ethylene production inEurope [3].
Neste (Finland)/IKEA recently announced a partnership to deliver renewable bio-based plastics.The announcement specifies that bio-based plastics will be compatible with existing recyclingstreams, which implies they are looking for drop-in products to replace oil derived polyethylene(PE) and polypropylene (PP). Neste’s source of bio-based feedstock are by-products from thebiodiesel production from waste oils and fats at their refineries in Finland and elsewhere, whichcan be fed to an existing cracker together with fossil oil derived feedstock which is processed at thesame time. However, crackers and polymerisation reactors are built at large scale and so the bio-feedstock is diluted with fossil oil derived feedstock based on hydrocarbon (e.g. naphtha) crackingmethod, which is processed at the same time. Further dilution occurs in the polymerisation reactorso any batch of PE or PP has a very low bio-based content [13].
11
10%
14%
19%
26%
31%
Others
Europe
Middle East
America*
Asia
* Including < 1% Bio-ethylene from Braskem
Based on ref. [5]
Global supply of ethylene (2016)
Others = Coal , shale gas

Cost and environmental performance
For bio-ethylene, bio-ethanol accounts for almost 90% of the production costs. Consequently, the region ofethanol production and feedstock source dictate total production costs. The acid-catalysed dehydration ofethanol has become attractive because of the large volume of sugarcane and corn bio-ethanol produced.
In Brazil, the availability of low-cost, low direct GHG emissions sugarcane-driven bio-ethanol has led toinvestments in facilities for production of bio-ethylene (bio-PE) and its downstream products.
The current production cost of bio-ethylene (sugar-cane case) is~ 1650 €/kg which is between 1.1 and 2.3times higher than the global average petrochemical ethylene cost of production. In the EU, this gap wouldbe bigger but lignocellulosic bio-ethylene could reduce the gap.
Producing bio-based ethylene from sugarcane is estimated to use 60% less energy compared to the fossil-based method (crude oil > naphtha > ethylene)[11] because of the integrated heat- and power-generationin burning bagasse. GHG emissions are also cut by 40%.
0
500
1000
1500
2000
Petrochemical Sugarcane Sweet Sorghum Corn Sugar beet Lignocellulose
Petrochemical Brazil China US Europe US
Petrochemicals Bio-Ethylene
Cost of production per feedstock (2009)
Global
Based on ref. [11]
[a] Years 2014-2015; [b] Bio-ethanol for bio-ethylene(estimated for EU) and naphtha for fossil ethylene; [c]Heat, steam, electricity; [d] Labour, maintenance, plantoverhead. NOTE: for fossil ethylene depreciation is alsoincluded in other costs; [e] Estimated as 5% of thecapital costs (20 years operating plant)
0
400
800
1200
1600
2000
Bio-ethylene EU fossil ethylene
Production costs, Euro/tonne[a]
Raw material [b]
Utilities [c]
G and A
Other costs [d]
Depreciation [e]
Based on ref. [14, 15]
12

SWOT analysis
Strengths
• Large market volume• High GHG emission saving compared to fossil ethylene• Less energy demand compared to fossil ethylene• Bio-ethanol catalytic dehydration technology commercially
available and competitive
Weaknesses
• Price gap with fossil ethylene• The Brazilian production conditions (from sugarcane) are
difficult to replicate in EU, making the EU uncompetitive
Threats
• Bio-ethanol used for bio-ethylene will compete with fuel sector• Strong competition with fossil ethylene from shale gas
feedstock• Fossil fuel subsidies• Low biomass availability in EU
Opportunities
• CO2-tax and other policy measures• Development of bio-ethanol production from lignocellulosic
feedstock• Global bio-based polymer production is expected to grow at 4%
by 2022, which could drive the production of bio-ethylene
13

Opportunities IssuesTechno-economic factors• Bio-based ethylene is easily produced by catalytic dehydration of bio-
ethanol which has become increasingly efficient and competitive.Nowadays, 90% of the ethanol on the market is biomass-derived.
• Bio-ethylene from sugarcane-based bioethanol appears to be the mostcost-competitive. In Brazil and US ethanol costs have come downsignificantly and this trend is expected to continue with increasing yields.
• Bio-ethylene production from ethanol via indirect synthesis from syngascould be an option, especially carbon capture and storage is considered.
Techno-economic factors• Bio-ethylene is still more costly than fossil-based ethylene, particularly in
light of the cheap feedstock opportunities presented by shale gasdevelopments in the United States.
• The Brazilian production conditions (from sugarcane) are difficult toreplicate in other areas. For example, production of sugars from starchyfeedstock large enough to supply bio-ethanol for large scale bio-ethyleneproduction is difficult to obtain in other areas.
• There is still no commercial process producing ethylene from secondgeneration feedstocks.
Environmental factors• Producing bio-based ethylene from sugarcane is estimated to use 60% less
energy compared to the fossil-based method because of the integrated heat- and power-generation in burning bagasse. GHG emissions are also cut by 40%.
• Lignocellulosic biomass, if cheap and competitive, could enlarge the feedstock availability with minor impact on food production.
Environmental factors• Careful consideration of sustainability of biomass feedstocks used
Potential and Barriers
14

Opportunities Issues
Market factors• More than 67% of the bioethanol is used as biofuel, but its high-volume
production at relatively low cost offers an opportunity for its valorisation asa raw material for the production of various renewable chemicals.
• Commercial projects on lignocellulosic biomass are currently supported bypolicy incentives and government loans in many countries.
• Removing subsidies to fossil fuels and carbon taxes will help close the pricegap between petrochemical and bio-based products.
• The current market for bio-based polymers is small but global bio-basedpolymer production is expected to grow at 4% by 2022.
• Bio-based plastics can attract premium prices on the market, which couldmake them a competitive business in regions with abundant and cheapbiomass feedstock.
Market factors• A higher demand for bio-based fuels and materials might lead to the
conversion of food plantations to bio-ethanol production and increasingfood prices with uncertain impacts in developing countries.
• The current increase in the production of bioethanol is mainly due to itsuse as a biofuel to substitute for the fossil fuels.
• Several industry sectors (e.g. transportation fuels, power generation andthe chemical industry) might compete for biomass feedstock.
Potential and Barriers (continued)
15

3.2 Methanol
Methanol is a liquid chemical with the formula CH3OH (often abbreviated MeOH). It is colourless, volatile,flammable, and poisonous.
Methanol can be made from a variety of feedstocks. The first step involves production of synthesis gas, which is amixture of CO, CO2 and H2. While natural gas is most often used, methanol can be made from any resource thatcan be converted into synthesis gas. This includes coal and oil, but also biomass, including agricultural andmunicipal waste, and wood. Methanol could be central to the development of biorefineries as an intermediate inthe conversion of biomass to useful products.
Synthesis gas can also be produced by combining waste CO2 from manufacturing or power plants with hydrogenproduced from the electrolysis of water using renewable electricity. And methanol can be manufactured fromsmall-scale units, producing a few hundred gallons or litres per day, to large plants making 1.6 million gallons/6million litres each day.
Based on [1,13]
16

Value chain
Olefins
Based on [2]
Fossil feedstock
Key chemicalBio-based feedstock
Gasoline Additive
Natural Gas
Coal
Methanol
Formaldehyde
Acetic acid
MMA
MTBE
DME
Gasoline
MTO
Biodiesel
Insulation
Paints/Coatings
Appliances
Electronics
Automotive
Construction
Fuels
PMMA
Acetic anhydride
Acetate esters
VAM
MDI
Polyacetals
UF/PF Resins
Solvents
PET Bottles
Lignocellulose
32%
11%
2%
10%
11%
11%
2%
4%
CO2
SyngasGasification
Gasification
Methanolsynthesis
17
Feedstock ApplicationKey derivatives
Glycerol from biodiesel unit
Purification, evaporation, cracking

Value chain (continued)
▪ Distributors
− Brenntag
− Univar
− Helm
▪ Intermediates for end-uses
− Celanese
− Evonik
− DuPont
− BASF
− Chemanol
− SAFCO
− Kothari
− Kuraray
− Changchun PC
▪ Methanol producers
− Methanex
− Helm
− Sabic
− Zagros
− Yankuang
− MGC
− Sinopec
− Mitsubishi
− Petronas
▪ Fuels
− Exxon Mobil
− Shell
− Sabic
− IOCL
Methanol Producers
End users Construction, Automotive, Electronics, Appliances, Paints, PET bottles, Solvents
Fuel producers
Methanol value chain
Distributor
Direct
18
Non-exhaustive list

Demand
Methanol is one of the chemicals/fuels with the largest growth rate in the last decade, with itsdemand increasing from ~ 5 in 2005 to >70 Mt in 2015. The CAGR nearly doubled in the lastfive years compared to the average in the decade before. A significant increase is seen for:
- Formaldehyde, driven by the expansion in polymers and resins particular in Asian markets.- Olefins (methanol-to-olefin (MTO)/methanol-to-propylene (MTP) processes) in the last few
years, particularly in China.- Dimethyl ether (DME), also especially in China.- Gasoline/fuel/biodiesel, especially in Europe.
In terms of end use, the formaldehyde segment is predicted to witness substantial demand inthe global methanol market over the period between 2017 and 2026. The application ofmethanol and its derivatives in the construction and automotive sectors has increasedsignificantly over the past few years.
Based on [3,4,11,13]
Asia Pacific, except Japan, is anticipated to continue to remain the most lucrative market formethanol during the period between 2017 and 2026. The growth of this market is attributedto the growing demand for methanol and its derivatives in several industry sectors, such asautomotive, textile, construction and furniture.
19
17%
11%
3%
51%
18%
Global methanol demand by region (2016)
Europe
North America
Latin America
China
Rest of Asia Pacific
28%
10%
11%5%
11%
15%
3%
17%
Global methanol demand by derivative (2016)
Formaldehyde
Acetic acid
MTBE
DME
Fuel blending
MTO
Biodiesel
Other
Supply
Major producers with large-capacity plants (up to 5,000-6,750 metric tonnes/day) arefound in China, the Middle East, Russia. Worldwide, there is an estimated annualproduction capacity of 110 million tonnes.
About 80% of methanol production is based on natural gas, the rest is based on coal (17%)and in small amounts on oil and biomass. Natural gas is likely to witness most growth as afeedstock. But, particularly in China, where large coal reserves are available, coal-basedmethanol capacity (i.e. currently about 9 Mt/year) is rapidly increasing, with applicationsas a fuel for transport and in the MTO (Methanol-to-Olefins) process.
The increasing oil and natural gas prices in recent years, as well as concerns aboutgreenhouse gas (GHG) emissions, have sparked growing interest in alternative processesfor methanol production based on renewable sources. Alternative feedstock includesbiomass, waste and by-products from various sectors (including biogas from landfill,sewage, solid waste treatment; glycerine (glycerol) from biodiesel production; and blackliquor from the pulp and paper industry). CO2 is expected to become a feedstock in thefuture – one of the main drivers in Europe will be policy incentives.
Based on [2,3,5,6,7,13 14]
20
There are advanced pilots (small demos), which have shown that conversion of cellulosicmaterial to synthesized products is feasible and that heat and material balances are in linewith results of simulation work. On that basis, the first commercial scale plants based onmunicipal solid waste gasification are being built.
14.3%
6.2%
6.1%
3.9%
3.8%
3.6%
3.2%
2.6%
2.2%
2.1%
Methanex
SCC/Helm (MHTL)
Sabic
Zagros (Iran)
Yankung
MGC
Sinopec
Shenhua
Mitsubishi (MSK
Petronas
Market share of top producers of methanol (2016)
12%
10%
46%
5%1%
13%
3% <1%
6%
3%
Global capacity for methanol (2018) (projection)
North America
South America
Northeast Asia
Southeast Asia
Indian Subcontinent
Middle East
Western Europe
Central Europe
CIS and Baltic States
Africa

Cost and environmental performance
Methanol prices have fluctuated between 200-450 US$ per tonne inrecent years. The consensus in the European market is that globalmethanol markets are set for an oversupply in 2018. Large plants inthe US and Iran have the potential to flood the global markets.
The methanol market in Europe is expected to follow global growth trends since 2016. The demand is driven mainly from the demand for biodiesel, formaldehyde and acetic acid derivatives. The increase in capacities in Asia ensures sufficient supplies worldwide. However, incremental demand from Asia coming from methanol conversion to olefins might increase the prices for methanol in the long run.
Expectations of supply length have already manifested themselves ingreater contractual discounts in Europe for 2018.
Based on [8,9]
But uncertainty remains around the timing and extent of the newproduction volumes as well as potential mothballing of older plantsand feedstock gas shortages in other regions.

Cost and environmental performance (Continued)
The costs of methanol production from fossil fuels range from 75-250 €/t for naturalgas and from 150-300 € /t for coal. The cost of wood-based bio-methanol productionis estimated to range from 160 to 940 € /t.
The production costs of bio-methanol are highly sensitive to local conditions. Keyfactors that influence the currently available estimates are feedstock types andprices, electricity generation fuel mix and prices, scale of production capacity,technology choice and investment costs and the desired grade of the final product.Electrolysis requires a lot of electricity, but if the price of electricity is very low, a bio-methanol facility using electrolysis can become an economically attractive option.
The capital cost per unit of capacity for wood-based bio-methanol is at least 3.4times higher than the capital cost of plants based on natural gas. A bio-methanolproduction facility based on CO2 is estimated to be about 15 times as expensive asthe most economical natural gas-based facility.
Larger plants (e.g. 30-40 kt/yr capacity) are estimated to have a significantly lowercost per unit of capacity. For a 300 MTPD methanol plant, a ROI of 29% is expected.For a 150 t/d For a plant based on biomass which is normally 150 t/d capacity, theROI is reduced to 18%.
Overall, for the same energy output, bio-methanol plants are about 1.8 times moreexpensive than bio-ethanol facilities.
In terms of environmental performance, bio-methanol can offer GHG emissionssavings of 19%.
Based on [10,11,15,16]
0
100
200
300
400
500
600
700
2017
Manufacturing costs – 300 million gal/yr (fossil)
€/ton
0
100
200
300
400
500
600
700
2017
Manufacturing costs - 40 million gal/yr (bio-based)
Depreciation (% of Capex)
Fixed costs
Utilities
Raw material
€ /ton
22

SWOT analysis
Strengths
• Methanol has a large market volume and is a flexible platform chemical with many downstream uses
• Since it is a drop-in no, change in processing is necessary at customers side
Weaknesses
• Bio-based methanol production in most cases is not cost-competitive with today’s hydrocarbon price
• Competition with natural gas and future possible competition with CO2 routes, which are both considered relatively clean options
Threats
• OECD mentioned that fossil fuel subsidies are damaging bio-based markets
• Larger plants similar to natural gas-based methanol might not be possible due to biomass availability constraint
• High cost of biomass in Europe
Opportunities
• More carbon efficient gasification of methane (CH4 → C + 2H2) not releasing CO2, could be an opportunity to produce bio-based methanol more efficiently
• A CO2 emission tax could make bio-based methanol more cost competitive
• Due to the low energy content of biomass and its low density (e.g. straw), processing of biomass could be divided into a decentralized (pyrolysis) step and an centralized gasification and synthesis step
23

Potential and Barriers
Opportunities IssuesTechno-economic factors• Methanol is a highly useful solvent for the synthesis of a huge portfolio of
chemicals• Methanol can follow the acetic acid, the formaldehyde or the DME/olefin
branch for chemicals in the value chain on page 17 and can also be used forfuels.
• Biomethanol is interchangeable with standard methanol and can benefitfrom the existing infrastructure.
• The technologies used in the production of methanol from biomass arerelatively well known since they are similar to the coal gasificationtechnology.
• There is a gradually increasing demand for methanol in chemical industry• A potentially economical option is to mix renewable and fossil feedstocks
(co-feeding). This can gradually make methanol production environmentallyfriendly and increase the expertise in biomass-based methanol production.
Techno-economic factors• In the short run, biomethanol suffers from the same problems as many
renewables in that it is more expensive than other sources of methanol.In other words, making biomass gasification cost-competitive has provento be difficult.
• Production costs of biomethanol are highly sensitive to local conditions,such as feedstock type and price, electricity mix and prices, scale ofproduction capacity.
• Energy density (by weight or volume) is one half of that of gasoline and24% less than ethanol.
• Strong competition by natural gas (fossil but better than crude oil) andCO2-based methanol.
• Production process is complex.
Environmental factors• The main environmental advantage of methanol from biomass is the uptake
of atmospheric CO2 in the plant growth phase.• Conversion of CO2 to methanol provides a possible route for using waste
CO2 from industrial processes that is attractive to both government andindustry.
Environmental factors• Current policies for CO2 accounting only consider the on-site emissions for
the chemical sector and do not accurately reflect environmentaladvantages of bio-based chemicals.
• Careful consideration of sustainability of biomass feedstocks usedBased on [11,12]
24

Potential and Barriers (continued)
Opportunities IssuesMarket factors• Chemicals coproduction can also improve economics and energy
efficiency. Bio-methanol can be co-produced along with hydrogen,bioethanol and urea.
• A significant increase is expected in the production of:• Formaldehyde, driven by the expansion in polymers and resins
particular in Asian markets. • Olefins (methanol-to-olefins (MTO)/methanol-to-propylene
(MTP) processes) in the last few years, particularly in China (coal-based).
• Dimethyl ether (DME), also especially in China. • Gasoline/fuel/biodiesel, especially in Europe.
Market factors• A higher demand for bio-based fuels and materials could lead to the
conversion of food plantations to bio-ethanol production withincreasing food prices. This risks negative environmental and socialimpacts on developing countries.
• Several industry sectors (e.g. transportation fuels, power generationand the chemical industry) might compete for the availability ofbiomass feedstock.
Based on [11,12]
25

4. Smart drop-in chemicals
Smart drop-in chemicals are a sub-group of drop-in chemicals. They are also chemically identical to existing chemicals based on fossil hydrocarbons,but their bio-based pathways provide advantages compared to the conventional pathways. Drop-in chemicals are considered to be ‘smart drop-ins’if at least two of the following criteria apply:
Business cases for the following smart drop-in chemicals are presented in this report:
1. Dodecanedioic acid (DDDA)
2. 1,4-Butanediol
• The Biomass Utilization Efficiency from feedstockto product is significantly higher compared toother drop-ins.
• Their production requires significantly less energycompared to other production alternatives.
• Time-to-product is shorter due to shorter and lesscomplex production pathways compared to thefossil-based counterpart or other drop-ins.
• Less toxic or harsh chemicals are used or occur asby-products during their production processcompared to the fossil-based counterpart or otherdrop-ins.1
Notes:1. Carus et al. (2017). Bio-based drop-in, smart drop-inand dedicated chemicals https://www.roadtobio.eu/uploads/publications/articles/17-12-18-RoadToBio-Drop-in-paper.pdf
26

4.1 Dodecanedioic acid (DDDA)
The traditional production of DDDA is a multi step process from butadiene, which hasseveral steps that require high pressures, temperatures and catalysts. Moreover, thefossil-based production produces 0.2 kg NOx per kg of DDDA. However, DDDA can also beobtained from bio-based sources, such as lauric acid (from palm kernel oil), using yeast toconvert lauric acid into DDDA in a single step.
With the bio-based process only requiring two steps from the palm kernel oil, comparedto the four steps required to obtain DDDA from fossil-based butadiene, DDDA can beclassified as a smart drop-in chemical. Moreover, the production of DDDA poses nohealth issues due to its low vapour pressure (no VOC emissions) and is not genotoxic ormutagenic. The only potential VOC emissions from the process originates from the ethylacetate used for the purification.
Dodecanedioic acid (DDDA) is a long chain diacid, with twelve carbon atoms and acarboxylic acid group on both sides. It is mainly used for the production of precursors ofpolymers, such as polyamide 6,12 (nylon 6,12) or polyesters. It also finds applications inmolding resins, adhesives, and lubricants.
27

Value chain
Fossil-based DDDAFossil-based DDDA is commonly produced in four steps starting from butadiene. In the first process, two equivalents of butadiene enter acyclisation reaction to form cyclododecatriene. A catalyst is needed to prevent the polymerisation of butadiene. The first commercial scale plantreached 90% selectivity in this step at a 18 kton/y scale. The cyclic alkene is then hydrogenated with H2 at 200 °C under 10 to 15 bar to formcyclododecane. The cyclododecane is then oxidized with boric acid to form a mixture of the cyclic alcohol and ketone. Oxidation to the diacid isperformed with HNO3 in a final step.
Bio-based DDDA:The starting material for bio-based DDDA is lauric acid, which is obtained from palm kernel oil. The lauric acid is fermented to obtain DDDA. Thefermentation has been performed by Verdezyne as an aerobic fed batch process with a co-feed of dextrose. The produced DDDA is insoluble in thefermentation broth and thereby easy to separate and purify.
The main application of DDDA is in polymer resins (60%). Next to this, it finds applications in powder coatings, such as anti-corrosioncoatings in the automobile industry, lubricants and adhesives.
Dodecanedioic acid (DDDA)
Lauric acid
Adhesives
Paints, coatings, dyes
Lubricants
Feedstock Key Derivatives Application
15%
8%
Fermentation
Nylon 6,12; polyesters 64%
ResinsButadiene
8%
Cyclododecatriene CyclododecaneCyclododecanol/ Cyclododecanone
Other (e.g. fragrances)5%
28
Fossil feedstock
Key chemicalBio-based feedstock

Demand
The demand for DDDA in Europe was >10 ktonnes/yr (2014) and is expected to continue togrow, due to the expected growth in its applications sectors (such as adhesives, nylon 6,12,paints and powder coatings). Pressure on the paint industry to reduce the amount of volatilecompounds is an opportunity for DDDA. 36%
17%10%
18%
19%
Global DDDA market
APAC USA Other North America Europe Other
0
5
10
15
20
25
30
2014 2030
Vo
lum
e (k
ton
/y)
European demand
CAGR = 5.5%
Resins are the most important use of DDDA, accounting for 64% of DDDA demand. This isalso the market where bio-based DDDA is expected to have the largest appeal. It isexpected that bio-based DDDA will contribute 30% to the total DDDA market.
The growth in DDDA markets is strongest in APAC and North America. The DDDA marketin the EU is only expected to see a modest growth, due to the small growth of nylon inthe EU. Overall, there is an established DDDA market with a lot of room for growth.
29

9%
9%
34%
49%
Evonik
Ube
Cathay
Invista
Global supply of DDDA (2010)
Supply
The currently installed fossil-based DDDA production capacity is unclear. However,numbers from 2010 give an indication of the top players for the fossil-based DDDAsupply. Most producers (e.g. Invista, Ube, Evonik) use the multi step process frombutadiene, whereas Cathay uses biotechnology processes with fossil-based startingmaterials. It should be noted that since the publication of these numbers Invista closedtheir DDDA plant in Texas in March 2016.
The bio-based production of DDDA is currently at TRL 8, with the first bio-based plantunder construction in Malaysia by Verdezyne. However, with the withdrawal of one of theinvestors, Sime Darby, Verdezyne had to stop operations in May 2018. Their plant wouldbe the first large scale bio-based production of DDDA with a capacity of 6 ktonnes/year,which was expected to be expanded to over 10 ktonnes/year. Cathay is involved in bio-based DDDA as well, aiming to convert their fossil-based bioprocess to one based on bio-based feedstocks.
30

Cost and environmental performance
There is still a large price gap between fossil-based and bio-based DDDA. Where fossil-based DDDA costs 3.5 to 4 €/kg (estimation from Cathay in 2011), bio-based DDDA costsmore than 5 €/kg (according to Verdezyne in 2017 and Mills 2018).
Using palm kernel oil reduces the costs for feedstock. This feedstock only costs around0.6 €/kg, whereas the butadiene required to produce DDDA from fossil feedstocks has aprice of nearly 3 €/kg.
The breakdown of the bio-based DDDA costs is based on Mills 2018, who estimates that aminimum price of DDDA of 4.9 €/kg is required in order to break-even. Assuming a life-time of the plant of 15 years with a production capacity of 14 kton/year.
The breakdown of the costs of fossil-based production of DDDA is based on theestimations from Cathay on both butadiene price and the price of butadiene basedDDDA. Assuming the ROI is 25% of the total DDDA cost.
In terms of environmental performance, there is no reliable evidence in the literatureabout GHG emissions savings from bio-based DDDA. However, the bio-based route toDDDA takes place in only one fermentation step from its feedstock, and thereby has amuch lower environmental impact (for example, in terms of NOx emissions) than thefossil production, which requires four conversion steps.
31
Production costs

SWOT analysis
Strengths
• Well known fermentation process ready for scale up.• DDDA is used in household and consumer goods, for which
there could be a demand for bio-based products.
Weaknesses
• DDDA is a small market (total demand of 10 ktonnes/yr in 2014), which does not have a high impact on the total CO2
emissions.
Threats
• The social acceptance of products that originate from (a co-product stream of) palm oil is low.
Opportunities
• 18% of the DDDA market is in Europe.• The markets where DDDA is used are expected to grow.
32

Opportunities IssuesTechno-economic factors• The market for bio-based nylons is expected to grow rapidly. This growth in
demand is expected to be challenging to meet with fossil supply. The gapcould be bridged with bio-based feedstocks, such as bio-based DDDA.
• The technology of bio-based DDDA production is well known and is ready forscale up to large production facilities.
• The successful production of long carbon chain diacids opens the possibilityto produce other long chain diacids via fermentation. This clears the way fornew products with new properties and applications.
Techno-economic factors• The scale up to multiple ktonne scale has proven difficult (too expensive
and uses palm oil), which is exemplified by the recent attempt byVerdezyne. The construction of the plant was interrupted when one of theinvestors backed out of the project in May 2018.
Environmental factors• As a smart drop-in, the bio-based route to DDDA takes place in only one
fermentation step from its feedstock. This saves many steps, and thereby hasa much lower environmental impact (for example, in terms of NOxemissions) than the fossil production, which requires four conversion steps.
Environmental factors• The use of palm kernel oil, even though it is often presented as a waste
stream from the palm oil production, is associated with deforestation byunsustainable palm oil production.
Potential and Barriers
33

4.2 1,4-Butanediol (BDO)
1,4-Butanediol (BDO) is today commercially produced from fossil feedstock and from renewable (bio)feedstock. Fossil based production remains dominant on the market although new capacities of bio-based1,4-BDO are planned in Europe, North America and Asia.
The largest consumption of BDO is for tetrahydrofuran (THF) used as a monomer in the production ofpolytetramethylene ether glycol (PTMEG), which is used in the manufacture of polyurethane fibres(Spandex), cast and TPU elastomers, and high-performance copolyester-polyether elastomers. Thesematerials are used in various sectors such as clothes, sportswear, automotive, aviation, etc.
Other important derivatives of BDO are: gamma-butyrolactone (GBL) used as solvent in paint strippers,circuit board cleaning products, and the production of herbicides and pharmaceutical products;polybutylene terephthalate (PBT) used for production of electrical and automotive components andpolybutylene succinate (PBS) used for biodegradable packaging [1].
34

Value chain
Glucose
1,4-Butanediol
GlucosePBT
THF
High performance resin for automotive and electronic components
Solvent for cleaning
PTMEG – Spandex & elastomers
Feedstock Key Derivatives Application
50%
14%
25%
Fermentation
Fermentation Succinic Acid
Hydrogenation GBL
PBS <1%
Biodegradable packaging
Acetylene Formaldehyde
ButynediolHydrogenation
Propylene OxHydroformylation
4-OH ButyralHydrogenation
Fossil based BDOBDO is produced from different fossil feedstock including acetylene, butadiene, maleic anhydride, propylene and propylene oxide. Historicallyacetylene-based production (Reppe process) is the most embedded into the BDO industry. Over 40% of fossil-based BDO is produced via Reppeprocess where acetylene is reacted with formaldehyde to form butynediol which then undergoes high-pressure hydrogenation to form BDO.Acetylene, maleic anhydride and propylene routes are popular in China and Middle East, while in Europe and the US the most popular route ispropylene oxide. [2]
Bio-based BDOBDO can be produced from renewable feedstocks, either via a one-step direct fermentation of glucose, or a two-step process consisting of the initialglucose fermentation into bio-based succinic acid and subsequent conversion to BDO through conventional hydrogenation. Both processes arecommercially available.
8%PU
Lightweight and durable parts for the automotive, construction and electronics
35
Fossil feedstock
Key chemicalBio-based feedstock

Demand
In 2016 the global market for BDO was at about 2,000 kta. Relatively little BDO is sold on themerchant market and most is consumed as intermediate. BDO demand is mainly driven bytextile, construction and automotive industry for growing China and developing marketconsumption. Rising health, fitness, and sports awareness has driven the demand for flexible,yet comfortable athletic & sportswear, contributing positively to BDO consumption for spandexfiber application. With the rising consumption of lightweight and durable parts for theautomotive, construction and electronics sectors, polyurethane (PU) emerged as another fast-growing application.[1]
The highest demand growth is expected in China and South-East Asia which is mainly driven bythe rapid growth of spandex, PBT and PU production. Developed regions such as North Americaand Europe may grow at lower rates, owing to end-use industry saturation and downwardrevision of GDP.[6]
Increasing environmental concerns, especially in Europe and United States are likely to favourbio-based BDO demand in these regions. Growing use of sustainable fibers and reducing carbonfootprint of clothing is a major opportunity and driver for bio-based BDO. Oher factors whichmay favour bio-based BDO include price volatility and high manufacturing cost of fossil derivedBDO.
The pricing trends for 1,4-butanediol basically follow raw material prices such as for propylene,butadiene, n-butane, or maleic anhydride, which in turn are related to feedstock costs for crudeoil, natural gas, or coal. However, the supply/demand balance also plays a role in pricing; 1,4-butanediol prices were lower in 2015 because of significant world overcapacity. [5]
41%
22%
16%
12%9%
1,4-Butanediol regional demand (2016)
China
Other Asia
United States
Western Europe
Other regoins
CAGR 7.7%
0
500
1000
1500
2000
2500
3000
3500
4000
4500
2016 2025
Globaldemand (kta)
36

Supply
BDO industry is moderately consolidated. In 2016 about 50% of total BDO was supplied by 5 topplayers, almost entirely produced from fossil feedstock. [7] The most important producers inEurope are BASF, in Ludwigshafen, Germany; LyondellBasell in Botlek, Netherlands, and Ashland inMarl Chemical Park, Germany, in total supplying about 415 kta of BDO. BASF and Ashland produceBDO via acetylene route while LyondellBasell used propylene oxide feedstock.
Production of bio-based BDO is commercially proven and currently available at TRL 8-9. Since2016, Novamont is producing in Italy about 30 kta of bio-based BDO by direct glucosefermentation route developed and licensed by Genomatica. BASF has licensed Genomatica’s bio-BDO technology and plans for a commercial production if market demand is present. BASFconsider building a 50 kta bio-based BDO. Other companies working on the development of bio-based BDO are Bio Amber and Myriant, both technologies are based on conversion of bio-basedsuccinic acid to BDO.
18%
14%
6%
5%
5%
53%
Darien
BASF
Lyondell Basell
Ashland
Xinjiang
Other (mostly Asia)
Global supply of 1,4-Butanediol (2016)
16%
84%
European 1,4-Butanediol supply capacity
Bio-based BDO
Fossil BDO
37

Cost and environmental performance
Cost of production via fermentation is 15-30% lower than fossil and competitive at low oilprices of $45/bbl range. Once fermentation route technology achieves scale, significant cost-advantages relative to petroleum-based BDO are expected. [8]
In 2016, Novamont reported investing €100 million to build the bio-based BDO plant of 30 ktacapacity in Italy. This sum is generally considered to be low compared to plants that producechemicals from fossil fuels, even more so since it is a first-of-its-kind plant. [10]The fermentation process is energy-intensive and there is likely to be an opportunity toimprove efficiency and further cut costs through process optimization and innovation, furtherimproving the competitive edge of the bio-based BDO.
Furthermore, development of new and higher value downstream products, such aspolyurethanes for lightweight and durable parts for the automotive, construction andelectronics sectors, which could outperform conventional plastic, is another opportunitywhere bio-based BDO could potentially feature and grow.
In terms of environmental performance, bio-based BDO can offer significant GHG emissionssavings compared to fossil route - > 70%
0
500
1000
1500
2000
2500
Bio-based 1,4 BDO Fossil 1,4 BDO
Production costs bio-based vs. fossil 1,4-Butanediol [€/tonne] (2016)
Feedstock Operating cost
Depreciation @5% G&A
Estimated production cost are for fossil and bio-based 1,4 butanediol plant of about 60 kta.
38

SWOT analysis
Strengths
• Bio-based 1,4-BDO has potentially lower production costs than fossil 1,4-BDO
• Bio-based 1,4-BDO offers potential to be more sustainable than fossil 1,4-BDO
Weaknesses
• The relative small market in the EU
Threats
• Glycol market is very competitive• Succinic acid has a high value, so it may not make economic
sense to go further than succinic acid• THF (the main product from BDO) is under pressure due to
health and safety (of the THF compound)
Opportunities
• There might be an opportunity in the packaging industry if bio-based PBS takes off. Expected growth in PBS market should be investigated (no knowledge of this in the audience)
• There are also routes via benzene and butane to make BDO
39

Opportunities IssuesTechno-economic factors• Bio-based 1,4-BDO is cost competitive at industrial scale• Growing demand for sustainable fibre in Europe and US are like to favour
the production of bio-based 1,4-BDO• Looking into other feedstock options which are more sustainable such as
sugars from lignocellulosic biomass may represent the opportunity tofurther improve cost competitiveness of 1,4-BDO
Techno-economic factors• For European production of bio-based 1,4-BDO the biggest challenges are
end-use industry saturation and low oil price. New capacities of fossil andbio-based 1,4-BDO are built mainly in Asia which is also home to most ofthe end-use industries e.g. textile, automotive, footwear.
• Lack of downstream integration with the end-use industry particularlywith textile and footwear industries which are mainly outside Europe, arelikely to limit the demand of bio-based and fossil 1,4-BDO in EU.
• 1,4-BDO price is still affected by supply/demand balance• Bio-based 1,4-BDO is not produced at commercial scale
Environmental factors• Bio-based route has significant reduction of GHG emissions compared to
fossil route - above 70%
Environmental factors• The 30,000 tonnes of bio-BDO produced by Novamont requires 100,000
tonnes of glucose syrup, which is used in the food industry and needsagricultural land to be produced. Although the volumes of bio-based BDOand other chemicals are still small, risks associated with an increase indemand in feedstock need to be considered.
Potential and Barriers
40

5. Dedicated chemicals
Dedicated bio-based chemicals are chemicals which are produced via a dedicated pathway and do not have an identical fossil-based counterpart.1
Business cases for the following dedicated chemicals are presented in this report:
1. Polyhydroxyalkanoate - PHA
2. Polyethylene furanoate - PEF
3. Lactic acid
4. Furfural
5. Glycerol
Notes:1. Carus et al. (2017). Bio-based drop-in, smart drop-inand dedicated chemicals https://www.roadtobio.eu/uploads/publications/articles/17-12-18-RoadToBio-Drop-in-paper.pdf
41

5.1 Polyhydroxyalkanoates (PHA)
The material was first commercialised in the 1980s. However, many companies quitproduction in the 90s as the oil price went down. The struggle in the early development ofPHA is a result of its high price. Especially for early applications, which were mostly aimed atpackaging, PHA could not compete in price with the commonly used fossil-based polymerssuch as polypropylene, polyethylene, polystyrene and polyethylene terephthalate.
Since the mechanical and physical properties of PHA can be tuned, and because of theexcellent biodegradability, PHA is still seen as a promising bio-based polymer that can replacea large share of fossil-based polymers currently used. It is expected that, potentially with ashift to cheaper feedstocks, the polymer will grow from niche applications, such as bio-implants, use in tissue engineering, and cosmetics to larger scale applications, such aspackaging and, in the form of blends, in foams and fibres.
Polyhydroxyalkanoates (PHA) are a family of linear polyesters that are naturally produced bynumerous microorganisms. Microorganisms produce PHA when excess of carbon is availableas a buffer for periods with less available resources. There are many types of PHAs,depending on the monomer that the PHA is built of. Common forms of PHA are polymers ofhydroxybutyrate (PHB) and hydroxyvalerate (PHV) or a mixture of the two in PHBV. Theproperties of PHA are dependent on the type of PHA being produced, where the ratio inmonomers determines the final polymer properties.
42

Value chain
Fossil based plasticsEarly versions of PHA were expected to compete with polypropylene, especially for use in packaging and disposable products. Thetargeted applications for PHA shifted towards more high-end applications such as cosmetics (micro-beads) and health care (tissueengineering, bio-implants).
Value chain summaryPHA is originally produced by fermentation of glucose. However, current trend in the production of PHA is to move towards lower coststarting materials, such as agricultural residues. The range of potential feedstock for PHA production is huge, where sugars, such asglucose and fructose, can be used as well as fatty acids. Waste streams from the pulp and paper industry, municipal waste streams,methane, and genetically modified plants have been used as well for PHA production on pilot scale. A difference with otherfermentations is that PHA resides inside the cells of the bacteria, which means that the down-stream processing is more challengingand costly.
PHA
Sugar
PHA granulate Cosmetics – biodegradable microbeads
Feedstock Key Derivatives Application
Fermentation PHABiodegradable packaging, disposable products, health care applications
Agricultural residues
Fermentation PHA blends
Blown films, fibres, foams, injection moulding
43
Key chemicalBio-based feedstock

Demand
PHA constitutes a small share of the total bio-based plastics market. Currently,PHA is used in food packaging on a small scale. The targeted high-end uses,such as microbeads in cosmetics (EU demand 4 ktonnes/yr) and medicalimplants (EU demand 12 ktonnes/yr) have relatively small production numbersas well.
Applications that open up larger markets include coatings for fertilisers thatenable controlled urea release (PHA market demand of 2 to 8 milliontonnes/yr). With a decrease in production cost, PHA is believed to potentiallyreplace 50% of the fossil packaging market due to its biodegradable nature.This would enable PHA to replace part of the polyethylene and polypropylenemarket, with a potential demand of 10 million tonnes/yr.
CAGR = 4.8%
1
10
100
1000
10000
Microbeads Medicalimplants
Fertilisercoating
Packaging
Potential EU demand (kta)
0
5
10
15
2017 2030
EU demand (kta)
44

22%
3%
3%
9%
9%
9%
45%
0% 10% 20% 30% 40% 50%
Other (mostly China)
PHB Industrial
Kaneka
TianAn Biologic Materials
Tianjin GreenBio Material
Meredian
ADM
Global supply of PHA
Supply
The current supply of 2.3 kton/y PHA in the EU is provided by Kaneka and Newlight. Thisis only a small part of the global PHA production, which takes place mostly in the US andChina. Examples of major global players are ADM, Meridian and Tianjin Green Bioscience.
Production capacity for PHA is growing rapidly using the available waste streams fromsugar beet agriculture. The capacity of Kaneka is expected to grow from 3.5 kton/y to 12kton/y in 2020. Moreover, Bio-on is constructing a plant with a potential capacity of 2kton/y in Italy.
PHA production based on sugar is well-known, but had many unsuccessful start ups in the90s. Other systems, that use alternative feedstocks, processes and/or purificationtechniques, are still being developed (TRL 6 - 8) and many pilot projects can be found inthe EU.
2%
57%
41%
Global PHA production (tonne/yr)
EU Americas Asia
45

Cost and environmental performance
Current PHA production has feedstock cost and downstream processing (DSP) costs as majordownsides. The sugar feed contributes 40 to 50% of the total PHA cost of €4 to €5 per kg.Switching to other feedstocks can significantly bring down the production cost of PHA.
Several cost estimations show the opportunities in cost reduction by switching to
• Wastewater (estimated cost of €1.99 to €2.46 per kg): Major cuts in production cost areachieved by using cheap feedstock such as wastewater rather than sugar.
• Biogas (estimated cost of €0.95 per kg): Major cuts in production cost can be achievedvia lower utility costs.
In summary, the biogas route compared to both sugar-based and wastewater-based PHAroutes appears to be the most attractive in terms of cost competitiveness.
Expensive DSP remains a bottleneck for cost efficient PHA production. However, price rangesin the order of fossil plastics (€1 to €2 per kg) are within reach.
In terms of environmental performance, PHA are biodegradable polymers that can offer GHG savings from 20% with starch feedstocks to 80% with sugarcane and 90% with lignocellulosic feedstocks.
0
1
2
3
4
5
6
Sugar Wastewater
Co
st (
€/k
g)
Sugar and wastewater based PHA
Feedstock DSP other
0
0.5
1
1.5
2
2.5
3
Biogas Wastewater
Co
st (
€/k
g)
Biogas and wastewater based PHA
Materials Labour Depreciation Utilities Other
• Sugar case based on Kootstra 2017, with DSP calculation from Dacosta 2015
• Wastewater case based on Dacosta 2015, DSP with halogenated solvent, no cost reduction for prevented wastewater treatment
• Biogas case based on Criddle 2014, DSP with SDS-hypochlorite, 10 kton/y scale
46

SWOT analysis
Strengths
• Marine biodegradability
Weaknesses
• Specialised equipment required for processing• High production costs due to the expensive downstream
processing• Competes with PEF
Threats
• Introduction of a product produced from waste is challenging due to regulations (e.g. Waste Framework Directive)
• Unsuccessful history of sugar-based PHA
Opportunities
• Many large or high value potential markets for biodegradable polymers (packaging, medical implants, cosmetics, fertilizer coatings, mulch films)
• Use of waste streams as feedstock could result in cheaper production
47

Opportunities IssuesTechno-economic factors• PHA can be obtained from many biomass feedstocks, as long as they contain
carbon that can be used by microorganisms. This means that PHA couldpotentially be produced from waste streams that have no or little value,such as municipal waste or agricultural residues.
• Many PHA-processes from waste streams are currently tested at pilot scale(e.g. BioBarr and P4SB in Horizon 2020, AFTERLIFE within BBI).
• There are many potential markets for PHA that can take advantage of itsbiodegradability. Examples include the use in medicine as implants, the usein cosmetics as a replacement for microbeads, or as coating for fertiliser thatenable a slow release of the fertiliser.
• The properties of PHA can be tuned by controlling the ratio of butyrate andvalerate monomers.
Techno-economic factors• PHA produced by microorganisms ends up inside the cells as polymer
granules. Together with the low concentration of the product, this makesthe downstream processing difficult and expensive.
• The melting point of PHA is close to its degradation temperature. Thisgives a very narrow processing window that requires specialisedknowledge and equipment.
• The properties of PHA are dictated by the ratio of butyrate and valerate.By utilising waste streams, this parameter is difficult to control andconstant quality can not be guaranteed.
• There is still no commercial process for the production of PHA from wastestreams and the current production is done on fermentation from sugars.
• The biodegradable and brittle nature of PHA makes them unsuitable forapplications with long-term use.
Environmental factors• PHAs are receiving a lot of attention due to excellent biodegradability. It is
one of the few materials that are fully marine biodegradable, which is animportant quality for tackling the plastics issue.
Environmental factors• Careful consideration of sustainability of biomass feedstocks used
Potential and Barriers
48

5.2 Polyethylene furanoate and terephthalate (PEF, PET)
Polyethylene furanoate (PEF) is an aromatic polyester formed by the polymerisation of FDCA (2,5-Furandicarboxylic acid) and MEG (monoethylene glycol). PEF is recyclable and is a 100% bio-basedalternative to PET (Polyethylene terephthalate). [1,2]
The current focus is on using PEF as a replacement resin for PET beverage bottles. However, PEFfilm and fibre can also be used in applications such as food packaging, and carpets, textiles. PEFproduction is still at pilot scale but has garnered interest from key customers such as Coca-Cola,Danone, and ALPLA. [1,4]
Polyethylene terephthalate (PET) is a thermoplastic polymer resin and the most commonly usedpolyester. It is produced from MEG (monoethylene glycol) and either purified terephthalic acid(PTA) or dimethyl terephthalate (DMT). PET can be made into a resin, fibre or film and has goodprocessability allowing it to be recycled repeatedly into many new products, as well as returned toits constituent monomers. The largest application of PET is for the production of polyester fibre(filament and staple), followed by packaging resin production. Currently PET film is mainly used inpackaging applications. It is also used in magnetic or adhesive tapes, and a new application in PV(photovoltaic) cells is growing rapidly. [3]
49
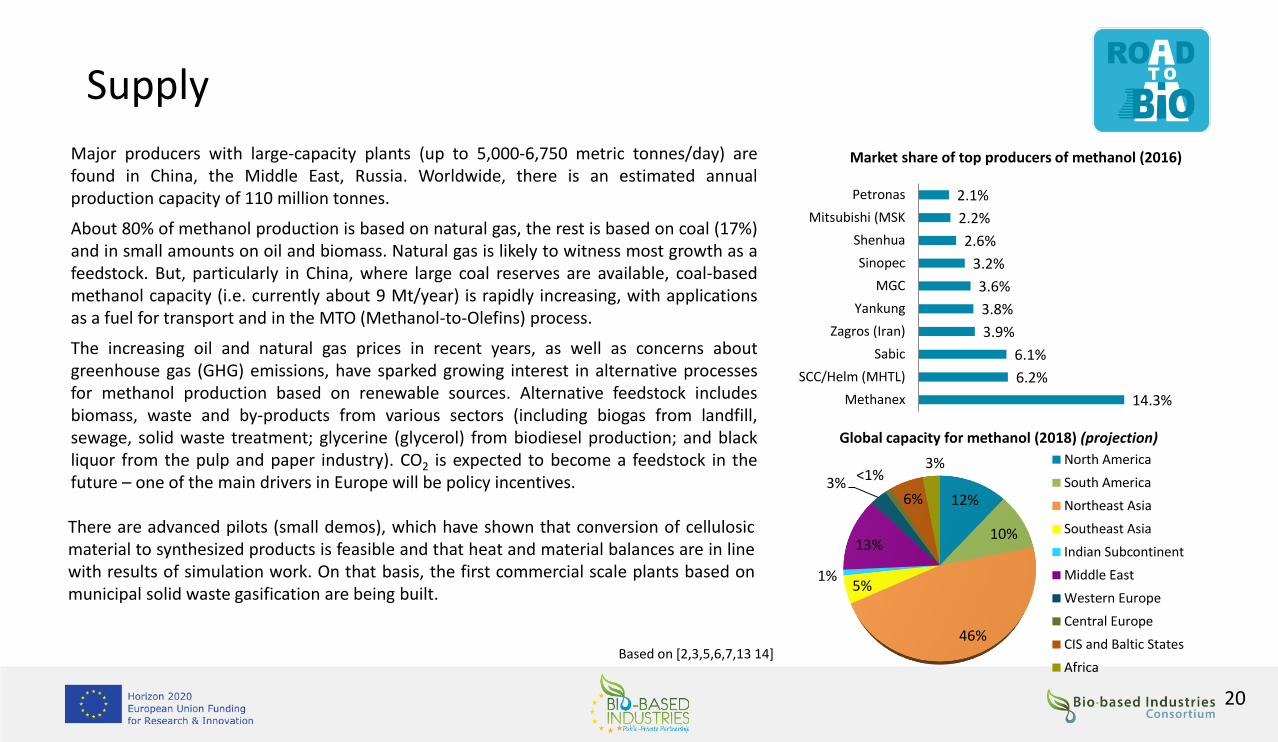
Value chain
Polyethylene furanoate (PEF) Film Food packaging
Carpet facing, textiles
Feedstock Key Derivatives Application
Fiber
PEFPEF can be produced from renewable feedstocks by a multistep process that involves catalytic dehydration of carbohydrate feedstock in an alcohol(e.g. methanol) to make alkoxymethyl furfural (RMF). This is followed by catalytic oxidation of RMF in acetic acid to make FDCA. Finally,polymerisation of FDCA and MEG is carried out to form PEF. This is a patented process by Avantium, known as the YXY technology, and has beentested at pilot scale. [5]
Resin Water and beverage bottles
Sugar (Fructose)
Dehydration Alkoxymethyl-Furfural (RMF)
Oxidation 2,5-Furandicarboxylic
acid (FDCA)
Polymerisation
Monoethyleneglycol (MEG)*
50
Key chemicalBio-based feedstock*Derived from bio-based or fossil-based ethylene
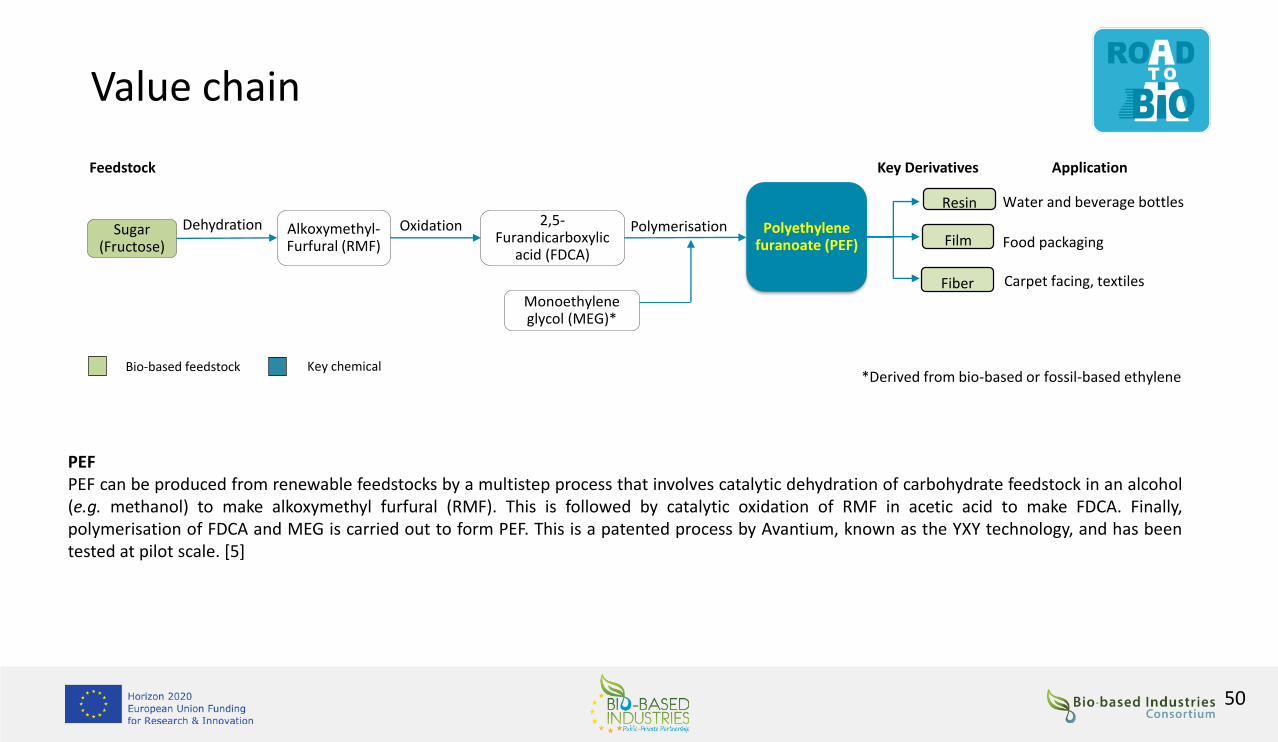
Value chain (continued)
PETPET can be produced from MEG (monoethylene glycol) and either purified terephthalic acid (PTA) or dimethyl terephthalate (DMT). The mainprocess steps are raw material preparation, esterification/transesterification, pre-polycondensation and polycondensation.
PTA is preferred to DMT as the PTA process eliminates the need to recover methanol while having the added advantage that esterification to thepre-polymer step is faster that the transesterification reaction using DMT. However, DMT may be favoured in polyester film applications due itsadhesion addition quality. [3, 6]
PTA
DMT
Or
+
+
MEG*
MEG*
Catalyst
Catalyst
Esterification process
Transesterificationprocess
Pre-polycondensationprocess
Polycondensationprocess
Polyethylene terephthalate
(PET)Film
Chip
Fibre, filament
Resin
Other polyester
49.6%
2.4%
15.2%
2.3%
51
FeedstockKey Derivatives Application
Key chemicalFossil feedstock
*Derived from bio-based or fossil-based ethylene
30.5%Bottles, containers for FMCG products
Textiles
Packaging film; video, photographic and X-ray film
Bottles, polyester fibre

0
2
4
6
8
10
12
14
16
18
2016 2022
Demand (kta)
Demand
PEF
Global PEF market is at a nascent stage of development. Global demand was close to 12 kta in2016 and is expected to grow to nearly 17 kta in 2022. [9,10] The PEF market in the Netherlandswas around 223 tons in 2016 and is expected to expand at a CAGR of 8.8% in the 2016-2022period. [10] Although PEF market volume was led by the Asia Pacific region in 2016, Europe islikely to emerge as the most promising region (CAGR of 7%) in terms of volume. Stringentregulatory standards and increasing demand for sustainable packaging are anticipated toaccelerate PEF market growth over the forecast period. Demand for PEF is mainly in the packagingof beverages, that is, PEF-based bottles as an alternative to fossil-based PET bottles.
PEF faces strong competition from bio-based PET. A recent study suggests that of 6.1 million tonsof bioplastics that could be produced in 2021, 1.1% will be PEF while 28.2% will be PET. [11] CocaCola has been supporting Virent since 2011 for R&D in producing p-Xylene from sugarcaneresidue, which in turn can be oxidized to PTA for use in the conventional production of PET.[4] Thefully recyclable and 100% bio-based plastic bottle has been marketed as PlantBottle™. Prior to thepartnership with Virent, the PlantBottles were made of 30% bio-based material (bio-MEG). As of2017, PlantBottle™ packaging is used in 6 billion bottles every year worldwide.[7,8]
PEF also competes with polytrimethylene furandicarboxylate (PTF) polymer. DuPont is focusing onthe production of the PTF which is similar to PEF. PTF can be used for the manufacture ofbeverage bottles and other applications currently served by PET. The monomer they plan to use isfuran dicarboxylic methyl ester (FDME), a derivative of FDCA. The process was developed inpartnership with ADM (US-based agricultural processor). [15] DuPont and ADM opened a 60 tpapilot plant for producing FDME in 2018. [16]
CAGR 6%
48%
25%
15%
12%
PEF regional market volume (2016)
Asia Pacific
Europe
North America
Rest of the world
52

0
10000
20000
30000
40000
50000
60000
70000
80000
90000
2014 2019
De
man
d (
kta)
Other polyester
Chip
Film
Staple fiber/textilefilament/industrialfilament
Demand (continued)
PET
Global consumption of PET reached 60,828 kta in 2014 and is expected to be wellover 76,000 kta by 2019, with the market expanding at a CAGR of 4.8% in theforecast period. Demand for PET is highest in Asia. The staple fibre (used for fillingsin pillows and sofa), textile filament (used in producing fabrics and textiles) andindustrial filament (used in making tyre cord, car safety belts, conveyor belts)segments together make up more than half the demand for PET globally. Solid stateresin, which is used to make bottles and containers, is the next segment that is inhigh demand. [4]
The solid state resin segment is of interest for PEF producers such as Avantium whointend to produce a PEF bottle-grade resin that can substitute PET bottle-graderesin. Global consumption of PET bottle resin was estimated at 19.4 million tons in2015, and is expected to grow at a rate of 5% per annum. [4]
CAGR 4.8%
53
64.8%6.5%
9.7%
7.9%
1.3%
3.4% 0.2%
1.6% 0.5%
4.1%
PET regional demand (2014)
Northeast Asia
Southeast Asia
Indian Subcontinent
North America
South America
Western Europe
Central Europe
CIS & Baltic States
Africa
Middle East

Supply
PEF production is at a nascent stage and involves the following companies:
Avantium, Corbion, Toyo Seikan Kaisha, AVALON Industries, Origin Materials (not an exhaustive list)
Synvina is a Joint Venture of Avantium and BASF, located in Amsterdam, and operates a pilot plant in Geleen (in the Netherlands). Synvina producesand markets furandicarboxylic acid (FDCA) from renewable resources on pilot plant scale and markets the new polymer polyethylene furanoate(PEF). [12] The pilot phase has been extended in order to improve the production process. [13]
Coca Cola, Danone and ALPLA have Joint Development Agreements with Avantium for development of PEF bottles based on Avantium’s ‘YXYtechnology’. [17] Further, Wifag-Polytype and Avantium are collaborating on producing 100% bio-based PEF thermoformed products such as cups,containers and trays. [18] In 2016, Avantium established a partnership with Toyobo for PEF polymerization and PEF films. [21]
Corbion is developing 100% biobased FDCA for PEF. [19] The process is at pilot scale and a toll manufacturer has produced several tonnes of HMFusing this process. [20] This HMF has been used to produce FDCA at the Bioprocess Pilot Facility in Delft. [20]
AVALON Industries’ 5-HMF (5-Hydroxymethylfurfural) platform chemical is the key molecule for bio-based plastics like PEF. The AVALON HTPtechnology uses C6 sugars to produce 5-HMF in crystalline form or in aqueous solution. [22]
US-based Origin Materials aims to make competitively priced FDCA from lignocellulosic feedstocks. It acquired technology from Eastman Chemicalfor making FDCA from sugar, and also purchased an Eastman oxidation pilot plant. The company has partnerships with Danone and Nestlé todevelop biobased monomers for bottles. [15]
In 2017, the European Joint Undertaking on Bio-Based Industries (BBI) granted €25 mn to “PEFerence”, a consortium of eleven companies includingSynvina, BASF and Croda*. The grant supports the establishment of an innovative value chain for bio-based raw materials as well as chemicals andmaterials based on polyethylenefuranoate (PEF). It includes the intended construction of a 50 kta FDCA reference plant, the main chemical buildingblock for PEF. Synvina will be coordinating the “PEFerence” project. [14, 23]
54

Supply (continued)
PET
As of 2014, the total capacity for PET polymer production in Europe was >3.6million metric tons, which represented > 4% of the total global capacity. [4]
The most important producers in Europe are Indorama Ventures (PTA productionin the Netherlands, Spain, and Portugal; PET production at 6 locations), NeoGroup (PET production: Lithuania), Novapet (PET production: Spain), Invista (PETproduction: Germany), Equipolymers (PET production: Germany), Lotte ChemicalUK Ltd (PET production: UK), PlastiVerd (PET production: Spain), JBF Global (PETproduction: Belgium), and Polisan Hellas SA (PET production: Greece). [24]
As of 2015, over 360 kta of PET was being imported from South Korea, Indonesiaand Turkey. [25]
PET recycling has been given priority in the EU, and as of 2016 nearly 60% of allPET bottles and containers placed in the European market were collected(1,880.9 kt) and 1,773.2 kt were mechanically recycled. [26] 0 500 1000 1500
Indorama ventures PCL
JBF Global
Lotte Chemical UK
Equipolymers
Neo Group
Invista
Novapet
PlastiVerd
Polisan
PET production by major players in Europe
Avg. annualcapacity (kta)
55

Cost and environmental performance
Currently PEF production costs are more than double those of PET, which is mainly because of highoperating and capital expenditures of PEF manufacturing. PEF is still produced on a small scale andit has not gone through the decades of learning that PET production has. Gradual increase in PEFproduction capacities is likely to create an opportunity to improve process efficiency and bringdown capital and operating costs.
Higher value applications where consumers are prepared to pay extra for advanced performanceof PEF over PET are likely to drive the initial demand growth and PEF production scale. This willenable PEF to reach the next level of applications at which point the bio-based polymer starts tobe produced on a larger scale.
Another opportunity to bring down PEF production cost is to switch to cheaper feedstock. TodayPEF is mainly produced from fructose which gives high yields to FDCA. Isomerization of glucose tofructose is economically limited to 42%, requiring additional and expensive separation steps. As aconsequence, the final market price of fructose is significantly higher than that of glucose. Singlestep conversion of glucose to FDCA, which would eliminate expensive separation steps couldpresent an opportunity to reduce PEF feedstock cost. High yield single-step conversion of glucoseto FDCA has already been successfully demonstrated on a lab scale. Investments are needed forfurther development of this technology and demonstration at commercially relevant scales. [32]
Production of PEF from FDCA has environmental advantages, reducing the non-renewable energyuse by 51% - 58% compared to PET, and producing GHG emissions of 1.4 – 2.1 tCO2/ t-productcompared to fossil PET emissions of 3.8 – 4.4 tCO2/ t-product (a saving of approximately 60%).
PEF is not yet produced at a commercial scale. Presented production cost are estimated for a PEF plant of about 150 kta, which is comparable to a medium size PET plant. PEF production cost are estimated for an integrated production process which includes conversion of fructose to FDCA and polymerization of FDCA and MEG into PEF.
56
0
500
1000
1500
2000
2500
PEF PET
Production costs of PEF vs. fossil derived PET [€/tonne] 2018
Depreciation @5%
G&A
Operating costs
Feedstock

SWOT analysis - PEF
Strengths
• Improved functionality vs. PET: better barrier properties and mechanical strength
• PEF is entirely made from renewable feedstock and it is more sustainable than fossil PET
Weaknesses
• Not easily recyclable • PEF is still not produced on a commercial scale
Threats
• Competition with other bio-based polymers e.g. PTF and bio-PET
• Big focus on recyclability in Europe – circular economy
Opportunities
• Development of fully recyclable products • Easily used in higher volume applications – e.g. packaging • Could be used in lesser amount than PET for same product• PEF can be produced in existing PET plants • Switching to cheaper feedstock e.g. glucose vs fructose
could improve PEF’s cost competitiveness
57

Opportunities IssuesTechno-economic factors• A major advantage of PEF compared to PET is the technical superiority. PEF
offers improved gas barrier properties important for food and drinkspackaging as well as tensile strength properties, which makes PEF more thana direct replacement for PET. PEF can in fact be used for applicationscurrently serviced by much more expensive multilayer, aluminium, steel orglass solutions.
• Another major opportunity for PEF is that existing PET polymerisation assetscan be used with minimal capital investment for retrofitting.
• Strong demand for sustainable packaging represents an opportunity for PEFpolymer
• Due to its superior properties PEF polymer could potentially access largemarket by replacing PET, aluminium and glass in various applications.
Techno-economic factors• PEF is still not produced at commercial scale. Production costs are still too
high to compete with fossil derived PET or other materials (aluminum orglass) which this bio-based polymer could replace.
• PEF faces strong competition from other bio-based polymers such as PTFand bio-based PET.
• To feature in circular economy PEF recyclability must be improved
Environmental factors• PEF is entirely made from renewable feedstock and it is more sustainable
than PET.• Low biodegradability.
Environmental factors• Careful consideration of sustainability of biomass feedstocks used
Potential and Barriers
58

5.3 Lactic acid
Lactic acid is used in a wide range of food processing and industrialapplications. Lactic acid has the potential of becoming a very largevolume, commodity-chemical intermediate produced from renewablecarbohydrates for use as feedstocks for biodegradable polymers,oxygenated chemicals, plant growth regulators, environmentally friendly‘green’ solvents, and specialty chemical intermediates.[2]
Lactic acid is commercially available today, however, the differentproduction technologies are at different levels of maturity assummarized in the figure to the right. [14]
Lactic acid exists as two optically active isomers (enantiomers orstereoisomers) referred to as L (+) lactic acid and D (-) lactic acid.Synthetic i.e. petrochemical routes result in a racemic mixture thatcontains each enantiomer in equal proportions. On the other hand,biological routes (fermentation) are designed to produce an opticallypure product.
Source: European Commission
Technology readiness levels for lactic acid production
59

Value chain
Lactic acid
DextroseButyl & Ethyl Lactate
Solvents, personal and homecare products
Feedstock Key Derivatives Application
Fermentation
Polylactic acid (PLA)75% Packaging, food packaging,
biodegradable films Acetylene Hydrogen cyanide
Cyanohydrin
Lactic acid is commercially produced by bacterial fermentation of carbohydrates (sugar, starch) or by chemical synthesis from acetaldehyde, that isavailable from coal or crude oil. Today most of the lactic acid is produced by fermentation process rather than chemical synthesis. This is becausealthough synthetic routes produce a high quality product, they use hazardous raw materials (hydrogen cyanide), have high energy intensity due to tripledistillation, cannot only make the desired L-lactic acid stereoisomer, and overall suffer high manufacturing costs.[1]
The majority of demand is for L-lactic acid. At the lowest level of purification, L-lactic acid is used in animal fodder, in which the residues fromfermentation add value as flavours and nutrients. High purity L-lactic acid is employed as active ingredient for antimicrobial cleaning and personal careformulations. L-lactic acid at the very highest levels of purification is used in cosmetics and pharmaceuticals [11]. D-lactic acid can serve as a buildingblock for PLA polymers used in food serviceware, rigid and flexible packaging, toys, electronics, nonwoven filtration materials, and personal careproducts. [12]
60
Fossil feedstock
Key chemicalBio-based feedstock

Demand
Global demand for lactic acid in 2016 was around 1200 kta and it is expected to growto > 4,000 kta by 2030 at a CAGR of 15.5% [13]. Maximum demand for lactic acid is inAsia, especially China. Demand for lactic acid in Europe was 120 kta in 2016 [13].
The main uses of lactic acid and its derivatives are in the production of foodadditives, personal care products, and biodegradable plastics. There is also a marketfor lactic acid in the manufacture of industrial chemicals and products for themedical and pharmaceutical sectors [11,12,13].
In 2015, highest demand for lactic acid was in food and beverage applications.Polylactic acid (PLA) manufacture was the second-largest end use of lactic acid. It isanticipated that PLA manufacture will be the leading application for lactic acid by2020. [16] Demand for more environmentally-friendly packaging products, and theuse of PLA in starch-based plastics is expected to drive demand for PLA over the nextfew years. [18] Growing application from industrial and personal care may promotelactic acid market size. Lactate ester solvent including butyl lactate and ethyl lactateare biodegradable and non-toxic in nature and provide use in consumer andindustrial applications.
CAGR 16.2%
10%13%
29%
48%
Regional demand
Europe Asia Americas China
0
500
1000
1500
2000
2500
3000
3500
4000
4500
2015 2030
Dem
and
(kt
a)
Global
61

Supply
Lactic acid industry is consolidated. The global market is dominated by Corbion(225 kta; production in the US, Netherlands, Spain, Thailand, and Brazil) andNatureWorks (180 kta; production in the US). Other producers, which havesmaller market share are mainly in Asia.
Technologies for producing bio-based lactic acid and its key derivative PLA, aretoday available at a commercial scale. Companies which specialize indevelopment and licensing of lactic acid and PLA technology include:ThyssenKrupp, Myriant (licensed to Corbion), Plaxica (Optipure D-lactic acidprocess technology licensed to NatureWorks), Hitachi Global.
New capacities of lactic acid and PLA are forecasted for Asia region, whichexpects the fastest growth driven by increasing demand from end user markets.There is no evidence which indicates that new production capacities of Lacticacid or PLA are planned Europe.
However, considering that in Europe there is a growing demand for bio-basedand sustainable plastics, and that Europe is becoming more strict on use andrelease of toxic and non-degradable chemicals in the environment; opportunitycould be large for PLA-based polymers and non-toxic lactic acid-based solventswhich are biodegradable and non-toxic to the environment. Increasing localsupply of lactic acid could potentially meet European market needs and reduceimport dependencies in the future.
22%
24%
19%
11%
9%
8%
7%
Others
Corbion
Natureworks
Hebei Jindan
Shenzhen BrightChina
Chongqing Bofei
Wuhan Sanjiang
Global supply of lactic acid (2013)
62

Cost and environmental performance
Lactic acid is a good example of industry switching from fossil to bio-based. Bio-based productionof lactic acid uses cheaper and safer feedstock: glucose vs. acetaldehyde/hydrogen cyanide, usesless energy and produces optically pure product.
Major derivative of lactic acid is polylactic acid (PLA) polymer which is often used for packaging,food packaging, disposable wipes, etc. PLA is biodegradable plastic, it offers a substantialreduction in GHG emissions (30% -70%) and energy use compared to competing fossilequivalents such as polypropylene (PP), polystyrene (PS) and polyethylene terephthalate (PET).However PLA suffers from performance drawbacks as compared to conventional plastics. Forexample, PLA is brittle, it has poor gas barrier performance and is susceptible to distortion atrelatively low temperatures.
Despite mature manufacturing technology PLA is still not cost competitive option for packaging, itis still more expensive than fossil alternatives that serve similar markets. At the end of 2017polylactic acid was traded at about 2600 €/tonne in Western Europe [17], while PET market pricewas estimated at about 1100 € /tonne.
To improve cost competitiveness, PLA feedstock costs (bio-based lactic acid) and production costshave to be further reduced. At the same time its performance characteristics have to be improvedto be at least comparable to its fossil equivalents PP, PE and PET.
0
500
1000
1500
2000
Fossil LA Bio-based LA
Production costs lactic acid fossil vs. bio-based [€/tonne] (2017)
Feedstock Operating cost G&A Depreciation @5%
Capital costs are estimated for fossil and bio-based processes of about 100 kta. Bio-based lactic acid process assumes sugar feedstock of 380 Euro/tonne
63

SWOT analysis
Strengths
• Nontoxic and biodegradable as a solvent• There are several markets • Lower price than other biodegradable polymers
Weaknesses
• PLA is brittle polymer• To improve performance PLA requires a lot of additives and
plasticizers which can reduce biodegradability and renewability character
• Use in applications other than PLA plastic are still fairly low• No established recycling stream
Threats
• PLA has no advanced performance characteristics compared to other plastics
Opportunities
• Development of fully recyclable process for PLA • Chemical recycling
64

Opportunities IssuesTechno-economic factors• Bio-based production of lactic acid is more cost-effective compared to fossil• Bio-based lactic acid and PLA manufacturing process is mature• PLA could potentially be used in large volume applications replacing fossil
plastics in packaging and food packaging• Strong demand for sustainable packaging represents an opportunity for bio-
based lactic acid and PLA polymer
Techno-economic factors• To feature in circular economy PLA recyclability must be improved• PLA polymer suffers from brittleness, poor gas barrier performance and is
susceptible to distortion at relatively low temperatures (i.e. lower heatresistance). Fossil equivalents such as PE, PP and PET outperform PLA inpackaging and food packaging applications.
Environmental factors• Bio-based lactic acid is more sustainable than fossil based – uses less energy
and it does not use harmful chemicals in the production process• PLA provides GHG emissions savings of between 30 – 70% compared to its
fossil equivalents PE, PP and PET• PLA offers a strong environmental incentive for replacement of fossil
equivalents. It has a lower carbon footprint and uses less energy, and offersimproved end-of-life options because it is biodegradable and low in toxicity
Environmental factors• Careful consideration of sustainability of biomass feedstocks used
Potential and Barriers
65

5.4 Furfural
Furfural, or furfuraldehyde, is a oily liquid, produced by dehydrating xylose, amonosaccharide found in large quantities in the hemicellulose fraction of biomass. Anymaterial with a sufficient amount of 5-carbon sugars (pentosans) can be used as feedstockfor furfural production, though lignocellulosic agricultural waste, such as bagasse, corn cobs,and wheat bran are being used extensively. Furfural is not produced from fossil feedstocks soall current – and presumably future – production is biobased.
Furfural was first produced commercially in 1922 by the Quaker Oats Company. Main reasonfor their furfural production was the large quantities of surplus oat hulls for which they hadno application. Furfural production starts with pre-treatment followed by acid hydrolysis(mainly sulphuric acid) to release the pentoses from the biomass. The next step isdehydration using acid and steam to produce the furfural. The furfural is recovered by steamstripping from the solution. Yields are generally low: about 50% of mono sugars is convertedinto furfural. The traditional Quaker Oats process consumes large amounts of energy andsulphuric acid. More recently, new processes, like the SupraYield technology, are beingdeveloped. Other developments are combinations of furfural production with celluloseethanol production.
66

Value chain
FurfuralLignocellulosicbiomass
Solvents
Feedstock Key Derivatives Application
Hydrolysis followed by dehydration Furfuryl
Alcohol
~85% Resins for foundry moulds (main application)Furan fiber-reinforced plastics, Converted to 1-pentanol (coating material for DVD’s), Wood modification
Value chain summaryFurfural is produced from the pentosans in lignocellulosic biomass. Dedicated productioninvolves hydrolysis with an acid catalyst, followed by dehydration. Furfural can also beproduced as a by-product during the production of cellulose ethanol, or cellulose pulp (forpaper production). Derivatives like furfuryl alcohol are produced via catalytichydrogenation.
Current (dedicated) furfural production is a process characterised by a low yield (approx.50%), high steam use (20-50 tonne of steam per tonne of furfural) and high (sulfuric) acidconsumption (20% of furfural output). New process developments aim to increase the yieldor reduce energy consumption during the purification step.
~7%
~7%Other
Tetrahydrofurfuryl alcohol (THFA) (green solvent used in agriculture, printing ink, cleaners), 2-methyltetrahydrofuran (MTHF) (specialty solvent), Tetrahydrofuran (THF) (solvent for chromatography applications)
2-methylfuran (MF) (feedstock for antimalarial drugs, other intermediate chemicals), Nitro substituted furans are used as biocides or fungicide. Sulphur substituted furans are used as flavouring agent, Cyclopentanone(pharmaceuticals, insecticides, rubber chemicals), Cyclopentanol (perfume, pharmaceutical solvent, intermediate for dyes and pharmaceuticals, Maleic Anhydride (polyester resins used in fiber-reinforced plastics, alkyl resins used in paints and coatings)
67
Key chemicalBio-based feedstock

0
50
100
150
200
250
2016 2030
Demand
Global furfural market demand was 270 ktonne in 2012 and is expected to reach 652.5ktonne by 2020, growing at a CAGR of 11.9% from 2014 to 2020. The European market has aslightly slower growth with a CAGR of 10.3%. Reasons for this growth forecast are shiftstowards minimizing dependence on fossil chemicals, and the recent emergence of moreapplications for furfural. China is an important market for furfural, mainly because of themany applications of furfuryl alcohol.
Growth in furfural demand in the EU is expected, though from a relatively low base. Total EUdemand is estimated to lie between 40– 70 ktonne/year. From 1995 until 2012 there was ananti-dumping regulation in force in the EU. This anti-dumping regulation was aimed atChina. In 2012 this anti-dumping regulation was repealed, on the basis that no significantbelow-price dumping took place anymore.
6.5%15.2%
8.7%
13.0%
2.2%
54.3%
Furfural regional demand (2016)
USA EU Middle east/africa other/Japan USSR China
Historical prices of furfural have shown to be volatile. In 2002 market prices of furfural werereported to be 1874 USD /tonne. In the years up to 2009 prices remained stable between720 – 1300 USD/tonne. Most recent price information lists 1250 USD/tonne. Chineseconditions as regard to supply of raw material (agricultural waste such as corn cobs) are ofprime importance for the global market price.
CAGR 10.3%
68
European demand (kta)
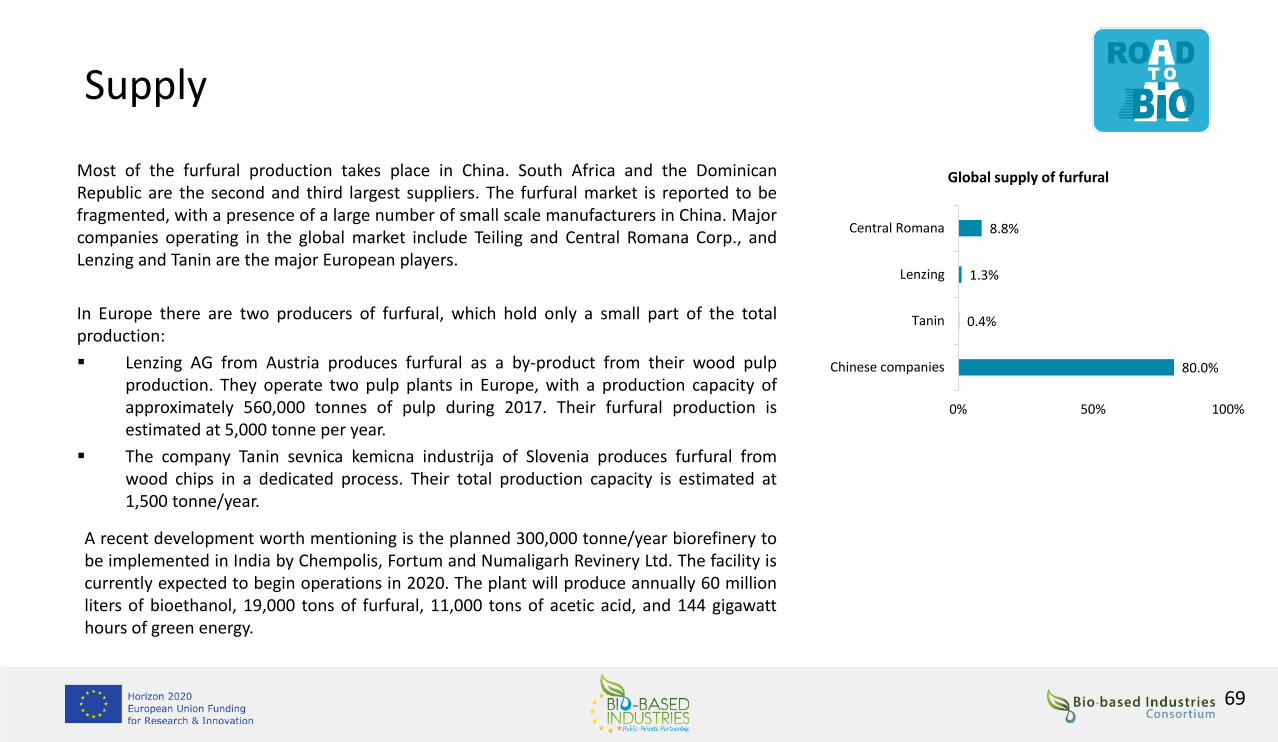
Supply
Most of the furfural production takes place in China. South Africa and the DominicanRepublic are the second and third largest suppliers. The furfural market is reported to befragmented, with a presence of a large number of small scale manufacturers in China. Majorcompanies operating in the global market include Teiling and Central Romana Corp., andLenzing and Tanin are the major European players.
In Europe there are two producers of furfural, which hold only a small part of the totalproduction:
▪ Lenzing AG from Austria produces furfural as a by-product from their wood pulpproduction. They operate two pulp plants in Europe, with a production capacity ofapproximately 560,000 tonnes of pulp during 2017. Their furfural production isestimated at 5,000 tonne per year.
▪ The company Tanin sevnica kemicna industrija of Slovenia produces furfural fromwood chips in a dedicated process. Their total production capacity is estimated at1,500 tonne/year.
A recent development worth mentioning is the planned 300,000 tonne/year biorefinery tobe implemented in India by Chempolis, Fortum and Numaligarh Revinery Ltd. The facility iscurrently expected to begin operations in 2020. The plant will produce annually 60 millionliters of bioethanol, 19,000 tons of furfural, 11,000 tons of acetic acid, and 144 gigawatthours of green energy.
80.0%
0.4%
1.3%
8.8%
0% 50% 100%
Chinese companies
Tanin
Lenzing
Central Romana
Global supply of furfural
69

Cost and environmental performance
The options for producing furfural in the ‘traditional’ way in Europe are considered limited. Thetraditional process is inefficient, which means that the raw material costs are high. Furthermore, largequantities of steam – and therefore energy – are required further increasing the costs. There are finallysafety issues, such as toxicity and corrosivity, related to the handling of large quantities of aqueoussulphuric acid required for the hydrolysing step. The fact that production in the EU is currently very smallis testimony of these concerns.
There are however opportunities for production of furfural in the EU when it can be combined with otherprocesses, such as cellulose ethanol production or wood pulp production. In practice, any large pentosan-rich residue stream can in principle be utilised. Utilising a residue stream also eliminates the need forusing large quantities of sulphuric acid.
An estimation of the production cost breakdown is presented to the right (in USD as this is the standardfor the global furfural market). In this estimation, it is already assumed that the furfural purification stepcan be replaced by vacuum recompression, eliminating 95% of the energy costs. Besides that, rawmaterials – assuming a reasonable price for the pentosans – are the largest production cost factor.
In terms of environmental performance, there is no reliable evidence from literature about GHGemissions savings. However, the use of agricultural waste streams as feedstock for furfural productionhelps tackle waste accumulation and is an example of waste valorisation.
0
100
200
300
400
500
600
700
800
900
USD
/to
nn
e
Depreciation
Labour andoverheads
Maintenance andother operationalcosts
Energy costs
Costs for rawmaterials
70

SWOT analysis
Strengths
• Uses non-food biomass as feedstock.• Established applications that are already economically
viable.
Weaknesses
• The European market is small compared to the global market.
• Limited number of product applications at commercial level.
Threats
• Furfural production is codependent on the production of other products.
• The resin produced is black, which limits its applications.
Opportunities
• The European market for furfural is much larger than the European production.
• Chemical routes to FDCA are possible, which could lead to PEF. These routes are currently at very low TRL.
• The furan functionality could enable furfural to establish itself as a platform chemical.
71

Opportunities IssuesTechno-economic factors• Furfural is already produced and used on a large scale. With the increasing
number of applications, the demand for furfural is expected to continue togrow rapidly.
• The European market is currently mostly supplied by furfural from theAmericas and China. European production is very limited compared to theEuropean market.
• It is formed as a by-product in older and established industries. Because ofthis, the main product may pay for the logistics. However, this can becomean issue when larger production volumes are desired, since the volume offurfural production is linked to the volume of the main product produced.
Techno-economic factors• Direct, dedicated furfural production is too costly in terms of high energy
use and low yields. Such a production would not be feasible within theEU. Improvements are being made in this area, however, none of thesetechniques have reached higher scale systems yet.
• A more feasible production of furfural is therefore linked to theproduction of other chemicals, where this could be a benefit in somecases, this can also act as a constraint.
• Even though European production is much smaller than the Europeanmarket, the European market is still small compared to the global market.This incentivises companies to build outside of Europe instead.
Environmental factors• Furfural can be produced from agricultural waste streams, which prevents
waste and has a low impact on the environment.
Environmental factors• Furfural is toxic.• Careful consideration of sustainability of biomass feedstocks used
Potential and Barriers
72

5.5 GlycerolGlycerol is the simplest alcohol and named propane-1,2,3-triol according to IUPAC. It is also commercially known asglycerine or 1,2,3-propanetriol. The term “glycerol” is only applicable to the pure chemical compound 1,2,3-propanetriol, while the term “glycerine” normally applies to purified commercial products with contents of higherthan 95% glycerol. This versatile molecule finds broad applications in the pharmaceutical, personal care, food &beverages, and tobacco industries.
Crude glycerol is a by-product of fatty acids and fatty alcohols production. It is not contaminated with methanol andcatalyst’s salts, and also has a much lower content of other organic impurities. This glycerol is usually completelyconverted into refined products, and mostly to those of Pharmaceutical or Kosher/Halal quality.
Crude glycerol from biodiesel units is commonly composed of around 80 % glycerol with small amounts of water, fattyacid, ash and methanol. Crude glycerol is not pure enough for direct use in many applications. To overcome thisproblem, impurities must be removed by an efficient purification process to minimize production costs and waste. It ispossible to purify up to Pharmaceutical or Kosher/Halal quality, but it is not economically viable except for large-scalebiodiesel factories.
Refined glycerol is classified into three main classes, related to glycerol purity:
– Technical grade (95.5% purity) – used as a building block in chemicals, not for food or drug formulation;
– USP glycerol from animal fat or plant oil sources, suitable for food products and pharmaceuticals;
– Kosher glycerol from plant oil sources (99.5-99.7% purity), suitable for use in kosher foods
Based on [1,7]
73

Value chain
Based on [2,7]
Glycerol can be produced by using different processes and feedstocks. For example, itcan be obtained by propylene synthesis via several pathways, by hydrolysis of oil or bytransesterification of fatty acids/oils.Fossile feedstock
Key chemicalBio-based feedstock
Direct use
Epichlorohydrin
Bio-methanol
Propylene glycol
Acrylic acid
Other uses
Propylene
Vegetable oil
Hydrolysis – (Soap and fatty acid)
Trans-esterification (Bio-diesel)
Various chemical steps
Glycerol
65%
11%
6%
3%
1%
14%Separation of Glycerol and methanol from bio-diesel
Separation of Glycerol and methanol by acidification
Personal care, food & beverages, pharmaceuticals
Key Derivatives Application
74
Epoxy resin, pharmaceuticals, water treatment chemicals
See business case on Methanol
As solvent in pharmaceuticals; antifreeze
Plastics, paint formulations
Feedstocks

Value chain (continued)
Bio-based glycerol(Biodiesel producers, Soap
producers
Fatty acid producers, Fatty
alcohol producer)
Petro-based glycerol
Intermediate Chemicals (Epichlorohydrin, Propylene glycol, Alkyd resins, Polyether polyols, Triacetin)
End users (Personal care, Food and Beverage, Pharmaceuticals)
Glycerol value chain
Distributor
▪ Distributors
− Brenntag
− Univar
− Helm
▪ Personal care
− Henkel
− L'Oréal
▪ Food and Beverage
− Nestle
− Ritter Sport
▪ Pharmaceuticals
− HEXAL
− Novartis
▪ Epichlorohydrin
− Dow
▪ Biodiesel producers
− Bioeton Kyritz
− Biopetrol Rostock
− Glencore
− Biopetrol
▪ Fatty acid producers
− Croda
− Oleon
− IO Oleo
▪ Fatty alcohol producers
− BASF
− Ecogen
− Sasol
▪ Propylene glycol
− Oleon
− Evonik
▪ Alkyd resins
− BASF
− Ipox
▪ Polyether polyols
− Covestro
− Wanhua chemicals
▪ Triacetin
− Eastmann
− Lanxess
Direct
75
Non-exhaustive list

Demand
15%8%
6%
11%6%
50%
3% 1%
Glycerol Demand
Animal Nutrition Energy
Glycol Substitution Epichlorohydrin
Biomethanol Traditional Use
More than 55% of the world’s demand for crude glycerol comes from two regions: Europeand South-East Asia. While Europe is the biggest buyer of crude glycerol, Asia is the biggestproducer and consumer of refined glycerol, using approximately 35% of world’s supply.
Europe consumes 28% of refined glycerol produced annually in the world and NorthAmerica around 19%.
0
1
2
3
2017 2022
Global refined glycerol demand (mn tons/yr)
Based on [3,4,5,6]
Utilisation pathway
Future plant conceptEstimated European glycerol demand via biodiesel route (t/a)
Food supplements
Vitamin B12Beta-caroteneDHATrehalose
2501,0006,50011,500
Green chemicals
1,3 PDO - concept 11,3 PDO - concept 2PHAPolymers
125,000160,000300,000250,000
BiofuelsEthanol, butanol, FAGE
200,000
Brosowski, A., et al., 2017
76
* Future plant concept: Currently no one is producing the chemicals/fuels/supplements mentioned in the table using glycerol. The quantities mentioned are a futuristic demand estimate if at all glycerol is used for these applications.

Crude Glycerol Production
Supply
Biodiesel was the largest source for production of glycerol accounting for
62% of the market in 2013. However, fatty alcohols are expected to be the
fastest growing source for glycerol production.
In 2013, European biodiesel production implied a technical glycerol potential
of 828 kt/a. There are about a total of 203 operational biodiesel plants in 37
European countries. This clearly indicates that there is a high availability of
crude glycerol in the market.
The global refined glycerol market is highly concentrated with the top four
companies including IOI Group, KL Kepong, Emery Oleochemicals and Wilmar
International accounting for more than 65% of market revenue in 2013.
Other companies operating in the market include P&G, Kao Corp., Cremer
Gruppe and Oleon.
Based on [3]
77
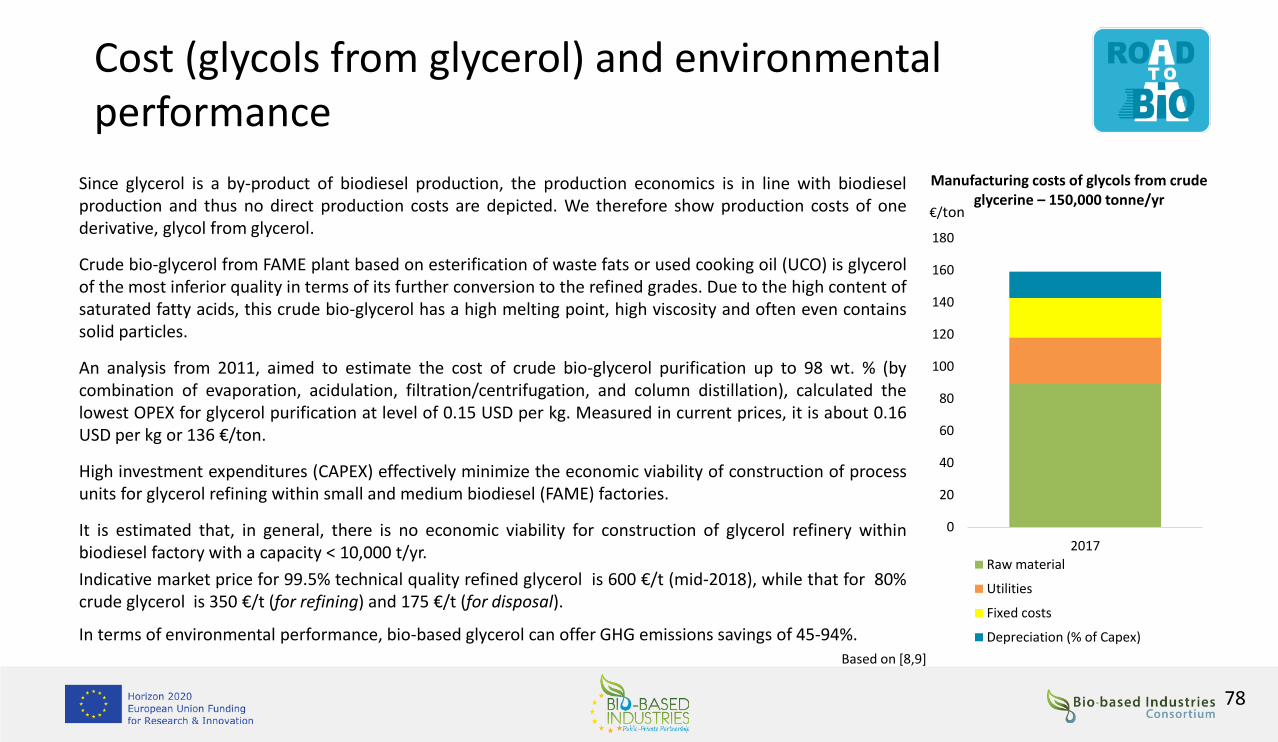
Cost (glycols from glycerol) and environmental performance
Since glycerol is a by-product of biodiesel production, the production economics is in line with biodieselproduction and thus no direct production costs are depicted. We therefore show production costs of onederivative, glycol from glycerol.
Crude bio-glycerol from FAME plant based on esterification of waste fats or used cooking oil (UCO) is glycerolof the most inferior quality in terms of its further conversion to the refined grades. Due to the high content ofsaturated fatty acids, this crude bio-glycerol has a high melting point, high viscosity and often even containssolid particles.
An analysis from 2011, aimed to estimate the cost of crude bio-glycerol purification up to 98 wt. % (bycombination of evaporation, acidulation, filtration/centrifugation, and column distillation), calculated thelowest OPEX for glycerol purification at level of 0.15 USD per kg. Measured in current prices, it is about 0.16USD per kg or 136 €/ton.
High investment expenditures (CAPEX) effectively minimize the economic viability of construction of processunits for glycerol refining within small and medium biodiesel (FAME) factories.
It is estimated that, in general, there is no economic viability for construction of glycerol refinery withinbiodiesel factory with a capacity < 10,000 t/yr.
Indicative market price for 99.5% technical quality refined glycerol is 600 €/t (mid-2018), while that for 80%crude glycerol is 350 €/t (for refining) and 175 €/t (for disposal).
In terms of environmental performance, bio-based glycerol can offer GHG emissions savings of 45-94%.Based on [8,9]
0
20
40
60
80
100
120
140
160
180
2017
Manufacturing costs of glycols from crude glycerine – 150,000 tonne/yr
Raw material
Utilities
Fixed costs
Depreciation (% of Capex)
€/ton
78

SWOT analysis
Strengths
• Cheap C3 platform molecule• Simple logistics• By-product• Some individual conversions are established
Weaknesses
• Price volatility• Purification required, leading to higher production costs • Dependant on biodiesel production and thus on biofuel
subsidies
Threats
• Difficult and expensive (considering smaller market size) to trace feedstock
- Need to ensure no GMO, no pesticides, no palm oil• Epichlorohydrin is still toxic, even if you make it from bio-
based resources.• DSM uses different feedstocks for production of bio-based
paints. This is direct competition for glycerol-based paint.
Opportunities
• In theory, potential to become a platform chemical for a wide range of bio-based chemicals
• Glycerol-based acrylic acid can be used for paints, coatings, diapers, detergents
79

Potential and Barriers
Opportunities IssuesTechno-economic factors• As long as biodiesel is produced, 10% crude glycerol is always produced - thus glycerol
is cheap to have in large quantities.• Large applications portfolio already available• Not drop-in as raw material - petrol-based glycerol is only available in small quantities
on the market (pharmaglycerine)• Glycerol can - at least theoretically - be used chemically as the basis for a wide range of
bio-based chemicals• Glycerol can - at least theoretically - be used biotechnologically as main or secondary
raw material.• Lot of R&D for glycerol to glycerol-derived products• Individual conversions are competitive and now established - e.g. epichlorohydrin for
epoxy resins• Simple logistics - liquid, non-explosive, low toxicity
Techno-economic factors• If biodiesel is no longer produced, the raw material could
become expensive and scarce (but not disappear, as it is alsoproduced in oleochemistry)
• Crude glycerol must be purified for many uses - higher costs• Existing IP and patents could hinder technical implementation• Prices of glycerol-based products cannot currently compete
with petrochemical alternatives
Fuel, Food & Materials• Price volatility, that once was linked to the volatile demand of a chemical mainly used
by the pharmaceutical and personal care industries, today originates from the volatilenature of the glycerol supply, influenced by two main factors: policies (i.e. fiscalincentives to biodiesel oleochemicals) and oil price.
Environmental factors• Land use (direct and indirect) if derived from raw vegetable oils
80

6. Conclusions
The analysis of the nine business case studies shows that there are a number of opportunities to replace fossil-based chemicals with bio-basedchemicals. This replacement could lead to more sustainable products on the market, in some cases with improved performance and functionality andrelatively lower production costs.
In most of the cases, bio-based chemicals have lower greenhouse gas (GHG) emissions compared to their fossil-derived equivalents. Large volumebio-based drop-ins like ethylene, and dedicated polymers such as PEF or glycerol derivatives could lead to significant displacement of fossil-basedfeedstock and improve the overall carbon footprint of European chemical industry. However, further technology developments and energyoptimization of bio-based process are needed to continue reducing GHG emissions and improve the overall sustainability and cost competitiveness ofbio-based chemicals.
A significant driver for dedicated bio-based plastics such as PEF, PLA and PHA is the environmental impact after disposal, where recycling and/orbiodegradability are key end-of-life considerations.
Focus should be on development of innovative bio-based products which outperform traditional fossil-based products technically, environmentallyand in terms of process efficiency - improved functionality and value will result in a strong end-user drivers.
An important enabler for the development and the market uptake of bio-based chemicals will be improving the cost competitiveness of bio-basedchemicals. Cost optimization of the entire value chain of bio-based chemicals is required. Supply of low cost renewable sugars and technologyadvances in utilization of waste feedstock are major opportunities for cutting the production costs and improving sustainability of bio-basedchemicals.
Seizing the opportunities in the bio-based sector will best be achieved through a range of supporting activities including research programmes andfunding, the facilitation of networks and collaborations, the establishment of open access piloting and demonstration facilities, support for earlystage companies, as well as demand side measures.
The economic value of the markets that could be accessed by these bio-based chemicals is very large. There is therefore a strong rationale forinvesting in this area, though investments should follow more careful and detailed assessments of the technical and economic prospects of thespecific bio-based chemical production pathways.
81

Acronyms
bbl – Barrel
BDO – Butanediol
CAGR – Compound annual growth rate
DDDA – Dodecanedioic acid
DMA – Dimethyl terephthalate
€ - Euro
EU – European Union
FDCA – Furan dicarboxylic acid
G&A – General and administrative costs – typically 5 – 10% of plant cash costs
GHG – Greenhouse gases
kt – Kilotonne
kta – Kilotonne per annum
MEG – Monoethylene glycol
PE- Polyethylene
PEF – Polyethylene furanoate
PET – Polyethylene terephthalate
PHA – Polyhydroxyalkanoate
PHB - Polyhydroxybutyrate
PHV – Polyhydroxyvalerate
PLA – Polylactic acid
PP - Polypropylene
PS – Polystyrene
PTA – Terephthalic acid
PVC – Polyvinylchloride
t – Tonne
$ - United States Dollar
USD – United States Dollar
Yr – Year
82

Colophon
Project Title: Roadmap for the Chemical Industry in Europe towards a Bioeconomy
Acronym: RoadToBio
Grant Agreement No: 745623
Start Date: 01 May 2017
Duration of the Project: 24 Months
Deliverable No. D1.2Deliverable Title Business cases: Case studies on potentially attractive opportunities
for bio-based chemicals in EuropeType ReportDue Date 07 September 2018Date Delivered 07 September 2018Prepared by (Lead Partner) E4tech
Contact: [email protected] Level Public

Ethylene
1. Hulea, V. 2018: Toward Platform Chemicals from Bio-Based Ethylene; Heterogeneous Catalysts and Processes. ACS Catal. 8:3263-3279.2. Lemonidou, A. A. et al. 2018: Olefins from Biomass Intermediates: A Review. Catalyst 8(2):1-19.3. Taherzadeh, M. J. et al 2017: Bioethylene Production from Ethanol: A Review and Techno-economical Evaluation. Chem. Bio. Eng. Rev. 4(2):75-91.4. https://www.petrochemistry.eu/about-petrochemistry/facts-figures/ (last accessed July 2018).5. Ethylene – Global. IHS Markit. Available at: https://cdn.ihs.com/www/pdf/Steve-Lewandowski-Big-Changes-Ahead-for-Ethylene-Implications-for-Asia.pdf (last accessed
July 2018).6. Global Ethylene Market Outlook: Low Cost. Media Corporate IR Net. Available at
http://media.corporateir.net/media_files/IROL/11/110877/05_Global_Ethylene_Market_Outlook_Eramo.pdf (last accessed July 2018).7. Dammer, L. et al. 2017: Sustainability First and Second-generation Bioethanol for Europe: A Sustainability Assessment in the Context of the European Commission‘s REDII
proposal. Industrial Biotechnology 13(6): 292-300.8. Thiruvenkataswamy, P. 2015: Safety and Techno-economic analysis of ethylene technologies. Master of Science. Texas A&M University. 9. Kokossis, A. C. 2015: A decision support environment for the high-throughput model-based screening and integration of biomass processing paths. Industrial Crops and
Products 75B:103-113.10. Manfred, K. 2014: The Emerging Bioeconomy: Industrial Drivers, Global Impact, and International Strategies. Industrial Biotechnology 10(1):11-18.11. 2013: Implementing Agreement of the International Energy Agency-Energy Technology Systems Analysis Programme, International Renewable Energy Agency. Production
of bio-ethylene technology brief. Available at: http://irena.org/documentdownloads/publications/irenaetsap%20tech%20brief%20i13%20production_of_bio-ethylene.pdf (last accessed July 2018).
12. Haro, P. et al. 2013: Technoeconomic assessment of potential processes for bio-ethylene production. Fuel Processing Technology 114:35-48.13. https://www.process-worldwide.com/neste-jacobs-and-coolbrook-to-develop-new-olefin-cracking-technology-a-590355/ (last accessed July 2018).14. Nikos Maroulis et al. EC Report 2016: Cumulative Cost Assessment for the EU Chemical Industry Ref. Ares(2016)330422615. Aikaterini Boulamanti et al. 2017: Production costs of the chemical industry in the EU and other countries: Ammonia, methanol and light olefins,; Renewable and
Sustainable Energy Reviews 68: 1205–1212
84
References

Methanol
1. https://www.sigmaaldrich.com/chemistry/solvents/methanol-center.html
2. https://igpenergy.com/methanol-overview/methanol
3. https://ngi.stanford.edu/sites/default/files/Alvarado_Stanford_Methanol_Meeting_2017.pdf
4. https://globenewswire.com/news-release/2018/01/03/1281413/0/en/Global-Methanol-Market-Savvy-Players-Strive-to-adopt-Novel-Production-Techniques-to-Up-Production-finds-TMR.html
5. https://www.methanex.com/sites/default/files/documents/MEOH%20May%202017%20single%20slide%20per%20page.pdf
6. http://gasprocessingnews.com/features/201612/process-design-overview-for-upgrading-a-gas-to-methanol-facility.aspx
7. http://platformduurzamebiobrandstoffen.nl/wp-content/uploads/2017/09/2017_F3_Methanol-as-a-renewable-fuel.pdf
8. http://www.methanol.org/wp-content/uploads/2016/07/Marc-Alvarado-Global-Methanol-February-2016-IMPCA-for-upload-to-website.pdf
9. https://www.platts.com/IM.Platts.Content/InsightAnalysis/IndustrySolutionPapers/emea-petrochemicals-outlook-h1-2018.pdf
10. http://www.rajwantbedi.com/dg1_final.pdf
11. Methanol Economy: Environment, Demand, and Marketing With a Focus on the Waste-to-Methanol Process Gaetano Iaquaniello*,‡, Gabriele Centi† , Annarita Salladini† , Emma Palo‡ * Processi Innovativi, L’Aquila, Italy † University of Messina and INSTM/CASPE, Messina, Italy ‡ KT—Kinetics Technology S.p.A., Rome, Italy
12. https://iea-etsap.org/E-TechDS/PDF/I09IR_Bio-methanol_MB_Jan2013_final_GSOK.pdf
13. www.methanol.org
14. https://dspace.library.uu.nl/bitstream/handle/1874/21713/NWS-E-2006-387.doc?sequence=1
15. https://www.pnnl.gov/main/publications/external/technical_reports/PNNL-18481.pdf
16. Int. J. Life Cycle Assess. (2017) 22: 1418-1440
85
References

Dodecanedioic acid (DDDA)
1. Arpe, H., Industrial Organic Chemistry, Fifth, completely revised edition, Wiley-VCH, 20122. Kroha, inform, September 2004, volume 15 (9), pp 5683. B.M. Mills et al, “Bio-Dodecanedioic Acid (DDDA) Production’, Senior Design Reports (CBE), 100, 20184. D.P. Mobley, ‘Biosynthesis of Long-Chain Dicarboxylic Acid Monomers From Renewable Resources’, Final Technical Report, GE Corporate Research and Development,
19995. https://www.biobasedworldnews.com/verdezyne-becomes-latest-victim-of-liquidation-as-investors-withdraw-funding6. http://news.bio-based.eu/research-and-markets-global-bio-based-resins-market-segmented-by-type-application-and-geography-2015-2020/7. http://www.biofuelsdigest.com/bdigest/2017/11/20/microorganism-factories-the-digests-2017-multi-slide-guide-to-verdezyne/3/8. http://www.biofuelsdigest.com/bdigest/2018/05/15/verdezyne-ave-atque-vale/9. http://biomalaysia.bioeconomycorporation.my/speakerssliders/day1/session1pinang/E%20William%20Radany.pdf10. https://www.biobasedpress.eu/2015/11/another-biobased-dicarboxylic-acid-comes-into-commercial-production-by-verdezyne/11. https://www.crystalmarketresearch.com/report/dodecanedioic-acid-ddda-market12. https://globenewswire.com/news-release/2016/06/06/846218/0/en/Dodecanedioic-Acid-DDDA-Market-Size-potential-worth-599-5-million-by-2023-Global-Market-
Insights-Inc.html13. https://www.gminsights.com/industry-analysis/dodecanedioic-acid-DDDA-market-report 14. https://www.grandviewresearch.com/industry-analysis/dodecanedioic-acid-ddda-industry 15. https://greenchemicalsblog.com/2015/06/10/verdezyne-partners-for-european-bio-ddda-sales/ 16. https://www.prnewswire.com/news-releases/dodecanedioic-acid-ddda-market-worth-4433-million-by-2022-grand-view-research-inc-514532611.html17. https://www.sec.gov/Archives/edgar/data/1517546/000104746911006440/a2204377zf-1.htm#da42001_our_history_and_corporate_structure18. https://www.stle.org/images/pdf/STLE_ORG/AM2017%20Presentations/Commercial%20Marketing%20Forum/STLE2017_Commercial%20Marketing%20Forum%20III
_Session%203B_J.%20Ngian_FerroShield_A%20New%20Product%20that%20Brings%20to%20you%20Superior%20Corrosion%20Inhibition.pdf
86
References

1,4-Butanediol (BDO)
1. “Handbook of commercial bio-based chemicals” Technon OrbiChem 2016.
2. http://thinking.nexant.com/sites/default/files/report/field_attachment_abstract/201304/2012_3_abs.pdf
3. https://www.genomatica.com/wp-content/uploads/2017/01/Novamont-opens-world%E2%80%99s-first-commercial-plant-for-bio-production-of-a-major-intermediate-chemical.pdf
4. https://www.ncbi.nlm.nih.gov/pmc/articles/PMC5456926/
5. https://ihsmarkit.com/products/butanediol-chemical-economics-handbook.html
6. https://www.grandviewresearch.com/industry-analysis/1-4-butanediol-market
7. https://www.chemanager-online.com/en/topics/chemicals-distribution/bdo-pacemaker-stumbles
8. https://ec.europa.eu/energy/sites/ener/files/documents/EC%20Sugar%20Platform%20final%20report.pdf
9. http://www.myriant.com/media/press-kit-files/Myriant-BioBDOBrochure-0613.pdf
10. http://www.orbichem.com/userfiles/promotions/bd_13_07_sample.pdf
11. https://transform.iema.net/article/coffee-cup-challenge
12. “UK Top Bio-based Chemicals Opportunities” LBNet report by E4tech August 2017
87
References

References
Polyhydroxyalkanoates (PHA)
1. Chen, G., ‘Industrial Production of PHA’, 2010
2. Criddle, C.S. et al, ‘Renewable Bioplastics and Biocomposites From Biogas Methane and Waste-Derived Feedstock: Development of Enabling Technology, Life Cycle Assessment, and Analysis of Costs’, CalRecycle, 2014
3. Fernández-Dacosta, C. et al, Bioresource Technology 185, 2015, pp 368-377
4. Gouin, T. et al, ‘Use of Micro-Plastic Beads in Cosmetic Products in Europe and Their Estimated Emissions to the North Sea Environment’, SOFW journal, 141, 3-2015, pp 40-46
5. Kootstra, M., Elissen, H., Huurman, S., PHA’s (Polyhydroxyalkanoates): General information on structure and raw materials for their production, ACRRES, WP9, Task 5, report 727, 2017
6. Kourmentza, C. et al, Bioengineering, 4, 2017, pp 55
7. https://bbi-europe.eu/projects/afterlife
8. http://www.bio-on.it/news.php?lin=inglese
9. http://www.bioplasticsmagazine.com/en/news/meldungen/11-05-2017-new-EU-food-packaging-project-based-on-PHA-from-Bio-on.php
10. https://www.grandviewresearch.com/industry-analysis/europe-medical-plastic-market
11. https://www.grandviewresearch.com/press-release/global-medical-plastics-market
12. https://www.marketsandmarkets.com/Market-Reports/pha-market-395.html
13. https://www.medicaldesignandoutsourcing.com/medical-polymers-market-size-worth-17-05-billion-by-2020/
14. http://www.p4sb.eu/
15. EC (2015). From the Sugar Platform to biofuels and biochemicals. Available at: https://ec.europa.eu/energy/sites/ener/files/documents/EC%20Sugar%20Platform%20final%20report.pdf
88

References
Polyethylene furanoate (PEF)
1. https://www.coebbe.nl/sites/default/files/documenten/nieuwsbericht/491/PEF%20Polyester%20-%20Ed%20de%20Jong.pdf2. https://www.biobasedpress.eu/2016/07/biobased-meg-directly-from-sugars-a-new-step-green-chemistry/3. “Handbook of commercial bio-based chemicals” Technon OrbiChem 2016. 4. E4tec h internal data5. https://www.avantium.com/yxy/yxy-technology/6. https://www.icis.com/resources/news/2007/11/06/9076427/polyethylene-terephthalate-pet-production-and-manufacturing-process/#7. https://www.coca-cola.co.uk/stories/innovative-packaging-an-introduction-to-plantbottle#8. http://www.biofuelsdigest.com/bdigest/2015/06/04/virent-coca-cola-hit-key-production-milestone-with-the-100-biobased-plant-bottle/9. https://www.prnewswire.com/news-releases/polyethylene-furanoate-market-demand-worth-16640-tons-by-2022-grand-view-research-inc-674018303.html10. https://www.grandviewresearch.com/industry-analysis/polyethylene-furanoate-pef-market11. European bioplastics, Nova Institute, 2017. Bio-based building blocks and polymers: Global capacities and trends 2016-2021. Available at: http://bio-based.eu/markets/ 12. https://www.basf.com/en/company/news-and-media/news-releases/2017/06/p-17-246.html13. https://www.avantium.com/press-releases/pef-pilot-phase-set-extended/14. https://www.basf.com/en/company/news-and-media/news-releases/2017/06/p-17-246.html15. http://www.sustainablebrands.com/press/dupont_corbion_synvina_pilot_furan-based_polymers_made_sugar_must_confront_pet%E2%80%99s_dominance16. https://cen.acs.org/business/biobased-chemicals/DuPont-ADM-pilot-biobased-monomer/96/i1917. https://www.avantium.com/press-releases/alpla-joins-coca-cola-company-danone-avantiums-pef-bottle-development/18. https://www.avantium.com/press-releases/wifag-polytype-avantium-announce-agreement-100-biobased-pef-thermoforming/19. https://www.corbion.com/base/DownloadHelper/DownloadFile/998520. http://www.agro-chemistry.com/articles/corbion-takes-steps-in-the-process-for-fdca/21. https://www.avantium.com/press-releases/toyobo-and-avantium-partner-on-pef-polymerization-and-pef-films/22. http://www.avalon-industries.com/web/pages/en/solutions/applications/bio-based-plastics.php?lang=EN23. https://www.bbi-europe.eu/projects/peference24. https://www.cpme-pet.org/members25. https://www.platts.cn/IM.Platts.Content/InsightAnalysis/IndustrySolutionPapers/SR-Europe-PET-impact-of-changes-in-supply-dynamics-0116.pdf26. https://www.cpme-pet.org/content/pet-collection-and-recycling-rates-europe-significantly-increased-2016-027. Open source image downloaded from: https://pixabay.com/en/photos/plastic%20bottles/28. https://www.icis.com/resources/news/2018/03/23/10205504/europe-march-pet-production-costs-lower-yet-prices-rise/29. https://www.icis.com/resources/news/2007/11/06/9076460/purified-terephthalic-acid-pta-prices-and-pricing-information/30. https://www.polyestertime.com/spot-prices-monoethylene-glycol-meg-europe/31. https://www.polyestertime.com/europe-pet-market-braced-potential-impact-bp-pta-force-majeure-europe-pet-market-bp-pta/32. US Patent US9617234B1: Method to produce furandicarboxylic acid (FDCA) from 5-hydroxymethylfurfural (HMF)33. “From the Sugar Platform to biofuels and biochemicals” Final report for the European Commission Directorate-General Energy. E4tech 2015.
89

References
Lactic acid
1. https://ec.europa.eu/energy/sites/ener/files/documents/EC%20Sugar%20Platform%20final%20report.pdf
2. https://www.sciencedirect.com/science/article/pii/0168644594000554
3. “Handbook of commercial bio-based chemicals” Technon OrbiChem 2016.
4. http://thinking.nexant.com/sites/default/files/report/field_attachment_abstract/201304/2012_3_abs.pdf
5. https://www.genomatica.com/wp-content/uploads/2017/01/Novamont-opens-world%E2%80%99s-first-commercial-plant-for-bio-production-of-a-major-intermediate-chemical.pdf
6. https://www.ncbi.nlm.nih.gov/pmc/articles/PMC5456926/
7. https://ihsmarkit.com/products/butanediol-chemical-economics-handbook.html
8. https://www.grandviewresearch.com/industry-analysis/1-4-butanediol-market
9. https://www.chemanager-online.com/en/topics/chemicals-distribution/bdo-pacemaker-stumbles
10. http://www.myriant.com/media/press-kit-files/Myriant-BioBDOBrochure-0613.pdf
11. https://www.corbion.com/media/434618/corbion_a_safe_antimicrobial_for_hpc_applications_eng.pdf
12. https://www.nnfcc.co.uk/news-natureworks-plaxica
13. https://www.cnbc.com/2016/06/30/globe-newswire-lactic-acid-and-poly-lactic-acid-pla-market-size-is-projected-to-reach-43122-million-and-21696-million-respectively-by-2020.html
14. https://ec.europa.eu/jrc/sites/jrcsh/files/BISO-EnvSust-Bioproducts-LA_140930.pdf
15. https://www.natureworksllc.com/About-NatureWorks
16. https://ihsmarkit.com/products/lactic-acid-its-salts-chemical-economics-handbook.html
17. https://www.plasticsinsight.com/resin-intelligence/resin-prices/polylactic-acid/
18. “From the Sugar Platform to biofuels and biochemicals” Final report for the European Commission Directorate-General Energy. E4tech 2015.
19. https://www.total-corbion.com/news/total-corbion-pla-at-npe-showcasing-biobased-pla-innovations/?p=1&q=
90

Furfural
1. NREL (2016); https://www.nrel.gov/docs/fy16osti/65509.pdf
2. Nhien et al. (2017), http://europepmc.org/articles/PMC5370433/
3. Xiaodan et al. (2016), https://pubs.acs.org/doi/abs/10.1021/acscatal.6b01838?src=recsys&
4. https://www.grandviewresearch.com/industry-analysis/furfural-market
5. https://ihsmarkit.com/products/furfural-chemical-economics-handbook.html
6. Dashtban et al. J-FOR 2, no. 4, 201, https://www.researchgate.net/publication/261051357_PRODUCTION_OF_FURFURAL_OVERVIEW_AND_CHALLENGES
7. Yan et al. (2014) https://www.sciencedirect.com/science/article/pii/S1364032114004559
8. https://echa.europa.eu/documents/10162/ed4e7680-4100-4411-be19-74c19bbc4ce0
9. https://echa.europa.eu/documents/10162/ed4e7680-4100-4411-be19-74c19bbc4ce0
10. http://dalinyebo.com/furfuralmarket
11. Marcotullio, thesis (2011) https://repository.tudelft.nl/islandora/object/uuid:a307ecb3-513a-4f57-b519-873a73403cfd/datastream/OBJ
12. http://blog.dalinyebo.com/furfural-market-on-the-move-double-digit-growth/
13. http://eur-lex.europa.eu/LexUriServ/LexUriServ.do?uri=OJ:L:2012:165:0004:0011:EN:PDF
14. https://www.lenzing.com/fileadmin/content/PDF/07_Finanzen/Praesentationen/DE/LAG_Investor_Presentation_Q3_2017.pdf
15. https://www.lenzing.com/en/sustainability/production/biorefinery/
16. http://www.tanin.si/podstrani_slo/produkti.php
17. Žilnic et al., Acta Chim. Slov. (2016), 63, 298-308, https://www.ncbi.nlm.nih.gov/pubmed/27333552
18. http://biomassmagazine.com/articles/15272/chempolis-fortum-nrl-partner-to-build-biorefinery-in-india
19. http://www.chempolis.com/description-of-the-chempolis-formicobio-technology/
91
References

Glycerol
1. https://www.sciencedirect.com/science/article/pii/S1364032113003948#bib632. http://www.mdpi.com/2077-0375/7/2/17/pdf
3. Understanding the Glycerol Market† Rosaria Ciriminna, Cristina della Pina, Michele Rossi, Mario Pagliaro*
4. https://vdocuments.mx/current-future-issues-for-oleo-chemical-industry.html
5. https://adi-analytics.com/2015/04/06/monetizing-north-american-shale-with-methanol/
6. Review of technical glycerol potential, Brosowski et al, 2017: https://www.researchgate.net/publication/316472077_Review_of_technical_glycerol_potential_from_biodiesel_production_and_availability_for_improved_cascading_in_Europe
7. http://www.ache.org.rs/CICEQ/2016/No4/CICEQ_Vol22_%20No4_p461-489_Oct-Dec_2016.pdf8. https://skemman.is/bitstream/1946/12685/1/AGC%20business%20plan_Final.pdf9. Int. J. Life Cycle Assess. (2017) 22: 1418-1440
92
References