Buruli Ulcer Disease and Its Association with Land Cover in Southwestern Ghana
19
RESEARCH ARTICLE Buruli Ulcer Disease and Its Association with Land Cover in Southwestern Ghana Jianyong Wu 1☯ , Petra Tschakert 1 , Erasmus Klutse 2 , David Ferring 3 , Vincent Ricciardi 1 , Heidi Hausermann 4 , Joseph Oppong 5 , Erica A. H. Smithwick 1☯ * 1 Department of Geography, The Pennsylvania State University, University Park, Pennsylvania, United States of America, 2 Ghana Health Service, Accra, Ghana, 3 Department of Geography, Rutgers University, Piscataway, New Jersey, United States of America, 4 Department of Human Ecology, Rutgers University, New Brunswick, New Jersey, United States of America, 5 Department of Geography, The University of North Texas, Denton, Texas, United States of America ☯ These authors contributed equally to this work. * [email protected] Abstract Background Buruli ulcer (BU), one of 17 neglected tropical diseases, is a debilitating skin and soft tissue infection caused by Mycobacterium ulcerans. In tropical Africa, changes in land use and proximity to water have been associated with the disease. This study presents the first anal- ysis of BU at the village level in southwestern Ghana, where prevalence rates are among the highest globally, and explores fine and medium-scale associations with land cover by comparing patterns both within BU clusters and surrounding landscapes. Methodology/Principal Findings We obtained 339 hospital-confirmed BU cases in southwestern Ghana between 2007 and 2010. The clusters of BU were identified using spatial scan statistics and the percentages of six land cover classes were calculated based on Landsat and Rapid Eye imagery for each of 154 villages/towns. The association between BU prevalence and each land cover class was calculated using negative binomial regression models. We found that older people had a significantly higher risk for BU after considering population age structure. BU cases were positively associated with the higher percentage of water and grassland surrounding each village, but negatively associated with the percent of urban. The results also showed that BU was clustered in areas with high percentage of mining activity, suggesting that water and mining play an important and potentially interactive role in BU occurrence. Conclusions/Significance Our study highlights the importance of multiple land use changes along the Offin River, par- ticularly mining and agriculture, which might be associated with BU disease in southwestern Ghana. Our study is the first to use both medium- and high-resolution imagery to assess these changes. We also show that older populations ( 60 y) appear to be at higher risk of BU disease than children, once BU data were weighted by population age structures. PLOS Neglected Tropical Diseases | DOI:10.1371/journal.pntd.0003840 June 19, 2015 1 / 19 OPEN ACCESS Citation: Wu J, Tschakert P, Klutse E, Ferring D, Ricciardi V, Hausermann H, et al. (2015) Buruli Ulcer Disease and Its Association with Land Cover in Southwestern Ghana. PLoS Negl Trop Dis 9(6): e0003840. doi:10.1371/journal.pntd.0003840 Editor: Pamela L. C. Small, University of Tennessee, UNITED STATES Received: November 24, 2014 Accepted: May 19, 2015 Published: June 19, 2015 Copyright: © 2015 Wu et al. This is an open access article distributed under the terms of the Creative Commons Attribution License, which permits unrestricted use, distribution, and reproduction in any medium, provided the original author and source are credited. Data Availability Statement: Data are available for researchers who meet the criteria for access to confidential data in accordance with Penn State's Institutional Review Board, for the National Science Foundation (0909447) project to P. Tschakert ( [email protected]). Non-confidential BU and landcover datasets used in this paper are also available at: http://dx.doi.org/10.13014/D3G44N6X. Funding: The study is supported by an National Science Foundation Coupled Natural Human Systems grant (No. 0909447) to PT EAHS JO, Edith Parker, Kamini Singha, and Annmarie Ward. The funders had no role in study design, data collection
Transcript of Buruli Ulcer Disease and Its Association with Land Cover in Southwestern Ghana

RESEARCH ARTICLE
Buruli Ulcer Disease and Its Association withLand Cover in Southwestern GhanaJianyongWu1☯, Petra Tschakert1, Erasmus Klutse2, David Ferring3, Vincent Ricciardi1,Heidi Hausermann4, Joseph Oppong5, Erica A. H. Smithwick1☯*
1 Department of Geography, The Pennsylvania State University, University Park, Pennsylvania, UnitedStates of America, 2 Ghana Health Service, Accra, Ghana, 3 Department of Geography, Rutgers University,Piscataway, New Jersey, United States of America, 4 Department of Human Ecology, Rutgers University,New Brunswick, New Jersey, United States of America, 5 Department of Geography, The University of NorthTexas, Denton, Texas, United States of America
☯ These authors contributed equally to this work.* [email protected]
Abstract
Background
Buruli ulcer (BU), one of 17 neglected tropical diseases, is a debilitating skin and soft tissue
infection caused byMycobacterium ulcerans. In tropical Africa, changes in land use and
proximity to water have been associated with the disease. This study presents the first anal-
ysis of BU at the village level in southwestern Ghana, where prevalence rates are among
the highest globally, and explores fine and medium-scale associations with land cover by
comparing patterns both within BU clusters and surrounding landscapes.
Methodology/Principal Findings
We obtained 339 hospital-confirmed BU cases in southwestern Ghana between 2007 and
2010. The clusters of BU were identified using spatial scan statistics and the percentages of
six land cover classes were calculated based on Landsat and Rapid Eye imagery for each
of 154 villages/towns. The association between BU prevalence and each land cover class
was calculated using negative binomial regression models. We found that older people had
a significantly higher risk for BU after considering population age structure. BU cases were
positively associated with the higher percentage of water and grassland surrounding each
village, but negatively associated with the percent of urban. The results also showed that
BU was clustered in areas with high percentage of mining activity, suggesting that water
and mining play an important and potentially interactive role in BU occurrence.
Conclusions/Significance
Our study highlights the importance of multiple land use changes along the Offin River, par-
ticularly mining and agriculture, which might be associated with BU disease in southwestern
Ghana. Our study is the first to use both medium- and high-resolution imagery to assess
these changes. We also show that older populations (� 60 y) appear to be at higher risk of
BU disease than children, once BU data were weighted by population age structures.
PLOS Neglected Tropical Diseases | DOI:10.1371/journal.pntd.0003840 June 19, 2015 1 / 19
OPEN ACCESS
Citation:Wu J, Tschakert P, Klutse E, Ferring D,Ricciardi V, Hausermann H, et al. (2015) Buruli UlcerDisease and Its Association with Land Cover inSouthwestern Ghana. PLoS Negl Trop Dis 9(6):e0003840. doi:10.1371/journal.pntd.0003840
Editor: Pamela L. C. Small, University of Tennessee,UNITED STATES
Received: November 24, 2014
Accepted: May 19, 2015
Published: June 19, 2015
Copyright: © 2015 Wu et al. This is an open accessarticle distributed under the terms of the CreativeCommons Attribution License, which permitsunrestricted use, distribution, and reproduction in anymedium, provided the original author and source arecredited.
Data Availability Statement: Data are available forresearchers who meet the criteria for access toconfidential data in accordance with Penn State'sInstitutional Review Board, for the National ScienceFoundation (0909447) project to P. Tschakert ([email protected]). Non-confidential BU and landcoverdatasets used in this paper are also available at:http://dx.doi.org/10.13014/D3G44N6X.
Funding: The study is supported by an NationalScience Foundation Coupled Natural HumanSystems grant (No. 0909447) to PT EAHS JO, EdithParker, Kamini Singha, and Annmarie Ward. Thefunders had no role in study design, data collection

Author Summary
We studied the relationship between a neglected tropical disease, Buruli Ulcer (BU), andlandscape disturbance. We hypothesized that the increased presence of BU was related tolandscape disturbance, especially alluvial mining, in endemic areas of the disease. Wecharacterized recent cases of BU in southwestern Ghana and characterized six types ofland cover classes at different spatial extents at the village level. We illustrated that miningand water areas were prevalent in BU clustered areas and may potentially play an interac-tive role in BU occurrence, a finding that should be explored further. No previous studyhas quantified the relationship between mining and BU at the village level. In addition, wefound that people� 60 years old had a higher prevalence than other age groups, whendata was weighted by the population age structure. To our knowledge, these findings havenot been reported in Ghana before and might provide new insight in BU disease interven-tion and control. While it is unclear how people come in contact with the bacterial source,our study shows that the importance of where people live (specifically, what land activitiesare occurring in the area) seems to play a large role in determining disease risk.
IntroductionBuruli ulcer (BU), a neglected emerging infectious disease, is a skin and soft tissue infectioncaused byMycobacterium ulcerans (MU). The infection is characterized by painless noduleswith necrotizing toxins that produce lesions in the skin, and which may lead to scarring, contrac-tual deformities, amputations, and disabilities if untreated [1–3]. BU has been reported in over30 countries inWest Africa, Southeast Asia, Central and South America and theWestern Pacific,as well as Australia [1,4,5]. Though the exact transmission mode of BU disease is still unclear,evidence indicates that the outbreak of BU is associated with climate factors (rainfall and flood-ing), proximity to slow-flowing or stagnant water, and human-linked environmental distur-bance, such as alluvial, pit and sand mining operations, deforestation, and agriculture [2,6–8].
Since different types of land cover classes have different influences on the distribution ofhuman population, the habitat of vectors, and the presence of causative pathogens, examiningthe association between land cover and BU provides valuable information to prioritize and tar-get specific areas for intervention and control of the disease [8]. The association between landcover and BU has been reported in some countries. In Benin, higher BU disease prevalencerates were found to be associated with rural villages surrounded by forest and at low elevationareas with variable wetness patterns [9]. Similarly, in Australia, the highest BU risk areas werealso located at low elevation areas covered by forest [10]. In Côte d'Ivoire, high-risk zones forBU were located in irrigated rice fields, as well as in banana fields and areas in the vicinity ofdams used for irrigation and aquaculture [11]. In Cameroon, the Nyong River and associatedcultivated wetlands were identified as the major driver of BU incidence [12].
Ghana, located in West Africa, with a population of 24.2 million and a total area of 238,535km2, is one of the most endemic countries of BU disease, second only to Cote d’Ivoire [13].The first possible BU case in Ghana was reported about 40 years ago [4]. Since then, more BUcases were reported in the country, especially in southern Ghana [14]. In 1993, 1,200 caseswere recorded in four regions by a passive surveillance system. A comprehensive national casesearch in 1999 identified 5,619 BU patients. Based on this data, the national prevalence ratewas estimated as 20.7 per 100,000, but up to 150.8 per 100,000 in Amansie West, the most dis-ease-endemic district in Ghana [15]. Since 1999, new BU cases ranged from 326 to 1202 peryear, though cases may have been underreported [16].
Buruli Ulcer and Land Cover in Ghana
PLOS Neglected Tropical Diseases | DOI:10.1371/journal.pntd.0003840 June 19, 2015 2 / 19
and analysis, decision to publish, or preparation ofthe manuscript.
Competing Interests: The authors have declaredthat no competing interests exist.

Based on satellite data, land cover in Ghana has changed dramatically in recent decades[17,18]. Yet, examination of the impacts of land cover and its effect on BU disease has mostlybeen attempted at district or regional scales [7,19,20], inevitably neglecting local variation inland cover. For example, by analyzing the relationship between land cover and BU disease atthe district level using Landsat imagery, Ruckthongsook [20] found that closed-forest areaswere positively correlated with BU incidence in southwestern Ghana. In another study, Dukeret al. [7] showed that mean BU prevalence was higher in settlements along arsenic-enricheddrainages and arsenic-enriched farmlands based on ASTER images. That study examined rela-tionships between the prevalence of BU and several spatial environmental factors in a smallerscale (61 settlements in the Amansie West District), however, it did not examine the associa-tion between BU prevalence and land cover.
To date, neither the characteristics of recent BU cases nor the association between BU prev-alence and land cover at different scales is well understood in southwestern Ghana. In the pres-ent study, we aim to 1) characterize the age and sex patterns of recent BU cases (2007–2010) insouthwestern Ghana, 2) illustrate spatial distribution and spatial clusters of BU disease sur-rounding individual villages, and 3) examine the association between BU prevalence and majortypes of land cover classes at different spatial extents.
Methods
Ethical statementApproval for this study was obtained from the Institutional Review Board (IRB) at the Pennsyl-vania State University (PSU), which specified oral informed consent for participation for adultsand heads/chiefs of communities as well as implied informed consent for parents on behalf oftheir children. Assent forms for children<18yrs was also approved by PSU’s IRB. No singleindividual declined the invitation to participate. In addition, the BU case data were analyzedanonymously and no private information was disclosed in this study.
Study areaOur study area is in southwestern Ghana, including a large part of Central Region andWesternRegion, and a small part of Ashanti Region and Eastern Region. For land cover analysis, thewhole study area is covered by two Landsat-7 scenes, ranging from 1.00° W to 2.875° W, 5.141°N to 6.515° N (Fig 1). The focus of the study was the Upper Denkyira District, Central Region,where the prevalence of BU is higher. According to the Ghana national census in 2010, thepopulation in Western Region and Central Region is 2,376,021 and 2,201,863, respectively.The sex ratio of male to female is 50:50 and 48:52, respectively.
Buruli ulcer data collection and analysisBU case data were collected by district hospitals and clinics mainly located in the Upper Den-kyira District, Central Region. This area accounts for the majority of BU cases (>85%) in Cen-tral Region and Western Region that was reported by the 2004–2009 Ghana national BUdataset. These hospitals and clinics have good facilities for BU diagnosis and treatment andaccept patients mainly from Central Region and Western Region. When patients visit a clinicor hospital, they are diagnosed by experienced doctors to examine whether they have BU basedon symptoms. Therefore, these cases were clinically confirmed, rather than laboratory-con-firmed. If a case is determined, detailed information about the patients (e.g. age, gender, resi-dence) was recorded. The location of lesions, including the upper limbs, the lower limbs, thehead and neck, and other parts were also recorded. According to the date of BU diagnosis, the
Buruli Ulcer and Land Cover in Ghana
PLOS Neglected Tropical Diseases | DOI:10.1371/journal.pntd.0003840 June 19, 2015 3 / 19

Fig 1. The study extent used to assess the relationship between Buruli Ulcer and land use in southwest Ghana. The study extent was determined bythe Landsat images, which covered ~95% of the villages/towns with BU cases in the clinical dataset.
doi:10.1371/journal.pntd.0003840.g001
Buruli Ulcer and Land Cover in Ghana
PLOS Neglected Tropical Diseases | DOI:10.1371/journal.pntd.0003840 June 19, 2015 4 / 19

number of BU cases in each month in the study area was calculated, then its seasonal patternand annual trend were explored with a seasonal-trend decomposition analysis using the STLfunction in R package, which decomposed the monthly BU case data into three components:trend, seasonal, and remainder [21].
Based on the residence of these patients, we calculated the number of BU cases in 91 villages[22]. The prevalence of BU disease in these villages was calculated using the observed totalnumbers of BU cases in a village during 2007–2010 divided by the population of that village.The prevalence of BU disease in the entire study area was calculated using the total number ofobserved BU cases divided by the total population in the study area (the total population inCentral Region and Western Region was used as a proxy). The prevalence of BU in each ageand sex group was calculated using the number of BU cases in that age and sex group dividedby the total population in that group and expressed as cases per 100,000 people.
Spatial cluster analysisSpatial Scan statistics [23] were used to determine whether there were spatial clusters of BUamong the villages in the study area. For this analysis, 6 of the 91 villages with BU case infor-mation were excluded because they fell slightly outside the study area where land cover wasanalyzed. The scan statistics approach creates a window (a circle or an ellipse) of point dataacross space and time, then calculates the observed value and expected value in and outside ofthe window. The null hypothesis is that the observed value in the window should be equal tothat outside of the window. A likelihood ratio test is used to examine whether the cluster is areal cluster or due to a chance [24,25]. The likelihood function is maximized across windows indifferent locations and sizes, and the window with the maximum likelihood is determined asthe most likely cluster. The p value is obtained through a Monte Carlo simulation, which is therank of the maximum likelihood of the observed value divided by the total number of the maxi-mum likelihood values. For example, if the rank is 10, the simulation number is 999, and thetotal number of the maximum likelihood values is 1000, then p = 10/1000 = 0.01.
SaTScan v9.1 package was used to detect spatial clusters of BU disease [24,25]. A spatial ret-rospective analysis with a Poisson probability model was implemented to scan areas with highrates of BU prevalence in 999 Monte Carlo simulations. The total number of BU cases during2007–2010 in each of the 85 villages was used as the case file, the population in each village in2010 was used as the population file, and the latitude and longitude of each village was used inthe coordinates file.
Satellite data and image processingLandsat imagery was used to classify land cover in the study area at a medium spatial resolution(30 m). Two scenes (path 194 and 195, row 56) in 2008 without the coverage of cloud wereacquired from the U.S. Geological Survey (USGS) (https://glovis.usgs.gov). The Landsat sceneswere radiometrically corrected by transforming digital number (DN) values to reflectance.Bands 1, 2, 3, 4, 5 and 7 of each image were selected and stacked into a new image. Then theimages were transformed into brightness, greenness and wetness by the Tasseled cap method[26] and followed by land cover classification. To quantify land cover at a finer spatial scale, weused Rapid Eye imagery (BlackBridge Ltd., Germany) with a resolution of 5 m. Rapid Eyeimages acquired on January 8, 2012 were first preprocessed by geometric and radiometric cor-rection, then bands 1, 2, 3 were selected for classification.
We based our initial land cover classification scheme on the USGS classification system [27]for both Landsat and Rapid Eye images. This system classifies land use and land cover intonine level 1 classes that could be discerned at both scales. According to the land cover
Buruli Ulcer and Land Cover in Ghana
PLOS Neglected Tropical Diseases | DOI:10.1371/journal.pntd.0003840 June 19, 2015 5 / 19

characteristics in southwestern Ghana, we are able to classify urban land, agriculture land,grassland, water and forest. Mining area is commonly classified as a level 2 class under urbanland or barren land. Here, we classified mining area separately because it is prevalent and a typ-ical type of land cover class in southwestern Ghana [28]. For example, in the Wassa West Dis-trict, southwestern Ghana, surface mining expanded from 0.2% of the mining concession areasin 1996 to 49.6% of the concession area in 2002, leading to a substantial loss of forest (58%)and farmland (45%) within mining concessions [28]. In total, we generated six classes and pro-vide detailed information about each class in Table 1. In the Landsat images, the regularly dis-tributed black strips due to the shutdown of the scan-line corrector (SLC-off) were treated as aseparate class, termed unclassified.
We used supervised classification with the maximum likelihood algorithm to create classi-fied maps. The training and testing sites in the classification approach were selected randomlyin areas where the land covers were seen to be relatively homogeneous, which was determinedusing multiple sources of information including a ground truth survey in 2012 as well as Goo-gle Earth in 2010, community participatory maps in 2011 and 2012, and high resolution images(e.g. Quickbird images in 2010 with 0.5 m resolution). Land cover classes were initially selectedbased on participatory mapping activities in each community. Through these mapping activi-ties, community members illustrated their village terrain at the time, including land use andland cover types such as various crop fields, forests, mining areas, and stagnant and flowingwater bodies as well as important community infrastructure (e.g. school, wells). During discus-sions while creating the map, community members also identified areas labeled as “BU riskareas”, indicating polluted or contaminated areas that they considered as possible reservoirs forthe MU bacteria and BU transmission (e.g., refuse dumps, areas of stagnant and dirty water inbetween neighborhoods). In a subsequent mapping activity, community members wereencouraged to illustrate changes in land use and land cover over three to four decades, indicat-ing changes in crop lands, areas of deforestation, expanding mining activity, and shifts in areasexposed to flooding. In addition, a ground truth survey included preliminary identification ofcandidate land covers from an unsupervised classification and field verification of detailed landuse/land covers and the associated geographic coordinates. After the supervised classification,isolated classified pixels were removed through the sieving procedure and similar adjacent clas-sified pixels were clumped together through the clumping procedure to smooth these images.The overall accuracy and the Kappa coefficient were used as indices of the classification accu-racy, which are derived from the error matrix, a cross-table of the mapped class versus expectedclass. The image processing was carried out with ENVI 4.8 package (Exelis, Inc., VA, USA).
After classification, we imported the classified images into ArcGIS 10.1 (ESRI, Redlands,CA, USA) for further analysis. First, we converted raster layers into shapefiles. Where RapidEye and Landsat images overlapped, land cover classes from the Rapid Eye image were used; ifRapid Eye image was not present, land cover classes from the Landsat image were used. We
Table 1. Land cover classes used in image classification.
Land cover class Explanation
Urban Residential area, road
Mining Alluvial and hard rock mining
Water Mining water, reservoirs, lakes, rivers
Grassland Grassland or similar
Forest Forest reserves or similar
Agriculture Cropland, plantations, non-crop trees
doi:10.1371/journal.pntd.0003840.t001
Buruli Ulcer and Land Cover in Ghana
PLOS Neglected Tropical Diseases | DOI:10.1371/journal.pntd.0003840 June 19, 2015 6 / 19

created a buffer around each village with the radius as 1 km, 2.5 km, 5 km, 10 km, 20 km and30 km and 40 km, respectively. We calculated the area of each land cover class in each bufferby intersecting each buffer with the classified image [22]. The percentage of each land coverwas calculated by dividing its area by the total area of the buffer (unclassified land cover areaswere included in the total area). In the same way, the percentage of each land cover class for154 villages/towns, including 85 villages where BU cases were reported and 69 villages ran-domly selected as the control, where BU cases were not reported. To examine the effect ofunclassified areas on the quantification of the land cover classes, mainly caused by the scan lineoff (SLC-off) problem, we used a modified nearest neighbor approach [29]. Specifically, wereplaced the value of unclassified pixels with the average value of the left neighbors and rightneighbors, respectively, and then averaged the results to obtain a new land cover class, essen-tially filling the gaps caused by the SLC-off problem.
Statistical analysisTo compare the number of BU cases by different gender and age groups, the Friedman test, anon-parametric equivalent of two-way ANOVA, was used considering the BU data could notbe assumed to follow a normal distribution. In this analysis, the dependent variable was the BUcases, the two influential factors were gender and age group. Gender has two levels: male andfemale; and age group has three levels: 0–19 yrs, 20–59 yrs, and> 60 yrs. To examine the dif-ference of the percentages of land cover types in the BU clustered area and the whole studyarea, Wilcoxon signed-rank test, a nonparametric equivalent of Paired t-test was used becausethe percentages of land cover types around villages were not assumed to follow a normal distri-bution. These tests were conducted with SAS 9.3 (SAS Institute, Inc, Cary, NC, USA).
To examine the association between BU prevalence and each land cover class, a set ofregression models, including Poisson and negative binomial regression models, were developed[8]. In these models, we used the number of BU cases in each village as the dependent variable,the natural logarithm of the population of each village as the offset term, and the percentage ofeach land cover class as independent variables. Since we had six categories of land cover, wehad six independent variables in the model.
Initially, we assumed the count data (BU cases, expressed as Y) followed a Poisson distribu-tion, of which the mean, E(Y), and the variance, Var (Y), are assumed equal (E(Y) = Var (Y) =μ). Goodness of fit test using the deviance showed that Poisson distribution was not a good fit(deviance/ degree of freedom>3.00). Therefore, we selected a negative binomial distribution,which allows the variance is higher than the mean (E(Y) = μ, Var(Y) = μ +kμ2, k is an overdis-persion coefficient). The general equation of the negative binomial regression model is writtenas below:
logðμiÞ ¼ logðNiÞ þ b0 þ b1x1i þ b2x2i þ . . .þ bnxni ð1Þ
Where μ is the expected number of BU, i is the index of an individual village, N is the numberof population of a village, x1, x2, . . . xn are the covariates of the model, denoting the percentagesof land cover classes, respectively. The summary statistics of these covariates were listed in S1Table. Considering the interactive effects between water and mining as well as water and agri-culture, we put two interaction terms into the model, namely, the percentage of water area mul-tiplied by the percentage of mining area, and the percentage of water area multiplied by thepercentage of agriculture area. Before running the model, we examined multicollinearity withcorrelation matrix generated by Pearson correlation analysis and variance inflation factors(VIF) calculated by SAS reg procedure. If mulitcollinearity was found among covariates (e.g. r>0.6 or VIF>5), only one of these highly correlated covariates was put into the model. Akaike’s
Buruli Ulcer and Land Cover in Ghana
PLOS Neglected Tropical Diseases | DOI:10.1371/journal.pntd.0003840 June 19, 2015 7 / 19

Information (AIC) as the criterion was used to select the best fitted models. A smaller AICvalue indicates a better fitted model. If the regression coefficient (β) for a land cover class wassignificantly larger than zero (β>0, p<0.05), we assumed the prevalence of BU had a positiveassociation with that land cover class. If β was significantly less than zero (β<0, p<0.05), a neg-ative association was assumed. To evaluate model performance, we ran residual diagnostics ofthe top-rank model. We calculated the predicted value, the raw residual, the deviance residual,the standardized Pearson residuals, standardized deviance residual and likelihood residual foreach observation and mapped the standardized Pearson residuals and the standardized devi-ance residual to illustrate the model performance. The raw residual, deviance residual, the stan-dardized Pearson residuals and the standardized deviance residual were also assessed forspatial dependence with global Morans’ I, an index of spatial autocorrelation. The model fittingand residual diagnostics were carried out using the SAS genmod procedure with SAS 9.3 (SASInstitute, Inc., Cary, NC, USA) and spatial autocorrelation was measured with ArcGIS 10.1(ERSI, Redlands, CA, USA)
To consider spatial dependence in residuals, a spatial lag model was developed to examinethe association between BU cases and the percentages of land cover classes. For the spatial lagmodel, the dependent variable at village i is assumed to be affected by the neighbors of village i.A general equation for the spatial lag model was shown below [30]:
logðyiÞ ¼ ρW � logðyiÞ þ b0 þ b1x1i þ b2x2i þ . . .þ bnxni ð2Þ
Where, the dependent variable (log (yi)) is the natural logarithm transformed BU prevalence inthe unit of case per 100,000 people, i is the index of the villages, W is the spatial weight matrix,ρ is the spatial autoregressive coefficient, β1. . . βn are the regression coefficients of covariates,and x1. . .xn are the percentages of land cover classes. The covariates in the spatial lag model aresame as that in the top-ranked negative binomial models. The spatial weight matrix W was cre-ated based on the Euclidean distance among villages. After fitting the model, the normality andspatial autocorrelation of model residuals were assessed using Jarque-Bera test and Morans’ I,respectively. The model fitting and residual diagnostics were carried out with GeoDa 1.6.6package [31].
Results
Characterization of BU casesOf the 339 BU cases reported in the study area during 2007–2010, 172 cases were male and 167cases were female. BU cases were found in all age groups (Fig 2). The cases among children< 5years account for 8.6%, age 5–14 account for 19.8%, age 15–34 account for 26.3%, while BUcases among the older population (age� 60 y) account for 22.1%. The Friedman test on thisraw data showed that the number of BU cases among older groups was significantly lower thanthat among the other groups under 60 (p< 0.01) and there was no difference between thenumbers of male cases and female cases (p> 0.05). However, when the number of BU caseswas adjusted by population age structure (the number of the observed BU cases in a specificage or gender group divided by the population in that group) (Fig 2), the prevalence of BU dis-ease was significantly higher for the older population (age� 60) when compared with popula-tion under 60 (p< 0.01).
BU cases were reported in each month, making it possible to detect temporal trends (Fig 3).The number of BU cases was slightly higher in July. It also varied across years and was nearly3.7 times higher in 2008 than that in 2009. The season-trend decomposition analysis alsoshowed that the number of BU cases had a seasonal pattern, which was higher in summer sea-son (June-August, peak at July), and lower in other seasons, and there was a decreasing trend
Buruli Ulcer and Land Cover in Ghana
PLOS Neglected Tropical Diseases | DOI:10.1371/journal.pntd.0003840 June 19, 2015 8 / 19

by year (S1 Fig). In terms of the location of the disease on the human body, 74% of lesions werefound in lower limbs and 21.5% were found in upper limbs.
Spatial distribution and cluster of BU diseaseOf the 85 villages in which BU cases were used for spatial analysis, most were located in CentralRegion andWestern Region. The Upper Denkyira District in Central Region andWasa AmenfiEast District in the Western Region have the most BU cases, which accounted for 62.2% and15.3% of the total cases, respectively. Some individual villages/towns such as Dunkwa, Domi-nase, Ayanfuri, Jameso Nikwanta, and Maudaso had a high number of BU cases (>10 cases).
The spatial scan analysis identified two significant BU clusters (the number of BUcases> 10; p< 0.01) in southwestern Ghana, one primary cluster and one secondary cluster.The primary cluster was located at 5.930°N and 1.861°W with a radius of 22.94 km. It included33 villages and 174 BU cases (Fig 4). The secondary cluster was located at 6.135° N and 2.118°W with a radius of 10.75 km, which includes 9 villages and 45 BU cases (Fig 4).
Fig 2. Age and sex of hospital-collected BU cases and population age structure in southwestern Ghana. Upper left: The distribution of BU diseases byage and sex; upper right: The adjusted distribution of BU prevalence by age and sex. The age structure in Ghana in 2010 was used to adjust BU cases in eachage and sex group; bottom left: the population age structure in Ghana in 2010; bottom right: the population age structure in Central region, Ghana, in 2010.
doi:10.1371/journal.pntd.0003840.g002
Buruli Ulcer and Land Cover in Ghana
PLOS Neglected Tropical Diseases | DOI:10.1371/journal.pntd.0003840 June 19, 2015 9 / 19

Association of BU with land coverThe overall accuracy of the land cover classification for the high resolution (Rapid Eye) andmedium resolution (Landsat) was 93.4% and 82.2%, respectively. Based on the Rapid Eyeimage, the major type of land cover class is agriculture (70.2%), followed by forest (12.4%) andgrassland (11.7%). Water and mining areas are relatively small, only accounting for 1.0–1.5%(Figs 5 and 6). The classified Rapid Eye image showed that many small scale mining patcheswere distributed along the river edge or near adjacent water areas (Fig 5).
The types of land cover classes in the entire study area covered by the Landsat images (asshown in Fig 1) are similar as those in the area covered by the Rapid Eye image in the BU clus-tered area. However, the percentages of water, mining and agriculture areas in the entire studyarea were smaller than these in the BU clustered area, especially for water and mining areas(Fig 6). Wilcoxon signed-rank test showed that land cover components were not significantlydifferent between the two spatial extents (the entire study area vs. the BU clustered area,p>0.05). In the entire study area, there is nearly 16% of land cover in the unclassified category,largely due to the dysfunction of the satellite detector.
The results of the final negative binomial regression model based on AIC values are pre-sented in Table 2, showing that associations between BU prevalence and the percentages ofland cover classes at the village level varied as a function of buffer distances (around a village/town). Overall, the percentage of urban area had a significantly negative association (p<0.01)with BU prevalence in all distances from 1 km to 40 km with the mean regression coefficientranging from-2.109 to -0.035, indicating that more urbanized villages might have a low risk ofBU prevalence. The percentage of water area had a positive association with BU prevalence inthe distances from 1 km to 20 km and associations were significant except that at 1 km, ofwhich p value was slightly above 0.05. The mean regression coefficient for the water variableranged from 0.224 to 2.950 and was larger than these of other covariates, which suggested thatthe increase in water area in a buffer in 2.5–20 kmmight lead to a large increase in BU
Fig 3. Monthly variation of BU cases during 2007–2010. BU cases were collected from October 2007 to March 2010. There were 11.3 cases in eachmonth on average and the highest number of BU (27 cases) was observed in July 2008.
doi:10.1371/journal.pntd.0003840.g003
Buruli Ulcer and Land Cover in Ghana
PLOS Neglected Tropical Diseases | DOI:10.1371/journal.pntd.0003840 June 19, 2015 10 / 19

prevalence. However, when the distance was 30 km and 40 km, the positive associationbetween water and BU was not held. Instead, the percentage of mining area showed a strongpositive association with BU (p<0.01, β = 3.266–4.195). The percentages of grassland and agri-culture also had positive associations with BU prevalence. The association for grassland areawas significant at all distances, and the association for agriculture was significant at 30 km to40 km. The increases in grassland and agriculture areas might slightly increase BU prevalencein some spatial extents, as indicated by the regression coefficients of both covariates, whichranged from 0.014 to 0.136 and 0.091 to 0.111, respectively. The association between the per-centage of forest and BU prevalence varied as the change of the buffer distances, which waspositive at the distances of 1, 2.5 and 5km, and was negative at the distances of 20, 30 and40km, respectively. The association was significant only at 2.5 km and 5 km. Two interactionterms, water with mining and water with agriculture, were not selected in the final model basedon AIC, likely because the term was strongly correlated with individual land covers (S2 Table).The evaluation of model performance for the final model with the smallest AIC value (dis-tance = 30 km) showed that the model fitted the data very well, indicated by very small stan-dardized Pearson residuals and standardized deviance residuals (S2 Fig). The examination of
Fig 4. Spatial distribution and spatial cluster of BU cases and prevalence. The map to the left shows the spatial distribution of BU cases in each village/town. The large yellow circle is the primary cluster of BU disease, which is located at 5.930°N and 1.861°Wwith a radius of 22.94 km. It includes 33 villagesand 174 BU cases. The map to the right is the spatial distribution of BU prevalence in each village/town. The prevalence is calculated using the number of BUcases divided by the population in each village.
doi:10.1371/journal.pntd.0003840.g004
Buruli Ulcer and Land Cover in Ghana
PLOS Neglected Tropical Diseases | DOI:10.1371/journal.pntd.0003840 June 19, 2015 11 / 19

Moran’s I showed that both standardized residuals had no significant spatial autocorrelation,while the raw residuals were spatially correlated.
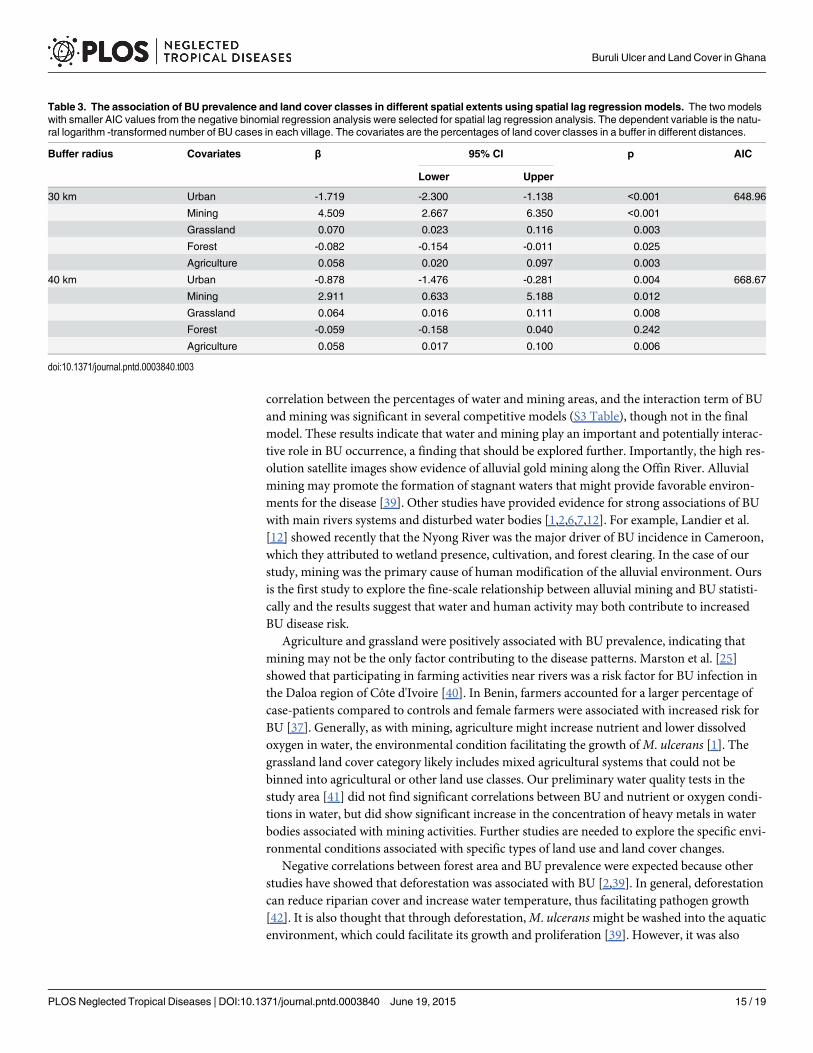
The dependent variable and covariates in two top-ranked negative binomial regressionmodels based on the AIC values were re-examined by spatial lag models. In the 30 km bufferradius, the percentages of mining, grassland and agriculture areas had positive associationswith BU prevalence, and urban and forest areas had a negative association. In the 40 km bufferradius, the percentages of mining, grassland and agriculture areas also had significantly positiveassociations with BU prevalence, and the percentage of urban area was negatively associatedwith BU prevalence, however, the association between forest and BU prevalence was not signif-icant. (Table 3).
DiscussionIn this study, we characterized recent cases of BU in southwestern Ghana, identified BU clus-ters, quantified land cover at two different spatial resolutions (Rapid Eye and Landsat), andevaluated the association between BU prevalence and six types of land cover classes at differentspatial extents at the village level. We found that the older population (age� 60) has a higher
Fig 5. Land cover map of the primary BU cluster based on the classification of the Rapid Eye image.Bottom inset shows extent of satellite imagery within the cluster. The area has a few villages/towns with ahigh number of BU cases, e.g. Ayanfuri and Pokukrom.
doi:10.1371/journal.pntd.0003840.g005
Buruli Ulcer and Land Cover in Ghana
PLOS Neglected Tropical Diseases | DOI:10.1371/journal.pntd.0003840 June 19, 2015 12 / 19

prevalence than other age groups, indicating higher vulnerability to BU disease. We illustratedthat mining and water areas were prevalent in the BU clustered area with high resolution satel-lite imagery. Moreover, we revealed that urban, water, grassland and mining areas werestrongly associated with BU prevalence in the area. While the importance of mining has beenindependently proposed as key factors, no previous study has quantified their effects at the vil-lage level. To our knowledge, these findings have not been reported in Ghana before and mightprovide new insight in BU disease intervention and control.
It is known that BU disease affects people of all age groups. However, the age group mostassociated with BU is still debated. Several studies on BU in African countries showed that chil-dren less than 15 years of age had a higher risk for BU [6,32,33], while in southeastern Austra-lia, people>60 years of age were associated with a higher rate of BU [34]. There are also somestudies showing that both young children and old adults could have a higher risk for BU [35–37]. Our results showed that young children (< 20 y) had a higher number of BU cases in con-trast to older people. However, after adjusting disease rates by population age structure, werevealed that older people (� 60 y) had a higher risk of contracting BU. Our results suggestedthat a higher number of BU among children in Africa reported in previous studies did not sup-port that young children were a high-risk group for BU disease, because younger childrenaccount for a higher percentage of total population than other age groups while older peopleaccount for a lower percentage (Fig 2). Our results from Ghana thus indicate that older maleshad the highest risk for BU disease, which is consistent with the conclusion by Debackert et al.[36] after adjusting for age distribution.
Using spatial scan statistics, we identified two BU disease clusters, one primary cluster with174 BU cases and one secondary cluster with 45 cases. The prevalence rates in both clusters aregreater than average prevalence rates. The primary cluster covered the main part of upper Den-kyira East District, east part of Wasa Amenfi West District, and south part of Obuasi
Fig 6. Comparison of land cover in the BU clustered area (574 km2) with the whole study area (31,580 km2). Here, the clustered area denotes the areacovered by the Rapid Eye image in the primary cluster of BU disease as shown in Fig 5; the whole area is the area covered by the Landsat image as shown inFig 1.
doi:10.1371/journal.pntd.0003840.g006
Buruli Ulcer and Land Cover in Ghana
PLOS Neglected Tropical Diseases | DOI:10.1371/journal.pntd.0003840 June 19, 2015 13 / 19

Municipal, Amansie Central and Amansie West District, where a higher prevalence of BU hasbeen observed [15]. The identification of disease clusters helps us target the specific area withhigher prevalence and form hypotheses on the relationships between land cover and BU dis-ease. With the high resolution satellite images, many alluvial gold mining patches distributedalong the Offin River were evident throughout the BU clustered area. After classifying satelliteimages, we also found that the percentages of water and mining areas in the BU clustered areawere much higher than those in the whole study area. These particular characteristics of landcover in the BU clustered area gave a strong indication that water and mining areas are relatedto BU disease.
Our results affirm the association between and human modification of aquatic ecosystems[1–3,12,38]. Specifically, the regression coefficients for water as a land cover type were statisti-cally significant at the scales from 1 km to 20 km buffers, while at the 30 km and 40 km bufferscales, the association of BU with mining was significant. In addition, there was a strong
Table 2. The association of BU prevalence and land cover classes at different spatial extents using negative binomial regression models. Thedependent variable is the natural logarithm-transformed number of BU cases in each village with the natural logarithm-transformed population in each villageas an offset. The covariates are the percentages of land cover classes in a buffer in different distances. For each buffer distance, the results of the model witha smaller AIC value were presented.
Buffer radius Covariates β 95% CI p AIC
Lower Upper
1 km Urban -0.035 -0.055 -0.015 0.001 590.60
Water 0.224 -0.008 0.457 0.059
Grassland 0.014 0.003 0.024 0.009
Forest 0.025 -0.006 0.055 0.110
2.5 km Urban -0.074 -0.109 -0.039 <0.001 588.15
Water 0.445 0.082 0.808 0.016
Grassland 0.014 0.004 0.024 0.007
Forest 0.025 0.001 0.049 0.043
5 km Urban -0.176 -0.254 -0.097 <0.001 579.85
Water 1.013 0.440 1.585 0.001
Grassland 0.016 0.006 0.026 0.003
Forest 0.027 0.006 0.049 0.014
10 km Urban -0.437 -0.596 -0.278 <0.001 571.24
Water 1.778 0.886 2.671 <0.001
Grassland 0.019 0.007 0.030 0.002
20 km Urban -1.378 -1.784 -0.971 <0.001 561.20
Water 2.950 1.874 4.025 <0.001
Grassland 0.024 0.010 0.038 0.001
Forest -0.021 -0.068 0.027 0.397
30 km Urban -2.109 -2.787 -1.432 <0.001 527.39
Mining 4.195 2.545 5.845 <0.001
Grassland 0.119 0.081 0.157 <0.001
Forest -0.074 -0.162 0.015 0.103
Agriculture 0.091 0.058 0.124 <0.001
40 km Urban -1.686 -2.534 -0.838 <0.001 537.11
Mining 3.266 1.193 5.338 0.002
Grassland 0.136 0.097 0.174 <0.001
Forest -0.095 -0.205 0.016 0.093
Agriculture 0.111 0.077 0.145 <0.001
doi:10.1371/journal.pntd.0003840.t002
Buruli Ulcer and Land Cover in Ghana
PLOS Neglected Tropical Diseases | DOI:10.1371/journal.pntd.0003840 June 19, 2015 14 / 19
correlation between the percentages of water and mining areas, and the interaction term of BUand mining was significant in several competitive models (S3 Table), though not in the finalmodel. These results indicate that water and mining play an important and potentially interac-tive role in BU occurrence, a finding that should be explored further. Importantly, the high res-olution satellite images show evidence of alluvial gold mining along the Offin River. Alluvialmining may promote the formation of stagnant waters that might provide favorable environ-ments for the disease [39]. Other studies have provided evidence for strong associations of BUwith main rivers systems and disturbed water bodies [1,2,6,7,12]. For example, Landier et al.[12] showed recently that the Nyong River was the major driver of BU incidence in Cameroon,which they attributed to wetland presence, cultivation, and forest clearing. In the case of ourstudy, mining was the primary cause of human modification of the alluvial environment. Oursis the first study to explore the fine-scale relationship between alluvial mining and BU statisti-cally and the results suggest that water and human activity may both contribute to increasedBU disease risk.
Agriculture and grassland were positively associated with BU prevalence, indicating thatmining may not be the only factor contributing to the disease patterns. Marston et al. [25]showed that participating in farming activities near rivers was a risk factor for BU infection inthe Daloa region of Côte d'Ivoire [40]. In Benin, farmers accounted for a larger percentage ofcase-patients compared to controls and female farmers were associated with increased risk forBU [37]. Generally, as with mining, agriculture might increase nutrient and lower dissolvedoxygen in water, the environmental condition facilitating the growth ofM. ulcerans [1]. Thegrassland land cover category likely includes mixed agricultural systems that could not bebinned into agricultural or other land use classes. Our preliminary water quality tests in thestudy area [41] did not find significant correlations between BU and nutrient or oxygen condi-tions in water, but did show significant increase in the concentration of heavy metals in waterbodies associated with mining activities. Further studies are needed to explore the specific envi-ronmental conditions associated with specific types of land use and land cover changes.
Negative correlations between forest area and BU prevalence were expected because otherstudies have showed that deforestation was associated with BU [2,39]. In general, deforestationcan reduce riparian cover and increase water temperature, thus facilitating pathogen growth[42]. It is also thought that through deforestation,M. ulceransmight be washed into the aquaticenvironment, which could facilitate its growth and proliferation [39]. However, it was also
Table 3. The association of BU prevalence and land cover classes in different spatial extents using spatial lag regression models. The two modelswith smaller AIC values from the negative binomial regression analysis were selected for spatial lag regression analysis. The dependent variable is the natu-ral logarithm -transformed number of BU cases in each village. The covariates are the percentages of land cover classes in a buffer in different distances.
Buffer radius Covariates β 95% CI p AIC
Lower Upper
30 km Urban -1.719 -2.300 -1.138 <0.001 648.96
Mining 4.509 2.667 6.350 <0.001
Grassland 0.070 0.023 0.116 0.003
Forest -0.082 -0.154 -0.011 0.025
Agriculture 0.058 0.020 0.097 0.003
40 km Urban -0.878 -1.476 -0.281 0.004 668.67
Mining 2.911 0.633 5.188 0.012
Grassland 0.064 0.016 0.111 0.008
Forest -0.059 -0.158 0.040 0.242
Agriculture 0.058 0.017 0.100 0.006
doi:10.1371/journal.pntd.0003840.t003
Buruli Ulcer and Land Cover in Ghana
PLOS Neglected Tropical Diseases | DOI:10.1371/journal.pntd.0003840 June 19, 2015 15 / 19

reported that forest might have a positive association with BU prevalence, e.g., the relationshipbetween BU prevalence and forest in Benin [8]. In our study, the negative association betweenthe percentage of forest area and BU prevalence was not significant and there were positiveassociations, suggesting the relationship between forest and BU might be complicated.
Finally, urban land cover was negatively correlated with BU prevalence, which is consistentwith some studies in Benin [8,9]. As explained in these studies, villages with a larger percent ofurban land cover may have better resources to prevent BU disease and better employmentopportunities outside of agriculture and/or mining to lower contact rates with high risk habi-tats [8,9].
Our study has a few limitations. First, similar to many other studies [2,6,8,12,37,43,44], it islikely that the number of BU cases analyzed here is underestimated because if BU patients didnot visit hospitals or clinics, we would not have those records. Second, due to the coarse resolu-tion (30 m) of Landsat images, we used a conserved land use classification across both sets ofimagery. We do not exclude the possibility that some subclasses of land cover, e.g. cocoa farms,rubber and palm plantations, which are common in the area, might have significant associa-tions with BU prevalence. Similarly, we cannot capture small water patches with the Landsatimages, which may underestimate the percentage of water area in the whole study area. For theLandsat image, nearly 16% of the land cover was not classified, mainly caused by the scan lineissue. However, the results from the simple gap-filling method showed the land cover assign-ments before and after the assignment of unclassified area were very similar, suggesting a lim-ited influence on final results (S3 Fig). However, another potential issue is that we used satelliteimagery at two different spatial resolutions to quantify land cover surrounding villages. For afew villages, quantification of land cover classes in a buffer might contain satellite data fromeither the high resolution image or medium resolution image, or both. However, we expect thiseffect to be minor because the area of the land cover classified with Rapid Eye image onlyaccounted for 1.8% of the total study area. Therefore, in 98.2% of the study area, we used Land-sat. Use of high spatial resolution images across the whole study might be better to illustratethe relationship between BU disease and land cover but these images were not available for theentire study area.
The significant association between BU prevalence and land cover does not suggest thatland cover change and BU disease have a cause-effect relationship. The land cover change maypose an important but indirect role on BU disease through its impacts on human activities, vec-tor habitat and pathogen distribution. Future studies should investigate how land cover changeaffects the occurrence of BU disease through landscape pattern analysis and participatory com-munity-based surveys, and examine other risk factors in the area of inquiry, such as socioeco-nomic status, and environmental and climatic factors. Based on our results, we also suggestthat the environmental characteristics of alternative land uses (e.g., mining, agriculture, andtheir interaction) on water quality in alluvial environments in BU endemic areas is importantfor understanding spatial patterns of the disease.
Supporting InformationS1 Table. Summary statistics of land cover classes in different buffer distances.(DOCX)
S2 Table. The result of Pearson correlation between the percentages of each individual landcover class with two interaction terms.(DOCX)
Buruli Ulcer and Land Cover in Ghana
PLOS Neglected Tropical Diseases | DOI:10.1371/journal.pntd.0003840 June 19, 2015 16 / 19

S3 Table. The association of BU prevalence and the interaction between water and miningat different spatial extents using negative binomial regression models.(DOCX)
S1 Fig. Seasonal-trend decomposition analysis of monthly BU cases.(DOCX)
S2 Fig. The standardized Pearson residual and the standardized deviance residual fromnegative binomial regression model with a buffer radius of 30 km.(DOCX)
S3 Fig. Comparison of land cover components before (plot A) and after (plot B) the assign-ment of unclassified pixels.(DOCX)
AcknowledgmentsWe would like to acknowledge our other team members in the U.S. and in Ghana for theirassistance, especially Charles Abbey, Richard Amankwah, Seth Boahen, Nathan Clay, EffahEmmanual, Julianne Hagarty, Mario Machado, Savior Mantey, Frank Nyame, Karen PaivaHenrique, Grace Ofori-Sarpong, Kamini Singha, and Amanda Young.
Author ContributionsConceived and designed the experiments: JW EAHS EK DF VR HH JO PT. Performed theexperiments: JW EAHS. Analyzed the data: JW. Contributed reagents/materials/analysis tools:EK. Wrote the paper: JW EAHS. Revised manuscript critically for important intellectual con-tent: EK DF VR HH JO PT.
References1. Merritt RW, Walker ED, Small PL, Wallace JR, Johnson PD, et al. (2010) Ecology and transmission of
Buruli ulcer disease: a systematic review. PLoS Negl Trop Dis 4: e911. doi: 10.1371/journal.pntd.0000911 PMID: 21179505
2. Merritt RW, BenbowME, Small PLC (2005) Unraveling an emerging disease associated with disturbedaquatic environments: the case of Buruli ulcer. Frontiers in Ecology and the Environment 3: 323–331.
3. Johnson PDR, Stinear T, Small PLC, Pluschke G, Merritt RW, et al. (2005) Buruli ulcer (M-ulceransinfection): New insights, new hope for disease control (vol 2, pg 282, 2005). Plos Medicine 2: 463–463.
4. Bayley AC (1971) Buruli ulcer in Ghana. British Medical Journal 2: 401–402. PMID: 5575986
5. Veitch MGK, Johnson PDR, Flood PE, Leslie DE, Street AC, et al. (1997) A large localized outbreak ofMycobacterium ulcerans infection on a temperate southern Australian island. Epidemiology and Infec-tion 119: 313–318. PMID: 9440434
6. Aiga H, Amano T, Cairncross S, Domako JA, Nanas OK, et al. (2004) Assessing water-related risk fac-tors for Buruli ulcer: A case-control study in Ghana. American Journal of Tropical Medicine and Hygiene71: 387–392. PMID: 15516631
7. Duker AA, Carranza EJ, Hale M (2004) Spatial dependency of Buruli ulcer prevalence on arsenic-enriched domains in Amansie West District, Ghana: implications for arsenic mediation in Mycobacte-rium ulcerans infection. Int J Health Geogr 3: 19. PMID: 15369592
8. Wagner T, BenbowME, Brenden TO, Qi J, Johnson RC (2008) Buruli ulcer disease prevalence inBenin, West Africa: associations with land use/cover and the identification of disease clusters. Int JHealth Geogr 7.
9. Wagner T, BenbowME, Burns M, Johnson RC, Merritt RW, et al. (2008) A landscape-based model forpredicting Mycobacterium ulcerans infection (Buruli ulcer disease) presence in benin, West Africa. Eco-health 5: 69–79. doi: 10.1007/s10393-007-0148-7 PMID: 18648799
10. van Ravensway J, BenbowME, Tsonis AA, Pierce SJ, Campbell LP, et al. (2012) Climate and Land-scape Factors Associated with Buruli Ulcer Incidence in Victoria, Australia. Plos One 7.
Buruli Ulcer and Land Cover in Ghana
PLOS Neglected Tropical Diseases | DOI:10.1371/journal.pntd.0003840 June 19, 2015 17 / 19

11. Brou T, Broutin H, Elguero E, Asse H, Guegan JF (2008) Landscape Diversity Related to Buruli UlcerDisease in Cote d'Ivoire. Plos Neglected Tropical Diseases 2.
12. Landier J, Gaudart J, Carolan K, Lo Seen D, Gue´gan JF, et al. Spatio-temporal Patterns and Land-scape-Associated Risk of Buruli Ulcer in Akonolinga, Cameroon. PLoS Negl Trop Dis 8: e3123. doi:10.1371/journal.pntd.0003123 PMID: 25188464
13. WHO. (2000) Buruli ulcer—diagnosis of Mycobacterium ulcerans disease. Geneva, Switzerland:World Health Organization.
14. Amofah GK, Sagoemoses C, Adjeiacquah C, Frimpong EH (1993) Epidemiology of Buruli Ulcer inAmansie West District, Ghana. Transactions of the Royal Society of Tropical Medicine and Hygiene87: 644–645. PMID: 8296362
15. Amofah G, Bonsu F, Tetteh C, Okrah J, Asamoa K, et al. (2002) Buruli ulcer in Ghana: Results of anational case search. Emerging Infectious Diseases 8: 167–170. PMID: 11897068
16. WHO. (2013) Global Health Observatory (GHO)- Buruli ulcer.
17. Alo CA, Pontius RG (2008) Identifying systematic land-cover transitions using remote sensing and GIS:the fate of forests inside and outside protected areas of Southwestern Ghana. Environment and Plan-ning B-Planning & Design 35: 280–295. doi: 10.1007/s00128-011-0208-0 PMID: 21290099
18. Braimoh AK (2006) Random and systematic land-cover transitions in northern Ghana. Agriculture Eco-systems & Environment 113: 254–263.
19. Denton CJ (2007) Estimating buruli ulcer prevalence in southwestern Ghana [Master thesis]: Universityof North Texas.
20. RuckthongsookW (2011) The impact of land use and land cover change on the spatial distribution ofburuli ulcer in southwest Ghana [Master thesis]: University of North Texas.
21. Cleveland RB, Cleveland WS, McRae JE, Terpenning I (1990) STL: A seasonal-trend decompositionprocedure based on loess. Journal of Official Statistics 6: 3–73.
22. Wu J, Smithwick E.A.H., Ferring D, Hausermann H, Oppong J, et al. (2015) Buruli Ulcer (BU) and land-scape disturbance in Ghana 2007–2010. Data set. [http://www.datacommons.psu.edu/] at The Penn-sylvania State University, University Park, Pennsylvania, U.S.A.
23. Kulldorff M (1997) A spatial scan statistic. Communications in Statistics-Theory and Methods 26:1481–1496.
24. Kulldorff M (2006) SaTScan TM Users Guide. Boston.
25. Kulldorff M, Heffernan R, Hartman J, Assuncao R, Mostashari F (2005) A space-time permutation scanstatistic for disease outbreak detection. PLoS Med 2: e59. PMID: 15719066
26. Kauth RJ, Thomas GS. The tasseled cap-a graphic description of the spectral-temporal development ofagricultural crops as seen by Landsat.; 1976; Purdue Univ., West Lafayette, Indiana. pp. 41–51.
27. Anderson JR, Hardy EE, Roach JT, Witmer RE (1976) A land use and land cover classification systemfor use with remote sensor data. U.S. Geological Survey Professional Paper 964: U.S. GovernmentPrinting Office, Washington, D.C.
28. Schueler V, Kuemmerle T, Schroder H (2011) Impacts of Surface Gold Mining on Land Use Systems inWestern Ghana. Ambio 40: 528–539. PMID: 21848141
29. Jabar ASA, Sulong G, George LE (2014) Survey on gap filling algorithms in Landsat 7 ETM+ images.Journal of Theoretical and Applied Information Technology 63: 136–146.
30. Weisent J, Rohrbach B, Dunn JR (2012) Socioeconomic determinants of geographic disparities in cam-pylobacteriosis risk: a comparison of global and local modeling approaches. International journal ofhealth geographics 11: 45. doi: 10.1186/1476-072X-11-45 PMID: 23061540
31. Anselin L, Syabri I, Kho Y (2010) GeoDa: an introduction to spatial data analysis. Handbook of AppliedSpatial Analysis: Springer. pp. 73–89.
32. Marston BJ, Diallo MO, Horsburgh CR Jr., Diomande I, Saki MZ, et al. (1995) Emergence of Buruliulcer disease in the Daloa region of Cote d'Ivoire. Am J Trop Med Hyg 52: 219–224. PMID: 7694962
33. Vanderwerf TS, Vandergraaf WTA, Groothuis DG, Knell AJ (1989) Mycobacterium-Ulcerans Infectionin Ashanti Region, Ghana. Transactions of the Royal Society of Tropical Medicine and Hygiene 83:410–413. PMID: 2617591
34. Quek TY, Athan E, Henry MJ, Pasco JA, Redden-Hoare J, et al. (2007) Risk factors for Mycobacteriumulcerans infection, southeastern Australia. Emerging Infectious Diseases 13: 1661–1666. doi: 10.3201/eid1311.061206 PMID: 18217548
35. Bratschi MW, Bolz M, Minyem JC, Grize L, Wantong FG, et al. (2013) Geographic Distribution, Age Pat-tern and Sites of Lesions in a Cohort of Buruli Ulcer Patients from the Mape Basin of Cameroon. PlosNeglected Tropical Diseases 7.
Buruli Ulcer and Land Cover in Ghana
PLOS Neglected Tropical Diseases | DOI:10.1371/journal.pntd.0003840 June 19, 2015 18 / 19

36. Debacker M, Aguiar J, Steunou C, Zinsou C, MeyersWM, et al. (2004) Mycobacterium ulcerans dis-ease (Buruli ulcer) in rural hospital, southern Benin, 1997–2001. Emerging Infectious Diseases 10:1391–1398. PMID: 15496239
37. Debacker M, Portaels F, Aguiar J, Steunou C, Zinsou C, et al. (2006) Risk factors for Buruli ulcer,Benin. Emerging Infectious Diseases 12: 1325–1331. PMID: 17073079
38. Williamson HR, BenbowME, Nguyen KD, Beachboard DC, Kimbirauskas RK, et al. (2008) Distributionof Mycobacterium ulcerans in Buruli Ulcer Endemic and Non-Endemic Aquatic Sites in Ghana. PlosNeglected Tropical Diseases 2.
39. Hayman J (1991) Postulated epidemiology of Mycobacterium ulcerans infection. Int J Epidemiol 20:1093–1098. PMID: 1800409
40. Marston BJ, Diallo MO, Horsburgh CR Jr., Diomande I, Saki MZ, et al. (1995) Emergence of Buruliulcer disease in the Daloa region of Cote d'Ivoire. American Journal of Tropical Medicine and Hygiene52: 219–224. PMID: 7694962
41. Hagarty H (2012) Spatial variation of chemical constituents in natural waters and their relation to inci-dence of Buruli ulcer in gold-mining regions of Ghana [Master thesis]: The Pennsylvania StateUniversity.
42. Portaels F, Chemlal K, Elsen P, Johnson PDR, Hayman JA, et al. (2001) Mycobacterium ulcerans inwild animals. Rev sci tech Off int Epiz 20: 252–264. PMID: 11288515
43. Stienstra Y, van der Graaf WTA, Asamoa K, van der Werf TS (2002) Beliefs and attitudes toward Buruliulcer in Ghana. American Journal of Tropical Medicine and Hygiene 67: 207–213. PMID: 12389949
44. Vincent QB, Ardant MF, Adeye A, Goundote A, Saint-Andre JP, et al. (2014) Clinical epidemiology oflaboratory-confirmed Buruli ulcer in Benin: a cohort study. Lancet Glob Health 2: e422–430. doi: 10.1016/S2214-109X(14)70223-2 PMID: 25103396
Buruli Ulcer and Land Cover in Ghana
PLOS Neglected Tropical Diseases | DOI:10.1371/journal.pntd.0003840 June 19, 2015 19 / 19