Building-Human-Capital-Lessons-from-Country-Experiences ...
72
Public Disclosure Authorized Public Disclosure Authorized Public Disclosure Authorized Public Disclosure Authorized
-
Upload
khangminh22 -
Category
Documents
-
view
1 -
download
0
Transcript of Building-Human-Capital-Lessons-from-Country-Experiences ...

Pub
lic D
iscl
osur
e A
utho
rized
Pub
lic D
iscl
osur
e A
utho
rized
Pub
lic D
iscl
osur
e A
utho
rized
Pub
lic D
iscl
osur
e A
utho
rized


BUILDING HUMAN CAPITAL
LESSONS FROM COUNTRY EXPERIENCES
The Trajectory of Human Capital Development in the Philippines
Abstract


Contents
1. Introduction .................................................................................... 1
Analytical Framework ..................................................................................... 1
Country context .............................................................................................. 2
2. A Policy Framework for Human Capital Development .................. 4
3. Trends and Patterns: Strong Beginnings, Modest and Unequal
Progress ............................................................................................... 7
Human Capital Index ..................................................................................... 7
Long-Run Trends in Human Capital Indicators .............................................. 8
Weaknesses (and Challenges) ...................................................................... 18
Conclusion .................................................................................................... 28
4. From Single-Sector to Transversal Approaches ............................ 31
Single-Sector Policies ................................................................................... 33
Whole-of-Government Approach .................................................................. 36
Whole-of-Life Approach ............................................................................... 39
Whole-of-Society Approach .......................................................................... 42
5. Summary and Future Challenges .................................................. 44
References ......................................................................................... 47
Annex 1 .............................................................................................. 53
Annex 2 .............................................................................................. 56
Figures
Figure 1: The HCI Score of the Philippines and Its Neighbors, 2018 .................................................. 3
Figure 2: Components of the Philippine Human Capital Index, 2018 ................................................. 8
Figure 3: Enrollment Rates and Expected Years of Schooling, 1950–2010 ...................................... 10
Figure 4: Per-Capita GDP and Average Performance of Students on 2018 PISA Tests .................... 12
Figure 5: Life Expectancy at Birth (Years), 1950–2015 .................................................................... 13
Figure 6: Healthy Life Expectancy at Birth, Males and Females (Years), 2000–2016 ...................... 14
Figure 7: Under-5 Child Mortality, 1950—55 through 2015–20 ........................................................ 15
Figure 8: Leading Causes of Death and Percentage Change, All Ages, 2007 and 2017 ................... 16
Figure 9: Under-5 Stunting (%), 1990–2015 .................................................................................... 18
Figure 10: Philippines HCI by Region and Wealth Quintile, 2017 ..................................................... 19
Figure 11: Philippines HCI Indicators by Region, 1998 and 2017 .................................................... 22
Figure 12: Selected Service Delivery Indicators by Region............................................................... 23
Figure 13: GDP per Capita and Education and Health Government Spending, 2017 ....................... 30
Tables
Table 1: Leading Causes of Morbidity by Gender, 2005 and 2015 .................................................... 17
Table 2: Human Capital Indicators by Wealth Quintile, 1993 and 2017 (%) ................................... 20
Table 3: List and Timeline of Policies Related to Human Capital Development ............................... 32
Annex Tables
Annex Table 1.1: List of Selected Legislation and Executive Acts Pertaining to Human Capital
Development ....................................................................................................................................... 53
Annex Table 2.1: Regions and Provinces of the Philippines .............................................................. 59
Annex Table 2.2: Distribution of Population Aged 6 and Over by Highest Education Level Attended,
Rural-Urban Residence, and Wealth Quintile (%), 1993 and 2017 ......................................... 60
Annex Table 2.3: Government education spending, as % of GDP .................................................... 60
Annex Figures
Annex Figure 2.1: Migrant Remittance Inflows (US$ million), 1977–2017 ..................................... 56
Annex Figure 2.2: School Enrollment by Age Group and Region, 2017 ............................................ 56
Annex Figure 2.3: Average Pupil-Teacher Ratios in Primary Education in the Philippines and
Comparator Countries, 1990–2016 ........................................................................................... 57
Annex Figure 2.4: Supply of Health Professionals in the Philippines and Comparator Countries,
2000–2015 ................................................................................................................................. 57
Annex Figure 2.5: Population with at least Basic Drinking Water in the Philippines and Comparator
Countries, 2000–2015 ............................................................................................................... 58
Annex Figure 2.6: Population with at least Basic Sanitation Services in the Philippines and
Comparator Countries, 2000–2015 ........................................................................................... 58

Acknowledgments

1. Introduction
Analytical Framework
•
•
•
5F
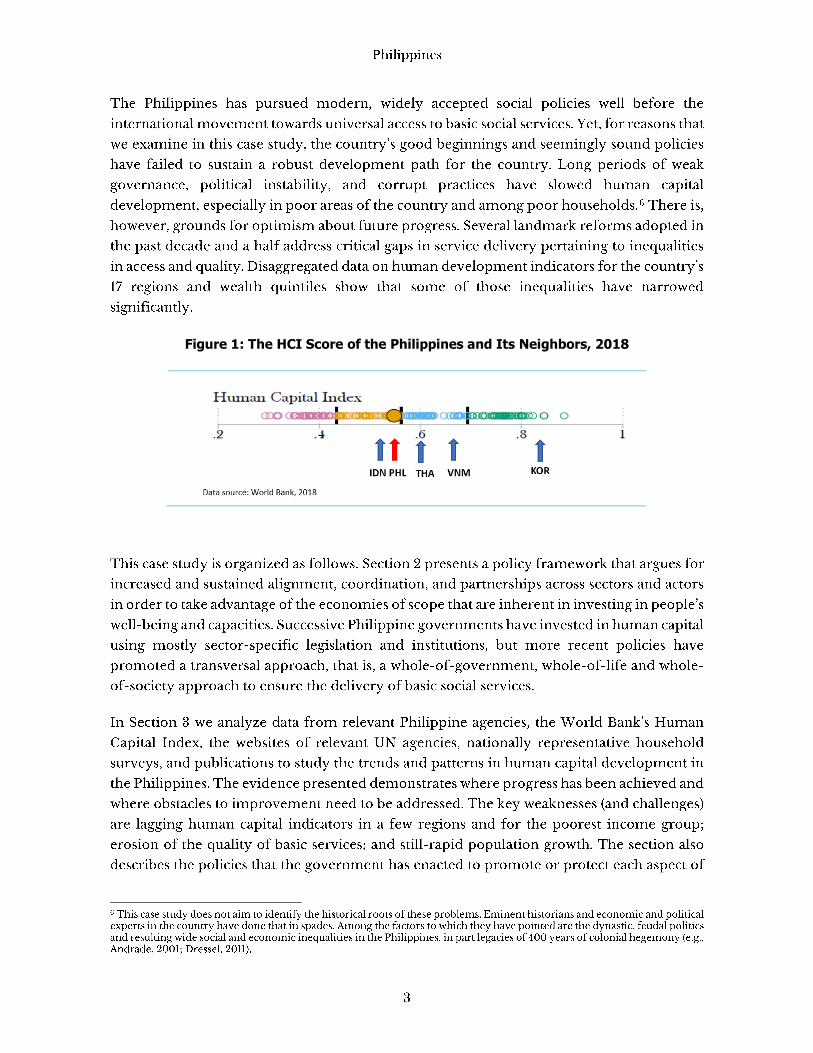
Figure 1: The HCI Score of the Philippines and Its Neighbors, 2018
2. A Policy Framework for Human Capital Development
6 F

7F
•
•
•
8F

3. Trends and Patterns: Strong Beginnings, Modest and Unequal Progress
Human Capital Index
9 F
10F
10

Figure 2: Components of the Philippine Human Capital Index, 2018
Long-Run Trends in Human Capital Indicators
11F

12F
13 F
14 F

Figure 3: Enrollment Rates and Expected Years of Schooling, 1950–2010
40.0
50.0
60.0
70.0
80.0
90.0
100.0
110.0
19
70
19
73
19
76
19
79
19
82
19
85
19
88
19
91
19
94
19
97
20
00
20
03
20
06
20
09
20
12
20
15
Completion rate in primary education (%)
EAP LMC UMC PHL
0
10
20
30
40
50
60
70
80
90
100
19
70
19
73
19
76
19
79
19
82
19
85
19
88
19
91
19
94
19
97
20
00
20
03
20
06
20
09
20
12
20
15
Gross enrollment rate in secondary education (%)
EAP LMC UMC PHL
0.0
10.0
20.0
30.0
40.0
50.0
60.0
19
70
19
73
19
76
19
79
19
82
19
85
19
88
19
91
19
94
19
97
20
00
20
03
20
06
20
09
20
12
20
15
Gross enrollment rate in tertiary education (%)
EAP LMC UMC PHL
0
2
4
6
8
10
12
14
19
50
19
55
19
60
19
65
19
70
19
75
19
80
19
85
19
90
19
95
20
00
20
05
20
10
Years of completed schooling, 15–
19 years old
China IndonesiaMalaysia PhilippinesSouth Korea Thailand

15F
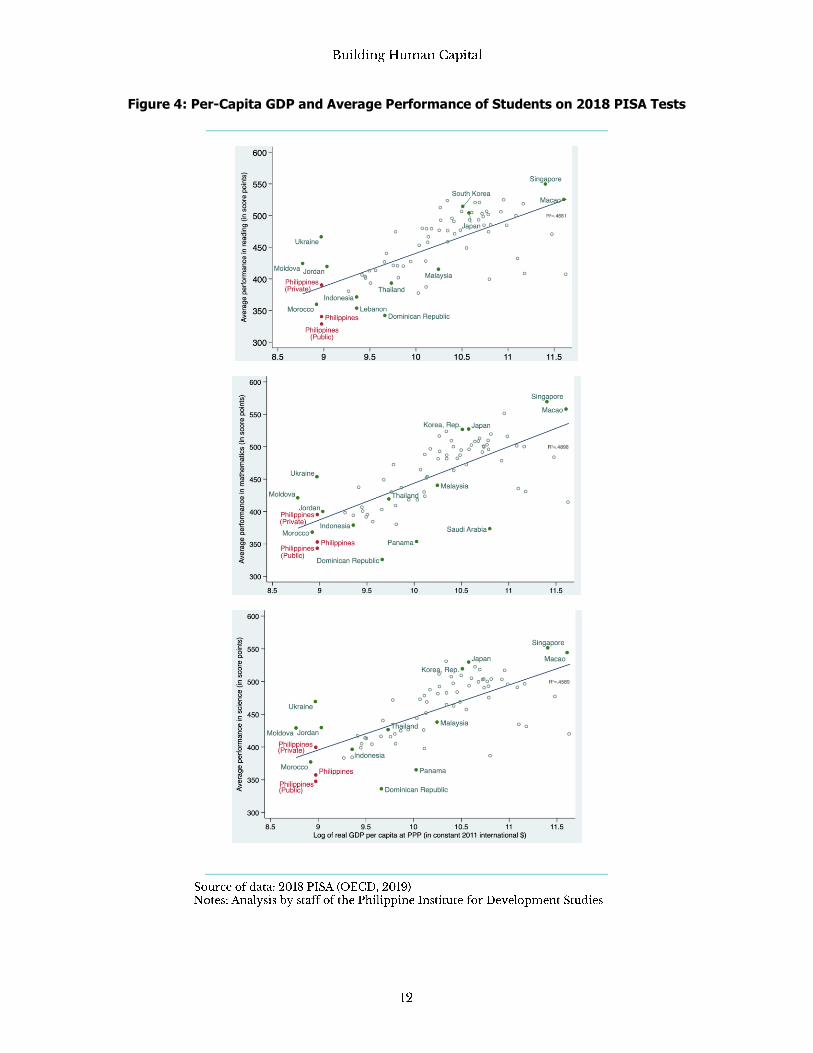
Figure 4: Per-Capita GDP and Average Performance of Students on 2018 PISA Tests

16F
Figure 5: Life Expectancy at Birth (Years), 1950–2015
40
50
60
70
80
90
1950-1955 1965-1970 1980-1985 1995-2000 2010-2015
China Indonesia South Korea MalaysiaPhilippines Thailand Viet Nam

Figure 6: Healthy Life Expectancy at Birth, Males and Females (Years), 2000–2016
50
60
70
80
2000 2005 2010 2016
Healthy life expectancy at birth (years), males
China IndonesiaSouth Korea MalaysiaPhilippines ThailandViet Nam
50
60
70
80
2000 2005 2010 2016
Healthy life expectancy at birth (years), females
China IndonesiaSouth Korea MalaysiaPhilippines ThailandViet Nam

Figure 7: Under-5 Child Mortality, 1950—55 through 2015–20
17F
18F
19F
0
50
100
150
200
250
300
China Indonesia South Korea
Malaysia Philippines Thailand
Viet Nam

20F
21F
Figure 8: Leading Causes of Death and Percentage Change, All Ages, 2007 and 2017

Table 1: Leading Causes of Morbidity by Gender, 2005 and 2015

Figure 9: Under-5 Stunting (%), 1990–2015
22F
23F
Weaknesses (and Challenges)
24F
25 F
26F
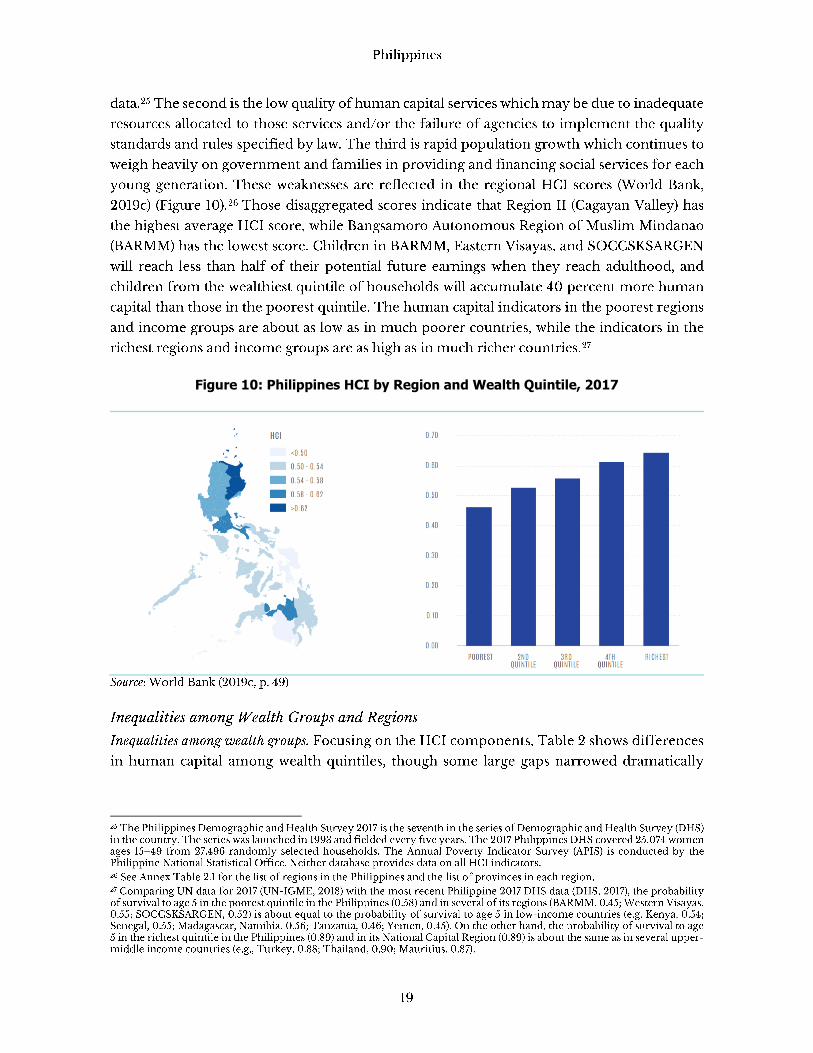
Figure 10: Philippines HCI by Region and Wealth Quintile, 2017

27F
Table 2: Human Capital Indicators by Wealth Quintile, 1993 and 2017 (%)
28

Figure 11: Philippines HCI Indicators by Region, 1998 and 2017
0
10
20
30
40
50
60
70
80
90
100
XV
I
VIII
XV
II
XIII XII IX X XI V II
XV I
IV VI
XIV II
I
VII
Under-5 Mortality Rate (%)
1998 2017
0123456789
101112
XV
I
VIII
XV
II IX V
VII
XIII XV II X VI
XII XI I III
IV
XIV
Median number of years of education, ages 15–49
1998 2017
0
5
10
15
20
25
30
35
40
45
50
XVI VIII XVII V XII VI IX VII X XV XIII XI I II IV XIV III
Under-5 Stunting (%), 2015
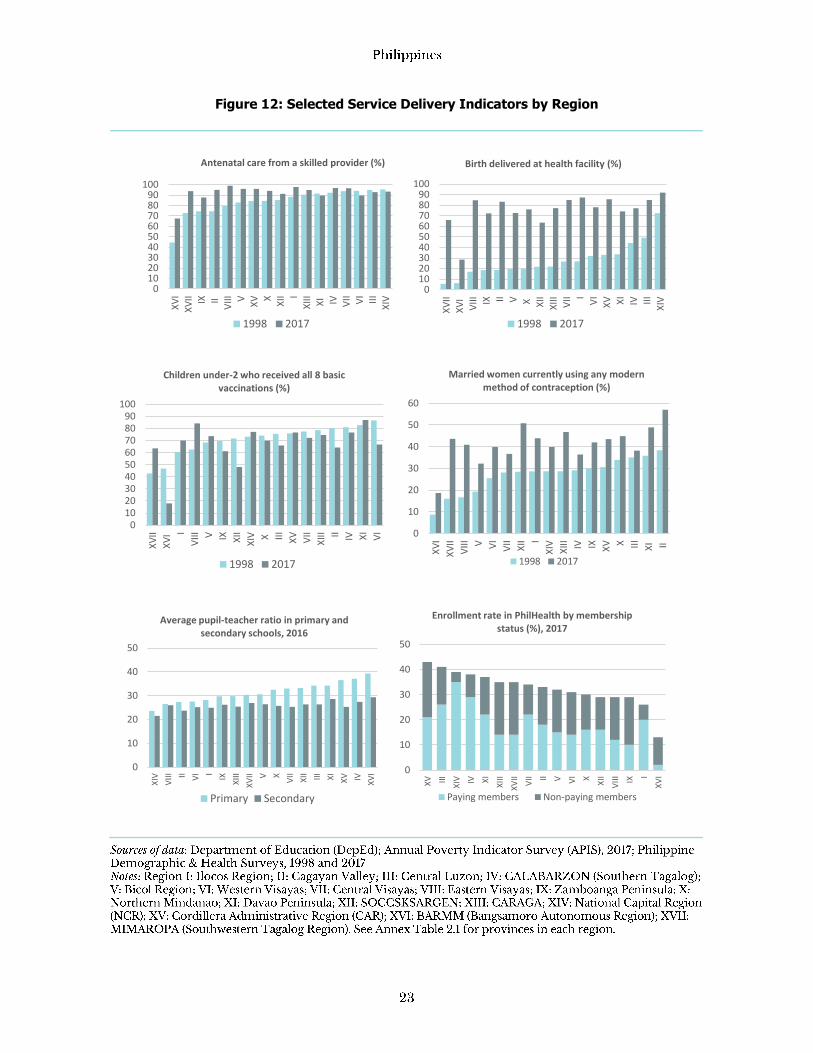
Figure 12: Selected Service Delivery Indicators by Region
0102030405060708090
100X
VI
XV
II IX IIV
III VX
V XX
II IX
III XI IV VII VI
III
XIV
Antenatal care from a skilled provider (%)
1998 2017
0102030405060708090
100
XV
II
XV
I
VIII IX II V X XII
XIII VII I
VI
XV XI
IV III
XIV
Birth delivered at health facility (%)
1998 2017
0102030405060708090
100
XV
II
XV
I I
VIII V IX XII
XIV X II
I
XV
VII
XIII II IV X
I
VI
Children under-2 who received all 8 basic vaccinations (%)
1998 2017
0
10
20
30
40
50
60
XV
I
XV
II
VIII V V
I
VII
XII I
XIV XIII IV IX XV X III
XI II
Married women currently using any modern method of contraception (%)
1998 2017
0
10
20
30
40
50
XIV
VII
I II VI I
IX
XII
I
XV
II V X
VII
XII III XI
XV IV
XV
I
Average pupil-teacher ratio in primary and secondary schools, 2016
Primary Secondary
0
10
20
30
40
50
XV III
XIV IV X
I
XII
I
XV
II
VII II V VI X
XII
VII
I
IX
I
XV
I
Enrollment rate in PhilHealth by membership status (%), 2017
Paying members Non-paying members

30F
31F
32F
33F

34F
35F

36F
37F
38F
39
39F
40
40F
41F
42F
43F
44F
45F
46F
47F
48 F
49F
50F
51F
Conclusion
contraception sexual education
individuals and couples
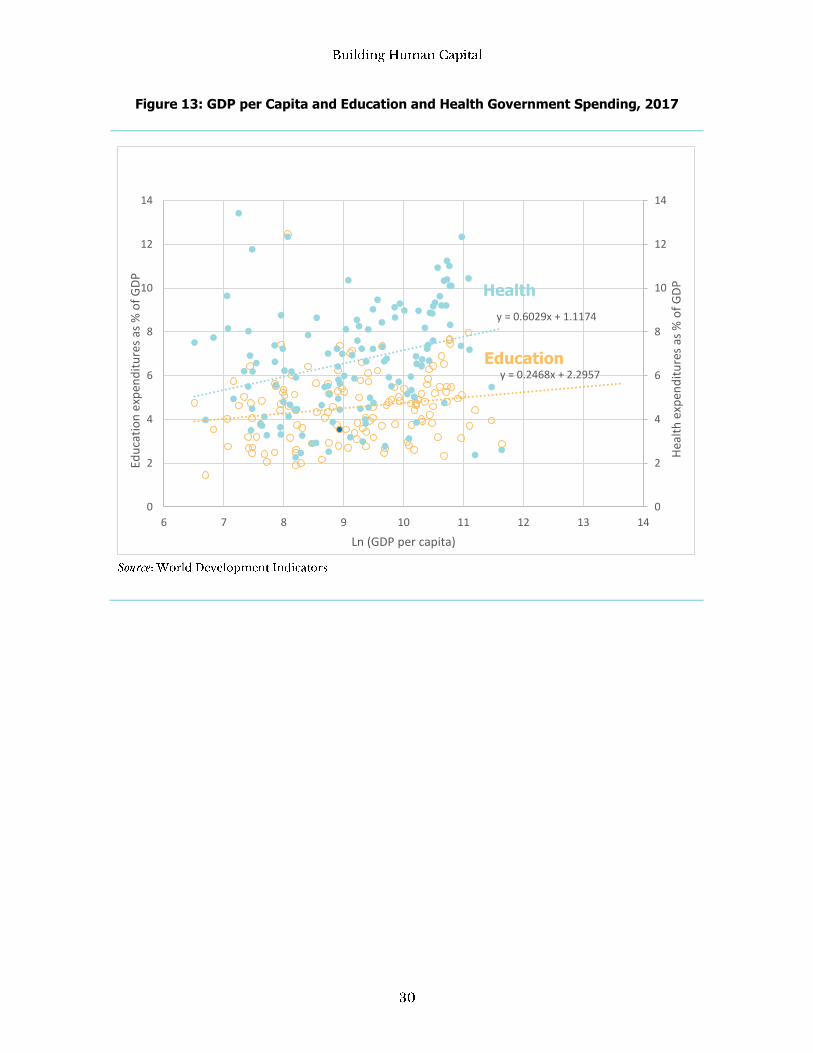
Figure 13: GDP per Capita and Education and Health Government Spending, 2017
y = 0.2468x + 2.2957
y = 0.6029x + 1.1174
0
2
4
6
8
10
12
14
0
2
4
6
8
10
12
14
6 7 8 9 10 11 12 13 14
Hea
lth
exp
end
itu
res
as %
of
GD
P
Edu
cati
on
exp
end
itu
res
as %
of
GD
P
Ln (GDP per capita)
Health
Education

4. From Single-Sector to Transversal Approaches

Table 3: List and Timeline of Policies Related to Human Capital Development
Single-Sector Policies
53F
54F

55F

56 F
57 F

Whole-of-Government Approach
58F
59F
60 F

61 F
62 F
63F
64F
65F

Whole-of-Life Approach

66F
67F
68F
69F

73F
74F
Whole-of-Society Approach
75F

76F
77F
78F
79F

80F
81F
5. Summary and Future Challenges
82F
83F

84F

References


Annex 1
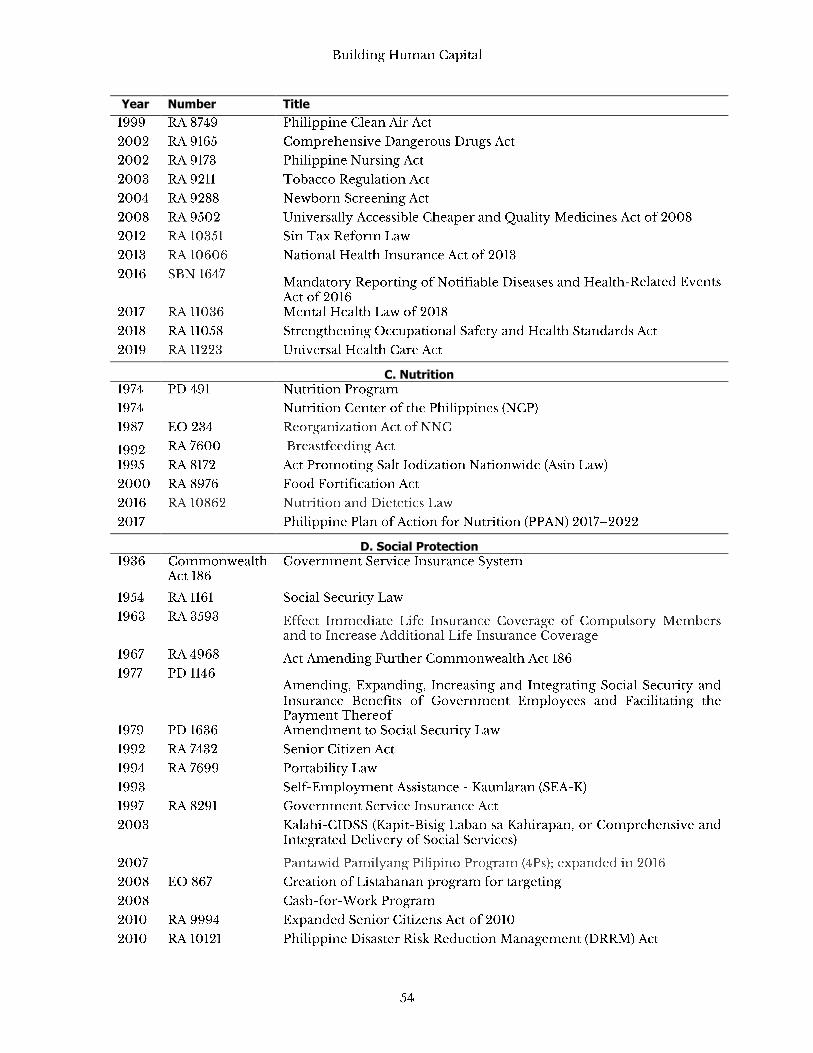
Annex Table 1.1: List of Selected Legislation and Executive Acts Pertaining to Human Capital Development
Year Number Title
A. Education
B. Health
Year Number Title
C. Nutrition
D. Social Protection

Year Number Title
E. Population
F. Water & Sanitation
G. Employment

Annex 2
Annex Figure 2.1: Migrant Remittance Inflows (US$ million), 1977–2017
Annex Figure 2.2: School Enrollment by Age Group and Region, 2017
-
5,000
10,000
15,000
20,000
25,000
30,000
35,000
19
77
19
79
19
81
19
83
19
85
19
87
19
89
19
91
19
93
19
95
19
97
19
99
20
01
20
03
20
05
20
07
20
09
20
11
20
13
20
15
20
17
Philippines Indonesia Malaysia Thailand
0
5
10
15
20
25
30
35
40
19
90
19
91
19
92
19
93
19
94
19
95
19
96
19
97
19
98
19
99
20
00
20
01
20
02
20
03
20
04
20
05
20
06
20
07
20
08
20
09
20
10
20
11
20
12
20
13
20
14
20
15
20
16
EAP LMC UMC PHL

Annex Figure 2.3: Average Pupil-Teacher Ratios in Primary Education in the Philippines
and Comparator Countries, 1990–2016
Annex Figure 2.4: Supply of Health Professionals in the Philippines and Comparator Countries, 2000–2015
0
5
10
15
20
25
2000 2005 2010 2015
Medical doctors per 10,000 population
China Indonesia
Malaysia Philippines
South Korea Thailand
Viet Nam
0
20
40
60
80
2000 2005 2010 2015
Nurses and midwives per 10,000
population
China Indonesia
Malaysia Philippines
South Korea Thailand
Viet Nam
0
5
10
15
20
25
30
35
401
99
0
19
91
19
92
19
93
19
94
19
95
19
96
19
97
19
98
19
99
20
00
20
01
20
02
20
03
20
04
20
05
20
06
20
07
20
08
20
09
20
10
20
11
20
12
20
13
20
14
20
15
20
16
EAP LMC UMC PHL

Annex Figure 2.5: Population with at least Basic Drinking Water in the Philippines and Comparator Countries, 2000–2015
Annex Figure 2.6: Population with at least Basic Sanitation Services in the Philippines and Comparator Countries, 2000–2015
60
65
70
75
80
85
90
95
100
2000 2005 2010 2015
Rural population
China Indonesia
Malaysia Philippines
Thailand Viet Nam
60
65
70
75
80
85
90
95
100
2000 2005 2010 2015
Urban population
China Indonesia
Malaysia Philippines
Thailand Viet Nam
20
40
60
80
100
20
00
20
01
20
02
20
03
20
04
20
05
20
06
20
07
20
08
20
09
20
10
20
11
20
12
20
13
20
14
20
15
Urban population
China Indonesia
Malaysia Philippines
Thailand Viet Nam
20
40
60
80
100
20
00
20
01
20
02
20
03
20
04
20
05
20
06
20
07
20
08
20
09
20
10
20
11
20
12
20
13
20
14
20
15
Rural population
China Indonesia
Malaysia Philippines
Thailand Viet Nam
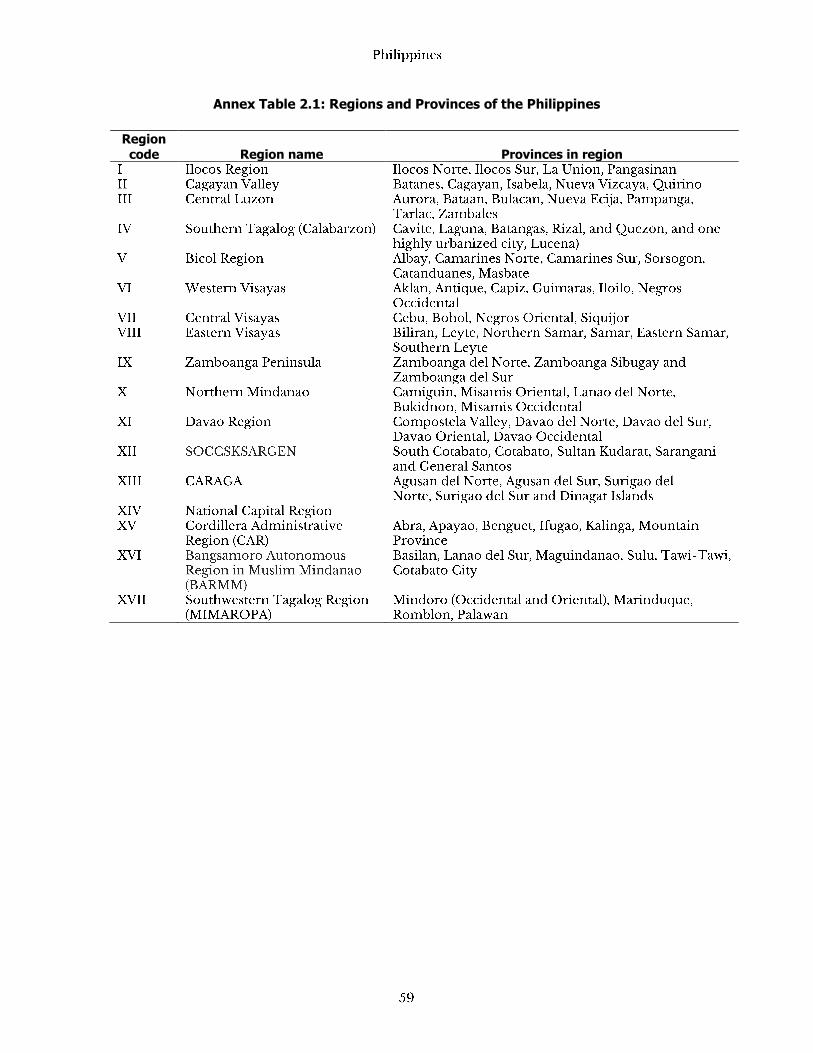
Annex Table 2.1: Regions and Provinces of the Philippines
Region
code Region name Provinces in region

Annex Table 2.2: Distribution of Population Aged 6 and Over by Highest Education Level Attended, Rural-
Urban Residence, and Wealth Quintile (%), 1993 and 2017
Type of household
Attended primary education Attended secondary education Attended higher education
1993 2017 %
change 1993 2017 %
change 1993 2017 %
change
Annex Table 2.3: Government education spending, as % of GDP 2005 2006 2007 2008 2009 2010 2011 2012 2013 2014 2015 2016 2017