Bubz, a 12-lead Wire-free EKG
24
Bubz, a 12-lead Wire-free EKG By Jack Rueth Madhavan Nair Samhita Inampudi Design Document for ECE 445, Senior Design, Fall 2021 TA: Josephine Melia 26 September 2021 Project Number 13
-
Upload
khangminh22 -
Category
Documents
-
view
7 -
download
0
Transcript of Bubz, a 12-lead Wire-free EKG

Bubz, a 12-lead Wire-free EKG
By
Jack RuethMadhavan Nair
Samhita Inampudi
Design Document for ECE 445, Senior Design, Fall 2021TA: Josephine Melia
26 September 2021Project Number 13

Section 1: Introduction1.1 OverviewThe heart is an organ that operates on a series of electrical impulses, creating a repeating rhythm
of PQRST waves (further explained below) that many medical professionals analyze to assess
cardiac function and health. An electrocardiogram (ECG/EKG) is a graph measuring these
impulses in the form of a voltage versus time chart. A sample of what this output looks like is
shown in Figure 1. This data is collected by strategically placing electrodes across the chest to
determine the horizontal and vertical changes in electric potential. The electrodes essentially
perform as an electric dipole; the resulting field vector is measured at the surface of the skin
(called skin potential) through medical adhesive or suction.
The patterns that these impulses create gives doctors and other medical staff necessary insight on
the functioning of a patient’s heart. Deviations from the standard EKG pattern can mean a variety
of cardiac issues, ranging from cardiac arrhythmias (abnormalities in heart rhythm) to
compromised blood flow in the coronary artery to electrolyte disturbances. This can be
determined by assessing the speed of the heart beat, the steadiness of its rhythm, and the strength
of the impulses being sent within the heart itself. It is important to note that no electricity is sent
into the body.
The basic EKG measures the electrical signals sent through the four chambers (left atrium, right
atrium, left ventricle, right ventricle) of the heart to detect any medical anomalies and monitor
the cardiovascular health of the patient. Essentially, the heart receives a series of electrical
signals that are seen in the PQRST wave seen in Figure 1. The first P wave is the signal sent to
the atria to contract, pushing oxygenated blood into the ventricles. This is called the Atrial
Depolarization. The ensuing QRS complex, as it is called, is the electrical signal for the
ventricles to constrict, sending the blood throughout the body, referred to as Ventricular
Depolarization. The atrial repolarization also takes place at this time but is generally not seen due
to the high electrical activity of the ventricle depolarization. Finally, the T wave contains the
Ventricular Repolarization, where the ventricles reset and are ready to constrict once again.

Figure 1. Sample of EKG results.
Figure 2. Diagram of electrical signals in the heart and how they translate to PQRST waves.

1.2 ProblemIn a traditional 12-lead EKG, ten electrodes are placed on the chest and limbs of a patient as
shown in Figure 2. As seen in the image, there are a lot of long, confusing wires along with
heavy, bulky equipment. These wires frequently get tangled, and make it difficult for doctors to
do their jobs quickly. According to Mayo Clinic, setting up an EKG can take between 10-20
minutes. While this may not seem like much of an issue on a relaxed day, in emergency cases,
even a minute could be the matter of life or death. In addition to this, EKG equipment is
generally bulky and hard to transport to underserved communities. This can mean decreased
access to this test, which could mean compromised patient care in such regions.
Current attempts to address this problem include solutions like a product from KardiaMobile
(shown in Figure 3). However, while this solution is incredibly user-friendly, it only provides a
single lead capability, meaning that there is no way to see any of the data from the horizontal
plane. In addition, other 12-lead solutions like AMD’s still include wires to connect all of the
electrodes together, and focus on transmitting data wirelessly over a long range for telemedicine
applications.
Figure 3. Patient receives a traditional 12-lead EKG

Figure 4. KardiaMobile, single-lead wireless solution
1.3 SolutionOur goal is to build a 12-lead wire-free EKG that does not require any wires to transmit data
from nodes to a computer. We want to prioritize ease of use, reusability, and keeping the
maintenance requirement low. In our solution we want to create small suction bulbs to
conveniently assess a patient’s heart health. Our choice for a suction device is a design choice
made to ensure reusability of the device in the larger goal of reaching underserved communities.
Each of these bulbs will contain a circuit board with wireless connectivity and a power supply
(potentially rechargeable if time permits) to transmit a PQRST wave quickly to the data display.
In addition, each bulb will require a method of measurement and a filtration process to ensure the
data that is displayed is insightful and actionable. Using Body Surface Potential Mapping, we
can measure the electrical potential gradient at various points of the body to create a vector
mapping including these 12 views from 2 different planes (vertical and horizontal). We hope that
this solution would make the process of getting an EKG faster, easier, and more efficient.

Figure 5. Vectors that show node placement in a 12-lead EKG
1.4 Visual AidWhile a whole 12-lead EKG would require a minimum of 9 bulbs, for the scope of our project,we want to focus on the creation of a single bulb that can accomplish the task of measuring thedata and transmitting it wirelessly to create some data visualization with an associatedtimestamp. We hope that this project will be scaled up easily after the design of the bulb deviceitself.
Figure 6. High-level visual representation of solution pipeline

Figure 7. Potential design structure for individual bulb
1.5 High-Level Requirements1. The device should display PQRST waves within accuracy of 0.1 mV for at least 15
seconds with timing delay of 1-2 ms. We will determine the accuracy through
extrapolating what standard theoretical values are for EKG readings in each segment of
the PQRST wave. Although it would be far more ideal to compare with real EKG results,
we unfortunately do not have access to a traditional EKG machine to be able to directly
compare results so we feel this method would be the most accessible way to determine
accuracy. The reason we are looking for at least 15 seconds of transmission is because we
need to see multiple PQRST cycles to be able to determine trends or rhythms. For an
individual whose heart rate is 50 bpm, we should still see 12 beats within 15 seconds,
which would be the minimum to be able to assess trends. Finally, we understand that data
transmission via Bluetooth cannot occur in real-time, but due to the urgency of data
accessibility in emergent medical cases, we hope to keep the timing delay as low as
possible. As such, research into applications that use the NRF24L01 chip report seeing
timing delays at around 1-2 ms, so we hope to stay within this range as well. Since we are
creating a single bulb for the scope of this project, we will not include both horizontal
and vertical views of the heart.
2. Device should transmit potential difference and associated timestamps with zerowires for a radius of 5 feet, while the whole device should fit within a 13 X 9 X 6”box. The device should also be reusable and have a battery life of at least 1 hour.According to an esteemed medical device wholesaler, the average length of EKG wires is

about 3 feet. This leads us to believe that it is reasonable to expect that EKG data wouldbe collected within this range. We propose a radius of 5 feet to allow some leeway duringdevice setup and data collection as well. Since our primary goal is to cater to potentiallyunderserved communities and emergent situations, it is a priority to make sure that thedevice is portable and low-maintenance. We set the size constraint to the size of astandard Emergency Response Trauma Bag, which is of the dimensions listed above, sothat the device would be able to be transported quickly and fit within already existingstorage locations. In addition, we added the requirement of reusability and battery life toensure that the device would not require significant upkeep during or between uses.
3. Data (potential difference and associated timestamps) should be sampled at afrequency of 500 Hz and be transmitted at a minimum of 2 Mbps. Kenny Leung, thisproject’s sponsor, mentioned that a standard EKG device (along with current marketsolutions) include a minimum of 20 samples per EKG grid box. Each square on thestandard EKG graph paper (1mm length) represents 0.04 seconds.
Section 2: Design2.1 Block Diagram


2.2 Subsystem Overview/ Requirements2.2.1 Control Unit:
For our Microcontroller, we have chosen to use the ATMega8-16AU to handle our corefunctions. One of the advantages of the ATMega8-16AU is that it has high performance with lowpower consumption which is ideal for our bulb. This specific chip was chosen due to theon-board ADC which eliminated the need for a separate ADC module which would grow to beexceedingly complicated since this would also need to be controlled by the ATMega. In thisdesign, the core will take our filtered and amplified analog signal from the electrodes and samplethis data at a sufficient rate above the Nyquist frequency (further explained in Risk Analysis). Itwill then send our filtered signal to the bluetooth module using an SPI protocol.
Requirement Verification
1. Microcontroller must get input signalfrom BPF
2. Microcontroller gets input VCC andGND from power supply
3. Microcontroller sends signal toBluetooth Module within 5m range
1. Connect an oscilloscope to PIN 19 onMicrocontroller and GND. Check tomake sure that data signals have beenreceived
2. Connect voltmeter to VCC and GNDof Microcontroller to make sure +5Vis available
3. Connect a pair of wires to Pinassigned for Bluetooth Module andGND to the transceiver. Using SPIprotocol check for outgoing signalfrom microcontroller.
2.2.2: Instrumentation Amplifiers & Filtering:
An Instrumentation Amplifier will take the electrical signals measured from theelectrodes and amplify this signal by a factor of 100. From here the signals will be sent throughthe band-pass filter to filter out the noise and clean up the signal. Most of our signal will be inthe range of 10 Hz - 200 Hz. Anything out of this range is essentially noise unproductive to ourdata visualization and measurement. Next, our signal will be sent from the passive filter to theanalog to digital converter in the ATMega. This will convert our analog signal to digital so that

we can view the PQRST wave on our display. One of the most important parts of this analog todigital converter is the speed at which it converts the signal.
We will be using an Instrumentation Amplifier which will take the electrical potentialdifference measured from the electrodes. In typical EKG, the electrical voltage is between 1mVand 5mV(). The signal that we gather will need to be amplified so we will use InstrumentationAmplifiers to do that. An Instrumentation Amplifier is a type of differential amplifier that is usedfor measurement because it contains input buffer amplifiers which eliminates the need for inputimpedance matching(). For our project, we will use the AD620 by Analog Devices in order toaccomplish this. The AD620 has quite a few characteristics that make it perfect to use for ourbulb. The AD620 has low noise, low power, and low input bias current which makes it ideal foruse with medical applications. In addition, the AD620 has a low offset and offset drift which isperfect for data acquisition. The AD620 also allows for a low power supply which is ideal forour bulb since we are using a coin-cell battery to power our system. For the AD620 we havechosen to use a resistance of ___ because ____. Insert formula for calculating gain and figure ofAD620 circuitry with Resistor values and capacitance values. We expect that we need to amplifyour signal by ____.
After passing the signal from the electrodes to the Instrumentation Amplifiers, it will besent to our low-pass filter. Filters are used to attenuate frequencies of signals. We will be using alow-pass filter to attenuate high frequency noise. Insert RC CIRCUIT for low-pass filter herewith calculations for R and C.
Requirement Verification
1. Instrumentation Amplifiermust amplify the signal by afactor of 15
2. Signal will be sampled at aNyquist frequency of 500Hz
1. Use oscilloscope to view signalgenerated by electrodes. Attach wiresto PIN __ and GND oninstrumentation amplifier and measurethe amplitude difference to see ifsignal has been amplified.
2. Use oscilloscope to view channelsettings of the signal and calculateNyquist frequency to make sure its at500Hz as we expected.
2.2.3 Power Supply:

The power supply module is essential to supplying power to the microcontroller in orderto send the signal to our display. We expect our power supply to provide 5V of power in order toprovide the sufficient power necessary for our control unit. The power supply we have designeduses a battery voltage around 5 volts attached to our Vin which is then regulated with theLM117-5.0 voltage regulating chip. This is then exported to our +5V node which is then easilyrun to many other parts of the circuit. We continue our power module with a debounced on-offswitch that uses a capacitor to ensure smooth operation of switching power to our IC’s.
Requirement: Power Subsystem must be able to supply 5V to the rest of the systemcontinuously during operation with low noise to ensure proper operation of the ADC in theATMega Microcontroller.
Requirement Verification
1. Stable +5V supply at up to 0.2A issupplied
1. Connect a voltmeter to PIN 2 andGND to make sure that voltage of +5Vis being supplied
2.2.5 Skin Module:

Our bulb will attach to the skin of the user. Through the use of suction, a vacuum will becreated, holding the device to the skin tightly and ensuring a proper electrical connectionbetween the metal contact pads and the skin with no air in between. These electrodes will gatherthe potential difference of the skin across the two electrodes and send this signal to our controlunit.
In order to measure the biopotential created by the heart, we need to attach our bulb to theskin of the user. Through the use of suction, a vacuum will be created which will hold the deviceto the skin tightly, This will ensure that a proper electrical connection has been establishedbetween the metal contact pads and the skin. We will be using reference electrodes made ofSilver-Silver Chloride half-cells for a few reasons. These electrodes use the breakdown of AgClin the reaction below to carry charge between the skin and the metal of the electrode wires.
In this reaction, the silver and chloride ions are actually the charge carriers across the boundaryinstead of electrons. This is needed because typical metal electrodes would build a potentialbarrier or half-cell potential derived from the Nernst equation:
Surface Ag/AgCl electrodes are the most common and favored electrodes in clinicalmeasurements for recording all biological signals such as EKG, EMG and EEG. One of the mainadvantages of using Ag/AgCl electrodes is the low noise level it generates during biologicalsignals recording. Additionally, the potentials of these electrodes do not change over time or withtemperature which offers long-term stability. Lastly, these electrodes also importantly havenon-toxic components which is instrumental for our project since our product will be used onhumans.
Requirement Verification
1. Skin attachments should stay within20-37 degrees C
2. Bulb must constantly adhere to skin,specifically metal contacts that havestrong electrical connection over theentire time interval of use(~30s-1min)
1. Use a thermometer to measure thetemperature of the attachment
2. Place bulb on human chest and if itdoes not detach from skin after 1min,successful attachment!
2.2.5 Bluetooth Transceiver Module:

From the Microcontroller, the signal will be sent to our bluetooth transceiver, theNRF24L01 chip. After a lot of research we chose this chip for a plethora of reasons. TheNRF24L01 allows us to send up to 2Mbps of data which is our ideal speed. While this chipconsumes low power, it has a communication range of up to 800m. This is well beyond the rangethat we are looking for which is around 5ft. In addition to that, this chip communicates with themicrocontroller via SPI communication.
Requirement Verification
1. Ensures that data from microcontrolleris being sent to transceiver
2. Data is sent at 2Mbps3. Ensure that data range is within at
least 5m
1. Connect wires from PIN 15 ofmicrocontroller to PIN 7 oftransceiver. Connect computer to SPIpins on microcontroller and test to seethat data is being sent
2. Send a bitstream of data frommicrocontroller to transceiver andcalculate time it takes
3. Stand 5m away from transceiver andsend data to make sure it is sent andreceived
4.

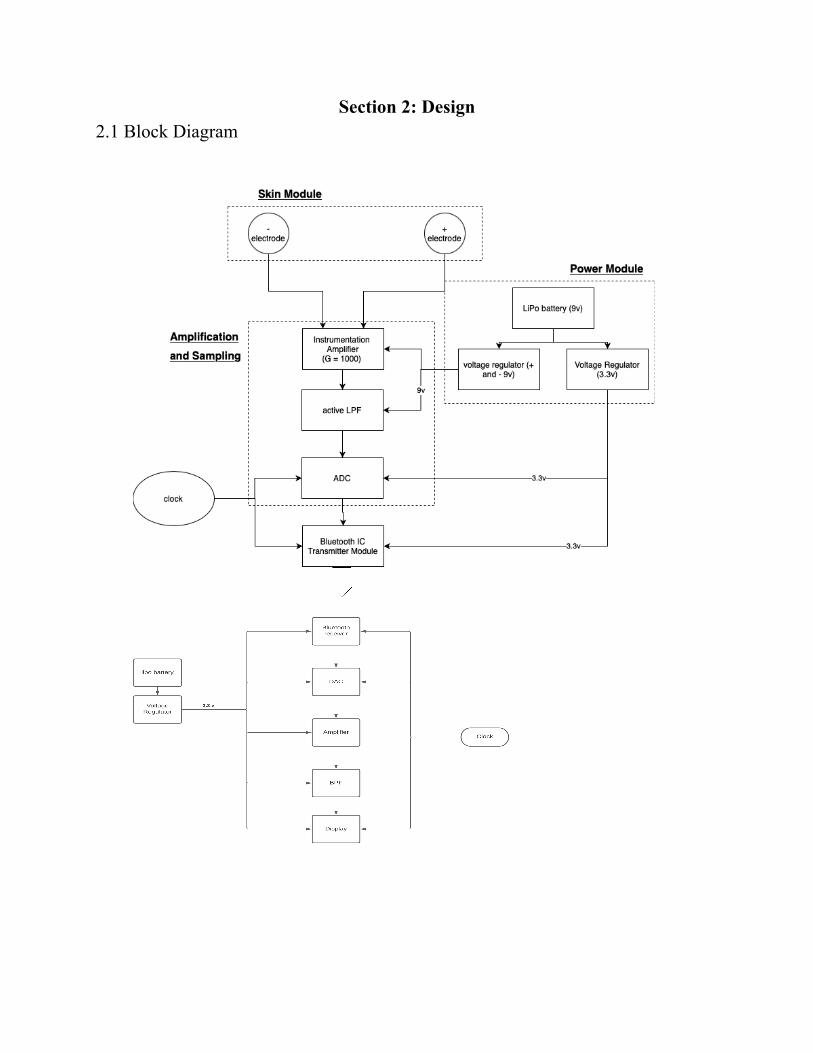
2.2.6 Data Visualization Module:Our display interface will have a graphical display of our signal in a PQRST wave form.
An image of this wave is shown below. As the signal comes in from the receiver it will be putthrough an algorithm that will display the wave and the timestamp.
From our Transceiver, we send the data to our display(laptop). In order to display ourdata as a PQRST wave form we will put our data through an FIR filter. This FIR filter willenable us to calculate the QRS complexes.
Requirement: PQRST wave will have 20 samples per EKG box
Requirement Verification

2.3: Schematics and PCB Design:


2.4 Software Design
Microcontroller:
Transceiver Module:
Example Code Outline for Transceiver Module:
//Include Libraries
#include <SPI.h>#include <nRF24L01.h>#include <RF24.h>
//create an RF24 objectRF24 radio(9, 8); // CE, CSN
//address through which two modules communicate.const byte address[6] = "00001";
void setup(){radio.begin();
//set the addressradio.openWritingPipe(address);
//Set module as transmitterradio.stopListening();
}void loop(){//Send message to receiverconst char text[] = "Hello World";radio.write(&text, sizeof(text));
delay(1000);}
Data Display:

2.4 Risk Analysis
The biggest risk to the completion of this project will be the bluetooth/RF module andreceiver. These units are responsible for sending and receiving the signal from the electrodes andto our display. While we think the general range of 1-2 Mbps will be sufficient for the needs ofour project, we are concerned that the data transmission may not occur at a satisfactory level. Ontop of this, we have a very tight size constraint as the general size of an EKG bulb is a fewcentimeters wide. Since we are choosing to measure the electric potential across a slightly largerarea to be able to reuse the bulbs, we don’t have to follow the constraint of a few centimeters asstrictly, but portability is a defining factor of our project and we have to be mindful of thissuccess criteria while making design decisions. In addition, a big challenge for creating wirelessEKGs is that there is no clock signal shared between all 9 or 10 electrodes, which makes timesynchronization difficult across multiple electrodes. We hope to address this challenge byrearranging data as it appears to our data visualization subsystem, so that data associated with acertain timestamp will be reordered to appear before later time stamps.
Going off of our requirement to have a minimum of 20 data points per EKG grid box.Each square on the standard EKG graph paper (1mm length) represents 0.04 seconds. This wouldmean:
20 data points * 1/0.04 seconds= 500 HzTherefore, we get the minimum sampling frequency to be 500 Hz.
2.5 Physical Design:
Table 8: Suction bulb (not to scale)

Section 3: Cost and Schedule3.1 Cost AnalysisTo consider the fixed costs of labor for this project, we look at an hourly rate of $40/hour for 3
individuals at approximately 20 hours per week. We consider the development lifespan to be 12
weeks since the last four weeks of the semester are dedicated to final demos, presentations, etc.
In this fixed cost estimation, we ignore the additional time spent from our sponsors and ECE lab
resources. As such, our estimate is the following:
3 ⋇ $40/ℎ𝑟 * 20 ℎ𝑟/𝑤𝑒𝑒𝑘 * 12 𝑤𝑒𝑒𝑘𝑠 * 2. 5 = $72, 000
In addition to our labor costs, we must also consider our costs for parts. We break down this
analysis into prototype costs and also mass production estimates in the case of scaling this
product for commercial use.
Part Prototyping Costs Commercial Costs
Double Handle LockingSuction Cup
$9.63 $2.26
Multi-Purpose ECGMonitoring Electrodes
$0.18 $0.06
NRF24L01- Single chip radiotransceiver
$1.30 $0.39
AD6204

It is important to note that these estimates are made from the production of one bulb. Once fully
scaled, the final product would have 9 of these bulbs so the total cost would be INSERT TOTAL
COST HERE.
3.2 Schedule
Week Jack Madhavan Samhita
9/26 Finalize PCB Design,revise block diagramfrom proposal feedback
Define subsystemverification, perform riskanalysis
Research bluetoothoptions, cost analysis,convert to final format
10/3 Revise Round 1 PCBDesign,
Prepare for Design Reviewbased on feedback fromDoc Check
10/10
10/17
10/24
10/31
11/7
11/14
11/21
11/28
12/5

Section 4: Ethics and Safety
When building our project, there are certain ethical issues and safety precautions that wehave to consider. Since we are creating a product that will be used on the human body, we needto ensure the safety of all patients. Especially when handling electricity, we must make sure thevoltage of our battery maintains safe levels of exposure to the human body so that it does notharm our user when they are getting an EKG. Specifically, we need to make sure that we followSection 1.2 of ACM Code of Ethics: Avoid harm. We deeply understand the ramifications ofinjuring a patient, even unintentionally. We hope to exercise extra caution to ensure the safety ofour users and follow all relevant regulatory standards. Since our product is being used onhumans, it is imperative that we follow this code. In terms of ethics we must abide by 7.8 of theIEEE Code of Ethics. Thus we must uphold the highest standards of integrity, responsiblebehavior, and ethical conduct in professional activities. As we are working in a group it is criticalthat we treat all persons fairly and with respect, avoid injuring others, and to not engage inharassment or discrimination. Finally it is vital that we all support our co-workers.

Sources:https://www.mayoclinic.org/tests-procedures/ekg/about/pac-20384983https://amdtelemedicine.com/product/12-lead-digital-wireless-ecg/https://store.kardia.com/products/https://www.ieee.org/about/corporate/governance/p7-8.htmlhttps://www.acm.org/code-of-ethicshttps://www.hopkinsmedicine.org/health/treatment-tests-and-therapies/electrocardiogramhttps://ecgwaves.com/topic/ekg-ecg-leads-electrodes-systems-limb-chest-precordial/https://lastminuteengineers.com/nrf24l01-arduino-wireless-communication/https://www.medcablesource.com/din-ecg-compatible-leadwire-3-leads-snap/