B.Sc. Sem. V & Sem. VI Course: STATISTICS
34
-
Upload
khangminh22 -
Category
Documents
-
view
6 -
download
0
Transcript of B.Sc. Sem. V & Sem. VI Course: STATISTICS


1
UNIVERSITY OF MUMBAI
Syllabus for the T.Y.B.Sc.
Programme: B.Sc.
Sem. V & Sem. VI
Course: STATISTICS
(As per Credit Based Choice System
with effect from the academic year 2018–2019)

2
T. Y. B. Sc. STATISTICS SYLLABUS
CREDIT BASED AND CHOICE SYSTEM
TO BE IMPLEMENTED FROM THE ACADEMIC YEAR 2018-19
SEMESTER V
Theory
Course UNIT TOPICS Credits L ectures
USST501
I PROBABILITY
2.5
15
II INEQUALITIES AND LAW OF
LARGE NUMBERS 15
III
JOINT MOMENT GENERATING
FUNCTION, TRINOMIAL AND
MULTINOMIAL DISTRIBUTION
15
IV ORDER STATISTICS 15
Course UNIT TOPICS Credits L ectures
USST502
I POINT ESTIMATION AND
PROPERTIES OF ESTIMATORS
2.5
15
II METHODS OF POINT ESTIMATION 15
III BAYESIAN ESTIMATION METHOD
& INTERVAL ESTIMATION 15
IV INTRODUCTION TO LINEAR
MODELS 15
Course UNIT TOPICS Credits L ectures
USST501
I EPIDEMIC MODELS
2.5
15
II BIOASSAYS 15
III CLINICAL TRIALS 15
IV CLINICAL TRIALS and
BIOEQUIVALENCE 15

3
Course UNIT TOPICS Credits L ectures
USST504A
(Elective)
I FUNDAMENTALS OF R
2.5
15
II SIMPLE LINEAR REGRESSION
MODEL 15
III MULTIPLE LINEAR REGRESSION
MODEL 15
IV VALIDITY OF ASSUMPTIONS 15
Course UNIT TOPICS Credits L ectures
USST504B
(Elective)
I INTRODUCTION
2.5
15
II NUMPY, PANDAS AND DATA
EXPLORATION 15
III
DESCRIPTIVE STATISTICS AND
STATISTICAL METHODS
15
IV INFERENTIAL STATISTICS 15
Course Practicals Credits Lectures per week
USSTP05 Practicals of course USST501+USST502 3 8
USSTP06 Practicals of course USST503+USST504 3 8

4
Course Code Title Credits
USST501 PROBABILITY AND DISTRIBUTION THEORY
2.5
Credits
(60 Lectures)
Unit I : PROBABILITY
(i) Basic definitions: Random Experiment, Outcome, Event, Sample Space,
Complementary, Mutually Exclusive, Exhaustive and Equally Likely Events.
(ii) Mathematical, Statistical, Axiomatic and Subjective probability.
(iii) Addition Theorem for (a) two (b) three events
(iv) Conditional Probability: Multiplication Theorem for two, three events.
(v) Bayes’ theorem.
(vi) Theorems on Probability of realization of :
(a) At least one (b) Exactly m (c) At least m of N events A1, A2, A3…AN.
Classical occupancy problems, Matching and Guessing problems.
Problems based on them.
15 Lectures
Unit II : INEQUALITIES AND LAW OF LARGE NUMBERS
(i) Markov Inequality
(ii) Tchebyshev’s Inequality
(iii) Boole’s Inequality
(iv) Cauchy Schwartz’s Inequality
(v) Weak law of large numbers.
(Ref.9,10)
15 Lectures

5
Unit III: JOINT MOMENT GENERATING FUNCTION,
TRINOMAIL DISTRIBUTION AND MULTINOMIAL DISTRIBUTION
(i) Definition and properties of Moment Generating Function (MGF) of two
random variables of discrete and continuous type. Necessary and Sufficient
condition for independence of two random variables.
Concept and definition of Bivariate MGF.
(ii) Trinomial distribution
Definition of joint probability distribution of (X, Y). Joint moment generating
function, moments rs where r=0, 1, 2 and s=0, 1, 2.
Marginal & Conditional distributions. Their Means & Variances.
Correlation coefficient between (X, Y). Distribution of the Sum X+Y
Extension to Multinomial distribution with parameters (n, p1, p2,…pk-1)
where p1+ p2,+…pk-1+ pk = 1. Expression for joint MGF. Derivation of: joint
probability distribution of (Xi, Xj). Conditional probability distribution of Xi
15 Lectures
Unit IV: ORDER STATISTICS
(i) Definition of Order Statistics based on a random sample.
(ii) Derivation of:
(a) Cumulative distribution function of rth
order statistic.
(b) Probability density functions of the rth
order statistic.
(c) Joint Probability density function of the rth
and the sth
order statistic ( r<s)
(d) Joint Probability density functions of all n ordered statistics.
(e) Distribution of Maximum observation (nth
order statistic) and Minimum
observation (first order statistic) in case of uniform and Exponential distribution .
(f) Probability density function of the difference between rth
and sth
order
statistic ( r<s) in case of uniform and Exponential distribution
(Ref.2,3,4)
15 Lectures
REFERENCES
1. Feller W: An introduction to probability theory and it’s applications, Volume: 1, Third
edition, Wiley Eastern Limited.
2. Hogg R V. & Craig Allen T.: Introduction to Mathematical Statistics, Fifth edition, Pearson
Education (Singapore) Pvt. Ltd.
3. Mood A. M., Graybill F. A., Boes D. C.: Introduction to the theory of statistics, Third
edition, Mcgraw- Hill Series.

6
4. Hogg R. V. and Tanis E.A. : Probability and Statistical Inference, Fourth edition, McMillan
Publishing Company.
5. Gupta S C & Kapoor V K: Fundamentals of Mathematical statistics, Eleventh edition, Sultan
Chand & Sons.
6. Biswas S.: Topics in Statistical Methodology, First edition, Wiley Eastern Ltd.
7. Kapur J. N. & Saxena H. C.: Mathematical Statistics, Fifteenth edition, S. Chand and
Company.
8. Chandra T.K. & Chatterjee D.: A First Course in Probability, Second Edition, Narosa
Publishing House.
9. S.C. Gupta and V.K.Kapoor : Fundamental of Mathematical Statistics,Sultan Chand and
Sons
10. V K Rohatgi: An Introduction to probability and Mathematical Statistics,

7
Course
Code
Title Credits
USST502 THEORY OF ESTIMATION 2.5
Credits
(60
Lectures)
Unit I : POINT ESTIMATION AND PROPERTIES OF ESTIMATORS
Notion of a Parameter and Parameter Space.
Problem of Point estimation.
Definitions : Statistic, Estimator and Estimate.
Properties of a good estimator :
1. Unbiasedness :Definition of an unbiased estimator,
Illustrations and examples.
Proofs of the following results:
(i) Two distinct unbiased estimators of U( ) give rise to
infinitely many unbiased estimators.
(ii) If T is an unbiased estimator of then U(T) is an unbiased
estimator of U( ) provided U( ) is a linear function.
2. Consistency:Definition of Consistency. Sufficient condition for consistency , proof & Illustrations
3. Sufficiency :Concept and Definition of sufficient statistic. Neyman’s Factorization theorem (without proof).Exponential
family of probability distributions and sufficient statistics.
4. Relative efficiencyof an estimator & illustrative examples.
15
Lectures

8
Minimum variance unbiased estimator(MVUE) and Cramer Rao
Inequality:
1.Definition of MVUE
2. Uniqueness property of MVUE ( proof).
3. Fisher's information function
4.Regularity conditions.
5. Statement and proof of Cramer-Rao inequality.
6. Cramer-Rao lower bound (CRLB), Efficiency of an estimator
using CRLB.
7. Condition when equality is attained in Cramer Rao Inequality and
its use in finding MVUE.
Ref. 1,3,8
UNIT II : METHODS OF POINT ESTIMATION
Method of Maximum Likelihood Estimation (M.L.E.) :
1. Definition of likelihood as a function of unknown parameter for a
random sample from: Discrete distribution & Continuous distribution.
2. Derivation of Maximum likelihood estimator (M.L.E.) for
parameters of Standard distributions (case of one and two unknown
parameters).
3. Properties of MLE (without proof).
Method of Moments :
1. Derivation of Moment estimators for standard distributions (case
of one and two unknown parameters)
Illustrations of situations where MLE and Moment Estimators are
distinct and their comparison using Mean Square error.
Method of Minimum Chi-square and Modified Minimum Chi-
Square Ref: 1,2,3
15
Lectures

9
UNIT III: BAYESIAN ESTIMATION METHOD & INTERVAL
ESTIMATION
Bayes Estimation: 1. Prior distribution, Posterior distribution
2. Loss function, Risk function
3. Types of Loss function: Squared error Loss function
(SELF), Absolute error Loss function (AELF)
4. Bayes' risk.
5.Bayes' method of finding Point estimator (assuming
SELF)
Examples : (i) Binomial- Beta (ii) Poisson- Gamma
(iii) Gamma-Gamma (iv) Normal-Normal
Interval Estimation:
1. Concept of confidence interval & confidence limits.
2. Definition of Pivotal quantity and its use in obtaining confidence
limits.
3. Derivation of 100(1- % equal tailed confidence interval for :
( a)The population mean : (population variance
known/ unknown) ( b) the population variance: ( Normal
distribution). Confidence interval for the parameters of
Binomial, Poisson and Exponential distributions.
Ref. 1,2,3
15
Lectures
UNIT IV:INTRODUCTION TO LINEAR MODELS
Explanation of General Linear Model of full rank with
assumptions. Model: = + e where e N (0, I)
Derivation of : 1) Least squares estimator of β
2) E 3) V
15
Lectures

10
Reference books:
1. HoggR.V., CraigA.T.: Introduction to Mathematical Statistics, Fourth Edition; Collier
McMillan Publishers.
2. HoggR.V., TannisE. A.: Probability and Statistical Inference, Third Edition; Collier
McMillan Publishers.
3. Rohatgi, V. K, EhsanesSaleh A.K. Md.: An introduction to Probability Theory and
Mathematical Statistics, Second Edition, Wiley series in Probability and Statistics.
4. John E. Freund’s Mathematical Statistics: I. Miller, M. Miller; Sixth Edition; Pearson
Education Inc.
5. HoelP.G.: Introduction to Mathematical Statistics; Fourth Edition; John Wiley & Sons
Inc.
6. GuptaS.C., KapoorV.K.: Fundamentals of Mathematical Statistics; Eighth Edition; Sultan
Chand & Sons.
7. KapurJ.N., SaxenaH.C.: Mathematical Statistics; Fifteenth Edition; S. Chand & Company
Ltd.
8. AroraSanjay and BansiLal : New Mathematical Statistics, SatyaPrakashan, New Market,
New Delhi,5(1989)
GuassMarkoff theorem for full rank Model: Y = Xβ + e.
Derivation of : 1) E( l 2) V( l' .
Confidence interval for l' when is known.
Confidence interval of when is known.
Ref. 9,10.

11
9. A.M.Kshirsagar; Linear Models
10. F.A. Graybill; An Introduction to Linear Models
2Course Code Title Credits
USST503 BIOSTATISTICS 2.5 Credits
(60
lectures )
Unit I : EPIDEMIC MODELS
(i) The features of Epidemic spread. Definitions of various terms
involved. Simple mathematical models for epidemics:
Deterministic model without removals (for ‘a’ introductions),
Carrier model.
(ii) Chain binomial models. Reed-Frost and Greenwood models.
Distribution of individual chains and total number of cases.
Maximum likelihood estimator of `p’ and its asymptotic variance
for households of sizes up to 4.
(Ref. 1)
15 Lectures
Unit II : BIOASSAYS
(i) Meaning and scope of bioassays. Relative potency. Direct assays.
Fieller’s theorem.
(ii) Indirect assays. Dose-response relationship. Conditions of similarity
and Monotony. Linearizing transformations. Parallel line assays.
Symmetrical (2, 2) and (3, 3) parallel line assays. Validity tests
using orthogonal contrasts. Point Estimate and Interval Estimate
of Relative potency.
(iii)Quantal Response assays. Tolerance distribution. Median effective
dose ED50 and LD50. Probit and Logit analysis.
(Ref.2, 3)
15 Lectures
Unit III : CLINICAL TRIALS :
Introduction to clinical trials : The need and ethics of clinical trials.
Common terminology used in clinical trials. Over view of phases (I-IV).
Introduction to ICH E9 guidelines, Study Protocol, Case record/Report
form, Blinding (Single/Double) Randomized controlled (Placebo/Active
controlled), Study Designs (Parallel, Cross Over).
Types of Trials : Inferiority, Superiority and Equivalence, Multicentric
15 Lectures

12
Trial. Inclusion/Exclusion Criteria. Sample size estimation.
(Ref. 4, 5, 6, 7, 8)
Unit IV : CLINICAL TRIALS and BIOEQUIVALENCE :
Statistical tools : Analysis of parallel Design using Analysis of Variance.
Concept of odds ratio. Concept of Repeated Measures ANOVA. Survival
analysis for estimating Median survival time, Kaplan-Meire approach for
survival analysis.
BIOEQUIVALENCE :
Definitions of Generic Drug product. Bioavailability, Bioequivalence,
Pharmacokinetic (PK) parameters Cmax, AUCt , AUC0-∞, Tmax, Kel, Thalf.
Estimation of PK parameters using `time vs. concentration’ profiles.
Designs in Bioequivalence: Parallel, Cross over (Concept only).
Advantages of Crossover design over Parallel design. Analysis of Parallel
design using logarithmic transformation (Summary statistics, ANOVA
and 90% confidence interval).
Confidence Interval approach to establish bioequivalence (80/125 rule).
(Ref. 4, 5, 6, 7, 8, 9)
15 Lectures
REFERENCES :
1. Bailey N.TJ. : The Mathematical theory of infectious diseases, Second edition,
Charles Griffin and Co. London.
2. Das M.N. and Giri N.C. : Design and Analysis of Experiments, Second edition, Wiley
Eastern.
3. Finney D.J. : Statistical Methods in Biological Assays, First edition, Charles Griffin
and Co. London.
4. Sanford Boltan and Charles Bon : Pharmaceutical Statistics, Fourth edition, Marcel
Dekker Inc.
5. Zar Jerrold H. :Biostatistical Analysis, Fourth edition, Pearson’s education.
6. Daniel Wayne W. : Biostatistics . A Foundation for Analysis in the Health Sciences,
7th
Edition, Wiley Series in Probability and Statistics.
7. Friedman L. M., Furburg C., Demets D. L. : Fundamentals of Clinical Trials,
First edition, Springer Verlag.
8. Fleiss J. L. The Design and Analysis of Clinical Experiments, Second edition, Wiley
and Sons.
9. Shein-Chung-Chow ; Design and Analysis of Bioavailability & Bioequivalence
studies, Third Edition, Chapman & Hall/CRC Biostatistics series.

13
Title Credits
USST504A Regression Analysis using R software 2.5 Credits
(60 lectures )
Unit I : Fundamentals of R
Introduction to R features of R, installation of R, Starting and ending R
session, getting help in R , Value assigning to variables
Basic Operations : +, -, *, ÷, ^, sqrt
Numerical functions : log 10, log , sort, max, unique, range, length,
var, prod, sum,
summary, dim, sort, five num etc
Data Types : Vector, list, matrices, array and data frame
Variable Type : logical, numeric, integer, complex, character
and factor
Data Manipulation : Selecting random N rows, removing
duplicate row(s), dropping a variable(s),
Renaming variable(s), sub setting data,
creating a new variable(s), selecting of
random fraction of row(s), appending of
row(s) and column(s), simulation of
variables.
Data Processing : Data import and export, setting working
directory, checking structure of Data
:Str(), Class(), Changing type of variable
(for eg as.factor, as.numeric)
Data Visualisation using ggplot: Simple bar diagram, subdivided bar
diagram, multiple bar diagram pie diagram,
Box plot for one and more variables,
histogram, frequency polygon, scatter plot
15 Lectures

14
eg plot()
(Ref.6, 7, 8, 9,10)
Unit II : Simple linear regression model
Assumptions of the model, Derivation of ordinary least square (OLS)
estimators of regression coefficients for simple, Properties of least square
estimators (without proof), Coefficient of determination R2 and adjusted R
2 ,
Procedure of testing
a) Overall significance of the models
b) Significance of individual coefficients
c) Confidence intervals for the regression coefficients
Data Pre-processing: Detection and treatment of missing value(s)and
outliers, Variable selection and Model building, Interpretation of output
produced by lm command in R. Weighted Least Square Method, Polynomial
Regression Models.
(Ref. 1,2,3,4,5)
15 Lectures
Unit III : Multiple linear regression model
Derivation of ordinary least square (OLS) estimators of regression
coefficients for multiple regression models, Coefficient of determination R2
and adjusted R2 , Procedure of testing
a) Overall significance of the models
b) Significance of individual coefficients
c) Confidence intervals for the regression coefficients
Data Pre-processing: Detection and treatment of missing value(s) and
outliers, Variable selection and Model building, Interpretation of output
produced by lm command in R.
(Ref. 1,2,3,4,5)
15 Lectures
Unit IV : Validity of Assumptions
Residual Diagnostics: Standardized residuals, Studentized residuals, residual
plots, Interpretation of four plots of ,Interpretation output produced by plot
command in R and corrective measures such as transformation of response
variable, testing normality of data .
Autocorrelation: Concept and detection using Durbin Watson Test,
Interpretation of output produced by DW-test function in R,
Heteroscedasticity: Concept and detection using Breusch –Pagan-Godfrey
Test, Interpretation of output produced by bptest function in R,
Multicollinearity: Concept and detection using R2
and t-ratios ii) pairwise
correlation between repressors iii) Variance Inflation Factor(VIF),
Interpretation of output produced by mctest function in R,
Consequences of using OLS estimators in presence of Autocorrelation,
Heteroscedasticity and Multicollinearity, Remedial measures,
Ridge Regression : Concept and case study using R,
(Ref. 1,2,3,4,5)
15 Lectures

15
References:
1) Draper, N. R. and Smith, H. (1998), Applied Regression Analysis (John Wiley), Third
Edition.
2) Montgomery, D. C., Peck, E. A. and Vining, G. G. (2003), Introduction to Linear Regression Analysis (Wiley).
3) Neter, J., W., Kutner, M. H. ;Nachtsheim, C.J. and Wasserman, W.(1996), Applied Linear Statistical Models, fourth edition, Irwin USA.
4) DamodarGujrati, Sangetha,Basic Econometrics, fourth edition, McGraw Hill Companies. 5) William Geene (1991), Econometrics Analysis, first edition, Mc Millan Publishing
Company. 6) Crawley, M. J. (2006 ). Statistics - An introduction using R. John Wiley, London 7) Purohit, S.G.; Gore, S.D. and Deshmukh, S.R. (2015). Statistics using R, second edition.
Narosa Publishing House, New Delhi. 8) Shahababa , B. (2011). Biostatistics with R, Springer, New York 9) Verzani, J. (2005). Using R for Introductory Statistics, Chapman and Hall /CRC Press,
New York 10) Asha Jindal (Ed.)(2018), Analysing and Visualising Data with R software- A Practical
Manual, Shailja Prakashan, K.C.College.

16
Title Credits
USST504B Statistical Data Analysis using PYTHON 2.5 Credits
(60 lectures )
Unit I : Introduction To PYTHON Software
Python Setup
Python Arithmetic
Basic Data Types
Variables
Lists
Tuples and Strings
Dictionaries and sets
Ref: 1,2,3
15 Lectures
Unit II : Numpy, Pandas and Data Exploration
numpy arrays: Creating arrays crating n-dimensional arrays using
np.array and array operations(indexing and slicing, transpose,
mathematical operations)
pandas dataframes: Creating series and dataframes and Operations on
series and dataframes
Reading and writing data: From and to Excel and CSV files
15 Lectures

17
Control statements: if, if-else, if-elif, while loop, for loop
Defining functions: def statement
Text data operations: len, upper, lower, slice, replace, contains
Frequency Tables
Ref: 1,2,3
Unit III : Descriptive statistics and Statistical Methods
Plotting: using “matplotlib”(Histograms, Box plots, Scatter plot, Bar
plot, Line plot)
Descriptive Statistics: mean, median, mode, min, max, quantile, std,
var, skew, kurt, correlation
Probability distributions: (using scipy.stats)
Simulation from distributions, computations of probabilities,
Cumulative probabilities, quantiles and drawing random sample
using functions for following distributions:
Binomial, Poisson, Hypergeometric, normal, exponential, gamma,
Cauchy, Lognormal,Weibull, uniform, laplace ,Graphs of pmf/pdf by
varying parameters for above distributions and Fitting of
distributions..
Ref: 1,2,3
15 Lectures
Unit IV : Inferential Statistics
Hypothesis testing and T-Tests: (using scipy.stats, math)ttest_1samp,
ttest_ind(2 sample test), ttest_rel(paired), Type I and Type II error
Chi-square tests: (using scipy.stats) chisquare, chi2
ANOVA: (using scipy.stats) f_oneway
Linear regression: from sklearn import linear model and use
linearmodel.linearregression function.
Ref: 1,2,3
15 Lectures
REFERENCES :
1. Python for Data Analysis by O’Reilly Media (Second Edition)

18
2. How to think like a computer scientist learning with Python by Allen Downey.
3. Python for Data Analysis by Armando Fernandgo
DISRIBUTION OF TOPICS FOR PRACTICALS
SEMESTER V
COURSE CODE USSTPO5 :
Sr. No. Practical topics from USST501 Sr. No. Practical topics from USST502
5.1.1 Probability-I 5.2.1 MVUE and MVBUE
5.1.2 Probability-II 5.2.2 Methods of Estimation
5.1.3 Inequalities and WLLN 5.2.3 Baye’s Estimaion
5.1.4 Trinomial and Multinomial
Distribution
5.2.4 Confidence Interval
5.1.5 Order statistics-I 5.2.5 Linear model
5.1.6 Order statistics-II 5.2.6 Use of R software
COURSE CODE USSTPO6 :
Sr.
No.
Practical topics
from USST503
Sr.
No.
Practical topics from
USST504A
Sr. No. Practical topics from
USST504B
5.3.1 Epidemic
Models
5.4A.1 Fundamentals of R 5.4B.1 Descriptive statistics
5.3.2 Direct Assays 5.4A.2 Graphs using R 5.4B.2 Correlations and
Simple Regression
5.3.3 Parallel Line
Assays
5.4A.3 Diagrams using R 5.4B.3 Probability
Distributions :Discrete
5.3.4 Quantal
Response
Assays
5.4A.4 Simple Linear
Regression using R
5.4B.4 Probability
Distributions
:Continuous
5.3.5 Clinical Trials 5.4A.5 Weighted Least
Square using R
5.4B.5 Statistical Test: t test
Chisquare and F test
5.3.6 Bioequivalance 5.4A.6 Multiple Linear
Regression and Ridge
Regression using R
5.4B.6 ANOVA

19
T. Y. B. Sc. STATISTICS SYLLABUS
CREDIT BASED AND CHOICE SYSTEM
TO BE IMPLEMENTED FROM THE ACADEMIC YEAR 2018-19
SEMESTER VI
Theory
COURSE UNIT TOPICS CREDITS LECTURES
USST601
I BIVARIATE NORMAL DISTRIBUTION
2.5
15
II GENERATING FUNCTIONS 15
III STOCHASTIC PROCESSES 15
IV QUEUING THEORY 15
USST602
I MOST POWERFUL TESTS
2.5
15
II UNIFORMLY MOST POWERFUL &
LIKELIHOOD RATIO TESTS 15
III SEQUENTIAL PROBABILITY RATIO
TESTS 15
IV NON-PARAMETRIC TESTS 15
USST603
I LINEAR PROGRAMMING PROBLEM
2.5
15
II INVENTORY CONTROL 15
III REPLACEMENT 15
IV SIMULATION AND RELIABILITY 15
USST604A
(Elective)
I MORTALITY TABLES
2.5
15
II COMPOUND INTEREST AND
ANNUITIES CERTAIN 15
III LIFE ANNUITIES 15
IV ASSURANCE BENEFITS 15
USST604B
(Elective)
I INTRODUCTION TO BASIC
STATISTICS
2.5
15
II SIX SIGMA 15
III CONTROL CHARTS I 15
IV CONTROL CHARTS II 15
20
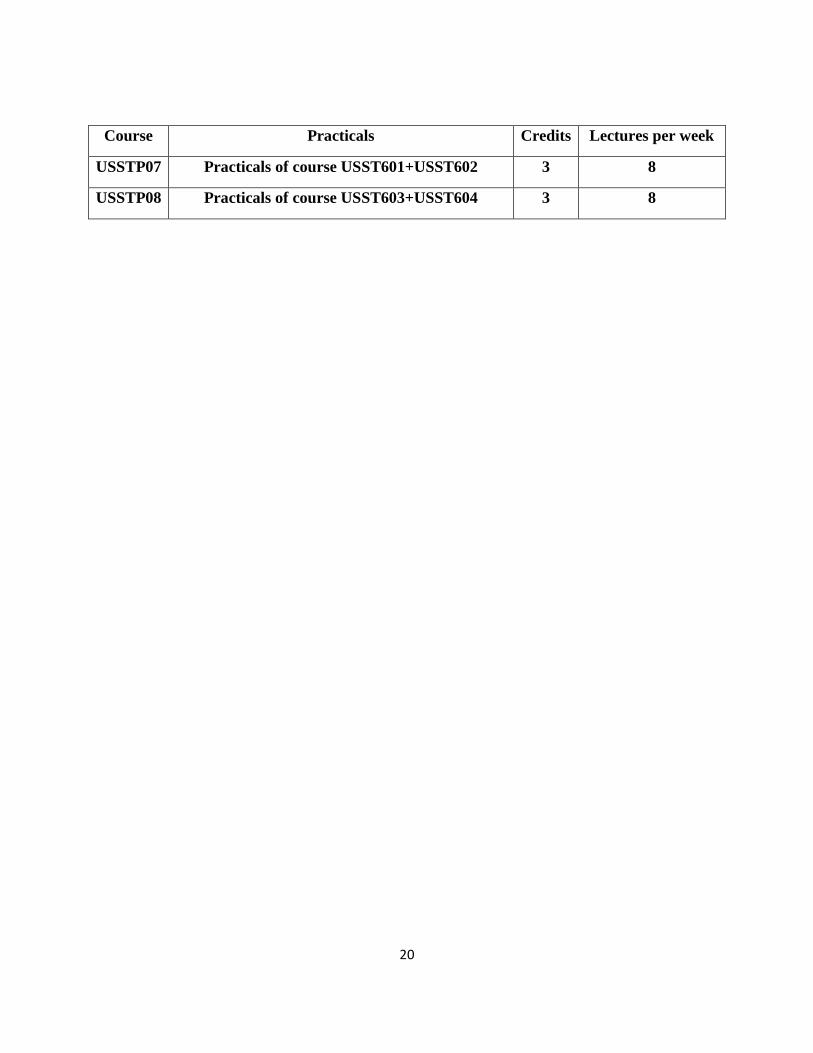
Course Practicals Credits Lectures per week
USSTP07 Practicals of course USST601+USST602 3 8
USSTP08 Practicals of course USST603+USST604 3 8

21
Course Code Title Credits
USST601 DISTRIBUTION THEORY AND
STOCHASTIC PROCESSES
2.5 Credits
(60 lectures )
Unit I : BIVARIATE NORMAL DISTRIBUTION
(i) Definition of joint probability distribution (X, Y). Joint Moment
Generating
function, moments μrs where r=0, 1, 2 and s=0, 1, 2. Marginal & Conditional
distributions. Their Means & Variances. Correlation coefficient between the
random variables. Necessary and sufficient condition for the independence of
X and Y.
Distribution of aX + bY, where ‘a’ and ‘b’ are constants.
(ii) Distribution of sample correlation coefficient when ρ = 0.Testing the
significance of a correlation coefficient. Fisher’s z – transformation.
Tests for i) H0: ρ = ρ0 ii) H0: ρ1 = ρ2, Confidence interval for ρ.
(Ref. 2,3,5,9)
15 Lectures
Unit II : GENERATING FUNCTIONS
Definitions of generating function and probability generating function.
Expression for mean and variance in terms of generating functions.
Definition of a convolution of two or more sequences. Generating function of
a convolution.
Generating functions of the standard discrete distributions. Relation between:
i) Bernoulli and Binomial distributions
ii) Geometric and Negative Binomial
distributions in terms of convolutions. (Ref.1,5)
15 Lectures
Unit III : STOCHASTIC PROCESSES
Definition of stochastic process. Postulates and difference differential
equations for :
(i)Pure birth process, (ii)Poisson process with initially ‘a’ members, for a =0
and a >0, (iii)Yule Furry process, (iv)Pure death process, (v)Death process
with μn=μ, (vi) Death process with μn= nμ, (vii)Birth and death process,
(viii)Linear growth model.
Derivation of Pn (t), mean and variance where ever applicable. (Ref.1,7,9)
15 Lectures
Unit IV : QUEUING THEORY
Basic elements of the Queuing model.
Roles of the Poisson and Exponential distributions.
Derivation of Steady state probabilities for birth and death process. Steady
state probabilities and various average characteristics for the following
models:
(i) (M/M/1) : (GD/ ∞ /∞) (ii) (M/M/1) : (GD/ N /∞)
(iii) (M/M/c) : (GD/∞/∞) (iv) (M/M/c) : (GD/ N /∞)
(v) (M/M/∞) : (GD/ ∞ /∞) (Ref.6)
15 Lectures

22
REFERENCES:
1. Feller W: An introduction to probability theory and it’s applications, Volume: 1, Third
edition, Wiley Eastern Limited.
2. Hogg R. V. & Craig A.T.: Introduction to Mathematical Statistics, Fifth edition, Pearson
Education (Singapore) Pvt Ltd.
3. Mood A M, Graybill F A, Bose D C: Introduction to the theory of statistics, Third edition,
Mcgraw- Hill Series.
4. Hogg R. V. and Tanis E.A.: Probability and Statistical Inference, Fourth edition,
McMillan Publishing Company
5. Gupta S C & Kapoor V K: Fundamentals of Mathematical statistics, Eleventh edition, Sultan
Chand & Sons.
6. Taha H.A.: Operations Research: An introduction, Eighth edition, Prentice Hall of India Pvt.
Ltd.
7. Medhi J: Stochastic Processes, Second edition, Wiley Eastern Ltd.
8. Biswas S.: Topics in Statistical Methodology (1992), First edition, Wiley Eastern Ltd.
9. Kapur J. N., Saxena H. C.: Mathematical Statistics, Fifteenth edition, S. Chand and Company

23
Course Code Title Credits
USST602 TESTING OF HYPOTHESIS 2.5 Credits
(60 lectures )
Unit I : MOST POWERFUL TESTS
Problem of testing of hypothesis.
Definitions and illustrations of i) Simple hypothesis ii) Composite
hypothesis iii)Null Hypothesis iv) Alternative Hypothesis v)Test of
hypothesis vi) Critical region vii) Type I and Type II errors viii) Level of
significance ix) p-value x) Size of the test xi) Power of the test xii)
Power function of a test xiii) Power curve.
Definition of most powerful test of size α for a simple hypothesis against
a simple alternative hypothesis. Neyman-Pearson fundamental lemma.
Randomised test ( Ref. 1,2,10)
15 Lectures
Unit II :UNIFORMLY MOST POWERFUL& LIKELIHOOD RATIO
TESTS
Definition, Existence and Construction of Uniformly most powerful
(UMP) test ( Ref. 1,2,10)
Likelihood ratio principle: Definition of test statistic and its asymptotic
distribution (statement only). Construction of LRT for the mean of
Normal distribution for (i) Known σ2 (ii) Unknown σ
2(two sided
alternatives).LRT for variance of normal distribution for (i) known µ (ii)
unknown µ (two sided alternatives hypothesis)
(Ref. 1,2,3,4)
15 Lectures
Unit III: SEQUENTIAL PROBABILITY RATIO TESTS
Sequential test procedure for testing a simple null hypothesis against a
simple alternative hypothesis. Its comparison with fixed sample size
(Neyman-Pearson) test procedure.
Definition of Wald’s SPRT of strength (α, β). Graphical/Tabular
procedure for carrying out SPRT. Problems based on Bernoulli,
Binomial. Poisson, Normal & Exponential distributions.
(Ref. 1,6,7,8)
15
Lectures
Unit IV: NON-PARAMETRIC TESTS
Need for non parametric tests.
Distinction between a parametric and a non parametric test.
Concept of a distribution free statistic. Single sample and two sample
Nonparametric tests. (i) Sign test (ii) Wilcoxon’s signed rank test (iii)
Median test (iv) Mann–Whitney test (v) Run test (vi) Fisher exact test
(vii) Kruskal -Wallis test (viii) Friedman test
15 Lectures

24
Assumptions, justification of the test procedure for small & large samples
. (Ref.5,9)
REFERENCES:
1. Hogg R.V. and Craig A.T: Introduction to Mathematical Statistics, Fourth edition London
Macmillan Co. Ltd.
2. Hogg R.V. and Tanis E.A.: Probability and Statistical Inference, Third edition Delhi Pearson
Education.
3. Lehmann, E. L: Testing of Statistical Hypothesis, Wiley &Sons
4. Rao, C. R.: Linear Statistical Inference and its applications, Second Edition Wiley Series in
Probability and Statistics.
5. Daniel W.W.:Applied Non Parametric Statistics, First edition Boston-Houghton Mifflin
Company.
6. Wald A.: Sequential Analysis, First edition New York John Wiley & Sons
7. Gupta S.C. and Kapoor V.K.: Fundamentals of Mathematical Statistics, Tenth edition New
Delhi S. Chand & Company Ltd.
8. Sanjay Aroraand BansiLal: New Mathematical Statistics, SatyaPrakashan, New Market, New
Delhi, 5(1989).
9. Sidney Siegal& N John Castellan Jr.:Non parametric test for behavioral sciences, McGraw
Hill c-1988
10. A. Mood , F. Graybill& D. Boes:Introduction to the theory of Statistics- McGraw Hill

25
Course Code Title Credits
USST603 OPERATIONS RESEARCH TECHNIQUES 2.5 Credits
(60 lectures )
Unit I : LINEAR PROGRAMMING PROBLEM
Two-Phase Simplex Method, Algorithm.
Dual Simplex Method, Algorithm. Post Optimality Sensitivity Analysis.
Effect on optimal solution to the LPP and improvement in the solution due to
(i) Change in cost coefficient, (ii)Change in the element of requirement vector,
(iii) Addition/deletion of a variable,(iv) Addition/deletion of a constraint.
(All expressions without proof) (Ref. 2, 3)
15 Lectures
Unit II : INVENTORY CONTROL
Introduction to Inventory Problem
Deterministic Models :
Single item static EOQ models for
(i) Constant rate of demand with instantaneous replenishment, with and
without shortages.
(ii) Constant rate of demand with uniform rate of replenishment, with and
without shortages.
(iii)Constant rate of demand with instantaneous replenishment without
shortages, with at most two price breaks.
Probabilistic models : Single period with
(i) Instantaneous demand (discrete and continuous) without setup cost.
(ii) Uniform demand (discrete and continuous) without set up cost.
(Ref. 1, 2, 3)
15 Lectures
Unit III : REPLACEMENT
Replacement of items that deteriorate with time and value of money (i) remains
constant, (ii) changes with time.
Replacement of items that fail completely : Individual replacement and Group
replacement policies. (Ref. 3)
15 Lectures
Unit IV : SIMULATION AND RELIABILITY
Concept and Scope of simulation. Monte Carlo Technique of
Simulation.Generation of random numbers using (i) Mid. Square Method and (ii)
Multiplicative Congruential Method. Inverse method of generation of random
observations from (i) Uniform distribution, (ii) Exponential distribution, (iii)
Gamma distribution, (iv) Normal distribution. Simulation techniques applied to
inventory and queueing model. (Ref. 1, 4)
RELIABILITY: Concept of reliability, Hazard-rate. Bath tub curve.
Failure time distributions : (i) Exponential, (ii) Gamma, (iii) Weibull, (iv)
15 Lectures

26
Gumbel, Definitions of increasing (decreasing) failure rate.System Reliability.
Reliability of (i) series ; (ii) parallel system of independent components having
exponential life distributions. Mean Time to Failure of a system (MTTF).
(Ref. 5,6)
REFERENCES :
1. Vora N. D. : Quantitative Techniques in Management, Third edition, McGraw Hill
Companies.
2. Kantiswarup, P.K. Gupta, Manmohan: Operations Research, Twelfth edition, Sultan Chand
& sons.
3. Sharma S. D. : Operations Research, Eighth edition, Kedarnath Ramnath & Co.
4. Taha Hamdy A. : Operations Research : Eighth edition, Prentice Hall of India Pvt. Ltd.
5. Barlow R. E. and Prochan Frank : Statistical Theory of Reliability and Life Testing Reprint,
First edition, Holt, Reinhart and Winston.
6. Mann N. R., Schafer R.E., Singapurwalla N. D.: Methods for Statistical Analysis of
Reliability and Life Data. First edition, John Wiley & Sons.
27
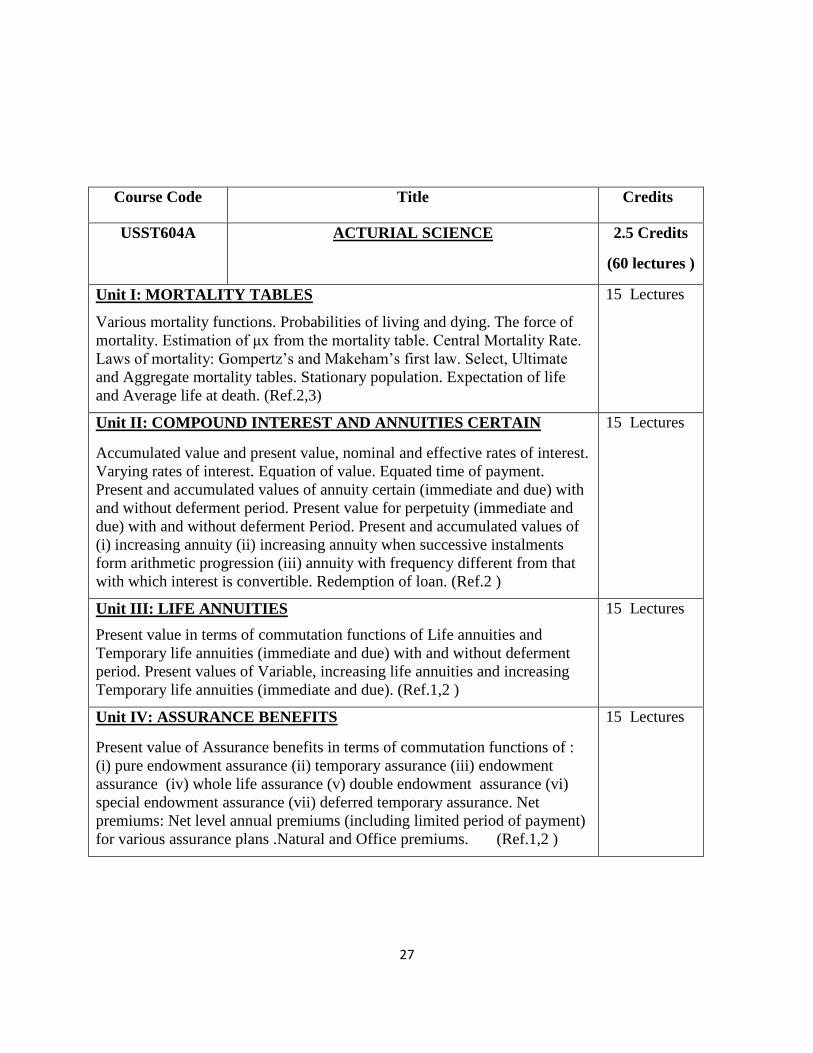
Course Code Title Credits
USST604A ACTURIAL SCIENCE 2.5 Credits
(60 lectures )
Unit I: MORTALITY TABLES
Various mortality functions. Probabilities of living and dying. The force of
mortality. Estimation of μx from the mortality table. Central Mortality Rate.
Laws of mortality: Gompertz’s and Makeham’s first law. Select, Ultimate
and Aggregate mortality tables. Stationary population. Expectation of life
and Average life at death. (Ref.2,3)
15 Lectures
Unit II: COMPOUND INTEREST AND ANNUITIES CERTAIN
Accumulated value and present value, nominal and effective rates of interest.
Varying rates of interest. Equation of value. Equated time of payment.
Present and accumulated values of annuity certain (immediate and due) with
and without deferment period. Present value for perpetuity (immediate and
due) with and without deferment Period. Present and accumulated values of
(i) increasing annuity (ii) increasing annuity when successive instalments
form arithmetic progression (iii) annuity with frequency different from that
with which interest is convertible. Redemption of loan. (Ref.2 )
15 Lectures
Unit III: LIFE ANNUITIES
Present value in terms of commutation functions of Life annuities and
Temporary life annuities (immediate and due) with and without deferment
period. Present values of Variable, increasing life annuities and increasing
Temporary life annuities (immediate and due). (Ref.1,2 )
15 Lectures
Unit IV: ASSURANCE BENEFITS
Present value of Assurance benefits in terms of commutation functions of :
(i) pure endowment assurance (ii) temporary assurance (iii) endowment
assurance (iv) whole life assurance (v) double endowment assurance (vi)
special endowment assurance (vii) deferred temporary assurance. Net
premiums: Net level annual premiums (including limited period of payment)
for various assurance plans .Natural and Office premiums. (Ref.1,2 )
15 Lectures
28
REFERENCES:
1. Neill A. : Life Contingencies, First edition, Heineman educational books London
2. Dixit S.P., Modi C.S., Joshi R.V.: Mathematical Basis of Life Assurance, First edition
Insurance Institute of India.
3. Gupta S. C. &. Kapoor V. K.: Fundamentals of Applied Statistics, Fourth edition,
Sultan Chand & Sons.

29
Course Code Title Credits
USST604B INTRODUCTION TO SIX SIGMA 2.5 Credits
(60 lectures )
Unit I : INTRODUCTION TO BASIC STATISTICS
Descriptive Statistics, Data Distribution, Skewness, Kurtosis, Box and
Whisker plots, Inferential Statistics (Sample, Population, Normal
Distribution, CLT theorem, Sampling distribution of mean), Hypothesis
testing with Normal and Non-Normal data : [1 and 2 sample tests, 1 sample
variance, One way ANOVA, Mann-Whitney U test, Kruskal-Wallis test,
Moods median test, Chi-square test], Regression analysis, Designed
experiments. (Ref. 1,2)
15 Lectures
Unit II : SIX SIGMA
History and concept, Basic Principles, Goals, six sigma v/s TQM, ISO 9000,
Traditional Management, Quality defined, VOC and CTQ, Quality
measurement to six sigma, Seven tools of quality and its application: 1)
Histogram or Stem and Leaf display. 2) Check sheet. 3) Pareto Chart. 4)
Cause and Effect diagram (Fish bone Diagram) 5) Defect concentration
diagram. 6) Scatter diagram. 7) Control charts (Only concept of control
chart), DMAIC with case study, introduction to Lean Six Sigma.
(Ref. 3,4,5,6,7,8,9,10)
15 Lectures
Unit III : CONTROL CHARTS I
Introduction, Chance and assignable causes, Statistical basis of the control
chart: Basic principles of control chart (Shewhart control charts), Choice of
control limits, Sample size and sampling frequency, Rational subgroups,
Analysis of patterns on control charts, Discussion of sensitizing rules for
control chart. Introduction to the concept of attribute, Defect. P, np, c and u
charts, their uses. p-chart with variable sample size. Operating-Characteristic
function, Average run length. Applications of variable control charts.(In
addition problems involving setting up standards for future use is also
expected), Guidelines to implement control charts. (In addition problems
involving setting up standards for future use is also expected). Ref.
11,12,13,14,15,16)
15 Lectures
Unit IV : CONTROL CHARTS II
Control chart for variables variables. X-Bar, R, S [sample standard deviation]
(Construction, charts based on standard values, Interpretation), Operating-
Characteristic function, Average run length. Applications of variable control
charts.
Introduction to process capability concept, Specification limits, natural
15 Lectures

30
References:
1. Fundamental of Mathematical Statistics, Gupta and Kapoor.
2. Probability and Random process by T. Veerarajan.
3. Six Sigma For Business Excellence, (2005), Penelope Przekop, McGraw-Hill
Six Sigma Handbook, by Pyzdek, McGraw Hill Education; 4 edition (1 July 2017).
4. The Certified Six Sigma Green Belt Handbook, Roderick A. Munro and Govindarajan
Ramu , American Society for Quality (ASQ),
5. What Is Design For Six Sigma,(2005), Roland Cavanagh, Robert Neuman, Peter Pande,
Tata McGraw-Hill
6. The Six Sigma Way: How GE, Motorola, And Other Top Companies Are Honing Their
Performance, (2000), Peter S. Pande, Robert P. Neuman, Roland R. Cavanagh, McGraw-
Hill
7. What Is Lean Six Sigma,(2004), Mike George, Dave Rowlands, Bill Kastle, McGraw-
Hill
8. Six Sigma Deployment,(2003), Cary W. Adams, Charles E Wilson Jrs, Praveen
Gupta, Elsevier Science.
9. Six Sigma For Beginners: Pocket Book (2018), Rajiv Tiwari Kindle Edition
10. Introduction to Statistical Quality Control(2009), Montgomery, Douglas, C ,Sixth
Edition, John Wiley & Sons.Inc.:.
11. Statistical Quality Control: E.L.Grant. 2nd edition, McGraw Hill, 1988.
12. Quality Control and Industrial Statistics: Duncan. 3rd edition, D.Taraporewala sons &
company.
13. Quality Control: Theory and Applications: Bertrand L. Hansen, (1973),Prentice Hall of
IndiaPvt. Ltd..
14. Introduction to Statistical Quality Control(2009), Montgomery, Douglas, C. , Sixth
Edition, John Wiley & Sons, Inc.:
15. Quality Control (1976), I.V. Burr, Mardekkar, New York,
16. Fundamentals of Applied Statistics , Gupta and Kapoor
tolerance limits and their comparisons, estimate of percent defectives,
Capability ratio and Capability indices(Cp), Capability performance indices
Cpk with respect to machine and process interpretation, relationship between
i) Cp and Cpk
ii) Defective parts per million and Cp
(Ref. 11,12,13,14,15,16)
31
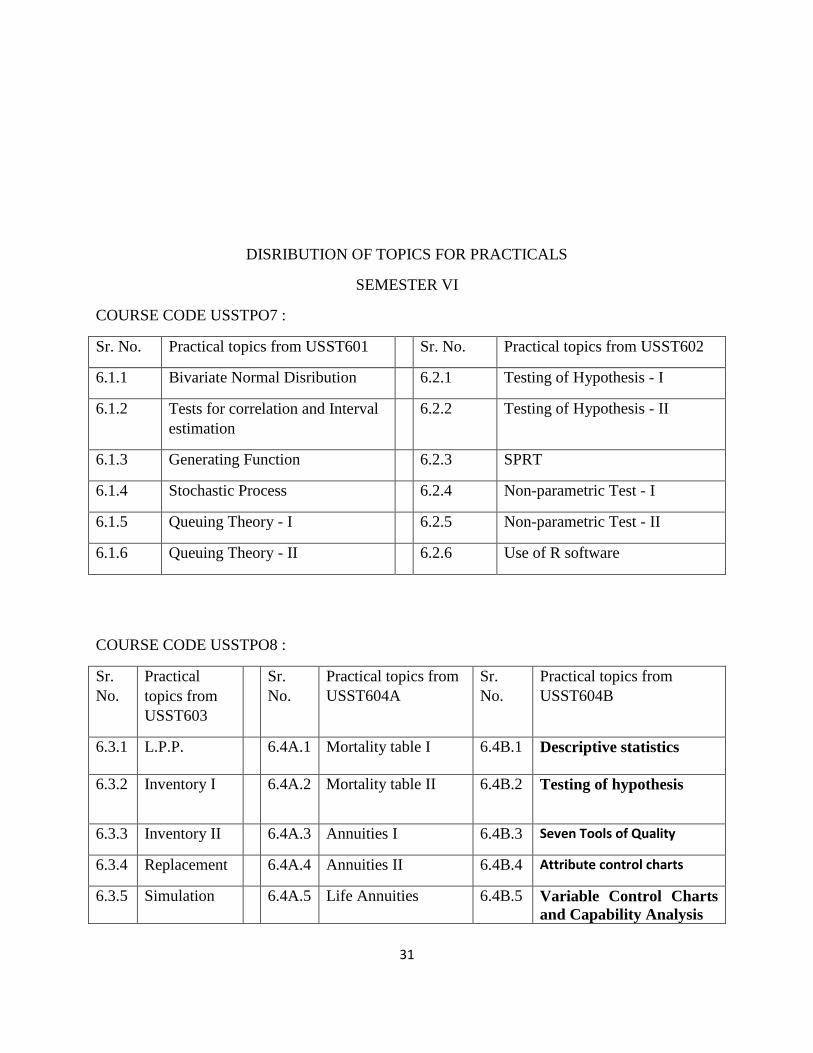
DISRIBUTION OF TOPICS FOR PRACTICALS
SEMESTER VI
COURSE CODE USSTPO7 :
Sr. No. Practical topics from USST601 Sr. No. Practical topics from USST602
6.1.1 Bivariate Normal Disribution 6.2.1 Testing of Hypothesis - I
6.1.2 Tests for correlation and Interval
estimation
6.2.2 Testing of Hypothesis - II
6.1.3 Generating Function 6.2.3 SPRT
6.1.4 Stochastic Process 6.2.4 Non-parametric Test - I
6.1.5 Queuing Theory - I 6.2.5 Non-parametric Test - II
6.1.6 Queuing Theory - II 6.2.6 Use of R software
COURSE CODE USSTPO8 :
Sr.
No.
Practical
topics from
USST603
Sr.
No.
Practical topics from
USST604A
Sr.
No.
Practical topics from
USST604B
6.3.1 L.P.P. 6.4A.1 Mortality table I 6.4B.1 Descriptive statistics
6.3.2 Inventory I 6.4A.2 Mortality table II 6.4B.2 Testing of hypothesis
6.3.3 Inventory II 6.4A.3 Annuities I 6.4B.3 Seven Tools of Quality
6.3.4 Replacement 6.4A.4 Annuities II 6.4B.4 Attribute control charts
6.3.5 Simulation 6.4A.5 Life Annuities 6.4B.5 Variable Control Charts
and Capability Analysis

32
6.3.6 Reliability 6.4A.6 Assurance benefits 6.4B.6 Practical based on
1,2,3,4,5 using MS-Excel
Semester End Examination:
Theory: At the end of the semester, Theory examination of three hours duration and 100 marks
based on the four units shall be held for each course.
Pattern of Theory question paper at the end of the semester for each course:
There shall be Five compulsory questions of twenty marks each with internal option.
Question 1 based on Unit I.
Question 2 based on Unit II.
Question 3 based on Unit III.
Question 4 based on Unit IV.
Question 5 based on all Four Units combined.
Semester End Examination Practicals : At the end of the semester, Practical examination of 3
hours duration and 100 marks (80+10*+10**) shall be held for each course as shown below:
Practical Course Part A Part B Duration Marks out of
USSTP05 Questions from
USST501
Questions from
USST502
3 hours 80
USSTP06 Questions from
USST503
Questions from
USST504
3 hours 80
USSTP07 Questions from
USST601
Questions from
USST602
3 hours 80
USSTP08 Questions from
USST603
Questions from
USST604
3 hours 80
*: Practical journal 10 marks, **: Viva 10 marks
Pattern of practical question paper at the end of the semester for each course:
Every paper will consist of two parts A and B. Every part will consist of two questions of 40
marks each. Students to attempt one question from each part.
Guidelines for conducting University examination of Paper on Statistical software at
T.Y. B.Sc. Semester V
a. The examination will be conducted in Statistics laboratory on computers.
b. Provision of at least 15 computers with necessary R / Python / MSExcel
software installed should be made available by the centre. Battery backup in
case of power failure is essential.
c. Duration of examination is one and hal hours.
d. The examination will be conducted batch wise. A batch will consist of at most 15

33
candidates.
e. The batches examined simultaneously will have same question paper. However
there will be separate question paper for each batch in case more (than one)
batches are required to be formed.
f. A candidate will solve the question paper given to him/ her on computer and the
output of work done by him/her will be evaluated by the examiner.
g. In case of partial power failure proportionate additional time may be given at
that centre for the concerned batch.
h. One internal examiner and one external examiner will be appointed for this
examination.
Workload Theory: 4 lectures per week per course. Practicals: 4 lecture periods per course per
week per batch. All four periods of the practicals shall be conducted in succession together on a
single day.
***************************************************************************