
Brokerage Commissions and Institutional Trading Patterns
46
Electronic copy available at: http://ssrn.com/abstract=528288 Brokerage Commissions and Institutional Trading Patterns Michael Goldstein Babson College Paul Irvine University of Georgia Eugene Kandel Hebrew University and CEPR Zvi Wiener Hebrew University November 18, 2007 Abstract The institutional brokerage industry faces ever increasing pressure to lower trading costs, which has already driven down average commissions and shifted volume towards low-cost ex- ecution venues. However, traditional full-service brokers that bundle execution with services remain a force and their commissions are still considerably higher than the marginal cost of trade execution. We hypothesize that commissions constitute a convenient way of charging a prearranged xed fee for long-term access to a brokers premium services. We derive testable predictions based on this hypothesis and test them on a large sample of institutional orders from 1999-2003. We nd that institutions negotiate commissions infrequently, and thus com- missions vary little with order characteristics. Institutions also concentrate their order ow with a relatively small set of brokers, with smaller institutions concentrating their trading more than large institutions and paying higher per-share commissions. These results are stable, consistent with our predictions, and cannot be explained by cost-minimization alone. Finally we discuss the evolution of the institutional brokerage market within the proposed framework and make predictions about the future developments in the industry. JEL Classications: G23, G24. We would like to thank Abel/Noser, Greenwich Associates and the Institutional Broker Estimate Service for providing the data. We also thank Ekkehart Boehmer, Chitru Fernando, Terence Lim, Marc Lipson, Maureen OHara, Christine Parlour, Chester Spatt, George Soanos, Daniel Weaver, seminar partici- pants at the Hebrew University, HEC (France), Tel Aviv University, Texas A&M, the NASDAQ Economic Advisory Board and participants at the New York Stock Exchange conference, the Yale-Nasdaq conference, and the FIRS Capri conference for their comments. We also thank Granit San for her assistance with the CDA/Spectrum data, David Hunter for his help with Thompson mutual funds data, and Michael Borns for his expert editorial assistance. Goldstein gratefully acknowledges nancial support from the Babson College Board of Research; Kandel and Wiener are grateful to the Krueger Center for Financial Research at Hebrew University for nancial support . We apologize for any errors remaining in the paper. Corresponding author: Paul Irvine, 444 Brooks Hall, Terry College of Business, Athens, GA 30602, e-mail: [email protected].
-
Upload
independent -
Category
Documents
-
view
0 -
download
0
Transcript of Brokerage Commissions and Institutional Trading Patterns

Electronic copy available at: http://ssrn.com/abstract=528288
Brokerage Commissions and Institutional Trading Patterns�
Michael GoldsteinBabson College
Paul IrvineUniversity of Georgia
Eugene KandelHebrew University and CEPR
Zvi WienerHebrew University
November 18, 2007
Abstract
The institutional brokerage industry faces ever increasing pressure to lower trading costs,which has already driven down average commissions and shifted volume towards low-cost ex-ecution venues. However, traditional full-service brokers that bundle execution with servicesremain a force and their commissions are still considerably higher than the marginal cost oftrade execution. We hypothesize that commissions constitute a convenient way of charging aprearranged �xed fee for long-term access to a broker�s premium services. We derive testablepredictions based on this hypothesis and test them on a large sample of institutional ordersfrom 1999-2003. We �nd that institutions negotiate commissions infrequently, and thus com-missions vary little with order characteristics. Institutions also concentrate their order �ow witha relatively small set of brokers, with smaller institutions concentrating their trading more thanlarge institutions and paying higher per-share commissions. These results are stable, consistentwith our predictions, and cannot be explained by cost-minimization alone. Finally we discussthe evolution of the institutional brokerage market within the proposed framework and makepredictions about the future developments in the industry.
�JEL Classi�cations: G23, G24. We would like to thank Abel/Noser, Greenwich Associates and the InstitutionalBroker Estimate Service for providing the data. We also thank Ekkehart Boehmer, Chitru Fernando, Terence Lim,Marc Lipson, Maureen O�Hara, Christine Parlour, Chester Spatt, George So�anos, Daniel Weaver, seminar partici-pants at the Hebrew University, HEC (France), Tel Aviv University, Texas A&M, the NASDAQ Economic AdvisoryBoard and participants at the New York Stock Exchange conference, the Yale-Nasdaq conference, and the FIRSCapri conference for their comments. We also thank Granit San for her assistance with the CDA/Spectrum data,David Hunter for his help with Thompson mutual funds data, and Michael Borns for his expert editorial assistance.Goldstein gratefully acknowledges �nancial support from the Babson College Board of Research; Kandel and Wienerare grateful to the Krueger Center for Financial Research at Hebrew University for �nancial support . We apologizefor any errors remaining in the paper. Corresponding author: Paul Irvine, 444 Brooks Hall, Terry College of Business,Athens, GA 30602, e-mail: [email protected].

Electronic copy available at: http://ssrn.com/abstract=528288
Brokerage Commissions and Institutional Trading Patterns
Abstract
The institutional brokerage industry faces ever increasing pressure to lower trading costs, whichhas already driven down average commissions and shifted volume towards low-cost execution venues.However, traditional full-service brokers that bundle execution with services remain a force and theircommissions are still considerably higher than the marginal cost of trade execution. We hypothesizethat commissions constitute a convenient way of charging a prearranged �xed fee for long-termaccess to a broker�s premium services. We derive testable predictions based on this hypothesisand test them on a large sample of institutional orders from 1999-2003. We �nd that institutionsnegotiate commissions infrequently, and thus commissions vary little with order characteristics.Institutions also concentrate their order �ow with a relatively small set of brokers, with smallerinstitutions concentrating their trading more than large institutions and paying higher per-sharecommissions. These results are stable, consistent with our predictions, and cannot be explainedby cost-minimization alone. Finally we discuss the evolution of the institutional brokerage marketwithin the proposed framework and make predictions about the future developments in the industry.

1 Introduction
The dominant business model in the institutional brokerage industry is under attack from discount
brokers, crossing networks, and ECNs, which provide trade execution at less than half the cost of
full-service commissions. In contrast, full-service brokers produce research, provide capital, time,
and expertise to facilitate trade execution, and allocate initial public o¤erings. These valuable but
costly services are bundled with trade execution and paid for with a high per-share commission.
In this paper we examine, theoretically and empirically, the economics of the bundled commission
market and �nd associated patterns of institutional trading that are not generally recognized. We
also use this framework to describe the evolution of the institutional brokerage industry.
Although commissions were deregulated on May 1, 1975, the continued reliance on high per-
share commissions is puzzling. In other industries deregulated in the 1970s, such as trucking,
banking, and airlines, the bundling of services and inducement in kind disappeared quickly after the
onset of competition. In addition, high per-share commissions do not appear to be the most natural
way for brokers to charge for order execution, since, as with any transaction cost, commissions
should signi�cantly reduce turnover, as argued in Constantinides (1986) and Vayanos (1998).1 Yet
the practice persists over thirty years after deregulation.2
It was argued that the main reason why the bundling of execution and services has survived for so
long after deregulation is the safe harbor provision of Section 28(e) of the 1975 Amendments to the
Securities Act. Section 28(e) permits institutions to pay for various investment-related services out
of brokerage commissions, rather than out of the management fee. While this exception facilitates
the continuance of bundling, it is not a su¢ cient condition, as payment for these services can take
other forms. Thus the underlying economics of per-share commissions and their impact remain
largely unexplored. Similar to airlines and restaurants, brokers provide many services that they
either cannot, or do not wish to, sell outright. Instead, they allocate them to their best clients as
a reward for past business and an inducement for future business. We contend that brokers and
their institutional clients enter into long-term agreements specifying a level of service (premium or
standard) and the overall payment for it. The payment for these services is rendered through the
1Since the level of trading volume remains one of the more puzzling problems in Finance, any market featurethat impedes trading, makes it even more puzzling. We argue later that full-service brokerage commissions do notconstitute marginal cost and thus do not impede trading as much.
2Total commission revenues have been steadily increasing over time: from $1.74 billion from all sources in 1974to $13.2 billion paid by institutional investors alone in 2005. Despite the growth of electronic trading, full-servicecommission payments still dominate U.S. institutional execution. So�anos (2001) notes that institutional commissionrates remain considerably higher than the marginal cost of trade execution.
1

appropriate allocation of order �ow to brokers, as institutional per-share commissions are already
set in the contract. These contracts may be informal, yet well understood by the parties involved.
Cumulative institutional commissions therefore represent a metering device that determines the
allocation of commission dollars, making it simple for a broker to keep a detailed pro�t and loss
account for each client, as noted in Kelly and Hechinger (2004).
In this paper, we suggest that per-share commissions constitute a convenient and legally safe-
harbored way of charging a prearranged �xed fee for a broker�s premium services. If one takes this
view of commissions, then the predictions of the extant quid pro quo theoretical models of com-
missions and trading, such as Brennan and Hughes (1991) and Brennan and Chordia (1993), may
change and empirical estimates of marginal trading costs need to be reexamined. This framework
can explain the continued existence of high per-share commissions despite notable competition
from discount brokers and ECNs. Viewing commissions as a prearranged fee also severs the link
between the characteristics of an order (such as price and size) and the commission applied to
it. On the other hand, it links commissions to the value of the premium services supplied by
full-service brokers. Finally, this framework helps predict institutions�allocation of trading volume
across brokers.
Using a proprietary database of institutional orders in 1999-2003 from Abel/Noser, we �nd
support for our hypotheses. First, we show that there is relatively little variation in the per-share
institutional commissions across transactions, regardless of the institution, broker, or trade. In fact,
the majority of institutional client-broker pairs use only one or two di¤erent per-share commissions
for all their transactions, which indicates that the order characteristics are not driving commissions.
Indeed, we �nd that the most important determinant of the per-share commission on any order is
the prior-period commission paid by that institutional client to that same broker. Order-speci�c
factors have little explanatory power. These results are stable through time and are consistent with
commissions being a metering device used to pay for a broker�s premium services, which implies
that full-service commissions are an average and not a marginal cost of trading.
Second, if institutions pay for premium services through commissions, it should a¤ect their
choice of order �ow allocation across brokers. Gargantuan institutions, such as Fidelity, can allocate
small proportions of their volume and still obtain the premium status from most brokers. Most
institutions, however, face a trade-o¤ between the need to hide their trading strategy by dispersing
their trades and the bene�ts of concentrating their order �ow with a small set of brokers, for whom
they become important clients and receive premium services. Consistent with this hypothesized
2
trade-o¤, we �nd that institutions indeed concentrate their volume with a few brokers, and smaller
institutions concentrate signi�cantly more. These �ndings are consistent over time. Third, we �nd
that smaller institutions also pay higher per-share commissions and tend to have higher turnover,
two facts consistent with their desire to pay enough to receive premium services from a few brokers.
Fourth, we present a simple alternative model wherein institutions allocate their order �ow to
minimize their total execution costs. While some results on the patterns of institutional order �ow
are consistent with both hypotheses (as these are not mutually exclusive), others are inconsistent
with the cost-minimization model, yet corroborate our hypotheses.
Finally, we show that the proportion of volume sent to ECNs increases over time at the expense
of full-service execution. Although the practice we describe remains in place throughout the period,
there is downward pressure on full-service per-share commissions. Even the practice of bundling
services with execution is under competitive pressure. A stronger emphasis on buy-side execution
costs forces many full-service brokers to provide low-cost execution in-house. Recent regulatory
measures have also reduced the pro�tability of premium broker services. In addition, more re-
search talent is moving from investment banks to hedge funds, which demand liquidity rather than
proprietary research. Together, these factors imply that the value of brokers�premium services
has declined for many institutional clients, while the importance of liquidity has increased. Conse-
quently, it is reasonable to presume that the process of the unbundling of research from execution,
which has already began, will accelerate in the future.
The paper is organized as follows. Section 2 puts the commissions in the perspective of the
extant literature. Section 3 presents commissions in the context of a long-term contract and presents
supporting evidence. Section 4 generates and tests hypotheses regarding the allocation of trading
volume across brokers. Section 5 examines the market for a broker�s premium services. Section 6
concludes.
2 History of Commissions and the Literature
Prior to 1975, commissions were tightly regulated by the SEC, and essentially �xed. Copeland
(1979) reports that prior to 1975 institutional commissions on the NYSE were a direct function of
both price and shares traded and calculated as
Commission per share = A+B � Price: (1)
3

The coe¢ cients A and B could vary with trade size and commissions on orders above $300,000
could be negotiated. As with many other industries under price regulation such as airlines, banking,
and trucking, brokers who were prohibited from competing for clients with lower priced commissions
reverted to o¤ering auxiliary services. Thus, prior to 1975, the bundling of services with execution
was the norm.
The May 1975 deregulation abolished �xed commissions, resulting in two major impacts on
securities trading. First, commissions fell rapidly, though not uniformly for all trades: Tinic and
West (1980) found large di¤erences across trade sizes, with large trades getting lower per-share
commissions. Figure 1 presents a 1977-2004 time-series of average institutional commission rates
reconstructed from Greenwich Associates survey data. The �gure shows how average institutional
commissions fell from the mid-teens (in cents per share) in the late 1970s to just under 5 cents per
share in 2004. The decline in real terms is much more dramatic.
The second major impact of deregulation was that discount brokers began to trade NYSE-
listed stocks. For the �rst time, institutional investors were able to unbundle trade execution from
the provision of ancillary services. Initially, discount brokers captured little institutional trading
volume: the discount market share was only six percent in 1980 (Jarrell, 1984). By 2003, over
forty percent of institutional volume in our sample was executed at discount prices. While this
is a signi�cant change, it is still surprisingly small relative to other industries that underwent
deregulation.3 This paper explores the economic forces that make this practice so persistent.
Early research modeled the post-deregulation commissions as a negotiated marginal cost of
trade execution, but the evidence for this was mixed. While Ofer and Melnick (1978) claimed
that commission rates represent the costs of executing various orders, Jarrell (1984) �nds that
commissions per share were relatively invariant to their estimated per-share cost, with the pro�ts
from large trades subsidizing losses from executing small trades. In Edmister (1978) and Edmister
and Subramanian (1982) the focus shifts to measuring commissions as a percentage of price.
Re�ecting this view, Figure 2 presents percentage institutional commissions on the NYSE in our
1999-2003 sample. In this graph, institutional commissions appear to be a continuously distributed
transaction cost, which seems consistent with the extant literature. The largest frequencies are
between 5 and 15 basis points of the stock price, and there is a long right tail, which gradually dies
out (we truncate it at 33bp for ease of presentation). However, the representation of commissions
3Close to 60 percent of institutional trades still pay commissions that bundle services with trade execution.
4
in basis points is misleading for U.S. stocks.4 In fact, the variation in commissions in Figure 2
comes primarily from price variation rather than from commission variation. To illustrate this
point, Figure 3 presents commissions in cents per share in 1999 and in 2003. For clarity, we round
commissions to the nearest tenth of a cent, making one hundred di¤erent price points available to
institutional brokers. Ignoring most available prices, brokers primarily price commissions in exact
cents per share. Commissions of 5 and 6 cents constitute the majority of observations in the 1999
sample, with the bulk of the rest executed at 2, 3, or 1 cent per share, respectively. While Figure
3 shows the distribution of institutional commissions in 2003 to be similar to that in 1999, the
increased competition from ECNs has signi�cantly reduced average commissions. Although this
trend is mainly re�ected in the paucity of commissions per share above 5 cents in 2003; commissions
of 6 cents per-share have almost disappeared.
Figure 4 presents the frequency of commissions by �ve order-size categories. For orders under
500 shares, low commissions are somewhat more prevalent: 25 percent of all small orders are
executed at 2 cents per share, while 52 percent are executed at 5 or 6 cents per share. For large
orders of over 10,000 shares, only 14 percent are executed at 2 cents per share, while 67 percent are
executed at 5 or 6 cents per share. Consistent with our point that commissions are not negotiated
trade-by-trade, So�anos (2001) contends that this variation in commission rates across order size
is likely due to the choice of trading venue by the client and not by the client-broker negotiations
over the commission rate on a particular order.
Note that while the safe-harbor provision of Section 28(e) allows institutions to pay higher com-
missions to brokers that provide additional services, thus making it possible for higher commissions
to exist, in no way does this provision require or predict the commission pattern observed in Figure
3 or the subsequent implications for trading volume allocation. The brokers could, for example,
charge the marginal cost of each particular trade plus a �xed markup. In such a case, observed
commission costs per share could vary widely. Since there are only a small number of per-share
commission price points in the data, something beyond Section 28(e) must be at work as well.
An extensive literature treats (explicitly or implicitly) commissions as a marginal execution
cost: Copeland (1979), Loeb (1983), Roll (1984), Berkowitz, Logue, and Noser (1988), Brennan
and Hughes (1991), Dermody and Prisman (1993), Chan and Lakonishok (1993, 1995), Livingston
and O�Neal (1996), Keim and Madhavan (1997), Bertsimas and Lo (1998), Conrad, Johnson, and
4However, it is common for commissions for European or Japanese stocks to be quoted in basis points. As wedemonstrate later, our results are not dependent on the type of quoting mechanism.
5

Wahal (2001).5 These studies �nd that commission costs, while smaller than price impact costs, are
still signi�cant, and have a material impact on various decisions by investors.6 Since the continuous
distribution of percentage commissions is an artifact of price variability and has little to do with
the determination of actual commissions, the interpretations of these �ndings may require revision.
A signi�cant part of what these studies consider a marginal cost of execution is not. For example,
Brennan and Hughes (1991) argue that �rms can a¤ect the level of analyst coverage they receive
by splitting their stock. In the model, splits increase the potential commission revenue generated
by trading the stock. However, if the total institutional commissions paid to a particular broker
are predetermined, then the broker receives little or no marginal revenue bene�t from the split, so
the results of Brennan and Hughes (1991) may require an alternative explanation. We expand on
this idea below.
3 Commission in the Context of a Long-Term Contract
Why should institutional commissions on the NYSE-listed stocks be charged using a few discrete
cents-per-share prices? Given the downward trend in average commissions (Figure 1), the market for
institutional execution appears competitive (Blake and Schack, 2002). Why then is the distribution
of per-share commissions in Figure 3 largely bimodal, a trend that accelerates as average per-share
commissions fall?
Since it is di¢ cult to reconcile the discrete distribution of commissions in Figure 3 and the
idea that commissions are proportional to the marginal cost of executing an order, we hypothesize
that per-share commissions are determined by the broker upfront and are not subject to change or
negotiations on an order-by-order basis. Instead, brokers set the prices for their premium services
packages. Given these prices, institutions decide which premium packages to purchase. If they
choose to remain with the standard level of services, they are under no obligation to the broker. If,
however, they choose to acquire the premium status, then they pay for it by routing enough trading
volume to this broker and paying the pre-speci�ed per-share commission. Brokers and their client
institutions then monitor the level of services received and the volume traded, keeping detailed
5These studies usually implicitly treat commissions as a marginal cost, by dividing the total per-share commissionby the share price. In our framework, only the relatively small execution cost component of full-service commissionsis truly a marginal cost.
6Commissions costs also have a signi�cant impact on the cost of owning mutual funds. Hechinger (2004) reportsthat Lipper Inc. studied 2,000 funds for the Wall Street Journal and found that brokerage commissions can morethan double the cost of owning fund shares.
6

accounts.7 Under this hypothesis, per share full-service commissions do not represent the marginal
cost of trading, but rather serve as a metering device representing the average cost of services.
Institutional brokerage is not the only competitive industry that charges for services through
something similar to the commissions relationship we have described. An analogous market mech-
anism is found in the airlines�frequent-�ier programs. Airlines possess valuable assets that they
cannot (or prefer not) sell outright, such as empty �rst-class seats. These seats are often allocated
to valuable customers based on the number of miles the customer has �own with the airline. The
level of services is a step function of the accumulated miles. Travelers tend to concentrate their
trips on their frequent-�ier airline to ensure continued access to the airline�s premium services.
Both miles �own and total commissions represent easy to compute (for both parties) metrics that
e¢ ciently measure the importance of a client to each business.8
The cent-per-share denomination of commissions, common in the U.S., is not necessary for
the long-term contract to exist and is not central to our argument. Commissions in Europe and
Japan are traditionally quoted in basis points of trade value. The standard full-service institutional
commission in Europe today is 15 basis points, which yields similar revenue for the broker on a stock
priced around $25-30 as a U.S. commission of 4-5 cents per share.9 Similarly, electronic execution
in Europe is priced at 5 basis points, which is comparable to 2 cents per share in the U.S. Thus,
the key element of the commission contract described here is not the basis on which the metering
is done, be it cents or basis points, but the metering itself, which explains the continued existence
of a premium commission in the presence of cheaper alternatives.10
Our framework, while applicable to soft dollars, is a much more encompassing concept. Soft
7Our conversations with market participants suggest that this is the way commissions are set and monitored. Asper-share commissions are relatively constant, each broker must only measure the total number of shares receivedfrom an institution over the contract period to ensure that it receives enough revenue to continue providing theagreed-upon level of service. Where these institutions execute the rest of their trades is immaterial, as institutionshave no incentive to reduce their level of trade with a broker unless they are dissatis�ed with the services they receive.
8Another puzzling example of a linear contract based on a measure unrelated to performance is found in adver-tising. Advertising agencies receive revenues proportional to total media billings for their campaign. As in brokerageservices, the quality of a single campaign is hard to quantify and contract upon, and thus the parties cannot basea payment on an objective performance measure. Instead, payments are based on an easily measurable variablethat is under the full control of the client, who, therefore, determines the total payment. It is well known that�rms frequently change their advertising agencies in search of better creativity. What is less known is that it is notuncommon for an agency to dismiss the �rm if its billings are too low for the required e¤ort.
9When commission deregulation �nally arrived in Japan in October 1999, the Japanese commission contractchanged from a function of price and volume (similar to that in the pre-deregulation NYSE) to European percentagecommissions.
10Our hypothesis implies that the institutional commissions in Europe, as represented in cents per share shouldbe distributed continuously, whereas the distribution of commissions in basis points should be discrete. While we donot have data available to test this hypothesis directly, from the limited data that we have seen and conversationswith industry practitioners, this seems to be the case.
7
dollars usually represent an explicit charge for services purchased from outside vendors. They have
been studied by regulators (SEC, 1998), practitioners (Greenwich, 2002) and academics (Blume,
1993: Conrad, Johnson and Wahal, 2001). Our focus is wider and extends to all full-service com-
missions, whether or not they are recorded in a separate soft-dollar account.
The di¤erence in our emphasis is not merely semantic. According to Greenwich Associates
(2002), explicit soft-dollar commissions constitute only 27 percent of all full-service commissions,
while the SEC (1998) reports that the 70 institutions it surveyed direct only about 8 percent of
their total commissions to soft-dollar accounts. However, in 1999 over 70 percent of all commissions
execute at prices above ECN execution costs (in 2003 this number falls to 58 percent), implying
that the market for premium commissions is much larger than conventional de�nitions of soft-
dollar payments. Second, our argument applies in regulatory regimes, such as the UK, where
explicit soft-dollar arrangements are ruled out but where informal contracts for premium services
still exist. Finally, explicit soft-dollar payments are predominantly used to buy third-party services:
according to the SEC (1998), the most common use of soft dollars is as a payment to data vendors
such as Standard and Poor�s, First Call, and Bloomberg. Thus, soft dollars do not necessarily yield
the same predictions regarding the allocation of order �ow as the premium service hypothesis.
3.1 Implications
Since brokers and their institutional clients predetermine commissions in a long-term agreement,
there is no reason to negotiate commissions on a trade-by-trade basis, and the same price is charged
repeatedly. Therefore, one testable prediction of our conjecture is the persistence of commissions
on orders between the same institutional client-broker pair. In an environment with little or no
order-by-order negotiation over commissions, variables normally used to proxy for the execution
cost of a trade should be relatively unimportant in determining per-share commissions, while the
past commission should be the main predictor.
Our ideas also explain why previous empirical studies contrasting commission costs with execu-
tion costs consistently �nd no signi�cant correlation between the two (Berkowitz, Logue, and Noser,
1988; Chan and Lakonishok, 1993, 1995; Conrad, Johnson, and Wahal, 2001). If commissions are
not charged based on the marginal cost of execution there should be no relation between the two
variables.
Finally, paying a commission arranged in advance is attractive to institutions relative to negoti-
ating commissions on an order-by-order basis, which takes time and impacts immediacy of execution
8

in a volatile market. Kavajecz and Keim (2005) argue that negotiations are costly, because they
reveal details about each particular order. Once the details of an order are revealed to a broker,
the institution cannot withdraw the information if the commission is unacceptable. A prearranged
commission charge avoids these costs.
3.2 Data
To examine these conjectures, we use several data sources. Our primary data source consists of
25,643,364 orders for NYSE-listed stocks by 683 institutional investors executed between January 1,
1999 and December 31, 2003. The data is obtained from Abel/Noser Corporation, a NYSE member
�rm and a leading provider of transaction cost analysis to institutional investors. Abel/Noser
most often receives direct feeds from institutional investors�compliance departments, therefore, the
database represents a complete record of an institution�s trading. The database includes several
unique items: the name of the executing broker, an institutional client identi�cation number,
which permits us to track orders associated with each of the 683 institutions, and a buy/sell order
indicator. In addition, the database contains the commission cost of each order, its size, date, and
the average execution price.
With proprietary records from Abel/Noser, we identify the broker used for each order. There
are 1,064 brokers in the database; however, many brokers appear infrequently.11 To concentrate
on the most important participants, we restrict the sample to brokers who execute at least 50
orders in a calendar quarter. After imposing this restriction, only 270 active brokers remain in the
Abel/Noser data, yet they account for over 98 percent of the original observations. We have further
truncated the sample by deleting observations with commissions above 10 cents per share (2.01%
of the sample), as well as those with zero commissions (2.77%). The resulting sample consists of
24,093,939 orders.
The size of the institutional client appears in several hypotheses, therefore we sort the clients
into �ve quintiles, ranked by trading volume. We present the aggregate trading statistics by quin-
tile in Table 1, which indicates that trading activity is highly skewed towards the largest clients.
The highest-volume quintile dominates the other quintiles in terms of total trading volume, num-
ber of orders, and total commissions paid to brokers. As a robustness check, we verify that the
average stock price per order is roughly equal across quintiles, which indicates that di¤erently sized
11Several of these broker codes are not di¤erent brokers, but the same broker identi�ed with two di¤erent codes. Inaddition to consolidating these broker codes, we also account for broker mergers. To track mergers, we use Ljungqvist,Marston and Wilhelm (2006), Corwin and Schultz (2005) and several news and information services.
9
institutions are not trading vastly di¤erently priced stocks.
3.3 The determinants of commissions per share
We initially demonstrate that institutional commissions behave as if they were generated in a
long-term contract, using two empirical tests. First, for every calendar quarter in our sample
we identify the orders of client-broker pairs (keeping only pairs with at least 5 orders in that
quarter), and calculate the mode of the commission distribution for each client-broker pair.12 In
our framework, where institutional per-share commissions are part of a long-term contract and are
relatively constant over time, we expect the modal commission to dominate traditional measures
of execution costs in predicting commissions in the subsequent quarter.
Table 2 presents the transition matrix between the mode of each client-broker pair in the prior
quarter and the mode of the commission distribution between that same client-broker pair in the
posterior quarter. The number of client-broker pairs in the prior (post) quarter is presented on the
extreme right (bottom); altogether there are 4,776 client-broker pairs. The post-period row at the
bottom of Table 2 is the number of post-period pairs that execute at a particular commission and
therefore represents the unconditional distribution of the modal commission in the post period. If
commissions are negotiated on an order-by-order basis, then the distribution of modal post-period
commissions should be independent of the prior-period commission. Instead, the data shows that
the actual transition probabilities depend heavily on the mode of the prior-period commission and
are dramatically di¤erent from the unconditional distribution probabilities, as demonstrated by
comparing the conditional probabilities along the main diagonal and the unconditional probabilities
along the bottom row. To verify the importance of the prior-period commission on the frequency
of post-period commissions, we perform a likelihood ratio test (Greene, 1997). In each case, the
hypothesis that the conditional probabilities are equal to the unconditional probabilities is strongly
rejected. Hence, the observed frequencies of post-period commissions are signi�cantly a¤ected by
prior-period commissions.
The fact that the prior-period commission between a client-broker pair is a strong predictor
of the future modal commissions between that client-broker pair is consistent with the conjecture
that per-share commissions represent average costs in long-term client-broker agreements. Next,
we extend our tests of this hypothesis by contrasting the ability of standard measures of execution
12Our results are robust to alternative de�nitions of a client-broker pair. Using a minimum of �ve trades increasesthe noise in the mode estimate relative to larger cuto¤ points and, therefore, our presented results are conservative.
10

costs to predict order-by-order commissions against the ability of the prior-period mode.
Similar to many other authors, Roll (1984) assumes that brokerage commissions are negotiated
on the basis of the di¢ culty of the order execution. Table 3 presents regressions which estimates
Equation (2) with and without the prior-period modal commission:
Commission per share = �+ �1Price+ �2Shares+ �3Mkt% (2)
+ �4Mode+ �5Cvol + �6Bvol + �:
In Equation (2), commission per share on an order in the post-period is the function of: Price - the
execution price, Shares - the order size in log shares, Mkt% - the order size as a percentage of that
day�s trading volume in the stock, Mode - the mode of the prior-period commission distribution
for each client-broker pair, Cvol - the volume-based quintile size rank (smallest (1)-largest (5)) of
the institutional client, and Bvol - the volume-based quintile size rank of the executing broker.
The explanatory power of the prior-period Mode relative to the explanatory power of the
execution cost variables - Price; Shares and Mkt% - is key to interpreting Equation (2). Our
hypothesis suggests that the Mode will have a strong explanatory power and a positive coe¢ cient.
Alternatively, if the traditional view that execution costs of a particular order a¤ect commissions
is correct, then we expect the execution cost variables to in�uence the post-period commission.
The e¤ect of Price on commissions per share should be positive as higher priced stocks may
require higher capital commitments from facilitating brokers. Larger orders may be more di¢ cult
to execute, so Shares should be positively related to commissions per share. Mkt% is a measure of
order di¢ culty: the larger the order relative to daily volume, the greater total liquidity the order
demands. Hence, Mkt% should be positively related to commissions per share. Cvol and Bvol are
included as control variables that measure potential e¤ects in commission rates related to the size
of the client or the size of the broker.
The �rst two regressions in Table 3 present two speci�cations of Equation (2) for all 16.5
million orders in the client-broker pairs sample (All). Under the null hypothesis that commissions
can be represented as a continuous distribution of marginal transactions costs, OLS estimation is
appropriate. However, as we show in Figure 3, the distribution of commissions per share is discrete,
not continuous. Thus we also present the log likelihoods from ordered Logit regressions to con�rm
the OLS inferences about the economic signi�cance of each regression are robust.13
13To save space we do not report the coe¢ cient results from the Logit speci�cation. The results are similar andare available upon request.
11

Execution cost variables do not explain much; although order size (Shares) has the predicted
sign, order di¢ culty (Mkt%) does not, and the regression only manages an R2 = 0:0098. Adding the
prior Mode as an additional explanatory variable increases the R2 substantially to 65:8 percent.
This striking result shows that past commissions dominate the order-speci�c characteristics in
explaining the order-by-order commissions.
Given the relatively bimodal distribution of commissions per share presented in Figure 3, it
is possible that the prior mode simply proxies for di¤erences between the commission levels at
full-service brokers as opposed to ECNs and other discounters. To check the robustness of our
results, we examine three regression speci�cations, estimating commissions per share separately for
low cost (per-share commissions <= 3 cents) and high cost (> 3 cents) markets separately. Again,
we are primarily interested in the relative explanatory power of the execution cost proxies against
our long-term agreement proxy (Mode). It turns out that in both sub-samples, the execution cost
variables do very poorly, obtaining R2 of 0.01-0.03 percent. In both markets, adding the Mode
to the speci�cation signi�cantly increases the explanatory power of the regression to 26 and 13
percent, respectively. This evidence indicates that individual trade commission costs are not driven
by the characteristics of particular trades and indicates how far the market has evolved from the
regulated commission market of Equation (1). Being invariant to the costs of trade execution,
commissions are unlikely to represent marginal execution costs.
Thus, the commission charge in both markets is best explained by the prior modal commission
between a client-broker pair. This result is not driven by the safe-harbor provision: under Section
28(e) brokers could charge the marginal cost per trade plus a �xed markup. In this case, the �xed
markup would be captured in the intercept of these regressions and the varying marginal cost of
the trade should be captured by the coe¢ cients of the independent variables and the prior mode
would not much matter. However, we do not observe this result in Table 3.
The prior-period mode explains post-period commissions well because commissions are rarely
negotiated on an order-by-order basis. Figure 5 presents the frequency distribution of commissions
between our 4,776 client-broker pairs. Overall, 43.5 percent of all client-broker pairs in the sample
only use a single per-share commission on all the orders they transact. An additional 30 percent of
client-broker pairs pay only two commission prices and over 92.6 percent of all client-broker pairs
use four or fewer commission prices. Clearly, order-by-order negotiation of commissions must play
a relatively minor role in the institutional market. Yet more than one per-share commission can,
in some instances, be used to ful�ll the terms of the long-term contract.
12

The relationships between four prominent full-service brokers and their largest ( > 50 trades
per client per quarter) clients in the �rst quarters of 1999 and 2003 serves as an illustration of
their response to low-cost competition. For example, Morgan Stanley o¤ers low-cost (<=3 cent)
executions to only 31 of these clients in 1999, but extends the arrangement to 58 clients by 2003.
Bear Stearns�low-cost commission relationships rise from 31 to 41 during the same period. The
change at Goldman Sachs is more dramatic: low-cost commission alternatives are charged to 22
of their largest clients in 1999, and to 55 in 2003. Finally, Merrill Lynch�s low-cost relationships
almost triple from 21 in 1999 to 61 in 2003. These market changes are re�ected in the decline of
average commissions presented in Figure 1 and the shift in the distribution of commissions towards
ECN prices presented in Figure 3.
4 Commissions and Institutional Trading Patterns
4.1 Hypotheses based on the long-term contract conjecture
One consequence of the bundling arrangement is that some clients get better service than others.
If an institution is willing to pay a su¢ cient amount to become one of the premier clients of
a particular broker, then it receives early access to analysts� research, priority in di¢ cult trade
executions, more capital committed to its trades, and a disproportionately larger share of IPOs.
To capture their share of these services, institutions must pay hefty fees, and since these are
charged using relatively constant per-share commissions, institutions must concentrate their order
�ow with a subset of brokers if they wish to become important customers (generate su¢ cient
revenue) within this subset. Institutional trading patterns thus re�ect a pattern of concentration
(�bunching�) of trades with particular brokers. Rather than allocate their volume equally across
the brokers with through whom they choose to trade, institutions allocate volume strategically so
as to obtain premier status at as many service-providing brokers as possible.
Marginal transaction costs reduce trading volume, but if the total commission payment per
period is largely predetermined, then the e¤ect of commissions on volume and order size is minimal
when basic execution is available at competitive prices. As long as an institution can trade with a
discount broker or an ECN, its desired trading volume is set using the ECN�s low transaction costs.
Higher commissions, which include payment for other services, are inframarginal for the institution
and thus should not a¤ect the trading decision. Since per-share commissions in excess of 1-3 cent
are payments for broker services, they should have a minimal e¤ect on volume and order sizes.
13

In fact, it is possible that bundling commissions with execution actually increases the volume of
institutional trading, to the detriment of investors. If institutional investors do not bear the cost of
trading directly, they might trade too much to get their desired amount of service.14 This problem
is particularly relevant for smaller institutions that may want to increase their service above the
level they would receive based on their size.
Treating commissions as an average cost in a long-term agreement allows us to make predictions
about the allocation of institutional order �ow.
Hypothesis 1: Institutions disproportionately �bunch�their order �ow with particular brokersto receive a premier level of service from these brokers.
Hypothesis 2: Smaller institutions bunch more than larger institutions due to their desire toobtain premier status with at least some brokers.
Hypothesis 3: In addition to bunching, smaller institutions employ fewer brokers than largerinstitutions since the sheer size of large institutions allows them to attain premier status with morebrokers, while small institutions need to reduce their dispersion so as to concentrate their tradeson fewer brokers.
Hypothesis 4: Smaller institutions may be willing to increase turnover to generate highercommission revenues and receive additional services from their brokers. Moreover, small institutionsmay be willing to pay a higher per-share commission to achieve this goal.
Hypothesis 5: Similar-sized brokers may receive vastly di¤erent allocations from the sameclient, while similar-sized clients may send vastly di¤erent allocations to a particular broker.
4.2 Alternate hypotheses based on cost minimization
Service provision is not the only determinant of institutional volume allocation. There are signi�cant
costs to concentration, which can o¤set the bene�ts identi�ed above. We identify three costs that
institutions must take into account when allocating their order �ow to brokers.
1. The �xed cost of adding an additional broker to a client�s list of brokers to cover electronicconnections, billing, clearing, and other back-o¢ ce services. This cost reinforces the desire ofclients to limit the number of their brokers.
2. The cost of frontrunning : an institution may not want to send too much trading volume toa broker to prevent the broker from frontrunning (interpreted here in the broadest possiblesense).15 This cost induces the client to distribute volume more evenly across brokers and toincrease the number of brokers used. Thus, potential frontrunning costs reduce the bunchingof institutional order �ow, contrary to our hypothesis.
14This agency cost argument has been made relative to soft dollars by Berkowitz and Logue (1987) and Logue(1991). On the other hand, Johnsen (1994) and Horan and Johnsen (2004) argue that soft dollars may ameliorateagency cost issues.
15Shwartz and Steil (2002) survey 27 major investment management �rms and conclude that frontrunning costs areimportant to buy-side institutions; such costs are a primary driver of the buy-side�s demand for trading immediacy.
14

3. The cost of trading strategy recognition: institutions do not want close identi�cation with aparticular broker, so as not to disclose the identity behind their trades and potentially increasetheir price-impact costs.16 As it is easier to hide a small volume than a large one, institutionscan reduce this cost by increasing the number of brokers they use and allocate trades pro-portionally to their size. Thus, an institution minimizing trading strategy recognition wouldsend comparable trading volumes to any two of its equally-sized brokers.17
The Appendix presents a simple model of institutional volume allocation among brokers under
the criteria of minimizing the sum of these execution costs, while ignoring the hypothesized bene�ts
of the access to services. The alternative cost-minimization model also implies that higher �xed costs
reduce the optimal number of brokers per institution. However, contrary to Hypothesis 5, the cost
model predicts that similar-sized brokers should receive similar volume allocations from the same
client and that similar-sized clients send roughly equal amounts to their brokers to best disguise
their trading strategies. These contrary predictions are testable alternatives to our hypotheses.
Moreover, contrary to Hypothesis 2, the cost-minimization model implies that the allocation
of smaller institutions should be less concentrated than that of larger ones as they have less to
lose from trading strategy recognition. Although cost considerations are potentially important
determinants of institutional allocation of order �ow, they cannot generate our Hypotheses 2, 4, and
5, or explain the stability of the per-share commission equilibrium. These alternative predictions
allow us to distinguish between the two hypotheses.
4.3 Results
Table 1 shows that small institutions spend signi�cantly less in terms of total commission dollars.
How do the four smallest quintiles compete for broker services? Hypothesis 2 suggests that small
institutions bunch their order �ow and Hypothesis 4 suggests they may also pay higher per-share
commissions.18 However, the di¤erence in per-share commissions across size quintiles is relatively
modest, especially compared to the large di¤erences in average trading volume. Thus, the total
commission payment to a broker is primarily determined by order �ow, not by the size of the per-
share commission. Small clients compete for broker services by allocating a larger share of their
16Chan and Lakonishok (1993, 1995) conclude that the most important determinant of the price impact of aninstitutional trade is the identity of the institution behind the trade.
17An interesting case is provided by Fidelity, which could easily dominate any broker�s volume, but then the marketwill know that this broker�s trades have a high probability of being Fidelity trades. Market participants actively tryto determine Fidelity�s trading patterns. Pethokoukis (1997) discusses the speci�c problems Fidelity faces in hidingtheir trading strategies from the market.
18Recall that we expect large institutions to be high-revenue, high-cost customers. This contention implies thatsmaller institutions need not compete on total commission revenue, but rather on net pro�tability to the broker.
15

order �ow to particular brokers.
4.3.1 Concentration of institutional trading
The fact that order �ow is the primary determinant of broker revenue has consequences for an
institution�s trading volume allocation decisions. Panel A of Table 4 presents institutional concen-
tration of order �ow as a function of institution size (quintile).19 We examine Hypotheses 1 and
2 by calculating broker concentration as the average market share (percent of each client�s total
commission dollars) that clients in each quintile send to their highest-revenue broker (top broker),
their three highest-revenue brokers (top 3), their top 5 brokers, and their top 10 brokers.
Hypothesis 1 predicts order-�ow bunching: a skewed allocation of client orders towards their
most important service-providing brokers, which is precisely what we observe in the data. The
largest institutions send 20.8 percent of their commission dollars to their top broker, whereas an
evenly distributed allocation, which would best disguise their trading strategies, would allocate
only about one percent of their order �ow to each broker. The largest institutions concentrate
their order �ow with a few top brokers: 37.8 percent of their commission dollars goes to their top
3 brokers, 49.4 percent to their top 5 brokers, and 68.2 percent to their top 10 brokers.20
Hypothesis 2 predicts that small institutions concentrate their trading more than large institu-
tions. Indeed, we show that the bunching of order �ow with an institution�s most important brokers
increases as the size of the institution decreases. Panel A reveals that the percentage of commission
dollars executed with their top broker increases monotonically with client size to a maximum of
40.7 percent for the smallest quintile. The alternative hypothesis that order �ow executed with a
top broker is independent of institution size is rejected at the 1 percent level with an F-statistic of
12.4. The top 3, top 5, and top 10 broker categories show the same pattern of institutional bunching
and similar rejections of equality across quintiles. This pattern is consistent with large institutions
having the �exibility to become premier clients to many brokers, while small institutions are forced
to concentrate their trading with only a few. Furthermore, this �nding contradicts the predictions
of the pure cost-minimization model. Nor can the bunching result be explained by the soft-dollar
19Using information from the Securities Industry Association, and company websites, we classi�ed our 270 activebrokers into �ve types: full service, discount, ECN, wholesaler, and other brokers. Full-service brokers (144) are themost frequent broker type. Discount brokers, ECNs, and wholesalers generally do not provide broker services, whileother brokers usually provide a single service. Tests of institutional trading patterns using only full-service ordersproduce similar results to the full-sample results presented below.
20Table 4 reports institutional averages by commission dollars because commission dollars represent the importanteconomic variable: brokers�revenue. Similar conclusions are obtained from share volume, but the reader should notethat using commission dollars represents the low-cost market as a relatively less important execution method.
16
arrangements, which primarily provide for data services (SEC, 1998). Institutions do not care
which broker provides soft-dollar credits to the data vendor, and, therefore, have no incentive to
bunch. Thus, while the competition for valuable services from the broker may encourage bunching,
soft dollar arrangements are not likely to do so.
Figure 6 tracks top broker�s order �ow annually in 1999-2003. The allocation of order �ow is
consistent across client quintiles throughout our sample period, and similar patterns also prevail
in our other top broker classi�cations. This �gure indicates that the institutional trading patterns
we document (and thus our conjectured commission contract) is consistent throughout our sample
period. For speci�c agents, these important client-broker relationships are stable as well. In
untabulated results, we �nd that a top broker in a quarter has an 89.7 percent chance of remaining
in that client�s list of Top 10 brokers in the following quarter. For relationships that we can track
over the entire sample period, a client�s initial top broker remains their top broker throughout the
sample period 25.2 percent of the time. Initial top brokers remain in a client�s top 10 brokers 72.0
percent of the time. These numbers show a level of competition for a client�s revenue stream, as
top brokers are occasionally displaced. Yet displaced top brokers often remain important to the
client and remain a competitive threat to reassert their dominant position.
This competition to be a client�s most important broker may contribute to the overall declining
trend in commissions. In general, when top brokers are replaced, we �nd that the replacement bro-
ker charges an average of 0.10 to 0.15 cent lower per share commissions than the former top broker.
When the former top broker is retained by the client, we �nd that they lower their commissions to
conform to the replacement broker�s price. Thus, despite the high retention ratios between speci�c
clients and brokers, the threat of being replaced keeps commissions competitive.21 Institutional
bunching of order �ow enhances the competitive threat; if institutions had dispersed their trades,
a broker�s rank with a client would be much less important.
Panel A of Table 4 also separates out low-cost trading commissions (ECN-level: less than 3
cents per share). ECN execution does not vary much in the lower size quintiles, but the largest
institutions use low-cost commissions for a greater proportion of their execution volume than do
smaller institutions (F-statistic = 2:44). This is consistent with our �rst two hypotheses, as large
institutions can easily pay for a broker�s premium services with only a fraction of their total share
21 In unreported results, we also use Rule 606 (Dash-6) data to examine broker competition in trade execution.We �nd that newly-promoted top brokers use more market centers and executed greater volume in alternative venuesthan existing top brokers. Based on the results in Boehmer, Jennings and Wei (2007) which examines executionquality using Rule 605 (Dash-5) data, we interpret this activity as greater e¤ort on behalf of newly-promoted brokersat seeking out low-cost execution for their clients. We thank an anonymous referee for this suggestion.
17

volume, and so are free to execute a greater percentage of their trading at low prices.
Hypothesis 3 predicts that large institutions can more easily a¤ord to pay the �xed costs of using
additional brokers and therefore tend to use more brokers than small institutions. As predicted, the
average number of brokers used by institutions in each client quintile is increasing in the size of the
institution. The smallest institutions use only 30.7 brokers on average, while the largest average
79.3 brokers. This pattern is also present in the low-cost market where the smallest institutions
use an average of 8.8 brokers, while the largest quintile uses an average of 13.3. These results are
consistent with the fact that the �xed costs of setting up a broker-client relationship help determine
institutional allocation of trading. The fact that Hypothesis 3 holds overall and in the low-cost
marketplace suggests that the �xed costs of setting up a broker-client relationship are not directly
related to per-share commissions.
Additional tests of institutional bunching We perform two additional tests on the degree of
bunching. As the large institutions use more brokers than small ones do, it could appear that they
spread their trades more evenly because of that. To account for this fact we restrict our attention
to an institution�s top 10 brokers, which constitute the bulk of any institution�s order �ow and
commission dollars.22 First, we normalize to one the proportions of each institution�s order �ow
to calculate each institution�s Her�ndahl-Hirschmann Index (HHI), which is the sum of squared
proportions of volume sent to every one of the institution�s top 10 brokers times 100. The results
are presented by client quintile in Panel B of Table 4. It is clear that large institutions have a
signi�cantly more even distribution than the small ones, even when we equalize the number of
brokers used. By comparison, a uniform distribution with 10 brokers would yield an HHI of 10,
compared to our �ndings of 17.8 for the largest institutions, and 23.6 for the smallest ones.
Next, we perform a parametric estimation of an institution�s order �ow allocation using the Zeta
distribution, which is a discrete probability distribution commonly used in the natural sciences to
measure concentration of types within a population. Let us denote by Zk the proportion of volume
that an institution sends to a broker ranked k (k = 1 being the largest) out of its K brokers. Zeta
distribution implies that
Zk =C(K; �)
k�8k � K; (3)
where C(K; �) is a normalizing constant that increases in �. Higher � implies a less even distribution
22We chose 10 brokers to ensure that our tests include almost all clients. However, these results are also robust toalternative speci�cations.
18
of volume allocation and hence a greater degree of order �ow concentration. For example, � = 0
corresponds to a uniform distribution (HHI=10), � = 0:75 corresponds to a HHI of about 14,
whereas � = 1:1 corresponds to a HHI of about 20. Taking logs on both sides of (3) we obtain an
equation that allows us to estimate �:
log(Zk) = �+ � log (k) + "; (4)
where k is the rank of the executing broker for this institution. We perform the estimation separately
for every institution in the sample, and then average the results by size quintile. Panel B of Table 4
clearly indicates that the Zeta distribution provides a good �t for client order �ow. The distribution
is signi�cantly more concentrated for smaller institutions than for large ones, which is evident from
the estimates of � and the intercept. Order �ow concentration declines with institution size and
the e¤ect is most pronounced for the smallest institutions. We also show the percentage of each
quintile�s � coe¢ cients that are signi�cantly lower or higher than 1, which is the value of � that
coincides with the HHI of the median-sized institutions. The majority of the institutions in the
largest quintile have � signi�cantly lower than 1 (75%), and only a small minority are signi�cantly
higher than 1 (14%), while the corresponding values for the smaller institutions are 42% and 47%,
respectively. These results indicate that bunching is far more pronounced for smaller institutions,
consistent with Hypothesis 2, but inconsistent with the model based on cost minimization.
4.3.2 Commission size and broker rank
Hypothesis 4 suggests that, in addition to bunching more, smaller institutions may also pay higher
commissions to generate more pro�ts for the broker and gain premier status. Panel C of Table 4
presents average per-share commissions for the institutions in each quintile. The smallest-quintile
institutions generally pay higher per-share commissions that average 5.04 cents per share across all
brokers, compared to the 4.80 cents per share that the largest clients pay. The average commissions
per share for the smallest quintile is 5 percent higher than the largest clients�average commission,
but this premium rises to a 12.3 percent di¤erence if only the top broker�s commissions are consid-
ered.23 This result is supportive of the hypothesis that smaller institutions are willing to pay more
to get premium services from at least some of their brokers. While this di¤erence is modest relative
to the large di¤erences in share volume across quintiles reported in Table 1, it may still a¤ect small
23 In Table 4 per-share commissions are averaged �rst by client, then within a quintile; thus they di¤er somewhatfrom the simple quintile averages reported in Table 1. Qualitatively, however, the results are similar.
19

clients�relative positions with their brokers. As we have stated earlier, the high-commission share
volume sent to a broker essentially determines the importance of an institution to a particular
broker, nevertheless, consistent with Hypothesis 4, the smallest institutions are willing to pay a
per-share commission premium, particularly to their top brokers.
The cost minimization model presented in the Appendix suggests that volume allocation de-
pends on broker size. Small institutions, which have no di¢ culty hiding their trades, should be
indi¤erent between the large and the small brokers, while large institutions should strictly prefer
larger brokers. Moreover, similar-sized brokers should get similar allocations from similar-sized
institutions. If we assume that large brokers also provide more premium services, then the services
hypothesis also suggests that large institutions will tend to use the largest brokers, as their volume
can ensure premium services even from the largest brokers. For the smaller institutions, there is a
trade-o¤ between being a less important client for a large broker, or a more important client to a
smaller broker. We do not know a priori their optimal choice.
Panel D of Table 4 examines the average and median broker size ranks (out of 270 active brokers)
for an institution�s �ve most important brokers, averaged within institutional size quintiles. The
data reveal that each of the quintile average and the median ranks is below 50, which indicates that
all institutions regardless of size concentrate their order �ow with the largest brokers, presumably
because this group provides the most valuable services.24 Nevertheless, the comparison of means
and medians also indicates that smaller institutions do tend to use somewhat smaller brokers as
their top broker, which allows them to compete more e¤ectively for these brokers�services.
Further, we know from Panel A of Table 4 that an institution�s top broker receives a much
larger allocation of order �ow than their �fth largest broker, yet the average size rank of the
latter is lower than the average size rank for the top broker. These results show that similar-sized
brokers receive vastly di¤erent allocations of order �ow, and provide direct support for Hypothesis
5, while refuting the cost-minimization explanation for the institutional trading patterns. Given the
conclusions in Chan and Lakonishok (1993, 1995) that an institution�s identity is the paramount
factor in determining execution costs, there must be strong reasons for institutions to deviate from
a strategy of hiding in the order �ow as e¤ectively as possible. Overall, our evidence is consistent
with all clients concentrating their orders to capture the bene�ts from moving up higher in the
queue for broker�s premium services. This pattern is most pronounced for small clients, where the
24This result is not tautological. Table 1 indicates that a broker�s size rank in the sample is primarily determinedby the largest institutions. Yet, the four smallest quintile institutions, whose allocations do not signi�cantly a¤ectbrokers�size ranks, choose to concentrate their order �ow with the same set of brokers as the largest quintile.
20

bene�ts from bunching outweigh the potential costs.
Yet another way for small institutions to pay for services is to increase their volume of trading
beyond what is required by their investment strategies, as stated in Hypothesis 4. We test this
hypothesis using Thompson�s mutual fund quarterly holding data from 1997 till 2002. To avoid
outliers, we �rst remove all the fund-quarter observations where the NAV was smaller than $10
million at the beginning of the quarter, or grew by more than 50 percent during the quarter. For
each fund in the sample we calculate the change in the number of shares of every security held
over the course of the quarter, and treat it as the fund�s trading volume in this security. We then
multiply volume by the average quarterly price and aggregate over all securities, which yields an
estimate of the total trading volume in dollars. Further dividing trading volume by the NAV at
the beginning of the quarter generates a turnover estimate. Each fund is then assigned to an NAV
quintile and we calculate average turnover statistics by quintile. The annual averages are presented
in Figure 7, which clearly shows that funds in the smallest quintile exhibit much higher turnover
than funds in the two largest quintiles (the di¤erences are signi�cant at the 10 percent level).25
Although small institutions may have higher turnover for other reasons, these results are con-
sistent with our interpretation of the market for brokers� premium services. Small institutions
that cannot generate su¢ cient brokerage revenues may attempt to increase their ability to procure
premium services by concentrating their trading with only a few brokers, paying higher per-share
commissions, and increasing their turnover to provide the required revenues to the chosen brokers.
5 Equilibrium in the Premium Service Market
Full-service brokers provide many services, the most prominent are timely information provision,
the reduction of market impact on di¢ cult trade execution, and IPO access. We argue that even if
these services were sold separately, the equilibrium would not take the form of a spot market, where
these services are paid for on a quid pro quo basis, but would rather evolve into a long-term contract
between brokers and institutions.26 The main reason is that clients observe only very crude proxies
for the quality of these services on a daily basis. Removing the noise by averaging over a large
number of events makes performance measurement far more accurate and easy to evaluate.
25Using the same technique, we also tested this hypothesis on the CDA/Spectrum data from 1994 to 2000, whichprovides quarterly holdings data on all investment managers with over $100 million in assets. We found that in fourof Spectrum�s �ve institutional type classi�cations, turnover signi�cantly declines as size increases, as predicted.
26Fulghieri and Spiegel (1993) present a model of IPO underpricing wherein broker services are complements. Intheir model, large clients received the most pro�table IPO allocations.
21

We conjecture that the equilibrium in the market for premium services takes the following
form. The contract between a broker and a client is set for a speci�c period. Each broker provides
a level of service corresponding to each client�s choice and ensures that it gets appropriate payment.
Premium clients receive top priority from the research department in providing timely information,
the trading desk gives the foremost attention to their orders, while investment banking provides
them with large IPO allocations upon demand. The absolute price for this level of service is high, as
evidenced by the size of the commission market. At the end of the period, the institution evaluates
the average quality (value) of services it received from the broker and decides at what level to
continue the relationship.27 At the opposite end of the scale there are clients that demand only
basic execution without any additional services, and so no long-term contract is required.
Our conjectured equilibrium is a variation on the Klein and Le er (1981) equilibrium of product
quality assurance. In their model, a high-quality producer prices the product above its marginal
cost. The customers are willing to pay more relative to cheaper substitutes as long as the quality
is maintained above some predetermined level. The producer could cheat and produce a cheaper
product, but this behavior would stop the stream of future positive pro�ts associated with producing
the high-quality good and receiving the premium price. Thus, the equilibrium yields a high-quality,
high-price market even in the presence of low-cost substitutes. Applied to the brokerage services
market, the model suggests that institutional clients can use repeated interactions to ensure high-
quality service provision from their full-service brokers even in the presence of discount brokers.
Both parties are known to monitor the relationship. Below, we specify the nature of the most
important premium services.
Timely Information Provision
Timmons (2000) quotes an anonymous sell-side analyst as saying: �I kept my Buy rating, but
I told my favorite investors to sell.�Clearly, some clients are getting better information form their
analysts than others. From any single client�s perspective, the value of information the client
receives crucially depends on the timing of its transmission from the broker. As prices adjust
to re�ect information imbedded in trades (Glosten and Milgrom, 1985; Kyle, 1985; Easley and
O�Hara, 1987), information loses its value upon revelation to additional market participants. Thus,
the scarce resource in this context is the client�s place in the information queue: those called �rst by
27Conversations with institutional traders and research directors indicate that the quality of a broker�s servicescan be considered �xed over a quarter or six months. Over longer periods, a broker�s relative quality can deteriorate,in which case the institution pays a high price for inferior service, or it can improve, in which case the broker wouldwish to be compensated.
22

the broker get the most valuable information.28 This feature of information provision implies that
clients have strong incentives to purchase a place near the head of the broker�s queue. However,
information quality that re�ects one�s place in the queue, is di¢ cult to verify in any speci�c instance,
as it is based on realized returns in a volatile market. Idiosyncratic e¤ects tend to cancel over many
independent observations, which suggests that the quality of research services provided by brokers
can be best evaluated over a long period.
Di¢ cult trades
Institutional clients frequently demand that their brokers minimize the price impact of their
orders. The time, skill, e¤ort, and capital allocated by the broker to provide a counterparty for
an order determine the degree of its price impact. The sheer number of variables that could
potentially a¤ect execution on a particular trade suggest that ascertaining execution quality on
an order-by-order basis is practically impossible. However, the idiosyncratic variables a¤ecting
execution quality on a particular trade tend to cancel out over time, so the precision of estimates
of broker�s performance improves over longer horizons. Indeed, the extensive use by institutional
investors of such �rms as Abel/Noser, which specialize in providing comparative analysis of brokers�
execution costs over time, suggests that the agreements based on execution cost measures are likely
long term as well.29
IPOs
A broker�s best institutional clients get larger allocations of �hot�IPOs, and the larger pro�ts
associated with them (Fulghieri and Spiegel, 1993; Nimalendran, Ritter, and Zhang, 2007).30 It
is obvious that brokers cannot explicitly charge for this service, and so they allocate shares to
those who pay for them implicitly. Reuter (2006) �nds con�rming evidence through the correlation
between mutual-fund commissions paid to underwriting brokers and post-IPO fund holdings. The
fact that Reuter (2006) �nds a signi�cant relation despite the relatively infrequent reports from
his data sources is strong evidence that the IPO allocation decision is at least partly based on
28Historically, information was delivered by telephone and the broker determined the ordering of the queue, hencethe name First Call for a well-known research distribution network. More recently, electronic dissemination ofanalysts�research notes ensures that most clients receive some information at approximately the same time. Today�squeue revolves around a race to receive elaboration from the analyst on the brief First Call note to ascertain thevalue of the analyst�s information.
29Aitken, Garvey, and Swan (1995) and Foucault and Desgranges (2002) also discuss long-term relationships fortrading services.
30There is a consensus in the IPO literature that underwriters compensate institutions that consistently providethem with information about the fundamental values of the issuing �rms (Jenkinson and Ljungquist, 2000). Produc-tion of this information requires institutions to invest in research capabilities, which is not economical if institutionsare awarded small positions in IPOs. Consequently, there are imbedded economies of scale in the IPO pre-issuemarket.
23
long-term relationships between brokers and their clients.
The di¢ culty in measuring the quality of these premium services on a quid pro quo basis
suggests that long-term agreements, which �x the level of service and the required payment over a
long period, are appropriate in the institutional market.
5.1 Value of information provision - an illustration
Our hypothesis assumes tangible bene�ts from brokers�premium services, in particular, the timeli-
ness and precision of sell-side analysts�information. We provide an illustration of the value of such
service by investigating institutional trading around changes in analysts�recommendations.
We use a sample of 7,010 analysts�recommendation changes from First Call during the 1999-
2003 period for the NYSE stocks for which we also have Abel/Noser data. Panel A of Table 5
presents average event-day abnormal returns for the analysts�recommendation changes and �nds
them in line with prior research (Elton, Gruber, and Grossman, 1986; Womack, 1996). Upgrades
produce an average abnormal return of 1.93% (t-statistic = 17.8) and downgrades produce and
average abnormal return of -3.73% (t-statistic = -24.0). These recommendation changes seem
to be informative, and hence timely trading in these stocks on these days may provide pro�t
opportunities. With the daily closing price as a benchmark, we can determine the pro�tability of
orders on these high-information days. We test whether the recommending broker�s clients receive
superior information by comparing the pro�tability of client trades in the recommended stock on
the day of the release of the report against the pro�tability of trades by non-clients.
Panel B of Table 5 presents an analysis of institutional trades in the recommended stock on the
day analysts change their recommendations. We compare the execution costs of orders through
the broker that issues the analyst�s recommendation and trading through other brokers. This is
a powerful and direct test of the informational value of being a client of a full-service broker.
Institutions trading through the recommending broker are by de�nition clients of that broker.
Although not required to trade with the recommending broker, many clients apparently do, perhaps
to reward the analyst whose bonus is often tied to the commission revenue generated by their
recommendations.31
Institutions that trade through the recommending broker obtained prices that average 19.31
31 Irvine (2004) reports that brokerage-�rm trading volume in the recommended stock rises signi�cantly afterbuy recommendations. Similarly, Green (2006) notes that recommendation changes for NASDAQ stocks result inaggressive quoting behavior from the a¢ liated market makers, as if accommodating customer order �ow. Neither acost-minimization framework nor the existence of soft dollars explains this result as directly as our conjecture thatbrokers reward pro�table clients with premium services.
24
cents per share better than the closing price, while orders through non-recommending brokers
received price gains of 9.07 cents relative to the close. A 19-cent pro�t is large, but it is comparable
to the existing evidence of trading gains for clients receiving noti�cation of reports before they are
broadly disseminated.32
Examining commission costs, we �nd that orders through the recommending broker on the
day of the recommendation change paid higher average commissions - 5.05 cents per share - than
orders in the same stock on the same day executed through any other broker - 4.35 cents per
share. This di¤erence re�ects the fact that research providers are primarily full-service brokers who
usually charge commissions of 5 or 6 cents per share. In this case, the extra commission payment
is pro�table as institutions that trade through the recommending broker gain signi�cant price
improvement in return for the higher commission. Thus, clients of the recommendation-changing
broker made more pro�table trades, despite the fact that these trades were, on average, signi�cantly
more di¢ cult to execute, as measured by size of the order relative to that day�s trading volume.
The pro�tability results support our assertion that brokers�services are valuable. Since a large
portion of the gain from trading on analysts�recommendations is likely to dissipate quickly, access
to early and precise information from the brokers�research department is a valuable asset. This is
only one of several services that institutions compete for by sending their order �ow to particular
brokers.
6 Conclusion and Discussion
Brokers provide many valuable services that are di¢ cult to sell explicitly. Moreover, the quality of
these services is hard to evaluate over a short period, which calls for a long-term contract. Thus
brokers need a simple mechanism that facilitates charging for these services over signi�cant periods
of time. We conjecture that the total revenue a broker receives from a client during a period is
a prearranged �xed fee for the level of services the client desires for that period. The client pays
this fee through per-share commissions on orders sent to the broker. Thus, full-service commissions
represent an average per-share cost of broker services. This framework sheds new light on the
trading volume allocation among brokers, and the possible future of the institutional brokerage
32For example, Kim, Lin and Slovin (1997) �nd that traders who execute before Dow Jones widely disseminatesan initial recommendation earn 32.3 cents-per-share intraday pro�t. Green (2006) �nds that early traders on thedays First Call reports analysts�recommendation changes earn 45 cents-per-share pro�t when buying on upgradesand 52 cents-per-share pro�t by shorting on downgrades.
25

industry.
First, we show that brokerage commissions are not set trade by trade (as claimed in the past),
but rather determined in the context of a long-term contract. The distribution of institutional
commissions indicates that proxies for the execution costs of an order are relatively unimportant
determinants of per-share commission charges. Instead, past commissions are the strongest predic-
tor of future commissions. This result is inconsistent with the view of commissions as a continuous
execution cost negotiated on an order-by-order basis, yet supports our view that per-share com-
missions are a low-cost way for institutions and brokers to track the revenues a client sends to a
broker. Both parties need only concentrate on the volume of trade directed to a broker to calculate
the payment rendered and gauge the importance of a client. Volume allocations accompanied by
stable per-share commissions accumulate the �xed fee for the broker�s services. A client that sends
enough order �ow to a particular broker expects in return to receive a premier level of service from
the broker.
Viewing commissions as an average cost has important consequences for understanding the allo-
cation of institutional order �ow and the consequent payment of billions of dollars in commissions.
We document that smaller institutions use fewer brokers than large institutions, at least partly
due to the associated �xed costs, but also because it facilitates bunching of their order �ow with
particular brokers. Institutions concentrate (bunch) their order �ow with a small subset of brokers,
from whom they receive premier services. We �nd that small institutions tend to concentrate their
order �ow signi�cantly more than large institutions in order to become relatively important clients
to a small set of brokers. These results are stable throughout our �ve-year sample period.
Bunching order �ow is not an optimal strategy for hiding one�s identity from the market. There-
fore, if bunching partially reveals an institution�s identity, it imposes signi�cant price-impact costs
on institutions. These costs must be o¤set by bene�ts to a bunching strategy. Understanding the
costs and bene�ts of the commission contract is crucial for diagnosing the rapid changes in the full-
service commission market. A soaring demand for liquidity has led to the emergence of alternative
trading systems such as Liquidnet, UNX, and ITG, whose low-cost executions drive the signi�cant
decline in average commissions that we have documented. These alternative systems sometimes
entirely bypass traditional brokers and many institutions implement order-routing programs that
use brokers as one execution choice among many potential destinations for the order, diminishing
the role of traditional full-service brokers.
At the same time, the value of the traditional premium services appears to be declining. The
26
post-2000 IPO market o¤ers fewer opportunities for brokers to allocate historically pro�table IPOs
than that of the late 1990s. Regulation Fair Disclosure, which restricts selective disclosure of
management information, has reduced the precision of analyst information (Bailey, Li, Mao, and
Zhong, 2003). The 2003 adoption of the Global Settlement between the SEC and ten of the largest
full-service brokers speci�cally restricts analysts�involvement in investment banking departments.
This restriction, coupled with declining commissions, reduces the revenues supporting research
departments. Kadan, Madureira, Wong, and Zach (2006) document that in from September 2002
to December 2004 the ten brokers covered in the Global Settlement have among them discontinued
coverage of 914 �rms, or 12.2 percent of their covered �rms. Smith and Linebagh (2006) contend
that recent research cuts at Morgan Stanley are directly attributable to ECN competition for
execution. Institutions have responded to the lower value of brokerage research and IPO services,
as well as to the continuing pressure from their investors, by demanding lower commissions and
more capital to facilitate their transactions.
Facing increased capital costs and lower commission revenues, brokers face a signi�cant decline
in return on equity employed in the institutional trading business (Hintz and Tang, 2003). As these
changes continue, mid-size institutional brokers �nd it hard to maintain pro�tability in the current
environment. This loss of pro�tability was the stated reason behind Wells Fargo�s announcement in
August 2005 of its complete withdrawal from the institutional equity business. Recently, Prudential
Securities also announced their withdrawal from the institutional brokerage market.
At the same time, we show that even when faced with increasing competition and reduced
ability to o¤er non-priced valuable services, the basic two-price commission market structure is
still intact, which suggests that it provides economic bene�ts. Large brokers are able to maintain
pro�tability through investment banking and by dramatically increasing the allocation of capital
to proprietary trading. For a large broker, capturing order �ow through internal execution (even at
the ECN-level commissions) has the ancillary bene�t of providing information to the broker�s pro-
prietary trading desk. Large brokers are thus involved in a race to provide low-cost, high-liquidity
execution to their institutional clients, while at the same time extracting valuable information from
the order �ow they observe. Mid-sized brokers incur many of the costs of large brokers, but if they
cannot invest in cutting-edge execution technology and proprietary trading they may �nd the insti-
tutional equity business increasingly unpro�table and exit entirely. Consequently, the full-service
segment of the institutional brokerage industry may become increasingly specialized, competitive,
and concentrated in the near future.
27
References
[1] Aitken, Michael J., Gerald T. Garvey, and Peter Swan, 1995. How brokers facilitate trade forlong-term clients in competitive securities markets, Journal of Business, 68.1, 1-33.
[2] Bailey, Warren, Li Haitao, Connie Mao, and Rui Zhong, 2003. Regulation Fair Disclosureand Earnings Information: Market, analyst and corporate responses, Journal of Finance, 58,2487-2514.
[3] Berkowitz, Stephen and Dennis Logue, 1987. The portfolio turnover explosion explored, Jour-nal of Portfolio Management, 13, 38-46.
[4] Berkowitz, Stephen, Dennis Logue, and Eugene Noser, 1988. The total cost of transactions onthe NYSE, Journal of Finance, 43.1, 97- 112.
[5] Bertsimas, Dimitris and Andrew Lo, 1998. Optimal control of execution costs, Journal ofFinancial Markets, 1.1, 1-50.
[6] Blake, Rich and Justin Schack, 2002. The buy side wakes up, Institutional Investor, April,58-68.
[7] Blume, Marshall E., 1993. Soft dollars and the brokerage industry, Financial Analysts Journal,49, 36-44.
[8] Boehmer, Ekkehart, Robert Jennings and Li Wei, 2007. Public disclosure and private decisions:Equity market execution quality and order routing, Review of Financial Studies, 20, 315-358.
[9] Brennan, Michael and Tarun Chordia, 1993. Brokerage commission schedules, Journal of Fi-nance, 48.4, 1379-1402.
[10] Brennan, Michael and Patricia Hughes, 1991. Stock prices and the supply of information,Journal of Finance, 46:5, 1665-1691.
[11] Chan Louis K.C., and Josef Lakonishok, 1993. Institutional trades and intraday stock pricebehavior, Journal of Financial Economics, 33.2, 173-199.
[12] Chan, Louis K.C. and Josef Lakonishok, 1995. The behavior of stock prices around institutionalorders. Journal of Finance, 50.4, 713-735.
[13] Conrad, Jennifer, Kevin M. Johnson, and Sunil Wahal 2001. Institutional trading and softdollars, Journal of Finance, 46.1, 397- 416.
[14] Constantinides, George, 1986. Capital market equilibrium with transaction costs, Journal ofPolitical Economy, 94.4 842-862.
[15] Corwin, Shane and Paul Schultz, 2005. The role of underwriting syndicates: Pricing, informa-tion production and underwriter competition, Journal of Finance, 60:1, 443-486.
[16] Copeland, Thomas, 1979. Liquidity changes following stock splits, Journal of Finance, 34:1,115-141.
[17] Dermody Jaime C. and Eliezer Z. Prisman, 1993. No arbitrage and valuation in markets withrealistic transaction costs, Journal of Financial and Quantitative Analysis, 28:1, 65-80.
28

[18] Easley, David and Maureen O�Hara, 1987. Price, trade size and information in securities mar-kets, Journal of Financial Economics, 19.1, 69-90.
[19] Edmister, Robert, 1978. Commission cost structure: Shifts and scale economics, Journal ofFinance, 33:2, 477- 486.
[20] Edmister, Robert and N. Subramanian, 1982. Determinants of brokerage rates for institutionalinvestors: A note, Journal of Finance, 37:4, 1087-1093.
[21] Elton, Edwin, Martin Gruber, and S. Grossman, 1986. Discrete expectational data and port-folio performance, Journal of Finance, 46, 699-714.
[22] Foucault, Thierry and Gabriel Desgranges, 2002. Reputation-based pricing and price improve-ments in dealership markets, Working paper, HEC and CEPR.
[23] Fulghieri, Paulo and Matthew Spiegel, 1993. A theory of the distribution of underpriced initialpublic o¤ers by investment banks, Journal of Economics and Management Strategy, 2:4, 509-530.
[24] Glosten, Larry and Paul Milgrom, 1985. Bid, ask and transactions prices in a specialist marketwith heterogeneously informed orders, Journal of Financial Economics, 14, 71-100.
[25] Green, Clifton, 2006. The value of client access to analysts� recommendations, Journal ofFinancial and Quantitative Analysis, 41:1, 1-24.
[26] Greene, William H., 1997. Econometric analysis, 3rd edition, Prentice Hall, Upper SaddleRiver, New Jersey.
[27] Greenwich Associates, 2002. A closer focus on trading costs. Report to Institutional Investors.
[28] Hechinger, John, 2004. Deciphering funds�hidden costs, Wall Street Journal, March 17, D1.
[29] Hintz, Brad and Kelly Lee Tang, 2003. U.S. brokerage: Institutional equities at a crossroads,Sanford Bernstein.
[30] Horan Stephen and Bruce Johnsen, 2004. Does soft dollar brokerage bene�t portfolio investors:Agency problem or solution? Law and Economics Working Paper 04-50, George Mason Uni-versity.
[31] Irvine, Paul, 2004. Analysts� forecasts and brokerage-�rm trading, The Accounting Review,79.1, 125-149.
[32] Jarrell, Greg A., 1984. Change at the exchange: The causes and e¤ects of deregulation, Journalof Law and Economics, 27, 273-312.
[33] Jenkinson, Tim and Alexander Ljungqvist, 2000. Going Public: The Theory and Evidence onHow Companies Raise Equity Finance, Clarendon Press, Oxford, U.K.
[34] Johnsen, Bruce, 1994. Property rights to investment research: The agency costs of soft dollarbrokerage, Yale Journal of Regulation, 11, 75-113.
[35] Kadan, Ohad, Leonardo Madureira, Rong Wang and Tzachi Zach, 2006. Con�icts of interestand stock recommendations - The e¤ects of the Global Settlement and related regulations,working paper, Washington University in St. Louis.
29

[36] Kavajecz, Kenneth A. and Donald B. Keim, 2005. Packaging liquidity: Blind auctions andtransaction cost e¢ ciencies, Journal of Financial and Quantitative Analysis, 40, 465-492.
[37] Keim, Donald and Ananth Madhavan, 1997. Execution costs and investment style: An inter-exchange analysis of institutional equity orders, Journal of Financial Economics, 46.3, 265-292.
[38] Kelly, Kate and John Hechinger, 2004. How Fidelity�s trading chief pinches pennies on WallStreet, Wall Street Journal, October 12, D1.
[39] Kim, Sok Tae, Ji-Chai Lin, and Myron Slovin, 1997. Market structure, informed trading andanalysts�recommendations, Journal of Financial and Quantitative Analysis, 32.4, 507-524.
[40] Klein, Benjamin and Keith Le er, 1981. The role of market forces in assuring contractualperformance, Journal of Political Economy, 89, 615-641.
[41] Kyle, Albert, 1985. Continuous auctions and insider trading, Econometrica, 53, 1335-1355.
[42] Livingston, Miles and Edward S. O�Neal, 1996. Mutual fund brokerage commissions, Journalof Financial Research, 39:2, 273-292.
[43] Logue, Dennis, 1991. Managing Corporate Pension Plans, Harper Publishing, New York, N.Y.
[44] Loeb, Thomas, 1983. Trading cost: The critical link between investment information and re-sults, Financial Analysts Journal, 39, 39- 44.
[45] Ljungqvist, Alexander, Felicia Marston and William J. Wilhelm, 2006. Competing for securi-ties underwriting mandates: Banking relationships and analyst recommendations, Journal ofFinance, 61:1, 301-340.
[46] Nimalendran, M., Jay Ritter, and Donghang Zhang, 2007. Do today�s trades a¤ect tomorrow�sIPO allocation? Journal of Financial Economics, 84:1, 97-109.
[47] Ofer, Aharon and Arie Melnick, 1978. Price deregulation in the securities industry: An empir-ical analysis, The Bell Journal of Economics, 9:2, 633-641.
[48] Pethokoukis, James, 1997. The thorn in Fidelity�s side, U.S. News and World Report, Septem-ber 8.
[49] Reuter, Jonathan, 2006. Are IPO allocations for sale? Evidence from mutual funds, Journalof Finance, forthcoming.
[50] Roll, Richard, 1984. A simple e¤ective measure of the bid-ask spread in an e¢ cient market,Journal of Finance, 39:4, 1127-1139.
[51] Schwartz, Robert and Benn Steil, 2002. Controlling institutional trading costs, Journal ofPortfolio Management, 28.4, 39-49.
[52] Securities and Exchange Commission, 1998. Inspection report on the softdollar practices of broker-dealers, investment advisors and mutual funds,http://www.sec.gov/news/studies/softdolr.htm.
[53] Smith, Randall and Kate Linebagh, 2006. Morgan Stanley plans reduction in research jobs,Wall Street Journal, March 22, C1.
30
[54] So�anos, George, 2001. The changing Nasdaq market and institutional transactions fees. Gold-man Sachs derivatives and trading research, May 31.
[55] Timmons, Heather, 2000. I kept on the buy rating, but I told my favorite investors to sell,Business Week, March 27.
[56] Tinic, Seha and Richard West, 1980. The securities industry under negotiated commissions:Changes in the structure and performance of NYSE member �rms, Bell Journal of Economics,11:1, 29-41.
[57] Vayanos, Dimitri, 1998. Transaction costs and asset prices: A dynamic equilibrium model,Review of Financial Studies, 11.1, 1-58.
[58] Womack, Kent, 1996. Do brokerage analysts�recommendations have investment value? Journalof Finance, 51, 1137-1167.
31
Appendix A: Cost Minimization Model
The main conjecture in this paper maintains that institutions allocate their order �ow to max-
imize the provision of premium services from a broker or a set of brokers. A tenable alternative
to our framework is to assume that institutions allocate trade to brokers only to minimize the
total costs of execution. We examine the implications of this alternative and then proceed to em-
pirically test whether institutional trading patterns re�ect the cost-minimization criteria or our
trade-o¤ equilibrium. The model is kept intentionally simple to focus on the most straightforward
implications.
Let us assume that an institution has to trade Q shares over a period. It can allocate this
amount among various brokers: j = 1; :::; J; such thatPqj = Q. We assume that it faces three
types of costs:
1. Cost of setting up and maintaining an active account with a broker: d per broker.
2. Cost of frontrunning, which we assume to be convex in the amount of order �ow sent to a
broker. For simplicity we assume that this cost is: 0:5 cfrq2j :
3. Cost of trading-strategy recognition. This cost is inversely related to broker�s size (larger
broker, lower cost), as well as to client�s size. Smaller clients can easily hide their trades, thus we
assume that for them this cost is zero; for large clients it is: 0:5csr;jq2j :
There are J potential brokers with the costs:
cj =
8<: cfr + csr;j for large institutions
cfr for small institutions:
We rank the brokers by their total costs (cj) from the lowest to the highest, when c1 is the
lowest cost (implicitly the largest broker). Then the overall cost function for small clients is
Mink;qj dk + 0:5kXj=1
cfrq2j s:t: k � J ;
kXj=1
qj �Q = 0; (A1)
and for large clients
Mink;qj dk + 0:5
kXj=1
cjq2j s:t: k � J ;
kXj=1
qj �Q = 0: (A2)
If we �x the number of brokers used by a client, k, and optimize with respect to quantities,
32

then small institutions choose to allocate their volume equally among all their active brokers:
q�j;SmallQ
=1
k: (A3)
Large institutions, on the other hand, will start from the least costly:
q�j;LargeQ
=1
cjPki=1
1ci
: (A4)
The optimal number of brokers that a small institution should use is
k�Small(k�Small + 1) >
0:5cfrQ2
d> (k�Small � 1)k�Small: (A5)
For the large clients, the optimal number of brokers minimizes the following expression (we assume
that no single institution uses all the available brokers, which is the case in our sample):
ck�Large+1
24k�LargeXi=1
1
ci
352 + k�LargeXi=1
1
ci>0:5Q2
d> ck�Large
24k�Large�1Xi=1
1
ci
352 + k�Large�1Xi=1
1
ci: (A6)
Predictions of the cost-minimization model are as follows (the derivations of these predictions
are straightforward):
1. Small institutions are indi¤erent between the large and the small brokers, while large in-
stitutions strictly prefer larger brokers. Small institutions allocate their trades evenly among all
the brokers they use. Large institutions, on the other hand, exhibit a strong bias towards larger
brokers, with declining shares allocated to smaller ones.
2. Institutions that trade more (higher Q) use more brokers. This is true within the de�nition
of large and small institutions subgroups, and even more so in the transition from the small to the
large group.
3. Higher d reduces the optimal number of brokers.
4. Equally sized institutions use the same number of brokers, and allocate their volume similarly.
5. Two institution, using the same broker should allocate the same proportion of their volume
to this broker.
6. The same institution should allocate a similar proportion of volume to all its brokers of
similar size.
33

34
Figure 1: Historical commissions per share. Institutional investor average cents-per-share commission, 1977-2004. Data is from Greenwich Associates and represents the unweighted average commission that is calculated from proprietary survey data.
0
4
8
12
16
1977 1978 1979 1980 1981 1982 1983 1984 1985 1986 1987 1988 1989 1990 1991 1992 1993 1994 1995 1996 1997 1998 1999 2000 2001 2002 2003 2004
Cen
ts p
er s
hare
Figure 2: Institutional percentage commission costs on the NYSE. The distribution of commissions in Abel/Noser’s NYSE-listed institutional trading data 1999-2003, as a percentage of stock price. Commissions per share are divided by the reported execution price to calculate percentage commission transactions cost. Zero cents per share commissions are not analyzed and the distribution is truncated at 33 basis points.
Commission/Price
0
20000
40000
60000
80000
100000
120000
140000
160000
0 2 4 6 8 10 12 14 16 18 20 22 24 26 28 30 32Basis points
Num
ber o
f obs
erva
tions

35
Figure 3: Per share institutional commissions for the NYSE-listed stocks in 1999 and 2003. All commissions per share are rounded to the nearest one-tenth of one cent. Zero cents per share commissions are not analyzed in this distribution, and the distribution is truncated above ten cents per share, where only a few observations reside. The resulting distribution of commissions is presented below. Few of the possible pricing nodes are actively used, institutions rely on whole number pricing, primarily at 2 and 5 cents per share.
0 0.01 0.02 0.03 0.04 0.05 0.06 0.07 0.080.09
0.1
1999
2003
0
5
10
15
20
25
30
35
40
45
50
Perc
ent o
f tot
al
Cents per share
Institutional commissions per share
19992003
Figure 4: Per share institutional commissions for the NYSE-listed stocks in 1999-2003 by trade size. All commissions per share are rounded to the nearest one-tenth of one cent. Zero cents per share commissions are not included, and the distribution is truncated above ten cents per share, losing only a few observations. Overall frequency of trades at each commission price is presented for five trade-size categories.
<1.0 1.0 2.0 3.0 4.0 5.0 6.0 7.0 8.0 9.0 10.0
5001,000
5,00010,000
>10,0000
2
4
6
8
10
12
14
16
Commissions per share
Percent of total trading
5001,0005,00010,000>10,000
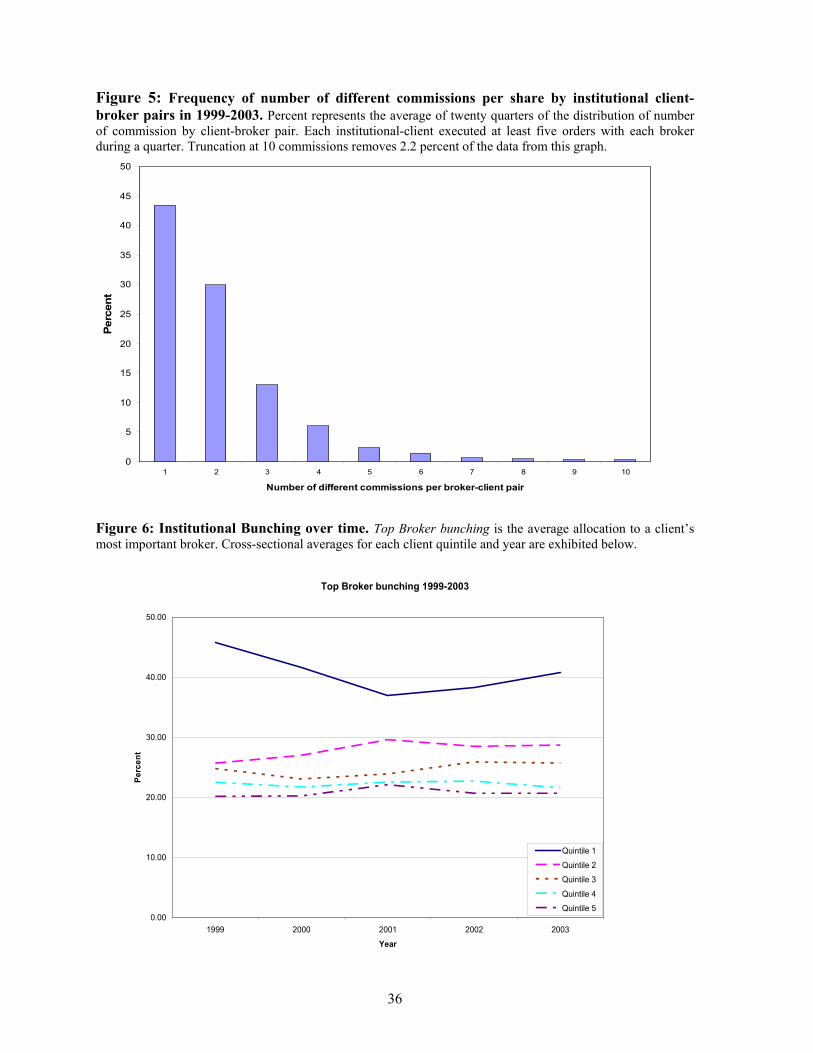
36
Figure 5: Frequency of number of different commissions per share by institutional client-broker pairs in 1999-2003. Percent represents the average of twenty quarters of the distribution of number of commission by client-broker pair. Each institutional-client executed at least five orders with each broker during a quarter. Truncation at 10 commissions removes 2.2 percent of the data from this graph.
0
5
10
15
20
25
30
35
40
45
50
1 2 3 4 5 6 7 8 9 10
Number of different commissions per broker-client pair
Perc
ent
Figure 6: Institutional Bunching over time. Top Broker bunching is the average allocation to a client’s most important broker. Cross-sectional averages for each client quintile and year are exhibited below.
Top Broker bunching 1999-2003
0.00
10.00
20.00
30.00
40.00
50.00
1999 2000 2001 2002 2003
Year
Perc
ent
Quintile 1
Quintile 2
Quintile 3
Quintile 4
Quintile 5

37
Figure 7: Mutual Funds' turnover by year and size. This figure uses Thompson's mutual fund quarterly holding data from 1997-2002. We remove all observations where the fund was smaller than $10M at the beginning of the quarter, or grew by more than 50% during the quarter. For each fund we calculate the change in the number of shares of every security held by the fund over the course of the quarter, and treat it as the fund's trading volume. We then multiply trading volume by the average quarterly price and aggregate over all securities, yielding the estimate of total dollar trading volume. We then divide by the NAV at the beginning of the quarter to obtain an estimate of the turnover. Each fund is then assigned a NAV quintile and the average turnover statistics for each quintile are presented in the figure (Quintile 1 are the smallest institutions).
0
0.1
0.2
0.3
0.4
0.5
0.6
1997 1998 1999 2000 2001 2002
year
mea
n tu
rnov
er
quintile 1
quintile 2
quintile 3
quintile 4
quintile 5
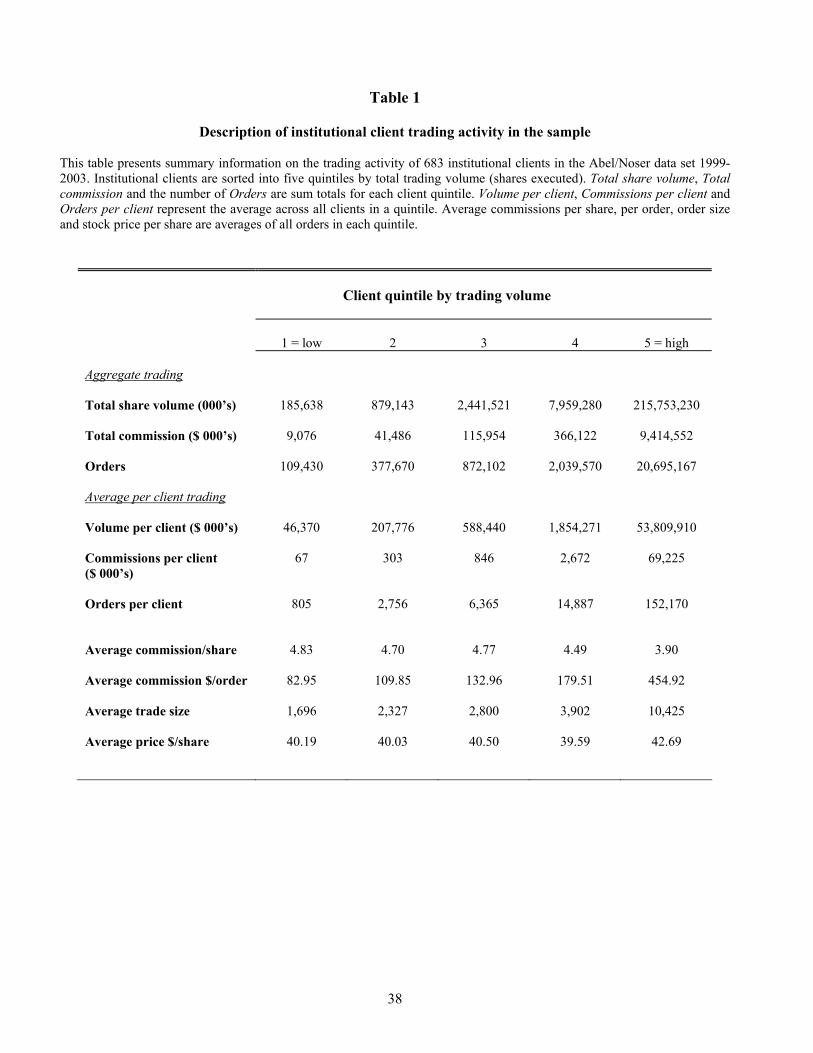
38
Table 1
Description of institutional client trading activity in the sample
This table presents summary information on the trading activity of 683 institutional clients in the Abel/Noser data set 1999-2003. Institutional clients are sorted into five quintiles by total trading volume (shares executed). Total share volume, Total commission and the number of Orders are sum totals for each client quintile. Volume per client, Commissions per client and Orders per client represent the average across all clients in a quintile. Average commissions per share, per order, order size and stock price per share are averages of all orders in each quintile.
Client quintile by trading volume
1 = low
2
3
4
5 = high
Aggregate trading
Total share volume (000’s)
185,638 879,143 2,441,521 7,959,280 215,753,230
Total commission ($ 000’s)
9,076 41,486 115,954 366,122 9,414,552
Orders
109,430 377,670 872,102 2,039,570 20,695,167
Average per client trading
Volume per client ($ 000’s)
46,370 207,776 588,440 1,854,271 53,809,910
Commissions per client ($ 000’s)
67 303 846 2,672 69,225
Orders per client
805 2,756 6,365 14,887 152,170
Average commission/share
4.83
4.70 4.77 4.49 3.90
Average commission $/order
82.95 109.85 132.96 179.51 454.92
Average trade size
1,696 2,327 2,800 3,902 10,425
Average price $/share
40.19 40.03 40.50 39.59 42.69
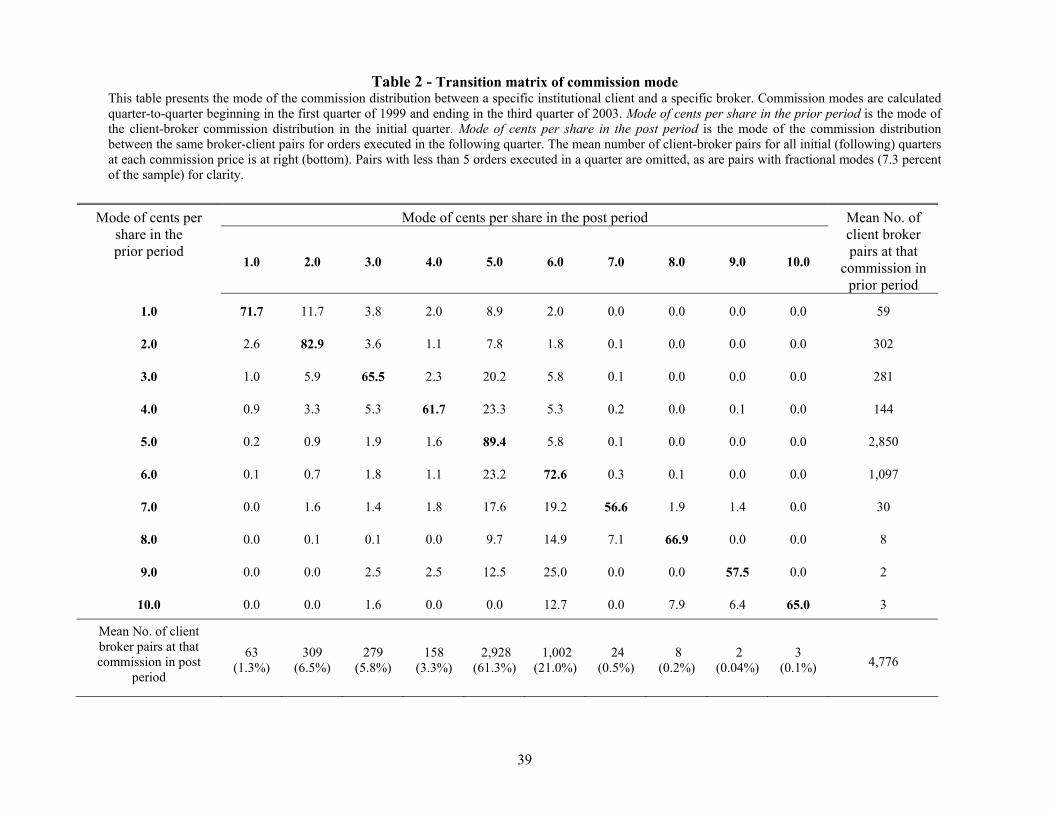
39
Table 2 - Transition matrix of commission mode This table presents the mode of the commission distribution between a specific institutional client and a specific broker. Commission modes are calculated quarter-to-quarter beginning in the first quarter of 1999 and ending in the third quarter of 2003. Mode of cents per share in the prior period is the mode of the client-broker commission distribution in the initial quarter. Mode of cents per share in the post period is the mode of the commission distribution between the same broker-client pairs for orders executed in the following quarter. The mean number of client-broker pairs for all initial (following) quarters at each commission price is at right (bottom). Pairs with less than 5 orders executed in a quarter are omitted, as are pairs with fractional modes (7.3 percent of the sample) for clarity.
Mode of cents per share in the post period Mode of cents per share in the prior period
1.0 2.0 3.0 4.0 5.0 6.0 7.0 8.0 9.0 10.0
Mean No. of client broker pairs at that
commission in prior period
1.0 71.7 11.7 3.8 2.0 8.9 2.0 0.0 0.0 0.0 0.0 59
2.0 2.6 82.9 3.6 1.1 7.8 1.8 0.1 0.0 0.0 0.0 302
3.0 1.0 5.9 65.5 2.3 20.2 5.8 0.1 0.0 0.0 0.0 281
4.0 0.9 3.3 5.3 61.7 23.3 5.3 0.2 0.0 0.1 0.0 144
5.0 0.2 0.9 1.9 1.6 89.4 5.8 0.1 0.0 0.0 0.0 2,850
6.0 0.1 0.7 1.8 1.1 23.2 72.6 0.3 0.1 0.0 0.0 1,097
7.0 0.0 1.6 1.4 1.8 17.6 19.2 56.6 1.9 1.4 0.0 30
8.0 0.0 0.1 0.1 0.0 9.7 14.9 7.1 66.9 0.0 0.0 8
9.0 0.0 0.0 2.5 2.5 12.5 25.0 0.0 0.0 57.5 0.0 2
10.0 0.0 0.0 1.6 0.0 0.0 12.7 0.0 7.9 6.4 65.0 3
Mean No. of client broker pairs at that commission in post
period
63 (1.3%)
309 (6.5%)
279 (5.8%)
158 (3.3%)
2,928 (61.3%)
1,002 (21.0%)
24 (0.5%)
8 (0.2%)
2 (0.04%)
3 (0.1%)
4,776

40
Table 3
Determinants of institutional commissions This table presents the results of regressions using commissions per share in each quarter from the second quarter of 1999 to the last quarter of 2003 as the dependent variable. Commissions per share are truncated at ten cents a share and rounded to the nearest 1/10 of a cent. Zero cent commissions are not analyzed. Shares is the order size, Price is the order price. MKT% is the size of the order divided by the daily volume in the traded stock. Prior Mode is the mode of each client-broker pair commission per share cost in the preceding quarter. Cvol is the institution’s quintile rank among all institutions in the sample, Bvol measures the brokers’ quintile rank among all brokers in the sample. Low cost commissions are those orders with executed commissions per share less than or equal to 3 cents per share (Low cost). High cost commissions are those orders executed with executed commissions per share between 4 and 10 cents per share (High cost). All combines both low-cost and high-cost commissions. Log likelihood presents the goodness of fit statistic from an ordered Logit regression specification of each regression with coefficient p-values reported in parentheses below the coefficient estimates.
Sample N= Intercept Price Shares
MKT
% Prior Mode
Cvol Bvol OLS Adjusted R2 (%)
Log Likelihood from a Logit regression
All 16,495,326 3.32 0.0000 0.089 -0.104 0.98 -1,330,695 (0.001) (0.001) (0.001) (0.001) All 16,495,326 0.406 0.0000 0.037 -0.026 0.83 65.80 -930,933 (0.001) (0.001) (0.001) (0.001) (0.001) Low cost 6,120,536 1.96 -0.0000 0.0015 0.047 0.01 -400,575 (0.001) (0.001) (0.001) (0.001) Low cost 6,120,536 1.31 -0.0000 0.0004 0.038 0.28 26.03 -370,531 (0.001) (0.003) (0.001) (0.001) (0.001) Low cost 6,120,536 2.04 -0.0000 -0.0006 0.037 0.28 -0.0083 -0.173 26.62 -367,941 (0.001) (0.002) (0.001) (0.001) (0.001) (0.001) (0.001) High cost 10,374,790 5.20 0.0000 -0.005 -0.007 0.03 -487,434
(0.001) (0.262) (0.001) (0.001) High cost 10,374,790 3.86 0.0000 0.0005 -0.003 0.26 12.84 -436,740 (0.001) (0.045) (0.011) (0.001) (0.001) High cost 10,374,790 4.05 0.0000 0.0022 -0.027 0.26 -0.049 -0.002 13.03 -432,881 (0.001) (0.008) (0.001) (0.001) (0.001) (0.001) (0.001)
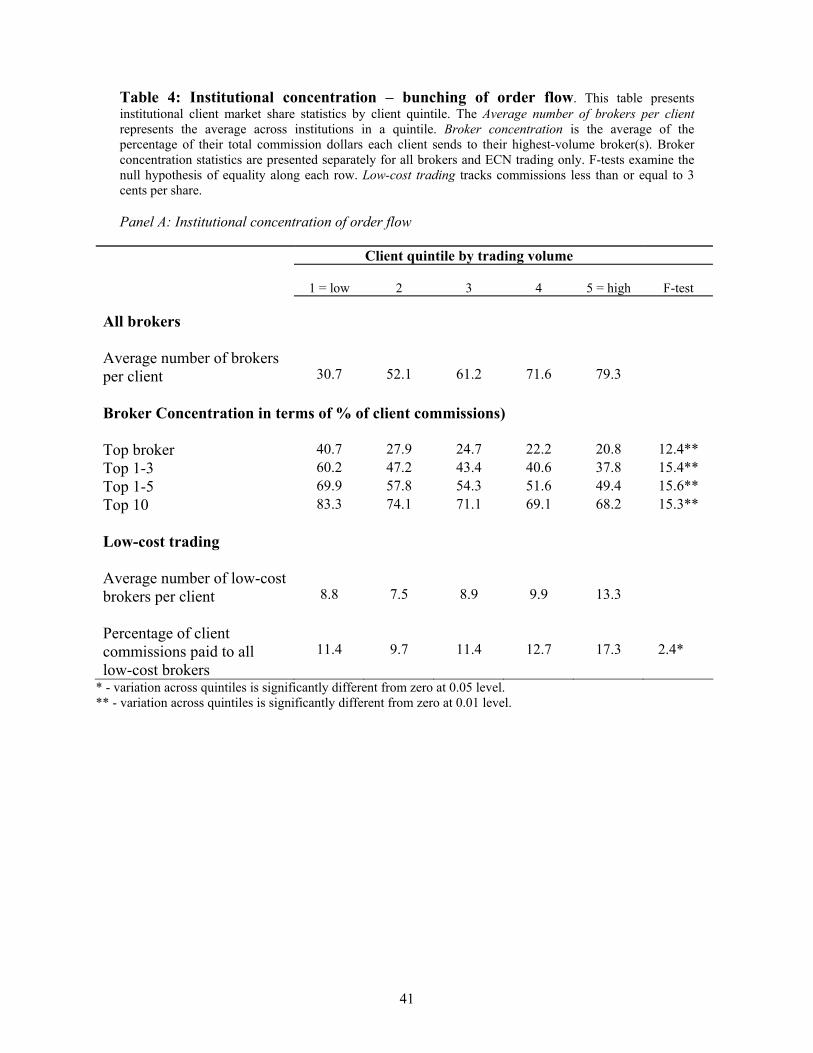
41
Table 4: Institutional concentration – bunching of order flow. This table presents institutional client market share statistics by client quintile. The Average number of brokers per client represents the average across institutions in a quintile. Broker concentration is the average of the percentage of their total commission dollars each client sends to their highest-volume broker(s). Broker concentration statistics are presented separately for all brokers and ECN trading only. F-tests examine the null hypothesis of equality along each row. Low-cost trading tracks commissions less than or equal to 3 cents per share. Panel A: Institutional concentration of order flow
Client quintile by trading volume
1 = low
2
3
4
5 = high
F-test All brokers Average number of brokers per client
30.7
52.1
61.2
71.6
79.3
Broker Concentration in terms of % of client commissions)
Top broker 40.7 27.9 24.7 22.2 20.8 12.4** Top 1-3 60.2 47.2 43.4 40.6 37.8 15.4** Top 1-5 69.9 57.8 54.3 51.6 49.4 15.6** Top 10 83.3 74.1 71.1 69.1 68.2 15.3** Low-cost trading Average number of low-cost brokers per client
8.8
7.5
8.9
9.9
13.3
Percentage of client commissions paid to all low-cost brokers
11.4
9.7
11.4
12.7
17.3
2.4*
* - variation across quintiles is significantly different from zero at 0.05 level. ** - variation across quintiles is significantly different from zero at 0.01 level.

42
Panel B: Institutional concentration of order flow – Robustness test. Herfindahl Index represents the (normalized) sum of the squared market shares of a client’s ten largest brokers. Zeta estimation presents the average intercept, coefficient and r-squared values in each quintile for client-by-client estimation of: log (broker market share) = α + θ log (broker rank) + ε. Larger θ indicates more concentration. Percent significantly greater or less than 1 is the percentage of each quintiles θ coefficients that are significantly greater or less than one at the 5 % level. Standard errors are in parentheses below the coefficient estimates.
Client quintile by trading volume 1 = low 2 3 4 5 = high F-test Herfindahl Index 23.6 21.0 19.7 17.9 17.8 4.46** Zeta Regression Intercept - α -1.12 -1.21 -1.25 -1.32 -1.46 (0.050) (0.031) (0.029) (0.023) (0.025) Coefficient - θ 1.09 0.96 0.90 0.82 0.76 (0.062) (0.039) (0.033) (0.027) (0.037) R2 91.7 91.8 91.8 91.5 90.9 % of institutions with θ > 1 41.9 32.0 25.7 21.3 14.0 % of institutions with θ < 1 46.8 48.4 64.7 70.6 75.0
* - variation across quintiles is significantly different from zero at 0.05 level. ** - variation across quintiles is significantly different from zero at 0.01 level.
Panel C: Institutional average commissions by institutions. Commission cost is the average per-share commissions on orders sent by clients to their highest volume broker(s).
Client quintile by trading volume
1 = low
2
3
4
5 = high
F-test Commission Cost ( (cents per share) All brokers Top broker 5.01 4.94 4.76 4.53 4.46 2.95* Top 1-3 5.04 5.02 4.88 4.67 4.45 10.81** Top 1-5 5.07 5.04 4.93 4.72 4.48 19.45** Top 1-10 5.11 5.08 5.01 4.80 4.55 40.09** All brokers 5.04 5.07 5.01 4.90 4.80 71.63**
* - variation across quintiles is significantly different from zero at 0.05 level. ** - variation across quintiles is significantly different from zero at 0.01 level.
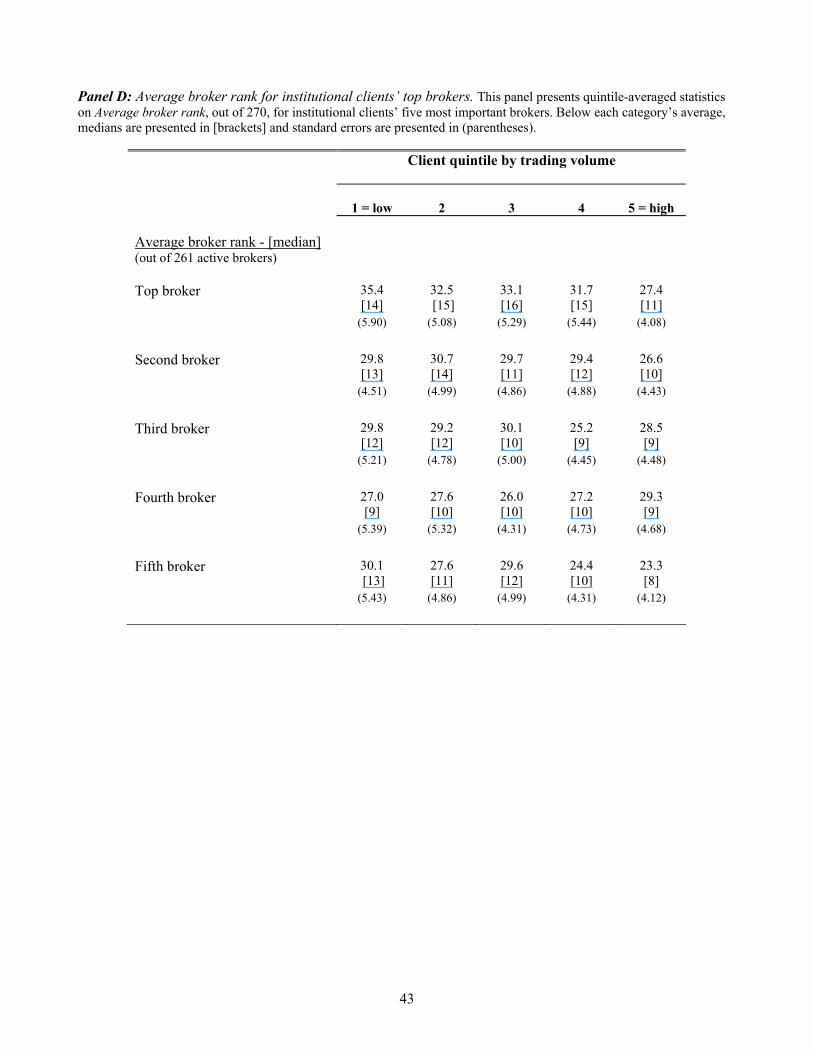
43
Panel D: Average broker rank for institutional clients’ top brokers. This panel presents quintile-averaged statistics on Average broker rank, out of 270, for institutional clients’ five most important brokers. Below each category’s average, medians are presented in [brackets] and standard errors are presented in (parentheses).
Client quintile by trading volume
1 = low
2
3
4
5 = high
Average broker rank - [median] (out of 261 active brokers)
Top broker 35.4
[14] 32.5 [15]
33.1 [16]
31.7 [15]
27.4 [11]
(5.90) (5.08) (5.29) (5.44) (4.08) Second broker 29.8
[13] 30.7 [14]
29.7 [11]
29.4 [12]
26.6 [10]
(4.51) (4.99) (4.86) (4.88) (4.43) Third broker 29.8
[12] 29.2 [12]
30.1 [10]
25.2 [9]
28.5 [9]
(5.21) (4.78) (5.00) (4.45) (4.48) Fourth broker 27.0
[9] 27.6 [10]
26.0 [10]
27.2 [10]
29.3 [9]
(5.39) (5.32) (4.31) (4.73) (4.68) Fifth broker 30.1
[13] 27.6 [11]
29.6 [12]
24.4 [10]
23.3 [8]
(5.43) (4.86) (4.99) (4.31) (4.12)

44
Table 5: Analysts' recommendation changes and the subsequent trading. Panel A. Abnormal returns for 7,010 NYSE-listed analyst recommendation changes in stocks that appeared in both First Call and Abel/Noser between 1999 and 2003. The abnormal returns are market-adjusted returns: the difference between the raw stock return on the day the analyst recommendation is reported and the value-weighted market return on that day.
N Mean T-statistic
All upgrades 3,125 1.93% 17.81 upgrades to strong buy 1,805 1.95% 13.96 upgrades to buy 1,180 1.95% 10.49 upgrades to hold 140 1.67% 10.80 All downgrades 3,885 -3.73% -24.04 downgrades to buy 1,321 -2.83% -13.87 downgrades to hold 2,313 -4.06% -19.02 downgrades to sell 251 -4.54% -6.14
Panel B. The sample of brokerage recommendation changes consists of 7.010 NYSE-listed analysts’ recommendation changes in stocks that appeared in both First Call and Abel/Noser between 1999 and 2003. Market percent is order size as a percent of that day’s trading volume. Standard errors are reported in parentheses. T-statistics for the difference in means test are presented in parentheses below the mean difference in the Difference column. Significant differences (5%) are in boldface.
Trade through Trade through the Other Brokers Changing Broker Difference
Number of orders 219,320 3,965
Improvement over VWAP – cents 2.34 (0.0013)
6.76 (0.0082)
4.42 (5.27)
Improvement over Close – cents 9.07 (0.0020)
19.31 (0.015)
10.23 (6.62)
Commissions per share – cents 4.35 (0.00003)
5.05 (0.0002)
0.70 (37.79)
Commissions paid per order ($) 745.8 (8.61)
965.6 (70.80)
219.8 (3.08)
Share volume 15,967 (173.19)
18,709 (1,324.74)
2,742 (2.05)
Market % 0.49 (0.0002)
0.70 (0.0005)
0.21 (3.87)