Brillouin scattering, DSC, dielectric and X-ray diffraction studies of phase transitions in...
7
Brillouin scattering, DSC, dielectric and X-ray diffraction studies of phase transitions in antiferroelectric PbHfO 3 :Sn Mirosław Ma ˛ czka a,⇑ , Tae Hyun Kim b , Anna Ga ˛gor a , Irena Jankowska-Sumara c , Andrzej Majchrowski d , Seiji Kojima b a Institute of Low Temperature and Structure Research, Polish Academy of Sciences, P.O. Box 1410, 50-950 Wrocław 2, Poland b Institute of Materials Science, University of Tsukuba, Tsukuba, Ibaraki 305-8573, Japan c Institute of Physics, Pedagogical University, ul. Podchora ˛ _ zych 2, 30-084 Kraków, Poland d Institute of Applied Physics, Military University of Technology, 2 Kaliskiego Str., 00-908 Warszawa, Poland article info Article history: Received 18 September 2014 Received in revised form 31 October 2014 Accepted 3 November 2014 Available online 10 November 2014 Keywords: Ferroelectrics Phonons Acoustic properties Inelastic light scattering Elastic light scattering abstract Specific heat, dielectric, powder X-ray diffraction and Brillouin scattering studies of phase transitions in antiferroelectric PbHf 0.975 Sn 0.025 O 3 crystal were performed. The specific heat data revealed clear anomalies at T 1 = 473.5 and T 2 = 426.3 K on cooling, which could be attributed to onset of first order phase transitions from the paraelectric (PE) phase to an intermediate antiferroelectric phase (AFE2) and the AFE2 phase to another antiferroelectric phase (AFE1), respectively. The estimated entropy changes at T 1 and T 2 pointed to mainly an order–disorder and displacive character of these transitions, respectively. X-ray diffraction data showed a complex superstructure of the intermediate phase with a = 11.895(6) Å, b = 11.936(4) Å, c = 8.223(3) Å at 453 K. Brillouin studies revealed pronounced softening of longitudinal acoustic (LA) mode in the PE phase associated with its broadening. The broadening and softening exhibited maximum values at T 1 . Additional acoustic anomalies, that is, abrupt frequency shifts for LA and transverse acoustic (TA) modes were also observed at T 2 . Brillouin scattering data also showed presence of a broad central peak (CP) that exhibited highest intensity at T 1 . The observed temperature dependences of acoustic modes and CP indicate order–disorder character of the FE to AFE2 phase transi- tion and importance of polar precursor clusters in the PE phase. The obtained data also suggest that the intermediate antiferroelectric phases in Sn 4+ doped PbHfO 3 and PbZrO 3 may have very similar structures with incommensurate modulations. Ó 2014 Elsevier B.V. All rights reserved. 1. Introduction Perovskite oxides have been the subject of great interest due to their ferroelectric (FE), antiferroelectric (AFE) and relaxor proper- ties [1–3]. In recent years, antiferroelectric perovskites received increasing attention due to their prospective applications as high-energy storage capacitors, transducers, high-density optical data storage materials and electrocaloric refrigerators [4,5]. These applications are possible since the energy difference between AFE and FE states is usually small, and the antiferroelectric state can be reverted into the ferroelectric one under application of an external electric field [4]. AFE to FE transition may also be induced by change of the chemical composition or crystallite size [4]. The first known AFE material is PbZrO 3 , which shows a first- order structural phase transition at 508 K from high-temperature paraelectric (PE) phase (space group Pm 3m) to low-temperature AFE1 phase (Pbam symmetry) [6]. The AFE properties are related to antiparallel displacements of lead cations [7]. The low-tempera- ture phase of PbHfO 3 is isostructural with the AFE1 Pbam phase of PbZrO 3 [6,7]. However, PbHfO 3 shows presence of an intermediate phase that is stable between 433 and 476 K [7–10]. Structural details of this intermediate phase have not been revealed yet but it was reported that this phase is a superstructure of the perovskite cell. For instance, Fujishita et al. suggested that the cell is 5 5 6 times larger than a perovskite cell [9]. Regarding symme- try of this intermediate phase, contradictory data were reported suggesting tetragonal, pseudotetragonal, orthorhombic or rhombo- hedral structures [11–14]. It is also worth adding that this phase was assumed to exhibit AFE order [10]. Recent X-ray powder dif- fraction data are in contradiction with previous results, that is, they suggest presence of two intermediate polar phases with space groups C2mm and P4mm [7]. Since chemical doping is one of the major ways to modify elec- tric properties of perovskites, numerous attempts were undertaken http://dx.doi.org/10.1016/j.jallcom.2014.11.020 0925-8388/Ó 2014 Elsevier B.V. All rights reserved. ⇑ Corresponding author. E-mail address: [email protected] (M. Ma ˛ czka). Journal of Alloys and Compounds 622 (2015) 935–941 Contents lists available at ScienceDirect Journal of Alloys and Compounds journal homepage: www.elsevier.com/locate/jalcom
Transcript of Brillouin scattering, DSC, dielectric and X-ray diffraction studies of phase transitions in...
Journal of Alloys and Compounds 622 (2015) 935–941
Contents lists available at ScienceDirect
Journal of Alloys and Compounds
journal homepage: www.elsevier .com/locate / ja lcom
Brillouin scattering, DSC, dielectric and X-ray diffraction studies of phasetransitions in antiferroelectric PbHfO3:Sn
http://dx.doi.org/10.1016/j.jallcom.2014.11.0200925-8388/� 2014 Elsevier B.V. All rights reserved.
⇑ Corresponding author.E-mail address: [email protected] (M. Maczka).
Mirosław Maczka a,⇑, Tae Hyun Kim b, Anna Gagor a, Irena Jankowska-Sumara c, Andrzej Majchrowski d,Seiji Kojima b
a Institute of Low Temperature and Structure Research, Polish Academy of Sciences, P.O. Box 1410, 50-950 Wrocław 2, Polandb Institute of Materials Science, University of Tsukuba, Tsukuba, Ibaraki 305-8573, Japanc Institute of Physics, Pedagogical University, ul. Podchora _zych 2, 30-084 Kraków, Polandd Institute of Applied Physics, Military University of Technology, 2 Kaliskiego Str., 00-908 Warszawa, Poland
a r t i c l e i n f o a b s t r a c t
Article history:Received 18 September 2014Received in revised form 31 October 2014Accepted 3 November 2014Available online 10 November 2014
Keywords:FerroelectricsPhononsAcoustic propertiesInelastic light scatteringElastic light scattering
Specific heat, dielectric, powder X-ray diffraction and Brillouin scattering studies of phase transitions inantiferroelectric PbHf0.975Sn0.025O3 crystal were performed. The specific heat data revealed clearanomalies at T1 = 473.5 and T2 = 426.3 K on cooling, which could be attributed to onset of first order phasetransitions from the paraelectric (PE) phase to an intermediate antiferroelectric phase (AFE2) and theAFE2 phase to another antiferroelectric phase (AFE1), respectively. The estimated entropy changes atT1 and T2 pointed to mainly an order–disorder and displacive character of these transitions, respectively.X-ray diffraction data showed a complex superstructure of the intermediate phase with a = 11.895(6) Å,b = 11.936(4) Å, c = 8.223(3) Å at 453 K. Brillouin studies revealed pronounced softening of longitudinalacoustic (LA) mode in the PE phase associated with its broadening. The broadening and softeningexhibited maximum values at T1. Additional acoustic anomalies, that is, abrupt frequency shifts for LAand transverse acoustic (TA) modes were also observed at T2. Brillouin scattering data also showedpresence of a broad central peak (CP) that exhibited highest intensity at T1. The observed temperaturedependences of acoustic modes and CP indicate order–disorder character of the FE to AFE2 phase transi-tion and importance of polar precursor clusters in the PE phase. The obtained data also suggest that theintermediate antiferroelectric phases in Sn4+ doped PbHfO3 and PbZrO3 may have very similar structureswith incommensurate modulations.
� 2014 Elsevier B.V. All rights reserved.
1. Introduction paraelectric (PE) phase (space group Pm�3m) to low-temperature
Perovskite oxides have been the subject of great interest due totheir ferroelectric (FE), antiferroelectric (AFE) and relaxor proper-ties [1–3]. In recent years, antiferroelectric perovskites receivedincreasing attention due to their prospective applications ashigh-energy storage capacitors, transducers, high-density opticaldata storage materials and electrocaloric refrigerators [4,5]. Theseapplications are possible since the energy difference between AFEand FE states is usually small, and the antiferroelectric state canbe reverted into the ferroelectric one under application of anexternal electric field [4]. AFE to FE transition may also be inducedby change of the chemical composition or crystallite size [4].
The first known AFE material is PbZrO3, which shows a first-order structural phase transition at 508 K from high-temperature
AFE1 phase (Pbam symmetry) [6]. The AFE properties are relatedto antiparallel displacements of lead cations [7]. The low-tempera-ture phase of PbHfO3 is isostructural with the AFE1 Pbam phase ofPbZrO3 [6,7]. However, PbHfO3 shows presence of an intermediatephase that is stable between 433 and 476 K [7–10]. Structuraldetails of this intermediate phase have not been revealed yet butit was reported that this phase is a superstructure of the perovskitecell. For instance, Fujishita et al. suggested that the cell is5 � 5 � 6 times larger than a perovskite cell [9]. Regarding symme-try of this intermediate phase, contradictory data were reportedsuggesting tetragonal, pseudotetragonal, orthorhombic or rhombo-hedral structures [11–14]. It is also worth adding that this phasewas assumed to exhibit AFE order [10]. Recent X-ray powder dif-fraction data are in contradiction with previous results, that is,they suggest presence of two intermediate polar phases with spacegroups C2mm and P4mm [7].
Since chemical doping is one of the major ways to modify elec-tric properties of perovskites, numerous attempts were undertaken

936 M. Maczka et al. / Journal of Alloys and Compounds 622 (2015) 935–941
to study effect of different dopants on properties of PbZrO3 andPbHfO3. In this respect, it was reported that doping of PbZrO3 withTi4+, Sn4+, La3+ or Nb5+ ions improves its electric properties [3]. Fur-thermore, doping may lead to the appearance of an intermediatephase. For instance, PbZr1�xSnxO3 (PZS) with x in the range 0.05–0.3 and x > 0.3 shows presence of a new intermediate AFE2 phaseand MMC (multicell cubic phase) phase, respectively [15–19].Under external electric field, the AFE2 phase can be reverted intothe FE phase what makes PZS attractive material for engineeringapplications [18].
The cubic phases of PbZrO3, PbHfO3 and PZS also received sig-nificant interest due to the presence of precursor phenomena[8,17–24]. It was shown that Brillouin scattering is one of theexperimental methods that may provide deeper insight into theprecursor dynamics and phase transition mechanism in PbZrO3
and PZS crystals [21–23]. Brillouin scattering was also recentlyemployed in studies of PbHfO3 and these studies revealed presenceof polar clusters and their coupling with acoustic phonons [24].
Although PbHfO3 was the subject of numerous studies, thestructure of the intermediate phase is still controversial and themechanism of the phase transitions is not fully understood. Influ-ence of doping with Sn4+ ions on properties of this material hasalso not been studied yet. We report, therefore, temperature-dependent Brillouin studies on high optical quality single crystalsof PbHf0.975Sn0.025O3 (PHS). We also present complementary DSC,dielectric and powder X-ray diffraction data as functions of tem-perature. The aim of these studies is to obtain information on thenature of the intermediate phase, precursor dynamics in the cubicphase, the mechanisms of the phase transitions and influence ofSn4+ doping on the phase transition mechanisms and acousticproperties of PbHfO3.
Fig. 1. Excess specific heat of PHS crystals upon cooling run (green line). For thecomparison sake, excess specific heat of undoped PbHfO3 is also shown (blue line).(For interpretation of the references to colour in this figure legend, the reader isreferred to the web version of this article.)
2. Experimental
Spontaneous crystallization from high-temperature solution was employed toobtain PHS single crystals. The starting composition of the flux was similar to thatused for synthesis of Ti-doped PbHfO3 crystals [25], except the presence of Pb3O4,that was used, after recounting, instead of PbO. Owing to oxidizing properties ofPb3O4 the quality of growing lead hafnate single crystals was greatly improvedand as-grown crystals were colorless and did not contain inclusions, while use ofPbO solvent gave samples of lower quality. The growth was carried out in a resis-tance furnace in a sealed Pt crucible. The detailed description of crystallizationset can be found elsewhere [22]. The soaking of the melt was carried at 1453 Kfor 10 h, then the melt was cooled at a rate of 2 K/h down to 1173 K. After decan-tation of obtained crystals the furnace was cooled to room temperature at a rateof 10 K/h. In the last step, to remove traces of solidified solvent from the surfaceof the obtained crystals, etching in hot diluted acetic acid was used.
The chemical composition was verified by means of Energy Dispersive Spec-trometry (EDS) measurements using a scanning electron microscopy (SEM) withthe Hitachi S4700 apparatus. This analysis showed that the composition of theas-grown crystals is PbHf0.975Sn0.025O3.
The specific heat measurements were made using the Netzsch DSC F3 Maia cal-orimeter in the temperature range from 300 K to 550 K under argon atmosphere atthe flow rate 30 ml/min. To perform the measurements, a single piece of PHS crystalwith the mass of about 20 mg was placed in an alumina crucible. The temperatureramps were performed at a rate of 1 K/min.
For dielectric measurements the opposite faces of the crystal in the form of thinplate were electroded using cold silver paste. The temperature dependences ofdielectric susceptibility on cooling and heating were measured on the frequencyf = 2 MHz using E4980A Precision LCR Meter. The temperature was controlled towithin ±0.1 K using a programmable Lake Shore (Model 331) temperaturecontroller.
Powder diffraction data (XRD) were collected on the X’Pert PRO X-ray diffrac-tion system equipped with PIXcel ultra-fast line detector, divergence slits and Sollerslits for Cu Ka1, Ka2 radiation. Measurements were done in a reflection mode in theBragg–Brentano geometry. High temperature was maintained by the HTK AntonPaar 1200 N High Temperature Oven Chamber. The sample was first heated to503 K and then cooled to room temperature. Temperature was stabilized for 0.5 hbefore each diffraction experiment.
The back-scattering Brillouin spectra of high-quality single crystals wereobtained with a 3 + 3 pass tandem Sandercock-type Fabry–Perot interferometercombined with an optical microscope. The beam of a solid-state laser (Compass315 M-100) at wavelength of 532 nm was incident on the (100) plane of PHS
crystal and the measurements were performed using 75 GHz and 300 GHz freespectral ranges (FSR). A conventional photon-counting system and a multichannelanalyzer were used to detect and average the signal. Temperature-dependent stud-ies were performed using THMS 600 (77–873 K range) and TS1500 (300–1773 Krange) cryostat cells. These cells were placed onto the stage of an optical micro-scope (Olympus BX60) having Z-adjustment. The Brillouin spectra were recordedusing a gate time of 500 s and 200 time repetitions of accumulation. The Brillouinfrequency shift (mB) and the full width at half maximum (FWHM) were evaluatedby fitting the experimental spectra to the convolution of the Gaussian instrumentalfunction with a theoretical spectral line shape that is Lorenzian in form.
3. Results and discussion
3.1. Specific heat
Fig. 1 shows the temperature dependence of excess specific heatof PHS and PbHfO3 crystals on cooling runs. The specific heat anom-alies for PHS are observed at T1 = 473.5 and T2 = 426.3 K. The shapesof the curves point to first-order transitions. The associated changesin enthalpy DH and entropy DS for PHS at T1 (T2) were estimated tobe �1.21 K J mole�1 (0.61 K J mole�1) and �5.65 J mole�1 K�1
(2.43 J mole�1 K�1), respectively. For an order–disorder transition,DS = Rln(N), where N is the number of sites for the disordered sys-tem. For the simplest case with N = 2, DS should be 5.8 J mol�1 K�1.The DS value at T1 points to an order–disorder character of thistransition. On the other hand, the DS value at T2 is significantlysmaller than that expected for an order–disorder transition, sug-gesting that this transition has mainly displacive character. Fig. 1also shows that the specific heat anomalies for pure PbHfO3 areobserved at T1 = 474.6 and T2 = 430.5 K, that is, doping with Sn4+
leads to decrease of T1 and T2 by 1.1 and 4.2 K, respectively.
3.2. Dielectric studies
The e0(T) dependences on heating and cooling are presented inFig. 2. The results are basically similar to those reported for purePbHfO3 [25]. However, the dielectric measurements of PHS evi-denced shifts of both PE-AFE2 and AFE2-AFE1 phase transition tem-peratures towards lower values, when compared with pure PbHfO3.The PE-AFE2 phase transition at T1 about 474 K is associated with asharp divergence in e0 and a very small thermal hysteresis. A smallbut clear additional anomaly, observed close to the PE-AFE2 phasetransition, can be attributed to the domain wall motion. Fulfillmentof the Curie–Weiss law e0 = C/(T � T0), where C is Curie–Weissconstant and T0 is Curie temperature, was checked in the paraelec-tric phase (see Fig. 3). The calculated values of C and T0 for PHS areequal to 2.5⁄105 1/K and 403 K, respectively. The fact that the
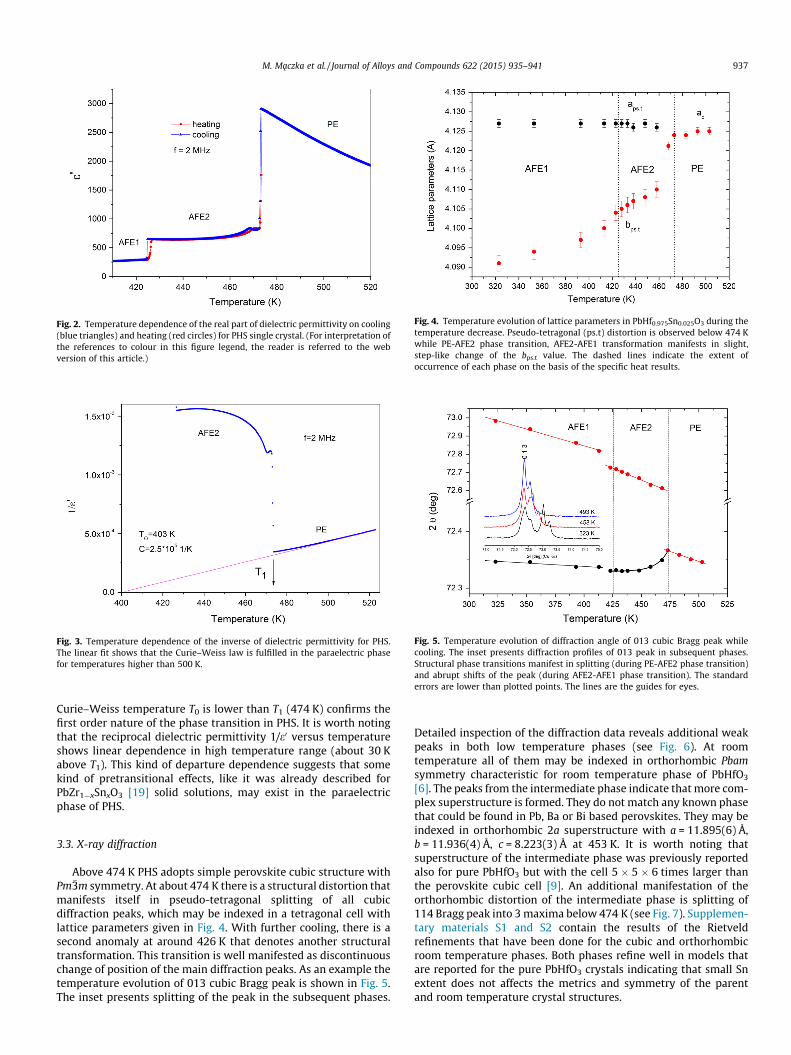
Fig. 2. Temperature dependence of the real part of dielectric permittivity on cooling(blue triangles) and heating (red circles) for PHS single crystal. (For interpretation ofthe references to colour in this figure legend, the reader is referred to the webversion of this article.)
Fig. 3. Temperature dependence of the inverse of dielectric permittivity for PHS.The linear fit shows that the Curie–Weiss law is fulfilled in the paraelectric phasefor temperatures higher than 500 K.
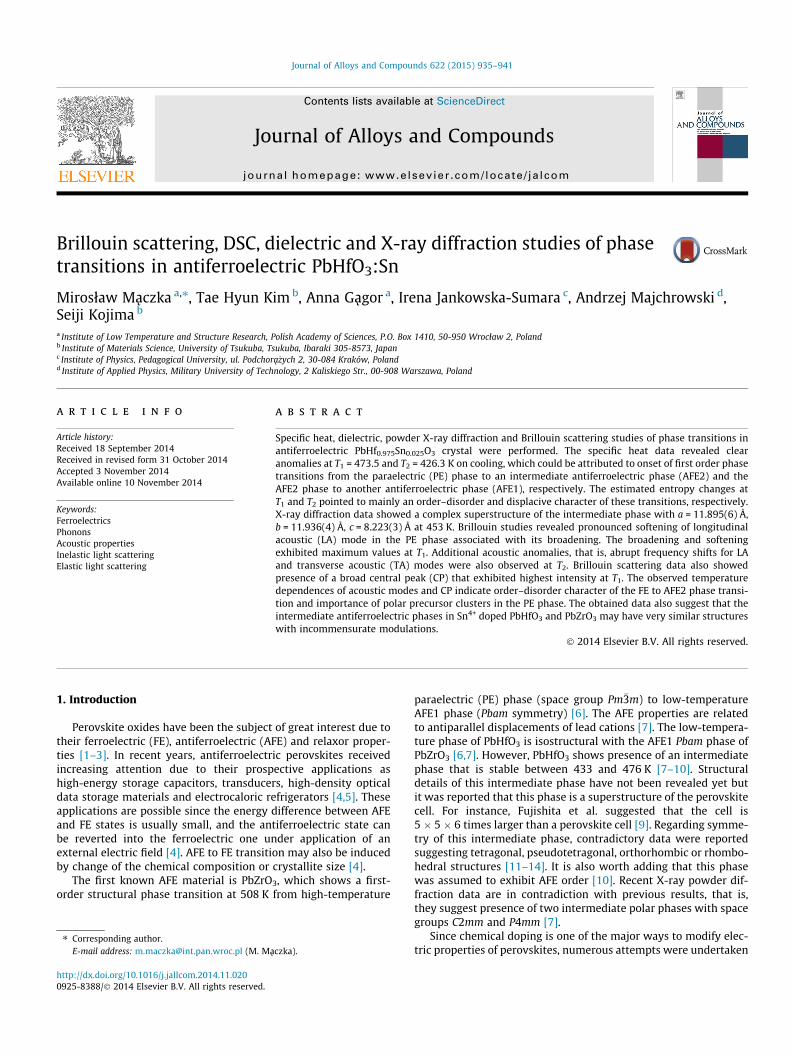
Fig. 4. Temperature evolution of lattice parameters in PbHf0.975Sn0.025O3 during thetemperature decrease. Pseudo-tetragonal (ps.t) distortion is observed below 474 Kwhile PE-AFE2 phase transition, AFE2-AFE1 transformation manifests in slight,step-like change of the bps.t value. The dashed lines indicate the extent ofoccurrence of each phase on the basis of the specific heat results.
Fig. 5. Temperature evolution of diffraction angle of 013 cubic Bragg peak whilecooling. The inset presents diffraction profiles of 013 peak in subsequent phases.Structural phase transitions manifest in splitting (during PE-AFE2 phase transition)and abrupt shifts of the peak (during AFE2-AFE1 phase transition). The standarderrors are lower than plotted points. The lines are the guides for eyes.
M. Maczka et al. / Journal of Alloys and Compounds 622 (2015) 935–941 937
Curie–Weiss temperature T0 is lower than T1 (474 K) confirms thefirst order nature of the phase transition in PHS. It is worth notingthat the reciprocal dielectric permittivity 1/e0 versus temperatureshows linear dependence in high temperature range (about 30 Kabove T1). This kind of departure dependence suggests that somekind of pretransitional effects, like it was already described forPbZr1�xSnxO3 [19] solid solutions, may exist in the paraelectricphase of PHS.
3.3. X-ray diffraction
Above 474 K PHS adopts simple perovskite cubic structure withPm�3m symmetry. At about 474 K there is a structural distortion thatmanifests itself in pseudo-tetragonal splitting of all cubicdiffraction peaks, which may be indexed in a tetragonal cell withlattice parameters given in Fig. 4. With further cooling, there is asecond anomaly at around 426 K that denotes another structuraltransformation. This transition is well manifested as discontinuouschange of position of the main diffraction peaks. As an example thetemperature evolution of 013 cubic Bragg peak is shown in Fig. 5.The inset presents splitting of the peak in the subsequent phases.
Detailed inspection of the diffraction data reveals additional weakpeaks in both low temperature phases (see Fig. 6). At roomtemperature all of them may be indexed in orthorhombic Pbamsymmetry characteristic for room temperature phase of PbHfO3
[6]. The peaks from the intermediate phase indicate that more com-plex superstructure is formed. They do not match any known phasethat could be found in Pb, Ba or Bi based perovskites. They may beindexed in orthorhombic 2a superstructure with a = 11.895(6) Å,b = 11.936(4) Å, c = 8.223(3) Å at 453 K. It is worth noting thatsuperstructure of the intermediate phase was previously reportedalso for pure PbHfO3 but with the cell 5 � 5 � 6 times larger thanthe perovskite cubic cell [9]. An additional manifestation of theorthorhombic distortion of the intermediate phase is splitting of114 Bragg peak into 3 maxima below 474 K (see Fig. 7). Supplemen-tary materials S1 and S2 contain the results of the Rietveldrefinements that have been done for the cubic and orthorhombicroom temperature phases. Both phases refine well in models thatare reported for the pure PbHfO3 crystals indicating that small Snextent does not affects the metrics and symmetry of the parentand room temperature crystal structures.

Fig. 6. XRD diffraction patterns for low theta angels reveal weak superstructurepeaks that appear in the intermediate and room temperature phase. At 298 K theymay be indexed in orthorhombic phase Pbam with lattice parameters: a = 5.92(3) Å,b = 11.92(6) Å, c = 8.22(4) Å; the intermediate phase may be indexed in 2asuperstructure with a = 11.895(6) Å, b = 11.936(4) Å, c = 8.223(3) Å at 453 K. Theasterisks denote diffraction of Cu Kb radiation.
Fig. 8. Brillouin spectra of PHS at several selected temperatures (FSR = 75 GHz) forthe phonons traveling along the [100] direction of the cubic phase.
938 M. Maczka et al. / Journal of Alloys and Compounds 622 (2015) 935–941
3.4. Brillouin studies
Fig. 8 shows representative Brillouin spectra of PHS at severaltemperatures. At high temperatures only LA mode correspondingto the c11 elastic constant is observed. Upon cooling to 473 K theband width significantly increases. At 471 K the LA mode exhibitsnarrowing and shifts towards higher frequency. These changes areassociated with appearance of the transverse acoustic (TA) modeat about 24.6 GHz. The observed changes can be attributed to thestructural phase transition found during the specific heat measure-ments as an anomaly at T1 = 473.5 K. Upon further cooling thespectra remain qualitatively the same down to room temperature.
Fig. 9 shows the temperature dependence of mB for the LA andTA modes as well as FWHM for the LA mode. As it can be noticed,the LA mode softens upon cooling in PE phase whereas its FWHMincreases. At 472 K both mB and FWHM exhibit clear jumps. Basedon our specific heat data, this behavior can be attributed to thefirst-order PE-AFE2 phase transition. Other acoustic anomalies inmB and FWHM of LA mode are observed at 426 K upon heatingand 423 K upon cooling. They correspond to the AFE2-AFE1 phasetransition. These anomalies are sharp but significantly smaller than
Fig. 7. Splitting of 200 and 114 cubic Bragg peaks. For 200 peak even in orthorhombic phreveal splitting characteristic for the orthorhombic phase (in orthorhombic phase 200 speaks in phase AFE2 indicating orthorhombic distortion of the crystal structure. Cu Ka2 li
those observed at the PE-AFE1 transition. Clear shift in mB to higherfrequencies at T2 is also observed for the TA mode (see Fig. 9c). Theobserved temperature dependence of mB for the LA mode is quitesimilar to that observed recently for pure PbHfO3 [24]. However,the FWHM exhibits much faster decrease below T1 for PHS crystalwhen compared to PbHfO3 [24]. Moreover, whereas no anomaly inFWHM of the LA mode was observed for PbHfO3, clear anomaly isobserved for PHS crystal. Here it is important to add that theobserved anomalies for PHS crystal are also similar to thoseobserved for PbZr0.78Sn0.22O3 (see Ref. [23] and Fig. 9). In particular,clear jumps of mB and FWHM of the LA mode were observed at T1
followed by smaller jumps in mB for LA and TA modes at T2. How-ever, no sharp anomaly in the temperature evolution of FWHMof the TA mode was observed for PbZr0.78Sn0.22O3 [23], as shownin Fig. 9b for the comparison sake. Furthermore, the temperaturerange of the intermediate phase is significantly narrower forPbZr0.78Sn0.22O3 (about 20 K [23]) than for studied here PHS (about47 K). It is worth to mention that the discontinuous jump of mB at T1
is slightly smaller than observed for both PbZrO3 and pure PbHfO3
[24]. Similar situation was observed in PbZr0.78Sn0.22O3 versus purePbZrO3 [23]. Ko et al. attributed such smaller jump in pure PbHfO3
to smaller disorder in the Pb sublattice than that found for purePbZrO3 [24]. Following the same reasoning as presented in Ref.[24], the smaller discontinuous jump of mB at T1 for PHS crystalwhen compared to pure PbHfO3 may indicate that Sn4+ ions affectthe reduction of disorder in Pb2+ ions sublattice when compared to
ase Pbam only two maxima are detected. The resolution of experiment is too low tohould evolve into three peaks). On the other hand 114 cubic peak splits into threene for 114 peak has been subtracted for better illustration of the diffracted maxima.

Fig. 9. (a) The Brillouin frequency shift and (b) the corresponding FWHM of the LAphonon as a function of temperature in heating (red, closed circles) and cooling(blue, closed triangles) runs. Solid black line shows temperature dependence of m0
obtained from fitting of the experimental data in the 983–1223 K range to a linearfunction. (c) Temperature evolution of the Brillouin frequency shift of the TAphonon in heating (red, closed circles) and cooling (blue, closed triangles) runs. Forthe comparison sake, experimental data for PZS (PbZr0.78Sn0.22O3) are also shown inheating (magenta, open circles) and cooling (cyan, open triangles) runs. Errors aresmaller than size of the symbols. (For interpretation of the references to colour inthis figure legend, the reader is referred to the web version of this article.)
Fig. 10. 1/s as a function of temperature calculated from temperature dependenceof the LA mode of PHS (red circles). Red solid line shows the linear fit to theexperimental data. For the comparison sake, experimental data for PZS (PbZr0.78-
Sn0.22O3) are also shown as black open triangles and solid line. (For interpretation ofthe references to colour in this figure legend, the reader is referred to the webversion of this article.)
M. Maczka et al. / Journal of Alloys and Compounds 622 (2015) 935–941 939
PbHfO3. Indeed, synchrotron and neutron powder diffraction stud-ies showed that Pb2+ cations are disordered in the cubic phases ofboth PbZrO3 and PbHfO3 [26–28]. We believe that this disorder isresponsible for appearance of transient ferroelectric phase inPbZrO3 crystals [20–22]. As reported in [15–19] doping of PbZrO3
with Sn4+ ions modifies its properties, that is, small amount ofSn4+ ions cancels the transient ferroelectric phase appearance,probably due to suppression of the off-center disordering of Pb2+
ions at A-site.The observed softening and broadening of the LA mode of PHS in
the PE phase resembles behavior of some other ferroelectric andantiferroelectric perovskites such as BaTiO3, PbZrO3, PbZr1�xTixO3
and PbZr0.78Sn0.22O3 [21,23,29–32]. Recently similar behavior wasalso reported for pure PbHfO3 [24]. It was argued that this type ofanomaly appears due to formation of precursor polar clusters thatcouple to the acoustic waves [21,23,29–32]. If the single relaxationtime approximation is appropriate, the relaxation time of precursorpolar clusters can be determined from the equation [33,34]:
12ps
¼ m2B � m2
0
C0 � CBð1Þ
where mB (CB) is the observed Brillouin shift (FWHM) and m0 (C0) isthe Brillouin shift (FWHM) not affected by the transition. The back-ground damping C0 taken as FWHM far above T1 is about 0.48 GHz.To obtain m0, we fitted the experimental data in the 983–1223 Krange to a linear function. The temperature dependence of m0 and1/s is presented in Fig. 9a and Fig. 10, respectively. Fig. 10 showsthat 1/s is approximately a linear function of temperature, that is,the relaxation time of the LA mode exhibits a critical slowing down,which can be fitted using the formula [35,36]:
1sLA¼ T1 � T
T1
1s1þ 1
s0ð2Þ
The best fit to the experimental data with Eq. (2) givess1 = 0.047 ps and s0 = 0.70 ps.
The formation of precursor polar clusters also leads to appear-ance of quasielastic central peak (CP) in perovskite antiferroelec-trics [21,23,24]. Fig. 11 shows that a broad CP is also observedfor the PHS crystals. Its intensity exhibits maximum near T1 anddecreases significantly below T1, without any clear anomaly nearT2 (see Figs. 11 and 12). Fig. 12 also shows that the CP narrowsupon cooling in the PE phase, indicating a slowing down behaviorin the dynamics of the polar precursor clusters and their growth.The CP broadens just below T1 and its FWHM changes slightly inthe AFE phases, showing no anomaly near T2.
The observed acoustic anomalies and temperature dependenceof CP give important insight into mechanism of the phase transi-tions and dynamics of precursor polar clusters. Firstly, the observa-tion of critical slowing down of the relaxation time near T1 provesthat the phase transition from the PE to the intermediate AFE2phase is associated with some order–disorder processes. Secondly,lack of any critical slowing down near the AFE1-AFE2 phase transi-tion is consistent with displacive character of this transition.Thirdly, fast decrease of CP intensity below T1 reflects decreasedimportance of dynamic polar clusters with ferroelectric type prop-erties upon cooling the AFE2 phase.
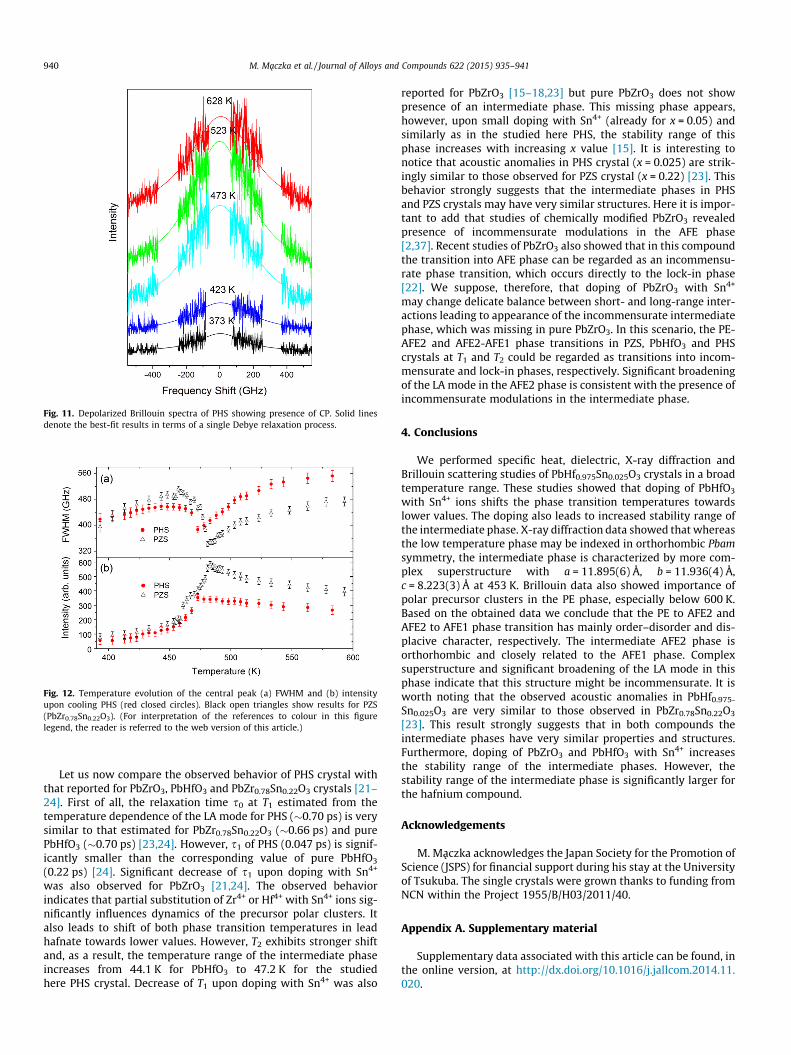
Fig. 11. Depolarized Brillouin spectra of PHS showing presence of CP. Solid linesdenote the best-fit results in terms of a single Debye relaxation process.
Fig. 12. Temperature evolution of the central peak (a) FWHM and (b) intensityupon cooling PHS (red closed circles). Black open triangles show results for PZS(PbZr0.78Sn0.22O3). (For interpretation of the references to colour in this figurelegend, the reader is referred to the web version of this article.)
940 M. Maczka et al. / Journal of Alloys and Compounds 622 (2015) 935–941
Let us now compare the observed behavior of PHS crystal withthat reported for PbZrO3, PbHfO3 and PbZr0.78Sn0.22O3 crystals [21–24]. First of all, the relaxation time s0 at T1 estimated from thetemperature dependence of the LA mode for PHS (�0.70 ps) is verysimilar to that estimated for PbZr0.78Sn0.22O3 (�0.66 ps) and purePbHfO3 (�0.70 ps) [23,24]. However, s1 of PHS (0.047 ps) is signif-icantly smaller than the corresponding value of pure PbHfO3
(0.22 ps) [24]. Significant decrease of s1 upon doping with Sn4+
was also observed for PbZrO3 [21,24]. The observed behaviorindicates that partial substitution of Zr4+ or Hf4+ with Sn4+ ions sig-nificantly influences dynamics of the precursor polar clusters. Italso leads to shift of both phase transition temperatures in leadhafnate towards lower values. However, T2 exhibits stronger shiftand, as a result, the temperature range of the intermediate phaseincreases from 44.1 K for PbHfO3 to 47.2 K for the studiedhere PHS crystal. Decrease of T1 upon doping with Sn4+ was also
reported for PbZrO3 [15–18,23] but pure PbZrO3 does not showpresence of an intermediate phase. This missing phase appears,however, upon small doping with Sn4+ (already for x = 0.05) andsimilarly as in the studied here PHS, the stability range of thisphase increases with increasing x value [15]. It is interesting tonotice that acoustic anomalies in PHS crystal (x = 0.025) are strik-ingly similar to those observed for PZS crystal (x = 0.22) [23]. Thisbehavior strongly suggests that the intermediate phases in PHSand PZS crystals may have very similar structures. Here it is impor-tant to add that studies of chemically modified PbZrO3 revealedpresence of incommensurate modulations in the AFE phase[2,37]. Recent studies of PbZrO3 also showed that in this compoundthe transition into AFE phase can be regarded as an incommensu-rate phase transition, which occurs directly to the lock-in phase[22]. We suppose, therefore, that doping of PbZrO3 with Sn4+
may change delicate balance between short- and long-range inter-actions leading to appearance of the incommensurate intermediatephase, which was missing in pure PbZrO3. In this scenario, the PE-AFE2 and AFE2-AFE1 phase transitions in PZS, PbHfO3 and PHScrystals at T1 and T2 could be regarded as transitions into incom-mensurate and lock-in phases, respectively. Significant broadeningof the LA mode in the AFE2 phase is consistent with the presence ofincommensurate modulations in the intermediate phase.
4. Conclusions
We performed specific heat, dielectric, X-ray diffraction andBrillouin scattering studies of PbHf0.975Sn0.025O3 crystals in a broadtemperature range. These studies showed that doping of PbHfO3
with Sn4+ ions shifts the phase transition temperatures towardslower values. The doping also leads to increased stability range ofthe intermediate phase. X-ray diffraction data showed that whereasthe low temperature phase may be indexed in orthorhombic Pbamsymmetry, the intermediate phase is characterized by more com-plex superstructure with a = 11.895(6) Å, b = 11.936(4) Å,c = 8.223(3) Å at 453 K. Brillouin data also showed importance ofpolar precursor clusters in the PE phase, especially below 600 K.Based on the obtained data we conclude that the PE to AFE2 andAFE2 to AFE1 phase transition has mainly order–disorder and dis-placive character, respectively. The intermediate AFE2 phase isorthorhombic and closely related to the AFE1 phase. Complexsuperstructure and significant broadening of the LA mode in thisphase indicate that this structure might be incommensurate. It isworth noting that the observed acoustic anomalies in PbHf0.975-
Sn0.025O3 are very similar to those observed in PbZr0.78Sn0.22O3
[23]. This result strongly suggests that in both compounds theintermediate phases have very similar properties and structures.Furthermore, doping of PbZrO3 and PbHfO3 with Sn4+ increasesthe stability range of the intermediate phases. However, thestability range of the intermediate phase is significantly larger forthe hafnium compound.
Acknowledgements
M. Maczka acknowledges the Japan Society for the Promotion ofScience (JSPS) for financial support during his stay at the Universityof Tsukuba. The single crystals were grown thanks to funding fromNCN within the Project 1955/B/H03/2011/40.
Appendix A. Supplementary material
Supplementary data associated with this article can be found, inthe online version, at http://dx.doi.org/10.1016/j.jallcom.2014.11.020.
M. Maczka et al. / Journal of Alloys and Compounds 622 (2015) 935–941 941
References
[1] G.A. Samara, J. Phys.: Condens. Matter 15 (2003) R357.[2] X. Tan, C. Ma, J. Frederick, S. Beckman, K.G. Webber, J. Am. Ceram. Soc. 94
(2014) 4091.[3] Z. Ren, N. Zhang, L.W. Su, H. Wu, Z.G. Ye, J. Appl. Phys. 116 (2014) 024103.[4] K.M. Rabe, Antiferroelectricity in oxides: a reexamination, in: S.B. Ogale, T.V.
Venkatesan, M.G. Blamire (Eds.), Functional Metal Oxides: New Science andNovel Applications, Wiley-VCH Verlag GmbH & Co. KGaA, Weinheim,Germany, 2013, http://dx.doi.org/10.1002/9783527654864.ch7.
[5] Hitesh Borkar, V.N. Singh, B.P. Singh, M. Tomar, Vinay Gupta, Ashok Kumar,RSC Advances 4 (2014) 22840.
[6] D.L. Corker, A.M. Glazer, J. Dec, K. Roleder, R.W. Whatmore, Acta Cryst. B 53(1997) 135.
[7] M.F. Kupryanov, E.V. Petrovich, E.V. Dutova, Yu.V. Kabirov, Cryst. Rep. 57(2012) 205.
[8] Y. Kuroiwa, H. Fijiwara, A. Sawada, H. Kawaji, T. Atake, J. Korean Phys. Soc. 46(2005) 296.
[9] J. Fijishita, Y. Ishikawa, A. Ogawaguchi, K. Kato, E. Nishibori, M. Takata, M.Sakata, J. Phys. Soc. Jpn. 74 (2005) 2743.
[10] K. Roleder, M. Maglione, M.D. Fontana, I. Jankowska-Sumara, G.E. Kugel, J. Dec,Ferroelectrics 238 (2000) 139.
[11] G. Shirane, R. Pepinsky, Phys. Rev. 91 (1953) 812.[12] P.D. Dernier, J.P. Remeika, Mater. Res. Bull. 10 (1975) 187.[13] N.G. Leont’ev, R.V. Kolesova, V.V. Eremkin, V.G. Smotrakov, O.E. Fesenko, Sov.
Phys. Crystallogr. 29 (1984) 238.[14] H. Fujishita, Y. Ishikawa, Ferroelectrics 269 (2002) 135.[15] I. Jankowska-Sumara, J. Dec, Ferroelectrics 313 (2004) 81.[16] I. Jankowska-Sumara, Phys. Stat. Sol. (b) 244 (2007) 1887.[17] I. Jankowska-Sumara, A. Majchrowski, A. _Zmija, Phase Transitions 84 (2010)
521.[18] I. Jankowska-Sumara, M. Górny, K. Rusek, A. Majchrowski, A. _Zmija, K. Roleder,
Ferroelectrics 400 (2010) 89.
[19] I. Jankowska-Sumara, Phase Transitions 87 (2014) 687.[20] A. Bussmann-Holder, J.H. Ko, A. Majchrowski, M. Górny, K. Roleder, J. Phys.:
Condens. Matter 25 (2013) 212202.[21] J.H. Ko, M. Górny, A. Majchrowski, K. Roleder, A. Bussmann-Holder, Phys. Rev.
B 87 (2013) 184110.[22] A.K. Tagantsev, K. Vaideeswaran, S.B. Vakhrushev, A.V. Filimonov, R.G.
Burkovsky, A. Shaganov, D. Andronikova, A.I. Rudskoy, A.Q.R. Baron, H.Uchiyama, D. Chernyshov, A. Bosak, Z. Ujma, K. Roleder, A. Majchrowski, J.-H. Ko, N. Setter, Nature Commun. 4 (2013) 2229.
[23] M. Maczka, T.H. Kim, M. Ptak, I. Jankowska-Sumara, A. Majchrowski, S. Kojima,J. Alloys Comp. 587 (2014) 273.
[24] J.H. Ko, K. Roleder, A. Majchrowski, A. Bussmann-Holder, J. Phys. Korean Soc.64 (2014) 1169.
[25] I. Jankowska-Sumara, G.E. Kugel, K. Roleder, J. Dec, J. Phys.: Condens. Matter 7(1995) 3957.
[26] Y. Kuroiwa, H. Fujiwara, A. Sawada, S. Aoyagi, E. Nishibori, M. Sakata, M.Takata, H. Kawaji, T. Atake, J. Appl. Phys. 43 (2004) 6799.
[27] Y. Kuroiwa, H. Fujiwara, A. Sawada, H. Kawaji, T. Atake, J. Korean Phys. Soc. 46(2005) 296.
[28] H. Fujishita, A. Ogawaguchi, S. Katano, J. Phys. Soc. Jpn. 77 (2008) 064601.[29] J.-H. Ko, S. Kojima, T.-Y. Koo, J.H. Jung, C.J. Won, N.J. Hur, Appl. Phys. Lett. 93
(2008) 102905.[30] J.-H. Ko, T.H. Kim, K. Roleder, D. Rytz, S. Kojima, Phys. Rev. B 84 (2011) 094123.[31] J.-H. Ko, T.H. Kim, S. Kojima, K. Roleder, D. Rytz, C.J. Won, N.J. Hur, J.H. Jung, T.-
Y. Koo, S.B. Kim, K. Park, Curr. Appl. Phys. 12 (2012) 1185.[32] T.H. Kim, J.H. Ko, S. Kojima, A.A. Bokov, X. Long, Z.G. Ye, Appl. Phys. Lett. 100
(2012) 082903.[33] W. Rehwald, Adv. Phys. 22 (1973) 721.[34] S. Yoshida, Y. Tsujimi, T. Yagi, Physica B 219–220 (1996) 596.[35] M.E. Lines, A.M. Glass, Principles and Application of Ferroelectrics and Related
Materials, Clarendon, Oxford, 1977, p. 241 (Chapter 8).[36] M.-S. Zhang, T. Yagi, W.F. Oliver, J.F. Scott, Phys. Rev. B 33 (1986) 1381.[37] H. He, X. Tan, Phys. Rev. B 72 (2005) 024102.