Branch surface area and its vertical distribution in coastal Douglas-fir
11
Trees (2006) 20:657–667 DOI 10.1007/s00468-006-0081-3 ORIGINAL ARTICLE Branch surface area and its vertical distribution in coastal Douglas-fir Aaron R. Weiskittel · Douglas A. Maguire Received: 22 December 2005 / Revised: 16 June 2006 / Accepted: 1 July 2006 / Published online: 1 September 2006 C Springer-Verlag 2006 Abstract Wood area index (WAI; total surface area of branches and bole per unit of land area) is an important yet often neglected forest structural attribute. Branchwood sur- face area, in particular, has significant implications for many ecophysiological processes including total respiration and interception of radiation and rainfall. Branch surface area was estimated at the branch-, tree-, and stand-level for 33 Douglas-fir (Pseduotsuga menziesii [Mirb.] Franco) plan- tations in the Oregon Coast Range. Patterns in WAI, leaf area index (LAI; total surface area of needles per unit of land area), tree area index (TAI = WAI + LAI) and vari- ous ratios of these dimensions were then investigated. The main axes of primary branches (those attached to the main stem) comprised 82 ± 13% of total branchwood surface area. Tree surface area (needles + woody tissue) increased with increasing tree size and crown length, and decreased with greater intensity of Swiss needle cast (SNC). At the stand- level, woody surface area increased with greater stand den- sity and decreased with more severe SNC, but on average it constituted 29 ± 12% of total tree surface area. Branch- wood surface area and bole surface area contributed equally to WAI. The variation in WAI for a given LAI has important implications for radiation and rainfall attenuation in these stands and for accurate partitioning of intercepted radiation between photosynthetic and non-photosynthetic tissues. Keywords Branch surface area . Crown structure . Wood area index . Swiss needle cast . Douglas-fir Communicated by R. Guy A. R. Weiskittel () · D. A. Maguire Department of Forest Science, Oregon State University, Corvallis, OR 97331, USA e-mail: [email protected] Introduction Wood area index (WAI; total surface area of branches and the tree bole) has received significantly less attention than leaf area index (LAI; total surface area of foliage per unit of land area) as an attribute of forest structure. The magnitude of WAI, however, has important implications for total radiation absorption by the canopy (Oker-Blom et al. 1991), for the partitioning of intercepted radiation by photosynthetic vs. non-photosynthetic tissues, and for accurately determining LAI through indirect measurement (Br´ eda 2003). WAI has been estimated for relatively few species, and its apparent contribution to tree area index (TAI = WAI + LAI) was found to vary from 7 to 41% (Br´ eda 2003). Little is currently known about how WAI varies within a species, particularly with respect to changes in site quality, stand age, and stand density, and in response to silvicultural manipulation of various stand structural features. The surface area of branches is one of the most difficult components of WAI to determine accurately because branch structure and crown architecture vary widely, even among trees of similar size (diameter and height). Because branches have been assumed to intercept a relatively small amount of direct beam radiation in both coniferous and deciduous forests (Fassnacht et al. 1994; Kucharik et al. 1998), branch- wood surface area has not been explicitly included in most in- direct assessments of LAI or canopy net photosynthesis mod- els. Branchwood surface area, however, plays a role in several other ecological processes, including maintenance respira- tion rates (Bosc et al. 2003), rainfall storage capacity (Keim 2004), avian foraging behavior (Doster and James 1998; Pierce and Grubb 1981), and spruce budworm infestation level (Jones 1979). Branchwood surface area and its vertical distribution also have important implications for forest bio- diversity, particularly as a substrate for epiphytic bryophytes, Springer
Transcript of Branch surface area and its vertical distribution in coastal Douglas-fir
Trees (2006) 20:657–667DOI 10.1007/s00468-006-0081-3
ORIGINAL ARTICLE
Branch surface area and its vertical distribution in coastalDouglas-firAaron R. Weiskittel · Douglas A. Maguire
Received: 22 December 2005 / Revised: 16 June 2006 / Accepted: 1 July 2006 / Published online: 1 September 2006C© Springer-Verlag 2006
Abstract Wood area index (WAI; total surface area ofbranches and bole per unit of land area) is an important yetoften neglected forest structural attribute. Branchwood sur-face area, in particular, has significant implications for manyecophysiological processes including total respiration andinterception of radiation and rainfall. Branch surface areawas estimated at the branch-, tree-, and stand-level for 33Douglas-fir (Pseduotsuga menziesii [Mirb.] Franco) plan-tations in the Oregon Coast Range. Patterns in WAI, leafarea index (LAI; total surface area of needles per unit ofland area), tree area index (TAI = WAI + LAI) and vari-ous ratios of these dimensions were then investigated. Themain axes of primary branches (those attached to the mainstem) comprised 82 ± 13% of total branchwood surface area.Tree surface area (needles + woody tissue) increased withincreasing tree size and crown length, and decreased withgreater intensity of Swiss needle cast (SNC). At the stand-level, woody surface area increased with greater stand den-sity and decreased with more severe SNC, but on averageit constituted 29 ± 12% of total tree surface area. Branch-wood surface area and bole surface area contributed equallyto WAI. The variation in WAI for a given LAI has importantimplications for radiation and rainfall attenuation in thesestands and for accurate partitioning of intercepted radiationbetween photosynthetic and non-photosynthetic tissues.
Keywords Branch surface area . Crown structure . Woodarea index . Swiss needle cast . Douglas-fir
Communicated by R. Guy
A. R. Weiskittel (�) · D. A. MaguireDepartment of Forest Science, Oregon State University,Corvallis, OR 97331, USAe-mail: [email protected]
Introduction
Wood area index (WAI; total surface area of branches and thetree bole) has received significantly less attention than leafarea index (LAI; total surface area of foliage per unit of landarea) as an attribute of forest structure. The magnitude ofWAI, however, has important implications for total radiationabsorption by the canopy (Oker-Blom et al. 1991), for thepartitioning of intercepted radiation by photosynthetic vs.non-photosynthetic tissues, and for accurately determiningLAI through indirect measurement (Breda 2003). WAI hasbeen estimated for relatively few species, and its apparentcontribution to tree area index (TAI = WAI + LAI) wasfound to vary from 7 to 41% (Breda 2003). Little is currentlyknown about how WAI varies within a species, particularlywith respect to changes in site quality, stand age, and standdensity, and in response to silvicultural manipulation ofvarious stand structural features.
The surface area of branches is one of the most difficultcomponents of WAI to determine accurately because branchstructure and crown architecture vary widely, even amongtrees of similar size (diameter and height). Because brancheshave been assumed to intercept a relatively small amountof direct beam radiation in both coniferous and deciduousforests (Fassnacht et al. 1994; Kucharik et al. 1998), branch-wood surface area has not been explicitly included in most in-direct assessments of LAI or canopy net photosynthesis mod-els. Branchwood surface area, however, plays a role in severalother ecological processes, including maintenance respira-tion rates (Bosc et al. 2003), rainfall storage capacity (Keim2004), avian foraging behavior (Doster and James 1998;Pierce and Grubb 1981), and spruce budworm infestationlevel (Jones 1979). Branchwood surface area and its verticaldistribution also have important implications for forest bio-diversity, particularly as a substrate for epiphytic bryophytes,
Springer

658 Trees (2006) 20:657–667
lichens, fungi, and invertebrates (e.g. Ingram and Nadkarni1993).
Branch surface area has been estimated in a variety ofways. Whittaker and Woodwell (1967) presented an equa-tion based on branch divarication theory using measurementsof branch basal diameter, branch length, the number of cur-rent twigs as branch termini, and mean diameter of currenttwigs. Jennings et al. (1990) computed branch surface area asthe area of a triangle with a height and base correspondingto length and maximum width, respectively. Both Halldin(1985) and Baldwin et al. (1997) assumed allometric rela-tionships between branch diameter and surface area, whileMohren (1987) used a fixed value of 0.3 m2 kg−1, to predictbranch surface area at the branch- and tree-level. These au-thors, however, do not report how sample branch surface areawas actually measured. Halldin (1985) and Baldwin et al.(1997) are apparently the only authors to examine patternsin the vertical distribution of branchwood surface area for asubject stand. Despite the variety of methods for estimatingbranchwood surface area, these previous studies have limitedapplicability due to their relatively small sample sizes andlack of replication across the landscape.
The goal of this research was to improve estimates ofradiation and rainfall interception in Douglas-fir (Pseudot-suga menziesii [Mirb.] Franco) plantations, and therebyfacilitate more accurate forecasting of plantation produc-tivity under alternative silvicultural regimes and under dif-fering levels of Swiss needle cast (SNC). Approximately72,000 ha of Douglas-fir plantations in the Oregon CoastRange are currently showing symptoms of SNC (Kanaskieet al. 2004), a foliar disease leading to premature needleabscission, wide variation in crown condition, and standLAIs ranging from 3 to 10 (Weiskittel 2003). These plan-tations are also managed under a wide variety of silvicul-tural regimes, producing equally large differences in standstructure. The objectives of this paper, therefore, were: (1)to assess the variability in WAI among Douglas-fir plan-tations in north coastal Oregon; (2) to relate WAI to siteand stand structural conditions; and (3) test the hypothesisthat the ratio of needle area to woody surface area declineswith increasing SNC severity. Achieving these objectives re-quired development of equations for predicting branch sur-face area at the individual branch-, tree-, and stand-levels(Table 1).
Table 1 Symbols, definitionsand units of variables forcharacterizing woody surfacearea of Douglas-fir plantations
Symbol Definition Unit
a Beta parameter –Ai Indicator variable for age class i (i = 1, 2, 3, 4, 5 + ) –AGE Stand mean breast-height age yearsb Beta parameter –BAI Branchwood area index (total surface area) m2 m−2
BADF Plot basal area in Douglas-fir m2 ha−1
%BADF Proportion of plot basal area in Douglas-fir (0–1) %BD Branch diameter mmBHT Branch height in the tree mBL Branch length mBSA Total branch surface area cm2
CL Crown length mCR Crown ratio –CLSA Crown sparseness index cm cm−2
dl Diameter of primary branch axis at distance l from the branch tip mmDBH Diameter at breast height cmDIN CAN Branch depth into the canopy (maximum plot tree height – branch height) mHCM Height to crown midpoint mHT Total tree height mFOLRET Plot mean foliage retention yearsl Distance from bole along primary branch axis mTAI Tree area index (LAI + BAI + SAI) m2 m−2
SAI Stem area index m2 m−2
SI Estimated Bruce’s (1981) plot site index m at 50-yearTBSA Surface area of all branches on a tree m2
TLBSA Surface area of lateral shoots on a tree m2
PRISA Surface area of all primary branch axes on a tree m2
TOPHT Plot top height (mean HT of the 100 largest trees per ha) mTPH Trees per ha –WAI Total wood area index (BAI + SAI) m2 m−2
Z Relative position along the primary branch axis, l/BL –
Springer
Trees (2006) 20:657–667 659
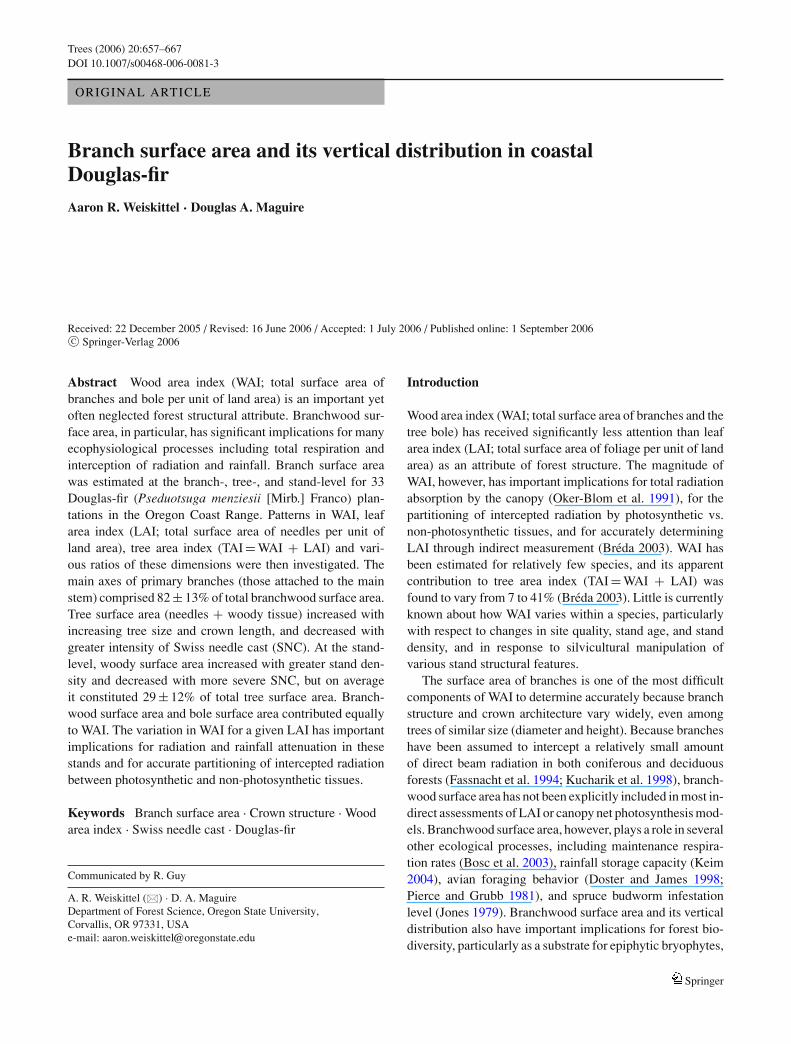
Table 2 Attributes of the 33 plots sampled for estimating woody surface area in Douglas-fir plantations
Attribute Mean Standard deviation Minimum Maximum
Douglas-fir basal area (m2 ha−1) 32.2 14.1 10.0 72.6Douglas-fir trees per ha 535 267 150 1223Douglas-fir quadratic mean diameter (cm) 30.0 10.7 11.4 53.5Douglas-fir relative density (Curtis 1982) (m2 ha−1 cm−1/2) 5.82 1.81 2.95 10.09% Basal area in other conifer 7 12 0 53% Basal area in hardwoods 2 2 0 9Total basal area (m2 ha−1) 36.9 14.5 10.4 76.8Average breast-height age (year) 29 15 11 62Average foliage retention (year) 2.5 0.8 1.3 4.4Bruce’s (1981) site index (m of top height at 50 years breast height age) 39 4 27 46Crown sparseness index (cm cm−2) 5.83 1.22 3.61 8.14Distance from the coast (km) 16.6 11.9 1.0 53.0Elevation (m) 218 143 24 549
Materials and methods
Field work
The sample collected for this study consisted of 122 Douglas-fir trees from 33 plantations across the northern Oregon CoastRange, north of Newport (N44◦40′, W124◦4′) and south ofAstoria (N46◦7′, W123◦45′). Breast height age ranged from10 to 60 years and SNC varied from mild to severe as mea-sured by foliage retention (Table 2). In the spring of 2002and 2003, foliage retention (years) was determined in eachthird of the live crown with the aid of binoculars. Plot-levelSNC intensity was indexed by the average foliage retentionfor all three crown levels in ten sample trees per stand. Rat-ings from 2002 were used for plots sampled in the fall ofthat year, and ratings from 2003 were used for plots sam-pled in the winter of 2003. Weiskittel et al. (2006) give amore complete description of the study sites and samplingscheme.
In each stand, three to five trees were felled and intensivelymeasured. Before felling, diameter at breast height (DBH),total height (HT), height to crown base (HCB), and maximumcrown width (CW) were measured (Table 3). After felling,a disk was cut from the bole at crown base and sapwoodcross-sectional area was estimated by measuring sapwood
widths on the longest and perpendicular-to-longest axes andassuming elliptical total and heartwood cross-sections. Inaddition, the height and diameter (just beyond basal swell) ofevery living primary branch (those attached to the tree boleand >1 mm in diameter) were determined. Ten to fifteenbranches (3–5 per crown third, including 2–3 whorl and 1–2interwhorl branches) were randomly selected and transportedback to the laboratory (Table 4).
Laboratory work
The 668 sample branches were clipped into separate ageclasses, placed into smaller paper bags, and oven dried at85◦C for 3 days. The needles were separated from the woodymaterial, and each component was weighed to the nearest0.01 g. The main axis of each primary branch was also cutinto age classes, dried and weighed. Each annual segmentof the branch main axis was measured for distance from thebranch tip, total length, and midpoint diameter.
Specific shoot area (SSA) of secondary and higher ordershoots (hereafter referred to as lateral shoots) was requiredto convert lateral shoot mass to lateral shoot surface area.On 309 branches selected from the 668 available, five toten higher order shoots of each age class were measuredfor length and midpoint diameter. Surface area was then
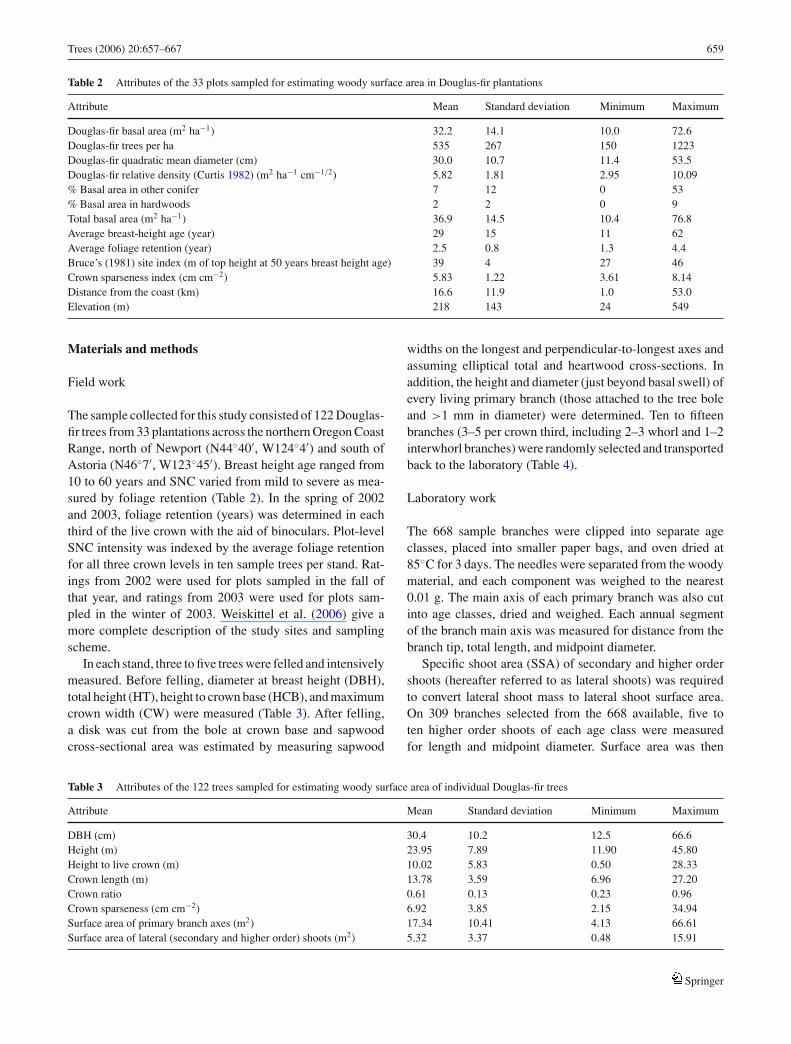
Table 3 Attributes of the 122 trees sampled for estimating woody surface area of individual Douglas-fir trees
Attribute Mean Standard deviation Minimum Maximum
DBH (cm) 30.4 10.2 12.5 66.6Height (m) 23.95 7.89 11.90 45.80Height to live crown (m) 10.02 5.83 0.50 28.33Crown length (m) 13.78 3.59 6.96 27.20Crown ratio 0.61 0.13 0.23 0.96Crown sparseness (cm cm−2) 6.92 3.85 2.15 34.94Surface area of primary branch axes (m2) 17.34 10.41 4.13 66.61Surface area of lateral (secondary and higher order) shoots (m2) 5.32 3.37 0.48 15.91
Springer
660 Trees (2006) 20:657–667
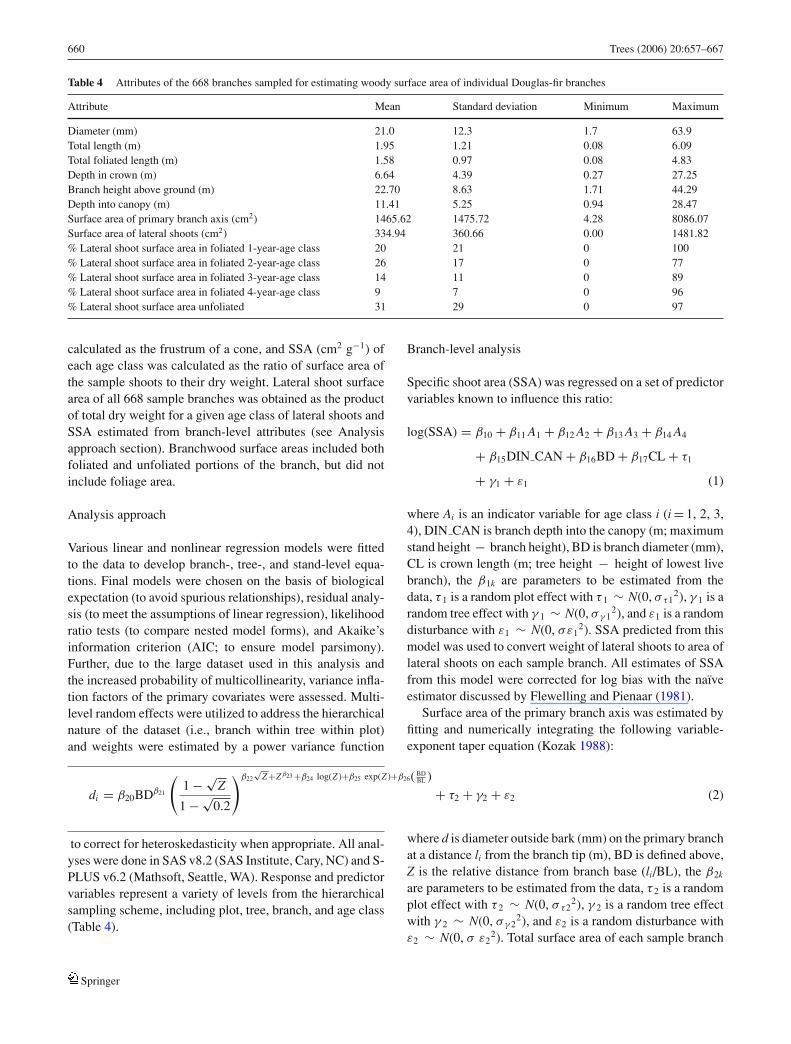
Table 4 Attributes of the 668 branches sampled for estimating woody surface area of individual Douglas-fir branches
Attribute Mean Standard deviation Minimum Maximum
Diameter (mm) 21.0 12.3 1.7 63.9Total length (m) 1.95 1.21 0.08 6.09Total foliated length (m) 1.58 0.97 0.08 4.83Depth in crown (m) 6.64 4.39 0.27 27.25Branch height above ground (m) 22.70 8.63 1.71 44.29Depth into canopy (m) 11.41 5.25 0.94 28.47Surface area of primary branch axis (cm2) 1465.62 1475.72 4.28 8086.07Surface area of lateral shoots (cm2) 334.94 360.66 0.00 1481.82% Lateral shoot surface area in foliated 1-year-age class 20 21 0 100% Lateral shoot surface area in foliated 2-year-age class 26 17 0 77% Lateral shoot surface area in foliated 3-year-age class 14 11 0 89% Lateral shoot surface area in foliated 4-year-age class 9 7 0 96% Lateral shoot surface area unfoliated 31 29 0 97
calculated as the frustrum of a cone, and SSA (cm2 g−1) ofeach age class was calculated as the ratio of surface area ofthe sample shoots to their dry weight. Lateral shoot surfacearea of all 668 sample branches was obtained as the productof total dry weight for a given age class of lateral shoots andSSA estimated from branch-level attributes (see Analysisapproach section). Branchwood surface areas included bothfoliated and unfoliated portions of the branch, but did notinclude foliage area.
Analysis approach
Various linear and nonlinear regression models were fittedto the data to develop branch-, tree-, and stand-level equa-tions. Final models were chosen on the basis of biologicalexpectation (to avoid spurious relationships), residual analy-sis (to meet the assumptions of linear regression), likelihoodratio tests (to compare nested model forms), and Akaike’sinformation criterion (AIC; to ensure model parsimony).Further, due to the large dataset used in this analysis andthe increased probability of multicollinearity, variance infla-tion factors of the primary covariates were assessed. Multi-level random effects were utilized to address the hierarchicalnature of the dataset (i.e., branch within tree within plot)and weights were estimated by a power variance function
to correct for heteroskedasticity when appropriate. All anal-yses were done in SAS v8.2 (SAS Institute, Cary, NC) and S-PLUS v6.2 (Mathsoft, Seattle, WA). Response and predictorvariables represent a variety of levels from the hierarchicalsampling scheme, including plot, tree, branch, and age class(Table 4).
Branch-level analysis
Specific shoot area (SSA) was regressed on a set of predictorvariables known to influence this ratio:
log(SSA) = β10 + β11 A1 + β12 A2 + β13 A3 + β14 A4
+ β15DIN CAN + β16BD + β17CL + τ1
+ γ1 + ε1 (1)
where Ai is an indicator variable for age class i (i = 1, 2, 3,4), DIN CAN is branch depth into the canopy (m; maximumstand height − branch height), BD is branch diameter (mm),CL is crown length (m; tree height − height of lowest livebranch), the β1k are parameters to be estimated from thedata, τ 1 is a random plot effect with τ 1 ∼ N(0, σ τ1
2), γ 1 is arandom tree effect with γ 1 ∼ N(0, σγ 1
2), and ε1 is a randomdisturbance with ε1 ∼ N(0, σε1
2). SSA predicted from thismodel was used to convert weight of lateral shoots to area oflateral shoots on each sample branch. All estimates of SSAfrom this model were corrected for log bias with the naıveestimator discussed by Flewelling and Pienaar (1981).
Surface area of the primary branch axis was estimated byfitting and numerically integrating the following variable-exponent taper equation (Kozak 1988):
di = β20BDβ21
(1 − √
Z
1 − √0.2
)β22√
Z+Zβ23 +β24 log(Z )+β25 exp(Z )+β26( BDBL )
+ τ2 + γ2 + ε2 (2)
where d is diameter outside bark (mm) on the primary branchat a distance li from the branch tip (m), BD is defined above,Z is the relative distance from branch base (li/BL), the β2k
are parameters to be estimated from the data, τ 2 is a randomplot effect with τ 2 ∼ N(0, σ τ2
2), γ 2 is a random tree effectwith γ 2 ∼ N(0, σγ 2
2), and ε2 is a random disturbance withε2 ∼ N(0, σ ε2
2). Total surface area of each sample branch
Springer
Trees (2006) 20:657–667 661
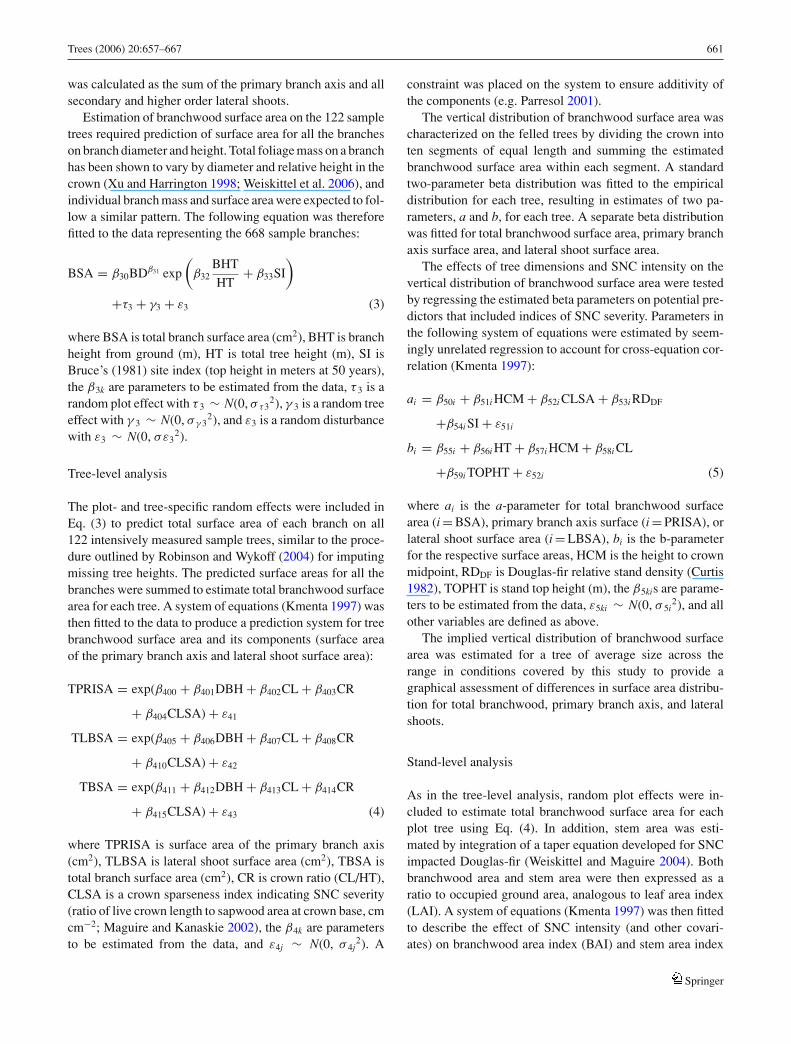
was calculated as the sum of the primary branch axis and allsecondary and higher order lateral shoots.
Estimation of branchwood surface area on the 122 sampletrees required prediction of surface area for all the brancheson branch diameter and height. Total foliage mass on a branchhas been shown to vary by diameter and relative height in thecrown (Xu and Harrington 1998; Weiskittel et al. 2006), andindividual branch mass and surface area were expected to fol-low a similar pattern. The following equation was thereforefitted to the data representing the 668 sample branches:
BSA = β30BDβ31 exp
(β32
BHT
HT+ β33SI
)+τ3 + γ3 + ε3 (3)
where BSA is total branch surface area (cm2), BHT is branchheight from ground (m), HT is total tree height (m), SI isBruce’s (1981) site index (top height in meters at 50 years),the β3k are parameters to be estimated from the data, τ 3 is arandom plot effect with τ 3 ∼ N(0, σ τ3
2), γ 3 is a random treeeffect with γ 3 ∼ N(0, σγ 3
2), and ε3 is a random disturbancewith ε3 ∼ N(0, σε3
2).
Tree-level analysis
The plot- and tree-specific random effects were included inEq. (3) to predict total surface area of each branch on all122 intensively measured sample trees, similar to the proce-dure outlined by Robinson and Wykoff (2004) for imputingmissing tree heights. The predicted surface areas for all thebranches were summed to estimate total branchwood surfacearea for each tree. A system of equations (Kmenta 1997) wasthen fitted to the data to produce a prediction system for treebranchwood surface area and its components (surface areaof the primary branch axis and lateral shoot surface area):
TPRISA = exp(β400 + β401DBH + β402CL + β403CR
+ β404CLSA) + ε41
TLBSA = exp(β405 + β406DBH + β407CL + β408CR
+ β410CLSA) + ε42
TBSA = exp(β411 + β412DBH + β413CL + β414CR
+ β415CLSA) + ε43 (4)
where TPRISA is surface area of the primary branch axis(cm2), TLBSA is lateral shoot surface area (cm2), TBSA istotal branch surface area (cm2), CR is crown ratio (CL/HT),CLSA is a crown sparseness index indicating SNC severity(ratio of live crown length to sapwood area at crown base, cmcm−2; Maguire and Kanaskie 2002), the β4k are parametersto be estimated from the data, and ε4j ∼ N(0, σ 4j
2). A
constraint was placed on the system to ensure additivity ofthe components (e.g. Parresol 2001).
The vertical distribution of branchwood surface area wascharacterized on the felled trees by dividing the crown intoten segments of equal length and summing the estimatedbranchwood surface area within each segment. A standardtwo-parameter beta distribution was fitted to the empiricaldistribution for each tree, resulting in estimates of two pa-rameters, a and b, for each tree. A separate beta distributionwas fitted for total branchwood surface area, primary branchaxis surface area, and lateral shoot surface area.
The effects of tree dimensions and SNC intensity on thevertical distribution of branchwood surface area were testedby regressing the estimated beta parameters on potential pre-dictors that included indices of SNC severity. Parameters inthe following system of equations were estimated by seem-ingly unrelated regression to account for cross-equation cor-relation (Kmenta 1997):
ai = β50i + β51i HCM + β52i CLSA + β53i RDDF
+β54i SI + ε51i
bi = β55i + β56i HT + β57i HCM + β58i CL
+β59i TOPHT + ε52i (5)
where ai is the a-parameter for total branchwood surfacearea (i = BSA), primary branch axis surface (i = PRISA), orlateral shoot surface area (i = LBSA), bi is the b-parameterfor the respective surface areas, HCM is the height to crownmidpoint, RDDF is Douglas-fir relative stand density (Curtis1982), TOPHT is stand top height (m), the β5kis are parame-ters to be estimated from the data, ε5ki ∼ N(0, σ 5i
2), and allother variables are defined as above.
The implied vertical distribution of branchwood surfacearea was estimated for a tree of average size across therange in conditions covered by this study to provide agraphical assessment of differences in surface area distribu-tion for total branchwood, primary branch axis, and lateralshoots.
Stand-level analysis
As in the tree-level analysis, random plot effects were in-cluded to estimate total branchwood surface area for eachplot tree using Eq. (4). In addition, stem area was esti-mated by integration of a taper equation developed for SNCimpacted Douglas-fir (Weiskittel and Maguire 2004). Bothbranchwood area and stem area were then expressed as aratio to occupied ground area, analogous to leaf area index(LAI). A system of equations (Kmenta 1997) was then fittedto describe the effect of SNC intensity (and other covari-ates) on branchwood area index (BAI) and stem area index
Springer

662 Trees (2006) 20:657–667
(SAI):
BAI = exp(β600 + β601AGE + β602TOPHT
+ β603FOLRET) + ε61
SAI = exp(β604 + β605TOPHT + β606RDDF
+ β607FOLRET) + ε62 (6)
where AGE is total stand age, FOLRET is mean plot foliageretention as an index of SNC severity, the β6k are parametersto be estimated from the data, and ε6k ∼ N(0, σ 6k
2). Pre-vious estimates of projected leaf area index (LAI) for theseplots (Weiskittel 2003) were converted to all-sided LAI us-ing the values provided in Barclay and Goodman (2000).Tree surface area index (TAI) was estimated as the sum ofleaf, branchwood, and stem surface areas. The trend in TAIacross the examined stand conditions was described with thefollowing equation:
ln(TAI) = β70 + β71RDDF + β72%BADF + β73AGE
+β74FOLRET + ε7 (7)
where %BADF is the percent stand basal area in Douglas-fir,ε7 ∼ N(0, σ 7
2), and all other variables were defined above.
Results
Branch-level
Specific shoot area averaged 2.44 ± 1.29 cm2 g−1, butgenerally increased over successively older age classes(Tables 5 and 6). For a given age class, SSA increased withgreater depth into the canopy and decreased with increas-ing branch diameter and crown length (Table 6). Specificshoot area of the 4-year age class did not differ significantlyfrom that of the ≥ 5-year age class. Unfoliated shoots com-prised a significant portion of the lateral shoot surface area(Table 4).
Branch profile was described well by the variable-exponent taper equation (R2 = 0.91; Table 6). Mean bias andmean absolute bias of the equation were 0.36 ± 3.66 mm and2.31 ± 2.86 mm, respectively. The basal swell of branchesled to slight under-prediction of branch diameter near point
of insertion into the bole. Branch taper was not significantlyaffected by foliated branch length or depth into the canopy.Surface area of the primary branch axis ranged from 4 to8086 cm2 (Table 4) and comprised on average 82 ± 13% oftotal branch surface area.
Total branch surface area (BSA) increased monotonicallywith greater branch diameter and site index, but decreasedwith higher relative position within crown. Surface areaof the primary branch axis and lateral shoots amounted to14 ± 7% and 4 ± 2%, respectively, of the foliage area on thesame branch.
Tree-level
Total surface area of branchwood on individual trees av-eraged 22.5 ± 12.8 m2, and 77 ± 8% of this total was con-tributed by primary branch axes. The total amount of branch-wood surface area on a tree increased with DBH, CL, andCR, but decreased with greater CLSA (Table 6). Compar-ison of a tree with severe SNC (CLSA = 7.5) to a tree ofthe same DBH and crown size but with relatively mild SNC(CLSA = 5.5) suggested that SNC has reduced total branch-wood surface area by an average of 7.4%.
The vertical distribution of branchwood surface area wasrelated to tree size (DBH, HT), crown size (CL, CR), standstructure (TOPHT, RD), site quality (SI), and SNC sever-ity (CLSA; Table 6). Although the beta parameters variedsignificantly by CLSA, the overall change in the vertical dis-tribution of branchwood surface area across the full rangein CLSA was not at all striking. Likewise, the distributionmodes for total, primary branch axis, and lateral shoot sur-face area were remarkably similar (Fig. 1). Lateral (secondorder and higher) shoot surface area was slightly more evenlydistributed than surface area of primary branch axes.
Stand-level
Wood area index (WAI; total surface area per unit groundarea) ranged from 0.9 to 5.5, averaging 1.92 ± 0.89 (Fig.2). Stem surface area comprised 54 ± 13% of the totalWAI. BAI and SAI were positively correlated, but the re-lationship was sufficiently variable that the correlation wasonly marginally significant (p = 0.10). BAI declined withincreasing stand age, and SAI increased with increasingstand density (RDDF; Table 6). For a stand of given age,
Table 5 Specific shoot area(cm2 g−1) for five age classes oflateral shoots on Douglas-firsample branches (n = 309)
Attribute Mean Standard deviation Minimum Maximum
1-year-old age class 2.67 1.57 0.36 7.362-year-old age class 3.08 1.56 1.39 9.553-year-old age class 2.53 1.08 1.15 7.074-year-old age class 2.21 0.97 1.12 6.08≥ 5-year-old age class 1.92 0.78 0.95 5.01
Springer

Trees (2006) 20:657–667 663
Table 6 Model form, parameter estimates, R2 and root mean square error (RMSE) for equations used in to estimate woody surface area inDouglas-fir plantations
Equation Form R2 RMSE
(1) Specific shoot area (cm2 g−1) log(SSA) = 1.1075 + 0.4028 × A1 + 0.3389 × A2 + 0.1671 × A3
+ 0.0427 × DIN CAN − 0.0141 × BD − 0.2467 × CL
0.26 0.28
(2) Primary branch taper di = 0.2425 × BD0.95541
(1−√
Z1−√
0.2
)(−5.1210×√
Z+Z−0.2001+1.6436×log(Z)+1.4159×exp(Z)−0.0023( BD
BL )
)0.91 3.45
(3) Individual branch surface area (cm2) BSA = 7.1556 × BD1.7278 exp(−0.6643 × BHTHT + 0.0142 × SI) 0.94 50.29
(4) Branchwood surface area ofindividual trees (m2)
TPRISA = exp(1.1295 + 0.0348 × DBH + 0.0163 × CL
+ 0.9647 × CR − 0.0352 × CLSA)
TLBSA = exp(0.3438 + 0.0252 × DBH + 1.3759
× CR − 0.0412 × CLSA)
TBSA = exp(1.5136 + 0.0319DBH + 0.0124 × CL
+ 1.0561 × CR − 0.0372 × CLSA)
0.69 7.35
(5a) Beta parameters – totalbranchwood surface area
aBSA = 1.6895 − 0.0306 × CLSA + 0.0001 × TPH − 0.0175 × RD
+ 0.0167 × SI
bBSA = 0.6089 − 0.1670 × HT + 0.1657 × HCM + 0.1097 × CL
+ 0.0232 × TOPHT
0.43 0.99
(5b) Beta parameters – surface area ofprimary branch axes
aPRISA = 1.4892 + 0.0112 × HCM − 0.0294 × CLSA + 0.0212 × SI
bPRISA = 0.0609 − 0.1644 × HT + 0.1559 × HCM + 0.1492 × CL
+ 0.0342 × TOPHT
0.47 0.98
(5c) Beta parameters – surface area oflateral shoots
aLBSA = 1.0071 − 0.0120 × DBH + 0.5499 × DBH
HT− 0.0293 × CLSA
+ 0.9836 × CR
bLBSA = 1.2325 − 0.1193 × HT + 0.1252 × HCM + 0.0579 × CL
0.33 0.99
(6) Branchwood area and stem areaindices
BAI = exp(−1.0043 − 0.0179 × AGE + 0.0288 × TOPHT
+ 0.2436 × FOLRET)
SAI = exp( − 1.899 + 0.2629 × RDDF + 0.1346 × FOLRET)
0.68 0.32
(7) Tree area index ln(TAI) = 0.7697 + 0.1055 × BADF + 0.8389 × %BADF
− 0.0169 × AGE + 0.1449 × FOLRET
0.82 0.18
All parameter estimates are significant at α = 0.05 level.
top height, and relative density, both BAI and SAI increasedsignificantly with greater FOLRET (Table 6). Comparisonof a stand with severe SNC (FOLRET = 1.5) to a relativelyhealthy stand (FOLRET = 3.5) implied that SNC reducedBAI and SAI by 34 and 24%, respectively (Fig. 3). At thestand level, wood surface area comprised 29 ± 12% of to-tal tree surface (WAI as % of TAI). Overall, TAI showed asignificantly positive relationship with RDDF, %BADF andFOLRET, but decreased with age (Table 6, Fig. 4). The re-duction in TAI due to SNC was approximately 25%.
Discussion
Previous studies of woody surface area have been basedon relatively few samples and a very restricted geographicscope. In contrast, the Douglas-fir plantations sampled inthis study covered a wide range in stand and site conditions
that were representative of the northern half of the OregonCoast Range. Although a high degree of natural variation inWAI was evident, a significant amount of this variation wasaccounted by site quality and stand structural attributes thatare routinely manipulated by silvicultural treatment.
The series of models developed for scaling up to stand-level estimates of branchwood area confirm established al-lometric relationships between branch diameter and: branchwoody mass (Maguire 1994; Baldwin et al. 1997), branch fo-liage mass (Xu and Harrington 1998; Kershaw and Maguire1995; Baldwin et al. 1997), and branch foliage area (Ker-shaw and Maguire 1995). Branch position expressed as ei-ther depth into crown or relative crown height has a strongeffect on Douglas-fir foliage mass or area, predominantlybecause the amount of foliage on a branch of given diam-eter declines near the base of the live crown as branchesbecome increasingly suppressed and lose foliage. Althoughdepth into crown emerges as influential in other species as
Springer

664 Trees (2006) 20:657–667
Proportion of total surface area
0.00 0.02 0.04 0.06 0.08 0.10
Rel
ativ
e de
pth
into
cro
wn
0.0
0.2
0.4
0.6
0.8
1.0
Total branch surface areaSurface of primary branch axisLateral shoot surface area
Fig. 1 Relative verticaldistribution of surface areacontributed by primary branchaxes, lateral shoots, and theirsum, as estimated from Eq. (5)for the average sampledDouglas-fir tree
Tree area index (total surface area/ground area)
2 4 6 8 10 12 14 16 18 20 22 24
Woo
d ar
ea in
dex
(tot
al s
urfa
ce a
rea/
grou
nd a
rea)
0
1
2
3
4
5
6
Wood area index (total surface area/ground area)
0 1 2 3 4 5 6
Bra
nch
area
inde
x (t
otal
sur
face
are
a/gr
ound
are
a)
0.4
0.6
0.8
1.0
1.2
1.4
1.6
1.8
(a)
(b)
Fig. 2 Plots of (a) wood area index (WAI; woody surface area/groundarea) over tree area index (TAI; total tree surface area/ground area) and(b) branchwood area index (BAI; total surface area/ground area) overWAI
well, it does not always imply this decline near crown base(Baldwin et al. 1997; Kenefic and Seymour 1999). As in thisDouglas-fir study, however, Baldwin et al. (1997) found thatmuch of the variation in woody surface area of loblolly pinebranches could be accounted for by branch diameter and itsdepth into the crown.
Halldin (1985) found that, for a given height in the crown,lateral shoot and primary branch surface area were 5 and 13%of the needle area, remarkably close to the values of 4 and14% for the Douglas-fir sample branches. Published val-ues for specific shoot area (SSA) are uncommon; however,Mohren (1987) reported a fixed value of 0.3 m2 kg−1 forthe ratio of branch surface area to dry weight in Douglas-firgrowing in the Netherlands. His value included both lateralshoots and the primary branch axes, so was not directly com-parable to the mean SSA obtained in this study (2.44 cm2 g−1
or 0.244 m2 kg−1). Furthermore, SSA was found to be highlyvariable within and between Douglas-fir trees in the OregonCoast Range, so depending on the application, considerableadvantage may be gained by accounting for this variationin SSA. Specific shoot area increased with increasing depthinto crown for at least several reasons. First, the proportionof dead shoots increased with depth into crown and, be-cause they are in various stages of decay, their mass wasdeclining more quickly than their surface area. The resultson vertical distribution of surface area also suggested that,through the bottom third of the crown, the proportion of to-tal branchwood surface area contributed by primary branchaxes (low surface area to mass ratio) declined while the con-tribution from lateral shoots (high surface area to mass ratio)increased (Fig. 1). Similarly, the decline in SSA with suc-cessively older age classes paralleled the increase in average
Springer
Trees (2006) 20:657–667 665
SAI
0 1 2 3 4 5
BA
I
0.4
0.6
0.8
1.0
1.2
1.4
1.6
1.8
AGE (yrs.)
0 10 20 30 40 50 60 70
BA
I
0.4
0.6
0.8
1.0
1.2
1.4
1.6
1.8
Douglas-fir basal area (m2 ha-1)
0 10 20 30 40 50 60 70 80
BA
I
0.4
0.6
0.8
1.0
1.2
1.4
1.6
1.8
Plot mean foliage retention (yrs.)
1.0 1.5 2.0 2.5 3.0 3.5 4.0 4.5 5.0
BA
I
0.4
0.6
0.8
1.0
1.2
1.4
1.6
1.8
(a) (b)
(c) (d)
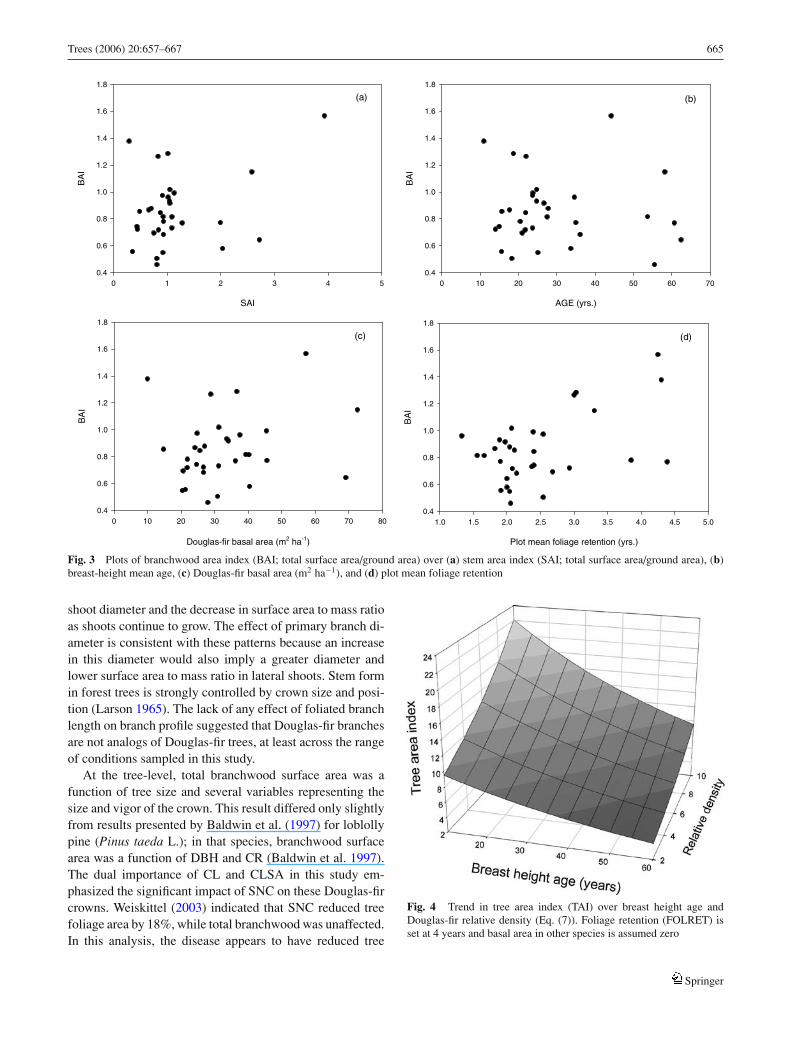
Fig. 3 Plots of branchwood area index (BAI; total surface area/ground area) over (a) stem area index (SAI; total surface area/ground area), (b)breast-height mean age, (c) Douglas-fir basal area (m2 ha−1), and (d) plot mean foliage retention
shoot diameter and the decrease in surface area to mass ratioas shoots continue to grow. The effect of primary branch di-ameter is consistent with these patterns because an increasein this diameter would also imply a greater diameter andlower surface area to mass ratio in lateral shoots. Stem formin forest trees is strongly controlled by crown size and posi-tion (Larson 1965). The lack of any effect of foliated branchlength on branch profile suggested that Douglas-fir branchesare not analogs of Douglas-fir trees, at least across the rangeof conditions sampled in this study.
At the tree-level, total branchwood surface area was afunction of tree size and several variables representing thesize and vigor of the crown. This result differed only slightlyfrom results presented by Baldwin et al. (1997) for loblollypine (Pinus taeda L.); in that species, branchwood surfacearea was a function of DBH and CR (Baldwin et al. 1997).The dual importance of CL and CLSA in this study em-phasized the significant impact of SNC on these Douglas-fircrowns. Weiskittel (2003) indicated that SNC reduced treefoliage area by 18%, while total branchwood was unaffected.In this analysis, the disease appears to have reduced tree
Fig. 4 Trend in tree area index (TAI) over breast height age andDouglas-fir relative density (Eq. (7)). Foliage retention (FOLRET) isset at 4 years and basal area in other species is assumed zero
Springer
666 Trees (2006) 20:657–667
branchwood surface area by nearly 8%, a change that maybe related to the decline in branch size and reduction in num-ber of secondary lateral shoots (Weiskittel 2003). Weiskittelet al. (2006) also found that the mode of vertical foliage dis-tribution shifted significantly upward with increasing SNC.A similar trend was observed for branchwood surface area,but the relative change in the distribution was smaller thanobserved for foliage biomass. Baldwin et al. (1997) foundthat branchwood surface area tended to peak close to thecrown midpoint, while the peak in this analysis was slightlylower in the crown. This is most likely a function of thedifferences in shade tolerance between the two species.
At the stand-level, values of WAI and the proportionof TAI that it accounts for have varied significantly, evenfor a single species (Breda 2003). For example, Barclayet al. (2000) found WAI/TAI to be 41% in a 24-year-oldDouglas-fir plantation, while Chen and Black (1991) reporta WAI/TAI value of 8% for a similar Douglas-fir stand. Inthis study, WAI/TAI expressed as a percentage varied from9 to 49% and showed a weak negative linear relationshipwith TAI. Increasing SNC severity also had a significantlypositive effect on this proportion due to premature loss offoliage.
In the sampled Douglas-fir plantations, branches and mainstem were nearly equal contributors of surface area to WAI(12 ± 3% and 17 ± 11%, respectively, of TAI). Smolanderand Stenberg (1996) likewise indicated that branches andstem contributed approximately equal amounts (8 and 6%,respectively) to stand-level TAI. Total WAI varied in thisstudy from 0.91 to 5.49, with the mean of 1.92 being verysimilar to that reported in Barclay et al. (2000). WAI inthis study pertained to only live primary branches so inclu-sion of attached dead branches would raise the estimatesslightly. Hagihara and Yamaji (1993), for example, foundthat dead branches comprised 5% of TAI in Chamaecyparisobtusa.
Tree area index (TAI) increased with Douglas-fir relativedensity because an increase in the latter implied fuller siteoccupancy due either to inherently higher carrying capacityof some sites or to a lighter thinning regime in some of theintensively managed stands. The decline in TAI with age wasmore surprising, but is consistent with some models of standdevelopment that propose a slow decline in leaf area aftera very early peak. If branchwood area parallels this trend,the decline with age is probably caused by the same mech-anism, for example, crown separation caused by physicalabrasion during wind sway (Rudnicki et al. 2003). In un-managed stands, or stands managed at maximum stand den-sity, the greater penetration of solar radiation and through-fall precipitation to the forest floor as the stand loses leafand branchwood area is most likely a major cause of theshift from the stem exclusion stage of stand development tothe understory re-initiation stage (Oliver and Larson 1996).
The variation in interception of light and precipitation iseven greater among stands managed at a wide range of standdensities. In these managed forests, therefore, a clearer un-derstanding of canopy responses to silvicultural treatment,and corresponding insight into mechanisms by which thesetreatments influence forest productivity and ecosystem func-tion, are key to achieving desired outcomes of managementactivities.
Conclusion
The procedure for deriving LAI from TAI is still a muchdebated question, largely because few direct measurementshave been made to validate any generalizations. While stemand branches may be neglected in indirect estimates of LAIfor fully leaved canopies, other corrections may be requiredfor partially canopies defoliated by insects, disease, or pollu-tion, or for species that retain a large number of dead brancheson the lower stem (Kucharik et al. 1998). Douglas-fir plan-tations with severe SNC definitely meet both conditions,so direct estimates of woody surface area at the individualbranch-, stem-, and stand-levels were the only way to accountfor the various sources of surface area reliably. SNC signifi-cantly reduced both branchwood and stem surface area at thetree- and stand-levels. Equations to predict branchwood sur-face area from easily measurable tree dimensions will helpbuild an information base on stand surface area and its spatialdistribution, as well as on changes brought about by naturalstand dynamics and silvicultural treatments. These equationsalso provide reliable estimates of branchwood to needle sur-face area ratios in lieu of detailed and costly measurementsfrom intensive study sites. Future progress in process-basedmodeling of Douglas-fir plantation growth, particularly inregions with varied stand health conditions or wide variationin silvicultural treatments and regimes, will require inclusionof WAI as a structural attribute because it has clear implica-tions for numerous ecophysiological processes such as woodtissue respiration and absorption of solar radiation that wouldotherwise be available for photosynthetic tissues. Woody sur-face area also has important ecological functions, includingservice as a substrate for numerous canopy-dwelling organ-isms that contribute to forest biodiversity.
Acknowledgments We gratefully acknowledge the field and lab assis-tance from Chet Behling, Rei Hayashi, Doug Mainwaring, Mfon Okon,and Joseph Weiskittel. This study was funded by the Swiss Needle CastCooperative, the Oregon Department of Forestry, and the USDA-ForestService Forest Health Monitoring program. Special thanks to HamptonTree Farms, Longview Fiber, Oregon Department of Forestry, PlumCreek Timber Company, Green Diamond (formerly Simpson Timber),Starker Forests, and USDA Forest Service for granting permission todestructively sample trees. Thanks to Greg Johnson, Sean Garber, andtwo anonymous reviewers for helpful comments on earlier drafts of thismanuscript.
Springer
Trees (2006) 20:657–667 667
References
Baldwin BC, Peterson KD, Burkhart HE, Amateis RL, Doughterty PM(1997) Equations for estimating loblolly pine branch and foliageweight. Can J For Res 27:918–927
Barclay HJ, Goodman D (2000) Conversion of total to projected leafarea index in conifers. Can J Bot 78:447–454
Barclay HJ, Trofymow JA, Leach RI (2000) Assessing bias from bolesin calculating leaf area index in immature Douglas-fir with theLI-COR canopy analyzer. Agric For Meteorol 100:255–260
Bosc A, Grancourt AD, Loustou D (2003) Variability of stem andbranch maintenance respiration in a Pinus pinaster tree. Tree Phys-iol 23:227–236
Breda N (2003) Ground-based measurements of leaf area index: areview of methods, instruments and current controversies. J ExpBot 54:2403–2417
Bruce D (1981) Consistent height-growth and growth-rate estimates forremeasured plot. For Sci 4:711–725
Chen JM, Black TA (1991) Measuring leaf area index of plant canopieswith branch architecture. Agric For Meteorol 57:1–12
Curtis RO (1982) A simple index of stand density for Douglas-fir. ForSci 28:92–94
Doster RH, James DA (1998) Home range size and foraging habi-tat of red-cockaded woodpeckers in the Ouachita Mountains ofArkansas. Wilson Bull 110:110–117
Fassnacht KS, Gower ST, Norman JM, McMurtrie RE (1994) Acomparison of optical and direct methods for estimating fo-liage surface area index in forests. Agric For Meteorol 71:183–207
Flewelling JW, Pienaar LV (1981) Multiplicative regression with log-normal errors. For Sci 27:281–289
Hagihara A, Yamaji K (1993) Interception of phhotosynthetic pho-ton flux density by woody elements in a hinoki (Chamaecy-paris obtusa [Sieb. et Zucc.] Endl.) stand. Ecol Res 8:313–318
Halldin S (1985) Leaf and bark area distribution in a pine forest. In:Hutchinson BA, Hicks BB (eds) The forest–atmosphere interac-tion: proceedings of the forest environmental measurements con-ference. D. Reidel, Boston, MA, pp 39–58
Ingram SW, Nadkarni NM (1993) Composition and distribution ofepiphytic organic matter in a neotropical cloud forest, Costa Rica.Biotropica 25:370–383
Jennings DT, Diamond JB, Watt BA (1990) Population densities ofspiders (Araneae) and spruce budworms (Lepidptera tortricidae)on foliage of balsam fir and red spruce in east-central Maine. JArachnol 18:181–193
Johnson NL, Kotz S, Balarishnan N (1995) Continuous univariate dis-tributions, vol 2. In: Wiley series in probability and statistics.Wiley-Interscience, Hoboken, NJ, p 752
Jones DD (1979) The budworm site model. In: Norton GA, Holling CS(eds). Pest management: proceedings of an international confer-ence, 25–29 October 1976. Pergamon Press, New York, NY, pp91–156
Kanaskie A, McWilliams M, Sprengel K, Overhulser D (2004) Swissneedle cast aerial surveys, 1996 to 2004. In: Mainwaring, D (ed)Swiss needle cast cooperative 2004 annual report. Oregon StateUniversity, College of Forestry, Corvallis, OR, pp 7–11
Keim RF (2004) Attenuation of rainfall by forest canopies. Ph.D. dis-sertation, Oregon State University, Corvallis, OR, p 150
Kenefic LS, Seymour RS (1999) Leaf area prediction modelsfor Tsuga canadensis in Maine. Can J For Res 29:1574–1582
Kershaw JA, Maguire, DA (1995) Crown structure in western hemlock,Douglas-fir, and grand fir in western Washington: trends in branch-level mass and leaf area. Can J For Res 25:1897–1912
Kmenta J (1997) Elements of econometrics, 2nd edn. University ofMichigan, Ann Arbor, MI
Kozak A (1988) A variable-exponent taper equation. Can J For Res18:1363–1368
Kucharik CJ, Norman JM, Gower ST (1998) Measurements of brancharea and adjusting leaf area index indirect measurements. AgricFor Meteorol 91:69–88
Larson PR (1965) Stem form in forest trees. Forest Science MonographMaguire DA (1994) Branch mortality and potential litterfall from
Douglas-fir trees in stands of varying density. For Ecol Man 70:41–53
Maguire DA, Kanaskie A (2002) The ratio of live crown length tosapwood area as a measure of crown sparseness. For Sci 48:93–100
Mohren GMJ (1987) Simulation of forest growth, applied to Douglas-fir stands in the Netherlands. Ph.D. dissertation, Wagenin-gen Agricultural University, Wageningen, The Netherlands,p 175
Oker-Blom P, Kaufmann MR, Ryan MG (1991) Performance of canopylight interception model for conifer shoot, trees, and stands. TreePhysiol 9:221–243
Oliver CD, Larson BC (1996) Forest stand dynamics. Wiley, New York,p 520
Parresol BR (2001) Additivity of nonlinear biomass equations. Can JFor Res 31: 865–878
Pierce V, Grubb TC (1981) Laboratory studies of foraging in four birdspecies of deciduous woodland. Auk 98:307–320
Robinson AP, Wykoff WR (2004) Inputting missing height measure-ments using a mixed-effects modeling strategy. Can J For Res34:2492–2500
Rudnicki M, Lieffers VJ, Silins U (2003) Stand structure governs thecrown collisions of lodgepole pine. Can J For Res 33:1238–1244
Smolander H, Stenberg P (1996) Response of LAI-2000 estimates tochanges in plant surface area index in a Scots pine stand. TreePhysiol 16:345–349
Weiskittel AR, Maguire DA (2004) Influence of Swiss needle cast onDouglas-fir stem properties. In: Mainwaring D (ed) Swiss nee-dle cast cooperative 2004 annual report. Oregon State University,College of Forestry, Corvallis, OR, pp 91–97
Weiskittel AR (2003) Alterations in Douglas-fir crown structure, mor-phology, and dynamics imposed by the Swiss needle cast diseasein the Oregon Coast Range. M.S. thesis, Oregon State University,Corvallis, OR, p 389
Weiskittel AR, Maguire DA, Garber SM, Kanaskie A (2006) Influenceof Swiss needle cast on foliage age class structure and verticaldistribution in Douglas-fir plantations of north coastal Oregon.Can J For Res 36:1497–1508
Whittaker RH, Woodwell GM (1967) Surface area relations of woodyplants and forest communities. Am J Bot 54:931–939
Xu M, Harrington TB (1998) Foliage biomass distribution of loblollypine as affected by tree dominance, crown size, and stand charac-teristics. Can J For Res 28:887–892
Springer