BPS Strategic Plan 2010-2014 - | PARIS21
82
-
Upload
khangminh22 -
Category
Documents
-
view
0 -
download
0
Transcript of BPS Strategic Plan 2010-2014 - | PARIS21


BPS Strategic Plan2010–2014

BPS Strategic Plan 2010-2014 ISBN : ...................... Publication No. : ...................... BPS Catalogue : ...................... Book Size : 17 cm x 24 cm Total Pages : 80 pages Manuscript : Division of Planning Cover Design : Subdirectorate of Statistics Publication Publish by : BPS-Statistics Indonesia Printed by : CV. Nario Sari May be cited with reference to the source

i
Abbreviation And Acronyms
ADHB Current Market Prices ADHK Constant Market Prices ASEAN Association of Southeast Asian Nations AusAid The Australian Agency for International Development BLT Unconditional Cash Transfer BPA Business Process Analysis BPK The Indonesian State Audit Board BPR Business Process Reengineering BPS BPS-Statistics Indonesia BRS Official Statistics Announcements DIPA Budget Implementation Entry List EPPD The Evaluation Guidelines of Regional Government EuroStat Statistical Office of the European Communities HPB Wholesale Price IHK Consumer Price Index IKK Wholesale Construction Price Index JICA Japan International Cooperation Agency KSK Statistics District Coordinating Officer LAKIP Report on Accountability and Performance of
Government Institutions LHKPN Public Officials' Wealth Reports MDG’s Millennium Development Goals MFSM Monetary and Financial Statistics Manual NAD Flow of Funds Accounts NSO National Statistical Offices NSPK Norms, Standards, Procedures, and Criteria NTP Farmers Terms of Trade PBB United Nations PDB Gross Domestic Product PDRB Gross Domestic Regional Product Perpres Presidential Regulation PKH Conditional Cash Transfer Podes Village Potential PP Government Regulation Program P2A2N Oversight and Accountability Improvement of
Apparatus State Program Program P2IS Program of Providing and Statistical Information
Service Program PSPA Facilities and Infrastructure Improvement Program
Apparatus

ii
Pusdiklat Education and Training Center Renstra Strategic Plan RPJM Medium Term Development Plan SAK Accountability and Performance System SAKERNAS National Labor Force Survey SAKIP Accountability and Performance of Government
Institutions System SBH Cost of Living Survey SDM Human Resources Si Rusa The statistical clearing house system SNA System of National Account SNSE Social Accounting Matrix SSN National Statistics System Statcap CERDAS
Statististical Capacity Building – Change and Reform for Development of Statistics in Indonesia
STIS Institute of Statistics SUSENAS National Socio-Economic Survey TIK Information And Communication Technologies UNDP United Nation Development Program UNFPA United Nation Population Fund UNICEF United Nation Children’s Fund UNSD United Nations Statistical Division USAid United State Agency for International Development UU Law of The Republic of Indonesia WDP Orderly Administration And Qualified Opinion WTP Orderly Administration And Unqualified Opinion

iii
Preface
ood planning is the starting point for determining the strategic direction of policy through the formulation of appropriate programs and activities. One key to the success of planning is the availability of data and statistics that are reliable and trustworthy.
The quality of data and statistics are references for all parties in formulating policy, conduct monitoring, and evaluating programs in order for a predetermined target activity to be achieved effectively and efficiently. Strategic Plan for Statistics Indonesia (Renstra BPS) Year 2010-2014 is a plan for statistical development in the field during the next five years that is prepared to consider strategic changes, particularly with regard to the potentials, opportunities, challenges, and problems of BPS-Statistics Indonesia. Strategic Plan formulated for the guidance and direction for all levels of the BPS-Statistics Indonesia and the stakeholders in an effort to achieve statistical development goals that have been determined. Recognition and gratitude for all the input and contributions of all parties who have participated in realizing BPS-Statistics Indonesia’s Strategic Plan 2010-2014. Hopefully, this document is beneficial for all parties concerned to strengthen the National Statistics System.
Jakarta, February 2010 Director General,
Dr. Rusman Heriawan
G

iv

v
Executive Summary
has the task of providing quality statistical data and
information: complete, accurate, current, ongoing, and
relevant for users of data. Quality statistical data and
information serves as references for policy formulation efforts in
planning, monitoring and evaluating programs to achive the set goals
with precision, so that development goals, including improving people's
welfare, can be achieved effectively.
Presidential Regulation No. 5 of 2010 set the duty of the Ministry /
Agency to prepare a Strategic Plan from 2010 to 2014 which includes
the vision and mission of the Ministry / Agency that has been aligned
with the vision and mission National Medium-Term Development Plan
(Rencana Pembangunan Jangka Menengah Nasional-RPJMN) 2010-
2014. Strategic Plan for Statistics Indonesia (Rencana strategis-Renstra
BPS) Year 2010-2014 have been prepared based on Law No. 16 of
1997 on Statistics and the National Development Plan of 2010-2014,
and considers input from stakeholders. Strategic Plan/Renstra BPS
Year 2010-2014 serves as a reference for all lines of Statistics
Indonesia and its stakeholders, in particular for implementing statistical
activities for national development in the field of statistics over the next
five years. Strategic Plan/Renstra BPS also serves as the basis for the
BPS-Statistics Indonesia in implementing the obligations as a provider
of data and statistical information.
By considering the various strengths and internal weaknesses and
opportunities and challenges faced by outside parties with proactive
premise, then the vision of BPS-Statistics Indonesia 2010-2014 is "The
vi
Agent of Trustworthy statistical data for all". National development in the
field of statistics is directed to be able to accommodate a growing
number of challenges, such as reform that supports transparency,
regional autonomy which contain challenges of diverse statistical data
and information at the small area level, development of information
technology which leads to increased ease of access to data and
information for society, and observe the readiness of the organizers of
human resources statistics and trends of restrictions on access to data
from respondents / object of statistical activity.
Based on the BPS-Statistics Indonesia vision, the mission of national
development statistics Indonesia include: 1). Strengthening the
foundation of the constitutional and operational statistics institute for the
collection of statistics to be effective and efficient; 2). Creating a
competent individual and professional in the field of statistics, supported
by the use of advanced information technology for the advancement
development of Statistics in Indonesia; 3). Improving the application of
classification standards, concepts and definitions, measurement, and
statistical code of ethics that are universal in every collection of
statistics, 4). Improving the quality of statistical information services for
all parties; and 5). Improve the coordination, integration, and
synchronization of statistical activities organized by the government and
private institutions, within the framework of the National Statistics
System (NSS) that is effective and efficient.
Strategic objective of Indonesia's national statistical development is
formulated as follows: 1). Availability of data and statistical information
that is complete, accurate, and timely in all areas of development and to
improve service for users of statistical data and information, 2). The
effective and efficient implementation of Statistics Indonesia
organizational structure in realizing good governance framework and
improving supervision and performance accountability of BPS-Statistics
vii
Indonesia apparatus; 3). Increased human resource capacity in
knowledge, mastery of science, statistical methods, and information
technology in order to refine methods of collecting, processing and
dissemination of statistics; 4). Increased cooperation among statistical
agencies / research domestically and internationally on the basis of
mutual respect for independence that is profitable in order to produce
statistical data and information of international quality, 5).
Implementation of NSS in supporting the implementation of duties and
functions of good statistical institutions in government agencies, or
private and public institutions; and 6). Increasing the quality and quantity
of physical infrastructure.
The main objective in national development in the field of statistics for
the next five years is the increasing availability of quality data and
statistical information and service excellence in order to realize a
qualified, effective, and efficient NSS. For that, Statistics Indonesia
needs to improve coordination with relevant agencies, integration,
synchronization, and standardization of statistical activities.
Based on the vision, mission, goals and targets, the bureau set a
strategy that includes: a) Data Quality and Diversity Improvement
Strategy Division; b) Information and Communication Technology (ICT);
c) Human Resource Capacity and Capabilities and Institutional Structure
Improvement.
As a non-Ministry Government Institution, Statistics Indonesia has one
Technical Program and three Generic Programs. The Technical
Program is Statistical Information Provision and Service Program
(P2IS). The BPS-Statistics Indonesia Generic Program include: (i)
Program Management Support and Implementation of other Technical
Activities BPS-Statistics Indonesia, (ii) Facilities and Infrastructure
Improvement Program Apparatus (Program Peningkatan Sarana dan

viii
Prasarana Aparatur-PSPA) BPS-Statistics Indonesia, (iii) Accountability
Improvement Program Oversight and Reform (Program Pengawasan
dan Peningkatan Akuntabilitas Aparatur Negara-P2A2N) BPS-Statistics
Indonesia.
Given the important role of data and statistical information in the process
of planning, monitoring, and evaluation of national development as well
as for society, BPS-Statistics Indonesia determine strategies
strengthening data and statistical information carried by rearranging
institutions within the framework of achieving good governance and
clean government. Bureaucratic reform is intended to increase the
quality of data, by building support pillars which include architecture
development and improvement of facilities and infrastructure to support
ICT, and to improve capacity and quality of human resources.This
commitment is defined as the anticipation of global and regional
challenges in the period five years into the future.

ix
TABLE OF CONTENTS
Halaman
ABBREVIATION AND ACRONYMS .................................................. i
PREFACE .......................................................................................... iii
EXECUTIVE SUMMARY .................................................................... v
TABLE OF CONTENTS ...................................................................... ix
CHAPTER I. INTRODUCTION ......................................................... 1
A. Background ........................................................................... 1
B. General Conditions ............................................................... 3
C. Potential and Problems ........................................................ 5
CHAPTER II. BPS-Statistics Indonesia VISION, MISSION,
AND OBJECTIVES .................................................... 11
A. BPS -Statistics Indonesia Vision .......................................... 11
B. BPS-Statistics Indonesia Mission ......................................... 12
C. Objectives ............................................................................. 14
D. BPS-Statistics Indonesia Strategic Objectives ..................... 15
CHAPTER III. STRATEGY AND POLICY DIRECTIONS .................. 17
A. Strategy and National Policy Directions ............................... 17
B. Strategy and Policy of BPS-Statistics Indonesia .................. 18
C. Programs and Activities ........................................................ 33
CHAPTER IV. CLOSING .................................................................. 43
APPENDIX

x
TABLES
Table 1. Key Performance Indicators, BPS-Statistics Indonesia
2010-2014 Priority Activities .............................................. 37
Table 2. 2010-2014 Budget Allocation By Program ..................... 42
APPENDIX
Appendix 1. Development Targets for the year 2010-2014
BPS-Statistics Indonesia .............................................. 47
Appendix 2. Development Funding Needs Year 2010-2014
BPS-Statistics Indonesia .............................................. 64
National Statistics System ........................................................ 67

BPS - STATISTICS INDONESIA
THE REGULATION OF CHIEF STATISTICIAN OF BPS-STATISTICS INDONESIA NUMBER 19 YEAR 2010
ON THE STRATEGIC PLAN OF BPS-STATISTICS INDONESIA YEARS 2010-2014
CHIEF STATISTICIAN OF BPS-STATISTICS INDONESIA,
Considering : that in order to fulfill the needs of statistical data, related to the quality,
complete, accurate, relevant, up to date and continuous, to be used as basic reference in planning the national development, therefore BPS-Statistics Indonesia has to establish a strategic plan comprising a vision, missions, objectives, strategies, policies, programs and activities for the next five-years through the Regulation of Chief Statistician of BPS-Statistics Indonesia;
In view of : 1. Law Number 16 Year 1997 on Statistics (State Gazette Year 1997
Number 39, Supplement to State Gazette Number 3683);
2. Law Number 25 Year 2004 on the National Development Planning System (State Gazette Year 2004 Number 104, Supplement to State Gazette Number 4421);
3. Law Number 17 Year 2007 on the National Long-Term Development Planning Years 2005-2025 (State Gazette Year 2007 Number 33, Supplement to State Gazette Number 4700);
4. Government Regulation Number 51 Year 1999 on Statistical Implementation (State Gazette Year 1999 Number 96, Supplement to State Gazette Number 3854);
5. Presidential Decree Number 86 Year 2007 on BPS-Statistics Indonesia;
6. Presidential Decree Number 5 Year 2010 on the National Middle Term Development Planning Years 2010-2014;
7. Decree of Chief Statistician of BPS-Statistics Indonesia Number 121 Year 2001 on the Organization and the Work Procedures of BPS-Statistics Indonesia Regional Offices;
8. Regulations of Chief Statistician of BPS-Statistics Indonesia Number 7 Year 2008 on the Organization and Work Procedures of BPS-Statistics Indonesia;
DRAFT 120111

HAS DECIDED:
To stipulate : THE REGULATION OF CHIEF STATISTICIAN OF BPS-STATISTICS INDONESIA ON THE STRATEGIC PLAN OF BPS-STATISTICS INDONESIA YEARS 2010-2014.
Article 1 The Strategic Plan of BPS-Statistics Indonesia Years 2010-2014, hereinafter in shall be referred to as BPS Strategic Plan Years 2010-2014, consisting of the overview of the national statistical condition, vision, missions, objectives, strategies, and policy directions of the statistical development, along with the programs and activities of BPS-Statistics Indonesia.
Article 2 (1) BPS Strategic Plan Years 2010-2014 is composed to support
realization of the objectives and the targets in the National Middle-Term Development Planning Years 2010-2014 in the field of statistics and used as the foundation and guidance in organizing the Government Work Plan in the field of statistics for 2010-2014 period.
(2) BPS Strategic Plan Years 2010-2014 as stated in Article (1) is served as the guideline for BPS vertical institution in establishing its strategic plan in each BPS vertical institution.
(3) The establishment of the Strategic Plan in BPS vertical institution Years 2010-2014 needs to consider the Regional Middle-Term Development Plan.
Article 3
The BPS Strategic Plan Years 2010-2014 is as stated in the Attachment to this Regulation.
Article 4 This regulation shall be initiated on the date of stipulation.
Stipulated in Jakarta
On 1 February 2010
Chief Statistician of BPS-Statistics Indonesia
Dr. RUSMAN HERIAWAN NIP. 19511104 197403 1 001

1
CHAPTER I
INTRODUCTION
A. Background
BPS-Statistics Indonesia has a duty to provide quality statistical
data and information: complete, accurate, current, ongoing, and relevant
for users of data. Quality statistical data and information are references
for efforts in policy formulation in planning, monitoring and evaluating
programs objectives, so that development goals, including improving
people's welfare, can be achieved effectively.
The Presidential Regulation No. 5 of 2010 stipulates that the
Medium Term Development Plan (Rencana Pembangunan Jangka
Menengah-RPJM) of the 2010-2014 National Year is a breakdown of the
vision, mission and programs of the President as a result of the General
Election of 2009. Thus, the Strategic Plan (Rencana Strategis-Renstra)
for 2010-2014 compiled by Ministries/Agencies must refer to the National
Development Plan of 2010-2014. The Presidential Regulation (Peraturan
Presiden-Perpres) No. 5 of 2010 also set the obligation for Ministries /
Agencies to prepare a Strategic Plan for 2010-2014 to develop the vision
and mission of the Ministry/Agency who are aligned with the vision and
mission of RPJMN 2010-2014. With the Strategic Plan as the basis for
annual work plan of Ministries/Institutions, the implementation of
programs and activities will become more targeted, effective, and
efficient.

2
The 2010-2014 Strategic Plan for BPS-Statistics Indonesia has
been prepared based under Law No. 16 of 1997 on Statistics and the
National Development Plan 2010-2014, and considered inputs from
stakeholders. In accordance to Presidential Regulation No. 5 2010, BPS
Strategic Plan 2010-2014 is a document of national development
planning in the field of statistics for the period of 2010-2014. BPS
Strategic Plan 2010-2014 is to serve as a general reference for all
positions within BPS-Statistics Indonesia and its stakeholders, in
particular for implementing statistics in national development over the
next five years. The Strategic Plan is also the basis for BPS-Statistics
Indonesia in implementing the obligations as a provider of data and
statistical information. To achieve the development goals established in
the Strategic Plan, more details need to be explained in an annual plan
through The Work Plan of the Ministry/Agency (Rencana Kerja-Renja K /
L).
The availability of data and statistical information that is diverse,
timely, and presented sooner, is demanded by the community. This is a
challenge for BPS-Statistics Indonesia and the organizers of statistical
activities to always improve the quality of the provision of data and
statistical information as well as quality of service. As a result, BPS-
Statistics Indonesia set a vision, mission, strategy, policies, programs,
and main activities of development in the field of statistics contained in
the BPS-Statistics Indonesia Strategic Plan 2010-2014.

3
B. General Conditions
In line with the implementation of performance-based planning and
budgeting, strengthening monitoring and evaluation measures the
implementation of development planning is a strategic choice. The
planning process requires quality statistical data and information.
Therefore, the availability of reliable data and statistical information is
one key to the success of planning. Quality data and statistical
information are not just a referral required by the government but also
private citizens and the community for business development and
various other needs.
In order to meet the needs of data and statistical information and
the mandate of Law no. 16 of 1997 on Statistics, BPS-Statistics
Indonesia has issued the Decree of the Head of BPS-Statistics Indonesia
No. 5 of 2000 on the National Statistics System (Sistem Statistik
Nasional-SSN). The purpose of the issuance of the Decree of the Head
of BPS-Statistics, are namely:
a) so the organizers of statistical activities are able to optimally utilize
available resources;
b) to avoid possible duplication of activities by the organizers of the
statistics; and
c) in order to create a National Statistical System that is reliable,
effective, and efficient.
One of the efforts to realize the SSN, among others, is coordination
and cooperation with government institutions and communities, both at
central and regional levels, as well as with international institutions.
Coordination and cooperation is implemented in partnership with
4
anticipation and utilizing the development of science and technology,
especially information and communication technology (ICT). Networking
is a force that continues to be developed within the framework of national
development in the field of statistics.
Society demands the availability of data and statistical information
that is diverse, detailed, easily understood, and timely. Those demands
of data and statistical information have not been fully met, but gradual
continued efforts are underway to achieve their availability. In the next
five years there will be a Program to Supply Statistical Information to
strengthen the national development data and information system in line
with the National Development Plan 2010-2014, as set forth in Book II of
the National Development Plan 2010-2014, Chapter XI. Strengthening
data and information system for development has a strategic role in
supporting the successful attainment of national development.
Development efforts taken by BPS-Statistics Indonesia up until
2009, has produced a variety of socio-economic data and indicators.
socio-economic indicators are generated through the Population Census,
Census of Agriculture, Economic Census, and various surveys in the field
of socio-economics and demography. All socio-economic indicators were
able to be generated on a regular basis or within a certain time.
BPS-Statistics Indonesia also meet government requirements that
are not previously scheduled, including Socio-Economic Data 2005, Data
Collection Program of Social Protection 2008, and Farm Data Collection
2009 to support specific programs, such as Unconditional Cash Transfer
(Bantuan Langsung Tunai-BLT), the Conditional Cash Transfer (Program
Keluarga harapan-PKH), and other similar programs.

5
BPS-Statistics Indonesia convey the results of statistical activities
to the public through press releases of Official Statistics Announcements
(Berita Resmi Statistik-BRS), which includes important statistical
information such as inflation, exports, imports, tourism, economic growth,
paddy productions, poverty, and unemployment. In addition, BPS -
Statistics Indonesia also disseminates statistical data and information
through print and electronic media.
In supporting the creation of a clean and authoritative government,
surveillance is conducted on the use of budget that becomes the
responsibility of BPS-Statistics Indonesia intensively in order to prevent
waste of resources. Surveillance is done by increasing supervision on
financial administration and management of goods in order for orderly
administration and unqualified opinion (Wajar Tanpa Pengecualian-WTP)
to the Financial Reports.
C. Potentials and Problems
C.1. Potentials Owned
Institutionally, BPS-Statistics Indonesia has been confirmed as a
stand alone Government agency through Perpres No. 86 of 2007. BPS-
Statistics Indonesia and BPS-Statistics Indonesia District/Municipality are
an integral part of BPS-Statistics Indonesia the Republic of Indonesia as
a whole. Perpres ensure vertical coordination in the implementation of
statistical activities, especially to supply and provide basic statistical data
and information both at central and regional levels.
Government Regulation (Peraturan Pemerintah-PP) No. 38 of 2007
on the Division of Government Affairs between the Central Government,

6
Provincial Government and District/Municipality, puts BPS-Statistics
Indonesia in a strategic position in developing the National Statistical
System, both at central and local levels. BPS-Statistics Indonesia
became the agency responsible in the provision of data and basic
statistical information, and performs the functions of coordination and
supervision on the implementation of sectoral statistics by the Provincial
Government and District/Municipality. To that end, BPS-Statistics
Indonesia issued a Head of BPS -Statistics Indonesia Regulation No. 9 /
2009 on the Implementation of the Sectoral Statistics by Local
Government is to establish norms, standards, procedures, and criteria
(NSPK).
In terms of developing human resources (HR) quality, BPS -
Statistics Indonesia College, the Institute of Statistics (Sekolah Tinggi
Ilmu Statistik-STIS), manages to produce professional statistical
resources every year. BPS-Statistics Indonesia also has a Center for
Statistics Education and Training, which serves to develop human
resource competencies within BPS-Statistics Indonesia or other
government agencies. The units are potentials that are constantly being
developed to overcome the statistical limitations of human resources,
particularly in the Eastern Region of Indonesia. In addition, BPS-
Statistics Indonesia is a functional institution builder for statisticians and
computer administration of functional positions.
The rapid progress of information and communication technologies
(ICTs) is a potential for supporting the activities of BPS-Statistics
Indonesia. Tools and equipment for the purposes of data collection, data
processing, and dissemination of advanced ICT-based data owned by

7
BPS-Statistics Indonesia is a potential to improve quality and accelerate
the availability of data and statistical information.
Developments are also underway for external potentials. Today,
data and statistical information is officially used as a reference for
government policy formulation, planning, monitoring, and evaluation of
development. Government Regulation No. 6 of 2008 regarding the
Evaluation Guidelines of Regional Government (EPPD), which contains a
number of key indicators to evaluate the performance of regional
autonomy, requires the availability of data and statistical information on
the smallest level of government territory.
In line with these conditions, nationwide public awareness to the
data and statistical information produced by BPS-Statistics Indonesia is
increasing, and become demands that cannot be avoided. In response to
this, the government's National Development Plan of 2010-2014 puts the
strengthening of data systems and statistical information as part of
national development management support system.
With a broad coverage area and large population, Indonesia has
become a strategic position for international purposes. World attention to
Indonesia often refers to the data and statistical information produced by
BPS-Statistics Indonesia. Several countries in the Asia-Pacific and Africa
also learned a lot from BPS-Statistics Indonesia in statistical activities.
BPS-Statistics Indonesia capability in developing poverty statistics,
social, economic and preparation of various other indicators have been
widely recognized internationally.

8
International institutions under the United Nations (including UNDP,
UNICEF, UNFPA, and UNSD), World Bank, Asian Development Bank,
Eurostat, AusAid, USAID, JICA, ASEAN Stat, and others also provided
assistance in statistical development in Indonesia.
Millennium Development Goals (MDG's) which have been agreed
by most countries including Indonesia, have become a motivator for the
organizers and observers of statistics to further increase its participation
in assessing the achievement of development performance. This
strengthens the national awareness of the importance of National
Statistics System (SSN) is an integrated, reliable, effective and efficient.
C.2. Facing Problems
The problems faced in improving the quality of the data include
internal and external problems. Internal problems that stand out are the
limited human resource (HR) in statistics that are professional and
competent in accordance with its assignment, especially in Eastern
Indonesia Region. This is as a result of the rapid expansion area, which
also brings the consequence of some municipalities that do not yet have
representation BPS-Statistics Indonesia. In addition, ICT facilities and
infrastructure owned by BPS-Statistics Indonesia are not entirely in
accordance with the latest technological developments.
External problems that stand out are lack of awareness of
respondents, whether households, firms, and institutions in providing the
information correctly. This results in data quality and a low response rate.
Other external problems are not yet fulfilled increasing variety of
data and information needs of small area statistics, including micro data.

9
This comes as a result of the implementation of regional autonomy
policy. To meet the needs of such data, BPS-Statistics Indonesia is
beleaguered by Law No. 16 of 1997 on statistics that do not allow BPS-
Statistics Indonesia to present individual data. Meanwhile, there is also
assumption from the community that BPS-Statistics Indonesia is the
source of all sources of information. This is caused by a lack of public
understanding about the main tasks and functions of BPS-Statistics
Indonesia.
Coordination between agencies are still not optimal, resulting in
duplication of statistical activities that result in less efficient use of
budget.
Another important problem that is not optimal implementation of the
four basic principles of the 10 basic principles of operation of official
statistics recommended by the United Nations, among others:
(i) The National Statistical Offices (NSO) has the right to correct
and clarify the case of errors of interpretation and misuse of
statistics.
(ii) Statistical information obtained from various sources, either
through censuses, surveys and administrative records in which
the NSO is responsible for the quality, timeliness, cost and
burden on respondents.
(iii) Coordination between the statistics organizers and the NSO is
essential to achieve statistical system consistent and efficient.
(iv) Bilateral and multilateral cooperation in the field of statistics is
recommended within the framework of improvement of national
statistical systems in all States.

10

11
CHAPTER II
BPS-Statistics Indonesia VISION, MISSION, AND OBJECTIVES
A. BPS-Statistics Indonesia Vision
2010-2014 BPS-Statistics Indonesia Vision is built by taking into
account various internal strengths and weaknesses and opportunities
and challenges faced by outside parties with a basis for proactive
thinking. National development in the field of statistics is directed to be
able to accommodate a growing number of challenges, such as reform
that supports transparency, autonomous region containing data and
information challenges of diversity at the level of small area statistics,
development of information technology which leads to increased ease of
access to data and information society , and observe the readiness of the
organizers of human resources statistics and trends of restrictions on
access to data from respondents/object statistics.
Considering the variety of things, the vision of BPS-Statistics
Indonesia 2010-2014 was agreed as follows:
"The Agent of Trustworthy statistical data for all"
BPS-Statistics Indonesia is a government institution that has a
fundamental duty to provide and coordinate the availability of data and
statistical information on national and regional scope. The word "pioneer"
has the meaning that the BPS-Statistics Indonesia as the originator of

12
the idea of a trusted provider of statistics, as well as actors in the
provision of reliable statistics. The words "reliable statistics" are statistics
that describe the real situation. The word "all" meant that all parties had
an equal right to access data from BPS-Statistics Indonesia (impartial).
With this vision, the existence of the BPS-Statistics Indonesia as a
provider of data and statistical information becomes increasingly
important, because it can be trusted by all parties. BPS-Statistics
Indonesia is not just part of the government, but also part of the whole
society and aspects of life. In addition, this vision also provides enough
space for the participation of various parties to participate in providing,
utilizing, and uses data and statistical information.
The process of providing data and statistical information produced
by BPS-Statistics Indonesia become an integral part of society which was
distributed through various media and various ways for utilization
helpless wide range, at home and abroad.
B. BPS-Statistics Indonesia Mission
The mission statement is an elaboration and implementation plan
for programs and activities in eager to achieve the vision that has been
set.
Based on BPS-Statistics Indonesia vision, the mission of national
development BPS-Statistics Indonesia include:
1. Strengthening the foundation of the constitutional and operational
statistics institute for the collection of statistics that is effective and
efficient;

13
2. Creating competent and professional individuals in statistics,
supported by the use of advanced information technology for the
advancement of Statistics in Indonesia;
3. Improving the application of classification standards, concepts and
definitions, measurement, and statistical code of ethics that are
universal in every collection of statistics;
4. Improving the quality of statistical information services for all parties;
5. Improve the coordination, integration, and synchronization of
statistical activities organized by government and private institutions,
within the framework of the National Statistics System (SSN), that is
effective and efficient.
The first mission refers to the basic philosophy that, to achieve the
vision, BPS-Statistics Indonesia requires a strong legal foundation.
Today many fundamental changes led to the importance of judicial
review of Law Number 16 of 19,997 on Statistics.
The second mission, making human resources and information and
communication technology (ICT) into two important pillars in the
administration of SSN. BPS-Statistics Indonesia STIS produce human
resources professionals in the field of statistics and statistical computing.
With the support of ICT, the human resources are capable to implement
SSN effectively and efficiently.
The third mission, in organizing national statistics, BPS-Statistics
Indonesia goes by the 10 basic principles of the UN recommendation,
which include that the BPS-Statistics Indonesia should generate data
based on a methodology that can be justified scientifically.

14
The fourth mission, BPS-Statistics Indonesia as a public servant is
required to provide excellent service. This mission is an important part in
realizing the vision and strategic BPS-Statistics Indonesia, namely as a
pioneer in providing data and statistical information for all.
The fifth mission, BPS-Statistics Indonesia as the institution
responsible for implementation of SSN, need to do the coordination,
integration, and synchronization effectively and efficiently.
B. Objectives
Act No. 16 of 1997 on Statistics mandates BPS-Statistics Indonesia
to provide data and statistical information on a national and regional
scale, as well as coordination, integration, synchronization, and
standardization in the collection of statistics.
The main objective in national development in the field of statistics
the next five years is the increasing availability of quality data and
statistical information and service excellence in order to realize to create
a qualified, effective, and efficient SSN. For that, BPS-Statistics
Indonesia needs to improve coordination with relevant agencies,
integration, synchronization, and standardization of statistical activities.
In order to anticipate the evolving strategic environment, the
statistical development is implemented through bureaucratic reform by
adopting Statcap CERDAS (Statistical Capacity Building - Change and
Reform for the Development of Statistics in Indonesia).The four pillars of
reform of the bureaucracy made within 2010-2014, include: (i).Improved
data quality, (ii). Development and improvement of the quality of human
resources, (iii). Strengthening Information and Communication

15
Technology (ICT) and working facilities, and (iv). Strengthening
institutions and relationships with data sources and data users.
C. BPS-Statistics Indonesia Strategic Objectives
In summary the strategic objectives of national statistical
development of Indonesia may be formulated as follows:
1. Availability of data and statistical information that is complete,
accurate, and timely in all areas of development and to improve
service for users of data and statistical information;
2. The realization of BPS-Statistics Indonesia organizational structure
effectively and efficiently to realize good governance framework and
improve supervision and performance accountability apparatus BPS-
Statistics Indonesia;
3. Increased human resource capacity in knowledge, mastery of
science, statistical methods, and information technology in order to
refine methods of collecting, processing and dissemination of
statistics;
4. Increased inter-institutional cooperation statistics/research
domestically and internationally on the basis of mutual respect for
independence and profitable in order to produce statistical data and
information of international quality;
5. The realization of SSN in supporting the duties and functions of
institutions that have good statistics in government agencies, private
and community; and
6. Increasing the quality and quantity of physical infrastructure.

16
The successful achievement of strategic objectives can be
measured with a variety of BPS-Statistics Indonesia main indicators,
such as increasing user trust data to the data and statistical information
generated, easy access to the user in obtaining statistical data and
information quickly, the fulfillment of supporting facilities and
infrastructure needs, particularly in order to utilize information technology
and communication technology (ICT), as well as the successful
management of financial administration and performance accountability
to the opinion "unqualified" to the Financial Reports.

17
CHAPTER III
STRATEGY AND POLICY DIRECTIONS
A. Strategy and National Policy Directions
Medium-term development priorities in the field of data and
statistical information are improving the quality of national statistics. Data
quality is measured in six dimensions, accuracy, relevance, timeliness,
accessibility, coherence, which means consistency between periods and
sectors and spatial, and interpretability.
To realize these goals, three steps have been formulated: (1)
improvement of data quality, (2) increased application of information and
communication technology (ICT), and (3) human resources capacity
building and institutional arrangements.
Statistics of high quality and reliability that result in a timely manner
is an essential part in the process of formulating a policy. This is
indicated by the increasing quality of statistical data and information
economy, the increasing quality of data and statistical information on
public welfare, increasing management survey, increasing the survey
methodology, the increase and development of statistical analysis, the
increasing relationships with data users increased effectiveness and
efficiency of data dissemination and statistical information, and the
increased application of information and communication technology.
Improving the quality of data and statistical information for this new focus
on the improvement of technical and statistical methodology. Currently

18
expected to begin improvements made to touch all aspects such as
management review process again (business process review),
development of ICT capacity, and capacity building and human resource
capabilities and institutional arrangements. The success of efforts to
improve the quality of data and statistical information can not be
separated from the support and the role of ICT, which is realized through
the development of architecture and framework of ICT and information
management. This is indicated by the increasing use of ICT statistics.
The success of improving the quality of data and statistical information
are also in desperate need of support and the role of HR. This shows the
increasing capacity and power capability in the central and regional
statistics.
Capacity building and provision of national data and statistical
information expected to be done through a technical program statistically,
namely the program of providing and Statistical Information Service. This
program will be a work plan data provider institutions and statistical
information, both at central and local levels.
B. Strategy and Policy of BPS-Statistics Indonesia
B.1. Strategy
Improved data quality becomes one of strategic objectives to be
achieved BPS-Statistics Indonesia in support of the strategy and
direction of national policy. In line with the strategy and policy direction of
BPS-Statistics Indonesia, over the next five years BPS-Statistics
Indonesia needs to pursue reforms and changes to the overall statistical
development. In an effort to improve data quality and improve the

19
qualities of the presentation of necessary improvements, among others,
to meet the needs of ICT tools and improve the quality of human
resources. The process of improving the quality of this data, in turn will
be reflected by reduced timelines presentation of data, and improve the
quality of presentation, and provide convenience to the user data for
accessing data.
The development of the global situation, the development of ICTs,
and increasing public awareness of the importance of statistics in the
future allow the emergence of a variety of challenges in statistical
development in Indonesia. The rapid development of science and
technology nowadays perceived impact on demand for data and
statistical information are increasingly diverse, accurate, continuous-
relations, and on time. Demand for data and information of this kind not
only come from the government, but also come from the community.
In order to realize the National Statistics System (SSN), a reliable,
effective and efficient, the statistical development program is aimed at
increasing the availability of reliable statistical data and information
quality. Increasing the capacity of statistical activities in BPS -Statistics
Indonesia conducted to answer the increasing demand for data and
statistical information in support of regional autonomy.
The capacity of information and communication technology (ICT) in
BPS -Statistics Indonesia is currently also not entirely in accordance with
the progress of computing technologies needed to accelerate the
collection, processing, and dissemination of data that is increasing in
coverage and quantity. To implement the SSN with the use of ICT
adequate facilities and infrastructure is required.

20
Human resources that are inadequate both in terms of quantity and
quality is a situation that is really troubling at the BPS-Statistics
Indonesia Regional level, especially at district / municipaity level. With
the Institute of Statistics and the Center for Statistics Education and
Training gradually expected to meet the needs of human resources.
In order to meet the needs of quality data, the use of ICT, and
human resources capacity-building has made an impact on institutional
conditions. Therefore, institutional restructuring of BPS -Statistics
Indonesia need to be done in accordance with the needs and
development of the strategic environment.
Based on the vision, mission, goals and targets, and reference to
the national development strategy in the field of statistics in the National
Development Plan, the BPS-Statistics Indonesia define strategies which
are a series of major activities to achieve the goals process. Strategies
are described for each target process and grouped in three areas that
include:
a) Data Quality Improvement Strategy Division and Diversity Data.
b) Information and Communication Technology (ICT) Strategy.
c) Human Resource Capacity and Capabilities and Institutional
Structure Improvement Strategy.
I. Data Quality Improvement Strategy Division and Diversity Data
This strategy is a means to achieve what is expected from the third
and fourth missions of BPS-Statistics Indonesia. BPS-Statistics
Indonesia third mission of improving the application of classification

21
standards, concepts and definitions, measurement, and statistical code
of ethics that is universal in every statistical collection. BPS-Statistics
Indonesia fourth mission is improving the quality statistical information
service for all parties. This strategy is aimed to achieve strategic
objectives within the framework of strengthening data systems and
statistical information. The purpose of this strategy is to optimize the
quality of data and statistical information produced by the BPS-Statistics
Indonesia.
This strategy consists of several series of major activities to achieve
priority goals. Each strategy begins with the preparation of management
Process Analysis / Business Process Analysis (BPA) and Process Re-
Engineering management / Business Process Reengineering (BPR). The
targets and strategies are outlined below:
a) Goal-1: Improving the Quality and Diversity of Economic Data and statistical information.
This goal is achieved by taking the following steps:
1. Conducting Census of Agriculture 2013 with quality;
2. Develop and apply the System of National Accounts of
Indonesia based on the System of National Accounts (SNA)
2008 for balance-sheet staples such as Production Account,
Balance of Receipts and Expenditures (the generating of income
accounts), Balance of Capital and Financial Account Balance in
BPS -Statistics Indonesia and the BPS-Statistics Indonesia
Regional Center to realize a national accounts data are
incomparable between countries;
22
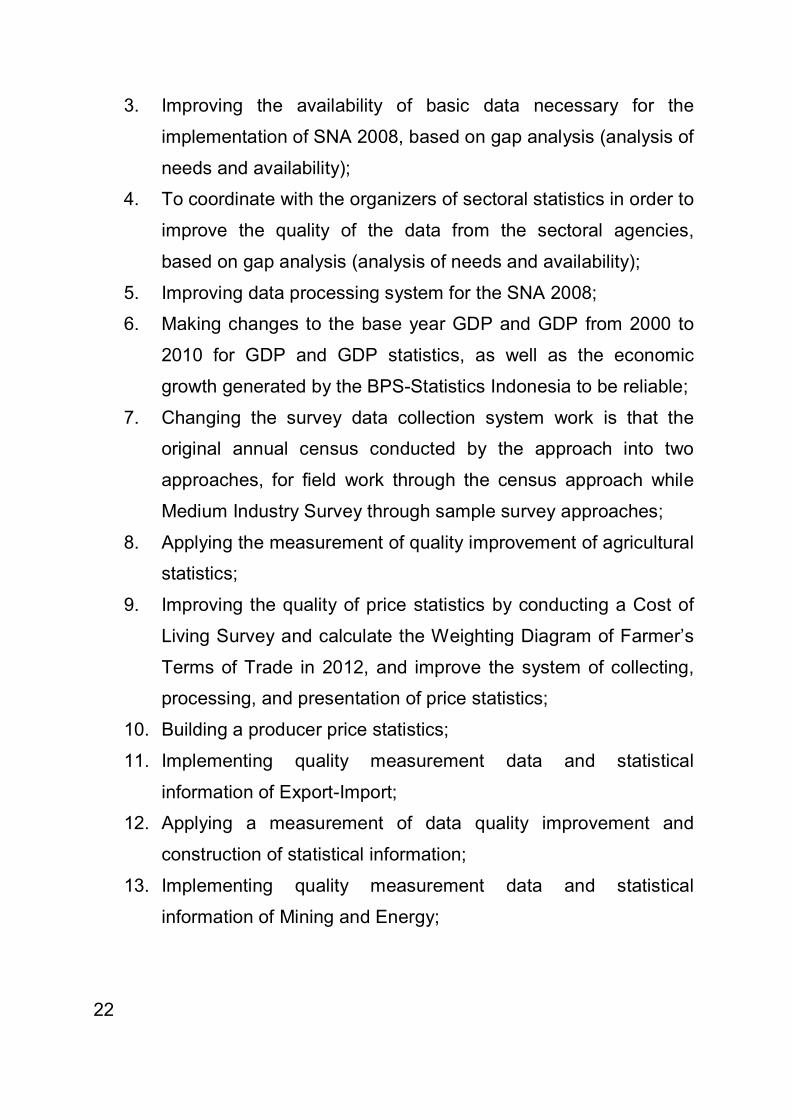
3. Improving the availability of basic data necessary for the
implementation of SNA 2008, based on gap analysis (analysis of
needs and availability);
4. To coordinate with the organizers of sectoral statistics in order to
improve the quality of the data from the sectoral agencies,
based on gap analysis (analysis of needs and availability);
5. Improving data processing system for the SNA 2008;
6. Making changes to the base year GDP and GDP from 2000 to
2010 for GDP and GDP statistics, as well as the economic
growth generated by the BPS-Statistics Indonesia to be reliable;
7. Changing the survey data collection system work is that the
original annual census conducted by the approach into two
approaches, for field work through the census approach while
Medium Industry Survey through sample survey approaches;
8. Applying the measurement of quality improvement of agricultural
statistics;
9. Improving the quality of price statistics by conducting a Cost of
Living Survey and calculate the Weighting Diagram of Farmer’s
Terms of Trade in 2012, and improve the system of collecting,
processing, and presentation of price statistics;
10. Building a producer price statistics;
11. Implementing quality measurement data and statistical
information of Export-Import;
12. Applying a measurement of data quality improvement and
construction of statistical information;
13. Implementing quality measurement data and statistical
information of Mining and Energy;

23
14. Implementing quality measurement data and statistical
information of Finance;
15. Implementing quality measurement data and statistical
information of Tourism;
16. Implementing quality measurement data and statistical
information Information and Communication Technology;
17. Implementing quality measurement data and statistical
information of Domestic Trade;
18. Implementing quality measurement data and statistical
information of Transportation;
19. Improving data processing system based survey companies and
households.
b) Objective 2: Improving the Quality of Data and Information for Social Statistics and Social Welfare.
This goal is achieved by taking the following steps:
1. Conducting Census of Population 2010, with quality;
2. Applying measurement of quality improvement for measurement
and demographic statistical information data;
3. Applying measurement of quality improvement for National
Socio-Economic Survey (SUSENAS) data;
4. Applying measurement of quality improvement for National Labor
Force Survey (SAKERNAS) data;
5. Applying measurement of quality improvement for Wage Survey
and Wage Structure data;
6. Implementing measurement of quality improvement for data and
statistical information poverty;

24
7. Implementing measurement of quality improvement for social
security data and statistical information.
c) Goal 3: Improve Management Survey
This goal is achieved by taking the following steps:
1. Improving response rate;
2. Improving data collection methods and monitoring.
d) Goal 4: Improve the Census and Survey Methodology.
This goal is achieved by taking the following steps:
1. Improving the sample frame for household-based surveys or
company / business;
2. Improving the working area of statistical maps and administrative
area (the village) for the purposes of collecting and presenting
data and statistical information;
3. Improving the classification and standardization of statistics for
the purposes of collecting, presenting, and statistical analysis;
4. Applying the census and survey design optimal.
e) Goal 5: Improve and Develop Statistical Analysis.
This goal is achieved by taking the following steps:
1. Improving the quality of cross-sector statistics;
2. Improving the statistical consistency across sectors;
3. Building a Total Quality Management System.

25
f) Goal-6: Improving Relations with the User Data.
This goal is achieved by taking the following steps:
1. Improve customer satisfaction;
2. Improving partnerships with providers of data;
3. Improving communication with data users and data providers.
g) Goal-7: Improving the Effectiveness and Efficiency of Data and Statistical Information Dissemination.
This goal is achieved by taking the following steps:
1. Improve ease of access to BPS-Statistics Indonesia data;
2. Improving the quality of service and the results (data and
statistical information);
3. Increasing the use of Si Rusa (Sistem Rujukan Statistik-
Statistical Referral System), compiling metadata within the
framework of Si Rusa.
II. Strategy Information and Communication Technology
To achieve what is expected from the second mission of BPS-
Statistics Indonesia which is creating individuals who are competent and
professional, is supported by the use of advanced information technology
for the advancement of Statistics in Indonesia, therefore a strategy of
information and communication technology field is formulated. This
strategy aimed to achieve strategic objectives within the framework of
strengthening the data base system. The purpose of this strategy is to
optimize the infrastructure is based on sophisticated information and
communication technology.

26
Based on the vision, mission, goals and targets, BPS-Statistics
Indonesia formulate some strategy and architecture development of
information technology framework for communication and information
management through a series of major activities to achieve targets.
Goal: Improve Infrastructure of ICT in the Framework of Improving Performance Effectively and Efficiently BPS-Statistics Indonesia.
This goal is achieved by taking the following steps:
1. Creating Analysis Process Re-Engineering Process management
and administration for Statistical Information System;
2. Improve online service to internal and external data users;
3. Building ICT Standardization (ICT architecture, procedures,
hardware and software);
4. Improve ICT facilities and infrastructure in general;
5. Improving Organizational and Human Resources Information
Technology.
III. Strategy Sector Capacity Building and Institutional Arrangement
This strategy is a means to achieve what is expected from the BPS-
Statistics Indonesia's mission is unity, the second and fifth. BPS-
Statistics Indonesia unity mission is to strengthen the constitutional basis
and operational statistics for the collection of statistics institute an
effective and efficient. The second mission is to create human BPS-
Statistics Indonesia statistics competent and professional, supported the
use of advanced information technology for the advancement of

27
Statistics in Indonesia Indonesia. BPS-Statistics Indonesia fifth mission is
improving the coordination, integration, and synchronization of activities
organized by government statistics and private, within the framework of
the National Statistics System (SSN), an effective and efficient. This
strategy aimed to achieve strategic objectives in enhancing the human
resource capacity and institutional arrangement. The purpose of this
strategy is to improve the performance of BPS-Statistics Indonesia
personnel.
The success of improving the quality of data and statistical information
are also in desperate need of support and the role of human resources
and institutional management of effective and efficient. Therefore, human
resource development and institutional arrangement is a strategic part in
the development of national statistics the next five years.
Based on the vision, mission, goals and targets, BPS-Statistics Indonesia
formulate some strategies to perform human resource development and
institutional arrangement, which consists of a series of major activities to
achieve set goals.
a) Goal-1: Improving Human Resources.
This goal is achieved by taking the following steps:
1. Creating Analysis Process management and reengineering of
management processes for human resources BPS-Statistics
Indonesia condition;
2. Perform gap analysis (gap analysis) between current conditions
and needs in the years to come;

28
3. Improve individual behavior in work (code of conduct) for each
apparatus BPS-Statistics Indonesia;
4. Establish policies and procedures for human resources
development;
5. Improving the acceptance and placement of human resources at
all levels, both at Central and Regional;
6. Building a career planning;
7. Building a human resource information system to support the
implementation of HR policies;
8. Improving the quality of education Institute of Statistics (STIS);
9. Improving the effectiveness of education and training center.
b) Objective 2: Improving the Organizational Structure of BPS-Statistics Indonesia Effectively and Efficiently In Achieve Good Governance Framework.
This goal is achieved by taking the following steps:
1. Increasing integration, synchronization and synergy between
units at Central BPS-Statistics Indonesia and the BPS-Statistics
Indonesia Center for the BPS-Statistics Indonesia Region, as
well as with related institutions in order to realize a quality
planning activities BPS-Statistics Indonesia;
2. Creating Analysis Process Re-Engineering Process of
management and institutional management BPS-Statistics
Indonesia;
3. Reviewing and amending Law No. 16 of 1997 on Statistics
followed by changes to legislation implementation;
4. Reorganized based on working conditions in the future;

29
5. Adjust and improve the legal and regulatory framework to
support the administration of statistical activities;
6. Develop and implement a work culture BPS-Statistics Indonesia;
7. Building Integrated Resource Planning System;
8. Building a document management system;
9. Improving strategic decision making process and improving the
process flow of information to support decision-making.
c) Goal-3: Increased Oversight and Accountability Performance Apparatus BPS-Statistics Indonesia.
This goal is achieved by taking the following steps:
1. Building regulation and supervision of internal inspection BPS-
Statistics Indonesia;
2. Conduct supervision and inspection activities intensively BPS-
Statistics Indonesia;
3. Improving the quality supervision and inspection of all work units
BPS -Statistics Indonesia;
4. Building a system of monitoring and inspection of new, effective
and efficient;
5. Perform administrative guidance to providers;
6. Implement monitoring and evaluation of programs and activities
effectively BPS-Statistics Indonesia.
d) Goal 4: Improve Infrastructure Apparatus BPS-Statistics Indonesia.
This goal is achieved by taking the following steps:

30
1. Build and renovate an office building adequate according to the
needs of organizations and the number of human resources;
2. Build and renovate decent housing accommodation needs of the
organization;
3. Sufficient for field operations vehicles in order to accelerate the
process of statistical activities;
4. Perform maintenance of facilities and infrastructure.
B.2. Policy Direction
As a follow-up Vision, Mission, Goals, and Objectives that have
been defined, BPS-Statistics Indonesia determines the direction of the
National Statistics Development policy as follows:
a. Conduct a review of Law No. 16 of 1997 on the following Statistics
legislation implementation. Act No. 16 of 1997 needs to be revisited,
especially in relation to the organizational structure of BPS-Statistics
Indonesia in the central and local governments, the assertion BPS-
Statistics Indonesia role in coordination with sectoral statistics in the
framework of the preparation of sectoral statistics are reliable and
effective administration and utilization of products of institutions as a
source compilation of basic statistics. Coordination with sectoral
institutions should be in line with the mandate of Regulation No. 38 of
2007 on the Division of Government Affairs between the Government
(Centre), the Provincial Government and District/City. Implementation
of the implementation of PP No. 41 year 2007 on the family activity
area devices also need to be followed up with the principle of
verticality BPS-Statistics Indonesia area to avoid the confusion of

31
interpretation and implementation of Government Regulation No. 38
of 2007.
b. Pioneered the implementation of statistical activities in an efficient
and effective way to obtain a reliable and excellent results based
upon the principles of integrity, accuracy, and updates. The
integration has the meaning that the statistical activities carried out
jointly by government and society must complement and reinforce
each other in meeting the needs of data and statistical information,
and avoiding duplication of activities. Accuracy principle implies that
all statistics should be sought to generate data and statistical
information that careful, precise, accurate, and true. While the
currency means that the data and statistical information presented or
available must be able to describe phenomena or changes on the
basis of recent. Therefore, the collection, processing, presentation
and analysis, and dissemination of data and statistical information
should always be constantly, continuously, and economic time series.
c. Creating conditions that support implementation of the Norms,
Standards, Procedures and Criteria (NSPK). NSPK will facilitate the
user in analyzing the data and statistical information and to make
comparisons between data with each other, both scale comparison of
regional, national, or international.
d. Facilitating increased mastery and development of science and
technology information, especially statistical science, through
research and study. Mastery of science and development is primarily
intended to achieve statistical activities more effectively with quality

32
results that encourage increased public confidence in the data and
statistical information presented.
e. Promote the establishment of information systems statistic reliable
and efficient by utilizing the latest technology, appropriate and
effective manner. Results of statistical activities will be useless if not
utilized by the user. Statistical information system is a means to
disseminate the results of statistical activities, both to the government
and society.
f. Seek guidance in the development of statistical information systems
of all national statistics. Mastery of information technology is still not
evenly distributed in the statistics. Equality knowledge about
information technology will support the development of an integrated
National Statistical System.
g. Pioneered the improvement of the palaksana activities in organizing
and presenting statistical data and statistical information. Quality of
human resources implementing statistical activities affect the quality
of statistical data and information generated and presented. The high
quality of human resources implemented will generate data and high-
quality statistical information.
h. Strive to increase public awareness of the importance and usefulness
of statistics. Besides depending on the quality of implementation, the
quality of data and statistical information is also influenced by the
data source. Society as a source of data will determine the resulting
data, given the data obtained is dependent upon the quality of
answers given community as sources of data.

33
i. Seek guidance for the utilization of labor force statistics in all areas of
government and private institutions. Units of field work in various
institutions such statistics do not yet have a uniform knowledge in the
field of statistics; affirmative knowledge of statistics is expected to
improve the quality of development statistics. One effort includes the
facilitation of BPS-Statistics Indonesia against the forces of functional
statisticians and computer administration in sector agencies, both at
the central and the regional agencies.
j. Arranging the provision of completeness of information technology
equipment such as notebook/laptops for Statistics District
Coordinating officer (CWC) in order to develop data collection
techniques by utilizing advances in information technology through an
electronic survey system.
C. Programs and Activities
As a non-Ministry of Government Institutions, BPS-Statistics
Indonesia has one Technical Program and three Generic Program. BPS-
Statistics Indonesia Technical Program is a Program of Providing and
Statistical Information Service (Program Penyediaan dan Pelayanan
Informasi Statistik-P2IS). The BPS-Statistics Indonesia Generic Program
include: (i) Program Management Support and Implementation of other
Technical Activities BPS-Statistics Indonesia, (ii) Facilities and
Infrastructure Improvement Program Apparatus (Program Peningkatan
Sarana dan Prasarana Aparatur-PSPA) BPS-Statistics Indonesia, (iii)
Oversight and Accountability Improvement of Apparatus State Program
(Program Pengawasan dan Peningkatan Akuntabilitas Aparatur Negara-
P2A2N) BPS-Statistics Indonesia.

34
Program of Providing and Statistical Information Service (P2IS)
aims to provide statistical information and provide quality services in
order to meet the needs of data users. To provide data and statistical
information, BPS-Statistics Indonesia continually refines and develops
the activities of gathering, processing, assessment and analysis, and
dissemination of data and statistical information.
Program Management Support and Implementation of other
Technical Activities BPS -Statistics Indonesia aims to provide
management support and the smooth implementation of technical
activities in the field of providing data and information quality statistics.
Basic policy in the budget plan this program is directed to the
implementation of operational activities of agencies such as planning
programs and activities, monitoring and evaluation activities, the
provision of payroll, human resource capacity building, and public
relations functions.
Facilities and Infrastructure Improvement Program Apparatus
(PSPA) BPS-Statistics Indonesia aims to maintain and improve physical
facilities and infrastructure that already exists in BPS-Statistics
Indonesia, among other facilities completing comfort and work space,
and the provision of housing accommodation and means of
transportation to the center and regions.
Oversight and Accountability Improvement of Apparatus State
Program (P2A2N) BPS-Statistics Indonesia aims to conduct supervision
and examination on implementation of activities, financial administration
and administrative management of goods across work units and the
Central BPS-Statistics Indonesia Region. The program is aimed to obtain

35
an assessment CPC with a qualified opinion for the financial reports of
the BPS-Statistics Indonesia.
Every program is translated into activities that are the responsibility
of each unit Echelon II at Central BPS-Statistics Indonesia. BPS-
Statistics Indonesia Technical Program is a Program of Providing and
Statistical Information Service (P2IS), which is the deconcentration of
activities of their respective Echelon II in BPS-Statistics Indonesia
(Central). As for Generic Program, in each Unit BPS -Statistics Indonesia
Echelon II provided two programs, namely: (i) Program Management
Support and Implementation of Technical Activities Other BPS-Statistics
Indonesia, and (ii) Facilities and Infrastructure Improvement Program
Apparatus (PSPA) BPS-Statistics Indonesia. Similarly for the BPS
District/Municipality provided the Technical Program and Generic
Program are the same as BPS Province.
From 26 activities which are the responsibility of second echelon
units of the Central BPS-Statistics Indonesia, defined 10 priority
activities. Determination of priorities based on:
(i) Commission Act No. 16 of 1997 on Statistics, the Census operation,
including the Census of Population 2010, Census of Agriculture
2013 and the preparation of Economic Census 2016.
(ii) Provision of strategic data that supports the Vision and Mission
National Development Plan includes a large-scale statistical
activities and cross-sector. Provided and Developed: Regional and
National Accounts Statistics, Price Statistics, Household Statistics
through the National Socio Economic Survey ( SUSENAS) and the
National Labor Force Survey (SAKERNAS), Poverty Data, Large /

36
Medium Industry Statistics, Living Cost Survey and the Weighting
Diagram Farmer’s terms of Trade Survey 2012, and the Village
Potential Census 2013.
Complete each activity and key performance indicators, targets and
achieving the necessary budget allocations shown in Annex 1 and Annex
2. Table 1 below presents the key performance indicators with the target
achievement in 2010 and 2014 to focus on priority activities. Table 2
shows the budget allocation is needed in order to achieve the targets and
achievements of the program during 2010-2014.

37
Table 1. Key Performance Indicators, BPS-Statistics Indonesia 2010-2014 Priority Activities
No Activities / Focus Activities Output Main Performance Indicators
Target2010 2014
(1) (2) (3) (4) (5) (6) 1 Activity:
1. Provision and Development ofPopulation and Labor Statistics 2. Development of Census and Survey Methodology 3. Development of Statistical Information Systems
Focus Activity : Population Census 2010
The implementation ofthe Population Census2010 Population Census of 2010 and the availability of demographic parameters and indicators for MDG's and the targeting of several social policy
1. Available data andstatistical information for small areas in the field of population
2. Available population projections 2010-2020
3. Available indicators for planning, evaluation, and social analysis, such as education, the elderly, the housing, and disability, and achievements of the MDG's
Temporary Figures:August 2010 Final Figures: July 2011
----
----
Completed by 2012
Completed by 2012
2 Activity :Provision and Development of Population and Labor Statistics Focus Activity : National Labor Force Survey
data availability andinformation on employment and unemployment statistics at the National, Provincial and District
Available indicators ofunemployment and employment
Twice a year
Quarterly

38
No Activities / Focus Activities Output Main Performance Indicators
Target2010 2014
(1) (2) (3) (4) (5) (6) 3
Activity : 1. Provision and Development of
Statistics of Food Crops, Horticulture and Estate Crops
2. Provision and Development of Statistics of Animal Husbandry, Fisheries and Forestry
3. Development of Census and Survey Methodology
Focus Activity : Agricultural Census 2013
Availability of statistical data base of food crops, horticulture, estate crops, animal husbandry, fishery, and forestry 2013
1. Preparation in 2011 and 2012
2. Implementation of Listings in 2013
3. Publication in 2014 and implementation of sub sector surveys and farmers'income survey in 2014
2011: Pilot study 2012: Field Trial
Publication and analysis of the results of 2013 Agricultural Census
4
Activity : 1. Provision and Development of
Statistical Distributions 2. Development of Census and
Survey Methodology Focus Activity : Economic Census 2016 (Preparation Phase)
Implemented test of Economic Census 2016 instrument
Pilot survey listing the list of Economic Census 2016
--- Availability of questionnaires and Handbook Listing of Economic Census 2016

39
No Activities / Focus Activities Output Main Performance Indicators
Target2010 2014
(1) (2) (3) (4) (5) (6) 5 Activity :
Provision and Development of Welfare Statistics Focus Activity : National Socio Economic Survey
Availability of data andstatistical information of welfare Statistics, National Provincial andDistrict, which includesthe households characteristics data, housing, education, and health
1. Standard error (s.e) dataSusenas decline
2. The reduced non-sampling error
all variables andJava-Sumatra regiondoes not exceed 40% s.e Implementation schedule on time
All variables and all areas not exceeding 40% s.e There is no replacement samples
6 Activity :1. Provision and Development of
Production Accounts Statistics 2. Balance of Supply and
Development Expenditure Statistics
Focus Activity : Compilation of National Accounts and Regional
Availability of data andeconomic growth of the National, Provincial and District quarterly and annually
1. Changes in the base year,from 2000 = 100, becomes 2010 = 100th start in 2011
2. Decrease deskrepansi GDP with GRDP
Base year 2000=100 GDP with GDP prop discrepancy of less than 15% (ADHB) and less than 6% (ADHK)
Base year 2010= 100 from 2011 Discrepancies GDP with GDP of less than 10% (ADHB) and less than 4% (ADHK)
7 Activity :Provision and Development of PriceStatistics Focus Activity : Compilation of Consumer Prices Statistics and Rural Statistics
Availability of dataInflation and Farmers Term of Trade (NTP) in all provinces and nationally every monthand several main districts
1. Presented price data, priceindex, and inflation
2. Presented rural price data
and NTP every month
1. Coverage: 66cities, 774 commodities, withbase year 2007
2. Coverage of 32 provinces with base year 2007
1. Coverage: 80 cities, 800 commodities with base year 2012
2. Coverage of the 33 provinces with base year : 2012

40
No Activities / Focus Activities Output Main Performance Indicators
Target2010 2014
(1) (2) (3) (4) (5) (6) 8 Activity :
Provision and Development of PriceStatistics Focus Activity : Cost of Living Survey (SBH 2012)and Weighting Diagram of Farmer’s Term of Trade (NTP) Survey 2012
Availability of theweighting diagram (base year 2012) for calculation of national inflation and Farmers Term of Trade (NTP)
Urban expansion of the scopeof commodity inflation
SBH Coverage: 66cities, 774 commodities
Coverage of NTP: 32Provinces
Coverage: 80 cities, 800 commodities
Coverage of NTP: 33 Provinces
9 Activity :Provision and Development of Industrial Statistics, Mining and Quarrying, Energy, and Construction Focus Activity : Survey of Large / Medium Industry
Availability ofindicators of national industrial development every month, quarterly and annually
Timelag of directorypresentation and publication of data and statistical information on large and medium industry, annually
October (t-2) Provincial Level
August(t-2) Provincial Level
10 Activity :1. Provision and Development of
Social Security Statistics 2. Development and Statistical
Analysis Focus Activity : Compilation of Statistical Information Poverty
Availability of data thenumber and percentage of poor people in the National,Provincial and District/ Municipality every year
Improved quality of macro andmicro poverty statistics
Change of base year Availability of community poverty inflation

41
No Activities / Focus Activities Output Main Performance Indicators
Target2010 2014
(1) (2) (3) (4) (5) (6) 11 Activity :
1. Provision and Development of Social Security Statistics
2. Development of Census and Survey Methodology
Focus Activity : Census Village Potential (Podes) 2013
Availability of potentialspatial area database, small area statistics
Presentation of small areastatistics
District/MunicipalityLevel
Sub-district Level

42
Table 2. 2010-2014 Budget Allocation By Program
(In Millions of Rupiah)
PROGRAM/ACTIVITY ALLOCATION
2010 2011 2012 2013 2014 (1) (2) (3) (4) (5) (6)
A. ALLOCATION OF TECHNICAL PROGRAMS
3.769.067 595.641 811.881 2.178.267 859.169
I. PROGRAM OF PROVIDING AND INFORMATION SERVICE (P2IS)
3.769.067 595.641 811.881 2.178.267 859.169
- 2010 Population Census 3.300.000 25.000 15.187 - - - Living Cost Survey 2012 - 9.358 104.815 23.997 12.442 - Survey Weighting Diagram
NTP 2012 - 15.000 122.785 33.703 13.258
- 2013 Agricultural Census - 6.979 119.684 1.641.947 238.606 - SUPAS 2015 - - - - 10.000 - 2016 Economic Census - - - - 5.000 - Other Technicalities 469.067 570.641 796.694 178.267 859.169 B. ALLOCATION OF
GENERIC PROGRAM 1.279.981 1.076.733 1.145.932 1.178.375 1.211.898
I. PROGRAM MANAGEMENT SUPPORT AND IMPLEMENTATION OF OTHER TECHNICAL ACTIVITIES BPS-Statistics Indonesia
915.132 819.618 887.140 987.863 1.019.624
- Statcap Cerdas (PHLN) 15.000 35.300 81.000 150.000 160.000 II. FACILITIES AND
INFRASTRUCTURE IMPROVEMENT PROGRAM APPARATUS (ATS) BPS -Statistics Indonesia
359.741 251.876 253.423 185.009 186.634
III. OVERSIGHT AND ACCOUNTABILITY APPARATUS STATE PROGRAM (P2A2N) BPS -Statistics Indonesia
5.109 5.238 5.369 5.503 5.640
TOTAL 5.049.048 1.672.374 1.957.813 3.356.642 2.071.068 Note: *) Program Management Support does not include budget plan / fund
remuneration (2011-2014) **) Program Management Support including Bureaucracy Reform Program
with World Bank loan through Statcap CERDAS (Statistical Capacity Building, Change and Reform for the Development of Statistics)

43
CHAPTER IV
CLOSING
Given the important role of data and statistical information in the process
of planning, monitoring, and evaluation of national development as well as for
society, BPS-Statistics Indonesia determine strategies of strengthening
statistical data and information so that it becomes a source of development
information that can be trusted by all parties. This is in line with RPJMN 2010-
2014, which places the development of data and statistical information as
program management support national development.
Strengthening data and statistical information carried by rearranging
institutions within the framework of achieving good governance and clean
government. Bureaucratic reform is intended to increase the quality of data, by
building support pillars which include architecture development and
improvement of facilities and infrastructure to support ICT, and to improve
capacity and quality of human resources. This commitment is defined as the
anticipation of global and regional challenges in the period five years into the
future.

44

45

46

47
Appendix 1: Development Targets for the year 2010-2014 BPS-Statistics Indonesia
PROGRAM/ACTIVITY OUTCOME/ OUTPUT INDICATORS TARGET IMPLEMENTING
ORGANIZATIONAL UNIT 2010 2014
(1) (2) (3) (4) (5) (6) PROGRAM OFPROVIDING AND STATISTICAL INFORMATION SERVICE
Increasing provider ofdata and statistical information is complete, accurate, and timely, and increased data services and statistical information on ICT-based effective
1. Increasing the quality of census and surveys in the fieldof social statistics, production, distribution, services and national and regional accounts
2. Availability of macro social andeconomic indicators as a reference in preparing planning documents, monitoring, and evaluation of development
3. Increasing the quality of census and survey methodology
4. Increasing the quality of processing and data services and statistical information
Population Censusesgoing well according to international standards
census results of2013 can be served with high quality
Deputy Technical Field
1. Development ofCensus and Survey Methodology
Availability of census andsurvey methodology that are relevant and timely
1. Sampling designs for sen-susand survey the field of social statistics, production statistics,and the field of distribution statistics and services available on time
2. Statistical standards and qualifications in accordance with international reference
September year t-1 Implementation of Standard Industrialal Classification of Indonesia in accordance with the ISIC revision 4
July year t-1 Implementation-fication Position classification of Indo-nesia adjusted Revised 4
Directorate of Census and Survey Methodology Development

48
PROGRAM/ACTIVITY OUTCOME/ OUTPUT INDICATORS TARGET IMPLEMENTING
ORGANIZATIONAL UNIT 2010 2014
(1) (2) (3) (4) (5) (6)
3. The frequency of updating
database sample frame of census and survey
4. The frequency of updating the administrative map area sketch and a sketch map of the working area of statistical (Enumeration Area)
Twice a year Twice a year
Four times a year Four times a year
2. Services and Development of Statistical Information Dissemination
The creation of excellent service to all users of data and statistical information in a balanced
1. Percentage of public servicesunit who have applied Service Standards
2. Establishment of the plan an increase in the quality of public services
3. The implementation plan for improving the quality of public services by the deadline set
4. Data consultation services are excellent
5. Establishment of integrated statistical services sistem
6. Establishment of integrated
data warehouse system 7. Availability of professional
library management
25 %
25 %
25 %
75% consulting services 30% quality of service to the user data 20% user satisfaction data 20% of library management based on standardized
100 %
100 %
100 %
95% consulting services 50% quality of service to the user data 50% user satisfaction data 50% of library management based on standardized
Directorate of Statistical Dissemination

49
PROGRAM/ACTIVITY OUTCOME/ OUTPUT INDICATORS TARGET IMPLEMENTING
ORGANIZATIONAL UNIT 2010 2014
(1) (2) (3) (4) (5) (6) 3. Development of
Statistical Information System
Availability of facilities and infrastructure of information technology to support statistical activities and managerial
1. Availability of application processing system for a variety of statistical activities and management-Rial and storing the resulting data
2. Availability of infrastructure facilities and data communication networks
3. Availability of infrastructure
that supports the processing of applications and data repositories
4. Availability of professional workers in information technology
30 application system 150 BPS -Statistics Indonesia office already has an internet connection and data connection services uptime 90% 80% of the total PC / Laptop to the number of employees 40 people
25 application systems All BPS-Statistics Indonesia offices already have an internet connection and data connection services uptime 94% 100% to the technical field and 75% for administration 200 people
Directorate of Statistical Information Systems
4. Provision and Development of Population and Labor Force Statistics
1. Availability of data and statistical information on socio-demographic and labor force are useful for analysis, planning and decision making
1.1. Available indicators of unemployment and employment
1.2. Wage level 1.3. Available demographic
parameters
Twice a year Quarterly Provincial Level
Quarterly Quarterly District/City Level
Directorate of Population and Labor Force Statistics

50
PROGRAM/ACTIVITY OUTCOME/ OUTPUT INDICATORS TARGET IMPLEMENTING
ORGANIZATIONAL UNIT 2010 2014
(1) (2) (3) (4) (5) (6) 2. The implementation of
Population Census 2010 and the availability of indicators that include demographic parameters and indicators for MDG's and the targeting of several social policy
2.1. Available data and statistical information for small areas in the field of population
2.2. Available population projections 2010-2020
2.3. Available indicators for planning, evaluation, and socio-economic analysis, such as education, elderly, housing, disability
Temporary Figures: August 2010 Final Figures: July 2011 Completed by 2012 Completed by 2012
-
-
-
5. Provision and Development of Welfare Statistics
Availability data and statistical information on welfare statistics, such as data on households, education, housing, and health
1. Standard error (s.e) data from the National Socio Economic Survey (SUSENAS) decreased
2. The reduced non-sampling error of National Social Economic Survey (SUSENAS)
All variables and Java-Sumatra region does not exceed 40% Implementation schedule on time
All variables and all areas not exceeding 40% s.e There is no replacement samples
Directorate of Social Welfare Statistics
6. Provision and Development of Social Resilience Statistics
Availability spatial database of potential areas, small area statistics and social capital, environmental, social vulnerability and political security
1. Presentation of small area statistics (small area statistics)
2. There is a continuous index of democracy
3. Availability of continuous environmental statistics
4. Statistics macro and micro poverty increased quality
District/Municipality Level National National Change of Base year
Sub-district Level Province Province Availability of Poverty Inflation
Directorate of Social Resilience Statistics

51
PROGRAM/ACTIVITY OUTCOME/ OUTPUT INDICATORS TARGET IMPLEMENTING
ORGANIZATIONAL UNIT 2010 2014
(1) (2) (3) (4) (5) (6) 7. Provision and
Development of Statistics of Food Crops, Horticulture and Plantation
1. Availability of data andstatistical information on crops, horticulture and sustainable plantation
1.1. Coverage of data and statistical information of foodcrops expanded
1.2. Coverage of the presentation of data and statistical information expanded horticulture
1.3. Coverage of the presentation of data and statistical information estate crops expanded
Province Province Province
District/Municipality District/Municipality District/Municipality
Directorate of Food Crops, Horticulture and Plantation Statistics
2. Availability of statisticaldata base of food crops, horticulture, and plantation of Agriculture 2013 Census results
2.1. Preparation in 2011 and 2012
2.2. Implementation of listings and sub-sector surveys in 2013
2.3. Presentation of the survey in2014 and farmers' income survey in 2014
2011: Pilot study2012: Field trial
Presentation and analysis of the Census of Agriculture survey 2013 and farmers' income survey
8. Provision and Development of Statistics of Animal Husbandry, Fisheries and Forestry
1. Availability of data andstatistical information on livestock, fisheries and forestry which includes the characteristics of firms, household enterprises, the estimated population and production, as well as secondary data compilation
1.1. Time published presenting data and statistical information farming, fishing, and forestry annual
1.2. Time published presenting the data statitik farming, fishing, and forestry quarterly
Time: August (datayear (t-2)) Per year (data year (t-1))
Time: October(data year (t-1)) Quarterly (data year (t))
Directorate of Forestry, Animal Husbandry, Fisheries Statistics
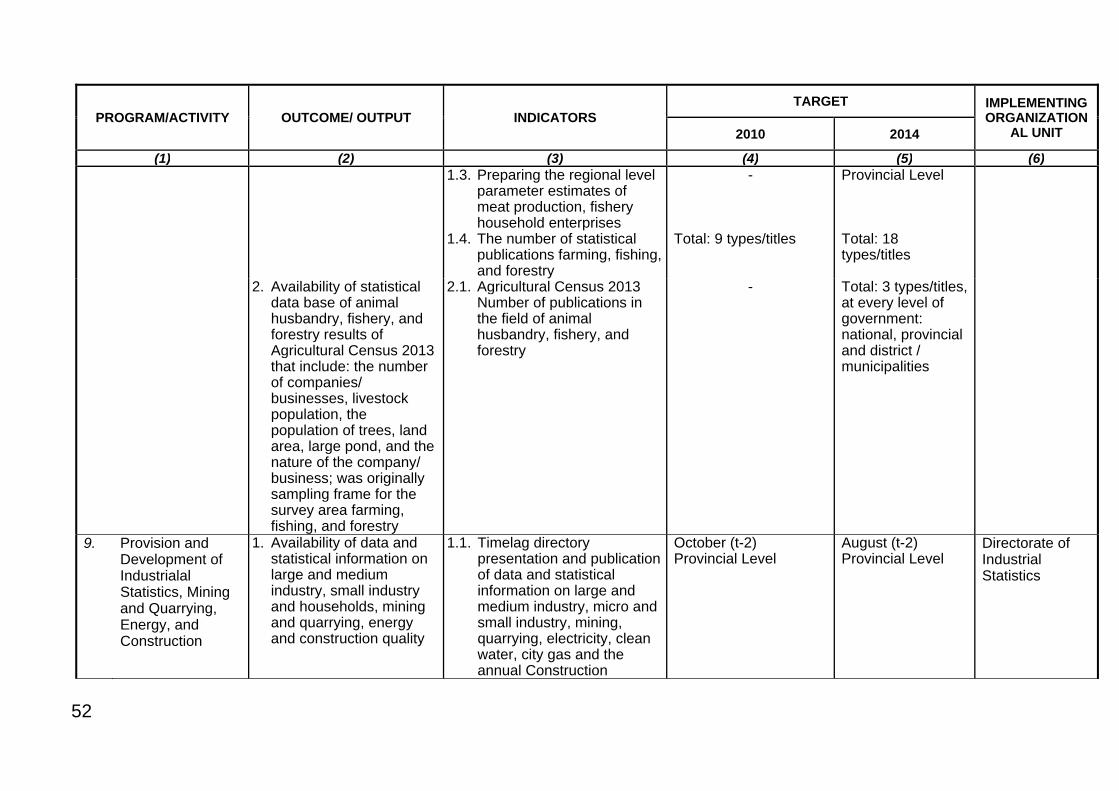
52
PROGRAM/ACTIVITY OUTCOME/ OUTPUT INDICATORS TARGET IMPLEMENTING
ORGANIZATIONAL UNIT 2010 2014
(1) (2) (3) (4) (5) (6) 1.3. Preparing the regional level
parameter estimates of meat production, fishery household enterprises
1.4. The number of statistical publications farming, fishing, and forestry
- Total: 9 types/titles
Provincial Level Total: 18 types/titles
2. Availability of statisticaldata base of animal husbandry, fishery, and forestry results of Agricultural Census 2013 that include: the number of companies/ businesses, livestock population, the population of trees, land area, large pond, and the nature of the company/ business; was originally sampling frame for the survey area farming, fishing, and forestry
2.1. Agricultural Census 2013 Number of publications in the field of animal husbandry, fishery, and forestry
- Total: 3 types/titles,at every level of government: national, provincial and district / municipalities
9. Provision and Development of Industrialal Statistics, Mining and Quarrying, Energy, and Construction
1. Availability of data andstatistical information on large and medium industry, small industry and households, mining and quarrying, energy and construction quality
1.1. Timelag directorypresentation and publication of data and statistical information on large and medium industry, micro and small industry, mining, quarrying, electricity, clean water, city gas and the annual Construction
October (t-2)Provincial Level
August (t-2)Provincial Level
Directorate of Industrial Statistics

53
PROGRAM/ACTIVITY OUTCOME/ OUTPUT INDICATORS TARGET IMPLEMENTING
ORGANIZATIONAL UNIT 2010 2014
(1) (2) (3) (4) (5) (6)
2. Instrument Economic
Census 2016
1.2 Timelag publications
presenting data and statistical information monthly large and medium industriales,
1.3 Timelag publications presenting data and information mining and energy statistics quarterly,
1.4 Timelag publications presenting data and statistical information quarterly construction
2.1 Pilot survey listing the list of
Economic Census 2016
November (t-1) National Level 1 month after the current quarter data quarter t National Level 6 month after the current quarter data quarter t National Level
-
September (t-1) National Level 1 month after the current quarter data quarter t National Level 6 month after the current quarter data quarter t National Level Availability questionnaire listing for 2016 Economic Census
10. Provision and Availability of Data Distribution
Availability a qualified Export, Import, Transportation, and Domestic Trade data
1. Presented Data (preliminary figures and actual) with current exports to the coverage of relevant KPBC
Time lag 1 month (Temporary Figures) and 2 month (actual figures) Coverage: 135 KPBC
Time lag 20 days (Temporary Figures) and 1,5 month (actual figures) Coverage: 150 KPBC
Directorate of Distribution Statistics

54
PROGRAM/ACTIVITY OUTCOME/ OUTPUT INDICATORS TARGET IMPLEMENTING
ORGANIZATIONAL UNIT 2010 2014
(1) (2) (3) (4) (5) (6) 2. Presented domestic trade
data, the pattern of distributionof basic commodities to date with coverage of the relevant sample
3. Data Presented land transportation, air, rail and seato date with relevant regional coverage
Presentation Level: National Coverage: 15 Province Presentation Level: Province Coverage: 33 Province
Presentation Level: Province Coverage: 33 Province Presentation Level: Province Coverage: 33 Province
11. Provision and Development of Price Statistics
1. Availability of price data at all levels, the Producer Price Index, Wholesale Price Index, Consumer Price Index, inflation / deflation and Farmers Term of Trade full range of quality
1.1. Presented price data and the latest producer price index with a range of sectorsand respondents representative / relevant
1.2. Data Presented prices and wholesale price index, construction cost index up todate with sectoral coverage and respondent representative / relevant
1.3. Presented price data, consumer price index, inflation / deflation, the indicator of price changes onthe outskirts of the CPI-date with coverage of a representative / relevant
1.4. Presented price data and the rural price index, the latest farmers terms of trade in the agriculture sub-sector
Time lag 2 month Coverage: 2 sector (agriculture, construction) Presentation: National Coverage: HPB: 162 district/city IKK: 105 district/city Coverage: 66 city, 774 commodities Time lag 1 month
Time lag 1 month Coverage: 3 sector (agriculture, construction, industrial) Presentation: National and Province Coverage: HPB: 190 district/cityIKK: 200 district/city Coverage: 80 city, 800 commodities No Time lag
Directorate of Price Statistics

55
PROGRAM/ACTIVITY OUTCOME/ OUTPUT INDICATORS TARGET IMPLEMENTING
ORGANIZATIONAL UNIT 2010 2014
(1) (2) (3) (4) (5) (6) 2. Establishment Weighting
Diagram Consumer Price Index, Wholesale Price Index, Producer Price Index, and qualified Farmers Terms of Trade
coverage and respondent representative / relevant
2.1. Presented the latest weighting diagram data of Consumer Price Index per city
2.2. Presented weighting diagram data of Wholesale Price Index
2.3. Presented weighting diagram data of Producen Price Index
2.4. Presented weighting diagram data of the latest Farmers Terms of Trade per subsector in the agricultural sector
Base year: 2007 Base year 2005 Base year 2005 Base year: 2007
Base year: 2012 Base year 2010 Base year 2010 Base year: 2012
12. Provision and
Development of Financial Statistics, Information Technology and Tourism
Availability of data and statistical information of Finance, Information Technology, and Tourism quality
1. Regional Financial data
presented at level I, II and III, BUMN and BUMD, Foreign Exchange, Banking and Insurance, Capital markets with a range of current and relevant.
Presentation Level: National Coverage: Province, District and village
Presentation Level: Province Coverage: Province, District and village
Directorate of Finance, Information Technology and Tourism Statistics

56
PROGRAM/ACTIVITY OUTCOME/ OUTPUT INDICATORS TARGET IMPLEMENTING
ORGANIZATIONAL UNIT 2010 2014
(1) (2) (3) (4) (5) (6) 2. Presented Foreign and
Domestic Tourists, Hotels and Restaurants, Bureau and Travel Agency with coverage of current and relevant samples
3. Presented data information technology, the use of information technology, technological literacy index
Presentation Level: Province Coverage: Entrance, Province Presentation Level: Province Coverage: Province
Presentation Level: Province Coverage: Entrance, Province Presentation Level: Province Coverage: Province
13. Provision and Development of Production Accounts Statistics
1. Availability of sectoral GDP statistics: quarterly and annually based on SNA 2008 as well as changes in the base year GDP and GRDP from 2000 = 100 to 2010 = 100
2. Availability statistics Input-Output Table Indonesia in 2010
3. Availability of GDP statistics (provincial and district/municipality) quarterly and annually reports by sector
4. Implementation of SNA 2008
1. Increased coverage of sectoral GDP data quarterly and annual.
2. Decrease time lag is
presenting statistical tables Input-Output Indonesia in 2010.
3. Decrease time lag is the presentation of GRDP (provincial and district/ municipality) by sector
4. Increased understanding of SNA 2008 and the application system / methodology of preparation of the balance of production
Base year 2000 24 month August year t+1 (Province) October year (t+1): district/city Comprehension of 2008 SNA material
Base year 2010 starting year 2011 22 month April year t+1 Mei year (t+1)): District/City Drafting according to SNA 2008 balance sheet
Directorate of Production Accounts

57
PROGRAM/ACTIVITY OUTCOME/ OUTPUT INDICATORS TARGET IMPLEMENTING
ORGANIZATIONAL UNIT 2010 2014
(1) (2) (3) (4) (5) (6)
5. Integrated Environmental Economic Accounting Matrix (Sisnerling)
5. The increase in commodity coverage and the development of methodology on Sisnerling preparation
Drafting of Economic Balance
Ecological balance is made up
14. Provision and Development Consumption Accounts Statistics
1. Availability of statistics quarterly and annual GDPon Consumption
2. Availability statistics Social Accounting Matrix (SAM)
3. Availability of Funds Flow statistics (Neraca Arus Dana-NAD) quarterly and annual reports of a higher quality
4. Availability of GDP statistics (provincial and district / city) quarterly and annual expenditures are more qualified.
1. Increased accuracy of GDP data quarterly and annual expenditure.
2. Decrease in the presentation of statistical time lag SAM
3. Decrease in lag time and the increased relevance of the presentation of quarterly and annual statistics NAD
4. Decrease time lag GDP data
presentation (provincial and district / city) according to the quarterly and annual expenditure.
5. Decline in GDP with GRDP
deskrepansi
Discrepancy of sectoral GDP <5 percent Lag 3 year - Lag 3 quarters - Classification of
financial instruments using the LBU 2002
- Time: 12 months (data
for year (t-1)) Level: national
- When: August (data year (t-1)) Level: Provincial
- When: October (data year (t-1)) Level: district / city
GDP with GDP prop discrepancy of less than 15 percent (ADHB) and less than 6 percent (ADHK)
discrepancy of sectoral GDP <2 percent Lag 2 year - Lag 1 quarter - Classification of
financial instrumentusing the concept MFSM
- Time: 10 months (data year (t-1)) Level: national - When: April (the data in (t-1)) Level: Provincial
- When: May (the data in (t-1)) Level: district / city
GDP discrepancy with ku-war GDP of 10 percent (ADHB) and less than 4 percent
Directorate of Consumption Accounts

58
PROGRAM/ACTIVITY OUTCOME/ OUTPUT INDICATORS TARGET IMPLEMENTING
ORGANIZATIONAL UNIT 2010 2014
(1) (2) (3) (4) (5) (6) 5. Implementation of SNA
2008
6. Increased understanding of SNA 2008 and balance sheet preparation applications revenue (income accounts), balance of capital, balance sheet and financial institutions (stream)
Mastery of SNA 2008
Availability revenue balance, capital balance, balance sheet and financial institutions (stream)
15. Provision and Development of Statistical Analysis
1. Availability of statistical analysis data of social, economic and cross-sector of higher quality
2. Ten-densi Availability
Index Business and Consumer Tendency Index
3. Human Development
Index (HDI) data availability and study the commodities profile of a higher quality
4. The availability of
statistical indicators of socio-economic and cross-sector
1. The reduced time lag is the presentation of statistical analysis of social, economic and cross-sector
2. Increased coverage 3. The reduced time lag for the
presentation and the presentation of the increased coverage area and the type of study
4. The reduced time lag
presentation welfare indicators and social reports, annual economic report Indonesia, Indonesia annual statistics and indicators of
- Time published: December
- National Scale - December - National Scale - 1 type of study - Time published the
indicator rises Welfare and social reports: July, September (data year (t-1))
- Time published : November
- National Scale
and 33 province - August (HDI),
November (commodities review)
- Scale of national, provincial, and district / city
- 8 types of studies - Time published
welfare indicators and social report: June, August (datafor year (t-1))
Directorate of Statistical Analysis and Development

59
PROGRAM/ACTIVITY OUTCOME/ OUTPUT INDICATORS TARGET IMPLEMENTING
ORGANIZATIONAL UNIT 2010 2014
(1) (2) (3) (4) (5) (6) 5. Availability Model of
Economic and Social Statistics
regional development
5. Increased type model of
Economic Statistics, social, within the framework of National and Regional
- Time published Indonesia's economy published annual report: May (the data in(t-1))
- Time published an annual statistical Indonesia: September (data year (t-1), severalyears of data (t)
- Time published the
regional development indicators in December(data year (t-1))
- Total: 3 types of
economic models and 3 types of social model
- Level of presentation: national and provincial
- Time published theannual Indonesian economy report: April (the data in (t-1))
- Time-tick Indonesia published static know-nan: August (data year (t-1), a few years of data pa (t)
- Time published indicators regional development: October (data for year (t-1))
- Total: 8 types of economic models and 8 types of social models (cumulative 2011-2014)
- Level of presentation: national and provincial

60
PROGRAM/ACTIVITY OUTCOME/ OUTPUT INDICATORS TARGET IMPLEMENTING
ORGANIZATIONAL UNIT 2010 2014
(1) (2) (3) (4) (5) (6) PROGRAM MANAGEMENT SUPPORT AND IMPLEMENTATION OF OTHER TECHNICAL ACTIVITIES BPS-Statistics Indonesia
Realization of goodgovernance and clean government
1. Availability of applied of effective discipline system
2. Percentage drafting of institutional structure-tional proportionate, effective, and efficient
3. Availability of laws and regulations adequate in the field of statistics
4. Increasing the quality of management of administration, resources and support other tasks within the BPS -Statistics Indonesia
5. Implementation of programs and activities of Government agencies in the region of BPS -Statistics Indonesia
80 %
80 %
80 %
80 %
80 %
100 %
100 %
100 %
100 %
100 %
Principal Secretary
1. Preparation, Development and Evaluation Program and Budget
Establishment of activities and budget planning documents and evaluation of programs and activities consistent
1. Percentage of application SAKIP (Strategic Plan, Determination and Assessment of Performance, Contract Performance, Control)
2. Establishment of e-Government implementation plan is concrete and measurable
3. Documents timely action plan 4. The reduced frequency of
revision DIPA
80 %
80 % April year t-1 5 times
100 %
100 % January year t-1 2 times
Bureau of Program Management

61
PROGRAM/ACTIVITY OUTCOME/ OUTPUT INDICATORS TARGET IMPLEMENTING
ORGANIZATIONAL UNIT 2010 2014
(1) (2) (3) (4) (5) (6) 5. Percentage of documents in a
timely determination of performance
6. Percentage of timely performance (LAKIP) reports document
February year t+0
80 %
January year t+0
100 %
2. Financial Administration and Development Management
Increase the quality of budget management accountability
1. Management of archives anddocumentation already wearing with ICT-based systems
2. The implementation of the corresponding GAAP rules PIU Finance Minister
3. Percentage treasurer who has a certificate of government accounting
80 %
80 %
60 %
100 %
100 %
100 %
Bureau of Finance
3. Personnel Administration and Development Management
1. Application of regulationsregarding the discipline of civil servants
2. Application of integrity pacts for echelon I, II, andIII
1. The availability of measurableperformance appraisal system
2. System availability emphasis measurable discipline
3. Percentage of Echelon I, II, and III who sign and implement integrity pact
4. Percentage of employees whoassume a certain functional positions and obtain credit value according to its terms and to gain certificate increasing the hierarchy/rank compared to the number of employees
80 %
80 %
0 %
10 %
100 %
100 %
100 %
25 %
Bureau of Personel

62
PROGRAM/ACTIVITY OUTCOME/ OUTPUT INDICATORS TARGET IMPLEMENTING
ORGANIZATIONAL UNIT 2010 2014
(1) (2) (3) (4) (5) (6) 4. Public Service,
Public Relations and the Law
1. Publicity activities andperformance results in a timely BPS-Statistics Indonesia
2. Review of Law No. 16/1997 on Statistics before 2012
3. Statistics Act implementing
regulations in-complete before 2014
1. Press releases accelerated 2. Revision of Law No. 16/1997 in
2010, along with implementing legislation before 2012
3. Percentage of institutional
structures evolve a propor-tionate, effective and efficient
Press release isaccelerated 15-day quarterly data Revised Law Statistics announced by President in 2011
80 %
The press release isaccelerated 10-day quarterly data Regulation and to lose about organiza-tion of BPS-StatisticsIndonesia settled right before the 2014
100 %
Bureau of Public Relations and Legal Affairs
5 Implementation of Education and Training Reform
1. The implementation ofLeadership Training
2. The implementation of the
Technical Education and Training Statistics and Computing expert level
3. The implementation of Training for Statisticians and Computer
1. The number of officers who complete the training structuralleadership
2. Availability of merit-based system of training and competence
3. Percentage of certified
expertise appropriate functional official caste
10 %
1 % Echelon IV
50 %
30 %
10 % Echelon IV
100 %
Education and Training Center
6 Internal Service Office and Civil Service
Bureaucratic implementationof reforms to the BPS District/Municipality
Reform of the bureaucracy in BPS-Statistics Indonesia
25 % 100 % Secretary Korpri
7. Organizing Institute of Statistics (STIS)
Increasing human resourceneeds D IV STIS competent and ready to use, both for BPS -Statistics Indonesia and Outside BPS -Statistics Indonesia
1. The number of graduate students who are ready to use STIS per year
2. Percentage of graduation STIS3. Ratio student/faculty 4. The increased graduate
student from outside the BPS-Statistics Indonesia
290
95 % 1350/40 66/1350
500
100 % 2000/80
100/2000
Institute of Statistics

63
PROGRAM/ACTIVITY OUTCOME/ OUTPUT INDICATORS TARGET IMPLEMENTING
ORGANIZATIONAL UNIT 2010 2014
(1) (2) (3) (4) (5) (6) FACILITIES ANDINFRASTRUCTURE IMPROVEMENT PROGRAM APPARATUS BPS -Statistics Indonesia
fulfillment facilities andinfrastructure that support improved performance of technical activities
1. Percentage of state building (office and home office) that were heavily damaged
2. The fulfillment of supporting facilities and well maintained
10 % and 15 %
50 %
0 %
100 %
Principal Secretary
1.
Facilities andInfrastructure Improvement BPS -Statistics Indonesia State Apparatus and Other Office Operations
1. The creation of aconducive working environment and adequate home
1. Renovation and construction of office buildings and home state performing well
2. Supplies of facilities and infrastructure are met
3. Maintained, and availability of operational vehicles wheel wheels 2 and 4
1. 70% GK & RNcomplete renovation & construction
2. Genset district 484
3. 7330 2 wheel vehicles and 934 wheeled vehicles 4
1. 90% completedrenovation & built
2. Genset district
526 3. 7823 2 wheel
vehicles and 1000vehicles 4-wheel
Bureau of General Affairs
OVERSIGHT ANDACCOUNTABILITY IMPROVEMENT OF APPARATUS STATE PROGRAMS BPS -Statistics Indonesia
increased quality offinancial administration and accountability of goods to the orderly administration and Unqualified opinion on the Financial Statements
1. Increasing the quality of account-tabilitas administrative management of financial and goods to the orderly administration and Unqualified opinion on the Financial Statements
2. The percentage of CPC findings which were followed
90 %
90 %
100 %
100 %
Home Inspector
1.
Oversight AndAccountability Improved Apparatus BPS -Statistics Indonesia
1. Performance Oversightand Accountability BPS -Statistics Indonesia
1. Opinion CPC for BPS -Statistics Indonesia LK
2. Percentage deviation of total budget
3. Percentage of officials who have reported LHKPN
4. Percentage level key performance achievements
WDP10 %
50 %
90 %
WTP2 %
100 %
98 %
Inspectorate of Region I, Region II and Region III

64
Appendix 2 Development Funding Needs Year 2010-2014 BPS-Statistics Indonesia
(1000 Rp)
PROGRAM/ACTIVITY ALLOCATION
2010 2011 2012 2013 2014 (1) (2) (3) (4) (5) (6)
A. TECHNICAL PROGRAM 3.769.066.829 595.640.948 811.881.491 2.178.266.923 859.169.416 I. PROGRAM OF PROVIDING AND STATISTICAL INFORMATION
SERVICE (P2IS) 3.769.066.829 595.640.948 811.881.491 2.178.266.923 859.169.416
1 Development of Census and Survey Methodology 752.522 6.057.190 7.834.613 27.040.033 7.113.858 2 Service and Development of Statistical Information
Dissemination9.267.980 5.495.062 6.044.568 6.649.025 7.313.928
3 Development of Statistical Information Systems 5.704.004 6.925.636 7.062.917 7.511.631 7.452.938 4 Provision and Development of Population and Labor Statistics 3.356.231.465 85.742.408 77.611.322 64.173.437 75.948.619 - 2010 Population Census 3.300.000.000 25.000.000 15.187.128 - - - Inter-Census Population Survey - - - - 10.000.000
5 Provision and Development of Welfare Statistics 149.072.206 151.562.390 154.889.726 158.631.268 162.135.870 6 Provision and Development of Social Resilience Statistics 3.382.184 111.339.082 7.330.712 8.176.397 119.594.238 7 Provision and Development of Statistics of Food Crops,
Horticulture, and Plantation 84.864.720 43.800.336 141.524.315 290.250.411 245.479.718
- Census of Agriculture for Food Crops, Horticulture andPlantation
- 3.288.809 100.000.000 1.247.687.988 201.853.234
8 Provision and Development of Statistics of Animal Husbandry,Fisheries and Forestry
11.858.248 14.938.154 31.213.336 406.076.569 48.866.008
- Census of Agriculture Livestock, Fisheries and Forestry - 3.690.022 19.684.000 394.259.000 36.753.000 9 Provision and Development of Industrial Statistics Mining and
Quarrying, Energy and Construction.29.213.359 25.431.717 26.322.033 27.260.060 28.249.535
10 Provision and Development of Statistical Distributions 8.716.211 9.068.020 9.284.901 9.507.007 12.650.337 - 2016 Economic Census - - - - 5.000.000

65
PROGRAM/ACTIVITY ALLOCATION
2010 2011 2012 2013 2014 (1) (2) (3) (4) (5) (6)
11 Provision and Development of Price Statistics 27.354.863 52.608.618 256.698.927 87.675.748 56.581.958 - 2010 Cost of Living Survey - 9.358.189 104.814.655 23.996.673 12.441.750 - 2012 Weighting Diagram Farmers Term of Trade - 15.000.000 122.785.345 33.703.327 13.258.250
12 Provision and Development of Financial Statistics Information Technology and Tourism
57.311.038 16.371.295 17.857.966 18.876.052 20.001.142
13 Provision and Development of Production Accounts Statistics 14.756.025 26.065.642 27.525.233 24.738.978 25.608.051 14 Provision and Development Consumption Statistics 7.279.685 17.968.067 18.266.044 18.571.470 18.884.532 15 Development and Statistical Analysis 3.302.319 22.267.333 22.414.879 23.128.837 23.288.685
B. GENERIC PROGRAM 1.279.981.391 1.076.732.582 1.145.931.800 1.178.374.592 1.211.898.247
I. PROGRAM MANAGEMENT SUPPORT AND IMPLEMENTATION OF OTHER TECHNICAL ACTIVITIES BPS -Statistics Indonesia
915.131.874 819.618.468 887.139.832 987.862.826 1.019.623.686
1 Preparation, Development and Evaluation Program and Budget Activity
27.126.130 23.247.971 23.500.930 24.455.175 25.854.280
2 Financial Administration and Development Management 83.522.165 86.078.707 86.300.523 87.600.448 90.568.712 3 Personnel Administration and Development Management 3.858.314 6.988.820 6.881.299 8.100.076 8.764.511 4 Public Service, Public Relations, and Legal 3.197.680 3.393.151 3.500.149 3.825.267 3.554.047 5 Implementation of Education and Training Reform 14.155.495 15.851.420 16.286.355 16.788.730 17.297.545 6 Internal Services Office and Civil Service 18.826.529 43.557.900 98.517.690 181.449.459 193.594.405 7 Organizing Institute of Statistics (STIS) 13.178.700 13.126.592 13.587.339 14.009.956 14.553.508 8 Other Office Operations (Activity Across Bureau) 31.755.643 20.000.000 20.000.000 20.000.000 20.000.000 9 General Bureau (outside PSPA) 1.779.770 1.824.264 1.869.871 1.916.618 1.964.533 10 Management and Implementation Support Other Technical
Task BPS Province 229.508.754 135.418.258 137.327.913 140.739.222 144.253.188
11 Management and Implementation Support Other Technical Task BPS District / Municipality
488.222.694 470.131.385 479.367.764 488.977.876 499.218.957

66
PROGRAM/ACTIVITY ALLOCATION
2010 2011 2012 2013 2014 (1) (2) (3) (4) (5) (6)
II. FACILITIES AND INFRASTRUCTURE IMPROVEMENT PROGRAM APPARATUS (PSPA) BPS -Statistics Indonesia
359.740.885 251.876.365 253.423.274 185.008.856 186.634.077
1 Procurement and Facilities and Infrastructure Improvement Aparatus BPS -Statistics Indonesia (Center)
162.526.241 82.847.847 83.169.043 33.498.269 33.835.726
2 Procurement and Facilities and Infrastructure Improvement Aparatus BPS -Statistics Indonesia ( Province and District/ Municipalities)
197.214.644 169.028.518 170.254.230 151.510.586 152.798.351
III. OVERSIGHT AND ACCOUNTABILITY IMPROVEMENT OF APPARATUS STATE PROGRAM (P2A2N) BPS -Statistics Indonesia
5.108.632 5.237.750 5.368.694 5.502.911 5.640.484
1 Increased Oversight and Accountability Inspectorate I 1.702.877 1.745.917 1.789.565 1.834.304 1.880.161 2 Increased Oversight and Accountability Inspectorate II 1.702.877 1.745.917 1.789.565 1.834.304 1.880.161 3 Increased Oversight and Accountability Inspectorate III 1.702.877 1.745.917 1.789.565 1.834.304 1.880.161
TOTAL 5.049.048.220 1.672.373.530 1.957.813.291 3.356.641.515 2.071.067.663

67
NATIONAL STATISTICS SYSTEM