Blueprint 4: New Business Models - r3.0
122
Blueprint 4: New Business Models Integral Business Model Design for Catalyzing Regenerave & Distribuve Economies Final Report | 12 June 2018 Lead Authors | Bill Baue & Ralph Thurm | Reporng 3.0 Blueprint Series 2016-2018
-
Upload
khangminh22 -
Category
Documents
-
view
2 -
download
0
Transcript of Blueprint 4: New Business Models - r3.0

Blueprint 4: New Business Models
Integral Business Model Design for Catalyzing Regenerative & Distributive Economies
Final Report | 12 June 2018Lead Authors | Bill Baue & Ralph Thurm | Reporting 3.0
Blueprint Series 2016-2018

2
This document is licensed under a Creative Commons Attribution-ShareAlike 4.0 International License.
You are free to share (copy and redistribute the material in any medium or format) or adapt (remix, trans-
form, and build upon) the material with appropriate attribution. You must give appropriate credit, provide
a link to the license, and indicate if changes were made. You may do so in any reasonable manner, but not
in any way that suggests that the author or Reporting 3.0 endorse you or your use of our work product.
Baue, B. & Thurm, R. (2018): Blueprint 4. Integral Business Model Design for Catalyzing Regenerative & Distributive Economies. Reporting 3.0.
Copyright
© Reporting 3.0 Platform
www.reporting3.org

3
1. About the Reporting 3.0 Platform and its Blueprints series 5
1.1. Four Blueprints – one systemic approach 5
1.2. Pre-competitive, collaborative, multi-stakeholder, global public good 8
1.3. Audiences 8
1.4. Link to the economic system thinking 10
1.5. Leadership & responsibility of the corporate sector 10
1.6. The Reporting 3.0 integral design thinking 11
2. Executive Summary 13
3. Integral Business Models for Catalyzing a Regenerative & Distributive Economy 17
3.1. Background: The Birth of the New Business Models Blueprint 17
3.2. Literature Review 19
3.2.1. On Realities, Models, and Meta-Models 20
3.2.2. On Tools, Design Principles, and Patterns 23
3.2.3. On Methods and Innovation 24
3.2.4. Literature Review Clustering 25
3.2.4.1. Production-Service Systems 25
3.2.4.2. Sustainable Business Models Archetypes 25
3.2.4.3. Sustainable Value Assessments 27
3.2.4.4. Strongly Sustainable Business Model Canvas 30
3.2.4.5. Systems Theory-Based Business Model Generation 31
3.3. Viewing New Business Models Through the Reporting 3.0 Lens 34
3.3.1. Towards Sustainable Business Models – New ‘Corridors’ of Thinking 39
3.3.2. Defining ‘Integral Business Models’ 39
3.3.2.1. General Characteristics of Integral Business Models 41
3.3.2.2. Selected Implementation Methods 46
3.3.2.2.1. Governance & Strategy 46
3.3.2.2.1.1. From ESG Push to GSE Pull 47
3.3.2.2.1.2. Accountability Design & Strategic Duty 48
3.3.2.2.2. Risk & Innovation 50
3.3.2.2.2.1. ESG + ERM 52
3.3.2.2.2.2. Innovation 54
3.3.2.2.3. Scenario Analysis & Transition Planning 57
3.3.2.2.3.1. Taking the Long View: Scenario Analysis 57
3.3.2.2.3.2. From Scenario Analysis to Transition Plans 58
3.3.2.2.4. Roles & Strategic Leadership 59
3.3.2.2.4.1. Work Levels, Enterprise Value & System Value 59
3.3.2.2.4.2. Compensation & Incentives 60
3.4. Case Examples 60
3.5. Recommendations 68
TABLE OF CONTENTS
Blueprint 4: Integral Business Models for Catalyzing Regenerative & Distributive Economies

4
4. Reporting 70
4.1. Shortcomings of Existing Reporting Standards 70
4.2. The Green, Inclusive and Open Economy Principles and the Six Desiderata 71
4.3. The New Impetus: Purpose, Success Measurement, Scalability 73
4.4. The Strategy Continuum and the Integral Materiality Process 75
4.5. Recommendations 80
5. Accounting 82
5.1. Shortcomings of Current Accounting Standards 82
5.2. Creating the Basic Infrastructure that Integral Accounting Needs to Offer 83
5.3. Recommendations 88
6. Data 90
6.1. Shortcomings of the Existing Information System Infrastructure 90
6.2. Creating a Seamless Data Flow Between Micro, Meso and Macro 90
6.2.1. From the Daly Triangle to the Daly Hourglass 91
6.2.2. Integral Information Systems 94
6.3. Contextualization, Integration and Activation 98
6.4. Recommendations 100
7. Online repository 102
8. Annexes 102
8.1. Integral Business Model Template 102
8.2. Authors 118
8.3. Working Group Members 118
8.4. Steering Board 120
8.5. About OnCommons 121

5About the RepoRting 3.0 plAtfoRm And its bluepRints seRies
1. ABOUT THE REPORTING 3.0 PLATFORM AND ITS BLUEPRINTS SERIES
Continuous improvement is betterthan delayed perfectionism.
– Mark Twain
The Reporting 3.0 Platform was launched in 2012 to test a premise: that corporate disclosure plays a key
role in influencing the trajectory of the global economy; so, if the economic design is inherently flawed
and unsustainable, reporting (and its interrelated elements) can help resolve this dilemma. Furthermore,
if reporting regimes are not fit-to-purpose, they too can be reformed so as to play their proper function
in triggering a green, inclusive, and open global economy.
To explore this premise, Reporting 3.0 (R3) held three major international conferences through 2015,
gathering a diversity of international experts from four continents and 15 countries. In addition, R3 con-
vened various Transition Labs and Regional Roundtables during that period. In the process,1 R3 curated
a neutral, pre-competitive, global public good platform for diverse stakeholders to consider solutions
that build off the foundations of existing standards, frameworks, and practices whereby the reporting
field raises its level of ambition to play its rightful role in spurring a regenerative, distributive economy
that promotes thriving for all humanity economy.
The platform thus performs an “open” research and development (R&D) think tank function where
‘positive mavericks’ – who work productively (not obstructively) toward positive change; challenge
constraints, structural limitations, unconscious biases, and shadow agendas; think and act at systems
levels; and seek transformative (on top of incremental) change – collaborate to co-create a new operating
system that generates fit-to-purpose disclosure practices.
The third international conference in November 2015 represented a watershed, when the R3 commu-
nity determined that the premise holds sufficient validity to warrant ongoing exploration and advocacy.
Specifically, two determinations were made at the end of the conference:
• First, to better serve these interests and expand its global public good value, Reporting 3.0 spun off
from its incubation under BSD Consulting to become the inaugural flagship program of “OnCommons,”
a newly-formed independent not-for-profit, registered under German law as gGmbH (gemeinnützige
GmbH).
• Second, to shift into a more active “solutions-generation” mode, R3 decided to launch a work eco-
system consisting of four interdependent Blueprint Projects in the areas of reporting, accounting, data, and new business models.
1.1. FOUR BLUEPRINTS – ONE SYSTEMIC APPROACH
This four-pronged Blueprint design stems from the recognition that this quartet of areas are distinct yet
interconnected and interrelated elements of the overall disclosure regime, thus each element warrants
in-depth focus in its own right, following a standardized, systemic approach, before synthesizing the
resulting findings into a single report. Further, this recognition stems from the following outcomes of
the earlier R3 conference deliberations:
1 See http://www.reporting3.org for conference reports of 2014 and 2015. The 2013 conference was held in German
language only.

6 About the RepoRting 3.0 plAtfoRm And its bluepRints seRies
• Purpose: Sustainability and integral disclosure need a clearly defined “North Star”2 purpose. The
Reporting 3.0 community recognizes the absence of a clear end-goal in current sustainability and
integrated reporting standards, frameworks and practices. As government leaders at the United
Nations Conference on Sustainable Development (Rio+20) in 2012 proclaimed in The Future We Want
Outcome Document, the “overarching goal” is the achievement of a green and inclusive economy in
the context of sustainable development and poverty alleviation.3 Yet current reporting generally
lacks a direct connection to this purpose of creating a green, inclusive, and open economy. More
frankly stated: no business can be truly sustainable in an unsustainable world; consequently, there
will never be integral sustainability without a seamless connection to an economic system design
whereby market mechanisms “do the right thing” through price signals and monetary incentivization,
including subsidies and taxation.
• Sustainability Context Gap: While The Future We Want takes an overall macro perspective, sustainabil-
ity reporting and integrated reporting focus on the micro-level, organization-specific perspective, thus
creating a micro-macro gap between the UN goal and company reporting. The Global Reporting Initiative
(GRI) advocates for closing this gap with its Sustainability Context Principle, which calls for “discussing
the performance of the organization in the context of the limits and demands placed on environmental
or social resources at the sector, local, regional, or global level.” This addresses “the underlying question
of … how an organization contributes … to the improvement or deterioration of economic, environmen-
tal and social conditions, developments and trends.” However, “[r]eporting only on trends in individual
performance (or the efficiency of the organization) fails to respond to this underlying question.”4
However, “to this day in the reporting world … Sustainability Context is incipient, uneven, and occa-
sional,” said GRI Co-Founder and Inaugural Chief Executive Allen White (a Reporting 3.0 Validator).5
Today, sustainability and integrated reports describe company-specific incremental progress on
issue-specific urgencies such as global warming, water shortages, biodiversity loss, human rights
abuses and corruption; however, it is rare that companies account for their own proportionate con-
tribution to these macro problems – and thus neither to their solutions.
• Risk Management & Integral Materiality: Material environmental, social and governance (ESG) infor-
mation doesn’t yet automatically link through to fiduciary duties, creating a disconnect from risk
management due to shortcomings in this materiality determination. In consequence, now underscored
by new research by the World Business Council for Sustainable Development (WBCSD) amongst its
member companies, only 29% of the companies who outline material sustainability risks in sustainabil-
ity reporting reflect the same information in their legal filings or disclosures.6 While 89% of companies
indicate that sustainability issues could have a financial impact on their business, 70% don’t believe
their risk management practices are adequately addressing those risks. This gaping gulf represents
a stark reality check on the general failure of companies to link their sustainability efforts to their
broader business disciplines and standard practices (such as Enterprise Risk Management). Attendees
2 We acknowledge that the term ‘North Star’ is more come in the Northern hemishere, whereas the ‘Southern Cross’
might be better fitting in the Southern hemisphere.
3 United Nations General Assembly, The Future We Want, 27 July 2012. http://www.un.org/ga/search/view_doc.
asp?symbol=A/RES/66/288&Lang=E
4 Global Reporting Initiative, Sustainability Context Principle, https://g4.globalreporting.org/how-you-should-report/
reporting-principles/principles-for-defining-report-content/sustainability-context/Pages/default.aspx
5 Bill Baue and Allen White, “#SustyGoals 2: A Dialogue with Allen White Of GISR, The Godfather Of Sustainability
Context,” Next-Generation Sustainability Targets: Toward Big, Context-Based Goals, Sustainable Brands, 2014.
http://e.sustainablebrands.com/resources-ebook-next-generation-sustainability-targets.html
6 WBCSD, Sustainability and Enterprise Risk Management – The First Step Towards Integration. http://www.wbcsd
.org/Projects/Non-financial-Measurement-and-Valuation/Resources/Sustainability-and-enterprise-risk-
management-The-first-step-towards-integration

7About the RepoRting 3.0 plAtfoRm And its bluepRints seRies
at Reporting 3.0 convenings consistently stressed the need for convergence of risk management,
governance and remuneration with integral material sustainability, based on sound contextualization
and proper impact assessments.
• Collaboration & Ambition: Reporting 3.0 convenings revealed broad perception of lagging collabora-
tion and plateauing ambition levels amongst reporting and accounting standard setters, data analysts
and information system architects, and new business model intrapreneurs and entrepreneurs, which
are falling short on clarifying purpose, implementing sufficient success measurement, and achieving
scalability at rates needed to be “on target” for ensuring the sustainability of the human race. That is
what the four Blueprints aim to address collectively in order to align with the disclosure needs for a
green, inclusive & open economy designed for regenerative and distributive capitalism.
• Integral Blueprints: The emergence of a third generation of “integral reporting” (after the first gen-
eration of financial reporting and the second generation of sustainability and integrated reporting)
requires a fluid exchange of learning in all four areas described by the below Blueprint design. We
also believe there needs to be a revolving process to update the Blueprints about every 3 years, given
the speed of developments in all areas related to this set of recommendations.
@2017 Reporting 3.0
Figure 1: The Reporting 3.0 Blueprint Ecosystem (Source: Reporting 3.0)
BLUEPRINT 1: Reporting
BLUEPRINT 2: Accounting
BLUEPRINT 3: Data
BLUEPRINT 4: New Business Models
A principles-based approach to reporting serving a green, inclusive & open economy
Data integration, contextualization & activation for multicapital accounting
Integral Business Model Design for Catalyzing Regenerative & Distributive Economies
BLUEPRINT 5: Synthesis of BP1 - BP4: The Transformation Journey
The Blueprint for New Accounting: Laying the foundations for Future-Ready Reporting
GREEN, INCLUSIVE & OPEN ECONOMY /
REGENERATIVE & DISTRIBUTIVE FINANCE SYSTEM / MULTICAPITALISM

8 About the RepoRting 3.0 plAtfoRm And its bluepRints seRies
1.2. PRE-COMPETITIVE, COLLABORATIVE, MULTI-STAKEHOLDER, GLOBAL PUBLIC GOOD
Don’t compete! Create! Find out what everyone else is doing and then don’t do it!– Joel Weldon
Reporting 3.0 does not seek to create yet another reporting or accounting standard, data analytics
product or new business model canvas. We are building on the strong shoulders of the existing report-
ing, accounting and data infrastructure as well as existing ideas around future business modeling. We
simply believe that the combination of these siloed pockets of expertise isn’t yet working towards the
end-goal of necessary systems change at sufficient pace. As a consequence, humanity remains on a blind
flight. These 55 years after Rachel Carson’s book Silent Spring, 45 years after Limits to Growth, 30 years
after the Brundtland Report and 25 years after the first Rio Conference, it is still impossible to properly
assess whether a company is sustainable or not. We therefore aim to boost cross-fertilization of these
four as-yet distinct markets through crowd-sourced and well curated collaboration. So far, we see the
Reporting 3.0 Platform as the only pre-competitive and open global public good community with this
holistic ambition. Through our conferences and discussions, we know that there’s isn’t yet a curriculum
that also offers this needed breadth between micro, meso, and macro aspects, cross-cutting economic
theory, social and environmental education as well behavioral science. It is these lacks – of language,
of forums to meet, and of sheer awareness of the magnitude of the urgency for global change – that
holds colleagues back from even addressing what Reporting 3.0 aims to achieve. Institutional inertia,
even in the seemingly forward-looking realms of ESG and corporate “sustainability,” create blockages
to progress, triggering the emergence of positive maverick stances and actions from those who share
the understanding that incremental change is necessary but insufficient. Reporting 3.0 aims to make a
real difference here.
Reporting 3.0 offers flexible engagement opportunities via Sponsor Partners, Working Group Partners,
Validation Partners, Pilot Project & Beta Testing Partners, Advocation Partners, and through various
public engagement opportunities such as virtual dialogues, events and public comment periods. We aim
to update the Blueprints every three years and disseminate them as a package to the constituencies that
work with us and our target audiences. We hope to stimulate market reaction accordingly, so that the
Blueprint recommendations will effect positive change of multiple actors while also catalyzing necessary
systems change.
1.3. AUDIENCES
The Blueprint ecosystem addresses four major areas that represent a baseline of the minimum necessary
ambition to achieve a sustainable economy (much less a thriving society). These four areas attract the
following audiences:
• Reporting: Reporting standards setters, reporters, governments (including statistics offices), NGOs,
academics, and financial markets players (including investors as well as credit and sustainability
rating agencies);
• Accounting: Accounting standard setters, accountants, CFOs, controllers; academics in accounting
and controlling;
• Data: reporting standard setters, companies, CIOs, investors, software and analytics firms, data
science experts, academics;

9About the RepoRting 3.0 plAtfoRm And its bluepRints seRies
• New Business Models: Circular, sharing and collaborative economy entrepreneurs, business model
designers, investors, NGOs, new business model initiatives, corporate intrapreneurs, funders, venture
capitalists, academics.
We believe that without these four areas in combination, breakthrough thinking and action will not
emerge. As an outcome, the new ‘common ground’ disclosure has to aim for a seamless information
flow between corporations and their related supply and demand chains / cycles (micro level), industries,
regions and habitats (meso), and nation states and global social and environmental ecosystems (macro).
We expect to address the outcomes of the Reporting 3.0 Blueprint deliberations to these actors in one
major dissemination rollout after the completion of all four Blueprint Projects; but for now, the main
Blueprint chapters address the primary parties that need to contribute to breakthroughs in disclosure by
actively applying our recommendations. These are reporting standard setters; governments, legislators
and multilateral organizations; corporations; and finally, investors and other stakeholders.
Of course, we invite all other constituencies (e.g. NGOs, academics, data scientists and statisticians,
economists, consultants, etc…) to use the recommendations to inform their own practices. They are also
invited to contribute to the outcome of the Blueprints and support the dissemination of their outcomes.
Figure 2: The implementers, users and beneficiaries of the Reporting 3.0 Blueprints in order to serve the
Commons and a ‘life-enhancing’ green, inclusive and open economy. (Source: Reporting 3.0)
INDUSTRIES
GLOBAL COMMONS
PLANET EARTH / ECOSYSTEM
BENEFICIARIES
CITI
ES, R
EGIO
NS,
HA
BITA
TS
INDUSTRIES & INVESTORS
SECTORS, PORTFOLIOS, HABITATS
ACCELERATORS
USERS
HU
MA
NIT
Y /
SOCI
ETY
GRE
EN, I
NCL
USI
VE
& O
PEN
ECO
NO
MY
GO
VER
NM
ENTS
, MU
LTIL
ATER
ALS
& F
OU
ND
ATIO
NS
CIV
IL S
OCI
ETY
REPORTING STANDARDSETTERS
ACCOUNTING STANDARDSETTERS
DATA ARCHITECTSSTATISTICS OFFICES
NEW BUSINESS MODELENTREPENEURS &
INTRAPENEURS
CORPORATIONS: BOARDS & MANAGEMENT
ORGANIZATIONS
REPORTING BP DATA BP
NEW BUSINESSMODELS BP
ACCOUNTING BP
IMPLEMENTERS
THE BLUEPRINTS
REPORTING 3.0 BLUEPRINT ECOSYSTEM
@2018 Reporting 3.0
NANO
MICRO
MESO
MACRO

10 About the RepoRting 3.0 plAtfoRm And its bluepRints seRies
1.4. LINK TO THE ECONOMIC SYSTEM THINKING
The question is how to make the human race concur in its own survival?– Bertrand Russell
Failures of economic system thinking, ecological system thinking and education system thinking are
the main reasons for the failure of sustainability. We coin the term “triple-e-failure” to describe this
triumvirate of shortfalls. Sustainability, in the way it is applied in corporations, in standard setting, in
data collection and information systems, in business model creation, is only a redux version of what it
was originally meant to be. The shift from the original three-pronged focus on people, planet and pros-perity to people, planet and profit, totally lost the prioritization on overall well-being through inter- and
intra-generational equity. This shift in emphasis has enabled the “fatal” incrementalism that creates the
“illusion of progress” while failing to truly solve global challenges, subordinated as it is to status quo
economic system thinking.
However, capitalism, if focused on the right outcomes through the right incentives, can generally sup-
port a green, inclusive & open economy. Regenerative capitalism, a concept promoted most visibly by
John Fullerton of the Capital Institute (who keynoted the 2015 Reporting 3.0 Conference), provides a
solution geared toward financial market transformation. Overall, the main ingredients of the necessary
readjustment for creating a new level playing field globally include:
• An adjustment of cost calculation by internalizing a full spectrum of externalized costs into cost
accounting;
• The addition of benefit accounting;
• The translation into pricing; and
• An adjusted tax regime that burdens resource use while liberating tax on labor.
In sum, achieving sustainability requires ambitious scalability by incentivizing leaders and nurturing
comprehensive followership through this new level playing field. This is one of the blunt truths we need
to understand. Reporting 3.0 is therefore taking those necessities into account in the design of the
Blueprints. They are integral parts of the “North Star”7 understanding.
1.5. LEADERSHIP & RESPONSIBILITY OF THE CORPORATE SECTOR
You cannot escape the responsibility of tomorrow by evading it today!– Abraham Lincoln
At Reporting 3.0, we see a necessary interplay between the macro, meso and micro levels, organized
both through the “push” of international policy, regulation and implementation standards, as well as the
“pull” of fit-to-purpose innovation in new business models and governance systems aligned to the thriv-
ing, climate-resilient economy and society currently envisioned to emerge by mid-century. The existing
economic system design has so far not enabled the emergence of true sustainability, but instead actively
acts against a green, inclusive & open economy by neglecting the needs to a) serve the well-being of
every global citizen; b) work within the cycles of nature; and c) align financial systems to serve the goals
of a regenerative and distributive real economy. But very importantly, all that interplay needs leadership,
and we think the corporate sector shows promise of supplying such leadership from enlightened boards
7 We acknowledge that the term ‘North Star’ is more come in the Northern hemishere, whereas the ‘Southern Cross’
might be better fitting in the Southern hemisphere.

11About the RepoRting 3.0 plAtfoRm And its bluepRints seRies
and CEOs (incited by informed institutional investors) who recognize that future value creation requires
significant transformation at the individual business model (micro), industry (meso), and economic
system (macro) levels.
According to Reporting 3.0 Partner Organizational Capital Partners, “[f]orty years of strategic leadership,
cognitive capacity, and crystallized intelligence research has identified that less than five percent of the
world’s adult population has the critical thinking capacity to perform complex work and investment
decision making at the higher levels of innovation and systems thinking complexity [that] is required
for conceptualizing and implementing new business and economic models.”8 So the trick is to identify
leaders with the cognitive capacities to think in inter-generational terms.
Leaders will understand that they will need to take action to advise of the overall economic system
conditions, defining the necessary level playing field, in order to scale up sustainable policy making,
technological changes and financing mechanisms. For their own organizations, the real challenge is
how to become sustainable beyond reducing negative impact and how to excel through transformation
capabilities that allow the organization to lead. Leadership excellence and organizational transformation
capabilities are necessary ingredients of being “future ready.” So far, reporting standards don’t have
any disclosure available for investors and other stakeholders to show where an organization stands on
its pathway to be future ready. These are additional ingredients and new reporting elements that need
coverage in an interplay between purpose, success measurement and scalability of any organization.
1.6. THE REPORTING 3.0 INTEGRAL DESIGN THINKING
Where is the life we have lost in living?Where is the wisdom we have lost in knowledge?
Where is the knowledge we have lost in information?– T.S. Eliot
In sum, Reporting 3.0 aims to make an impact through the four Blueprints that make up the design eco-
system of fit-to-purpose disclosure for a green, inclusive and open economy. Figure 3 summarizes the
basic assumptions, the consequences, outcomes and impacts of our design thinking: achieving integral
thinking in all sorts of organizations through a new level of transparency currently unknown; integral
materiality deliberations that take a systems approach to assess and prioritize, integral data systems
that allow for a seamless flow of information from the micro to the meso to the macro level; and finally
integral business model creation that benefits from such new disclosures.
8 Network for Sustainable Financial Markets (NSFM), Submission to Members of the Task Force on Climate-Related
Financial Disclosures (TCFD) in response to Public Consultation on Task Force Recommendations, 12 February 2017

12 About the RepoRting 3.0 plAtfoRm And its bluepRints seRies
Figure 3: The integral design thinking of Reporting 3.0 (Source: Reporting 3.0)
@2017 Reporting 3.0
ASSUMPTION: Disclosure serves higherpurpose, describing contribution to agreen, inclusive + open economy
ASSUMPTION: Data availability is not a restriction anymore; sensors, AI, big dataallow for any necessary data to be made available
CONSEQUENCE: Need to describe· Purpose through connectedness· Success as total contribution and future value· Scalability is essential through advocation
CONSEQUENCE: Need to showcase· Seamless data flows (micro, meso, macro)· Contextualization of data· Integration, activation + acceleration
ASSUMPTION: Accounting needs to serveaccountability on micro, meso and macro level.The well-being intention needs to be accountedfor on the basis of various capitals
ASSUMPTION: Sustainable, net positive and gross positive businesses have a future license to grow, while others will disappear
CONSEQUENCE:Need to account for· Impacts across multiple capitals· Embracing multiple objects/units· Integral P/L + balance enlarge focus
CONSEQUENCE: Need to spur· 2 degree global warming adaptability· Growth in well-being is ultimate goal· Taxation needs to benefit NBMs· Economic system design change essential
INTEGRALTHINKING
INTEGRALMATERIALITY
INTEGRALBUSINESS MODELS
IMPACTS
INTEGRALDATA SYSTEMS
OUTCOME: Reporting clarifies· Contribution on micro / meso / macro level· Instigation of new level playing field discussion
OUTCOME: Data allow for
OUTCOME: Accounting supports OUTCOME: NBM clarification leads to
· Seamless data on micro / meso / macro · Flows do not allow collateral damage· Support of wellbeing through contextualized data
· Embedded micro / meso / macro accounting· New necessary conventions and iterative learning over time
· Non 2-degree adaptable business will dissapear· Scaling up of compatible NBM· Circular, sharing, collaborative BMs will flourish
DATABLUEPRINTREPORTIN
G
BLUEPRIN
T
ACCOUNTING
BLUEPRIN
T NEW BUSINESS
MODELS BLUEPRINT
REPORTING 3.0 BLUEPRINT IMPACT ASSESSMENT

13ExEcutivE Summary
2. EXECUTIVE SUMMARY
Business models provide an effective way to assess actual companies against generalized strategies and
structures that have proven successful, in order to identify optimization opportunities and ultimately
build better companies. But existing companies, business models, and even business model canvasses
operate in a flawed economic system that predominantly generates value in certain capitals (typically
short-term financial capital) by degenerating value in other capitals (typically natural, human, social, and
even long-term financial capital) in ways that are demonstrably undermining the carrying capacities of
those capitals. So generalizations (business models and canvasses) based on current economic system
design and practices inherently embed the DNA of this flawed system and thereby reinforce it.
Figure 4: Business Model Development (Source: Reporting 3.0; inspired by Antony Upward, Towards an Ontology and Canvas for Strongly Sustainable Business Models: A Systemic Design Science Exploration, 2013)9
So, society faces significant innovation challenges, first and foremost around innovating economic rede-
sign principles, strategies, and promising interventions. The first three focus areas in the Reporting 3.0
Blueprint series – Reporting, Accounting, and Data – lay out Recommendations anchored in such economic
redesign principles, and backcast from them to identify generalized strategies and practices that all share
the goal of catalyzing economic system level transformation to a Green, Inclusive, and Open Economy.
The New Business Models Blueprint builds on the foundation of the first three Blueprints to propose a new
approach to business models that integrates considerations from multiple perspectives. Accordingly, we
establish a working definition of what we call Integral Business Models.
9 Antony Upward, Towards an Ontology and Canvas for Strongly Sustainable Business Models: A Systemic Design Science
Exploration, 2013. Fig 3-10, p113. http://hdl.handle.net/10315/20777 Accessed 22 May 2018.

14 ExEcutivE Summary
To set a baseline, the New Business Models Blueprint conducts a comprehensive literature and practice
review to assess the current state of play and thinking around sustainable business models, and identifies
five clusters of thinking and practice. The Blueprint then draws from the other three Blueprints to collate
a set of aspects that add economic system redesign considerations to the existing current new business
models practice / thinking.
Figure 5: Business Model Literature Clustering and Integral Business Model Differentiators (Source:
Reporting 3.0)
The Blueprint consolidates eight General Characteristics of Integral Business Models:
Figure 6: Eight General Characteristics of Integral Business Models (Source: Reporting 3.0)

15ExEcutivE Summary
The Blueprint then identifies a selected set of Implementation Methods for seeding Integral Business Models in both bottom-up approaches by entrepreneurs incubating startups and early stage companies,
and inside-out approaches by intrapreneurs to transform existing business models for navigating the
transition of emerging economic, social, and ecological realities. The Implementation Methods fall into
the following broad categories, with more specific categories (including, for example, performance and
compensation metrics):
• Governance & Strategy
• Risk & Innovation
• Scenario Analysis & Transition Planning
• Roles & Strategic Leadership
To support integration of both General Characteristic assessment and Implementation Methods, the
Blueprint provides an Integral Business Models Process Flowchart, and well as a Template for hands-on
guidance. To “road-test” these materials, and illustrate movement toward Integral Business Models (since
none currently exist), the Blueprint includes three Case Examples of startup / early enterprises (VDMbee,
ReBlend, and Co-op Power) self-administering (in a structured process) the Process Flowchart and
Template.
The key deliverable of Blueprints are Recommendations that arise from broad vetting during the 12-month-
plus Blueprint development process with the Working Group of 40-plus global experts featuring two
Exposure Drafts accompanied by In-Person Meetings (in Copenhagen and Boston) and Virtual Dialogues
(on Convetit) as well as Public Comment opportunities. The Blueprint addresses Recommendations to
key Constituencies: Corporates (Entrepreneurs and Intrapreneurs), Investors, Standards, Government/
Multilaterals/Foundations, and NGOs.
Figure 7: Business Model Transformation Scalability (Source: Reporting 3.0)

16 ExEcutivE Summary
After formulating broad Recommendations in Chapter 3, the Blueprint assesses Integral Business Models
through the lenses of the other three Blueprints (on Reporting, Accounting, and Data) in Chapters 4, 5
and 6 (respectively). Each chapter ends with specific Recommendations on how entrepreneurs and
intrapreneurs can use the tools from the other Blueprints in the various phases of the Integral Business
Model lifecycle. The Process Flowchart and Template consequently pick up on these Recommendations.
The ultimate goal of the New Business Models Blueprint is to scale up Integral Business Models from the
micro level to the meso level to create new Industry Ecosystems and to the macro level to catalyze new
Integral Economies.
17Integral BusIness Models for CatalyzIng a regeneratIve & dIstrIButIve eConoMy
3. INTEGRAL BUSINESS MODELS FOR CATALYZING A REGENERATIVE & DISTRIBUTIVE ECONOMY
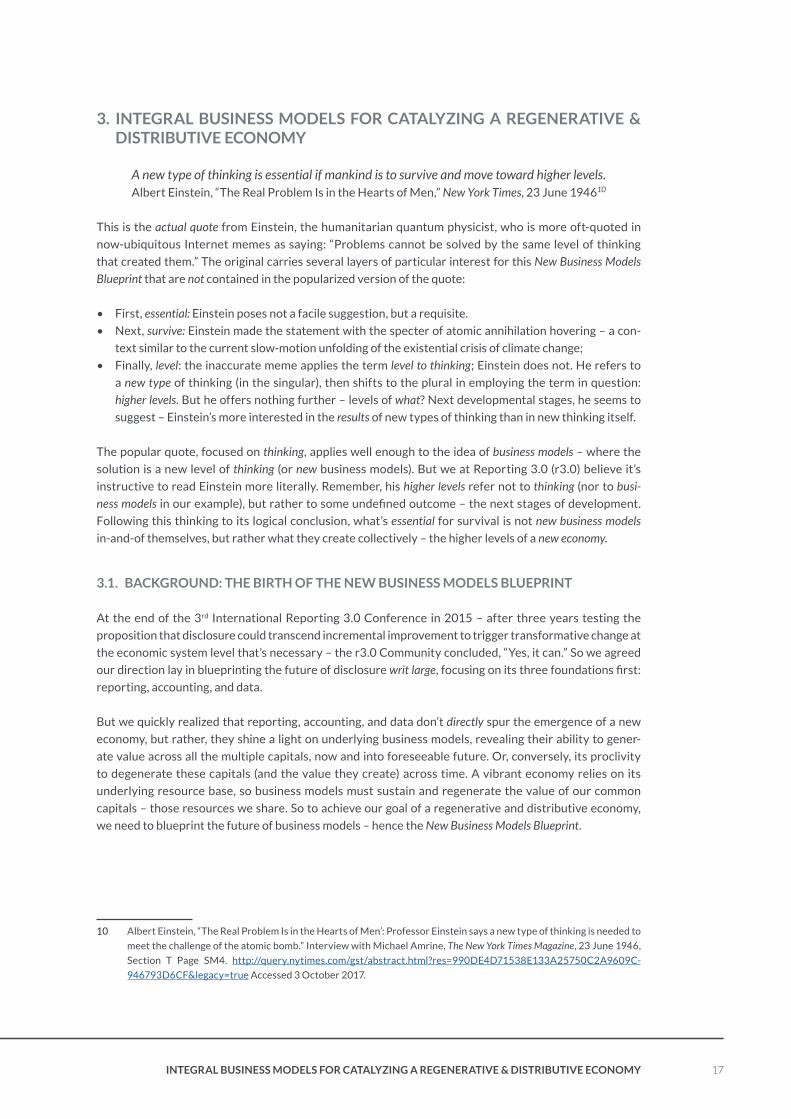
A new type of thinking is essential if mankind is to survive and move toward higher levels.Albert Einstein, “The Real Problem Is in the Hearts of Men,” New York Times, 23 June 194610
This is the actual quote from Einstein, the humanitarian quantum physicist, who is more oft-quoted in
now-ubiquitous Internet memes as saying: “Problems cannot be solved by the same level of thinking
that created them.” The original carries several layers of particular interest for this New Business Models Blueprint that are not contained in the popularized version of the quote:
• First, essential: Einstein poses not a facile suggestion, but a requisite.
• Next, survive: Einstein made the statement with the specter of atomic annihilation hovering – a con-
text similar to the current slow-motion unfolding of the existential crisis of climate change;
• Finally, level: the inaccurate meme applies the term level to thinking; Einstein does not. He refers to
a new type of thinking (in the singular), then shifts to the plural in employing the term in question:
higher levels. But he offers nothing further – levels of what? Next developmental stages, he seems to
suggest – Einstein’s more interested in the results of new types of thinking than in new thinking itself.
The popular quote, focused on thinking, applies well enough to the idea of business models – where the
solution is a new level of thinking (or new business models). But we at Reporting 3.0 (r3.0) believe it’s
instructive to read Einstein more literally. Remember, his higher levels refer not to thinking (nor to busi-ness models in our example), but rather to some undefined outcome – the next stages of development.
Following this thinking to its logical conclusion, what’s essential for survival is not new business models in-and-of themselves, but rather what they create collectively – the higher levels of a new economy.
3.1. BACKGROUND: THE BIRTH OF THE NEW BUSINESS MODELS BLUEPRINT
At the end of the 3rd International Reporting 3.0 Conference in 2015 – after three years testing the
proposition that disclosure could transcend incremental improvement to trigger transformative change at
the economic system level that’s necessary – the r3.0 Community concluded, “Yes, it can.” So we agreed
our direction lay in blueprinting the future of disclosure writ large, focusing on its three foundations first:
reporting, accounting, and data.
But we quickly realized that reporting, accounting, and data don’t directly spur the emergence of a new
economy, but rather, they shine a light on underlying business models, revealing their ability to gener-
ate value across all the multiple capitals, now and into foreseeable future. Or, conversely, its proclivity
to degenerate these capitals (and the value they create) across time. A vibrant economy relies on its
underlying resource base, so business models must sustain and regenerate the value of our common
capitals – those resources we share. So to achieve our goal of a regenerative and distributive economy,
we need to blueprint the future of business models – hence the New Business Models Blueprint.
10 Albert Einstein, “The Real Problem Is in the Hearts of Men’: Professor Einstein says a new type of thinking is needed to
meet the challenge of the atomic bomb.” Interview with Michael Amrine, The New York Times Magazine, 23 June 1946,
Section T Page SM4. http://query.nytimes.com/gst/abstract.html?res=990DE4D71538E133A25750C2A9609C-
946793D6CF&legacy=true Accessed 3 October 2017.

18 Integral BusIness Models for CatalyzIng a regeneratIve & dIstrIButIve eConoMy
The Reporting, Accounting, and Data Blueprints are consciously sequenced to first focus on identifying
the North Star11 – the organization’s core purpose – and then on how it impacts the world at the micro-
(company), meso- (industry / portfolio / habitat), and macro- (systems) levels. This holistic approach,
linking the part to the whole, calls for aligning business models with the world they live in – and the
economy they co-create. Indeed, if a degenerative economy derives from business models that degen-
erate capital resources in Earth’s systems, then business models that regenerate capitals and systems
can collectively create a regenerative economy that distributes value inclusively. And reporting on how
business models generate value across all the capitals is the key.
So this New Business Models Blueprint development process starts off with a comprehensive literature
review, to identify how new business models are currently defined, and further, how they are linked
into our broader economic system. The literature collection process spanned several months, with key
recommendations from the 40-plus members New Business Model Working Group (see the Appendix 9.3.
for a full list). We have structured and clustered the existing literature in an attempt to see if and how
the New Business Model Blueprint adds additional value and an additional layer of Einstein’s “new type of
thinking” to spur the broader economic system to “move toward higher levels.” Building on the strong
foundation of knowledge in the existing literature, we then propose an Integral Business Model Design, which augments additional elements. This segment of the chapter takes the reader there step by step.
In addition to this analysis of the literature, we also integrate the work already done in this first cycle of
the Reporting 3.0 Blueprint developments, namely excerpting valuable content from the final reports (in
first phase of an extended process that updates Blueprints on a biennial cycle) of the Reporting Blueprint
and Data Blueprint and the Accounting Blueprint. We are embedding concepts from those earlier Blueprints
into this Blueprint, such as:
• The Reporting Blueprint’s ◦ Six Desiderata of a Green, Inclusive and Open Economy;
◦ Web of 9 Principles;
◦ Strategy Continuum;
◦ Micro- / Meso- / Macro-Level Linkage;
◦ Integral Materiality Process (a Plan-Do-Check-Act Deming Wheel of Action as known from Quality
Management);
• The Data Blueprint’s Integral Data as visualized with the Daly Hourglass for a seamlessly interconnected
data architecture and information system; and
• The Accounting Blueprint’s next-generation approach that integrates sustainability, management, and
financial accounting.
And as with the other Blueprints, the opening chapter (where we are currently in this Blueprint) is the
longest, as it lays out the overarching thinking – in this instance, clarifying what defines and constitutes
new business models that truly serve a green, inclusive and open economy. Using the literature review
as our launching pad, we project the necessary next steps of business model development – to what we
call Integral Business Models.
We so name them because they integrate the “Four Quadrants” of Integral Theory, which span from the
individual to the collective and from the interior to the exterior.12
Integral Business Models amalgamate elements from all quadrants, while also attending to individual and
collective (cultural) developmental stages, such as the Work Levels approach and others addressed later.
11 Or Southern Cross in the other hemisphere
12 Ken Wilber, “What Are the Four Quadrants?” Integral Life, 28 October 2014 https://integrallife.com/four
-quadrants/ Accessed 4 October 2017.

19Integral BusIness Models for CatalyzIng a regeneratIve & dIstrIButIve eConoMy
The outcomes of this Blueprint’s deliberations are a set of highly vetted Recommendations. As in other
Blueprints, these are mainly directed to a primary audience – in this case, Integral Business Model
entrepreneurs and intrapreneurs – but we also address the Recommendations to standard setters, gov-
ernments, multilaterals, investors and non-governmental organizations, to account for all rightsholder
perspectives.
Figure 8: The Four Quadrants of Integral Theory (Source: Ken Wilber, “What Are the Four Quadrants?”
Integral Life, 2014.13)
3.2. LITERATURE REVIEW
The concept of business models is a relatively recent development, emerging in the dot.com bubble, while
tracing its roots earlier to Peter Drucker’s “theory of the business” and Michael Porter’s definition of
strategy.14 “All it really meant was how you planned to make money,” writes Michael Lewis now, casting
back to the “term of art” he originally addressed back in 1999.
13 Ken Wilber, “What Are the Four Quadrants?” Integral Life, 28 October 2014 https://integrallife.com/four-quad-
rants/ Accessed 4 October 2017.
14 Andrea Ovans, “What Is a Business Model?” Harvard Business Review, 23 January 2015. https://hbr.org/2015/01/
what-is-a-business-model Accessed 3 October 2017.

20 Integral BusIness Models for CatalyzIng a regeneratIve & dIstrIButIve eConoMy
The year before, in his book Cannibals with Forks, John Elkington coined the term “Triple Bottom Line,”
which laid out the conceptual framework for designing business models that seek to create value across
economic, social, and ecological dimensions.15 Since then, the literature on business models has bur-
geoned, increasingly focusing on new business models and sustainable (or even flourishing) business
models.16
Early in this Millennium, Alex Osterwalder proposed a business model “design template” – or “canvas”
– based on his business model ontology in his 2004 doctoral dissertation.17 Osterwalder’s Business
Model Canvas18 focused at the micro level of the company, without integrating the meso or in partic-
ular macro / systems level dynamics, Antony Upward noted – and so asserted in his 2016 Ontology for Strongly Sustainable Business Models (with co-author Peter Jones) that led to his Flourishing Business
Model Canvas. We go into these in more depth in the literature review proper, but for now, we refer
to this work to establish a key definition “strong sustainability” as compared to “weak sustainability,”
which the Reporting 3.0 Data Blueprint has already delved into, citing Simon Dresner in The Principles of Sustainability thus:
There is controversy about whether to consider human-made capital and natural capital together
(weak sustainability) or separately (strong sustainability). If they are counted together then increases
in human-made capital can compensate for running down natural capital. Is that legitimate? Are the
two kinds of capital substitutable in that way?
This distinction is important to establish in an initial broad mapping of the landscape we’re traversing,
before diving into the literature review proper.
3.2.1. ON REALITIES, MODELS, AND META-MODELS
Specifically, it’s helpful to distinguish between three levels when discussing business models: reality
(actual companies), theory / model (business models), and meta-theory / meta-models (models of models,
or ontologies). New Business Models Blueprint Working Group Member Antony Upward explains it thus:
1. We have enterprises / businesses / organizations. These exist in the world. They operate. They have
human stakeholders ... Enterprises take biophysical stocks and move and transform them as resources.
They rely on flows of ecosystem services to enable their activities. etc. etc.
2. Then we have business models. Each enterprise has a business model (or perhaps more than one),
whether or not it is understood ... One can say a business (#1) is an instantiation of a business model
(#2).
3. Then we have meta-models - models of models. This is where Osterwalder’s Business Model
Ontology and my more recent Strongly Sustainable Business Model Ontology exist… Ontologies
[#3] are models of business models - they claim to identify the necessary and sufficient factors in a
business model (#2).19
15 John Elkington, Cannibals with Forks: The Triple Bottom Line of 21st Century Business, Capstone Publishing, 1999.
16 Cite Antony Upward
17 Alexander Osterwalder, The Business Model Ontology: A Proposition In A Design Science Approach, Diplômé
postgrade en Informatique et Organisation (DPIO) de l'Ecole des HEC de l'Université de Lausanne, Pour l’obtention
du grade de Docteur en Informatique de Gestion, 2004. http://www.hec.unil.ch/aosterwa/PhD/Osterwalder_
PhD_BM_Ontology.pdf Accessed 9 February 2018.
18 Antony Upward & Peter Jones, “An Ontology for Strongly Sustainable Business Models: Defining an Enterprise
Framework Compatible With Natural and Social Science,” Organization & Environment, 2016, Vol. 29(1) 97–123.
19 Antony Upward, Reporting 3.0 New Business Models Blueprint Exposure Draft 1.0 Review, Convetit, 15-20 October
2017. https://convetit.com/reporting-30-new-business-models-blueprint-exposure-draft-10-review-714.html

21Integral BusIness Models for CatalyzIng a regeneratIve & dIstrIButIve eConoMy
Figure 9: Business Model Development (Source: Reporting 3.0; inspired by Antony Upward, Towards an
Ontology and Canvas for Strongly Sustainable Business Models: A Systemic Design Science Exploration,
201320)
This three-level approach abstracts from an actual company to its theoretical description as its business
model(s), to the more abstract level of a theoretical description of business models, generally speaking.
This framework represents a horizontal representation of businesses, from actual to theoretical to
general.
This horizontal representation on the micro level of businesses can also be turned into a vertical progres-
sion along the Reporting 3.0 micro/meso/macro framework, scaling transformation from new business
models to new industry ecosystems to new integral economies. This progression aligns with recent
academic research by Bidmon & Knab that links business model research to transition research, and
points to the German energy sector as an example of scaling change from business model (micro) to
sector (meso) level.21
The progression also aligns with the Work Levels approach that New Business Models Blueprint Working
Group Member Mark Van Clieaf of Organizational Capital Partners employs (as discussed in the Data Blueprint). Van Clieaf draws on Elliot Jacques’ Work Levels concept to propose the need for alignment
between leaders’ “strategic horizon” and levels of transformation22. The first three Work Levels are largely
transactional (with strategic horizons up to 2 years), with Work Level 4 (Breakthrough) associated with
product / service / channel innovation with a 3-5 year strategic horizon (see Figure 33). The next three
Work Levels address transformation of business models, industry ecosystems, and economic / social
systems:
20 Antony Upward, Towards an Ontology and Canvas for Strongly Sustainable Business Models: A Systemic Design Science
Exploration, 2013. Fig 3-10, p113. http://hdl.handle.net/10315/20777 Accessed 22 May 2018.
21 Christina Bidmon & Sebastian Knab, “The three roles of business models in societal transitions: New linkages
between business model and transition research,” Journal of Cleaner Production, Volume 178, 20 March 2018,
Pages 903-916.
22 “Elliott Jaques,” The Economist, 1 May 2009. https://www.economist.com/node/13599026 Accessed 20 May 2018.

22 Integral BusIness Models for CatalyzIng a regeneratIve & dIstrIButIve eConoMy
• Work Level 5: Business Model Transformation (5-10 year strategic horizon);
• Work Level 6: Industry Ecosystem Transformation (10-20 year strategic horizon);
• Work Level 7: Intergenerational Global Economic / Societal System Transformation (20+ year stra-
tegic horizon).
Figure 10: Business Model Transformation Scalability (Source: Reporting 3.0 Inspired in part by Mark Van
Clieaf, Organizational Capital Partners)
Says Van Clieaf:
Only 5% of the world’s adults have the cognitive hard wiring and systems thinking to conceptualize,
plan out, resource and implement business model and industry ecosystem transformations.
Designing such holistic solutions is required in the face of the interconnectedness of “wicked problems”
we now face – or even “super wicked problems” such as climate change where 1) Time is running out; 2)
There’s no central authority; 3) Those seeking to solve the problem are also causing it; 4) Policies discount
the future irrationally.23 We will come back to this issue of interconnected, holistic solutions again later.
23 Kelly Levin, Benjamin Cashore; Steven Bernstein & Graeme Auld, "Overcoming the tragedy of super wicked prob-
lems: constraining our future selves to ameliorate global climate change," Policy Sciences, 45 (2): 123–152, 23 May
2012. https://link.springer.com/article/10.1007%2Fs11077-012-9151-0 Accessed 27 January 2018.

23Integral BusIness Models for CatalyzIng a regeneratIve & dIstrIButIve eConoMy
3.2.2. ON TOOLS, DESIGN PRINCIPLES, AND PATTERNS
“Ontologies” or “meta-models” are really just a fancy name for “tools.” Upward further explains:
Osterwalder and Pigneur’s insight was that an Ontology [#3] – a very technical artefact – could be
transformed into a visual collaborative tool that anyone could easily learn and use to describe their
current or future business models [#2]. We call these tools canvases. They provide a shared language
(nouns and verbs from the underlying ontology) to allow people to have better conversations about
all the business model factors.24
Before getting to the verbs, let’s finish defining the nouns.
In addition to representing business models visually, canvass “tools” pose questions whose answers
suggest a set of “design principles” that companies apply in the nested reality of “an environment that
contains society that creates the economy,” says Upward. He continues:
… If a tool user is aiming to describe strongly sustainable / future-fit / thriving / flourishing / integral
business model [#2] to be instantiated as a real operating business [#1] to actually realize, for example,
the “possibility for flourishing” in the world, how must the questions the tool asks [#3] be answered?
To make this deep knowledge accessible to practitioners, the science has been summarized in various
ways - we call these summaries “design principles” or sometimes “enabling constraints”…Much more
work must be done on this topic of design principles.25
This Blueprint proposes such principles for Integral Business Models later. And next in sequence from
design principles, according to Upward, are patterns, which
…exist to provide inspiration / shortcuts to enterprise designers (aka strategists) / business model
designers (aka tool users). They aim to capture elements / factors that are known from experience to
lead to desired enterprise outcomes - e.g. profit, environmental regeneration, social benefit, etc… The
value / purpose of patterns is that they have the potential to speed up the creation of, and de-risk,
the creation of new business model designs.
To be useful, patterns need to be organized. And if a business model designer is going to use a tool,
it would be most useful for them if the patterns were organized using that tool (or its underlying
ontology); i.e. in this case the tool / ontology becomes a taxonomy for the patterns. So far this has not been done with any of the patterns work for sustainable business models that I am aware of.
Patterns are the product of descriptive science - i.e. phenomena / something must exist in the world
to be observed by the person trying to identify and describe patterns involving it. This is a problem
if what we are looking for is patterns of business model factors i.e. typical combinations of answers
to the questions asked by canvas tools that are known to lead to flourishing / future-fit / thriving /
strongly sustainable / integral outcomes.
Why? Because today no enterprise aiming to create only these desirable outcomes can exist - it
would not be financially viable and so would quickly go bankrupt. (We don’t yet have social and envi-
ronmental bankruptcy laws - we only have financial bankruptcy laws) … We just don’t know for sure
the patterns derived from even today’s best businesses are anything other than (at best) patterns of
24 Upward, op cit.
25 Ibid

24 Integral BusIness Models for CatalyzIng a regeneratIve & dIstrIButIve eConoMy
weakly sustainable business models - as there are no strongly sustainable / flourishing / future-fit
/ thriving / integral enterprises [#1] whose business models can be studied [#2] to find patterns!26
This conundrum – how do we create what doesn’t currently exist but what’s clearly needed, seeing as
we don’t have examples to point the way – is as old as humanity, and we humans have always responded
by tapping into our innate creativity.
3.2.3. ON METHODS AND INNOVATION
In the absence of such patterns, we can turn to methods. Upward continues:
So we need well designed, useful, proven methods to effectively use the tools to create “good” / useful
business model designs (descriptions of future business models not yet instantiated in an operating
business) that once instantiated will actually result in flourishing / strongly sustainable / future-fit /
thriving / integral outcomes.27
In other words, we need to mirror the Design Principles → Patterns progression for existing business models
with a similar progression for not-yet-existing business models. Upward suggests Methods as the analog for
Patterns; later in this Blueprint, we suggest “General Characteristics” as the analog for Design Principles. So
the parallel progression for not-yet-existing (or Integral) business models would be: General Characteristics
→ Methods.
But how do we get from here to there? This brings us to Upward’s verbs – namely, to innovate:
Clearly business models [#2], that when instantiated in operating businesses [#1], lead to flourishing
/ strongly sustainable / future-fit / thriving / integral outcomes … must be (very) innovative [and]
must design using backcasting.28
New business model creation that simultaneously catalyzes the emergence of new industry ecosystems
(at the meso level) and new integral economies (at the macro level) to solve our “super wicked problems”
requires “super wicked innovation”.
To summarize, Upward identifies the innovator’s dilemma of inventing that which does not yet exist,
and so lacks the luxury of pre-existing patterns, thus requiring here to rely on general characteristics and
methods to innovate truly new business models that spur the emergence of new industry ecosystems
and new integral economies.
26 Ibid
27 Ibid
28 Ibid

25Integral BusIness Models for CatalyzIng a regeneratIve & dIstrIButIve eConoMy
3.2.4. LITERATURE REVIEW CLUSTERING
We structured the fractal nature of the literature into a more systematic approach by identifying five
distinct definitional categories:
1. Production-Service Systems
2. Sustainable Business Model Archetypes
3. Sustainable Value Assessments
4. Strongly Sustainable Business Model Ontology
5. Systems Theory-Based Business Model Generator
Please note that this five-category approach to sustainable business models is neither temporally sequen-
tial nor mutually exclusive categorically. In other words, the categories did not develop in a historical
progression; and they share cross-over characteristics. So we acknowledge that our categorization
superimposes a somewhat developmental sequence, as well as introducing seeming separations where
such may not exist.
After observing and clustering this progression, we assessed the degree to which they fulfill our earlier
Blueprint Recommendations, and found gaps. To fill it, we propose a sixth category of Integral Business Models, which we explain later.
Now, we lay out the distinguishing features of these 5 categories:
3.2.4.1. PRODUCTION-SERVICE SYSTEMS
Production-service systems (PSS) were the first extrapolation from a purely economic and market-based
approach into the environmental sphere, as documented by Arnold Tukker in a 2004 study that identified
8 distinct PSS typologies, as assessed for economic and environmental potential.29 We are not covering
this early development in this Blueprint, as it is of lesser importance to the development of new busi-
ness models in the way as we see them needed regarding a) the completeness of what we focus on (e.g.
missing the social dimension), and b) the level of transformation needed. However they can be seen as
a necessary stepping stone into the development of sustainable business models.
3.2.4.2. SUSTAINABLE BUSINESS MODELS ARCHETYPES
A proliferation of approaches to sustainable business models emerged, which warrants clustering them
into archetypes30 , helping us understand the directionality of business models that seek to achieve sus-
tainability (or reduce unsustainability) – primarily by optimizing within the existing system. These are all
bottom-up symptom cures – of procedures, processes and value chain activities. They remain focused on
the micro-level, not on overall impact, scalability and change potential for the meso- and macro-levels.
29 Arnold Tukker, “Eight types of product–service system: eight ways to sustainability? Experiences from SusProNet,”
Business Strategy and the Environment, Volume 13, Issue 4, July/August 2004, pp 246–260. http://onlinelibrary.wiley.
com/doi/10.1002/bse.414/abstract Accessed 5 October 2017.
30 N.M.P. Bocken*, S.W. Short, P. Rana, S. Evans, “A literature and practice review to develop sustainable business
model archetypes,” Journal of Cleaner Production, 65 (2014) pp 42-56. http://www.sciencedirect.com/science/
article/pii/S0959652613008032. Accessed 7 October 2017.

26 Integral BusIness Models for CatalyzIng a regeneratIve & dIstrIButIve eConoMy
The discussion of maturity is another form of defining archetypes of strategies.31 This clarification is help-
ful, as it shifts the perspective from inside-out to outside-in, and so recognizes the shift of perspective to
create value for the Common Good. However, the awareness of this shift of value creation for the Common Good is still based on optimizing within an existing economic design. There is no link to the macro-level
need to change the economic system design towards incentivizing different market mechanisms – for
example through internalization of external effects or smart taxation that rewards behavior we want
and punishes anti-social behavior, to name just a few.
Figure 11: Sustainable Business Model Archetypes (Source: Bocken et al, “A literature and practice review
to develop sustainable business model archetypes”, Journal of Cleaner Production, 2014)
Dyllick & Muff (2016) propose a 3-stage developmental approach to defining sustainable business (beyond
business-as-usual) (see Figure 12) that echoes elements of the Reporting 3.0 Strategy Continuum. Dyllick
& Muff state:
Truly sustainable business shifts its perspective from seeking to minimize its negative impacts to
understanding how it can create a significant positive impact in critical and relevant areas for society
and the planet. A Business Sustainability 3.0 firm looks first at the external environment within which
it operates and then asks itself what it can do to help overcome critical challenges that demand the
resources and competencies it has at its disposal.32
31 Dyllick & Muff, „Clarifying the Meaning of Sustainable Business: Introducing a Typology from Business as Usual
to True Business Sustainability“, Organization & Environment 2016, Vol. 29(2) 156–174, 2016.
32 same

27Integral BusIness Models for CatalyzIng a regeneratIve & dIstrIButIve eConoMy
It warrants noting the distinction between descriptive and normative approaches to research. The
former identifies things as they are and the latter as they should be, based on clear and rational criteria.
Much of the literature and research we review falls into the descriptive category, while the Reporting
3.0 approach is inherently normative.
Figure 12: Dyllick & Muff: Clarifying the Meaning of Sustainable Business: Introducing a Typology from
Business as Usual to True Business Sustainability (2016)
3.2.4.3. SUSTAINABLE VALUE ASSESSMENTS
Another approach to steer sustainable business models is based on the idea of value creation. There
is broad variability on what value creation is, particularly around the desired outcomes (what “value” is
being created?) Take, for example, the 2011 Harvard Business Review article where Porter and Kramer
conceived their notion of “Creating Shared Value,”
which involves creating economic value in a way that also creates value for society by addressing its
needs and challenges. Businesses must reconnect company success with social progress. Shared value
is not social responsibility, philanthropy, or even sustainability, but a new way to achieve economic
success. It is not on the margin of what companies do but at the center. We believe that it can give
rise to the next major transformation of business thinking.33
Others are not as optimistic in their assessment of the transformative potential of Shared Value as the
“Next Evolution in Capitalism.”34 Crane, Palazzo, Spence & Mattern voice significant concern about
Creating Shared Value (CSV):35
33 Michael Porter & Mark Kramer. “The Big Idea: Creating Shared Value.” Harvard Business Review, January- February
2011, pp 62-77. https://hbr.org/2011/01/the-big-idea-creating-shared-value Accessed 5 October 2017.
34 Ibid
35 Crane, A., Palazzo, G., Spence, L., & Mattern, D. (2014). “Contesting the Value of 'Creating Shared value'. University
of California, Berkeley,” 56(2), 130-153.

28 Integral BusIness Models for CatalyzIng a regeneratIve & dIstrIButIve eConoMy
• Porter and Kramer advance a caricature of CSR in order to prop up Creating Shared Value as an
attractive counter-proposal. They neglect literature about stakeholder engagement and stakeholder
management and other existing approaches to social innovation (social entrepreneurs, B-Corps). Their
assumption that CSR is separate from the realization of profit and therefore qualifies as philanthropy
enables them to pose CSV as a distinct concept directly connected to profit maximization. Crane et
al identify these “straw man” arguments as weak support for CSV.
• CSV ignores trade-offs between social and economic target setting and is therefore naive in its
conceptual design. Porter and Kramer say that CSV could solve such trade-offs. In practice, CSV is
typically applied in win-win situations for which a business case can easily be designed, but when
difficult trade-offs are presented, CSV strategies often doesn’t suffice as a means of mitigation. This
in consequence means that CSV isn’t suitable for cracking really transformational issues and becomes
a ‚cherry-picking’ instrument, creating significant risk of greenwashing.
• CSV doesn’t discuss the ethical issue of the role of corporations, so it doesn’t add to the deeper
discussion about the legitimacy crises of capitalism. Instead, CSV offers a reduced and simple effi-
ciency-oriented answer to partially normative questions. The firm as a political and ethical actor is
totally neglected.
In sum, CSV falls short of tackling the entrenched societal problems, and is more rightly considered an
extension of the ‘Competitive Advantage’ doctrine into the social sphere. It is an optimization in a given
economic system and inable to tackle the proclaimed redesign of capitalism. We even think it endangers
such radical change.
Defined more rigorously, the notion of value creation provides a very useful lens for identifying sus-
tainable business models, spawning specific tools for this purpose. For example, Bocken et al (2013)36
propose a model that distinguishes various forms of value (value captured, value missed, value destroyed,
and new value opportunities) and four major stakeholder groups (environment, society, customer, and
network actors). This mapping tool enables entrepreneurs and intrapreneurs alike assess the transfor-
mative potential of their new business models.
A updated version of this model was recently introduced in a 2016 Network for Business Sustainability
report that embraces the multicapital approach propounded by the International Integrated Reporting
Council (IIRC) (and generally advocated in the Reporting, Data and Accounting Blueprints of Reporting
3.0) to advance a “Total Value Creation” approach to new business models. Visually, this report melds
the above graphic with the IIRC “Octopus” to arrive at an hourglass depiction of value creation.
This report introduces a systems-level approach, and so qualifies for cross- categorization in System
Theory-Based Business Model Generation (see our #5 further down below). However, the report also
uses the “Shared Value” frame that has been critiqued above for, among other things, inadequately
addressing value destruction and little effectiveness of value creation. While the report addresses value
destruction, its embrace of the Shared Value framing muddies the waters.
36 Bocken, N.M.P, Short, S., Rana, P., Evans, S.A. “Value mapping tool for sustainable business modeling”. Corporate
Governance, Vol. 13 Iss: 5, pp.482 – 497

29Integral BusIness Models for CatalyzIng a regeneratIve & dIstrIButIve eConoMy
Figure 13: From Bocken et al.: Value mapping tool for sustainable business modeling”. Corporate
Governance (2013)
Figure 14: Hourglass Model, Lüdeke-Freund et al (2016)

30 Integral BusIness Models for CatalyzIng a regeneratIve & dIstrIButIve eConoMy
3.2.4.4. STRONGLY SUSTAINABLE BUSINESS MODEL CANVAS
In their 2016 “Ontology for Strongly Sustainable Business Models” paper, Upward and Jones advance
the definitional rigor of “sustainability” as applied to business models by appealing to the distinction
between “strong” and “weak” sustainability.
Strong sustainability demands an understanding of the “macro-economy as a sub-system of the
finite ecosystem” (Neumayer, 2013, p. 28) informed by natural science. On the other hand, weak
sustainability “can be interpreted as an extension to neoclassical economics” (Neumayer, 2013, p. 28),
where such containing systems are not considered (Victor, 2008). “Strong sustainability” is explicitly
informed by current natural science observations about the importance of certain stocks of “critical
natural capital” to sustaining “basic life support functions” (Neumayer, 2013, pp. 26-27).37
Figure 15: Strongly Sustainable Business Model Ontology (Source: Antony Upward & Peter Jones, “An
Ontology for Strongly Sustainable Business Models: Defining an Enterprise Framework Compatible With
Natural and Social Science,” Organization & Environment, 2016)
37 Antony Upward & Peter Jones, “An Ontology for Strongly Sustainable Business Models: Defining an Enterprise
Framework Compatible With Natural and Social Science,” Organization & Environment, 2016, Vol. 29(1) 97–123.
http://journals.sagepub.com/doi/pdf/10.1177/1086026615592933 Accessed 5 October 2017.

31Integral BusIness Models for CatalyzIng a regeneratIve & dIstrIButIve eConoMy
For another take on the distinction, the Reporting 3.0 Data Blueprint quotes Simon Dresner in The
Principles of Sustainability:
There is controversy about whether to consider human-made capital and natural capital together
(weak sustainability) or separately (strong sustainability). If they are counted together then increases
in human-made capital can compensate for running down natural capital. Is that legitimate? Are the
two kinds of capital substitutable in that way?38
“No,” is strong sustainability’s answer, adding a key element to the field of new business model
theory. Upward & Jones also helpfully integrate the “business model canvas” approach popularized by
Osterwalder. They perform a comparative analysis between their canvas and the “Osterwalder prof-
it-oriented ontology … to deconstruct and evaluate its affordances and gaps with respect to the relevant
sciences informing business sustainability.” Unsurprisingly, the Osterwalder approach contains significant
blind spots when viewed through a (strong) sustainability lens.
Recently, Upward has shifted semantic labeling from “strongly sustainable” to “flourishing,” a move that
aligns with the Reporting 3.0 Strategy Continuum that places “regenerative” and “thriving” beyond
“sustainable.”
Figure 16: Flourishing Business Canvas (Source: Flourishing Business Canvas)
3.2.4.5. SYSTEMS THEORY-BASED BUSINESS MODEL GENERATION
The recognition of systems dynamics as an influencing factor in business models was proposed a decade
ago, with Stubbs & Cocklin (2008) addressing it as a key component of holistic sustainability:
38 Simon Dresner, The Principles of Sustainability, London: Earthscan, 2002

32 Integral BusIness Models for CatalyzIng a regeneratIve & dIstrIButIve eConoMy
Organizations can make significant progress towards achieving sustainability through their own
internal capabilities, but ultimately organizations can only be sustainable when the whole system of
which they are part is sustainable (Jennings & Zandbergen, 1995). Changes to the socioeconomic
system, both structural (such as redesigning transportation systems and taxation systems) and cultural
(such as attitudes to consumption and, economic growth and wellbeing), are required to facilitate
firm-level and system-level sustainability.39
This micro-macro link between the firm and the systems it operates within encapsulates the Reporting
3.0 approach.
Figure 17: An Illustration of a Systems-Based Sustainable Business Model (Source: Stubbs & Cocklin,
“Conceptualizing a ‘Sustainability Business Model,’” Organization & Environment, 2008)
39 Wendy Stubbs & Chris Cocklin, “Conceptualizing a ‘Sustainability Business Model,’” Organization & Environment,
Volume 21 Number 2, June 2008 103-127. http://edge.sagepub.com/sites/default/files/W%20STUBBS%20-%20
Conceptualizing%20a%20sustainability%20business%20model_3.pdf Accessed 5 October 2017

33Integral BusIness Models for CatalyzIng a regeneratIve & dIstrIButIve eConoMy
Abdelkafi and Täufer (2016) extend the Stubbs & Cocklin approach first by mapping generic business
model logic into a systems dynamics stocks-and-flows chart.
Figure 18: Stocks and Flows Diagram of a Generic Business Model Logic (Source: Abdelkafi & Täufer,
“Business Models for Sustainability from a System Dynamics Perspective,” Organization & Environment,
2016)
Then, Abdelkafi & Täufer introduce systems dynamics thinking into new business model design, con-
sciously tapping into both positive (reinforcing) and negative (balancing) feedback loops, amongst and
between stocks and flows of capital resources.
Figure 19: System Dynamics-Based Representation of Business Models for Sustainability (Source:
Abdelkafi & Täufer, “Business Models for Sustainability from a System Dynamics Perspective,”
Organization & Environment, 2016)

34 Integral BusIness Models for CatalyzIng a regeneratIve & dIstrIButIve eConoMy
However, Abdelkafi and Täufer make only passing mention of limits and thresholds, and no mention of car-
rying capacity, thus falling short of laying out a holistic – and Contextualized – approach to sustainability.
Summary Figure 20 puts all five categories into one connecting circle. These categories aren’t mutually
exclusive or sequential. They summarize the current main areas of discussion around New Business
Models.
Figure 20: Clustering of Sustainable Business Model Literature (Source: Reporting 3.0)
3.3. VIEWING NEW BUSINESS MODELS THROUGH THE REPORTING 3.0 LENS
The part can never be well unless the whole is well.Plato, Charmides , 380 BCE
No man is an island entire of itself; every manis a piece of the continent, a part of the main…
John Donne, “Meditation XVII” Devotions upon Emergent Occasions, 1623
The Sustainable Business Models literature as a whole advances a strong and comprehensive case for
business model transformation. However, the literature generally approaches the business model out-
side the context of the “super wicked problems” business and society now faces, and thereby focuses
primarily at the micro level, attending less to meso- and macro-level effects. One distinguishing aspect
of Reporting 3.0’s approach is its insistence on attending to micro-meso-macro interlinkages, as a key
to scalability and sustainability.
As the epigraphs to this section show, the notion of a micro-macro link is hardly a novel concept that
Reporting 3.0 invented; to the contrary, it is a key interrelationship recognized since time immemorial.
Looking to a re-articulation of this issue from a half-century ago proves particularly instructive for our
present purposes. In his seminal 1968 essay, “The Tragedy of the Commons,” Garrett Hardin exhumed an

35Integral BusIness Models for CatalyzIng a regeneratIve & dIstrIButIve eConoMy
obscure 1833 pamphlet where William Forster Lloyd coined the idea of the “commons.” Lloyd describes
“a pasture open to all” that supports multiple herds, with natural forces keeping impacts “well below the
carrying capacity of the land” – until the “day of reckoning” when
the rational herdsman [sic] concludes that the only sensible course for him to pursue is to add another
animal to his herd. And another; and another... But this is the conclusion reached by each and every
rational herdsman sharing a commons. Therein is the tragedy. Each man is locked into a system that
compels him to increase his herd without limit – in a world that is limited.40
Replace “herdsman” with “company” and “animal” with “growth” and voilà, we have the 21st Century’s
super wicked problem! What’s perhaps most interesting about Hardin’s essay is his lead-in to Lloyd:
Adam Smith. Hardin bridges to the Commons from Adam Smith’s (in)famous notion of the “invisible
hand” – namely, the assumption that “decisions reached individually will, in fact, be the best decisions
for an entire society”).
However, what Hardin fails to acknowledge is that Smith implicitly called for an “invisible band” to guide
and constrain the invisible hand. Smith first proposed his “invisible hand” concept in The Theory of Moral Sentiments (1759), applying it to a micro / meso example of landowners distributing the excess production
of their fields to the laborers who harvested it, simply because the bounty exceeds the capacity of the
landowners’ stomachs. Such landowners
are led by an invisible hand to make nearly the same distribution of the necessaries of life, which
would have been made, had the earth been divided into equal portions among all its inhabitants, and
thus without intending it, without knowing it, advance the interest of the society, and afford means
to the multiplication of the species.41 [emphasis added]
In the better-known appearance in The Wealth of Nations (1776), Smith addresses a micro / meso / macro
example of individual production in the domestic and foreign contexts:
By preferring the support of domestic to that of foreign industry, he intends only his own security;
and by directing that industry in such a manner as its produce may be of the greatest value, he intends
only his own gain, and he is in this, as in many other cases, led by an invisible hand to promote an end
which was no part of his intention. Nor is it always the worse for the society that it was not part of it.42
[emphasis added]
Perhaps it shouldn’t surprise us that a mechanism that’s by definition impossible to see (and hence to
prove) gained such entrenched traction. Stating the obvious like the boy in The Emperor’s New Clothes,
Nobel laureate economist Joseph Stiglitz points out “the reason that the invisible hand often seems
invisible is that it is often not there.”43 In other words, there’s a difference between “invisible” and “non-ex-
istent.” And the problem is, as with the Emperor, it can be hard to distinguish between invisibility and
non-existence, or to establish credibility in contexts intermediated by political power.
40 Garrett Hardin, “The Tragedy of the Commons,” Science, 13 Dec 1968, Vol. 162, Issue 3859, pp. 1243-1248. http://
science.sciencemag.org/content/162/3859/1243.full Accessed 27 January 2018.
41 Adam Smith, The Theory of Moral Sentiments, 1759.
42 Adam Smith, The Wealth of Nations, 1776.
43 Joseph Stiglitz, Making Globalization Work, New York: W. W. Norton & Company, 2007.
Altman, Daniel. Managing Globalization. In: Q & Answers with Joseph E. Stiglitz, Columbia University and The
International Herald Tribune, October 11, 2006. https://web.archive.org/web/20090626040606/http://blogs.iht.
com/tribtalk/business/globalization/?p=177 Accessed 7 October 2017.

36 Integral BusIness Models for CatalyzIng a regeneratIve & dIstrIButIve eConoMy
For example, Smith’s Moral Sentiments example presupposes the “invisible” existence of a sufficiently
abundant crop and a social fabric that promotes noblesse oblige or a religion that preaches charity or a tax
code that incentivizes such donations, etc... Such conditions can be just as “invisible” in their presence
as in their absence – that’s the rub.
For the invisible hand to work, it really requires an “invisible band” of preconditions that can elude the
eye. In the Reporting Blueprint, we shed light on some of the key elements of that “invisible band”:
For example, sustainable performance at the micro level benefits from level playing fields at the meso
sector level, which require pre-competitive collaboration amongst industry peers as well as regulators
and others;
At the macro / economic system level, transformation of taxation protocols is due. As Stubbs & Cocklin
(2008) write:
“Interface stated that the structure of the tax system is a barrier to sustainability. To fully realize
an [sustainable business model], modifications to the taxation systems are required to shift the tax
burden from ‘goods,’ like income and labour, to ‘bads,’ like ecological damage and consumption of
nonrenewable resources (Costanza, Cumberland, Daly, Goodland, & Norgaard, 1997). According to
Interface, this would encourage organizations to redesign their products and practices to eliminate
negative environmental impacts and create a ‘level-playing field.’”
Boiled down to its essence, the tragedy of the commons results from the aggregation of unintended
consequences from incremental impacts by individual actors, none of which on its own seems egre-
gious, but taken collectively, cross tipping points that trigger systems out of their dynamic balance into
disequilibrium, which creates cascading consequences.
But what if we can use the same mechanics of the problem to create solutions? For example, instead of
aggregating impacts that add up to overshoot (tragedy of the commons), what if we aggregate positive
impacts that, in toto, rebalance systems by restabilizing the cycles that make up systems? In this way, we
can “scale up” change that transcends incrementalism to achieve necessary transformation.
This is precisely what New Business Models Blueprint Working Group members John Elkington and Lorraine
Smith (collaborating with Jacqueline Lim) of Volans advocate in their Breakthrough Compass report when
they call for “exponential” breakthroughs.44
Says Elkington in the Harvard Business Review:
Our conclusion: instead of pursuing incremental goals, we need to start chasing goals that will have
10x or 100x the impact on anywhere between a million and a billion people. The horizontal axis
(“impact”)tracks the spectrum of outcomes created by business, from negative to positive. The bil-
lion-people-impacted scale may seem far-fetched, but two brothers define the outer limits here.
Google’s Larry Page invests in solutions that potentially benefit a billion people, while his brother Carl
(at the Anthropocene Institute) focuses on problems that could disadvantage – even kill – a billion of
us. The vertical axis (“scale”) moves from incremental change to increasingly exponential outcomes.
To address the realities of climate change and other ways in which we are increasingly overrunning
planetary boundaries, we must now shift our mindsets, technologies, and business models from left
to right, and from bottom to top.45
44 See https://hbr.org/2017/05/saving-the-planet-from-ecological-disaster-is-a-12-trillionopportunity
45 same

37Integral BusIness Models for CatalyzIng a regeneratIve & dIstrIButIve eConoMy
Figure 21: The Breakthrough Compass (Source: Volans)
• Entrepreneurs and Intrapreneurs
In order to scale exponentially, new business models must apply not only to entrepreneurial startups,
but also to intrapreneurial46 transformation of existing business models in even the largest multinational
corporations. The NBS report cited in the Literature Review notes that new business models apply
differently to startup entrepreneurs than to intrapreneurs seeking to transform existing (and often
entrenched) business models in order to align them to the systems they operate within. But in general,
this is the exception, not the rule, with the sustainable business model literature.
The Reporting 3.0 approach recognizes that new, sustainable business models need to emerge
both from the bottom-up (via entrepreneurialism) as well as inside-out (via intrapreneurialism). In
fact, the new term “system entrepreneur” has emerged over the last several years as “a person or
organization that facilitates a change to an entire ecosystem by addressing and incorporating all
the components and actors required to move the needle on a particular social issue.”47 While this
definition is clearly broader than the traditional scope of entrepreneurship to business, it does
apply to new business model entrepreneurs in light of the fifth category in the Clustering above.48
But interestingly, the term “system intrapreneur” has yet to produce a Google footprint.
46 In his 1984 book Intrapreneuring: Why You Don't Have to Leave the Corporation to Become an Entrepreneur (Harper &
Row), Gifford Pinchot coined the term intrapreneur as “dreamers who do. Those who take hands-on responsibility
for creating innovation of any kind, within a business.”
47 Bryce Butler, “Systems Entrepreneur: Defining the Role of Community Quarterback,” Medium, 28 November
2016. https://medium.com/@bryce.butler/systems-entrepreneur-defining-the-role-of-community-quarterback
-1722db64dbbc Accessed 6 October 2017.
48 Amira Bliss & Warren Nilsson, “Cultivating a New Generation of Leader: The System Entrepreneur,” Rockefeller
Foundation, 20 May 2015. https://www.rockefellerfoundation.org/blog/cultivating-a-new-generation-of-lead-
er-the-system-entrepreneur/ Accessed 5 October 2015. “Systems Entrepreneurship: A How-To Guide for a New
Action Paradigm,” 2017 Skoll World Forum, 6 April 2017. http://skoll.org/session/skoll-world-forum-2017/sys-
tems-entrepreneurship-a-how-to-guide-for-a-new-action-paradigm/ Accessed 5 October 2015.

38 Integral BusIness Models for CatalyzIng a regeneratIve & dIstrIButIve eConoMy
• Red Flags: Greenwashing New Business Models
While the discussion in this chapter has primarily focused on ‘upward’ dynamics that enhance new busi-
ness models, we’d also like to caution against dynamics that drag new business model design ‘downwards’.
To identify some of the primary red flags, we developed this chart of potential greenwashing:
Figure 22: Red Flags - Greenwashing New Business Models (Source: Reporting 3.0)
Sustainability reports often tout efficiency, productivity and dematerialization gains. These messages
create an illusion of progress, as the global Ecological Footprint is still growing due to ‘rebound effects’
whereby greater efficiency / productivity simply spurs more consumption (on an absolute basis) result-
ing in net unsustainability, no matter how well-intended. Life-cycle analysis, combined with circular (or
even “cyclical”) economics and contextual assessment can be a critical application to reveal these total
impacts. Again, most likely this phenomenon and the sheer existence of greenwashing is simply another
sign of the desperation to find a “business case for sustainability” in our unsustainable economic system.

39Integral BusIness Models for CatalyzIng a regeneratIve & dIstrIButIve eConoMy
3.3.1. TOWARDS SUSTAINABLE BUSINESS MODELS – NEW ‘CORRIDORS’ OF THINKING
Chapter 3.1. gave an overview of existing business model literature, and placed it in the context of
Reporting 3.0’s Reporting, Accounting, and Data Blueprints. In essence, this has revealed a gap between
the ‘what is’ and ‘what should be’ and leads us now into the definition of an ‘integral’ business model
design, as distinct from the summarized discussion of sustainable business models.
Shining through in the archetypes and other literature is a new structure that differentiates various
new ‘corridors’ in which new business models manifest themselves. We have observed the following
approaches to business models:
◦ Circular
◦ Sharing
◦ Collaborative
◦ Cooperative
◦ Benefit Corporation
◦ Impact-Based
◦ Community-Based
There is a whole body of literature and increasing instantiation for each of these corridors, as well as
emerging hybridization between and amongst them. However, these solutions, in isolation, will not result
in the level of transformation required to trigger the emergence of a truly regenerative and distributive
economy – because each only solves for discrete elements of our “super wicked problems.”
In order to succeed, new business models will need to advance context-based solutions that apply
synergistically across the multiple capitals. In other words, integral business models need to take a suf-
ficiency-based approach, whereby their impacts ensure sufficiency of all capitals, within their broader
carrying capacities. Indeed, unless business models achieve these objectives, they will not create the
sustainability that is minimally necessary to prevent systemic collapses on the one hand, and on the other
hand, serve as the foundation for flourishing.
3.3.2. DEFINING ‘INTEGRAL BUSINESS MODELS’
The modus operandi of the Reporting 3.0 Blueprint process is to test existing and proposed practices
against the potential for system change to bona fide sustainability, and beyond to regeneration and thriv-
ing. What we typically find is that current incremental progress, as important and profound as it is, often
falls short of “needed” transformation. Our Blueprints ground their approach to “necessary” change in
science and ethics. Reasonable people can disagree with our conclusions, but our goal remains to identify
all necessary work toward fit-to-purpose transformation at a pace and scale matching the magnitude
of the urgency. The main message of the New Business Models Blueprint is that “transformation” is the
new norm; conventional business models are no longer an option. This is also the reason why further
chapters transfer the knowledge from the other Blueprints and interpret their tools and methodologies
for the use of creating Integral Business Models.
Our use of the term “Integral” signals an approach that synthesizes a diversity of disciplines, develop-
mental levels, perspectives, etc… For example, New Business Models Blueprint Working Group Members
(and Advocation Partners) Shanti Gaia and Sean Esbjörn-Hargens of MetaIntegral explain how the Four
Quadrants of Integral Theory enhance understanding of conditions and impacts:

40 Integral BusIness Models for CatalyzIng a regeneratIve & dIstrIButIve eConoMy
Conditions in the four quadrants are co-dependent and evolve together in a dependent, but not
sufficient manner. Conditions must develop to a certain level in all four quadrants for new things
to emerge in the human experience, and as conditions change in each of the quadrants it has a
ripple effect on the other three. An effective change strategy must simultaneously pay attention
to transforming mindsets, behaviors, culture (relationships), and worldly systems (everything from
economics to ecology). As well, impacts are dramatically different in each of the four quadrants, and
each is crucially important for a thriving human existence.
Gaia and Esbjörn-Hargens also explain how most interventions focus on exterior (third person) per-
spectives, while transformation requires integration of interior (first person) and interpersonal (second
person) perspectives. This multi-perspectival approach also helps to identify biases (which are natural)
and reduce their effects.
Figure 23: Four Quadrants of Transformations and Impacts (Source: MetaIntegral)
In the Reporting 3.0 construct, we extend the macro/meso/micro scale down one further step, to the
nano level, to address personal and interpersonal issues from interior perspectives.
With this background in mind, we propose this new category of Integral Business Models, which we describe
in more depth here. Figure 26 shows differentiators we derived from comparing existing literature with the
current Reporting 3.0 Blueprint Recommendations and tooling. The rest of this chapter concentrates on
defining general characteristics and selected implementation methods for Integral Business Models.

41Integral BusIness Models for CatalyzIng a regeneratIve & dIstrIButIve eConoMy
Figure 24: Integral Business Models: a ‘sixth’ category for new business model design (Source: Reporting 3.0)
3.3.2.1. GENERAL CHARACTERISTICS OF INTEGRAL BUSINESS MODELS
Earlier in this chapter, we proposed the need to extend the existing thinking in the new business model
literature with what we call Integral Business Models. And taking our cue from Antony Upward, we rec-
ognize the need to mirror the design principles and patterns for existing business models with general characteristics and implementation methods for what Integral Business Models must exhibit if they are to
emerge. And Upward said “[m]uch more work must be done on this topic of design principles” for existing
business models, so clearly even more work needs to be done on general characteristics and implementation methods for catalyzing Integral Business Models.
In this section, in an effort to further define this new concept, we describe 8 general characteristics that
arise from Reporting 3.0 Blueprint Recommendations. It is important to stress that Integral Business Model really require all 8 of these key characteristics. While they overlap, each is a distinct yet integral
element – totality integrality can’t be achieved by leaving any of these key characteristcs out. This is
also a differentiator to any of the sustainable business model ‘corridors’ mentioned at the beginning of
3.2. For example, a truly circular economy also needs to be a sustainable (and even thriving) economy,
requiring Integral Business Models. A sharing business model that avoids to define a multi-capital success
measurement will remain incomplete, to name just two examples.
The 8 General Characteristics of Integral Business Models are:
• Four Scale (Nano/Micro/Meso/Macro): Sustainability, across economic, social, and environmental
dimensions, is inherently nested, with movement at one scale interdependent upon movement at
broader and narrower scales simultaneously. Uncoordinated movement (e.g. micro-level change
without commensurate meso- and macro-level transformation) can act as a straitjacket of short-term
optimization that will produce only incremental outcomes. Backcasting scenarios from the end-goal
of a regenerative and distributive Green, Inclusive & Open Economy is therefore a precondition, and
the tools of the other Blueprints help with that backcasting (see further down and in chapters 4/5/6).
An integral business therefore needs to define its contribution to transformation at all four scales:

42 Integral BusIness Models for CatalyzIng a regeneratIve & dIstrIButIve eConoMy
◦ on the nano level: individual mindset shifts are the building blocks of paradigm shifts; stated from
the opposite perspective, no change can happen at higher levels without change at the personal
level, including cascading behavior and relationship changes (at the objective and intersubjective
levels.)
◦ on the micro level: companies must transform their business model(s) to operate within the car-
rying capacities of all capitals to optimize impact. This will entail conducting scenario analyses of
business model resilience in the face of projected changes, as well as creating transition plans to
new Integral Business Models.
◦ on the meso level: in business, new industry ecosystems emerge to create new level playing fields
and market conditions that enable competition within “invisible band” sustainability constraints; in
investment, portfolio construction screens in companies with integral business models and applies
forceful stewardship engagement encouraging companies to fulfill their fiduciary duty of sustainable
performance across all three bottom lines; and in habitats, commoners create smart social contracts
that preserve, regenerate, and enhance the health of capital resources in the commons that are vital
to the wellbeing of all inhabitants.
◦ on the macro level: dynamic equilibrium of cyclical regeneration is established and maintained in
ecological, social, and economic systems to enable ongoing creating of system value.
• Purposeful: In addition to focusing on excellence in product / service delivery, Integral Business Models
embed a larger purpose into their DNA to survive leadership changes and provide a “North Star”49
for all decision-making. Purpose-driven business models anchor themselves to holistic economic
system design and are therefore systems-oriented. Instead of simply curing symptoms (the focus of
many current sustainability strategies), Integral Business Models instead take a root-cause approach
to addressing such issues as environmental degradation (in all its forms), social injustice and bias, and
economic inequality and concentrated wealth distribution. Such root-cause-curing applies what its
leaders might consider “legacy-building” that can be summarized on gravestone epitaphs.
• Contextualized (with a Capital C). Integral Business Models comprehensively assess their impacts
within the Sustainability Context of carrying capacity thresholds of all resource systems within
which they operate. A successful business model insulates itself against environmental, social, and
economic risks by ensuring sufficient resource stocks and flows within a fair share allocation at the
firm level, which scale vertically to the meso and macro levels. Context (with a Big C) is arguably
the most fundamental general characteristic embraced by Reporting 3.0, the golden thread running
through all four Blueprints and advocated in the Beta Testing Program, with the Global Thresholds
& Allocations Council stewarding governance of Sustainability Context.
• Multicapitalist. Integral Business Models synthesize the multiple capitals (natural, human, social,
financial, built, etc…), to create holistic system value. Optimizing performance on one capital (e.g. gen-
erating financial profit) at the expense of the viability of other capitals undermines business models
(and the industrial and economic systems they operate within), so an Integral approach assesses all the vital capitals. When accounting for a company’s total contribution to society, Integral Business Models assess intercapital dynamics while taking care to measure impacts on capitals separately, and
refrain from cross-capital “offsetting” – the distorting practice of counting positive impacts on one
capital as “credit” against the “debits” of negative impacts on other capitals.
• Scalable: Integral business models are designed to scale needed change across the business as well
as catalyzing scalable change at the meso (industry / portfolio / habitat) level to accelerate bigger
systemic change, as represented earlier in Figure 7 in the Executive Summary (repeated as Figure
10 in the main text.)
49 We acknowledge that the term ‘North Star’ is more come in the Northern hemishere, whereas the ‘Southern Cross’
might be better fitting in the Southern hemisphere.

43Integral BusIness Models for CatalyzIng a regeneratIve & dIstrIButIve eConoMy
• Leadership-driven. The Reporting Blueprint and Data Blueprint call for assessing individual devel-
opment in the context of broader cultural development (Integral Theory / Spiral Dynamics) and
cognitive capacity (Work Levels) in order to align leadership roles with their need for understanding
of complexity and horizon thinking. Aspects like the definition of the ambition level of an organization,
the willingness to develop a legacy, the existence of a corporate mindset and thereby a collective
worldview, are dependent on the quality of leadership in an organization.
• Thriveable: Integral Business Models set their sights beyond sustainability into regeneration and gross
positive impact (i.e. engineering negative impacts out of their design.) This ideal state can only be
achieved after collective action in industries and habitats and a clear transformation of the economic
system design.
• Synergistic: Integral Business Models optimize intercapital synergies. Integral Business Models recog-
nize the interconnected nature of change, and so design interventions that synergize across multiple
variables. This approach was propounded in the work of the ThriveAbility Foundation as described
in the book A Leader’s Guide to ThriveAbility.50
Figure 25 summarizes the eight key General Characteristics in one picture:
Figure 25: General Characteristics of Integral Business Models (Source: Reporting 3.0)
We expect the use of these eight General Characteristics to be an essential check at the beginning of the
ideation phase of any new Integral Business Model design as well as an evaluation tool for further adap-
tation or improvement of an existing business model striving for becoming integral. You can see this in
the below Integral Business Model Flowchart. This flowchart is our attempt to combine the learning of
the other Reporting 3.0 Blueprints into an Integral Business Model creation process, including ideation,
prototyping, go-to-market and adaption/improving phases. We present the overall flowchart here and
will pick up the parts from the Reporting, Data and Accounting Blueprints in Chapters 4, 5 and 6. This
flowchart can be used for the design of completely new Integral Business Models (entrepreneurs) as well
as for the adaptation of existing business models with the attempt to change them to become integral
(intrapreneurs).
50 Robin Lincoln Wood and The ThriveAbility Core Team, ‘A Leader’s Guide to ThriveAbility’, 2015.

44 Integral BusIness Models for CatalyzIng a regeneratIve & dIstrIButIve eConoMy
Figure 26: The Integral Business Model Design Flowchart for Entrepreneurs & Intrapreneurs (Reporting 3.0)
This flowchart also serves various functions as it combines the Integral Business Model creation process
with
• Tools and methodologies of the Reporting, Accounting and Data Blueprint e.g the Reporting 3.0
Strategy Continuum, the Integral Materiality Process, the Accounting Blueprint Process Flowchart,
and the Data Blueprint Process Flowchart;
Figure 27: Reporting Blueprint Process Flowchart (Source: Ralph Thurm, Reporting Blueprint, Reporting
3.0, 2017)

45Integral BusIness Models for CatalyzIng a regeneratIve & dIstrIButIve eConoMy
Figure 28: Accounting Blueprint Process Flowchart (Cornis Van Der Lugt, Accounting Blueprint,
Reporting 3.0, 2018)
Figure 29: Data Blueprint Process Flowchart (Source: Bill Baue, Data Blueprint, Reporting 3.0, 2017)
We have developed an Integral Business Model Design Template as a self-assessment for entrepreneurs
and intrapreneurs. Chapters 4, 5 and 6 will pick up on aspects of this template; a complete version can
be found in Annex 9.1. Chapter 3.4 also excerpts aspects from various case examples that we carried
out in the process of finalizing this Blueprint.

46 Integral BusIness Models for CatalyzIng a regeneratIve & dIstrIButIve eConoMy
3.3.2.2. SELECTED IMPLEMENTATION METHODS
Making the leap from generic Integral Business Models to specific IBMs at actual companies in the
real world – by translating the General Characteristics into innovative new businesses – requires
Implementation Methods that are as-yet unproven (and hence don’t qualify as Upward’s Patterns based
on Design Principles.) Given the focus on into:
• Governance & Strategy
• Risk & Innovation
• Scenario Analysis & Transition Planning
• Roles & Strategic Leadership
3.3.2.2.1. GOVERNANCE & STRATEGY
“Business model disruption and competition for increasingly scarce talent—which contribute to major
industry upheaval—are also ranked among the top five 2018 trends, suggesting boards are concerned
about a dramatic transformation in how enterprise value is created and their companies’ ability to effec-
tively adapt.”51 So stated the National Association of Corporate Directors (NACD) in its 2017-2018
Public Company Governance Survey. Indeed, more than half (58%) of the thousand-plus directors and
executives surveyed see the need for industry transformation (at the meso level) and almost half (46%)
foresee the need for business model innovation (at the micro level).
What they miss (perhaps predictably) are the systemic risks at the macro level, with a mere 6% viewing
climate change as an impactful trend. In other words, boards aren’t seeing how current enterprise value
creation depends on future system value creation.
Figure 30: Top-of-Mind Trends for Corporate Directors (Source: 2017-2018 NACD Public Company
Governance Survey)
51 National Association of Corporate Directors, 2017-2018 NACD Public Company Governance Survey, 28 November
2017. https://www.nacdonline.org/Resources/Article.cfm?ItemNumber=50360 Accessed 8 February 2018.

47Integral BusIness Models for CatalyzIng a regeneratIve & dIstrIButIve eConoMy
Integral Business Models require governors to shift from their current monocular focus on near-term
enterprise value creation to a more full-spectrum view of perpetual system value creation across the
multiple capitals, fueled by business model reinvention on the micro level that drives industry ecosystem
transformation on the meso level to trigger macro level shifts toward flourishing systems.
3.3.2.2.1.1. FROM ESG PUSH TO GSE PULL
Reporting 3.0 has long advocated for a shift from the current strategy of what we call ESG Push, to what
we call GSE Pull. ESG Push is best characterized by the 400+ shareholder resolutions filed each year on
Environmental, Social, and Governance issues that seek to push corporate directors toward stronger
ESG practices.52 This system is predicated on lagging leadership by corporate directors.
Reporting 3.0 advocates for a system where strong corporate governance plays a leading role, and so we
flip the order from ESG to GSE, which provides the governance pull instigating progress. In essence, we
believe that corporate (as well as investment, NGO, foundation, etc) boards have the opportunity (and
responsibility) to play leadership roles in transforming the economy. We believe that such leadership
is in the best interest of companies and investors, from financial and system value perspectives, and
thereby in the best interest of society.
The primary change needed at the board level is to expand the time horizon for strategic planning. Recent
esearch by Organizational Capital Partners on the S&P 1500 finds:
• The longest strategic planning horizon is less than 5 years for 85% of companies surveyed
• The longest horizon for CEO succession planning is less than 3 years for 70% of Directors surveyed.53
Organizational Capital Partners’ Mark Van Clieaf labels statistics such as these the “Elephants in the
Room,” underlining his call for the shift from ESG to GSE. New Business Models Blueprint Working Group
Member Alan Willis graphically represented these concerns in the Elephants in the Room figure (Figure 31).
The lack of strategic duty creates a series of “elephants in the room” that are knowable but not yet
comprehensively addressed by corporate boards nor by the investment trustees whose duty is to create
sustainable value for investment beneficiaries.
52 Heidi Welsh & Michael Passoff, Proxy Preview 2018, As You Sow, Sustainable Investments Institute, Proxy Impact,
2018. https://static1.squarespace.com/static/59f0ef404c326d3b5a4cf6a0/t/5aa2cf838165f56d578afce0/15
20619414334/Proxy-Preview-2018-Final.pdf Accessed 22 May 2018.
53 Mark Van Clieaf, Karel Leeflang & Stephen O’Byrne, The Alignment Gap Between Creating Value, Performance
Measurement, and Long-Term Incentive Design, Investor Responsibility Research Center Institute, 2014. https://irrcin-
stitute.org/wp-content/uploads/2015/09/alignment-gap-study1.pdf Accessed 22 May 2018.

48 Integral BusIness Models for CatalyzIng a regeneratIve & dIstrIButIve eConoMy
Figure 31: Elephants in the Room Framework (Source: Organizational Capital Partners, January 2018)
3.3.2.2.1.2. ACCOUNTABILITY DESIGN & STRATEGIC DUTY
Investment trustees and corporate boards have a fiduciary duty to manage the assets under their care
strategically, for perpetual returns to their beneficiaries – a duty of care unseen in current asset own-
ership and management. With Integral Business Models, boards hold themselves accountable not only
for the risks they take, but also the risks they make – at all levels, from the local to the global. They see
it as their duty to create system value – that is, create value not just for the company and its financiers
at the micro level (the doctrine of shareholder primacy), but value for all impacted rightsholders at the
meso level and for all the systems it operates in – economic, social, and ecological – at the macro level.
Van Clieaf argues for a maturation of the concept of fiduciary duty to encompass a duty for strategic
foresight, making the case that corporate boards and officers – as well as investment trustees – can
only fulfill their fiduciary duty by attending to their responsibility to set a long-term strategic vision that
attends to sustainable future value creation. He calls this Strategic Duty, a concept that can be tested
in legal settings to set a new bar of accountability for those who carry these responsibilities to their
beneficiaries. Keith Johnson and Ken McNeil recently laid out the legal case that corporate pursuit of
short-term profits has eclipsed sustainable long-term value creation, despite the fact that the latter is
the rightful core of fiduciary duty.54 Johnson & McNeil further observe that
Delaware court justices, the primary referee of corporate director fiduciary duties in the United
States, are so frustrated with the persistent effects of short-term pressures … that they are actively
encouraging investors to bring the right cases to help change the rules… There would be no better
54 Keith Johnson & Ken McNeil, “The Elephant in the Room: Helping Delaware Courts Develop Law to End Systemic
Short-Term Bias in Corporate Decision Making,” Michigan Business & Entrepreneurial Law, Volume 8, 2018
(forthcoming). https://www.reinhartlaw.com/knowledge/the-elephant-in-the-room-helping-delaware-courts-de-
velop-law-to-end-systemic-short-term-bias-in-corporate-decision-making/ Accessed 22 May 2018.

49Integral BusIness Models for CatalyzIng a regeneratIve & dIstrIButIve eConoMy
time to bring such litigation than when a court encourages it.55
So Integral Business Models will integrate Strategic Duty into their Board design, and integral investors will
enact their own form of Strategic Duty by demanding implementation of long-term strategic planning
of the boards and officers of their investee companies.
Van Clieaf bemoans the current implementation of fiduciary duty from a compliance mindset, calling
instead for a strategic mindset:
The problem with this emphasis on “compliance governance” is that compliance and oversight con-
stitute only a portion of a director’s duty to ensure that the business and affairs of a corporation are
managed “by or under the direction of” the board. The ultimate goal of corporations is to continue to
create wealth as a viable and growing entity for the long term; directors have a proactive responsi-
bility to ensure that the corporation they serve has those processes and metrics in place — including
strategic and financial plans — that they believe will accomplish this end. In other words, they have
a “strategic duty,” not just a compliance duty.56
• Performance Metrics & Periods
Strategic Duty calls for long-term planning, including the following considerations:
◦ 10 year+ enterprise strategy
◦ 10 year+ Research & Development (R&D) & Capital Expenditure (CAPEX) plan
◦ 10-20 year Succession Plan for CEO
◦ 5-10 year metrics aligned to the strategy
◦ 5 years+ ESG metrics aligned to strategy
◦ 5 year Long-Term Incentive Program (LTIP) design
Says Van Clieaf:
In my clients’ Boardrooms and C-Suites, when we define “sustainability” as sustainable cash flows
and returns on invested capital over 10 - 20 years-plus, then we have all the directors’ attention in
regards to long term business strategy and the need to invest for innovation for long term perfor-
mance, including investing in talent assessment / development for four-plus generations of C-Suite
executives. This is core to their fiduciary duty as Directors!57
• True Future Value Equation
The core job of Integral Business Models is to create system value, from now into the future. However,
measuring this value requires new metrics, such as the True Future Value Equation from the ThriveAbility
Foundation – which measures value creation contextually across the multiple capitals, identifying inno-
vation opportunities. There are three primary components:
◦ The Equation anchors performance with Social and Environmental Sustainability Factors in the
denominator, setting the operating space as “safe and just” between ecological ceilings and social
55 Ibid.
56 Mark Van Clieaf and Janet Langford Kelly, “The New DNA of Corporate Governance,” Directorship, March 2005.
http://mvcinternational.com/documents/MVC_DNA_Directorship.pdf Accessed 22 May 2018.
57 Mark Van Clieaf, email correspondence with authors, 28 September 2017.

50 Integral BusIness Models for CatalyzIng a regeneratIve & dIstrIButIve eConoMy
foundations à la Kate Raworth’s Doughnut Economics (with data based on science-based goals,
according to the principles of context-based sustainability);
◦ Also in the denominator is a sustainable innovation optimizer for synergizing natural and manu-
factured capitals;
◦ The numerator synergizes the “anthro capitals” (human, social, relationship, intellectual) which are
the key to creating value through positive impact.
Figure 32: True Future Value Equation (Source: ThriveAbility Foundation)
3.3.2.2.2. RISK & INNOVATION
The World Economic Forum Global Risks Report 2018 counterbalances the NACD survey, with climate-re-
lated risks as seven of the top eight populating the upper right quadrant of the likelihood / impact matrix.58
Applying this intelligence to the corporate setting, Integral Business Models take a holistic approach to risk,
encompassing not only traditional risk categories that impact the enterprise directly, but also broader
sustainability-related risks that impact the enterprise more indirectly. Furthermore, Integral Business Models factor not only “internal” risk (i.e. risk to the enterprise from the external environment), but also
“external” risk (i.e. risk from the enterprise to the external environment – which of course circles back
as risk to the enterprise).
And on the flipside, Integral Business Models similarly approach innovation holistically, viewing sus-
tainability-related factors as “enabling constraints” (that inform the “design principles,” per Upward.)
58 World Economic Forum, The Global Risks Report 2018, http://www3.weforum.org/docs/WEF_GRR18_Report.pdf
Accessed 10 February 2018.

51Integral BusIness Models for CatalyzIng a regeneratIve & dIstrIButIve eConoMy
Viewed through this lens, innovation is an ongoing practice that takes a lifecycle approach to business
models, acknowledging their natural birth / growth / maturation / decline cycles, and intervening before
the decline phase to transform them toward ongoing viability and thriving.
Figure 33: The Global Risk Landscape 2018 (Source: World Economic Forum, The Global Risks Report 2018)

52 Integral BusIness Models for CatalyzIng a regeneratIve & dIstrIButIve eConoMy
3.3.2.2.2.1. ESG + ERM
There are emerging signs of the integration of sustainability and Enterprise Risk Management (ERM).
At the micro level, for example, Lockheed Martin recently created a new position for Matt Swibel, who
had headed up the sustainability function there, with the new title combining oversight for sustainability
and ERM. And the Moore Foundation is supporting work by the World Business Council for Sustainable
Development (WBCSD) and Ernst & Young exploring the intersection of sustainability and ERM.59
A preliminary report released in 2017 extended work by the Committee of Sponsoring Organizations of
the Treadway Commission (COSO) that looks at the relationship between ERM and governance, culture,
strategy, and performance.60
EY and WBCSD added COSO to the fold for a 2018 report that more comprehensively integrates ERM
and ESG / sustainability. They start by identifying the Principles of COSO’s ERM Framework:
Figure 34: Principles According to COSO’s Framework (Source: WBCSD & COSO, Enterprise Risk Management: Applying enterprise risk management to environmental, social and governance-related risks, February 2018)
59 World Business Council for Sustainable Development, Sustainability and enterprise risk management: The first step
towards integration, 2016.
60 Committee of Sponsoring Organizations of the Treadway Commission (COSO), Enterprise Risk Management: Aligning
Risk with Strategy and Performance. Public Exposure Draft, June 2016.

53Integral BusIness Models for CatalyzIng a regeneratIve & dIstrIButIve eConoMy
The 2018 report builds on this foundation by integrating sustainability considerations into the ERM
Framework:
Figure 35: ESG-ERM Wheel (Source: WBCSD & COSO, Enterprise Risk Management: Applying enterprise risk management to environmental, social and governance-related risks, February 2018)
The ESG-ERM “Wheel” integrates elements of the Reporting 3.0’s vision of next-generation practices.
For example, in the first step on Governance, it calls for assesses “organizational bias,” reflected in r3.0’s
Positive Maverick attribute of challenging “the constraints, structural limitations, unconscious biases
and shadow agendas of the systems, networks, institutions and organizations they work in and with.”
The ESG-ERM Wheel also largely overlaps with the r3.0 Integral Materiality Process (discussed further
in Chapter 4).
However, the ESG-ERM model falls short of the level of ambition promoted by r3.0 – for example by
recommending scenario analysis, in line with the Task Force on Climate-Related Disclosure (TCFD), but
only implicitly pointing toward the need for Transition Planning (discussed in more depth in the subse-
quent section.)
Perhaps more significantly, the COSO Framework upon which the ESG-ERM report is based essentially
takes an internal approach to risk – framing risk as something that impacts an enterprise. This neglects
to address the risk that company impacts impose on external to the enterprise – and that circle back
around to impact the enterprise in the form of “systemic risk.”
Investors are starting to wake up to systemic risk. For example, universal investors (who typically apply
Modern Portfolio Theory and diversify their holdings across entire economies) increasingly recognize
that systemic risk cannot be hedged. There’s no place to hide from systemic risk, by definition. And
therefore, the traditional practice of buffering portfolio risk by generating alpha from security selection

54 Integral BusIness Models for CatalyzIng a regeneratIve & dIstrIButIve eConoMy
fails in a world of systemic risks. Indeed, Jim Hawley and Jon Lukomnik make the case in a recent paper
for “beta activism,” or “improving and enhancing beta, which it defines as the market as a whole, through
corporate governance stewardship.”61
This issue of systemic risk management (on top of enterprise risk management) rises in significance when
shifting from the micro-level lens of individual enterprises, to the meso-level lens of investment portfolios,
particularly for “universal investors” whose portfolios essentially hold the entire economy. Such investors
are increasingly recognizing the reality that “beta” is not necessarily endogenous, as Modern Portfolio
Theory assumes, but rather exogenous. In other words, systemic risk erodes “beta.” Raj Thamotheram
and Ed Waitzer capture this in a recent op-ed:
Managing risks and rewards at the systems level (environmental, social, financial) while at the same
time achieving competitive returns at the portfolio level is among the most difficult challenges facing
corporate and asset owner fiduciaries/managers.62
3.3.2.2.2.2. INNOVATION
Counterbalancing the downside risk associated with (un)sustainability is the upside opportunity of inno-
vation that addresses sustainability, according to Van Clieaf and Cathy Hansell:
COP21 – like the SDGs – is bounded by a 30-year+ planning horizon. Both goal sets are just beginning
to be part of companies’ business and innovation strategies by way of R&D and CAPEX plans for
long-term value creation. This transition includes sustainability and environment, social and gover-
nance factors (ESG) being transformed away from primarily legal compliance, operational impacts
on processes and downside risks to longer term, upside value creation.
The downside risk view considers how ESG and sustainability scenarios may negatively impact rev-
enues, margins and cash flows from current operations, and thus may adversely impact company
long-term valuation.
However, the International Energy Agency (lEA) has shifted the global playing field to the ‘upside’.
It has modelled the less than 2 degree centigrade COP21 target by 2050, demonstrating the need
for business model transformation and electrical grid/ distributed eco-systems transformation to
achieve 95% clean power systems for the world. Yes, 95% clean power is the required business model
change to be COP21 aligned.63
Van Clieaf, Hansell, and their Organizational Capital Partners colleagues take a lifecycle approach to
business model innovation, recognizing the need for dynamic balancing of current enterprise value cre-
ation with future system value creation, as a means of creating “evergreen” sustainable value creation.
61 Jim Hawley & Jon Lukomnik, The Third, System Stage of Corporate Governance: Why Institutional Investors
Need to Move Beyond Modern Portfolio Theory, 2 Mar 2018. https://papers.ssrn.com/sol3/papers.cfm?abstract_
id=3127767 Accessed 22 May 2018.
62 Raj Thamotheram and Ed Waitzer, “Long-Term Matters: Elephants in the Sustainability Room,” IPE Magazine,
November 2017.
63 Mark Van Clieaf and Cathy Hansell, “The Challenger: We have to see the business upside if COP21 and the SDGs are
to Work,” ESG Magazine, Issue 8, Summer 2017. https://app.esg-magazine.com/2017/07/21/the-challenger/pugpig
_index.html Accessed 11 February 2018.

55Integral BusIness Models for CatalyzIng a regeneratIve & dIstrIButIve eConoMy
Specifically, Organizational Capital Partners maps business models into a lifecycle flow (Figure 36),
delineating nine distinct phases that correspond to nine value quadrants (Figure 37).64
Figure 36: Corporate Lifecycle Stages & Future Value That Align to 9 Value Quadrants (Source:
Organizational Capital Partners)
Figure 37: Corporate Lifecycle Stages & Future Value That Align to 9 Value Quadrants (Source:
Organizational Capital Partners)
64 Network for Sustainable Financial Markets, Submission to Members of the Task Force on Climate-Related Financial
Disclosures (TCFD) in response to Public Consultation on Task Force Recommendations, 12 February 2018. http://www.
sustainablefinancialmarkets.net/files/wp-content/uploads/2009/02/SFM-Submission-TCFD-Final-02122017-v3-
with-supplemented-signatories_0.pdf Accessed 11 February 2018.

56 Integral BusIness Models for CatalyzIng a regeneratIve & dIstrIButIve eConoMy
Clearly, the goal is to align business models toward the upper right quadrant (3), such that downward
migration (4) triggers the need to innovate in order to refresh business models.
All directors of companies should know which value quadrant they are in relative to their peers and
their industry as part of strategy review, strategic goal setting, long-term incentive program design
and CEO succession and selection.65
So stated a Public Comment Letter from the Network for Sustainable Financial Markets (NSFM) to the
Taskforce on Climate-Related Financial Disclosure (TCFD) that was lead-authored by Van Clieaf.
Designing Regenerative Cultures author Daniel Christian Wahl applies the “Three Horizons” approach
conceived by Bill Sharpe and colleagues at the International Futures Forum, where Horizon 1 (H1 – in red
in Figure 38 below) is “business as usual”; Horizon 2 (H2 – in blue) represents the “world in transition”;
and Horizon 3 (H3 – in green) is how we envision a “viable world.”
Figure 38: Three Horizons Framework (Source: Daniel Christian Wahl, Designing Regenerative Cultures,
2016; via Bill Sharpe, Three Horizons, 2013)
Note that business model lifecycles can be mapped onto this framework, with H1 representing the stan-
dard trajectory of business model lifecycles. Integral Business Models seek to bridge H1 with H3 via H2
innovations. Wahl adds nuance to this kind of bridging innovation, pointing out that it’s
useful to classify H2 innovations into two categories. The first category is called H2 minus. H2-
innovations change the technology employed and therefore disrupt “business as usual” temporarily
but without leading to a profound systemic transformation. The second category is H2 plus. H2+
innovations offer a bridge to H3, leading to a structural change and transformation of the system in
question.66
65 Ibid
66 Daniel Christian Wahl, Designing Regenerative Cultures, Axminster, England: Triarchy Press, 2016.

57Integral BusIness Models for CatalyzIng a regeneratIve & dIstrIButIve eConoMy
Applying this thinking to business model lifecycles, the Integral Business Model approach is to consistently
seek H2+ innovation when business models mature into quadrant 4, “Create Innovation Renewal.”
3.3.2.2.3. SCENARIO ANALYSIS & TRANSITION PLANNING
Bridging current realities with future potentialities requires a certain amount of crystal-ball-gazing –
otherwise known as scenario analysis, when implemented with discipline. And analysis alone is useless
without innovative planning for transition in response to the most likely unfolding future.
3.3.2.2.3.1. TAKING THE LONG VIEW: SCENARIO ANALYSIS
Scenario analysis is certainly not new, according to Peter Schwartz in The Art of the Long View. The
discipline emerged post-World War II, with the US Air Force imagining what it’s opponents might do,
then entered corporate consciousness via Herman Kahn, who applied Air Force learnings to business
prognostication that reached a state-of-art with Shell’s London Group Planning office in the 1970s. 67
However, it is safe to suggest a gap between Shell’s future visioning and its business modeling. Alex
Steffen would call this predatory delay, or the conscious choice to postpone known transformation
imperatives in order to profit off the “spread” between recognition and action.68
The TCFD has clearly raised the bar for mainstream financial reporting as it relates to sustainability
issues – specifically climate change. In particular, the TCFD Recommendations, released in June 2017,
prominently endorse scenario analysis as a key strategy for assessing future business model viability.
One of the Task Force’s key recommended disclosures focuses on the resilience of an organization’s
strategy, taking into consideration different climate-related scenarios, including a 2° Celsius or lower
scenario. An organization’s disclosure of how its strategies might change to address potential cli-
mate-related risks and opportunities is a key step to better understand the potential implications
of climate change on the organization. The Task Force recognizes the use of scenarios in assessing
climate-related issues and their potential financial implications is relatively recent and practices will
evolve over time, but believes such analysis is important for improving the disclosure of decision-use-
ful, climate-related financial information.69
The actual Recommendation itself calls for companies to “describe how resilient their strategies are to
climate-related risks and opportunities, taking into consideration a transition to a lower-carbon economy
consistent with a 2°C or lower scenario…”70 The term “transition” is important here, as it applies to the
overall economy at the macro level, but is not applied at the micro level: the transition of the company’s
own business model in response to the scenario analysis.
67 Peter Schwartz, The Art of the Long View. New York: Doubleday, 1991.
68 Alex Steffen, “Predatory Delay and the Rights of Future Generations,” Medium, 29 April 2016.
https://medium.com/@AlexSteffen/predatory-delay-and-the-rights-of-future-generations-69b06
094a16 Accessed 10 February 2018.
69 https://www.fsb-tcfd.org/wp-content/uploads/2017/06/FINAL-TCFD-Report-062817.pdf
70 Ibid

58 Integral BusIness Models for CatalyzIng a regeneratIve & dIstrIButIve eConoMy
3.3.2.2.3.2. FROM SCENARIO ANALYSIS TO TRANSITION PLANS
Preventable Surprises (PS), a member of this Blueprint’s Working Group and a r3.0 Advocation Partner,
has for several years been calling for transcending (and including) scenario analysis by producing Transition
Plans for transforming business models in light of climate change (and other sustainability impacts). After
engaging its global network of Positive Mavericks, PS decided to focus its efforts first on the energy utility
sector as the most strategic leverage point. It produced a Guidance Note for companies in the sector,
as well as investors with exposure to the sector and thus opportunities to conduct forceful stewardship
engagement consistent with their strategic fiduciary duty.
Companies and investors must work together to understand the implications of the transition to a
clean power system, which must occur by 2050. Failure to do so threatens shareholder value and
the possibility of meaningful emissions reductions. To facilitate discussion between investors and
utilities, we developed this guidance note focusing on eight key questions. The publications cover
emissions goals; the development of new business models that take account of new opportunities,
new technologies and new entrants; the capital expenditure required for the transition; and the
internal changes to personnel and incentives needed to facilitate the transition.71
The market is starting to respond. While the lion’s share of <2°C shareholder resolutions since 2016 ask
for scenario analyses, one resolution (at the utility Southern Company) has asked for transition plans,
with strong support (34%) in 2016 and near-majority (45.7%) support in 2017. That year that saw majority
support for scenario analysis resolutions at Occidental (67.3%), ExxonMobil (62.1%), and PPL (56.8%).72
In 2018, the tide is starting to turn – with transition plan resolutions filed at Chevron, ExxonMobil, and
Valero. Says Natasha Lamb of Arjuna Capital, which filed the Chevron and ExxonMobil resolutions (with
As You Sow):
These resolutions represent a next level in the maturation of our strategies, following in the footsteps
of resolutions in previous years (and continuing this year) asking companies to conduct scenario
analyses of potential climatic outcomes based on scientific extrapolations.
So the main questions we now face are: how do we scale business model transitions to encourage
industry-wide transformation to a low carbon energy models? And how can we encourage other
investors to support transition plan resolutions through filing and proxy voting?73
Companies are starting to produce transition plans. For example, on 6 February 2018, American Electric
Power produced a Strategic Vision for a Clean Energy Future 2018 report that presents a plan to “transition
to a more balanced resource portfolio will help mitigate risk for our customers and shareholders alike and
ensure a more resilient and reliable energy system into the future,” said CEO Nicholas Akins.74
71 https://preventablesurprises.com/publications/guidance-notes/flip-the-switch/
72 Ceres Shareholder Resolutions Database, https://tools.ceres.org/resources/tools/resolutions/@@resolutions_s3_
view Accessed 10 February 2018.
73 Natasha Lamb, “Scaling Business Model Transitions Through Investor Resolutions,” Reporting 3.0 New Business
Models Blueprint Exposure Draft 2 Review, https://convetit.com/reporting-30-new-business-models-blueprint-ex-
posure-draft-2-review-729.html Accessed 22 May 2018.
74 American Electric Power, “AEP's Clean Energy Strategy Will Achieve Significant Future Carbon Dioxide Reductions,”
Press Release, 6 February 2018. https://www.aep.com/newsroom/newsreleases/?id=2021 Accessed 10 February
2018. American Electric Power, Strategic Vision for a Clean Energy Future 2018, http://aep.com/investors/docs/
AEP2018CleanEnergyFutureReport.pdf Accessed 10 February 2018.

59Integral BusIness Models for CatalyzIng a regeneratIve & dIstrIButIve eConoMy
3.3.2.2.4. ROLES & STRATEGIC LEADERSHIP
Business models come to life when we humans breathe them into being. Indeed, businesses are nothing
more than collections of people aligned around a common purpose. The key to meeting companies’ micro,
meso and macro challenges is to align people’s roles to their cognitive capacities.
3.3.2.2.4.1. WORK LEVELS, ENTERPRISE VALUE & SYSTEM VALUE
Organizational Capital Partners pursues such a “Work Levels” approach, calculating Enterprise Value
as the sum of Current Value and Future Value. The metric distinguishes itself by aligning value creation
with Work Levels, which correlate to individual cognitive capacity, particularly around time horizons
for strategic thinking and accountability (and by extension, organizational innovation capacity). Current
Value creation is associated with the lower Work Levels with more transactional innovation capacity
and shorter strategic horizons, while Future Value is associated with the higher Work Levels with more
complex innovation capacity and longer strategic horizons (over two decades at Work Level 7).
Figure 39: Work Levels, Strategic Horizons, and Enterprise Valuation (Source: Organizational Capital Partners)
From an Integral Business Models perspective, the Work Levels approach (which traces its roots to the
work of Elliot Jacques75 ) addresses
• micro-level business model innovation (with 5-10 year strategic horizons) at Work Level 5;
• meso-level industry structure / habitat ecosystem transformation (with 7-20 year strategic horizons)
at Work Level 6; and
• macro-level economic system transformation (with 20+ year strategic horizons) at Work Level 7.
75 Art Kleiner, “Elliott Jaques Levels With You,” strategy+business, January 1, 2001, https://www.strategy-business.
com/article/10938?gko=f119b Accessed 10 October 2017.

60 Integral BusIness Models for CatalyzIng a regeneratIve & dIstrIButIve eConoMy
The higher Work Levels transcend and include the previous Work Levels, so Work Level 7 encompasses
the considerations of all the lower Work Levels.
In implementing Integral Business Models, entrepreneurs and intrapreneurs will ideally work at Work
Levels 5 (micro / 5; meso / 6; and macro 7).
3.3.2.2.4.2. COMPENSATION & INCENTIVES
Van Clieaf also contends that current board setting of compensation and incentive structures are mis-
aligned with sustainable future value creation, and are instead focused on short-term profitability (often at
the expense of long-term value creation). Such entrenchment is further reinforced by investors (including
ESG investors), who overwhelming approve these Pay for Performance packages and Say on Say votes.
This dynamic further entrenches unsustainable business models, because the compensation structure
isn’t incentivizing sustainable business models. For example, the study mentioned above also found the
longest performance period is less than 4 years in long term incentive planning (LTIP) design for 80%+
of surveyed companies.
Van Clieaf sees the opportunity to further link compensation to long term planning aligned with the
achievement of societal sustainability targets, such as the COP21 / Paris Agreement targets of below
2°C global warming and the more concrete IEA goal of 95% renewable energy by 2050.
3.4. CASE EXAMPLES
The design of an integral business model and the flowchart discussed in the earlier parts of this chapter
(supported by the forthcoming chapters 4, 5 and 6) are an ideation that until now have not been applied in
practice. However, we received interest from several small organizations / startups to test the flowchart
and the advice given in this Blueprint. Reporting 3.0 developed a template in which organizations can
self-assess their awareness, readiness, and to-do’s to validate their existing (young) businesses. Please find
the template in Annex x. The following three case examples exemplify steps for further implementation.
Figure 40: Key Characteristics of an Integral Business Model (Source: Reporting 3.0)

61Integral BusIness Models for CatalyzIng a regeneratIve & dIstrIButIve eConoMy
These case examples went through a three-step process: a workshop to examine the drafts of the
Blueprint and get acquainted with the template, a second meeting to apply a first version of the template,
and an iterative process in discussing the eight general characteristics for finding gaps and help offered
to design an Integral Business Model.
Figure 41: The Integral Business Model Design Flowchart for Entrepreneurs & Intrapreneurs (Reporting 3.0)
The three companies that helped deliver case examples are:
VDMbee – IT sector:
VDMbee is a Dutch IT company. The VDMbee Value Management Platform creates business blueprints
and dashboards to support managerial decisions about future direction using a fact-based and data-
driven approach. VDMbee supports discovery of business ideas, strategy rationalization and scenario
analysis for successful business models in a continuous, closed-loop approach empowered by Object
Management Group (OMG) modeling standards.76 With this in mind VDMbee took part in the New
Business Model Blueprint Development to seek alignment of the Blueprint with their tooling, called the
Value Management Platform (VMP).
How can VDMbee make use of the New Business Model Blueprint for the benefit of their clients?
The below picture shows the fully integrated set of modules of VMP, used to support the VDMbee
Continuous Business Model Planning (CBMP) method. It follows a similar structure as the Integral
Business Model Flowchart.
76 See http://www.omg.org/marketing/omg-standards.htm

62 Integral BusIness Models for CatalyzIng a regeneratIve & dIstrIButIve eConoMy
Figure 42: VDMbee Continuous Business Model Planning (CBMP) Approach
The VMP has been analysed using the Integral Business Model Template in order to see which elements
can be supported. There was ample overlap:
• The software follows a structure that aligns well with the Integral Business Model Design Flowchart:
discover, prototype, adopt. These steps can be applied iteratively, resulting in a time-phased business
model plan. This fits well with ideation, prototyping, go-to-market, improving/adapting; the latter
two combined can lead to a change of the model then adopted.
• The Business Ecomap allows for describing relationships for all partners in a value cycle. The micro,
meso and macro perspective of Reporting 3.0 can be easily added as a design element and clarification
of direct and indirect relationships of all ‘rightsholders’ in the value cycle. Typical for VMP is that it
is adequate to support discovery and prototyping of multi-perspective ecosystems of interacting
business models.
• The Business Canvas tool allows to select and/or add various types of canvases. The Blueprint
mentions the Flourishing Business Model Canvas as a fitting option that can be used while creating
an Integral Business Model Design. The Business Canvas tool, in combination with other tools like
Value Stream Map and Strategy Map, are used to specify the realisation of the contribution of a
partner in the ecosystem.
• The Prototyping tools, building further on Discovery tools, allow for a context-based multicapital
approach for designing value and value aggregation. Impacts as prototyped, possibly over a time-
phased planning horizon, can be imported to a MultiCapital Scorecard, for purpose of assessment of
context-based sustainability (a pilot project is currently underway between VDMbee and the Center
for Sustainable Organizations).
• The multifunctional dashboards can then show the outcomes, and allow for what-if scenario analysis.
It is possible to follow the Integral Materiality Process for the evaluation of delivery of an Integral Business Model. This includes what-if scenario analysis, monitoring and comparison of planned versus
actual impacts.

63Integral BusIness Models for CatalyzIng a regeneratIve & dIstrIButIve eConoMy
What does this mean for the application of the eight general characteristics of an integral business
model?
VDMbee’s VMP is well suited to support the generic flow and use of the integrated Reporting 3.0 tools,
as described in the Integral Business Model Flowchart. In particular the following support is envisaged:
• Four Scale (Nano/Micro/Meso/Macro): The different levels of relationship in direct and indirect
form are possible elements.
• Contextualized: from a software perspective thresholds and allocations, the aspects that can help
build indicators for context-based sustainability, are just additional data points (numerator data)
necessary for designing indicators. These indicators and their related areas of impact would prefer-
ably be derived from the Global Thresholds & Allocations Council work of Reporting 3.0 over time,
but can, in anticipation, be defined and included in business model plans, as necessary parts in the
creation of dashboards.
• Purposeful: this aspect is linked to the ambition level of an organization and speaks for root-cause
analysis of an organizations impact. The various tools in VMP allow for that framing.
• Multicapitalist: a multicapital approach is essentially supported, and application of this may drive
further refinement on a needs-basis.
• Synergistic: This based on suitable collaboration between organisations (and their respective business
models) in industries and habitats (cross-industry, regional). Triangulations, nexuses and other forms
of collaborations can be simulated in VMP.
• Scalable, Leadership-driven, Thriveable: these areas appeal to the attitude of the management of
the organizations that use VMP. Although its data-driven nature and dashboard capability is pivotal
in this context, the readiness, mindsets and advocation willingness potential of the client company’s
leaders are at least as important to increase maturity levels in these areas.
Overall, VDMbee, with its VMP, is well suited to facilitate innovation and transformation towards Integral
Business Models, and aims to further pilot inclusion as described.
ReBlend – Circular and Sharing – Fashion/Apparel sector:
ReBlend started in 2013 with the idea of making fashion and textiles without the current huge negative
ecological impact. It has pioneered an environmentally friendly process to make new yarn and textiles
from non-wearable garments. ReBlend believes in the change from linear to circular and that is why is
organised in close co-operation with designers, labels and producers to develop textiles, prototypes and
pilot projects to support organizations to close the loop.
How can ReBlend make use of the New Business Model Blueprint for the benefit of their clients?
ReBlend works with corporations in the apparel & textile sector. As only 1% of all global textiles is
currently being recycled back into textiles, the remainder is either downcycled or incinerated, the chal-
lenge – and opportunity – is immense. ReBlend has shown that up to 100% can be recycled, made from
70% post-consumer textile waste and 30% recycled polyester from PET bottles. The yarn is developed
for both knitwear and woven materials that can be used within Fashion as well as interior applications.
The Integral Business Model and its eight General Characteristics serve as a frame in which ReBlend’s
USP can be positioned and analysed. This case example positions ReBlend in the Reporting 3.0 Strategy
Continuum, and discusses pathways for further development.

64 Integral BusIness Models for CatalyzIng a regeneratIve & dIstrIButIve eConoMy
Figure 43: Environmental Impacts of Textile Production Change (Source: ReBlend)
What does this mean for the application of the eight General Characteristics of an Integral Business Model?
• Four Scale (nano/micro/meso/macro): At this moment, ReBlend aims to support sustainable and
regenerative approaches to apparel & textiles by working with corporations of various sizes (small
to big) directly to incentivize use of 100% recycled yarn. In current economic system conditions,
ReBlend’s yarn is more expensive, but would be competitive through economies of scale if it were
used in larger amounts. However, if macroeconomics were designed to add external costs to the ‘true
costs’ of conventional cotton, the cost difference would be 16 Euros higher per kilo of conventional
cotton, benefitting ReBlend’s recycled cotton immensely (that just includes the additional natural capi-
tal costs on material; it might be even higher if social effects of the cotton supply chain were included).
• Contextualized: international competition in the cotton market will sooner or later be in conflict with
thresholds & allocations of the cotton sector. Water is the most prominent and concerning aspect, and
the use of pesticides is adding on top of that. Negative effects through the overuse of thresholds and
irresponsible allocations of water use lead to immense negative effects on communities and nature.
It is therefore of utmost importance to use recycled yarn in considerable percentages, not just to
reach economies of scale and better pricing, but to avoid all the bottlenecks of resource overuse and
constraints in availability to others.
• Purposeful: It is clear that ReBlend has the ambition to engineer out negative consequences in the
apparel & textile industry through its 100% recycled fibers. This ‘North Star’ approach defines the
ambition level and helps to always define how big the gap to success and scalability still is.
• Scalable: While economies of scale can help make 100% recycled yarn from ReBlend price com-
patible, there is a clear need to advocate for changes from linear to circular economies and for the
internalization of external effects to allow true costing. There is also a need to think how to make
available ReBlend’s IP as a global public good, while also being able to allow growth of ReBlend itself

65Integral BusIness Models for CatalyzIng a regeneratIve & dIstrIButIve eConoMy
and secure its core value proposition. This also includes advocation for stricter regulation in contrast
to investing into changing consumer behavior. Better offer regenerative solutions than to convince
every single customer to ‘buy responsibly’, a rather unsuccessful approach in other industries.
• Multicapitalist: ReBlend has done extensive research on natural capital as well as environmental
assessment, and considers the social and human capital side as well. Taking a “total contribution”
approach to their product is work in progress.
• Leadership-driven: while ReBlend is clearly leadership-driven through its founder Anita de Wit,
driving leadership at client companies is more challenging when it comes to 100% recycled yarn.
ReBlend’s contacts are mostly situated at CSO level, which inherits its own level of dynamics to
approach their leadership and convince them of this transformational agenda.
• Thriveable: this concept is appealing as a longer-term ambition, having engineered out all negative
impact from the value cycle and making sure there is no loser in the cycle due to 100% recycled yarn.
As thriveable is also the level of highest maturity in Reporting 3.0’s Strategy Continuum, maturation
pathways can be defined for longer-term achievement of thriveability of ReBlend and its impact on
nano, micro, meso, and macro levels. At this moment, ReBlend is concentrating on regeneration and
on micro to meso level impact.
• Synergistic: the use of textiles is prevalent in many industries. The necessity of dyeing for coloration
has been tackled by ReBlend through sorting the unwearables so that basic colors can be achieved
without a highly chemical dyeing process. Aspects of fire protected coatings and finishings of the
yarn is piloted through collaboration. Looking at synergistic business models as e.g. Interface’s Net
Positive enlarges the spectrum of Integral Business Modeling, looking for maximum synergy between
different industries.
Co-op Power – Energy Sector:
Co-op Power is a US-based, consumer-owned energy cooperative serving communities in New England
and New York. Co-op Power is a regional network of Community Energy Co-ops connected to other US
energy cooperatives and community-based energy organizations around the world through the Energy
Democracy Movement, NEC, and The Working World. Co-op Power is a multi-class, multi-race movement
for a just and sustainable future. Co-op Power provides tools for its members and Community Energy
Cooperatives to use to create new products and services, new businesses, and new jobs in their com-
munity, designed to meet the energy and economic needs of their community. Co-op Power members
sign on to use their market power, their investments, their labor (volunteer and paid), and their voting
power to support their development efforts, to build access to clean energy for all and to facilitate local
ownership of clean energy.77
Co-op Power has worked with its network of Community Energy Cooperatives to build 24 business
entities.
Example #1 – Solar Installers: Co-op Power supported the development of seven solar installers 15 years
ago, and they’re all going strong. There were few installers in the region and no one would service the
solar systems that were installed in the 70s, that were still functional but in need of routine maintenance.
Members stepped forward to start companies or recruited friends and neighbors who were interested.
They provided the initial markets, investments, policy advocacy, and encouragement to help these new
companies get started.
77 See www.cooppower.coop

66 Integral BusIness Models for CatalyzIng a regeneratIve & dIstrIButIve eConoMy
Example #2 – Energy Efficiency Companies: Co-op Power supported the development of three energy
efficiency companies ten years ago. Two only lasted six years and one is still going strong. The two that
closed down had difficulty managing the relationship with the utilities that oversaw the state energy
efficiency programs. They resisted doing things that were not in the customers’ interests and they
struggled with background and drug testing requirements that made it difficult to hire people of color
and people from limited resource communities. The one that’s working now provides 24 good green jobs
in Holyoke, Massachusetts, a challenged urban community. Three quarters (75%) of their workforce is
under 25, and the same percentage (75%) is Latino. The workers own a third of the business and two
community-based nonprofits own the remainder.
Example #3 – Solar Fund: Co-op Power is currently taking the lead to build a solar fund to support
community ownership of solar resources. They have recruited tax equity and debt to finance com-
munity-based solar developers in the US, working in partnership with an international loan fund and
community-based solar developers across the country. They are also making funding available to an
international sister network of indigenous communities for solar projects on their land.
Figure 44: Mapping Co-op Power’s Business Models on the Reporting 3.0 Strategy Continuum (Source:
Reporting 3.0 & Co-op Power)
Co-op Power has analyzed its business model(s) using the Integral Business Model Template. Co-op Power
has been working to implement many of the key concepts included in the Integral Business Model since its
inception in 2004. Because of the context challenges it faces, it is not yet thriving financially, but opportu-
nities have emerged in the last year that may allow it to achieve financial thriveability soon.

67Integral BusIness Models for CatalyzIng a regeneratIve & dIstrIButIve eConoMy
It has lots of work to do on its data gathering and reporting, and look forward to using those tools to get
better at doing what matters most.
What does this mean for the application of the eight General Characteristics of an Integral Business Model?
• Four Scale (Nano/Micro/Meso/Macro): Co-op Power embodies a commitment to connectedness and
clear communication, with positive impact on all four levels. Example: National Solar Fund develop-
ment in collaboration with other community-based solar developers – Co-op Power has partnered to
bring in enough financing for the solar projects it’s building and for the solar projects its colleagues
are developing too.
• Contextualized: Co-op Power has clear context know-how and the desire to showcase how sustain-
able, regenerating and thriving it is, but it has not yet thrived. Hopefully this year because we have
recently solved our problem accessing financing for our community-owned solar projects.
• Purposeful: Co-op Power has a clear purpose understood throughout the organization. It is a multi-
race, multi-class movement for a just and sustainable future in New England and New York and
beyond.
• Scalable: Co-op Power is focused on building a business model that works now, and that could work
for communities across our region (and beyond) once the financial thriveability challenge is solved.
It moves quickly to take advantage of new market opportunities, new funding streams, new talent.
• Multicapitalist: We focus on making good use of natural capital, human capital, social capital, manu-
factured capital, and intellectual capital. We value them all highly in our multi-class context, respecting
the contributions of every person and the environment.
• Leadership-driven – Co-op Power leaders aim high and are focused on these eight general charac-
teristics. They are also committed to justice and equity.
• Thriveable: This has been a very big challenge. The Co-op makes sound plans to bring in the financial
resources it needs to thrive financially, but has often experienced broken agreements with utilities,
banks, and other businesses coming from competitive mindsets instead of collaborative mindsets.
It is possible that the Co-op’s very business model asserts an existential and ethical challenge to the
traditional organizations with which it works. Due to this, the Co-op has stood on the brink of bank-
ruptcy several times, and boot strapped its way back onto firmer ground. It is harrowing. Because
of this, most exciting work is done by volunteers, and we haven’t had the resources to offer those
more creative job opportunities. It has often made choices for justice and sustainability that came
at the expense of financial viability. Its decision-making needs to be more conservative given the
challenging context it operates in.
• Synergistic: Co-op Power does make the most use possible of collaborations with other organizations.
It is as committed to the success of other mission-aligned organizations and businesses as to its own.
Co-op Power believes that Reporting 3.0 provides a way for the cooperative to better communicate
internally and externally about why it has made such an extraordinary commitment to collaboration, to
inclusive organizing, and to building an energy commons, serving not only the needs of its cooperative
and its members but also the broader social and ecological systems it operates within. This business
model template gives people a way to honor its achievements for long-term success.

68 Integral BusIness Models for CatalyzIng a regeneratIve & dIstrIButIve eConoMy
3.5. RECOMMENDATIONS
The Integral Business Model design is built by backcasting from a desired future state. While it is primarily
addressed at the nano level to entrepreneurs and intrapreneurs, it seeks transformation at the micro
(organizational) level that scales up to transformation of industry ecosystems, investment portfolios, and
bioregional habitats at meso level, and by extension, new integral economies on macro level. Thus entre-
preneurs and intrapreneurs need to be joined by investors, governments / multilaterals / foundations,
NGOs and standard setters. The Recommendations thus address these constitutencies.
Other Blueprints differentiated between education, advocation, and acceleration as three maturity levels
for recommendations. As Integral Business Model design is a new concept, we refrain from making that
differentiation in this Blueprint.
Constituency Recommendations
Corporations -
Entrepreneurs
• Apply the Integral Business Model Template as early in development as
possible, in order to adopt the most holistic approach to business model
design possible.
• Design and build a data infrastructure for measuring and managing the
business in keeping with Integral principles.
• Filter business models through the eight General Characteristics to iden-
tify hidden areas of opportunity to insulate against risk of embedding
unsustainable practices into the the business model.
• Exert leadership in industry / sector and entrepreneurial peer groups
advocating for Integral Business Modeling.
Corporations -
Intrapreneurs
• Run existing business models through the Integral Business Model Template to test their future-readiness – e.g. for navigating to net zero
GHG emissions by 2050.
• Identify priority opportunities to insulate business models against
emerging risks at the enterprise, portfolio, and systemic levels by assess-
ing the eight General Characteristics, and the Template.
• Apply select Implementation Methods to transition to Integral Business Models. For example:
• Shift to proactive GSE Pull approach.
• Add “inside-out” Systemic Risk assessment to “outside-in” Enterprise
Risk Management.
• Align key roles with leadership Work Levels.
• Set Long-Term Incentive Plans based on Sustainable System Value
Creation.

69Integral BusIness Models for CatalyzIng a regeneratIve & dIstrIButIve eConoMy
Standard
Setters
• Assess Frameworks and Standards against the eight General Characteristics to identify, anticipate, and align with emerging trends.
Investors • Develop tools to assess the Eight Integral Business Model Characteristics
at the portfolio level in order to identify companies with the greatest
potential to navigate emerging realities (and those less prepared).
• Assert influence on portfolio companies (e.g. through Forceful
Stewardship including direct engagement, filing shareholder resolutions,
and active proxy voting) to apply scenario analysis and develop transition
plans to Integral Business Models.• Shift from alpha to beta orientation in recognition of the migration of
risk from the portfolio to the systemic level.
• Evolve new interpretations of Fiduciary Duty, from a Compliance to a
Strategic Duty approach to Governance. Consider joining the Delaware
suit on corporate short-termism.
• Exert leadership through leverage of investment capital to spur the scal-
ing up of Integral Business Models.
Governments,
Multilaterals,
Foundations
• As major funders, governments, multilateral organizations and foun-
dations inhabit an influential position for promoting Integral Business Models in program work.
• Assess own programs through the Integral Business Model lens, applying
the eight General Characteristics.
NGOs • Utilize the Eight General Characteristics to shift from isolated focal areas
and single-issue advocacy campaings to more holistic approaches to
change advocacy.
• Practice pre-competitive collaboration as a means of tackling the inter-
connected nature of super wicked problems jointly.

70 RepoRting
4. REPORTING
Reporting 3.0 released the final report of the Reporting Blueprint at the 4th International Reporting 3.0
Conference in May 2017, and so its Recommendations are ripe for integration into the subsequent
Blueprints – particularly this Integral Business Models Blueprint, which leans heavily on other Reporting
3.0 thinking.
4.1. SHORTCOMINGS OF EXISTING REPORTING STANDARDS
We have laid out the shortcomings of current reporting standards in the Reporting Blueprint chapter 3.2.6.
We pick up on these shortcomings here to analyze and clarify how the Integral Business Model design
needs to adapt and take further actions based on these shortcomings.
We specifically assessed that:
• Sustainability Context is chronically forgotten in GRI-based sustainability reports due to the neglect
of the Sustainability Context principle. An attempt to include an impact assessment as a pre-step
to define Context for impacts was recommended in the G4 draft, but again taken out in the final
version. A proper Context integration process was never further enforced since then (G4.1. and GRI
Standards).
◦ A 2017 Danish study published in the Journal for Cleaner Production clearly showed that just 0.3%
of all 40.000 sustainability reports published by about 9.000 organisations worldwide between
2000 and 2013 made reference to Context (ecological limits specifically) for the understanding of
their sustainability perfomance.78
◦ This results in “numerator-only” data, using company-produced statistics to assess company per-
forance, neglecting to include “denominator” data from external sources to assess performance
of an organization vis-à-vis sustainability thresholds and allocations in its operating environment.
• Current reporting standards typically don’t follow a multicapital approach, but are topic-focused based
on the differing materiality processes, with different depth and focus based on which stakeholder
groups are prioritized – shareholders or stakeholders is the most basic distinction. These “stovepipe”
approaches on both capitals and audiences create an incomplete picture of performance.
• Reporting standards strongly focus on “less footprint” (i.e. negative impact) instead of “more hand-
print” (i.e. positive impact). “Doing less bad” isn’t as inspiring as “doing more good.”
• The 8 General Characteristics of an Integral Business Model include Purposeful and Leadership-driven.
Outcomes of these would be a higher capability of any organization to adapt and allow transfor-
mational change. It needs to close what we called the ‘organizational transformation gap’ and the
‘socio-cultural leadership gap’, both not at all described in sustainability reporting, that , as we learned,
isn’t even offering information on how to close the Sustainability Context gap.
The Integral Business Model design will move away from these shortcomings completely, mainly based
on the integral approach that the two most prominent tools from the Reporting Blueprint of Reporting
3.0 offer: the Reporting 3.0 Strategy Continuum (SC) and the Reporting 3.0 Integral Materiality Process
(IMP). They are built into the Integral Business Model Flowchart at those places where it makes most
sense to use them.
78 See Anders Bjørn et al, “Is Earth recognized as a finite system in corporate responsibility reporting?” Journal
of Cleaner Production, Volume 163, 1 October 2017. https://doi.org/10.1016/j.jclepro.2015.12.095 Accessed 23
May 2018.

71RepoRting
4.2. THE GREEN, INCLUSIVE AND OPEN ECONOMY PRINCIPLES AND THE SIX DESIDERATA
Before delving into tooling for the Integral Business Model Process Workflow we’d like to remind of some
basic considerations about what a Green, Inclusive and Open Economy actually means, and in how far
it builds out the mindset on which we’re basing our deliberations. In general:
• We define green as ecological sustainability, or the cyclical regenerativity of earth systems and nat-
ural capital that serves as the foundation of wellbeing for all species, including humans. In Doughnut Economics, Kate Raworth calls for respect for ‘environmental ceiling’ thresholds, as exemplified by
the Stockholm Resilience Center’s notion of Planetary Boundaries.79
• We define inclusive as the extension of economic and social empowerment to all humans to achieve
wellbeing and pursue flourishing and thriving, which requires systemic parity of access and oppor-
tunity for people of all sexes, genders, races, etc.. Kate Raworth calls for the broad achievement of
minimum ‘social foundation’ thresholds.
• We define open in the sense of the unfettered flow of information and resources that basic human
rights dictate. This notion underpins our definition of ‘rightsholders’ (as compared to shareholders
or stakeholders): all humans have the ‘right to know’ about issues that impact them (as well as the
right to privacy of information about themselves that doesn’t impact others), and the right to fair
distribution of vital capital resources in the Commons needed to support their wellbeing.
The Reporting 3.0 Reporting Blueprint coined the saying, “there is no sustainable business in an unsus-
tainable world,” a more concise version of the earlier mentioned quote from Stubbs & Cocklin in our fifth
category of Sustainable Business Models:
Organizations can make significant progress towards achieving sustainability through their own
internal capabilities, but ultimately organizations can only be sustainable when the whole system of
which they are part is sustainable.80
Both of these statements hearken back to the philosophy of Plato linking the part to the whole. The
Reporting Blueprint picks up on this “micro-macro link” by asserting the need to transform the economic
system design to a green, inclusive and open economy. In other words, an economy based on what John
Fullerton of The Capital Institute calls Regenerative Capitalism, in particular its two (of eight) princi-
ples focused on Balance (regenerate the multiple capitals by respecting systems balance) and Robust
Circulatory Flow (circulate value instead of extracting and concentrating it.)81 Kate Raworth picks up on
these threads in her work on Doughnut Economics by calling for the transformation to an economy that
is regenerative and distributive by design.82
79 Kate Raworth, Doughnut Economics, White River Junction: Chelsea Green, 2017. Johan Rockström et al, "Planetary
Boundaries: Exploring the Safe Operating Space for Humanity,” Ecology and Society, 14 (2): 32, 2009. http://
www.stockholmresilience.org/download/18.8615c78125078c8d3380002197/ES-2009-3180.pdf Accessed 23
May 2018.
80 Wendy Stubbs & Chris Cocklin, “Conceptualizing a ‘Sustainability Business Model,’” Organization & Environment,
Volume 21 Number 2, June 2008 103-127. http://edge.sagepub.com/sites/default/files/W%20STUBBS%20-%20
Conceptualizing%20a%20sustainability%20business%20model_3.pdf Accessed 5 October 2017
81 John Fullerton, Regenerative Capitalism: How Universal Principles And Patterns Will Shape Our New Economy, Capital
Institute, April 2015. http://capitalinstitute.org/wp-content/uploads/2015/04/2015-Regenerative-Capitalism
-4-20-15-final.pdf Accessed 7 October 2017.
82 Kate Raworth, Doughnut Economics, 7 Ways to Think Like a 21st Century Economist, White River Junction: Chelsea
Green, 2017.

72 RepoRting
This link between the micro (firm) level and macro (economy) level undergirds the Reporting 3.0 frame-
work and respective tooling, as laid out earlier and in the Reporting Blueprint and Data Blueprint, which
warrant coverage here:
• Six Desiderata and Nine Principles: Chapter 3 of the Reporting Blueprint describes an ‘ideation of
the Green, Inclusive and Open Economy’ through Six Desiderata and Nine Principles. These are
helpful to new business model intrapreneurs and entrepreneurs as guideposts for interlinking orga-
nization-level design with systems level considerations, in order to align with normative foundations
of an ideal end-state.
Figure 45: The Reporting 3.0 Six Desiderata (Source: Ralph Thurm, Reporting Blueprint: A principles-based approach to reporting serving a green, inclusive & open economy. Reporting 3.0, 2017.)

73RepoRting
• The Six Desiderata are structured according to the Triple Bottom Line and clustered around the
Multiple Capitals. The Desiderata propose vital design elements for a regenerative and distributive
economy to which new business models entrepreneurs and intrapreneurs can align their organiza-
tion-level design.
• The Nine Principles introduce values-based considerations and due process recommendations that
can be applied to new business model generation:
Figure 46: Nine Principles Supporting Disclosure Serving a Green, Inclusive and Open Economy (Source:
Ralph Thurm, Reporting Blueprint: A principles-based approach to reporting serving a green, inclusive & open economy. Reporting 3.0, 2017.)
The nine principles served the design of new the impetus for reporting as laid out in the Reporting
Blueprint and chapter 4.3. here, which in turn informed the design of the tools now described in chapter
4.4.
4.3. THE NEW IMPETUS: PURPOSE, SUCCESS MEASUREMENT, SCALABILITY
The New Impetus for Reporting: The Reporting Blueprint proposes a new framework for reporting, cov-
ering Purpose, Success and Scalability for telling the ‘story’ of new business model instigation. These
three lenses offer a series of questions for disclosures to answer:
• Purpose:
◦ What beneficial “reason-to-exist” does the business model assert?
◦ How does the business model assess root-cause solutions to establish its ‘right-to-exist’ claims?
◦ What legacy does it aim to build?
PRINCIPLESSUPPORTING DISCLOSURE
SERVING A GREEN, INCLUSIVEAND OPEN ECONOMY
RELEVANCEa symbiosis of sustainability
contact and materiality
RECIPROCITYUpward oral downward information
flow serving micro, meso, andmacro level
CIRCULARITYGuaranteeing ‘no loser in the value
circle’; negative impacts‘bounce ball’
MUTUALITYEvery action leads to reaction;
collaboration tramps competition
HUMBLENESS‘There are no passengers on
spaceship Earth; we are all crew’
ADAPTABILITYTake the journey together and
take consequences that oldpractices don’t have a future
REDUNDANCYNew business models have to
ensure that the ‘old’ becomes obsoletein order to ensure net positive or
gross positive impacts
MODULARITYResources are not losing values due
to intelligent circular concepts
CONNECTEDNESS‘There is no sustainable business in
an unsistainable world’, making a contribution to the
‘bigger whole’
@2017 Reporting 3.0

74 RepoRting
• Success:
◦ Does the report take a context-based, multicapital approach to success measurement?
◦ Does the report handle failure transparently, comprehensively, and accountably, accompanied by
proposed remedies?
◦ What is the horizon for the board and officers to measure true future value creation, and how does
this tie into governance decisions, strategy setting, enterprise risk management, compensation,
performance metrics, and valuation?
• Scalability:
◦ How do intrapreneurs scale transformation to sustainability and beyond across the entire business
– and catalyze it throughout the value cycle?
◦ How do entrepreneurs build scalable impact into new business models?
◦ How does the business model and the corporate leaders activate and accelerate transformation of
the economic system design?
The new impetus is also helpful to envisage to tell the story about the Integral Business Model. As we’ve
seen from the Eight Characteristics, all parts of the organization need to share the same vision, if small
or big. The Reporting Blueprint’s New Impetus is the right mechanism to prepare that storytelling right
from the outset. What can be avoided is the typical ‘beginner’s fault’ in which – starting with reporting
to funder like venture capitalists or other investors – financial ROI is implemented as the only measure
of success. Meanwhile, describing an ‘ROI for sustainability’ will always fall short of a more holistic con-
text-based multicapital success litmus test that looks at the total contribution. Also, the components of
the following Strategy Continuum and Integral Materiality Process will be needed to fully satisfy such
reporting based on the new impetus.
We know from yearly Edelman studies that trust in corporations (and their business models) remains at
very low percentages, whereas the translation of sustainability into innovation is vulnerable to shortfalls
in transformation capabilities and insufficient Work Level alignment of corporate leaders. We also know
that a resilient economy is far from sight given our current 1.7 planet Ecological Footprint. Current sus-
tainability reporting has no answers how to solve these challenges, while transparency is known to be one
of the best triggers of change – if done right. The New Impetus aims at revitalizing this trigger function.
Figure 47: The New Impetus for New Business Model Disclosure (Source: Ralph Thurm, Reporting Blueprint: A principles-based approach to reporting serving a green, inclusive & open economy. Reporting
3.0, 2017.)

75RepoRting
4.4. THE STRATEGY CONTINUUM AND THE INTEGRAL MATERIALITY PROCESS
The Strategy Continuum and the Integral Materiality are two essential tools embedded in the Integral
Business Model Flowchart.
• The Reporting 3.0 Strategy Continuum: After framing the need for new business models to spur the
emergence of a Green, Inclusive and Open Economy, the Reporting Blueprint asks the question: what
strategies would best realize this objective? Enter the Reporting 3.0 Strategy Continuum.
Figure 48: Reporting 3.0 Strategy Continuum (Source: Ralph Thurm, Reporting Blueprint: A principles-based approach to reporting serving a green, inclusive & open economy. Reporting 3.0, 2017.)
First, here is a general take that we used for plotting existing sustainability strategies into the contin-
uum. This helps as a first nearing to generally understand where and why an integral business model
in the down left quadrant. Several of the eight key characterists come to the front, e.g. context-based,
multicapital-based, micro-meso-macro focus, thriveability-based, etc..
This figure has proven one of the most clarifying and at the same time challenging in the Reporting Blueprint, as it offers a two-dimensional means of mapping the maturity of strategies triggering the
achievement of sustainability, regeneration, and thriving on the one hand, and economic system trans-
formation on the other hand. Reporting 3.0 has been working with Beta Testing Program Working Group
Members to map their current practices as well as their existing goals onto the dual-axis continuum. This
has led to the exploration of additional uses of the Strategy Continuum:
REPORTING 3.0 STRATEGY CONTINUUM
FROM INCREMENTAL STRATEGIES
BUSINESS-AS-USUAL IMPROVING SUSTAINING REGENERATING THRIVING
TO TRANSFORMATIVE STRATEGIES
FROM
CURREN
T ECON
OM
IC SYSTEM D
ESIGN
TO N
EW ECO
NO
MY
Cont
ext-
base
d th
resh
olds
and
allo
catio
ns a
cros
s m
ultip
le c
apita
ls
SUST
AIN
ABI
LITY
@2017 Reporting 3.0
DENIAL
COMPLIANCE
PHILANTROPY
CSR
ESG
SHARED VALUE
SYSTEM VALUE
SCIENCE-BASED/<2˚C
CONTEXT-FREE
CONTEXT-BASED
NET POSITIVE
CONTEXT-FREE
CONTEXT-BASED
MULTICAPITAL
GROSS POSITIVE
Economic system design transformation
NEW ECONOMY

76 RepoRting
Strategy Design Tool /
New Business Model Design
Maturation Pathways For
Mid/Long-term Planning
Goal-Setting From IS To
Planned Performance &
Controlling/Evaluation
POSITIONING SCENARIOS ROADMAP
Figure 49: Uses of the Strategy Continuum of Reporting 3.0 for the design of integral business models
(Source: Reporting 3.0)
An empty Strategy Continuum can be used to plot ideas around a future business model, assessing it
with regard to the ambition level that is connected to it, as well as to assess how far meso and macro
aspects are obstructions and/or potential benefits. A generic positioning of a business model ideation
is the outcome of this assessment.
Perhaps more importantly, we worked together to spec out “Maturation Corridors” and more specific
“Maturation Pathways” for moving into the target zone of the lower right quadrant.
REPORTING 3.0 STRATEGY CONTINUUM
FROM INCREMENTAL STRATEGIES
BUSINESS-AS-USUAL IMPROVING SUSTAINING REGENERATING THRIVING
TO TRANSFORMATIVE STRATEGIES
FROM
CURREN
T ECON
OM
IC SYSTEM D
ESIGN
TO N
EW ECO
NO
MY
@2017 Reporting 3.0
Economic system design transformation
Cont
ext-
base
d th
resh
olds
and
allo
catio
ns a
cros
s mul
tiple
cap
itals
SUST
AIN
ABI
LITY
NEW ECONOMYGoal Maturity
MaturationPathway
Figure 50: Reporting 3.0 Strategy Continuum with Maturation Pathway (Source: Reporting 3.0)

77RepoRting
For intrapreneurs, it is a ‘reality check’ on ‘what is’ and an ambition level check with regard to ‘what
should be’ when starting to plan a transition of an existing business model to <2 degree adaptability. It
also clarifies the need to understand and then act upon more than just a product or service portfolio,
but to address an overall portfolio of responsibilities for business leaders to advocate for change at the
nano (personal), micro (firm), meso (sector), and macro (economy) levels.
The Strategy Continuum also mentally prepares entrepreneurs for designing Integral Business Models.
Whereas intrapreneurs are challenged with reverse-engineering unsustainability out of their business
models, entrepreneurs have the opportunity to design new business models “from scratch,” and the r3.0
Strategy Continuum can focus attention on the “sweet spot” of the lower right quadrant that encourages
thriving at the micro (firm) and macro (economy, ecological, and social) levels.
At the same time, the Strategy Continuum also shines a light on the risk of business models that fall short
of sustainability and economic system design change. Clearly, this latter challenge cannot be achieved
alone, that’s why the Reporting Blueprint clearly lays out the need for education, advocation, and accel-
eration in the following New Impetus.
Finally the Strategy Continuum can be used for effective goal-setting based on both axis, including and
IS to PLAN roadmap, as well as to control & to evaluate performance after the go-to-market phase.
Figure 51 shows the areas in the integral business model flowchart where the Strategy Continuum can
be best positioned for use:
Figure 51: Use of the Strategy Continuum in the ideation and evaluation phase of the integral business
model flowchart (Source: Reporting 3.0)
• The Integral Materiality Process: while the above mentioned variations of the Strategy Continuum
help to describe, position, and clarify ambition levels, we developed the ‘Integral Materiality Process’
to embed the consequences of the use of the Strategy Continuum into process steps for actual
implementation and integration. This redefined materiality process correlates perfectly with what

78 RepoRting
described as key elements of the integral Business Model. We refer to the main steps in the Reporting
Blueprint in detail, but in short it refers to ‘external contextualization’ through definition of right-
sholders, areas of impact, thresholds & allocations, as well as ‘internal contextualization’ through
governance, risk, innovation, leadership, target-setting and controlling thereof (see also the chapter
three 3.3.2.2.2 specific areas in that regard – risk, governance, leadership). And in the final steps of
the Deming Wheel (the “Act” aspect of the Plan-Do-Check-Act Cycle), we tie back to industry and
the broad economy, as well as to society and natural ecosystems to close the loop to meso- and
macro-level transformation needs.
Figure 52: The Reporting 3.0 Integral Materiality Process (Source: Reporting 3.0)
The IMP is designed to help an integral business model entrepreneur and intrapreneur to build the nec-
essary information and process infrastructure in the form of a Deming wheel. The application of those
phases best belong in the prototyping and evaluation phase of the integral business model flowchart.
As mentioned earlier, it’s not the product and/or service alone that is important for the success of an
integral business model, it’s also dependent from the whole information infrastructure around it.
industrial, economic and societalecosystems
Rightsholdersto whom duties
& obligationsare owed
PLAN
1
DO
CHECK
ACT
ADVOCATE+
ACCELERATE
REPORTING 3.0 INTEGRAL MATERIALITY PROCESSEMBEDDED P-D-C-A
EDUCATE+
ADVOCATE
Impact areasand capitals
involved
Sustainabilitythresholds
and fair-share allocations
Context-based multicapital targets + performance metrics dashboard
With rightsholders on impact areas, thresholds
+ allocations
To net zero GHG by 2050 strategies & business models
SYSTEMIC TRANSFORMATION
DISCLOSUREELEMENTS
LOCAL, REGIONAL, GLOBAL BOUNDARIES
GAPIDENTIFICATION
INNOVATION
INTEGRALTHINKING
INTEGRALMATERIALITY
Rightsholders on sustainable business model & future value creation
Business model viability & sustainable future value creation
<2˚ Scenarios & devise transition plans that address systemic risk
Performance against interimtrajectory targets
Context into risk management, governance, leadership, innovation processes
EDUCATE
ADVOCATE+ACCELERATE
2
3
4
5
67
8
9
10
11
12
@2017 Reporting 3.0
TRANSFORM
TRANSITION
ENGAGE
ASSESS
TEST
TRACK INTEGRATE
SET
IDENTIFY
IDENTIFY
IDENTIFY
COLLABORATE

79RepoRting
Figure 53: Using the Integral Materiality Process in the prototyping and go-to-market phase of the inte-
gral business model flowchart (Source: Reporting 3.0)

80 RepoRting
4.5. RECOMMENDATIONS
The below Recommendations build on the earlier Recommendations made in Chapter 3. They specifically
focus on the purpose of Integral Business Model design as discussed in this chapter. In other words,
they don’t address the Eight General Characteristics, which were already covered in the Chapter 3
Recommendations.
Constituency Recommendations
Corporations
- Entrepreneurs
• Start linking business model design at the micro level to Green, Inclusive
and Open Economy parameters at the macro level in ideation phase.
Specifically, identify corridors of viability for the business model while
navigating from the existing economy to the new economy. Build the
necessary flexibility and transition capacity into design from the get-go.
• Appeal to the 9 Principles and 6 Desiderata for additional guidance on
Integral Business Model design.
• Conduct preliminary competitive analysis with the Strategy Continuum
to position early ideation in the overall continuum while also supporting
scenarios for mid-to-long term maturation/transition pathways.
• Utilize the Integral Materiality Process as guidance for constructing
Integral Business Models.
Corporations
- Intrapreneurs
• Reassess corporate Purpose through the lens of Integral Business Model Principles.
• Cross reference the Reporting Blueprint’s 9 Principles and 6 Desiderata
with the 8 General Characteristics of Integral Business Model design to
identify sweet spot harmonization.
• Conduct a competitive analysis using the Strategy Continuum to plot the
business models of same-sector peers to identify competitive advantage
from Integral Business Model adoption.
• Apply the Integral Materiality Process as a roadmap for transitioning to
Integral Business Models.
Standard
Setters
• Utilize the Stategy Continuum to plot standard / framework maturity
in providing guidance toward Integral Business Models emergence, and
identify standard / framework maturation opportunities / pathways /
corridors.
• Conduct a comparative analysis of standard / framework against the
Integral Materiality Process as tools for spurring Integral Business Model
development.

81RepoRting
Investors • Explore investment strategy Purpose in relation to capitalizing Integral Business Models that spur New Industry Ecosystems and New Integral
Economies to emerge using the 9 Principles and 6 Desiderata as
guideposts.
• Plot business models of portfolio companies on the Strategy Continuum
to identify more mature and robust business models that are more likely
to create ROI through societal transitions.
• Apply scenario analyses to build maturation pathways for your portfolios
and actively seek such investments and/or help build a market for them.
Governments,
Multilaterals,
Foundations
• Use the Strategy Continuum to plot your expected policy outcome, pro-
grams impacts, and grant/subsidy processes as a measure of promoting
Integral Business Models.
• Utilize the 9 Principles and 6 Desiderata to assess government / multi-
lateral / foundation policies, programs, projects, and subsidies / grants
as instations of Integral Business Model practices.
NGOs • Plot campaigns onto the Startegy Continuum to assess current posi-
tioning vis-à-vis Integral Business Model advocacy, desired future
positioning, and the maturation pathways to get there.
• Consider the ways in which the NGO business models are Integral
Business Models. Do the missions and strategies of NGOs support a
Green, Inclusive and Open Economy? How does focal issue advocacy
intersect supportively with issue advocacy by other NGOs? Where is
collaboration necessary? Where does it need a third and independent
facilitator? r3.0 aims at supporting pre-competitive and market-mak-
ing action deemed necessary to support NGOs in a positive maverick
approach. NGOs are invited to use the 9 Principles and 6 Desiderata to
assess their complementarity to a Green, Inclusive and Open Economy.

82 Accounting
5. ACCOUNTING
The Accounting Blueprint and New Business Models Blueprint development paralleled each other. The
Accounting Blueprint focused on the question of how new accounting could look 20 years from now,
when Integral Business Models have emerged in earnest, with a need for Integral Accounting across the
multiple capitals to assess performance within their carrying capacities.
5.1. SHORTCOMINGS OF CURRENT ACCOUNTING STANDARDS
The Accounting Blueprint launches with the assertion of three currently disconnected accounting subdis-
ciplines – financial accounting, management accounting and sustainability accounting. The Accounting Blueprint promotes convergence between the three into a new form of Integrated Accounting.
Figure 54: New accounting as a comprehensive discipline - three accounting subdisciplines lay the foun-
dation for diverse communications (Source: Reporting 3.0)
A context-based and multicapital accounting system converging these three disciplines would also sup-
port the development of the Integral Materiality Process, Reporting 3.0’s recommended management
PDCA process (described in Chapter 4). Many of the 12 steps are reliant on information from con-
text-based multicapitalism.
The Accounting Blueprint therefore also asks for a redefinition of the reporting principles. The below
figure shows how the principles pick up aspects from the other Blueprints: ‘Relevance’ is a consequence
of the neglect of sustainability context when defining materiality, and ‘Multicapital’ is based on a holistic
success measurement that all Blueprints pick up on. This set of principles is also based on a p-d-c-a logic.
Current accounting features profit & loss accounts that focus on financial capital exclusively, pointing to
the need for multicapital accounting that also attends to thresholds and allocations, externalities, and
non-monetary information in the valuation of the multiple capitals. Balance sheets fall short of answering
what the difference between book value and market value entails as they do not differentiate between
owned assets (e.g. human and intellectual capital) and shared assets (e.g. social and natural capital). In
addition, there is no view on long-term risks (and opportunities). Finally, narrative reporting falls short in
deepening necessary information and especially fails to address the new quality of ‘ethical management’
and its consequences for corporate governance. This is where this Blueprint hints towards aspects of
renewed accounting for the design of Integral Business Models.

83Accounting
Figure 55: Recognized Comprehensive Accounting Principles as the basis for Reporting 3.0’s ‘New
Accounting’ (Source: Reporting 3.0)
5.2. CREATING THE BASIC INFRASTRUCTURE THAT INTEGRAL ACCOUNTING NEEDS TO OFFER
We used the below figure in chapter 4 already where we elaborated on the Integral Materiality Process.
In this chapter we want to alert to the accounting consequences. The prototyping phase of new Integral
Business Models can sow the seeds for Integral Accounting. This would be the moment where the
implementation of the Integral Materiality Process would go hand in hand in planning the necessary
accounting steps.
Figure 56: Preparing a revised accounting for success (Source: Reporting 3.0)

84 Accounting
As well, the Accounting Blueprint advises a full Accounting Department cycle that would later be imple-
mented fully, but its instigation and implementation starts in the prototyping phase of Integral Business Model design. We don’t expect entrepreneurs to focus on this area in full breadth at an early start of
their development cycle, but it’s good to have a general grasp of how a succesful Integral Business Model would pick up on these points step by step.
Figure 57: Accounting Department Cycle supporting Integral Business Model design (Source: Reporting 3.0)
The Reporting and Accounting Blueprints especially concentrate on the shortcomings of the current
Materiality principle. The Accounting Blueprint advises combining Materiality and Sustainability Context into
one principle called ‘Relevance’. As a shortcut to the full description of the Process Flowchart, the following
steps are rudimentary aspects to take care of when starting to build out the accounting infrastructure for
an Integral Business Model, as also advised in the Integral Materiality Process:
• Map your Integrated Value Creation Process, including Value Proposition and Business Model with
their associated intended impacts;
• Assess your Impacts, including impactful unintended consequences of your business, relying on scien-
tific opinion on risks associated with carrying capacity and impacts on vital capitals;
• Assess innovation opportunities, including opportunities around enhancing use of different capitals
and ways of turning negative impacts or risks into opportunities and positive impacts;
• Consider your organizational Policy, Values and Strategy, including different types of values such as
business values, ethical values, behavioral values and cultural values;
• Consider industry and market trends, including peer behavior, evolving industry norms, standards and
foresight;
• Consider societal trends, including societal behavior and norms, governmental laws and regulations;
• Engage with prioritized rightsholders on findings related to the above, seeking to improve understand-
ing, prioritize topics and validate your management approach;
• Discuss conclusions from the above with internal leadership, agreeing on follow-up actions in view of
implications for accounting systems, processes, data requirements, different disclosure documents and
aligned performance communications

85Accounting
The Accounting Blueprint also advises on a set of changed designs for the income statement, balance sheet
and recommends to add a statement of long-term risk and aligning all three of them with a better narrative,
especially how corporate governance is creating the creative processes necessary to have a constant push
on continuous improvement.
Figure 58: Statement of Full Comprehensive Income (Source: Reporting 3.0)
The multilayered Statement of Full Comprehensive Income (FCI) presents (i) Other Comprehensive
Income, (ii) Value Added Distributed, as well as (iii) Indirect Benefits and Costs to arrive at a total FCI. It
separates internalities (covered in the Value Added Distributed section) and externalities (covered in the
Indirect Benefits / Costs section). The former presents monetary values based on recorded transactions
between the reporting entity and others, while the latter presents monetary values based on scientific
estimations. The items listed under the former covers the fields of ID Materiality and ED Materiality,
while the items listed under the latter cover the fields of ED Materiality and EI Materiality. Breakdown
categorization of the items in the externalities layer can be refined to reflect capitals such as Human,
Societal and Relationship, as well as Intellectual Capital. The “external” dimension of Human Capital
in the form of “own employees” relates to issues such as work/life balance and the health impacts of
societal phenomena such as epidemics.
Figure 59: Comprehensive Statement of Financial Position (Source: Reporting 3.0)

86 Accounting
The Accounting Blueprint also presents an expanded balance sheet, the Comprehensive Statement of
Financial Position for the current or past year. It adds a new layer to the conventional balance sheet,
referring to the market value of the enterprise to come up with a new total which is Total Comprehensive
Liabilities including market capitalization of Owners Equity. The market value and associated Price/Book
Value Ratio is calculated on the basis of share price as at 31 December. To avoid the impact of short-term
shock events, the share price can be taken as the average price of the last month.
On the left-hand side of the expanded balance sheet, the reporting entity is invited to give its estimation
of the relative contribution of its non-purchased IAs with indefinite life to the difference (gap) between
market value and book value. If the share is undervalued, the reporting entity can give an estimation of
the relative values of such non-purchased IAs which are not effectively recognized by the market and
which would make the difference in taking the Price/Book Value Ratio to par and beyond 1/1. Of course,
each enterprise would make the case that its shares are worth substantially more. If a reporting enterprise
added up more or less scientific estimations of the assets involved - for example brand value, reputation
value, or employee value – it may result with a grand total far more than Total Comprehensive Liabilities
(including Market Value of Owners Equity). However, short of giving reporting entities a complete blank
check in suggesting the real value of their enterprises, the expanded statement uses current Market
Value to set a ceiling.
Note also that the second layer of the expanded balance sheet differentiates between “own” and “shared”
capitals, the latter providing for the Social, Relationship and Natural Capitals. The former includes Human
Capital and the workforce, one of the most obvious assets whose absence on conventional balance sheets
many find surprising. Most financial accountants would agree that IASB recognition criteria could be
met for Human Capital. An entity can measure the value of its workforce, and prove future economic
benefit associated with the cost and investment involved. Why then could the value of the workforce
not be capitalised on the balance sheet? The value that a reporting entity would enter on our expanded
balance sheet would focus not on expenditure on employees, but rather on investment in employees –
i.e. capturing activities that are expected to generate income beyond one year (longer term). Calculating
the value of Human Capital will therefore be based on components such as total compensation and
expected income – the reporting entity will generate economic income returns from Human Capital in
future periods.
The Social and Relationship Capital is dependent on the reporting entity taking action, meaning it co-cre-
ates the capital and can bring it to an end if it so wishes. Being co-created, it remains at best shared and
cannot be owned. In the case of Natural Capital, this refers to external assets that may belong to others
or may be a public good. Different from a company’s own land and assets, as reflected in the conventional
balance sheet, these external Natural Capital assets can at best be shared and its services purchased.
As the expanded balance sheet uses Market Value to set an overall ceiling to what is reported as Total
Comprehensive Assets in the Comprehensive Statement, the real value of external Natura Capital assets
that the reporting entity relies on is likely to be substantially greater than what is reflected in this state-
ment. The statement only gives an estimation of relative importance, as currently recognized by the
market, of that portion of Natural Capital services on which the entity is directly and highly dependent.
What the expanded Balance Sheet does is to provide for more informed decision-making related to
the gap between book value and market value today (this year). It seeks to present a more complete
Statement of Financial or Value Position. But related to future direction and prospective outlook, a
remaining question is that of future risks related to long-term assets as reflected on the conventional
balance sheet. To address this, we suggest a Statement of Long-Term Risks and Estimated Non-Current
Asset / Liability Value. Partially a Future Balance statement addressing future value, this statement pres-
ents a combination of quantitative, financial and qualitative, explanatory information. The reporting entity

87Accounting
is invited to provide estimations (range) of what may be the value of its long-term assets and liabilities
twenty years from now. For industries such as oil & gas, mining, power generation and water services it is
common to do planning related to assets with lifespans of for example 50 – 100 years. For the purposes
of facilitating a discussion on long-term risk across industries, a period of 20 years however suffices – a
period for which demographic and other trends are understood with greater certainty.
Figure 60: Statement of Long-Term Risks and Estimated Non-Current Asset / Liability Value (Source:
Reporting 3.0)
New Accounting will therefore challenge the reporting entity to illustrate to rightsholders that it is pre-
pared and able to exercise informed decision-making about long-term risks associated with its non-current
tangible and intangible assets. These include land, reserves and building property that may be vulnerable
in the face of global climate change. The brief descriptive text provided by the reporter in the Statement
of Long-Term Risks can be expanded on in narrative reporting. Compared to the Comprehensive Income
Statement and its coverage of flows, this combination of the expanded balance sheet and statement of
long-term risks addresses current and future stocks. Its presentation of financial and explanatory infor-
mation in a balance sheet type structure serves to enhance integration and narrow the gap between
narrative discussion and financial statements. It presents an approach more focused on timely values
and less on the reliability of numbers, resulting in what ICAEW (2016: 18) has referred to as a form of
Full Fair Value Accounting. It follows the prediction that ‘in the New Economy, companies will need to
continuously measure and report all assets at fair value to all users’ (Boulton et al, 2000). And the fair
or market value of today incorporates expectations of future value.
These are just glimpses of accounting that can ideally be expected in the years to come, with steps that
can be taken right from the start.

88 Accounting
5.3. RECOMMENDATIONS
The Recommendations of the Accounting Blueprint backcast from a necessary ideal 20 years from
now. Using these Recommendations may therefore differ quite a bit between Integral Business Model
entrepreneurs and intrapreneurs. For the other constituencies we think it is necessary that they build
an understanding why being supportive of these changes will be for their very own benefit.
Constituency Recommendations
Corporations
- Entrepreneurs
• The ideation and prototyping phases are ideal opportunities to exper-
iment with alternative accounting mechanisms, such as the Integral
Accounting advocated by the Blueprint. might not be at the core of your
thinking as a business model entrepreneur. Think of a Corporate Value
Officer and how she may set up her function, how profit and loss need
to support true costing and true benefiting, support transparency on
multiple capitals and how a balance sheet needs to explain the difference
between book value and market value.
Corporations
- Intrapreneurs
• Implement principles and practices from the Accounting Blueprint in
designing a transition strategy to an Integral Business Model with more
holistic value creation.
• Ask accountants to support an Intergral Materiality Process through
multicapital accounting. Understanding impacts based on depreciation
and appreciation of/on multiple capitals is a great starting point.
• Build first versions of a multicapital designs in profit/loss and balance
sheets as next steps in the transition, followed by iterations.
• Launch projects to pilot Integral Accounting practices such as multilay-
ered balance sheets and income statements.
Standard
Setters
• Perform a Gap Analysis between Accounting Blueprint Recommendations
and current Standards, assessing expected outcomes in terms of rein-
forcing existing business models as compared to spurring Integral
Business Models.
Investors • Apply Integral Accounting principles and practices (such as multicapital
/ context-based accounting) to portfolio assessment.

89Accounting
Governments,
Multilaterals,
Foundations
• Governments, multilateral organizations and foundations can play
important support roles in instigating the emergence of multicapital
integral accounting and its transition from incrementalism to scalability.
• Apply Integral Accounting to national accounts, project finance, and
funding portfolio accounting.
NGOs • We are recommending NGOs to learn about multicapital accounting, the
need for thresholds & allocations, and coming to the point to position
their own campaigns under the logic of the Accounting Blueprint and
the broader work ecosystem logic of Reporting 3.0.

90 Data
6. DATA
Reporting 3.0 released the Data Blueprint alongside the Reporting Blueprint at the 4th International
Reporting 3.0 Conference in May 2017, so the Recommendations and concepts it contains are also ripe
for integration into the New Business Models Blueprint.
6.1. SHORTCOMINGS OF THE EXISTING INFORMATION SYSTEM INFRASTRUCTURE
The primary shortcoming of the existing information system infrastructure is the so-called “Sustainability
Context Gap” (or shortened to simply “Context Gap”) which the Data Blueprint documents by referencing
the 2017 Danish mega-study of ~40,000 sustainability reports issued since 2000, of which only 5%
discuss ecological limits at all, and only 0.3% of reporting companies (31 of ~9,000) link their discussion
of ecological limits to innovation or strategy.83 This latter finding is, of course, particularly pertinent to
applying the Data Blueprint to the New Business Models Blueprint, as Integral Business Models clearly need
to bridge the Context Gap to operate in the “safe and just operating space for humanity” described by
Johan Rockström with the Planetary Boundaries concept and Kate Raworth’s addition of the Social
Foundations concept from her Doughnut Economics work.
Figure 61: Planetary Boundaries (left) plus Social Foundations (right) (Sources: Johan Rockström et al,
“A Safe Operating Space for Humanity,” Nature, Vol 461, 24 September 2009; Kate Raworth, Doughnut Economics: 7 Ways to Think Like a 21st Century Economist, White River Junction: Chelsea Green, 2017.)
6.2. CREATING A SEAMLESS DATA FLOW BETWEEN MICRO, MESO AND MACRO
The Data Blueprint proposes a seamless flow of data that discerns inter-capital dynamics and closes the
Context Gap by linking company’s micro-level impacts to the broader macro-level economic, social and
ecological systems they operate within.
83 Anders Bjørn et al, „Is Earth recognized as a finite system in corporate responsibility reporting?“ Journal of Cleaner
Production, Volume 163, 1 October 2017, pp 106-117. https://www.sciencedirect.com/science/article/pii/S0959
652615019204 Accessed 11 February 2018.

91Data
6.2.1. FROM THE DALY TRIANGLE TO THE DALY HOURGLASS
A key resource for this is Limits to Growth Co-Author Donella Meadows’ 1998 report, Indicators & Information Systems for Sustainable Development, in which she proposes a framework for designing a data
architecture for tracking progress toward sustainability and development. She presents her framework
graphically through the Daly Triangle, an image first proposed by World Bank Economist and Ecological
Economics Co-Founder Herman Daly that Meadows augmented by layering in the Multiple Capitals atop
Daly’s 4 categories of Ultimate Means, Intermediate Means, Intermediate Ends, and Ultimate Ends.
Figure 62: The Daly Triangle (Source: Donella Meadows, Indicators and Information Systems for Sustainable Development, The Sustainability Institute, 1998)
Reporting 3.0 follows in Meadows’ footsteps by augmenting the inherited Daly Triangle, making a series
of transformations – for example, merging two opposite-facing triangles into an hourglass to equally
emphasize the Ultimate Means and the Ultimate Ends, and flipping it over so the Ultimate Means are
atop, like the reservoir of sand that creates an hourglass’ flow. As well, we added corresponding stocks
of capitals, and the flows between them. Finally, we added thresholds, as Meadows discusses the key
role that carrying capacities of capitals play in measuring and determining sustainability.

92 Data
DALY TRIANGLE TO DALY HOURGLASS
Ultimate MEANSNatural Capital
Intermediate MEANSBuilt Capital &Human Capital
Stocks
Flows
Intermediate ENDSSocial Capital &Financial Capital
Current Daly Triangle
Add Cycles Add Doughnut
Ultimate MeansNatural Capital
Ultimate EndsWell-Being
Natural Capital
Well-Being Natural Capital
Well-Being
Balance “Ultimate” Emphasis Combine Flip
Ultimate ENDSWell-Being
@2017 Reporting 3.0
“Doughnut”SustainabilityEcological Ceilings
Social Foundations
Figure 63: Daly Triangle → Daly Hourglass (Source: Bill Baue, Data Blueprint: Data Integration, Contextualization & Activation for Multicapital Accounting, Reporting 3.0, 2017)
What results is Reporting 3.0’s vision of a “Daly Hourglass”84:
Figure 64: The Daly Hourglass (Source: Bill Baue, Data Blueprint: Data Integration, Contextualization & Activation for Multicapital Accounting, Reporting 3.0, 2017)
84
LEGEND
DALY HOURGLASS
ULTIMATE MEANSNatural Capital
INTERMEDIATE MEANSBuilt Capital
Human Capital
INTERMEDIATE ENDSSocial Capital
Financial Capital
ULTIMATE ENDSWell-Being
Capital FlowsCapital Stocks
Ecological Ceilings
Social Foundations
@2017 Reporting 3.0
Susta
inab
ility
Thr
esho
lds

93Data
The Reporting 3.0 “Daly Triangle” taps into (and arguably extends) Daly’s own visual think-
ing of the Georgescu-Roegen Hourglass from his seminal text with Joshua Farley, Ecological Economics: Principles and Applications. Washington, DC: Island Press, 2004. It’s worth reprinting
the Georgescu-Roegen Hourglass here and excerpting Daly & Farley’s explanation:
“The hourglass on the left is an isolated system; no sand enters, no sand exits. Also, within the
hourglass there is neither creation nor destruction of sand; the amount of sand in the hourglass
is constant. This, of course, is the analog of the First Law of Thermodynamics, the conservation
of matter and energy. Finally, there is a continual running down of sand in the top chamber and
an accumulation of sand in the bottom chamber. Sand in the bottom chamber has used up its
potential to fall and thereby do work. It is high-entropy or unavailable matter-energy. Sand in the
top chamber still has potential to fall; it is low-entropy or available matterenergy (still useful). This
is the analogy of the Second Law of Thermodynamics: Entropy, or “used-up-ness,” increases in
an isolated system. The hourglass analogy is particularly apt because entropy is “time’s arrow” in
the physical world—that is, we can tell earlier from later by whether or not entropy has increased.
However, unlike a real hourglass, the entropy hourglass cannot be turned upside down!
With a bit of license, we can extend the basic analogy by considering the sand in the upper cham-
ber to be the stock of low-entropy fossil fuel on Earth, depicted in the right-hand figure. Fossil
energy is used at a rate determined by the constricted middle of the hourglass, but unlike a normal
hourglass, humans alter the width (i.e., they change the rate of consumption of fossil fuels). Once
consumed, the sand falls to the bottom of the chamber, where it accumulates as waste and inter-
feres with terrestrial life processes.
To represent solar energy, the top of the hourglass on the left would be vast (from the human
perspective) as would the bottom; solar energy, too, ends as waste heat, but it is not confined to
the Earth. It does not disappear, but it radiates into outer space, and unlike waste matter does not
accumulate on Earth. The constricted middle, however, would be quite small, and humans would
be unable to adjust it. The solar source of low entropy is stock-abundant but flow-limited. In other
words, there is a lot of it, but we get only a little at a time. The terrestrial source is stock-limited
but flow-abundant, until the stock runs out. The asymmetry is important. With industrialization
we have come to depend more and more on the least abundant source of low entropy. However
convenient in the short run, this will be uneconomic in the long run.”
84

94 Data
As stated in the Data Blueprint:
Now that we can see the hourglass design in its entirety, its implications crystallize. First and fore-
most, an hourglass is traditionally a timepiece, reminding us that the process of transforming natural
capital resources into anthro capitals for the ultimate purpose of supporting wellbeing and enhancing
fulfillment is embedded in the flow of time – one of the key defining aspects of sustainability indi-
cators, according to Meadows (“How long can this activity last? How long do we have to respond before we run into trouble?”)
Simultaneously, the Daly Hourglass demonstrates the feasibility of transcending the “ticking clock”
aspect of 21st Century life (ever-aware as we are that overshooting ecological ceilings and shortfalling
social foundations can only last so long before systems collapse) by tapping into cyclical balance for
the perpetual regeneration of capital stocks and flows inherent in the natural order.
This underlines the vital importance of a data / information systems architecture that encompasses
this multicapital, contextualized orientation. Our current monocapital, uncontextualized data archi-
tecture, wedded as it is to the status quo or to incrementalism at best, yields information shackled
to the illusion of progress, thereby damning itself to always fall short of sustainability. So, a fit-to-
purpose data / information systems architecture creates seamless data and information flows across
3 dimensions:
• Across the multiple capitals;
• Across the micro / meso / macro levels interlinking companies / industries & habitats /
socio-ecological systems;
• Across value cycles.
So, what we arrive at with the Daly Hourglass is a general specification for data architecture and
information systems that are fit-to-purpose for spurring the emergence of a truly regenerative, green,
inclusive, and open economy. Indicators and metrics built to represent financial, economic, environ-
mental, and social sustainability should align with this general specification.85
New business model intrapreneurs and entrepreneurs can use the Daly Hourglass to design data flows
and information systems that track their organization’s impacts, importantly interlinking from Ultimate
Means (natural capital – think of information from sensors in the environment) to Ultimate Ends (wellbe-
ing – think of indicators of health, satisfaction, fulfillment, even transcendence). As well, data architects
can design information systems that filter for carrying capacities of capitals, with algorithms to determine
if a company’s impacts are within their fair share allocation of respecting thresholds.
6.2.2. INTEGRAL INFORMATION SYSTEMS
Integral information systems build atop existing data architecture for new business model generation,
which typically focuses on firm-level information, sometimes related to same-sector peers. Integral
information systems, on the other hand, embeds micro- (firm) level data within the broader context of
the macro-level data on the economic, social, and ecological systems within which the firm operates.
85 Bill Baue, Data Blueprint: Data Integration, Contextualization & Activation for Multicapital Accounting, Reporting
3.0, 2017. https://reporting3.org/wp-content/uploads/2017/12/R3_Data_Blueprint_Report-1.pdf Accessed 23
May 2018.

95Data
Integral information equations place firm-level data in the numerator, with systems-level data in the
denominator, enabling direct micro / macro interlinkages.
Furthermore, denominator data contextualizes thresholds that represent the carrying capacities of capital
resources that firms impact, with allocation calculations enabling assessment if the proportionate impact
falls within the fair share of the accountability for collectively maintaining resources within thresholds.
After the publication of the Data Blueprint, Reporting 3.0 devised the below Data Process Flowchart:
Figure 65: Data Blueprint Process Flowchart (Reporting 3.0)
The visualization builds off the existing International Integrated Reporting Council (IIRC) “Octopus” that
tracks inputs of resources across the multiple capitals, their transformation though the business model
via company activities to create outputs that result in outcomes:
Figure 66: The IIRC “Octopus” (Source: International Integrated Reporting Council, The International <IR> Framework, 2013.)
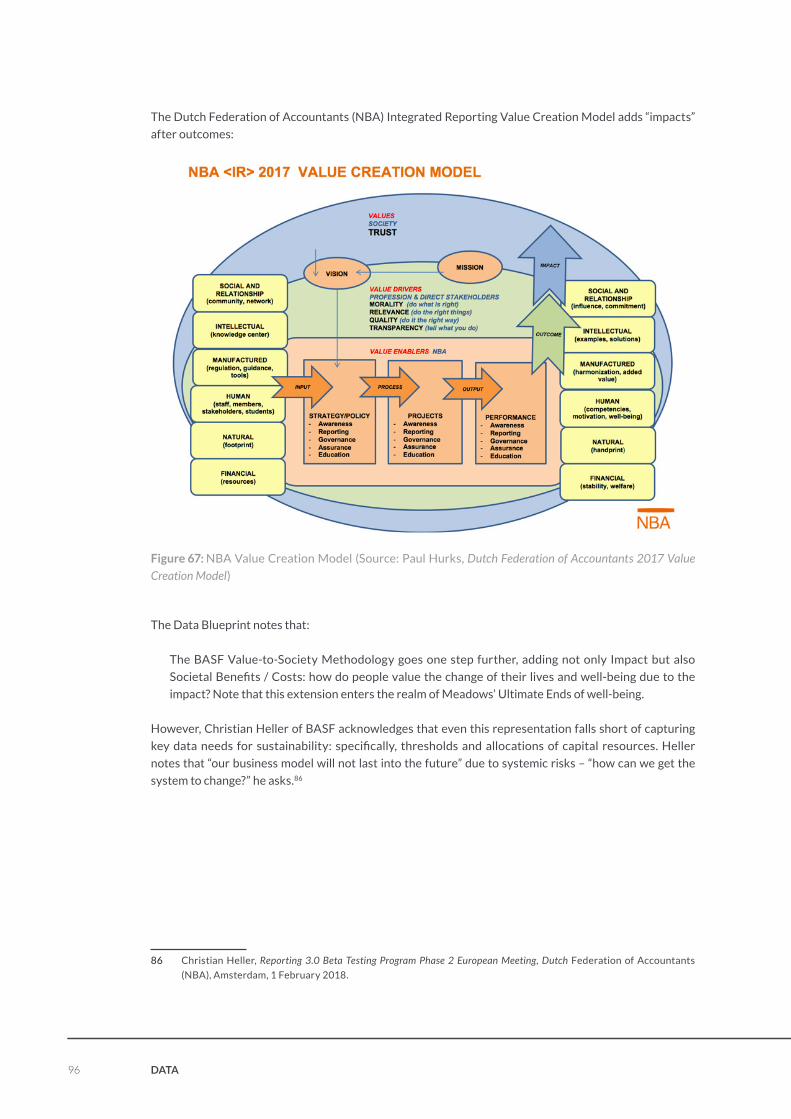
96 Data
The Dutch Federation of Accountants (NBA) Integrated Reporting Value Creation Model adds “impacts”
after outcomes:
Figure 67: NBA Value Creation Model (Source: Paul Hurks, Dutch Federation of Accountants 2017 Value Creation Model)
The Data Blueprint notes that:
The BASF Value-to-Society Methodology goes one step further, adding not only Impact but also
Societal Benefits / Costs: how do people value the change of their lives and well-being due to the
impact? Note that this extension enters the realm of Meadows’ Ultimate Ends of well-being.
However, Christian Heller of BASF acknowledges that even this representation falls short of capturing
key data needs for sustainability: specifically, thresholds and allocations of capital resources. Heller
notes that “our business model will not last into the future” due to systemic risks – “how can we get the
system to change?” he asks.86
86 Christian Heller, Reporting 3.0 Beta Testing Program Phase 2 European Meeting, Dutch Federation of Accountants
(NBA), Amsterdam, 1 February 2018.

97Data
Figure 68: BASF Value-to-Society Methodology (Source: BASF, We create value)87
In other words, the next logical step is to assess what the Future Fit Business Benchmark calls System
Value Creation:
Figure 69: Creating System Value (Source: Future Fit Business Benchmark, Creating System Value: Concept Note, April 2017)88
87 BASF, We create value. https://www.basf.com/en/company/sustainability/management-and-instruments/quanti-
fying-sustainability/we-create-value.html Accessed 28 May 2017.
88 Future Fit Business Benchmark, Creating System Value: Concept Note, April 2017. http://futurefitbusiness.org/
wp-content/uploads/2017/04/Future-Fit-Business-Benchmark-Creating-System-Value-Concept-Note-V1.pdf
Accessed 23 May 2018.

98 Data
For demonstration purposes, this progression can be plotted back onto the IIRC Octopus:
Figure 70: Octopus + Impact + System Value (Sources: IIRC, BASF, Future Fit Business Benchmark,
Reporting 3.0)
The Reporting 3.0 Data Process Flowchart integrates the above described interconnections into its
proposed data flow architecture, along with a number of further features:
• It sources data not only from the micro (firm) level but also from the meso (habitat) and macro (eco-
logical, social, and economic systems) levels;
• It contextualizes data within the carrying capacities of the multiple capitals by integrating thresholds
& allocations;
• It therefore enables performance assessment and benchmarking that distinguished between “sus-
tainable” and “unsustainable” performance;
• It allows for the re-aggregation of data to the macro, meso, and micro levels, per the performance
context in question (i.e. national statistics offices to assess performance on Nationally Determined
Contributions (NDC) to Paris Climate Treaty goals, for example);
• It allows for assessment of “System Value Creation” that integrates Current Enterprise Value Creation
calculations into broader Future System Value Creation determinations.
6.3. CONTEXTUALIZATION, INTEGRATION AND ACTIVATION
The Data Blueprint advances a general specification based on three primary dimensions necessary for
building out a data infrastructure that fulfills the potential of triggering transformative systems change:
• Integration of the multiple capitals (natural, human, social, built, and financial) to optimize positive
synergies (and mute / eradicate negative interaction) between and amongst them, to better support
the creation of financial, societal (shared), and system value (to employ a recently coined term.)

99Data
In Daly’s and Meadows’ terms, this integration links the “ultimate means” of natural capital through
the intermediate means and ends of human, social, built, and financial capital, all the way through
the “ultimate ends” of well-being.
• Contextualization of organization-level impacts on the multiple capitals within the carrying capac-
ities of those capitals at the systems level, either a virtuous (regenerative) or vicious (degenerative)
cycle. Context-Based Sustainability (an implementation mechanism of the Principle of Sustainability
Context) calls for identifying thresholds separating sustainability from unsustainability, as well as
assessing allocations of fair-share contributions to maintaining the overall sufficiency of vital capital
resources and cycles.
• Activation of responses when the sustainability of any capitals – and hence the potential for biota
well-being and human fulfillment – is placed at significant risk. Data without engagement falls short
of its potential; “activated” data fulfills its potential of driving the change signaled by integrated,
contextualized data. The key to activation is evidence-based advocacy by context-driven stakehold-
ers. And activated data also catalyzes “acceleration” to scale up change to trigger tipping points of
systems change. Indeed, properly contextualized data embeds a gap analysis to signal the magnitude
of unsustainability and hence the pace and scale of reform needed to achieve sustainability.

100 Data
6.4. RECOMMENDATIONS
Constituency Recommendations
Corporations
- Entrepreneurs
• Design Integral Information System Architecture concurrently while
building Integral Business Models. • Build contextualized, multicapitalist data measurement into company
culture.
• Make contextualized, multicapitalist data obsolete through truly Integral
Business Models, which generate system value and thereby eclipse the
need to measure and track negative performance.
Corporations
- Intrapreneurs
• Integrate denominator data with numerator data to create quotients
that measure sustainability performance.
• Build real-time dashboards to track progress on trajectory targets that
enable management responses to red flag performance nearing critical
thresholds or diversion from positive pathways.
• Provide contextualized, multicapitalist data to rating and ranking orga-
nizations to encourage them to rate and rank on such a basis.
Standard
Setters
• Provide research, guidance, and training on contextualized, multicapital-
ist performance measurement, management, and reporting.
• Collaborate with peer standards, frameworks, and others to promote
market-making for contextualized.
Investors • Assess portfolio-level sustainability performance against critical thresh-
olds & allocations, such as climate-related emissions (i.e., transcend the
Montreal Pledge by measuring aggregate carbon fooprints in the context
of proportionate share of the carbon budget).
• Apply this same approach across all material economic, social, and eco-
logical impacts, in order to identify companies moving toward Integral Business Models for positive engagement / overweighting and those
moving away from IBMs for assertive engagement / underweighting /
last resort divestment.
Governments,
Multilaterals,
Foundations
• Support / fund information infrastructure development for implement-
ing contextualized, multicapitalist information architecture, for example
through open sourcing sensor data, necessary for Integral Business Model development.

101Data
NGOs • Advocate for Integral Business Models by employing contextualized, mul-
ticapitalist data in research, proactive positive enagement, and activist
campaigning.

102 Online repOsitOry
7. ONLINE REPOSITORY
During the development process of the Blueprints Reporting 3.0 has been developing a repository
structure including all publicly available resources that supported the development of the blueprints. In
total, more than 1,000 documents were scanned, assessed and clustered. Reporting 3.0 aims to put the
repositories online in the near future to make the resources available.
8. ANNEXES
8.1. INTEGRAL BUSINESS MODEL TEMPLATE
Reporting 3.0 Integral Business Model (IBM) Assessment Template- based on NBM BP Process Flowchart –
Preamble:
1. This template refers to Integral Business Model Design. The term integral is explained in the tem-
plate through eight general characteristics. This is the starting point and the end point of this work
template.
2. The process workflow of designing a business model based on a ‚integral’ approach is furthermore
following known categorizations of phases like ideation, prototyping, go-to-market, evaluation
(improving & adapting).
3. Other tools like the ones in the template can be used in parallel if the organization feels more com-
fortable with it. Reporting 3.0 however refers to tools that it has developed in its set of blueprints, and
by that also showcasing how they are of specific value for the creation of an integral business model.
4. The different phases are first explained in more depth in the left columns of the template, and then
a set of hands-on statements is trying to find out the level of existing readiness to design an ideal
‚integral’ business model.
5. So far we haven’t seen ‚integral business models’ yet. That is not a surprise as this Blueprint and its
template offers an innovation, not yet explored in the literature, but necessary if we design our future
economic system and related business models in an integral way.
6. The outcome of the use of this template can be understood as a gap analysis. The scoring is an
attempt to show how far you are away or close to be ‚able’ to transition towards our understanding
of an ‚integral business model’. A low score should not be seen as a disappointment, but as a point
for improvement towards future-readiness of a business model.
7. All steps in the journey towards that ‚ideal’ situation can be supported by the whole set of Reporting
3.0 Blueprints, depending on how you design your process to come closer.
8. Most of all, feel inspired, not frustrated. You are on to something ‚grand’, and it should sparkle ideas
on next steps to take.

103Annexes
Flowchart:

104 Annexes
Template:
PH
ASE
IBM
Fo
cus Flowchart Assessment
Area
Explanation Self-Assessment
(Take an honest look if there are components that you
already follow, explicitly or implicitly. Note them down,
then give an overall score)
IDE
AT
ION
Inte
gral
Bu
sin
ess
Mo
del
Fra
min
g
IBM FRAMING: An Integral Business
Model (IBM) differen-
tiates itself through a
design that integrates 8
mutually reinforcing gen-
eral characteristics:
• Four Scale (Nano /
Micro / Meso / Macro)
• Contextualized
• Purposeful
• Scalable
• Multicapitalist
• Leadership-driven
• Thriveable
• Synergistic
These elements partially
overlap and describe a
mindset in which missing
one of these elements
means not being fully
integral (please refer
to the BP for further
explanation of the 8 key
characteristics). This
thinking sets a frame for
all tools, discussions and
decisions that the organi-
zation will have to make.
• The organization takes into account that its business
model has impacts on the supply and demand side of
its value cycle (in a circular framing) and that impacts
can happen on micro level (organizational level), meso
level (industry/habitat/portfolio), and is also dependent
on macro economic system framing. This frames an
attitude of ambition of connectedness and clear com-
munication to ‚do good’ with impact on all three levels.
• The organization has clear context know-how and
related ambition to showcase how ‚sustainable, regen-
erating and thriving’ it is.
• Given the first two general characteristics the organiza-
tion has a clear purpose that is understood throughout
the organization.
• The organization understands that while it is creating
a business model that needs to survive in current eco-
nomic system conditions it would thrive better under
ideal economic system conditions. The level of aware-
ness of adaptability of its business model (from ‚now’ to
‚then’) is therefore always in focus and aims at scaling
up positive impact.
• It is conscious in its use of different forms of capital,
including natural capital, human capital, social capital,
manufactured capital, intellectual capital, etc., in an
attempt to learn what its ‚total contribution’ is.
• It is lead with clear purpose and direction by leaders
that aim high and are aware of the totality of the eight
general characteristics.
• ThriveAbility-focused means that there is an under-
standing of the shortcoming of sustainability as
operationalized in most companies and that there is
more to do than doing less harm. It addresses the need
to instigate a climate that allows transformation and
support of the leadership to close the sustainability
context gap.
• It makes the most use possible of synergy with other
organisations, meaning that thinking often takes place
in nexusses, triangulations, and /or – more conventional
– circular/sharing/collaborative business settings with a
clear ‚sphere of impact’ that should be achieved.
TIP: Design a vision and mission statement that sets the
tone of wanting to be an ‘integral’ business’. It is a reference
point for everything that you will design, like a best friend
reminding you of what is at stake.

105Annexes
MACRO-FOCUS:
• How can we advocate
for necessary eco-
nomic system design
change?
The ‘invisible band’ – the
determining incentives
and disincentives of
a value system – are
essential to create
success conditions for
the ‘invisible hand’.
It is necessary for an
IBM entrepreneur to
be aware and learn to
advocate for economic
system design change
needed to fully allow
thriveable value creation.
The shortcomings must
be clear, as well as the
understanding ‘there is
no sustainable business
in an unsustainable
world’.
• ‘There is no sustainable business in an unsustainable
world’. The IBM entrepreneur is aware of defects in
the surrounding economic system and advocate for
changes that will fully allow thriveable value creation.
• Learning, educating and advocating will need a will-
ingness to openly collaborate with others. The IBM
entrepreneur looks for ways how advocation can be
done most effectively.
TIP: Ask yourself what incentives would be favouring your
business model. If external effects would be internalized
and related costs needed to be accounted for, would your
product benefit (e.g. become cheaper in relation to sort-like
products) in comparison to today?

106 Annexes
MESO-FOCUS:
• With whom do
we improve which
impacts?
The IBM will deliver
its impacts mainly on
meso level, meaning
in industries (e.g. as
supplier’s product/
service), in habitats
(stand-alone and in
collaboration, mainly
in cities or bioregions),
or through investment
decision effects in
portfolios. The IBM
entrepreneur will need
to have a systemic
understanding of impact
and locate their impact in
any of these three areas
of impact. The value
cycle perspective is a
guiding paradigm that
encloses all rightsholders
and delivers information
of ‘losers and winners’.
The existence of ‘losers’
means potential for
optimization. Economic
trends like circular,
sharing, collaborative
are all meso impact
directions that can be
supported by macro
conditions and can
support the creation of
IBMs.
• The organization has defined and positioned itself in a
value cycle and looks at the impacts from suppliers (and
tiers further down) and customers (including further
process for the end-of-life phase of the product).
• IT has defined its position in the industry and of the
industry as a whole.
• It looks at impacts within relevant geographical areas,
e.g. that could be regional habitats or cities.
• It also understands how investments into the organi-
zation as part of e.g. a venture capital or other asset
approaches in a portfolio mean to create positive
impacts for the investor and all impacted rightsholders.
TIP: Assess how your doing is creating winners, but poten-
tially also losers in that value cycle you are in. Are there
ways to mitigate any such effect? Playing in role plays and
‘living’ through scenarios.

107Annexes
MICRO-FOCUS:
• What are we
positively
contributing to in
a systems context?
• How are we
eliminating negative
impacts?
The IBM needs the
support of an internally
optimized and balanced
support system. It
is important that all
elements supporting the
IBM work in the same
direction. The eight key
characteristics serve
as guiding principles to
design such a balanced
system and is the key
to integrate context,
purpose, success
measurement and
scalability in ways that
the functions supporting
the IBM are aware,
focused and delivering.
Some elements of the
8 key characteristics
are especially needed
to enable creating the
mental, technical and
functional infrastructure,
e.g. leadership focus or
scalability focus.
• The IBM entrepreneur understands both and inside-
out and an outside-in perspective. While changing
conditions on meso and macro levels will benefit the
organization, the organization itself needs to ‘live the
change’ from inside to outside too.
• The eight key characteristics are translated into road-
maps for critical functions of the organization, including
risk management, governance, leadership development,
innovation, and all support functions – as far as they
exist or need to be planned by the entrepreneur.
TIP: As an entrepreneur the focus at such an early phase
of the development of a business model to the whole sup-
porting infrastructure may be daunting, but scalability and
other elements will mean 50% or more of your success.
Imagine how the ideal company exploiting your business
model would look.

108 Annexes
Gen
eric
IBM
Des
ign
SYSTEMS
CONDITIONS:
• Obstructions
through wrong
incentives
• Desired accelerations
through changed
incentives
The generic IBM
Design translates
macro perspectives
into concrete activity
focus areas. A clear
view of obstructions
and accelerations
through the existing and
future economic design
delivers a roadmap
for advocation, e.g.
governmental action
needed and support
of necessary lobbying.
This can embrace the
generation of fitting
market conditions
through trade that enable
thriving or aspects of
taxation and subsidies.
The scenarios for an IBM
need to anticipate those
market conditions for
advocation leading to
scalable IBMs.
• An IBM will have a particular perspective on the block-
ages and opportunities offered by the existing economic
system. This perspective should form the basis of an
advocacy strategy to improve the business environ-
ment, for example through tax and subsidy structures
that enable businesses to thrive for the common good
and operate at scale.
TIP: These aspects are normally advanced in a scenario
analysis or PEST analysis. While scenario analysis is mostly
based on four generic quadrants (free to choose which axis
theme they carry) a PEST analysis looks at political factor,
economic factors, socio-cultural factors and technological
factors. For the macro analysis the economic, political and
socio-cultural factor may be taken into account.
MARKETS
(CLIENTS):
• Industries
• Habitats
• Portfolios
The generic IBM Design
also translates meso
perspectives into
concrete activity focus
areas. Clients are parts
of industries, habitats
or manage portfolios
in which all the major
impacts occur. A clear
impact focus is therefore
needed. This is the level
where collaboration for
joint success is most
effective. In short:
creating the notion of
collective success in
which one or more IBMs
are embedded.
• The IBM entrepreneur takes into account interacting
with other industrial sectors, natural environments and
the financial system. It needs to embody a clear under-
standing of how collaboration can lead to success all
around including healthy environments and a fair return
on capital.
• Some of the questions the entrepreneur will face now
are: How will the IBM be a scenario for others to suc-
ceed in order to create a value cycle without ‘losers’?
• How will habitats be able to thrive through collective
engagement of various IBMs from different origins (soil,
agri, food, energy, mobility, digital support, social ser-
vices, local or regional governance, etc.)?
• How will the investment sector be pushing the creation
of thriving in their portfolios?
TIP: you can continue to use scenario analysis for specifying
your wanted impact. You can also backcast from a PEST
analysis and break it down to the meso level.

109Annexes
PRODUCTS /
SERVICES:
• Positive contribution
• Design of value cycle
• Infrastructure
support
An IBM supports one or
various products and / or
services with an ‘integral
value creation potential’
on the micro level. It is
supported by the earlier
mentioned ‘no loser in
the value cycle’ idea, but
also embraces the idea
of positive contributions.
While the product and/
or service is what is sold,
a big part of the success
is dependent on the
supporting process infra-
structure that enables a
synchronized, balanced
and learning environ-
ment, supported by
data, analytics and mea-
surement on impacts on
various capitals, based on
proper contextual analy-
sis (through thresholds &
allocations).
• The IBM delivers one or more products and/or services.
While the quality of these will be a major determinant
of success, the IBM entrepreneur realizes that the sup-
porting infrastructure of processes plays an important
role, enabling continuous learning and data driven mea-
surement of the impact on different capitals, which in
turn is based on contextual analysis and understanding
of the relevant thresholds and allocations.
TIP: this part of the process doesn’t have to focus too much
on the micro level. You only have to be aware that in the
Prototyping Phase this area will be getting specific atten-
tion, while it will also takes benefit from all the meso and
macro level thinking that went into this ideation phase so
far.
STR
AT
EG
Y C
ON
TIN
UU
M
1) COMPETITIVE
ASSESSMENT
The ideation phase is
completed with a com-
petitive assessment
of the design vis-à-vis
potential competitors.
This enables the unique
selling proposition to be
tested.
This assessment needs
to take account of the
enabling or obstructing
conditions at the meso
or macro level. These
may already be facing
competitors but may also
suggest areas for future
collaboration. While
competition is not a pur-
pose in itself, a superior
business model may lead
to the demise of compet-
ing businesses.
• A competitive assessment of the to-be-designed IBM
vis-a-vis potential competitors is a first use of the r3.0
Strategy Continuum. In this assessment the unique sell-
ing position of an IBM can be assessed and developed
further. This can be done in combination with other
tools.
• The generic Reporting 3.0 Strategy Continuum differ-
entiates BAU, improving, sustainable, regenerative and
thriving business models, but also enlarges vertically by
looking at the enabling or obstructing conditions of the
meso and macro level. This is important to understand
restrictions or obstacles that other competitors may
already face, and/or to assess where potential future
areas of collaboration may open up.
TIP: An IBM is generically not developed to compete, but
reality will mean that outperforming other business models
may lead to their disappearance. It can be used to help clar-
ify to others in how far change is needed on the meso level.
This is the first step in practical industry level playing field
discussions, a first necessary part of advocation for change.

110 Annexes
2) IBM POSITIONING In a second step the
Reporting 3.0 Strategy
Continuum is used to
position the IBM ide-
ation. This is a reality
check on all internal and
external conditions to
create ‘integral business
value’, and most of the
insight from the ‘Generic
IBM Design’ phase can
be used here to develop
a full picture on where to
slot in the ambition level
for the prototype and go
to market phase.
• As a result the IBM minimally needs to meet the middle
part of both axis, or – if not fully integral – should aim at
getting there. The acknowledgement of shortcomings
is the first step to improvement.
• There are both axis that need to be looked at. Steps to
the right in the continuum already means improvement,
but not addressing how to address meso and macro
change needed, it will remain a parallel move, whereas
the ideal will be to move into the down-right quadrant.
TIP: At the start of such maturations it might be difficult
to anticipate changes at the meso and macro level. Often
it will be the disruption potential of a new business model,
making a real difference in existing markets over time. This
may shake up a whole industry. Remember that an integral
business model won’t do it alone, it’s the collaboration with
others. Much of this collaboration can be anticipated and
planned over time, so not bad to use some fantasy of what
might be able.
3) MATURATION
PATHWAY
The third and last step
in using the Reporting
3.0 Strategy Continuum
lies in defining so-called
‘maturation pathways’.
• As a third and last step in using the Reporting 3.0
Strategy Continuum the IBM entrepreneur looks for-
ward to future scenarios that consider possible changes
in meso and macro conditions, as well as possible future
improvements to products and services.
• Defining maturation pathways can be combined with
scenario planning, explicitly embedding meso and
macro level market and system conditions, but also
embed later product and/or service improvements that
can be anticipated as well.
TIP: The New Business Model Blueprint showed that
the creation of the ‘integral business models’ goes fur-
ther than the existing literature. However, some of the
tools described, e.g value assessments and the use of
the Flourishing Business Model Canvas are very valuable
tools to get even greater clarity for the positioning in the
definition of maturation pathways in the r3.0 Strategy
Continuum. Take what you think you need to support your
information flow.

111Annexes
PR
OT
OT
YP
ING
PR
OC
ESS
DE
SIG
N1) IMP (PLAN/DO) A major aspect of the
process design phase is
to embed the Reporting
3.0 ‘Integral Materiality
Process’. Designed to
follow a Deming-Wheel
approach (known from
quality management)
and tackling mostly the
internal infrastructure
that must be in place to
allow suitable exchange
with rightsholders on
micro, meso and macro
level, it ensures that the
8 key characteristics of
the IBM are placed in the
right process context.
In short: if the Integral
Materiality Process is
fully followed, all IBM
key characteristics
should be met. In that
sense it serves as a pro-
cess control tool as well.
• The Reporting 3.0 Integral Materiality Process tackles
the internal infrastructure that needs to be in place to
guide the exchanges with rightsholders on the micro,
meso and macro level. If followed correctly this should
ensure that all IBM key characteristics are met. At this
stage only the PLAN and DO phases apply:
• PLAN phase:
• Identify ‘Rightsholders’ to whom duties & obliga-
tions are owed
• Identify impacts areas and capitals involved
• Identify thresholds and ‘fair-share’
allocations
• DO phase:
• Collaborate with rightsholders on impact areas,
thresholds and allocations
• Set context-based multicapital targets & perfor-
mance metrics dashboards
• Integrate context into risk, governance, leadership,
innovation processes
TIP: These processes don’t have to be implemented at the
same time, we expect and even recommend a step-by-step
approach. So scores in this part of the assessment will be
low in the beginning, and by that indicate to follow a road-
map approach on how to start integrating these steps.

112 Annexes
2) DATA DESIGN
PROCESS
In order to support
a seamless data flow
between micro, meso
and macro level the
Reporting 3.0 Data
Blueprint has been
developed. In line with
the ideas of Donella
Meadows and Herman
Daly. We improved
their thinking into the
Reporting 3.0 ‘Daly
Hourglass’, respecting
the need for measure-
ment of stocks and flows.
We also added macro
and meso elements like
Raworth’s Doughnut
Economics and improve-
ment of context-based
multicapital thinking,
delivering thriving and
wellbeing.
• The IBM entrepreneur understands ‘stock’ and ‘flows’
of capitals as a way to assess his impact on various cap-
itals, and as way to start gathering information on how
to assess a ‘total contribution’.
• The DO part of the Integral Materiality Process is asking
for ‘dashboard creation’ and target setting’ for crucial
functions.
• The IBM entrepreneur will aim at implementing a
generic data grid as proposed in the Data Blueprint and
that is in line with the IBM Flowchart:
TIP: Multicapital Accounting and application of thresholds &
allocations are crucial elements, to be started in the PLAN &
DO phase. What follows here is the data ‘pendant’ of these
assessments. In the same way as the Integral Materiality
Process will take time, the implementation and stabilization
of the data through dashboards will take time too.
LEGEND
DALY HOURGLASS
ULTIMATE MEANSNatural Capital
INTERMEDIATE MEANSBuilt Capital
Human Capital
INTERMEDIATE ENDSSocial Capital
Financial Capital
ULTIMATE ENDSWell-Being
Capital FlowsCapital Stocks
Ecological Ceilings
Social Foundations
@2017 Reporting 3.0
Susta
inab
ility
Thr
esho
lds

113Annexes
3) ACCOUNTING
FOR SUCCESS /
DASHBOARDING
Accounting is the heart
of the nervous system
for proper indication
of inputs, outputs, out-
comes, impacts, and
system value creation.
It shows how value is
created through financial
accounting, management
accounting and sustain-
ability accounting. The
Reporting 3.0 Accounting
Blueprint advocates
for the design of one
overall Value Creation
Accounting System.
• Integral Accounting combines financial accounting,
management accounting and sustainability accounting
and supports context-based multicapital accounting. In
consequence Reporting 3.0 recommends to build over
time on:
• A recognizing comprehensive accounting principles
• A multi-layered income statement (also acknowledg-
ing externalities)
• A multi-layered balance sheet (with a comprehensive
multicapital asset overview that helps to explain the
difference between book value and market value
and thereby supports to be better understand
intangibles)
• A statement of long-term risks, including
◦ Land (natural capital)
◦ Reserves (natural capital, recoverable)
◦ Buildings (built capital)
◦ Equipment (manufactured capital)
◦ Financial assets (financial capital)
◦ Intangible assets (intellectual capital-based, pur-
chased, with limited / identifiable life
• Narrative Reporting on
◦ Business models
◦ Value creation, value creation process and mul-
tiple capitals
◦ Risk reporting (incl ESG risks)
• Governance reporting (cf Corporate Governance
Codes)
TIP: The Accounting Blueprint of Reporting 3.0 backcasts
accounting from 20 years into the future. This indicates that
it might still take long until the above is common practice.
Still, even without new ruling in accounting, bits and pieces
can be acknowledged when creating an Integral Business
Model. At this moment following the PLAN and DO steps
will ask for taking steps that anticipate what might become
common sense in accounting in the future. Feel inspired
and try working towards a ‘total contribution’ approach and
learn about thresholds& allocations first.

114 Annexes
4) IMP (CHECK) The third and last phase
of the IMP is closing off
the prototyping phase for
the IBM.
• In this CHECK part of the IBM support system we
• Track performance against interim trajectory targets
• Test scenarios and transition plans that address sys-
temic risk
• Assess business model viability & sustainable future
value creation
TIP: This last part of the prototyping phase overlaps slightly
with the Go To Market Phase, but the basic preparatory
steps should already be taken here. Here, you build out
those parts of the process that will serve you to check if you
are on track with regard to your trajectory targets, scenario
assumptions, transition plans (in the maturity pathways of
the Strategy Continuum), but also regarding current busi-
ness model viability.
GO
TO
MA
RK
ET
IBM
IMP
LEM
EN
TAT
ION
MACRO: In the Go To Market
Phase we look again at
the micro, meso and
macro aspects we have
been designing into pro-
cesses in the ideation
phase and make use of
the PLAN, DO, CHECK
elements of the IMP
from the prototyping
phase. As we particularly
created context in the
early phases of the IBM
creation process we can
now go back and specifi-
cally check:
• Can we effectively
influence economic
system obstructions?
• Are there economic
system benefactors
we can positively
influence?
• To answer these questions – even if the impact on that
level can be zero or low in the early days of an IBM – is
a crucial step to prepare the later evaluation phase. It is
also essential to analyse how much the success of the
IBM is currently affected by obstructions.
• In case of positive impact on transforming economic
design it will be essential to measure the extra boost an
IBM gets through changed economic conditions.
• Changes at the macro level is likely to be the hardest to
achieve as they need to go through global organizations
in order to be globally applicable and accepted. It can
be that changed incentives will actually be advocated
for a long time before reaching a scalable breakthrough.
TIP: In the first years, information from the macro level
will still be difficult to gather and impact to be made has
to slowly build up. Keep ambitions high at the level of nec-
essary economic system change and continue to offer to
share learnings on meso and micro level in order to increase
awareness at these levels, so that coordinated campaigning
for macro level change can become reality in the future.

115Annexes
MESO: On the meso level we
check:
• Are we leveraging pos-
itive impact through
collaboration to
- reduce negative
impact?
- increase positive
impact for industries,
habitats, portfolios
• Here we review the assumptions about collabora-
tions that could reduce negative impacts and increase
positive impacts for industries, habitats and financial
portfolios.
• Here we also check back on the assumptions we made
in the ideation phase and in applying the Reporting 3.0
Strategy Continuum. This is a preparatory step to espe-
cially look at the IBM positioning and the maturation
pathways (scenarios) for the following evaluation phase.
TIP: A successful new business model will not stay unrec-
ognized by the rest of the industry, in habitats or as a
worthwhile portfolio component of investors. Many of the
macro changes need to come through a signaling of success
from the meso level. So keep tracking this carefully.
MICRO: On the micro level we
check:
• Are we creating
positive impact as
expected?
• How is stand-alone
performance and col-
lective performance of
products / service in
value cycles?
• Are infrastructure
elements working in
support of delivery?
• IMP (ACT)
• Here the IBM entrepreneur pulls together necessary
know-how of the macro, meso and micro levels to look
at the tasks of the ACT phase of the IMP that asks to:
• Engage Rightsholders on sustainable business model
& future value creation
• Transition to net-zero-by-2050 business strategies
• Transform industrial economics & societal
ecosystems
• These three tasks close the feedback loop to restart
the IMP for a next cycle. With the outcomes of this
last part of the IMP all information is gathered to
start the last phase of the IBM process – the eval-
uation phase.
TIP: Through this phase you will be starting to further design
the next cycle of the PLAN-DO-CHECK-ACT approach. The
next loops are more and more moving into adjusting than
creating. The first loop is surely more difficult than later
ones. But all the groundwork is done. Congratulations!

116 Annexes
IMP
RO
VIN
G/A
DA
PT
ING
IBM
EV
ALU
AT
ION
1) IS VS. PLAN The first step in the
evaluation is to go back
to the Reporting 3.0
Strategy Continuum.
In the ideation phase
we used the Strategy
Continuum for multiple
purposes, but in the
evaluation phase we
can revisit the specific
use for the ‘maturation
pathways’. At the end of
the IMP we have finished
gathering experience,
data, measurement and
market and systems
information to improve
or adapt the scenarios of
the maturation pathways.
• Are macro economics still the same, have obstructions
prevented positive moves, have rightsholders on macro
level moved forward, have benefactors been increased
that the IBM is thriving. If not, what was the reason
for that. If yes, what made them move? What else is
needed?
• How have industries, habitats and portfolios changed?
How is the information on collective performance
developing? Are there new initiatives, consortia or a
new collective consciousness developing? Has success
measurement evolved? Are there growing insight about
the value cycles and on the winners and losers?
• On the micro level, how did the implementation of the
IMP work out and how has infrastructure change pro-
duced effective improvement?
TIP: In all three areas the learnings, successes, shortcom-
ings should be documented, assessed and taken as the basis
for an improvement plan. Learnings should be shared with
others in respective parts of the value cycles, various levels
of communication and storytelling should be advanced.
2) ALIGNMENT WITH
INTEGRAL BUSINESS
MODEL
WHEEL
We are closing the loop
with another look at the
8 key characteristics. The
8 key characteristics are
the ‚golden nugget’ for
differentiating an IBM
from any other business
model.
We differentiate ourselves through continuously keeping
in mind all eight characteristics:
• A focus on synergies at all three levels – micro, meso
and macro. Without advocacy and collaboration we will
not achieve regeneration and thriving.
• Context-based multicapital-based thresholds & allo-
cations for total contribution. Use of resources must
be viewed in relation to scientifically bases thresholds
and allocations. Knowing context based on thresholds
& allocations are a precondition to know your total
contribution.
• Purpose-driven towards Thriveability, enabled by
leadership: the IBM needs leaders who can clear com-
municate an ambitious vision, advocate for change at
the macro level and promote collaboration at the micro
level.
• Scalability-focus impacts meso and macro level: coming
back to the start where we said: ‘there is no sustainable,
yet thriving business in an unsustainable world’.
• Incrementalism isn’t a feasible solution. One needs to
aim for the bigger, but that ‘bigger’ needs a clear vision.
At Reporting 3.0 we embrace the ideation of a Green,
Inclusive and Open Economy as that vision. Anything
necessary to achieve it has to be done. There will always
be someone who will do it. Who will it be? Will it be you?
Now start the process all over again. Learning never ends.
The sky is the limit!

117Annexes
Scoring: Each statement can be assessed and scored. We recommend the scoring below as a first at-
tempt to see how far the gap from an existing business model to a fully Integral Business Model really is
4 = fully understood and fully applied
3 = fully understood, partially applied
2 = understood, not yet applied
1 = awareness, not yet understood
0 = not yet aware

118 Annexes
8.2. AUTHORS
Bill Baue is an internationally recognized expert on sustainability context, online stakeholder engage-
ment, and sustainability communications, Baue designs systemic transformation. As a serial entrepre-
neur, he’s co-founded a number of companies and initiatives:
• Reporting 3.0, a global public good nonprofit platform of Positive Mavericks working to transform to
a regenerative and distributive economy using disclosure as a fulcrum of leverage.
• Convetit, an online stakeholder engagement platform.
• Sustainability Context Group, a global community of thought leaders and practitioners who advocate
for Context-Based Sustainability;
• Sea Change Radio, a globally syndicated podcast on sustainability.
He currently serves as Senior Director of Reporting 3.0, where he oversees the series of Blueprint Proj-
ects crowdsourcing redesign templates for the fields of reporting, accounting, data, and new business
models with the goal of triggering the transformation to a regenerative and distributive economy and
society.
Baue has worked with prominent organizations across the sustainability ecosystem, including Audubon,
Cabot Creamery Co-op, Ceres, GE, Harvard, United Nations Environment Programme, Walmart, and
Worldwatch Institute. He serves on the UN Science-Policy-Business Forum, the Technical Advisory
Group of the Science Based Targets initiative and as Senior Advisor to Preventable Surprises.
Ralph Thurm is a co-initiator, facilitator and moderator of Reporting 3.0. His ideas about the shortcom-
ings of corporate reporting helped to steer the community since the beginning of Reporting 3.0 in 2012.
He has designed and facilitated earlier Reporting 3.0 International Conferences, Transition Labs and Re-
gional Roundtables. Announced end of May 2017 Ralph accepted to become the Managing Director of
‘Oncommons’, a Berlin-based NGO that will carry forward Reporting 3.0 as its flagship program. Ralph
is also the owner of A|HEAD|ahead, a Dutch-based advisory firm. As part of this role Ralph actively
supports GISR and was co-founder of the ThriveAbility Foundation. Before that Ralph had various sus-
tainability functions at Siemens, Global Reporting Initiative (GRI) and Deloitte.
8.3. WORKING GROUP MEMBERS
The Working Group members of the New Business Models Blueprint in alphabetical order:
Lynn Benander Co-op Power
Tabea Bereuther University St. Gallen
Stefan Bergheim Zentrum für gesellschaftlichen Fortschritt e.V.
Colin Blom Homie
Nancy Bocken TU Delft
Tiberius Brastaviceanu Sensorica
Geraldine Brennan Middlesex Univerity
Henk de Man VDMbee
Anita De Wit ReBlend
John Elkingtion Volans
Niels Faber Radboud University
Gil Friend City of Palo Alto / Natural Logic
Laura Gerritsen Fairphone

119Annexes
Nathan Gilbert B Lab Europe
Raz Godelnik Parsons School of Design
Maurits Groen Waka Waka/Kipster
Stuart Hart University of Vermont
Carolyn Hayman Preventable Surprises
Maya Hoveskog Halmstad University
Anna Nicoletta Köhl University of Innsbruck
Alexandre Lemille Stone Soup Consulting
Florian Lüdeke-Freund University Hamburg
JosephineMatthews Sustainable Value Creation
David Murray Preventable Surprises
Dan Osusky B Lab
Martina Prox FSLCI
Romana Rauter University of Graz
Steve Rogers NextChar
Randy Sa’d REFOCUS
Lorraine Smith Volans
Fiona Stappmanns University St. Gallen
Hans Stegeman Triodos Bank
Philip Strothmann FSLCI
Raj Thamotheram Preventable Surprises
Stéphane Trébucq University of Bordeaux
Antony Upward Flourishing Enterprise Innovation
Mark Van Clieaf Organizational Capital Partners
Lisette van der Maarel ReBlend
Theodoor van Donge VDMbee
Bob Willard Sustainability Advantage (F2B2)
Alan Willis Alan Willis & Associates
Robin Wood Project Synergise
Thomas Wunder University of Neu-Ulm
Online Virtual Dialogue Participants
Exposure Draft 1.0 Review | 15-20 October 2017
https://convetit.com/reporting-30-new-business-models-blueprint-exposure-draft-10-review-714.html
Exposure Draft 2.0 Review | 12-16 March 2018
https://convetit.com/reporting-30-new-business-models-blueprint-exposure-draft-2-review-729.html
David Baxter
Lynn Benander
Tabea Bereuther
Stefan Bergheim
Nancy Bocken
Tiberius Brastaviceanu
Jane Fiona Cumming
Henk De Man
Morris Fedel
Gil Friend
Glenn Frommer

120 Annexes
Danielle Fugere
Anita de Wit
Shanti Gaia
Raz Godelnik
Henk Hadders
Carolyn Hayman
Maya Hoveskog
Anna Köhl
Natasha Lamb
Alexandre Lemille
Florian Lüdeke-Freund
Josephine Matthews
Mark McElroy
David Murray
Thomas Murtha
David Plummer
Martina Prox
Stephan Rogers
Randy Sa’d
Fiona Stappmanns
Hans Stegeman
Dr Raj Thamotheram
Nina Thurm
Stéphane Trébucq
Antony Upward
Mark Van Clieaf
Theodoor van Donge
Lisette van der Maarel
Jennifer van der Meer
Alan Willis
Robin Lincoln Wood
Thomas Wunder
8.4. STEERING BOARD
Members of the Reporting 3.0 Steering Board (in alphabetical order):
Bill Baue Convetit, Sustainability Context Group
Claudine Blamey The Crown Estate
Sarah Grey International Integrated Reporting Council
Paul Hurks Dutch Federation of Accountants
Mairead Keigher Shift
Brendan LeBlanc Ernst & Young
Stephen Russell World Resources Institute
Peter Teuscher BSD Consulting
Ralph Thurm A|HEAD| ahead
Cornis Van der Lugt Stellenbosch University

121Annexes
8.5. ABOUT ONCOMMONS
OnCommons is a Berlin-based not-for-profit, legally registered as a gGmhH (gemeinnützige Ge-
sellschaft mit beschränkter Haftung), aiming at making contributions to the development of transpar-
ency, disclosure and collaboration through global public goods. Reporting 3.0 is the flagship program
of OnCommons.
OnCommons carries out research, development, testing and training activities aimed at three major
dissemination levels: educate (for starters in the various focus areas), advocate (for implementers of
relevant approaches in organizations) and accelerate (for those convinced of external scaling of neces-
sary solutions deemed at increasing the nano-micro-meso-macro links designing a green, inclusive and
open economy).
Figure 71: OnCommons Work Ecosystem (Source: Reporting 3.0 Platform)
ACCELERATE
ADVOCATE
EDUCATE
3 FOCUS AREAS FORDISSEMINATION
· New work items that support scalable solutions + dissemination
· Develop dissemination with partners of high latitude and impact
· Sell repository value
· Redistribute best practice to all possible constituencies
· Big DATA approach / accelerate training output + impact
· Enlarge partner program for new work items
· Use ADVOCATION PARTNERSHIP to dissemine blueprint recommendations
· Focus on best practices from beta testing for new blueprint iterations
· Best practice training on existing products (blueprints): basic- advanced-leading
· Find ADVOCATION PARTNERS globally
· Find participants to support work in blueprint development
· Develop drafts for blueprints · Test best integrations mechanisms, develop feedback processes
· Beta testing programs for all blueprints
· Training program for interpretation of blueprint recommendations into core strategies in various constituencies
· Use repositories
· Define areas of collaboration
· Develop repository· Develop repository
RESEARCH DEVELOPMENT
4 ACTIVITIES
REPORTING 3.0 + OTHER PROGRAMS (T.B.D.)
ON COMMONSVISION, MISSION, STRATEGY
TESTING TRAINING
· Enhance repositories
ON COMMONS WORK ECOSYSTEM
@2017 Reporting 3.0

122 Annexes
Mark van Clieaf, Organizational Capital Partners “Only 5% of the world’s adults have the cognitive hard wiring and systems thinking to conceptualize, plan out, resource and implement business model and industry ecosystem transformations.”
Antony Upward, Edward James Consulting “Integral Business Model designers must apply design principles derived from the same latest trans-disci-plinary systems-based scientifically credentialed knowledge, ethical and human rights frameworks that informed the design and the questions in the tool.”
Lisette van der Maarel, ReBlend “Current business decisions are made on incomplete data and P&L statements only show a part of the reality. We aim to develop a business that is built on true value and Reporting3.0 plays a crucial role in this.”
Gil Friend, Natural Logic ”I’m never surprised by sustainability/systems blind-ness. I’m always surprised by basic business blind-ness.”
Shanti Gaia, MetaIntegral ”To create the effective new thriving systems we’re envisioning, it’s not enough to just include more forms of capital. Multidimensional thinking is crucial for regenerative and thriving design – it is important to understand the ontological, epistemological, and methodological relationships between the capitals and how they relate to all aspects of building new business models, including alternative ownership models.”
Josephine Matthews, Sustainable Value Creation “The truly integral business models are likely to come from a small percentage of system entrepreneurs who can “see” both the collective need and a fundamen-tally better way to achieve it, and who can build the integral maturity into their organisation, with leaders operating at teal level leadership.”
Natasha Lamb, Arjuna Capital “Resolutions asking companies for transition plans to new business models that reduce climate change risk and align with an increasingly decarbonizing energy market represent a next level in the maturation of our strategies, following in the footsteps of resolutions in previous years (and continuing), asking companies to conduct scenario analyses of potential climatic outcomes based on scientific extrapolations. So the main questions we now face are: how do we scale business model transitions to encourage indus-try-wide transformation to a low carbon energy models? And how can we encourage other investors to support transition plan resolutions through filing and proxy voting?”