
Black System South Australia, 28 September 2016 - Australian ...
273
BLACK SYSTEM SOUTH AUSTRALIA 28 SEPTEMBER 2016 Published: March 2017
-
Upload
khangminh22 -
Category
Documents
-
view
1 -
download
0
Transcript of Black System South Australia, 28 September 2016 - Australian ...

BLACK SYSTEM SOUTH AUSTRALIA 28 SEPTEMBER 2016
Published: March 2017

BLACK SYSTEM SOUTH AUSTRALIA 28 SEPTEMBER 2016 – FINAL REPORT
Australian Energy Market Operator Ltd ABN 94 072 010 327 www.aemo.com.au [email protected]
NEW SOUTH WALES QUEENSLAND SOUTH AUSTRALIA VICTORIA AUSTRALIAN CAPITAL TERRITORY TASMANIA WESTERN AUSTRALIA
IMPORTANT NOTICE
Purpose
AEMO has prepared this final report of its review of the Black System in South Australia on Wednesday
28 September 2016, under clauses 3.14 and 4.8.15 of the National Electricity Rules (NER).
This report is based on information available to AEMO as of 23 March 2017.
Disclaimer
AEMO has been provided with data by Registered Participants as to the performance of some
equipment leading up to, during, and after the Black System. In addition, AEMO has collated
information from its own systems.
Any views expressed in this update report are those of AEMO unless otherwise stated, and may be
based on information given to AEMO by other persons.
Accordingly, to the maximum extent permitted by law, AEMO and its officers, employees and consultants involved in the preparation of this update report:
make no representation or warranty, express or implied, as to the currency, accuracy, reliability or
completeness of the information in this update report; and,
are not liable (whether by reason of negligence or otherwise) for any statements or representations
in this update report, or any omissions from it, or for any use or reliance on the information in it.
© 2017 Australian Energy Market Operator Limited. The material in this publication may be used in
accordance with the copyright permissions on AEMO’s website.

BLACK SYSTEM SOUTH AUSTRALIA 28 SEPTEMBER 2016 – FINAL REPORT
© AEMO 2017 1
NER TERMS, ABBREVIATIONS, AND MEASURES
This report uses many terms that have meanings defined in the National Electricity Rules (NER). The
NER meanings apply in this report unless otherwise specified.
Abbreviations Abbreviation Expanded name
AC Alternating Current
AEMO Australian Energy Market Operator
AEMC Australian Energy Market Commission
AER Australian Energy Regulator
AEST Australian Eastern Standard Time
AGC Automatic Generation Control
AWEFS Australian Wind Energy Forecasting System
BOM Bureau of Meteorology
CB Circuit breaker
CC Cloud-to-cloud (lightning strike)
CCGT Closed cycle gas turbine
CG Cloud-to-ground (lightning strike)
DC Direct Current
DER Distributed Energy Resources
DFS Demand Forecasting System
DI Dispatch interval
DNSP Distribution Network Service Provider
DVAR Dynamic Volt-Amp Reactive
EMMS Electricity Market Management System
EMT Electromagnetic transient
EMTDC Electromagnetic transients including DC
ESCOSA Essential Services Commission of South Australia
FACTS Flexible AC Transmission Systems
FCAS Frequency control ancillary services
FPSS Future Power System Security (program)
GIC Geomagnetic Induced Current
GSMG Generating System Model Guidelines
GT Gas Turbine
HV High Voltage
HVDC High Voltage Direct Current
HSM High-Speed Monitor
HYTS Heywood Terminal Station
I/S In Service
LBSP Local Black System Procedure
LOS Loss of Synchronism
LV Low Voltage
LVRT Low Voltage Ride Through

BLACK SYSTEM SOUTH AUSTRALIA 28 SEPTEMBER 2016 – FINAL REPORT
© AEMO 2017 2
Abbreviation Expanded name
NEM National Electricity Market
NEMDE National Electricity Market Dispatch Engine
NEMOC National Electricity Market Operations Committee
NER National Electricity Rules
NERC North-American Electric Reliability Corporation
NSP Network Service Provider
OEM Original equipment manufacturer
OPDMS Operations and Planning Data Management System
O/S Out of Service
PSCAD Power System Computer Aided Simulation
PSS/E Power System Simulator for Engineering
POD Power Oscillation Damper
PSB Power Swing Blocking
PSSWG Power System Security Working Group
PTL Port Lincoln
PV Photovoltaic
QPS Quarantine Power Station
RMS Root mean square
RoCoF Rate of Change of Frequency
RTDS Real Time Digital Simulator
SA South Australia
SAPN SA Power Networks
SCADA Supervisory Control and Data Acquisition
SCR Short Circuit Ratio
SESS South East Substation
SPAR Single phase auto-reclosing
SPS Special Protection Scheme
SRAS System restart ancillary service
SRS System Restart Standard
STATCOM Static compensator
SVC Static Var Compensator
TIPS Torrens Island Power Station
TNSP Transmission Network Service Provider
UFLS Under frequency load shedding
WF Wind farm
WSCR Weighted Short Circuit Ratio
Measures Abbreviation Unit of Measure
Hz Hertz (cycles per second)
km/h Kilometres per hour
kV Kilovolt
kWhr Kilowatt hour

BLACK SYSTEM SOUTH AUSTRALIA 28 SEPTEMBER 2016 – FINAL REPORT
© AEMO 2017 3
Abbreviation Unit of Measure
ms Milliseconds
MVA Mega volt amps
MVAR Mega volt amps reactive
MW Megawatts
MWhr Megawatt hour
MWs Megawatt second
MW/s Megawatts per second (rate of change)
pu Per unit

BLACK SYSTEM SOUTH AUSTRALIA 28 SEPTEMBER 2016 – FINAL REPORT
© AEMO 2017 4
INTRODUCTION
This is AEMO’s final report into the Black System in South Australia (SA) on 28 September 2016. It
contains all the information previously published, and highlighted information that has been updated or
added since the previous report. Chapter 1 gives details about, and links for, the earlier reports.
This report is divided into the following sections:
Pre-event – the status of the power system in SA prior to the Black System on 28 September 2016
and a summary of NER provisions related to AEMO pre-event decisions on system security.
The events resulting in the Black System – the sequence of events on the power system that
occurred in the SA region of the National Electricity Market (NEM) in the 87 seconds before system
shutdown at 16:18:16.
Restoration – the sequence of steps taken to restore normal power supply to all SA
electricity consumers.
System Restart Ancillary Services (SRAS) – the sequence of events and actions taken relating
to provision of SRAS in SA during the Black System.
Market suspension and subsequent operation – a summary of the provisions in the NER
related to market suspension in the NEM, and of the sequence of events from the system
shutdown to lifting of market suspension on 11 October 2016 at 2230 hrs.
Recommendations – for action proposed by AEMO as a result of this investigation.
Next Steps – an outline of the broader work being undertaken by AEMO to address the challenges
to power system security and reliability posed by the changing nature of the power system.
References to times in this report, unless otherwise specified, are market time (Australian Eastern
Standard Time), not local time in SA, nor local time in Victoria.

BLACK SYSTEM SOUTH AUSTRALIA 28 SEPTEMBER 2016 – FINAL REPORT
© AEMO 2017 5
EXECUTIVE SUMMARY
This is AEMO’s final report about the sequence of events before, during, and after the South Australia
(SA) region black system event on 28 September 2016 (Black System), in which some 850,000 SA
customers lost electricity supply, affecting households, businesses, transport and community services,
and major industries.
It consolidates all the information previously published in AEMO’s three preliminary reports 0F
1, adding
further insights about the performance of the power system during this event, and risks identified, from
AEMO’s investigations and analysis.
This report also outlines actions taken since this event, and ongoing actions from before and after the
event, to collectively mitigate the risk of similar major supply disruptions occurring in SA and the rest of
the National Electricity Market (NEM).
What challenges and potential improvements has AEMO identified?
This report focuses on the specifics of the SA Black System event on 28 September 2016. It also
highlights a number of challenges and valuable lessons relevant to improving power system security
and customer supply reliability, particularly as the power system responds to extreme circumstances,
as the NEM generation mix changes and Australia makes the transition to high levels of renewable
energy sources.
The generation mix now includes increased amounts of non-synchronous and inverter-connected plant.
This generation has different characteristics to conventional plant, and uses active control systems, or
complex software, to ride through disturbances. With less synchronous generation online, the system is
experiencing more periods with low inertia and low available fault levels, so AEMO is working with
industry on ways to use the capability of these new types of power generation to build resilience to
extreme events.
As the generation mix continues to change across the NEM, it is no longer appropriate to rely solely on
synchronous generators to provide essential non-energy system services (such as voltage control,
frequency control, inertia, and system strength). Instead, additional means of procuring these services
must be considered, from non-synchronous generators (where it is technically feasible), or from network
or non-network services (such as demand response and synchronous condensers).
The technical challenges of the changing generation mix must be managed with the support of efficient
and effective regulatory and market mechanisms, to ensure the most cost-effective measures are used
in the long-term interest of consumers.
AEMO is continuing to work in association with its stakeholders to resolve these challenges, including
through the established Future Power System Security (FPSS) program, and collaborative engagement
with the Australian Energy Market Commission (AEMC) and the Council of Australian Governments
(COAG) Independent Review into the Reliability and Security of the NEM, led by Dr Alan Finkel.
AEMO has also begun work with the Australian Renewable Energy Authority (ARENA) and others on
proof-of-concept trials of promising new technologies, starting with use of the new Hornsdale Stage 2
wind farm to provide grid stabilisation services. These projects can deliver engineering solutions to
make the grid more resilient and protect customer supply as the transformation of Australia’s energy
system continues.
1 Preliminary reports are available at: http://www.aemo.com.au/Electricity/National-Electricity-Market-NEM/Market-
notices-and-events/Power-System-Operating-Incident-Reports.

BLACK SYSTEM SOUTH AUSTRALIA 28 SEPTEMBER 2016 – FINAL REPORT
© AEMO 2017 6
What happened on 28 September 2016?
This summary of events is based on the findings of all AEMO’s investigations since the Black System
event, and information published by other organisations.
On Wednesday 28 September 2016, tornadoes with wind speeds in the range of 190–260 km/h
occurred in areas of South Australia. 1 F
2 Two tornadoes almost simultaneously damaged a single circuit
275 kilovolt (kV) transmission line and a double circuit 275 kV transmission line, some 170 km apart.
The damage to these three transmission lines caused them to trip 2F
3, and a sequence of faults in quick
succession resulted in six voltage dips on the SA grid over a two-minute period at around 4.16 pm.
As the number of faults on the transmission network grew, nine wind farms in the mid-north of SA
exhibited a sustained reduction in power as a protection feature activated. For eight of these wind
farms, the protection settings of their wind turbines allowed them to withstand a pre-set number of
voltage dips within a two-minute period. Activation of this protection feature resulted in a significant
sustained power reduction for these wind farms. A sustained generation reduction of 456 megawatts
(MW) occurred over a period of less than seven seconds.
The reduction in wind farm output caused a significant increase in imported power flowing through the
Heywood Interconnector. Approximately 700 milliseconds (ms) after the reduction of output from the
last of the wind farms, the flow on the Victoria–SA Heywood Interconnector reached such a level that it
activated a special protection scheme that tripped the interconnector offline.
The SA power system then became separated (“islanded”) from the rest of the NEM. Without any
substantial load shedding following the system separation, the remaining generation was much less
than the connected load and unable to maintain the islanded system frequency. As a result, all supply
to the SA region was lost at 4.18 pm (the Black System). 3F
4 AEMO’s analysis shows that following
system separation, frequency collapse and the consequent Black System was inevitable.
Immediately following the Black System, AEMO and ElectraNet first assessed the state of the
transmission network, then ElectraNet made safe the damaged transmission lines that may have been
presenting a potential threat to public safety.
After assessing what sections of the network were safe to energise, a system restart plan began at
4.30 pm, including restart capability from one of two contracted SA system restart ancillary service
(SRAS) generators, and supply from Victoria via the Heywood Interconnector.
The first customers had power restored by 7.00 pm on 28 September. About 40% of the load in SA
capable of being restored had been restored by 8.30 pm, and 80 to 90 % had been restored by
midnight. The remaining load was gradually restored as fallen transmission lines were bypassed, and
all customers had supply restored by 11 October 2016.
Within minutes of the event, AEMO declared the NEM suspended in the SA region. The market
suspension was not immediately lifted when the Black System ended, due to continuing uncertainties in
power system operations. Twelve days later, on 11 October 2016, the SA government advised AEMO
at 5.48 pm that its direction for suspension of the market had been revoked, and AEMO lifted the
suspension at 10.30 pm.
While the market was suspended:
AEMO continued to manage power system operations in SA. This included, from 3 October 2016,
reclassifying the loss of multiple wind farms as a credible contingency event and placing a
constraint equation on the output of these wind farms until the pre-set levels for their special
protection scheme were increased. No wind farms are still subject to the constraint equation.
2 Bureau of Meteorology. Severe thunderstorm and tornado outbreak South Australia 28 September 2016, 14 November 2016. Available at:
http://www.bom.gov.au/announcements/sevwx/. 3 When a transmission line is damaged there is a short circuit (fault) and the line must be disconnected to protect the remainder of the system
(known as a “trip”). However disconnection cannot occur instantaneously and so for a fraction of a second there is voltage dip (disturbance). 4 The supply demand imbalance was in the order of 1,000 MW, for a regional demand of 1,826 MW.
BLACK SYSTEM SOUTH AUSTRALIA 28 SEPTEMBER 2016 – FINAL REPORT
© AEMO 2017 7
AEMO implemented the required pricing mechanisms for the SA region and, in limited instances,
for other NEM regions.
What conclusions have come from AEMO’s investigations?
From its analysis of the Black System event, many of AEMO’s conclusions provide valuable guidance
for improving the management of extreme conditions in SA:
Access to correct technical information about grid-connected equipment is critical for
system security.
Wind turbines successfully rode through grid disturbances. It was the action of a control setting
responding to multiple disturbances that led to the Black System. Changes made to turbine
control settings shortly after the event has removed the risk of recurrence given the same number
of disturbances.
Had the generation deficit not occurred, AEMO’s modelling indicates SA would have remained
connected to Victoria and the Black System would have been avoided. AEMO cannot rule out the
possibility that later events could have caused a black system, but is not aware of any system
damage that would have done this.
The following factors must be addressed to increase the prospects of forming a stable SA island
and avoiding a Black System:
Sufficient inertia to slow down the rate of change of frequency and enable automatic load
shedding to stabilise the island system in the first few seconds. This will require increases in SA
inertia under some conditions, as well as improvements to load shedding systems combined
with reduced interconnector flows under certain conditions.
Sufficient frequency control services to stabilise frequency of the SA island system over
the longer term. This will require increases in local frequency control services under
some conditions.
Sufficient system strength to control over voltages, ensure correct operation of grid protection
systems, and ensure correct operation of inverter-connected facilities such as wind farms. This
will require increases in local system strength under some conditions.
As noted in the recommendations chapter, AEMO is working with stakeholders to identify the best ways
to address each of these requirements.
A number of factors investigated by AEMO were found to have little or no material effect on the event:
Trips of wind turbines due to high wind speed.
Operation of the five gas generators on-line at the time.
Performance of the Murraylink interconnector.
Settings of the relays that tripped the interconnector.
Settings of powerline protection relays.
Static Var Compensators (SVCs).
AEMO’s key conclusions related to system restoration are:
The time to restore the majority of the load was in line with restoration times experienced in other
recent power system restorations in Australia and elsewhere around the world.
The failure of the Quarantine Power Station (QPS) SRAS was due to the switching sequence
used. Measures have been put in place and tested to remedy this.
The Mintaro emergency diesel generator tripped soon after starting, but this did not delay the
restoration process because the generator cannot by itself restore large generating units in the
Torrens Island area. The cause has been addressed.
BLACK SYSTEM SOUTH AUSTRALIA 28 SEPTEMBER 2016 – FINAL REPORT
© AEMO 2017 8
AEMO will work with the SA System Restart Working Group to learn from this event by identifying
cost-effective measures to improve speed of restoration of supply to all areas without increasing risk.
The key conclusion related to the market suspension is that there is a lack of detailed procedures on
how to operate the power system under extended periods of market suspension.
What does AEMO recommend?
While extreme events will occur from time to time, testing the wider resilience of the grid, this report
recommends practical measures to be implemented to:
Reduce the risk of islanding of the SA region.
Increase the likelihood that, in the event of islanding, a stable electrical island can be sustained at
least in part of SA.
Improve the performance of the system restart process.
Improve market and system operation processes required during periods of market suspension.
Address other technical issues highlighted by this investigation.
This report also outlines actions taken since this event, and ongoing actions from before and after the
event, to collectively mitigate the risk of similar major supply disruptions occurring in SA. These actions
have included:
Changes by several wind farms in SA to the settings for the protective feature for multiple voltage
disturbances.
Introduction of restrictions on Heywood Interconnector flow to ensure the rate of change of
frequency in SA for the unexpected loss of the Heywood Interconnector alone does not exceed
3 Hz/sec.
Requirement for a minimum number of on-line synchronous generators in SA.
AEMO’s recommendations are summarised below. Of the 19 recommendations:
Seven are new in this report (recommendations 1, 4, 5, 8, 9, 10, and 11 below).
Three have already been implemented (recommendations 2, 13, and 14 below, addressing more
rigorous weather warning monitoring, and improvements to SRAS testing).
Work has begun on another eight recommendations (3, 4, 12, 15, 16, 17, 18, and 19).
AEMO plans to complete the remaining recommendations by December 2017 (noting that two
recommendations relate to potential changes to the National Electricity Rules (NER), and a
number of recommendations involve review, consultation and engagement processes with other
organisations and bodies).
Chapter 7 has more detail on these recommendations, including relevant conclusions from AEMO’s
investigations and analysis.

BLACK SYSTEM SOUTH AUSTRALIA 28 SEPTEMBER 2016 – FINAL REPORT
© AEMO 2017 9
Table 1 Summary of recommendations
1 AEMO to propose to ESCOSA changes to generator licensing conditions, and also to request similar changes to the NER, to address deficiencies in performance standards identified through this investigation.
2 AEMO to put in place more rigorous processes to monitor weather warnings for changes to forecasts, to trigger reassessment of reclassification decisions where relevant.
3 AEMO to review and implement, following consultation, a more structured process for reclassification decisions when faced with power system risks due to extreme wind speeds.
4 AEMO to assess options for improved forecasting of when wind speeds will exceed protection settings on wind turbines, which would lead to ‘over-speed cut-outs’.
5 AEMO to consider development of a new generator reclassification process to manage generator ‘type’ risks4F
5, including how information about potential risks will be sought, and the most appropriate methods to manage power system security during such a generator reclassification.
6 AEMO to work with ElectraNet to determine the feasibility of developing a special protection scheme to operate in response to sudden excessive flows on the Heywood Interconnector, and to initiate load shedding with a response time fast enough to prevent separation.
7 AEMO to modify existing transfer limits on the Heywood Interconnector to take into account the fact that the largest credible generator contingency under conditions of high wind generation is greater than previously assumed.
8 AEMO to modify operational procedures for SA island operation to:
Take into account the fact that, under islanded conditions, system strength may fall to a level where some wind farms might not be able to ride through credible voltage disturbances.
Ensure that maintenance of adequate system strength is incorporated into the transmission planning process in a more systematic manner.
9 AEMO to support ElectraNet to identify and address any specific risks to the operation of protection systems due to the low levels of system strength that may be experienced if SA is islanded.
10 AEMO to support ElectraNet in reassessing control strategies to achieve very rapid switching of reactive plant to manage the risk of severe over voltages in SA that might occur due to large levels of under frequency load shedding following separation.
11 AEMO to review its reclassification procedures to address any remaining material risk due to multiple voltage disturbances, and to approach relevant Generators to review the feasibility of increasing plant limits for the maximum number of multiple voltage disturbances that can be tolerated over a 30-minute period.
12 AEMO, together with the South Australian System Restart Working Group, to review the system restart process in detail to determine efficiencies and to implement relevant recommendations from the Reliability Panel. These learnings will be shared across all Australian jurisdictions
13 Any differences between SRAS test plans and the restart process set out in a system restart plan and associated local black system procedures to be identified and explained by AEMO, to ensure the test simulates, as far as practicable, the conditions that will be encountered in a real restart situation
14 Similarly, where the restart procedure depends initially on starting a low voltage generator, the start of this generator alone to be tested on a regular basis, in addition to the annual test of the entire SRAS source
15 AEMO to develop detailed procedures for in power system operations during periods of market suspension, and identify if any NER changes are desirable to improve the process
16 AEMO to investigate a better approach to ensuring that the minimum stable operating levels of generating units are taken into account in the dispatch process
17 AEMO to review market processes and systems, in collaboration with participants, to identify improvements and any associated NER or procedure changes that may be necessary to implement those improvements
18 AEMO to develop a more structured process in consultation with participants to source and capture data after a major event in a timely manner and to co-ordinate data requests.
19 AEMO to investigate with participants the possibility of introducing a process to synchronise all high speed recorders to a common time standard.
5 There are generating systems consisting of many mass-produced smaller generating units with, often, a particular model of generating unit
common to a number of generating systems. Thus, a feature or fault for such a model could result in a large number of smaller generating units across multiple generating systems tripping simultaneously. As a result, AEMO may need to develop a new form of reclassification process to manage such risks.
BLACK SYSTEM SOUTH AUSTRALIA 28 SEPTEMBER 2016 – FINAL REPORT
© AEMO 2017 10
Focus of this report
Building on the detailed third preliminary report published in December 2016, the preparation and
publication of new and updated information in this final report focuses specifically on:
Whether the actual performance of power system plant was consistent with:
The performance that would be expected, based on the relevant performance and
system standards. 5F
6
Expected performance based on AEMO’s dynamic power system models.
Whether changes to access standards are desirable, in light of the risks highlighted by this event.
Scenario studies, including:
Would the result have been different if wind farm generation had not reduced in output due to
the low voltage protection feature?
What would have been the result if AEMO had decided to reclassify the loss of multiple
transmission lines as a credible contingency on that day?
Performance requirements for possible special protection schemes to prevent islanding of the SA
region or to improve the likelihood of successful islanding.
Reviewing the performance of SVCs at Para and South East
sub-stations.
Further investigation of the materiality of risks, including those:
Due to a transient reduction of output from multiple wind farms during fault conditions.
From high winds, or rapidly changing winds, in in areas of high wind farm concentration.
Of unnecessary impedance relay operations during this type of event.
Of over voltages in the SA transmission system due to load shedding or islanding conditions.
Of low system strength in the SA transmission system, following separation from the rest of
the NEM.
Conclusion
AEMO has completed its investigations into the 28 September 2016 Black System in SA, and will
continue to work closely with industry to implement all recommendations outlined in this report.
6 The AER may also be undertaking separate investigations regarding Generator compliance with their performance standards.

BLACK SYSTEM SOUTH AUSTRALIA 28 SEPTEMBER 2016 – FINAL REPORT
© AEMO 2017 11
CONTENTS
NER TERMS, ABBREVIATIONS, AND MEASURES 1
Abbreviations 1
Measures 2
INTRODUCTION 4
EXECUTIVE SUMMARY 5
1. REPORT OBJECTIVES AND SCOPE 22
2. PRE-EVENT 23
2.1 Assessment of conditions 23
2.2 Management of power system security 24
2.3 System configuration 25
2.4 Transmission line faults 30
2.5 Weather – a post-event analysis 30
3. EVENTS RESULTING IN BLACK SYSTEM 32
3.1 Sequence of events 32
3.2 SA Generator performance 39
3.3 Network performance 50
3.4 Demand response 61
3.5 Scenario analysis 63
3.6 Conclusions 66
4. RESTORATION 69
4.1 Restoration strategy 69
4.2 Restoration sequence of events 70
4.3 Generation 71
4.4 Load restoration 73
4.5 Information provided to Participants 76
4.6 Conclusion of the Black System 76
4.7 Restoration performance 77
5. SYSTEM RESTART ANCILLARY SERVICES 78
5.1 Performance of SRAS from QPS 78
5.2 Performance of SRAS from Mintaro 80
6. MARKET SUSPENSION AND SUBSEQUENT OPERATION 82
6.1 Suspension of the market 82
6.2 Sequence of events relevant to SA market suspension 82
6.3 Pricing under market suspension 83
6.4 Directions and compensation 85
6.5 Dispatch mechanism during market suspension 86
6.6 Reserve management 86
6.7 Negative settlements residue management 87
6.8 Power system security 88

BLACK SYSTEM SOUTH AUSTRALIA 28 SEPTEMBER 2016 – FINAL REPORT
© AEMO 2017 12
6.9 Frequency control ancillary services 90
6.10 Rate of Change of Frequency 91
6.11 Other issues experienced during market suspension 91
6.12 Resumption of market operation 92
6.13 Changes in current operational strategy 92
7. RECOMMENDATIONS 93
7.1 Scope of recommendations 93
7.2 Pre-event and event 93
7.3 Restoration 102
7.4 Market suspension 104
7.5 Data issues 106
8. NEXT STEPS 107
8.1 Introduction 107
8.2 Ongoing investigations 107
8.3 Regulatory and strategic initiatives 108
8.4 Power system modelling and analysis activities 110
APPENDIX A. POWER SYSTEM DIAGRAM 112
APPENDIX B. WEATHER EVENT REPORT SUPPLIED BY WEATHERZONE 113
APPENDIX C. WEATHER EVENT REPORT FROM BUREAU OF METEOROLOGY 117
APPENDIX D. SA REGION TRANSMISSION SYSTEM 118
APPENDIX E. PRE-EVENT WEATHER INFO 119
E.1 Forecast weather vs actual 119
E.2 Additional weather data 121
E.3 Pre-event wind farm outputs 124
APPENDIX F. POWER SYSTEM SECURITY MANAGEMENT 125
F.1 AEMO’s roles and responsibilities 125
F.2 Preparedness 125
F.3 Definition of a contingency event 125
F.4 Definition of a credible contingency event 126
F.5 Definition of a non-credible contingency event 126
F.6 Secure operating state and power system security 126
F.7 Satisfactory operating state 127
F.8 Technical envelope 127
F.9 Contingency management 128
F.10 Reclassifying contingency events 128
F.11 Registered Participant, Network Service Provider, and System Operator responsibilities 128
F.12 Reclassifying contingency events due to lightning 129
F.13 Reclassification due to “other” threats 129
F.14 Black System 129
APPENDIX G. SA SYSTEM VOLTAGES 130

BLACK SYSTEM SOUTH AUSTRALIA 28 SEPTEMBER 2016 – FINAL REPORT
© AEMO 2017 13
APPENDIX H. GENERATOR PERFORMANCE STANDARD REQUIREMENTS FOR FAULT
RIDE-THROUGH 132
APPENDIX I. INDIVIDUAL GENERATOR RESPONSES 133
I.1 Individual wind farm responses 133
I.2 Individual synchronous generating unit’s responses 140
APPENDIX J. LOSS OF SYNCHRONISM PROTECTION 143
J.1 Saddle node bifurcation 143
J.2 Operating philosophy of loss of synchronism protection 144
APPENDIX K. HISTORICAL SA SYSTEM SEPARATION EVENTS 145
K.1 2 December 1999 145
K.2 8 March 2004 147
K.3 14 March 2005 148
APPENDIX L. RESPONSE OF NETWORK REACTIVE SUPPORT PLANT 150
L.1 Dynamic reactive support plant 150
L.2 Series capacitors 151
L.3 Assess improvements in the response of network dynamic reactive support plant 151
APPENDIX M. NETWORK CAPABILITY ANALYSIS 156
M.1 Scenario 1: If wind farms did not reduce output due to the multiple voltage disturbances 156
M.2 Scenario 2: Scenario 1, with an additional loss of wind generation due to high wind speeds 168
M.3 Scenario 3: If AEMO had received information on wind ratings of vulnerable transmission lines
and had reclassified the multiple loss of lines for those lines where advised wind ratings were
less than forecast wind speeds 175
APPENDIX N. WEIGHTED SHORT CIRCUIT RATIO 176
APPENDIX O. ROLES AND RESPONSIBILITIES 177
O.1 AEMO 177
O.2 TNSPs 177
O.3 DNSPs 178
O.4 Generators 178
O.5 Staff competency 178
APPENDIX P. SYSTEM RESTART ANCILLARY SERVICES 180
P.1 SRAS contracts in SA 180
P.2 Routine tests 180
APPENDIX Q. OVERVIEW OF THE RESTORATION PROCESS 181
Q.1 Secure and make safe the power system 181
Q.2 Prepare the system for load restoration 182
Q.3 Load restoration 182
APPENDIX R. RESTORATION DETAILS 183
APPENDIX S. GENERATION RESTORATION 186
APPENDIX T. MARKET INFORMATION 188
T.1 AEMO market notices 188

BLACK SYSTEM SOUTH AUSTRALIA 28 SEPTEMBER 2016 – FINAL REPORT
© AEMO 2017 14
T.2 AEMO Media Centre statements 189
APPENDIX U. PROGRESS OF LOAD RESTORATION 190
APPENDIX V. ADVICE FROM ELECTRANET REGARDING DESIGN RATING OF
TRANSMISSION LINES 194
APPENDIX W. VALIDATION OF POWER SYSTEM SIMULATION MODELS 195
W.1 Summary 195
W.2 Individual wind farms/synchronous generators/SVCs 196
W.3 Overall SA power system 204
W.4 Comparison of PSS/E and PSCAD simulation models 212
APPENDIX X. ASSESSMENT OF ADDITIONAL RISKS FOR SYSTEM SECURITY IN SOUTH
AUSTRALIA 215
X.1 Risk of transient wind farm reduction due to a single credible fault 215
X.2 Remaining level of risk of wind farm output reduction due to multiple voltage disturbances 231
X.3 Adequacy of system strength in South Australia during islanded operation 238
X.4 Assessment of the need for changes in technical performance requirements 244
APPENDIX Y. INVESTIGATIONS OF CONTROL AND PROTECTION SCHEMES 249
Y.1 Introduction 249
Y.2 Factors that need to be considered when designing a load shedding scheme 251
Y.3 General requirements for special protection scheme 252
Y.4 Feasibility of an SPS to prevent system separation 254
Y.5 Feasibility of an SPS to ensure formation of a successful island 261
Y.6 Adequacy of conventional load shedding schemes 268
Y.7 Possibility of improvements to response of impedance based relays 268
TABLES
Table 1 Summary of recommendations 9
Table 2 Generators on-line 25
Table 3 Prior network outages 27
Table 4 SA constraint sets invoked pre-event 28
Table 5 Constraint equation results summary 29
Table 6 Transmission line faults in SA on 28 September 2016 30
Table 7 Transmission line faults 34
Table 8 SA wind farm responses to six voltage disturbances between 16:17:33 and 16:18:15 on
28 September 2016 43
Table 9 SA wind farms on-line in SA on 28 September 2016 44
Table 10 Protection settings implemented in SA wind turbines at the time of incident, and proposed
mitigation measures 48
Table 11 Previous events – complete loss of the Heywood Interconnector due to generation
disconnection in SA 55
Table 12 Short circuit ratio and weighted short circuit ratio calculated for all on-line wind farms
north of Adelaide 66

BLACK SYSTEM SOUTH AUSTRALIA 28 SEPTEMBER 2016 – FINAL REPORT
© AEMO 2017 15
Table 13 Generating units returned to service 71
Table 14 Load restoration in the northern part of the state 74
Table 15 International comparison of black system restoration timeframes 77
Table 16 Market suspension review points 83
Table 17 Price revision statistics during market suspension 85
Table 18 Wind farm reclassification changes 89
Table 19 Synchronous generating units on-line 90
Table 20 RoCoF constraint action 91
Table 21 Summary of forecast weather warning detail and actual wind speed data 119
Table 22 Table of wind farm output reductions (pre-event) 124
Table 23 Restoration sequence of events – main SA network 183
Table 24 Restoration sequence of events – Port Lincoln area 185
Table 25 AEMO market notices 188
Table 26 Comparison of on-line generators for the event and scenario analysis 215
Table 27 Short circuit ratio and weighted short circuit ratio calculated for all on-line wind farms 238
Table 28 Short circuit ratio calculated for Para and South East SVCs 240
Table 29 Short circuit ratio calculated for Murraylink HVDC link 240
Table 30 Possible special protection schemes for Heywood import conditions and loss of several
hundred MW of generation 253
FIGURES
Figure 1 SA generation mix pre-event 25
Figure 2 SA total wind farm output (semi-scheduled and non-scheduled) 27
Figure 3 Map of SA transmission system showing location of faults and major terminal stations 33
Figure 4 275 kV voltage decline across SA prior to separation 35
Figure 5 SA frequency compared to Victoria during event 36
Figure 6 Frequency and ROCOF in various SA nodes immediately before the system separation 37
Figure 7 Lightning stike map for Melrose area in the five minutes prior to the Black System 38
Figure 8 Example of low voltage ride-through withstand capability curve at the wind turbine
terminals 40
Figure 9 Voltage response of an example wind turbine against its LVRT withstand capability 40
Figure 10 Total wind farm output – Sustained vs transient power reduction, 28 September 2016 45
Figure 11 Wind farm power reduction based on wind turbine grouping 46
Figure 12 SA system frequencies relative to the Heywood Interconnector 51
Figure 13 Voltage angle difference between various SA nodes and Heywood Substation 51
Figure 14 Heywood Interconnector power flow and voltages across SA power system 52
Figure 15 Response of Heywood Interconnector loss of synchronism relay 53
Figure 16 Impedance trajectory at Heywood and South East substations 54
Figure 17 Power transfer across Murraylink and frequency 57
Figure 18 Operation of a number of distance relays before and after the system separation 59
Figure 19 Total load shed during the event against total load available for load shedding 60
Figure 20 Variations of overall operational demand in SA on 28 September 2016 62
Figure 21 Three-phase voltages, active and reactive power at Olympic Dam’s connection point 62
Figure 22 Port Pirie’s demand variations 63
Figure 23 Comparison of forecast and actual load 69
BLACK SYSTEM SOUTH AUSTRALIA 28 SEPTEMBER 2016 – FINAL REPORT
© AEMO 2017 16
Figure 24 Total unit generating MW output versus availability 72
Figure 25 8 hours after the Black System 75
Figure 26 56 hours after the Black System 76
Figure 27 Simplified schematic of QPS SRAS components 79
Figure 28 Damage to Mintaro diesel generator stator windings 80
Figure 29 30-minute spot market price in SA since 16 September 2016 84
Figure 30 Interconnector constraint action 88
Figure 31 Reclassified wind farms – total constrained power 89
Figure 32 Summarised chain of events and potential mitigating measures 94
Figure 33 Status of SA 275 kV transmission network pre-event 112
Figure 34 Snowtown weather observation (located 82km SSW of Mt Lock) 121
Figure 35 Port Pirie weather observation (63km west of Belalie) 121
Figure 36 Port Augusta weather observation (16km west of Davenport) 122
Figure 37 Clare weather observation (68km south of Belalie) 122
Figure 38 Wind speed data at representative weather stations several seconds before the Black
System 123
Figure 39 Voltages measured at Davenport–Olympic Dam 275 kV line 130
Figure 40 Voltages measured at Robertstown–Tungkillo 275 kV line 130
Figure 41 Voltages measured at Para–Parafield Gardens West 275 kV line 131
Figure 42 Voltages measured at South East–Tailem Bend No. 1 275 kV line 131
Figure 43 Three-phase voltages, active and reactive power at Canunda Wind Farm’s connection
point 133
Figure 44 Three-phase voltages, active and reactive power at Clements Gap Wind Farm’s
connection point 134
Figure 45 Three-phase voltages, active and reactive power at Hallett Wind Farm’s connection point 134
Figure 46 Three-phase voltages, active and reactive power at Hallett Hill Wind Farm’s connection
point 135
Figure 47 Three-phase voltages, active and reactive power at Hornsdale Wind Farm’s connection
point 135
Figure 48 Three-phase voltages, active and reactive power at Lake Bonney Wind Farm’s connection
point 136
Figure 49 Three-phase voltages, active and reactive power at Lake Bonney 2 Wind Farm’s
connection point 136
Figure 50 Three-phase voltages, active and reactive power at Lake Bonney 3 Wind Farm’s
connection point 137
Figure 51 Three-phase voltages, active and reactive power at Mt Millar Wind Farm’s connection
point 137
Figure 52 Three-phase voltages, active and reactive power at North Brown Hill Wind Farm’s
connection point 138
Figure 53 Three-phase voltages, active and reactive power at Snowtown 2 Wind Farm’s connection
point 138
Figure 54 Three-phase voltages, active and reactive power at The Bluff Wind Farm’s connection
point 139
Figure 55 Three-phase voltages, active and reactive power at Waterloo Wind Farm’s connection
point 139
Figure 56 Three-phase voltages, active and reactive power at TIPS B1 connection point 140
Figure 57 Three-phase voltages, active and reactive power at TIPS B3 connection point 140

BLACK SYSTEM SOUTH AUSTRALIA 28 SEPTEMBER 2016 – FINAL REPORT
© AEMO 2017 17
Figure 58 Three-phase voltages, active and reactive power at TIPS B4 connection point 141
Figure 59 Three-phase voltages active and reactive power at Ladbroke Grove’s connection point 141
Figure 60 Measured frequency at Penola West to which Ladbroke Grove is connected 142
Figure 61 Bifurcation diagram showing variation of voltage magnitude and phase angle as function
of loading 143
Figure 62 Heywood Interconnector MW flow, and SA system voltages for 2 December 1999 event 145
Figure 63 Heywood Interconnector MW flow, and SA system voltages for 2 December 1999 event
(zoomed in) 146
Figure 64 SA and Heywood frequencies for 2 December 1999 event 147
Figure 65 Heywood Interconnector MW flow, and SA system voltages for 8 March 2004 event 147
Figure 66 SA and Heywood frequencies for 8 March 2004 event 148
Figure 67 Heywood Interconnector MW flow, and SA system voltages for 14 March 2005 event 148
Figure 68 SA and Heywood frequencies for 14 March 2005 event 149
Figure 69 Three-phase voltages and MVAr injection by Para SVC1 150
Figure 70 Three-phase voltages and MVAr injection by Para SVC2 150
Figure 71 Current across the two series capacitors and bypass time 151
Figure 72 Reactive power output from the SVCs and external capacitors 152
Figure 73 System voltages 153
Figure 74 Active and reactive power transfer at Heywood Interconnector 153
Figure 75 Reactive power output from the SVCs and external capacitor 154
Figure 76 System voltages 154
Figure 77 Active and reactive power transfer at Heywood Interconnector 155
Figure 78 Network capability with loss of three lines assuming no sustained power reduction by
wind farms 156
Figure 79 Network capability with loss of four lines assuming no sustained power reduction by wind
farms 157
Figure 80 South East voltages versus Heywood transfers 158
Figure 81 QV plots at South East with varying Heywood transfers (no contingency) 158
Figure 82 QV plots at South East with varying Heywood transfers (loss of four lines at Davenport) 159
Figure 83 Davenport voltages versus Davenport demand 159
Figure 84 QV plots at Davenport with varying Davenport demand (no contingency) 160
Figure 85 QV plots at Davenport with varying Davenport demand (loss of four lines in Davenport) 160
Figure 86 Para voltages versus Robertstown transfers 161
Figure 87 QV plots at Para with varying Robertstown transfers (no loss of line) 161
Figure 88 QV plots at Para with varying Robertstown transfers (loss of four lines at Davenport) 162
Figure 89 Active and reactive power transfer at Heywood Interconnector 163
Figure 90 Impedance trajectory at Heywood Interconnector 163
Figure 91 Voltage magnitudes at key SA 275 kV substations 164
Figure 92 Voltage phase angles relative to HYTS at key SA 275 kV substations 164
Figure 93 Frequencies at key SA 275 kV substations 165
Figure 94 Individual generators’ active power output 165
Figure 95 Active and reactive power transfer at Heywood Interconnector 166
Figure 96 Impedance trajectory at Heywood Interconnector 166
Figure 97 Voltage magnitudes at key SA 275 kV substations 167
Figure 98 Voltage phase angles relative to HYTS at key SA 275 kV substations 167
Figure 99 Frequencies at key SA 275 kV substations 168
Figure 100 Individual generators’ active power output 168
BLACK SYSTEM SOUTH AUSTRALIA 28 SEPTEMBER 2016 – FINAL REPORT
© AEMO 2017 18
Figure 101 Active and reactive power transfer at Heywood Interconnector 169
Figure 102 Impedance trajectory at Heywood Interconnector 170
Figure 103 Voltage magnitudes at key SA 275 kV substations 170
Figure 104 Voltage phase angles relative to HYTS at key SA 275 kV substations 171
Figure 105 Frequencies at key SA 275 kV substations 171
Figure 106 Active and reactive power transfer at Heywood Interconnector 172
Figure 107 Impedance trajectory at Heywood Interconnector 172
Figure 108 Voltage magnitudes at key SA 275 kV substations 173
Figure 109 Voltage phase angles relative to HYTS at key SA 275 kV substations 173
Figure 110 Frequencies at key SA 275 kV substations 174
Figure 111 Individual generators’ active power output 174
Figure 112 QPS MW output during restoration 186
Figure 113 TIPS A2 Generating Unit MW output during restoration 186
Figure 114 TIPS A4 Generating Unit MW output during restoration 186
Figure 115 Pelican Point Power Station MW output during restoration 187
Figure 116 Two hours after the Black System, no load had been restored 190
Figure 117 Percentage of load restored after 3 hours 191
Figure 118 Percentage of load restored after 4 hours 191
Figure 119 Percentage of load restored after 5 hours 192
Figure 120 Percentage of load restored after 6 hours 192
Figure 121 Percentage of load restored after 7 hours 193
Figure 122 PSS/E And PSCAD simulation of voltage, active power, and reactive power at
Canunda Wind Farm’s connection point 197
Figure 123 PSS/E and PSCAD simulation of voltage, active power, and reactive power at Hallett
Hill Wind Farm’s connection point 198
Figure 124 PSS/E and PSCAD simulation of voltage, active power, and reactive power at
Hornsdale Wind Farm’s connection point 199
Figure 125 PSS/E and PSCAD simulation of voltage, active power, and reactive power at Lake
Bonney 1 Wind Farm’s connection point 199
Figure 126 PSS/E simulation of voltage, active power, and reactive power at Mt Millar Wind
Farm’s connection point 200
Figure 127 PSS/E and PSCAD simulation of voltage, active and reactive power at North Brown
Hill Wind Farm’s connection point 201
Figure 128 PSS/E and PSCAD simulation of voltage, active and reactive power at Snowtown
South Wind Farm’s connection point 201
Figure 129 PSS/E and PSCAD simulation of voltage, active power, and reactive power at
Waterloo Wind Farm’s connection point 202
Figure 130 PSS/E and PSCAD simulation of voltage, active power, and reactive power at TIPS
B4 connection point 202
Figure 131 PSS/E and PSCAD simulation of voltage, active power, and reactive power at
Ladbroke Grove connection point 203
Figure 132 PSS/E and PSCAD simulation of three-phase voltages and reactive power at Para
SVC2 203
Figure 133 Active and reactive power transfer at Heywood Interconnector 205
Figure 134 Voltage magnitudes at key SA 275 kV substations 206
Figure 135 Simulated impedance trajectory at Heywood Interconnector against relay
characteristic area 206

BLACK SYSTEM SOUTH AUSTRALIA 28 SEPTEMBER 2016 – FINAL REPORT
© AEMO 2017 19
Figure 136 Voltage phase angles relative to HYTS at key SA 275 kV substations 207
Figure 137 Frequencies at key SA 275 kV substations 207
Figure 138 Individual active power output 208
Figure 139 Active and reactive power transfer at Heywood Interconnector 209
Figure 140 PSCAD impedance trajectory at Heywood Interconnector against relay characteristic
area 209
Figure 141 Voltage magnitudes at key SA 275 kV substations 210
Figure 142 Voltage phase angles relative to HYTS at key SA 275 kV substations 210
Figure 143 Frequencies at key SA 275 kV substations 211
Figure 144 Individual generators’ active power 212
Figure 145 Voltages at Heywood Interconnector 213
Figure 146 Active power transfer at Heywood Interconnector 213
Figure 147 Reactive power transfer at Heywood Interconnector 214
Figure 148 Actual Heywood Interconnector flows with a dispatch target of 600 MW 217
Figure 149 Active and reactive power transfer at Heywood Interconnector 219
Figure 150 Simulated impedance trajectory at Heywood Interconnector against relay
characteristic area 219
Figure 151 Voltage magnitudes at key SA 275 kV substations 220
Figure 152 Voltage phase angles relative to HYTS at key SA 275 kV substations 220
Figure 153 Frequencies at key SA 275 kV substations 221
Figure 154 Active and reactive power transfer at Heywood Interconnector 221
Figure 155 PSCAD Impedance trajectory at Heywood Interconnector against relay characteristic
area 222
Figure 156 Voltage magnitudes at key SA 275 kV substations 222
Figure 157 Voltage phase angles relative to HYTS at key SA 275 kV substations 223
Figure 158 Frequencies at key SA 275 kV substations 223
Figure 159 Active and reactive power transfer at Heywood Interconnector 224
Figure 160 Simulated impedance trajectory at Heywood Interconnector against relay
characteristic area 224
Figure 161 Voltage magnitudes at key SA 275 kV substations 225
Figure 162 Voltage phase angles relative to HYTS at key SA 275 kV substations 225
Figure 163 Frequencies at key SA 275 kV substations 226
Figure 164 Active and reactive power transfer at Heywood Interconnector 226
Figure 165 Simulated impedance trajectory at Heywood Interconnector against relay
characteristic area 227
Figure 166 Voltage magnitudes at key SA 275 kV substations 227
Figure 167 Voltage phase angles relative to HYTS at key SA 275 kV substations 228
Figure 168 Frequencies at key SA 275 kV substations 228
Figure 169 Active and reactive power transfer at Heywood Interconnector 229
Figure 170 Simulated impedance trajectory at Heywood Interconnector against relay
characteristic area 229
Figure 171 Voltage magnitudes at key SA 275 kV substations 230
Figure 172 Voltage phase angles relative to HYTS at key SA 275 kV substations 230
Figure 173 Frequencies at key SA 275 kV substations 231
Figure 174 Active and reactive power transfer at Heywood Interconnector 233
Figure 175 Simulated impedance trajectory at Heywood Interconnector against relay
characteristic area 233

BLACK SYSTEM SOUTH AUSTRALIA 28 SEPTEMBER 2016 – FINAL REPORT
© AEMO 2017 20
Figure 176 Voltage magnitudes at key SA 275 kV substations 234
Figure 177 Voltage phase angles relative to HYTS at key SA 275 kV substations 234
Figure 178 Frequencies at key SA 275 kV substations 235
Figure 179 Active and reactive power transfer at Heywood Interconnector 235
Figure 180 Simulated impedance trajectory at Heywood Interconnector against relay
characteristic area 236
Figure 181 Voltage magnitudes at key SA 275 kV substations 236
Figure 182 Voltage phase angles relative to HYTS at key SA 275 kV substations 237
Figure 183 Frequencies at key SA 275 kV substations 237
Figure 184 Impact of weak grids on operation of over current relays 241
Figure 185 Impact of system strength on impedance trajectory seen by the distance relay during
fault conditions 242
Figure 186 Impact of system strength on fault direction seen by the distance relay 242
Figure 187 Impact of system strength on current level seen by the distance relay 243
Figure 188 Normalised fault currents across SA tranmission lines 244
Figure 189 Comparison of reactive power responses at Snowtown 2 and Hornsdale Wind
Farms 246
Figure 190 Comparison of reactive power responses at the connection point of the Hallett,
Hallett Hill, North Brown Hill, and The Bluff wind farms 247
Figure 191 Comparison of reactive power responses at the connection point and that provided
by the dynamic reactive support plant 247
Figure 192 Heywood Interconnector’s active power flow and voltage for the 3 March 2017
generation disconection event in SA 250
Figure 193 Impedance trajectory seen by the Heywood loss of synchronism relay for the 3
March 2017 generation disconection event in SA 250
Figure 194 Voltage phase angles relative to HYTS at key SA 275 kV substations without SPS 255
Figure 195 Active and reactive power transfer at Heywood Interconnector with SPS 256
Figure 196 Simulated impedance trajectory at Heywood Interconnector with SPS against relay
characteristic area 256
Figure 197 Voltage magnitudes at key SA 275 kV substations with SPS 257
Figure 198 Voltage phase angles relative to HYTS at key SA 275 kV substations 257
Figure 199 Frequencies at key SA 275 kV substations 258
Figure 200 Active and reactive power transfer at Heywood Interconnector 259
Figure 201 Simulated impedance trajectory at Heywood Interconnector with SPS against relay
characteristic area 259
Figure 202 Voltage magnitudes at key SA 275 kV substations 260
Figure 203 Voltage phase angles relative to HYTS at key SA 275 kV substations 260
Figure 204 Frequencies at key SA 275 kV substations 261
Figure 205 Active and reactive power transfer at Heywood Interconnector 262
Figure 206 Simulated impedance trajectory at Heywood Interconnector against relay
characteristic area 263
Figure 207 Voltage magnitudes at key SA 275 kV substations 263
Figure 208 Voltage phase angles relative to HYTS at key SA 275 kV substations 264
Figure 209 Frequencies at key SA 275 kV substations 264
Figure 210 Load shedding profiles 265
Figure 211 Active and reactive power transfer at Heywood Interconnector 265
BLACK SYSTEM SOUTH AUSTRALIA 28 SEPTEMBER 2016 – FINAL REPORT
© AEMO 2017 21
Figure 212 Simulated impedance trajectory at Heywood Interconnector against relay
characteristic area 266
Figure 213 Voltage magnitudes at key SA 275 kV substations 266
Figure 214 Voltage phase angles relative to HYTS at key SA 275 kV substations 267
Figure 215 Frequencies at key SA 275 kV substations 267
Figure 216 Coordination between conventional distance realy reach, and power swing blocking
and load encroachment functions 269
Figure 217 Overlay of impedance trajectory and relay characteristic area for Tailem Bend-Keith
132 kV line during the Black System 270
Figure 218 Overlay of impedance trajectory and relay characteristic area for Waterloo-Templers
132 kV line during the Black System 270

BLACK SYSTEM SOUTH AUSTRALIA 28 SEPTEMBER 2016 – FINAL REPORT
© AEMO 2017 22
1. REPORT OBJECTIVES AND SCOPE
This is AEMO’s final report on the South Australian (SA) black system event of 28 September 2016
(Black System). It sets out AEMO’s understanding of:
Details of the Black System, and the series of events that led to the Black System.
The performance of the system restart process and supply restoration.
The performance of power system and market operations during market suspension.
Recommendations for further action.
The scope of this report is intended to meet the requirements of clause 4.8.15 of the National Electricity
Rules (NER) for events prior to declaration of market suspension, and of clauses 3.14.3(c) and
3.14.4(g) of the NER for subsequent events.
Specifically, the report examines:
The adequacy of the provision and response of facilities or services.
The appropriateness of actions taken to restore or maintain power system security, including how
reclassification criteria were assessed and applied.
The reason for the market suspension, and the effect the suspension had on the operation of the
National Electricity Market (NEM) spot market.
This report has incorporated all information from AEMO’s three previous reports on this event, except
where that information has now been superseded. The previous reports are:
Preliminary Report – published on 5 October 2016, titled Preliminary Report – Black System
Event in South Australia on 28 September 2016 and based on information available up to 0900 hrs
on Monday 3 October 2016.
Update Report – published on 19 October 2016, titled Update Report – Black System Event in
South Australia on 28 September 2016 and based on information available up to 1700 hrs on
Tuesday 11 October 2016.
Third Report – published on 12 December 2016, titled Black System South Australia 28
September 2016 – Third Report and based upon information available up to 0900 hrs on
Wednesday 7 December 2016.
All these reports are available on AEMO’s website at http://www.aemo.com.au/Electricity/National-
Electricity-Market-NEM/Market-notices-and-events/Power-System-Operating-Incident-Reports.
Updated or new information is highlighted through this report.
BLACK SYSTEM SOUTH AUSTRALIA 28 SEPTEMBER 2016 – FINAL REPORT
© AEMO 2017 23
2. PRE-EVENT
This chapter outlines the state of the power system 6F
7 in the period leading up to the events resulting in a
Black System at 1618 hrs on 28 September 2016, which resulted in the loss of supply to all customers
in SA (approximately 850,000 customer connections and 1,826 megawatts (MW)7F
8 of demand).
The information in this chapter is unchanged since AEMO published its previous report in December
2016, except where otherwise noted.
Prior to the event:
The electricity system in SA was in a secure operating state.
The electricity market was operating normally.
2.1 Assessment of conditions
At 0830 hrs on 28 September 2016:
AEMO assessed the state of the weather using available weather analysis tools.8F
9 Bureau of
Meteorology (BOM) weather reports, at the time of this assessment, included wind speed forecasts
of up to 120 km/h (gusts). The forecasts received by AEMO did not include any warnings regarding
the possibility of tornadoes. Details of these weather warnings are in Appendix E.1. 9F
10
AEMO noted that forecast wind conditions could reduce wind farm output where the wind speed
exceeded 90 km/h, and implemented increased monitoring of wind farm performance.10F
11 This
included comparisons between forecast and actual wind farm outputs to ensure accurate dispatch
(see Appendix E.3). Over-speed trips occur at the individual wind turbine level and reduce power
output over several minutes. Potential over-speed reductions were adequately covered by spare
capacity on the Heywood Interconnector.
AEMO was operating the power system in accordance with the NER and procedures under the
NER, and was covering the loss of certain groups of wind farms as a credible contingency event,
where these wind farms were connected to the grid via a single transmission line.11 F
12 This meant the
Heywood Interconnector would remain stable for the loss of 260 MW of generation within SA, and
action would then be required by AEMO to bring the flow on the interconnector back to the secure
limit within half an hour. There was sufficient reserve generating capacity within SA to achieve this
if needed.
AEMO assessed the potential impact on the transmission network due to lightning. As no double
circuit transmission lines in SA were classified as ‘vulnerable’ to lightning 12 F
13, the potential presence
of lightning did not warrant the loss of those lines being reclassified from a non-credible
contingency event to a credible contingency event. The unexpected disconnection of a single
circuit transmission line, for any reason, is always treated as a credible contingency event.
AEMO assessed conditions that could impact the Heywood Interconnector. As both transmission
circuits comprising the Heywood Interconnector were in service, the loss of both lines was
considered a non-credible contingency event. The lines had not been classified as ‘vulnerable’ due
to lightning, and AEMO had not received advice regarding abnormal risks to the transmission
network due to the forecast weather conditions.
7 Appendix A illustrates the SA 275 kilovolt (kV) transmission network before the event. Further details relating to the roles and responsibilities of
everyone involved in the event, as well as key power system security concepts such as ‘credible contingency event’, ‘non-credible contingency event’, and ‘vulnerable’, are in Appendix F.
8 This was given as 1,895 MW of demand in the Preliminary Report – Black System Event in South Australia on 28 September 2016. The minor variation is due to the data timestamp, which has been aligned at 1618 hrs.
9 AEMO’s sources of information include Weatherzone, the BOM, and Indji Watch (Global Positon and Tracking Systems Pty Ltd (GPATS)). 10 Since 1 January 2006, warnings of damaging winds (wind gusts exceeding 90 km/hr) have been issued in SA on 617 days, and warnings of
destructive winds (wind gusts exceeding 124 km/hr) have been issued in SA on 29 days. 11 Under high wind speed or high ambient temperature conditions, wind generation can shut down to protect wind turbines from damage. 12 The largest such contingency at the time in South Australia was the group of Lake Bonney wind farms (approximately 260 MW). 13 See Section 11.4.1 of AEMO’s Power System Security Guidelines, available at: http://www.aemo.com.au/Electricity/National-Electricity-Market-
NEM/Security-and-reliability/Power-system-operation.

BLACK SYSTEM SOUTH AUSTRALIA 28 SEPTEMBER 2016 – FINAL REPORT
© AEMO 2017 24
AEMO had not been informed by ElectraNet or SA Generators of any circumstance which could
have adversely affected the secure operation of the power system or their equipment under these
forecast conditions (advice to AEMO of the existence of such risks is standard practice under
clause 4.8.1 of the NER). 13F
14 Under procedures in place at that time, AEMO would only reclassify the
loss of multiple circuits under high wind conditions if the maximum wind speed was forecast to be
in excess of the design rating for the lines, as advised by the relevant transmission network service
provider (TNSP).14F
15 AEMO did not keep details of design ratings for wind loadings, and relied upon
TNSPs, as asset owners, to alert AEMO.
AEMO understood that all wind turbines were capable of riding through credible faults, provided
these faults were within the size and duration parameters specified in generator performance
standards 15F
16 that would have ensured they cleared within the maximum clearance times set out in
the System Standards.16F
17 AEMO had not received any advice from the impacted Generators on
their pre-set protection limits with respect to the number of faults in quick succession.
At around 0930 hrs, AEMO discussed the approaching weather with ElectraNet:
ElectraNet advised that several outages had been cancelled, several more outages were expected
to be returned to service early, and field crews were on standby if required.
No issues were raised by ElectraNet about abnormal risks to the transmission network. Across the
NEM, the transmission system has had a history of successfully withstanding storms with
maximum gust wind speeds of 120 to 140 km/h without major incidents. The lack of any advice
from ElectraNet of additional risks to its transmission network under these forecast conditions was
not inconsistent with the historical performance of the grid. 17F
18
In accordance with the NER and AEMO’s procedures under the NER, AEMO:
Concluded there was insufficient justification to reclassify the loss of multiple transmission circuits,
including the two circuits that constitute the Heywood Interconnector, or any additional multiple
generating units, as a credible contingency event.
Accordingly, placed no additional constraints on the operation of the Victorian and SA transmission
network prior to the events of 28 September 2016.
AEMO’s assessment was that under the NER, in the absence of advice as to specific threats to power
system security, it had no obligation or authority to take further action to maintain the secure operation
of the power system.
2.2 Management of power system security AEMO has power system security responsibilities as set out in Chapter 4 of the NER. A detailed
summary is in Appendix F. At a high level:
AEMO manages the NEM power system from two control rooms in different states that function as
a single virtual control room. System management is a minute-by-minute activity that relies on
extensive use of large real-time data processing systems.
AEMO manages the power system to an N-1 standard, meaning that any single element (such as
a generating unit or transmission line) can be suddenly lost without system parameters breaching
limits. These events are termed credible contingency events, because their occurrence is
considered reasonably possible in the normal running of the power system.
When the power system is operating to this N-1 standard, it is in a secure operating state.
14 See Appendix F.11 for further details on this requirement. 15 For instance, during Cyclone Marcia in February 2015. For further details see AEMO. NEM Event – Directions to Northern Queensland
Generators during Tropical Cyclone Marcia – 20 February 2015, 7 May 2015. Available at: https://www.aemo.com.au/media/Files/Other/reports/NEM%20Event%20%20Directions%20to%20Nth%20Queensland%20Gens%20%2020%20February%202015.pdf.
16 See NER S5.2.5.5. 17 The System Standards are detailed in Schedule 5.1a of the NER, specifically, clause S5.1a.8 of the NER. 18 ElectraNet later advised AEMO that, prior to the event, it did not consider that there was an increased risk of multiple single circuit or double
circuit lines tripping.

BLACK SYSTEM SOUTH AUSTRALIA 28 SEPTEMBER 2016 – FINAL REPORT
© AEMO 2017 25
Following a contingency event (whether or not a credible contingency event) or a significant
change in power system conditions, AEMO seeks to restore the system to a secure operating state
within 30 minutes by adjusting plant settings and power flows.
Events beyond the N-1 standard, such as the coincident loss of multiple generating units or
transmission lines, are termed non-credible contingency events.
AEMO can reclassify non-credible contingency events as credible contingency events if
circumstances increase the risk of their occurrence. Common examples of reclassification include
lightning in the vicinity of transmission lines known to be vulnerable to lightning, or bushfires
crossing easements that contain multiple transmission lines.18F
19 Reclassification usually requires
AEMO to apply additional constraints to the transmission network, and this can result in changes to
generation dispatch, which may limit the ability of individual plant to generate electricity and may
increase regional energy prices.
AEMO has overall responsibility for management of power system security, but works very closely
with Market Participants and Network Service Providers (NSPs) to achieve this. AEMO relies on
the assistance and cooperation of these parties to stay informed about the state of the power
system and any anticipated risks.
2.3 System configuration Pre-event operational demand 19F
20 in SA was being supplied by a combination of thermal (synchronous)
generation, wind generation, and imports from Victoria across both the alternating current (AC)
Heywood Interconnector and the Murraylink direct current (DC) interconnection.
A summary of the generation mix prior to the event is outlined below.
Figure 1 SA generation mix pre-event
Table 2 sets out the output of the generators on-line at the time of the Black System, including the
substation and lines they connect to. The combined inertia of the thermal generating units was around
3,000 megawatt seconds (MWs).
Table 2 Generators on-line
Generator Type Output (MW) Substation Lines connected
The Bluff Wind Farm (WF) Wind 43 Belalie Davenport–Belalie Belalie–Mokota
Clements Gap WF Wind 14 Redhill Redhill–Bungama Redhill–Brinkworth
Canunda WF Wind 43 Snuggery Snuggery–Mayura–South East Snuggery–Blanch
Hallett WF Wind 38 Canowie Canowie–Mt Lock Canowie–Robertstown
Hallett Hill WF Wind 42
19 See Appendix F for definitions. 20 Operational demand refers to the electricity used by residential, commercial, and large industrial consumers, as supplied by scheduled,
semi-scheduled, and significant non-scheduled generating units.

BLACK SYSTEM SOUTH AUSTRALIA 28 SEPTEMBER 2016 – FINAL REPORT
© AEMO 2017 26
Generator Type Output (MW) Substation Lines connected
Hornsdale WF Wind 86 Mt Lock Mt Lock–Davenport Mt Lock–Canowie
Lake Bonney 1 WF Wind 77 Mayura Mayura–Snuggery–South East
Lake Bonney 2 WF Wind 149
Lake Bonney 3 WF Wind 35
Mt Millar WF Wind 67 Yadnarie Yadnarie–Middleback Yadnarie–Port Lincoln
North Brown Hill WF Wind 85 Belalie Davenport–Belalie Belalie–Mokota
Snowtown North WF Wind 44 Snowtown Snowtown–Blyth West
Snowtown South WF Wind 65
Waterloo WF Wind 95 Waterloo East Waterloo East–Waterloo Waterloo East–Robertstown
Total wind generation 883
Ladbroke Grove Unit 1 Thermal 42 Ladbroke Grove Ladbroke Grove–Penola West
Ladbroke Grove Unit 2 Thermal 40
Torrens Island B PS Unit 1 Thermal 82 Torrens Island Torrens Island–Para Torrens Island–Le Fevre Torrens Island–Magill Torrens Island–City West Torrens Island–Cherry Gardens Torrens Island–North Field Torrens Island–Kilburn
Torrens Island B PS Unit 3 Thermal 84
Torrens Island B PS Unit 4 Thermal 82
Total thermal generation 330
Note: Snowtown 2 comprises Snowtown North and Snowtown South wind farms.
As Figure 2 shows, there were significant variations in wind generation in the hour before the event,
including a significant reduction at about 1540 hrs.
Figure 34 in Appendix E.2 shows that general wind speeds in the Snowtown area peaked above
90 km/hr around that time. The output of the wind farms in this immediate area was reduced, probably
due to operation of the over-speed protection. The wind speed dropped away quickly and the output of
these wind farms began to increase around 1605 hrs.
The subsequent BOM report 20F
21 indicates that the storm front continued to move eastwards, and the
winds began to peak in the vicinity of the wind farms near Hallett. Immediately prior to events leading to
the Black System, the output of some of these wind farms was falling, again probably due to operation
of the over-speed protection.
If this event had not happened, it is possible that output of these wind farms could have continued to
fall. To understand the significance of this, AEMO has undertaken a scenario study assuming:
The loss of the four 275 kilovolt (kV) transmission lines damaged in the storm.
No sustained power reduction due to the operation of the protective feature triggered by multiple
voltage disturbances, but a further 200 MW reduction in wind generation due to operation of the
over-speed protection.
The simulation results for this scenario have indicated that the SA power system would have remained
stable and separation from the rest of the NEM would not have occurred. Detailed results of this
simulation are in Section 3.5.1 and Appendix M.2.21F
22
These unusually large and rapid variations in wind generation can result in flow on the Heywood
Interconnector exceeding its secure limit but not reaching the limit for stable operation. Normal dispatch
21 BOM. Severe thunderstorm and tornado outbreak South Australia 28 September 2016. Available at:
http://www.bom.gov.au/announcements/sevwx/sa/Severe_Thunderstorm_and_Tornado_Outbreak_28_September_2016.pdf. 22 The above information is additional to that provided in the Third Report. It has been added to provide more explanation of the reasons for the
variability of the wind generation prior to the event and the reason that AEMO does not believe that it was a critical issue for this event.

BLACK SYSTEM SOUTH AUSTRALIA 28 SEPTEMBER 2016 – FINAL REPORT
© AEMO 2017 27
processes then act to increase dispatch of local SA generation or Murraylink to bring the Heywood
Interconnector flow back within the secure limit.
For instance, the sharp fall in wind generation at around 1540 hours resulted in flow on the Heywood
Interconnector peaking to 585 MW (about 160 MW above the secure limit at that time). The central
dispatch system then increased dispatch of generation to bring the flow back to the secure limit within
15 minutes.
While the intermittency of the wind was not a material factor in the Black System event itself, its impact
was greater than expected and action has been recommended in Chapter 7 to improve AEMO’s ability
to forecast the impact of over-speed protection during high wind conditions.
Figure 2 shows SA’s total wind farm output prior to the Black System. The variation shown is typical of
the intermittent nature of wind generation. The red dashed line depicts the time of the Black System.
Figure 2 SA total wind farm output (semi-scheduled and non-scheduled)
Table 3 shows SA transmission equipment which was out of service before the event or was returned to
service early because of the approaching storm.
Table 3 Prior network outages
Outage Start date/time
End date/time
Constraint set invoked
Status
PARA SVC No.2 Power Oscillation Damper (POD)
16/09/2016 17:00
25/10/2016 09:26
S-PA_SVC1-POD (Oscillatory limits)
Completed after the event.
Monash North West Bend No. 2 132 kV line
24/09/2016 13:30
28/09/2016 15:33
S-MHNW_2 (thermal limits)
Returned to service early at the request of ElectraNet. Original planned return to service was 1630 hrs on 30 September 2016.
Robertstown–Waterloo East 132 kV line and associated circuit breakers (CBs)
28/09/2016 08:10
28/09/2016 11:14
S-WE_MWP4_RB (thermal limits)
Returned to service early at the request of ElectraNet. Original planned return to service was 1800 hrs on 28 September 2016.
Ardrossan West–Wattle Point Tee Dalrymple 132 kV line
22/09/2016 11:15
30/09/2016 16:08
n/a Completed after the event.
800
900
1000
1100
1200
1:3
0:0
0 P
M
1:3
5:0
0 P
M
1:4
0:0
0 P
M
1:4
5:0
0 P
M
1:5
0:0
0 P
M
1:5
5:0
0 P
M
2:0
0:0
0 P
M
2:0
5:0
0 P
M
2:1
0:0
0 P
M
2:1
5:0
0 P
M
2:2
0:0
0 P
M
2:2
5:0
0 P
M
2:3
0:0
0 P
M
2:3
5:0
0 P
M
2:4
0:0
0 P
M
2:4
5:0
0 P
M
2:5
0:0
0 P
M
2:5
5:0
0 P
M
3:0
0:0
0 P
M
3:0
5:0
0 P
M
3:1
0:0
0 P
M
3:1
5:0
0 P
M
3:2
0:0
0 P
M
3:2
5:0
0 P
M
3:3
0:0
0 P
M
3:3
5:0
0 P
M
3:4
0:0
0 P
M
3:4
5:0
0 P
M
3:5
0:0
0 P
M
3:5
5:0
0 P
M
4:0
0:0
0 P
M
4:0
5:0
0 P
M
4:1
0:0
0 P
M
4:1
5:0
0 P
M
4:2
0:0
0 P
M
MW
Time of event

BLACK SYSTEM SOUTH AUSTRALIA 28 SEPTEMBER 2016 – FINAL REPORT
© AEMO 2017 28
Outage Start date/time
End date/time
Constraint set invoked
Status
Torrens Island Power Station (TIPS)–City West 275 kV line
24/08/2016 09:36
04/11/2016 16:30
n/a Long-term outage.
Munno Para 1 275/66 kV XFMR and associated 275 kV CBs
22/09/2016 09:50
30/09/2016 17:06
n/a Completed after the event.
Pimba–Olympic Dam 132 kV line n/a n/a n/a Note this line is normally out of service.
Note: Table 3 contains additional outage entries compared to the Preliminary Report – Black System.
Action by ElectraNet to return lines to service was in accordance with normal outage management
practice when faced with forecasts of adverse weather conditions.
Constraint sets and constraint equations are used by the NEM dispatch engine (NEMDE) for the
secure and sustainable operation of the power system. 22F
23 Constraint equations are used to define
the mathematical restrictions translated from a physical transmission network representation.
These constraint equations may be grouped into constraint sets to simplify the constraint
management process.
As the physical transmission network configuration changes, due to planned or unplanned outages,
constraint sets may need to be changed to represent a modified mathematical model.
The constraint sets detailed in Table 4 were in place immediately prior to the Black System. 23F
24
Table 4 SA constraint sets invoked pre-event
Constraint set Date/time invoked Date/time revoked Description
S-NIL 12/10/2001 09:05 31/12/9999 00:00 Out = Nil, SA System Normal
F-MAIN_RREG_0300 28/09/2016 15:55 28/09/2016 16:50 Mainland Raise Regulation Requirement equal to 300 MW
S-WE_MWP4_RB 28/09/2016 08:10 28/09/2016 11:14 Out = Robertstown–MWP4–Waterloo East 132 kV line O/S (or any line segment(s) between Robertstown–Waterloo East 132 kV O/S)
S-MHNW_2 24/09/2016 13:30 28/09/2016 15:55 Out = Monash to North West Bend line 2
S-PA_SVC1-POD 16/09/2016 17:05 29/09/2016 11:30 Out= One Para SVC POD O/S (with associated SVC I/S)
(Note: with both Black Range Series caps I/S)
S-POR_CB6215 28/09/2016 08:00 28/09/2016 08:35 Outage = Port Lincoln 132 kV CB6215 (Note: applies for either Port Lincoln 33 kV CB 4637 OPEN or CLOSED)
I-VS_600_TEST 05/08/2016 12:00 12/12/2016 10:00 Out = NIL, Heywood VIC to SA limit of 600 MW for testing of upgraded Heywood interconnection
I-VS_650_TEST 27/09/2016 12:30 31/12/9999 00:00 Out = NIL, Heywood VIC to SA limit of 650 MW for testing of upgraded Heywood interconnection
I-VSS_820_TEST 05/08/2016 12:00 12/12/2016 10:00 Out = NIL, Heywood and Murraylink combined VIC to SA limit of 820 MW for testing of upgraded Heywood interconnection
I-VSS_870_TEST 27/09/2016 12:30 31/12/9999 00:00 Out = NIL, Heywood and Murraylink combined VIC to SA limit of 870 MW for testing of upgraded Heywood interconnection
Frequency control ancillary services (FCAS) enable AEMO to control the frequency of the power
system and ensure the system meets the frequency standards prescribed by the Reliability Panel.
23 See http://www.aemo.com.au/-/media/Files/Electricity/NEM/Security_and_Reliability/Congestion-
Information/Constraint_Formulation_Guidelines_v10_1.pdf. 24 Table 4 contains additional constraint entries, compared to those listed in the Preliminary Report – Black System Event in South Australia on 28
September 2016.
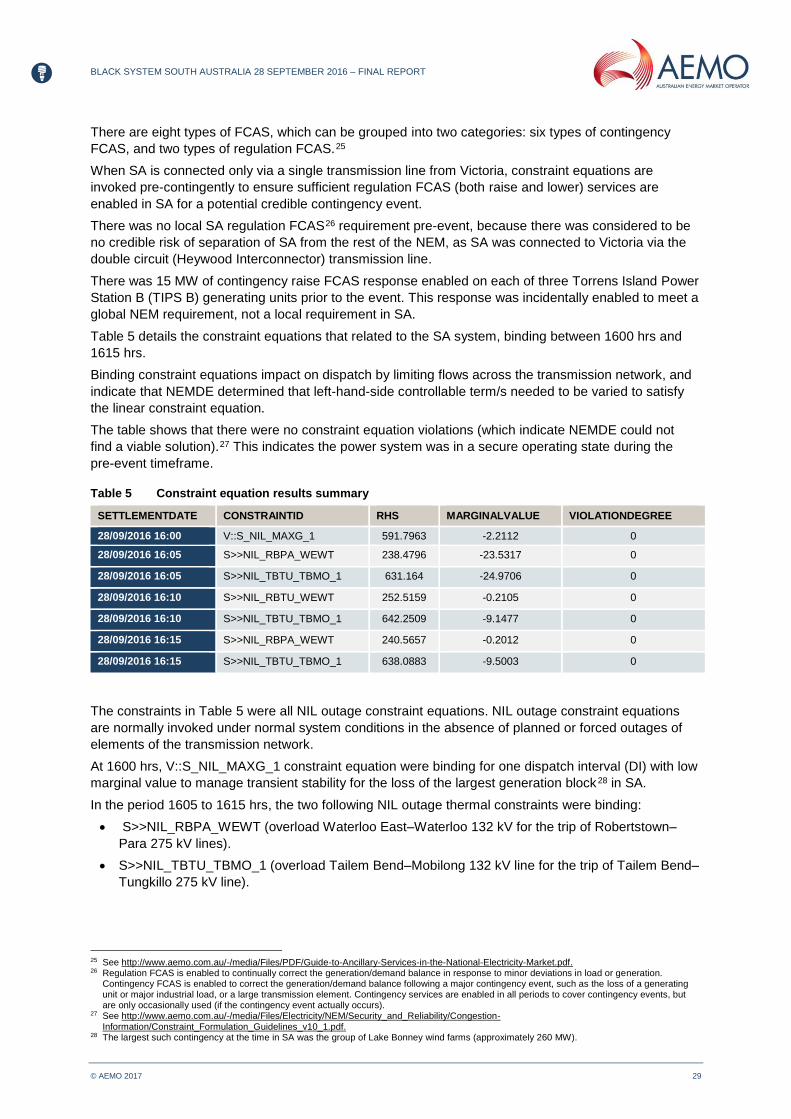
BLACK SYSTEM SOUTH AUSTRALIA 28 SEPTEMBER 2016 – FINAL REPORT
© AEMO 2017 29
There are eight types of FCAS, which can be grouped into two categories: six types of contingency
FCAS, and two types of regulation FCAS. 24F
25
When SA is connected only via a single transmission line from Victoria, constraint equations are
invoked pre-contingently to ensure sufficient regulation FCAS (both raise and lower) services are
enabled in SA for a potential credible contingency event.
There was no local SA regulation FCAS 25F
26 requirement pre-event, because there was considered to be
no credible risk of separation of SA from the rest of the NEM, as SA was connected to Victoria via the
double circuit (Heywood Interconnector) transmission line.
There was 15 MW of contingency raise FCAS response enabled on each of three Torrens Island Power
Station B (TIPS B) generating units prior to the event. This response was incidentally enabled to meet a
global NEM requirement, not a local requirement in SA.
Table 5 details the constraint equations that related to the SA system, binding between 1600 hrs and
1615 hrs.
Binding constraint equations impact on dispatch by limiting flows across the transmission network, and
indicate that NEMDE determined that left-hand-side controllable term/s needed to be varied to satisfy
the linear constraint equation.
The table shows that there were no constraint equation violations (which indicate NEMDE could not
find a viable solution).26F
27 This indicates the power system was in a secure operating state during the
pre-event timeframe.
Table 5 Constraint equation results summary
SETTLEMENTDATE CONSTRAINTID RHS MARGINALVALUE VIOLATIONDEGREE
28/09/2016 16:00 V::S_NIL_MAXG_1 591.7963 -2.2112 0
28/09/2016 16:05 S>>NIL_RBPA_WEWT 238.4796 -23.5317 0
28/09/2016 16:05 S>>NIL_TBTU_TBMO_1 631.164 -24.9706 0
28/09/2016 16:10 S>>NIL_RBTU_WEWT 252.5159 -0.2105 0
28/09/2016 16:10 S>>NIL_TBTU_TBMO_1 642.2509 -9.1477 0
28/09/2016 16:15 S>>NIL_RBPA_WEWT 240.5657 -0.2012 0
28/09/2016 16:15 S>>NIL_TBTU_TBMO_1 638.0883 -9.5003 0
The constraints in Table 5 were all NIL outage constraint equations. NIL outage constraint equations
are normally invoked under normal system conditions in the absence of planned or forced outages of
elements of the transmission network.
At 1600 hrs, V::S_NIL_MAXG_1 constraint equation were binding for one dispatch interval (DI) with low
marginal value to manage transient stability for the loss of the largest generation block 27F
28 in SA.
In the period 1605 to 1615 hrs, the two following NIL outage thermal constraints were binding:
S>>NIL_RBPA_WEWT (overload Waterloo East–Waterloo 132 kV for the trip of Robertstown–
Para 275 kV lines).
S>>NIL_TBTU_TBMO_1 (overload Tailem Bend–Mobilong 132 kV line for the trip of Tailem Bend–
Tungkillo 275 kV line).
25 See http://www.aemo.com.au/-/media/Files/PDF/Guide-to-Ancillary-Services-in-the-National-Electricity-Market.pdf. 26 Regulation FCAS is enabled to continually correct the generation/demand balance in response to minor deviations in load or generation.
Contingency FCAS is enabled to correct the generation/demand balance following a major contingency event, such as the loss of a generating unit or major industrial load, or a large transmission element. Contingency services are enabled in all periods to cover contingency events, but are only occasionally used (if the contingency event actually occurs).
27 See http://www.aemo.com.au/-/media/Files/Electricity/NEM/Security_and_Reliability/Congestion-Information/Constraint_Formulation_Guidelines_v10_1.pdf.
28 The largest such contingency at the time in SA was the group of Lake Bonney wind farms (approximately 260 MW).

BLACK SYSTEM SOUTH AUSTRALIA 28 SEPTEMBER 2016 – FINAL REPORT
© AEMO 2017 30
The behaviour of these constraints was consistent with the system conditions at that time, including
increased Hallett area wind generation and interconnector flows from Victoria flowing into the Adelaide
load centre.
For the period prior to the events covered in Chapter 3, AEMO’s real-time diagnostic tools confirmed
the power system was in a secure operating state and the operating state did not represent a threat to
power system security, based on AEMO’s procedures and NER requirements..
2.4 Transmission line faults
AEMO has reviewed all transmission line faults that occurred in SA on the day of 28 September 2016.
These are set out in Table 6.
Table 6 Transmission line faults in SA on 28 September 2016
Transmission line Out of service
In service Comment
Hummocks–Snowtown–Bungama 132 kV 10:31 10:31 Single phase fault.a Auto-reclosed.
Blyth West–Bungama 275 kV 10:35 10:35 Single phase fault. Auto-reclosed.
Blyth West–Bungama 275 kV 10:35 10:35 Single phase fault. Auto-reclosed.
Blyth West–Bungama 275 kV 10:53 10:53 Single phase fault. Auto-reclosed.
Hummocks–Snowtown–Bungama 132 kV 11:28 11:28 Single phase fault.a Auto-reclosed.
Hummocks–Snowtown–Bungama 132 kV 15:49 15:49 Single phase fault.a Auto-reclosed.
Northfield–Harrow 66 kV feeder (Distribution)
16:16:46 16:16:46 Tripped (no details). Auto-reclosed.
Brinkworth–Templers West 275 kV 16:17:33 10/10/2016 17:20 Two phase to ground fault. No auto-reclose. Damaged towers bypassed.b
Davenport–Belalie 275 kV line 16:17:59 16:18:00 Single phase fault. b Auto-reclosed.
Davenport–Belalie 275 kV line 16:18:08 10/10/2016 13:40 Single phase fault. b No auto-reclose (due to earlier fault), locked out. Damaged towers bypassed.
Davenport–Mt Lock 275 kV line 16:18:13 12/10/2016 19:15 Single phase fault. b Auto-reclosed, then locked out. Damaged towers bypassed.
Davenport–Brinkworth 275 kV line Not knownc 18/12/2016 13:38 Damaged. Did not trip prior to system shutdown. b
Port Lincoln–Yadnarie 132 kV line Not knownc Approximately 30/09/2016 21:00
Insulator damage repaired.
a Referred to as a three-phase fault in the Update Report – Black System Event in South Australia on 28 September 2016. b See Section 3.1.4 for more details. c Occurred after the Black System, hence actual time unknown.
The series of transmission line faults in the period from 1031 hrs to 1549 hrs did not pose significant
risks, because:
They involved only two transmission circuits.
Both lines successfully auto-reclosed and remained in service.
2.5 Weather – a post-event analysis
At the time of the Black System, there were severe weather conditions in SA.
A report from Weatherzone (see Appendix B), after the event, has confirmed that:
There was an “intense low pressure system” that “brought severe weather to SA” from Wednesday
28 September 2016 until early Friday 30 September 2016.
The low pressure system and associated pre-frontal trough and cold front “triggered especially
severe thunderstorms (including tornadoes)” as it crossed SA on 28 September 2016.
BLACK SYSTEM SOUTH AUSTRALIA 28 SEPTEMBER 2016 – FINAL REPORT
© AEMO 2017 31
The “complex weather system affected large parts of southern and south-eastern Australia, with
damaging to destructive winds, widespread thunderstorms, cloud to ground lightning strikes,
damaging hail, and heavy rainfall (leading to flooding) over SA in particular”.
Appendix C includes SA rain radar screen shots from the BOM.
Wind speeds (average) were forecast in the range of 50–75 km/h, while wind speeds (gusts) were
forecast in the range of 90–140 km/h.
Actual BOM weather data confirms wind speeds within the lower range of these forecasts.28F
29 The BOM
confirmed that Yunta, approximately 276 km north of Adelaide, recorded (worst case) maximum wind
speeds of 113 km/h at 1820 hrs on 28 September.29F
30 Other recorded maximum wind speed data 30F
31,
closer to the time of the Black System, indicates values around 100 km/h.31F
32 Appendix E.1 shows a
summary of forecast and worst case actual data.
The report published by the BOM32F
33 provides more details of the tornadoes that are likely to have
caused the observed damage to the transmission lines. The BOM indicated wind speeds in localised
areas exceeded the forecast of 140 km/h (gusts) and were estimated to have been at the high end of
the F2 range of 190–260 km/h. Tornado events were not forecast on this occasion.
As described in Section 2.1, AEMO’s risk assessment was made at 0830 hrs, based on forecasts of
maximum wind speeds of 120 km/h. Updated weather forecasts issued by the BOM from 1257 hrs 33F
34,
after this assessment had been made, indicated forecast wind speeds up to 140 km/h (gusts).34F
35 AEMO
did not review its 0830 hrs decision in light of these updated forecasts.
AEMO’s post-event analysis of the weather data concludes that, based on existing practices, AEMO
would not have changed its actions if it had reviewed the increase in forecast wind speeds reported
from 1257 hrs.
29 Information provided to AEMO indicates that damaged transmission lines were subjected to actual wind speeds that were much higher than
forecast. See Section 5, Impact on Power Transmission Network, page 39, BOM report, Severe thunderstorm and tornado outbreak South Australia 28 September 2016, available at: http://www.bom.gov.au/announcements/sevwx/sa/Severe_Thunderstorm_and_Tornado_Outbreak_28_September_2016.pdf/.
30 Last paragraph page 21, BOM report 2016. 31 This refers only to general maximum wind speeds and does not include the localised extreme wind speeds due to tornadoes. 32 See Appendix E.2 for actual wind speed data for Snowtown, Port Pirie, Port Augusta, and Clare. 33 See Section 4 Tornado Damage Assessment, page 22, BOM report. 34 See Appendix E.1 Forecast Weather vs Actual, Table 21. 35 BOM report 2016.

BLACK SYSTEM SOUTH AUSTRALIA 28 SEPTEMBER 2016 – FINAL REPORT
© AEMO 2017 32
3. EVENTS RESULTING IN BLACK SYSTEM
Where AEMO has completed investigations and reached conclusions since it published the previous
report in December 2016, these points are highlighted.
3.1 Sequence of events
3.1.1 Event summary
Immediately prior to the event, Supervisory Control and Data Acquisition (SCADA) data showed
that the 1,826 MW of electricity demand of SA’s 850,000 electricity customers was being collectively
supplied by:
883 MW of SA wind generation.35F
36
330 MW of SA gas generation.
613 MW of electricity imports via the two interconnections with Victoria (Heywood and Murraylink).
The total amount of domestic solar photovoltaic (PV) was estimated to be approximately 50 MW.
Extreme weather conditions resulted in five system faults on the SA transmission system in the
87 seconds between 16:16:46 and 16:18:13, with three transmission lines ultimately brought down.36F
37
Following these faults 37F
38, and the resulting six voltage disturbances 38F
39, there was a sustained reduction of
456 MW 39F
40 of wind generation to the north of Adelaide. Analysis of high speed monitoring data has
shown a further 42 MW of transient wind power reduction. This transient response is the normal
expected response of wind farms riding through the voltage disturbances.
Increased flows on the Heywood Interconnector counteracted this loss of local generation by increasing
flows from Victoria to SA. More detail on this is in Section 3.3.1.
This reduction in generation, and immediate compensating increase of imports on the Heywood
Interconnector, resulted in the activation of Heywood Interconnector’s automatic loss of synchronism
protection mechanism at South East Substation (SESS), leading to the ‘tripping’ (disconnection) of both
of the transmission circuits of the Heywood Interconnector.
As a result, approximately 900 MW of supply from Victoria over the Heywood Interconnector was
immediately lost, and the remaining generation in SA was unable to meet the SA demand.
This sudden and large deficit of supply caused the system frequency to collapse more quickly than the
SA under frequency load shedding (UFLS) scheme was able to act. Without any significant load
shedding, the large mismatch between the remaining generation and connected load led to the system
frequency collapse, and consequent Black System.
Chapter 3 examines the system faults and voltage disturbances in the period immediately prior to the
Black System and the system response during these disturbances.
3.1.2 Measured voltages
Using high speed voltage records provided by ElectraNet, AEMO has reviewed the voltage disturbance
caused by each of the faults on the transmission network. AEMO has concluded the voltage
disturbances were as would be expected for the type of powerline faults that occurred.
36 High speed monitoring data showed 850 MW. 37 From the BOM report published on 14 November 2016, AEMO concurs that the root cause of the five electrical faults that occurred before the
Black System was tornado conditions. 38 In a power system, a “fault” is a condition that causes failure of the equipment in the circuit to deliver energy as intended. In this context, it is
mainly the flow of current from a high voltage conductor to earth through an arc resulting from a lightning strike or direct contact caused by a fallen tower.
39 The difference between the number of faults and the number of voltage disturbances was due to the fact that, for one fault, there was an unsuccessful auto-reclose attempt, resulting in two voltages disturbances due to the one fault.
40 The Preliminary Report – Black System Event in South Australia on 28 September 2016 advised 315 MW of wind generation disconnected, based on data available at that time.

BLACK SYSTEM SOUTH AUSTRALIA 28 SEPTEMBER 2016 – FINAL REPORT
© AEMO 2017 33
Figure 3 shows the approximate location of the faults on the SA transmission network in relation to the
major substations in the area.
Figure 3 Map of SA transmission system showing location of faults and major terminal stations

BLACK SYSTEM SOUTH AUSTRALIA 28 SEPTEMBER 2016 – FINAL REPORT
© AEMO 2017 34
Five transmission line faults, resulting in six voltage disturbances on the network, caused sustained loss
of power from multiple generating systems. This, in turn, initiated a sequence of events that ultimately
led to the Black System. Table 7 provides more detail on each transmission line fault.
Table 7 Transmission line faults
Fault number Time Details
1 16:16:46 Fault on Northfield–Harrow 66 kV feeder in the Adelaide metropolitan area.
Trip and successful auto-reclose.
Voltage dipped to 85% at Davenport.
2 16:17:33 Two phase to ground fault on the Brinkworth–Templers West 275 kV transmission line. No reclose attempt was made as the fault was two phase to ground whereas SA 275 kV transmission system uses single phase auto-reclosing (SPAR) only.
Voltage dropped to 60% at Davenport.
3 16:17:59 Single phase to ground fault on the Davenport–Belalie 275 kV transmission line. Faulted phase successfully auto-reclosed.
Voltage dropped to 40% at Davenport.
4 16:18:08 Single phase to ground fault on the Davenport–Belalie 275 kV transmission line. No auto-reclose attempted as fault was within 30 seconds of the previous fault. Line opened on all three phases and remained out of service.
Voltage dropped to 40% at Davenport.
5
16:18:13 Single phase to ground fault on the Davenport–Mt Lock 275 kV transmission line. 40F
41
Voltage dropped to 40% at Davenport.
16:18:14 Single phase to ground fault on the Davenport–Mt Lock 275 kV transmission line due to unsuccessful auto-reclose. Fault still on line. Line opened on all three phases and remained out of service.
Voltage dropped to 40% at Davenport.
AEMO has examined the impact of these faults, as seen at Davenport, Robertstown, Para, and South
East Terminal Stations, using data from high speed monitors located at these points. This data sample
spans the whole SA transmission network except the Eyre Peninsula and the line to Olympic Dam.
Information obtained from ElectraNet’s fault recorders, and comparison against connection point
voltages for all on-line generators, indicate that all faults, including those caused by an unsuccessful
auto-reclosure, were cleared within the time settings of the appropriate primary protection systems,
which ranged from 80 to 120 milliseconds (ms).
AEMO’s analysis has confirmed the same six voltage dips were experienced at the above locations
between 16:16:46 and 16:18:14, corresponding to the faults on the network. The observed disturbances
are smaller in magnitude further from the fault location, as would be expected. Voltages near Mount
Gambier experienced the lowest deviations from their pre-event value.
The voltage levels measured at each of these locations over the period of the Black System are
illustrated in Appendix G (Figure 39 to Figure 42).
Figure 4 shows voltages measured at a number of key 275 kV points across the SA networks, as well
as the 275 kV voltage measured at Heywood in Victoria, for the period immediately before loss of the
Heywood Interconnector.
The graph shows a rapid decline in voltages across the SA network following final loss of the
Davenport–Mt Lock 275 kV line. This initial rapid decline in voltages was caused by sustained power
reduction of wind generation accumulating to 456 MW just after 16:18:15 (see Section 3.2.1).
After the Heywood Interconnector opened at 16:18:15.8, the voltage levels recovered. In fact, there
were over voltage conditions until the collapse of the electrical island within SA.
41 The Davenport–Mt Lock and Davenport–Belalie lines share common tower structures.

BLACK SYSTEM SOUTH AUSTRALIA 28 SEPTEMBER 2016 – FINAL REPORT
© AEMO 2017 35
Figure 4 275 kV voltage decline across SA prior to separation
These six voltage disturbances resulted in depression of the generating systems’ connection point
voltage for all on-line wind farms north of Adelaide. The impact of these voltage disturbances on fault
ride-through response of all on-line wind farms in SA is discussed in Section 3.2.
3.1.3 Measured frequencies
Figure 5 shows frequency measured at Robertstown in SA, and at Heywood in Victoria, in the period
immediately before loss of the Heywood interconnection.
Note that the Heywood frequency is measured at SESS, from the Heywood Terminal Station (HYTS)
line voltage transformers. These voltage transformers are on the line side of the circuit breakers (CBs)
on the HYTS to SESS lines which were opened by the loss of synchronism protection at the time of
separation, and thus were connected to Victoria post-separation.
Figure 5 shows a separation in the measured frequency between the two areas in the period
immediately prior to loss of the Heywood Interconnector. This is caused by the growing angular
difference between the respective voltage phase angles, which also confirms the loss of synchronism
between the SA power system and the remainder of the NEM.

BLACK SYSTEM SOUTH AUSTRALIA 28 SEPTEMBER 2016 – FINAL REPORT
© AEMO 2017 36
Figure 5 SA frequency compared to Victoria during event
SA’s UFLS scheme is designed to quickly rebalance supply and demand, following any separation from
Victoria which leaves SA short of supply.
It triggers in stages, and starts when frequency falls below 49 hertz (Hz). In each stage of load
shedding, as soon as frequency drops below a certain value, a pre-determined percentage of the load
allocated for load shedding will be disconnected after a pre-determined time delay. It is designed such
that all load available to the UFLS scheme will be shed by the time frequency declines to 47.5 Hz.
Clause 4.3.5 of the NER requires that at least 60% of customer demand for connection points over
10 MW is available for UFLS.
On 28 September 2016, the UFLS scheme did not trigger prior to the loss of the Heywood
Interconnector, as the frequency remained above the 49 Hz trigger level.
Upon loss of the Heywood Interconnector, Figure 6 indicates that the rapid Rate of Change of
Frequency (RoCoF) experienced in SA was too great for the UFLS to stop the fall in frequency.
Effectively, the time taken for the frequency to suddenly drop from 49 Hz to below 47 Hz was too fast
considering various time delays involved in operation of this scheme.
All UFLS load blocks in SA have a total measurement and operating delay varying between 150 and
250 ms. This delay varies depending on the type of relay used, the number of CBs that need to be
disconnected, and the voltage level to which the CB is connected (lower voltage CBs have longer
opening time).
Following the sustained reduction of 456 MW of wind generation, frequency started to decline until
16:18:15.8 when the system separation occurred. At this point, a frequency nadir between 47 Hz and
48 Hz was observed in most SA nodes. Immediately after the separation, a momentary frequency
rebound reaching 49.2 Hz was experienced.

BLACK SYSTEM SOUTH AUSTRALIA 28 SEPTEMBER 2016 – FINAL REPORT
© AEMO 2017 37
Figure 6 Frequency and ROCOF in various SA nodes immediately before the system separation
It is not clear whether these frequency measurements are a true reflection of power system frequency,
or a transient frequency measurement or calculation issue, given the large and almost step changes in
voltage phase angles in SA following separation (see Figure 13). These sudden angle changes, along
with rapid changes in load due to possible operation of the UFLS scheme, may result in short-term
inaccuracies in frequency measurements.
The key reason for the frequency collapse was that, in the absence of any substantial load shedding,
the remaining synchronous generators and wind farms were unable to maintain the islanded
system frequency.
The frequency in various SA nodes therefore fell rapidly following loss of the Heywood Interconnector,
dropping below 47 Hz in most parts of the SA island. This is the lower bound of the extreme frequency
excursion tolerance limits nominated in the frequency operating standards determined by the Reliability
Panel. Generators are not required to operate outside the extreme frequency excursion tolerance limits.
In summary, there was a rapid fall in frequency in the SA region following separation. The RoCoF was
too great for the UFLS scheme to operate effectively. The frequency fell below 47 Hz and the remaining
generation in SA tripped as would be expected. Even if the RoCoF had been low enough to allow the
UFLS to operate as designed, resulting in 60% of SA load being shed before the frequency reached
47.0Hz, the remaining load of approximately 800 MW may still have been too great for the remaining
generation41F
42 to maintain the islanded system frequency.
3.1.4 Cause of electrical faults
Lightning strikes
Close inspection of lightning strike data for various locations in the mid-north and northern parts of SA
during the five electrical faults indicates low levels of lightning strikes for most locations except Melrose.
42 The remaining generation comprised three TIPS B units, two Ladbroke Grove units, Canunda, Lake Bonney, and Waterloo Wind Farms, and
import from Murraylink. Given large oscillations in active power responses of the generating systems, it is not practical to quote fixed MW figures for these generating systems after system separation. Additionally, reduced system strength caused by system separation raises a question as to whether or not these wind farms would have remained connected (see Section 3.5.2 for details on the definition of SCR and the need for the available fault level in the system to exceed the minimum SCR withstand capability of wind turbines, as confirmed by each original equipment manufacturer to AEMO).
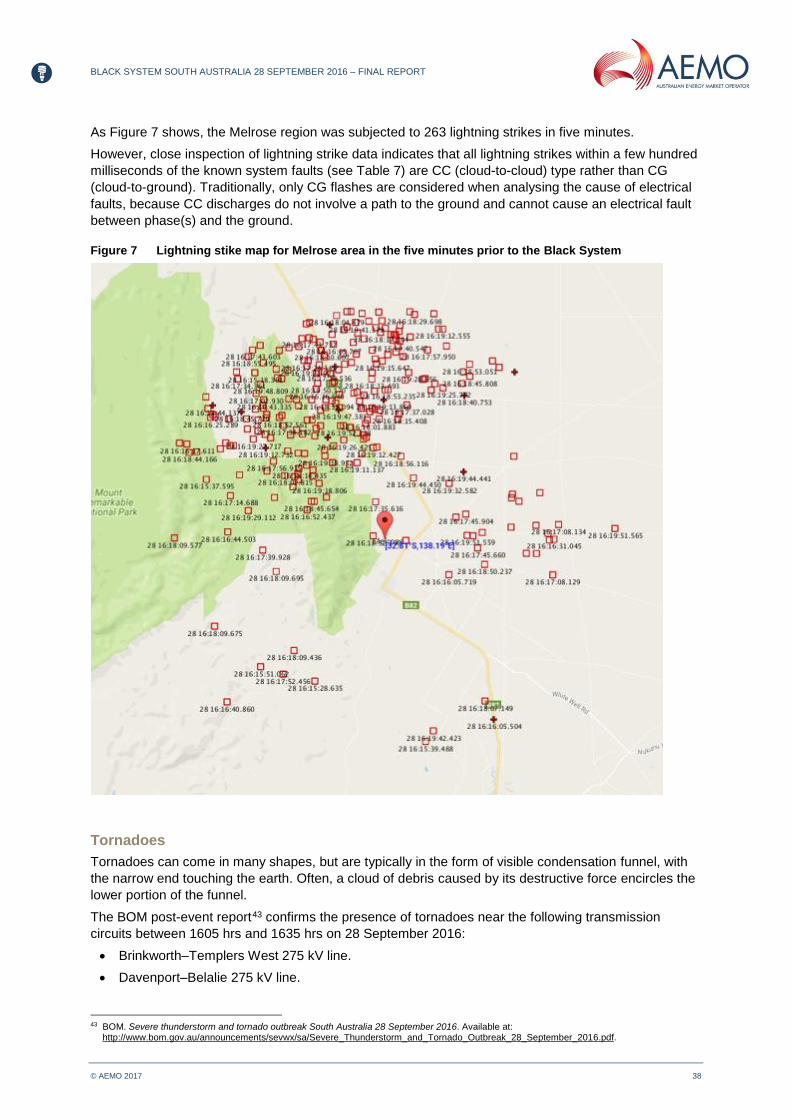
BLACK SYSTEM SOUTH AUSTRALIA 28 SEPTEMBER 2016 – FINAL REPORT
© AEMO 2017 38
As Figure 7 shows, the Melrose region was subjected to 263 lightning strikes in five minutes.
However, close inspection of lightning strike data indicates that all lightning strikes within a few hundred
milliseconds of the known system faults (see Table 7) are CC (cloud-to-cloud) type rather than CG
(cloud-to-ground). Traditionally, only CG flashes are considered when analysing the cause of electrical
faults, because CC discharges do not involve a path to the ground and cannot cause an electrical fault
between phase(s) and the ground.
Figure 7 Lightning stike map for Melrose area in the five minutes prior to the Black System
Tornadoes
Tornadoes can come in many shapes, but are typically in the form of visible condensation funnel, with
the narrow end touching the earth. Often, a cloud of debris caused by its destructive force encircles the
lower portion of the funnel.
The BOM post-event report 42F
43 confirms the presence of tornadoes near the following transmission
circuits between 1605 hrs and 1635 hrs on 28 September 2016:
Brinkworth–Templers West 275 kV line.
Davenport–Belalie 275 kV line.
43 BOM. Severe thunderstorm and tornado outbreak South Australia 28 September 2016. Available at:
http://www.bom.gov.au/announcements/sevwx/sa/Severe_Thunderstorm_and_Tornado_Outbreak_28_September_2016.pdf.

BLACK SYSTEM SOUTH AUSTRALIA 28 SEPTEMBER 2016 – FINAL REPORT
© AEMO 2017 39
Davenport–Mt Lock 275 kV line.
This information corroborates the conclusion that tornadoes were the cause of the five electrical faults
that occurred before the system separation, due to either the associated high rotating winds or clouds of
debris causing damage to towers or conductors to clash.
The BOM, however, does not suggest a tornado as the cause of the Davenport–Brinkworth 275 kV line
outage that occurred after the Black System. It suggests those towers were impacted by a severe
downdraft within minutes of the Black System.
The wind speeds involved, as estimated in the BOM report, were well in excess of the design rating of
these transmission lines (see Appendix V).
General high wind speeds
During this period, the highest recorded wind gust was 104 km/h, which was measured at the
Snowtown weather station at 1538 hrs. In its report, however, the BOM indicates wind strengths ranging
from 190 to 260 km/h in localised areas and evidence of tornadoes. 43F
44
The cause of transmission network faults immediately prior to the Black System can be attributed to
transmission equipment damage caused by localised tornadoes.
3.2 SA Generator performance
Where AEMO has completed investigations and reached conclusions since publishing its previous
report in December 2016, these points are highlighted.
3.2.1 Wind farms
Wind turbine fault ride-through capability
Wind turbines are designed so that when a low voltage is detected at their terminals, the normal
steady-state control is suspended and a sequence of actions is initiated by the turbine control systems,
referred to as fault ‘ride-through’ mode. The purpose is for the wind turbine to remain connected to the
grid and provide support to the voltage recovery at the point of connection.
Wind turbine control systems are set to provide a fault ride-through response when voltage dips to
below 80% to 90% of normal voltage, as seen at the turbines’ voltage terminals. This applies to all wind
turbines installed in SA.44F
45
In response to exactly the same voltage dips, wind turbines with a higher low-voltage ride-through
(LVRT) activation threshold, such as 90%, activate fault ride-through mode more often than wind
turbines with a lower LVRT activation threshold. For example, for voltage dips of 15%, 20%, and 25%, a
wind turbine with LVRT activation threshold of 90% would activate fault ride-through mode three times,
while another wind turbine with LVRT activation threshold of 80% would activate fault ride-through
mode twice only.
The size of the voltage dips observed by SA wind turbines on-line at the time of the event was sufficient
for ten of the thirteen on-line wind farms to activate their fault ride-through mode. Depending on the
wind farm, this mode of turbine operation was activated between three and six times.
Figure 8 shows an example of LVRT withstand capability of a commercial wind turbine installed in SA.
This wind turbine will ride through faults when the combination of residual voltage and fault duration is
above the black line:
For example, this turbine can ride through a fault with a residual voltage of 5% for 300 ms. If the
fault lasts for longer than 300 ms at 5% residual voltage, the turbine will disconnect. Equally, if the
fault has a residual voltage less than 5% at any time, the turbine will disconnect.
44 Information on wind speeds updated from that in third report to reflect detailed information from BoM 45 Similar fault ride-through design applies to most other power electronic technologies, such as solar inverters, High Voltage Direct Current (HVDC)
links, Static Compensators (STATCOMs), and other power electronic devices that interact with the power system. More traditional power system assets, such as synchronous generators, achieve ride-through based on their physical properties rather than power electronics with software controls.
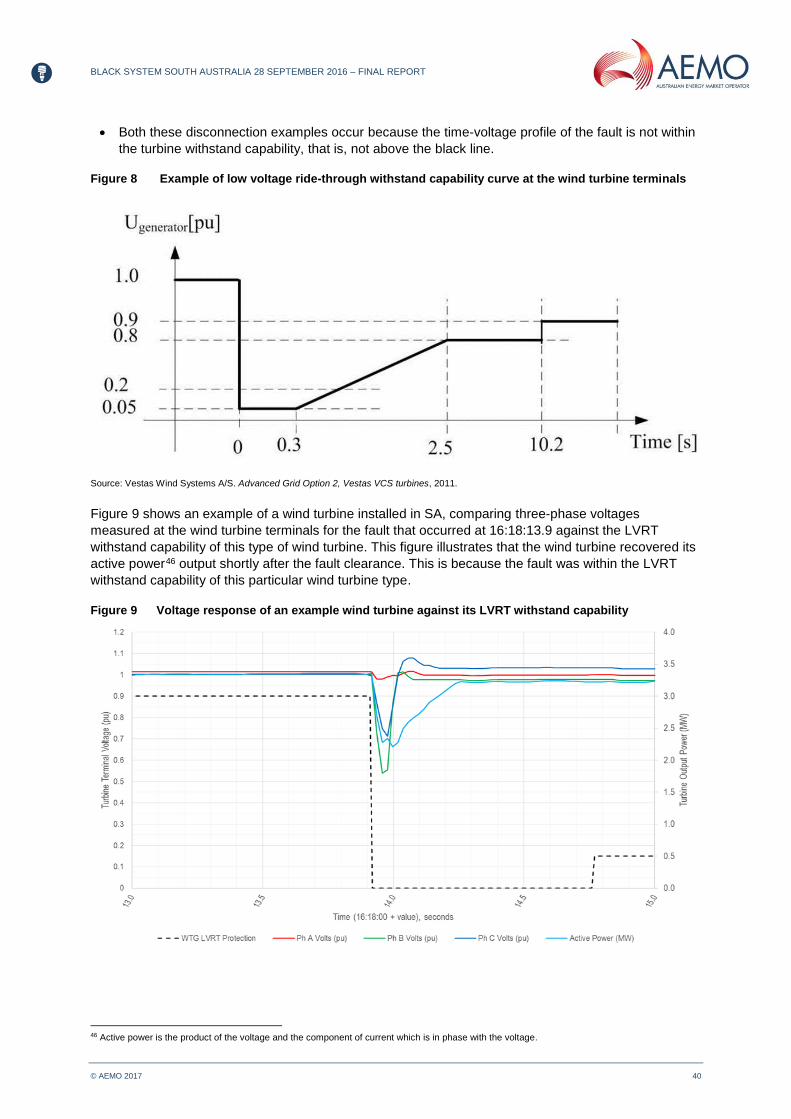
BLACK SYSTEM SOUTH AUSTRALIA 28 SEPTEMBER 2016 – FINAL REPORT
© AEMO 2017 40
Both these disconnection examples occur because the time-voltage profile of the fault is not within
the turbine withstand capability, that is, not above the black line.
Figure 8 Example of low voltage ride-through withstand capability curve at the wind turbine terminals
Source: Vestas Wind Systems A/S. Advanced Grid Option 2, Vestas VCS turbines, 2011.
Figure 9 shows an example of a wind turbine installed in SA, comparing three-phase voltages
measured at the wind turbine terminals for the fault that occurred at 16:18:13.9 against the LVRT
withstand capability of this type of wind turbine. This figure illustrates that the wind turbine recovered its
active power 45F
46 output shortly after the fault clearance. This is because the fault was within the LVRT
withstand capability of this particular wind turbine type.
Figure 9 Voltage response of an example wind turbine against its LVRT withstand capability
46 Active power is the product of the voltage and the component of current which is in phase with the voltage.
BLACK SYSTEM SOUTH AUSTRALIA 28 SEPTEMBER 2016 – FINAL REPORT
© AEMO 2017 41
Similar trends can be observed on all other wind turbines, whereby the voltage dips were within their
LVRT withstand capability.
All wind turbines successfully rode through faults until the pre-set protection limit applied to most on-line
wind turbines was reached or exceeded. This will be further discussed in this sub-section.
Relation to connection studies and commissioning tests
The following applies when a Generator seeks connection to the grid.
Model assessment and due diligence studies
Following negotiation of suitable performance standards between the connection applicant and the
connecting NSP, with AEMO’s input where required by the NER, AEMO conducts a due diligence
review of the capability of a generating system to meet its performance standards.
To make this assessment, AEMO uses power system simulation software, together with computer
models of the generating system provided by the applicant. The requirements for generating system
models are specified in AEMO’s Generating System Model Guidelines.46F
47
In this assessment, AEMO reviews any technical studies presented by the connection applicant and/or
the connecting NSP, and conducts its own studies.
AEMO will generally select a subset of scenarios to consider, covering the extremes of power system
loading and generation dispatch and fault severity. The faults studied are typically those that will have
the greatest impact (lowest system voltage at connection point) and the longest clearing time.
Historically, the greatest issue with fault ride-through capability has related to transient stability, which is
highly dependent on these factors.
Commissioning and compliance testing
A Generator seeking connection is responsible for demonstrating the compliance of each of its
generating systems with its performance standards and for demonstrating the accuracy of models via
R247F
48 model validation, as specified in clause S5.5.2 of the NER.
As part of the initial commissioning and compliance regime, AEMO will review the Generator’s
commissioning test results as well as model validation results. Generating system models are only
accepted as R2 (registered) data after the Generator has demonstrated the model satisfies the
accuracy requirements of the Generating System Model Guidelines.
For some criteria defined in the generator performance standards, direct testing is not practicable.
Testing of fault ride-through requirements involves the application of a network fault. While this method
has been used in rare circumstances, it is not typical, because it places network security, reliability, and
plant integrity at risk.
The primary means of testing compliance against fault ride-through requirements set out in NER
S5.2.5.5 has been through long-term event monitoring. Measured responses captured through
long-term monitoring are then compared against simulated responses, to:
Ensure the veracity of results obtained from simulation models.
Confirm that associated generator performance standards can be met or exceeded in practice.
Derive validated R2 models.
Like other types of generating systems, wind farms demonstrate compliance with relevant generator
performance standards requirements through their performance during network faults over time.48F
49
Non-compliance may be identified by Generators, AEMO, or network service providers, and can be
47 Available at https://www.aemo.com.au/Electricity/National-Electricity-Market-NEM/Network-connections/-
/media/B468B9355D4249C2A0BF55C44971B08C.ashx. 48 R2 is registered data on generating plant which is obtained from on-system testing after the connection of the generator to the power system. 49 A common practice applied in Europe for assessing fault ride-through capability of actual wind turbines is container tests, which subject a single
wind turbine in isolation to a number of defined fault scenarios as required for certification of wind turbine models in certain countries. Some of the factors relating to actual network faults, such as fault impedance, system strength, and impact of nearby power system equipment, cannot always be adequately accounted for. In addition, AEMO understands that these types of tests have not been previously used for application of multiple faults in quick succession, like six voltage disturbances within two minutes, and would need modifications to the standard set-up.

BLACK SYSTEM SOUTH AUSTRALIA 28 SEPTEMBER 2016 – FINAL REPORT
© AEMO 2017 42
reported and resolved via the performance standards compliance process set out in clauses 4.15(f),
4.15(g) and 5.8.5(d) of the NER.
The end-to-end generator connection assessment described above highlights the process applied by
AEMO and relevant NSPs to ensure fault ride-through capability of the generating system. Salient
activities conducted in this process include:
Confirmation of the compatibility and authentication of simulation models submitted to AEMO.
Due diligence studies to confirm relevant clauses in generator performance standard as proposed
by the Generator.
Commissioning tests and long-term monitoring to demonstrate the ability to meet relevant clauses
on the actual installed plant and validate the simulation models.
AEMO’s awareness of ride-through capability for multiple successive faults
The event has revealed that many wind farms in the NEM have a protection feature that takes action if
the number of ride-through events in a specific period exceeds a pre-set limit. Each wind turbine then
either disconnects from the network, stops operating (remains connected with zero output), or reduces
its output.
AEMO was unaware of this protection feature before the Black System event, for the following reasons:
This protection feature is not represented in the simulation models submitted to AEMO for any of
the affected wind farms. AEMO is also unaware of this feature in any other wind turbine simulation
models it has received. Accordingly, simulations of wind farm performance using the wind farm
models currently available to AEMO would not display disconnection or offloading in response to a
large number of faults in quick succession.
Performance with respect to fault ride-through capability is generally assessed based on recorded
network fault event analysis. No previous examples of repeated fault ride-through issues with wind
farms have been reported to AEMO.49F
50 Additionally, AEMO is not aware of any reported instances
of this phenomenon internationally.
Response of on-line wind farms
Summary
The size of the voltage dips observed by SA wind turbines on-line at the time of the event was sufficient
for ten of the thirteen wind farms on-line to activate their fault ride-through function.
Depending on the wind farm, this mode of turbine operation was activated between three and six times,
as shown in Table 8.
Of the 13 wind farms on-line prior to the event, four remained in service: Canunda, Lake Bonney 1,
Lake Bonney 2 & 3 50 F
51, and Waterloo. Of these, only one (Waterloo) initiated ride-through mode multiple
times, but it remained in service because it was set to a limit of more than six ride-through events.
The size of the voltage dips for wind farms connected to the south-east part of SA, such as Lake
Bonney and Canunda Wind Farms, was not as large as the voltage dips observed at Davenport. Wind
turbines in the south-east initiated fault ride-through mode either once, at around 16:18:15, or not at all.
50 AEMO can be made aware of any unexpected behaviour regarding fault ride-through by a number of means including:
Long-term monitoring and network fault event data provided by wind farms to: - Demonstrate wind farm compliance with respect to pertinent clauses in their generator performance standards as required in their
performance monitoring plans. - Validate wind farm models (R2).
Notices of non-compliance, to be submitted by wind farm owners as soon as identified, under clauses 4.15 (f), 4.15 (g) and 5.8.5 (d) of the NER.
AEMO’s investigation of historical events resulting in loss of multiple circuits and the extent to which they resulted in multiple successive faults being imposed on any wind farms.
51 Lake Bonney Wind Farms 2 and 3 are counted as a single wind farm, since they connect to the transmission network at a single point.
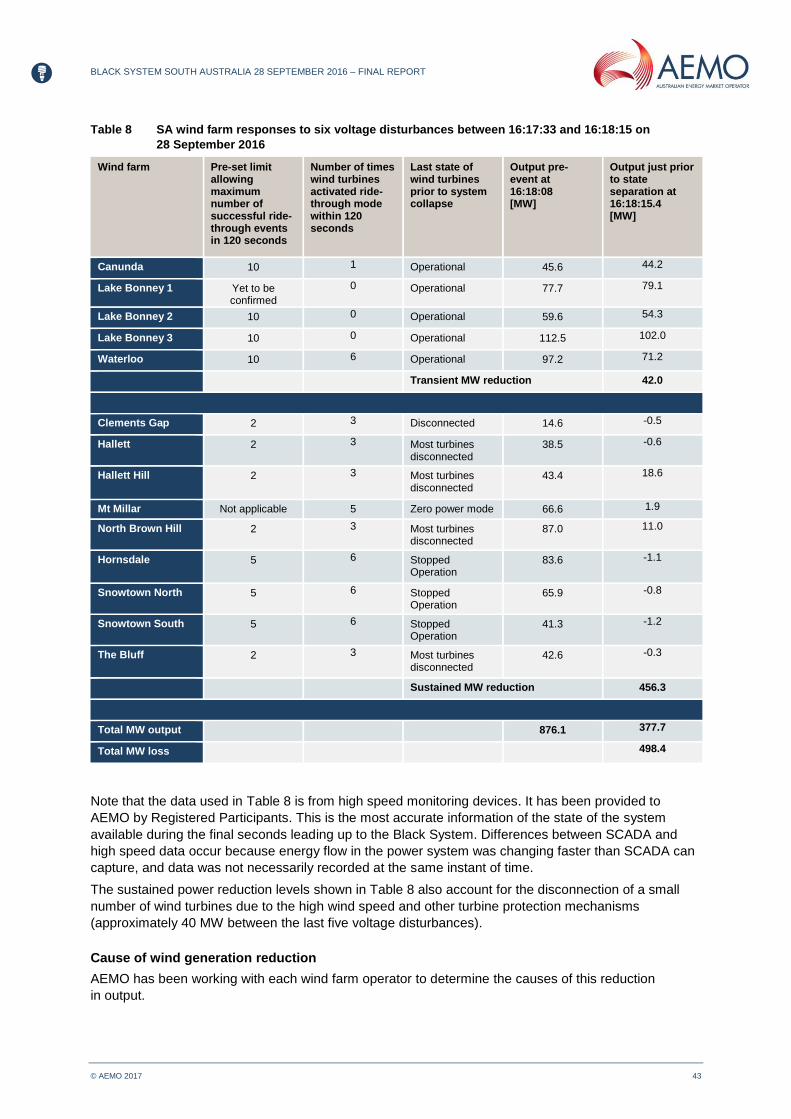
BLACK SYSTEM SOUTH AUSTRALIA 28 SEPTEMBER 2016 – FINAL REPORT
© AEMO 2017 43
Table 8 SA wind farm responses to six voltage disturbances between 16:17:33 and 16:18:15 on
28 September 2016
Wind farm Pre-set limit allowing maximum number of successful ride-through events in 120 seconds
Number of times wind turbines activated ride-through mode within 120 seconds
Last state of wind turbines prior to system collapse
Output pre-event at 16:18:08 [MW]
Output just prior to state separation at 16:18:15.4 [MW]
Canunda 10 1 Operational 45.6 44.2
Lake Bonney 1 Yet to be confirmed
0 Operational 77.7 79.1
Lake Bonney 2 10 0 Operational 59.6 54.3
Lake Bonney 3 10 0 Operational 112.5 102.0
Waterloo 10 6 Operational 97.2 71.2
Transient MW reduction 42.0
Clements Gap 2 3 Disconnected 14.6 -0.5
Hallett 2 3 Most turbines disconnected
38.5 -0.6
Hallett Hill 2 3 Most turbines disconnected
43.4 18.6
Mt Millar Not applicable 5 Zero power mode 66.6 1.9
North Brown Hill 2 3 Most turbines disconnected
87.0 11.0
Hornsdale 5 6 Stopped Operation
83.6 -1.1
Snowtown North 5 6 Stopped Operation
65.9 -0.8
Snowtown South 5 6 Stopped Operation
41.3 -1.2
The Bluff 2 3 Most turbines disconnected
42.6 -0.3
Sustained MW reduction 456.3
Total MW output 876.1 377.7
Total MW loss
498.4
Note that the data used in Table 8 is from high speed monitoring devices. It has been provided to
AEMO by Registered Participants. This is the most accurate information of the state of the system
available during the final seconds leading up to the Black System. Differences between SCADA and
high speed data occur because energy flow in the power system was changing faster than SCADA can
capture, and data was not necessarily recorded at the same instant of time.
The sustained power reduction levels shown in Table 8 also account for the disconnection of a small
number of wind turbines due to the high wind speed and other turbine protection mechanisms
(approximately 40 MW between the last five voltage disturbances).
Cause of wind generation reduction
AEMO has been working with each wind farm operator to determine the causes of this reduction
in output.

BLACK SYSTEM SOUTH AUSTRALIA 28 SEPTEMBER 2016 – FINAL REPORT
© AEMO 2017 44
To illustrate the output reductions, the wind farms have been grouped together as shown in Table 9.
Table 9 SA wind farms on-line in SA on 28 September 2016
From information made available to date by wind farm operators and turbine manufacturers, AEMO has
concluded the following about each group.
Groups A and B
Nine wind farms exhibited sustained power reduction during the six voltage disturbances on the
transmission system, out of which eight wind farms are categorised as Groups A and B in this report.
Groups A and B wind turbines have a protection system that takes action if the number of ride-through
events in a specific period exceeds a pre-set limit:
If the pre-set limit was exceeded in the event, each wind turbine either disconnected from the
network, stopped operating (remained connected with zero output), or reduced its output.
The pre-set limit varied from wind farm to wind farm, and the six voltage disturbances exceeded
this limit in some cases.
This protection system caused eight wind farms to reduce output when the number of ride-through
events caused by voltage disturbances exceeded the pre-set limits.
Group C
The one wind farm in Group C exhibited sustained power reduction during the six voltage disturbances
on the transmission system.
The operating philosophy of Group C wind turbines differs from all other wind turbines. When a system
disturbance occurs which causes the AC voltage at the wind turbine terminals to fall below 0.8 per unit
(pu), the power electronic converter used in the wind turbine is blocked about 40 ms later. The current
supply to the grid is therefore forced to zero (P = Q = 0) referred to as the “zero power mode” of
operation.
The process of unblocking the power electronics and restoring power output from the wind turbine
commences if the generating unit’s low voltage terminal voltage recovers to a pre-set level of 0.8 pu.
Current ramping to the pre-disturbance value commences at an approximately fixed rate about 100 ms
after the voltage recovers. The ramp rate to increase the current from zero to its rated value is
8 megawatts per second (MW/s). During and immediately following the clearance of the fault, no current
is supplied by the wind turbine.
AEMO therefore concludes that the sustained power reduction by Group C wind turbines was caused
by zero power mode fault ride-through response and slow active power recovery of 8 MW/s. However, it
must be recognised the single line connecting this wind farm to the grid was damaged in the storm.
Group D
In addition to the 456 MW sustained power reduction by nine wind farms during the six successive
voltage disturbances, a further reduction of 42 MW of wind power was observed at 16:18:15.4 (the
onset of rapid voltage decline). This was caused by the natural response of those remaining wind farms
(Group D) that activated their fault ride-through mode.
While Group D wind farms successfully rode through the faults, they did not recover to the
pre-disturbance output power level immediately and took several hundred milliseconds to recover. This
Wind farm – ‘Grouping’ Wind farms
Group A Hallett, Hallett Hill, The Bluff, North Brown Hill, Clements Gap
Group B Hornsdale, Snowtown North and South (collectively referred to as Snowtown 2 Wind Farm)
Group C Mt. Millar
Group D Lake Bonney 1, 2, 3, Canunda, Waterloo
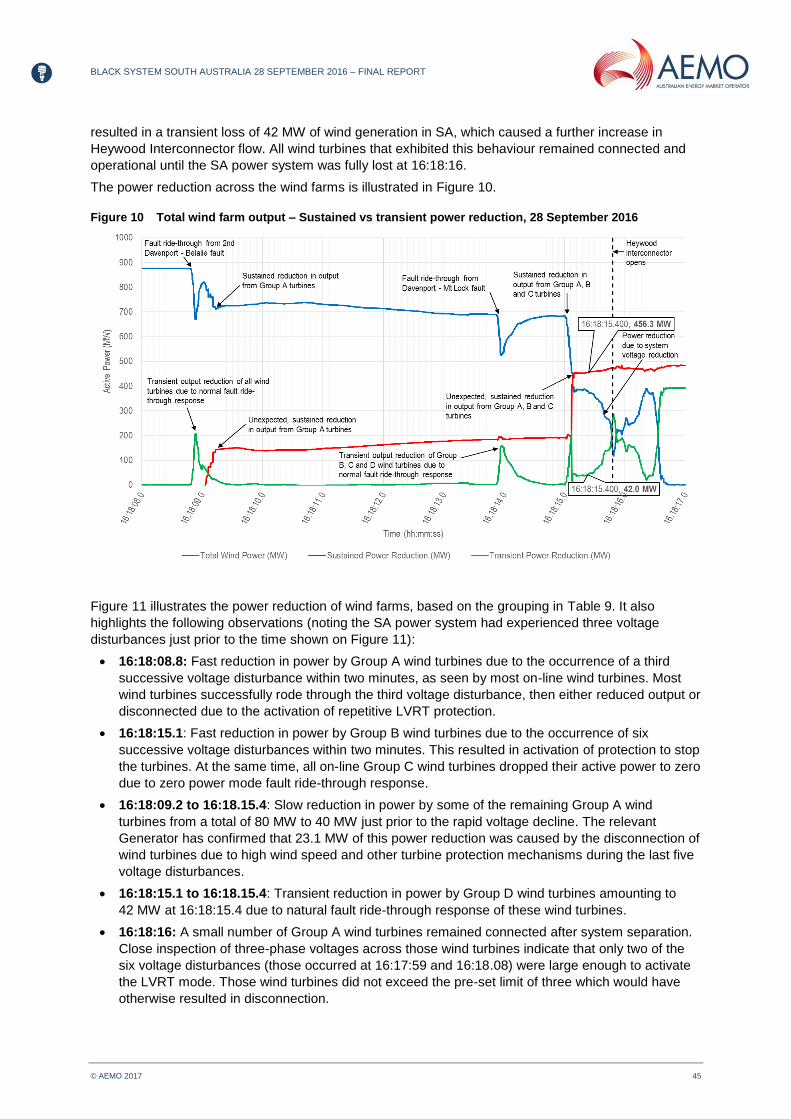
BLACK SYSTEM SOUTH AUSTRALIA 28 SEPTEMBER 2016 – FINAL REPORT
© AEMO 2017 45
resulted in a transient loss of 42 MW of wind generation in SA, which caused a further increase in
Heywood Interconnector flow. All wind turbines that exhibited this behaviour remained connected and
operational until the SA power system was fully lost at 16:18:16.
The power reduction across the wind farms is illustrated in Figure 10.
Figure 10 Total wind farm output – Sustained vs transient power reduction, 28 September 2016
Figure 11 illustrates the power reduction of wind farms, based on the grouping in Table 9. It also
highlights the following observations (noting the SA power system had experienced three voltage
disturbances just prior to the time shown on Figure 11):
16:18:08.8: Fast reduction in power by Group A wind turbines due to the occurrence of a third
successive voltage disturbance within two minutes, as seen by most on-line wind turbines. Most
wind turbines successfully rode through the third voltage disturbance, then either reduced output or
disconnected due to the activation of repetitive LVRT protection.
16:18:15.1: Fast reduction in power by Group B wind turbines due to the occurrence of six
successive voltage disturbances within two minutes. This resulted in activation of protection to stop
the turbines. At the same time, all on-line Group C wind turbines dropped their active power to zero
due to zero power mode fault ride-through response.
16:18:09.2 to 16:18.15.4: Slow reduction in power by some of the remaining Group A wind
turbines from a total of 80 MW to 40 MW just prior to the rapid voltage decline. The relevant
Generator has confirmed that 23.1 MW of this power reduction was caused by the disconnection of
wind turbines due to high wind speed and other turbine protection mechanisms during the last five
voltage disturbances.
16:18:15.1 to 16:18.15.4: Transient reduction in power by Group D wind turbines amounting to
42 MW at 16:18:15.4 due to natural fault ride-through response of these wind turbines.
16:18:16: A small number of Group A wind turbines remained connected after system separation.
Close inspection of three-phase voltages across those wind turbines indicate that only two of the
six voltage disturbances (those occurred at 16:17:59 and 16:18.08) were large enough to activate
the LVRT mode. Those wind turbines did not exceed the pre-set limit of three which would have
otherwise resulted in disconnection.
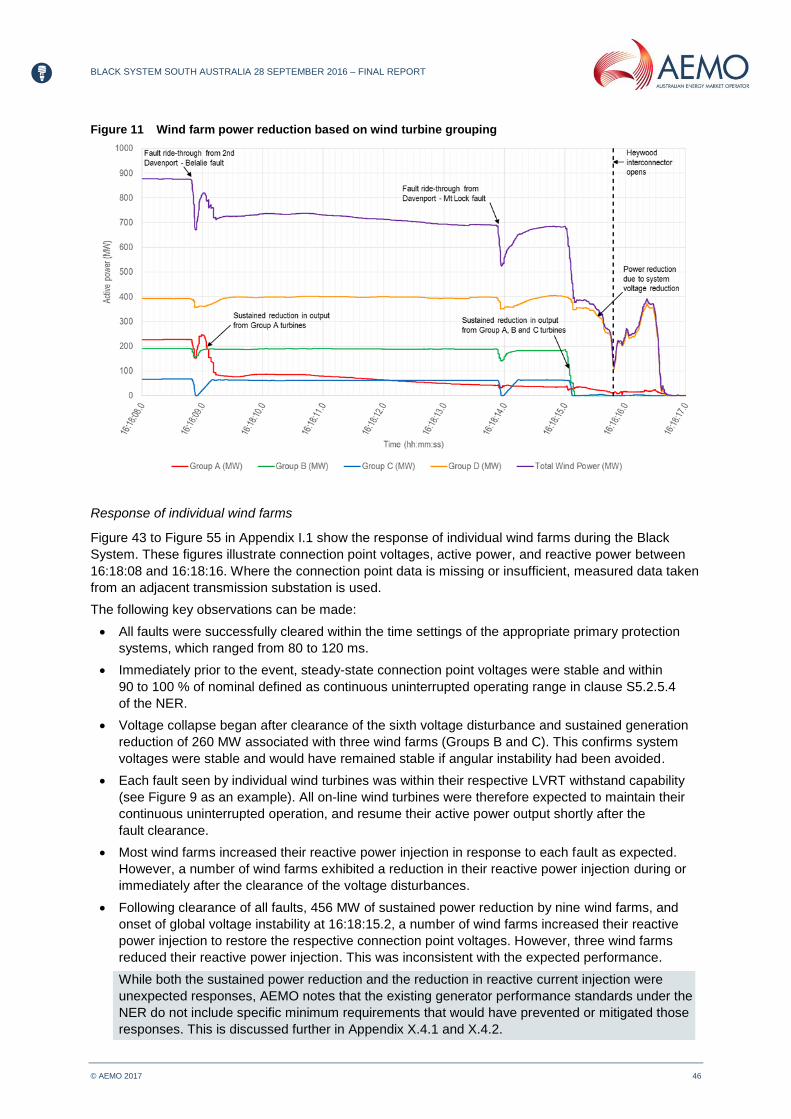
BLACK SYSTEM SOUTH AUSTRALIA 28 SEPTEMBER 2016 – FINAL REPORT
© AEMO 2017 46
Figure 11 Wind farm power reduction based on wind turbine grouping
Response of individual wind farms
Figure 43 to Figure 55 in Appendix I.1 show the response of individual wind farms during the Black
System. These figures illustrate connection point voltages, active power, and reactive power between
16:18:08 and 16:18:16. Where the connection point data is missing or insufficient, measured data taken
from an adjacent transmission substation is used.
The following key observations can be made:
All faults were successfully cleared within the time settings of the appropriate primary protection
systems, which ranged from 80 to 120 ms.
Immediately prior to the event, steady-state connection point voltages were stable and within
90 to 100 % of nominal defined as continuous uninterrupted operating range in clause S5.2.5.4
of the NER.
Voltage collapse began after clearance of the sixth voltage disturbance and sustained generation
reduction of 260 MW associated with three wind farms (Groups B and C). This confirms system
voltages were stable and would have remained stable if angular instability had been avoided.
Each fault seen by individual wind turbines was within their respective LVRT withstand capability
(see Figure 9 as an example). All on-line wind turbines were therefore expected to maintain their
continuous uninterrupted operation, and resume their active power output shortly after the
fault clearance.
Most wind farms increased their reactive power injection in response to each fault as expected.
However, a number of wind farms exhibited a reduction in their reactive power injection during or
immediately after the clearance of the voltage disturbances.
Following clearance of all faults, 456 MW of sustained power reduction by nine wind farms, and
onset of global voltage instability at 16:18:15.2, a number of wind farms increased their reactive
power injection to restore the respective connection point voltages. However, three wind farms
reduced their reactive power injection. This was inconsistent with the expected performance.
While both the sustained power reduction and the reduction in reactive current injection were
unexpected responses, AEMO notes that the existing generator performance standards under the
NER do not include specific minimum requirements that would have prevented or mitigated those
responses. This is discussed further in Appendix X.4.1 and X.4.2.

BLACK SYSTEM SOUTH AUSTRALIA 28 SEPTEMBER 2016 – FINAL REPORT
© AEMO 2017 47
Of the 14 on-line wind farms, 10 utilise dynamic reactive power support plant in the form of static
compensators (STATCOMs).
AEMO investigated the response of these devices in detail (see Appendix X.4.2), and has
concluded that unexpected measured responses were attributed to the reverse polarity of current
measurement devices at one of the wind farms. This has since been rectified by the relevant
Generator.
In summary, each individual fault was consistent with the historical network faults on the SA
transmission network, which wind farms are expected to ride through. Following clearance of each fault,
connection point voltage for each on-line wind farm returned to the range for which continuous
uninterrupted operation is required.
All on-line wind farms successfully rode through faults, until a pre-set limit which allows a maximum
number of successful ride-through events was reached or exceeded. This resulted in sustained power
reduction by Group A and B wind farms. The system-wide voltage instability commenced after
sustained power reduction of 456 MW by nine wind farms.
Impact of wind intermittency and excessive wind speed
The most well-known characteristic of wind power, variation of output with wind strength (often termed
‘intermittency’), was not a material factor in the events immediately prior to the Black System.
Other potential causes for the sustained power reduction have been subject to analysis by AEMO,
including wind turbine disconnection due to excessive wind speed.
Typically, wind turbines exhibit a protective behaviour whereby they shut down to protect themselves
from excessive mechanical stress in high winds, typically 90 km/h or more. Of the 456 MW sustained
power reduction by nine wind farms, approximately 35 MW of wind generation was disconnected due to
excessive wind speed during the last five voltage disturbances.
This was not a material contributor to the event, as shown in Appendix M.2, which discusses a scenario
where wind farms did not reduce output power due to the multiple voltage disturbances, but assumes a
loss of 200 MW of wind generation due to high wind speeds immediately afterwards. Simulation studies
carried out by AEMO demonstrate that the SA power system would have remained stable and
interconnected under these conditions.
Subsequent measures taken by Generators in SA
Based on information provided to AEMO by SA Generators and respective wind turbine manufacturers
following the Black System, AEMO understands the purpose of the protection settings, with respect to
the number of successive faults for which fault ride-through mode is activated, is to both:
Avoid excessive stress and fatigue on turbine mechanical drive train, tower, and so on.
Account for the cooling cycle and thermal capacity of dump resistors included in modern wind
turbines for enhanced fault ride-through capability.
Additional factors which determine the number of successive faults that can be ridden through are the
fault duration and size of voltage dip for each fault. For example, a given wind turbine may be designed
to withstand 10 faults, each lasting up to 200 ms, with a maximum voltage drop of 20% each.
Generators involved advised that these protection settings can be increased to some extent without
compromising the integrity and lifetime of the electrical and mechanical components in the wind turbine.
AEMO permitted the impacted Generators to implement the proposed new settings on-site, enabling
successful ride-through for a larger number of successive faults. These Generators subsequently
amended these protection settings.
One Generator confirmed that its turbines have a similar protection function, but it was not operating at
the time of the incident. This Generator has also amended its settings for this function.
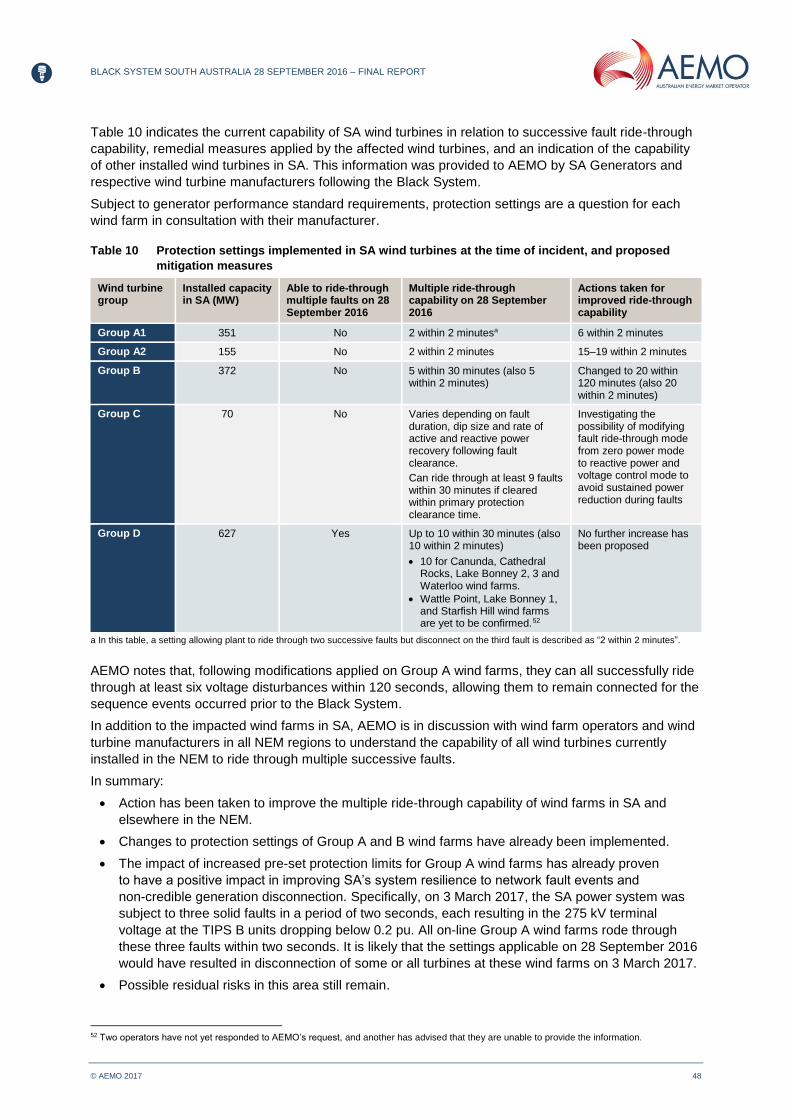
BLACK SYSTEM SOUTH AUSTRALIA 28 SEPTEMBER 2016 – FINAL REPORT
© AEMO 2017 48
Table 10 indicates the current capability of SA wind turbines in relation to successive fault ride-through
capability, remedial measures applied by the affected wind turbines, and an indication of the capability
of other installed wind turbines in SA. This information was provided to AEMO by SA Generators and
respective wind turbine manufacturers following the Black System.
Subject to generator performance standard requirements, protection settings are a question for each
wind farm in consultation with their manufacturer.
Table 10 Protection settings implemented in SA wind turbines at the time of incident, and proposed
mitigation measures
a In this table, a setting allowing plant to ride through two successive faults but disconnect on the third fault is described as “2 within 2 minutes”.
AEMO notes that, following modifications applied on Group A wind farms, they can all successfully ride
through at least six voltage disturbances within 120 seconds, allowing them to remain connected for the
sequence events occurred prior to the Black System.
In addition to the impacted wind farms in SA, AEMO is in discussion with wind farm operators and wind
turbine manufacturers in all NEM regions to understand the capability of all wind turbines currently
installed in the NEM to ride through multiple successive faults.
In summary:
Action has been taken to improve the multiple ride-through capability of wind farms in SA and
elsewhere in the NEM.
Changes to protection settings of Group A and B wind farms have already been implemented.
The impact of increased pre-set protection limits for Group A wind farms has already proven
to have a positive impact in improving SA’s system resilience to network fault events and
non-credible generation disconnection. Specifically, on 3 March 2017, the SA power system was
subject to three solid faults in a period of two seconds, each resulting in the 275 kV terminal
voltage at the TIPS B units dropping below 0.2 pu. All on-line Group A wind farms rode through
these three faults within two seconds. It is likely that the settings applicable on 28 September 2016
would have resulted in disconnection of some or all turbines at these wind farms on 3 March 2017.
Possible residual risks in this area still remain.
52 Two operators have not yet responded to AEMO’s request, and another has advised that they are unable to provide the information.
Wind turbine group
Installed capacity in SA (MW)
Able to ride-through multiple faults on 28 September 2016
Multiple ride-through capability on 28 September 2016
Actions taken for improved ride-through capability
Group A1 351 No 2 within 2 minutesa 6 within 2 minutes
Group A2 155 No 2 within 2 minutes 15–19 within 2 minutes
Group B 372 No 5 within 30 minutes (also 5 within 2 minutes)
Changed to 20 within 120 minutes (also 20 within 2 minutes)
Group C 70 No Varies depending on fault duration, dip size and rate of active and reactive power recovery following fault clearance.
Can ride through at least 9 faults within 30 minutes if cleared within primary protection clearance time.
Investigating the possibility of modifying fault ride-through mode from zero power mode to reactive power and voltage control mode to avoid sustained power reduction during faults
Group D 627 Yes Up to 10 within 30 minutes (also 10 within 2 minutes)
10 for Canunda, Cathedral Rocks, Lake Bonney 2, 3 and Waterloo wind farms.
Wattle Point, Lake Bonney 1, and Starfish Hill wind farms are yet to be confirmed.51F
52
No further increase has been proposed
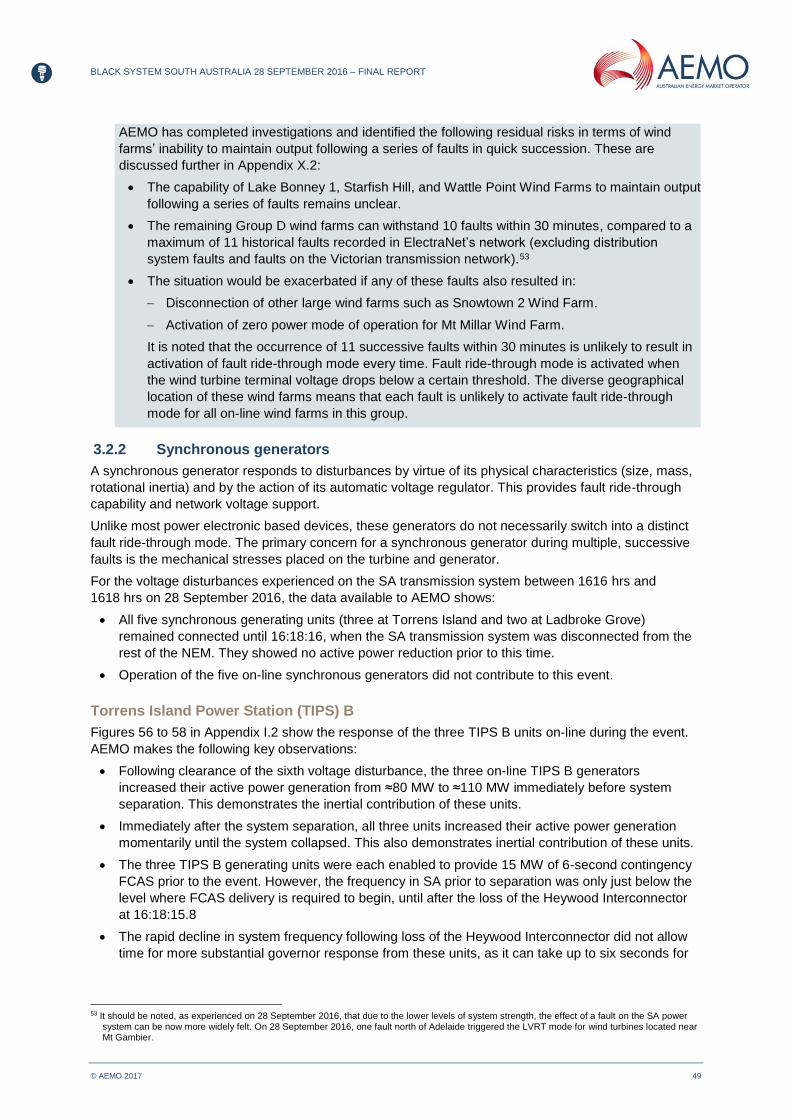
BLACK SYSTEM SOUTH AUSTRALIA 28 SEPTEMBER 2016 – FINAL REPORT
© AEMO 2017 49
AEMO has completed investigations and identified the following residual risks in terms of wind
farms’ inability to maintain output following a series of faults in quick succession. These are
discussed further in Appendix X.2:
The capability of Lake Bonney 1, Starfish Hill, and Wattle Point Wind Farms to maintain output
following a series of faults remains unclear.
The remaining Group D wind farms can withstand 10 faults within 30 minutes, compared to a
maximum of 11 historical faults recorded in ElectraNet’s network (excluding distribution
system faults and faults on the Victorian transmission network).52F
53
The situation would be exacerbated if any of these faults also resulted in:
Disconnection of other large wind farms such as Snowtown 2 Wind Farm.
Activation of zero power mode of operation for Mt Millar Wind Farm.
It is noted that the occurrence of 11 successive faults within 30 minutes is unlikely to result in
activation of fault ride-through mode every time. Fault ride-through mode is activated when
the wind turbine terminal voltage drops below a certain threshold. The diverse geographical
location of these wind farms means that each fault is unlikely to activate fault ride-through
mode for all on-line wind farms in this group.
3.2.2 Synchronous generators
A synchronous generator responds to disturbances by virtue of its physical characteristics (size, mass,
rotational inertia) and by the action of its automatic voltage regulator. This provides fault ride-through
capability and network voltage support.
Unlike most power electronic based devices, these generators do not necessarily switch into a distinct
fault ride-through mode. The primary concern for a synchronous generator during multiple, successive
faults is the mechanical stresses placed on the turbine and generator.
For the voltage disturbances experienced on the SA transmission system between 1616 hrs and
1618 hrs on 28 September 2016, the data available to AEMO shows:
All five synchronous generating units (three at Torrens Island and two at Ladbroke Grove)
remained connected until 16:18:16, when the SA transmission system was disconnected from the
rest of the NEM. They showed no active power reduction prior to this time.
Operation of the five on-line synchronous generators did not contribute to this event.
Torrens Island Power Station (TIPS) B
Figures 56 to 58 in Appendix I.2 show the response of the three TIPS B units on-line during the event.
AEMO makes the following key observations:
Following clearance of the sixth voltage disturbance, the three on-line TIPS B generators
increased their active power generation from ≈80 MW to ≈110 MW immediately before system
separation. This demonstrates the inertial contribution of these units.
Immediately after the system separation, all three units increased their active power generation
momentarily until the system collapsed. This also demonstrates inertial contribution of these units.
The three TIPS B generating units were each enabled to provide 15 MW of 6-second contingency
FCAS prior to the event. However, the frequency in SA prior to separation was only just below the
level where FCAS delivery is required to begin, until after the loss of the Heywood Interconnector
at 16:18:15.8
The rapid decline in system frequency following loss of the Heywood Interconnector did not allow
time for more substantial governor response from these units, as it can take up to six seconds for
53 It should be noted, as experienced on 28 September 2016, that due to the lower levels of system strength, the effect of a fault on the SA power
system can be now more widely felt. On 28 September 2016, one fault north of Adelaide triggered the LVRT mode for wind turbines located near Mt Gambier.

BLACK SYSTEM SOUTH AUSTRALIA 28 SEPTEMBER 2016 – FINAL REPORT
© AEMO 2017 50
these generating units to increase their active power output when they participate in the
contingency FCAS market.
Each of the three on-line TIPS B units increased their reactive power generation from
≈20 Mega volt amps reactive (MVAr) immediately after the onset of rapid voltage decline to
≈110 MVAR at the time of system separation.
0.5 seconds after system separation, the three TIPS B units disconnected as soon as frequency
dropped below 47 Hz.
Of three TIPS B units, one tripped on frequency protection, whereas the other two disconnected on
lockout protection. The purpose of lockout relay is not simply to trip the generator. When this trip
mechanism is activated the generator breaker is opened, and the turbine is tripped on emergency
shutdown. When the generator is tripped by lockout protection, it requires a manual reset to permit
a turbine restart, hence the term "lock-out".
The timing of CB opening to disconnect the units from the transmission system varied between
16:18:16.24 and 16:18:16.26, plus an additional 40–60 ms delay for CB opening.
Data from the three TIPS B units shows generator current dropping to zero at approximately
16:18:16.31.
Ladbroke Grove Power Station
Figure 59 in Appendix I.2.4 shows the response of two Ladbroke Grove generating units. AEMO makes
the following key observations:
Following clearance of the sixth voltage disturbance, each unit decreased its active power
generation from ≈40 MW to ≈28 MW immediately before system separation.
Both units increased their reactive power generation from ≈15 MVAr immediately after the onset of
rapid voltage decline to ≈80 MVAR at the time of system separation.
Frequency at Ladbroke Grove was significantly different to the rest of SA, and appears to have
followed the SESS frequency rather than those measured at remainder of the SA system. Section
3.3.1 confirms that South East experienced an over frequency as opposed to a declining frequency
that was observed in rest of SA before the system separation. This is further corroborated by
Figure 60, which shows the measured frequency on the transmission line to which these
generating units are connected.
Generator data indicates the protection system tripped the units on over voltage after system
separation, when frequency at most SA nodes had declined below 47 Hz.
This is consistent with the over voltages observed on the three TIPS B units following system
separation, and consistent with historical responses of the SA system (see Appendix J),
whereby over voltages were experienced in all previous events immediately following
separation. The over voltage protection is set to trip instantaneously at 13.2 kV. After system
separation, unit 1 peaked at 14 kV and unit 2 at 13.5 kV.
The generator current dropped to zero at 16:18:16.01 indicating when unit CBs opened (that is,
0.21 seconds after system separation).
3.3 Network performance
3.3.1 Interconnectors
Heywood Interconnector
Cause of system separation
Figure 12 indicates that the frequencies measured across various nodes in the SA power system
started to diverge from that measured at the Heywood Substation at around 16:18:15.2 (approximately
600 ms before the system separation).
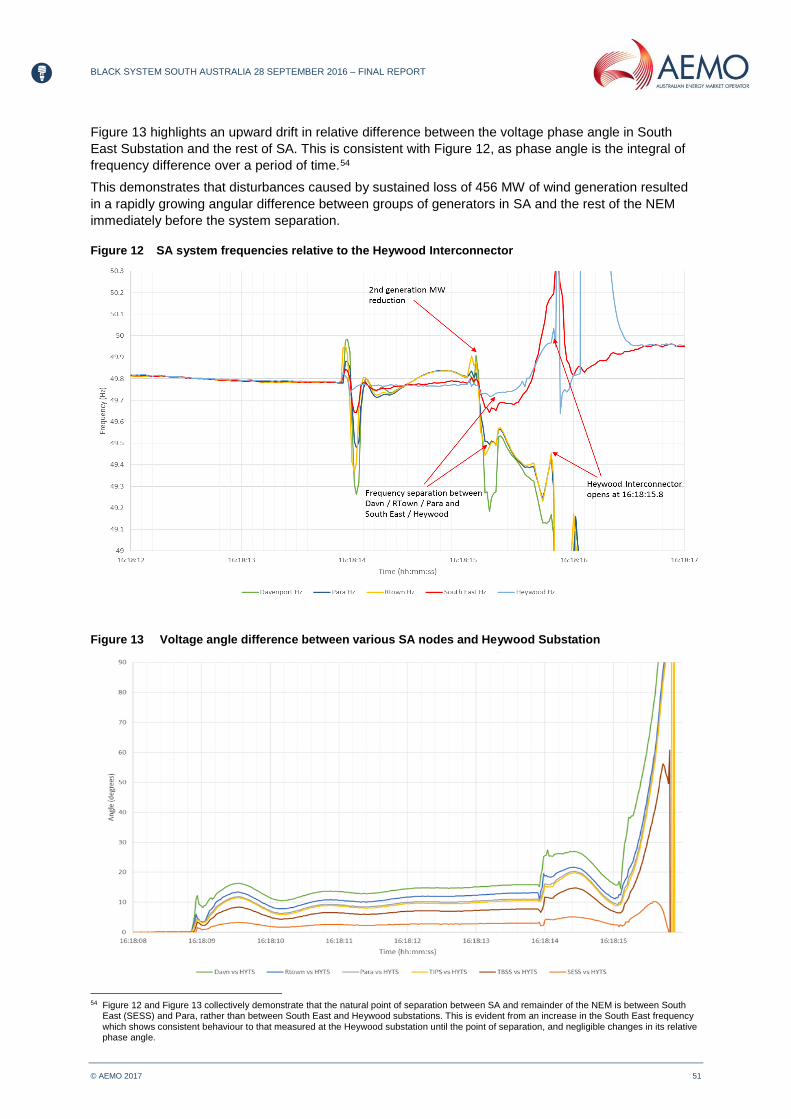
BLACK SYSTEM SOUTH AUSTRALIA 28 SEPTEMBER 2016 – FINAL REPORT
© AEMO 2017 51
Figure 13 highlights an upward drift in relative difference between the voltage phase angle in South
East Substation and the rest of SA. This is consistent with Figure 12, as phase angle is the integral of
frequency difference over a period of time.53F
54
This demonstrates that disturbances caused by sustained loss of 456 MW of wind generation resulted
in a rapidly growing angular difference between groups of generators in SA and the rest of the NEM
immediately before the system separation.
Figure 12 SA system frequencies relative to the Heywood Interconnector
Figure 13 Voltage angle difference between various SA nodes and Heywood Substation
54 Figure 12 and Figure 13 collectively demonstrate that the natural point of separation between SA and remainder of the NEM is between South
East (SESS) and Para, rather than between South East and Heywood substations. This is evident from an increase in the South East frequency which shows consistent behaviour to that measured at the Heywood substation until the point of separation, and negligible changes in its relative phase angle.
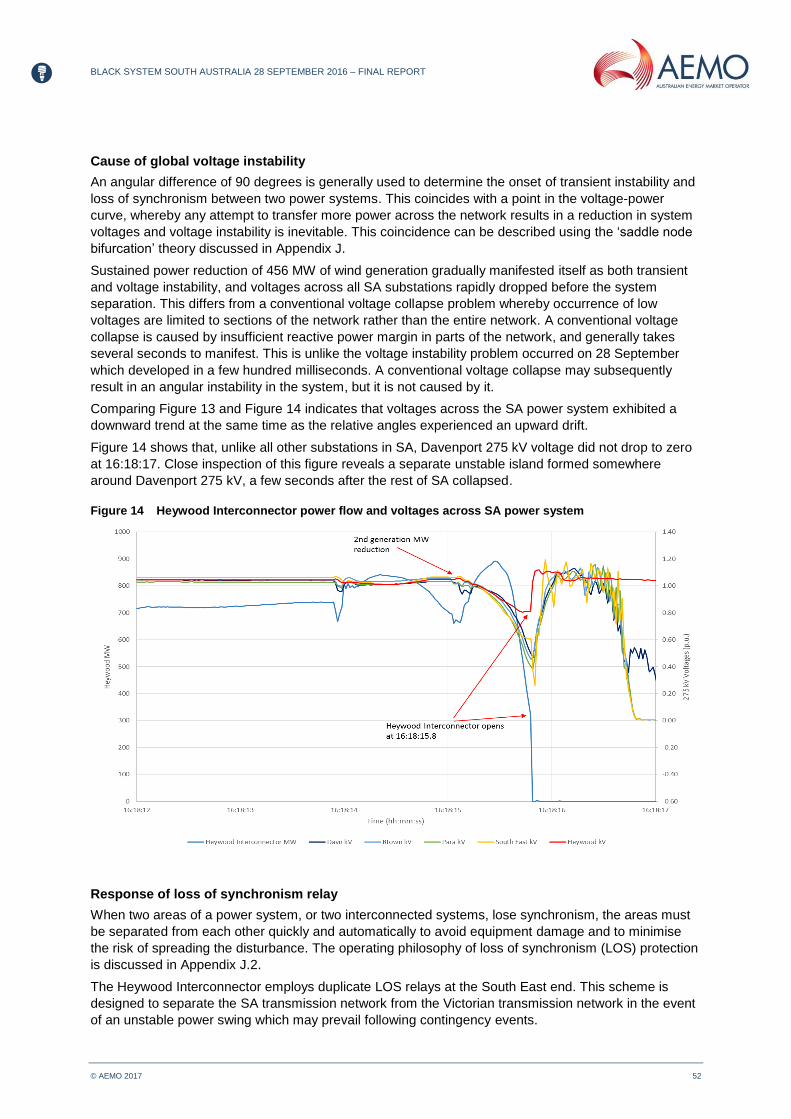
BLACK SYSTEM SOUTH AUSTRALIA 28 SEPTEMBER 2016 – FINAL REPORT
© AEMO 2017 52
Cause of global voltage instability
An angular difference of 90 degrees is generally used to determine the onset of transient instability and
loss of synchronism between two power systems. This coincides with a point in the voltage-power
curve, whereby any attempt to transfer more power across the network results in a reduction in system
voltages and voltage instability is inevitable. This coincidence can be described using the ‘saddle node
bifurcation’ theory discussed in Appendix J.
Sustained power reduction of 456 MW of wind generation gradually manifested itself as both transient
and voltage instability, and voltages across all SA substations rapidly dropped before the system
separation. This differs from a conventional voltage collapse problem whereby occurrence of low
voltages are limited to sections of the network rather than the entire network. A conventional voltage
collapse is caused by insufficient reactive power margin in parts of the network, and generally takes
several seconds to manifest. This is unlike the voltage instability problem occurred on 28 September
which developed in a few hundred milliseconds. A conventional voltage collapse may subsequently
result in an angular instability in the system, but it is not caused by it.
Comparing Figure 13 and Figure 14 indicates that voltages across the SA power system exhibited a
downward trend at the same time as the relative angles experienced an upward drift.
Figure 14 shows that, unlike all other substations in SA, Davenport 275 kV voltage did not drop to zero
at 16:18:17. Close inspection of this figure reveals a separate unstable island formed somewhere
around Davenport 275 kV, a few seconds after the rest of SA collapsed.
Figure 14 Heywood Interconnector power flow and voltages across SA power system
Response of loss of synchronism relay
When two areas of a power system, or two interconnected systems, lose synchronism, the areas must
be separated from each other quickly and automatically to avoid equipment damage and to minimise
the risk of spreading the disturbance. The operating philosophy of loss of synchronism (LOS) protection
is discussed in Appendix J.2.
The Heywood Interconnector employs duplicate LOS relays at the South East end. This scheme is
designed to separate the SA transmission network from the Victorian transmission network in the event
of an unstable power swing which may prevail following contingency events.

BLACK SYSTEM SOUTH AUSTRALIA 28 SEPTEMBER 2016 – FINAL REPORT
© AEMO 2017 53
The scheme uses redundant out-of-step protections installed at South East Substation on the Heywood
#1 and #2 lines to determine if an unstable power swing is taking place.
The thermal overload capability of Heywood Interconnector at the South East end is approximately
750 mega volt amps (MVA) (for up to 15 minutes) per circuit. The total power flow across the Heywood
Interconnector as measured at the South East end was approximately 890 MW (1,060 MVA) at the
onset of voltage collapse at 16:18:15.4. It was the combination of high currents and low voltages that
resulted in activation of Heywood LOS relay, rather than the sheer size of current (over-load).
Figure 15 depicts impedance trajectory against the relay operating characteristic. This figure clearly
shows that the impedance trajectory crossed both inner and outer relay blinders, resulting in correct
operation of the relay and opening of the associated CB. Immediately following system separation, the
impedance trajectory experienced a sharp knee point.
In summary, the LOS relay operated as designed and its operation was appropriate in these
circumstances.
It should be noted that the settings of the LOS relay have changed as part of Heywood Interconnector
series capacitor augmentation that changes the effective line impedance, creating the need for revised
settings for a relay that acts on the system impedance. These revised settings have been in place since
October 2016, and were used in the scenario analysis discussed in Appendices X and Y in this report.
Figure 15 highlights that system separation would have occurred irrespective of whether the new or the
old LOS relay settings had been in place on 28 September 2016.
Figure 15 Response of Heywood Interconnector loss of synchronism relay
Impact on Victorian network
Figure 16 compares impedance trajectory at the Heywood and South East ends of the interconnector.
The South East impedance trajectory is a zoomed out version of that presented in Figure 15.
Impedance trajectory calculated at the Heywood substation indicates that, following disconnection from
SA, the equivalent Victorian power system as seen by the Heywood substation resumed its stability and
attempted to return to the pre-event impedance.
However, it is noted that the pre-event impedance is purely resistive, as the capacitive reactance of the
series capacitors installed at Black Range would somewhat cancel out inductive reactance of the

BLACK SYSTEM SOUTH AUSTRALIA 28 SEPTEMBER 2016 – FINAL REPORT
© AEMO 2017 54
transmission line. Following system separation, the apparent impedance becomes highly inductive, due
to loss of reactive support from the South East reactive power support devices, and as the nearest
source of reactive support for Heywood Substation was provided by Latrobe Valley generation.
Figure 16 Impedance trajectory at Heywood and South East substations
Comparison against historical SA system separation events
Unforeseen separation and complete loss of the Heywood Interconnector has occurred six 54F
55 times in
the seventeen years since 1999.55F
56
Table 11 indicates that, in addition to the 28 September 2016 event, three other relevant system
separation events 56F
57 were initiated by a non-credible disconnection of generation in SA and resultant
increase in the Heywood Interconnector flow, combined with declining system voltages. Appendix K
compares key attributes of the three relevant events and the event on 28 September 2016 to depict
active power, voltage, and frequency variations.
In all four generation-related events, disconnection of SA from the remainder of the NEM occurred due
to correct operation of loss of synchronism protection between Heywood and South East substations. In
all cases frequency drift can be seen between South East and rest of SA (Para is used as the frequency
reference in SA) prior to loss of synchronism.
The key differentiator between the 28 September 2016 event and other three events is that there was
significantly lower inertia in SA in the most recent event, due to a lower number of on-line synchronous
generators. This resulted in a substantially faster RoCoF compared to the other events, exceeding the
ability of the UFLS scheme to arrest the frequency fall before it dropped below 47 Hz.
All four events indicate over voltages across the SA system following system separation. AEMO has
investigated this further to determine the extent to which these over voltages might undermine the
ability to form a viable SA island. Simulation case studies conducted are reported in Appendix Y.
55 This figure has been updated since the third preliminary report, due to the system separation event in 1 December 2016. 56 AEMO has reliable data and records back to 1999. 57 Four separation events were mentioned in the Update Report, but one of those occurred during bushfires, so it is not relevant for
present purposes.

BLACK SYSTEM SOUTH AUSTRALIA 28 SEPTEMBER 2016 – FINAL REPORT
© AEMO 2017 55
Table 11 Previous events – complete loss of the Heywood Interconnector due to generation disconnection in SA
Date Time Cause of interconnector trip
Supply interrupted in SA
Duration of separation
Sufficient load was shed by UFLS
System inertia (MW.s)
Peak Heywood flow (MW)
Time between start of frequency decline and system separation
2 December 1999 13:11 Trip of both units at Northern Power Station (520 MW)
1,130 MW 26 minutes Yes 10,693 950 2.8 seconds
8 March 2004 11:28 Runback of both units at Northern Power Station (480 MW)
650 MW 43 minutes Yes 7,617 825 1.7 seconds
14 March 2005 06:39 Runback of both units at Northern Power Station (465 MW)
580 MW 22 minutes Yes 11,127 900 2 seconds
28 September 2016
16:18 Extreme weather event caused loss of three transmission lines and loss of 456 MW of generation from nine wind farms.
1,895 MW
Black System
65 minutes No 3,000 890 0.6 seconds

BLACK SYSTEM SOUTH AUSTRALIA 28 SEPTEMBER 2016 – FINAL REPORT
© AEMO 2017 56
Adequacy of transfer limits for Heywood Interconnector
Works to upgrade the capacity of the Heywood Interconnector from 460 MW to a nominal capacity of
650 MW were completed early in 2016. This involved installation of a third 500/275 kV transformer at
Heywood Terminal Station in Victoria, installation of 50% series compensation on the Tailem Bend–
South East 275 kV lines in SA, and reconfiguration of the 132 kV transmission lines running in parallel
with the Tailem Bend–South East 275 kV lines.
Following completion of these works, a program to progressively test the operation of the Heywood
interconnection at higher power transfers commenced. On 28 September 2016, the maximum transfer
allowed on the Heywood Interconnector from Victoria to SA under this testing program was 600 MW.
Work to test it at a transfer limit of 650 MW from Victoria to SA had not yet commenced.
ElectraNet had previously provided AEMO with transfer limit equations for flow on the Heywood
Interconnector from Victoria to SA, considering its operation up to a maximum limit of 650 MW. This
advice included limit equations for both voltage and transient stability, considering loss of the largest
generating unit in SA, and loss of key transmission elements in SA. These transfer limits vary with
system conditions, and at times set a limit above 650 MW from Victoria to SA, however, a separate
maximum cap of 650 MW on transfers was still to be used at all time.
AEMO undertook due diligence on this advice, which indicated these limit equations were appropriate to
maintain power system security in SA. Both ElectraNet’s work to develop these limit equations, and
AEMO’s subsequent review of this advice, were undertaken with the same power system dynamic
model, available via AEMO’s OPDMS system.
Following the Black System, a decision was made to leave the maximum transfer limit at Heywood at
600 MW, pending the findings of the investigation.
AEMO’s investigations included dynamic simulations of the Black System to compare simulation results
from the available power system dynamic model with the reality observed during the event.
This work identified a range of differences between simulations and reality, some small, some
important. Among these were differences in the active power recovery time of some power electronic
interfaced generation, and in the depth of active power reduction immediately following faults. The
performance standards for several existing wind farms in SA do not have any specific requirements with
regard to the active power response during and after faults.
Investigation into these differences has allowed corrections to be applied to the simulation models to
give a more accurate simulation of the Black System. In many cases, the differences individually are
small, but the aggregate effect of these makes an important difference to the overall performance of the
SA power system in response to disturbances, particularly to flows observed on the Heywood
Interconnector.
These simulation models were then used to perform a range of ‘what-if’ scenarios, including
assessment of transfer limits on the Heywood Interconnector at high power transfer levels. This
simulation work has identified some dispatch scenarios that would have been permitted, based on a
maximum scheduled transfer level of 650 MW or 600 MW, and that may have led to the insecure
operation of the SA power system.57F
58
In the short term, AEMO plans to modify existing transfer limits to account for these findings, so as to
maintain the secure operation of the SA power system. The existing transfer limit equations include a
term for the maximum sustained loss of generation from the SA power system. Initially, AEMO will apply
a varying increase to this maximum generation loss term based on real-time power system conditions,
to account for the observed active power response of generation in SA to disturbances. Under
conditions of low wind generation, this will result in the same transfer limits as previously advised by
ElectraNet, however, under high wind conditions it will reduce the allowable transfer limits on the
Heywood Interconnector.
In the longer term, AEMO will work with ElectraNet to review the transfer limits applied to the Heywood
Interconnector more broadly, to fully incorporate the findings of this investigation, and allow for the
58 See details of studies in Appendix X.1.

BLACK SYSTEM SOUTH AUSTRALIA 28 SEPTEMBER 2016 – FINAL REPORT
© AEMO 2017 57
highest utilisation of the Heywood Interconnector that is consistent with maintaining power
system security.
Murraylink High Voltage Direct Current (HVDC) interconnector
The second interconnector with Victoria, the Murraylink HVDC link (Murraylink), uses voltage source
converter technology based on power electronic converters.
The Murraylink design has a fast response time to voltage disturbances of less than 20 ms.
Occurrence of a voltage disturbance causes a temporary increase of up to 150% in the HVDC link
current. After around 20 ms, the nominal HVDC link current is restored.
This means power flow across Murraylink recovers much faster from a voltage disturbance when
compared to other technologies.
The negligible decline in active power transfer across Murraylink in response to the six voltage
disturbances further confirms that its transient power reduction warrants no further consideration
for this event.
The data available to AEMO at this time shows:
Murraylink remained connected to the network during all faults and disturbances, maintained its
pre-event active power level of 114 MW, and disconnected at 16:18:16 when SA system collapsed
(see Figure 17). This is because Murraylink requires an AC voltage supply at both the SA and
Victorian ends. Loss of supply at the SA end following system collapse therefore caused
its disconnection.
Operation of Murraylink did not impact SA system performance during the six voltage disturbances
between 16:17:33 and 16:18.15.
The response of Murraylink was consistent with expectations, and did not contribute to this event.
Figure 17 Power transfer across Murraylink and frequency
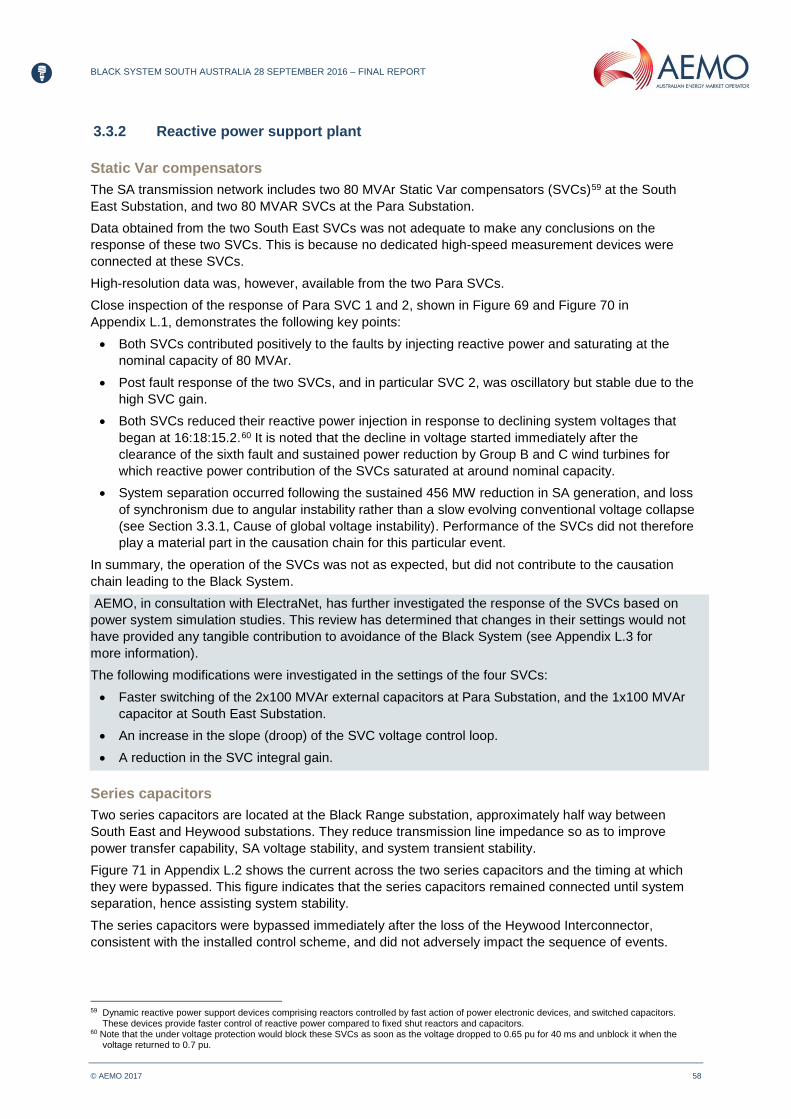
BLACK SYSTEM SOUTH AUSTRALIA 28 SEPTEMBER 2016 – FINAL REPORT
© AEMO 2017 58
3.3.2 Reactive power support plant
Static Var compensators
The SA transmission network includes two 80 MVAr Static Var compensators (SVCs) 58F
59 at the South
East Substation, and two 80 MVAR SVCs at the Para Substation.
Data obtained from the two South East SVCs was not adequate to make any conclusions on the
response of these two SVCs. This is because no dedicated high-speed measurement devices were
connected at these SVCs.
High-resolution data was, however, available from the two Para SVCs.
Close inspection of the response of Para SVC 1 and 2, shown in Figure 69 and Figure 70 in
Appendix L.1, demonstrates the following key points:
Both SVCs contributed positively to the faults by injecting reactive power and saturating at the
nominal capacity of 80 MVAr.
Post fault response of the two SVCs, and in particular SVC 2, was oscillatory but stable due to the
high SVC gain.
Both SVCs reduced their reactive power injection in response to declining system voltages that
began at 16:18:15.2. 59F
60 It is noted that the decline in voltage started immediately after the
clearance of the sixth fault and sustained power reduction by Group B and C wind turbines for
which reactive power contribution of the SVCs saturated at around nominal capacity.
System separation occurred following the sustained 456 MW reduction in SA generation, and loss
of synchronism due to angular instability rather than a slow evolving conventional voltage collapse
(see Section 3.3.1, Cause of global voltage instability). Performance of the SVCs did not therefore
play a material part in the causation chain for this particular event.
In summary, the operation of the SVCs was not as expected, but did not contribute to the causation
chain leading to the Black System.
AEMO, in consultation with ElectraNet, has further investigated the response of the SVCs based on
power system simulation studies. This review has determined that changes in their settings would not
have provided any tangible contribution to avoidance of the Black System (see Appendix L.3 for
more information).
The following modifications were investigated in the settings of the four SVCs:
Faster switching of the 2x100 MVAr external capacitors at Para Substation, and the 1x100 MVAr
capacitor at South East Substation.
An increase in the slope (droop) of the SVC voltage control loop.
A reduction in the SVC integral gain.
Series capacitors
Two series capacitors are located at the Black Range substation, approximately half way between
South East and Heywood substations. They reduce transmission line impedance so as to improve
power transfer capability, SA voltage stability, and system transient stability.
Figure 71 in Appendix L.2 shows the current across the two series capacitors and the timing at which
they were bypassed. This figure indicates that the series capacitors remained connected until system
separation, hence assisting system stability.
The series capacitors were bypassed immediately after the loss of the Heywood Interconnector,
consistent with the installed control scheme, and did not adversely impact the sequence of events.
59 Dynamic reactive power support devices comprising reactors controlled by fast action of power electronic devices, and switched capacitors.
These devices provide faster control of reactive power compared to fixed shut reactors and capacitors. 60 Note that the under voltage protection would block these SVCs as soon as the voltage dropped to 0.65 pu for 40 ms and unblock it when the
voltage returned to 0.7 pu.
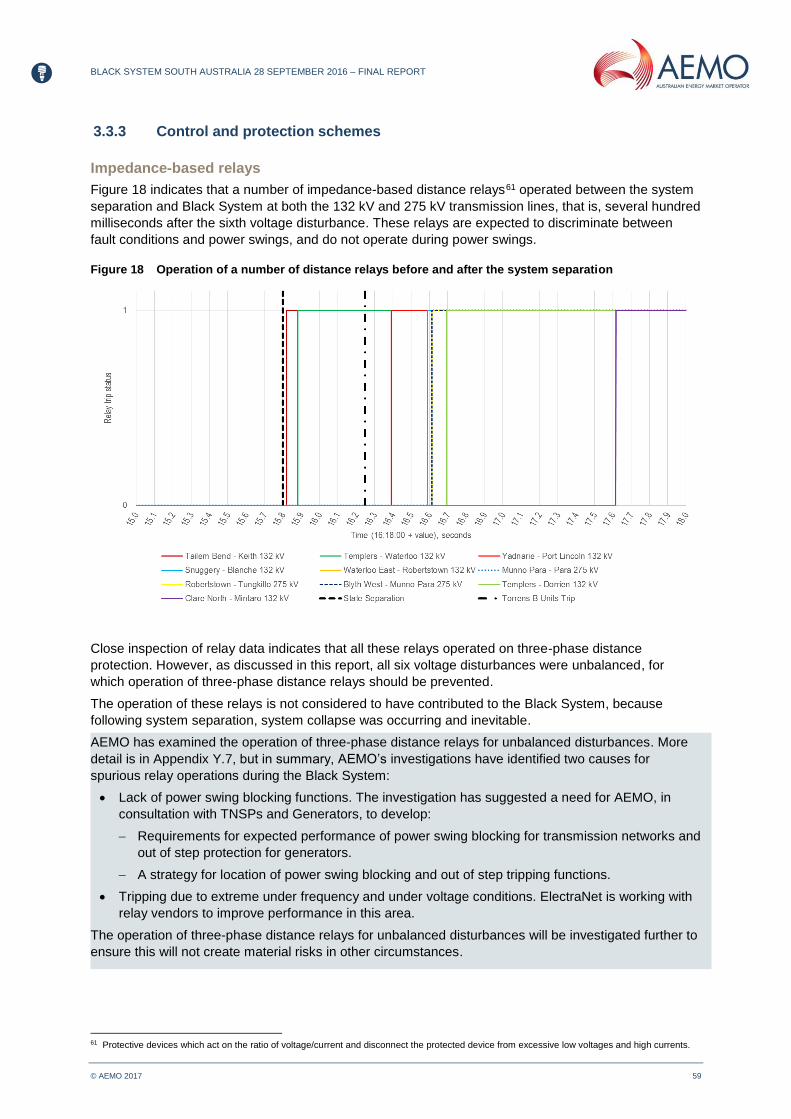
BLACK SYSTEM SOUTH AUSTRALIA 28 SEPTEMBER 2016 – FINAL REPORT
© AEMO 2017 59
3.3.3 Control and protection schemes
Impedance-based relays
Figure 18 indicates that a number of impedance-based distance relays 60F
61 operated between the system
separation and Black System at both the 132 kV and 275 kV transmission lines, that is, several hundred
milliseconds after the sixth voltage disturbance. These relays are expected to discriminate between
fault conditions and power swings, and do not operate during power swings.
Figure 18 Operation of a number of distance relays before and after the system separation
Close inspection of relay data indicates that all these relays operated on three-phase distance
protection. However, as discussed in this report, all six voltage disturbances were unbalanced, for
which operation of three-phase distance relays should be prevented.
The operation of these relays is not considered to have contributed to the Black System, because
following system separation, system collapse was occurring and inevitable.
AEMO has examined the operation of three-phase distance relays for unbalanced disturbances. More
detail is in Appendix Y.7, but in summary, AEMO’s investigations have identified two causes for
spurious relay operations during the Black System:
Lack of power swing blocking functions. The investigation has suggested a need for AEMO, in
consultation with TNSPs and Generators, to develop:
Requirements for expected performance of power swing blocking for transmission networks and
out of step protection for generators.
A strategy for location of power swing blocking and out of step tripping functions.
Tripping due to extreme under frequency and under voltage conditions. ElectraNet is working with
relay vendors to improve performance in this area.
The operation of three-phase distance relays for unbalanced disturbances will be investigated further to
ensure this will not create material risks in other circumstances.
61 Protective devices which act on the ratio of voltage/current and disconnect the protected device from excessive low voltages and high currents.

BLACK SYSTEM SOUTH AUSTRALIA 28 SEPTEMBER 2016 – FINAL REPORT
© AEMO 2017 60
Under frequency load shedding
SA Power Networks (SAPN) records show that approximately 1,150 MW of load (as measured just
before the event at the load shedding CBs) was available for UFLS.
Approximately 932 MW of SAPN load was activated for load shedding by the UFLS scheme, as shown
in Figure 19. For most of these loads, UFLS relays would have been expected to start to operate, but
the system went black either before the relays timed out or before the CBs opened. However, this
cannot be confirmed due to the low four-second resolution of SCADA data.
Only some of the relays with lower frequency settings (48.3 Hz and below) failed to trip, as
Figure 19 shows.
Figure 19 Total load shed during the event against total load available for load shedding
Following system separation, over voltages were experienced across the SA power system. The
under voltage inhibit feature of the load shedding did not, therefore, adversely impact the ability of the
UFLS scheme.
While it is likely that some load shedding occurred after system separation, the amount of load shed
and the timing at which those loads were disconnected was not sufficient to avoid system collapse.
AEMO has completed investigations into the UFLS scheme and distribution of load blocks (see
Appendix Y.5.2 for more detail), and concluded that:
The distribution of load blocks currently assigned to the UFLS scheme could not respond
adequately, because the RoCoF of approximately 6 Hz/s was well above the 3 Hz/s level where
the UFLS could be expected to operate quickly enough to maintain SA’s frequency above 47 Hz.
Numerous power system simulation studies carried out by AEMO indicate that:
For a RoCoF of up to 3 Hz/s, frequency collapse can be arrested with high confidence following
SA system separation.
With RoCoF values above 4 Hz/s, the likelihood of maintaining frequency is very low.

BLACK SYSTEM SOUTH AUSTRALIA 28 SEPTEMBER 2016 – FINAL REPORT
© AEMO 2017 61
AEMO has not further investigated the effect of a distribution of load blocks different to that currently in
place. This is because the simulation studies conducted by AEMO showed that a more aggressive,
faster acting SPS to rebalance supply and demand following islanding would not successfully stabilise
the SA power system following system separation. This means that under the conditions on the day,
less aggressive measures such as shedding more load at higher frequencies by the UFLS would have
been ineffective.
AEMO concluded that the benefit of an improved UFLS scheme would be very marginal, considering
the physical limitations of the network in terms of availability and capability of necessary CBs and
relays, and limited availability of higher percentages of operational demand for the UFLS scheme at a
given time.
To maintain system stability under high RoCoF conditions, there is a need for an SPS which, in
response to sudden excessive flows on the Heywood Interconnector, would initiate load shedding with a
response time fast enough to prevent separation, or at least to create a stable island.
AEMO has investigated this possibility and found that:
An SPS to prevent separation could be effective provided that:
A total response time in the order of several power frequency cycles could be achieved (as an
example a total response time of 100 ms was studied in the report).
Other necessary control and protection mechanisms could operate in a consistent timeframe to
ensure secure operation of the SPS (to avoid unnecessary load shedding).
Even with very rapid shedding of load by an SPS following separation, a viable island cannot be
formed under medium and low demand conditions, when there is a large imbalance between
supply and demand. This imbalance would exist when the loss of multiple generating units led to
separation. The key threat to the stability of an islanded SA system would be temporary over
voltages, beyond the over voltage protection settings of the several generating systems. This is
because load shedding as required in conditions similar to this event would require a sudden
reduction in demand to levels at or lower than minimum regional demand under normal conditions.
As discussed in Section 3.5.2, system strength within the island could also be an issue.
More information is in Appendices Y.4 and Y.5.
3.4 Demand response
3.4.1 Overall demand response
Figure 20 shows variations of the overall operational demand in SA shortly before and during the
incident, based on four-second SCADA data.
This figure indicates practically no changes in the overall operational demand for the last 10 seconds
before the event, including during the six voltage disturbances. The low four-second resolution of the
data does not allow determination of the exact time at which SA regional demand experienced a
significant reduction. However, it provides sufficient information to conclude that no substantial
reduction in SA operational demand occurred prior to system separation.
There was a small reduction in demand from 1,885 MW to 1,820 MW during the sequence of six
voltage disturbances just prior to the Black System. However, such a reduction would have had no
significant impact on the overall situation.
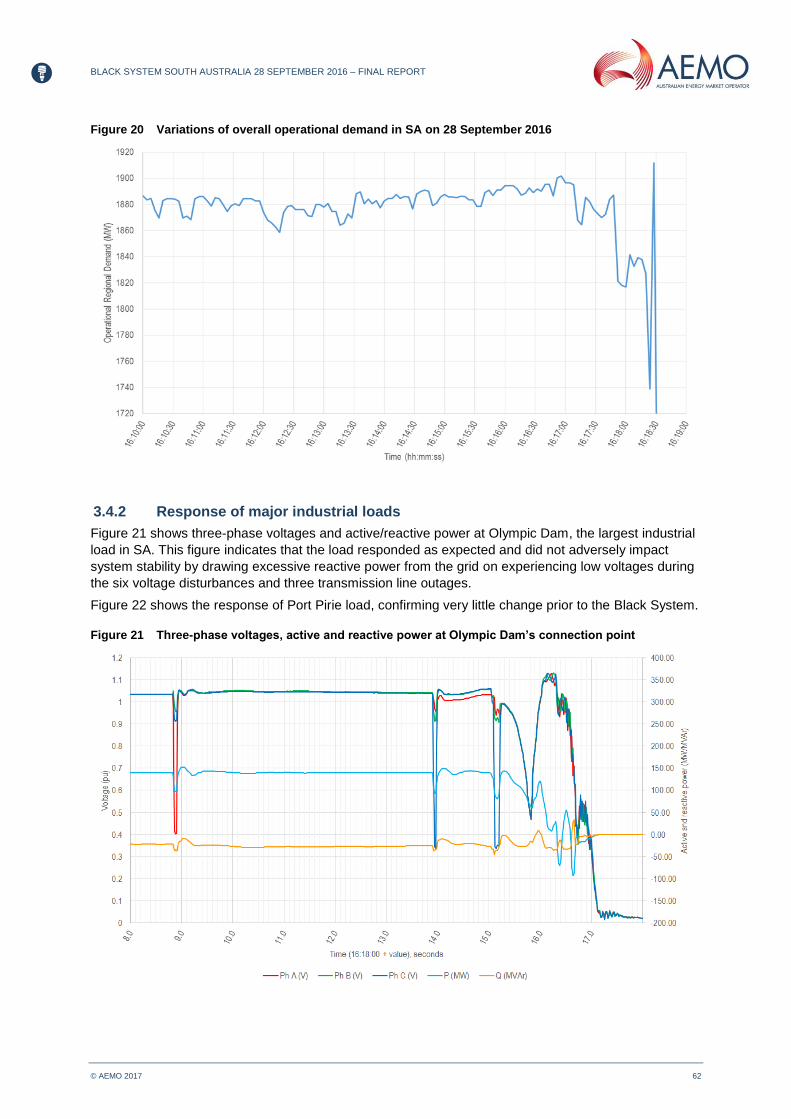
BLACK SYSTEM SOUTH AUSTRALIA 28 SEPTEMBER 2016 – FINAL REPORT
© AEMO 2017 62
Figure 20 Variations of overall operational demand in SA on 28 September 2016
3.4.2 Response of major industrial loads
Figure 21 shows three-phase voltages and active/reactive power at Olympic Dam, the largest industrial
load in SA. This figure indicates that the load responded as expected and did not adversely impact
system stability by drawing excessive reactive power from the grid on experiencing low voltages during
the six voltage disturbances and three transmission line outages.
Figure 22 shows the response of Port Pirie load, confirming very little change prior to the Black System.
Figure 21 Three-phase voltages, active and reactive power at Olympic Dam’s connection point
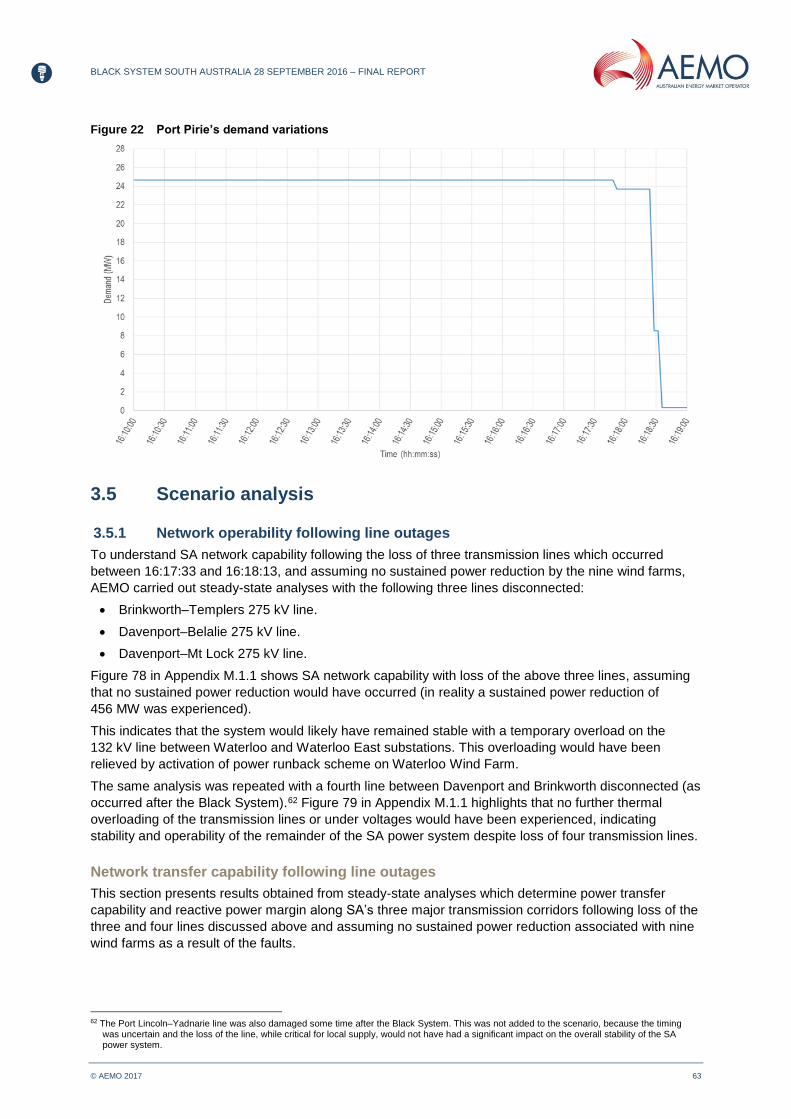
BLACK SYSTEM SOUTH AUSTRALIA 28 SEPTEMBER 2016 – FINAL REPORT
© AEMO 2017 63
Figure 22 Port Pirie’s demand variations
3.5 Scenario analysis
3.5.1 Network operability following line outages
To understand SA network capability following the loss of three transmission lines which occurred
between 16:17:33 and 16:18:13, and assuming no sustained power reduction by the nine wind farms,
AEMO carried out steady-state analyses with the following three lines disconnected:
Brinkworth–Templers 275 kV line.
Davenport–Belalie 275 kV line.
Davenport–Mt Lock 275 kV line.
Figure 78 in Appendix M.1.1 shows SA network capability with loss of the above three lines, assuming
that no sustained power reduction would have occurred (in reality a sustained power reduction of
456 MW was experienced).
This indicates that the system would likely have remained stable with a temporary overload on the
132 kV line between Waterloo and Waterloo East substations. This overloading would have been
relieved by activation of power runback scheme on Waterloo Wind Farm.
The same analysis was repeated with a fourth line between Davenport and Brinkworth disconnected (as
occurred after the Black System).61F
62 Figure 79 in Appendix M.1.1 highlights that no further thermal
overloading of the transmission lines or under voltages would have been experienced, indicating
stability and operability of the remainder of the SA power system despite loss of four transmission lines.
Network transfer capability following line outages
This section presents results obtained from steady-state analyses which determine power transfer
capability and reactive power margin along SA’s three major transmission corridors following loss of the
three and four lines discussed above and assuming no sustained power reduction associated with nine
wind farms as a result of the faults.
62 The Port Lincoln–Yadnarie line was also damaged some time after the Black System. This was not added to the scenario, because the timing
was uncertain and the loss of the line, while critical for local supply, would not have had a significant impact on the overall stability of the SA power system.

BLACK SYSTEM SOUTH AUSTRALIA 28 SEPTEMBER 2016 – FINAL REPORT
© AEMO 2017 64
Static modelling is an indicator of a possible scenario in a point in time. Based on AEMO’s static
modelling, it is probable that the SA power system could have withstood the loss of all three
transmission lines, and the fourth damaged after the Black System.
AEMO still cannot predict what additional events might have affected the SA power system beyond the
time of the Black System as the storm front continued its progress through the state.
To corroborate the findings of static analyses discussed above, AEMO has conducted two further
dynamic scenario analysis, discussed in Appendices M.1.2 and M.2, including:
Loss of the three and four transmission lines and assuming no sustained power reduction
associated with nine wind farms that occurred during the incident (consistent with the
corresponding static analysis).
A modification of the above scenario to include an additional reduction of 200 MW of wind farm
output immediately following the loss of the fourth transmission line. As discussed in Section 2.3, it
is quite likely that high wind speeds were present in the Hallett area in the period immediately
following the sixth fault.
The results under this scenario indicate the SA power system would have remained stable and
separation from the rest of the NEM would not have occurred. Detailed results of this simulation
are in Appendix M.2.
A third scenario was considered for a situation where, prior to the faults, AEMO had reclassified the
simultaneous loss of six 275 kV transmission lines, subsequently advised by ElectraNet as potentially
vulnerable lines to high wind speed conditions, as a credible contingency event due to high winds. As
set out in Chapter 2, AEMO was not advised of any specific risks to these transmission lines prior to
this event.
The analysis concluded that any such reclassification prior to the event would not have prevented the
Black System. Details are in Appendix M.3.
Heywood Interconnector transfer capability
The following key observations can be made about the transfer capability between South East and
Heywood circuits (see Appendix M.1.1):
750 MW of power could most likely have been transferred across South East–Heywood circuits
while maintaining healthy voltages even with loss of four circuits in the Davenport area
(see Figure 80).
Line outages in the Davenport area:
Have no material impact on Heywood transfer capability. Comparison of Figure 81 and Figure
82 provides further evidence that the loss of these lines would likely have had no noticeable
impact on reactive power margin at South East substation.
Would have been unlikely to have resulted in a noticeable voltage decline at South East
area. Figure 81 and Figure 82 indicate the presence of sufficient reactive power margin at
this substation.
Transfer capability from Adelaide to Davenport
The following key observations can be made about the transfer capability between Davenport and
Adelaide area (see Appendix M.1.1):
Line outages in the Davenport area would likely have impacted the ability to maintain Davenport
voltages. Comparison between Figure 84 and Figure 85 illustrates a reduction in reactive power
margin at Davenport with the loss of three and four lines. Despite this reduction in reactive power
margin, the system could probably have been operated within the envelope defined in System
Standards specified in Schedule 5.1a of the NER, with all voltages within the continuous
uninterrupted operating range.
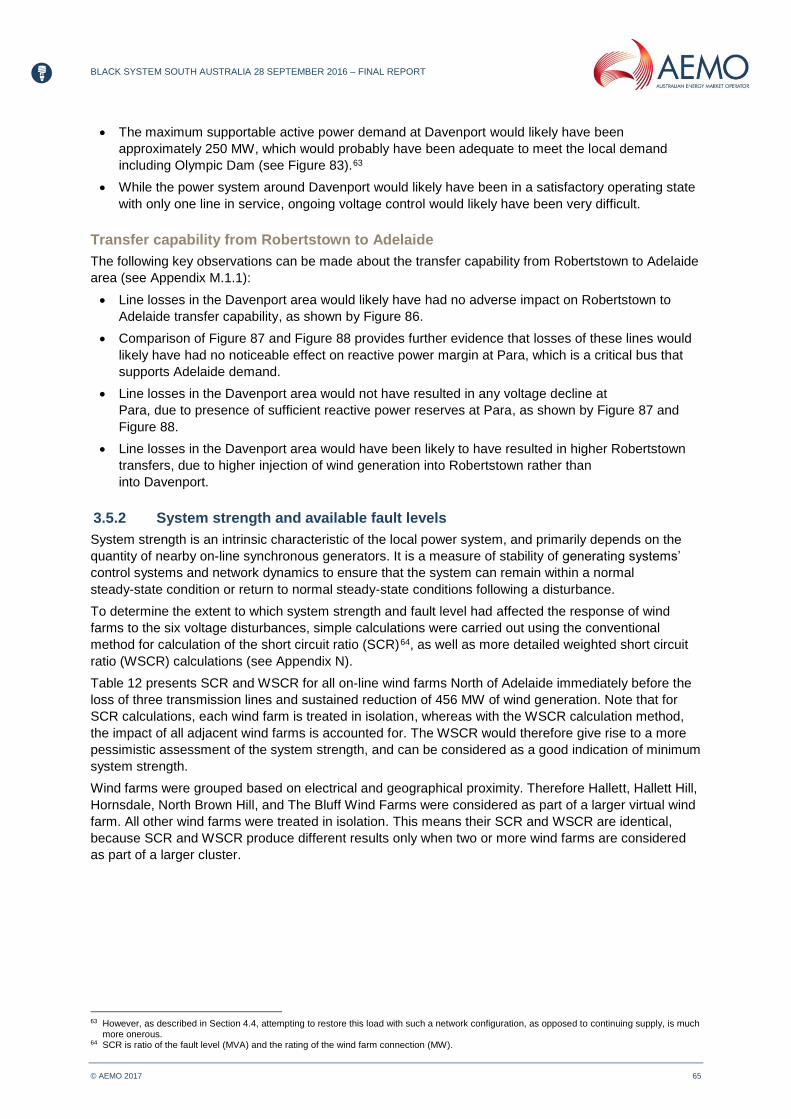
BLACK SYSTEM SOUTH AUSTRALIA 28 SEPTEMBER 2016 – FINAL REPORT
© AEMO 2017 65
The maximum supportable active power demand at Davenport would likely have been
approximately 250 MW, which would probably have been adequate to meet the local demand
including Olympic Dam (see Figure 83).62F
63
While the power system around Davenport would likely have been in a satisfactory operating state
with only one line in service, ongoing voltage control would likely have been very difficult.
Transfer capability from Robertstown to Adelaide
The following key observations can be made about the transfer capability from Robertstown to Adelaide
area (see Appendix M.1.1):
Line losses in the Davenport area would likely have had no adverse impact on Robertstown to
Adelaide transfer capability, as shown by Figure 86.
Comparison of Figure 87 and Figure 88 provides further evidence that losses of these lines would
likely have had no noticeable effect on reactive power margin at Para, which is a critical bus that
supports Adelaide demand.
Line losses in the Davenport area would not have resulted in any voltage decline at
Para, due to presence of sufficient reactive power reserves at Para, as shown by Figure 87 and
Figure 88.
Line losses in the Davenport area would have been likely to have resulted in higher Robertstown
transfers, due to higher injection of wind generation into Robertstown rather than
into Davenport.
3.5.2 System strength and available fault levels
System strength is an intrinsic characteristic of the local power system, and primarily depends on the
quantity of nearby on-line synchronous generators. It is a measure of stability of generating systems’
control systems and network dynamics to ensure that the system can remain within a normal
steady-state condition or return to normal steady-state conditions following a disturbance.
To determine the extent to which system strength and fault level had affected the response of wind
farms to the six voltage disturbances, simple calculations were carried out using the conventional
method for calculation of the short circuit ratio (SCR) 63F
64, as well as more detailed weighted short circuit
ratio (WSCR) calculations (see Appendix N).
Table 12 presents SCR and WSCR for all on-line wind farms North of Adelaide immediately before the
loss of three transmission lines and sustained reduction of 456 MW of wind generation. Note that for
SCR calculations, each wind farm is treated in isolation, whereas with the WSCR calculation method,
the impact of all adjacent wind farms is accounted for. The WSCR would therefore give rise to a more
pessimistic assessment of the system strength, and can be considered as a good indication of minimum
system strength.
Wind farms were grouped based on electrical and geographical proximity. Therefore Hallett, Hallett Hill,
Hornsdale, North Brown Hill, and The Bluff Wind Farms were considered as part of a larger virtual wind
farm. All other wind farms were treated in isolation. This means their SCR and WSCR are identical,
because SCR and WSCR produce different results only when two or more wind farms are considered
as part of a larger cluster.
63 However, as described in Section 4.4, attempting to restore this load with such a network configuration, as opposed to continuing supply, is much
more onerous. 64 SCR is ratio of the fault level (MVA) and the rating of the wind farm connection (MW).

BLACK SYSTEM SOUTH AUSTRALIA 28 SEPTEMBER 2016 – FINAL REPORT
© AEMO 2017 66
Table 12 Short circuit ratio and weighted short circuit ratio calculated for all on-line wind farms
north of Adelaide
Wind farm SCR at 33 kV wind turbine terminals WSCR at 33 kV wind turbine terminals
Clements Gap 11 11
Hallett 6.9 2.9
Hallett Hill 6 2.8
Hornsdale 6.2 3.1
North Brown Hill 5.2 2.8
The Bluff 10.3 3.4
Mt Millar 2 2
Snowtown 2 4.6 4.6
Waterloo 4.4 4.4
Comparison of these calculations with the minimum SCR withstand capability of wind turbines, as
confirmed by each original equipment manufacturer (OEM) to AEMO, demonstrates that all wind
turbines were operating above the minimum SCR for which they were designed.
All wind farms successfully rode through the voltage disturbances until the pre-set protection limit of
three or six was reached or exceeded, and did not indicate any issues that manifest specifically when
operating in low system strength conditions.
Transient stability limit equations are calculated by ElectraNet and provided to AEMO. ElectraNet has
advised that the most recent limit equations provided to AEMO have considered higher renewable
penetration levels, and hence a weaker system. A weaker system will generally result in reduced
transfer limits.
There would likely have been sufficient system strength and available fault level provided the Heywood
Interconnector remained in service.
However, this may not have been the case if separation had occurred, even if the resulting island
remained viable.
This risk has been investigated further, as set out in Appendix X.3.1. AEMO’s investigations have
indicated that when SA is islanded with a moderately low level of synchronous generation, the system
strength at the HV terminals of wind turbines for a number of wind farms will fall below their minimum
design level. This means that the wind turbines at these locations may not be able to ride through
credible voltage disturbances, creating additional risks for islanded operation.
AEMO also investigated the impact of low system strength on protection operation, as set out in
Appendix X.3.4. These investigations show that, for islanded operation with moderately low levels of
synchronous generation, more than 10% of transmission line protection can be prone to mal-operation
or failure to operate conditions.
3.6 Conclusions
Electrical faults
Close inspection of the BOM’s report 64F
65 and AEMO’s internal review of lightning protection data
demonstrates it is unlikely that lightning strikes caused any of the five electrical faults and six voltage
disturbances. Information obtained from the BOM indicates tornadoes as a very likely cause of the five
electrical faults that occurred before the system separation.
65 BOM. Severe thunderstorm and tornado outbreak South Australia 28 September 2016. Available at:
http://www.bom.gov.au/announcements/sevwx/sa/Severe_Thunderstorm_and_Tornado_Outbreak_28_September_2016.pdf.

BLACK SYSTEM SOUTH AUSTRALIA 28 SEPTEMBER 2016 – FINAL REPORT
© AEMO 2017 67
Generation reduction
Investigations now show that there was a total sustained reduction of 456 MW of wind generation
across nine wind farms, plus further transient reductions of 42 MW after the clearance of the sixth
voltage disturbance.
Nine wind farms exhibited sustained power reduction during the six voltage disturbances on the
transmission system:
Eight of these wind farms are categorised as Group A and B in this report. Group A and B wind
turbines have a protection system that takes action if the number of ride-through events in a
specific period exceeds a pre-set limit. The pre-set protection limit for these wind farms was
unknown to AEMO prior to this event.
Wind turbines categorised as Group C do not have any pre-set limit for the number of permitted
fault ride-through events. The sustained power reduction by Group C wind turbines was caused by
zero power mode fault ride-through response of those turbines (resulting in both active and
reactive power to drop to zero temporarily) and slow active power recovery of 8 MW/s.
In addition to 456 MW of sustained reduction in wind generation, 42 MW of transient reduction was
experienced due to natural fault ride-through response of remaining wind farms which do not
immediately recover active power to pre-event level.
System separation
The sustained loss of 456 MW of generation, and an additional temporary loss of 42 MW of generation,
increased flows on the Heywood Interconnector. This caused the relative voltage phase angle of the
Heywood Interconnector measured at SESS, and that of the remainder of the SA power system, to
exceed 90 degrees immediately before the system separation. This is an indicator of transient instability
or loss of synchronism between the groups of generators in SA and those in the rest of the NEM. At the
same time, and for the same reason, voltages across the SA power system started to decline.
The Heywood Interconnector uses an automatic protection mechanism which disconnects SA from the
remainder of the NEM when a loss of synchronism is detected. This protective function operates based
on the ratio of voltage to current (impedance). Declining system voltages and increased flow over the
Heywood Interconnector resulted in the apparent impedance seen by the loss of synchronism relay
reaching its trip setting. This led to correct operation of the loss of synchronism relay, and disconnection
of the Heywood Interconnector.
Voltage instability
A rapid decline in voltage across the SA network was observed immediately prior to the tripping of the
Heywood Interconnector. This rapid voltage decline was consistent across the SA transmission network
from the south-east to the north.
This observed reduction in network voltages is consistent with the loss of synchronism between the SA
power system and the remainder of the NEM caused by the relative phase angle between the two
systems exceeding 90 degrees.
Once separated from the rest of the NEM, network voltages within SA momentarily experienced minor
levels of temporary over voltages, before the rapid frequency fall led to the Black System.
Voltage instability began after clearance of the sixth voltage disturbance and sustained generation
reduction of 260 MW associated with three wind farms (Groups B and C). This indicates that system
voltages were stable and would likely have remained stable if angular instability and accompanying
rapid decline in the voltage, due to loss of wind generation, had not occurred.
Frequency instability
Following separation from Victoria, voltages across SA momentarily returned to the continuous
uninterrupted operating range. However, a viable island could not be established and voltages and
frequencies collapsed shortly after across SA.
BLACK SYSTEM SOUTH AUSTRALIA 28 SEPTEMBER 2016 – FINAL REPORT
© AEMO 2017 68
The key reason for the failure of the five on-line synchronous generators and five remaining wind farms
to form a viable island was that frequency in various SA nodes fell rapidly following loss of the Heywood
Interconnector. The frequency dropped below 47 Hz in most parts of the SA island, at which point
synchronous generators and wind farms are not required to remain connected (see clause S5.2.5.3 of
the NER).
This rapid decline in frequency stemmed from 966 MW net loss of supply (510 MW on the Heywood
Interconnector and 456 MW of wind generation). The resultant RoCoF of approximately 6 Hz/s was well
above the 3 Hz/s level where the UFLS could be expected to operate sufficiently quickly to maintain SA
frequency above 47 Hz.
Historically, the RoCoF following a separation between SA and Victoria has been below 3 Hz/s, which
has allowed UFLS to operate and avoid a total black system. However, during this event, the
proportionally low amount of conventional generation dispatched in SA at the time of separation, and
the subsequent low inertia, resulted in a higher RoCoF than had been experienced during previous
separation events.
Without any substantial load shedding following the system separation (see Section 3.3.3), the
remaining generation was much smaller than the connected load and unable to maintain the islanded
system frequency. As a result a total black system occurred.
This would likely have occurred even if the RoCOF was low enough to ensure successful operation of
UFLS scheme, resulting in 60% of SA load being shed before frequency fell to 47.0 Hz. This is because
the remaining load of approximately 800 MW, after UFLS action, may still have been too great for the
remaining generation to maintain the islanded system frequency.
At the point of separation, frequency collapse and consequent Black System was therefore inevitable.

BLACK SYSTEM SOUTH AUSTRALIA 28 SEPTEMBER 2016 – FINAL REPORT
© AEMO 2017 69
4. RESTORATION
This chapter sets out the roles and responsibilities of the different organisations involved, and details of
AEMO’s restoration strategy used to restore the power system and load in SA. More detail on the
restoration process is in Appendix Q.
AEMO would like to acknowledge the efforts of all parties involved during the restoration process, and
their contribution in restoring the power system and customer load in difficult circumstances. See
Appendix O for a summary of the roles and responsibilities of the various organisations involved.
Where information has been updated since AEMO published the previous report in December 2016,
these points are highlighted.
To summarise, Figure 23 illustrates the restoration of consumer load following the Black System, as a
comparison between the forecast load for SA and the load actually supplied.
Figure 23 Comparison of forecast and actual load
4.1 Restoration strategy
4.1.1 General concepts
The basic restoration sequence can be broken down into three major steps, each of which must be
completed before moving onto the next. These stages are:
1. Secure and make safe the power system.
2. Provide auxiliary supply to power stations.
3. Load restoration.
Appendix Q gives an overview of the restoration process.
The primary objective of any system restart plan is to provide auxiliary supply to generating units to
allow them to commence their restart processes as quickly as possible. This is done by restoring
transmission networks between the generating units that will provide system restart ancillary services
(SRAS) and other power stations’ auxiliary loads. Other load may be restored during this process, but
only if it is required to stabilise the power system.

BLACK SYSTEM SOUTH AUSTRALIA 28 SEPTEMBER 2016 – FINAL REPORT
© AEMO 2017 70
The restoration of the power system must be undertaken as quickly as possible, but it must also be
systematic and deliberate to avoid additional disruptions that would potentially extend the duration of
the restart process.
4.1.2 Safety considerations
Proceeding without a clear understanding of the status of the network and what is available could
result in safety risks to the public and industry personnel, and damage to the power system and
generating units.
Once the status of the power system is assessed, preparation for system restoration may commence.
This includes making equipment safe prior to any restoration activities, through liaison with TNSPs,
distribution network service providers (DNSPs), and Generators.
Each step in the process must be implemented, assessed, and confirmed before proceeding to the next
stage. This is critical due to the potentially unstable state of the partially restored power system.
4.2 Restoration sequence of events
At 1630 hrs on 28 September 2016, AEMO and ElectraNet agreed on a restoration strategy. The
strategy consisted of using two separate plans in parallel to restore auxiliary supply to the power
stations in the Torrens Island area and high priority loads:
One plan was to use the SRAS65 F
66 at Quarantine Power Station 66 F
67 (QPS).
The second plan was to import electricity to SA through the Heywood Interconnector
from Victoria.
This was the quickest and safest way to restore supply to SA67F
68, and allowed segregation between
restart paths to provide another level of redundancy, in case one method encountered difficulties.
AEMO initially excluded the northern areas of the state from the restoration process, due to extensive
damage to transmission assets in the area. A priority safety concern was reports of transmission lines
down over roads, north of the Hummocks–Waterloo–Robertstown lines.
In accordance with standard industry practices to protect public safety and the safety of ElectraNet’s
field crews, the transmission lines north of the Adelaide metropolitan area could not be re-energised
before visual inspection. Continued poor weather conditions and high winds kept helicopters grounded,
making slower ground patrols of the transmission network necessary. This was not completed until the
next day.
Chronological details of the restoration process are in Appendix R.
4.2.1 Use of SRAS provided by Quarantine Power Station
AEMO issued an instruction to QPS to provide SRAS at 1637 hrs. Limited auxiliary supplies were
provided to the Torrens Island A and Torrens Island B power stations by 1713 hrs.
Due to problems with SRAS from QPS, the provision of auxiliary supply from the SRAS was not
completed before supply to the Torrens Island area was made available from the Heywood
Interconnector. This is discussed further in Chapter 5.
4.2.2 Use of interconnection to Victoria
There are two interconnections between SA and Victoria:
The Heywood AC Interconnector consists of two parallel 275 kV transmission lines between
Heywood Substation in Victoria and South East Substation in SA. These lines remained energised
from Heywood after the Black System.
66 Details of SRAS contracts are normally considered as confidential information, but AEMO has obtained permission from the operators of the
SRAS in SA to provide limited details. 67 See Chapter 5 for further information on the SRAS. 68 Wind farms cannot be used in the initial stages of a power system restoration for technical reasons including the variable nature of their output.
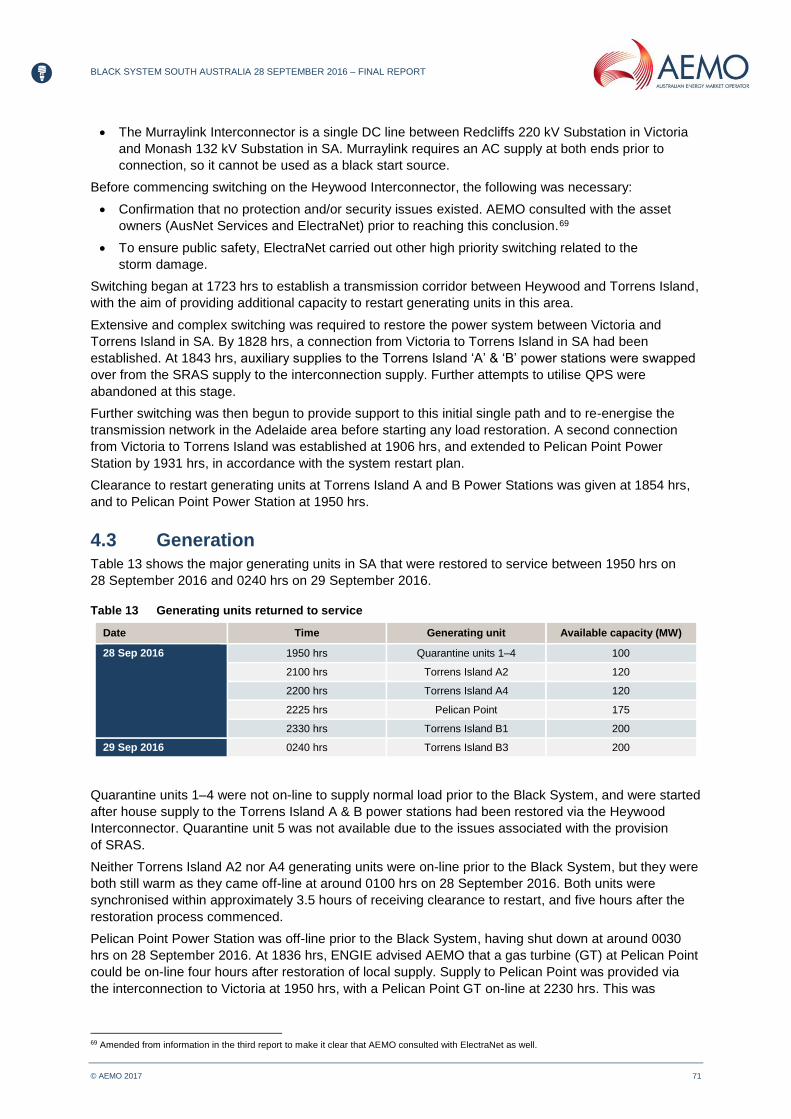
BLACK SYSTEM SOUTH AUSTRALIA 28 SEPTEMBER 2016 – FINAL REPORT
© AEMO 2017 71
The Murraylink Interconnector is a single DC line between Redcliffs 220 kV Substation in Victoria
and Monash 132 kV Substation in SA. Murraylink requires an AC supply at both ends prior to
connection, so it cannot be used as a black start source.
Before commencing switching on the Heywood Interconnector, the following was necessary:
Confirmation that no protection and/or security issues existed. AEMO consulted with the asset
owners (AusNet Services and ElectraNet) prior to reaching this conclusion.68F
69
To ensure public safety, ElectraNet carried out other high priority switching related to the
storm damage.
Switching began at 1723 hrs to establish a transmission corridor between Heywood and Torrens Island,
with the aim of providing additional capacity to restart generating units in this area.
Extensive and complex switching was required to restore the power system between Victoria and
Torrens Island in SA. By 1828 hrs, a connection from Victoria to Torrens Island in SA had been
established. At 1843 hrs, auxiliary supplies to the Torrens Island ‘A’ & ‘B’ power stations were swapped
over from the SRAS supply to the interconnection supply. Further attempts to utilise QPS were
abandoned at this stage.
Further switching was then begun to provide support to this initial single path and to re-energise the
transmission network in the Adelaide area before starting any load restoration. A second connection
from Victoria to Torrens Island was established at 1906 hrs, and extended to Pelican Point Power
Station by 1931 hrs, in accordance with the system restart plan.
Clearance to restart generating units at Torrens Island A and B Power Stations was given at 1854 hrs,
and to Pelican Point Power Station at 1950 hrs.
4.3 Generation
Table 13 shows the major generating units in SA that were restored to service between 1950 hrs on
28 September 2016 and 0240 hrs on 29 September 2016.
Table 13 Generating units returned to service
Date Time Generating unit Available capacity (MW)
28 Sep 2016 1950 hrs Quarantine units 1–4 100
2100 hrs Torrens Island A2 120
2200 hrs Torrens Island A4 120
2225 hrs Pelican Point 175
2330 hrs Torrens Island B1 200
29 Sep 2016 0240 hrs Torrens Island B3 200
Quarantine units 1–4 were not on-line to supply normal load prior to the Black System, and were started
after house supply to the Torrens Island A & B power stations had been restored via the Heywood
Interconnector. Quarantine unit 5 was not available due to the issues associated with the provision
of SRAS.
Neither Torrens Island A2 nor A4 generating units were on-line prior to the Black System, but they were
both still warm as they came off-line at around 0100 hrs on 28 September 2016. Both units were
synchronised within approximately 3.5 hours of receiving clearance to restart, and five hours after the
restoration process commenced.
Pelican Point Power Station was off-line prior to the Black System, having shut down at around 0030
hrs on 28 September 2016. At 1836 hrs, ENGIE advised AEMO that a gas turbine (GT) at Pelican Point
could be on-line four hours after restoration of local supply. Supply to Pelican Point was provided via
the interconnection to Victoria at 1950 hrs, with a Pelican Point GT on-line at 2230 hrs. This was
69 Amended from information in the third report to make it clear that AEMO consulted with ElectraNet as well.

BLACK SYSTEM SOUTH AUSTRALIA 28 SEPTEMBER 2016 – FINAL REPORT
© AEMO 2017 72
approximately 2.5 hours after auxiliary supply was restored, and six hours after the restoration
process commenced.
Both of the Torrens Island B units were on-line at the time of the Black System. Full auxiliary supply
was restored at 1843 hrs, just under 2.5 hours after the units tripped. The first unit was synchronised
approximately five hours after the event, and the second unit eight hours after the event.
Appendix S shows the output of each of these units. There were no unexpected delays in ramping to
maximum capability of the particular generating unit. The ramp rates of all units were in accordance
with expectations during normal operation.
Figure 24 shows the total output of the generating units listed in Table 13 versus the availability of
the units.
Figure 24 Total unit generating MW output versus availability
Attempts were made to start the Dry Creek Power Station 69F
70, however this failed due to problems with
the auxiliary supply switchboards at the power station.
Osborne Power Station was not available due to ongoing maintenance works.
In accordance with AEMO’s system restart procedures, wind farms were not reconnected in the early
stages of the restoration process due to the potential impact of the variable nature of their output on
frequency and voltage control. The Lake Bonney wind farms were given clearance to reconnect at
around 0100 hrs on 29 September 2016 to assist with voltage control. Other wind farms were given
clearance to reconnect when connections and transmission capacity became available.
4.3.1 Generation delays
If SRAS from QPS had operated as expected, clearance to restart the Torrens Island generating units
would likely have been given approximately one hour earlier, at 1730 hrs. AGL 70F
71 has advised AEMO
that if clearance to restart generating units had been given earlier, it is likely the generating units would
have been returned to service earlier.
Similar delays, for the same reason, were experienced with restoring generation at Pelican Point
Power Station.
70 Dry Creek Power Station has three 45 MW gas turbine units. 71 AGL SA Generation Pty Ltd is the operator of the Torrens Island A & B power stations.
BLACK SYSTEM SOUTH AUSTRALIA 28 SEPTEMBER 2016 – FINAL REPORT
© AEMO 2017 73
4.3.2 Port Lincoln area
This section is based on information provided by ElectraNet and ENGIE.71F
72
Port Lincoln has three generating units that are capable of supplying the local load when the
transmission network connection is unavailable.
On 27 September 2016, in advance of the extreme weather event, all three Port Lincoln units
underwent successful test runs. During this testing, all of the units successfully synchronised and no
alarms, trips, or failed starts occurred.
Following the Black System, ElectraNet advised ENGIE that the Port Lincoln generating units were to
be started in accordance with its Network Support Agreement. 72F
73 All three generating units were
successfully started, and supply to the Port Lincoln load was restored at 1915 hrs on 28 September
2016. Port Lincoln Unit 3 was being used to manage the frequency in this small islanded network.
At 0053 hrs on 29 September 2016, Port Lincoln unit 1 and unit 2 both tripped unexpectedly. Following
the trip of units 1 and 2, unit 3 was taken off line due to frequency control issues. This resulted in the
loss of supply to the Port Lincoln area.
A number of attempts were made to start unit 3 on 30 September, however, the unit continued to
experience frequency control issues. Unit 3 was returned to service at 1505 hrs on 30 September and
was able to generate power, although the frequency control issues were continuing.
Due to damage to the transmission network between Port Lincoln and Yadnarie, the Port Lincoln
generation could not be utilised elsewhere.
At 2048 hrs on 30 September, following repair of the Port Lincoln to Yadnarie transmission line, unit 3
was shut down. This allowed the reconnection of the Port Lincoln load to the main transmission network
at 2055 hrs on 30 September, with all load being restored in the Port Lincoln area shortly thereafter.
Following further adjustments to unit 3, it was made available for service on 1 October. Units 1 and 2
were made available for service on 8 October.
Following the Black System, ENGIE has investigated the operation of the Port Lincoln units during the
event and subsequent restoration.
The failure of units 1 and 2 resulted from extreme weather conditions, including extreme rainfall, wind
and lightning strikes. Unit 3 was subsequently forced to be taken offline when stability issues were
experienced (these stability issues were only experienced following the trip of units 1 and 2).
ENGIE has subsequently carried out a number of actions, including review and adjustment of the
control systems related to the frequency control response on unit 3, procuring a new replacement
generator CB for unit 3 and enhanced monitoring of the transformer terminal box to avoid future
moisture ingress.
4.4 Load restoration
Load restoration commenced at approximately 1900 hrs on 29 September 2016.
Load restoration was initially achieved via the Heywood Interconnector, and supplemented by
generation in SA as it became available.
Load restoration was halted temporarily at around 2040 hrs, because flow on the interconnector was
around 100 MW above the interconnector limit of 300 MW.73F
74 Load restoration began again at around
2115 hrs, as generation from the power stations on Torrens Island became available.
By 2030 hrs (four hours after the Black System), approximately 40% of the load that was available for
restoration was restored. By midnight on 28 September 2016 (7.5 hours after the Black System),
approximately 1,000 MW or 80–90% of load that could be restored had been restored.74F
75
72 Synergen Power Pty Ltd is the operator of the Port Lincoln Power Station. ENGIE S.A. is the majority ultimate owner of Synergen. 73 This is a contractual agreement between the operator of the Port Lincoln generator and ElectraNet. This agreement is normally activated by
ElectraNet when the single 132 kV transmission line supplying Port Lincoln is out of service. 74 This limit was based on conservative estimates of the system capability at the time. The limit was increased to 400 MW at 2050 hrs. 75 Or approximately 64% of the load at the same time the previous day.

BLACK SYSTEM SOUTH AUSTRALIA 28 SEPTEMBER 2016 – FINAL REPORT
© AEMO 2017 74
Although AEMO gave clearance to restore all remaining load at 1829 hrs on Thursday 29 September,
approximately 34% of forecast load (mainly in the northern part of the network) could not be restored
due to damage to the transmission network. Load in this area was progressively restored over the next
few days as repairs to the transmission network were completed.
Table 14 shows the restoration sequence of the major industrial loads fed from the Davenport
substation. The timing of the restoration was based on two factors:
Initially no connection was available to Davenport substation from the south, due to actual or
potential damage to all transmission lines. The first transmission line to Davenport (Davenport–
Bungama 275 kV line) was returned to service at 1215 hrs on 29 September after completion of
line patrols. This allowed partial restoration of the loads in the northern area of the state.
After the Davenport–Bungama line was returned to service, the capability of supplying the load in
the area was limited due to voltage control issues with only this single line in service.
Full load capability was restored after a second line to Davenport (Davenport–Belalie 275 kV line) was
returned to service after repairs at 1340 hrs on 10 October 2016.
All load in SA was restored by 11 October 2016.
Table 14 Load restoration in the northern part of the state
Connection Point / Load First energised Maximum permissible load Full load capability restored
Whyalla Central (Arrium Steel Works & SA Power Network customers))
1655 hrs on 29/09/2016 Initially 30 MW total pending further network studies by ElectraNet.
Increased to 46 MW total (Arrium Steel 26 MW) at 1800 hrs on 4/10/2016
1700 hrs on 10/10/2016
Middleback (Arrium Mine) 1930 hrs on 29/09/2016 2 MW (pending further network studies by ElectraNet)
1800 hrs on 4/10/2016
Olympic Dam 132 kV connection (this is a standby supply and not normally required if the 275 kV connection is available)
1840 hrs on 30/09/2016 20 MW (as requested by BHP)
1700 hrs on 6/10/2016
Whyalla Central (Arrium Ladle Metallurgical Furnace (LMF))
ElectraNet advised Arrium connection point available to energise at 1930 hrs on 5/10/2016. Arrium commenced taking load 0520 hrs on 6/10/2016.
20 MW (normal full load) 0520 hrs on 6/10/2016
Olympic Dam 275 kV connection
ElectraNet were ready to energise the line at 1615 hrs on 10/10/2016 but BHP requested a delay until 0730 hrs on 11/10/2016
No limit 0730 hrs on 11/10/2016
In Section 3.5.1, it was noted that the power system around Davenport would likely have been in a
satisfactory operating state with only one line in service, but that ongoing voltage control would have
been very difficult.
Because normal local voltage control capability was unavailable due to the remaining transmission
circuit outages, a conservative approach to load restoration in this area was required, until at least a
second line had been restored.

BLACK SYSTEM SOUTH AUSTRALIA 28 SEPTEMBER 2016 – FINAL REPORT
© AEMO 2017 75
There were other factors preventing the use of local generation:
Prior to 1215 hrs on 29 September 2016, there was no connection from the south to Davenport.
With the Yadnarie to Port Lincoln line out of service, Mt Millar Wind Farm would have been the
only generation available in the isolated system containing Port Augusta and Whyalla. It would
have been impossible to restore or maintain this island from this wind farm alone, because wind
turbines (and all other power electronic interfaced generation) require a stable voltage source
before they can connect to the network.
Similarly, Cathedral Rocks Wind Farm would not been able to restore or maintain supply to the
isolated load in the Port Lincoln area.
Following return to service of the first line to Davenport, system strength was very low in the Eyre
Peninsula. Return to service of the Cathedral Rocks and Mt Millar Wind Farms was delayed until
there was confidence that they could operate stably. This stems from the requirement for a
minimum fault level in the network before wind farm transformers can be energised and the
individual wind turbines can be connected and operate stably.
Figure 25 and Figure 26 show the restoration timelines, including events that had a material effect on
restoration progress.
Appendix U provides an overview of the progress of load restoration in the Adelaide
metropolitan area.
Figure 25 8 hours after the Black System
Load restoration continued on Thursday 29 September 2016 as transmission supply was restored to
some areas in the north.

BLACK SYSTEM SOUTH AUSTRALIA 28 SEPTEMBER 2016 – FINAL REPORT
© AEMO 2017 76
Figure 26 56 hours after the Black System
4.5 Information provided to Participants AEMO is required to keep the market advised on progress of the restoration.
Appendix T.1 contains a summary of the Market Notices issued from the Black System, during the
restart, up until ‘Clearance to restore last load block’.
AEMO also issued five media releases to ensure the market and the public were kept informed, listed in
Appendix T.2.75F
76
4.6 Conclusion of the Black System
In accordance with AEMO operating procedures 76F
77, for a black system condition to no longer exist, the
following criteria must be met:
Restoration of the power system has reached a level where all involuntary load shedding has
ceased and clearance to restore the last load block has been given, and
The emergency situation is expected to continue to improve within the part of the power system
declared as a black system.
At 1825 hrs on Thursday, 29 September 2016, AEMO considered the above criteria had been met and
advised the market that the black system condition no longer existed.
Although AEMO had given clearance to restore the last load block in SA, this does not mean all load
had been restored, only that sufficient supply capacity was available to restore all load as the
transmission network was restored. Some customers still remained without supply due to faults on the
transmission and distribution networks.
The market suspension in SA remained in place even though the black system condition no longer
existed. This is discussed further in Chapter 6.
76 Appendix T provides links to AEMO’s market notices and media releases on the AEMO website. 77 SO_OP 5000 – System restart Overview.

BLACK SYSTEM SOUTH AUSTRALIA 28 SEPTEMBER 2016 – FINAL REPORT
© AEMO 2017 77
4.7 Restoration performance
4.7.1 Best practice – international comparison
A review of recent black system events, within and outside of Australia, provides a useful point of
comparison. The following table highlights a number of recent events and the times it took for the
system operator to restore load.
Table 15 International comparison of black system restoration timeframes
Place Year Restoration time Proportion of load restored
South Australia 2016 7.5 hours 80–90%
Turkeya 2015 6.5 hours 80%
Northern Territoryb 2014 13 hours Majority
Malaysia (Sarawak)c 2013 6 hours Majority
Indiad 2012 (30 July) 7.5/13.5 hours 40/100%
2012 (31 July) 8.5 hours 100%
Hawaiic 2008 15 hours 80%
Italyc 2003 10/15 hours 70/99%
a entsoe – Report on blackout in Turkey on 31 March 2015: https://www.entsoe.eu/Documents/SOC%20documents/Regional_Groups_Continental_Europe/20150921_Black_Out_Report_v10_w.pdf.
b Utilities Commission of the Northern Territory – Independent investigation into the 12 March 2014 Darwin/Katherine system black: http://www.utilicom.nt.gov.au/PMS/Publications/UC-FR-DKSB-ATTB-1403.pdf.
c International Comparison of major blackouts and restoration – AEMC Reliability Panel: http://www.aemc.gov.au/getattachment/144f4579-f61f-41ea-803f-2048e2eb695d/DGA-Consulting-International-comparison-of-major-b.aspx.
d Report on the grid disturbance on 30 July 2012 and 31 July 2012: http://www.google.com.au/url?sa=t&rct=j&q=&esrc=s&source=web&cd=9&cad=rja&uact=8&ved=0ahUKEwiLt4z10NHQAhVDu7wKHQZQA-kQFghPMAg&url=http%3A%2F%2Fwww.cercind.gov.in%2F2012%2Forders%2FFinal_Report_Grid_Disturbance.pdf&usg=AFQjCNF3n-c9iDgA_5voNkw7bIeOrQ2_Xg.
BLACK SYSTEM SOUTH AUSTRALIA 28 SEPTEMBER 2016 – FINAL REPORT
© AEMO 2017 78
5. SYSTEM RESTART ANCILLARY SERVICES
This chapter reviews the performance of SRAS in SA during the Black System. See Appendix P for an
overview of SRAS.
AEMO has contracted with two SRAS providers in SA:
A service provided by Quarantine Power Station (QPS).
A service provided by Mintaro Power Station.
5.1 Performance of SRAS from QPS
Provision of SRAS from QPS is a staged process:
1. One of the smaller generating units is used to start the larger unit 5.
2. The larger generating unit is then used to energise the auxiliary supplies of other power stations in
the SA power network.
The smaller generating unit is not capable of energising the transformers required to energise the
275 kV transmission network.
AEMO instructed QPS to provide a restart service at 1637 hrs on 28 September 2016.
QPS successfully started the small generating unit then attempted to start the larger generating unit.
ElectraNet has informed AEMO a CB in the Torrens Island 66 kV switchyard connecting these two units
was closed but subsequently tripped. Following three attempts to close this CB, the stored energy for
operating the CB was depleted. This required manual intervention (ElectraNet field crew attendance) to
rectify. Until this was done, power could not be supplied to start QPS unit 5.
ElectraNet subsequently advised AEMO that the CB operated correctly and the inability to close
successfully was associated with a control signal from QPS unit 5.
The QPS SRAS was bid unavailable by the operator at 2200 hrs on 28 September 2016. The service
was made available again by the operator from 1100 hrs on 29 September 2016, after ElectraNet staff
attended the site on the morning of 29 September 2016 to reset the CB.
Investigation of the failure of the QPS SRAS concluded that the cause was related to the switching
sequence used by ElectraNet to connect the small generating unit to the larger one.
The restart sequence carried out on 28 September had a number of steps (see Figure 27):
1. All CBs in the Torrens Island 66 kV switchyard were opened, except for the two CBs that connect
the small generating unit and the large generating unit to the switchyard.
2. The smaller generating unit was then started and made fully available (spinning at full speed and
generating power at nominal voltage). This energised the associated busbar at the substation.
3. The three CBs connecting the two busbars together were then closed to energise the other busbar
and the generator transformer and auxiliary supply transformer of the large generating unit. When
the last of these three CBs was closed, the CB connecting the large generating unit tripped.
Origin Energy has advised AEMO that the control signal that resulted in the trip of the CB on the
large generating unit was the result of in-rush current on the generator transformer and
auxiliary transformer.

BLACK SYSTEM SOUTH AUSTRALIA 28 SEPTEMBER 2016 – FINAL REPORT
© AEMO 2017 79
Figure 27 Simplified schematic of QPS SRAS components
This problem had not been encountered during the test referred to in Appendix P or previous tests.
Investigations by AEMO, ElectraNet, and Origin Energy have determined that a different switching
sequence was used by ElectraNet on 28 September 2016 during the Black System than had been used
for previous tests:
The switching sequence used for the tests had the three CBs connecting the two busbars already
closed before the small generating unit was started. In this configuration, the smaller generating
unit was directly connected to the larger generating unit prior to the smaller generating unit
starting. When operating in this manner, the larger unit’s transformers were ‘soft-started’, meaning
the in-rush current is gradual (as opposed to an instantaneous surge).
The switching procedure used during the Black System connected the two generating units after
the smaller generating unit was operating at nominal voltage. This essentially resulted in a large
in-rush current on the larger unit’s transformers.
AEMO has reviewed why different switching procedures were used.
In March 2016, AEMO received from ElectraNet a set of detailed switching procedures intended for use
following a major supply disruption.77F
78 An updated version of these procedures was received in August
2016. One of these procedures is intended for use when SRAS is required to be delivered from QPS.
This switching procedure was used by ElectraNet on 28 September 2016.
However, ElectraNet provided a different procedure for use when testing the QPS SRAS. This
procedure was written on the basis that a ‘soft’ start on QPS unit 5 was possible and has been used for
at least the last two years.
The difference in the switching sequence is subtle, and relates to how ElectraNet manages the risks
associated with potential damage to a customer’s plant as a result of abnormal voltages during the
restart process. The switching procedure for testing manages this risk by opening an isolator, while the
switching procedure used following a major supply disruption manages the risk by opening CBs. This
isolator can only be operated ‘dead’, that is, there is no voltage on either side. While this is possible
under test conditions, as the 66 kV switchyard is isolated again at the end of the test, it is not possible
during an actual restart condition.
Although AEMO had a copy of both procedures, neither the Origin Energy, nor the AEMO, staff involved
in SRAS testing were aware the procedures were subtly different.
As an interim measure, ElectraNet has agreed to use a switching procedure similar to the one used for
testing to allow the smaller generating unit to soft-start the larger generating unit. AEMO witnessed a
successful test using this procedure on 29 October 2016.
78 These are detailed switching procedures developed by ElectraNet in line with the requirements to convert AEMO’s broad instructions, as outlined
in the Regional System Restart procedures, into detailed switching sequences.
Torrens Island
Substation
Large generator
Busbar, line Transformer
CB Generator
Small generator
Quarantine P.S.
Generator
transformers
CB that opened
Auxiliary supplies
Auxilary
transformer

BLACK SYSTEM SOUTH AUSTRALIA 28 SEPTEMBER 2016 – FINAL REPORT
© AEMO 2017 80
Origin Energy has reviewed its protection settings and internal processes with a view to accommodating
ElectraNet’s ‘hard-start’ switching procedure, but this has not yet been tested by AEMO.
Although QPS unit 5 could not be started, from 1713 hrs on 28 September 2016, the small generating
unit was used to supply some auxiliary power to TIPS.
Power was restored to TIPS using the Heywood Interconnector at 1828 hrs on 28 September 2016.
At 1843 hrs, auxiliary supplies to TIPS A & B were swapped over from the QPS supply to the
interconnection supply. Attempts to utilise the QPS SRAS were abandoned at this stage, given that
QPS unit 5 could not be started until the CB in the Torrens Island switchyard was checked by
ElectraNet staff.
As noted above, none of the smaller generating units at QPS is capable of energising the transformers
between the 66 kV and 275 kV networks, or of restarting the larger thermal generating units on Torrens
Island. It may be possible to use a number of the smaller generating units together to provide the
SRAS, and this service was offered to AEMO by Origin Energy after the failure to start QPS unit 5.
While AEMO considered this at the time, it was determined this was an untested process and the risks
with trying to do this were unknown.
As noted in Section 4.3, the four smaller units at QPS were restarted later in the restoration process to
assist in the restoration of load.
5.2 Performance of SRAS from Mintaro
Following the Black System, the Mintaro emergency diesel generator automatically started in response
to the loss of supply from the network. This was in accordance with the power station’s normal
response to power outages, not in response to a request from AEMO. The emergency diesel generator
provides power supply to all auxiliaries of the main generating unit that supplies the SRAS. The main
generating unit at Mintaro cannot start without these auxiliary supplies.
ENGIE reported the emergency diesel generator tripped after only five seconds of operation, due to a
stator earth fault which severely damaged the diesel generator (see Figure 28). This made Mintaro
Power Station unavailable for service.
Multiple lightning strikes were recorded in the vicinity of Mintaro Power Station around the time of the
fault, including a cloud-to-ground strike in very close proximity.78 F
79 Although not conclusive, this is highly
suggestive of lightning being the cause of the fault.
Figure 28 Damage to Mintaro diesel generator stator windings
79 Based on information provided by Weatherzone, lightning strikes were recorded in the vicinity at 16:18:21 hrs and 16:18:29 hrs.

BLACK SYSTEM SOUTH AUSTRALIA 28 SEPTEMBER 2016 – FINAL REPORT
© AEMO 2017 81
ENGIE has installed a temporary replacement diesel generator at Mintaro Power Station. AEMO
witnessed a successful test of the Mintaro SRAS on 13 October 2016.
The faulty diesel generator had been repaired and a successful test of the Mintaro SRAS was
conducted on 14 March 2017.
The generating unit at Mintaro is not capable of restarting the large generating units in the Torrens
Island area alone, due to a combination of the electrical capacity of the generating unit and the
electrical distance from Torrens Island.
Mintaro can be used as an SRAS to either:
Start the Mintaro generating unit, and use it to restart a number of smaller generating units
such as Dry Creek or Quarantine unit 5, and then use this combined generation to restart the
larger units, or
Start the Mintaro generating unit, then synchronise it to the island created around QPS, and use
this combined generation to assist in restarting the larger units.
As most of these smaller generating units were also unavailable, the failure of Mintaro SRAS did not in
itself result in any delays to the restoration process.

BLACK SYSTEM SOUTH AUSTRALIA 28 SEPTEMBER 2016 – FINAL REPORT
© AEMO 2017 82
6. MARKET SUSPENSION AND SUBSEQUENT
OPERATION
This chapter outlines the market and system operation during the SA market suspension, and
subsequently to 8 March 2016 for those issues that were specific outcomes of this event.
6.1 Suspension of the market
Under clause 3.14.3 of the NER, AEMO may declare the spot market to be suspended in a region when
any of the following occur:
The power system in the region has collapsed to a black system.
AEMO has been directed by a participating jurisdiction to suspend the market following declaration
by that jurisdiction of a state of emergency.
AEMO determines that it has become impossible to operate the spot market in accordance with
the provisions of the NER.
Following the Black System, AEMO suspended the spot market in SA with effect from the trading
interval commencing at 1600 hrs on 28 September 2016.
During market suspension, AEMO monitors whether the cause of the suspension is continuing, and
whether it can resume operation of the spot market in accordance with the NER. AEMO moves to
resume the market when none of the three conditions apply and AEMO is satisfied that the possibility of
suspending the spot market within the next 24 hours due to the same cause is minimal.79F
80
The SA market suspension was lifted with effect from at 2330 hrs on 11 October 2016.
6.2 Sequence of events relevant to SA market suspension
Table 16 describes key events relevant to the spot market suspension in SA on
28 September 2016, including AEMO’s ongoing assessment of the market suspension criteria at
each point.
At 1748 hrs on 11 October 2016, AEMO was informed that the SA jurisdictional direction was revoked.
Market suspension was lifted at 2330 hrs on that day, after market participants had been provided with
adequate notice and readiness to resume was confirmed.
80 AEMO’s Failure of Market or Market Systems Procedure is available at: http://www.aemo.com.au/-
/media/Files/Electricity/NEM/Security_and_Reliability/Power_System_Ops/2016/SO_OP_3706---Failure-of-Market-or-Market-Systems.ashx.

BLACK SYSTEM SOUTH AUSTRALIA 28 SEPTEMBER 2016 – FINAL REPORT
© AEMO 2017 83
Table 16 Market suspension review points
Timing Review Point
Suspension Criteria
Market System black
Ministerial direction
Impossible to operate
Pre-event - - - Normal
28/09/2016
16:25
SA market suspended following the collapse of the power system in that region to a black system.
- Suspended
29/09/2016
18:25
Black system condition removed as clearance given to restore the last block of load.*
- - Suspended**
29/09/2016
20:39
AEMO directed to suspend the market in SA by Ministerial direction under the Essential Services Act 1981.
- Suspended
3/10/2016
23:46
AEMO reclassified the loss of a specific group of generating units in SA to be a credible contingency while investigation continues. AEMO is confident system and market can be managed through constraints and central dispatch processes.
- - Suspended
6/10/2016
15:05
SA Government advised AEMO that the Ministerial direction to maintain suspension is extended by a further seven days.
- - Suspended
11/10/2016
17:48
SA Government advised AEMO that the Ministerial direction to maintain suspension had been revoked. - - -
Normal market resumed from 22:30
* This does not mean all load had been restored, only that sufficient generation or interconnector capacity was available to restore all load as the transmission network was restored. Some customers still remained without supply due to faults on the transmission and distribution networks.
** SO_OP_3706 stipulates the resumption of the spot market is based on the satisfying general conditions including “The original cause of the market suspension has been eliminated or sufficient steps have been taken to exclude its influence on market processes and AEMO assesses that the possibility of suspending the spot market within next 24 hours due to the same cause is minimal”. At this time AEMO did not have adequate information that the original cause had been eliminated.
6.3 Pricing under market suspension
AEMO must determine the spot price and ancillary service prices in a suspended region, according to
clause 3.14.5 of the NER. During the SA market suspension, spot prices were determined in
accordance with a pre-published ‘suspension pricing schedule’ of average regional prices.
Under clause 3.14.5 and associated procedures, AEMO determines a weekly suspension pricing
schedule for each region on a rolling basis, published where possible 14 days before the first day to
which the schedule relates. These schedules include a price for each 30-minute trading interval in the
billing week, calculated as the average price in the region for each corresponding trading interval over
the previous four billing weeks.
Suspension prices in one region can impact spot prices in any neighbouring regions that have a power
flow towards the suspended region in any trading interval. AEMO must retrospectively calculate and
apply price adjustments for those regions.
While the calculation and publication of market suspension pricing schedules is an automated process,
the subsequent application in market systems and calculation and application of price effects in other
regions is performed manually. During the market suspension, AEMO performed these calculations
each business day for the previous day(s), and published the results to the AEMO website and via
Market Notices. 80F
81
81 Available at: http://www.aemo.com.au/Market-Notices.

BLACK SYSTEM SOUTH AUSTRALIA 28 SEPTEMBER 2016 – FINAL REPORT
© AEMO 2017 84
The new prices were uploaded directly into AEMO’s market systems and all settlement and prudential
processes were then re-triggered to calculate new settlement transactions and prudential support
requirements based on the revised prices.
While the suspension was in effect, all normal market settlement, prudential, and compensation
processes were applied using the revised market prices.
6.3.1 Spot pricing in SA during market suspension
Figure 29 illustrates the applicable SA prices for the period 16 September to 12 October 2016, covering
both normal market dispatch pricing and suspension pricing. Separate pricing schedules are calculated
for weekdays and weekend days to reflect differences in typical supply and demand patterns on
these days.
These prices apply to all market participants in SA, and the full schedule is provided on
AEMO’s website. 81 F
82
Figure 29 30-minute spot market price in SA since 16 September 2016
Note: Price spikes on weekends reflect price spikes that occurred during the four week price-averaging period prior to market suspension.
While these prices are not linked to the dispatch pattern of generation during the suspension, AEMO
requested that Generators continue to bid their plant into AEMO’s systems and follow dispatch
instructions unless otherwise instructed. 82F
83
This ensured that, subject to system security constraints, participants in SA continued to be dispatched
as close as possible to economic merit order.
6.3.2 Spot price impacts in other NEM regions
In accordance with clause 3.14.5(m) of the NER, when energy flows from other NEM regions towards a
suspended region, energy prices in those regions must be capped to ensure negative settlements
residue does not accrue.
Prices in those regions must not exceed the SA suspension price, scaled by the average loss factor
applicable to energy flow from their region towards SA.
82 Available at: http://aemo.com.au/Media-Centre/Prices-in-South-Australia. 83 Market Notice 55230, issued at 1250 hrs on 5 October 2016.
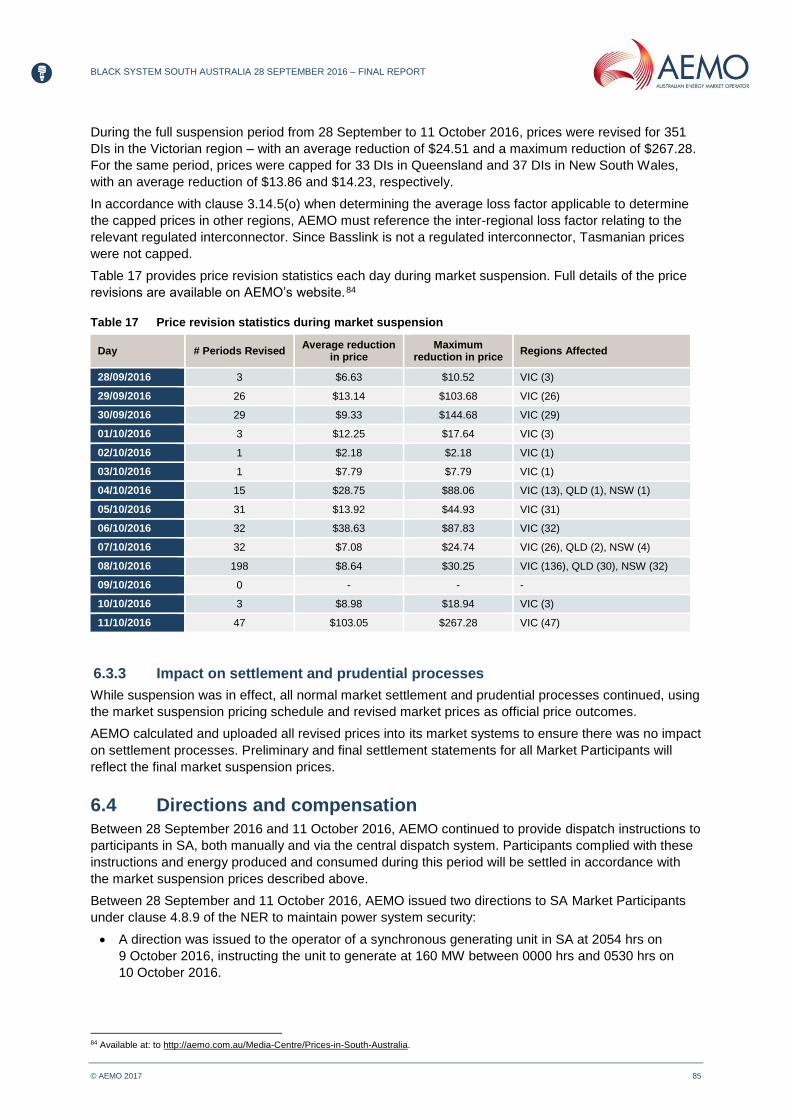
BLACK SYSTEM SOUTH AUSTRALIA 28 SEPTEMBER 2016 – FINAL REPORT
© AEMO 2017 85
During the full suspension period from 28 September to 11 October 2016, prices were revised for 351
DIs in the Victorian region – with an average reduction of $24.51 and a maximum reduction of $267.28.
For the same period, prices were capped for 33 DIs in Queensland and 37 DIs in New South Wales,
with an average reduction of $13.86 and $14.23, respectively.
In accordance with clause 3.14.5(o) when determining the average loss factor applicable to determine
the capped prices in other regions, AEMO must reference the inter-regional loss factor relating to the
relevant regulated interconnector. Since Basslink is not a regulated interconnector, Tasmanian prices
were not capped.
Table 17 provides price revision statistics each day during market suspension. Full details of the price
revisions are available on AEMO’s website. 83F
84
Table 17 Price revision statistics during market suspension
Day # Periods Revised Average reduction
in price Maximum
reduction in price Regions Affected
28/09/2016 3 $6.63 $10.52 VIC (3)
29/09/2016 26 $13.14 $103.68 VIC (26)
30/09/2016 29 $9.33 $144.68 VIC (29)
01/10/2016 3 $12.25 $17.64 VIC (3)
02/10/2016 1 $2.18 $2.18 VIC (1)
03/10/2016 1 $7.79 $7.79 VIC (1)
04/10/2016 15 $28.75 $88.06 VIC (13), QLD (1), NSW (1)
05/10/2016 31 $13.92 $44.93 VIC (31)
06/10/2016 32 $38.63 $87.83 VIC (32)
07/10/2016 32 $7.08 $24.74 VIC (26), QLD (2), NSW (4)
08/10/2016 198 $8.64 $30.25 VIC (136), QLD (30), NSW (32)
09/10/2016 0 - - -
10/10/2016 3 $8.98 $18.94 VIC (3)
11/10/2016 47 $103.05 $267.28 VIC (47)
6.3.3 Impact on settlement and prudential processes
While suspension was in effect, all normal market settlement and prudential processes continued, using
the market suspension pricing schedule and revised market prices as official price outcomes.
AEMO calculated and uploaded all revised prices into its market systems to ensure there was no impact
on settlement processes. Preliminary and final settlement statements for all Market Participants will
reflect the final market suspension prices.
6.4 Directions and compensation
Between 28 September 2016 and 11 October 2016, AEMO continued to provide dispatch instructions to
participants in SA, both manually and via the central dispatch system. Participants complied with these
instructions and energy produced and consumed during this period will be settled in accordance with
the market suspension prices described above.
Between 28 September and 11 October 2016, AEMO issued two directions to SA Market Participants
under clause 4.8.9 of the NER to maintain power system security:
A direction was issued to the operator of a synchronous generating unit in SA at 2054 hrs on
9 October 2016, instructing the unit to generate at 160 MW between 0000 hrs and 0530 hrs on
10 October 2016.
84 Available at: to http://aemo.com.au/Media-Centre/Prices-in-South-Australia.
BLACK SYSTEM SOUTH AUSTRALIA 28 SEPTEMBER 2016 – FINAL REPORT
© AEMO 2017 86
A direction was issued to the operator of a synchronous generating unit in SA at 1616 hrs on
11 October 2016, instructing the unit to synchronise and run to minimum generation (60 MW). This
direction was cancelled at 1906 hrs on 11 October 2016.
Market Participants directed under clause 4.8.9 may be entitled to compensation calculated in
accordance with the NER. AEMO will publish Direction Reports following the determination of final
compensation according to the Intervention Settlement Timetable.84F
85
6.5 Dispatch mechanism during market suspension
6.5.1 From 30 September 2016 until 4 October 2016
On 30 September 2016, AEMO implemented an operational strategy for generation dispatch during
market suspension. This provided the operational framework to manage SA’s network while the market
was suspended to ensure that the system remained secure and stable.
This operational strategy was developed by AEMO and shared with affected Registered Participants at
industry conferences and included the following key points:
All available slow start gas units would be dispatched at their minimum load.
Any extra generation that was required in SA for this period would be met by semi-scheduled and
non-scheduled wind farm generation.
If the wind generation was inadequate to make up this difference, scheduled generation would be
further utilised.
6.5.2 From 5 October 2016 until market resumption
On 5 October, AEMO issued Market Notice 55230, notifying the market of an update to the strategy.85F
86
The change was intended to assist in managing power system security through the use of network
constraint equations and to move towards a situation where the central dispatch system was more
reflective of how the system was being operated and generation was dispatched.
Key points were:
Where possible, dispatch instructions would be issued by the standard methods.
Unless otherwise instructed by AEMO, all SA scheduled and semi-scheduled generators had to
follow dispatch targets issued by the NEM dispatch engine (NEMDE).
6.6 Reserve management
6.6.1 From 30 September 2016 until 6 October 2016
While the root cause of the system collapse was still unknown, AEMO had to take all necessary
precautions to maximise its ability to maintain power system security and reliability.
SA contingency reserves were initially managed manually by maintaining sufficient headroom on the
Heywood Interconnector to cater for the largest credible contingency event. Victoria to SA flow was,
therefore, limited to 350 MW, which was approximately the secure interconnector limit minus the largest
SA generating unit, or Murraylink, if applicable.
In conjunction with the headroom on the Heywood Interconnector, dispatch constraint equations were
applied to ensure that the maximum single credible contingency event in SA was limited to 240 MW.
85 Intervention Settlement timetable is published on the AEMO website at http://www.aemo.com.au/Electricity/National-Electricity-Market-
NEM/Settlements-and-payments/Prudentials-and-payments/Settlement-calendars/Intervention-Settlement-Timetables. 86 As confidence increased in the NEMDE pre-dispatch and dispatch outcomes, it was decided to utilise NEMDE.
BLACK SYSTEM SOUTH AUSTRALIA 28 SEPTEMBER 2016 – FINAL REPORT
© AEMO 2017 87
6.6.2 From 6 October 2016 until Market resumption
From 6 October 2016 until market resumption, AEMO reverted to reserve management via the
normal Projected Assessment of System Adequacy (PASA) processes. As a result, the 350 MW limit on
the Heywood Interconnector was lifted on 6 October 2016.
6.7 Negative settlements residue management
6.7.1 From 30 September 2016 until market resumption
For the duration of the market suspension, AEMO restricted the net power flow from SA to Victoria to
0 MW. This was done to minimise the market distortion in the other regions.
The following constraint equations were invoked:
Heywood Interconnector 0 MW limit (SA to Vic). Constraint Set I-SV_000.
Murraylink Interconnector 0 MW limit (SA to Vic). Constraint Set I-SVML_000.
6.7.2 From 4 October 2016 until market resumption
The automatic negative settlements residue process was not producing correct results for the SA
to Victoria interconnection during the market suspension, because of the pricing mechanism applied
in SA.
Consequently, the following negative settlements residue constraint equations were blocked:
NRM_SA1_VIC1.
NRM_VIC1_SA1.
6.7.3 From 5 October 2016 until Market resumption
Due to the dynamic nature of the power system and generation response to market dispatch targets
across the NEM, it was not possible to prevent periods of power flow on the Heywood Interconnector in
the direction SA to Victoria, despite a 0 MW constraint.
In response to this, AEMO developed a dynamic constraint equation to further minimise power flow
from SA to Victoria:
Heywood Interconnector 0 MW limit (SA to Vic). Constraint Set I-SV_000_DYN.
This constraint equation works more effectively than the constraint equations mentioned in Section
6.7.2 as it will correct the target when the actual flows on the interconnector are over the limit.
Figure 30 identifies flows on the Murraylink and Heywood interconnectors and when the following
constraint sets were invoked:
Heywood Interconnector 0 MW limit (SA to Vic). Constraint Set I-SV_000.
Murraylink Interconnector 0 MW limit (SA to Vic). Constraint Set I-SVML_000.
Heywood Interconnector 0 MW limit (SA to Vic). Constraint Set I-SV_000_DYN.
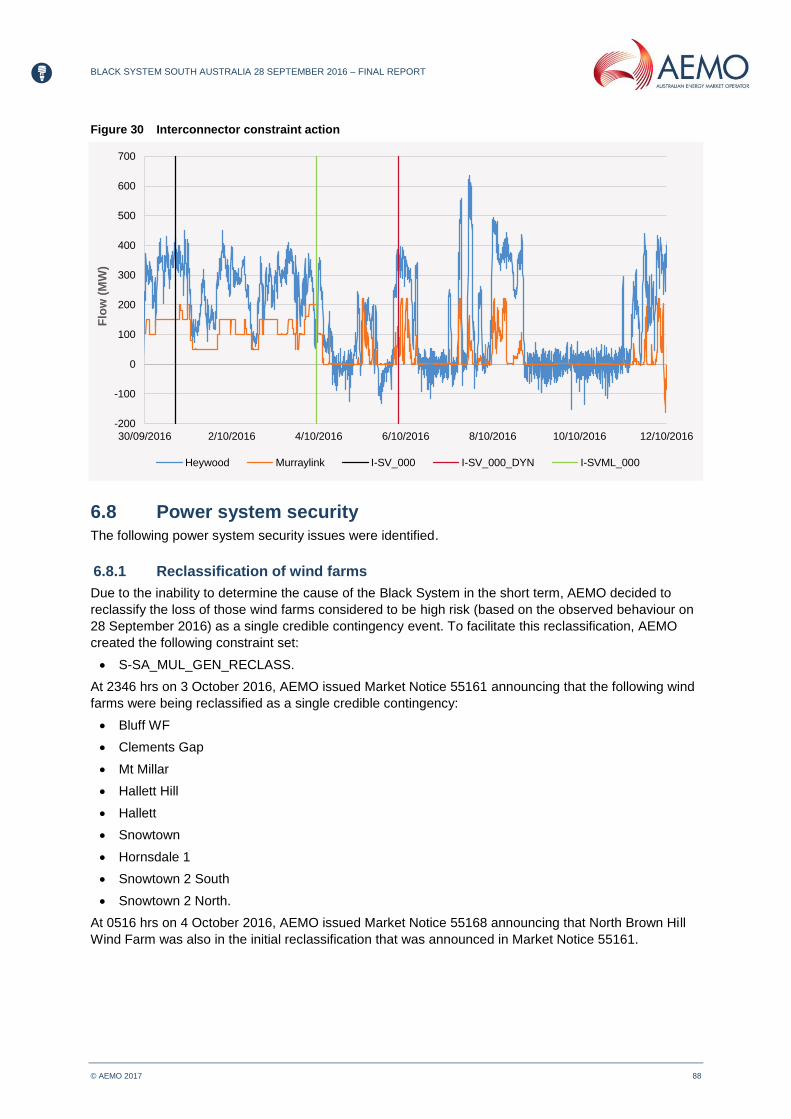
BLACK SYSTEM SOUTH AUSTRALIA 28 SEPTEMBER 2016 – FINAL REPORT
© AEMO 2017 88
Figure 30 Interconnector constraint action
6.8 Power system security The following power system security issues were identified.
6.8.1 Reclassification of wind farms
Due to the inability to determine the cause of the Black System in the short term, AEMO decided to
reclassify the loss of those wind farms considered to be high risk (based on the observed behaviour on
28 September 2016) as a single credible contingency event. To facilitate this reclassification, AEMO
created the following constraint set:
S-SA_MUL_GEN_RECLASS.
At 2346 hrs on 3 October 2016, AEMO issued Market Notice 55161 announcing that the following wind
farms were being reclassified as a single credible contingency:
Bluff WF
Clements Gap
Mt Millar
Hallett Hill
Hallett
Snowtown
Hornsdale 1
Snowtown 2 South
Snowtown 2 North.
At 0516 hrs on 4 October 2016, AEMO issued Market Notice 55168 announcing that North Brown Hill
Wind Farm was also in the initial reclassification that was announced in Market Notice 55161.
-200
-100
0
100
200
300
400
500
600
700
30/09/2016 2/10/2016 4/10/2016 6/10/2016 8/10/2016 10/10/2016 12/10/2016
Flo
w (
MW
)
Heywood Murraylink I-SV_000 I-SV_000_DYN I-SVML_000

BLACK SYSTEM SOUTH AUSTRALIA 28 SEPTEMBER 2016 – FINAL REPORT
© AEMO 2017 89
6.8.2 Changes to reclassification of wind farms
AEMO removed 86F
87 wind farms from the reclassification after they supplied AEMO with information about
taking action to ensure the cause of the generating unit trips had been addressed and AEMO had
accepted the changes as adequate. Table 18 details the reclassification changes.
Table 18 Wind farm reclassification changes
Date Action Taken Wind farm Market notice number
10 October 2016 Removed
Clements Gap
Snowtown
55328
11 October 2016 Removed Snowtown North
Snowtown South
Hornsdale
55336
24 December Removed Bluff
Hallett
Hallett Hill
North Brown Hill
56434
Five wind farms remained in the reclassification after this amendment.
Figure 31 identifies the total constrained value of wind farm generation as a result of these wind farm
reclassifications. This value may be the result of more than one constraint acting.
Figure 31 Reclassified wind farms – total constrained power
Due to AEMO’s inability to determine the cause of the Black System in the short term, it was not
possible to ascertain the exact generation requirement to ensure AEMO was meeting its obligations to
maintain power system security. 87F
88 However, as it was suspected that inertia and system strength may
have played a role in the system collapse, AEMO determined that the level of synchronous generation
on-line should not fall below the level on-line prior to the Black System.
From 3 October 2016, AEMO amended the secure technical envelope to require that a minimum of
three thermal synchronous generating units, each of not less than 100 MW installed capacity, must be
on-line at all times.
87 Clause of the NER 4.2.3A (h) states “…AEMO considers that the relevant facts and circumstances have changed so that the occurrence of that
credible contingency event is no longer reasonably possible”. 88 As defined in Chapter 4 of the NER. During the Market suspension period, the system was not insecure for longer than 30 minutes.
0
100
200
300
400
500
600
700
800
MW
constr
ain
ed
10 wind farms were reclassified.
2 wind farms were removed from reclassification.
3 additional wind farms were removed from reclassification.
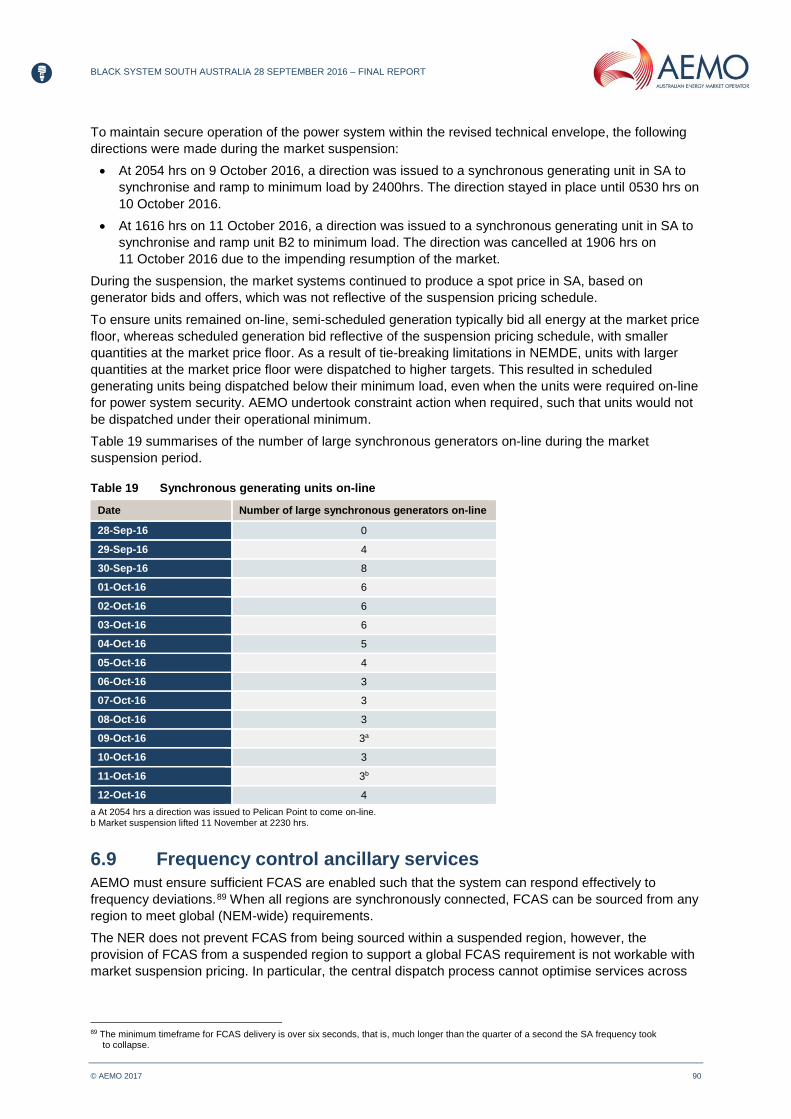
BLACK SYSTEM SOUTH AUSTRALIA 28 SEPTEMBER 2016 – FINAL REPORT
© AEMO 2017 90
To maintain secure operation of the power system within the revised technical envelope, the following
directions were made during the market suspension:
At 2054 hrs on 9 October 2016, a direction was issued to a synchronous generating unit in SA to
synchronise and ramp to minimum load by 2400hrs. The direction stayed in place until 0530 hrs on
10 October 2016.
At 1616 hrs on 11 October 2016, a direction was issued to a synchronous generating unit in SA to
synchronise and ramp unit B2 to minimum load. The direction was cancelled at 1906 hrs on
11 October 2016 due to the impending resumption of the market.
During the suspension, the market systems continued to produce a spot price in SA, based on
generator bids and offers, which was not reflective of the suspension pricing schedule.
To ensure units remained on-line, semi-scheduled generation typically bid all energy at the market price
floor, whereas scheduled generation bid reflective of the suspension pricing schedule, with smaller
quantities at the market price floor. As a result of tie-breaking limitations in NEMDE, units with larger
quantities at the market price floor were dispatched to higher targets. This resulted in scheduled
generating units being dispatched below their minimum load, even when the units were required on-line
for power system security. AEMO undertook constraint action when required, such that units would not
be dispatched under their operational minimum.
Table 19 summarises of the number of large synchronous generators on-line during the market
suspension period.
Table 19 Synchronous generating units on-line
Date Number of large synchronous generators on-line
28-Sep-16 0
29-Sep-16 4
30-Sep-16 8
01-Oct-16 6
02-Oct-16 6
03-Oct-16 6
04-Oct-16 5
05-Oct-16 4
06-Oct-16 3
07-Oct-16 3
08-Oct-16 3
09-Oct-16 3a
10-Oct-16 3
11-Oct-16 3b
12-Oct-16 4
a At 2054 hrs a direction was issued to Pelican Point to come on-line. b Market suspension lifted 11 November at 2230 hrs.
6.9 Frequency control ancillary services AEMO must ensure sufficient FCAS are enabled such that the system can respond effectively to
frequency deviations. 88F
89 When all regions are synchronously connected, FCAS can be sourced from any
region to meet global (NEM-wide) requirements.
The NER does not prevent FCAS from being sourced within a suspended region, however, the
provision of FCAS from a suspended region to support a global FCAS requirement is not workable with
market suspension pricing. In particular, the central dispatch process cannot optimise services across
89 The minimum timeframe for FCAS delivery is over six seconds, that is, much longer than the quarter of a second the SA frequency took
to collapse.

BLACK SYSTEM SOUTH AUSTRALIA 28 SEPTEMBER 2016 – FINAL REPORT
© AEMO 2017 91
both suspended and unsuspended markets. Global FCAS requirements were sourced from other NEM
regions during this period.
AEMO would still have sourced FCAS from registered ancillary service providers within SA if it became
necessary to do so to maintain power system security or reliability.
During the market suspension period, no local FCAS requirements arose and AEMO did not dispatch
FCAS from participants in SA.
6.10 Rate of Change of Frequency On 4 October 2016, AEMO received a ministerial direction that revised the secure technical envelope
as follows:
Expected RoCoF of the SA power system, in relation to the non-credible contingent trip of both
Heywood Interconnector circuits, must be limited at or below 3 Hz per second.
To maintain secure operation of the power system the following constraint equations were added to the
S-NIL constraint set:
V_S_NIL_ROCOF.
S_V_NIL_ROCOF.
These constraint equations limit flow on the Heywood Interconnector under conditions of low power
system inertia in the SA system.
Table 20 shows the proportion of time the constraint equations V_S_NIL_ROCOF and
S_V_NIL_ROCOF bound from 5 October 2016 to 9 March 2017.
Table 20 RoCoF constraint action
Constraint equation Number of binding intervals (DIs) Proportion of time
the constraint bound (approximate)
V_S_NIL_ROCOF 5982 15%
S_V_NIL_ROCOF 68 0.2%
On 12 October 2016, regulations were made in SA89F
90 under which ElectraNet was required to issue
limits advice to AEMO with substantially the same effect as the previous Ministerial direction. ElectraNet
provided that advice to AEMO on the same date, and this replaced the Ministerial direction after the
direction expired on 13 October 2016.
This RoCoF requirement remains in place.
6.11 Other issues experienced during market suspension
The lack of detailed procedures on how to operate the power system under extended periods of market
suspension was identified as an issue. This issue particularly relates to:
Merit order principles applicable when the dispatch engine is not usable or when directions
are required.
Management of reserves and FCAS.
Management of export limits and negative settlement residues.
Principles and processes for resuming market operation after suspension.
90 Electricity (General) (Provision of Limit Advice) Variation Regulations 2016 (SA). Available at:
https://www.legislation.sa.gov.au/LZ/V/R/2016/ELECTRICITY%20(GENERAL)%20(PROVISION%20OF%20LIMIT%20ADVICE)%20VARIATION%20REGULATIONS%202016_240/2016.240.UN.PDF.
BLACK SYSTEM SOUTH AUSTRALIA 28 SEPTEMBER 2016 – FINAL REPORT
© AEMO 2017 92
6.12 Resumption of market operation
AEMO took two steps during the suspension period to help prepare the market for an orderly
resumption of market operations:
1. On 1 October 2016, AEMO requested that Market Participants in SA continue to bid their units into
AEMO’s Electricity Market Management System (EMMS) as normal. This was to ensure that,
subject to power system security constraints, AEMO could instruct Market Participants in a way
that most closely represented economic merit order.
2. On 5 October 2016, AEMO requested that SA Market Participants follow instructions being issued
by its central dispatch system.
This orderly resumption was achieved by ensuring the Generators bid appropriately, ensuring the DFS
and AWEFS was functioning correctly and ensuring all constraint equations reflected the then-current
technical envelope.
At 1748 hrs on 11 October 2016, AEMO was advised that the Ministerial direction to suspend the spot
market had been lifted. At 1826 hrs, AEMO issued a Market Notice announcing that normal market
operation would resume from 2230 hrs.
From 1830 hrs, AEMO performed all necessary processes to ensure that bids, forecasts, and
suspension-related constraints were correctly represented in market and operational systems.
Pre-dispatch systems began to publish forecasts of resumed market outcomes from 2000 hrs on
11 October 2016. At 2230 hrs, spot market operation resumed in SA. AEMO continues to monitor price
and dispatch outcomes closely.
6.13 Changes in current operational strategy
AEMO implemented new arrangements to maintain power system security during periods of anticipated
low fault levels on 2 December 2016.90F
91
91 For further details see https://www.aemo.com.au/Electricity/National-Electricity-Market-NEM/Security-and-reliability/Power-system-operation.

BLACK SYSTEM SOUTH AUSTRALIA 28 SEPTEMBER 2016 – FINAL REPORT
© AEMO 2017 93
7. RECOMMENDATIONS
The Black System has raised a number of direct questions around the management of the power
system and the performance of generation in SA. It also raised broader questions of the resilience of
the SA power system in the context of the changing generation mix, and that was, in part, responsible
for the outcome the Black System.
Chapter 7 explores the lessons that can be learned from each stage of the Black System, the actions
AEMO recommends, and the measures AEMO is putting in place to address these issues.
Where each root cause is identifiable, current initiatives to address the challenges are outlined.
Where relevant, this chapter also notes which recommendations have been added or updated since the
third report.
AEMO is also continuing work to assess the longer-term needs of the NEM. This work is discussed
further in Chapter 8.
7.1 Scope of recommendations
These recommendations focus on practical measures to:
1. Reduce the risk of islanding of the SA region.
2. Increase the likelihood, that in the event of islanding, a stable electrical island can be sustained
in SA.
3. Improve performance of the system restart process.
4. Improve market and system operation processes required during periods of Market suspension.
5. Address other technical issues highlighted by this investigation.
These recommendations have taken into account:
Work already underway as part of the Future Power System Security (FPSS) Program.
Relevant proposed NER changes under consideration by the Australian Energy Market
Commission (AEMC).
The 2016 National Transmission Network Development Plan (NTNDP).
Any known proposals being made by other parties such as ElectraNet and the SA Government.
These recommendations do not cover areas that are outside of the scope of AEMO’s responsibility for
the SA region, such as asset design and maintenance.
7.2 Pre-event and event
The focus of recommendations in this area are on measures that, if they had been in place, might have
broken the chain of events which led to the Black System.
The following diagram summarises the chain of events in a very simplified manner, and also in generic
terms the type of measures that might have broken this chain of events.

BLACK SYSTEM SOUTH AUSTRALIA 28 SEPTEMBER 2016 – FINAL REPORT
© AEMO 2017 94
Figure 32 Summarised chain of events and potential mitigating measures
7.2.1 Transmission line design and maintenance
Issues related to design standards of transmission line lines and maintenance practices are outside of
the scope of this report. The design standards and maintenance standards are the responsibility of the
TNSPs. These standards and practices take into account the need to strike a balance between cost
and performance.
7.2.2 Generator performance standards
AEMO’s investigation since the third report has highlighted the need for changes to generator
performance standards in the following areas:
Reactive output of generators during fault conditions.
Ability of generators to remain in service through multiple voltage disturbances.
Generator over voltage ride-through capability. 91F
92
Requirement for generators to be capable of stable operation whilst system strength remains
above a level specified in the access standard
More generally, the investigation has highlighted the need to:
Have performance standards that describe unambiguously the expected performance of each
generating system/unit.
92 See Appendix X.4.

BLACK SYSTEM SOUTH AUSTRALIA 28 SEPTEMBER 2016 – FINAL REPORT
© AEMO 2017 95
Assess the performance of the power system for a plausible sequence of faults over a short period
of time that would be more onerous than a trip reclose and lockout cycle – perhaps linked to the
concept of ‘protected events’ (discussed further in Chapter 8).92F
93
It should be noted that these recommended changes would, based upon current policy, only apply to
new generators, so it would be a long time before the major benefits of these changes would be
realised. However it is possible that costs of complying with some aspects of these proposed changes
could be low even for existing generators. For such aspects the extension of new requirements to
existing generators should be considered.
Recommendation 1 (new in this report)
AEMO to provide recommendations by early April 2017 to the Essential Services Commission
of South Australia (ESCOSA) regarding changes the generator licensing conditions in SA.
Further, AEMO to submit a Rule change proposal to the AEMC by July 2017, requesting
changes to Schedule 5.2 of the NER to address the generator performance standard issues
raised in this report.
7.2.3 Reclassification
Awareness of updated weather forecasts
As indicated in Section 2.5, an update to the weather forecast received by AEMO later in the day did
not trigger a reassessment of power system contingencies. While AEMO’s post-event analysis indicates
that such a reassessment would have been likely to confirm the earlier assessment, the failure to
undertake a reassessment has highlighted a weakness in AEMO’s processes.
Recommendation 2
During extreme weather conditions, more rigorous processes to be put in place to monitor
weather warnings for changes in forecasts in order to trigger reassessment of
reclassification decisions where relevant.
This process has now been established.
Update on actions from this recommendation:
In addition to operations planning staff, severe weather warnings are now also sent directly to the
AEMO control rooms.
Routine weather information available to the control room now contains a section on weather
warnings.
A training package has been developed to improve the ability of control room staff to interpret the
warnings as they are received and assess the risks they pose to the power system.
Training of staff is currently underway.
BOM staff are available to NEM control centres.
Reclassification due to lightning
The investigation has found that it is unlikely that the series of faults in the period leading to the Black
System were caused by lightning. This is consistent with the assumption on which the current
reclassification process for lightning risks is based, which is that the risk of loss of multiple circuits for
93For a protected event, AEMO will be able manage the system at all times so that the frequency will stay within defined limits, if the protected event
were to occur. This may include ex-ante actions, such as procuring ancillary services and constraining the dispatch of generation in the system. Some load shedding will also be allowed to limit the expected consequences of the protected event, if it occurs.

BLACK SYSTEM SOUTH AUSTRALIA 28 SEPTEMBER 2016 – FINAL REPORT
© AEMO 2017 96
high voltage transmission lines with adequate earthing protection is quite small. Thus, no
recommendations have been made in this area.
Reclassification due to high winds
In the past, AEMO has only reclassified the loss of multiple circuits under high wind conditions if the
maximum wind speed was forecast to be in excess of the design rating for the lines as advised by the
relevant TNSP. 93F
94
In light of this experience and investigation, a more detailed risk-based approach should be considered,
for the following reasons:
Unlike tropical cyclones, the path and intensity of storms such as the one on 28 September 2016
are extremely difficult to forecast.
The possible presence of tornadoes can mean that local wind conditions may be much more
extreme than general forecasts suggest.
High winds pose risks to transmission lines, from excessive wind loading and from flying debris.
Recommendation 3
AEMO to work with the PSS Working Group 94F
95 to develop a more structured process for
information exchange and reclassification decisions when faced with risks due to extreme
wind speeds, which may include development of more sophisticated forecasting systems
for extreme wind conditions including tornadoes. This proposal will be put forward
for consultation with participants and other relevant parties such as weather
service providers.
It is planned to formulate this proposal and commence consultation by end June 2017.
Update on actions from this recommendation:
Work with the PSS Working Group to develop processes for information exchange and
reclassification decisions due to high wind speeds has commenced.
The first key step is to identify transmission assets in each region that have been impacted by high
wind or extreme weather events in the past, and look at the environmental conditions that were
present (if possible) for those events.
TNSPs are aiming to identify the impacted assets by end of March 2017.
The event also suggested that the level of risks associated with wind turbine over-speed protection
action, while not a major issue in this event, needs to be considered more closely.
94 For instance, during Cyclone Marcia in February 2015. 95 The PSSWG is a forum for transmission System Operators to provide technical advice to the National Electricity Market Operations Committee
(NEMOC) on matters that are outside the near real-time power system operations time frame, and which do not fit into the long-term planning horizon.
BLACK SYSTEM SOUTH AUSTRALIA 28 SEPTEMBER 2016 – FINAL REPORT
© AEMO 2017 97
Recommendation 4 (new in this report)
AEMO to develop measures to better manage risks to power system security when wind
speeds are forecast to exceed wind turbine over-speed cut-outs, or rapid changes in wind
direction are forecast in areas where there are large concentrations of wind farms. In
particular, to:
Provide the historical likelihood/frequency that a significant ramping event may take
place by region. It is planned to compete this by 31 May 2017.
Provide a forward looking forecast that a significant ramping event is likely to occur.
This is a complex prediction in terms of modelling methodology. It is planned to
compete this by 30 September 2017.
This recommendation replaces the previous Recommendation 3, which proposed a risk assessment,
and is the result of this risk assessment being completed.
Update on actions:
AEMO is currently investigating multiple approaches that may improve AEMO’s ability to predict a
significant change in wind farm generation over the short term (0 to 6 hrs). One cause of significant
change in generation is extreme wind cut-out, which occurs when the wind speed exceeds a
turbine’s rated survival speed, above which the turbine will be damaged. Another cause is a
sudden increase or decrease in wind speed, which is not always foreseen by weather forecasters.
AEMO has engaged its Australian Wind Energy Forecasting System (AWEFS) vendor to deliver a
proposed methodology to predict a significant change in generation and alert the control room. A
proposal is expected by the end of March 2017.
AEMO has been approached by vendors who presented possible technological solutions that are
currently in the feasibility stage. AEMO intends to work with the Australian Renewable Energy
Agency (ARENA) to determine if a technological solution currently exists that addresses the issue.
Reclassification to manage ‘type’ risk
Traditionally, non-credible multiple generating unit contingencies have resulted from:
Faults in power station switchyards affecting multiple generating units at that station.
Unusual failures of power station auxiliary supplies affecting multiple generating units at a single
power station.
A voltage disturbance resulting in a number of generating units being unexpectedly unable to ride
through the disturbance.
There are generating systems consisting of many mass-produced smaller generating units with, often, a
particular model of generating unit common to a number of generating systems. Thus, a feature or fault
for such a model could result in a large number of smaller generating units across multiple generating
systems tripping simultaneously. As a result, AEMO may need to develop a new form of reclassification
process to manage such risks.
Such a process may be quite different to traditional reclassification processes, and might have
similarities to processes used in the aircraft industry to manage ‘type’ risk.
Recommendation 5 (new in this report)
AEMO to consider developing a new reclassification process to manage ‘type’ risk, including how information of potential risks will be sought and the most appropriate methods to manage power system security during such a reclassification.
AEMO to assess the level of potential risk in this area by December 2017.

BLACK SYSTEM SOUTH AUSTRALIA 28 SEPTEMBER 2016 – FINAL REPORT
© AEMO 2017 98
7.2.4 Fast action to prevent separation
Because of the current difficulties in forming a stable island in SA, it would be preferable to avoid
islanding if at all possible. The development of SPSs has now reached a level that it could be feasible to
develop schemes that could:
1. Detect abnormal flows on the Heywood Interconnector or events within SA that would inevitably
lead to separation.
2. Determine appropriate action.
3. Execute this action.
AEMO’s investigations 95F
96 since the third report have indicated that this may be feasible and is worthy of
further consideration. The main challenge is ensuring secure operation of the scheme while still
achieving the required response time for it to be effective in preventing islanding.
Recommendation 6 (updated based on progress to date)
In consultation with ElectraNet, AEMO to investigate the feasibility of developing a special
protection scheme that would detect sudden excessive flows on the Heywood Interconnector
or serious events within SA and initiate, if necessary, load shedding or generation response 96F
97
with a response time fast enough to prevent separation.
AEMO will commence investigations with ElectraNet regarding feasibility in April 2017.97F
98
7.2.5 Fast action to rebalance the island
If the SA region forms an island, there is likely to be a severe unbalance between supply and demand
resulting in a very high RoCoF, beyond what can be managed by the current under frequency and over
frequency management processes. There are a number of measures that could help manage this,
summarised below, with recommendations where relevant.
Pre-contingent measures to restrict RoCoF
Such measures include constraining flows on the Heywood Interconnector. These have already been
initiated by AEMO as short term measures. However, these measures impact on the efficiency of the
market and, ideally, should be replaced or supplemented by longer term measures that either do not
require or reduce the need for pre-contingent arrangements.
Implementation of RoCoF UFLS relays 98 F
99
As part of a review of the UFLS scheme for SA in 2016, it was recommended that a minimum of 15% of
the load available to the UFLS be tripped on the basis of RoCoF. That is, 15% of the UFLS load would
be tripped if the RoCoF is ≥ 1.5 Hz/s and the absolute frequency is ≤ 49.4 Hz. This will enable the UFLS
to operate reliably for a RoCoF up to 3 Hz/s.
The key features of this option are:
Since 15% of the load is shed sooner, this option effectively presents a smaller contingency with
lower residual RoCoF to the remaining blocks of UFLS.
For a NEM-wide under frequency event, it does not affect existing pain sharing arrangements.
The changes were implemented by SA Power Networks in February 2017 using existing relays.
96 See Appendix Y.4. 97 It is also possible that devices such as rapid response energy storage systems could be used. 98 Implementation may also need to be supported by Rule Changes along the lines currently being considered, such as the concept of
“Protected Events”. 99 These are relays that are triggered by rate of change of frequency rather than the value of the frequency.

BLACK SYSTEM SOUTH AUSTRALIA 28 SEPTEMBER 2016 – FINAL REPORT
© AEMO 2017 99
Reallocation of UFLS load shed blocks
Currently, load available for load shedding is allocated to individual blocks that are set to trigger at
different frequencies to meet two requirements:
To operate effectively when SA is islanded.
To ensure reasonably equitable load shedding between NEM regions when there is a common
frequency event.
The current design seeks to achieve a balance between these two requirements. However it is possible
that the effectiveness of the UFLS under islanding conditions could be improved (if only marginally) if
the requirement for equitable sharing is relaxed to some extent.
Since publication of the third report, AEMO has undertaken work, on the feasibility of an SPS99F
100 to
rebalance the SA island rapidly, has shown that any such reallocation to make the UFLS action more
aggressive would achieve little improvement to its effectiveness.
Implementation of a graded over frequency generation shedding scheme
If separation occurs while there is a significant flow on the Heywood Interconnector towards the Victoria
region, there will be an initial significant over frequency in the islanding. This needs to be managed by
rapid reduction or disconnection of generating units 100F
101 within the island, and must be done in a graded
fashion, since over-shedding of generation would then lead to under frequency conditions.
Since the third report, AEMO, working with ElectraNet, has completed the design for such a scheme.
Discussions are now underway with SA Generators regarding implementation.
Event-triggered frequency control schemes
The development of SPSs is such that it may be feasible to take effective action immediately after an
islanding event is detected, rather than waiting until a significant frequency deviation is detected.
AEMO’s investigations 101F
102 since the third report have shown that:
Such an SPS to rebalance the island, even acting with no time delay, would be ineffective.
Such rapid load shedding may create severe over voltage issues.
For these reasons, such a proposal is not considered worth pursuing at this time. Priority should instead
be placed on the development of a scheme to prevent islanding in the first place.
Special arrangements for frequency regulation
While not an issue for the cause of this event, AEMO’s investigations since the third report have
highlighted potential risks for frequency control if a stable island could have been established.
Even if an island is stabilised immediately, there is a need for frequency regulation services to be made
available promptly. Measures to enable regulation services pre-contingency are in place to address this
issue whenever there is a credible risk of islanding but not otherwise.
In the longer term, there could be a need to encourage new types of providers of regulation services
due to the reducing availability of services from traditional sources. This issue is already part of the
work of the FPSS program 102F
103, so no recommendations have been made in this area.
Availability of FCAS to manage contingencies
Whilst not an issue for the cause of this event, AEMO’s investigations since the third report have
highlighted potential risks for frequency control if a stable island could have been established.
100 See Appendix Y.5. 101 Disconnection of generating units with high inertia should be avoided. 102 See Appendix Y.5. 103 For more information, see http://www.aemo.com.au/Electricity/National-Electricity-Market-NEM/Security-and-reliability/-
/media/823E457AEA5E43BE83DDD56767126BF2.ashx.

BLACK SYSTEM SOUTH AUSTRALIA 28 SEPTEMBER 2016 – FINAL REPORT
© AEMO 2017 100
Within thirty minutes of the island forming, the NER expect that there should be sufficient contingency
FCAS enabled to meet the frequency operating standard for islanded operation. It is considered that
existing processes are adequate, and no recommendation for further work in this area is required.
In the longer term, there could be a need to encourage new types of providers of contingency
services due to the reducing availability of services from traditional sources. This is already part of
the work of the FPSS program, so no recommendations have been made in this area.
7.2.6 Other risks
Other operational risks, in relation to common response of generators during fault conditions and
system conditions when SA is islanded, were identified during the investigation. AEMO’s investigations
since the third report have updated one recommendation and generated several new
recommendations.
Risk of a single fault triggering low voltage fault ride-through for multiple wind farms
The events of 28 September 2016 have highlighted that a single fault in a section of the power system
where there is a concentration of wind farms can reduce the voltages simultaneously at the connection
points of a number of wind farms, triggering the LVRT mode of operation for all these wind farms and
thus transient reductions in their outputs. In the case of SA, this would cause a transient increase in the
loading on the Heywood Interconnector.
AEMO’s investigations 103F
104 since the third report have shown that this is a real issue, and that the largest
generator credible contingency under conditions of high wind generation is larger than currently
assumed. This has led to a revision of the transfer limits for the Heywood Interconnector. 104F
105 This will
involve, in the short term, reductions in the transfer limits for import to SA to between 400 to 500 MW
under conditions of high wind generation. In addition, the current maximum transfer level of 600 MW for
import to SA, under any conditions, will remain in place at least until:
Longer-term work with ElectraNet on review of transfer limits has been completed, and
Work under recommendations 3, 4, and 11 to improve risk management processes has been
implemented to an acceptable level.
Recommendation 7
AEMO, in the short term, to modify existing transfer limits to account for the findings of this
investigation, so as to ensure secure operation of the SA power system.
In the longer term, AEMO to work with ElectraNet to further broadly review the transfer
limits applied to the Heywood Interconnector, to fully incorporate the findings of this
investigation, and ensure the ongoing security of the SA power system, while still allowing
for the highest utilisation of the Heywood Interconnector, where it is secure to do so.
It is planned to complete the short-term work by end of March 2017.
This updates and replaces the previous Recommendation 7.
System strength and generator stability
AEMO’s investigations 105F
106 since the third report have shown that:
When SA is islanded, the SCR may fall below design capability for a number of wind farms. This
means the wind turbines at these locations may not be able to ride through credible voltage
disturbances, creating additional risks. AEMO understands that tuning of the converter control
104 See Section 3.3. 105 The proposed changes to generator performance standards being considered by ESCOSA would reduce the risk in the future. 106 See Section 3.5.2.

BLACK SYSTEM SOUTH AUSTRALIA 28 SEPTEMBER 2016 – FINAL REPORT
© AEMO 2017 101
system in the wind turbine generators may enhance a wind turbine’s capability to successfully
operate under lower SCR conditions.
Even when not islanded, the SCR may be below the design capability of Eyre Peninsula wind
farms. This may create some additional risks, but these are not expected to be major.
The AEMC is currently consulting on a Rule change proposal that will ensure effective market or
regulatory arrangements to procure system strength services in the NEM. AEMO is contributing to
this work.
AEMO understands one question the AEMC is considering is whether is an obligation on NSPs may
already exist under the NER to maintain some minimum level of system strength, although it is unclear
how this minimum level is specified.
Recommendation 8 (new in this report)
AEMO to arrange for the issue of maintenance of adequate system strength be incorporated
into the planning process for all regions in a more structured manner, similar to the NSCAS
gap process.
AEMO to also take this risk into account in its operational procedures for operation of the
SA region when islanded.
AEMO plans to complete the work to take this risk into its own operational procedures by end of June 2017.
It is planned to complete the work related to regional planning processes by December
2017, but this may first require changes to the NER.
System strength and protection relay operation
AEMO’s investigations 106F
107 since the third report have shown that when SA is islanded, system strength
could now fall to such a level that it could impact on effective operation of some protection schemes.
Recommendation 9 (new in this report)
AEMO to support ElectraNet in a more detailed review to identify any specific risks to
protection systems due low system strength when SA is islanded, and address them.
It is planned to complete the work by December 2017
Over voltages due to significant load shedding
AEMO’s investigations 107F
108 since the third report suggest that, following significant load shedding after separation, there is a risk of severe over voltages that could imperil the SA island under medium and low demand conditions.
Recommendation 10 (new in this report)
AEMO to support ElectraNet in assessing methods to manage the risk of severe over
voltages following load shedding after separation.108F
109
It is planned to complete this assessment by October 2017.
107 See Appendix X.3.4. 108 See Appendix Y.5. 109 Enhancement of the over voltage rise through capability of generators, as proposed in Recommendation 1, will also assist.

BLACK SYSTEM SOUTH AUSTRALIA 28 SEPTEMBER 2016 – FINAL REPORT
© AEMO 2017 102
Remaining risk for multiple voltage disturbances
AEMO has carried out a review of this risk 109F
110, taking into account the recent changes in wind turbine
settings.
The review indicated that these changes have improved the resilience of the SA power system 110F
111, but a
material risk may still remain for multiple disturbances over a thirty-minute period. Details of actual limits
have also not be confirmed for a number of wind farms.
Recommendation 11 (new in this report)
AEMO to review its reclassification procedures to address the risk of a failure by wind farms
to ride through multiple disturbances over a thirty-minute period, under abnormal
conditions which are likely to make this risk significant.
AEMO to approach relevant Generators to discuss the feasibility of raising the limit for the
number of LVRT events within a 30-minute period.
AEMO to follow up with a small number of remaining Generators to ensure information on
the limit on the number of LVRT events within different time periods is confirmed for all
wind farms in SA.
AEMO plans to review its reclassification procedures by November 2017.
AEMO plans to approach relevant Generators about the feasibility of raising limits for LVRT
events by May 2017.
AEMO plans to confirm information with remaining Generators by May 2017.
7.3 Restoration The focus of recommendations in this area is on measures that should improve the speed of restoration
without increasing risk.
Recommendation 12
AEMO, with the SA System Restart Working Group, to review the system restart process in
detail to:
Determine whether there are any:
Cost-effective measures that could be implemented to assess the situation more
quickly or effectively immediately after a black system to determine which equipment
should not be used as part of the restoration process.
Cost-effective measures that could be adopted to reduce the time required to establish
restart paths without increasing risk.
Shortcomings in the local black system procedures developed by participants, and if
so, what measures could be taken to address those deficiencies.
Cost-effective measures that could be adopted to speed up the restoration of load
without increasing risk, including local load in remoter areas.
Cost-effective measures that could be adopted to improve the communication
between participants during the restart process.
Improved processes to track the availability of system restart sources.
110 See Section 3.2.1. 111 For instance, on 3 March 2017, all wind farms in service rode through a number of faults which occurred in quick succession.
BLACK SYSTEM SOUTH AUSTRALIA 28 SEPTEMBER 2016 – FINAL REPORT
© AEMO 2017 103
Implement the recommendations made by the Reliability Panel as part of its
determination on the System Restart Standard.
These learnings will then be shared with the Restart Working Groups in the other NEM
regions, Western Australia, and the Northern Territory.
It is planned to complete this work by end of June 2017.
This recommendation updates the previous Recommendation 8, by adding the implementation of
System Restart Standard recommendations made by the Reliability Panel.
Update on actions from this recommendation:
A plan to address this recommendation was agreed at the SA System Restart Working Group on
31 January 2017. Different organisations within the working group are taking a lead in the various
elements of the recommendation.
A major issue identified was that the operation of Quarantine Power Station failed due to the use of
switching procedures during the restart that differed from those used to test it earlier in 2016.
Recommendation 13
In preparation for an SRAS test, the test plan to be compared by AEMO to the actual plan as
set out in the system restart plan and associated local black system procedures to identify
and explain differences so as to ensure that the test simulates, as far as practicable, the
conditions that will be encountered in a real restart situation.
In the event of a material change to the equipment or procedures used in the restart of an
SRAS source AEMO, the SRAS provider and any other parties directly involved in the process
to be consulted on the feasibility of the change and the annual SRAS test to be repeated to
prove that this change has not impacted on the capability of the SRAS provider.
These changes are planned to be adopted immediately.
Update on actions from this recommendation:
The SRAS testing process has been updated to introduce the following process:
At the time of each SRAS test, AEMO will, in consultation with the SRAS provider, set out
what is expected to happen in a real black system. This will be documented in the AEMO
witness report.
These real event procedures and processes will then be compared to test procedures and
processes.
Where the test and real procedures and processes are alike this will be recorded. Where they
are different, the reason for the difference will be recorded and assessed against a real event
process.
AEMO will either state that it is satisfied that the test process, as far as practicable, reflects the
expected real event process, or identify gaps that require attention.
AEMO and the SRAS provider will assess these gaps to determine if they represent processes
that, if failed, would reduce the likelihood a successful restart.
Any such gaps, if not practical to include in the test, will either be addressed before an SRAS
test, or, if identified after the test, require either a repeat of the test, or amendment for the next
test (depending on the significance of the gap).
Despite a successful test earlier in the year, the Mintaro SRAS source was unavailable due to the
failure of a low voltage generator. The low voltage generator failed shortly after it had stated in
response to the black event. The testing of a low voltage generator alone is relatively
BLACK SYSTEM SOUTH AUSTRALIA 28 SEPTEMBER 2016 – FINAL REPORT
© AEMO 2017 104
straightforward, and is often done on a monthly basis for emergency generation for hospitals and
other critical facilities.
Recommendation 14
Where an SRAS source depends initially on a start of a low voltage generator, the start of this
generator alone to be tested on a regular basis, in addition to the annual test for the entire
SRAS source.
AEMO plans to work with SRAS providers to put this into effect by end June 2017.
Update on actions from this recommendation:
The SRAS testing process has been amended to introduce the following process:
Where the provision of SRAS depends on the start-up of a diesel generator, at the time of each
SRAS test AEMO will ask the SRAS provider to submit evidence demonstrating that the diesel
generator is operated periodically as part of a planned maintenance program.
This evidence may be maintenance records or time-stamped data trends that will then form part
of the test report for the annual SRAS test.
7.4 Market suspension
7.4.1 System operation
The experience in market and power system operation gained during an extended market suspension
highlighted a number of opportunities for improvement.
A major problem identified was the lack of detailed procedures on how to operate the power system
under extended periods of market suspension.
Recommendation 15
AEMO to develop detailed procedures on the differences required in power system operations
during periods of market suspension and identify if any NER changes are required to improve
the process.
It is planned to complete this work by end of June 2017.
Update on actions from this recommendation:
Work has started on identifying the procedures that need to be modified or created, with the aim of
providing more comprehensive information on how the power system and market would be
operated and priced during a market suspension.
Work on the power system and market procedures is progressing in parallel, because power
system operation and market operation are two sides of the same coin. However, the early focus
has been on any potential NER changes and the consequences that these might have
There were also specific difficulties with Generators receiving dispatch targets below the minimal
stable load of their plant.

BLACK SYSTEM SOUTH AUSTRALIA 28 SEPTEMBER 2016 – FINAL REPORT
© AEMO 2017 105
Recommendation 16
AEMO to investigate the possibility of implementing a better approach for ensuring the
minimum stable load of generating units is taken into account in the dispatch process.
It is planned to complete this work by end of June 2017.
Update on actions from this recommendation:
Work is underway on ways to cater for the minimum stable load of scheduled generating units in
the central dispatch process.
A key part of this work is balancing the need to maintain appropriate price signals, preserve
technological neutrality, and avoid imposing undue costs on participants. AEMO notes that this is a
market issue, rather than a market suspension issue, but recognises that the market suspension
heightened the visibility of this issue.
7.4.2 Market operation
The known scope for improvements to market processes and systems, updated since the third
report, includes:
Automation of systems for pricing during a market suspension and related procedures.
Rationalisation of the different pricing mechanisms during a market suspension.
Clarification of procedures for directing during a market suspension.
Review of procedures and systems for defining local FCAS requirements and for settling FCAS
provision during a market suspension.
Resolution of issues with SRAS settlement during a black system where there is no underlying
energy as a basis to recover SRAS costs.
Addressing other market system issues, including the processing and reporting of market
suspension flags, market suspension pricing schedules, over-constrained dispatch, revisions to
market suspension pricing schedules and participant database discrepancies.
Recommendation 17
AEMO to review market processes and systems, in collaboration with Registered Participants,
to identify improvements and any associated NER or procedure changes necessary to
implement those improvements.
It is planned to complete this work by end of June 2017.
This recommendation covers a broad range of issues, of varying degrees of complexity and
significance.
Update on actions from this recommendation:
An early area of investigation has been the potential for harmonising the NER provisions on market
suspension pricing with other price revision mechanisms in the NER. Other price revision
mechanisms in the NEM include over-constrained dispatch, manifestly incorrect inputs,
intervention pricing, administered pricing, and price-scaling between adjacent regions.
For example, harmonising the NER provisions on price-scaling would facilitate the automation
of price-scaling during a market suspension. Any such automation would reduce manual
workload and the attendant risk of human error during an extended market suspension.

BLACK SYSTEM SOUTH AUSTRALIA 28 SEPTEMBER 2016 – FINAL REPORT
© AEMO 2017 106
7.5 Data issues
AEMO’s experience gathering data for the investigation of this incident has highlighted a need to
improve the process.
Recommendation 18
AEMO to develop, in consultation with Registered Participants, a more structured process to
source and capture data after a major event in a timely manner and better co-ordinate data
requests made to them.
It is planned to complete this work by end of June 2017 but implementation may be dependent
upon Rule changes.
The availability of high speed data was invaluable in analysing this event and identifying root causes.
However, correlation between high speed data from different sources was difficult at times due to the
lack of a common time standard.
Recommendation 19
AEMO to investigate, with Registered Participants, the possibility of introducing a process to
synchronise all high speed recorders to a common time standard.
It is planned to complete this investigation by the end of September 2017. Further work will
depend on the results of the investigation.

BLACK SYSTEM SOUTH AUSTRALIA 28 SEPTEMBER 2016 – FINAL REPORT
© AEMO 2017 107
8. NEXT STEPS
All content in this chapter is new, and has not been included in AEMO’s previous reports about
this event.
8.1 Introduction
The Black System has raised a number of direct questions around the management of the power
system and the performance of generation in SA. It also raises broader questions of the resilience of
the power system in SA associated with the changing generation mix, whether or not those factors were
in part responsible for the outcome on 28 September.
Building on the specific recommendations from Chapter 7, this chapter provides a brief overview of
other relevant activities to improve the resilience of the SA power system, and the longer-term
resilience of the NEM.
Each NEM region has unique characteristics including generation mix, structure of the local network, and
level of interconnection. This means any short-term solutions applied in SA may not be transferable to
the rest of the NEM.
In 2015, AEMO established the Future Power System Security (FPSS) program, 111F
112 which takes a
strategic approach to power system requirements.
The program addresses the need for efficient national solutions by analysing the technical challenges
and solutions of the power system of the future, while building on the lessons learned from ongoing
operational experience.
Full details of the FPSS program, including reports, publications, and a January 2017 Progress Report
are available on AEMO’s website. 112F
113
8.2 Ongoing investigations In addition to the actions taken as a direct result of the Black System (Chapters 6.8 to 6.13 and
Chapter 7), a number of other activities to improve the resilience of the SA power system were
underway prior to the Black System. Progress is summarised below.
8.2.1 Exploring options to procure inertia and system strength in SA
While NEM-wide options are being explored for the procurement of inertia and system strength from
synchronous machines 113F
114 as part of the AEMC’s System Security Market Frameworks Review, due to
the time required to develop these changes, AEMO is pursuing options with ElectraNet for possible
early investment in available solutions in SA.
8.2.2 Reviewing and updating technical standards for registered generators
AEMO is currently working with the Essential Services Commission of South Australia (ESCOSA) to
review technical licence conditions for generation in SA, such that the SA generation fleet is armed with
the capabilities it needs to provide a secure and resilient power supply for the life of the assets. AEMO
will be providing its recommendations to ESCOSA by early April 2017.
AEMO considers that the generator performance standards in the NER require updating as soon as
practicable, and intends to submit a Rule change to the AEMC requesting appropriate revisions. It is
anticipated that the standards recommended for SA through ESCOSA’s process would be a key
consideration in determining the appropriate changes. Ideally, any new licence conditions imposed by
112 The FPSS program website is at: http://aemo.com.au/Electricity/National-Electricity-Market-NEM/Security-and-reliability .
113 FPSS Reports and Publications, including January 2017 progress report: https://www.aemo.com.au/Electricity/National-Electricity-Market-NEM/Security-and-reliability/FPSSP-Reports-and-Analysis.
114 A short overview of system strength can be found in the following fact sheet: https://www.aemo.com.au/-/media/Files/Electricity/NEM/Security_and_Reliability/Reports/AEMO-Fact-Sheet-System-Strength-Final-20.pdf.
Following a system event in November 2016, new arrangements to maintain power system security during periods of anticipated low fault levels (low system strength) were implemented: http://www.aemo.com.au/-/media/Files/Media_Centre/2016/SA-System-Strength.pdf.

BLACK SYSTEM SOUTH AUSTRALIA 28 SEPTEMBER 2016 – FINAL REPORT
© AEMO 2017 108
ESCOSA would be transitional arrangements that are eventually superseded by the NER. AEMO
intends to submit this Rule change request by July 2017.
8.2.3 Exploring the response of existing generation and network equipment to extreme frequency changes.
The protection system response of groups of wind farms to successive faults indicates that AEMO does
not have all the information it needs to predict accurately how the power system, and each element in it,
will behave during more extreme power system conditions such as those observed in SA on
28 September 2016.
Some elements may have been designed under different technical requirements (prior to the NER for
example), or may have protection settings that are designed to trip at a point unknown to AEMO.
AEMO is currently working to understand more about the settings of existing SA generation and
network equipment related to withstand capability of high RoCoF. This will give AEMO crucial
information to help manage power system security and resilience in the immediate and longer term.
8.2.4 Services to assist in system restoration
Recovery of a region from a black system condition relies on SRAS that are contracted for that purpose,
and thus, for an islanded region, need to be local. This means that the changing generation mix may
limit the number of eligible restart generators. Over the longer term, AEMO is looking to investigate the
ability of non-synchronous generation to provide SRAS.
In the interim, through the ESCOSA licence conditions, AEMO is considering recommendations for
whether new non-synchronous generation should have the ability to assist in system restoration
following a black system event. While currently unable to provide SRAS, the contribution to voltage and
reactive power control from non-synchronous generators could be important in system restoration,
provided that a number of synchronous machines are already restarted that can provide the minimum
fault level required for stable operation of non-synchronous technologies.
8.3 Regulatory and strategic initiatives
8.3.1 Short-term focus areas
The challenges of managing high RoCoF were outlined in the FPSS program progress report released in
August 2016 114 F
115, and are being pursued by AEMO and through work being carried out in collaboration
with the AEMC.
In parallel with short-term activities in SA, AEMO is progressing a number of relevant actions over the
short term including:
Collaborating with the AEMC on a Rule change proposal that considers a new regime to
implement Emergency Frequency Control Schemes (EFCS) that would manage the system
frequency when it is in the extreme band.115F
116 This Rule change proposal also considers the
introduction of a new category of contingent risk in the network referred to as ‘protected events’.
This includes a risk assessment framework to review low probability events that could have a high
impact, and assess if there is an economic case to take some form of action to mitigate the risk.
Collaborating with the AEMC on a Rule change proposal considering the potential future need for
new market or regulatory arrangements to procure system strength, inertia and fast frequency
response services.
Reviewing the specification and design of all FCAS to ensure AEMO can obtain services in the
future from non-traditional sources.
115 AEMO. FPSS program progress report. Available at: http://aemo.com.au/-/media/Files/Electricity/NEM/Security_and_Reliability/Reports/FPSS---
Progress-Report-August-2016.pdf. 116 Draft determination available at http://www.aemc.gov.au/Rule-Changes/Emergency-frequency-control-schemes-for-excess-gen/Draft-
Determination/AEMC-Documents/Draft-Rule-Determination,-Emergency-Frequency-Cont.aspx.
BLACK SYSTEM SOUTH AUSTRALIA 28 SEPTEMBER 2016 – FINAL REPORT
© AEMO 2017 109
Assessing the future needs of power system services ancillary to energy to test the adequacy of
current frameworks and/or design new ones.
Developing more structured processes to source and capture data after major events.
8.3.2 Medium-term focus areas
Establishing arrangements to get access to improved data on DER
AEMO only has access to data related to generation and load that is owned by Registered Participants.
The change in generation mix has seen an increase in the proportion of distributed energy resources
(DER), the owners of which do not participate directly in the wholesale market as most do not meet the
plant size thresholds for registration. AEMO has little to no visibility of the location or operation of DER.
A lack of information about DER poses a number of risks to power system security. For example, DER
that is connected to the network via inverters are pre-set to respond in a certain way to system
disturbances.116F
117
With increased penetration of different types of DER, understanding how they will behave is critical to
power system security. Given the volume of inverter-connected small-scale PV generation in the NEM,
and the lack of information on how it will respond to frequency disturbances, in 2015 AEMO initiated a
stocktake of the then current fleet of inverters and their frequency trip settings 117F
118 to ascertain whether
they would respond simultaneously to frequency disturbances by disconnecting at a set frequency.
The data collected indicated a low probability of inverters tripping in unison due to frequency
disturbances within the required frequency operating ranges. Limitations in the data obtained, however,
mean concern remains over the reliability of the conclusions that can be drawn.
Need for proof of concept
While the NEM has successfully dispatched and co-optimised markets for energy and ancillary services
for many years, the current mechanisms may not deliver the services required for the future as
traditional providers of synchronous generation retire. Furthermore, with the change in generation mix,
the ancillary services required into the future go beyond those currently procured, and include services
such as inertia and fast frequency response.
The future power system will need services from non-traditional sources like utility-scale solar PV, wind
farms, batteries, and importantly from DER such as ‘behind the meter’ facilities installed in customer
premises. Like all technology development, there is a need to support early deployment to ensure
potentially attractive solutions can be both technically and commercially deployed in the NEM. In this
respect, support for ‘proof of concept’ projects to better integrate new technologies into the grid will
improve the overall resilience of system in the future and support an efficient and effective transition.
AEMO will work with the Australian Renewable Energy Agency (ARENA) and others seeking to test and
demonstrate:
The value of new services such as fast frequency response to contribute to power system security
and the ability to source those services from a range of technologies, potentially including:
Batteries and other storage technologies.
Inverter connected generators.
DC interconnectors.
Supercapacitors.
Improved traditional sources such as synchronous condensers, rotating stabilisers,
and flywheels.
117 See AEMO, Visibility of Distributed Energy Resources for further examples. Available at: http://aemo.com.au/-
/media/Files/Electricity/NEM/Security_and_Reliability/Reports/AEMO-FPSS-program----Visibility-of-DER.pdf. 118 AEMO, Response of existing PV inverters to frequency disturbances. Available at: http://aemo.com.au/-/media/Files/PDF/Response-of-Existing-
PV-Inverters-to-Frequency-Disturbances-V20.pdf.

BLACK SYSTEM SOUTH AUSTRALIA 28 SEPTEMBER 2016 – FINAL REPORT
© AEMO 2017 110
The potential use of aggregated services from ‘behind the meter’ demand management, distributed
generation, and battery storage control to provide security services to the grid.
The ability to test and demonstrate the capability of various technologies to provide the required system
services will facilitate the efficient and effective development of operational, regulatory, and market
frameworks necessary to deliver future power system security.
8.4 Power system modelling and analysis activities
8.4.1 Power system modelling and simulation
Increased modelling requirements
Managing power system security relies on understanding how the system behaves dynamically through
a suite of power system models and tools. With the change in generation mix from synchronous to
non-synchronous generation, the dynamics of the power system are also changing.
This means accurate modelling requires more granular (detailed) data from Generators about how their
plant behaves. Better modelling allows AEMO to prepare and manage disturbances in the system to
maintain power system security. Since early 2016, AEMO has been requesting more detailed models
from Generators seeking to connect to the NEM where there is an assessed need for these models.
AEMO lodged a Rule change proposal in November 2016 to update and broaden the scope of
Generating System Model Guidelines (GSMG), and is set to undertake a subsequent review of the
GSMG in recognition of the growing importance of aspects of the power system, such as embedded
generation, voltage support equipment/control, and protection systems, on AEMO’s role as system
operator. AEMO considers that these are not adequately addressed by the current GSMG.
The key objectives of this Rule change proposal118F
119 are to allow for:
Broadening the GSMG and datasheets to include non-generating system power system elements.
More detailed and accurate modelling and simulation of the power system to manage power
system security with rapidly changing power system dynamics and generation technologies.
More efficient procurement of ancillary services, and more accurate understanding of the technical
capability of plant for the provision of new ancillary services.
Additionally, AEMO, in consultation with relevant Generators and ElectraNet, will obtain improved
simulation models that more accurately represent generating system performance. This applies to a
number of wind farms and synchronous generators in the SA power system, many of which are
currently working with AEMO in this regard.
Power system modelling and simulation studies
Extensive power system simulation studies presented in this report focus primarily on the following
scenarios:
Black system operating conditions.
Black system operating conditions, but assuming that wind farms did not reduce output due to the
multiple voltage disturbances.
Black system operating conditions, but assuming that wind farms did not reduce output due to the
multiple voltage disturbances, and with a loss of 200 MW of wind generation output due to high
wind speeds.
Three TIPS B and two Pelican Point CCGT units online with approximately 1,400 MW of wind
generation (see Appendix X.1.1 for more details).
AEMO will undertake additional power system simulation studies considering a wider range of operating
conditions, and generation dispatch pattern so as to modify operational procedures.
119 See http://www.aemc.gov.au/Rule-Changes/Generating-System-Model-Guidelines.

BLACK SYSTEM SOUTH AUSTRALIA 28 SEPTEMBER 2016 – FINAL REPORT
© AEMO 2017 111
Specifically, AEMO will undertake the following:
Repeat PSS/E and PSCAD studies documented in this report following:
Connection of any new non-synchronous generation.
Major SA system incidents, such as that on 3 March 2017.
Investigate the impact of a higher number of on-line synchronous machines on:
Viability of the SA power system following loss of Heywood Interconnector.
Heywood Interconnector transient stability limit.
Effectiveness of post-separation load shedding.
Investigate the impact on system strength as the ratio of non-synchronous/synchronous generation
increases, including:
Determining the required number of on-line synchronous machines (including any synchronous
condensers) during periods of low Interconnector transfer.
Determining the maximum level of non-synchronous generation as a function of the number of
on-line synchronous machines which allows maintaining a secure operating state.
Determining the relative capability of various types of wind turbines with respect to their
withstand capability as the number of on-line synchronous machines declines.
Identifying relays of potential susceptibility in consultation with ElectraNet.
In consultation with TNSPs and Generators, develop requirements for expected performance of
power swing blocking for transmission networks and out-of-step tripping for synchronous
generators. Power swings are complex events, and dynamic interaction between the primary
power system equipment and protective functions must be accurately accounted for. For this
reason, correct distinction between stable and unstable swings can only be practically achieved
by detailed power system modelling and simulation studies.
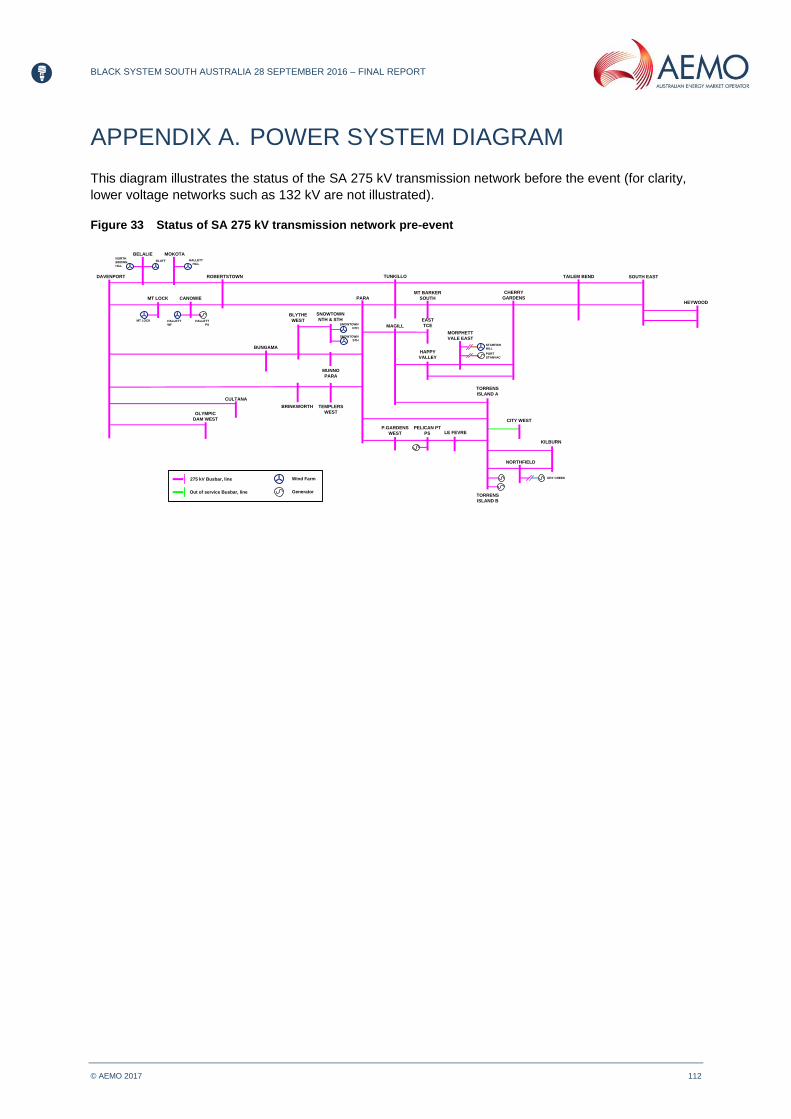
BLACK SYSTEM SOUTH AUSTRALIA 28 SEPTEMBER 2016 – FINAL REPORT
© AEMO 2017 112
APPENDIX A. POWER SYSTEM DIAGRAM
This diagram illustrates the status of the SA 275 kV transmission network before the event (for clarity,
lower voltage networks such as 132 kV are not illustrated).
Figure 33 Status of SA 275 kV transmission network pre-event
SOUTH EASTTAILEM BEND
HEYWOOD
TUNKILLOROBERTSTOWN
CANOWIE
MOKOTABELALIE
DAVENPORT
MT LOCK PARA
MT BARKER
SOUTH
CHERRY
GARDENS
MAGILL
EAST
TCE
HAPPY
VALLEY
MORPHETT
VALE EAST
TORRENS
ISLAND A
P.GARDENS
WEST
PELICAN PT
PS LE FEVRE
TORRENS
ISLAND B
CITY WEST
NORTHFIELD
KILBURN
OLYMPIC
DAM WEST
CULTANA
BUNGAMA
BLYTHE
WEST
SNOWTOWN
NTH & STH
BRINKWORTH
MUNNO
PARA
TEMPLERS
WEST
NORTH
BROWN
HILL
BLUFF HALLETT
HILL
MT LOCK HALLETT
WF
HALLETT
PS SNOWTOWN
NTH
SNOWTOWN
STH
PORT
STANVAC
STARFISH
HILL
DRY CREEK
Out of service Busbar, line
275 kV Busbar, line Wind Farm
Generator

BLACK SYSTEM SOUTH AUSTRALIA 28 SEPTEMBER 2016 – FINAL REPORT
© AEMO 2017 113
APPENDIX B. WEATHER EVENT REPORT SUPPLIED
BY WEATHERZONE
The following is a summary of the weather event on 28 September 2016, from Weatherzone.
Synoptic overview
An intense low pressure system brought severe weather to SA from Wednesday 28 September until
early Friday 30 September, moving into Victoria and southern/south-eastern New South Wales from
Thursday 20 September
The low pressure system was especially intense, with sub 974h Pa central pressure as it moved over
the Bight on Wednesday 28 September. Associated with this system was a pre-frontal trough and also
a cold front, both of which triggered especially severe thunderstorms as they crossed the state of SA on
28 September. This thunderstorm activity (including tornadoes) was all connected with the one synoptic
scale weather system, so should be considered one event.
The complex system affected large parts of southern and south-eastern Australia, with damaging to
destructive winds, widespread thunderstorms, damaging hail and heavy rainfall (leading to flooding)
over SA in particular.
System progression and impacts
A strong cold front and low pressure system with significant support from a coupled upper trough
lagging to the west began to move into the western parts of SA early on Wednesday
28 September 2016. As expected from a strong cold front over the region, northerly to north-westerly
winds began to strengthen ahead of its passage over the western and central interior of the state, while
instability over the same areas was enhanced by a weak low pressure trough extending from the
interior of the country, also enhancing moisture availability for thunderstorm development.
Thunderstorms ahead of the system began to develop, spread and intensify over the southern parts of
the North West Pastoral with the pre-frontal trough just before 07:00 CST, already observed as
widespread over the eastern parts of the West Coast, eastern North West Pastoral and Eastern Eyre
Peninsula by 09:00 CST. As storms continued to spread eastward over the peninsulas, interior and
metro, the second wave of widespread thunderstorms with the frontal band began to move in over the
eastern West Coast and Eyre Peninsula around 13:00 CST, also bringing sustained and damaging
south-westerly winds in its wake, along the north-western flank of the deepening low pressure system.
The second wave of storms led to widespread thunderstorms, likely destructive wind gusts at times,
reported large and damaging hail and cloud-to-ground lightning strikes in excess of 20,000 over large
parts of the Eastern Eyre Peninsula, southern Mid North, Yorke Peninsula, Adelaide, and Mt Lofty
Ranges.
As the frontal band swept across the state and eventually into Victoria during Wednesday evening, the
surface low pressure began to slow down significantly over the open waters to the southwest of Port
Lincoln, and deepened its coupling with the upper cut-off low pressure immediately aloft. This coupling
and deceleration resulted in sustained damaging winds, persistent showers and lingering thunderstorms
over much of the southern and south-eastern parts of the state from midday Wednesday 28 September
into the evening of Thursday 29 September.
The coupled low pressure systems slowly tracked into Victoria from late on Thursday 29 September into
Friday 30 September, leading to strong and sustained south-westerly wind gusts and showers over
south-eastern SA into Friday afternoon.

BLACK SYSTEM SOUTH AUSTRALIA 28 SEPTEMBER 2016 – FINAL REPORT
© AEMO 2017 114
Major effects on South Australia
Wind
Sustained winds ahead of the cold front and low pressure system were primarily from the northwest and
west, while subsequent winds were predominantly westerly to south-westerly.
Throughout the duration of the event, long periods of sustained winds of 50–70 km/h were experienced
across SA, with winds progressively abating from the western interior early on Friday 30 September, but
lingering over the south-eastern parts of the state into the afternoon and evening. Some parts endured
sustained winds of 60–80 km/h, including the eastern parts of the West Coast, western margin of the
Eyre Peninsula, Yorke Peninsula and Mt Lofty Ranges. The evening of Thursday 29 September in
particular saw a spike in the sustained wind strength.
Wind gusts, notably more erratic in occurrence and frequency during intense weather systems, were
significantly stronger than the reported sustained winds. Peak wind gusts on Wednesday 28 September
of 90–110 km/h were reported for locations across the state, particularly when noting the wide
distribution of location, including Yunta in the North East Pastoral, Snowtown in the Mid North, Cape
Willoughby on Kangaroo Island, and Nullarbor on the West Coast.
Destructive wind gusts were a result of severe thunderstorms, which also carry the potential to produce
tornadoes. The most likely area and time of severe thunderstorm occurrence was on Wednesday 28
September over the southern parts of the Mid North between 15:00 and 17:00 CST. It is also likely that
severe thunderstorms occurred in the broad vicinity of the lower Mid North, northern Yorke Peninsula
and Adelaide during or near this period.
On Thursday 29 September, wind gusts of 100–120 km/h were recorded along the eastern West Coast,
Lower Eyre Peninsula, Kangaroo Island, Yorke Peninsula, and Mt Lofty Ranges throughout the day.
Adelaide itself, together with large parts of all districts to the east of the Metro, reported wind gusts of
80–100 km/h throughout the day and into the early hours of Friday 30 September.
Noteworthy wind gust values include:
Nullarbor (West Coast) – 100 km/h at 13:19 CST on 28 September;
Snowtown (Mid North) – 104 km/h at 15:30 CST on 28 September;
Adelaide (Outer harbour) – 96.3 km/h at 06:25 CST on 29 September;
Neptune Island (West Coast) – 120 km/h at 12:30 CST on September 29;
Cummins (West Coast) – 115 km/h at 03:00 CST on September 29;
Moonta (Yorke Peninsula) – 106 km/h at 06:30 CST on September 29.
Storm surge
The sustained nature of winds that resulted from the slow-moving low pressure system, together with a
large oceanic fetch, contributed to significant storm surge along coastal areas of SA on Thursday 29
September.
Hail, rainfall and flooding
The system as a whole brought 40–60 mm over large parts of southern and south-eastern Australia,
exceeding 100 mm in parts of south-eastern SA and the interior of Victoria.
Large and destructive hail, together with large amounts of small hail were observed with both
thunderstorm bands on Wednesday 28 September. In particular, a line of severe thunderstorms moving
in a northwest-southeast line from Snowtown to Blanchtown between 15:00 and 17:00 CST would have
led to large hail, damaging wind and a tornado near Blyth. More severe thunderstorms were observed
to the north of this line during the same period.
Notable SA rainfall totals, rates and periods recorded are detailed below:
Cleve – large hailstones and 14mm of rain in 15min in the early afternoon of Wednesday 28
September;
BLACK SYSTEM SOUTH AUSTRALIA 28 SEPTEMBER 2016 – FINAL REPORT
© AEMO 2017 115
Whyalla – 6.8mm/10min late morning on Wednesday 28 September; and
Elizabeth and Adelaide – 9 mm in an hour late morning/early afternoon on Wednesday 28
September.
Persistent rainfall over a relatively short period of time usually leads to at least minor flooding events.
As of Friday 12:00 CST, minor to major flooding was reported for the southern parts of the Mid North,
Adelaide and parts of the Mt Loft Ranges.
Overview of significant warnings before and during the event
Tuesday 27 September
SA
Tue 12:09 CST – Flood Watch for Mid North, Mount Lofty Ranges and Adelaide Metro
Tue 10:20 CST – Gale Warning for Far W/Upper W/Lower W/Central/S Central coasts, Spencer Gulf
and Investigator Strait. Strong Wind elsewhere
Tue 16:46 CST – Severe Weather Warning (Damaging Wind) for West Coast, North West Pastoral and
Eastern Eyre Peninsula
VIC
Tue 16:49 EST – Severe Weather Warning (Damaging Wind/Heavy Rainfall) for Central, Mallee, South
West, Northern Country, North Central and Wimmera
Tue 16:40 EST – Strong Wind Warning for West Coast, Central Coast, Central Gippsland Coast and
East Gippsland Coast
Tue 16:40 EST – Strong Wind Warning for West Coast, Central Coast, Central Gippsland Coast and
East Gippsland Coast
Wednesday 28 September
SA
Wed 10:10 CST – Severe Storm Warning (Damaging Wind) for Lower Eyre Peninsula, Eastern Eyre
Peninsula, West Coast and North West Pastoral
Wed 05:29 CST – Gale Warning for Far W/Upper W/Lower W/Central/S Central/Lower SE/Upper SE
coasts & Spencer Gulf. Strong Wind Warning elsewhere
Wed 12:50 CST – Severe Weather Warning (Damaging Winds) for West Coast, Eastern Eyre Peninsula
and North West Pastoral
Wed 12:27 CST – Severe Storm Warning (Destructive Wind/Rain/Hail) E Eyre/Yorke Peninsulas,
Flinders, Mid N & NE/NW Pastoral. Cancel W Coast & L Eyre
Wed 23:00 CST –Severe Storm Warning (Destructive Wind/Rain/Hail) Adelaide, Mt Lofty, E Eyre/Yorke
Peninsulas, Flinders, Mid N, Murraylands & NW/NE Pastoral
VIC
Wed 04:55 EST – Severe Weather Warning (Damaging Wind and Heavy Rain) for the Central, Mallee,
South West, Northern Country, North Central and Wimmera
Wed 11:00 EST – Severe Weather Warning (Damaging Wind/Heavy Rain) for Central, Mallee, South
West, Northern Country, North Central, Wimmera and North East

BLACK SYSTEM SOUTH AUSTRALIA 28 SEPTEMBER 2016 – FINAL REPORT
© AEMO 2017 116
Thursday 29 September
SA
Thu 13:11 CST – Severe Weather (Damaging Winds/Abnormally High Tides) for all districts excluding
Upper/Lower South East
Thu 11:02 CST – Storm Force Wind for Central/S Central coasts, Spencer Gulf & Investigator Strait.
Gale Warning elsewhere excl. Upper/Lower South East
NSW
Thu 13:14 EST – Gale Warning for Illawarra Coast, Batemans Coast and Eden Coast. Strong Wind
Warning elsewhere
Thu 11:28 EST – Severe Weather Warning (Damaging Winds) for Hunter, Lower Western, Mid North
Coast, Central/Northern Tablelands, Riverina & Upper Western
Known reported damage and effects
Damaging winds (destructive at times), heavy rainfall and damaging hail have been reported across SA.
A tornado was reported in and around Blyth, coincident with the occurrence of a super-cell
thunderstorms in that area, which is a necessary precursor to tornado development from
thunderstorms. The reported meteorological effects led to widespread power loss for the entire state of
SA, mainly due to damage to key infrastructure. Restoration was also hampered by the persistence of
severe weather throughout Wednesday 28 and Thursday 29 September.
The major impact on Victoria and southern New South Wales has been rainfall leading localised to
widespread flooding. This has largely been due to already saturated soils and heavily burdened rivers
from above-average September rainfall.
Summary
A complex and significant cold front and low pressure system led to severe weather over large parts of
SA from Wednesday 28 September to Friday 30 September 2016. Its deceleration during a key period
of the passage across SA contributed to significant damage to electricity infrastructure, and loss of
power to the entire state.
Although widespread thunderstorms affected mostly SA, the system led to significant rainfall over
Victoria and southern New South Wales, where flooding subsequently continued after earlier rainfall
events led to widespread flooding across these areas.
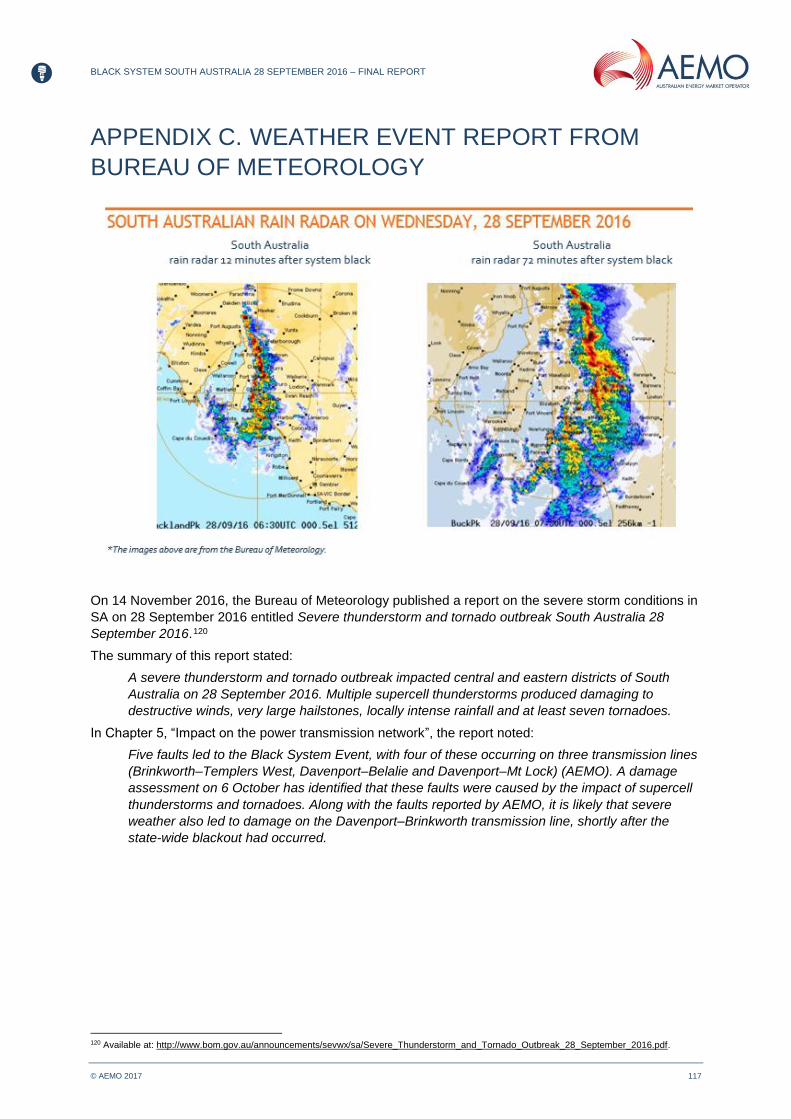
BLACK SYSTEM SOUTH AUSTRALIA 28 SEPTEMBER 2016 – FINAL REPORT
© AEMO 2017 117
APPENDIX C. WEATHER EVENT REPORT FROM
BUREAU OF METEOROLOGY
On 14 November 2016, the Bureau of Meteorology published a report on the severe storm conditions in
SA on 28 September 2016 entitled Severe thunderstorm and tornado outbreak South Australia 28
September 2016.119 F
120
The summary of this report stated:
A severe thunderstorm and tornado outbreak impacted central and eastern districts of South
Australia on 28 September 2016. Multiple supercell thunderstorms produced damaging to
destructive winds, very large hailstones, locally intense rainfall and at least seven tornadoes.
In Chapter 5, “Impact on the power transmission network”, the report noted:
Five faults led to the Black System Event, with four of these occurring on three transmission lines
(Brinkworth–Templers West, Davenport–Belalie and Davenport–Mt Lock) (AEMO). A damage
assessment on 6 October has identified that these faults were caused by the impact of supercell
thunderstorms and tornadoes. Along with the faults reported by AEMO, it is likely that severe
weather also led to damage on the Davenport–Brinkworth transmission line, shortly after the
state-wide blackout had occurred.
120 Available at: http://www.bom.gov.au/announcements/sevwx/sa/Severe_Thunderstorm_and_Tornado_Outbreak_28_September_2016.pdf.

BLACK SYSTEM SOUTH AUSTRALIA 28 SEPTEMBER 2016 – FINAL REPORT
© AEMO 2017 118
APPENDIX D. SA REGION TRANSMISSION SYSTEM

BLACK SYSTEM SOUTH AUSTRALIA 28 SEPTEMBER 2016 – FINAL REPORT
© AEMO 2017 119
APPENDIX E. PRE-EVENT WEATHER INFO
E.1 Forecast weather vs actual This table is based on Weatherzone forecast and actual data compiled by AEMO.
Table 21 Summary of forecast weather warning detail and actual wind speed data
Date time of forecast for 28/09/16 (AEST)
Warning type Forecast wind speed (km/h)
Forecast wind gust (km/h)
Issued for districts Worst case observations for districts: wind speed (ws) and wind gusts (WG)
27/09/2016 17:16
Severe Weather Warning120F
121 50–75 km/h 90–120
km/h West Coast
North West Pastoral
Parts of:
Eastern Eyre Peninsula
WS: 64–76 km/h
WG: 93–100 km/h
27/09/2016 20:14
Severe Weather Warning
50–75 km/h 90–120 km/h
West Coast
North West Pastoral
Parts of:
Eastern Eyre Peninsula
WS: 64–76 km/h
WG: 93–100 km/h
27/09/2016 23:00
Severe Weather Warning
50–75 km/h 90–120 km/h
West Coast
Parts of:
Lower Eyre Peninsula
Eastern Eyre Peninsula
North West Pastoral
WS: 64–76 km/h
WG: 93–100 km/h
28/09/2016 02:00
Severe Weather Warning
50–75 km/h 90–120 km/h
West Coast
Parts of:
Lower Eyre Peninsula
Eastern Eyre Peninsula
North West Pastoral
WS: 64–76 km/h
WG: 93–100 km/h
28/09/2016 04:32
Severe Weather Warning
50–75 km/h 90–120 km/h
West Coast
Parts of:
Lower Eyre Peninsula
Eastern Eyre Peninsula
North West Pastoral
WS: 64–76 km/h
WG: 93–100 km/h
28/09/2016 07:30
Severe Weather Warning
N/A (no additional information)
N/A (no additional information)
N/A (no additional information)
N/A
28/09/2016 10:17
Severe Weather Warning
50–75 km/h 90–120 km/h
West Coast
Parts of:
Eastern Eyre Peninsula
North West Pastoral
WS: 64–76 km/h
WG: 93–100 km/h
28/09/2016 10:40
Severe Thunderstorm Warning121F
122
N/A (no additional information)
In excess of 90 km/h
Lower Eyre Peninsula
Eastern Eyre Peninsula
Parts of:
West Coast
North West Pastoral
WS: 64–76 km/h
WG: 93–100 km/h
28/09/2016 12:57
Severe Thunderstorm Warning
N/A (no additional information)
Up to 140 km/h
Eastern Eyre Peninsula
Flinders
Parts of:
Yorke Peninsula
Mid North
North West Pastoral
North East Pastoral
WS: 64–76 km/h
WG: 93–100 km/h
121 For a further details of Severe Weather Warnings refer http://www.bom.gov.au/catalogue/warnings/WarningsInformation_SW_SWW.shtml 122 For further details of Severe Thunderstorm Warnings refer http://www.bom.gov.au/catalogue/warnings/WarningsInformation_SW_STSW.shtml

BLACK SYSTEM SOUTH AUSTRALIA 28 SEPTEMBER 2016 – FINAL REPORT
© AEMO 2017 120
Date time of forecast for 28/09/16 (AEST)
Warning type Forecast wind speed (km/h)
Forecast wind gust (km/h)
Issued for districts Worst case observations for districts: wind speed (ws) and wind gusts (WG)
28/09/2016 13:20
Severe Weather Warning
50–75 km/h 90–120 km/h
West Coast
Parts of:
Eastern Eyre Peninsula
North West Pastoral
WS: 64–76 km/h
WG: 93–100 km/h
28/09/2016 14:40
Severe Thunderstorm Warning
N/A (no additional information)
Up to 140 km/h
Eastern Eyre Peninsula
Yorke Peninsula
Flinders
Parts of:
Mid North
North West Pastoral
North East Pastoral
WS: 67–93 km/h
WG: 93–113 km/h
28/09/2016 15:54
Severe Thunderstorm Warning
N/A (no additional information)
Up to 90 km/h in Adelaide Metro and Mount Lofty.
Up to 140 km/h in other districts.
Adelaide Metropolitan
Mount Lofty Ranges
Yorke Peninsula
Flinders
Mid North
Parts of:
Eastern Eyre Peninsula
Murraylands
North West Pastoral
North East Pastoral
WS: 64–93 km/h
WG: 93–113 km/h
28/09/2016 16:19
Severe Weather Warning
50–75 km/h Up to 140 km/h
West Coast
Lower Eyre Peninsula
Eastern Eyre Peninsula
Yorke Peninsula
North West Pastoral
Parts of:
Adelaide Metropolitan
Mount Lofty Ranges
Kangaroo Island
Flinders
Mid North
North East Pastoral
WS: 64–93 km/h
WG: 93–113 km/h
28/09/2016 17:27
Severe Weather Warning
50–75 km/h Up to 140 km/h
West Coast
Lower Eyre Peninsula
Eastern Eyre Peninsula
Yorke Peninsula
North West Pastoral
Parts of:
Adelaide Metropolitan
Mount Lofty Ranges
Kangaroo Island
Flinders
Mid North
North East Pastoral
WS: 67–93 km/h
WG: 93–113 km/h
28/09/2016 17:52
Severe Thunderstorm Warning
N/A (no additional information)
Up to 140 km/h
Flinders
Riverland
Parts of:
Mid North
North East Pastoral
WS: 70–93 km/h
WG: 93–113 km/h
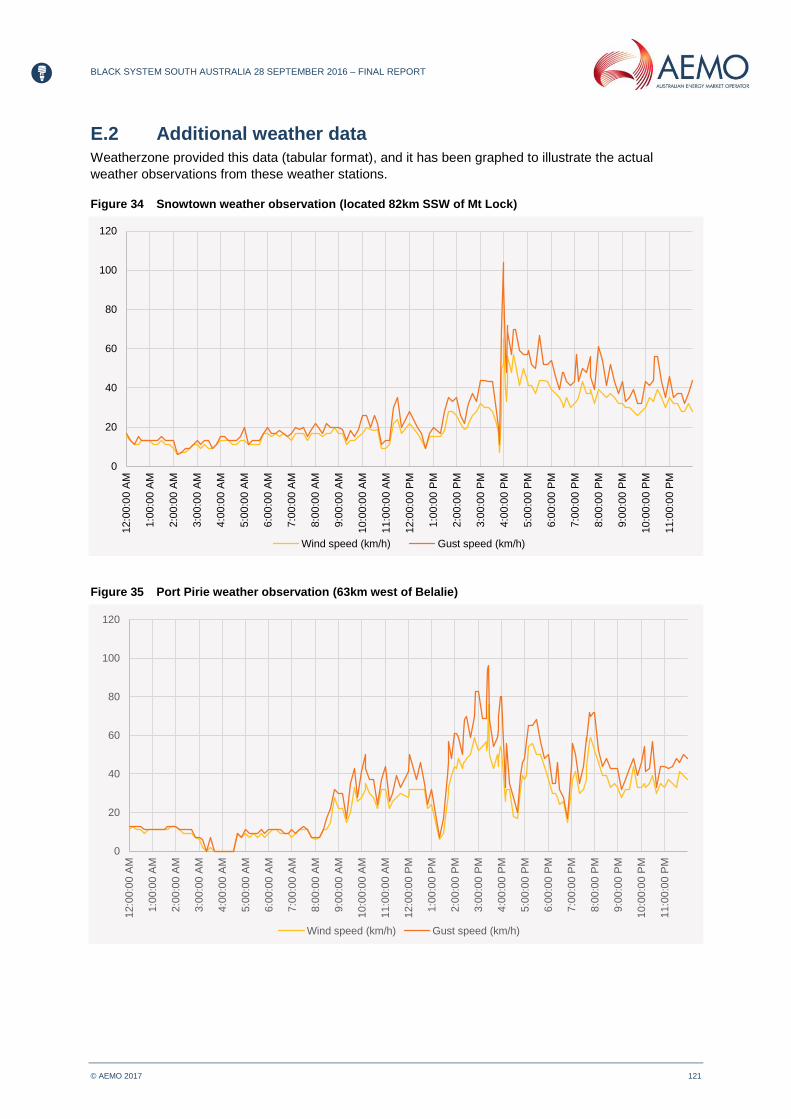
BLACK SYSTEM SOUTH AUSTRALIA 28 SEPTEMBER 2016 – FINAL REPORT
© AEMO 2017 121
E.2 Additional weather data
Weatherzone provided this data (tabular format), and it has been graphed to illustrate the actual
weather observations from these weather stations.
Figure 34 Snowtown weather observation (located 82km SSW of Mt Lock)
Figure 35 Port Pirie weather observation (63km west of Belalie)
0
20
40
60
80
100
120
12:0
0:0
0 A
M
1:0
0:0
0 A
M
2:0
0:0
0 A
M
3:0
0:0
0 A
M
4:0
0:0
0 A
M
5:0
0:0
0 A
M
6:0
0:0
0 A
M
7:0
0:0
0 A
M
8:0
0:0
0 A
M
9:0
0:0
0 A
M
10:0
0:0
0 A
M
11:0
0:0
0 A
M
12:0
0:0
0 P
M
1:0
0:0
0 P
M
2:0
0:0
0 P
M
3:0
0:0
0 P
M
4:0
0:0
0 P
M
5:0
0:0
0 P
M
6:0
0:0
0 P
M
7:0
0:0
0 P
M
8:0
0:0
0 P
M
9:0
0:0
0 P
M
10:0
0:0
0 P
M
11:0
0:0
0 P
M
Wind speed (km/h) Gust speed (km/h)
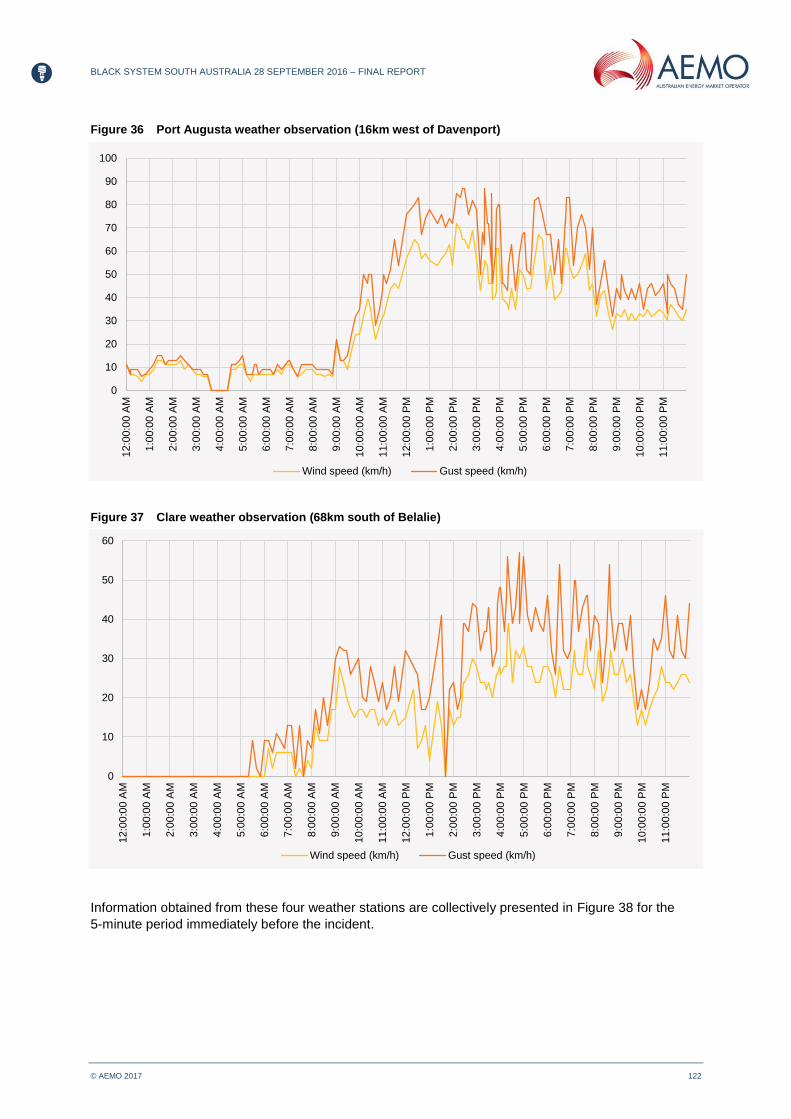
BLACK SYSTEM SOUTH AUSTRALIA 28 SEPTEMBER 2016 – FINAL REPORT
© AEMO 2017 122
Figure 36 Port Augusta weather observation (16km west of Davenport)
Figure 37 Clare weather observation (68km south of Belalie)
Information obtained from these four weather stations are collectively presented in Figure 38 for the
5-minute period immediately before the incident.
0
10
20
30
40
50
60
70
80
90
100
12:0
0:0
0 A
M
1:0
0:0
0 A
M
2:0
0:0
0 A
M
3:0
0:0
0 A
M
4:0
0:0
0 A
M
5:0
0:0
0 A
M
6:0
0:0
0 A
M
7:0
0:0
0 A
M
8:0
0:0
0 A
M
9:0
0:0
0 A
M
10:0
0:0
0 A
M
11:0
0:0
0 A
M
12:0
0:0
0 P
M
1:0
0:0
0 P
M
2:0
0:0
0 P
M
3:0
0:0
0 P
M
4:0
0:0
0 P
M
5:0
0:0
0 P
M
6:0
0:0
0 P
M
7:0
0:0
0 P
M
8:0
0:0
0 P
M
9:0
0:0
0 P
M
10:0
0:0
0 P
M
11:0
0:0
0 P
M
Wind speed (km/h) Gust speed (km/h)
0
10
20
30
40
50
60
12:0
0:0
0 A
M
1:0
0:0
0 A
M
2:0
0:0
0 A
M
3:0
0:0
0 A
M
4:0
0:0
0 A
M
5:0
0:0
0 A
M
6:0
0:0
0 A
M
7:0
0:0
0 A
M
8:0
0:0
0 A
M
9:0
0:0
0 A
M
10:0
0:0
0 A
M
11:0
0:0
0 A
M
12:0
0:0
0 P
M
1:0
0:0
0 P
M
2:0
0:0
0 P
M
3:0
0:0
0 P
M
4:0
0:0
0 P
M
5:0
0:0
0 P
M
6:0
0:0
0 P
M
7:0
0:0
0 P
M
8:0
0:0
0 P
M
9:0
0:0
0 P
M
10:0
0:0
0 P
M
11:0
0:0
0 P
M
Wind speed (km/h) Gust speed (km/h)
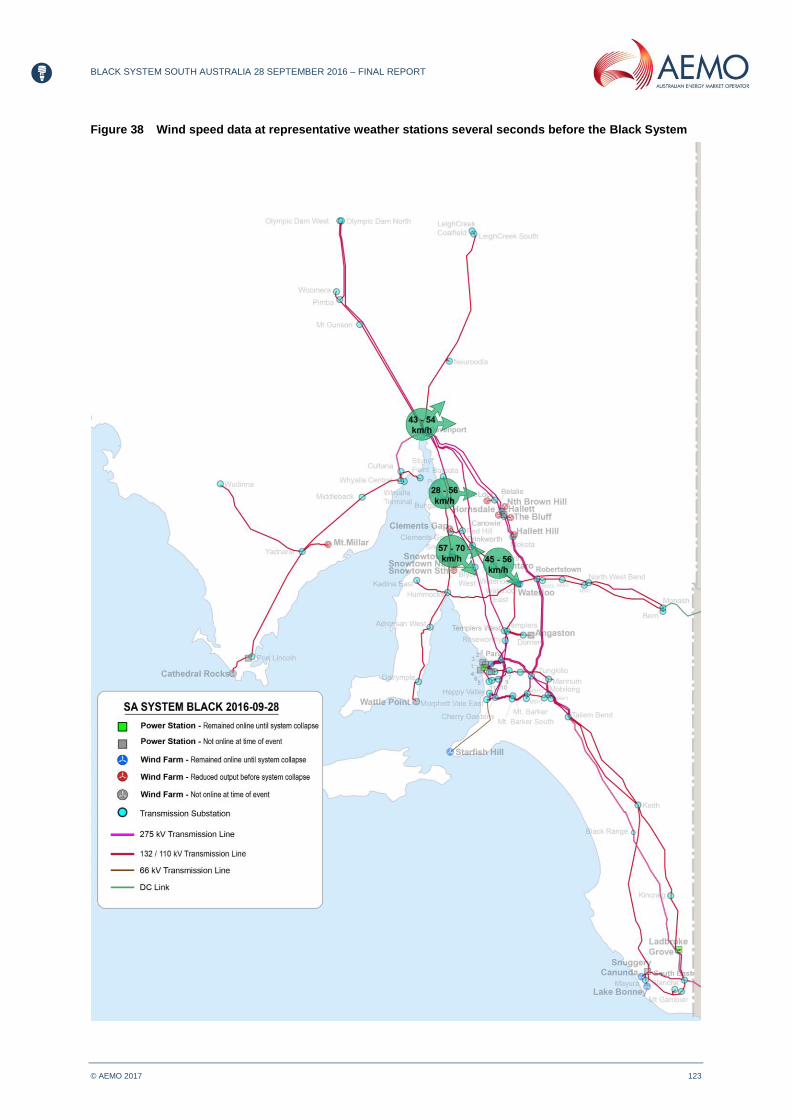
BLACK SYSTEM SOUTH AUSTRALIA 28 SEPTEMBER 2016 – FINAL REPORT
© AEMO 2017 123
Figure 38 Wind speed data at representative weather stations several seconds before the Black System

BLACK SYSTEM SOUTH AUSTRALIA 28 SEPTEMBER 2016 – FINAL REPORT
© AEMO 2017 124
E.3 Pre-event wind farm outputs Table 22 details wind farms that reduced output during the pre-event timeframe.
Table 22 Table of wind farm output reductions (pre-event)
Wind farm Initial MW
Time of reduction
MW reduction
Time to reduce MW
Recovery ‘Intermittency’ confirmed by wind farm data
North Brown Hill
126 14:29 91 < 5 min Began at 14:41, stabilised at 14:52. Output ~40 MW lower.
No
Hallet 85 14:29 74 < 5 min Began at 14:49, stabilised at 14:52 (55 MW) then 15:02. Output back to 85 MW.
No
Cathedral Rocks
21 14:33 21 < 5 min Stayed at 0 MW. No
Snowtown South
107 15:42 53 ~ 5 min Began at 15:49, increased ~20 MW before reducing then back to 98 MW at 16:13.
Yes
Snowtown North
141 15:44 141 < 10 min Began at 16:07, reached 56 MW at 16:16.
Yes
Snowtown 40 15:45 32 ~ 5 min Stayed at 0 MW. No
Clements Gap
43 15:46 41 ~ 10 min Began at 15:59, only reached 14 MW at 16:12.
No
Bluff 51 15:49 10 ~ 1 min Began at 16:06, back to 50 MW at 16:06.
No
BLACK SYSTEM SOUTH AUSTRALIA 28 SEPTEMBER 2016 – FINAL REPORT
© AEMO 2017 125
APPENDIX F. POWER SYSTEM SECURITY
MANAGEMENT
F.1 AEMO’s roles and responsibilities AEMO operates the power system in the NEM from two control rooms in different states. These co-
primary centres operate 24 hours / 365 days a year, and are equipped with identical telecommunication
and information technology systems. They operate as a virtual single control room with one on-shift
manager who coordinates the control room daily activities and immediate operational response to
emergencies.
The NER and AEMO’s operating procedures govern the operation of the NEM and the power system.
Chapter 4 of the NER sets out the rules and framework that govern AEMO’s responsibilities.
F.2 Preparedness
AEMO works in conjunction with Registered Participants to develop plans, where required, to cover
planned and unplanned outages on the power system to an N-1 standard. 122 F
123 These plans are
developed to ensure the power system is prepared for credible contingency event that would have the
largest impact on the power system. 123F
124 This may be the loss of a generator, load, or transmission
element. AEMO continuously assesses the state of the power system and environmental conditions that
can impact either demand or security of the network, with AEMO control rooms having a range of real-
time diagnostic tools to assist with the monitoring of the power system and automatic control schemes
during normal and abnormal power system conditions.
AEMO’s situational awareness and response to conditions on the power system are provided through
resources and processes including:
Dedicated services providing detailed current weather conditions and forecast weather up to seven
days ahead.
Lightning and bushfire detection systems.
Monitoring of geo-magnetic disturbance.
Various control schemes to safeguard equipment and manage loading of equipment within ratings
following contingencies.
Established procedures specifying action when the monitored conditions change beyond
acceptable thresholds.
Dispatch of generation taking into account power transfer limits of the power system, and
environmental conditions.
Manual and automatic UFLS across the power system – of the load supplied. This is a NER
requirement to assist managing multiple or non-credible contingencies.
Availability of under voltage load shedding at various locations, where required.
Procurement of SRAS (see Appendix P).
F.3 Definition of a contingency event A contingency event is defined in clause 4.2.3(a) of the NER as an event affecting the power system
which AEMO expects would be likely to involve the failure or removal from operational service of one or
more generating units and/or transmission elements.
123 N-1 redundancy is a standard of resilience that ensures system availability in the event of failure of any single transmission element, load, or
generation unit. 124 Credible contingency events are events that are considered as reasonably likely to occur in normal operation of the electricity supply system,
including the trip of any single item of plant. AEMO must prepare the power system to be secure should the event occur. Non-credible contingency events are considered to be events that are less likely to occur such as the loss of a multiple items of plant at the same time – these include the loss of double circuit transmission lines or multiple generating units.

BLACK SYSTEM SOUTH AUSTRALIA 28 SEPTEMBER 2016 – FINAL REPORT
© AEMO 2017 126
The voluntary removal from service of transmission network equipment by a TNSP due to routine
or unusual conditions is regarded as a planned or short notice outage; it is not regarded as a
contingency event.
F.4 Definition of a credible contingency event
A credible contingency event is defined in clause 4.2.3 (b) of the NER as a contingency event the
occurrence of which AEMO considers to be reasonably possible in the surrounding circumstances
including the technical envelope. Without limitation, examples of credible contingency events are likely
to include:
(1) the unexpected automatic or manual disconnection of, or the unplanned reduction in capacity of,
one operating generating unit; or
(2) the unexpected disconnection of one major item of transmission plant (e.g. transmission line,
transformer or reactive plant) other than as a result of a three phase electrical fault anywhere on
the power system.
F.5 Definition of a non-credible contingency event
A non-credible contingency event is defined in clause 4.2.3 (e) of the NER as a contingency event other
than a credible contingency event. Without limitation, examples of non-credible contingency events are
likely to include:
(1) three phase electrical faults on the power system; or
(2) simultaneous disruptive events such as:
(i) multiple generating unit failures; or
(ii) double circuit transmission line failure (such as may be caused by tower collapse).
An event is credible if AEMO considers it reasonably possible in the surrounding circumstances and the
technical envelope of the power system. The NER indicates that the unplanned tripping of a single
generating unit or major transmission element would ordinarily be considered credible.
Events which are normally considered to be non-credible contingency events include:
The trip of any busbar in the transmission network (these involve multiple disconnections of
transmission or generation assets).
The trip of more than one transmission element.
The trip of transmission plant in a manner not normally considered likely (e.g. a transmission line
that trips at one end only).
The trip of multiple generating units.
The trip of more than one load block where the combined load lost exceeds that which would
normally be considered a credible contingency event in that region.
The trip of a combination of transmission plant, scheduled generating units or load, where that
combination is not normally considered likely.
F.6 Secure operating state and power system security
Secure operating state and power system security is defined in clause 4.2.4 of the NER as:
(a) The power system is defined to be in a secure operating state if, in AEMO’s reasonable opinion,
taking into consideration the appropriate power system security principles described in clause 4.2.6:
(1) the power system is in a satisfactory operating state; and
(2) the power system will return to a satisfactory operating state following the occurrence of any
credible contingency event in accordance with the power system security standards.
(b) Without limitation, in forming the opinions described in clause 4.2.4(a), AEMO must:
(1) consider the impact of each of the potentially constrained interconnectors; and
BLACK SYSTEM SOUTH AUSTRALIA 28 SEPTEMBER 2016 – FINAL REPORT
© AEMO 2017 127
(2) use the technical envelope as the basis of determining events considered to be credible
contingency events at that time.
F.7 Satisfactory operating state
Satisfactory operating state is defined in clause 4.2.2 of the NER as:
The power system is defined as being in a satisfactory operating state when:
(a) the frequency at all energised busbars of the power system is within the normal operating
frequency band, except for brief excursions outside the normal operating frequency band but within
the normal operating frequency excursion band;
(b) the voltage magnitudes at all energised busbars at any switchyard or substation of the power
system are within the relevant limits set by the relevant Network Service Providers in accordance
with clause S5.1.4 of schedule 5.1;
(c) the current flows on all transmission lines of the power system are within the ratings (accounting
for time dependency in the case of emergency ratings) as defined by the relevant Network Service
Providers in accordance with schedule 5.1;
(d) all other plant forming part of or impacting on the power system is being operated within the
relevant operating ratings (accounting for time dependency in the case of emergency ratings) as
defined by the relevant Network Service Providers in accordance with schedule 5.1;
(e) the configuration of the power system is such that the severity of any potential fault is within the
capability of CBs to disconnect the faulted circuit or equipment; and
(f) the conditions of the power system are stable in accordance with requirements designated in or
under clause S5.1.8 of schedule 5.1.
F.8 Technical envelope
Technical envelope is defined in clause 4.2.5 of the NER as:
(a) The technical envelope means the technical boundary limits of the power system for achieving
and maintaining the secure operating state of the power system for a given demand and power
system scenario.
(b) AEMO must determine and revise the technical envelope (as may be necessary from time to time)
by taking into account the prevailing power system and plant conditions as described in clause
4.2.5(c).
(c) In determining and revising the technical envelope AEMO must take into account matters such as:
(1) AEMO's forecast of total power system load;
(2) the provision of the applicable contingency capacity reserves;
(3) operation within all plant capabilities of plant on the power system;
(4) contingency capacity reserves available to handle any credible contingency event;
(5) advised generation minimum load constraints;
(6) constraints on transmission networks, including short term limitations;
(7) ancillary service requirements;
(8) [Deleted]
(9) the existence of proposals for any major equipment or plant testing, including the checking of,
or possible changes in, transmission plant availability; and
(10) applicable performance standards.
(d) AEMO must, when determining the secure operating limits of the power system, assume that the
applicable performance standards are being met, subject to:
(1) a Registered Participant notifying AEMO, in accordance with rule 4.15(f), that a performance
standard is not being met; or

BLACK SYSTEM SOUTH AUSTRALIA 28 SEPTEMBER 2016 – FINAL REPORT
© AEMO 2017 128
(2) AEMO otherwise becoming aware that a performance standard is not being met.
F.9 Contingency management
Only credible contingency events are considered when assessing whether the system is in a secure
operating state.
Contingency management refers to AEMO’s operational management of the power system so that the
power system remains within the pre-defined technical limits (primarily related to voltage, frequency,
and asset loading) following a credible contingency.
A contingency on the power system may result in any number of abnormal conditions, some of which
are listed below:
Reduced transmission capacity between generators and load centres.
Reduced interconnector transmission capacity.
Separation of parts of the network into islands.
Generation and loads relying on single connections resulting in larger than normal credible
contingencies.
The majority of single contingency events are considered as being credible at all times. Some however,
are defined as being credible or non-credible depending on the surrounding circumstances at the time.
F.10 Reclassifying contingency events
Reclassification of a non-credible contingency event to a credible contingency event may be necessary
at times to adequately reflect current or expected conditions. Abnormal conditions may result in
reclassification. The reclassification is based upon an assessed increase in the likelihood of a trip of
equipment to occur, the occurrence of which is normally considered to be relatively low. If AEMO
determines that the occurrence of the non-credible event is reasonably possible, based on established
criteria, then AEMO must reclassify the event as credible.
The reclassification of a non-credible contingency event to a credible contingency event is to be advised
to participants by the issue of a Market Notice.
Abnormal conditions are conditions posing added risks to the power system including without limitation
severe weather conditions, lightning storms, and bush fires. Whenever AEMO receives information on
abnormal conditions AEMO will discuss the situation with the relevant TNSP to determine whether any
non-credible contingency event is more likely to occur because of the existence of the abnormal
condition. If abnormal conditions exist near a regional boundary, all relevant TNSPs will be consulted.
The usual outcome of a reclassification is the introduction of a system constraint which depending on
circumstances, may increase prices in one or more NEM regions.
F.11 Registered Participant, Network Service Provider, and System Operator responsibilities
In accordance with clause 4.8.1 of the NER, Registered Participants must promptly advise AEMO or
a relevant ‘System Operator’124F
125 of any circumstance that could be expected to adversely affect the
secure operation of the power system or any equipment owned or under the control of the
Registered Participant.
A System Operator must, to the extent it is aware, keep AEMO fully and timely informed as to:
The state of the security of that part of the power system under its control.
Any present or anticipated risks to power system security, such as bushfires.
125 Generally, a TNSP to whom AEMO has delegated some of its power system security responsibilities under clause 4.3.3 of the NER. In this
instance, ElectraNet is the System Operator for SA.

BLACK SYSTEM SOUTH AUSTRALIA 28 SEPTEMBER 2016 – FINAL REPORT
© AEMO 2017 129
-------------------------------------------------------------------------------------------------------------------
Clause 4.8.1 of the NER – extract 125F
126
4.8.1 Registered Participants' advice
A Registered Participant must promptly advise AEMO or a relevant System Operator at the time that
the Registered Participant becomes aware, of any circumstance which could be expected to
adversely affect the secure operation of the power system or any equipment owned or under the
control of the Registered Participant or a Network Service Provider.
---------------------------------------------------------------------------------------------------------------------
F.12 Reclassifying contingency events due to lightning
Reclassification of a non-credible contingency event to a credible contingency event could be
necessary at times to reflect current or expected conditions, known as ‘abnormal conditions’. AEMO’s
Power System Security Guidelines 126F
127 detail the process undertaken by AEMO, and criteria used when
assessing whether such a reclassification is warranted. If AEMO determines that the occurrence of the
non-credible contingency event is reasonably possible, AEMO will reclassify the event as a credible
contingency event.
Lightning causing the trip of two adjacent single circuit transmission lines is considered to be highly
unlikely and is generally not taken into consideration for reclassification.
F.12.1 Vulnerable transmission lines
Lightning in the vicinity of a double circuit transmission line that is considered ‘vulnerable’ means that
the event is eligible to be reclassified as a credible contingency event during a lightning storm if a cloud
to ground lightning strike is detected within a specified distance of the relevant line.
The criteria used to determine whether a line should be classified as ‘vulnerable’ include whether the
line has tripped due to lightning in the last three years and where the TNSP has advised AEMO that the
line has deteriorated to such an extent that warrants reclassification. 127F
128 These classifications are
reviewed every two years. 128F
129 In general, the higher the operating voltage of a transmission line, the less
it is likely to be affected by lightning.
F.13 Reclassification due to “other” threats
Reclassification due to ‘other’ threats 129F
130 may include but is not limited to the following:
Multiple generating unit disconnection.
Impact of pollution on transmission line insulators.
Impact of Protection or Control Systems Malfunction.
In all such cases (that is, for threats other than Lightning, Bushfires, and Geomagnetic Induced
Currents (GICs)), AEMO relies on advice from the asset owner regarding increased risks to their plant
due to abnormal conditions.
F.14 Black System
A ‘black system’ is defined in the NER (Chapter 10 Glossary) as:
The absence of voltage on all or a significant part of the transmission system or within a region
during a major supply disruption affecting a significant number of customers.
126 Based on NER version 85, http://www.aemc.gov.au/energy-rules/national-electricity-rules/current-rules. 127 See http://www.aemo.com.au/Electricity/National-Electricity-Market-NEM/Security-and-reliability/Power-system-operation. 128 See Section 11.4 of AEMO’s Power System Security Guidelines for further information, available at: http://www.aemo.com.au/Electricity/National-
Electricity-Market-NEM/Security-and-reliability/Power-system-operation. 129 See Section 11.4.7 of AEMO’s Power System Security Guidelines. 130 In accordance with NER 4.8.1.

BLACK SYSTEM SOUTH AUSTRALIA 28 SEPTEMBER 2016 – FINAL REPORT
© AEMO 2017 130
APPENDIX G. SA SYSTEM VOLTAGES
Figure 39 Voltages measured at Davenport–Olympic Dam 275 kV line
Figure 40 Voltages measured at Robertstown–Tungkillo 275 kV line
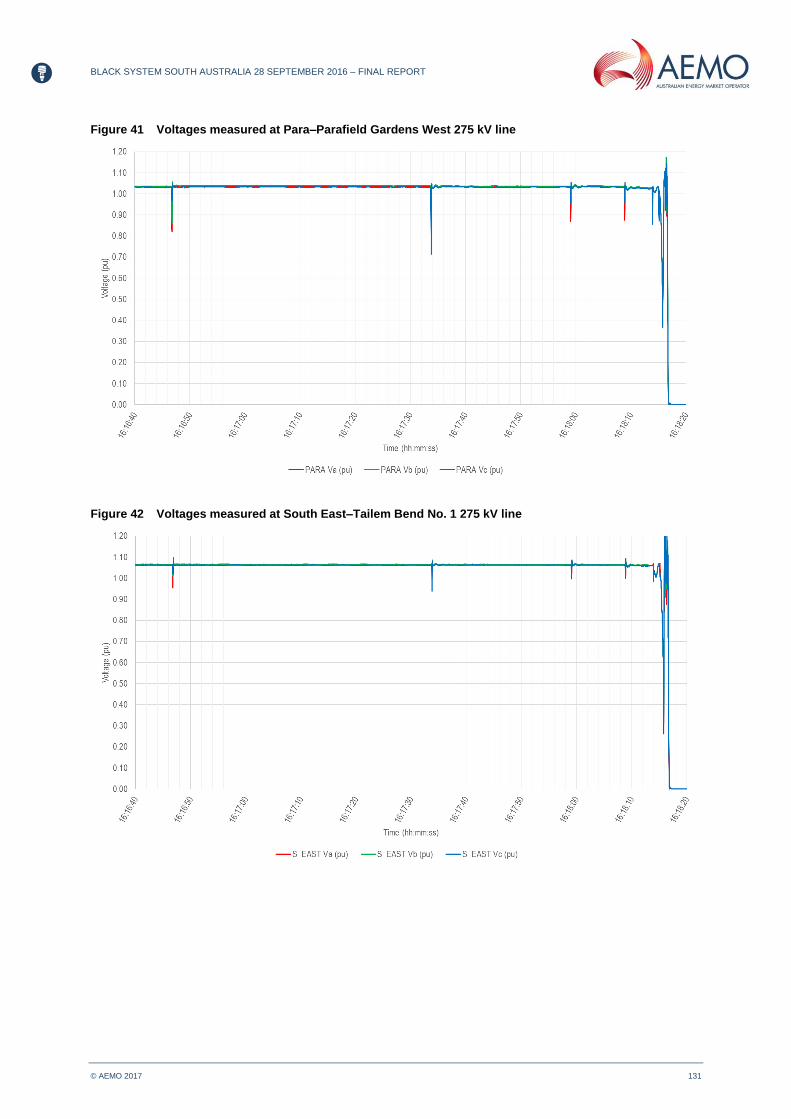
BLACK SYSTEM SOUTH AUSTRALIA 28 SEPTEMBER 2016 – FINAL REPORT
© AEMO 2017 131
Figure 41 Voltages measured at Para–Parafield Gardens West 275 kV line
Figure 42 Voltages measured at South East–Tailem Bend No. 1 275 kV line

BLACK SYSTEM SOUTH AUSTRALIA 28 SEPTEMBER 2016 – FINAL REPORT
© AEMO 2017 132
APPENDIX H. GENERATOR PERFORMANCE
STANDARD REQUIREMENTS FOR FAULT
RIDE-THROUGH
Performance standards requirements for fault ride-through are defined under clause S5.2.5.5 of the
NER (Generating system response following contingency events). There is some inter-relation with
clause S5.2.5.4 (Generating system response to voltage disturbance).
In SA, there are also some special licencing conditions applied by ESCOSA that define the required
performance level in relation to fault ride-through capability. AEMO assists ESCOSA in confirming that
a generating system will meet its special licence conditions.
Under the NER, AEMO has an advisory role 130 F
131 in negotiating particular clauses of generator
performance standards. AEMO assesses proposed performance standards and works with the
applicant and connecting network service provider to ensure that the agreed performance standard is
consistent with the NER and meets the system requirements.
One of the criteria for eligibility for registration as a Generator under Chapter 2 of the NER is for a
Generator to satisfy AEMO that each generating system is capable of meeting or exceeding its
performance standards. To aid this exercise, AEMO regularly conducts due diligence reviews of an
applicant’s technical studies relating to connection and negotiation of performance standards.
AEMO also reviews test results following commissioning of new generating systems to ensure that
performance standards compliance is demonstrated.
Performance standards are negotiated at a level between automatic standard and minimum standard.
The standards for fault ride-through have developed over time, the most significant change between
versions 12 and 13 of the NER.131F
132 Today, in SA, a fault ride-through standard negotiated under
S5.2.5.5 of the NER requires that a generating system maintains continuous uninterrupted operation for
the range of faults and protection clearance times described under the automatic standard for S5.2.5.5.
131 AEMO has an additional function in Victoria as the transmission network service provider (TNSP). 132 Version 13 of the NER was effective on 31 May 2007.
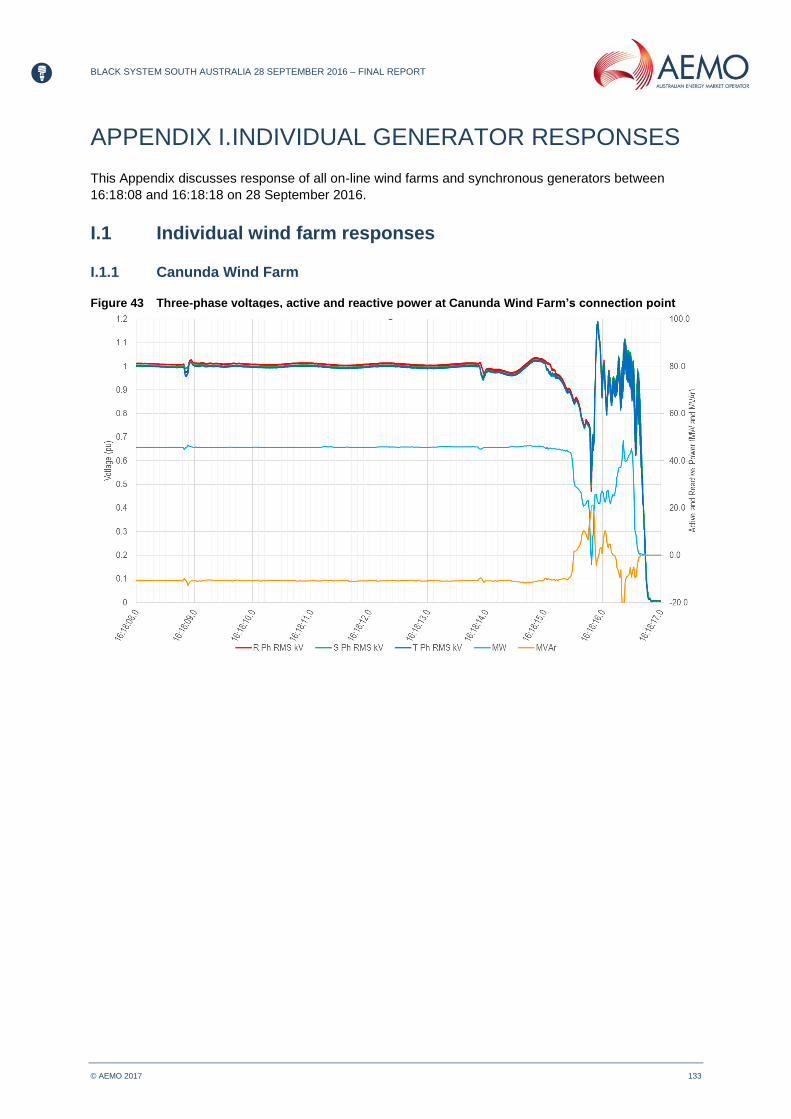
BLACK SYSTEM SOUTH AUSTRALIA 28 SEPTEMBER 2016 – FINAL REPORT
© AEMO 2017 133
APPENDIX I. INDIVIDUAL GENERATOR RESPONSES
This Appendix discusses response of all on-line wind farms and synchronous generators between
16:18:08 and 16:18:18 on 28 September 2016.
I.1 Individual wind farm responses
I.1.1 Canunda Wind Farm
Figure 43 Three-phase voltages, active and reactive power at Canunda Wind Farm’s connection point

BLACK SYSTEM SOUTH AUSTRALIA 28 SEPTEMBER 2016 – FINAL REPORT
© AEMO 2017 134
I.1.2 Clements Gap Wind Farm
Figure 44 Three-phase voltages, active and reactive power at Clements Gap Wind Farm’s connection
point
I.1.3 Hallett Wind Farm
Figure 45 Three-phase voltages, active and reactive power at Hallett Wind Farm’s connection point
Has periods of no data – linear extrapolation between points.

BLACK SYSTEM SOUTH AUSTRALIA 28 SEPTEMBER 2016 – FINAL REPORT
© AEMO 2017 135
I.1.4 Hallett Hill Wind Farm
Figure 46 Three-phase voltages, active and reactive power at Hallett Hill Wind Farm’s connection point
Has periods of no data – linear extrapolation between points.
I.1.5 Hornsdale Wind Farm
Figure 47 Three-phase voltages, active and reactive power at Hornsdale Wind Farm’s connection point

BLACK SYSTEM SOUTH AUSTRALIA 28 SEPTEMBER 2016 – FINAL REPORT
© AEMO 2017 136
I.1.6 Lake Bonney 1 Wind Farm
Figure 48 Three-phase voltages, active and reactive power at Lake Bonney Wind Farm’s connection point
I.1.7 Lake Bonney 2 Wind Farm
Figure 49 Three-phase voltages, active and reactive power at Lake Bonney 2 Wind Farm’s connection
point

BLACK SYSTEM SOUTH AUSTRALIA 28 SEPTEMBER 2016 – FINAL REPORT
© AEMO 2017 137
I.1.8 Lake Bonney 3 Wind Farm
Figure 50 Three-phase voltages, active and reactive power at Lake Bonney 3 Wind Farm’s connection
point
I.1.9 Mt Millar Wind Farm
Figure 51 Three-phase voltages, active and reactive power at Mt Millar Wind Farm’s connection point
Has periods of no data – linear extrapolation between points.
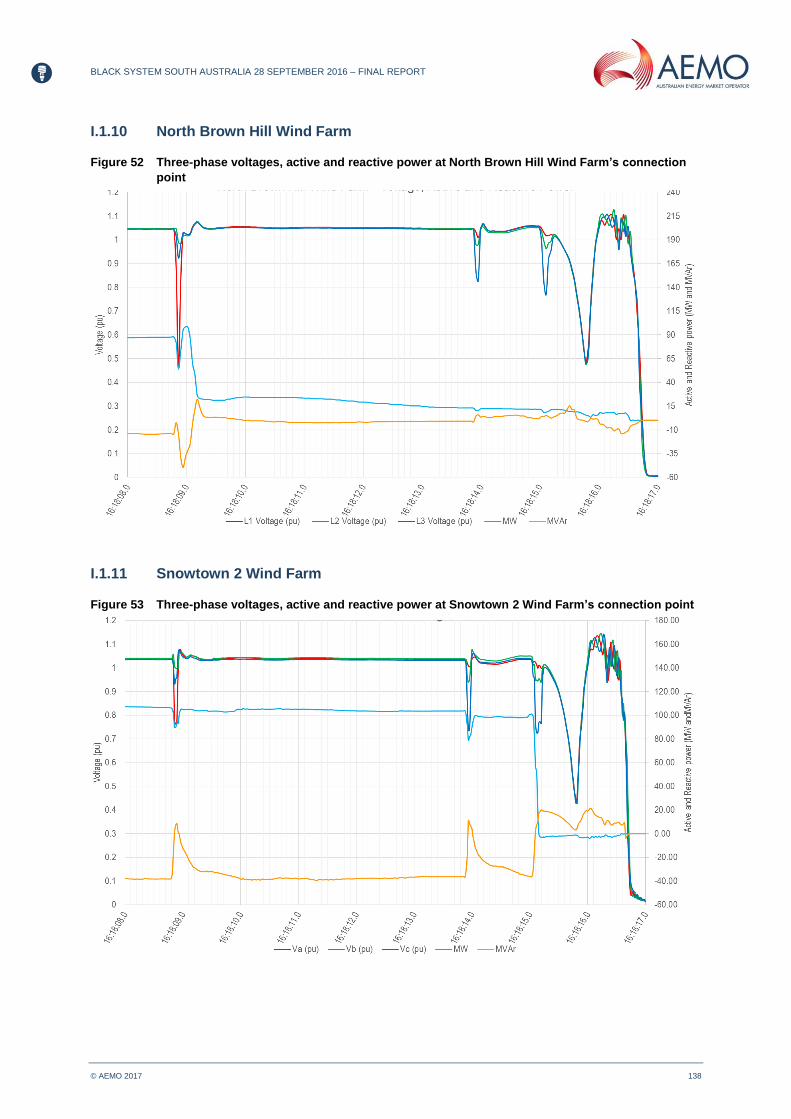
BLACK SYSTEM SOUTH AUSTRALIA 28 SEPTEMBER 2016 – FINAL REPORT
© AEMO 2017 138
I.1.10 North Brown Hill Wind Farm
Figure 52 Three-phase voltages, active and reactive power at North Brown Hill Wind Farm’s connection
point
I.1.11 Snowtown 2 Wind Farm
Figure 53 Three-phase voltages, active and reactive power at Snowtown 2 Wind Farm’s connection point

BLACK SYSTEM SOUTH AUSTRALIA 28 SEPTEMBER 2016 – FINAL REPORT
© AEMO 2017 139
I.1.12 The Bluff Wind Farm
Figure 54 Three-phase voltages, active and reactive power at The Bluff Wind Farm’s connection point
I.1.13 Waterloo Wind Farm
Figure 55 Three-phase voltages, active and reactive power at Waterloo Wind Farm’s connection point

BLACK SYSTEM SOUTH AUSTRALIA 28 SEPTEMBER 2016 – FINAL REPORT
© AEMO 2017 140
I.2 Individual synchronous generating unit’s responses
I.2.1 TIPS B1
Figure 56 Three-phase voltages, active and reactive power at TIPS B1 connection point
I.2.2 TIPS B3
Figure 57 Three-phase voltages, active and reactive power at TIPS B3 connection point
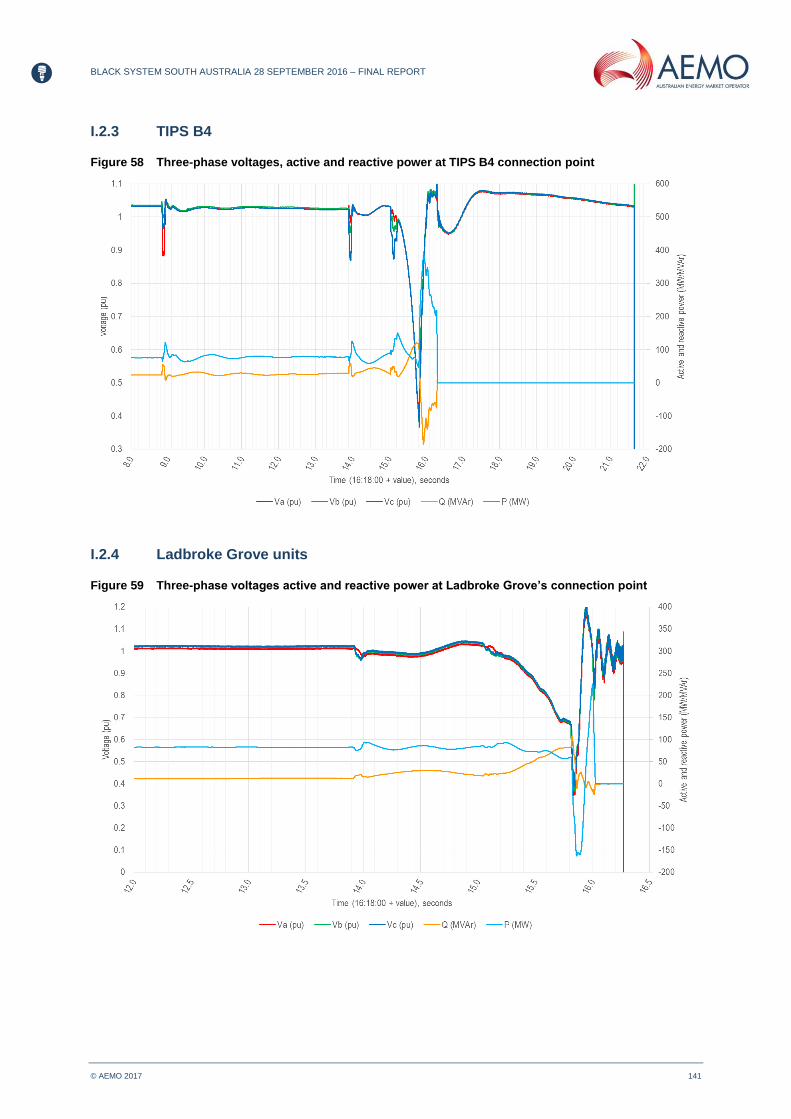
BLACK SYSTEM SOUTH AUSTRALIA 28 SEPTEMBER 2016 – FINAL REPORT
© AEMO 2017 141
I.2.3 TIPS B4
Figure 58 Three-phase voltages, active and reactive power at TIPS B4 connection point
I.2.4 Ladbroke Grove units
Figure 59 Three-phase voltages active and reactive power at Ladbroke Grove’s connection point
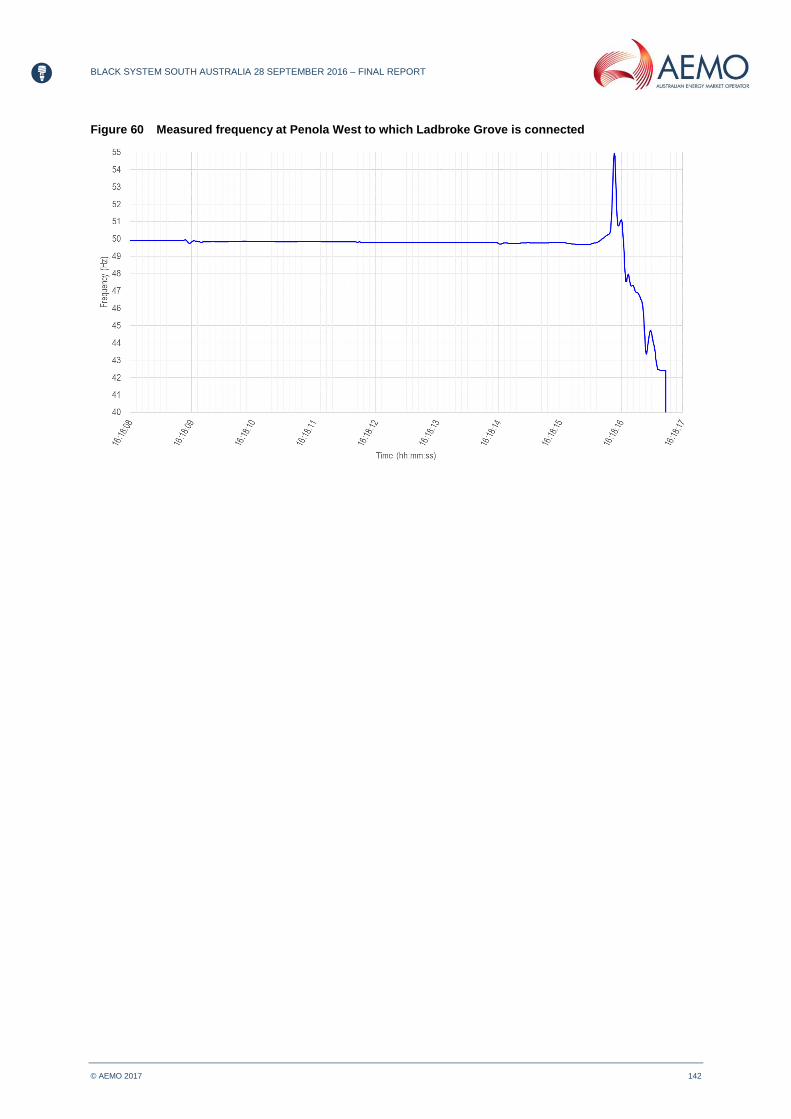
BLACK SYSTEM SOUTH AUSTRALIA 28 SEPTEMBER 2016 – FINAL REPORT
© AEMO 2017 142
Figure 60 Measured frequency at Penola West to which Ladbroke Grove is connected
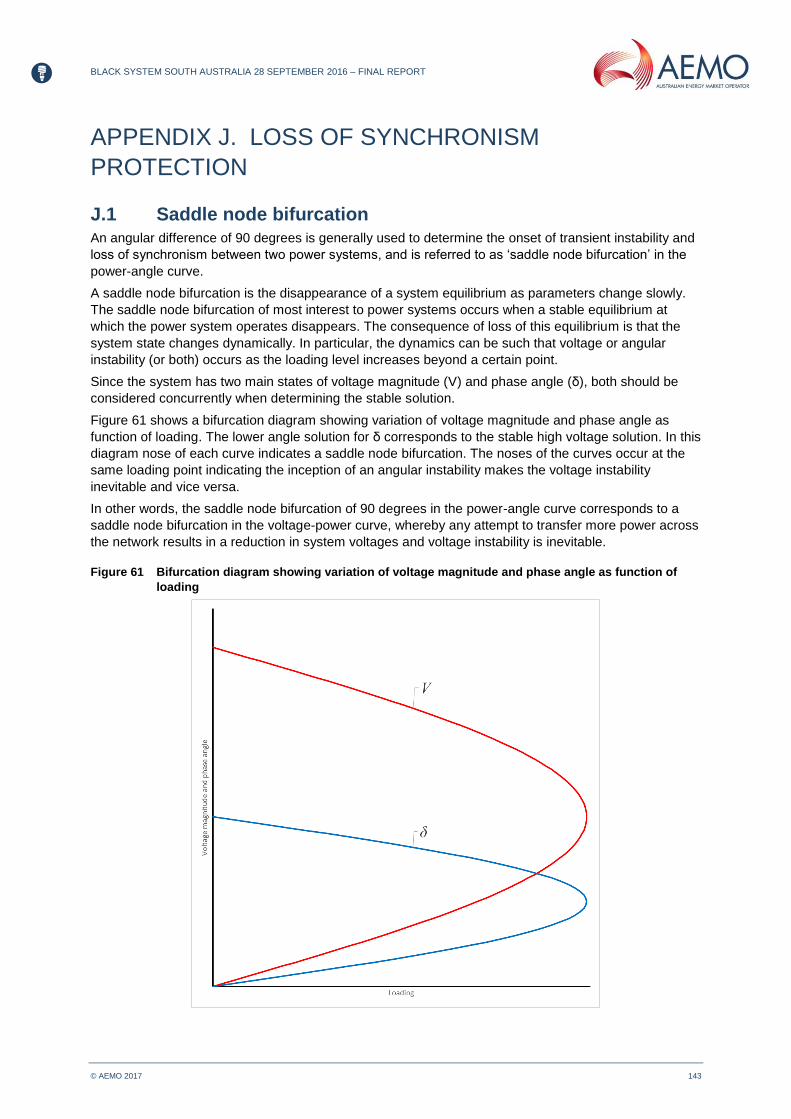
BLACK SYSTEM SOUTH AUSTRALIA 28 SEPTEMBER 2016 – FINAL REPORT
© AEMO 2017 143
APPENDIX J. LOSS OF SYNCHRONISM
PROTECTION
J.1 Saddle node bifurcation An angular difference of 90 degrees is generally used to determine the onset of transient instability and
loss of synchronism between two power systems, and is referred to as ‘saddle node bifurcation’ in the
power-angle curve.
A saddle node bifurcation is the disappearance of a system equilibrium as parameters change slowly.
The saddle node bifurcation of most interest to power systems occurs when a stable equilibrium at
which the power system operates disappears. The consequence of loss of this equilibrium is that the
system state changes dynamically. In particular, the dynamics can be such that voltage or angular
instability (or both) occurs as the loading level increases beyond a certain point.
Since the system has two main states of voltage magnitude (V) and phase angle (δ), both should be
considered concurrently when determining the stable solution.
Figure 61 shows a bifurcation diagram showing variation of voltage magnitude and phase angle as
function of loading. The lower angle solution for δ corresponds to the stable high voltage solution. In this
diagram nose of each curve indicates a saddle node bifurcation. The noses of the curves occur at the
same loading point indicating the inception of an angular instability makes the voltage instability
inevitable and vice versa.
In other words, the saddle node bifurcation of 90 degrees in the power-angle curve corresponds to a
saddle node bifurcation in the voltage-power curve, whereby any attempt to transfer more power across
the network results in a reduction in system voltages and voltage instability is inevitable.
Figure 61 Bifurcation diagram showing variation of voltage magnitude and phase angle as function of
loading

BLACK SYSTEM SOUTH AUSTRALIA 28 SEPTEMBER 2016 – FINAL REPORT
© AEMO 2017 144
J.2 Operating philosophy of loss of synchronism protection
Power swing blocking and out-of-step tripping relays are generally used in power systems for controlled
tripping of certain power system elements as necessary to minimise widespread impact of disturbances,
and to protect against loss of synchronism. The operating philosophy is such that the apparent
impedance seen by the relay during the steady-state condition is fairly large reflecting healthy system
voltages, and currents varying between no load and full load. The apparent steady-state impedance is
therefore farm from the relay operating characteristic indicating no spurious tripping will occur.
Power system faults and large power swings due to generation and transmission network disconnection
will result in a concurrent reduction in system voltages and an increase in the current flowing through
the relay. The apparent impedance will therefore be much smaller than the steady-state impedance. It
is therefore likely for the impedance trajectory to enter the relay operating characteristic at which point a
trip command (often with a delay) is initiated.
The traditional and most common method used in power swing detection is based on measuring the
positive-sequence impedance and the transition time through a blocking impedance area in the R-X
(resistance-reactance) diagram. The movement of the impedance for short circuit faults is faster
compared to the movement for a power swing.
A timer is started when the impedance measured enters the outer characteristic. If the measured
impedance remains between the inner and outer characteristic for the set time delay, it is considered a
stable power swing and the tripping of the relay is blocked during a certain time. However, if impedance
trajectory crosses the inner and outer characteristic in a time shorter than the set time delay, it is
considered either as a short circuit fault or unstable power swing and relay tripping is permitted. After an
out-of-step phenomenon has occurred, the relay separates the power system near the power swing
centre to curtail the extent of the out-of-step condition and to minimise its impact.

BLACK SYSTEM SOUTH AUSTRALIA 28 SEPTEMBER 2016 – FINAL REPORT
© AEMO 2017 145
APPENDIX K. HISTORICAL SA SYSTEM SEPARATION
EVENTS
This appendix presents Heywood Interconnector MW flow and voltages across the SA power system for
relevant system separation events following NEM inception.
K.1 2 December 1999
Figure 62 Heywood Interconnector MW flow, and SA system voltages for 2 December 1999 event
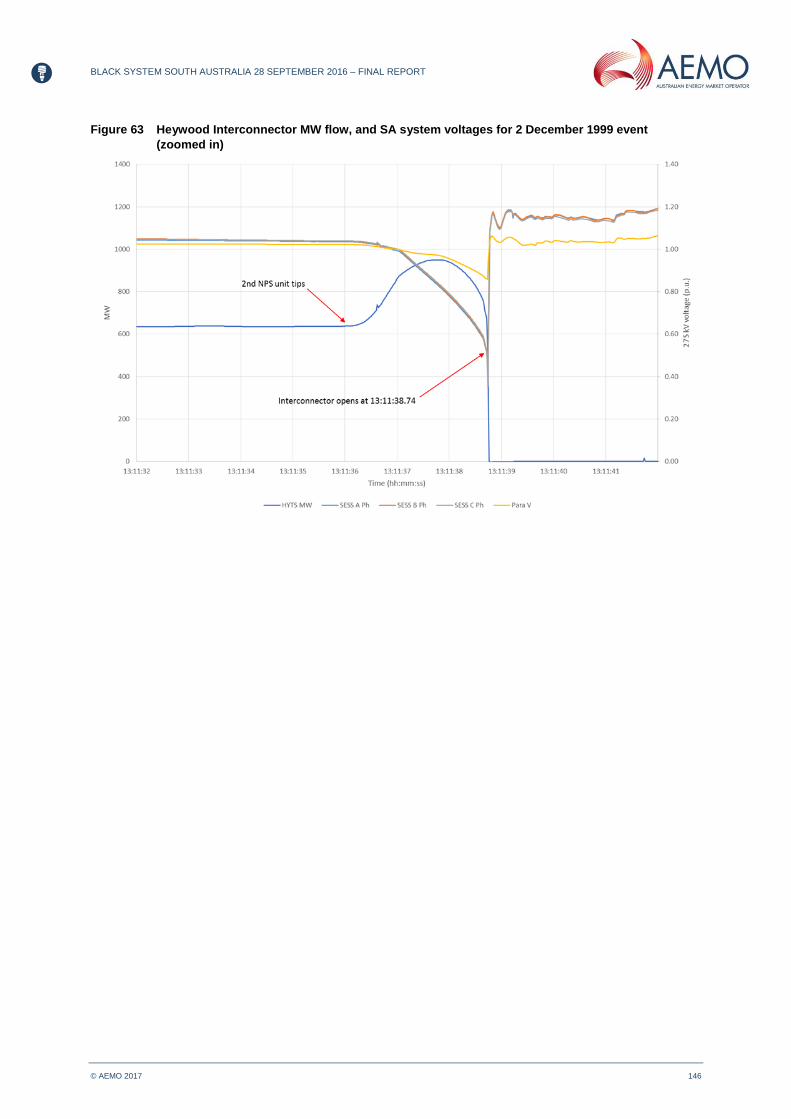
BLACK SYSTEM SOUTH AUSTRALIA 28 SEPTEMBER 2016 – FINAL REPORT
© AEMO 2017 146
Figure 63 Heywood Interconnector MW flow, and SA system voltages for 2 December 1999 event
(zoomed in)

BLACK SYSTEM SOUTH AUSTRALIA 28 SEPTEMBER 2016 – FINAL REPORT
© AEMO 2017 147
Figure 64 SA and Heywood frequencies for 2 December 1999 event
K.2 8 March 2004
Figure 65 Heywood Interconnector MW flow, and SA system voltages for 8 March 2004 event

BLACK SYSTEM SOUTH AUSTRALIA 28 SEPTEMBER 2016 – FINAL REPORT
© AEMO 2017 148
Figure 66 SA and Heywood frequencies for 8 March 2004 event
K.3 14 March 2005
Figure 67 Heywood Interconnector MW flow, and SA system voltages for 14 March 2005 event
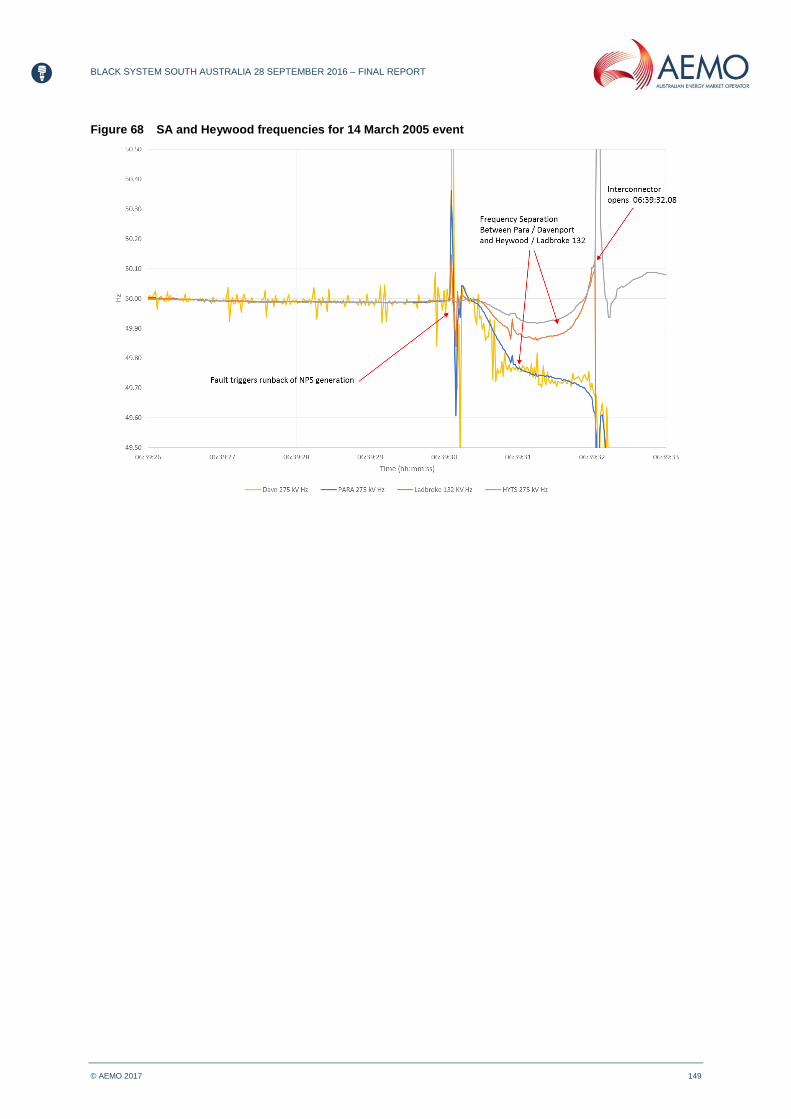
BLACK SYSTEM SOUTH AUSTRALIA 28 SEPTEMBER 2016 – FINAL REPORT
© AEMO 2017 149
Figure 68 SA and Heywood frequencies for 14 March 2005 event

BLACK SYSTEM SOUTH AUSTRALIA 28 SEPTEMBER 2016 – FINAL REPORT
© AEMO 2017 150
APPENDIX L. RESPONSE OF NETWORK REACTIVE
SUPPORT PLANT
This appendix shows response of the two Para SVCs and series capacitors at Black Range (AEMO
does not have sufficient data to determine the response of South East SVCs). Appendix L.3 has been
added for this final report.
L.1 Dynamic reactive support plant
Figure 69 Three-phase voltages and MVAr injection by Para SVC1
Figure 70 Three-phase voltages and MVAr injection by Para SVC2

BLACK SYSTEM SOUTH AUSTRALIA 28 SEPTEMBER 2016 – FINAL REPORT
© AEMO 2017 151
L.2 Series capacitors
Figure 71 Current across the two series capacitors and bypass time
L.3 Assess improvements in the response of network dynamic reactive support plant
SVCs and the external capacitor/reactor banks they switch are employed to maintain dynamic voltage
stability during system disturbances.
For most historical separation events in the SA power system, including the Black System, the SVCs at
Para and South East Substations provided full capacitive reactive power in response to each of the
network faults, including the one that occurred at 16:18:15:1 on 28 September 2016.
Due to full saturation of the SVCs’ output at the respective capacitive reactive limit, they were unable to
contribute further to avoid the rapidly declining system voltages caused by angular instability of the SA
power system after the fault clearance.
AEMO, in consultation with ElectraNet, carried out a number of power system simulation studies to
determine the extent to which the performance of the four SVCs can be optimised for events comprising
multiple voltage disturbances and several hundred MW of generation reduction within the SA power
system, like that which instigated angular instability on 28 September 2016.
The following modifications were investigated in the settings of the four SVCs:
Faster switching of the 2x100 MVAr external capacitors at Para Substation, and the 1x100 MVAr
capacitor at South East Substation.
At present, the pre-set time delay for switching in these capacitors is 5 seconds. Investigations
were carried out to determine the extent to which faster switching of out-of-service capacitors
with a time delay of 300 ms would assist in maintaining system voltages following significant
generation reduction in SA.
An increase in the slope (droop) of the SVC voltage control loop.

BLACK SYSTEM SOUTH AUSTRALIA 28 SEPTEMBER 2016 – FINAL REPORT
© AEMO 2017 152
A droop of 10% was investigated, compared to the current setting of 3%. This would make the
SVC less responsive for shallower voltage disturbances, allowing the SVC to maintain some
margin to respond to a subsequent voltage disturbance.
A reduction in the SVC integral gain.
SVCs at both the Para and South East Substations utilise integral control, as opposed to
proportional control. At present, the integral gains for the Para and South East SVC are set at
750 and 400 respectively. The impact of reducing the gains by half was investigated.
The following sub-sections evaluate the impact of these settings on the response of the SA power
system through PSS/E power system simulation studies.
L.3.1 Para SVCs
Figure 72 to Figure 74 show the response of the two Para SVCs during the actual event, and compare
these to modelled responses obtained with the above three modifications implemented.
These studies indicate that the response of the Para SVCs did not play a part in the causation chain
resulting in system separation, and that none of the modelled three improvements would have
prevented system separation. This can be attributed to the fact that the SVCs can only address the
symptom (dynamic voltage decline) rather than the cause (angular instability).
Figure 72 Reactive power output from the SVCs and external capacitors

BLACK SYSTEM SOUTH AUSTRALIA 28 SEPTEMBER 2016 – FINAL REPORT
© AEMO 2017 153
Figure 73 System voltages
Figure 74 Active and reactive power transfer at Heywood Interconnector
L.3.2 South East SVCs
Figure 75 to Figure 77 depict responses of the South East SVCs for the operating conditions during the
Black System with the current SVC settings, and with the modified setting investigated.
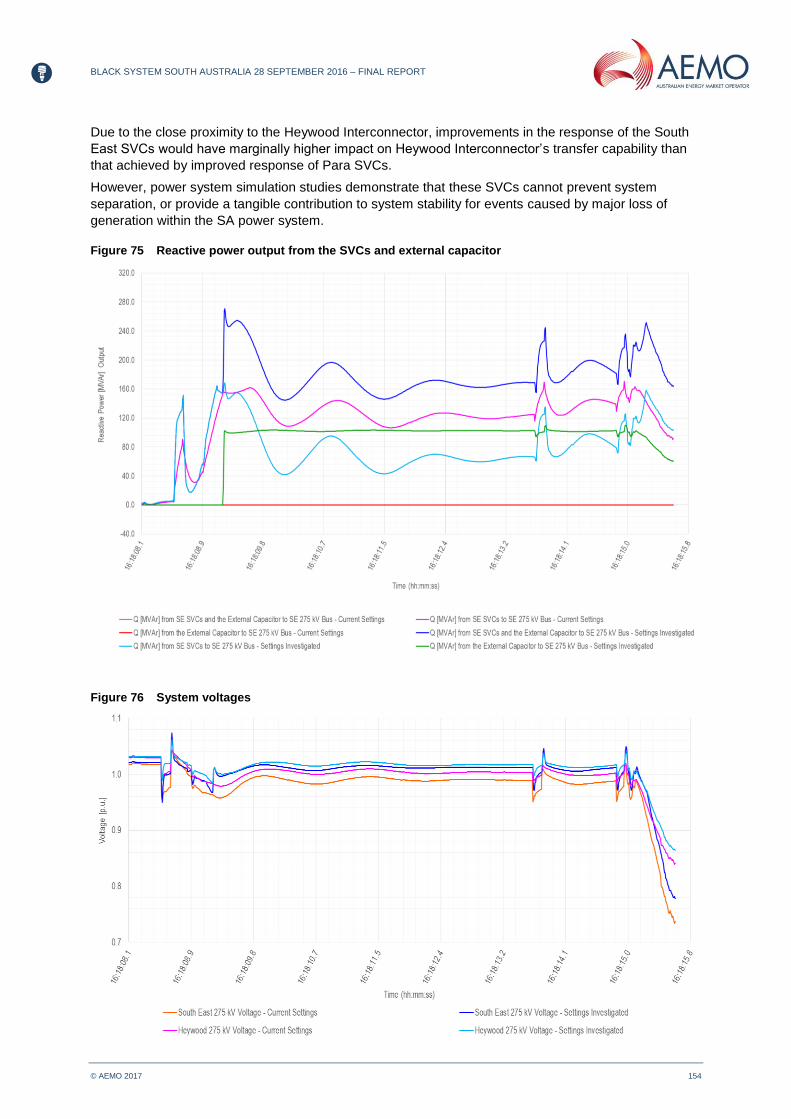
BLACK SYSTEM SOUTH AUSTRALIA 28 SEPTEMBER 2016 – FINAL REPORT
© AEMO 2017 154
Due to the close proximity to the Heywood Interconnector, improvements in the response of the South
East SVCs would have marginally higher impact on Heywood Interconnector’s transfer capability than
that achieved by improved response of Para SVCs.
However, power system simulation studies demonstrate that these SVCs cannot prevent system
separation, or provide a tangible contribution to system stability for events caused by major loss of
generation within the SA power system.
Figure 75 Reactive power output from the SVCs and external capacitor
Figure 76 System voltages
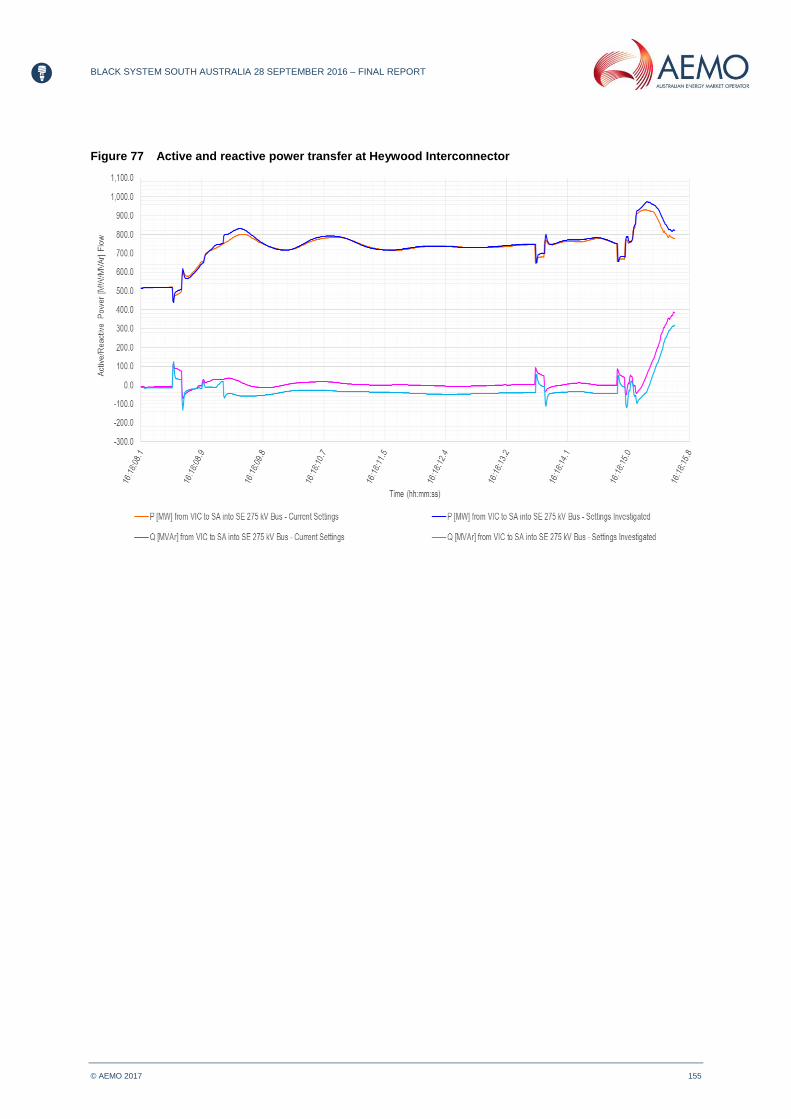
BLACK SYSTEM SOUTH AUSTRALIA 28 SEPTEMBER 2016 – FINAL REPORT
© AEMO 2017 155
Figure 77 Active and reactive power transfer at Heywood Interconnector

BLACK SYSTEM SOUTH AUSTRALIA 28 SEPTEMBER 2016 – FINAL REPORT
© AEMO 2017 156
APPENDIX M. NETWORK CAPABILITY ANALYSIS
This Appendix presents the results obtained from power system simulation studies carried out by
AEMO to investigate the impact of transmission network line outages, and disconnection of a number of
wind turbines due to high wind speed, provided that all wind farms were able to ride through a sufficient
number of voltage disturbances in quick succession.
These studies built on static analyses including load flow and PV/QV studies (in Section M.1.1)
presented in the third preliminary report.
They further investigated the stability and operability of the SA power system through power system
dynamic studies carried out in PSS/E and PSCAD simulation tools.
M.1 Scenario 1: If wind farms did not reduce output due to the multiple voltage disturbances
M.1.1 Static analysis
Network operability with loss of three/four lines
Figure 78 Network capability with loss of three lines assuming no sustained power reduction by
wind farms

BLACK SYSTEM SOUTH AUSTRALIA 28 SEPTEMBER 2016 – FINAL REPORT
© AEMO 2017 157
Figure 79 Network capability with loss of four lines assuming no sustained power reduction by wind
farms
PV/QV analyses
This section presents results obtained from steady-state PV and QV analyses which determine SA
power system transfer capability in the event of loss of four transmission lines, assuming that no
sustained power reduction of wind farms would have occurred.
Specifically, these studies are used to:
Determine the maximum transfer of power between two substations before the voltage
collapse point.
Confirm reactive power margin available in a given location, so as to maintain all system voltages
within the continuous uninterrupted operating range.
The objective of the PV and QV analyses is to determine the ability of a power system to maintain
voltage stability at all locations in the system under normal and contingency operating conditions.
The PV and QV curves are obtained through a series of load flow solutions. The PV curve is a
representation of voltage change as a result of increased power transfer between two systems, and the
QV curve is a representation of reactive power demand by a bus or buses as voltage level changes.
As power transfer is increased, voltage decreases at some buses on or near the transfer path. Transfer
can continue to increase until the solution identifies a condition of voltage collapse, or when the
numerical solutions of the load flow equations cannot be solved.

BLACK SYSTEM SOUTH AUSTRALIA 28 SEPTEMBER 2016 – FINAL REPORT
© AEMO 2017 158
Heywood Interconnector
Figure 80 South East voltages versus Heywood transfers
Figure 81 QV plots at South East with varying Heywood transfers (no contingency)

BLACK SYSTEM SOUTH AUSTRALIA 28 SEPTEMBER 2016 – FINAL REPORT
© AEMO 2017 159
Figure 82 QV plots at South East with varying Heywood transfers (loss of four lines at Davenport)
Davenport
Figure 83 Davenport voltages versus Davenport demand
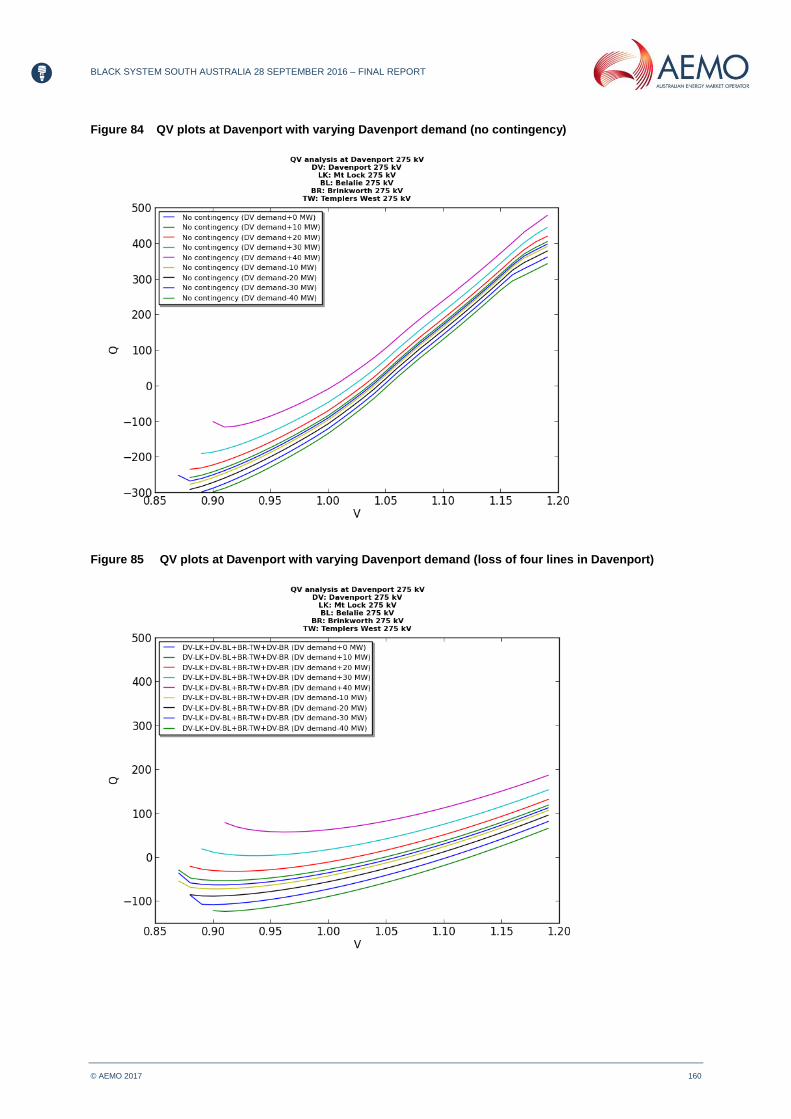
BLACK SYSTEM SOUTH AUSTRALIA 28 SEPTEMBER 2016 – FINAL REPORT
© AEMO 2017 160
Figure 84 QV plots at Davenport with varying Davenport demand (no contingency)
Figure 85 QV plots at Davenport with varying Davenport demand (loss of four lines in Davenport)

BLACK SYSTEM SOUTH AUSTRALIA 28 SEPTEMBER 2016 – FINAL REPORT
© AEMO 2017 161
Robertstown
Figure 86 Para voltages versus Robertstown transfers
Figure 87 QV plots at Para with varying Robertstown transfers (no loss of line)

BLACK SYSTEM SOUTH AUSTRALIA 28 SEPTEMBER 2016 – FINAL REPORT
© AEMO 2017 162
Figure 88 QV plots at Para with varying Robertstown transfers (loss of four lines at Davenport)
M.1.2 Dynamic analysis
Dynamic simulation studies were carried out using both PSS/E and PSCAD simulation tools, replicating
the exact operating conditions and sequence of event leading to the Black System. This included:
Disconnection of three/four transmission lines before/after the system separation.
Dispatching all on-line wind farms and synchronous generators with the same active and reactive
power levels.
For wind farms with dual mode of operation (voltage control vs power factor control), the exact
operating mode immediately before the event was obtained from ElectraNet and correctly
implemented in the models.
Simulation studies were conducted with loss of three/four transmission lines and sustained power
reduction by the Group C wind farm. This is because the Group C wind farm implements the zero power
mode of operation in response to a single credible fault. The mechanism for sustained generation
reduction for this wind farm, therefore, differs from those of the Group A and B wind farms.
In summary, both PSS/E and PSCAD simulation studies carried out by AEMO indicate that the SA
power system would have remained stable and interconnected if the Group A and B wind farms had
ridden through all the six voltage disturbances.
Figure 89 to Figure 100 show the dynamic simulation results obtained from the PSS/E and PSCAD
studies, specifically:
Figure 89 and Figure 95 indicate a stable response of the Heywood Interconnector, as evident
from the simulated responses of active and reactive power.
Figure 90 and Figure 96 show that the impedance trajectory seen by the Heywood loss of
synchronism relay would have been far from the loss of synchronism relay characteristic area,
indicating that system separation would not have occurred. This is further corroborated by:
Figure 92 and Figure 98, which highlight system voltage phase angles are maintained well
below 90 degrees (around which loss of synchronism typically occurs).

BLACK SYSTEM SOUTH AUSTRALIA 28 SEPTEMBER 2016 – FINAL REPORT
© AEMO 2017 163
Figure 91 and Figure 97, which show healthy system voltage magnitudes that recover to
pre-disturbance values shortly after the clearance of each fault.
System frequencies would be maintained above 49.5 Hz indicating that no under frequency load
shedding would occur.
PSS/E simulation studies
Figure 89 Active and reactive power transfer at Heywood Interconnector
Figure 90 Impedance trajectory at Heywood Interconnector

BLACK SYSTEM SOUTH AUSTRALIA 28 SEPTEMBER 2016 – FINAL REPORT
© AEMO 2017 164
Figure 91 Voltage magnitudes at key SA 275 kV substations
Figure 92 Voltage phase angles relative to HYTS at key SA 275 kV substations
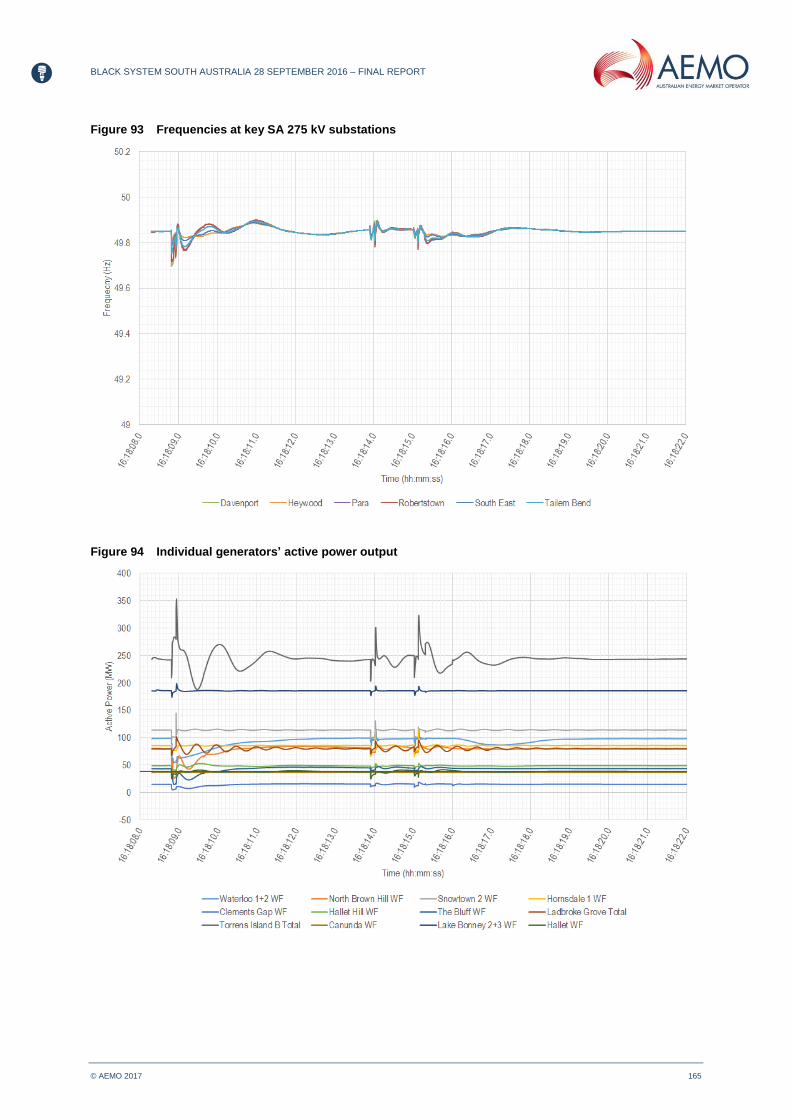
BLACK SYSTEM SOUTH AUSTRALIA 28 SEPTEMBER 2016 – FINAL REPORT
© AEMO 2017 165
Figure 93 Frequencies at key SA 275 kV substations
Figure 94 Individual generators’ active power output
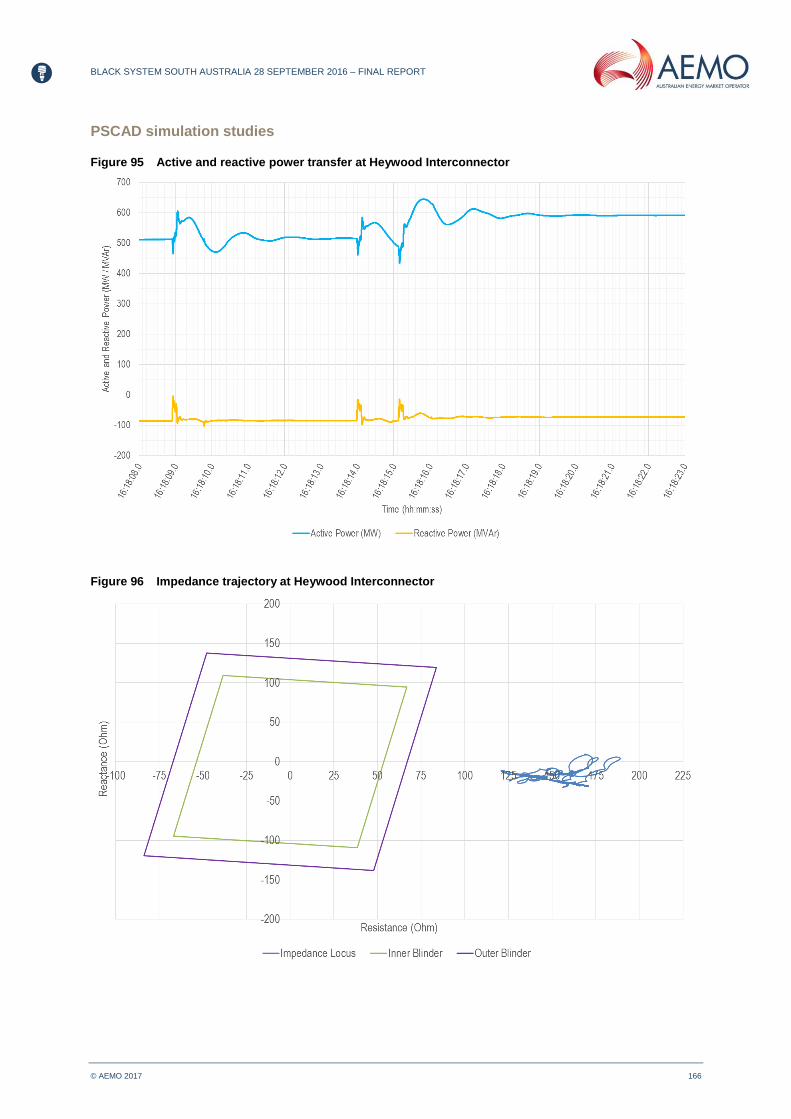
BLACK SYSTEM SOUTH AUSTRALIA 28 SEPTEMBER 2016 – FINAL REPORT
© AEMO 2017 166
PSCAD simulation studies
Figure 95 Active and reactive power transfer at Heywood Interconnector
Figure 96 Impedance trajectory at Heywood Interconnector
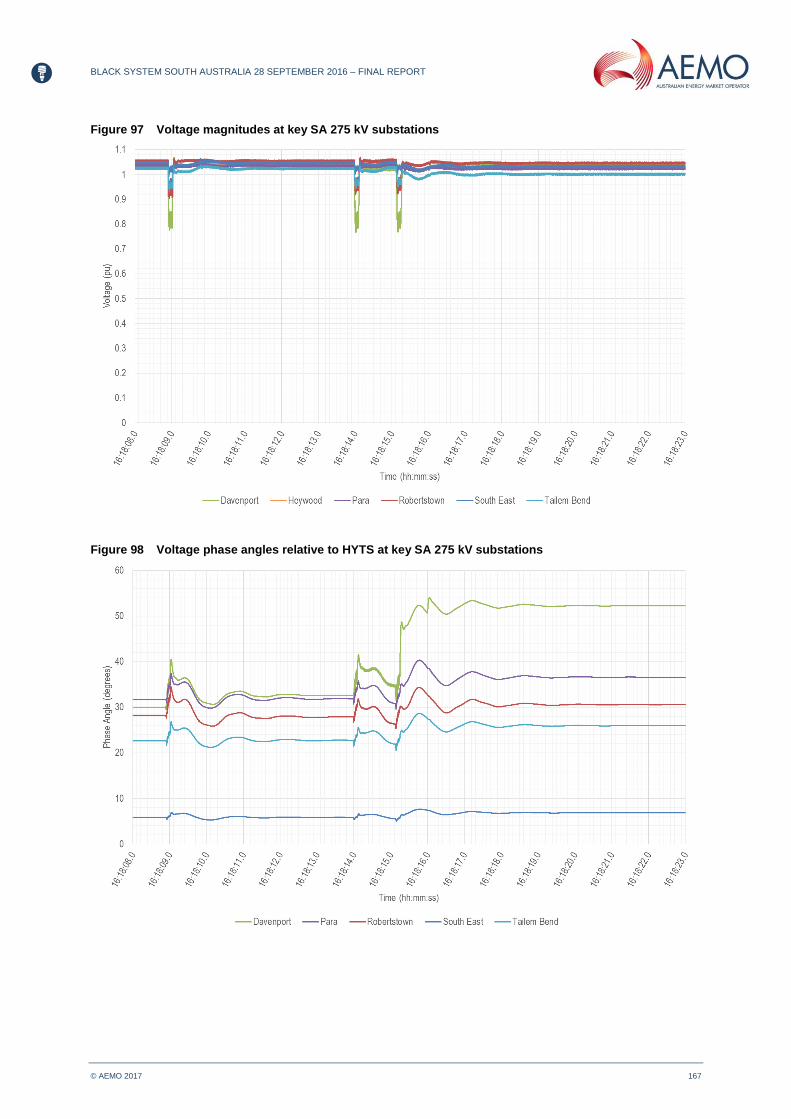
BLACK SYSTEM SOUTH AUSTRALIA 28 SEPTEMBER 2016 – FINAL REPORT
© AEMO 2017 167
Figure 97 Voltage magnitudes at key SA 275 kV substations
Figure 98 Voltage phase angles relative to HYTS at key SA 275 kV substations

BLACK SYSTEM SOUTH AUSTRALIA 28 SEPTEMBER 2016 – FINAL REPORT
© AEMO 2017 168
Figure 99 Frequencies at key SA 275 kV substations
Figure 100 Individual generators’ active power output
M.2 Scenario 2: Scenario 1, with an additional loss of wind generation due to high wind speeds
The scenario investigated in this section is an extension of Scenario 1. In Scenario 2, it has been
assumed that all wind farms successfully rode through all six voltage disturbances, and 200 MW of wind

BLACK SYSTEM SOUTH AUSTRALIA 28 SEPTEMBER 2016 – FINAL REPORT
© AEMO 2017 169
generation was disconnected after the loss of the fourth transmission line due to high wind speed
conditions.
The 200 MW figure was chosen as a pessimistic estimate of the amount of wind generation that could
have been disconnected in the several minutes after system separation, and assuming that the three
on-line TIPS B units or Murraylink HVDC link would not increase their active power contribution in
subsequent dispatch intervals.
The resultant loss of wind generation due to high wind speed would therefore be completely reflected
onto the Heywood Interconnector, leading the Interconnector import to stabilise at around 800 MW with
healthy voltage magnitudes and phase angles throughout the SA power system. The loss of
synchronism relay would have correctly remained unresponsive to this stable power swing.
In summary, both PSS/E and PSCAD simulation studies carried out by AEMO consistently demonstrate
that the SA power system would have remained stable and interconnected with loss of i) four
transmission lines, ii) 200 MW of wind generation due to high wind speed, and iii) zero power mode of
Mt Millar Wind Farm.
PSS/E simulation studies
Figure 101 Active and reactive power transfer at Heywood Interconnector

BLACK SYSTEM SOUTH AUSTRALIA 28 SEPTEMBER 2016 – FINAL REPORT
© AEMO 2017 170
Figure 102 Impedance trajectory at Heywood Interconnector
Figure 103 Voltage magnitudes at key SA 275 kV substations

BLACK SYSTEM SOUTH AUSTRALIA 28 SEPTEMBER 2016 – FINAL REPORT
© AEMO 2017 171
Figure 104 Voltage phase angles relative to HYTS at key SA 275 kV substations
Figure 105 Frequencies at key SA 275 kV substations

BLACK SYSTEM SOUTH AUSTRALIA 28 SEPTEMBER 2016 – FINAL REPORT
© AEMO 2017 172
PSCAD simulation studies
Figure 106 Active and reactive power transfer at Heywood Interconnector
Figure 107 Impedance trajectory at Heywood Interconnector

BLACK SYSTEM SOUTH AUSTRALIA 28 SEPTEMBER 2016 – FINAL REPORT
© AEMO 2017 173
Figure 108 Voltage magnitudes at key SA 275 kV substations
Figure 109 Voltage phase angles relative to HYTS at key SA 275 kV substations

BLACK SYSTEM SOUTH AUSTRALIA 28 SEPTEMBER 2016 – FINAL REPORT
© AEMO 2017 174
Figure 110 Frequencies at key SA 275 kV substations
Figure 111 Individual generators’ active power output
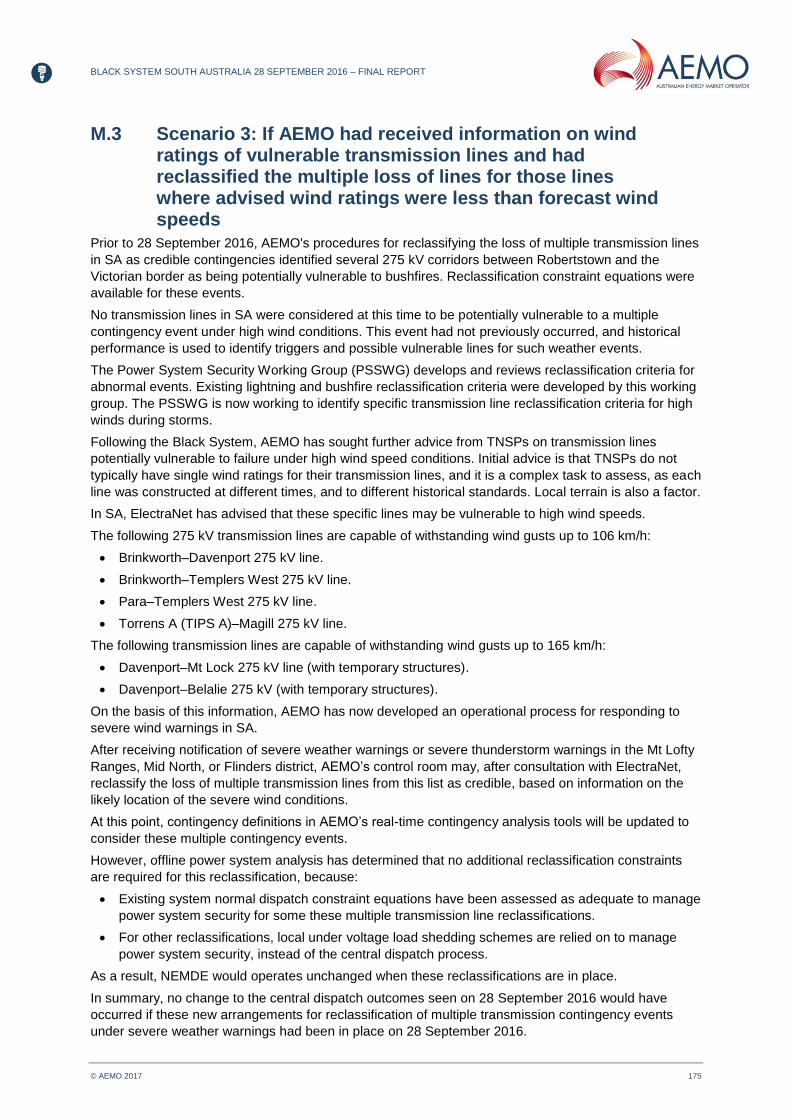
BLACK SYSTEM SOUTH AUSTRALIA 28 SEPTEMBER 2016 – FINAL REPORT
© AEMO 2017 175
M.3 Scenario 3: If AEMO had received information on wind ratings of vulnerable transmission lines and had reclassified the multiple loss of lines for those lines where advised wind ratings were less than forecast wind speeds
Prior to 28 September 2016, AEMO's procedures for reclassifying the loss of multiple transmission lines
in SA as credible contingencies identified several 275 kV corridors between Robertstown and the
Victorian border as being potentially vulnerable to bushfires. Reclassification constraint equations were
available for these events.
No transmission lines in SA were considered at this time to be potentially vulnerable to a multiple
contingency event under high wind conditions. This event had not previously occurred, and historical
performance is used to identify triggers and possible vulnerable lines for such weather events.
The Power System Security Working Group (PSSWG) develops and reviews reclassification criteria for
abnormal events. Existing lightning and bushfire reclassification criteria were developed by this working
group. The PSSWG is now working to identify specific transmission line reclassification criteria for high
winds during storms.
Following the Black System, AEMO has sought further advice from TNSPs on transmission lines
potentially vulnerable to failure under high wind speed conditions. Initial advice is that TNSPs do not
typically have single wind ratings for their transmission lines, and it is a complex task to assess, as each
line was constructed at different times, and to different historical standards. Local terrain is also a factor.
In SA, ElectraNet has advised that these specific lines may be vulnerable to high wind speeds.
The following 275 kV transmission lines are capable of withstanding wind gusts up to 106 km/h:
Brinkworth–Davenport 275 kV line.
Brinkworth–Templers West 275 kV line.
Para–Templers West 275 kV line.
Torrens A (TIPS A)–Magill 275 kV line.
The following transmission lines are capable of withstanding wind gusts up to 165 km/h:
Davenport–Mt Lock 275 kV line (with temporary structures).
Davenport–Belalie 275 kV (with temporary structures).
On the basis of this information, AEMO has now developed an operational process for responding to
severe wind warnings in SA.
After receiving notification of severe weather warnings or severe thunderstorm warnings in the Mt Lofty
Ranges, Mid North, or Flinders district, AEMO’s control room may, after consultation with ElectraNet,
reclassify the loss of multiple transmission lines from this list as credible, based on information on the
likely location of the severe wind conditions.
At this point, contingency definitions in AEMO’s real-time contingency analysis tools will be updated to
consider these multiple contingency events.
However, offline power system analysis has determined that no additional reclassification constraints
are required for this reclassification, because:
Existing system normal dispatch constraint equations have been assessed as adequate to manage
power system security for some these multiple transmission line reclassifications.
For other reclassifications, local under voltage load shedding schemes are relied on to manage
power system security, instead of the central dispatch process.
As a result, NEMDE would operates unchanged when these reclassifications are in place.
In summary, no change to the central dispatch outcomes seen on 28 September 2016 would have
occurred if these new arrangements for reclassification of multiple transmission contingency events
under severe weather warnings had been in place on 28 September 2016.

BLACK SYSTEM SOUTH AUSTRALIA 28 SEPTEMBER 2016 – FINAL REPORT
© AEMO 2017 176
APPENDIX N. WEIGHTED SHORT CIRCUIT RATIO
Conventional calculation methods for determining SCR gives rise to misleading results for wind farms
that are part of an electrically close cluster. This is because adjacent wind farms must be thought of one
large installation. Each wind farm will therefore only get a portion of the overall available fault current,
not the entire fault current to itself.
Three alternative methods were developed for calculating the SCR for multiple concentrated wind
farms. These will be presented in the upcoming CIGRE Technical brochure on Connection of Wind
Farms to Weak AC Networks.
Another appropriate index for the calculation of impact of adjacent wind farms is the WSCR, defined by:
2N
i
RMWi
N
i
RMWiSCMVAi
N
i
RMWi
N
i
RMWi
N
i
RMWiSCMVAi
N
i
RMWi
SCMVA
)P(
P*S
P
P)/P*S(
P
SWeightedWSCR
where SSCMVAi is the short circuit capacity at bus i before the connection of Wind farm i and PRMWi is the
MW rating of WPP i to be connected. N is the number of Wind farm fully interacting with each other and
i is the Wind farm index.
The proposed WSCR calculation method is based on the assumption of full interactions between wind
farms. This is equivalent to assuming that all wind farms are connected to a virtual connection point. For
a real power system, there is usually some electrical distance between each wind farm’s connection
point and the wind farms will not fully interact with each other.
Note that conventional WSCR method calculates the equivalent SCR at a virtual connection point.
However, wind turbine manufacturers specify the minimum permissible SCR at the 33 kV side of the
wind turbine transformers. To allow for a like-for like comparison, the WSCR calculated at the virtual
connection point is reflected back into the 33 kV wind turbine terminals.

BLACK SYSTEM SOUTH AUSTRALIA 28 SEPTEMBER 2016 – FINAL REPORT
© AEMO 2017 177
APPENDIX O. ROLES AND RESPONSIBILITIES
Restoration of supply would be required following a ‘major supply disruption’, or ‘black system’, as those
terms are defined in the NER. By definition, a black system can occur following a major
supply disruption.
Restoration relies on co-operation between four groups whose roles are discussed briefly below.
Section O.5 addresses system restart training.
O.1 AEMO
AEMO is responsible for the co-ordination of restoration. This includes:
Being restoration ready, including:
Having a ‘system restart plan’ in place at all times, as required by clause 4.8.12 of the NER.
While AEMO has a system restart plan for each region, AEMO adapts it as a basis for use in
the circumstances of the major supply disruption.
Developing communication protocols with NSPs to apply during a restoration in accordance
with clause 4.8.12 of the NER.
Having secured SRAS by entering into contracts for the supply of SRAS in accordance with
clause 3.11.9 of the NER.
During a major supply disruption, this includes:
Securing the power system.
Advising the market of the existence of a major supply disruption, or black system.
Determining, in conjunction with the relevant TNSPs, the cause of the major supply disruption
or black system.
Ascertaining, in conjunction with the relevant TNSPs, the status of the power system.
Developing a restoration strategy in conjunction with the relevant TNSPs.
Requiring the provision of SRAS.
Managing the restoration process.
Advising the market of the progress of the restoration.
At the conclusion of the restoration:
Advising the market that the system has returned to normal operation.
O.2 TNSPs
TNSPs are key players during any restoration. Their role includes:
Being restoration ready, including:
Providing AEMO with their ‘Local Black System Procedures’, as required by clause 4.8.12 of
the NER.
Assisting AEMO in the development of the communication protocols required by clause 4.8.12
of the NER.
Assist AEMO in determining the capability of any proposed SRAS in accordance with clause
3.11.9(i) of the NER.
During a major supply disruption, this includes:
Determining the cause of the major supply disruption in conjunction with AEMO.
Determining the status of the transmission network and advising AEMO.
Assisting in the development of a restoration strategy with AEMO.

BLACK SYSTEM SOUTH AUSTRALIA 28 SEPTEMBER 2016 – FINAL REPORT
© AEMO 2017 178
Switching circuits on the transmission network in accordance with AEMO’s restoration strategy,
including converting AEMO’s broad instructions into detailed switching sequences.
Liaising with AEMO on restoration of the transmission network.
Liaising with AEMO and DNSPs on load restoration.
Managing voltage levels in conjunction with AEMO.
Keeping AEMO advised of progress of the restoration, and supplying any other information
AEMO requests.
O.3 DNSPs
DNSPs are key players during any restoration. Their role includes:
Being restoration ready, including:
Providing AEMO with their ‘Local Black System Procedures’, as required by clause 4.8.12 of
the NER.
Assisting AEMO in the development of the communication protocols required by clause 4.8.12
of the NER.
During a major supply disruption, this includes:
Responding to instructions to restore load from their local TNSP.
Perform switching on their distribution system in preparation for load restoration.
Liaising with TNSPs on load restoration.
Managing loads and load restoration.
O.4 Generators
Generators are key players during any restoration. Their role includes:
Being restoration ready, including:
Providing AEMO with their ‘Local Black System Procedures’, as required by clause 4.8.12 of
the NER.
Assisting AEMO in the development of the communication protocols required by clause 4.8.12
of the NER.
Some will enter into contracts for the supply of SRAS in accordance with clause 3.11.9 of
the NER.
During a major supply disruption, this includes:
Providing SRAS if they have a contract for the supply of SRAS upon AEMO’s instructions.
Stabilising their on-line plant on-line and supplying electricity.
Stabilising any plant that has tripped to house load.
Advising AEMO of:
○ Any urgent requirement for load to stabilise on-line plant.
○ Status of plant and ability to supply electricity.
○ Any requirement for a start-up supply.
O.5 Staff competency
Although black system conditions are rare events, it is essential that all staff likely to be involved in a
system restart are suitably trained.
Every six months, AEMO Control Room staff are required to attend System Restart training sessions on
the Dispatch Training Simulator.

BLACK SYSTEM SOUTH AUSTRALIA 28 SEPTEMBER 2016 – FINAL REPORT
© AEMO 2017 179
AEMO also invites NEM Participants to attend the training sessions, with regular participation by staff
from TNSP, DNSP, and power station control rooms, trading room staff, and Government agencies.
The objective of the training is to review the latest System Restart plans and provide an overview of the
operational issues and market processes involved in a system restart.
As part of each training session, an exercise is conducted using the Simulator to restore a NEM region
after a black system. During this exercise, the trainees are required to:
Devise and implement an agreed restoration plan.
Manage load restoration, taking into consideration load block size and high priority/sensitive loads.
Activate SRAS contracts as required.
Prioritise tasks and actions.
Determine the cause of the contingency and assess the status of the power system in conjunction
with the relevant TNSPs.
Advise participants and crisis management teams of restoration progress at regular intervals.
Determine if an exit of the Black System declaration can occur.
Determine if resumption of the spot market can occur.
In 2016, AEMO conducted System Restart training sessions covering the Queensland and SA regions.

BLACK SYSTEM SOUTH AUSTRALIA 28 SEPTEMBER 2016 – FINAL REPORT
© AEMO 2017 180
APPENDIX P. SYSTEM RESTART ANCILLARY
SERVICES
SRAS is a contracted service to restart a power system following a black system event. SRAS is
provided by a generating unit, or combination of generating units, that can be started without requiring
electricity from the power system.132F
133
P.1 SRAS contracts in SA
AEMO is required to procure SRAS consistent with the system restart standard (SRS).
AEMO has contracts with two SRAS providers in SA.
Prior to establishing these contracts, AEMO modelled restoration scenarios to confirm that the SRAS
procured would be capable of meeting the SRS.
P.2 Routine tests
Part of AEMO’s due diligence when procuring SRAS is to require the SRAS providers to demonstrate
their restart capability in a test prior to entering into an SRAS contract, and then to demonstrate that
capability throughout the term of the contract by testing at least annually.
Both of the SRAS procured for SA had been successfully tested less than six months prior to the
Black System.
AEMO witnessed Origin successfully perform a restart test on 21 May 2016. Origin demonstrated
that it could use a small generating unit to restart a larger generating unit within the same power
station without using any power supply from the network. During this test, a section of the
ElectraNet network was de-energised and isolated to provide a restart path from the small unit to
the larger unit. It was then re-energised by QPS. All CBs operated as expected during this test.
AEMO witnessed ENGIE successfully perform a restart test on 19 April 2016. ENGIE
demonstrated that it could restart its main generating unit without using any electricity supply from
the network. This test included the energising of a 50 km 132 kV transmission line.
133 Further information on SRAS is available on AEMO’s website at: http://www.aemo.com.au/Electricity/National-Electricity-Market-NEM/Security-
and-reliability/Ancillary-services/System-restart-ancillary-services-guidelines.

BLACK SYSTEM SOUTH AUSTRALIA 28 SEPTEMBER 2016 – FINAL REPORT
© AEMO 2017 181
APPENDIX Q. OVERVIEW OF THE RESTORATION
PROCESS
Identify state of the power system
Secure any islanded sections and
devise restoration plan
Provide auxiliary
supply to power
stations
Prepare for
restoration of
generation
Prepare
transmission
network
Provide auxiliary
supply to
substations
Restore
generation
capacity
Restore
frequency and
voltage in each
island
Restore basic
transmission
system
Synchronise
islands
Restore loads
where
necessary or
possible
Restore
remaining load
as generation is
available
Restore
remaining
transmission
Q.1 Secure and make safe the power system
The initial task after a major system disturbance is to identify the state of the power system and to
determine the extent of the disturbance. AEMO, in conjunction with the TNSPs and Generators,
will determine:
Which areas of the power system are blacked out.
Which areas of the power system have islanded around.
Any requirements for stabilising the island.
Where are the separation points in the system and equipment that is not available.
After a major system disturbance, electrical islands can be formed. When the island(s) conditions have
been assessed, then actions can be taken to stabilise their operation. This may require additional load
shedding or load reconnection to ensure adequate frequency and voltage control within the
surviving island.
BLACK SYSTEM SOUTH AUSTRALIA 28 SEPTEMBER 2016 – FINAL REPORT
© AEMO 2017 182
Once any islanded generation has been stabilised, AEMO, in conjunction with the TNSPs, will
determine an appropriate process to restore the power system. The plans may be in accordance with
the Regional Restart Procedure, or the plans may require modification to take into account the state of
power system.
Q.2 Prepare the system for load restoration The initial stage of load restoration will be to energise power station auxiliaries, by using either SRAS or
any on-line generation. 133F
134 Such an arrangement requires express transmission corridors to be
established between the start-up generation sources and auxiliaries of receiving power stations.
NSPs will need to first disconnect all circuits and then re-energise transmission network with adequate
stable load necessary for effective voltage and frequency control, to establish the corridor. The priority
is therefore not to reconnect consumer load, but to build sufficient network such that, when offline
generating units becomes available, loads can be restored efficiently.
Q.3 Load restoration
Once transmission corridors have been established with auxiliary supply restored to all accessible
power stations, the restoration of the remaining network and loads will depend on the availability of
generation and the ability of the NSPs to restore the network. A major factor here will be staff
availability, accessibility, and workload.
It is essential that, as generation capacity is made available, suitable transmission elements should be
in place.
134 Including generation in other regions via interconnectors.
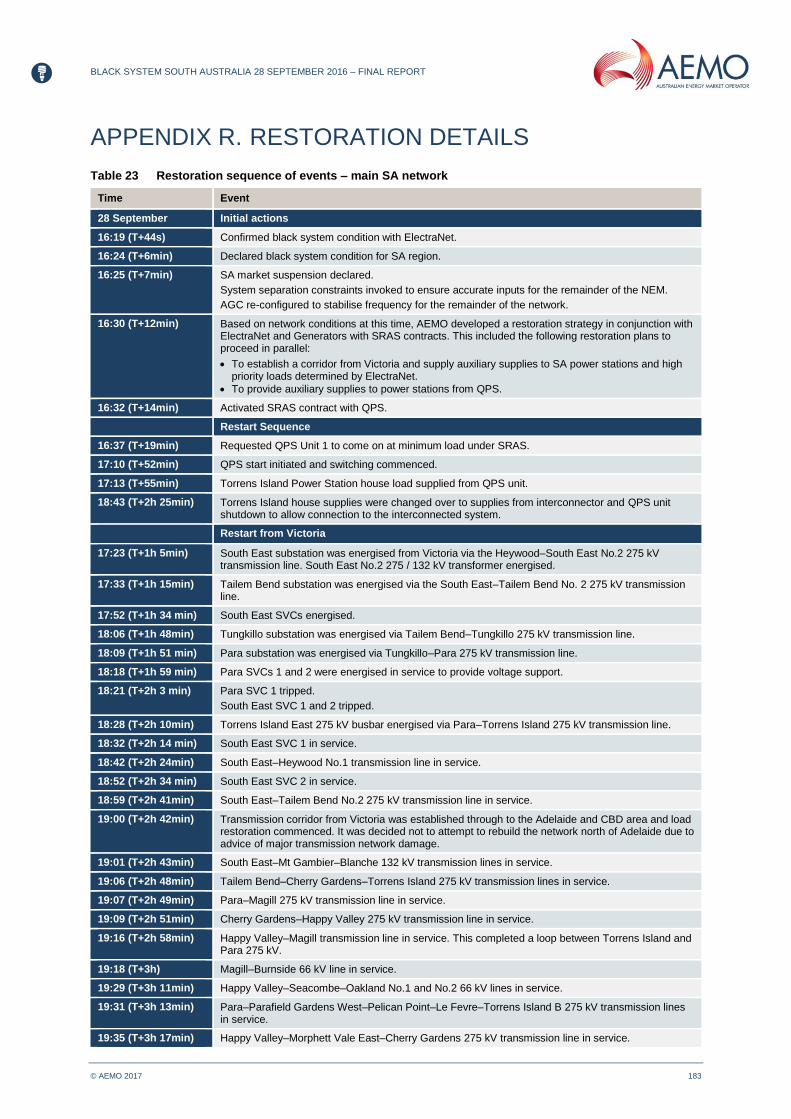
BLACK SYSTEM SOUTH AUSTRALIA 28 SEPTEMBER 2016 – FINAL REPORT
© AEMO 2017 183
APPENDIX R. RESTORATION DETAILS
Table 23 Restoration sequence of events – main SA network
Time Event
28 September Initial actions
16:19 (T+44s) Confirmed black system condition with ElectraNet.
16:24 (T+6min) Declared black system condition for SA region.
16:25 (T+7min) SA market suspension declared.
System separation constraints invoked to ensure accurate inputs for the remainder of the NEM.
AGC re-configured to stabilise frequency for the remainder of the network.
16:30 (T+12min) Based on network conditions at this time, AEMO developed a restoration strategy in conjunction with ElectraNet and Generators with SRAS contracts. This included the following restoration plans to proceed in parallel:
To establish a corridor from Victoria and supply auxiliary supplies to SA power stations and high priority loads determined by ElectraNet.
To provide auxiliary supplies to power stations from QPS.
16:32 (T+14min) Activated SRAS contract with QPS.
Restart Sequence
16:37 (T+19min) Requested QPS Unit 1 to come on at minimum load under SRAS.
17:10 (T+52min) QPS start initiated and switching commenced.
17:13 (T+55min) Torrens Island Power Station house load supplied from QPS unit.
18:43 (T+2h 25min) Torrens Island house supplies were changed over to supplies from interconnector and QPS unit shutdown to allow connection to the interconnected system.
Restart from Victoria
17:23 (T+1h 5min) South East substation was energised from Victoria via the Heywood–South East No.2 275 kV transmission line. South East No.2 275 / 132 kV transformer energised.
17:33 (T+1h 15min) Tailem Bend substation was energised via the South East–Tailem Bend No. 2 275 kV transmission line.
17:52 (T+1h 34 min) South East SVCs energised.
18:06 (T+1h 48min) Tungkillo substation was energised via Tailem Bend–Tungkillo 275 kV transmission line.
18:09 (T+1h 51 min) Para substation was energised via Tungkillo–Para 275 kV transmission line.
18:18 (T+1h 59 min) Para SVCs 1 and 2 were energised in service to provide voltage support.
18:21 (T+2h 3 min) Para SVC 1 tripped.
South East SVC 1 and 2 tripped.
18:28 (T+2h 10min) Torrens Island East 275 kV busbar energised via Para–Torrens Island 275 kV transmission line.
18:32 (T+2h 14 min) South East SVC 1 in service.
18:42 (T+2h 24min) South East–Heywood No.1 transmission line in service.
18:52 (T+2h 34 min) South East SVC 2 in service.
18:59 (T+2h 41min) South East–Tailem Bend No.2 275 kV transmission line in service.
19:00 (T+2h 42min) Transmission corridor from Victoria was established through to the Adelaide and CBD area and load restoration commenced. It was decided not to attempt to rebuild the network north of Adelaide due to advice of major transmission network damage.
19:01 (T+2h 43min) South East–Mt Gambier–Blanche 132 kV transmission lines in service.
19:06 (T+2h 48min) Tailem Bend–Cherry Gardens–Torrens Island 275 kV transmission lines in service.
19:07 (T+2h 49min) Para–Magill 275 kV transmission line in service.
19:09 (T+2h 51min) Cherry Gardens–Happy Valley 275 kV transmission line in service.
19:16 (T+2h 58min) Happy Valley–Magill transmission line in service. This completed a loop between Torrens Island and Para 275 kV.
19:18 (T+3h) Magill–Burnside 66 kV line in service.
19:29 (T+3h 11min) Happy Valley–Seacombe–Oakland No.1 and No.2 66 kV lines in service.
19:31 (T+3h 13min) Para–Parafield Gardens West–Pelican Point–Le Fevre–Torrens Island B 275 kV transmission lines in service.
19:35 (T+3h 17min) Happy Valley–Morphett Vale East–Cherry Gardens 275 kV transmission line in service.

BLACK SYSTEM SOUTH AUSTRALIA 28 SEPTEMBER 2016 – FINAL REPORT
© AEMO 2017 184
Time Event
19:46 (T+3h 28min) Torrens Island A–Northfield 275 kV transmission line in service.
19:48 (T+3h 30min) Torrens Island A–Magill 275 kV transmission line in service.
19:50 (T+3h 32min) Pelican Point gas turbine transformer energised. Auxiliary supply restored to Pelican Point Power Station.
19:54 (T+3h 36min) Tungkillo–Mt Barker–Cherry Gardens 275 kV transmission line in service.
19:55 (T+3h 37min) QPS units 1–4 in service.
20:06 (T+3h 48min) Tailem Bend–Mobilong–Murray Bridge / Hahndorf Pumps No.2 132 kV transmission line in service.
20:43 (T+4h 25min) Magill–East Terrace 275 kV transmission line in service.
20:47 (T+4h 29min) South East–Snuggery 132 kV transmission line in service.
20:58 (T+4h 40min) Torrens Island Power Station A2 generating unit in service.
21:23 (T+5h 5min) Tailem Bend–Keith–Kincraig 132 kV transmission line in service.
21:34 (T+5h 16min) Northfield–Kilburn–Torrens Island A 275 kV transmission line in service.
22:02 (T+5h 44min) Torrens Island Power Station A4 generating unit in service.
22:05 (T+5h 47min) Pelican Point Power Station gas turbine generating unit 1 in service.
22:08 (T+5h 50min) Snuggery Power Station in service.
23:10 (T+6h 52min) Pelican Point Power Station steam generating unit in service.
23:11 (T+6h 53min) Para–Robertstown 275 kV transmission line in service.
23:31 (T+7h 31min) Torrens Island Power Station B1 generating unit in service.
23:52 (T+7h 34min) Tungkillo–Robertstown 275 kV transmission line in service.
29 September Conclusion of black system condition
02:40 (T+10h 22min) Torrens Island Power Station B3 generating unit in service.
12:15 (T+19h 57min) Davenport–Bungama 275 kV line was re-energised after line patrol. Allowing some electricity to be restored in the northern region.
18:25 (T+1d 2h 7min) AEMO advised that that a black system condition in the SA region was no longer current. AEMO gave clearance to restore the last load block in SA. AEMO notified that the Spot Market would continue to be suspended.
10 October 2016
13:40 (T+11d 21h 22min)
Davenport–Belalie 275 kV line
12 October 2016
19:15 (T+13d 2h 57min)
Davenport–Mt Lock 275 kV line.
18 December 13:18 (T+ 81d)
Davenport–Brinkworth 275 kV line
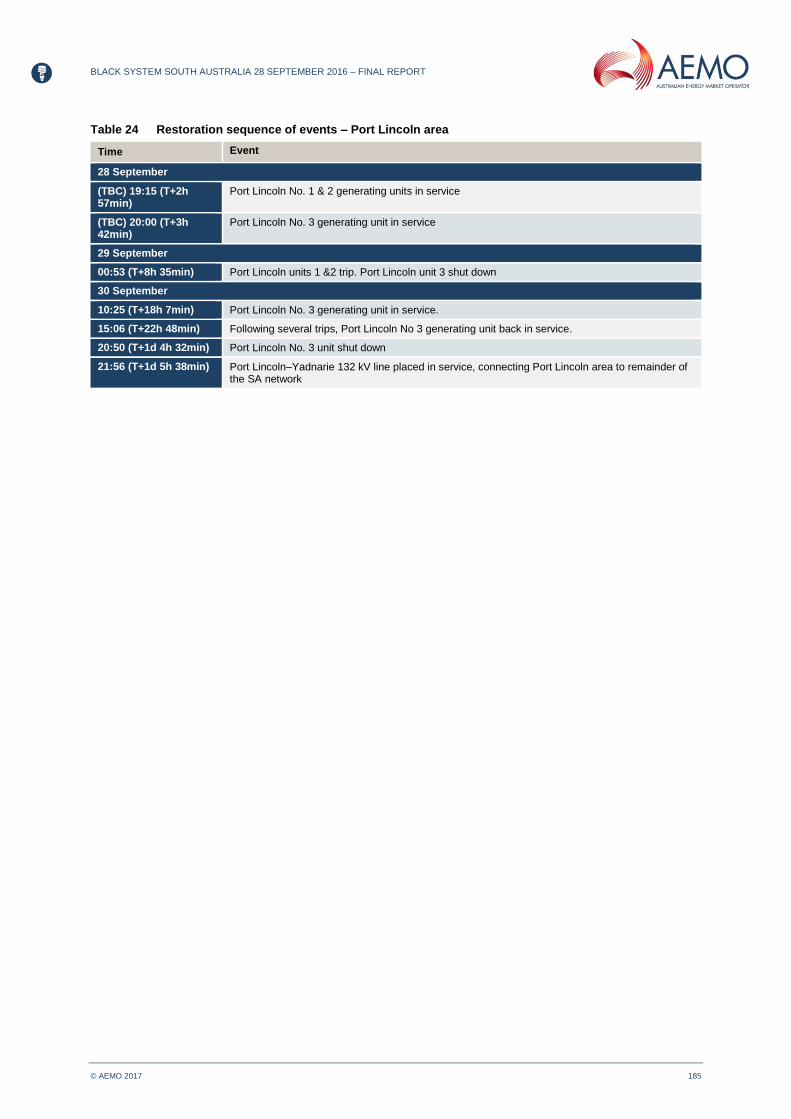
BLACK SYSTEM SOUTH AUSTRALIA 28 SEPTEMBER 2016 – FINAL REPORT
© AEMO 2017 185
Table 24 Restoration sequence of events – Port Lincoln area
Time Event
28 September
(TBC) 19:15 (T+2h 57min)
Port Lincoln No. 1 & 2 generating units in service
(TBC) 20:00 (T+3h 42min)
Port Lincoln No. 3 generating unit in service
29 September
00:53 (T+8h 35min) Port Lincoln units 1 &2 trip. Port Lincoln unit 3 shut down
30 September
10:25 (T+18h 7min) Port Lincoln No. 3 generating unit in service.
15:06 (T+22h 48min) Following several trips, Port Lincoln No 3 generating unit back in service.
20:50 (T+1d 4h 32min) Port Lincoln No. 3 unit shut down
21:56 (T+1d 5h 38min) Port Lincoln–Yadnarie 132 kV line placed in service, connecting Port Lincoln area to remainder of the SA network

BLACK SYSTEM SOUTH AUSTRALIA 28 SEPTEMBER 2016 – FINAL REPORT
© AEMO 2017 186
APPENDIX S. GENERATION RESTORATION
Figure 112 QPS MW output during restoration
Figure 113 TIPS A2 Generating Unit MW output during restoration
Figure 114 TIPS A4 Generating Unit MW output during restoration
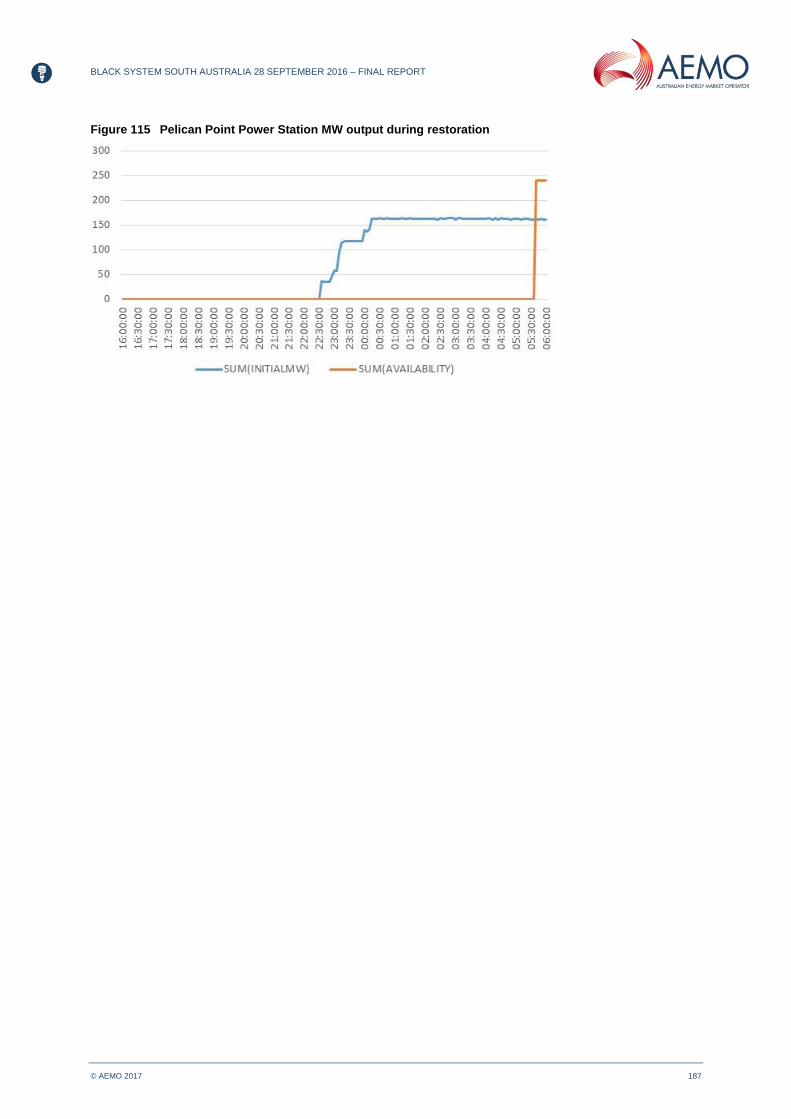
BLACK SYSTEM SOUTH AUSTRALIA 28 SEPTEMBER 2016 – FINAL REPORT
© AEMO 2017 187
Figure 115 Pelican Point Power Station MW output during restoration
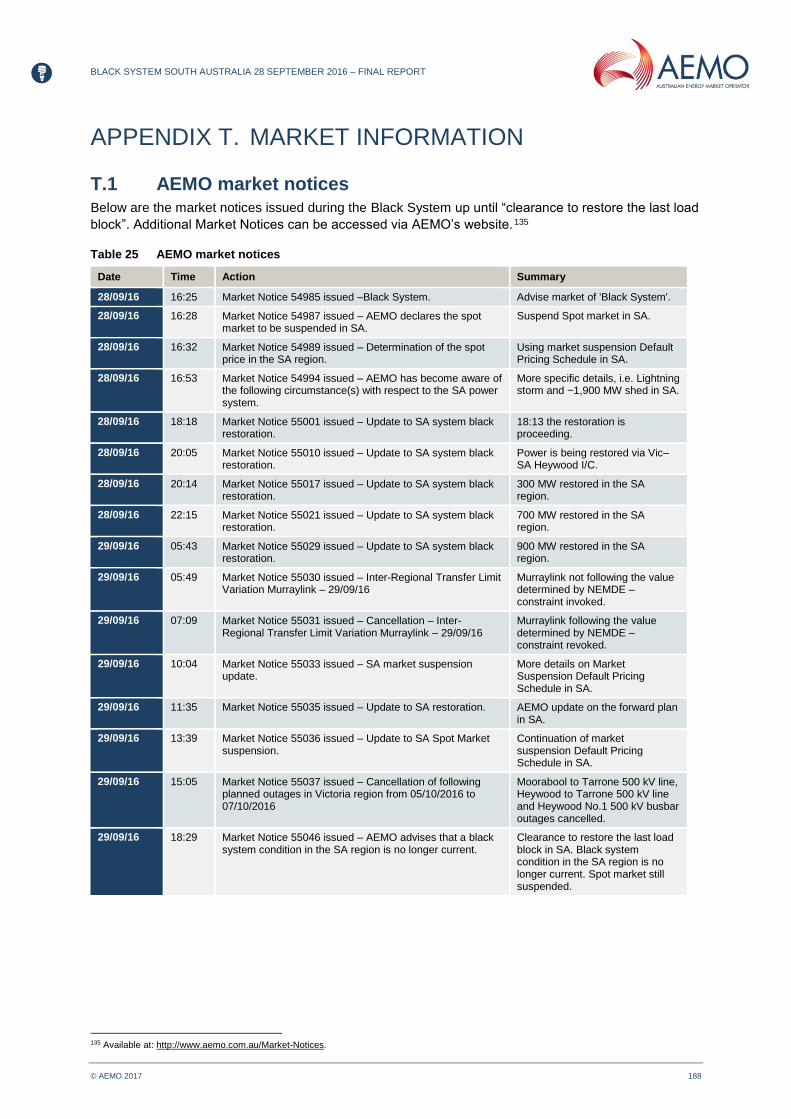
BLACK SYSTEM SOUTH AUSTRALIA 28 SEPTEMBER 2016 – FINAL REPORT
© AEMO 2017 188
APPENDIX T. MARKET INFORMATION
T.1 AEMO market notices Below are the market notices issued during the Black System up until “clearance to restore the last load
block”. Additional Market Notices can be accessed via AEMO’s website. 134 F
135
Table 25 AEMO market notices
Date Time Action Summary
28/09/16 16:25 Market Notice 54985 issued –Black System. Advise market of 'Black System'.
28/09/16 16:28 Market Notice 54987 issued – AEMO declares the spot market to be suspended in SA.
Suspend Spot market in SA.
28/09/16 16:32 Market Notice 54989 issued – Determination of the spot price in the SA region.
Using market suspension Default Pricing Schedule in SA.
28/09/16 16:53 Market Notice 54994 issued – AEMO has become aware of the following circumstance(s) with respect to the SA power system.
More specific details, i.e. Lightning storm and ~1,900 MW shed in SA.
28/09/16 18:18 Market Notice 55001 issued – Update to SA system black restoration.
18:13 the restoration is proceeding.
28/09/16 20:05 Market Notice 55010 issued – Update to SA system black restoration.
Power is being restored via Vic–SA Heywood I/C.
28/09/16 20:14 Market Notice 55017 issued – Update to SA system black restoration.
300 MW restored in the SA region.
28/09/16 22:15 Market Notice 55021 issued – Update to SA system black restoration.
700 MW restored in the SA region.
29/09/16 05:43 Market Notice 55029 issued – Update to SA system black restoration.
900 MW restored in the SA region.
29/09/16 05:49 Market Notice 55030 issued – Inter-Regional Transfer Limit Variation Murraylink – 29/09/16
Murraylink not following the value determined by NEMDE – constraint invoked.
29/09/16 07:09 Market Notice 55031 issued – Cancellation – Inter-Regional Transfer Limit Variation Murraylink – 29/09/16
Murraylink following the value determined by NEMDE – constraint revoked.
29/09/16 10:04 Market Notice 55033 issued – SA market suspension update.
More details on Market Suspension Default Pricing Schedule in SA.
29/09/16 11:35 Market Notice 55035 issued – Update to SA restoration. AEMO update on the forward plan in SA.
29/09/16 13:39 Market Notice 55036 issued – Update to SA Spot Market suspension.
Continuation of market suspension Default Pricing Schedule in SA.
29/09/16 15:05 Market Notice 55037 issued – Cancellation of following planned outages in Victoria region from 05/10/2016 to 07/10/2016
Moorabool to Tarrone 500 kV line, Heywood to Tarrone 500 kV line and Heywood No.1 500 kV busbar outages cancelled.
29/09/16 18:29 Market Notice 55046 issued – AEMO advises that a black system condition in the SA region is no longer current.
Clearance to restore the last load block in SA. Black system condition in the SA region is no longer current. Spot market still suspended.
135 Available at: http://www.aemo.com.au/Market-Notices.

BLACK SYSTEM SOUTH AUSTRALIA 28 SEPTEMBER 2016 – FINAL REPORT
© AEMO 2017 189
T.2 AEMO Media Centre statements
1. “Media Statement – South Australia”, issued 1732 hrs on 28 September 2016. Available at:
http://www.aemo.com.au/Media-Centre/Media-Statement---South-Australia.
2. “Media Statement – South Australia – update as at 22:00 AEST”, issued at 2258 hrs on
28 September 2016. Available at: http://www.aemo.com.au/Media-Centre/Media-Statement---
South-Australia-Update.
3. “Media Statement 3 – South Australia Update 10:30 am”, issued at 1052 hrs on 29 September
2016. Available at: http://www.aemo.com.au/Media-Centre/Media-Statement-3---South-Australia-
Update.
4. “South Australia Electricity Update”, issued at 1424 hrs on 2 October 2016. Available at:
http://www.aemo.com.au/Media-Centre/Media-statement---SA-electricity-update-2-Oct-2016.
5. “Resumption of spot market in South Australia”, issued 2103 hrs on 11 October 2016. Available at:
http://www.aemo.com.au/Media-Centre/Media-statement---South-Australian-suspension-revoked.

BLACK SYSTEM SOUTH AUSTRALIA 28 SEPTEMBER 2016 – FINAL REPORT
© AEMO 2017 190
APPENDIX U. PROGRESS OF LOAD RESTORATION
The diagrams below provide an overview of the load restoration process in the Adelaide
metropolitan area.
The amount of load restored is calculated based on the load on the major 275/66 kV transformers in the
major substations that that feed each of the different areas:
Northern suburbs – Para and Parafield Gardens West.
Southern suburbs – Happy Valley and Morphet Vale East.
Eastern suburbs – Magill, East Terrace and Northfield.
Western suburbs – Le Fevre and Torrens Island.
Figure 116 Two hours after the Black System, no load had been restored

BLACK SYSTEM SOUTH AUSTRALIA 28 SEPTEMBER 2016 – FINAL REPORT
© AEMO 2017 191
Figure 117 Percentage of load restored after 3 hours
Figure 118 Percentage of load restored after 4 hours
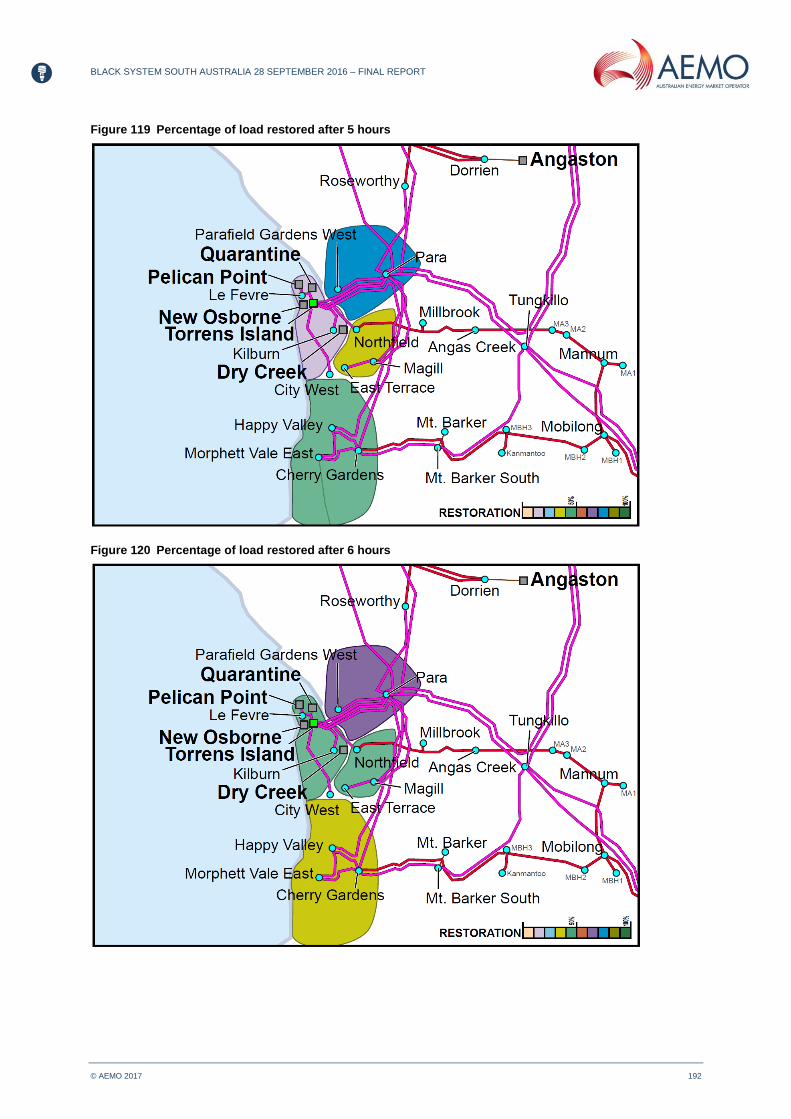
BLACK SYSTEM SOUTH AUSTRALIA 28 SEPTEMBER 2016 – FINAL REPORT
© AEMO 2017 192
Figure 119 Percentage of load restored after 5 hours
Figure 120 Percentage of load restored after 6 hours

BLACK SYSTEM SOUTH AUSTRALIA 28 SEPTEMBER 2016 – FINAL REPORT
© AEMO 2017 193
Figure 121 Percentage of load restored after 7 hours

BLACK SYSTEM SOUTH AUSTRALIA 28 SEPTEMBER 2016 – FINAL REPORT
© AEMO 2017 194
APPENDIX V. ADVICE FROM ELECTRANET
REGARDING DESIGN RATING OF TRANSMISSION
LINES
With regard to the design ratings of the lines involved in the Black System, ElectraNet has advised,
subsequent to this event, the following:
Feeder Capability of towers (original structures)
See Notes 1, 2 & 3
Davenport–Mount Lock / Davenport–Belalie 275 kV (Double circuit) (F1919/F1920)
46m/sec [165 km/h]
Templers West–Brinkworth 275 kV (F1911) 28.6 m/sec [106 km/h]
Brinkworth–Davenport 275 kV (F1910) 28.6 m/sec [106 km/h]
Para–Templers West 275 kV (F1961)* 28.6 m/sec [106 km/h]
Torrens A (TIPS A)–Magill 275 kV (F1912)* 28.6 m/sec [106 km/h]
* This advice has been updated since the publication of the third report.
Notes:
1. The original design specifications for each feeder differ due to changes in design philosophy that
have occurred in Australian over the past 50 years. To simplify rating comparisons of each feeder,
wind models representative of synoptic/downburst/tornado events defined in AS/NZS 7000-2016
“Overhead Line Design – Detailed Procedures” are used.
2. The design ratings are relevant for the tower performance at the specific failure sites. A review of
the duty of the remaining structures within the whole feeder is required to ascertain the rating for
that feeder.
3. The wind speed ratings used for transmission design are derived from a 3-second gust wind speed
over a defined gust width in accordance with AS/NZS Overhead Line Design and AS1170.2 Wind
Loading. This is not the same as an average wind speed across a whole storm front.

BLACK SYSTEM SOUTH AUSTRALIA 28 SEPTEMBER 2016 – FINAL REPORT
© AEMO 2017 195
APPENDIX W. VALIDATION OF POWER SYSTEM
SIMULATION MODELS
This Appendix has been added to this final report.
W.1 Summary This Appendix presents power system modelling and simulation studies assessing the accuracy of the
individual wind farms, synchronous generating units, and SVCs in both PSS/E and PSCAD/ETMDC
simulation tools. Furthermore, the accuracy of the integrated model of the SA power system comprising
all those individual components is evaluated.
The individual plant and overall system models in PSS/E are generally the same as those provided to
all Registered Participants, except that adjustments were made to a few individual plant as highlighted
in the next section. This is to account for aspects of the plant response not adequately represented in
the model, or not represented at all.
To allow a more detailed and accurate assessment of the response of the SA power system under
extreme operating conditions, AEMO developed a PSCAD/EMTDC model of the entire SA power
system. This includes highly detailed models developed by the OEMs of all Group B and Group D wind
farms, and the four SVCs. The PSCAD model used to represent the remainder of the SA power system,
including all installed wind farms, is the intellectual property of AEMO.
PSCAD is the most widely used electromagnetic transient (EMT) type simulation tool, and extensively
used by a number of major power system equipment manufacturers covering equipment such as wind
turbines, solar inverters, HVDC, and FACTS devices. In recent years it has been increasingly used by
equipment manufacturers for designing and tuning wind turbines and solar inverters’ control systems for
connection of wind and solar farms in areas of the NEM with low system strength. The PSCAD permits
a full three-phase representation of transmission, distribution, and generation, and the inclusion of fast
acting control systems in power electronic converters used in wind turbines. Key advantages of the
PSCAD modelling, compared to the PSS/E, are for the following analyses:
Unbalanced faults.
Active and reactive power response of the wind turbines during the fault, and recovery after
the clearance.
System strength during islanding conditions.
System over voltages during islanding conditions.
Assessment of any SPS to ensure formation of a stable island.
The integrated PSCAD model of the SA power system is the largest and most detailed simulation model
of this type developed in Australia to simulate the response of power systems with high penetration of
non-synchronous generation.
Despite superior accuracy, a disadvantage of EMT-type simulation tools is the associated
computational burden, which inherently limits the number of studies that can be practically undertaken
in a reasonable timeframe. For this reason, AEMO has adopted a hybrid approach during this
investigation. PSS/E simulations have been used to carry out broad studies, with notable results
shortlisted for further investigation and validation in PSCAD.
The Black System has provided AEMO with valuable measured High-Speed Monitor (HSM) data to
correlate and validate models against the areas of operation outside of normal limits. This data is rarely
captured, and the models have traditionally been considered highly theoretical in application.

BLACK SYSTEM SOUTH AUSTRALIA 28 SEPTEMBER 2016 – FINAL REPORT
© AEMO 2017 196
W.2 Individual wind farms/synchronous generators/SVCs
W.2.1 Summary
Model validation of individual plant was carried out by segregating each individual model from the rest
of the power system, to eliminate external network influences. This approach is referred to as open-loop
playback model validation, where the measured voltages and frequencies are injected into the
simulation model.
For the PSS/E model validation, the measured positive-sequence root mean square (rms) voltages
were injected in the model, whereas in the PSCAD the individual three-phase voltages were injected.
The measured (HSM) values and simulated voltages, and active and reactive power at their respective
connection points, were then overlaid (see Figures 123 to 130).
The following key conclusions can be made:
Models of synchronous generators and SVCs are generally accurate.
Various degrees of accuracy are observed with the wind farm models. While the more detailed
PSCAD models are generally more accurate than the PSS/E models routinely used for large-scale
power system studies by AEMO and Registered Participants, AEMO has identified two key factors
where actual measured responses differ from the simulations in important ways:
The Mt Millar Wind Farm model behaves fundamentally different to actual measured responses.
Whereas the simulated response recovers almost instantaneously, in practice, the wind farm
takes up to 9 seconds to return to its pre-fault active power level.
Across all wind farm models, measured active power responses dip more than the simulated
responses during the fault and recover slower following fault clearance.
The combination of these two factors indicates wind farm model responses led to optimistic
transient stability limits being calculated for the Heywood Interconnector. This is discussed further
in Appendix X.1. Note that this issue will remain relevant, irrespective of wind farms’ capability to
ride through a sufficient number of faults in quick succession.
Sustained power reduction of Group A and B wind farms is not accounted for in any of the
simulation models submitted to AEMO. This behaviour was, therefore, manually implemented in
the models consistent with the known times of disconnection during the event.
However, it is noted that with Group A wind farms, disconnection of the actual wind turbines
follows a non-linear process, whereby the wind turbines first recover from the fault and disconnect
immediately after recovery. Implementing step reductions in a wind farm’s active power to emulate
an individual wind turbine’s disconnection causes minor errors. This is evident from the difference
between the measured and simulated response of the transient peaks in active power flow across
the Heywood Interconnector following clearance of each fault.
Simulation models are developed to represent the actual equipment’s response, assuming that it
behaves as designed. The model cannot replicate the measured response if the actual plant does
not behave as designed, such as when a wind farm reduces reactive current injection during the
fault, or consumes reactive current during fault conditions. Mismatches between the measured and
simulated responses cannot always be considered a modelling deficiency.
Two prime examples of challenges associated with modelling and simulation of power systems
with high penetration of non-synchronous generation can be observed in the response of Waterloo
Wind Farm, shown in Figure 129. These errors also cannot be attributed to the simulation model.
PSS/E model: PSS/E is a positive-sequence simulation platform, responding to the
positive-sequence component of the voltage, which is approximately the average of the
three-phase voltages. However, wind turbines and dynamic reactive power support devices
respond to per-phase measured quantities, which might be very different to the
positive-sequence component, especially during unbalanced faults.

BLACK SYSTEM SOUTH AUSTRALIA 28 SEPTEMBER 2016 – FINAL REPORT
© AEMO 2017 197
In the Waterloo Wind Farm example (Figure 129), the positive-sequence component of the
voltage is sufficiently above the 0.85 pu voltage threshold below which fault ride-through mode
is activated.
As a result, the PSS/E model does not activate fault ride-through mode for any of the faults
leading up to the Black System – unlike the actual wind turbines.
PSCAD/EMTDC model: For wind turbines and dynamic reactive power support devices, certain
control actions, such as fault ride-through action, are not analogue in nature, but present more
like “switching controllers” with an ‘on/off’ type response, rather than being continuous over
time. There is, therefore, a potential for significant non-linearities at the switching threshold.
For example, in the PSCAD model of the Waterloo Wind Farm (Figure 129), the first fault
results in the aggregate wind turbine voltage dropping marginally below 0.85 pu, whereas in the
second fault, the wind turbine terminal voltage remains marginally above 0.85 pu.
The wind farm model, therefore, correctly replicates the actual response for the first fault, but
(due to small errors in the order of a fraction of a percent) not the second fault.
More accurate representation of the individual wind turbine voltages during fault conditions
necessitates explicit representation of each wind turbine and associated impedances. This
makes it practically impossible to simulate a large-scale power system comprising several
hundreds of wind turbines.
For brevity, representative model overlays are shown. For example, Clements Gap, Hallett, Hallett Hill,
The Bluff, and North Brown Hill all use identical wind turbines and dynamic reactive support plant
(AMSC’s DVAR). Model overlays are only provided for Hallett Hill and North Brown Hill Wind Farms.
W.2.2 Canunda Wind Farm
Figure 122 shows a good match between PSCAD modelling and measured (HSM) values, but a poorer
match between PSS/E modelling and measured values.
Figure 122 PSS/E And PSCAD simulation of voltage, active power, and reactive power at Canunda Wind
Farm’s connection point
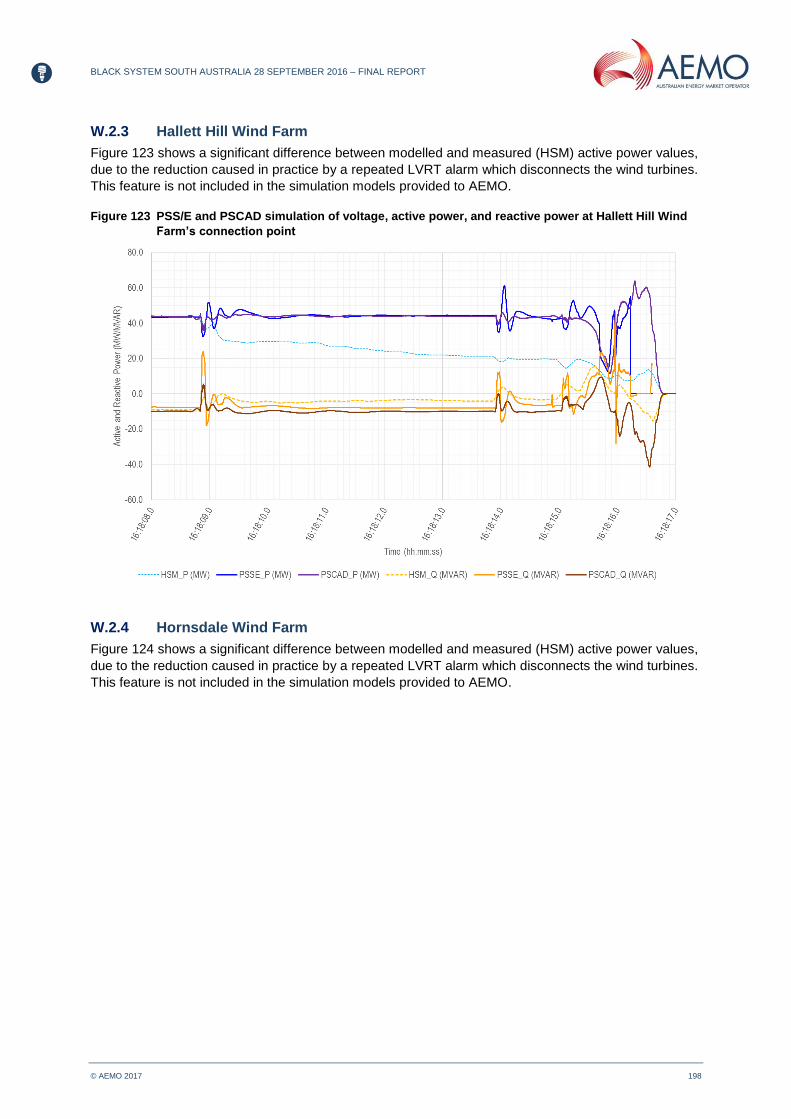
BLACK SYSTEM SOUTH AUSTRALIA 28 SEPTEMBER 2016 – FINAL REPORT
© AEMO 2017 198
W.2.3 Hallett Hill Wind Farm
Figure 123 shows a significant difference between modelled and measured (HSM) active power values,
due to the reduction caused in practice by a repeated LVRT alarm which disconnects the wind turbines.
This feature is not included in the simulation models provided to AEMO.
Figure 123 PSS/E and PSCAD simulation of voltage, active power, and reactive power at Hallett Hill Wind
Farm’s connection point
W.2.4 Hornsdale Wind Farm
Figure 124 shows a significant difference between modelled and measured (HSM) active power values,
due to the reduction caused in practice by a repeated LVRT alarm which disconnects the wind turbines.
This feature is not included in the simulation models provided to AEMO.

BLACK SYSTEM SOUTH AUSTRALIA 28 SEPTEMBER 2016 – FINAL REPORT
© AEMO 2017 199
Figure 124 PSS/E and PSCAD simulation of voltage, active power, and reactive power at Hornsdale Wind
Farm’s connection point
W.2.5 Lake Bonney 1 Wind Farm
Figure 125 shows a good match between PSCAD and PSS/E modelling and measured (HSM) values
up to final collapse.
Figure 125 PSS/E and PSCAD simulation of voltage, active power, and reactive power at Lake Bonney 1
Wind Farm’s connection point

BLACK SYSTEM SOUTH AUSTRALIA 28 SEPTEMBER 2016 – FINAL REPORT
© AEMO 2017 200
W.2.6 Mt Millar Wind Farm
Figure 126 shows a good match between PSCAD and PSS/E modelling and measured (HSM) values
up to 16:18:15. After that time, PSS/E modelling outcomes for active power differ considerably from
measured values, due to the absence of zero power mode of operation in the simulation model.
A PSCAD model of this turbine type was not made available to AEMO. Such a model would not have
necessarily improved the model accuracy, unless it accounted for the zero power mode feature.
Figure 126 PSS/E simulation of voltage, active power, and reactive power at Mt Millar Wind Farm’s
connection point
W.2.7 North Brown Hill Wind Farm
Figure 127 shows a significant difference between modelled and measured (HSM) active power values,
due to the reduction caused in practice by a repeated LVRT alarm which disconnects the wind turbines.
This feature is not included in the simulation models provided to AEMO.

BLACK SYSTEM SOUTH AUSTRALIA 28 SEPTEMBER 2016 – FINAL REPORT
© AEMO 2017 201
Figure 127 PSS/E and PSCAD simulation of voltage, active and reactive power at North Brown Hill Wind
Farm’s connection point
W.2.8 Snowtown South Wind Farm
Figure 128 shows a significant difference between modelled and measured (HSM) active power values,
due to the reduction caused in practice by a repeated LVRT alarm which disconnects the wind turbines.
This feature is not included in the simulation models provided to AEMO.
Figure 128 PSS/E and PSCAD simulation of voltage, active and reactive power at Snowtown South Wind
Farm’s connection point

BLACK SYSTEM SOUTH AUSTRALIA 28 SEPTEMBER 2016 – FINAL REPORT
© AEMO 2017 202
W.2.9 Waterloo Wind Farm
Figure 129 shows significant differences between modelled and measured (HSM) values at 16:18:14
and 16:18:15, due to modelling of trigger point for LVRT mode (for more detail, see Appendix W.1).
Figure 129 PSS/E and PSCAD simulation of voltage, active power, and reactive power at Waterloo Wind
Farm’s connection point
W.2.10 TIPS B4
Figure 131 shows a good match between PSCAD and PSS/E modelling and measured (HSM) values
up to final collapse.
Figure 130 PSS/E and PSCAD simulation of voltage, active power, and reactive power at TIPS B4
connection point

BLACK SYSTEM SOUTH AUSTRALIA 28 SEPTEMBER 2016 – FINAL REPORT
© AEMO 2017 203
W.2.11 Ladbroke Grove units
Figure 131 shows a good match between PSCAD and PSS/E modelling and measured (HSM) values
up to 16:18:16.
Figure 131 PSS/E and PSCAD simulation of voltage, active power, and reactive power at Ladbroke Grove
connection point
W.2.12 Para SVC 2
Figure 132 shows a good match between PSCAD and PSS/E modelling and measured (HSM) values
up to final collapse.
Figure 132 PSS/E and PSCAD simulation of three-phase voltages and reactive power at Para SVC2

BLACK SYSTEM SOUTH AUSTRALIA 28 SEPTEMBER 2016 – FINAL REPORT
© AEMO 2017 204
W.3 Overall SA power system
W.3.1 Introduction
To gain confidence in the veracity of simulation results, and the observations/conclusions that have
followed, AEMO has benchmarked the integrated simulation model representing the SA transmission
and distribution network and all SA generating units against field measurements for the system incident
from ElectraNet and Generators.
AEMO’s primary objective was to demonstrate that the transmission network faults leading to the Black
System can be recreated by simulation. This provides confidence in veracity of these modelling tools for
predicting the power system response for any given ‘what if’ scenario analysis.
To assess the accuracy of the simulations, the following benchmarking criteria were established, using
the PSS/E and PSCAD/EMTDC simulation tool:
Active and reactive power flow at Heywood Interconnector.
System voltage magnitudes at key 275 kV substations, in particular the South East Substation.
Relative voltage phase angles at the key 275 kV substation with reference to Heywood Terminal
Station’s voltage phase angle.
Impedance trajectory seen by the Heywood loss of synchronism relay.
Frequencies at key 275 kV substations.
The detailed results from the benchmarking studies are presented in Appendices W.3.2 and W.3.3.
These show that the PSS/E and PSCAD models used for event analysis could accurately recreate the
key phenomena. Most critically, they could recreate the combination of rapidly changing currents and
voltages across the Heywood Interconnector, which determine whether a loss of synchronism and
subsequent islanding would occur.
Note that minor differences exist between the PSS/E and PSCAD impedance trajectories after they
enter the inner blinder of loss of synchronism relay. This is because, with PSS/E, it is not possible to
continue the simulation run after the Heywood Interconnector opens. PSCAD simulation studies can,
however, be successfully run several hundred ms after the islanding.
The sharp knee point in the impedance trajectory that occurs after the islanding conditions is
observable in the PSCAD results but not the PSS/E. This does not, however, have any impact on
accuracy of the PSS/E results, as the loss of synchronism is inevitable as soon as the impedance
trajectory crosses the inner blinder of the relay.
Based on the results obtained, AEMO concludes that for the overall power system simulation:
PSCAD results are more accurate than the PSS/E.
The SA power system models developed in both the PSS/E and PSCAD (including modifications
applied to a few models) are sufficiently accurate to confidently analyse the sequence of events
(despite inaccuracies in some of the individual models).
The use of these models is also appropriate for analysing issue of SA system stability following credible
and non-credible loss of generation in the SA power system.
It must be recognised that simulation tools in general show susceptibility to abrupt changes in RoCoF
(which also means abrupt changes in the voltage phase angles). For this reason, simulated frequencies
in the PSS/E or PSCAD may not be reliable at the time of system separation. However, this has no
implications on the conclusions reached, because system frequencies at the time of separation are not
used in this report to draw any conclusions.
Due to the absence of multiple fault ride-through settings in wind farm models provided to AEMO,
Group A and B wind farms were manually disconnected at known fault times in the simulation models to
emulate the sustained power reduction experienced during the event.
Figures 134 to 147 show the comparison of measured and simulated responses of the Heywood
Interconnector in terms of voltage, active power, and reactive power.
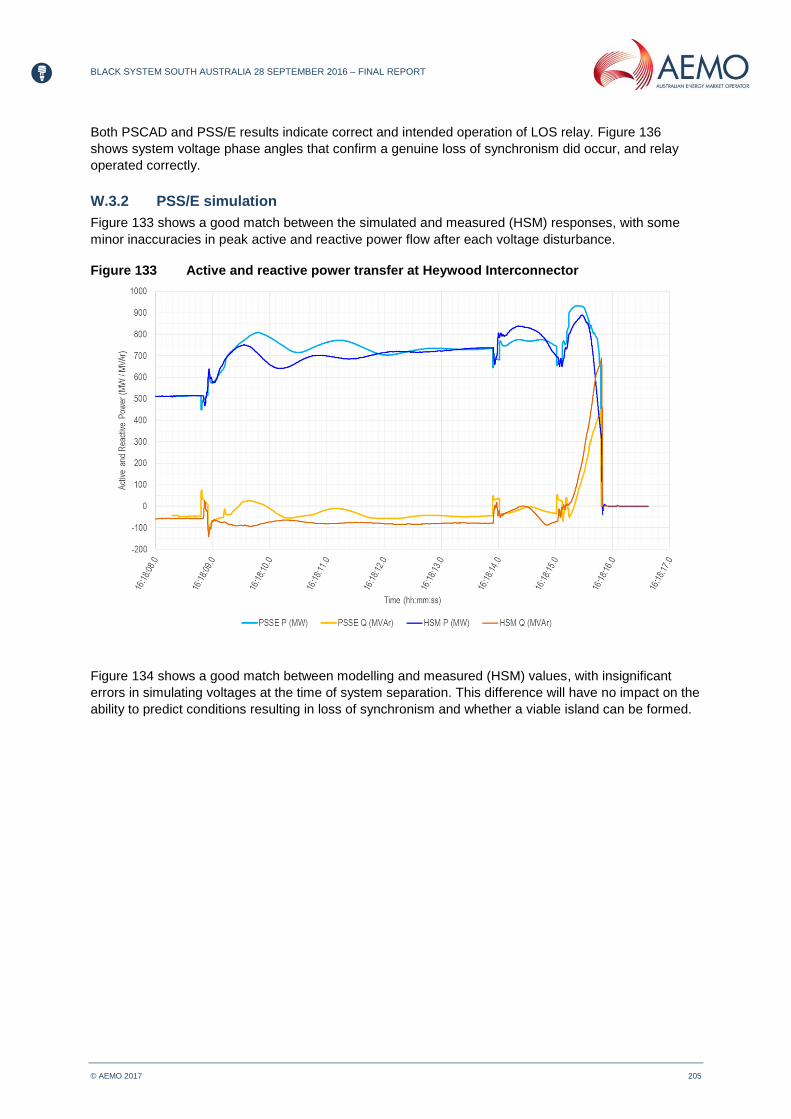
BLACK SYSTEM SOUTH AUSTRALIA 28 SEPTEMBER 2016 – FINAL REPORT
© AEMO 2017 205
Both PSCAD and PSS/E results indicate correct and intended operation of LOS relay. Figure 136
shows system voltage phase angles that confirm a genuine loss of synchronism did occur, and relay
operated correctly.
W.3.2 PSS/E simulation
Figure 133 shows a good match between the simulated and measured (HSM) responses, with some
minor inaccuracies in peak active and reactive power flow after each voltage disturbance.
Figure 133 Active and reactive power transfer at Heywood Interconnector
Figure 134 shows a good match between modelling and measured (HSM) values, with insignificant
errors in simulating voltages at the time of system separation. This difference will have no impact on the
ability to predict conditions resulting in loss of synchronism and whether a viable island can be formed.

BLACK SYSTEM SOUTH AUSTRALIA 28 SEPTEMBER 2016 – FINAL REPORT
© AEMO 2017 206
Figure 134 Voltage magnitudes at key SA 275 kV substations
Figure 135 shows a good match between the measured and simulated response of impedance
trajectory seen by Heywood LOS relay. Note that the PSS/E impedance trajectory stops earlier than the
measured response, because it is not possible to continue the PSS/E dynamic simulation run once the
system is separated.
Figure 135 Simulated impedance trajectory at Heywood Interconnector against relay characteristic area
Figure 136 shows a good match between the measured and simulated response of the voltage phase
angles up to the point of separation. From this point, all voltage phase angles swing rapidly between -

BLACK SYSTEM SOUTH AUSTRALIA 28 SEPTEMBER 2016 – FINAL REPORT
© AEMO 2017 207
180 and 180 degrees, due to the overall system’s loss of synchronism. Voltage phase angle does not
therefore have any practical significance in the last few hundred ms after system separation.
Figure 136 Voltage phase angles relative to HYTS at key SA 275 kV substations
In Figure 137, differences can be observed between the modelled and measured (HSM) values of the
Davenport frequency. This stems from the inability of the PSS/E and most other simulation tools to
calculate the frequency under extreme operating conditions with abrupt changes in both voltage and
frequency. This difference has no material impact on predicting whether loss of synchronism and
islanding conditions will occur.
Figure 137 Frequencies at key SA 275 kV substations

BLACK SYSTEM SOUTH AUSTRALIA 28 SEPTEMBER 2016 – FINAL REPORT
© AEMO 2017 208
Figure 138 Individual active power output
The measured values for generator active power are shown in Appendix I. Comparisons of measured and simulated response of each generating system are presented in Figure 122 to Figure 131. Note that PSS/E dynamic simulation could not be continued after 16:18:16, due to inability of the dynamic simulation solver to deal with rapidly changing dynamics.
W.3.3 PSCAD simulation
Figure 139 shows a good match between modelling and measured (HSM) values, with an insignificant
mismatch in reactive power flow immediately before system separation. This difference has no material
impact on predicting whether loss of synchronism and islanding conditions will occur, as this is
determined by the impedance trajectory (shown in Figure 140). Comparing Figure 139 and Figure 133
indicates more accurate simulation of peak values of active and reactive power flows in PSCAD
immediately after the clearance of each voltage disturbance.

BLACK SYSTEM SOUTH AUSTRALIA 28 SEPTEMBER 2016 – FINAL REPORT
© AEMO 2017 209
Figure 139 Active and reactive power transfer at Heywood Interconnector
Figure 140 shows a good match between modelling and measured (HSM) values where both the
measured and simulated impedance trajectories enter the inner blinder of the Heywood LOS relay,
confirming correct and intended operation of this relay.
Figure 140 PSCAD impedance trajectory at Heywood Interconnector against relay characteristic area
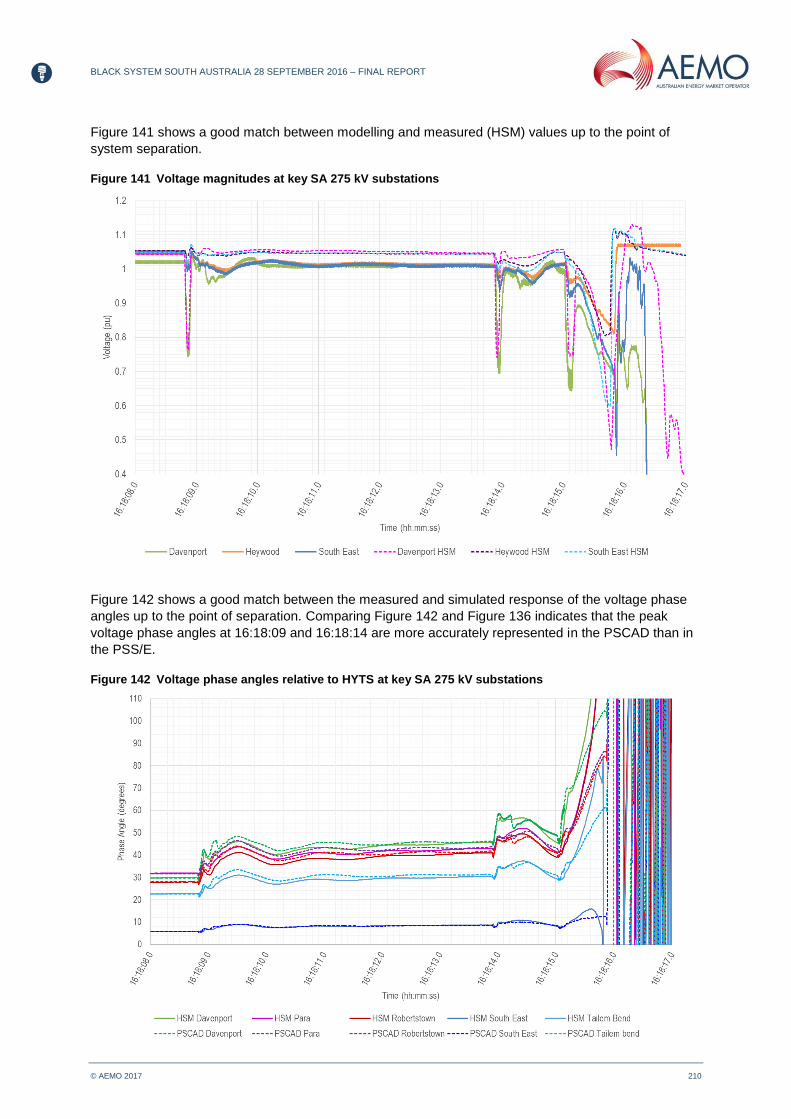
BLACK SYSTEM SOUTH AUSTRALIA 28 SEPTEMBER 2016 – FINAL REPORT
© AEMO 2017 210
Figure 141 shows a good match between modelling and measured (HSM) values up to the point of
system separation.
Figure 141 Voltage magnitudes at key SA 275 kV substations
Figure 142 shows a good match between the measured and simulated response of the voltage phase
angles up to the point of separation. Comparing Figure 142 and Figure 136 indicates that the peak
voltage phase angles at 16:18:09 and 16:18:14 are more accurately represented in the PSCAD than in
the PSS/E.
Figure 142 Voltage phase angles relative to HYTS at key SA 275 kV substations

BLACK SYSTEM SOUTH AUSTRALIA 28 SEPTEMBER 2016 – FINAL REPORT
© AEMO 2017 211
Figure 143 shows mismatches between the measured and simulated frequency for each of the three
voltage disturbances. However, this is not relevant to predicting whether loss of synchronism and
islanding conditions will occur. The reason for this inaccuracy has been already discussed in Appendix
W.3.1 and W.3.2.
Comparing Figure 143 and Figure 137 it can be seen that, unlike the PSS/E which shows smaller
frequency nadirs than the measured vales for the three voltage disturbances, corresponding PSCAD
results indicate larger nadirs than the measured responses. This difference stems from different
approaches used by the PSS/E and PSCAD for calculating the frequency.
Figure 144 depicts responses of individual generating systems. Unlike the PSS/E, the PSCAD dynamic
studies can be successfully run up to 16:18:17. The measured values for generator active power are
shown in Appendix I. Comparisons of the measured and simulated response of each generating system
are presented in Figure 122 to Figure 131.
Figure 143 Frequencies at key SA 275 kV substations

BLACK SYSTEM SOUTH AUSTRALIA 28 SEPTEMBER 2016 – FINAL REPORT
© AEMO 2017 212
Figure 144 Individual generators’ active power
The measured values for generator active power are shown in Appendix I. Comparisons of the
measured and simulated response of each generating system are presented in Figure 122 to
Figure 131.
W.4 Comparison of PSS/E and PSCAD simulation models
Figure 145 shows a good match between modelling and measured (HSM) values up to separation.
The model performance post separation is not relevant to predicting whether loss of synchronism and
islanding conditions will occur. Note that PSS/E simulation stops immediately after system separation,
due to the inability of the dynamic solution engine to deal with rapid and substantial changes in voltages
and frequencies. A sharp peak of 1.25 pu is observable in the PSCAD response immediately after the
separation. The actual measured response exhibits smaller over voltages, likely to be due to over
voltage clamping behaviour of network transformers in the saturated region.

BLACK SYSTEM SOUTH AUSTRALIA 28 SEPTEMBER 2016 – FINAL REPORT
© AEMO 2017 213
Figure 145 Voltages at Heywood Interconnector
Figure 146 shows a good match between modelling and measured (HSM) values, except for the PSS/E
result for peak power flow. This difference has no material impact on predicting whether loss of
synchronism and islanding conditions will occur, as this is determined by the impedance trajectory.
In Figure 135 and Figure 140, close alignment between the measured and simulated impedance
trajectories can be observed.
Figure 146 Active power transfer at Heywood Interconnector

BLACK SYSTEM SOUTH AUSTRALIA 28 SEPTEMBER 2016 – FINAL REPORT
© AEMO 2017 214
Figure 147 shows that modelling values for peak reactive power flow at 16:18:15.8 is less than the
measured (HSM) value. Good correlation can be observed for remainder of the response. One
contributor to this difference is load shake off and disconnection during the actual incident which could
not be accounted for in the simulation models, even with detailed load models. This difference has no
material impact on predicting whether loss of synchronism and islanding conditions will occur, as this is
determined by the impedance trajectory (shown in Figure 135 and Figure 140).
Figure 147 Reactive power transfer at Heywood Interconnector
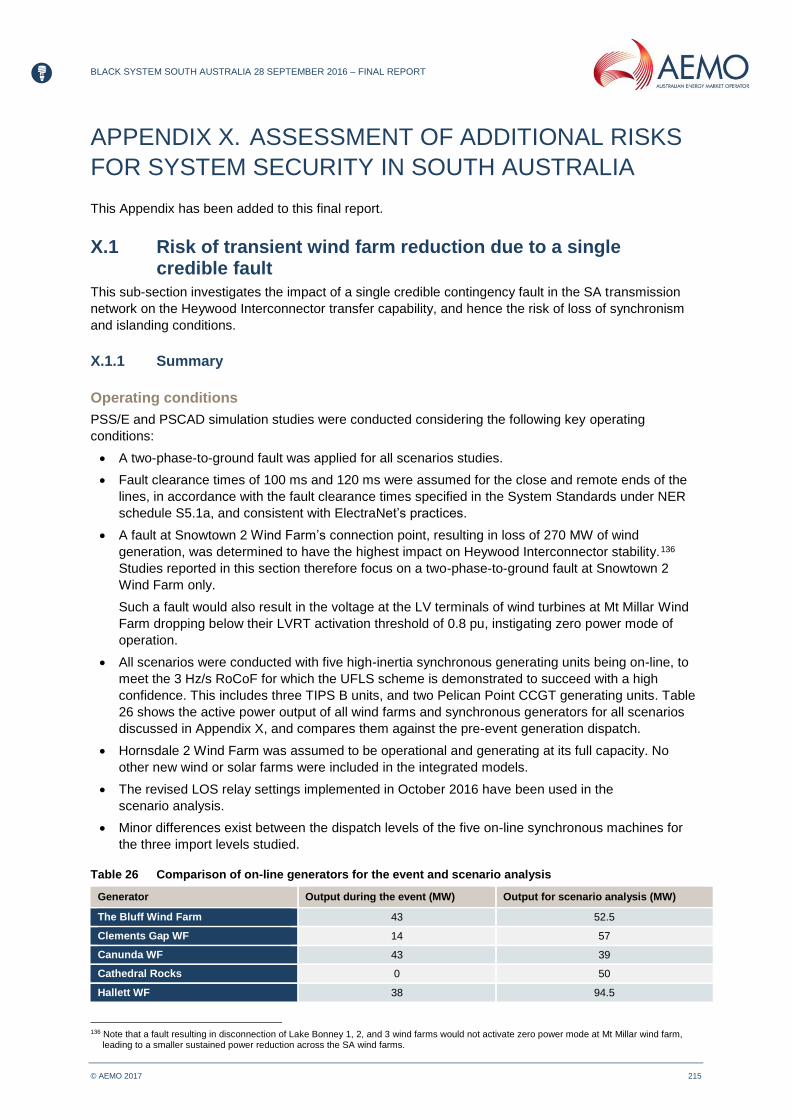
BLACK SYSTEM SOUTH AUSTRALIA 28 SEPTEMBER 2016 – FINAL REPORT
© AEMO 2017 215
APPENDIX X. ASSESSMENT OF ADDITIONAL RISKS
FOR SYSTEM SECURITY IN SOUTH AUSTRALIA
This Appendix has been added to this final report.
X.1 Risk of transient wind farm reduction due to a single credible fault
This sub-section investigates the impact of a single credible contingency fault in the SA transmission
network on the Heywood Interconnector transfer capability, and hence the risk of loss of synchronism
and islanding conditions.
X.1.1 Summary
Operating conditions
PSS/E and PSCAD simulation studies were conducted considering the following key operating
conditions:
A two-phase-to-ground fault was applied for all scenarios studies.
Fault clearance times of 100 ms and 120 ms were assumed for the close and remote ends of the
lines, in accordance with the fault clearance times specified in the System Standards under NER
schedule S5.1a, and consistent with ElectraNet’s practices.
A fault at Snowtown 2 Wind Farm’s connection point, resulting in loss of 270 MW of wind
generation, was determined to have the highest impact on Heywood Interconnector stability.135 F
136
Studies reported in this section therefore focus on a two-phase-to-ground fault at Snowtown 2
Wind Farm only.
Such a fault would also result in the voltage at the LV terminals of wind turbines at Mt Millar Wind
Farm dropping below their LVRT activation threshold of 0.8 pu, instigating zero power mode of
operation.
All scenarios were conducted with five high-inertia synchronous generating units being on-line, to
meet the 3 Hz/s RoCoF for which the UFLS scheme is demonstrated to succeed with a high
confidence. This includes three TIPS B units, and two Pelican Point CCGT generating units. Table
26 shows the active power output of all wind farms and synchronous generators for all scenarios
discussed in Appendix X, and compares them against the pre-event generation dispatch.
Hornsdale 2 Wind Farm was assumed to be operational and generating at its full capacity. No
other new wind or solar farms were included in the integrated models.
The revised LOS relay settings implemented in October 2016 have been used in the
scenario analysis.
Minor differences exist between the dispatch levels of the five on-line synchronous machines for
the three import levels studied.
Table 26 Comparison of on-line generators for the event and scenario analysis
Generator Output during the event (MW) Output for scenario analysis (MW)
The Bluff Wind Farm 43 52.5
Clements Gap WF 14 57
Canunda WF 43 39
Cathedral Rocks 0 50
Hallett WF 38 94.5
136 Note that a fault resulting in disconnection of Lake Bonney 1, 2, and 3 wind farms would not activate zero power mode at Mt Millar wind farm,
leading to a smaller sustained power reduction across the SA wind farms.
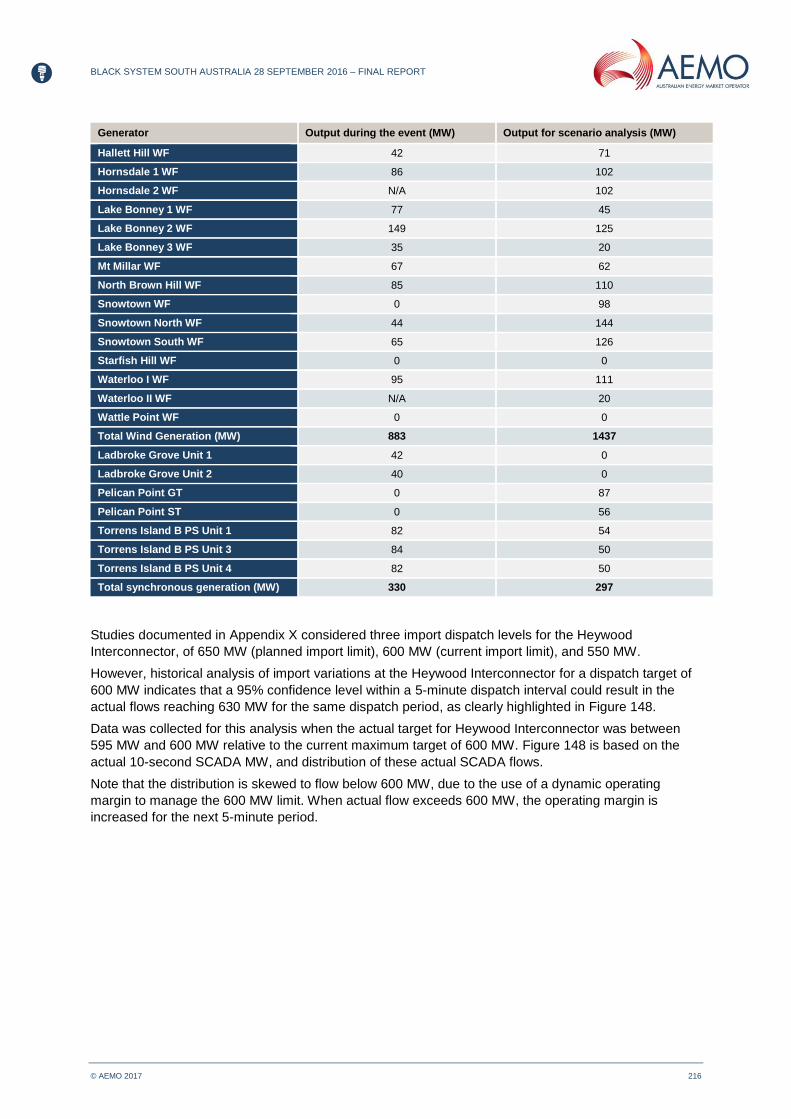
BLACK SYSTEM SOUTH AUSTRALIA 28 SEPTEMBER 2016 – FINAL REPORT
© AEMO 2017 216
Generator Output during the event (MW) Output for scenario analysis (MW)
Hallett Hill WF 42 71
Hornsdale 1 WF 86 102
Hornsdale 2 WF N/A 102
Lake Bonney 1 WF 77 45
Lake Bonney 2 WF 149 125
Lake Bonney 3 WF 35 20
Mt Millar WF 67 62
North Brown Hill WF 85 110
Snowtown WF 0 98
Snowtown North WF 44 144
Snowtown South WF 65 126
Starfish Hill WF 0 0
Waterloo I WF 95 111
Waterloo II WF N/A 20
Wattle Point WF 0 0
Total Wind Generation (MW) 883 1437
Ladbroke Grove Unit 1 42 0
Ladbroke Grove Unit 2 40 0
Pelican Point GT 0 87
Pelican Point ST 0 56
Torrens Island B PS Unit 1 82 54
Torrens Island B PS Unit 3 84 50
Torrens Island B PS Unit 4 82 50
Total synchronous generation (MW) 330 297
Studies documented in Appendix X considered three import dispatch levels for the Heywood
Interconnector, of 650 MW (planned import limit), 600 MW (current import limit), and 550 MW.
However, historical analysis of import variations at the Heywood Interconnector for a dispatch target of
600 MW indicates that a 95% confidence level within a 5-minute dispatch interval could result in the
actual flows reaching 630 MW for the same dispatch period, as clearly highlighted in Figure 148.
Data was collected for this analysis when the actual target for Heywood Interconnector was between
595 MW and 600 MW relative to the current maximum target of 600 MW. Figure 148 is based on the
actual 10-second SCADA MW, and distribution of these actual SCADA flows.
Note that the distribution is skewed to flow below 600 MW, due to the use of a dynamic operating
margin to manage the 600 MW limit. When actual flow exceeds 600 MW, the operating margin is
increased for the next 5-minute period.

BLACK SYSTEM SOUTH AUSTRALIA 28 SEPTEMBER 2016 – FINAL REPORT
© AEMO 2017 217
Figure 148 Actual Heywood Interconnector flows with a dispatch target of 600 MW
This analysis confirmed a drift of up to 30 MW in the actual flows, compared to the target flows.
To account for this natural drift, the three import levels stated above were each increased by 30 MW.
The three import levels analysed by the PSS/E and PSCAD simulation were, therefore, 680 MW,
630 MW, and 580 MW.
Results
PSS/E studies were carried out for all three import levels of 680 MW, 630 MW, and 580 MW. These
studies indicate that loss of synchronism and system separation can occur for a single credible fault in
the SA transmission system for the 680 MW and 630 MW import levels, but not for the 580 MW level,
even when the 3 Hz/s RoCoF constraint is binding.
These conclusions were corroborated by PSCAD simulation studies for the 680 MW and 630 MW
import levels. Consistent results from two independent simulation platforms provide high confidence in
the veracity of these conclusions.
Note that PSCAD results are presented with the Interconnector opening 50 ms after the impedance
trajectory crosses the inner blinder of the loss of synchronism relay. However, PSS/E simulation would
have stopped immediately after islanding. For this reason PSS/E simulation results are presented with
the Interconnector closed, however, system instability is still observable.
The following key traits can be consistently seen in both the PSS/E and PSCAD studies 136F
137:
Loss of synchronism events due to sustained reduction of several hundred MW of generation
manifest themselves with declining voltage magnitudes and increasing voltage phase angles
beyond 90 degrees across the SA power system.
This can be seen from Figure 151, Figure 156, Figure 161, and Figure 166 (which show PSS/E
and PSCAD simulations of system voltage magnitudes for the 680 MW and 630 MW import levels),
as well as Figure 152, Figure 157, Figure 162, and Figure 167 (which highlight system voltage
phase angles).
The loss of synchronism events when operating at 680 MW and 630 MW import levels evolve
approximately three times slower than those which occurred in the time between the fault
137 PSS/E simulation studies are conducted for the 680, 630, and 580 MW import levels. PSCAD studies are used to verify the PSS/E results for the
two unstable import levels of 680 MW and 630 MW.

BLACK SYSTEM SOUTH AUSTRALIA 28 SEPTEMBER 2016 – FINAL REPORT
© AEMO 2017 218
clearance and the Heywood Interconnector opening. This is evident from Figure 149, Figure 154,
Figure 159, and Figure 164, which show active and reactive power transfer across the
Heywood Interconnector.
Figure 150, Figure 155, Figure 160, and Figure 165 indicate that the loss of synchronism relay
correctly operates for unstable power swings for the 680 MW and 630 MW import levels, and
blocks operation for stable power swings at 580 MW import level. The relay, therefore, operates
where it should and does not operate where it should not.
The frequency variations prior to the system separation are not sufficient to activate the UFLS
scheme (see Figure 153, Figure 158, Figure 163, and Figure 168).
The study results and conclusions presented in this report are based on five high-inertia synchronous
generators being on-line in SA. AEMO has not carried out any studies to determine the extent to which
operating with a larger number of on-line synchronous generators would assist in the stable and secure
operation of the Heywood Interconnector, above the 550 MW dispatch level demonstrated to be a
stable operating point.
X.1.2 Simulation results
Appendix X.1.2 presents the following simulation case studies:
PSS/E simulation for the 680 MW, 630 MW, and 580 MW Heywood Interconnector import levels.
PSCAD simulation for the 680 MW and 630 MW import levels.
For each of the five simulation studies, the following quantities were used to determine system stability
or otherwise for a single credible fault:
Heywood active and reactive power flow.
Heywood impedance trajectory.
System voltage magnitudes.
System voltage phase angles.
System frequencies.

BLACK SYSTEM SOUTH AUSTRALIA 28 SEPTEMBER 2016 – FINAL REPORT
© AEMO 2017 219
680 MW import level
PSS/E simulation studies
Figure 149 Active and reactive power transfer at Heywood Interconnector
Figure 150 Simulated impedance trajectory at Heywood Interconnector against relay characteristic area
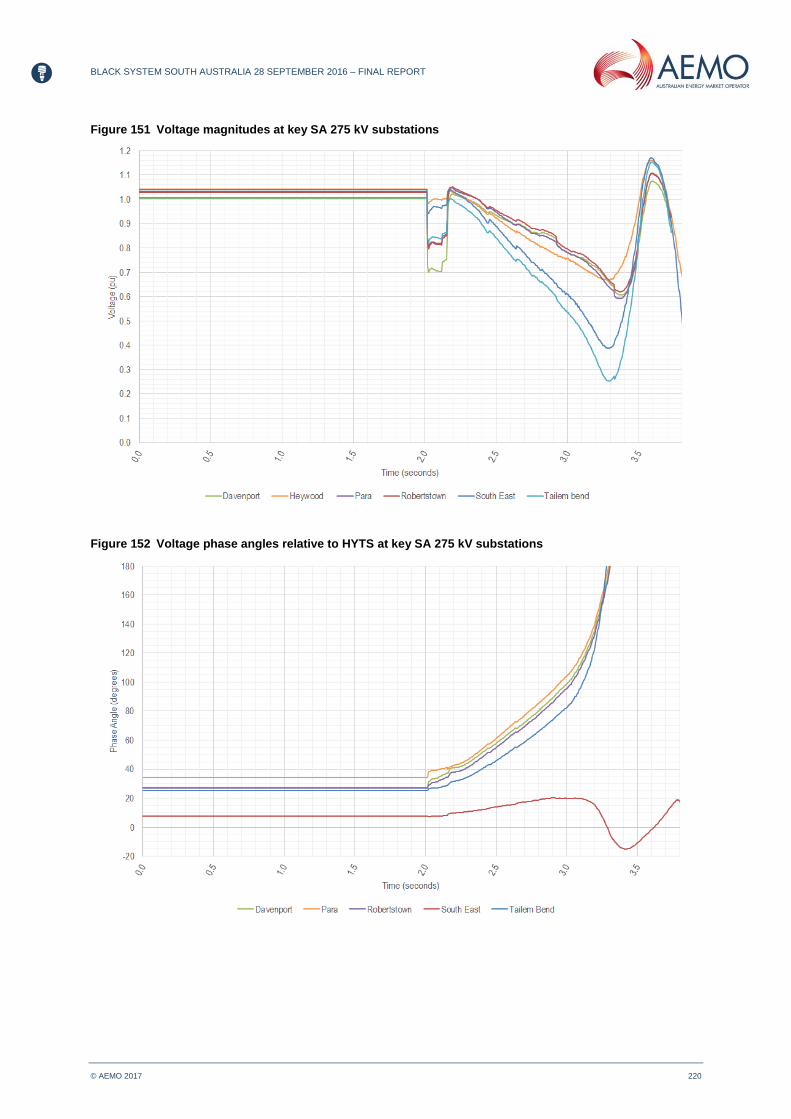
BLACK SYSTEM SOUTH AUSTRALIA 28 SEPTEMBER 2016 – FINAL REPORT
© AEMO 2017 220
Figure 151 Voltage magnitudes at key SA 275 kV substations
Figure 152 Voltage phase angles relative to HYTS at key SA 275 kV substations
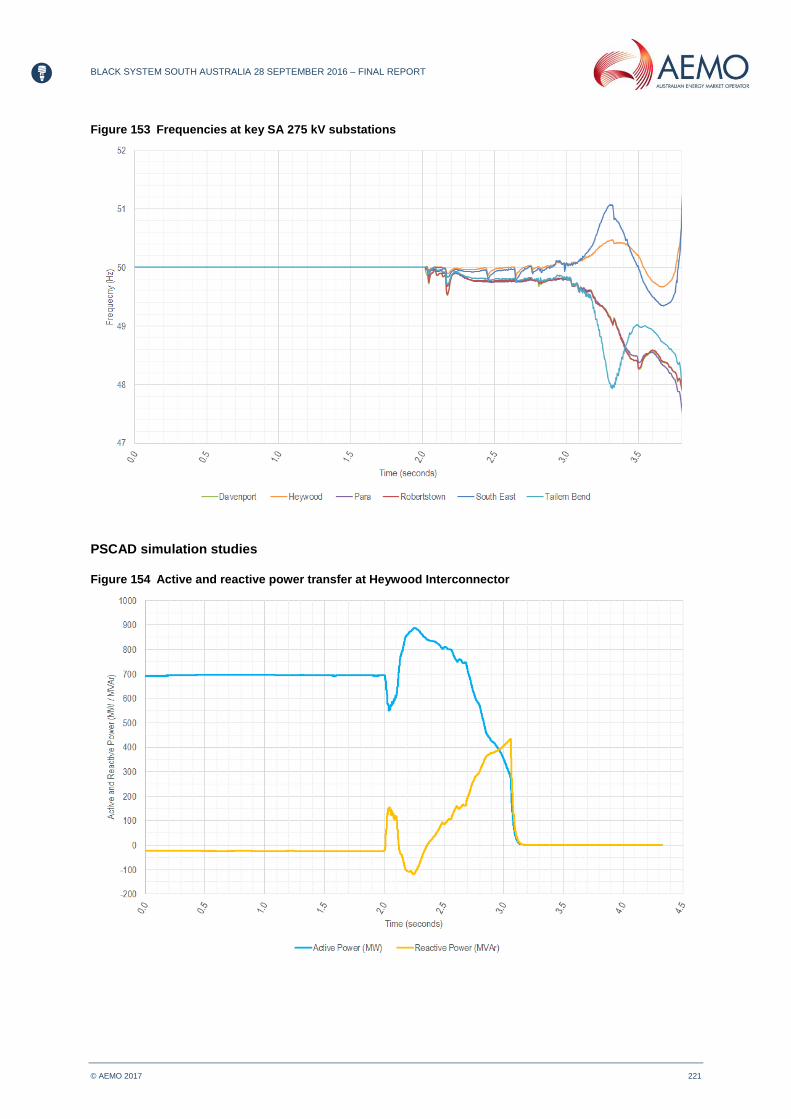
BLACK SYSTEM SOUTH AUSTRALIA 28 SEPTEMBER 2016 – FINAL REPORT
© AEMO 2017 221
Figure 153 Frequencies at key SA 275 kV substations
PSCAD simulation studies
Figure 154 Active and reactive power transfer at Heywood Interconnector

BLACK SYSTEM SOUTH AUSTRALIA 28 SEPTEMBER 2016 – FINAL REPORT
© AEMO 2017 222
Figure 155 PSCAD Impedance trajectory at Heywood Interconnector against relay characteristic area
Figure 156 Voltage magnitudes at key SA 275 kV substations

BLACK SYSTEM SOUTH AUSTRALIA 28 SEPTEMBER 2016 – FINAL REPORT
© AEMO 2017 223
Figure 157 Voltage phase angles relative to HYTS at key SA 275 kV substations
Note that large spikes seen at 3.1 seconds in Figure 158 stem from the inherent inability of simulation
tools to track the abrupt changes in voltage phase angles and RoCoF.
Figure 158 Frequencies at key SA 275 kV substations

BLACK SYSTEM SOUTH AUSTRALIA 28 SEPTEMBER 2016 – FINAL REPORT
© AEMO 2017 224
630 MW import level
PSS/E simulation studies
Figure 159 Active and reactive power transfer at Heywood Interconnector
Figure 160 Simulated impedance trajectory at Heywood Interconnector against relay characteristic area

BLACK SYSTEM SOUTH AUSTRALIA 28 SEPTEMBER 2016 – FINAL REPORT
© AEMO 2017 225
Figure 161 Voltage magnitudes at key SA 275 kV substations
Figure 162 Voltage phase angles relative to HYTS at key SA 275 kV substations

BLACK SYSTEM SOUTH AUSTRALIA 28 SEPTEMBER 2016 – FINAL REPORT
© AEMO 2017 226
Figure 163 Frequencies at key SA 275 kV substations
PSCAD simulation studies
Figure 164 Active and reactive power transfer at Heywood Interconnector

BLACK SYSTEM SOUTH AUSTRALIA 28 SEPTEMBER 2016 – FINAL REPORT
© AEMO 2017 227
Figure 165 Simulated impedance trajectory at Heywood Interconnector against relay characteristic area
Figure 166 Voltage magnitudes at key SA 275 kV substations
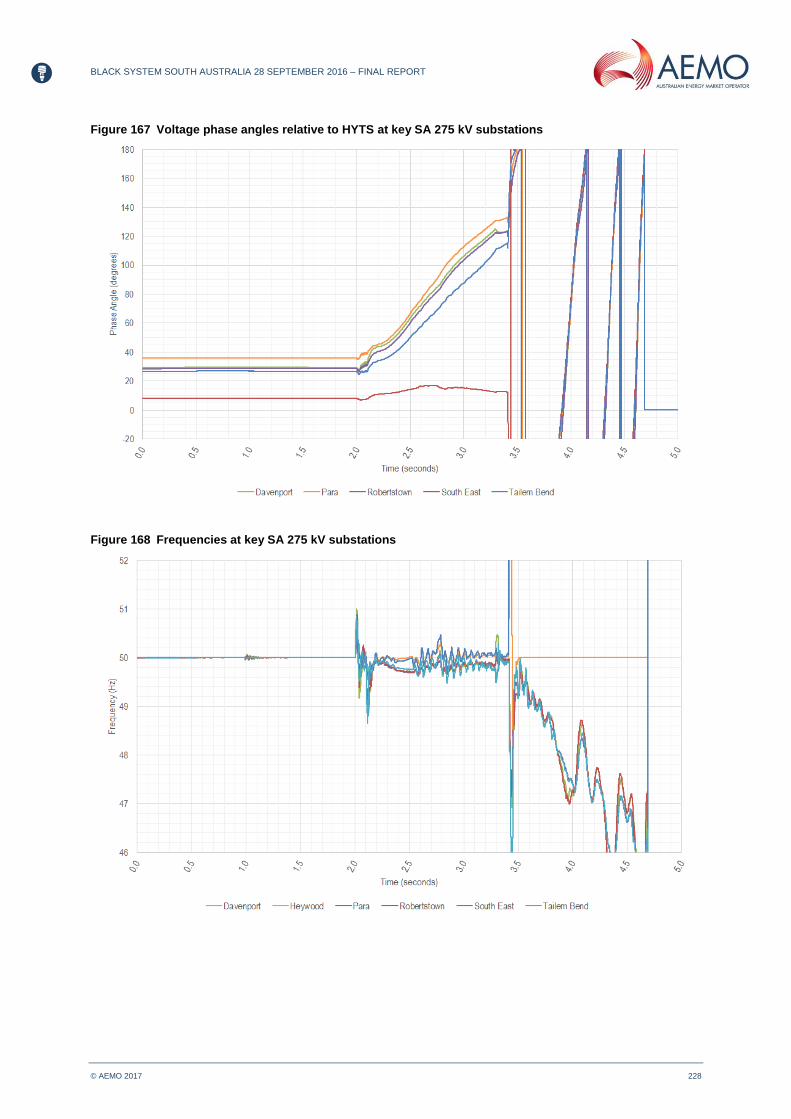
BLACK SYSTEM SOUTH AUSTRALIA 28 SEPTEMBER 2016 – FINAL REPORT
© AEMO 2017 228
Figure 167 Voltage phase angles relative to HYTS at key SA 275 kV substations
Figure 168 Frequencies at key SA 275 kV substations

BLACK SYSTEM SOUTH AUSTRALIA 28 SEPTEMBER 2016 – FINAL REPORT
© AEMO 2017 229
580 MW import level
PSS/E simulation studies
Figure 169 Active and reactive power transfer at Heywood Interconnector
Figure 170 Simulated impedance trajectory at Heywood Interconnector against relay characteristic area

BLACK SYSTEM SOUTH AUSTRALIA 28 SEPTEMBER 2016 – FINAL REPORT
© AEMO 2017 230
Figure 171 Voltage magnitudes at key SA 275 kV substations
Figure 172 Voltage phase angles relative to HYTS at key SA 275 kV substations
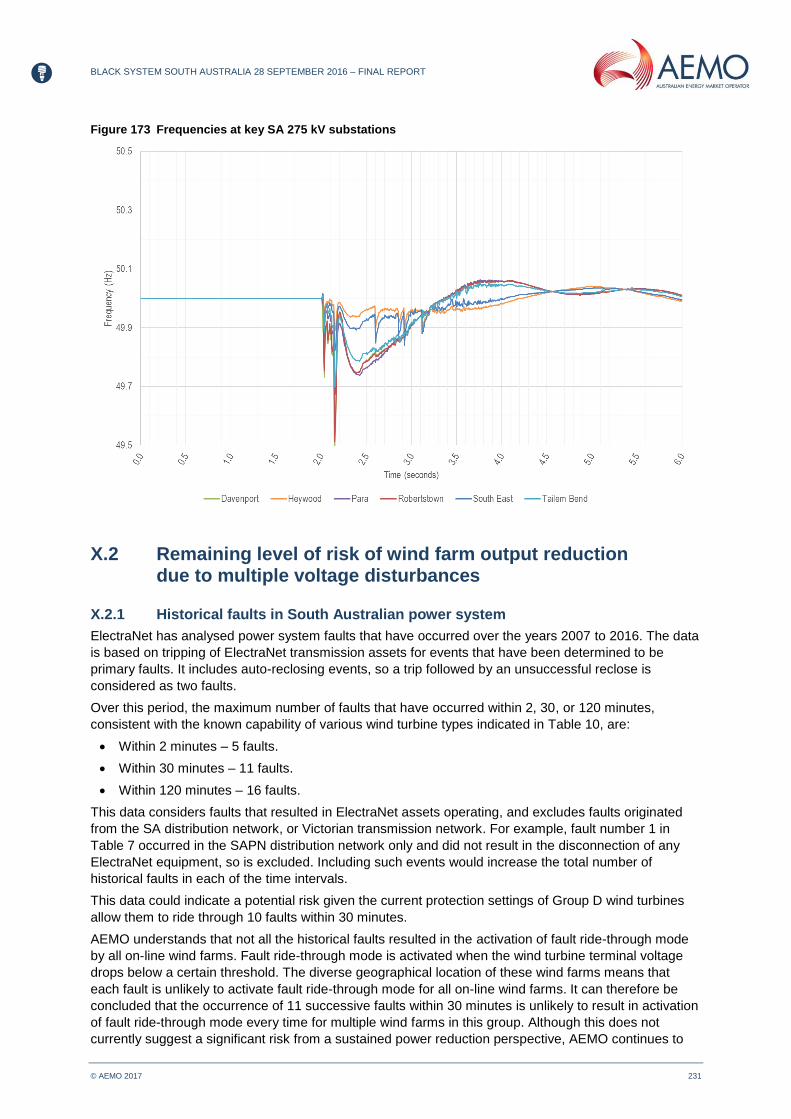
BLACK SYSTEM SOUTH AUSTRALIA 28 SEPTEMBER 2016 – FINAL REPORT
© AEMO 2017 231
Figure 173 Frequencies at key SA 275 kV substations
X.2 Remaining level of risk of wind farm output reduction due to multiple voltage disturbances
X.2.1 Historical faults in South Australian power system
ElectraNet has analysed power system faults that have occurred over the years 2007 to 2016. The data
is based on tripping of ElectraNet transmission assets for events that have been determined to be
primary faults. It includes auto-reclosing events, so a trip followed by an unsuccessful reclose is
considered as two faults.
Over this period, the maximum number of faults that have occurred within 2, 30, or 120 minutes,
consistent with the known capability of various wind turbine types indicated in Table 10, are:
Within 2 minutes – 5 faults.
Within 30 minutes – 11 faults.
Within 120 minutes – 16 faults.
This data considers faults that resulted in ElectraNet assets operating, and excludes faults originated
from the SA distribution network, or Victorian transmission network. For example, fault number 1 in
Table 7 occurred in the SAPN distribution network only and did not result in the disconnection of any
ElectraNet equipment, so is excluded. Including such events would increase the total number of
historical faults in each of the time intervals.
This data could indicate a potential risk given the current protection settings of Group D wind turbines
allow them to ride through 10 faults within 30 minutes.
AEMO understands that not all the historical faults resulted in the activation of fault ride-through mode
by all on-line wind farms. Fault ride-through mode is activated when the wind turbine terminal voltage
drops below a certain threshold. The diverse geographical location of these wind farms means that
each fault is unlikely to activate fault ride-through mode for all on-line wind farms. It can therefore be
concluded that the occurrence of 11 successive faults within 30 minutes is unlikely to result in activation
of fault ride-through mode every time for multiple wind farms in this group. Although this does not
currently suggest a significant risk from a sustained power reduction perspective, AEMO continues to

BLACK SYSTEM SOUTH AUSTRALIA 28 SEPTEMBER 2016 – FINAL REPORT
© AEMO 2017 232
follow up with the relevant Generators to ensure it has accurate information on the pre-set protection
limits of these wind farms on the number of LVRT events within different time periods, and to
understand the extent to which these settings can be increased. Of the Group D wind farms, AEMO has
not yet received conclusive information on Lake Bonney 1, Starfish Hill, and Wattle Point Wind Farms.
AEMO also notes that a continual increase in the ratio of on-line wind generation to synchronous
generation results in a reduction in SA system strength. Operation under reduced system strength
scenarios would result in increased severity of the voltage disturbances in terms of the depth, spread,
and recovery time following fault clearance for exactly the same voltage disturbance 137F
138, hence a higher
likelihood of activating the fault ride-through mode across multiple wind farms.
X.2.2 Simulation results
Simulation case studies were conducted using the PSS/E simulation tool to determine the impact on the
Heywood Interconnector’s stability, and the risk of islanding, if only one wind farm was unable to ride
through multiple faults.
Lake Bonney 1 and Wattle Point Wind Farms were taken as illustrative and plausible examples, due to
their unknown capability to ride through multiple faults in quick succession. Simulation case studies
were then undertaken with exactly the same conditions set out in Appendix X.1.2 for the 580 MW import
level, except the Lake Bonney 1 and Wattle Point Wind Farms were disconnected at the same time as
that Snowtown 2 Wind Farms.
Note that scenarios resulting in potential disconnection of any of the SA wind farms due to lack of
multiple fault ride-through capability are likely to be caused by non-credible network contingences.
However, the resulting voltage disturbances are well within the capability of the wind farms and
individual wind turbines, as highlighted in their performance standards.
These studies demonstrate the correct and intended operation of Heywood’s loss of synchronism relay
due to the loss of more than 400 MW of wind generation and resultant rapidly declining system
voltages. This is accompanied by a sharp increase in voltage phase angles relative to HYTS of all major
275 kV substations.
These simulation case studies highlight that it is paramount for all SA wind farms to ride through a
sufficient number of voltage disturbances in quick succession, to allow the Heywood Interconnector to
stably and securely operate at an import level of 550 MW.
138 See Figure 34 of AEMO’s 2016 National Transmission Network Development Plan. Available at: http://www.aemo.com.au/Electricity/National-
Electricity-Market-NEM/Planning-and-forecasting/National-Transmission-Network-Development-Plan.

BLACK SYSTEM SOUTH AUSTRALIA 28 SEPTEMBER 2016 – FINAL REPORT
© AEMO 2017 233
Disconnection of Lake Bonney 1 wind farm
PSS/E simulation studies
Figure 174 Active and reactive power transfer at Heywood Interconnector
Figure 175 Simulated impedance trajectory at Heywood Interconnector against relay characteristic area

BLACK SYSTEM SOUTH AUSTRALIA 28 SEPTEMBER 2016 – FINAL REPORT
© AEMO 2017 234
Figure 176 Voltage magnitudes at key SA 275 kV substations
Figure 177 Voltage phase angles relative to HYTS at key SA 275 kV substations

BLACK SYSTEM SOUTH AUSTRALIA 28 SEPTEMBER 2016 – FINAL REPORT
© AEMO 2017 235
Figure 178 Frequencies at key SA 275 kV substations
Disconnection of Wattle Point wind farm
PSS/E simulation studies
Figure 179 Active and reactive power transfer at Heywood Interconnector
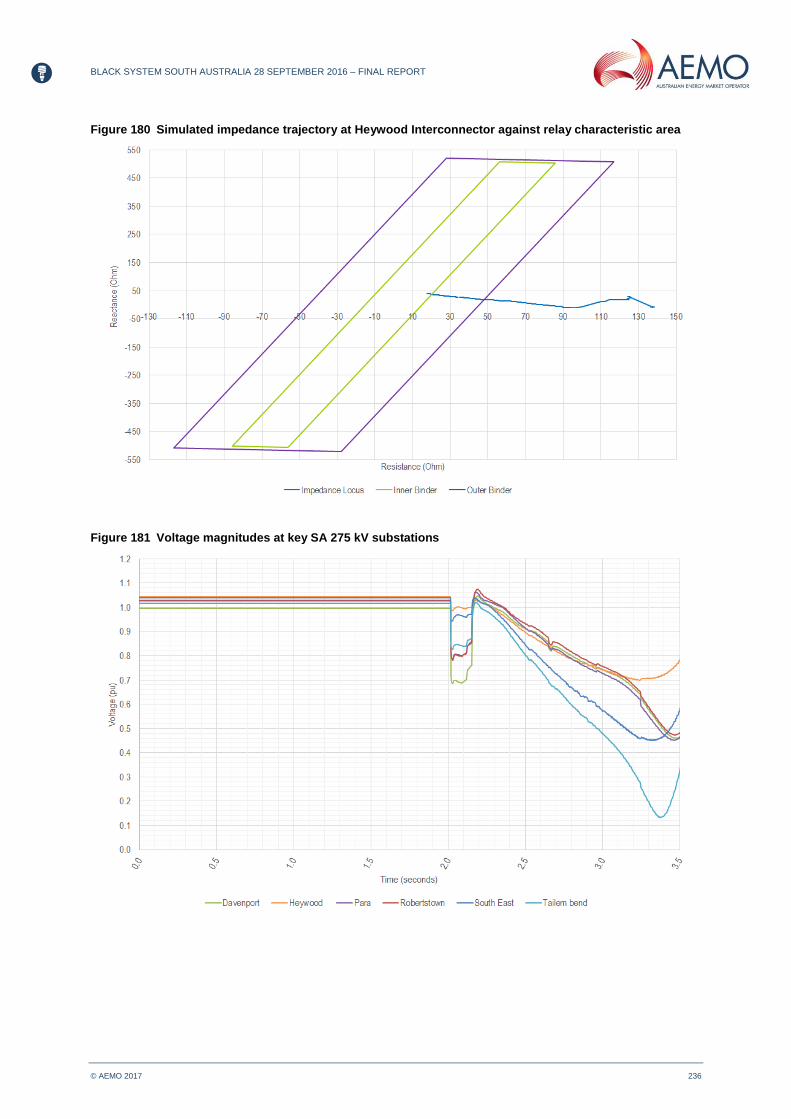
BLACK SYSTEM SOUTH AUSTRALIA 28 SEPTEMBER 2016 – FINAL REPORT
© AEMO 2017 236
Figure 180 Simulated impedance trajectory at Heywood Interconnector against relay characteristic area
Figure 181 Voltage magnitudes at key SA 275 kV substations

BLACK SYSTEM SOUTH AUSTRALIA 28 SEPTEMBER 2016 – FINAL REPORT
© AEMO 2017 237
Figure 182 Voltage phase angles relative to HYTS at key SA 275 kV substations
Figure 183 Frequencies at key SA 275 kV substations

BLACK SYSTEM SOUTH AUSTRALIA 28 SEPTEMBER 2016 – FINAL REPORT
© AEMO 2017 238
X.3 Adequacy of system strength in South Australia during islanded operation
Appendix X.3 evaluates the adequacy of system strength for a number of operating conditions with
varying levels of wind and synchronous generation on-line, and during system intact and islanding
conditions. The key susceptibility mechanisms investigated include:
Wind turbines.
Dynamic reactive power support devices.
Murraylink HVDC link.
Protective relays.
X.3.1 Wind turbine generators
Table 27 presents WSCR for all wind farms in SA as a function of:
Amount of wind generation on-line.
Combination of synchronous generating units on-line.
Whether or not the Heywood Interconnector remains connected.
Note that the SA power system currently requires a minimum number of synchronous generating units
on-line (equivalent to two TIPS B units). Scenarios studied in Table 27, therefore, reflect higher system
strength conditions than the minimum permissible level. However, operation with two synchronous
generators can only occur for low Heywood power flow conditions (for example, less than 200 MW),
whereas the scenarios discussed in this report primarily focus on high import conditions which
necessitate a larger number of on-line synchronous machines.
Appendix X.3.4, which evaluates potential susceptibility of protective relays to low system strength
conditions, has accounted for weaker operating conditions with two TIPS B units on-line and loss of the
Heywood Interconnector.
Wind farms were grouped based on electrical and geographical proximity to each other as follows:
Hallett, Hallett Hill, North Brown Hill, and The Bluff Wind Farms.
Lake Bonney 1, 2, and 3 and Canunda Wind Farm.
Hornsdale 1 and 2 Wind Farms.
Cathedral Rocks and Mt Millar Wind Farms.
Snowtown Wind Farm.
Snowtown 2 Wind Farms.
Waterloo Wind Farm.
Clements Gap Wind Farm.
Starfish Hill and Wattle Point Wind Farms were not considered on-line in the dispatch scenarios
studied. These generating systems are located in remote areas and will not be significantly impacted as
the SA generation dispatch varies.
Table 27 Short circuit ratio and weighted short circuit ratio calculated for all on-line wind farms
Wind farm 3 TIPS B + Ladbroke Grove
(pre-separation)
3 TIPS B + Ladbroke Grove
(post-separation)
3 TIPS B + Pelican Point CCGT
(pre-separation)
3 TIPS B + Pelican Point CCGT
(post-separation)
Clements Gap 10.9 10.8 10.8 10.8
Snowtown N/A N/A 6.9 6.9
Snowtown 2 4.3 4.2 2.8 2.8
Waterloo 4.3 4.1 3.9 3.9
Cathedral Rocks N/A N/A 1.1 1.1
Mt Millar 2.1 2.1 1.1 1.1

BLACK SYSTEM SOUTH AUSTRALIA 28 SEPTEMBER 2016 – FINAL REPORT
© AEMO 2017 239
Wind farm 3 TIPS B + Ladbroke Grove
(pre-separation)
3 TIPS B + Ladbroke Grove
(post-separation)
3 TIPS B + Pelican Point CCGT
(pre-separation)
3 TIPS B + Pelican Point CCGT
(post-separation)
Hornsdale 1 8.5 8.1 5.4 5.4
Hornsdale 2 N/A N/A 5.4 5.4
Hallett 3.7 3.5 2.4 2.3
Hallett Hill 3.4 3.3 2.3 2.3
North Brown Hill 3.5 3.3 2.3 2.3
The Bluff 3.7 3.5 2.4 2.4
Canunda 2.6 2.1 1.9 1.6
Lake Bonney 1,2,3 2.6 1.7 1.6 1.4
Comparison of these calculations with the minimum SCR withstand capability of wind turbines, as
confirmed by each OEM to AEMO, demonstrates that during the islanding conditions wind turbines
installed at the following wind farms would operate below the minimum SCR for which they
were designed.
Canunda.
Cathedral Rocks.
Lake Bonney 1, 2, and 3.
Mt Millar.
Cathedral Rocks and Mt Millar Wind Farms are located in remote areas, and far from any baseload
synchronous generation. The combined level of system strength as measured by the WSCR for these
two wind farms is generally low, even when the Heywood Interconnector remains connected. To
maintain the sufficient level of system strength required for stable operation of these wind farms, it may
be necessary to limit their combined output power below that required by ElectraNet’s Generation
Dispatch Limit (GDL). Further detailed power system studies are required to determine the maximum
permissible total output power of these wind farms.
X.3.2 Static Var Compensators
A reduction in system strength can cause oscillations in the SVC reactive power output, due to a
voltage regulator gain too high for the reduced system strength.
The following controls currently apply to Para and South East SVCs when operating with reduced
system strength conditions:
Para SVCs:
Gain supervision: Para SVCs are equipped with an automatic gain supervision feature that
ensures stability in the closed-loop voltage control under low system strength conditions. This
function reduces the SVC integral gain to 20% of the original value as soon as the fault level at
Para Substation drops below 800 MVA as measured at Para Substation.
Gain reduction: To avoid large voltage oscillations before the gain supervision takes effect, the
operator can reduce the gain with a push button. The function is referred to as the ‘Black Start
Gain’ and the gain can be changed between 10% and 90% of the nominal gain.
South East SVCs:
South East SVCs are currently enabled with manual gain reduction capability, which reduces
the normal gain by half when enabled by the operator. Automatic gain supervision requiring a
further decrease in the gain could be achieved with a software upgrade.
The minimum design SCR for stable operation of each of the SVCs is 3.
Table 28 shows the calculated SCR at the 275 kV terminals of the Para and South East SVCs, with
each of the 2x80 MVAr SVCs bundled as a single SVC. These studies indicate that the available

BLACK SYSTEM SOUTH AUSTRALIA 28 SEPTEMBER 2016 – FINAL REPORT
© AEMO 2017 240
system strength, as measured by the SCR for both the Para and South East SVCs, is well above their
minimum design limit, before and after system separation.
The quantity of synchronous generation considered is:
Three TIPS B + two Ladbroke Grove generating units.
Three TIPS B + two Pelican Point CCGT generating units.
Table 28 Short circuit ratio calculated for Para and South East SVCs
SVC 3 TIPS B + Ladbroke Grove
(pre-separation)
3 TIPS B + Ladbroke Grove
(post-separation)
3 TIPS B + Pelican Point CCGT
(pre-separation)
3 TIPS B + Pelican Point CCGT
(pre-separation)
Para 1+2 16.7 13 23 19.6
South East 1+2 17.8 6.7 17.5 7.38
X.3.3 Murraylink HVDC link
Murraylink HVDC link is located in a remote area, and far from synchronous generation in both SA and
Victoria. Because of this remoteness, it has been designed to operate at SCR values down to
approximately 1.
For this reason, operation of Murraylink HVDC link is not significantly influenced by the generation
dispatch pattern in SA, as shown in Table 29. Operation of the SA power system with low levels of
synchronous generation is not, therefore, expected to compromise Murraylink’s stability.
Table 29 Short circuit ratio calculated for Murraylink HVDC link
Plant 3 TIPS B + Ladbroke Grove
(pre-separation)
3 TIPS B + Ladbroke Grove
(post-separation)
3 TIPS B + Pelican Point CCGT
(pre-separation)
3 TIPS B + Pelican Point CCGT
(pre-separation)
Murraylink 13.1 13.1 6.2 6.3
The reason for a lower SCR for the 3 TIPS B + Pelican Point CCGT dispatch scenario is that the full
capacity of 220 MW is used for the calculations, as opposed to 114 MW import level during the Black
System. Additionally, Table 29 indicates a slightly higher SCR for this dispatch scenario following
system separation, due to the development of temporary over voltages following system separation.
X.3.4 Protective relays
Introduction
This section:
Provides general guidance on issues that might be experienced when operating protective relays
with lower fault levels than those they are originally designed for.
Evaluates the mechanisms by which lack of system strength can result in spurious tripping or
failure to operate protective relays, and confirms these discussions by performing PSCAD
simulation studies for example relays investigated.
Outlines the fault current calculation studies which were conducted. These studies determine
available fault level at all 275 kV and 132 kV transmission lines and busbars, and highlight
relays/locations of potential susceptibility.
Over current relays
Figure 184 illustrates the mechanism by which the operation of over-current relays can be adversely
impacted as system strength declines. It shows that a lower fault current in weak grids, Iw , would result
in a trip delay of tw, relative to faster time delay of tg associated with a stronger power system.
Prolonged fault clearance under weak grid conditions could result in operation of protective relays in

BLACK SYSTEM SOUTH AUSTRALIA 28 SEPTEMBER 2016 – FINAL REPORT
© AEMO 2017 241
non-faulted zones of protection resulting in excessive disconnection of network and generation
elements, or both.
Figure 184 Impact of weak grids on operation of over current relays
Transmission line distance relays
Faults on transmission lines are commonly detected by protective relays, which measure and respond
to one or another form of the ratio of voltage to current. This ratio is impedance, or a component of
impedance. These relays are called ‘distance relays’ because the measured impedance is proportional
to the distance along the line from the relay location to the fault.
A change in the detected impedance is used to determine if a fault has occurred, and also if the fault is
in its zone of protection or is elsewhere on the system. This is accomplished by limiting the operation of
the relay to a certain range of the observed impedance, commonly called ‘reach’. When a fault occurs
within the protected zone of a distance relay, only the faulted transmission line is isolated.
The operating characteristics of these relays are expressed in terms of impedance, or its components,
resistance and reactance. Plotted on a rectangular coordinate system (using resistance, R, as the
abscissa and reactance, X, as the ordinate), the characteristics usually form simple geometric figures.
As an example, the black and red lines in Figure 185 show the characteristics of a commonly used
distance relay with two zones of protection.
Distance relays often employ a ‘directional’ element to determine whether each end of the line sees the
fault as forward or reverse depending on the function of current flow. This scheme requires information
on currents and voltages at both ends of the line. They often use both phase-distance and
ground-distance elements, and operate on measurements of zero- and negative-sequence
components.
To ascertain the security of distance relays, modern relays are often equipped with an over current
pick, whereby current measurements lower than a pre-determined threshold does not result in
relay operation.
Correct operation of the distance relay would therefore require meeting all three criteria of (i) impedance
reach, (ii) fault direction, and (iii) current pick-up (relay operation would be blocked if any of these
criteria is not met).
As an example, Figure 185 to Figure 187 demonstrate the impact of system strength on each of these
three criteria for a two-phase-to-ground fault.
Impedance reach: System impedance trajectory during fault conditions enters one or both zones
of protection (see Figure 185). As an example, Figure 185 shows the ground impedance trajectory
for weak and strong network conditions. It can be seen that the end of point of impedance

BLACK SYSTEM SOUTH AUSTRALIA 28 SEPTEMBER 2016 – FINAL REPORT
© AEMO 2017 242
trajectory is located at two different points for weak and strong network conditions. In this case,
study fault location is set to 60% of the line distance and Zone 1 reach is set to 80%. Closer
inspection reveals that the end point of impedance trajectory in the weak grid exceeds the Zone 1
reach, hence the relay will see the fault in Zone 2 rather Zone 1.
Fault direction: The distance relay directional logic is configured for forward faults in the
simulation case studies conducted. This implies that the directional component should give logic
“1” for forward faults and logic “0” for reverse faults. Therefore, if the relay identifies a fault as a
reverse fault (logic 0), it should block operation for that particular fault. Figure 186 shows when
operating in strong grid conditions the correct forward fault direction is detected by the relay.
However, weak grid conditions give rise to incorrect reverse fault direction for which relay
operation is blocked.
Current pick-up: Current measured by the relay should exceed the pre-determined threshold to
ascertain correct operation. Figure 187 indicates operation in a strong network causes the fault
current to exceed the threshold. However, operation of the distance relay would be blocked in a
weak grid, due to the lack of fault current and inability of the distance relay to detect the fault.
Figure 185 Impact of system strength on impedance trajectory seen by the distance relay during fault
conditions
(a) Strong grid (b) weak grid
Figure 186 Impact of system strength on fault direction seen by the distance relay
(b) Strong grid (b) weak grid

BLACK SYSTEM SOUTH AUSTRALIA 28 SEPTEMBER 2016 – FINAL REPORT
© AEMO 2017 243
Figure 187 Impact of system strength on current level seen by the distance relay
(a) Strong grid (b) weak grid
Fault current calculations
Power system studies were carried out to investigate the impact on the performance of transmission
system relays of various generation dispatch scenarios in SA, with and without the Heywood
Interconnector.
The following four generation dispatch scenarios have been investigated:
Scenario 1: Two Torrens Island B generating units.
Scenario 2: Two Torrens Island B generating units, Heywood Interconnector out of service.
Scenario 3: Three Torrens Island B generating units, and two Pelican Point CCGT units.
Scenario 4: Three Torrens Island B generating units, and two Pelican Point CCGT units, Heywood
Interconnector out of service.
Figure 188 shows that when the Heywood Interconnector is in service, and with dispatch of five large
synchronous generators, 95% of the SA transmission lines would be operating with fault currents
greater than 1 pu (winter rating of the lines is considered as the base for per-unitisation).
The following types of transmission system protective relays require a minimum fault current for
satisfactory operation138F
139:
Distance protection with over current security function, as described earlier in Appendix X.3.4.
Busbar protection.
The likelihood of satisfactory operation decreases dramatically where the available fault current drops
below 1 pu.
This analysis indicates that with SA islanded, even with three TIPS B and Pelican Point CCGT on-line,
there might be a risk to power system security due to potential cascaded tripping, as well as concerns
on public safety due to potentially uncleared faults, if the risk is not appropriately mitigated.
Figure 188 also shows that the number of on-line synchronous generators has a marginal impact on the
results. This is because the relays with most susceptibility are located in remote areas, and far from the
metropolitan region where all the studied synchronous generators are located.
These calculations indicate that with the loss of the Heywood Interconnector there is at least 10%
likelihood of an unexpected response of protective relays that could result in cascaded tripping across
the system. During islanding conditions, the number of synchronous machines on-line would have a
marginal impact on the available fault currents.
AEMO is working with ElectraNet to determine:
The precise over current settings of transmission system relays in locations identified as being
potentially susceptible.
139 This infers that the relay operates where it should and does not operate where it should not.

BLACK SYSTEM SOUTH AUSTRALIA 28 SEPTEMBER 2016 – FINAL REPORT
© AEMO 2017 244
The extent to which relay settings can be changed without compromising any other aspects of
relay performance.
AEMO will conduct further power system studies to determine the extent of residual risk.
Figure 188 Normalised fault currents across SA tranmission lines
X.4 Assessment of the need for changes in technical performance requirements
X.4.1 Ability to ride through sufficient number of voltage disturbances in quick succession
AEMO concludes that the cause of the six voltage disturbances on 28 September 2016 was a
non-credible contingency event.
In relation to generator performance standards, however, it is irrelevant whether the event – or the
resulting number of faults – were credible or not.
The performance standards applicable to generation in the NEM are developed between the Generator,
the connecting NSP, and, in certain circumstances, AEMO.
Schedule 5.2 of the NER contains the criteria used to derive those performance standards. At a high
level, Schedule 5.2 details a number of capabilities that generating units and generating systems must
demonstrate to effect connection to the network.
There are three levels of capability on which a Generator may seek connection, and they are referred to
as ‘access standards’:
Automatic access standards.
Minimum access standards.
Negotiated access standards.

BLACK SYSTEM SOUTH AUSTRALIA 28 SEPTEMBER 2016 – FINAL REPORT
© AEMO 2017 245
Once they are agreed between all parties, these become the performance standards to which a
generating system (or individual generating units, as applicable) must adhere.
Only a few of these performance standards are relevant to the fault ride-through capability.
It is acknowledged that the interpretation of clause S5.2.5.4 in relation to multiple successive voltage
disturbances is uncertain, and more problematic in light of the physical operational response of
inverter-connected technology compared with thermal synchronous generation.
The performance standard is silent on how many successive disturbances must be ridden through, or
how much time can be allowed between each disturbance while maintaining the ride-through capability.
Clause S5.2.5.8 (d) of the NER requires that the conditions be specified for which a generating system
or generating unit must trip and must not trip. Inclusion of any limitation to withstand numerous
successive disturbance could be included here.
X.4.2 Reactive current injection during voltage disturbances
Introduction
Close inspection of measured responses of wind farms during the Black System, presented in Appendix
I.1, indicates unexpected reactive power responses for the following wind farms during fault conditions:
Hornsdale.
North Brown Hill and The Bluff.
Typical behaviour of a synchronous generator is that a voltage dip will result in active power reduction,
however, reactive power increases to support the voltage during a fault. This is specifically addressed
by the automatic access standard in clause S5.2.5.5 (b)(2)(i), which effectively requires capacitive
current (reactive power) injection during the fault.
This is not required for either the minimum or negotiated access standard, and a requirement is not
specified in the performance standards of the wind farms of concern.
Several international Grid Codes 139F
140 have specific requirements on the reactive power response of
non-synchronous generation during and after the faults that require the generating system to inject
reactive current into the grid during the fault, irrespective of the control mode in which it was operating
before the fault. These requirements also apply to the rise time and response time for the reactive
current injection that prevents significant variations in reactive power several hundred milliseconds after
the fault.
The performance standards only specify the requirement as for “continuous uninterrupted operation for
an event”. The definition of continuous uninterrupted operation in the NER, together with the negotiated
access standard in clause S5.2.5.5, imply that the only requirement during an event is for the
generating system/unit to not disconnect.
Hornsdale Wind Farm
Figure 189 shows that Hornsdale started to absorb reactive power in response to the fault that occurred
at 16:18:13.9 on 28 September 2016.
This cannot be attributed to the reverse polarity of current measurements, as the wind farm provided
positive and expected reactive current injection for the faults before and after. Comparison of the
response of Hornsdale and Snowtown 2 Wind Farms, based on their very similar wind turbine types,
indicates positive contribution of the latter wind farm to the same fault. This is despite the fact the
connection point voltage at Hornsdale dropped approximately 15% more than that of Snowtown 2.
The size of reactive current injection during fault conditions is a function of the voltage drop at the wind
turbine terminals. The larger the voltage drop, the higher the reactive current injection will be, until it
reaches its maximum reactive current injection of approximately 1 pu. With this in mind, a larger
reactive injection was expected from Hornsdale for the fault that occurred in 16:18:13.9.
140 Including Danish, German, and Spanish Grid Codes.

BLACK SYSTEM SOUTH AUSTRALIA 28 SEPTEMBER 2016 – FINAL REPORT
© AEMO 2017 246
Figure 189 Comparison of reactive power responses at Snowtown 2 and Hornsdale Wind Farms
North Brown Hill and The Bluff Wind Farms
Figure 190 presents a comparison of measured reactive power responses at the connection points of
Hallett, Hallett Hill, North Brown Hill, and The Bluff.
This indicates that immediately after the fault clearance at 16:18:08.9, North Brown Hill started to
consume reactive power from the network with a peak value of -50 MVAr. It also exhibited significant
variations in the reactive power for approximately 500 ms after the fault clearance.
Closer inspection of this response reveals that the dynamic reactive support plant for North Brown Hill
were measuring currents with the reverse polarity, as shown in Figure 191.
Note that the actual dynamic reactive support plant were injecting reactive power into the network. The
Generator has confirmed that the reverse polarity has been rectified since then.
The negated response of these devices is also shown in Figure 191. The reactive power consumption
immediately after the fault cannot, therefore, be attributed to the response of dynamic reactive
support plant.

BLACK SYSTEM SOUTH AUSTRALIA 28 SEPTEMBER 2016 – FINAL REPORT
© AEMO 2017 247
Figure 190 Comparison of reactive power responses at the connection point of the Hallett, Hallett Hill,
North Brown Hill, and The Bluff wind farms
Figure 191 Comparison of reactive power responses at the connection point and that provided by the
dynamic reactive support plant
In addition to North Brown Hill, excessive reactive power variations are visible at The Bluff. While the
magnitude of these variations is smaller than those of the North Brown Hill, it constitutes a larger
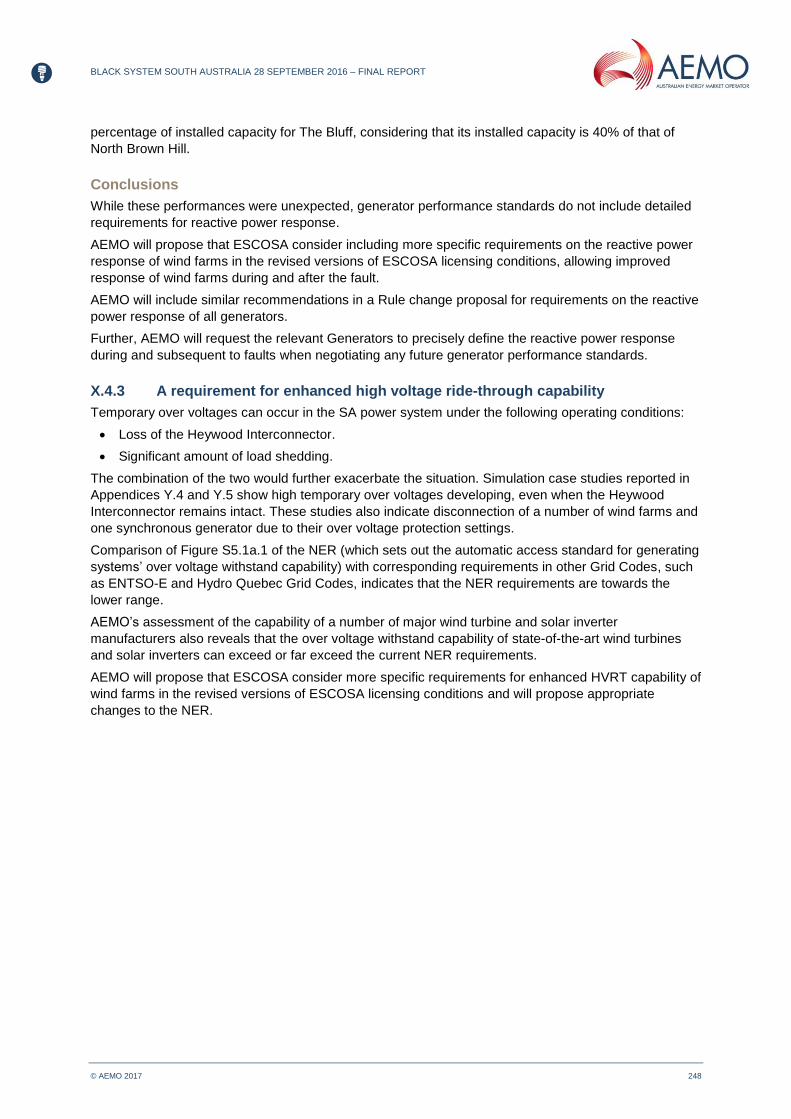
BLACK SYSTEM SOUTH AUSTRALIA 28 SEPTEMBER 2016 – FINAL REPORT
© AEMO 2017 248
percentage of installed capacity for The Bluff, considering that its installed capacity is 40% of that of
North Brown Hill.
Conclusions
While these performances were unexpected, generator performance standards do not include detailed
requirements for reactive power response.
AEMO will propose that ESCOSA consider including more specific requirements on the reactive power
response of wind farms in the revised versions of ESCOSA licensing conditions, allowing improved
response of wind farms during and after the fault.
AEMO will include similar recommendations in a Rule change proposal for requirements on the reactive
power response of all generators.
Further, AEMO will request the relevant Generators to precisely define the reactive power response
during and subsequent to faults when negotiating any future generator performance standards.
X.4.3 A requirement for enhanced high voltage ride-through capability
Temporary over voltages can occur in the SA power system under the following operating conditions:
Loss of the Heywood Interconnector.
Significant amount of load shedding.
The combination of the two would further exacerbate the situation. Simulation case studies reported in
Appendices Y.4 and Y.5 show high temporary over voltages developing, even when the Heywood
Interconnector remains intact. These studies also indicate disconnection of a number of wind farms and
one synchronous generator due to their over voltage protection settings.
Comparison of Figure S5.1a.1 of the NER (which sets out the automatic access standard for generating
systems’ over voltage withstand capability) with corresponding requirements in other Grid Codes, such
as ENTSO-E and Hydro Quebec Grid Codes, indicates that the NER requirements are towards the
lower range.
AEMO’s assessment of the capability of a number of major wind turbine and solar inverter
manufacturers also reveals that the over voltage withstand capability of state-of-the-art wind turbines
and solar inverters can exceed or far exceed the current NER requirements.
AEMO will propose that ESCOSA consider more specific requirements for enhanced HVRT capability of
wind farms in the revised versions of ESCOSA licensing conditions and will propose appropriate
changes to the NER.

BLACK SYSTEM SOUTH AUSTRALIA 28 SEPTEMBER 2016 – FINAL REPORT
© AEMO 2017 249
APPENDIX Y. INVESTIGATIONS OF CONTROL AND
PROTECTION SCHEMES
This Appendix has been added to this final report.
Y.1 Introduction Appendix Y investigates the feasibility of a number of additional control and protection schemes, not
currently in place in the SA power system, to assist in maintaining the integrity of the Heywood
Interconnector in response to major loss of generation events in the SA.
When considering the operation of loss of synchronism protection at the Heywood Interconnector, the
following factors must be considered:
It is the rate of change of impedance that predominantly determines whether the loss of
synchronism relay operates. A fast rate of change of impedance implies fast increase in
Interconnector’s active power flow at the same time as a rapid decline in the SESS voltage.
Increase in Heywood Interconnector flow alone, due to non-credible loss of generation in SA, does
not result in angular instability and loss of synchronism so long as voltages are maintained across
the system, and most importantly at the SESS. The dynamic voltage decline is not the cause of
angular instability and system separation, however it plays a part in determining system stability.
Events resulting in slow changes in the currents and voltages as seen by the Heywood
Interconnector are less likely to drive the impedance trajectory to enter the loss of synchronism
relay characteristic area. Such events may include localised generation reduction/disconnection,
for example, the event which occurred on 3 March 2017, which resulted in loss of three TIPS B
and Pelican Point units.
These points are corroborated by Figure 192, which shows the Heywood Interconnector’s active power
flow and voltage for the 3 March 2017 event, based on SCADA data. This figure highlights a peak
import level of 960 MW across the Heywood Interconnector, which is higher than that for all five
relevant historical system separation events for which the loss of synchronism relay operated.
However, for the 3 March 2017 event, voltages at the South East area momentarily dropped to a
minimum of 0.88 pu and recovered immediately thereafter. The high current by itself could not therefore
result in loss of synchronism.
Figure 193 indicates that the impedance trajectory during this event was far from the relay characteristic
area. The loss of synchronism relay therefore correctly blocked operation for this stable power swing.
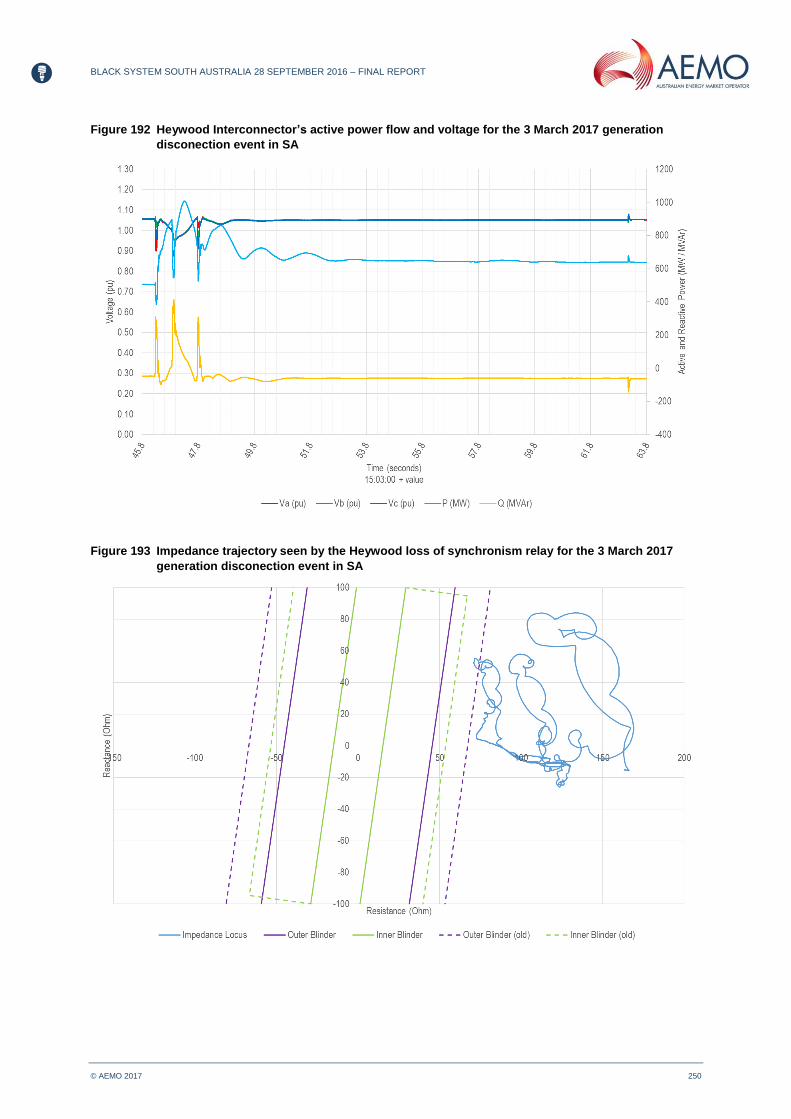
BLACK SYSTEM SOUTH AUSTRALIA 28 SEPTEMBER 2016 – FINAL REPORT
© AEMO 2017 250
Figure 192 Heywood Interconnector’s active power flow and voltage for the 3 March 2017 generation
disconection event in SA
Figure 193 Impedance trajectory seen by the Heywood loss of synchronism relay for the 3 March 2017
generation disconection event in SA

BLACK SYSTEM SOUTH AUSTRALIA 28 SEPTEMBER 2016 – FINAL REPORT
© AEMO 2017 251
Y.2 Factors that need to be considered when designing a load shedding scheme
Y.2.1 Supply demand balance management
SA power system stability, following loss of the Heywood Interconnector, is currently managed by the
conventional UFLS scheme.
However, it is becoming increasingly foreseeable that the UFLS scheme will not work for non-credible
loss of generation events, such as the event on 28 September 2016. It did not work on that occasion
because the frequency did not drop sufficiently to activate the conventional UFLS scheme prior to the
system separation. This is expected to be the case for any potential future separation events, because
the rest of the NEM will maintain the system frequency, including that measured in SA.
Any enhanced load shedding scheme would therefore need to act on network parameters which reflect
the state of the ‘health’ of the power system more quickly than the system frequency, and initiate as
soon as conditions indicating near instability are detected.
This is addressed in Appendix Y.3 to Y.5, which consider the feasibility and effectiveness of load
shedding based on both pre-emptive (pre-separation) and post-separation SPSs, primarily focusing on
stabilising the system following the rapid loss of a significant amount of generation.
AEMO notes that if an SPS with faster speed of response and larger amount of load shed is unable to
stabilise the system, any enhancements that could be achieved within the limits of conventional UFLS
scheme (in terms of larger allocation of load blocks, or faster speed of response) would not provide any
tangible value.
It is important to recognise that the issue of supply demand balance management cannot be considered
in isolation. Any solutions to arrest the frequency following system separation would need to account for
the severity of temporary over voltages and the adequacy of system strength, as discussed below.
Y.2.2 Temporary over voltages following system separation
All five relevant historical SA separation events resulted in over voltages of up to 1.2 pu immediately
after the islanding, which lasted for several seconds (see Appendix K).
When designing a load shedding scheme, whether it is based on UFLS or SPS, there is a trade-off
between the amount of load shed, and the level of resulting over voltages.
This is because the majority of loads comprise both active and reactive components. Load shedding
would therefore result in the reactive power demand falling below the reactive power generation, which
causes temporary over voltages.
The three critical factors that need to be considered when assessing temporary over voltages include:
Over voltage withstand capability of wind farms and synchronous generators.
Time delays for connection of out-of-service shunt reactors and disconnection of in-service shunt
capacitors. These time delays are generally in the order of 5–10 seconds. Smaller time delays (in
the range of a few hundred ms) have been discussed in technical literature to assist in the
formation of viable islands as part of SPSs.140F
141
Any instantaneous/fast over voltage protection in the transmission or distribution network with time
delays less than 1 second.
Series capacitors at Black Range Terminal Station are bypassed following system separation, and
would not therefore need to be considered as part of the management of temporary over voltages
following system separation.
141 See references in Appendix Y.4.1.

BLACK SYSTEM SOUTH AUSTRALIA 28 SEPTEMBER 2016 – FINAL REPORT
© AEMO 2017 252
Y.2.3 Adequacy of system strength
The significance of maintaining system strength in the SA power system, particularly under islanding
conditions, was discussed in X.3. The SCR/WSCR calculations presented in Table 28 indicate the
susceptibility of a number of wind farms following loss of the Heywood Interconnector.
Time-domain studied discussed in Appendices Y.4 and Y.5 confirm a higher possibility of disconnection
for wind farms with low SCR following islanding. Disconnection of a number of wind farms due to rapidly
changing voltages across the SA power system immediately after system separation could invalidate
the supply-demand balance achieved through a load shedding scheme.
Y.3 General requirements for special protection scheme
Table 30 presents a number of possible SPSs that can assist in stabilising the SA power system for SA
import conditions and the loss of several hundred MW of wind generation. ‘Traffic-light’ colour coding is
used to show the contribution of each potential solution to:
Avoiding system separation following major loss of generation in SA.
Ensuring the formation of a viable and stable island following separation.
The ‘traffic-light’ colour coding can be interpreted as:
Green: High contribution.
Yellow: Potential contribution.
Red: Unlikely contribution.
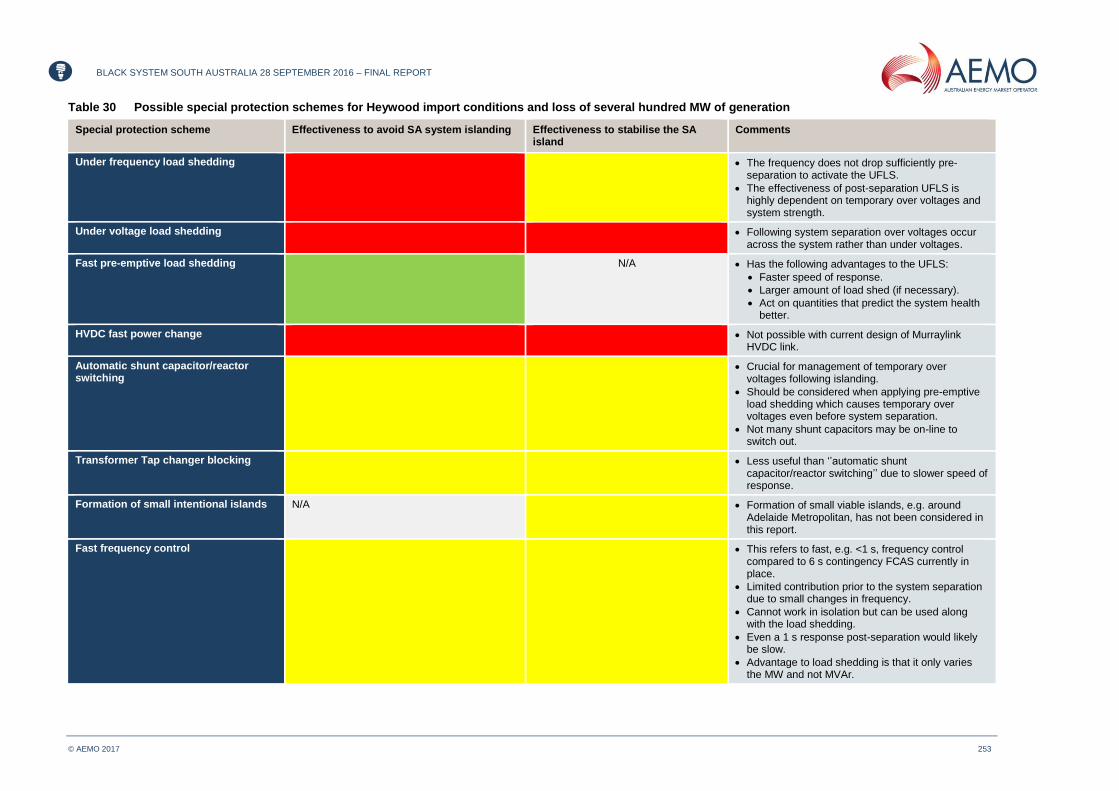
BLACK SYSTEM SOUTH AUSTRALIA 28 SEPTEMBER 2016 – FINAL REPORT
© AEMO 2017 253
Table 30 Possible special protection schemes for Heywood import conditions and loss of several hundred MW of generation
Special protection scheme Effectiveness to avoid SA system islanding Effectiveness to stabilise the SA island
Comments
Under frequency load shedding The frequency does not drop sufficiently pre-separation to activate the UFLS.
The effectiveness of post-separation UFLS is highly dependent on temporary over voltages and system strength.
Under voltage load shedding Following system separation over voltages occur across the system rather than under voltages.
Fast pre-emptive load shedding N/A Has the following advantages to the UFLS:
Faster speed of response.
Larger amount of load shed (if necessary).
Act on quantities that predict the system health better.
HVDC fast power change Not possible with current design of Murraylink HVDC link.
Automatic shunt capacitor/reactor switching
Crucial for management of temporary over voltages following islanding.
Should be considered when applying pre-emptive load shedding which causes temporary over voltages even before system separation.
Not many shunt capacitors may be on-line to switch out.
Transformer Tap changer blocking Less useful than ‘’automatic shunt capacitor/reactor switching’’ due to slower speed of response.
Formation of small intentional islands N/A Formation of small viable islands, e.g. around Adelaide Metropolitan, has not been considered in this report.
Fast frequency control This refers to fast, e.g. <1 s, frequency control compared to 6 s contingency FCAS currently in place.
Limited contribution prior to the system separation due to small changes in frequency.
Cannot work in isolation but can be used along with the load shedding.
Even a 1 s response post-separation would likely be slow.
Advantage to load shedding is that it only varies the MW and not MVAr.

BLACK SYSTEM SOUTH AUSTRALIA 28 SEPTEMBER 2016 – FINAL REPORT
© AEMO 2017 254
Y.4 Feasibility of an SPS to prevent system separation
Y.4.1 Introduction
This section discusses the feasibility of a pre-emptive SPS enabled load shedding scheme.
As an example, for demonstrating the effectiveness of the SPS, voltage phase angle is used to initiate
the load shedding. In this example, the load shedding starts to act as soon as the voltage phase angle
difference between the Heywood and Para exceeds 60 degrees.
The load shedding is considered to comprise three stages of 200 MW, each delayed by 100 ms. It is
assumed that the first stage takes effect in 100 ms. Note that the 100 ms action time is towards the high
end of what can be achieved with today’s technology.141 F
142,142F
143 AEMO considered such a fast action time to
understand the maximum contribution of an SPS.
The following sub-sections evaluate the contribution of such an SPS for the generation dispatch,
during the Black System event, and with a higher inertia system with three TIPS B and Pelican Point
CCGT units.
Studies reported in this section demonstrate that an SPS-enabled load shedding is effective in
preventing SA islanding conditions due to non-credible loss of generation, and that the level of load
shedding can be judiciously chosen to avoid temporary over voltages across SA.
Y.4.2 Ability of an SPS to prevent system separation on 28 September 2016
The scenario discussed in this section is a variation of that presented in Appendix W.3.2. It has been
modified so 600 MW of load is shed after the clearance of the six voltage disturbances, and as soon as
the relative voltage phase angle between the Heywood and Para Substations reaches 60 degrees.
This is shown in Figure 194, which highlights the originally unstable voltage phase angles, and the time
at which the three load blocks of 200 MW each were shed as implemented in the simulation model
accounting for the 100 ms delay for each stage.
Over voltages are experienced across the SA power system immediately after the load shedding due to
disconnection of both active and reactive components of the loads. This results in disconnection of the
following generating systems due to their over voltage protection settings 143F
144:
Canunda Wind Farm
Lake Bonney 1, 2, and 3 Wind Farms.
Hallett Wind Farm.
Hallett Hill Wind Farm.
The Bluff Wind Farm.
North Brown Hill Wind Farm.
Ladbroke Grove Power Station.
Most wind turbines associated with the Hallett, Hallett Hill, North Brown Hill, and The Bluff Wind Farms
were already disconnected on other mechanisms (including limited capability to ride-through multiple
faults), and on high wind speed disconnection. Also, all on-line wind turbines at Clements Gap Wind
Farm were disconnected before 16:18:15 and were therefore not on-line after the six voltage
disturbances where the SPS is considered to respond.
142 A. Heniche, I. Kamwa and M. Dobrescu, "Hydro-Québec's defense plan: Present and future," 2013 IEEE Power & Energy Society General
Meeting, Vancouver, BC, 2013, pp. 1-5. 143 J. Sykes, M. Adamiak and G. Brunello, "Implementation and Operational Experience of a Wide Area Special Protection Scheme on the SRP
System", 2006 Power Systems Advanced Metering, Protection, Control, Communication, and Distributed Resources, Clemson, SC, 2006, pp. 145-158.
144 A less aggressive SPS-enabled load shedding, e.g. shedding 200 MW of load, would have reduced the extent of generation disconnection due to temporary over voltages. However, the resulting post-event Heywood Interconnector flow would have been in the range of 900–1,000 MW, which is not considered viable to operate over several minutes.

BLACK SYSTEM SOUTH AUSTRALIA 28 SEPTEMBER 2016 – FINAL REPORT
© AEMO 2017 255
However, the Canunda and Lake Bonney 1, 2, and 3 Wind Farms, and Ladbroke Grove Power Station
were operating at high output power and disconnected due to high temporary over voltages.
The remaining load of approximately 1,200 MW in the SA power system would therefore by supplied by:
Heywood Interconnector.144F
145
Murraylink HVDC link.
TIPS B1, B3, and B4.
Waterloo Wind Farm.
Figure 195 indicates a transient peak of approximately 1,100 MVA on the Heywood Interconnector,
which is well within the 15-minute short-term rating of approximately 1,500 MVA for the two circuits.
Figure 196, Figure 197, Figure 198, and Figure 199 indicates the stable response of the SA power
system, and that the impedance trajectory would not have entered the loss of synchronism operating
area. Note that Figure 196 is based on the loss of synchronism relay characteristic which was in service
at the time of the Black System. The new loss of synchronism relay currently in service has a narrower
characteristic around the R-axis compared to the previous relay settings.
PSS/E simulation studies
Figure 194 Voltage phase angles relative to HYTS at key SA 275 kV substations without SPS
145 Note that Heywood interconnector would be initially operating above its secure limit, and dispatch of further generation would be required to
return the flow to its secure limit within 30 minutes.

BLACK SYSTEM SOUTH AUSTRALIA 28 SEPTEMBER 2016 – FINAL REPORT
© AEMO 2017 256
Figure 195 Active and reactive power transfer at Heywood Interconnector with SPS
Figure 196 Simulated impedance trajectory at Heywood Interconnector with SPS against relay
characteristic area

BLACK SYSTEM SOUTH AUSTRALIA 28 SEPTEMBER 2016 – FINAL REPORT
© AEMO 2017 257
Figure 197 Voltage magnitudes at key SA 275 kV substations with SPS
Figure 198 Voltage phase angles relative to HYTS at key SA 275 kV substations

BLACK SYSTEM SOUTH AUSTRALIA 28 SEPTEMBER 2016 – FINAL REPORT
© AEMO 2017 258
Figure 199 Frequencies at key SA 275 kV substations
Y.4.3 Feasibility of an SPS to prevent system separation for the future events
The operating conditions investigated in this Appendix are the same as those presented in Appendix
X.1.2 for the 680 MW Heywood Interconnector import level.
This scenario was shown to cause loss of synchronism and islanding conditions.
Figure 200 to Figure 204 highlight that fast disconnection of 600 MW of load allows the integrity of
Heywood Interconnector to be preserved, and results in stable responses across the SA power system.
The following generating systems are disconnected due to over voltage protection:
Cathedral Rocks Wind Farm.
The Bluff Wind Farm.
Prior to this, Snowtown 2 Wind Farm is disconnected due to a fault at its connection point, and Mt Millar
Wind Farm undergoes zero power mode of operation. Heywood Interconnector flow would therefore
decrease by 160 MW following completion of 600 MW load shedding.
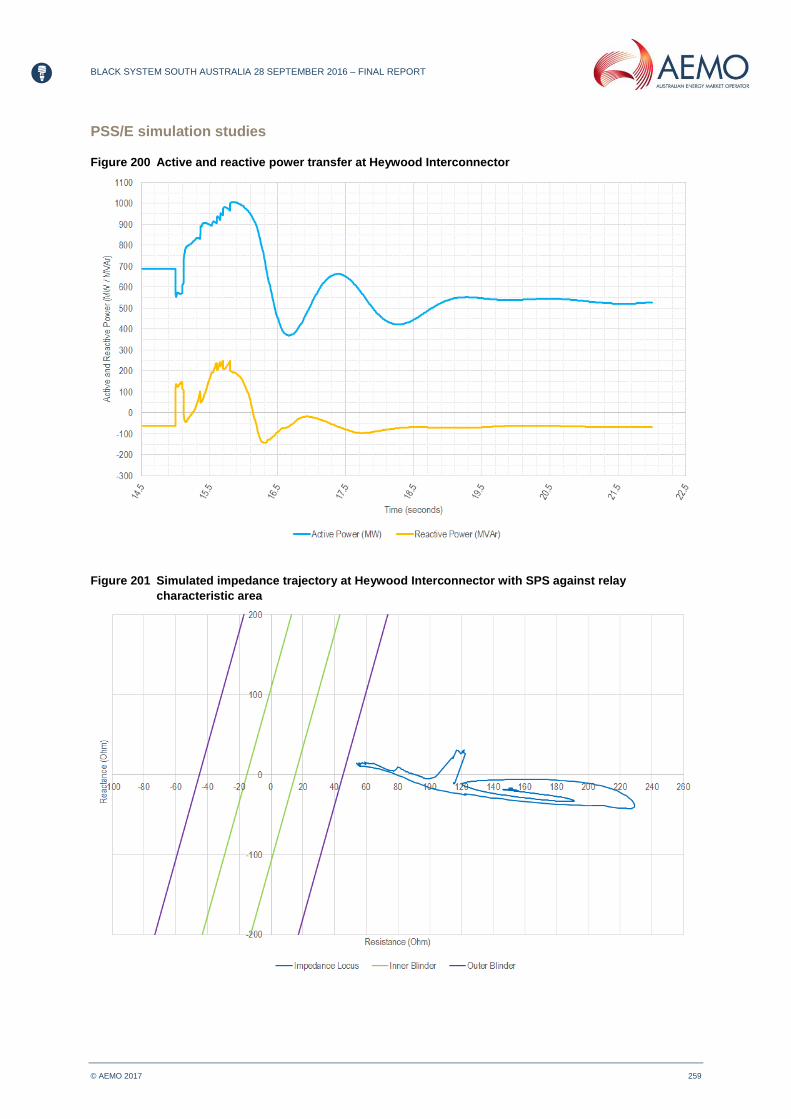
BLACK SYSTEM SOUTH AUSTRALIA 28 SEPTEMBER 2016 – FINAL REPORT
© AEMO 2017 259
PSS/E simulation studies
Figure 200 Active and reactive power transfer at Heywood Interconnector
Figure 201 Simulated impedance trajectory at Heywood Interconnector with SPS against relay
characteristic area

BLACK SYSTEM SOUTH AUSTRALIA 28 SEPTEMBER 2016 – FINAL REPORT
© AEMO 2017 260
Figure 202 Voltage magnitudes at key SA 275 kV substations
Figure 203 Voltage phase angles relative to HYTS at key SA 275 kV substations

BLACK SYSTEM SOUTH AUSTRALIA 28 SEPTEMBER 2016 – FINAL REPORT
© AEMO 2017 261
Figure 204 Frequencies at key SA 275 kV substations
Y.5 Feasibility of an SPS to ensure formation of a successful island
This Appendix investigates the effectiveness of an SPS-enabled fast load shedding that starts actioning
after system separation, addressing:
The feasibility of an SPS helping to form a successful island on 28 September 2016.
The feasibility of an SPS helping to form a successful island in future events.
The SPS aims at compensating for the lost MW infeed as fast as possible, rather than waiting for the
falling frequency to trigger smaller load blocks as pertains to the conventional UFLS scheme.
PSS/E simulation studies were attempted first. However, meaningful and stable responses could not be
obtained, due to the instability of the simulation tool when analysing extreme operating conditions with
the voltages and frequencies declining rapidly in the islanded SA power system. For this reason,
simulation studies presented in this Appendix are obtained from the PSCAD simulation tool.
Note that a larger amount of load needs to be shed compared to the pre-emptive load shedding, to
compensate for the lost Heywood Interconnector infeed. For this reason, three load blocks of 300 MW
are disconnected, each delayed by 100 ms with respect to one another.
PSCAD simulation results presented in Figure 205 to Figure 210 show that a viable island cannot be
formed following islanding conditions, even with three TIPS B and Pelican Point CCGT units on-line.
The key determining factor in stability of the islanded SA system is temporary over voltages beyond the
over voltage protection settings of the several generating systems.
No attempt was made to shed more than 900 MW of load, as this would have further exacerbated the
over voltages experienced. Conversely, a less aggressive load shedding resulting in disconnection of
smaller amount of loads would not have allowed the fall in frequency to be arrested above 47 Hz.
Fast disconnection of shunt capacitor banks immediately after islanding conditions could have assisted
in mitigating the temporary over voltages. However, most of the seven 275 kV connected 100 MVAr
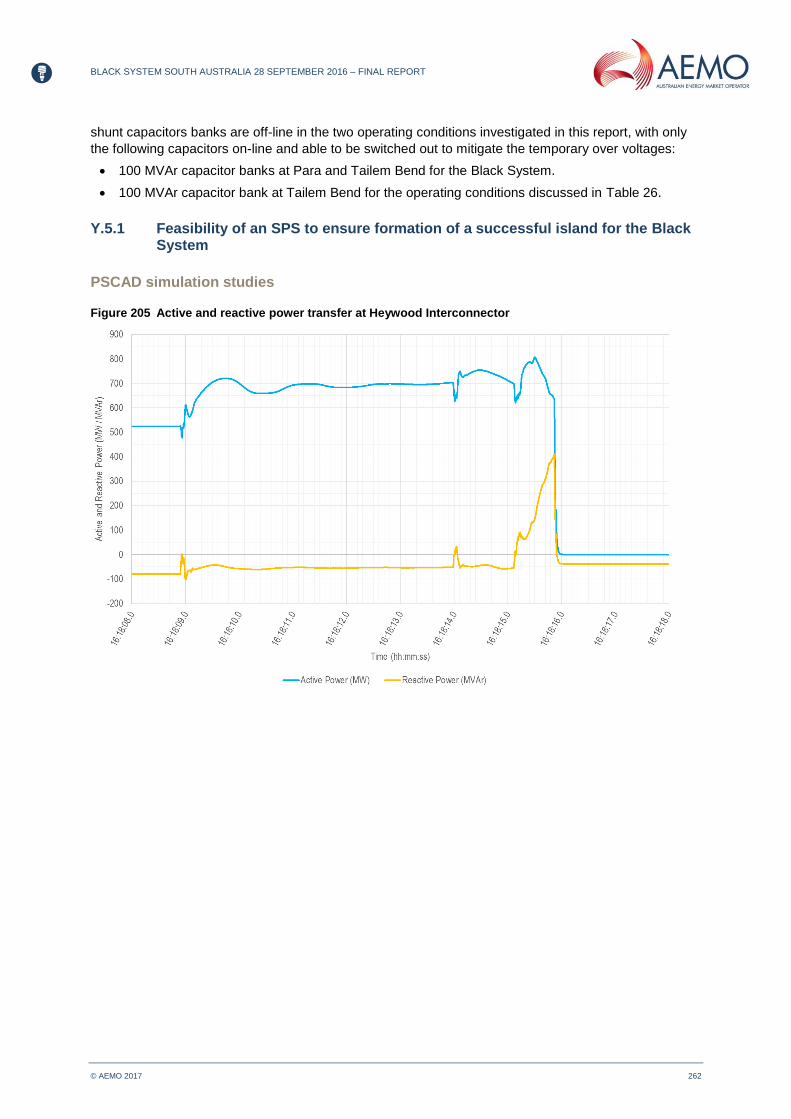
BLACK SYSTEM SOUTH AUSTRALIA 28 SEPTEMBER 2016 – FINAL REPORT
© AEMO 2017 262
shunt capacitors banks are off-line in the two operating conditions investigated in this report, with only
the following capacitors on-line and able to be switched out to mitigate the temporary over voltages:
100 MVAr capacitor banks at Para and Tailem Bend for the Black System.
100 MVAr capacitor bank at Tailem Bend for the operating conditions discussed in Table 26.
Y.5.1 Feasibility of an SPS to ensure formation of a successful island for the Black System
PSCAD simulation studies
Figure 205 Active and reactive power transfer at Heywood Interconnector

BLACK SYSTEM SOUTH AUSTRALIA 28 SEPTEMBER 2016 – FINAL REPORT
© AEMO 2017 263
Figure 206 Simulated impedance trajectory at Heywood Interconnector against relay characteristic area
Figure 207 Voltage magnitudes at key SA 275 kV substations

BLACK SYSTEM SOUTH AUSTRALIA 28 SEPTEMBER 2016 – FINAL REPORT
© AEMO 2017 264
Figure 208 Voltage phase angles relative to HYTS at key SA 275 kV substations
Figure 209 Frequencies at key SA 275 kV substations

BLACK SYSTEM SOUTH AUSTRALIA 28 SEPTEMBER 2016 – FINAL REPORT
© AEMO 2017 265
Figure 210 Load shedding profiles
Y.5.2 Feasibility of an SPS to ensure formation of a successful island for future events
PSCAD simulation studies
Figure 211 Active and reactive power transfer at Heywood Interconnector
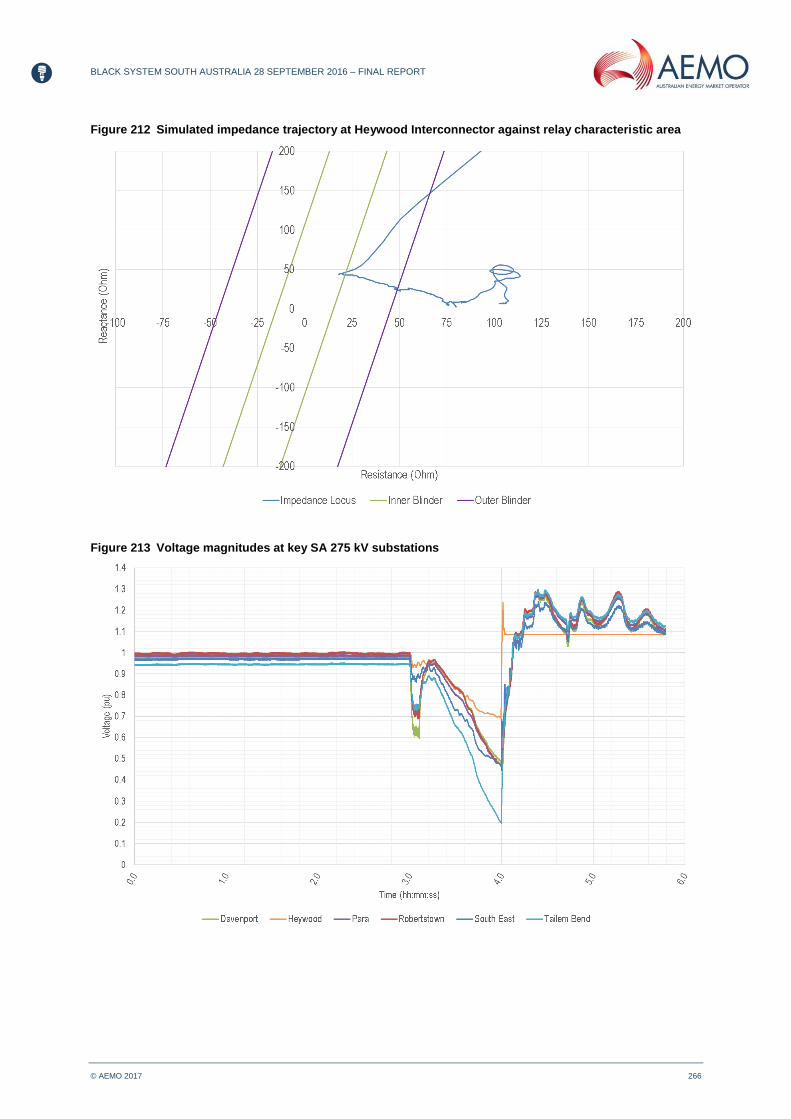
BLACK SYSTEM SOUTH AUSTRALIA 28 SEPTEMBER 2016 – FINAL REPORT
© AEMO 2017 266
Figure 212 Simulated impedance trajectory at Heywood Interconnector against relay characteristic area
Figure 213 Voltage magnitudes at key SA 275 kV substations
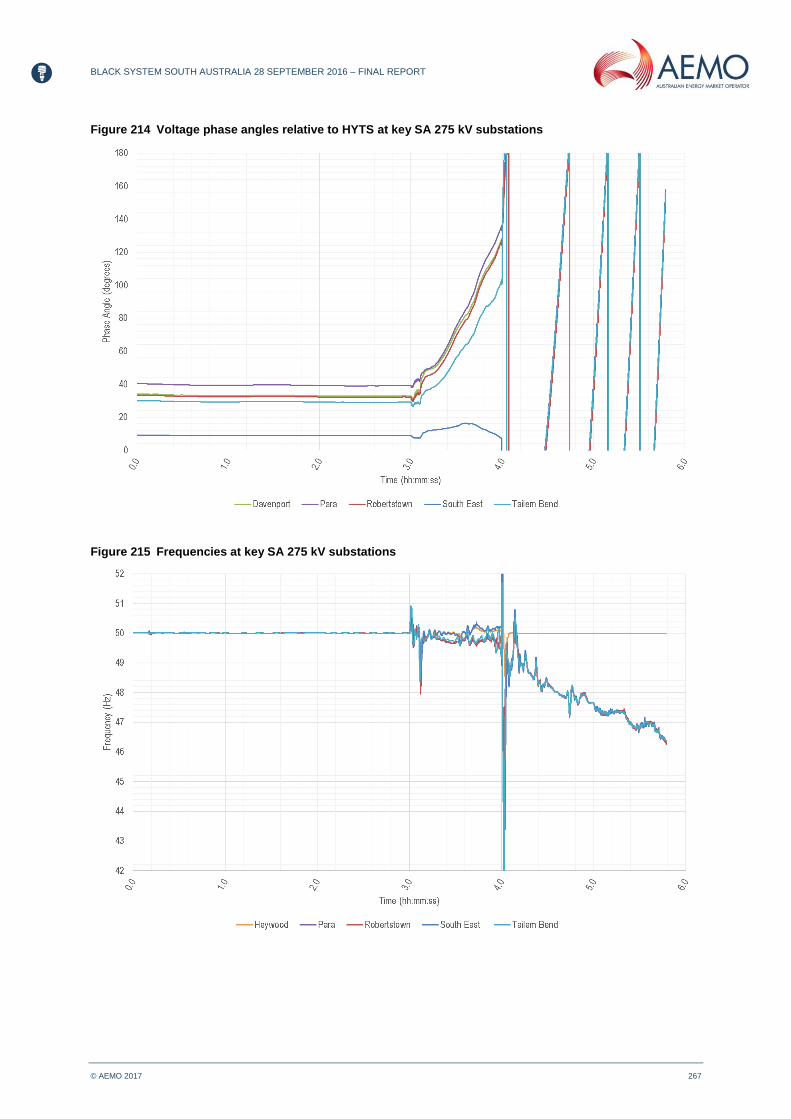
BLACK SYSTEM SOUTH AUSTRALIA 28 SEPTEMBER 2016 – FINAL REPORT
© AEMO 2017 267
Figure 214 Voltage phase angles relative to HYTS at key SA 275 kV substations
Figure 215 Frequencies at key SA 275 kV substations

BLACK SYSTEM SOUTH AUSTRALIA 28 SEPTEMBER 2016 – FINAL REPORT
© AEMO 2017 268
Y.6 Adequacy of conventional load shedding schemes Simulation case studies presented in Appendix Y.5.1 and Y.5.2 indicate that SPS-enabled load
shedding with faster speed of response, and a larger amount of load shed, is unable to form a stable
island even with dispatch scenarios corresponding to the 3 Hz/s RoCoF constraint.
A more aggressive UFLS scheme would not increase the likelihood of forming a viable island, as it
would increase the risk of generator disconnection due to increased temporary over voltages.
Additionally, the system frequency will not drop sufficiently prior to the system separation. A
pre-emptive load shedding based on a conventional UFLS scheme is not, therefore, expected to
provide significant contribution in preventing islanding conditions in response to events resulting in
major loss of generation in the SA.
For these reasons, no simulation studies are presented for the conventional UFLS scheme.
Y.7 Possibility of improvements to response of impedance based relays
Y.7.1 Failure mechanism
Lack of power swing blocking feature
Of ten protection relays that operated at one end of the 275 kV and 132 kV lines (discussed in Section
3.3.3), only the Tailem Bend–Keith 132 kV and Templers–Waterloo 132 kV disconnections are
considered to be related to the initial power swing associated with the network conditions on
28 September 2016, which resulted in the loss of synchronism protection tripping at SESS.
Initiation of all other eight distance relays that operated during the Black System commenced after the
system separation whose operation mechanism is discussed in this sub-section.
The loss of synchronism phenomenon is generally accompanied by low voltages and high currents in
the system. The transmission system distance protection relays could therefore recognise it as
three-phase faults.
Without activating the power swing blocking (PSB) functions that are generally included within the
distance function in all digital relays, distance protection relays are likely to trip, especially those close
to the electrical centre (the electrical centre of the SA power system is near Tailem Bend Substation).
Zone 1 distance relay elements with no intentional time delay are the distance elements most prone to
operate during a power swing. This could result in cascaded tripping of several transmission lines,
leading to widespread system collapse (as, for example, occurred in the 2003 New York state blackout).
Proper application and setting of the PSB elements would have prevented operation of Zone 1 distance
relays for power swings.
Figure 216 shows how the power swing blocking and load encroachment functions can be coordinated
with the reach of Zone 1 and 2 for distance relays. Such a coordination would avoid operation of
distance relay due to non-faulted power swing events in Zone 1 and 2.
Note that the load encroachment function generally deals with slow developing power swings, and
primarily aims at preventing mal-operation of Zone 3 distance relay.
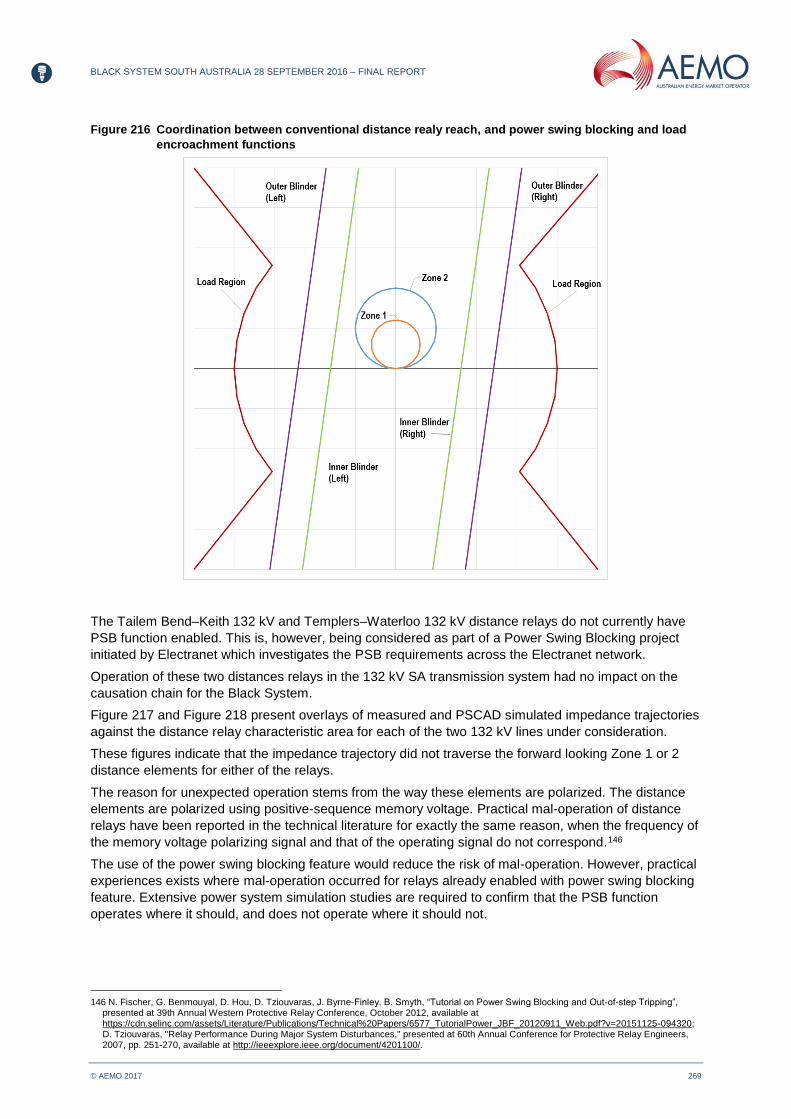
BLACK SYSTEM SOUTH AUSTRALIA 28 SEPTEMBER 2016 – FINAL REPORT
© AEMO 2017 269
Figure 216 Coordination between conventional distance realy reach, and power swing blocking and load
encroachment functions
The Tailem Bend–Keith 132 kV and Templers–Waterloo 132 kV distance relays do not currently have
PSB function enabled. This is, however, being considered as part of a Power Swing Blocking project
initiated by Electranet which investigates the PSB requirements across the Electranet network.
Operation of these two distances relays in the 132 kV SA transmission system had no impact on the
causation chain for the Black System.
Figure 217 and Figure 218 present overlays of measured and PSCAD simulated impedance trajectories
against the distance relay characteristic area for each of the two 132 kV lines under consideration.
These figures indicate that the impedance trajectory did not traverse the forward looking Zone 1 or 2
distance elements for either of the relays.
The reason for unexpected operation stems from the way these elements are polarized. The distance
elements are polarized using positive-sequence memory voltage. Practical mal-operation of distance
relays have been reported in the technical literature for exactly the same reason, when the frequency of
the memory voltage polarizing signal and that of the operating signal do not correspond.145F
146
The use of the power swing blocking feature would reduce the risk of mal-operation. However, practical
experiences exists where mal-operation occurred for relays already enabled with power swing blocking
feature. Extensive power system simulation studies are required to confirm that the PSB function
operates where it should, and does not operate where it should not.
146 N. Fischer, G. Benmouyal, D. Hou, D. Tziouvaras, J. Byrne-Finley, B. Smyth, “Tutorial on Power Swing Blocking and Out-of-step Tripping”,
presented at 39th Annual Western Protective Relay Conference, October 2012, available at https://cdn.selinc.com/assets/Literature/Publications/Technical%20Papers/6577_TutorialPower_JBF_20120911_Web.pdf?v=20151125-094320; D. Tziouvaras, "Relay Performance During Major System Disturbances," presented at 60th Annual Conference for Protective Relay Engineers, 2007, pp. 251-270, available at http://ieeexplore.ieee.org/document/4201100/.
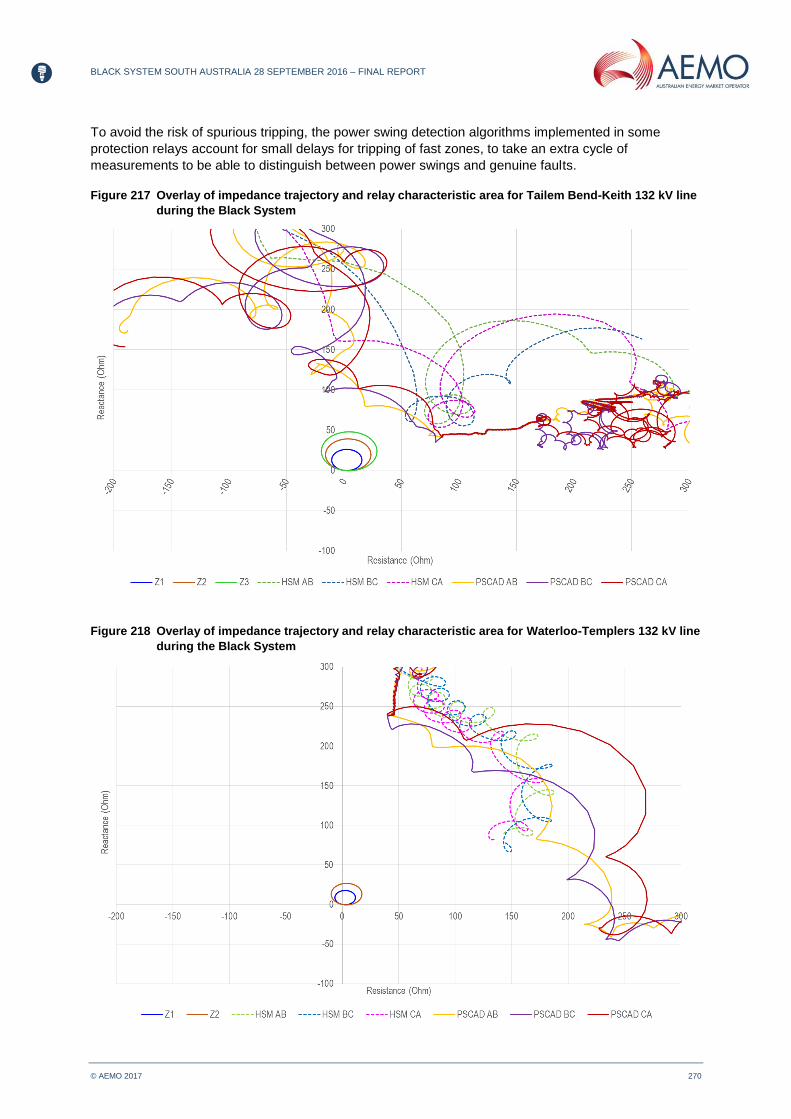
BLACK SYSTEM SOUTH AUSTRALIA 28 SEPTEMBER 2016 – FINAL REPORT
© AEMO 2017 270
To avoid the risk of spurious tripping, the power swing detection algorithms implemented in some
protection relays account for small delays for tripping of fast zones, to take an extra cycle of
measurements to be able to distinguish between power swings and genuine faults.
Figure 217 Overlay of impedance trajectory and relay characteristic area for Tailem Bend-Keith 132 kV line
during the Black System
Figure 218 Overlay of impedance trajectory and relay characteristic area for Waterloo-Templers 132 kV line
during the Black System

BLACK SYSTEM SOUTH AUSTRALIA 28 SEPTEMBER 2016 – FINAL REPORT
© AEMO 2017 271
Extreme under frequency and under voltage conditions
Operation of the other eight relays after system separation on 28 September 2016 can be attributed to
rapidly declining system voltages and frequencies, both of which simultaneously deviated from their
normal steady-state values immediately after the separation with the duration of excursion for some of
the relays persisted significantly longer than that occurring during fault conditions.
All distance relays use a polarizing or memory quantity, which is the reference quantity to determine
whether or not the distance relay should operate. Voltage is generally used as the polarizing quantity.
However, comparator-based mho 146F
147 distance elements require a polarizing quantity to provide a reliable
angle reference, and are therefore also susceptible to large and sustained changes in the frequency.
ElectraNet is currently working with the respective relay vendors to prevent operation of those eight
relays for any potential future system separation events which may result in similarly large and
sustained changes in the voltages and/or frequencies.
Y.7.2 Other points to consider
Power swings are complex events, and dynamic interaction between the primary power system
equipment and protective functions must be accurately accounted for. For this reason correct
distinction between stable and unstable swings can only be practically achieved by detailed power
system modelling and simulation studies. Close collaboration between engineers who perform
power system modelling and simulation, and the protection engineers who implement those
settings, is essential to ensure secure and reliable settings for these relays.
Unlike the USA where the North-American Electric Reliability Corporation (NERC) sets out specific
requirements on the acceptable performance of the distance relays and power swing blocking /
out-of-step tripping functions, Australia does not have overarching rules on the required response
of generator and network protection to power swings. AEMO’s initial assessment indicates that the
power swing blocking function is not widely used in the SA, Victoria, and New South Wales
transmission networks. It is recommended that AEMO, in consultation with TNSPs and
Generators 147F
148, develop requirements for expected performance of power swing blocking for
transmission networks and out-of-step tripping for synchronous generators.
Additionally, a standardised strategy on location and distinction between power swing blocking and
out-of-step tripping functions is necessary. Survey of international practices indicates that the out-
of-step tripping is applied at predefined locations for system separation in case of unstable power
swings, similar to that applied to the Heywood Interconnector, whereas the power swing blocking
function is implemented elsewhere in the transmission system. Note that:
The power swing blocking feature is generally implemented as a supervisory function for
operation of the distance relay. The blocking feature is primarily intended to apply to Zone 1
and in some circumstances for Zone 2 of distance relays.
The out-of-step tripping feature is generally implemented as a standalone relay rather than as a
supervisory element for the distance relays.
While evaluation of relay settings through power system simulation studies will contribute to
developing secure and reliable settings for power swing blocking functions, relays offered by
different vendors have subtle differences and features, not included in the respective simulation
models. Such subtle features can have significant implications in the response of power swing
blocking function. Additional understanding and confidence in relay algorithm and performance can
be gained by lab testing or commissioning testing of the relay using simulated waveforms. In this
case, simulated responses can be injected into the actual relay using a playback method, the
necessary intermediate hardware such as RelaySimTest. The simulated waveforms can be
generated from offline studies based on electromagnetic transient (EMT)-type simulation such as
PSCAD/EMTDC, or from on-line studies using real-time digital simulation (RTDS).
147 The reciprocal of Ohm. 148 The power swing blocking feature only applies to synchronous generators.