Biosfer: Jurnal Pendidikan Biologi
13
10.21009/biosferjpb.v12n2.157-169 Trilipi et al E-ISSN: 2614-3984 157 Biosfer: Jurnal Pendidikan Biologi, 12 (2), 157-169 (2019) Biosfer: Jurnal Pendidikan Biologi Journal homepage: http://journal.unj.ac.id/unj/index.php/biosfer Note-taking roundhouse diagram strategy: improving student retention on body defense system concepts Desi Trilipi 1* , Bambang Subali 1 , Yenny Anwar 2 , Lucia Maria Santoso 2 1 Biology Education, Faculty of Mathematics and Natural Science, Universitas Negeri Yogyakarta, Indonesia 2 Biology Education, Faculty of Teacher Traning and Education, Universitas Sriwijaya, Indonesia * Corresponding author: [email protected] ARTICLE INFO A B S T R A C T Article history Received: 29 August 2019 Revised: 31 October 2019 Accepted: 13 November 2019 Note-taking Roundhouse diagrams strategy is a students' conceptual framework for new notes. This study aims to improve student retention on body defense system material through note-taking roundhouse diagram strategy. The method used was the one-group pretest-posttest design. The sample in this study was taken by simple random sampling technique. The number of samples in this study was 30 students. The instrument used in the study was multiple choice. This research was conducted during six meetings. Three meetings using roundhouse diagram with pretest and posttest. After four weeks, three more meetings were held to collect the second posttest (retest). The data were analyzed by t-test statistical analysis. Based on the results of the t-test statistical analysis at a significant level α = 0.05, it can be seen that t count > t table for short-term retention and long-term retention. The retention category also showed very satisfying results. Average results of N-gain score for short and long-term retention were in excellent category. It can be included, the note-taking roundhouse diagram strategy on the body's defense system concept can improve student retention. Keywords: Body defense systems Note-taking strategy Retention Roundhouse diagram © 2019 Universitas Negeri Jakarta. This is an open-access article under the CC-BY license (https://creativecommons.org/licenses/by/4.0) Suggested Citation. Trilipi, D., Subali, B., Anwar, Y., & Santoso, L. M. (2019). Note-taking roundhouse diagram strategy: improving student retention on body defense system concepts. Biosfer: Jurnal Pendidikan Biologi, 12(2), 157-169. Doi: 10.21009/biosferjpb.v12n2.157-169
-
Upload
khangminh22 -
Category
Documents
-
view
0 -
download
0
Transcript of Biosfer: Jurnal Pendidikan Biologi
10.21009/biosferjpb.v12n2.157-169 Trilipi et al E-ISSN: 2614-3984 157
Biosfer: Jurnal Pendidikan Biologi, 12 (2), 157-169 (2019)
Biosfer: Jurnal Pendidikan Biologi
Journal homepage: http://journal.unj.ac.id/unj/index.php/biosfer
Note-taking roundhouse diagram strategy: improving student
retention on body defense system concepts
Desi Trilipi1*, Bambang Subali1, Yenny Anwar2, Lucia Maria Santoso2
1 Biology Education, Faculty of Mathematics and Natural Science, Universitas Negeri Yogyakarta,
Indonesia 2 Biology Education, Faculty of Teacher Traning and Education, Universitas Sriwijaya, Indonesia
* Corresponding author: [email protected]
ARTICLE INFO A B S T R A C T
Article history
Received: 29 August 2019
Revised: 31 October 2019
Accepted: 13 November 2019
Note-taking Roundhouse diagrams strategy is a students'
conceptual framework for new notes. This study aims to
improve student retention on body defense system material
through note-taking roundhouse diagram strategy. The method
used was the one-group pretest-posttest design. The sample in
this study was taken by simple random sampling technique. The
number of samples in this study was 30 students. The instrument
used in the study was multiple choice. This research was
conducted during six meetings. Three meetings using
roundhouse diagram with pretest and posttest. After four weeks,
three more meetings were held to collect the second posttest
(retest). The data were analyzed by t-test statistical analysis.
Based on the results of the t-test statistical analysis at a
significant level α = 0.05, it can be seen that t count > t table for
short-term retention and long-term retention. The retention
category also showed very satisfying results. Average results of
N-gain score for short and long-term retention were in excellent
category. It can be included, the note-taking roundhouse
diagram strategy on the body's defense system concept can
improve student retention.
Keywords:
Body defense systems
Note-taking strategy
Retention
Roundhouse diagram
© 2019 Universitas Negeri Jakarta. This is an open-access article under the CC-BY license
(https://creativecommons.org/licenses/by/4.0)
Suggested Citation.
Trilipi, D., Subali, B., Anwar, Y., & Santoso, L. M. (2019). Note-taking roundhouse diagram strategy:
improving student retention on body defense system concepts. Biosfer: Jurnal Pendidikan Biologi,
12(2), 157-169. Doi: 10.21009/biosferjpb.v12n2.157-169
10.21009/biosferjpb.v12n2.157-169 Trilipi et al E-ISSN: 2614-3984 158
INTRODUCTION
Learning is a critical process of interaction between teachers and students in a learning
environment (Inah, 2015; Puspita, Kurniawan, & Rahayu, 2017). A Study has a meaning that is an
attempt by someone to obtain a new change in behavior as a whole, as a result of his own experience
in interacting with his environment (Slameto, 2010). The presence of the teacher in the learning
process plays an important role. The teacher is directly involved in the formation and intellectual
development of students (Juhji, 2016; Nurhaidah & Musa, 2016; Warsono, 2017; Dasem, Laka, &
Niwale, 2018; Hasanah, 2019). Therefore, the teacher must have the skills in choosing the right
strategy when delivering material to students, so that the material can be accepted quickly and support
the learning outcomes. In the era of globalization and information, to achieve the desired learning
outcomes, students are required to do the learning process correctly and adequately (Mansyur,
Salahuddin, & Ismail, 2018).
The low students’ learning outcomes can be caused by weak thinking ability and understanding
of concepts. When the demands of learning on material concepts is high, students need an appropriate
specific strategy in building their knowledge (Barlian, 2013; Harjali, 2016; Kusumawati, Sumardi,
2016). Students can readily accept knowledge if it is built in the mind of students themselves as
striving to organize experiences to schemes (Dahar, 2011).
Notes, drawings, and diagrams are examples of visuals that can be used to help students build
schemes. Well-organized notes can be used to show relationships, strengthen information, and
identify lost information (Ward & Lee, 2002). Taking notes in writing is something important,
recording information that is heard and seen while the lesson is taking place, making it easy to
remember about points, concepts, and see the interrelation of both (Dewi & Indrawati, 2014; Cristal,
Sano, & Yusri, 2013).
Taking notes helps students build the knowledge they want to remember. The ability of students
to remember a learning material is called retention. Retention is the ability of students to remember
material that has been taught by the teacher at a particular time. Retention means student can
remember information in a short as well as in a relatively long period. According to Kintsch (1970),
that retention is an embodiment of learning outcomes. This means that when student retention is
excellent, the learning outcomes will also be useful.
Based on the observations of researchers, the activity of taking notes was limited to transferring
writing from textbooks or writing explanations from teachers. Note-taking activities like these tend
to produce notes that are less interesting and make students lazy to read the notes. Some noted
strategies include using mind maps, vee diagrams, fish bones, and roundhouse diagrams. The strategy
of taking notes using a roundhouse diagram is a note-taking strategy that involves the images, colors,
and keywords (Mccartney & Wadsworth, 2012). The persistence of the material learned so that it is
not easy to forget can be done by using keywords. This is because sentences that are strange,
meaningful, or that involve visual elements are the sentences that are easiest to remember (Solso,
Machin, & Maclin, 2007). Images are a way that can also be used to convey what is thought
effectively and can easily be remembered.
When information enters our memory system (from sensory input), it is necessary converted
into a form that can be overcome by the system so that it can be stored. Information can be changed
and coded in three ways, visual or icon, acoustic or sound, and semantic or meaning. Evidence shows
if the principle encoding system in short term memory (STM) is acoustic coding. The principle coding
system in long term memory (LTM) seems to be semantic coding (meaning). However, the
information in LTM can also be coded visually and acoustics. If we cannot remember something,
that is maybe because we cannot remember again. The difference between STM and LTM is
noticeable. STM is stored and retrieved sequentially while LTM is stored and taken by the association
Mcleod (Mcleod, 2007)
This is supported by Reed (2011), who explains that images tend to be easier to remember
compared to words that are concrete, and are usually easily stored in memory compared to abstract
words (Reed, 2011; Khairoh, Rusilowati, & Nurhayati, 2014). Images can also increase imagination,
10.21009/biosferjpb.v12n2.157-169 Trilipi et al E-ISSN: 2614-3984 159
which makes memory performance increase (Ami, Susantini, & Raharjo, 2012). Meanwhile, Hackney
& Ward (2002) explains that students' memories can be strengthened by visual information and
writing in the form of diagrams.
The strategy of note-taking roundhouse diagrams is very suitable for use in biological material
that contains many concepts and is difficult to understand. This is because the placement of
information in the roundhouse diagram can accommodate the ability of the eye and can strengthen
brain processes (Ward &Wandersee, 2002). Biological material that contains many concepts and is
difficult to understand, one of which is the body's defense system material. The body's defense system
material consists of abstract concepts and contains concepts that are very complex so difficult for
students to understand (Alfiraida, 2018). Often students' understanding of this concept is still not
optimal, for example, activities on the human body's defense system are challenging to explore in
detail because there are no direct objects that can be learned — precisely the body's defense response,
such as non-specific response and specific response.
The material of the body's defense system is divided into three scopes, namely the functions
and components of the body's defense system, the response of the body's defense system, also disease
and its prevention in the body's defense system. The purpose of each learning session is dependent
on the learning is given to students during the day. Overall it can be seen and felt that the purpose of
learning is to explain the mechanism of the body's defense system against foreign objects in the form
of antigens and germs because this type of body defense system material makes roundhouse diagrams
very suitable for use. The reason is that the roundhouse diagram can help students to learn complex
concepts and retain that knowledge (Hackney & Ward, 2002).
Several studies report that the application of roundhouse diagrams can improve students'
cognitive and metacognitive abilities, motivation, and learning outcomes (Wibowo, Asri, & Titik,
2012; Rukmana, Suciati, & Indrowati, 2013). However, there are no studies report the effect of
roundhouse diagrams on student retention in learning biology, especially in the body's defense system
concept. There has not been much research on the relationship between retention and the body's
defense system material. However, retention studies have been carried out on other biological
concepts. Lubis & Simatupang (2014) explained that there was an increase of 76,22% of the retention
power of students towards biological concepts through the use of Adobe Flash media in the direct
learning model. However, the use of this media has not been able to facilitate students to build their
knowledge where students determine their images and keywords that they want as a representation
of the concept they want to remember.
This study is critical in answering the problem of students’ retention, which is still low. The
note-taking roundhouse diagram strategy can overcome weak student retention abilities. The note-
taking roundhouse diagram strategy can help students understand the difficult concepts of the body's
defense system. Also, it can make learning more enjoyable.
METHODS
Research Design
The method used in this study is an experimental design. The research design used was the one-
group pretest-posttest design (Sugiyono, 2012). In this research design, there was a pretest before
treatment. Thus the results of the treatment can be more accurate because it can compare the situation
before treatment being given. This study has six meetings. Three meetings using a roundhouse
diagram with a posttest at the end of the lesson and three subsequent meetings doing a retest after
four weeks from the posttest. The research design is described in Table 1.
Table 1
One Group Pretest-Posttest Design
Pretest Treatment Posttest 1 Interval Posttest 2 (Retest) O1 X O2a Four weeks O2b
10.21009/biosferjpb.v12n2.157-169 Trilipi et al E-ISSN: 2614-3984 160
Population and Samples
The population in this study were 61 students, namely all students of class XI IPA in Indralaya
Utara, South Sumatera. The sample selection in this study used the simple random sampling
technique, which is a sampling technique where all individuals in the population have the same
opportunity to be selected as a sample (Sugiyono, 2012). Random sampling is by lottery, which is by
taking an opportunity for each individual to become a sample member. In this study, the class name
was written on paper, then rolled and put into a glass and shook it until one paper came out. The class
name on paper will be the sample class. The sample obtained in this study was class XI IPA, with a
total of 30 students.
Instrument
The instruments used to collect data in this study were written tests. Written tests are used to
obtain data about student retention results. The instrument in this study was named the Human Body
Define Concepts Test (HBDCT). The final test was divided into two, namely the final test on short-
term retention (posttest) and the final test on long-term retention (retest). The final test on short-term
retention (posttest) was done after learning was carried out, and long-term retention (retest) was
carried out four weeks after the posttest. The final test helps researchers to see the use of roundhouse
diagrams on student retention scores. The written test instrument consisted of ten multiple-choice
questions for each meeting. Each question was made of a grid-based on the purpose of learning,
question indicators, and cognitive process level. The instrument was equipped with a grid and test
items arranged by the researcher based on the learning objectives to be achieved in the learning
process. The instrument used in this study was considered as valid and reliable. The validity and
reliability of the instruments in this study were tested using ANATES V4 software. Also, the
instrument was examined by a supervisor.
Procedure
This research was conducted during six meetings for one month. Three meetings using
roundhouse diagram with pretest and posttest. After four weeks, three more meetings were held to
collect the second posttest (retest). The steps of learning during three meetings using roundhouse
diagram were 7 phases (Table 2), and student activities are described in Figure 1.
Table 2
The Steps of Learning Step Description
1 The teacher opens learning by conveying apperception, motivation, learning objectives. After that,
students work on the pre-tests provided.
2 Students pay attention to the teacher's explanation of the material defense system of the human
body.
3 Students are divided into five groups consisting of 6 students.
4 Students discuss with group members and make notes on the roundhouse diagram, with the
following steps.
a. Identify the main topics of the material being studied and understand what information should
be targeted
b. Write the main title by using "dash (-)" and the words "and" for subtitles. The main title and
subtitle are written on the inner circle, which is divided by the S curve. The main headline is
placed centrally, while the subtitle is placed on the edge of the S curve.
c. Write down the objectives to be achieved by making the roundhouse diagram. This goal
provides the focus and direction to be achieved from the concept being studied.
d. Divide the whole concept into seven or five parts. The concept is made into a short question
that contains core ideas.
e. Summarize each concept with complex reminder sentences according to its own words
(paraphrasing) or by keywords. These concepts are then included in the roundhouse diagram.
Placement begins on the during with the 12 o'clock position and moves clockwise.
10.21009/biosferjpb.v12n2.157-169 Trilipi et al E-ISSN: 2614-3984 161
Step Description
f. Create pictures related to reminder sentences. Images (icons) are made to connect one concept
with another concept.
5 The results of the notes on the roundhouse diagrams of each group are posted on the board, so all
students know the work of the other groups.
6 The teacher checks whether there is a wrong concept in the student notes in the roundhouse diagram
of each group.
7 At the end of the learning, students work on the posttest
Figure 1. Note-taking using roundhouse diagram
Data Analysis Techniques
The obtained score to determine student retention is the sum of each student's answer score.
The formulation to determine the initial and final test scores is to compare the obtained scores with
the maximum score multiplied by one hundred.
Final Score = Obtained Score
Maximum Score x100
(Sudijono, 2012)
The acquisition of student learning outcomes after and before using a roundhouse (gain)
diagram is calculated by looking at the difference between the posttest scores and the pretest scores.
After that, the normalized gain was calculated. Its function is to maintain no assumption of the same
acquisition value between two or more students, and learning achievement is still based on the initial
and final test scores for which the assessment standards have been determined.
Normalized Gain =Gain (Posttest Score − Pretest Score)
Ideal Score − Pretest Score
(Hake, 2002)
The percentage of student retention was calculated by comparing the retest score with the
posttest score multiplied by one hundred percent. The retention percentage categories can bee seen
in the following Table 3.
R =Skor Retest
Skor Postestx 100%
(Haibach, Reid, & Collier, 2011)
10.21009/biosferjpb.v12n2.157-169 Trilipi et al E-ISSN: 2614-3984 162
Table 3
The retention percentage categories. Retention (%) Category
80 – 100 Very Good
70 – 79 Good
60 – 69 Sufficient
50 – 59 Less
0 – 49 Very Less
(Syah, 2016)
Hypothesis testing was done by the t-test. It aimed at proving the use of roundhouse diagrams
in biology learning in increasing students’ retention. Ho of this study stated there was not an
improvement in students’ retention, while Ha stated a significant improvement in students’ retention.
RESULTS AND DISCUSSION
This study presents learning that can increase students’ retention — packed with exciting and
undull learning activities. All students have the same opportunity when learning to use this strategy.
Not only that, from this study, students have valuable and meaningful experiences so that they can
strengthen their memory. The average scores of students' pretest and posttest, gain, n-gain can be seen
in the following Table 4.
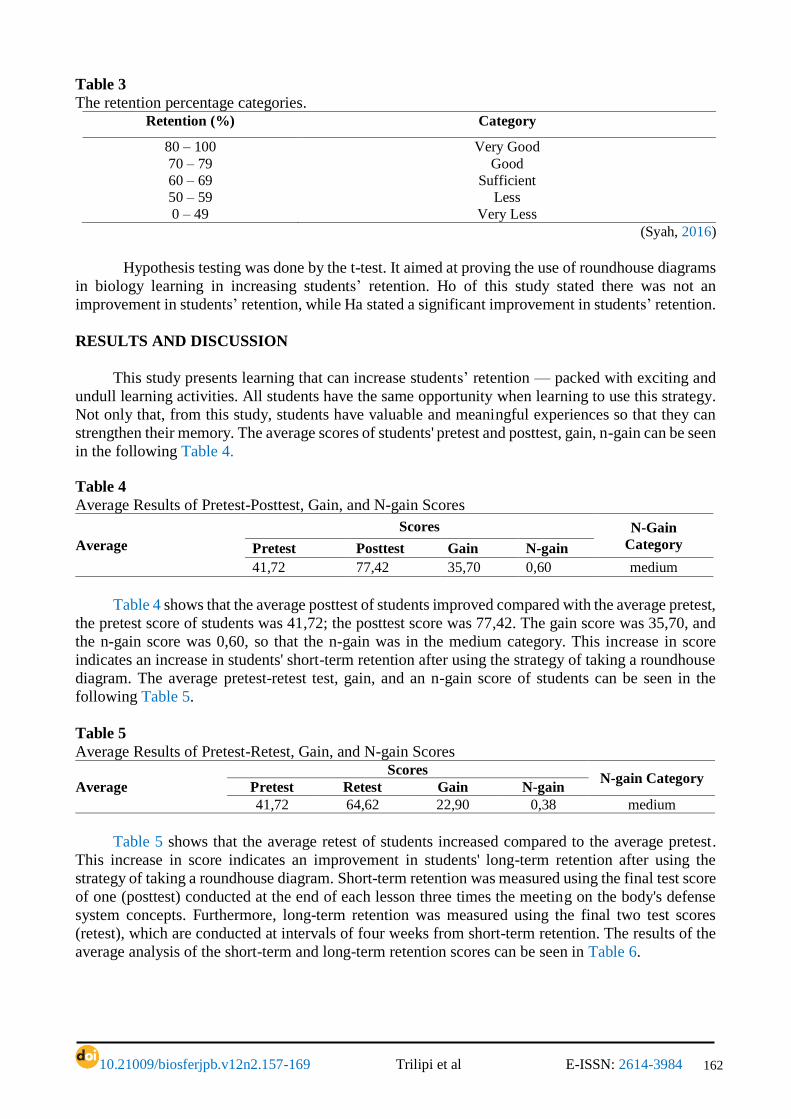
Table 4
Average Results of Pretest-Posttest, Gain, and N-gain Scores
Average
Scores N-Gain
Category Pretest Posttest Gain N-gain
41,72 77,42 35,70 0,60 medium
Table 4 shows that the average posttest of students improved compared with the average pretest,
the pretest score of students was 41,72; the posttest score was 77,42. The gain score was 35,70, and
the n-gain score was 0,60, so that the n-gain was in the medium category. This increase in score
indicates an increase in students' short-term retention after using the strategy of taking a roundhouse
diagram. The average pretest-retest test, gain, and an n-gain score of students can be seen in the
following Table 5.
Table 5
Average Results of Pretest-Retest, Gain, and N-gain Scores
Average
Scores N-gain Category
Pretest Retest Gain N-gain
41,72 64,62 22,90 0,38 medium
Table 5 shows that the average retest of students increased compared to the average pretest.
This increase in score indicates an improvement in students' long-term retention after using the
strategy of taking a roundhouse diagram. Short-term retention was measured using the final test score
of one (posttest) conducted at the end of each lesson three times the meeting on the body's defense
system concepts. Furthermore, long-term retention was measured using the final two test scores
(retest), which are conducted at intervals of four weeks from short-term retention. The results of the
average analysis of the short-term and long-term retention scores can be seen in Table 6.

10.21009/biosferjpb.v12n2.157-169 Trilipi et al E-ISSN: 2614-3984 163
Table 6
Analysis Results of Short-term and Long-term Retention Scores from Three Meetings
Topics Short-term retention Long-term retention
Functions and components of the human body's defense
system
80,64 69,68
The response of the body's defense system 59,35 50,00
Disease and its prevention in the body's defense system 92,26 74,19
Average 77,42 64,62
Table 6 shows the difference between the average short-term retention score and the average
long-term retention score for three meetings. The average long-term retention score has decreased to
the average short-term retention score. The decrease in the difference between the average short-term
retention score against the long-term retention score of 12.79. The percentage of retention is sought
to find out the number of students who have retention with excellent, good, sufficient, less, and
decidedly less category.
Figure 2. The Percentages of Student Retention
Based on Figure 2, students with excellent retention occupied the highest percentage among
the others. This proves that using a roundhouse diagram has the effect of improving retention when
learning the body's defense system.
Hypothesis Test Results
Hypothesis tested data of pretest and posttest for short-term retention, then folllowed by long-
term retention. The following data are the results of the t-test for short-term retention and long-term
retention.
Table 7
Hypothesis Test Calculation Results
Retention t count t table
Short-term 19,37* 2,042 Long-term 11,34* 2,042 Note: * = significantly different
Based on the t-test for short-term retention and long-term retention, the results show that the
value of t count > t table. It can be concluded that the note-taking roundhouse diagram strategy increases
the ability to remember or retention of students. Students can well remember the concepts of the
body's defense system.
In this study, the fifth groups have members who are enthusiastic about learning (Figure 3).
70,97
22,58
3,23 3,23
0
10
20
30
40
50
60
70
80
Student Quantity
Very Good
Good
Sufficient
Less
Very Less
22 7 1 1 0
Ret
enti
on
(%)

10.21009/biosferjpb.v12n2.157-169 Trilipi et al E-ISSN: 2614-3984 164
This can be seen from their enthusiasm for making notes on roundhouse diagrams and often asking
questions to teachers when they lack understanding of the learning concept. To construct a note on
the roundhouse diagram, students build mental representations of what already they know (Ausubel,
1968). They are passionate about making these notes because they take notes using roundhouse
diagrams involving images, colors, and keywords. They discuss with members of their respective
groups in making notes according to their wishes.
Figure 3. The students' enthusiasm in learning using roundhouse diagram
Pictures, colors, and keywords used by students in recording learning material in a roundhouse
diagram make the material easy to remember. Students identify keywords and make critical
knowledge in short statements (Figure 4). Then, students rely on personal interpretation to relate
keywords to an image. Students recall verbal or visual information they have for inclusion in the
roundhouse diagram (Hackney & Ward, 2002). One factor that increases retention performance is
the use images and keywords because they have associations in memory (Solso, Machin, & Maclin,
2007). Atkinson and Shiffrin (1968) that information in short-term memory will be transferred into
long-term memory by carrying out several control processes. This control process is a strategy that
determines how the information is processed. The control process consists of repetition, coding, and
drawing. Repetition is repeating verbal information to remain active in short-term memory or transfer
it into long-term memory. Coding is a semantic elaboration of information, so it is easy to remember.
Making a picture is creating a visual picture, so the material is more comfortable to remember.
Figure 4. The example of students’ roundhouse diagram
10.21009/biosferjpb.v12n2.157-169 Trilipi et al E-ISSN: 2614-3984 165
Enthusiasm in participating when learning oocur can be seen from many question arise from
student. This situation showed that students have an interest in learning. Sardini (2013), students who
have high learning interests will have good learning outcomes. Because of the interest in learning,
make students able to complete notes using colors, pictures, and keywords on roundhouse diagrams
very well. The pictures made on the roundhouse diagram are the encoding or representative of the
concept of learning material, which is easy for students to remember. In line with Hackney & Ward
(2002) which states if the visual image created in a roundhouse diagram is a coding and analogy
technique to make students easier to memorize the material. Besides, subconcepts injuring are
represented by simple sentences as reminders (keywords). The same thing was expressed by Wibowo,
Asri, & Titik (2012) that high school students have been able to perform concept abstractions in their
cognitive structures to be able to create visual codes for learning. It is through this technique of
creating visual codes that they can better understand the concept of biology. A good note on the
roundhouse diagram makes the concept of learning material more precise and can be well understood
by students; this can increase student retention.
Based on Table 6, the average short-term retention score is higher than the long-term retention
score. The decrease is caused by a considerable amount of time between the short-term retention test
and long-term retention test. This causes students to forget the material being taught because the
storage of information is not one hundred percent stored in memory. This forgetfulness event can
reduce student retention. Reed (2011), the information in short-term memory will disappear quickly
unless maintained by recalling the information. A fast forgetfulness level indicates that we must
practice verbal information to stay awake in short-term memory. Another cause is that new
information received within this period can suppress old information. In line with Syah (2016), a
student will experience a retroactive disturbance if the new subject matter brings conflict and
disruption to the recall of old subject matter, which has already been stored in the student's permanent
reason subsystem. In this case, the old subject matter will be complicated to remember or reproduce.
Solso (2007), most of the ability to remember and forget, is controlled by neural processes that
govern the whole process without conscious effort. If the material presented is complex and abstract,
it cannot give students sufficient opportunities to process and understand the information submitted
to the processing of information received is not perfect. If information processing is perfect, there
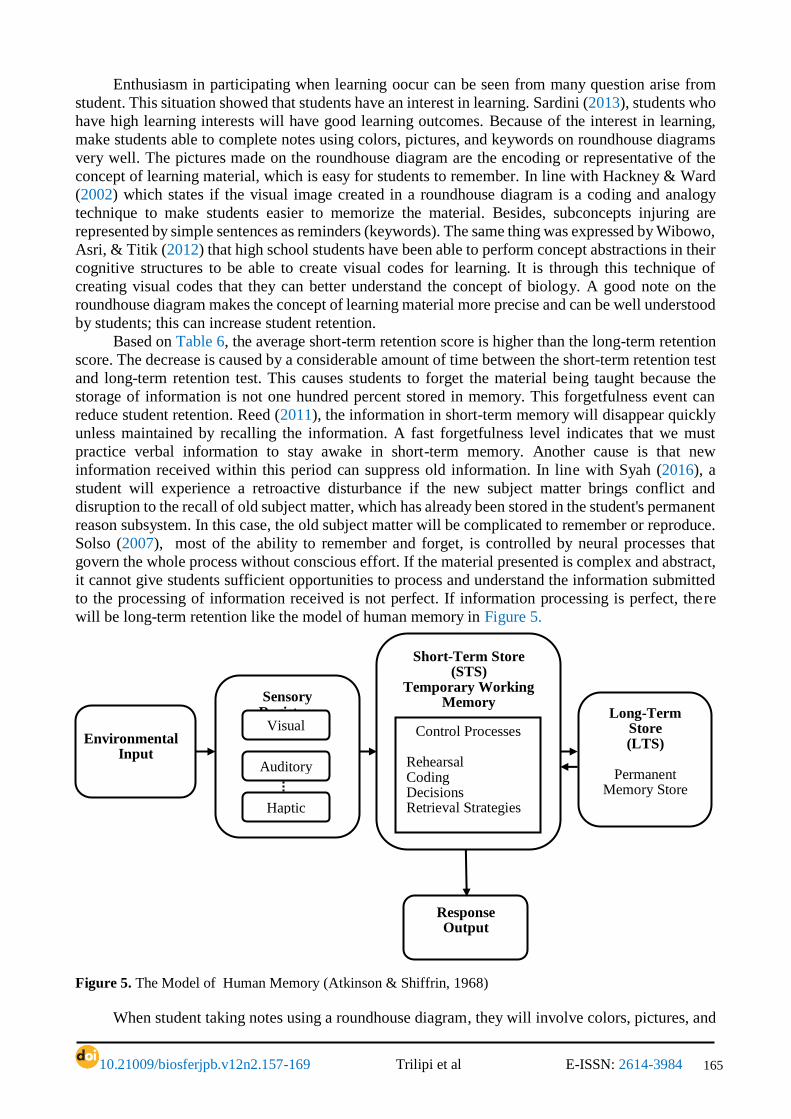
will be long-term retention like the model of human memory in Figure 5.
Figure 5. The Model of Human Memory (Atkinson & Shiffrin, 1968)
When student taking notes using a roundhouse diagram, they will involve colors, pictures, and
Environmental
Input
Sensory Registers
Visual
Auditory
Haptic
Short-Term Store (STS)
Temporary Working Memory
Control Processes Rehearsal Coding Decisions Retrieval Strategies
Long-Term Store (LTS)
Permanent
Memory Store
Response Output
10.21009/biosferjpb.v12n2.157-169 Trilipi et al E-ISSN: 2614-3984 166
keywords. When taking notes, students receive stimuli that are accommodated by the sensory devices
(receptors) that process these stimuli. The stimulus will be transmitted to the next nerve and then
processed to form a harmonious pattern (McCartney & Figg, 2011). Sensory impressions that are not
considered relevant will disappear and has no effect anymore. The matching pattern will be entered
into short-term memory if the incoming information is retained longer through the storage process
(Ward & Wandersee, 2002). This storage process allows further processing that is created as an
organizational form, such as concepts, schemes, and verbal formulation. Short-term retention
capacity is limited, both from the amount of information and the time available. If it is not processed
correctly, it will be pushed out and replaced with new information. If it can be processed for an
extended period, it will become long-term retention. The result of the average percentage of retention
in students, found that the retention of students in learning using roundhouse diagrams falls into the
first category. Ward and Wandersee (2001), that right and useful notes will help students remember
in more detail about key points, main concepts and see their links.
CONCLUSION
Based on the results of research, it can be concluded that the strategy of taking notes using
roundhouse diagrams on learning the biology of the body's defense system concept can improve
students’ retention.
ACKNOWLEDGMENT
Researchers want to say thank you to SMAN 1 Indralaya Utara, mainly student in class XI
IPA 1, for supporting this research until it can be published.
REFERENCES
Alfiraida, S. (2018). Identifikasi materi biologi sma sulit menurut pandangan siswa dan guru sma se-
kota Salatiga. Journal of Biology Education, 1(2), 209–222. Retrieved from
http://journal.stainkudus.ac.id/index.php/jobe.
Ami, M.S., Susantini, E., & Raharjo. (2012). Pengembangan buku saku materi sistem ekskresi
manusia di SMA/MA kelas XI. BioEdu, 1(2), 10-13. Retrieved from
https://media.neliti.com/media/publications/241395-pengembangan-buku-saku-materi-sistem-
eks-1ce144c7.pdf.
Atkinson, R. C. & Shiffrin, R. M. (1968). Human memory: a proposed system and its control
processes. In K.W. Spence (ed.), The Psychology of Learning and Motivation: Advances in
Research and theory, 2(89–195). New York: Academic Press.
Ausubel, D. (1968). Educational psychology: a cognitive view. New York: Holt, Reinthart &
Winston.
Barlian, I. (2013). Begitu pentingkah strategi belajar mengajar bagi guru ?. Jurnal Forum Sosial,
VI(1), 241–246. Retrieved from http://eprints.unsri.ac.id/2268/2/isi.pdf.
Cristal, W., Sano,A., & Yusri. (2013). Hubungan keterampilan mencatat dengan hasil belajar. (n.d.).
Jurnal Ilmiah Konseling, 2(1), 83–87. Doi: 10.24036/0201321829-0-00.
Dahar, R. W. (2011). Teori-teori belajar dan pembelajaran. Bandung: PT. Gelora Aksara Pratama.
10.21009/biosferjpb.v12n2.157-169 Trilipi et al E-ISSN: 2614-3984 167
Dasem, A. A., Laka, B. M., & Niwele, A. (2018). Peranan guru dalam proses pembelajaran bahasa
Indonesia di SD inpres komboi kabupaten biak numfor. Wacana Akademika, 2(2), 126–136.
Doi: 10.30738/wa.v2i2.2596.
Dewi, I. A. G. B. P., & Indrawati, K. R. (2014). Perilaku mencatat dan kemampuan memori pada
proses belajar. Jurnal Psikologi Udayana, 1(2), 241–250. Doi: 10.24843/jpu.v1i2.25084.
Hackney, M. W., & Ward, R. E. (2002). How-to-learn biology via roundhouse diagrams. The
American Biology Teacher, 64(7), 525–533. Doi: 10.1662/0002-7685(2002)064.
Haibach, P. S., Reid, G., & Collier, H. D. (2011). Motor learning and development. New York:
Human Kinetics.
Hake, R. R. (1999). Analyzing change/gain scores. Woodland Hills: Dept. of Physics, Indiana
University.
Harjali. (2016). Strategi guru dalam membangun lingkungan belajar yang kondusif: studi
fenomenologi pada kelas-kelas sekolah menengah pertama di ponorogo. Jurnal Pendidikan
dan Pembelajaran, 23(1), 10–19. Retrieved from http://journal.um.ac.id/index.php/pendidikan-
dan-pembelajaran/article/view/10147.
Hasanah. (2019). Upaya meningkatkan hasil belajar siswa pada materi larutan asam, basa dan garam
melalui penerapan strategi pembelajaran resoursce based learning (RBL) pada siswa kelas XI
IPA 3 di SMAN 22 bandung. Lantanida, 7(1), 13–24. Doi: 10.22373/lj.v7i1.4715.
Inah, E. N. (2015). Peran komunikasi dalam interaksi guru dan siswa. Jurnal Al-Ta’dib, 8(2), 150–
167. Doi: 10.31332/atdb.v8i2.416.
Juhji. (2016). Peran urgen guru dalam pendidikan. Studia Didaktika, 10(1), 52–61. Retrieved from
http://jurnal.uinbanten.ac.id/index.php/studiadidaktika/article/view/73.
Khairoh, L., A. Rusilowati, & S. Nurhayati. (2014).Pengembangan buku cerita IPA terpadu
bermuatan pendidikan karakter peduli lingkungan pada tema pencemaran lingkungan. Unnes
Science Education Journal, 3(2), 519–527. Doi: 10.15294/usej.v3i2.3349.
Kintsch, W. C. (1970). Learning Memory and Conceptual Processes. Boulder, Colorado: Jhon
Wileyard sons. Inc.
Kusumawati, A. D. & Sumardi, Y. (2016). Peranan perangkat pembelajaran fisika berbasis
elaboration learning untuk siswa SMA. Unnes Physics Education Journal, 5(2), 42–53.
Retrieved from http://journal.unnes.ac.id/sju/index.php/upej.
Lubis, N.F. & Simatupang, Z. (2014). Peningkatan daya retensi terhadap konsep-konsep biologi
melalui pemanfaatan media adobe flash pada model pembelajaran langsung. Prosiding Seminar
Nasional Biologi dan Pembelajarannya, 654-664. Medan, 23 Agustus 2014. Retrieved from
http://digilib.unimed.ac.id/4831/.
Mansyur, R. A., Salahuddin, & Ismail, W. (2018). Pengaruh strategi pembelajaran probing prompting
terhadap hasil belajar IPA materi sel di SMPN 3 sungguminasa kabupaten gowa. Jurnal Biotek,
6(2), 80–92. Doi:10.24252/jb.v6i1.4308.
Mccartney, R. W. & Figg, C. (2011). Every picture tells a story: the roundhouse process in the digital
age. Teaching & Learning, 6(1), 1–14. Doi: 10.26522/tl.v6i1.374.
10.21009/biosferjpb.v12n2.157-169 Trilipi et al E-ISSN: 2614-3984 168
Mccartney, R. W., & Wadsworth, D. E. D. (2012). Middle school students with exceptional learning
needs investigate the use of visuals for learning science. Teaching & Learning, 7(1), 1–20.
Retrieved from https://www.readcube.com/articles/10.26522/tl.v7i1.395.
Mcleod, S. (2007). Stages of memory encoding storage and retrieval. Retrieved from
https://www.simplypsychology.org/simplypsychology.org-memory.pdf.
Nurhaidah & Musa, M.I. (2016). Pengembangan kompetensi guru terhadap pelaksanaan tugas dalam
mewujudkan tenaga guru yang profesional. Jurnal Pesona Dasar, 2(4), 8–27. Retrieved from
http://www.jurnal.unsyiah.ac.id/PEAR/article/view/7529.
Puspita, A., Kurniawan, A. D., & Rahayu, H. M. (2017). Pengembangan media Pembelajaran booklet
pada materi ssistem imun terhadap hasil belajar siswa kelas XI SMAN 8 pontianak. Jurnal
Bioeducation, 4(1), 64–72. Doi: 10.29406/524.
Reed, S. K., Kognisi Teori dan Aplikasi. Diterjemahkan oleh A. Tusyani, (2011). Jakarta: Salemba
Humanika.
Ward, R.E. & Wandersee, J. (2001). Visualizing science using the roundhouse diagram. Teaching
Strategy, 24(4), 17–21. Retrieved from http://connection.ebscohost.com/c/articles/19004818.
Rukmana, H. G. T., Suciati, & Indrowati, M. (2013). Penerapan model pembelajaran guided inquiry
disertai teknik roundhouse untuk meningkatkan motivasi dan hasil belajar biologi siswa kelas
XI-IPA III SMA Negeri 1 teras boyolali tahun ajaran 2011/2012. Bioedukasi, 5(1), 26–28.
Retrieved from http://jurnal.fkip.uns.ac.id/index.php/bio/article/view/1436.
Sardini. (2013). Pengaruh minat belajar terhadap hasil belajar pelajaran ekonomi siswa kelas XI IPS
MAN pontianak. Jurnal Untan, 2(7), 1–16. Retrieved from
http://jurnal.untan.ac.id/index.php/jpdpb/article/view/2777.
Slameto. (2010). Belajar dan Faktor-faktor yang Mempengaruhinya. Jakarta: Rineka Cipta.
Solso, R. L., Machin, O. H., & Maclin, M. K. (2007). Psikologi kognitif. Diterjemahkan oleh M.
Rahardianto dan K. Batuadji. Jakarta: Erlangga.
Sudijono, A. (2012). Pengantar evaluasi pendidikan. Jakarta: Raja Grafindo Persada.
Sugiyono. (2012). Metode penelitian kuantitatif, kualitatif, dan R&D. Bandung: Alfabeta.
Syah, M. (2016). Psikologi pendidikan dengan pendekatan terbaru edisi revisi. Bandung: Remaja
Rosdakarya.
Ward, R. E., & Lee, W. D. (2002). Understanding the periodic table of elements via iconic mapping
and sequential diagramming: the roundhouse strategy. Science Activities: Classroom Projects
and Curriculum Ideas, 42(2), 11–19. Doi: 10.3200/SATS.42.4.11-19.
Ward, R. E., & Wandersee, J. H. (2002). Struggling to understand abstract science topics: a
roundhouse diagram-based study. International Journal of Science Education, 24(6), 575–591.
Doi: 10.1080/09500690110074017.
Ward, R. E., & Wandersee, J. H. (2002). Students’ perceptions of roundhouse diagramming: a
middle-school viewpoint. International Journal of Science Education, 24(2), 205–225. Doi:
10.1080/09500690110074008.
Warsono. (2017). Guru: antara pendidik, profesi, dan aktor sosial. The Journal of Society & Media,
1(1), 1–10. Retrieved from https://journal.unesa.ac.id/index.php/jsm/index.
10.21009/biosferjpb.v12n2.157-169 Trilipi et al E-ISSN: 2614-3984 169
Wibowo, Y., Widowati, A., & Krisnawati, T. (2012). Pengaruh pembelajaran diagram roundhouse
terhadap kemampuan kognitif dan metakognitif siswa SMAN 1 ngaglik sleman yogyakarta.
Bioedukasi, 5(2), 39–49. Retrieved from https://jurnal.uns.ac.id/bioedukasi/article/view/3930.