Conservation biological control and enemy diversity on a landscape scale
Upload
khangminh22Category
view
3download
0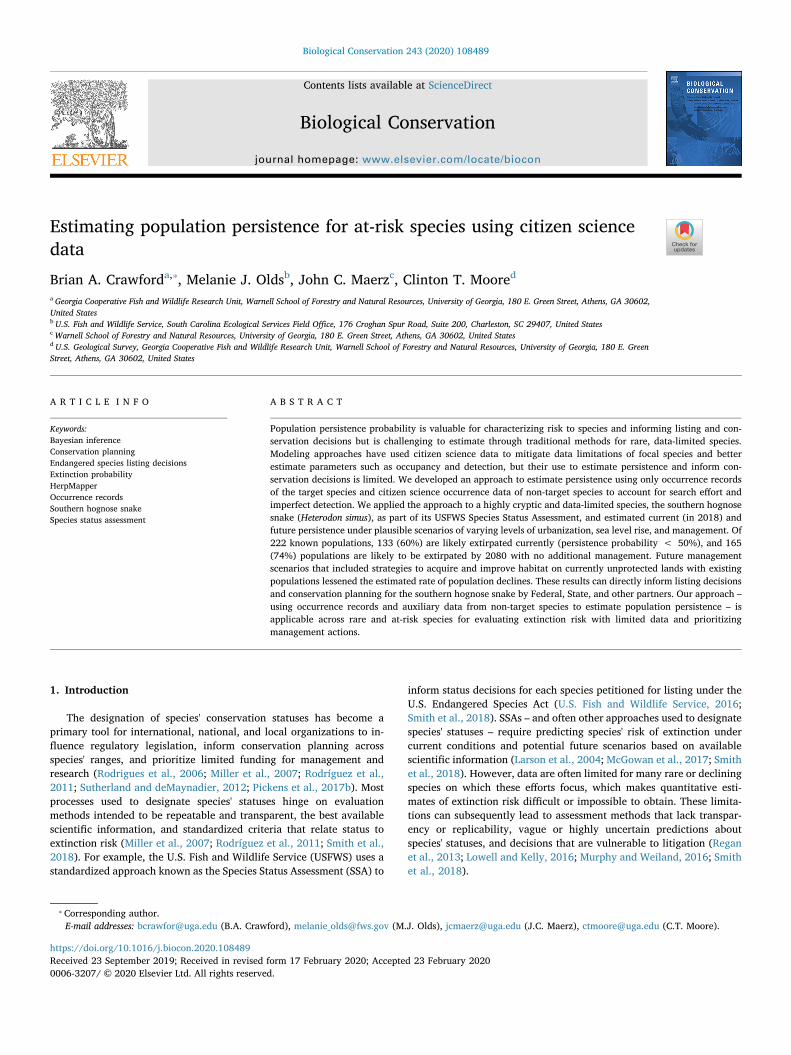
Contents lists available at ScienceDirect
Biological Conservation
journal homepage: www.elsevier.com/locate/biocon
Estimating population persistence for at-risk species using citizen sciencedata
Brian A. Crawforda,⁎, Melanie J. Oldsb, John C. Maerzc, Clinton T. Moored
aGeorgia Cooperative Fish and Wildlife Research Unit, Warnell School of Forestry and Natural Resources, University of Georgia, 180 E. Green Street, Athens, GA 30602,United StatesbU.S. Fish and Wildlife Service, South Carolina Ecological Services Field Office, 176 Croghan Spur Road, Suite 200, Charleston, SC 29407, United StatescWarnell School of Forestry and Natural Resources, University of Georgia, 180 E. Green Street, Athens, GA 30602, United StatesdU.S. Geological Survey, Georgia Cooperative Fish and Wildlife Research Unit, Warnell School of Forestry and Natural Resources, University of Georgia, 180 E. GreenStreet, Athens, GA 30602, United States
A R T I C L E I N F O
Keywords:Bayesian inferenceConservation planningEndangered species listing decisionsExtinction probabilityHerpMapperOccurrence recordsSouthern hognose snakeSpecies status assessment
A B S T R A C T
Population persistence probability is valuable for characterizing risk to species and informing listing and con-servation decisions but is challenging to estimate through traditional methods for rare, data-limited species.Modeling approaches have used citizen science data to mitigate data limitations of focal species and betterestimate parameters such as occupancy and detection, but their use to estimate persistence and inform con-servation decisions is limited. We developed an approach to estimate persistence using only occurrence recordsof the target species and citizen science occurrence data of non-target species to account for search effort andimperfect detection. We applied the approach to a highly cryptic and data-limited species, the southern hognosesnake (Heterodon simus), as part of its USFWS Species Status Assessment, and estimated current (in 2018) andfuture persistence under plausible scenarios of varying levels of urbanization, sea level rise, and management. Of222 known populations, 133 (60%) are likely extirpated currently (persistence probability < 50%), and 165(74%) populations are likely to be extirpated by 2080 with no additional management. Future managementscenarios that included strategies to acquire and improve habitat on currently unprotected lands with existingpopulations lessened the estimated rate of population declines. These results can directly inform listing decisionsand conservation planning for the southern hognose snake by Federal, State, and other partners. Our approach –using occurrence records and auxiliary data from non-target species to estimate population persistence – isapplicable across rare and at-risk species for evaluating extinction risk with limited data and prioritizingmanagement actions.
1. Introduction
The designation of species' conservation statuses has become aprimary tool for international, national, and local organizations to in-fluence regulatory legislation, inform conservation planning acrossspecies' ranges, and prioritize limited funding for management andresearch (Rodrigues et al., 2006; Miller et al., 2007; Rodríguez et al.,2011; Sutherland and deMaynadier, 2012; Pickens et al., 2017b). Mostprocesses used to designate species' statuses hinge on evaluationmethods intended to be repeatable and transparent, the best availablescientific information, and standardized criteria that relate status toextinction risk (Miller et al., 2007; Rodríguez et al., 2011; Smith et al.,2018). For example, the U.S. Fish and Wildlife Service (USFWS) uses astandardized approach known as the Species Status Assessment (SSA) to
inform status decisions for each species petitioned for listing under theU.S. Endangered Species Act (U.S. Fish and Wildlife Service, 2016;Smith et al., 2018). SSAs – and often other approaches used to designatespecies' statuses – require predicting species' risk of extinction undercurrent conditions and potential future scenarios based on availablescientific information (Larson et al., 2004; McGowan et al., 2017; Smithet al., 2018). However, data are often limited for many rare or decliningspecies on which these efforts focus, which makes quantitative esti-mates of extinction risk difficult or impossible to obtain. These limita-tions can subsequently lead to assessment methods that lack transpar-ency or replicability, vague or highly uncertain predictions aboutspecies' statuses, and decisions that are vulnerable to litigation (Reganet al., 2013; Lowell and Kelly, 2016; Murphy and Weiland, 2016; Smithet al., 2018).
https://doi.org/10.1016/j.biocon.2020.108489Received 23 September 2019; Received in revised form 17 February 2020; Accepted 23 February 2020
⁎ Corresponding author.E-mail addresses: [email protected] (B.A. Crawford), [email protected] (M.J. Olds), [email protected] (J.C. Maerz), [email protected] (C.T. Moore).
Biological Conservation 243 (2020) 108489
0006-3207/ © 2020 Elsevier Ltd. All rights reserved.
T
Characterizing species' statuses with rigorous estimates of extinctionrisk (or its complement, persistence probability) can be hindered by thequality and quantity of data available. One traditional approach ispopulation viability analysis (PVA) that estimates metrics of persistenceor abundance over a decision-relevant time frame (Beissinger andWestphal, 1998; Akçakaya and Sjögren-Gulve, 2000; Morris et al.,2002; McGowan et al., 2017), but PVA relies on species' demographicrates (e.g., survival and recruitment) estimated from high quality datafrom systematic methods, such as capture-mark-recapture or distancesampling (Lebreton et al., 1992; Engler et al., 2004; Marshall et al.,2004). Data sufficient for estimating demographic rates are often un-available for many species even at local scales. Occupancy modeling isanother approach used to estimate population extinction risk with de-tection-non-detection data from repeated samples when more intensivedata (e.g., capture-mark-recapture) or demographic estimates are toochallenging or costly to obtain (MacKenzie et al., 2002; Royle and Kéry,2007; Kéry et al., 2010). However, datasets for many at-risk species arecollected opportunistically (Wolf et al., 2015) and lack the samplingdesign required for occupancy modeling. Collecting high quality data toconduct PVA, occupancy modeling, or additional approaches allows forestimating persistence while also accounting for imperfect detection(i.e., separating variation of underlying demographic processes of in-terest with observation error in the data: MacKenzie et al., 2002; Keryet al., 2009). Not accounting for imperfect detection can result in biasedor imprecise estimates, especially for secretive, data-poor species(MacKenzie et al., 2003; Clark and Bjørnstad, 2004; Kery et al., 2009;Zipkin et al., 2014). An additional challenge for predicting statuses ofspecies is that data should ideally be collected across broad spatialextents (i.e., the species' range) and at multiple points in time. It isinherently difficult and costly to collect demographic data useful forestimating persistence over large spatial scales. Studies for many at-riskspecies commonly collect data from only a small portion of the species'range, even though demographic rates can vary geographically. Thisvariation in demographic rates should be accounted for when esti-mating range-wide persistence (e.g., Tuberville et al., 2009; Bonnotet al., 2011). Faced with these challenges, Wolf et al. (2015) contendedthat estimating persistence was too data-intensive for most at-riskspecies using approaches such as PVA. Thus, novel approaches areneeded that use available datasets to better quantify persistence at arange-wide scale for at-risk species and inform subsequent listing andconservation decisions.
Citizen science data have been increasingly collected and applied toecological and conservation contexts in recent years to mitigate datagaps and improve estimation of metrics of interest (Dickinson et al.,2012). One of the most common forms of citizen science data is geor-eferenced species occurrence records from opportunistic surveys (alsocalled atlas data), which is collected at large spatial scales, verified byspecies experts, and stored on web-based platforms, such as iNaturalist(www.inaturalist.org), eBird (https://ebird.org), and HerpMapper(www.herpmapper.org: HerpMapper, 2018). Modeling distributions orhabitat suitability for focal species requires a sufficient number of oc-currence records distributed across the species' range (Elith andLeathwick, 2009; Franklin, 2010), so citizen science data can supple-ment those contained in State-maintained or other databases (e.g.,natural heritage programs: Groves et al., 1995). Because robust absenceinformation is often unavailable, several species distribution modelingstudies have begun using citizen science datasets collected for “non-target” species (i.e., those observed while in search of a focal species) as“inferred absences” of the focal species, which has improved the ac-curacy of model estimates of species presence (e.g., Phillips et al., 2009;Stratmann et al., 2016; Bradter et al., 2018). Occupancy modelingstudies have also incorporated citizen science data from systematic,repeated surveys to capture search effort, account for imperfect detec-tion, and improve estimates of population extinction and colonization(e.g., Kéry et al., 2010; Peach et al., 2017). Integrated populationmodels can also be used to combine occurrence data from citizen
scientists with mark-recapture and productivity data from formalsampling efforts to estimate population trends (Robinson et al., 2018;Zipkin and Saunders, 2018). Still, more opportunities exist for in-corporating citizen science data into models estimating persistence forat-risk species in order to overcome common challenges of limited dataand imperfect detection and better assess species' statuses.
This study developed a novel approach to estimate persistence andcharacterize the range-wide status of an at-risk species under currentand future conditions using only occurrence records of the target spe-cies and citizen science data of non-target species. Current conditionsreflect those at the time of the study (in 2018). Specifically, we de-veloped and applied the approach to a small, highly cryptic, and data-limited species in the southeastern U.S., the southern hognose snake(Heterodon simus), as part of its SSA (U.S. Fish and Wildlife Service,2019). Our objectives were (i) to estimate the probability of persistencefor each of 222 populations under current conditions while accountingfor imperfect detection with citizen science observations of non-targetsnake species, and (ii) to project population persistence into the year2080 under scenarios representing plausible future conditions of ur-banization, sea level rise, and broad management strategies. This ana-lysis builds on previous research predicting habitat suitability acrossthe southern hognose snake's range (Crawford et al., 2020). We usedhabitat suitability as a predictor of current population persistence in2018 and linked changes in habitat suitability from stressors andmanagement to future persistence. In alignment with the SSA frame-work (Smith et al., 2018), we employed the conservation biologyprinciples of resiliency, redundancy, and representation (the “3Rs”)when designing the analysis and summarizing results. In short, re-siliency describes the condition of populations and their ability topersist over time using attributes such as population growth rate; re-dundancy describes the number and distribution of populations and isrelated to the species' ability to withstand large-scale catastrophicevents; and representation describes the breadth of genetic diversity orecological settings occupied by the species (Shaffer and Stein, 2000;Wolf et al., 2015; Smith et al., 2018). We evaluated southern hognosesnake resiliency using population persistence probabilities, redundancyusing the number and spatial distribution of populations predicted topersist based on a range of probability thresholds, and representationusing the number of populations predicted to persist in each of ninerepresentative units (unique ecological settings). The results from thisstudy can directly inform listing decisions and conservation planningfor the southern hognose snake by Federal, State, and other partners.Our approach – using occurrence records and auxiliary data from non-target species to estimate population persistence – is applicable acrossrare, data-limited species, including many at-risk species in need ofconservation status designations in the U.S. or internationally (e.g., forthe International Union for Conservation of Nature Red List), for eval-uating extinction risk and prioritizing threats and management actions.
2. Methods
We went through the following steps when conducting this analysisand describe each step in more detail in the sections below. First, wegathered a comprehensive dataset of southern hognose snake occur-rence records and delineated population boundaries and representativeunits based on clusters of these records (Section 2.1). We also extractedspatial metrics of current conditions (e.g., mean habitat suitability) foreach population in this step to use later as predictors of persistence.Second, we gathered occurrence records for other snake species (non-target species) commonly observed in southern hognose snake habitatsthat were found within population boundaries to represent search effort(Section 2.2). Third, we constructed a persistence model to estimatecurrent population persistence that leveraged southern hognose snakedetection histories and search effort histories of non-target species toaccount for imperfect detection (Section 2.3). Fourth, we created sevenscenarios of stressors and management representing a range of plausible
B.A. Crawford, et al. Biological Conservation 243 (2020) 108489
2
future conditions for the species; we then constructed a projectionmodel to forecast population persistence through 2080 under eachscenario, given current population persistence and predicted changes inhabitat (Section 2.4). Lastly, we summarized results by representativeunit and range-wide currently (in 2018) and in 2080 to characterize thespecies' status using resiliency, redundancy, and representation (seeSection 3. Results). We performed all spatial analyses in ArcGIS version10.4 (ESRI, Redlands, CA) and statistical analyses in R version 3.5.3 (RCore Team, 2019).
2.1. Target species, populations, and representative units
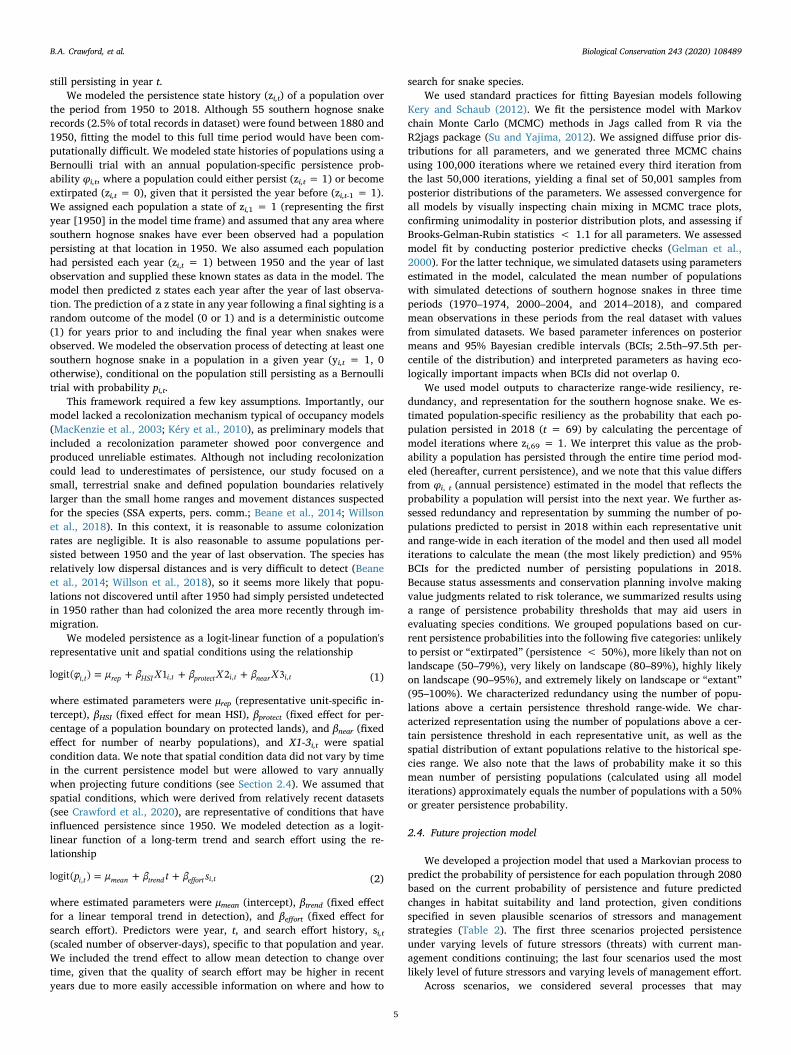
The southern hognose snake is a small terrestrial species found inthe Coastal Plain region of the southeastern U.S. in portions of NorthCarolina, South Carolina, Georgia, Florida, and west to Alabama andMississippi (Fig. 1: Tuberville et al., 2000; U.S. Fish and WildlifeService, 2019). In addition to substantial habitat loss, fragmentation,and degradation caused by infrequent fire of longleaf pine (Pinus pa-lustris) systems (Outcalt and Sheffield, 1996), threats to the speciesinclude spread of invasive species such as the red imported fire ant(Solenopsis invicta), road mortality, and other factors (Gibbons et al.,2000; Tuberville et al., 2000; Beane et al., 2014). The southern hognosesnake is highly cryptic with low rates of detection (Steen et al., 2012),which has made it challenging to explicitly estimate demographic rates,population trends, or effects of threats (Beane et al., 2014; Willsonet al., 2018). Only a few, localized studies have been able to estimate
certain demographic rates and population densities for this speciesusing road surveys and radio-tracking of a few individuals (Enge andWood, 2002; Beane et al., 2014; Willson et al., 2018). Tuberville et al.(2000) conducted a range-wide review of published information andspecies occurrence records to identify qualitative trends in distributionof occupied areas, and evidence suggested population extirpations arelikely to have occurred across a large portion of the species' range whileother populations appeared stable at the time. The USFWS was peti-tioned to list the southern hognose snake in July 2012 and subsequentlypublished a 90-day finding indicating that listing may be warranted forthe species (80 FR 37568, July 1, 2015). In 2019, the USFWS conductedan SSA to formally assess the species' viability using the best availablescientific data despite the limited data available for the species.
We compiled a geospatial database of southern hognose snake oc-currence records from datasets maintained by natural heritage pro-grams, USFWS, U.S. Forest Service (USFS), U.S. Department of Defense(DoD), State agencies, academic researchers, and HerpMapper(HerpMapper, 2018). We note that all species records submitted toHerpMapper were validated by professional herpetologists. Recordsincluded opportunistic sightings, as well as observations from sys-tematic studies from trained researchers (e.g., Enge et al., 2014).
Next, we created population boundaries around occurrence records.Delineating populations ideally relies on information about genetics,home ranges, or dispersal distances, but this does not exist for thesouthern hognose snake. Therefore, we buffered all records by 5 km,joined overlapping buffers to represent the same population, and
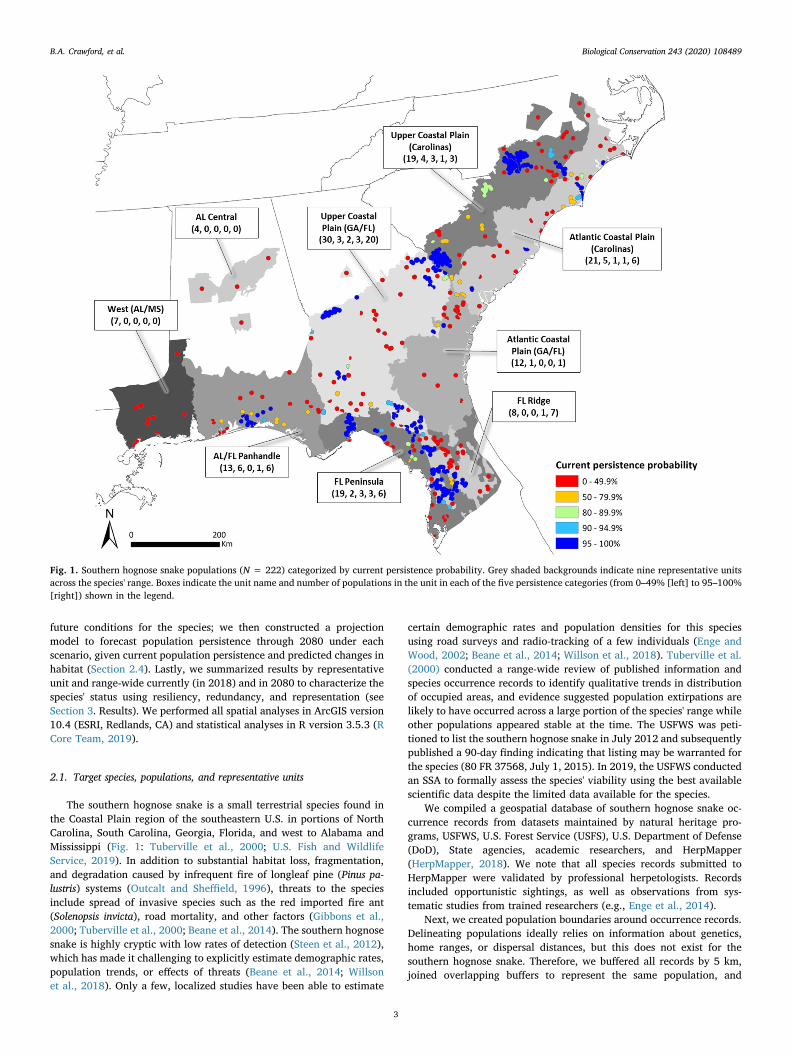
Fig. 1. Southern hognose snake populations (N = 222) categorized by current persistence probability. Grey shaded backgrounds indicate nine representative unitsacross the species' range. Boxes indicate the unit name and number of populations in the unit in each of the five persistence categories (from 0–49% [left] to 95–100%[right]) shown in the legend.
B.A. Crawford, et al. Biological Conservation 243 (2020) 108489
3
divided population boundaries by large (6th order or higher) rivers andmajor highways that likely represent barriers to southern hognosesnake movement. We based these methods on species expert input andNatureServe protocols for defining populations for small terrestrialsnakes (NatureServe, 2018). Using population boundaries, we con-ducted spatial analyses and extracted three population-specific metricsto use as predictors in the persistence model: (1) mean Habitat Suit-ability Index (HSI), that was derived from the work of Crawford et al.(2020), where HSI was positively influenced by the amount of well-drained soil, compatible land cover, and fire frequency in a focal area,(2) percentage of area within the population boundary on protectedlands, and (3) the number of additional populations within 10 km(Table 1). We defined all areas as protected if they were found in theU.S. Geological Survey (USGS) Protected Areas Database (http://www.protectedlands.net/), as well as State-maintained conservation landsdatabases, and these databases included publicly-owned and managedlands as well as private lands registered in State or Federal programswhere natural resource conservation is one of the management goals.For further spatial processing details, see U.S. Fish and Wildlife Service(2019, section 4.1.2, Appendix A).
We delineated nine subdivisions of the range (hereafter, re-presentative units: Fig. 1) in collaboration with species experts to re-present variation in ecological roles of the species across its range. Unitswere based on EPA IV ecoregions (U.S. Environmental ProtectionAgency, 2017) that were grouped by similar ecological characteristics(e.g., soil, geology) and divided by the Savannah, Chattahoochee, andMobile-Tombigbee Rivers.
Lastly, we assigned the appropriate population ID and re-presentative unit ID for each southern hognose snake record. Fromthese records, we created detection histories (denoted as yi,t) describingif at least one individual was observed in a population i in a given year t(yi,t = 1, 0 otherwise) to model persistence (see Section 2.3).
2.2. Non-target species data collection
Models estimating persistence or other demographic parameterstypically rely on non-detection information – i.e., when searches oc-curred but the target species was not observed – to account for im-perfect detection (MacKenzie et al., 2002; Kery et al., 2009; Kery andSchaub, 2012). However, robust absence or search effort data do notexist for the southern hognose snake. Therefore, we developed a searcheffort index to estimate detection from citizen-collected occurrencerecords of southern hognose snakes and other non-target snake speciescommonly observed in southern hognose snake habitats obtained fromHerpMapper and other partners (hereafter search effort dataset). Wedeveloped a list of 13 non-target species most commonly observedwhile surveying for southern hognose snakes that are active during thesame months of peak activity (May, June, September, and October):Agkistrodon contortrix subspp., Agkistrodon piscivorus subspp., Cemophoracoccinea subspp., Coluber constrictor subspp., Crotalus adamanteus, Cro-talus horridus, Lampropeltis getula subspp., Masticophis flagellum subspp.,
Opheodrys aestivus subspp., Pantherophis guttatus, Pantherophis obsoletussubspp., Pituophis melanoleucus subspp., and Thamnophis sirtalis subspp.(multiple experts, pers. comm.). We queried HerpMapper and accessed11,631 records of these snake species within the study extent. Theserecords included data on observer name and date of observation. Weadded 1522 Florida pine snake (Pituophis melanoleucus mugitus) recordscollected during a previous study (Crawford et al., 2020) and allsouthern hognose snake records, since these also indicated searchevents, to the search effort dataset. Snake datasets included recordscollected between 1880 and 2018 that we used to create a search effortindex.
We assigned the appropriate population ID to each record in thesearch effort dataset and removed any record falling outside of anypopulation boundary, which left 5473 records. We noticed occasions inthe HerpMapper data where the same observer would submit multiplerecords from the same date. In order to better capture the number ofsearch events and create an index of search effort, we filtered the searcheffort dataset to remove duplicate records coming from the same ob-server on the same date. Thus, the final dataset represented uniquesearches by individuals, which we refer to as observer-days, and in-cluded 3825 observer-days in total. We then followed the same processused to create detection histories of southern hognose snakes to createsearch effort histories for each population. Search effort histories (si,t)described the number of observer-days for population i in year t. Lastly,we scaled all search effort values so they were centered on 0 for use inthe persistence model.
Records of non-target snake species that fell within a given popu-lation boundary indicate that the area was searched by an individual ina given year and informed the likelihood a population is still persisting.In using non-target species data, we made the following assumptions:(i) non-target records indicated an event when an area known to havesouthern hognose snakes at some time was searched, (ii) the search wasperformed in a way that southern hognose snakes could be observed(e.g., road surveys), and (iii) when a person submitted non-target re-cords but not southern hognose snake records to HerpMapper after asearch, this indicated the area was searched but no southern hognosesnake was found (i.e., we assumed southern hognose snakes would bereported if found).
2.3. Current persistence model
We developed a model (hereafter, persistence model) to estimatetrends in southern hognose snake populations and derive probabilitiesthat each population in the species' range persists currently in 2018. Weadapted the Cormack-Jolly-Seber model (Lebreton et al., 1992; Brookset al., 2000), designed to estimate survival of individual animals basedon mark-recapture data, to analogously estimate persistence (“sur-vival”) of populations based on their detection histories. We applied astate-space formulation fitted in a Bayesian framework (Kery andSchaub, 2012) to estimate the annual population persistence prob-ability (φi,t) and detection probability (pi,t), given the population was
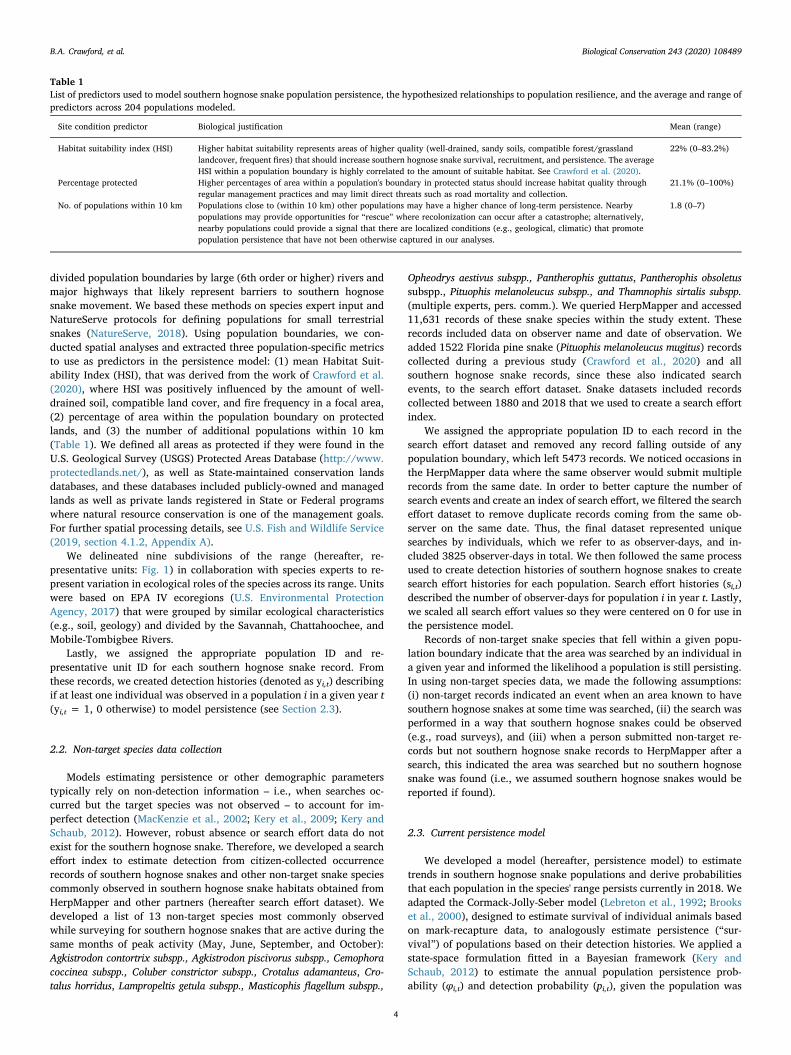
Table 1List of predictors used to model southern hognose snake population persistence, the hypothesized relationships to population resilience, and the average and range ofpredictors across 204 populations modeled.
Site condition predictor Biological justification Mean (range)
Habitat suitability index (HSI) Higher habitat suitability represents areas of higher quality (well-drained, sandy soils, compatible forest/grasslandlandcover, frequent fires) that should increase southern hognose snake survival, recruitment, and persistence. The averageHSI within a population boundary is highly correlated to the amount of suitable habitat. See Crawford et al. (2020).
22% (0–83.2%)
Percentage protected Higher percentages of area within a population's boundary in protected status should increase habitat quality throughregular management practices and may limit direct threats such as road mortality and collection.
21.1% (0–100%)
No. of populations within 10 km Populations close to (within 10 km) other populations may have a higher chance of long-term persistence. Nearbypopulations may provide opportunities for “rescue” where recolonization can occur after a catastrophe; alternatively,nearby populations could provide a signal that there are localized conditions (e.g., geological, climatic) that promotepopulation persistence that have not been otherwise captured in our analyses.
1.8 (0–7)
B.A. Crawford, et al. Biological Conservation 243 (2020) 108489
4
still persisting in year t.We modeled the persistence state history (zi,t) of a population over
the period from 1950 to 2018. Although 55 southern hognose snakerecords (2.5% of total records in dataset) were found between 1880 and1950, fitting the model to this full time period would have been com-putationally difficult. We modeled state histories of populations using aBernoulli trial with an annual population-specific persistence prob-ability φi,t, where a population could either persist (zi,t = 1) or becomeextirpated (zi,t = 0), given that it persisted the year before (zi,t-1 = 1).We assigned each population a state of zi,1 = 1 (representing the firstyear [1950] in the model time frame) and assumed that any area wheresouthern hognose snakes have ever been observed had a populationpersisting at that location in 1950. We also assumed each populationhad persisted each year (zi,t = 1) between 1950 and the year of lastobservation and supplied these known states as data in the model. Themodel then predicted z states each year after the year of last observa-tion. The prediction of a z state in any year following a final sighting is arandom outcome of the model (0 or 1) and is a deterministic outcome(1) for years prior to and including the final year when snakes wereobserved. We modeled the observation process of detecting at least onesouthern hognose snake in a population in a given year (yi,t = 1, 0otherwise), conditional on the population still persisting as a Bernoullitrial with probability pi,t.
This framework required a few key assumptions. Importantly, ourmodel lacked a recolonization mechanism typical of occupancy models(MacKenzie et al., 2003; Kéry et al., 2010), as preliminary models thatincluded a recolonization parameter showed poor convergence andproduced unreliable estimates. Although not including recolonizationcould lead to underestimates of persistence, our study focused on asmall, terrestrial snake and defined population boundaries relativelylarger than the small home ranges and movement distances suspectedfor the species (SSA experts, pers. comm.; Beane et al., 2014; Willsonet al., 2018). In this context, it is reasonable to assume colonizationrates are negligible. It is also reasonable to assume populations per-sisted between 1950 and the year of last observation. The species hasrelatively low dispersal distances and is very difficult to detect (Beaneet al., 2014; Willson et al., 2018), so it seems more likely that popu-lations not discovered until after 1950 had simply persisted undetectedin 1950 rather than had colonized the area more recently through im-migration.
We modeled persistence as a logit-linear function of a population'srepresentative unit and spatial conditions using the relationship
= + + +φ μ β X β X β Xlogit( ) 1 2 3i t rep HSI i t protect i t near i t, , , , (1)
where estimated parameters were μrep (representative unit-specific in-tercept), βHSI (fixed effect for mean HSI), βprotect (fixed effect for per-centage of a population boundary on protected lands), and βnear (fixedeffect for number of nearby populations), and X1-3i,t were spatialcondition data. We note that spatial condition data did not vary by timein the current persistence model but were allowed to vary annuallywhen projecting future conditions (see Section 2.4). We assumed thatspatial conditions, which were derived from relatively recent datasets(see Crawford et al., 2020), are representative of conditions that haveinfluenced persistence since 1950. We modeled detection as a logit-linear function of a long-term trend and search effort using the re-lationship
= + +p μ β t β slogit( )i t mean trend effort i t, , (2)
where estimated parameters were μmean (intercept), βtrend (fixed effectfor a linear temporal trend in detection), and βeffort (fixed effect forsearch effort). Predictors were year, t, and search effort history, si,t(scaled number of observer-days), specific to that population and year.We included the trend effect to allow mean detection to change overtime, given that the quality of search effort may be higher in recentyears due to more easily accessible information on where and how to
search for snake species.We used standard practices for fitting Bayesian models following
Kery and Schaub (2012). We fit the persistence model with Markovchain Monte Carlo (MCMC) methods in Jags called from R via theR2jags package (Su and Yajima, 2012). We assigned diffuse prior dis-tributions for all parameters, and we generated three MCMC chainsusing 100,000 iterations where we retained every third iteration fromthe last 50,000 iterations, yielding a final set of 50,001 samples fromposterior distributions of the parameters. We assessed convergence forall models by visually inspecting chain mixing in MCMC trace plots,confirming unimodality in posterior distribution plots, and assessing ifBrooks-Gelman-Rubin statistics < 1.1 for all parameters. We assessedmodel fit by conducting posterior predictive checks (Gelman et al.,2000). For the latter technique, we simulated datasets using parametersestimated in the model, calculated the mean number of populationswith simulated detections of southern hognose snakes in three timeperiods (1970–1974, 2000–2004, and 2014–2018), and comparedmean observations in these periods from the real dataset with valuesfrom simulated datasets. We based parameter inferences on posteriormeans and 95% Bayesian credible intervals (BCIs; 2.5th–97.5th per-centile of the distribution) and interpreted parameters as having eco-logically important impacts when BCIs did not overlap 0.
We used model outputs to characterize range-wide resiliency, re-dundancy, and representation for the southern hognose snake. We es-timated population-specific resiliency as the probability that each po-pulation persisted in 2018 (t = 69) by calculating the percentage ofmodel iterations where zi,69 = 1. We interpret this value as the prob-ability a population has persisted through the entire time period mod-eled (hereafter, current persistence), and we note that this value differsfrom φi, t (annual persistence) estimated in the model that reflects theprobability a population will persist into the next year. We further as-sessed redundancy and representation by summing the number of po-pulations predicted to persist in 2018 within each representative unitand range-wide in each iteration of the model and then used all modeliterations to calculate the mean (the most likely prediction) and 95%BCIs for the predicted number of persisting populations in 2018.Because status assessments and conservation planning involve makingvalue judgments related to risk tolerance, we summarized results usinga range of persistence probability thresholds that may aid users inevaluating species conditions. We grouped populations based on cur-rent persistence probabilities into the following five categories: unlikelyto persist or “extirpated” (persistence < 50%), more likely than not onlandscape (50–79%), very likely on landscape (80–89%), highly likelyon landscape (90–95%), and extremely likely on landscape or “extant”(95–100%). We characterized redundancy using the number of popu-lations above a certain persistence threshold range-wide. We char-acterized representation using the number of populations above a cer-tain persistence threshold in each representative unit, as well as thespatial distribution of extant populations relative to the historical spe-cies range. We also note that the laws of probability make it so thismean number of persisting populations (calculated using all modeliterations) approximately equals the number of populations with a 50%or greater persistence probability.
2.4. Future projection model
We developed a projection model that used a Markovian process topredict the probability of persistence for each population through 2080based on the current probability of persistence and future predictedchanges in habitat suitability and land protection, given conditionsspecified in seven plausible scenarios of stressors and managementstrategies (Table 2). The first three scenarios projected persistenceunder varying levels of future stressors (threats) with current man-agement conditions continuing; the last four scenarios used the mostlikely level of future stressors and varying levels of management effort.
Across scenarios, we considered several processes that may
B.A. Crawford, et al. Biological Conservation 243 (2020) 108489
5
influence future habitat suitability and population persistence of thesouthern hognose snake and used spatial analyses to capture changes inland cover and fire frequency rasters (developed in Crawford et al.,2020). Specifically, we captured the effects of future urbanization andsea level rise on compatible land cover within population boundaries.We represented low, medium, and high levels of urbanization usingareas predicted to have a 0.9, 0.5, and 0.1 probability of being devel-oped by 2080, respectively, in the Slope, Land cover, Exclusion, Ur-banization, Transportation, and Hillshade (SLEUTH) model (Chaudhuriand Clarke, 2013; Terando et al., 2014). Thus, the scenario using a lowlevel of urbanization only considered areas to be urbanized in the futureif the SLEUTH model predicted this with a 90% or greater probability;the scenario using a high level of urbanization included additional areaspredicted to be developed with a lower (10% or greater) probability.We represented low, medium, and high levels of sea level rise usingcoastal areas in NOAA's spatial datasets (https://coast.noaa.gov/slr/;accessed 15 Nov 2018) predicted to be lost by 2080 to inundationheights of 1, 3, and 6 ft. (0.3, 0.9, 1.8 m), respectively. We removed anyareas currently classified as compatible land that overlapped futureareas of urbanization and sea level rise by 2080 and interpolated annualhabitat loss each year between 2018 and then. We also captured theeffects of urbanization on fire frequency. This was done to account forfire exclusion/suppression that often occurs in habitat adjacent to urbanareas, known as the wildland-urban interface, due to safety and smokemanagement restrictions (Theobald and Romme, 2007). Studies havefound evidence of fire exclusion/suppression in habitats within 600 mto 5 km of urban areas (Theobald and Romme, 2007; Pickens et al.,2017a). Therefore, we chose a moderate value of 3.2 km (2 mi) tocapture the interaction between urbanization and fire frequency. Usingthe areas predicted to be urbanized under low, medium, and highscenarios, we applied a distance-weighted reduction in fire frequency tothe current fire raster where the value of any cell in a future urban areawas reduced by 100%, the value of any cell between 0 and 3.2 km awayfrom an urban area was reduced proportionally to its distance, and thevalue of any cell further than 3.2 km away from an urban area wasunchanged.
We made additional changes to spatial layers to capture the effectsof the last four scenarios varying in management practices, which rangefrom lowest to highest relative management effort. In the “DecreasedManagement” scenario, we decreased future fire frequency by 20% onprotected lands to simulate the equivalent of applying one less pre-scribed burn every five years in these areas, representing cost or otherlogistical constraints to prescribed burning in the future. In the“Improved Management” scenario, we increased future fire frequencyby 20% on protected lands to simulate applying one additional fireevery five years in these areas. In the “Protect More Populations”
scenario, we represented conditions where current management efforts,including State-level parcel acquisition and regional longleaf pine re-storation facilitated by the Longleaf Alliance (a non-governmental or-ganization), continue and increase in the future. We selected popula-tions that are very likely to currently persist (≥80% current persistenceprobability) but are not currently protected (< 10% on protected land)and simulated the following changes: (i) we changed the percentage ofthe population on protected land to 90% to simulate protecting themajority of land within the population boundary, (ii) we increased thepercentage of compatible land cover by 10% to simulate restoring ha-bitat in the population area, and (iii) we increased future fire frequencyon protected lands to simulate applying one additional fire every fiveyears in these areas. In the “Protect Even More Populations” scenario(the most intensive and costly management scenario), we simulated thesame changes as the previous scenario except we selected populationsthat are more likely than not to persist (> 50% current persistenceprobability) but are not currently protected (< 10% on protected land).See U.S. Fish and Wildlife Service (2019, Section 5.1.2) for additionalinformation on future scenarios.
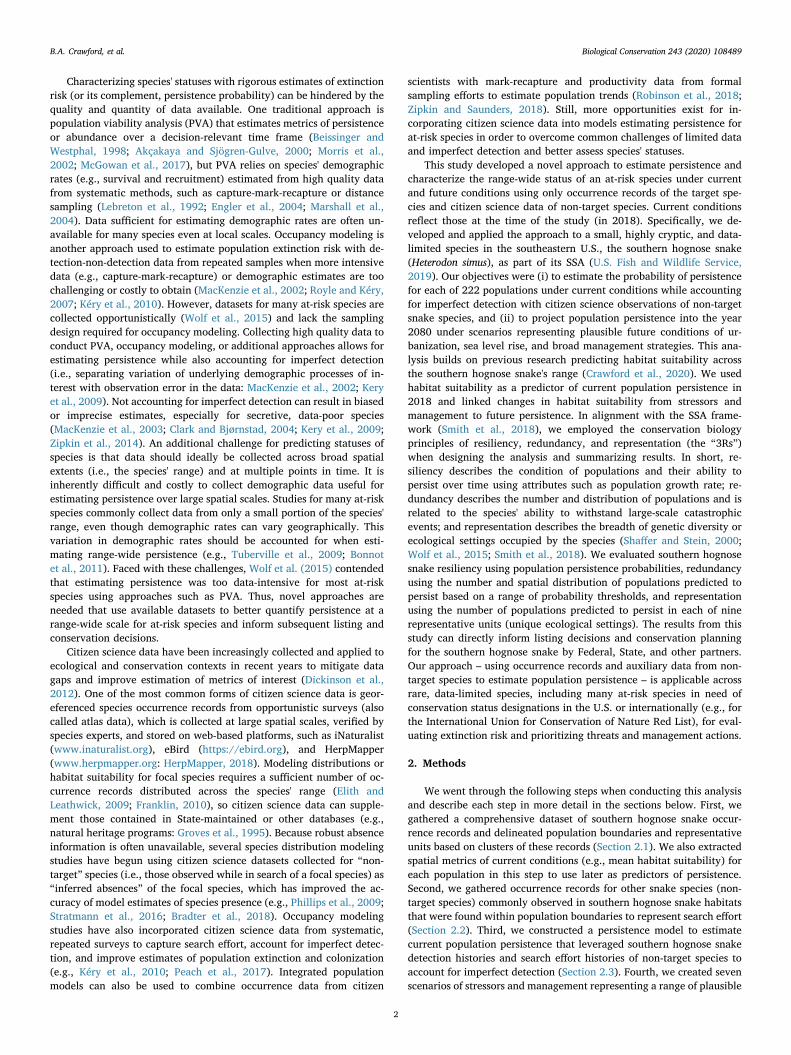
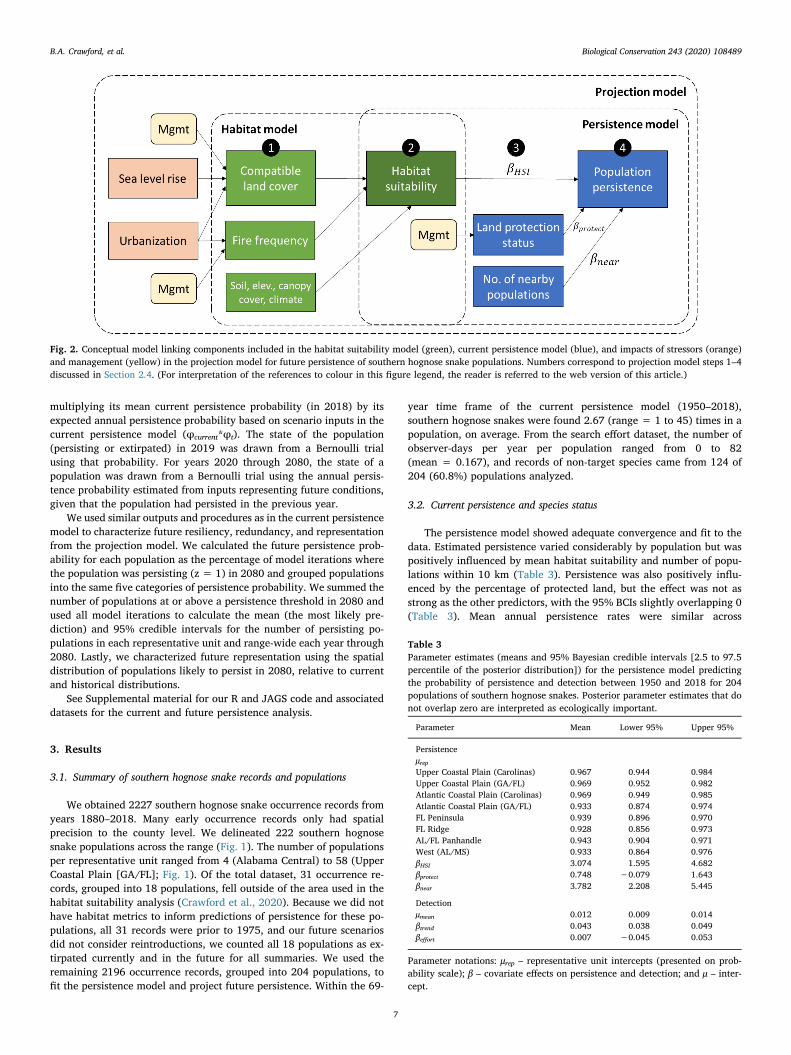
We built a multi-loop stochastic simulation model (followingMcGowan et al., 2014) that allowed us to simulate thousands of re-plicates of each population under different scenarios and examine therelationship between threats and management with future persistence.This approach accounted for random year-to-year stochasticity as wellas uncertainty around rates (i.e., annual persistence probability) esti-mated from the current persistence model. The model looped through10,000 iterations for each of the seven scenarios. In each iteration, itsimulated persistence states (zi,t) of each southern hognose snake po-pulation over 62 time steps from the present (2018) to 2080. In eachiteration of the model, future population persistence was predictedusing a series of four steps (Fig. 2). In step 1, we calculated annualvalues of land cover, fire frequency, and percentage of protected landfor each population using the spatial layers representing stressors andmanagement in each scenario. In step 2, we used inputs of future landcover and fire frequency, along with all other constant predictors usedin the habitat suitability model (e.g., soil drainage, local elevation:Crawford et al., 2020), to calculate mean habitat suitability for eachpopulation and year using the predict.glm function in R, given condi-tions of each scenario. In step 3, we randomly selected a single set ofposterior estimates of all parameters (e.g., representative unit intercept,effect of HSI) generated from one iteration of the current persistencemodel to account for parametric uncertainty. In step 4, we used theposterior estimates and scenario-, population-, and year-specific inputsto simulate populations persisting or becoming extirpated each yearthrough 2080 using the current persistence model structure. Theprobability of persistence of a population in 2019 was predicted by
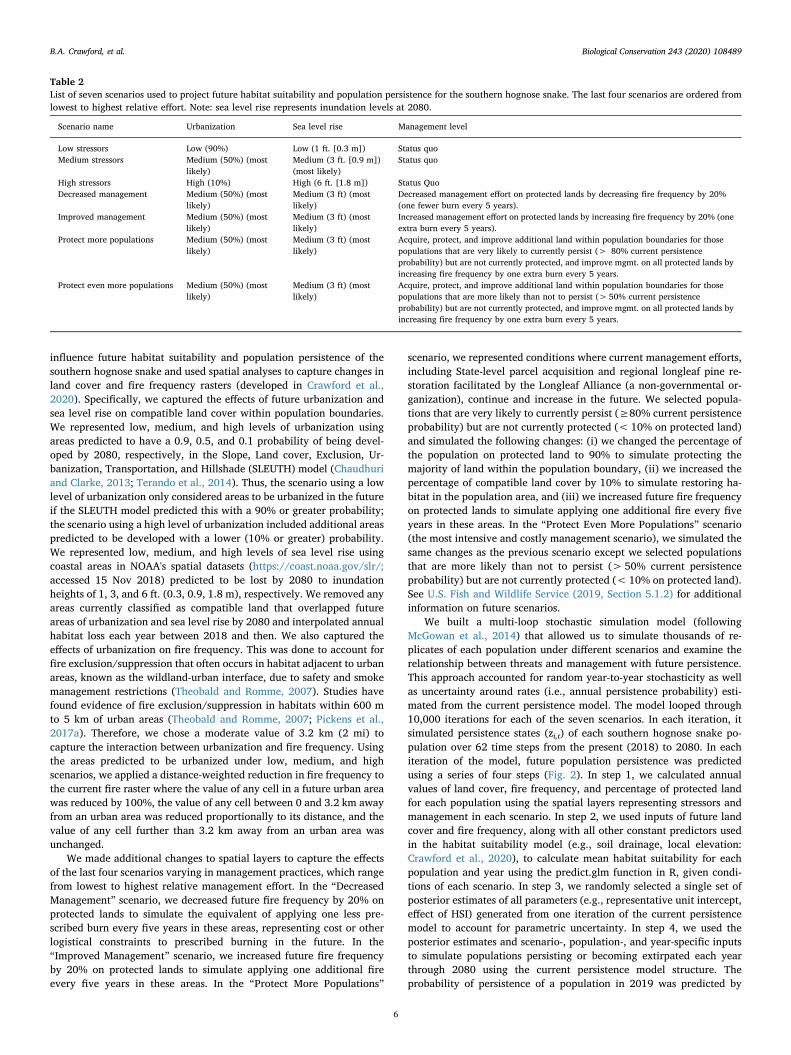
Table 2List of seven scenarios used to project future habitat suitability and population persistence for the southern hognose snake. The last four scenarios are ordered fromlowest to highest relative effort. Note: sea level rise represents inundation levels at 2080.
Scenario name Urbanization Sea level rise Management level
Low stressors Low (90%) Low (1 ft. [0.3 m]) Status quoMedium stressors Medium (50%) (most
likely)Medium (3 ft. [0.9 m])(most likely)
Status quo
High stressors High (10%) High (6 ft. [1.8 m]) Status QuoDecreased management Medium (50%) (most
likely)Medium (3 ft) (mostlikely)
Decreased management effort on protected lands by decreasing fire frequency by 20%(one fewer burn every 5 years).
Improved management Medium (50%) (mostlikely)
Medium (3 ft) (mostlikely)
Increased management effort on protected lands by increasing fire frequency by 20% (oneextra burn every 5 years).
Protect more populations Medium (50%) (mostlikely)
Medium (3 ft) (mostlikely)
Acquire, protect, and improve additional land within population boundaries for thosepopulations that are very likely to currently persist (> 80% current persistenceprobability) but are not currently protected, and improve mgmt. on all protected lands byincreasing fire frequency by one extra burn every 5 years.
Protect even more populations Medium (50%) (mostlikely)
Medium (3 ft) (mostlikely)
Acquire, protect, and improve additional land within population boundaries for thosepopulations that are more likely than not to persist (> 50% current persistenceprobability) but are not currently protected, and improve mgmt. on all protected lands byincreasing fire frequency by one extra burn every 5 years.
B.A. Crawford, et al. Biological Conservation 243 (2020) 108489
6
multiplying its mean current persistence probability (in 2018) by itsexpected annual persistence probability based on scenario inputs in thecurrent persistence model (φcurrent*φt). The state of the population(persisting or extirpated) in 2019 was drawn from a Bernoulli trialusing that probability. For years 2020 through 2080, the state of apopulation was drawn from a Bernoulli trial using the annual persis-tence probability estimated from inputs representing future conditions,given that the population had persisted in the previous year.
We used similar outputs and procedures as in the current persistencemodel to characterize future resiliency, redundancy, and representationfrom the projection model. We calculated the future persistence prob-ability for each population as the percentage of model iterations wherethe population was persisting (z = 1) in 2080 and grouped populationsinto the same five categories of persistence probability. We summed thenumber of populations at or above a persistence threshold in 2080 andused all model iterations to calculate the mean (the most likely pre-diction) and 95% credible intervals for the number of persisting po-pulations in each representative unit and range-wide each year through2080. Lastly, we characterized future representation using the spatialdistribution of populations likely to persist in 2080, relative to currentand historical distributions.
See Supplemental material for our R and JAGS code and associateddatasets for the current and future persistence analysis.
3. Results
3.1. Summary of southern hognose snake records and populations
We obtained 2227 southern hognose snake occurrence records fromyears 1880–2018. Many early occurrence records only had spatialprecision to the county level. We delineated 222 southern hognosesnake populations across the range (Fig. 1). The number of populationsper representative unit ranged from 4 (Alabama Central) to 58 (UpperCoastal Plain [GA/FL]; Fig. 1). Of the total dataset, 31 occurrence re-cords, grouped into 18 populations, fell outside of the area used in thehabitat suitability analysis (Crawford et al., 2020). Because we did nothave habitat metrics to inform predictions of persistence for these po-pulations, all 31 records were prior to 1975, and our future scenariosdid not consider reintroductions, we counted all 18 populations as ex-tirpated currently and in the future for all summaries. We used theremaining 2196 occurrence records, grouped into 204 populations, tofit the persistence model and project future persistence. Within the 69-
year time frame of the current persistence model (1950–2018),southern hognose snakes were found 2.67 (range = 1 to 45) times in apopulation, on average. From the search effort dataset, the number ofobserver-days per year per population ranged from 0 to 82(mean = 0.167), and records of non-target species came from 124 of204 (60.8%) populations analyzed.
3.2. Current persistence and species status
The persistence model showed adequate convergence and fit to thedata. Estimated persistence varied considerably by population but waspositively influenced by mean habitat suitability and number of popu-lations within 10 km (Table 3). Persistence was also positively influ-enced by the percentage of protected land, but the effect was not asstrong as the other predictors, with the 95% BCIs slightly overlapping 0(Table 3). Mean annual persistence rates were similar across
Fig. 2. Conceptual model linking components included in the habitat suitability model (green), current persistence model (blue), and impacts of stressors (orange)and management (yellow) in the projection model for future persistence of southern hognose snake populations. Numbers correspond to projection model steps 1–4discussed in Section 2.4. (For interpretation of the references to colour in this figure legend, the reader is referred to the web version of this article.)
Table 3Parameter estimates (means and 95% Bayesian credible intervals [2.5 to 97.5percentile of the posterior distribution]) for the persistence model predictingthe probability of persistence and detection between 1950 and 2018 for 204populations of southern hognose snakes. Posterior parameter estimates that donot overlap zero are interpreted as ecologically important.
Parameter Mean Lower 95% Upper 95%
PersistenceμrepUpper Coastal Plain (Carolinas) 0.967 0.944 0.984Upper Coastal Plain (GA/FL) 0.969 0.952 0.982Atlantic Coastal Plain (Carolinas) 0.969 0.949 0.985Atlantic Coastal Plain (GA/FL) 0.933 0.874 0.974FL Peninsula 0.939 0.896 0.970FL Ridge 0.928 0.856 0.973AL/FL Panhandle 0.943 0.904 0.971West (AL/MS) 0.933 0.864 0.976βHSI 3.074 1.595 4.682βprotect 0.748 −0.079 1.643βnear 3.782 2.208 5.445
Detectionμmean 0.012 0.009 0.014βtrend 0.043 0.038 0.049βeffort 0.007 −0.045 0.053
Parameter notations: μrep – representative unit intercepts (presented on prob-ability scale); β – covariate effects on persistence and detection; and μ – inter-cept.
B.A. Crawford, et al. Biological Conservation 243 (2020) 108489
7
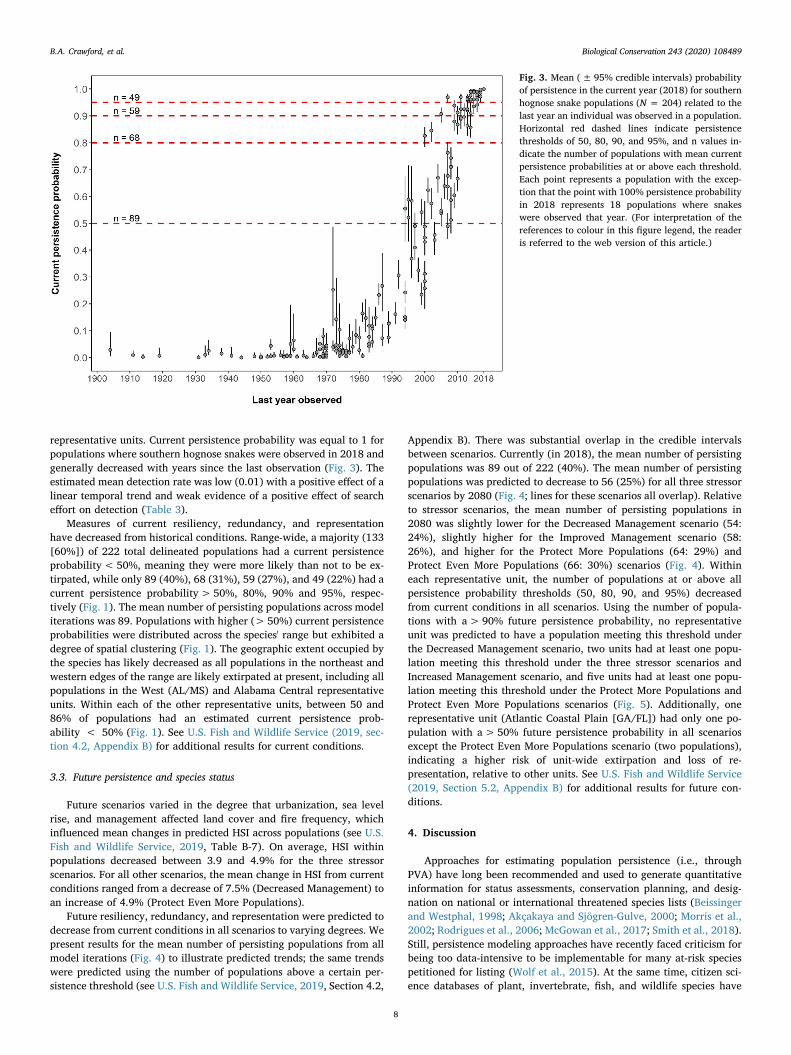
representative units. Current persistence probability was equal to 1 forpopulations where southern hognose snakes were observed in 2018 andgenerally decreased with years since the last observation (Fig. 3). Theestimated mean detection rate was low (0.01) with a positive effect of alinear temporal trend and weak evidence of a positive effect of searcheffort on detection (Table 3).
Measures of current resiliency, redundancy, and representationhave decreased from historical conditions. Range-wide, a majority (133[60%]) of 222 total delineated populations had a current persistenceprobability< 50%, meaning they were more likely than not to be ex-tirpated, while only 89 (40%), 68 (31%), 59 (27%), and 49 (22%) had acurrent persistence probability> 50%, 80%, 90% and 95%, respec-tively (Fig. 1). The mean number of persisting populations across modeliterations was 89. Populations with higher (> 50%) current persistenceprobabilities were distributed across the species' range but exhibited adegree of spatial clustering (Fig. 1). The geographic extent occupied bythe species has likely decreased as all populations in the northeast andwestern edges of the range are likely extirpated at present, including allpopulations in the West (AL/MS) and Alabama Central representativeunits. Within each of the other representative units, between 50 and86% of populations had an estimated current persistence prob-ability < 50% (Fig. 1). See U.S. Fish and Wildlife Service (2019, sec-tion 4.2, Appendix B) for additional results for current conditions.
3.3. Future persistence and species status
Future scenarios varied in the degree that urbanization, sea levelrise, and management affected land cover and fire frequency, whichinfluenced mean changes in predicted HSI across populations (see U.S.Fish and Wildlife Service, 2019, Table B-7). On average, HSI withinpopulations decreased between 3.9 and 4.9% for the three stressorscenarios. For all other scenarios, the mean change in HSI from currentconditions ranged from a decrease of 7.5% (Decreased Management) toan increase of 4.9% (Protect Even More Populations).
Future resiliency, redundancy, and representation were predicted todecrease from current conditions in all scenarios to varying degrees. Wepresent results for the mean number of persisting populations from allmodel iterations (Fig. 4) to illustrate predicted trends; the same trendswere predicted using the number of populations above a certain per-sistence threshold (see U.S. Fish and Wildlife Service, 2019, Section 4.2,
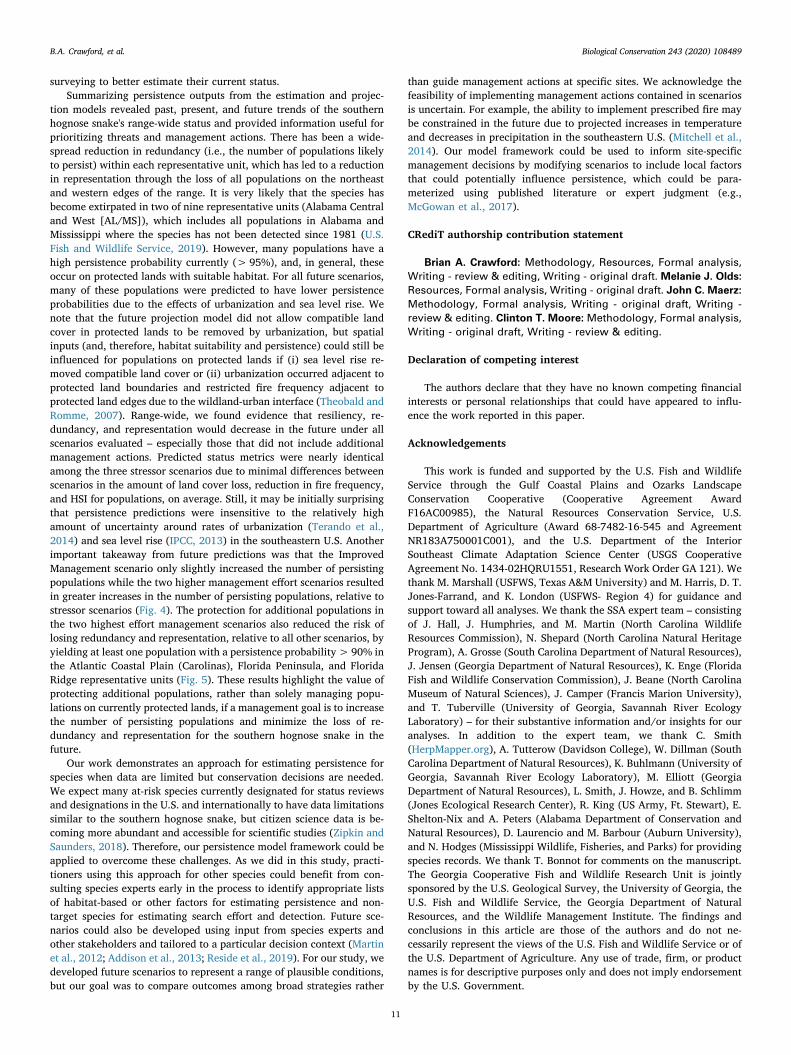
Appendix B). There was substantial overlap in the credible intervalsbetween scenarios. Currently (in 2018), the mean number of persistingpopulations was 89 out of 222 (40%). The mean number of persistingpopulations was predicted to decrease to 56 (25%) for all three stressorscenarios by 2080 (Fig. 4; lines for these scenarios all overlap). Relativeto stressor scenarios, the mean number of persisting populations in2080 was slightly lower for the Decreased Management scenario (54:24%), slightly higher for the Improved Management scenario (58:26%), and higher for the Protect More Populations (64: 29%) andProtect Even More Populations (66: 30%) scenarios (Fig. 4). Withineach representative unit, the number of populations at or above allpersistence probability thresholds (50, 80, 90, and 95%) decreasedfrom current conditions in all scenarios. Using the number of popula-tions with a> 90% future persistence probability, no representativeunit was predicted to have a population meeting this threshold underthe Decreased Management scenario, two units had at least one popu-lation meeting this threshold under the three stressor scenarios andIncreased Management scenario, and five units had at least one popu-lation meeting this threshold under the Protect More Populations andProtect Even More Populations scenarios (Fig. 5). Additionally, onerepresentative unit (Atlantic Coastal Plain [GA/FL]) had only one po-pulation with a> 50% future persistence probability in all scenariosexcept the Protect Even More Populations scenario (two populations),indicating a higher risk of unit-wide extirpation and loss of re-presentation, relative to other units. See U.S. Fish and Wildlife Service(2019, Section 5.2, Appendix B) for additional results for future con-ditions.
4. Discussion
Approaches for estimating population persistence (i.e., throughPVA) have long been recommended and used to generate quantitativeinformation for status assessments, conservation planning, and desig-nation on national or international threatened species lists (Beissingerand Westphal, 1998; Akçakaya and Sjögren-Gulve, 2000; Morris et al.,2002; Rodrigues et al., 2006; McGowan et al., 2017; Smith et al., 2018).Still, persistence modeling approaches have recently faced criticism forbeing too data-intensive to be implementable for many at-risk speciespetitioned for listing (Wolf et al., 2015). At the same time, citizen sci-ence databases of plant, invertebrate, fish, and wildlife species have
Fig. 3. Mean (± 95% credible intervals) probabilityof persistence in the current year (2018) for southernhognose snake populations (N = 204) related to thelast year an individual was observed in a population.Horizontal red dashed lines indicate persistencethresholds of 50, 80, 90, and 95%, and n values in-dicate the number of populations with mean currentpersistence probabilities at or above each threshold.Each point represents a population with the excep-tion that the point with 100% persistence probabilityin 2018 represents 18 populations where snakeswere observed that year. (For interpretation of thereferences to colour in this figure legend, the readeris referred to the web version of this article.)
B.A. Crawford, et al. Biological Conservation 243 (2020) 108489
8
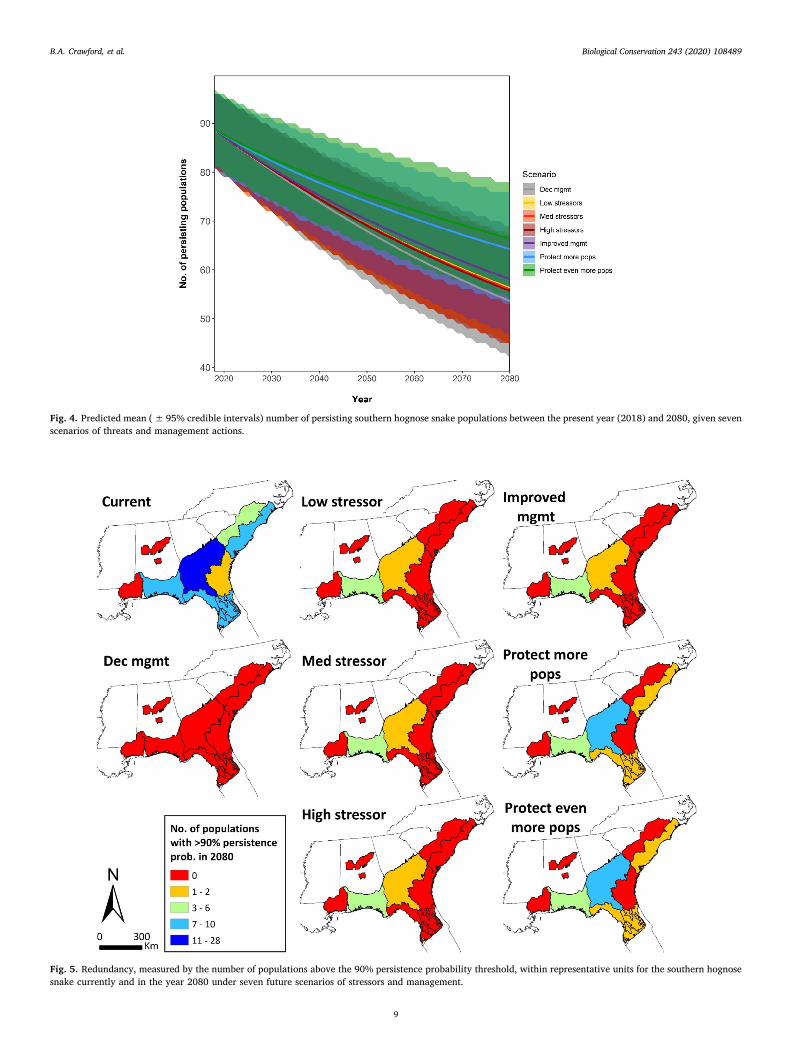
Fig. 4. Predicted mean (±95% credible intervals) number of persisting southern hognose snake populations between the present year (2018) and 2080, given sevenscenarios of threats and management actions.
Fig. 5. Redundancy, measured by the number of populations above the 90% persistence probability threshold, within representative units for the southern hognosesnake currently and in the year 2080 under seven future scenarios of stressors and management.
B.A. Crawford, et al. Biological Conservation 243 (2020) 108489
9

become increasingly populated and accessible, and studies have begundeveloping approaches to use these datasets to better estimate certainparameters like habitat suitability and occupancy (e.g., Kéry et al.,2010; Peach et al., 2017; Robinson et al., 2018). Our work contributesan additional example of using citizen science data of non-target speciesas inferred absences when target species data are limited, but it alsodemonstrates a method for using these minimal inputs to estimatepersistence to inform status assessments and conservation decisions.Estimating persistence allowed us to characterize the southern hognosesnake's overall status and revealed several patterns in resiliency, re-dundancy, and representation: (i) a majority (60%) of all known po-pulations have likely become extirpated by 2018, (ii) the species haslikely experienced a range contraction as two of nine representativeunits are likely extirpated, and at least one additional unit is at risk ofextirpation by 2080, and (iii) although more populations are predictedto become extirpated in the future under all scenarios tested, manage-ment strategies to acquire and improve habitat on currently un-protected lands with existing populations could lessen the rate of po-pulation declines.
It is important to acknowledge that persistence models and esti-mates, however rigorous, do not solely determine any listing or con-servation decision for a species. These decisions involve other elementssuch as stakeholders' values and risk tolerance that cannot be addressedwith scientific information. However, using a persistence modelingapproach like ours ensures the methods used to characterize a species'status are transparent and replicable, the results explicitly capture ex-tinction risk and uncertainty, and any subsequent policy decisions arebased on the best available scientific information. While persistenceprobability for a population offers a straightforward metric to comparewith a decision maker's risk tolerance level, persistence can furtherserve as the basis for summarizing other metrics important for char-acterizing a species' status at broader scales. In our study, we usedmultiple persistence probability thresholds (analogous to levels of risktolerance) to capture principles of redundancy and representationacross the southern hognose snake's range. We expressed these princi-ples as the number of populations predicted to persist and the numberand extent of ecological settings predicted to be occupied by popula-tions, respectively. These results provide evidence regarding the spe-cies' ability to withstand large-scale catastrophic events and changes ingenetic or ecological breadth of the species under current and futureconditions that is valuable for listing and conservation planning deci-sions for at-risk species (Shaffer and Stein, 2000; Wolf et al., 2015;Smith et al., 2018).
The persistence and detection components of our model frameworkhave limitations that should be considered when interpreting results. Asstated previously, our adaptation of the Cormack-Jolly-Seber model(Lebreton et al., 1992; Brooks et al., 2000) lacked a recolonizationmechanism typical of occupancy models (MacKenzie et al., 2003; Kéryet al., 2010). We also assumed persistence probability responded onlyto landscape-based site predictors (habitat suitability, proportion ofpopulation area in protected status, number of nearby populations) andnot to internal population attributes commonly used in PVAs (e.g.,population growth or recruitment rates: McGowan et al., 2017). Thesemore complex frameworks require basic life history and demographicinformation that have not been estimated for southern hognose snakes.Within the context of our study (focused on a small-bodied species withlow detection and limited dispersal), it is reasonable to assume colo-nization rates are negligible and population dynamics are more stronglyinfluenced by annual persistence rates in the model, which account forinternal processes of survival and recruitment. Therefore, it is reason-able that our model can yield accurate estimates of persistence over agiven time frame that are valuable for assessing risk for species withsimilar traits.
Our model hinged on accounting for imperfect detection with ci-tizen science data of non-target species, which required other as-sumptions. In addition to the assumptions stated previously (see Section
2.2), we assumed that records of non-target snake species withinsouthern hognose snake population boundaries indicate that preferredhabitat of the southern hognose snake was searched. Although manynon-target species are also found in more mesic habitats that may occurin population boundaries but are not used by southern hognose snakes,the list of 13 non-target species includes those most commonly foundduring surveys targeting southern hognose snakes according to expertjudgment and previous work (Enge and Wood, 2002). Applying ourapproach for other species will require careful consideration of the setof non-target species used to most accurately represent cases whereappropriate searches were conducted but the target species was notdetected. We also note that we retained the effect of search effort in themodel even though it had a small (but still positive) effect on detectionprobability in order to demonstrate its potential application for otherstudies using citizen science data. This estimate may have been reducedby the inclusion of the temporal trend effect, as the two effects mayhave been correlated. The number of non-target records generally in-creased over the 69-year period modeled due to many social andtechnological factors (e.g., emergence of citizen science databases,improvement of georeferencing software on phones). Although in-cluding both effects may have slightly influenced the precision ofparameter estimates in this study, other studies focused on shortertemporal scales (< 10 years) would likely not require a trend effect andcould better estimate the isolated effect of search effort. Additionalwork could explore any interactions between search effort and temporalor spatial trends that could relate to the ability of citizen scientists todetect target species. Lastly, we caution that although citizen sciencedata can be effectively integrated in models to estimate populationpersistence, improving the quality and quantity of data through sys-tematic surveys (e.g., detection-non-detection data) and other researchefforts (e.g., telemetry, mark-recapture) will reduce the number of re-quired model assumptions and greatly improve the accuracy of esti-mates needed for status assessments and conservation planning for at-risk species.
The results from the current persistence model offer insights into theeffects of site conditions on risk of extinction for southern hognosesnake populations. Relationships between persistence probability andsite predictors agree with life history studies and expert judgment thatthe species uses and survives best in fire-dependent, xeric habitat (e.g.,longleaf pine sandhills: Tuberville et al., 2000; Beane et al., 2014;Willson et al., 2018) – attributes that were associated with a higher HSI(Crawford et al., 2020). Still, a specific site may have additional factors,such as presence of non-native invasive species or a history of over-collection (Tuberville et al., 2000), that may influence estimates butwere not able to be captured in this analysis. It is reasonable that po-pulations on protected lands likely have a reduced risk to direct threatssuch as habitat loss, road mortality, and collection, especially if pro-tected lands have been established and managed for conservation goalsover longer periods, which would cause higher population persistenceprobabilities. This relationship supports previous findings of Tubervilleet al. (2000) that many southern hognose snake populations on pro-tected lands appeared to be stable. The strong relationship betweennumber of populations within 10 km and persistence could support thatnearby populations may provide opportunities for “rescue” where re-colonization can occur after a catastrophe or could provide a signal thatthere are localized conditions (e.g., geological, climatic, managementpractices) that promote long-term population persistence that have notbeen otherwise captured in our analyses. However, we caution that thisrelationship is somewhat phenomenological without further researchinto dispersal capabilities of the species (but see Willson et al., 2018) orinfluential spatial attributes at local scales. Lastly, the current persis-tence model also estimated higher than average persistence prob-abilities for certain populations that had favorable site-level conditions(i.e., high habitat suitability, percentage of protected land) but no re-cord of southern hognose snakes or non-target species (i.e., no searcheffort) in many years (Fig. 3). These sites could be prioritized for
B.A. Crawford, et al. Biological Conservation 243 (2020) 108489
10
surveying to better estimate their current status.Summarizing persistence outputs from the estimation and projec-
tion models revealed past, present, and future trends of the southernhognose snake's range-wide status and provided information useful forprioritizing threats and management actions. There has been a wide-spread reduction in redundancy (i.e., the number of populations likelyto persist) within each representative unit, which has led to a reductionin representation through the loss of all populations on the northeastand western edges of the range. It is very likely that the species hasbecome extirpated in two of nine representative units (Alabama Centraland West [AL/MS]), which includes all populations in Alabama andMississippi where the species has not been detected since 1981 (U.S.Fish and Wildlife Service, 2019). However, many populations have ahigh persistence probability currently (> 95%), and, in general, theseoccur on protected lands with suitable habitat. For all future scenarios,many of these populations were predicted to have lower persistenceprobabilities due to the effects of urbanization and sea level rise. Wenote that the future projection model did not allow compatible landcover in protected lands to be removed by urbanization, but spatialinputs (and, therefore, habitat suitability and persistence) could still beinfluenced for populations on protected lands if (i) sea level rise re-moved compatible land cover or (ii) urbanization occurred adjacent toprotected land boundaries and restricted fire frequency adjacent toprotected land edges due to the wildland-urban interface (Theobald andRomme, 2007). Range-wide, we found evidence that resiliency, re-dundancy, and representation would decrease in the future under allscenarios evaluated – especially those that did not include additionalmanagement actions. Predicted status metrics were nearly identicalamong the three stressor scenarios due to minimal differences betweenscenarios in the amount of land cover loss, reduction in fire frequency,and HSI for populations, on average. Still, it may be initially surprisingthat persistence predictions were insensitive to the relatively highamount of uncertainty around rates of urbanization (Terando et al.,2014) and sea level rise (IPCC, 2013) in the southeastern U.S. Anotherimportant takeaway from future predictions was that the ImprovedManagement scenario only slightly increased the number of persistingpopulations while the two higher management effort scenarios resultedin greater increases in the number of persisting populations, relative tostressor scenarios (Fig. 4). The protection for additional populations inthe two highest effort management scenarios also reduced the risk oflosing redundancy and representation, relative to all other scenarios, byyielding at least one population with a persistence probability> 90% inthe Atlantic Coastal Plain (Carolinas), Florida Peninsula, and FloridaRidge representative units (Fig. 5). These results highlight the value ofprotecting additional populations, rather than solely managing popu-lations on currently protected lands, if a management goal is to increasethe number of persisting populations and minimize the loss of re-dundancy and representation for the southern hognose snake in thefuture.
Our work demonstrates an approach for estimating persistence forspecies when data are limited but conservation decisions are needed.We expect many at-risk species currently designated for status reviewsand designations in the U.S. and internationally to have data limitationssimilar to the southern hognose snake, but citizen science data is be-coming more abundant and accessible for scientific studies (Zipkin andSaunders, 2018). Therefore, our persistence model framework could beapplied to overcome these challenges. As we did in this study, practi-tioners using this approach for other species could benefit from con-sulting species experts early in the process to identify appropriate listsof habitat-based or other factors for estimating persistence and non-target species for estimating search effort and detection. Future sce-narios could also be developed using input from species experts andother stakeholders and tailored to a particular decision context (Martinet al., 2012; Addison et al., 2013; Reside et al., 2019). For our study, wedeveloped future scenarios to represent a range of plausible conditions,but our goal was to compare outcomes among broad strategies rather
than guide management actions at specific sites. We acknowledge thefeasibility of implementing management actions contained in scenariosis uncertain. For example, the ability to implement prescribed fire maybe constrained in the future due to projected increases in temperatureand decreases in precipitation in the southeastern U.S. (Mitchell et al.,2014). Our model framework could be used to inform site-specificmanagement decisions by modifying scenarios to include local factorsthat could potentially influence persistence, which could be para-meterized using published literature or expert judgment (e.g.,McGowan et al., 2017).
CRediT authorship contribution statement
Brian A. Crawford: Methodology, Resources, Formal analysis,Writing - review & editing, Writing - original draft. Melanie J. Olds:Resources, Formal analysis, Writing - original draft. John C. Maerz:Methodology, Formal analysis, Writing - original draft, Writing -review & editing. Clinton T. Moore: Methodology, Formal analysis,Writing - original draft, Writing - review & editing.
Declaration of competing interest
The authors declare that they have no known competing financialinterests or personal relationships that could have appeared to influ-ence the work reported in this paper.
Acknowledgements
This work is funded and supported by the U.S. Fish and WildlifeService through the Gulf Coastal Plains and Ozarks LandscapeConservation Cooperative (Cooperative Agreement AwardF16AC00985), the Natural Resources Conservation Service, U.S.Department of Agriculture (Award 68-7482-16-545 and AgreementNR183A750001C001), and the U.S. Department of the InteriorSoutheast Climate Adaptation Science Center (USGS CooperativeAgreement No. 1434-02HQRU1551, Research Work Order GA 121). Wethank M. Marshall (USFWS, Texas A&M University) and M. Harris, D. T.Jones-Farrand, and K. London (USFWS- Region 4) for guidance andsupport toward all analyses. We thank the SSA expert team – consistingof J. Hall, J. Humphries, and M. Martin (North Carolina WildlifeResources Commission), N. Shepard (North Carolina Natural HeritageProgram), A. Grosse (South Carolina Department of Natural Resources),J. Jensen (Georgia Department of Natural Resources), K. Enge (FloridaFish and Wildlife Conservation Commission), J. Beane (North CarolinaMuseum of Natural Sciences), J. Camper (Francis Marion University),and T. Tuberville (University of Georgia, Savannah River EcologyLaboratory) – for their substantive information and/or insights for ouranalyses. In addition to the expert team, we thank C. Smith(HerpMapper.org), A. Tutterow (Davidson College), W. Dillman (SouthCarolina Department of Natural Resources), K. Buhlmann (University ofGeorgia, Savannah River Ecology Laboratory), M. Elliott (GeorgiaDepartment of Natural Resources), L. Smith, J. Howze, and B. Schlimm(Jones Ecological Research Center), R. King (US Army, Ft. Stewart), E.Shelton-Nix and A. Peters (Alabama Department of Conservation andNatural Resources), D. Laurencio and M. Barbour (Auburn University),and N. Hodges (Mississippi Wildlife, Fisheries, and Parks) for providingspecies records. We thank T. Bonnot for comments on the manuscript.The Georgia Cooperative Fish and Wildlife Research Unit is jointlysponsored by the U.S. Geological Survey, the University of Georgia, theU.S. Fish and Wildlife Service, the Georgia Department of NaturalResources, and the Wildlife Management Institute. The findings andconclusions in this article are those of the authors and do not ne-cessarily represent the views of the U.S. Fish and Wildlife Service or ofthe U.S. Department of Agriculture. Any use of trade, firm, or productnames is for descriptive purposes only and does not imply endorsementby the U.S. Government.
B.A. Crawford, et al. Biological Conservation 243 (2020) 108489
11

References
Addison, P.F., Rumpff, L., Bau, S.S., Carey, J.M., Chee, Y.E., Jarrad, F.C., McBride, M.F.,Burgman, M.A., 2013. Practical solutions for making models indispensable in con-servation decision-making. Divers. Distrib. 19, 490–502.
Akçakaya, H.R., Sjögren-Gulve, P., 2000. Population viability analyses in conservationplanning: an overview. Ecol. Bull. 48, 9–21.
Beane, J.C., Graham, S.P., Thorp, T.J., Pusser, L.T., 2014. Natural history of the southernhognose snake (Heterodon simus) in North Carolina, USA. Copeia 2014, 168–175.
Beissinger, S.R., Westphal, M.I., 1998. On the use of demographic models of populationviability in endangered species management. J. Wildl. Manag. 62, 821–841.
Bonnot, T.W., Thompson III, F.R., Millspaugh, J.J., 2011. Extension of landscape-basedpopulation viability models to ecoregional scales for conservation planning. Biol.Conserv. 144, 2041–2053.
Bradter, U., Mair, L., Jönsson, M., Knape, J., Singer, A., Snäll, T., 2018. Can opportu-nistically collected citizen science data fill a data gap for habitat suitability models ofless common species? Methods Ecol. Evol. 9, 1667–1678.
Brooks, S.P., Catchpole, E.A., Morgan, B.J., 2000. Bayesian animal survival estimation.Stat. Sci. 15, 357–376.
Chaudhuri, G., Clarke, K., 2013. The SLEUTH land use change model: a review.Environmental Resources Research 1, 88–105.
Clark, J.S., Bjørnstad, O.N., 2004. Population time series: process variability, observationerrors, missing values, lags, and hidden states. Ecology 85, 3140–3150.
Crawford, B.A., Maerz, J.C., Moore, C.T., 2020. Expert-informed habitat suitability ana-lysis for at-risk species assessment and conservation planning. Journal of Fish &Wildlife Management. https://doi.org/10.3996/092019-JFWM-075.
Dickinson, J.L., Shirk, J., Bonter, D., Bonney, R., Crain, R.L., Martin, J., Phillips, T.,Purcell, K., 2012. The current state of citizen science as a tool for ecological researchand public engagement. Front. Ecol. Environ. 10, 291–297.
Elith, J., Leathwick, J.R., 2009. Species distribution models: ecological explanation andprediction across space and time. Annu. Rev. Ecol. Evol. Syst. 40, 677–697.
Enge, K.M., Wood, K.N., 2002. A pedestrian road survey of an upland snake community inFlorida. Southeast. Nat. 1, 365–380.
Enge, K.M., Farmer, A.L., Mays, J.D., Castellón, T.D., Hill, E.P., Moler, P.E., 2014. Surveyof Winter-Breeding Amphibian Species. Final report. Florida Fish and WildlifeConservation Commission, Fish and Wildlife Research Institute, Gainesville, Florida,pp. 1–136. https://f50006a.eos-intl.net/ELIBSQL12_F50006A_Documents/14_Enge.pdf.
Engler, R., Guisan, A., Rechsteiner, L., 2004. An improved approach for predicting thedistribution of rare and endangered species from occurrence and pseudo-absencedata. J. Appl. Ecol. 41, 263–274.
Franklin, J., 2010. Mapping Species Distributions: Spatial Inference and Prediction.Cambridge University Press, Cambridge, UK.
Gelman, A., Goegebeur, Y., Tuerlinckx, F., Van Mechelen, I., 2000. Diagnostic checks fordiscrete data regression models using posterior predictive simulations. J. R. Stat. Soc.:Ser. C: Appl. Stat. 49, 247–268.
Gibbons, J.W., Scott, D.E., Ryan, T.J., Buhlmann, K.A., Tuberville, T.D., Metts, B.S.,Greene, J.L., Mills, T., Leiden, Y., Poppy, S., 2000. The global decline of reptiles, déjàvu amphibians. BioScience 50, 653–666.
Groves, C.R., Klein, M.L., Breden, T.F., 1995. Natural heritage programs: public-privatepartnerships for biodiversity conservation. Wildl. Soc. Bull. 23, 784–790.
HerpMapper, 2018. HerpMapper - a global herp atlas and data hub. Iowa, U.S.Ahttp://www.herpmapper.org, Accessed date: 12 January 2018.
IPCC, 2013. Summary for policymakers. In: Stocker, T.F. (Ed.), Climate Change 2013: ThePhysical Science Basis. Contribution of Working Group I to the Fifth AssessmentReport of the Intergovernmental Panel on Climate Change. Cambridge UniversityPress, Cambridge, UK and New York, NY, USA, pp. 3–29.
Kery, M., Schaub, M., 2012. Bayesian Population Analysis Using WinBUGS: AHierarchical Perspective. Academic Press, Waltham, Mass.
Kery, M., Dorazio, R.M., Soldaat, L., Van Strien, A., Zuiderwijk, A., Royle, J.A., 2009.Trend estimation in populations with imperfect detection. J. Appl. Ecol. 46,1163–1172.
Kéry, M., Royle, J.A., Schmid, H., Schaub, M., Volet, B., Haefliger, G., Zbinden, N., 2010.Site-occupancy distribution modeling to correct population-trend estimates derivedfrom opportunistic observations. Conserv. Biol. 24, 1388–1397.
Larson, M.A., Thompson III, F.R., Millspaugh, J.J., Dijak, W.D., Shifley, S.R., 2004.Linking population viability, habitat suitability, and landscape simulation models forconservation planning. Ecol. Model. 180, 103–118.
Lebreton, J.-D., Burnham, K.P., Clobert, J., Anderson, D.R., 1992. Modeling survival andtesting biological hypotheses using marked animals: a unified approach with casestudies. Ecol. Monogr. 62, 67–118.
Lowell, N., Kelly, R.P., 2016. Evaluating agency use of “best available science” under theUnited States endangered species act. Biol. Conserv. 196, 53–59.
MacKenzie, D.I., Nichols, J.D., Lachman, G.B., Droege, S., Andrew Royle, J., Langtimm,C.A., 2002. Estimating site occupancy rates when detection probabilities are less thanone. Ecology 83, 2248–2255.
MacKenzie, D.I., Nichols, J.D., Hines, J.E., Knutson, M.G., Franklin, A.B., 2003.Estimating site occupancy, colonization, and local extinction when a species is de-tected imperfectly. Ecology 84, 2200–2207.
Marshall, M.R., Diefenbach, D.R., Wood, L.A., Cooper, R.J., 2004. Annual survival esti-mation of migratory songbirds confounded by incomplete breeding site–fidelity:study designs that may help. Anim. Biodivers. Conserv. 27, 59–72.
Martin, T.G., Burgman, M.A., Fidler, F., Kuhnert, P.M., Low-Choy, S., McBride, M.,Mengersen, K., 2012. Eliciting expert knowledge in conservation science. Conserv.Biol. 26, 29–38.
McGowan, C.P., Catlin, D.H., Shaffer, T.L., Gratto-Trevor, C.L., Aron, C., 2014.Establishing endangered species recovery criteria using predictive simulation mod-eling. Biol. Conserv. 177, 220–229.
McGowan, C.P., Allan, N., Servoss, J., Hedwall, S., Wooldridge, B., 2017. Incorporatingpopulation viability models into species status assessment and listing decisions underthe US endangered species act. Global Ecology and Conservation 12, 119–130.
Miller, R.M., Rodríguez, J.P., Aniskowicz-Fowler, T., Bambaradeniya, C., Boles, R., Eaton,M.A., Gärdenfors, U., Keller, V., Molur, S., Walker, S., 2007. National threatenedspecies listing based on IUCN criteria and regional guidelines: current status andfuture perspectives. Conserv. Biol. 21, 684–696.
Mitchell, R.J., Liu, Y., O’Brien, J.J., Elliott, K.J., Starr, G., Miniat, C.F., Hiers, J.K., 2014.Future climate and fire interactions in the southeastern region of the United States.For. Ecol. Manag. 327, 316–326.
Morris, W.F., Bloch, P.L., Hudgens, B.R., Moyle, L.C., Stinchcombe, J.R., 2002. Populationviability analysis in endangered species recovery plans: past use and future im-provements. Ecol. Appl. 12, 708–712.
Murphy, D.D., Weiland, P.S., 2016. Guidance on the use of best available science underthe US endangered species act. Environ. Manag. 58, 1–14.
NatureServe, 2018. NatureServe explorer: an online encyclopedia of life [web applica-tion]. Version 7.0. http://explorer.natureserve.org, Accessed date: 4 December 2018.
Outcalt, K.W., Sheffield, R.M., 1996. The Longleaf Pine Forest: Trends and CurrentConditions, in Resource Bulletin SRS-9. USDA Forest Service, Southern ResearchStation, Asheville, NC, pp. 28.
Peach, M.A., Cohen, J.B., Frair, J.L., 2017. Single-visit dynamic occupancy models: anapproach to account for imperfect detection with atlas data. J. Appl. Ecol. 54,2033–2042.
Phillips, S.J., Dudík, M., Elith, J., Graham, C.H., Lehmann, A., Leathwick, J., Ferrier, S.,2009. Sample selection bias and presence-only distribution models: implications forbackground and pseudo-absence data. Ecol. Appl. 19, 181–197.
Pickens, B.A., Marcus, J.F., Carpenter, J.P., Anderson, S., Taillie, P.J., Collazo, J.A.,2017a. The effect of urban growth on landscape-scale restoration for a fire-dependentsongbird. J. Environ. Manag. 191, 105–115.
Pickens, B.A., Mordecai, R.S., Drew, C.A., Alexander-Vaughn, L.B., Keister, A.S., Morris,H.L., Collazo, J.A., 2017b. Indicator-driven conservation planning across terrestrial,freshwater aquatic, and marine ecosystems of the South Atlantic, USA. Journal ofFish and Wildlife Management 8, 219–233.
R Core Team, 2019. R: A Language and Environment for Statistical Computing. RFoundation for Statistical Computing, Vienna, Austria.
Regan, T.J., Taylor, B.L., Thompson, G.G., Cochrane, J.F., Ralls, K., Runge, M.C., Merrick,R., 2013. Testing decision rules for categorizing species’ extinction risk to help de-velop quantitative listing criteria for the US endangered species act. Conserv. Biol.27, 821–831.
Reside, A.E., Critchell, K., Crayn, D.M., Goosem, M., Goosem, S., Hoskin, C.J., Sydes, T.,Vanderduys, E.P., Pressey, R.L., 2019. Beyond the model: expert knowledge improvespredictions of species’ fates under climate change. Ecol. Appl. 29, e01824.
Robinson, O.J., Ruiz-Gutierrez, V., Fink, D., Meese, R.J., Holyoak, M., Cooch, E.G., 2018.Using citizen science data in integrated population models to inform conservation.Biol. Conserv. 227, 361–368.
Rodrigues, A.S., Pilgrim, J.D., Lamoreux, J.F., Hoffmann, M., Brooks, T.M., 2006. Thevalue of the IUCN red list for conservation. Trends Ecol. Evol. 21, 71–76.
Rodríguez, J.P., Rodríguez-Clark, K.M., Baillie, J.E., Ash, N., Benson, J., Boucher, T.,Brown, C., Burgess, N.D., Collen, B., Jennings, M., 2011. Establishing IUCN red listcriteria for threatened ecosystems. Conserv. Biol. 25, 21–29.
Royle, J.A., Kéry, M., 2007. A Bayesian state-space formulation of dynamic occupancymodels. Ecology 88, 1813–1823.
Shaffer, M.L., Stein, B.A., 2000. Safeguarding our precious heritage. In: Stein, B.A.,Kutner, L.S., Adams, J.S. (Eds.), Precious Heritage: The Status of Biodiversity in theUnited States. Oxford University Press, New York, pp. 301–321.
Smith, D.R., Allan, N.L., McGowan, C.P., Szymanski, J.A., Oetker, S.R., Bell, H.M., 2018.Development of a species status assessment process for decisions under the US en-dangered species act. Journal of Fish and Wildlife Management 9, 302–320.
Steen, D., Guyer, C., Smith, L., 2012. A case study of relative abundance in snakes. In:McDiarmid, R.W., Foster, M.S., Guyer, C., Gibbons, J.W., Chernoff, N. (Eds.), ReptileBiodiversity: Standard Methods for Inventory and Monitoring. University ofCalifornia Press, Berkeley, California, USA, pp. 287–294.
Stratmann, T.S., Barrett, K., Floyd, T.M., 2016. Locating suitable habitat for a rare species:evaluation of a species distribution model for bog turtles (Glyptemys muhlenbergii) inthe southeastern United States. Herpetol. Conserv. Biol. 11, 199–213.
Su, Y., Yajima, M., 2012. R2jags: A Package for Running JAGS from R.Sutherland, R., deMaynadier, P., 2012. Model Criteria and Implementation Guidance for a
Priority Amphibian and Reptile Conservation Area (PARCA) System in the USA.http://parcplace.org/wp-content/uploads/2017/08/PARCA_System_Criteria_and_Implementation_Guidance_FINAL.pdf, Accessed date: 29 March 2019.
Terando, A.J., Costanza, J., Belyea, C., Dunn, R.R., McKerrow, A., Collazo, J.A., 2014. Thesouthern megalopolis: using the past to predict the future of urban sprawl in theSoutheast US. PLoS One 9, e102261.
Theobald, D.M., Romme, W.H., 2007. Expansion of the US wildland–urban interface.Landsc. Urban Plan. 83, 340–354.
Tuberville, T.D., Bodie, J.R., Jensen, J.B., LaClaire, L., Gibbons, J.W., 2000. Apparentdecline of the southern hog-nosed snake, Heterodon simus. Journal of the ElishaMitchell Scientific Society 116, 19–40.
Tuberville, T.D., Gibbons, J.W., Balbach, H.E., 2009. Estimating Viability of GopherTortoise Populations. Engineer Research and Development Center. ConstructionEngineering Research Lab, Champaign, Il.
U.S. Environmental Protection Agency, 2017. Level III and IV ecoregions of the con-tinental United States. https://www.epa.gov/eco-research/level-iii-and-iv-
B.A. Crawford, et al. Biological Conservation 243 (2020) 108489
12
ecoregions-continental-united-states, Accessed date: 1 January 2017.U.S. Fish and Wildlife Service, 2016. Long-term listing transformation and five guiding
principles of the unified listing team. In: Director’s Memorandum 16 March 2016,Washington, D.C, https://doi.org/10.3996/052017-JFWM-041.S9.
U.S. Fish and Wildlife Service, 2019. Species status assessment for the southern hognosesnake (Heterodon simus). Version 1.1, April 2019. Atlanta, GA. https://ecos.fws.gov/ServCat/DownloadFile/168148.
Willson, J.D., Pittman, S.E., Beane, J.C., Tuberville, T.D., 2018. A novel approach forestimating densities of secretive species from road-survey and spatial-movement
data. Wildl. Res. 45, 446–456.Wolf, S., Hartl, B., Carroll, C., Neel, M.C., Greenwald, D.N., 2015. Beyond PVA: why
recovery under the endangered species act is more than population viability.BioScience 65, 200–207.
Zipkin, E.F., Saunders, S.P., 2018. Synthesizing multiple data types for biological con-servation using integrated population models. Biol. Conserv. 217, 240–250.
Zipkin, E.F., Thorson, J.T., See, K., Lynch, H.J., Grant, E.H.C., Kanno, Y., Chandler, R.B.,Letcher, B.H., Royle, J.A., 2014. Modeling structured population dynamics using datafrom unmarked individuals. Ecology 95, 22–29.
B.A. Crawford, et al. Biological Conservation 243 (2020) 108489
13
Copyright © 2022 FDOKUMEN