Biogeography of Deep-Sea Benthic Bacteria at Regional Scale (LTER HAUSGARTEN, Fram Strait, Arctic)
10
Biogeography of Deep-Sea Benthic Bacteria at Regional Scale (LTER HAUSGARTEN, Fram Strait, Arctic) Marianne Jacob 1,2 *, Thomas Soltwedel 1,2 , Antje Boetius 1,2 , Alban Ramette 1,2 1 HGF-MPG Research Group for Deep-Sea Ecology and Technology, Alfred-Wegener-Institut Helmholtz-Zentrum fu ¨ r Polar- und Meeresforschung, Bremerhaven, Germany, 2 Max Planck Institute for Marine Microbiology, Bremen, Germany Abstract Knowledge on spatial scales of the distribution of deep-sea life is still sparse, but highly relevant to the understanding of dispersal, habitat ranges and ecological processes. We examined regional spatial distribution patterns of the benthic bacterial community and covarying environmental parameters such as water depth, biomass and energy availability at the Arctic Long-Term Ecological Research (LTER) site HAUSGARTEN (Eastern Fram Strait). Samples from 13 stations were retrieved from a bathymetric (1,284–3,535 m water depth, 54 km in length) and a latitudinal transect (, 2,500 m water depth; 123 km in length). 454 massively parallel tag sequencing (MPTS) and automated ribosomal intergenic spacer analysis (ARISA) were combined to describe both abundant and rare types shaping the bacterial community. This spatial sampling scheme allowed detection of up to 99% of the estimated richness on phylum and class levels. At the resolution of operational taxonomic units (97% sequence identity; OTU 3% ) only 36% of the Chao1 estimated richness was recovered, indicating a high diversity, mostly due to rare types (62% of all OTU 3% ). Accordingly, a high turnover of the bacterial community was also observed between any two sampling stations (average replacement of 79% of OTU 3% ), yet no direct correlation with spatial distance was observed within the region. Bacterial community composition and structure differed significantly with increasing water depth along the bathymetric transect. The relative sequence abundance of Verrucomicrobia and Planctomycetes decreased significantly with water depth, and that of Deferribacteres increased. Energy availability, estimated from phytodetrital pigment concentrations in the sediments, partly explained the variation in community structure. Overall, this study indicates a high proportion of unique bacterial types on relatively small spatial scales (tens of kilometers), and supports the sampling design of the LTER site HAUSGARTEN to study bacterial community shifts in this rapidly changing area of the world’s oceans. Citation: Jacob M, Soltwedel T, Boetius A, Ramette A (2013) Biogeography of Deep-Sea Benthic Bacteria at Regional Scale (LTER HAUSGARTEN, Fram Strait, Arctic). PLoS ONE 8(9): e72779. doi:10.1371/journal.pone.0072779 Editor: Jack Anthony Gilbert, Argonne National Laboratory, United States of America Received April 19, 2013; Accepted July 11, 2013; Published September , 2013 Copyright: ß 2013 Jacob et al. This is an open-access article distributed under the terms of the Creative Commons Attribution License, which permits unrestricted use, distribution, and reproduction in any medium, provided the original author and source are credited. Funding: Funding was provided by the European Research Council Advanced Investigator grant ABYSS 294757 and the Leibniz program of the Deutsche Forschungsgemeinschaft to AB. Additional funding came from the Helmholtz Association and Max Planck Society. The funders had no role in study design, data collection and analysis, decision to publish, or preparation of the manuscript. Competing Interests: The authors have declared that no competing interests exist. * E-mail: [email protected] Introduction Biogeographic patterns have been identified at global and regional scales for marine microbes, (e.g., [1,2]). In most studies, these patterns may be explained by a combination of spatial distance effects and contemporary environmental variations in physical, chemical and biological factors [3]. In an environmen- tally relatively uniform habitat such as the deep-sea floor, the influence of horizontal geographical distance on community patterns is likely related to dispersal limitation, resulting in a distance-decay relationship [2,4]. In a completely uniform habitat, this relationship could be entirely caused by drift [5]. In naturally patchy environments, selection pressures and historical processes will also play an important role [6]. However, so far it remains unclear at what spatial scales these different processes act on bacterial communities in deep-sea sediments. Information on such spatial patterns is not only important to understand the distribution range of bacterial species, it is also a prerequisite for monitoring and evaluating temporal variations in deep-sea ecosystems, for example by climate change and other anthropo- genic disturbances [7], or for the implementation of marine protected areas [8]. A strong impact of spatial distance together with water depth and surface water productivity on variation in marine benthic bacterial community structure has already been detected on a global scale in coastal and deep-sea sediments [2]. In the South Atlantic, correlations between spatial distances and bacterial community structures at intermediate scale (up to 1,200 km distance), large scale (up to 3,500 km distance) and basin wide scale (up to 18,000 km distance) were observed [1]. Also in the Arctic sector, geographically related patterns of bacterial diversity were suggested based on surface sediment samples from two shallow (40 and 447 m water depth) and two deep stations (3,000 and 3,850 m water depth) in the Chukchi Sea and Canada Basin [9], while no such patterns were found in the western Greenland Sea (2,747–3,395 m water depth; 16 stations) [10]. Along the Siberian continental margin an energy-diversity relationship was found, which was tightly coupled to water depth differences, while accounting for spatial factors (37–3,427 m water depth; 17 stations) [11]. PLOS ONE | www.plosone.org 1 September 2013 | Volume 8 | Issue 9 | e72779 2
-
Upload
independent -
Category
Documents
-
view
0 -
download
0
Transcript of Biogeography of Deep-Sea Benthic Bacteria at Regional Scale (LTER HAUSGARTEN, Fram Strait, Arctic)
Biogeography of Deep-Sea Benthic Bacteria at RegionalScale (LTER HAUSGARTEN, Fram Strait, Arctic)Marianne Jacob1,2*, Thomas Soltwedel1,2, Antje Boetius1,2, Alban Ramette1,2
1HGF-MPG Research Group for Deep-Sea Ecology and Technology, Alfred-Wegener-Institut Helmholtz-Zentrum fur Polar- und Meeresforschung, Bremerhaven, Germany,
2Max Planck Institute for Marine Microbiology, Bremen, Germany
Abstract
Knowledge on spatial scales of the distribution of deep-sea life is still sparse, but highly relevant to the understanding ofdispersal, habitat ranges and ecological processes. We examined regional spatial distribution patterns of the benthicbacterial community and covarying environmental parameters such as water depth, biomass and energy availability at theArctic Long-Term Ecological Research (LTER) site HAUSGARTEN (Eastern Fram Strait). Samples from 13 stations wereretrieved from a bathymetric (1,284–3,535 m water depth, 54 km in length) and a latitudinal transect (, 2,500 m waterdepth; 123 km in length). 454 massively parallel tag sequencing (MPTS) and automated ribosomal intergenic spacer analysis(ARISA) were combined to describe both abundant and rare types shaping the bacterial community. This spatial samplingscheme allowed detection of up to 99% of the estimated richness on phylum and class levels. At the resolution ofoperational taxonomic units (97% sequence identity; OTU3%) only 36% of the Chao1 estimated richness was recovered,indicating a high diversity, mostly due to rare types (62% of all OTU3%). Accordingly, a high turnover of the bacterialcommunity was also observed between any two sampling stations (average replacement of 79% of OTU3%), yet no directcorrelation with spatial distance was observed within the region. Bacterial community composition and structure differedsignificantly with increasing water depth along the bathymetric transect. The relative sequence abundance ofVerrucomicrobia and Planctomycetes decreased significantly with water depth, and that of Deferribacteres increased.Energy availability, estimated from phytodetrital pigment concentrations in the sediments, partly explained the variation incommunity structure. Overall, this study indicates a high proportion of unique bacterial types on relatively small spatialscales (tens of kilometers), and supports the sampling design of the LTER site HAUSGARTEN to study bacterial communityshifts in this rapidly changing area of the world’s oceans.
Citation: Jacob M, Soltwedel T, Boetius A, Ramette A (2013) Biogeography of Deep-Sea Benthic Bacteria at Regional Scale (LTER HAUSGARTEN, Fram Strait,Arctic). PLoS ONE 8(9): e72779. doi:10.1371/journal.pone.0072779
Editor: Jack Anthony Gilbert, Argonne National Laboratory, United States of America
Received April 19, 2013; Accepted July 11, 2013; Published September , 2013
Copyright: � 2013 Jacob et al. This is an open-access article distributed under the terms of the Creative Commons Attribution License, which permitsunrestricted use, distribution, and reproduction in any medium, provided the original author and source are credited.
Funding: Funding was provided by the European Research Council Advanced Investigator grant ABYSS 294757 and the Leibniz program of the DeutscheForschungsgemeinschaft to AB. Additional funding came from the Helmholtz Association and Max Planck Society. The funders had no role in study design, datacollection and analysis, decision to publish, or preparation of the manuscript.
Competing Interests: The authors have declared that no competing interests exist.
* E-mail: [email protected]
Introduction
Biogeographic patterns have been identified at global and
regional scales for marine microbes, (e.g., [1,2]). In most studies,
these patterns may be explained by a combination of spatial
distance effects and contemporary environmental variations in
physical, chemical and biological factors [3]. In an environmen-
tally relatively uniform habitat such as the deep-sea floor, the
influence of horizontal geographical distance on community
patterns is likely related to dispersal limitation, resulting in a
distance-decay relationship [2,4]. In a completely uniform habitat,
this relationship could be entirely caused by drift [5]. In naturally
patchy environments, selection pressures and historical processes
will also play an important role [6]. However, so far it remains
unclear at what spatial scales these different processes act on
bacterial communities in deep-sea sediments. Information on such
spatial patterns is not only important to understand the
distribution range of bacterial species, it is also a prerequisite for
monitoring and evaluating temporal variations in deep-sea
ecosystems, for example by climate change and other anthropo-
genic disturbances [7], or for the implementation of marine
protected areas [8].
A strong impact of spatial distance together with water depth
and surface water productivity on variation in marine benthic
bacterial community structure has already been detected on a
global scale in coastal and deep-sea sediments [2]. In the South
Atlantic, correlations between spatial distances and bacterial
community structures at intermediate scale (up to 1,200 km
distance), large scale (up to 3,500 km distance) and basin wide
scale (up to 18,000 km distance) were observed [1]. Also in the
Arctic sector, geographically related patterns of bacterial diversity
were suggested based on surface sediment samples from two
shallow (40 and 447 m water depth) and two deep stations (3,000
and 3,850 m water depth) in the Chukchi Sea and Canada Basin
[9], while no such patterns were found in the western Greenland
Sea (2,747–3,395 m water depth; 16 stations) [10]. Along the
Siberian continental margin an energy-diversity relationship was
found, which was tightly coupled to water depth differences, while
accounting for spatial factors (37–3,427 m water depth; 17
stations) [11].
PLOS ONE | www.plosone.org 1 September 2013 | Volume 8 | Issue 9 | e72779
2
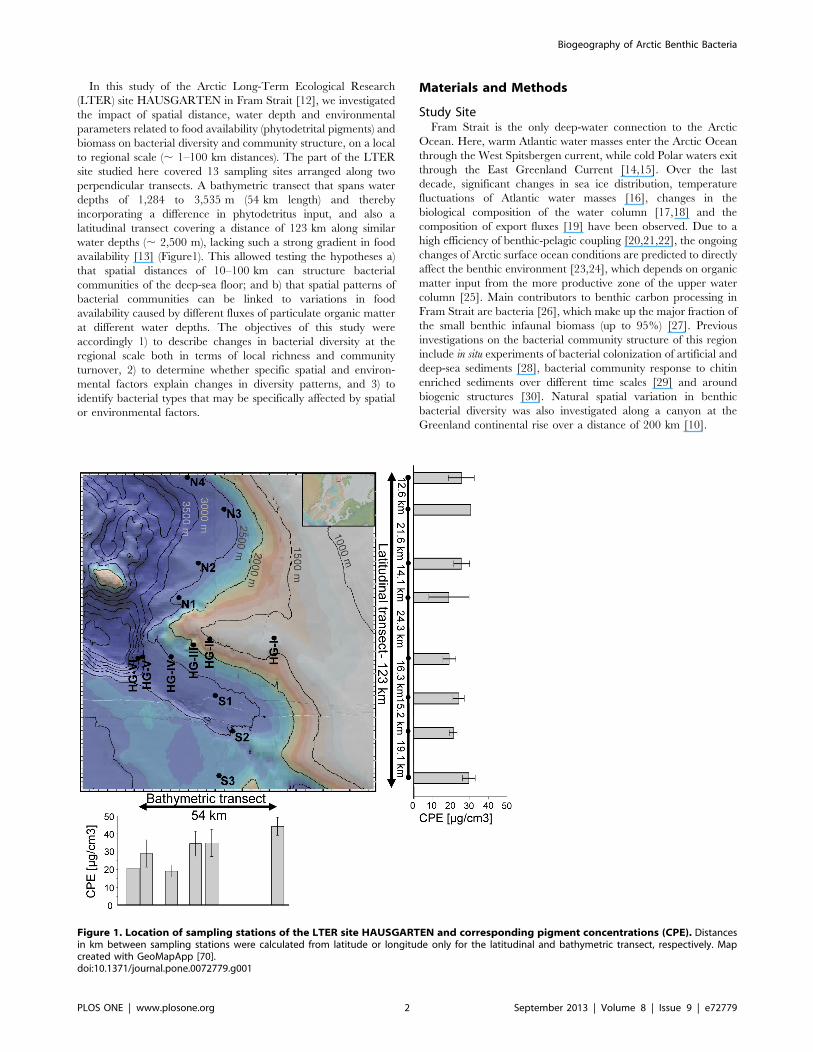
In this study of the Arctic Long-Term Ecological Research
(LTER) site HAUSGARTEN in Fram Strait [12], we investigated
the impact of spatial distance, water depth and environmental
parameters related to food availability (phytodetrital pigments) and
biomass on bacterial diversity and community structure, on a local
to regional scale (, 1–100 km distances). The part of the LTER
site studied here covered 13 sampling sites arranged along two
perpendicular transects. A bathymetric transect that spans water
depths of 1,284 to 3,535 m (54 km length) and thereby
incorporating a difference in phytodetritus input, and also a
latitudinal transect covering a distance of 123 km along similar
water depths (, 2,500 m), lacking such a strong gradient in food
availability [13] (Figure1). This allowed testing the hypotheses a)
that spatial distances of 10–100 km can structure bacterial
communities of the deep-sea floor; and b) that spatial patterns of
bacterial communities can be linked to variations in food
availability caused by different fluxes of particulate organic matter
at different water depths. The objectives of this study were
accordingly 1) to describe changes in bacterial diversity at the
regional scale both in terms of local richness and community
turnover, 2) to determine whether specific spatial and environ-
mental factors explain changes in diversity patterns, and 3) to
identify bacterial types that may be specifically affected by spatial
or environmental factors.
Materials and Methods
Study SiteFram Strait is the only deep-water connection to the Arctic
Ocean. Here, warm Atlantic water masses enter the Arctic Ocean
through the West Spitsbergen current, while cold Polar waters exit
through the East Greenland Current [14,15]. Over the last
decade, significant changes in sea ice distribution, temperature
fluctuations of Atlantic water masses [16], changes in the
biological composition of the water column [17,18] and the
composition of export fluxes [19] have been observed. Due to a
high efficiency of benthic-pelagic coupling [20,21,22], the ongoing
changes of Arctic surface ocean conditions are predicted to directly
affect the benthic environment [23,24], which depends on organic
matter input from the more productive zone of the upper water
column [25]. Main contributors to benthic carbon processing in
Fram Strait are bacteria [26], which make up the major fraction of
the small benthic infaunal biomass (up to 95%) [27]. Previous
investigations on the bacterial community structure of this region
include in situ experiments of bacterial colonization of artificial and
deep-sea sediments [28], bacterial community response to chitin
enriched sediments over different time scales [29] and around
biogenic structures [30]. Natural spatial variation in benthic
bacterial diversity was also investigated along a canyon at the
Greenland continental rise over a distance of 200 km [10].
Figure 1. Location of sampling stations of the LTER site HAUSGARTEN and corresponding pigment concentrations (CPE). Distancesin km between sampling stations were calculated from latitude or longitude only for the latitudinal and bathymetric transect, respectively. Mapcreated with GeoMapApp [70].doi:10.1371/journal.pone.0072779.g001
Biogeography of Arctic Benthic Bacteria
PLOS ONE | www.plosone.org 2 September 2013 | Volume 8 | Issue 9 | e72779
Sampling StrategyDuring the cruise ARK-XXIV/2 in July 2009 with the German
research ice-breaker RV Polarstern to the LTER site HAUS-
GARTEN [12] west of Spitsbergen (Figure 1), samples of virtually
undisturbed sediments where taken using a TV-guided multiple
corer (TV-MUC) at 78.6–9.7uN and 3.5–6uE (Table S1). Six
stations (HG-I to HG-VI) along a bathymetric transect from East
to West from 1,284 m down to 3,535 m water depth as well as a
latitudinal transect with eight stations (N1 to N4, HG-IV, and S1
to S3) at about 2,500 m water depth were sampled (Table S1). The
most northern stations (N3 and N4) as well as the deepest station
sampled in this study (HG-VI) were partly ice covered during
sampling. TV-MUC cores were sub-sampled using modified 10-ml
syringes (2 cm in diameter), sub-divided into 1-cm layers and only
the uppermost centimeter representing the most active community
was analyzed in this study [31]. Necessary permits for sampling
were obtained from the Norwegian authorities (Fisheries director-
ate). The locations sampled are not privately-owned or protected
areas, and the field studies did not involve endangered or
protected species.
Biotic and Abiotic FactorsSample processing for all environmental parameters was done
as described in [22]. In brief, concentrations of chlorophyll a and
its degradation products phaeopigments, here summarized as
chloroplastic pigment equivalents (CPE) [32], were determined
using a Turner fluorometer. CPE concentrations serve as an
indicator for food availability in form of phytodetritus originating
from photosynthetic production in surface ocean layers. Porosity
of sediments was assessed by the weight loss of wet sediment
samples dried at 60uC. Phospholipids, indicating the total
microbial biomass, were analysed by gas chromatography, and
particulate proteins, indicating the biomass of detrital matter, were
analysed photometrically [33]. Data is available at doi.pan-
gaea.de/10.1594/PANGAEA.744673 -doi.pangaea.de/10.1594/
PANGAEA.744685 (Table S1).
DNA Extraction and PurificationSediment from the uppermost centimeter originating from three
different TV-MUC cores was pooled. Total DNA was extracted
from 1 g of this homogenized slurry (comprising on average
4.226108 bacterial cells as determined by acridine orange direct
counting [34]) using the UltraClean Soil DNA Isolation Kit (MO
BIO Laboratories, Inc., Carlsbad, CA, USA) according to the
manufacturer’s instructions for maximum yields. Elution was
carried out using 4650 ml Tris-EDTA buffer (Promega, Madison,
WI, USA). DNA extracts that showed a final DNA concentration
lower than 4 ng ml21 (determined spectrophotometrically using a
NanoDrop Spectrophotometer ND 1000, Thermo Fisher Scien-
tific Inc., Wilmington, DE, USA) were purified via isopropanol
precipitation. Final DNA concentrations ranged from 4–12 ng
ml21.
Automated Ribosomal Intergenic Spacer Analysis (ARISA)ARISA PCR consisted of 16Eppendorf PCR buffer (59Prime
Inc., Gaithersburg, MD, USA), 0.25 mM desoxynucleoside-
triphosphate mix (Promega), 0.3 g l21 bovine serum albumin,
0.4 mM of each primer, 0.05 units Eppendorf Taq (59Prime Inc.)
and 20–25 ng DNA (determined spectrophotometrically using a
Tecan Infinite 200, Tecan Group Ltd., Switzerland) in a total
volume of 50 ml. Primers were used and PCR amplification (in
triplicates per sample), separation of fragments by capillary
electrophoresis, evaluation of signals and binning into operational
taxonomic units (OTU) was done as described previously [35]. In
order to get reliable data for statistical analyses, only those OTU
that occurred in at least two of the PCR triplicates were kept for
further analyses and their relative peak areas were averaged to
produce one complete fingerprint per sample.
454 Massively Parallel Tag Sequencing (MPTS)Extracted DNA was amplified at the Marine Biological
Laboratory (Woods Hole, MA, USA) according to the protocol
published on http://vamps.mbl.edu, using primers targeting the
V4–V6 region of the bacterial 16 S rRNA gene. SFF files were
deposited in the GenBank Sequence Read Archives (www.ncbi.
nlm.nih.gov) under BioProject ID: PRJNA208712. Preparation of
flowgrams and transformation into an OTU- by- Sample table
were conducted with ‘‘mothur’’ [36] according to the standard
operating procedure (SOP [37]) including the implemented
denoising algorithm. Alignment of denoised sequences and
taxonomic affiliation were carried out using the SILVA reference
file for bacteria [38] (downloaded from http://www.mothur.org in
March 2012) and chimeric sequences were identified using the
mothur implemented uchime program. Cleaned sequences were
clustered at a 97% identity level into operational taxonomic units
(OTU3%) and the dataset was normalized by the total amount of
sequences per sample to get relative abundances. To investigate
the rare biosphere [39] we considered: a) OTU3% that occurred
with only one sequence in the whole denoised dataset (absolute
singletons), called SSOabs and b) OTU3% that consisted of only
one sequence in at least one sample, and were not absolute
singletons (relative singletons or SSOrel), so the total number of
sequences for any SSOrel was larger than one [40]. Taxonomic
assignment up to the genus level was possible for 40% of all
OTU3%, but only 4% of all OTU3% were assigned up to the
species level. Therefore we only considered annotation up to genus
level for subsequent analyses.
Statistical AnalysesChao1 richness estimates per sample were calculated on a
normalized subset based on the sample with lowest number of
OTU3% (i.e. HG-II, 3,716 OTU3%). Turnover of OTU was
calculated as percentage of pairwise shared, lost or gained OTU
relative to the total number of OTU in the two samples. Shared
OTU are those appearing in both samples, lost OTU are only
present in the first sample and gained OTU are only present in the
second sample. To compare bacterial classes found in this study to
those found in other studies (i.e. [2,11]), we only considered the
shared classes and then calculated their mean relative sequence
abundances for each subset. To determine whether class
proportions obtained in this study could be predicted from the
previous studies, we used linear regression and determined
whether the slope coefficients were significantly different from
one by calculating the 95% confidence intervals of the respective
slope coefficients (e.g. [35]).
Dissimilarity matrices based on community data and environ-
mental tables were calculated using Bray-Curtis and Euclidean
distances, respectively. Homogeneity of group dispersions were
determined by calculating the average distance of a group member
to the median of the group [41] and the central station HG-IV was
included in both transects. Non-metric multidimensional scaling
(NMDS) was performed together with a minimum-spanning tree
between samples connecting nearest neighbours (i.e. the most
similar stations) in terms of similarity of their community structure
to visualize pairwise community similarities. Mantel tests with 999
Monte-Carlo permutations were used to test for the significance of
Biogeography of Arctic Benthic Bacteria
PLOS ONE | www.plosone.org 3 September 2013 | Volume 8 | Issue 9 | e72779
Spearman correlations between dissimilarity matrices or dissimi-
larity matrices and environmental parameters.
Except for longitude, latitude, spatial distance and water depth,
all parameters were normalized by log10 transformation to meet
the assumptions for regression analysis (see [42]). Distances
between sampling stations were calculated in kilometer from only
longitude or latitude for the bathymetric and latitudinal transect,
respectively. Spatial distance between sampling stations of all
stations were calculated with both, longitude and latitude.
Redundancy analyses (RDA) were used to explore the degree of
variation in community datasets that can be explained by
environmental parameters. In order to look for pure effects of
certain environmental parameters, canonical variation partitioning
[42] was performed using the forward selected contextual
parameters water depth and CPE concentrations. We used CPE
concentrations as they explained more of the variability than
chlorophyll a or phaeopigments alone. When referring to
behaviour of certain taxa, the OTU3% data was pooled using
the ‘‘taxa.pooler.1.2’’ of the MultiCoLA software package [43]
which groups all OTU3% that were assigned to a taxonomic group
at a predefined taxonomic level. OTU3% that were not classified at
a certain taxonomic level were combined into one group. All
analyses were performed in R (v.2.14.1) [44] using vegan [45],
permute [46] and MASS [47] packages.
Results and Discussion
Biogeographic patterns of surface sediment bacterial commu-
nities were investigated at the Arctic LTER site HAUSGARTEN
(,79uN, 4uE; Figure 1, Table S1). Shifts in bacterial community
structure were investigated using automated ribosomal intergenic
spacer analysis (ARISA) and 454 massively parallel tag sequencing
(MPTS) of the V4–V6 variable regions. We found consistent
community patterns derived from both data types at different
taxonomic resolution levels (Table S2), thus we mostly focused on
results based on MPTS data, including some comparisons to the
patterns detected by ARISA.
Richness of Bacterial TypesUsing MPTS data, a total of 41 phyla, 78 classes, 136 orders,
215 families, and 410 genera were identified (Table S3). Most of
the OTU3% belonged to the phylum Proteobacteria (47% of all
OTU3%) with the most abundant classes being Gammaproteo-
bacteria (23%), Deltaproteobacteria (15%) and Alphaproteobac-
teria (7%). The second most OTU3% abundant phylum was
Bacteroidetes (9%) with, among others, the classes Flavobacteria
(3%) and Sphingobacteria (5%). Other abundant phyla were
Actinobacteria (3%), Acidobacteria (5%), and Verrucomicrobia
(4%). Those proportions barely changed when excluding SSOabs
from the dataset. These phyla and classes were also found as
abundant members of Arctic sediments from the Pacific sector [9],
in a fjord off Svalbard [48], the Siberian continental margin [11],
as well as in other benthic environments [2].
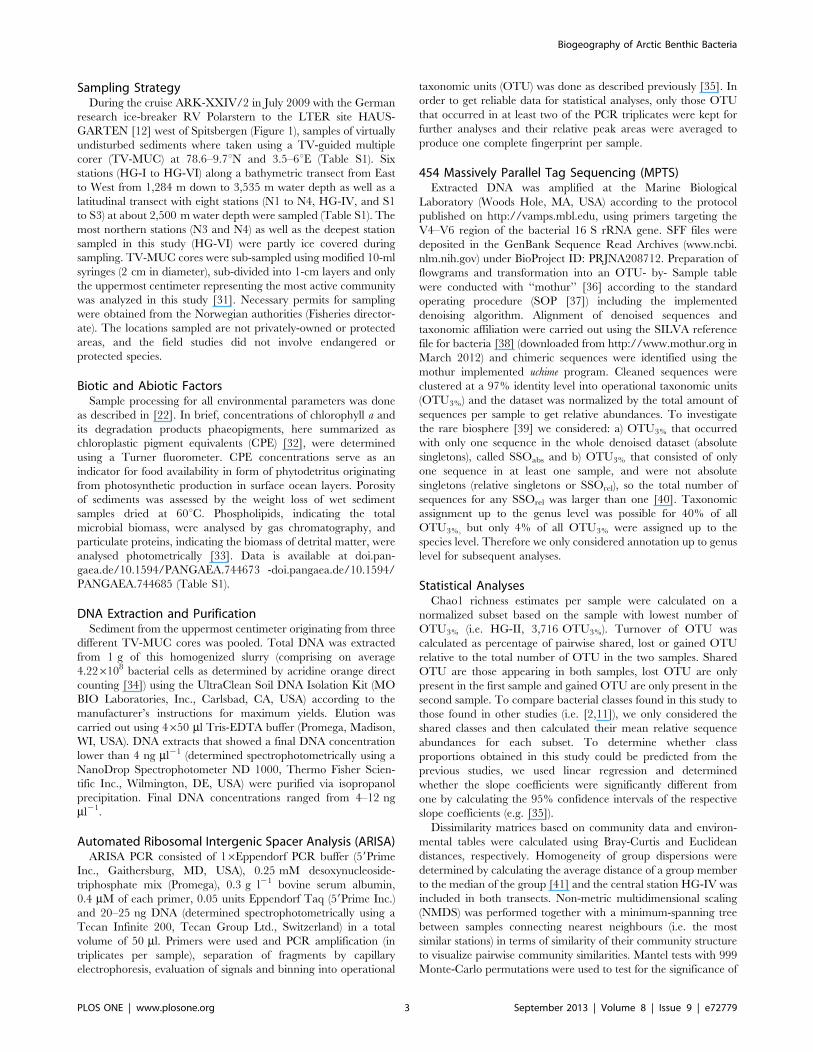
The mean proportions of bacterial classes inhabiting HAUS-
GARTEN sediments were in very good agreement (R2 = 0.78,
p,0.001; determined by linear regression; Figure 2) with those
predicted for globally distributed benthic deep-sea samples (262–
5,347 m water depth), indicating a typical deep-sea microbiome
[2]. Differences from the global average included for example
lower Alphaproteobacteria and higher Gammaproteobacteria
relative sequence abundances at HAUSGARTEN. When consid-
ering Siberian continental margin sediments (534–3,427 m water
depth) [11], we found an even better relationship for mean class
proportions (R2 = 0.85, p,0.001; Figure 2). Those observations
were corroborated by determining the slope coefficients of each
comparison, and slope coefficients of 1.2560.24 (95% confidence
interval assuming a Student’s t distribution with 30 degrees of
freedom) and 1.160.19 (24 degrees of freedom), were obtained for
the comparison with the global dataset and the Siberian margin
dataset, respectively. This shows that the best model (i.e. a slope
coefficient of 1 and higher explained variance) is obtained in the
latter case when only considering sediments from the Arctic.
Chao1 richness estimates were on average 3,0106642 OTU3%
per sample at each station (Table S4), which is comparable to
sediments from the Siberian continental margin [11] and higher
than for samples from the deep Arctic Ocean water column [49].
Interestingly the variation in richness (coefficient of variation 0.21)
was close to that observed for biomass (phospholipid concentration
per sample, CV = 0.25 based on 1263 nmol ml21; Table S1). We
found no correlation of the number of OTUARISA, nor of observed
or estimated richness of OTU3% per sample with pigment
concentrations (CPE), water depth (Table S5) or with any other
contextual parameter (latitude, porosity, particulate protein
concentrations, phospholipid concentrations; data not shown).
These observations did not change when removing singletons from
the dataset (data not shown). Our findings differ from a previous
investigation of the oligotrophic Siberian continental margin
where both, numbers of OTUARISA and estimated richness of
OTU3%, correlated positively with phaeopigment concentrations
below 4 mg cm23 [11]. However, in Fram Strait, phaeopigment
concentrations were considerably higher (13–37 mg cm23) than at
the Siberian continental margin (,8 mg cm23) [11]. This may
indicate that, within the range of phytodetritus supply to the deep
Fram Strait (Table S1), the observed local variations in bacterial
richness might be driven by other factors than energy supply and
water depth. For example, it is possible that the locally differing
assemblages of benthic fauna [13,50,51] have an impact on local
patterns in bacterial richness for example, by altering the
sediment-water interface and particle deposition or grazing (see
[30,52,53]), which remains to be further investigated.
Sampling Effect on Diversity DiscoveryThe increase of newly detected OTU3% with every sampled
station was linear (Figure S1B). By sampling 12 of 13 stations, 95%
of observed OTU3% were detected and 36% of estimated richness
was recovered, when considering all stations (Table S3). The
OTU3% accumulation curve could not reach a plateau because of
the high numbers of singletons in the dataset (62% of all OTU3%).
In contrast, the OTU accumulation curve for ARISA data did
reach a plateau and only nine stations were needed to recover 95%
of all observed OTUARISA (Figure S1A). This reflects the technical
limitations of ARISA such as the maximum number of detectable
OTUARISA (here 450) and 16–23 S length identity between
different genera or species [54] (see Text S1).
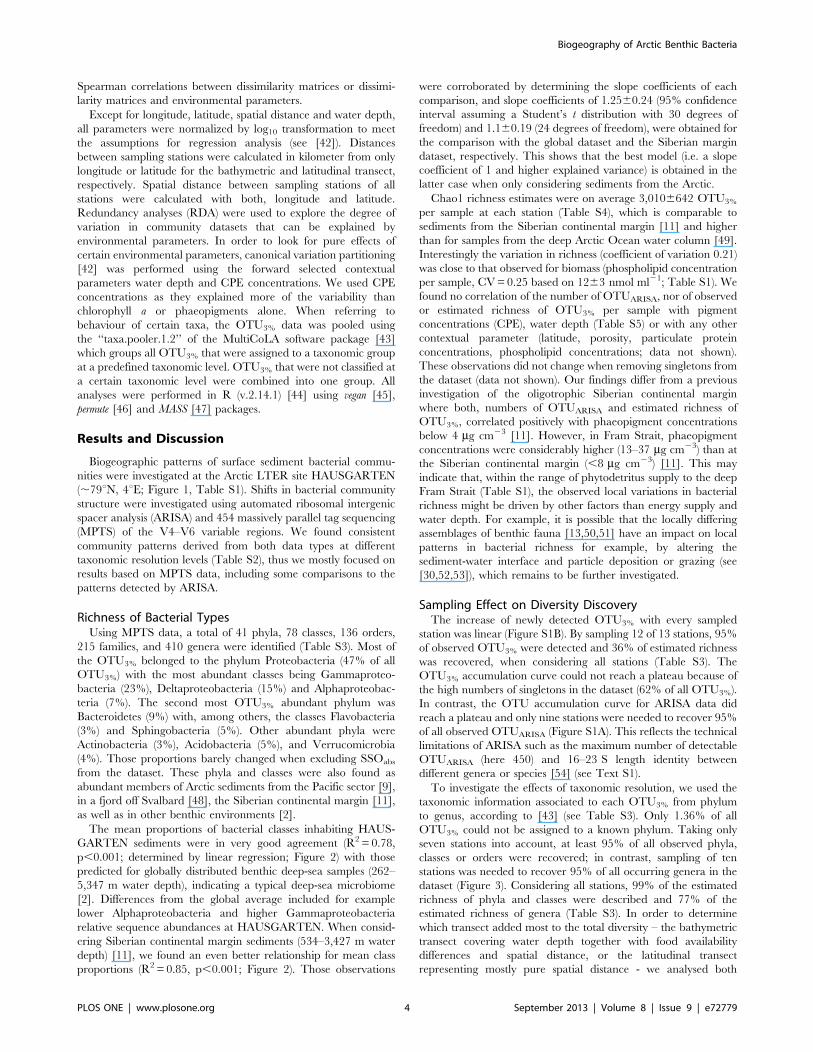
To investigate the effects of taxonomic resolution, we used the
taxonomic information associated to each OTU3% from phylum
to genus, according to [43] (see Table S3). Only 1.36% of all
OTU3% could not be assigned to a known phylum. Taking only
seven stations into account, at least 95% of all observed phyla,
classes or orders were recovered; in contrast, sampling of ten
stations was needed to recover 95% of all occurring genera in the
dataset (Figure 3). Considering all stations, 99% of the estimated
richness of phyla and classes were described and 77% of the
estimated richness of genera (Table S3). In order to determine
which transect added most to the total diversity – the bathymetric
transect covering water depth together with food availability
differences and spatial distance, or the latitudinal transect
representing mostly pure spatial distance - we analysed both
Biogeography of Arctic Benthic Bacteria
PLOS ONE | www.plosone.org 4 September 2013 | Volume 8 | Issue 9 | e72779
transects separately, but compared the recovered diversity with
that of the whole dataset. From the latitudinal transect alone 5, 6,
5 and 8 stations were needed to cover 95% of all observed phyla,
classes, orders and families, respectively, in the entire HAUS-
GARTEN dataset. With all stations from the latitudinal transect,
99% of the estimated total richness at the phylum, class and order
level were recovered, 95 and 92% at the family and genus level,
respectively. At the OTU3% level, 78% of observed and 28% of
estimated total richness was recovered. Along the bathymetric
transect, 89%, 93%, 93%, 75% and 81% of the estimated total
richness was recovered at the phylum, class, order, family and
genus level, respectively. Only 50% of all observed OTU3% were
found at stations from the bathymetric transect, and only 18% of
estimated richness could be recovered by sampling the six stations
along this transect. Hence, a high amount of bacterial diversity
came from the latitudinal transect. By sampling only this transect,
most of the diversity discovery at coarse taxonomic levels was
covered. The latitudinal transect hosted four unique candidate
divisions WS1, OP9, SR1 and WCHB1–60, which did not occur
in samples from the bathymetric transect. Overall, the near-
complete coverage of diversity at coarse taxonomic resolution
shows that our sampling scheme was suitable to examine bacterial
diversity at the regional scale. Still, with every additional sample,
new families, genera and, most of all, OTU3% could be detected.
Community Turnover and Structure along the TwoTransects
On average 2162% OTU3% (3263% when removing SSOabs)
were shared between any two samples at HAUSGARTEN (Table
S6) which is higher than shared OTU3% between coastal and
deep-sea surface sediments (, 14 OTU3%) around the whole
globe [2]. Overall, no correlation of community composition
(similarities in the presence and absence of OTU3%) with spatial
distance between any two samples was observed (p = 0.557),
neither for the whole data set, nor for samples of the latitudinal
transect (13–123 km difference; p = 0.246) or of the bathymetric
transect alone (2–52 km difference; p = 0.107) when based on
MPTS data including singletons. Removing absolute singletons
from the dataset led to the same conclusions (data not shown). In
contrast, community composition of samples from the bathymetric
transect based on ARISA – known to detect the more abundant
types - significantly correlated with spatial distance (r = 0.83,
p = 0.013).
Dissimilarities in community composition significantly correlat-
ed with water depth differences along the bathymetric transect
(r = 0.56, p = 0.032; r = 0.62, p = 0.034 when removing SSOabs;
263–2,251 m water depth differences). Pairwise shared OTU3%
Figure 2. Comparison of bacterial classes in sediments from HAUSGARTEN with other datasets. A: Globally distributed sediments; B:sediments from the Siberian continental margin. The solid lines indicate the best fit using linear regression; solid grey lines indicate 95% confidenceintervals; dotted grey lines indicate predicted intervals at a 95% confidence level; dotted black lines indicate the case where equal proportions werefound in the datasets being compared (y = x).doi:10.1371/journal.pone.0072779.g002
Figure 3. Accumulation curves per taxonomic category basedon MPTS data. Arrows indicate how many stations are needed torecover 95% of categories per taxonomic level. The percentagesindicated for n = 1 station correspond to how much diversity would berecovered on average by randomly sampling only one station.doi:10.1371/journal.pone.0072779.g003
Biogeography of Arctic Benthic Bacteria
PLOS ONE | www.plosone.org 5 September 2013 | Volume 8 | Issue 9 | e72779
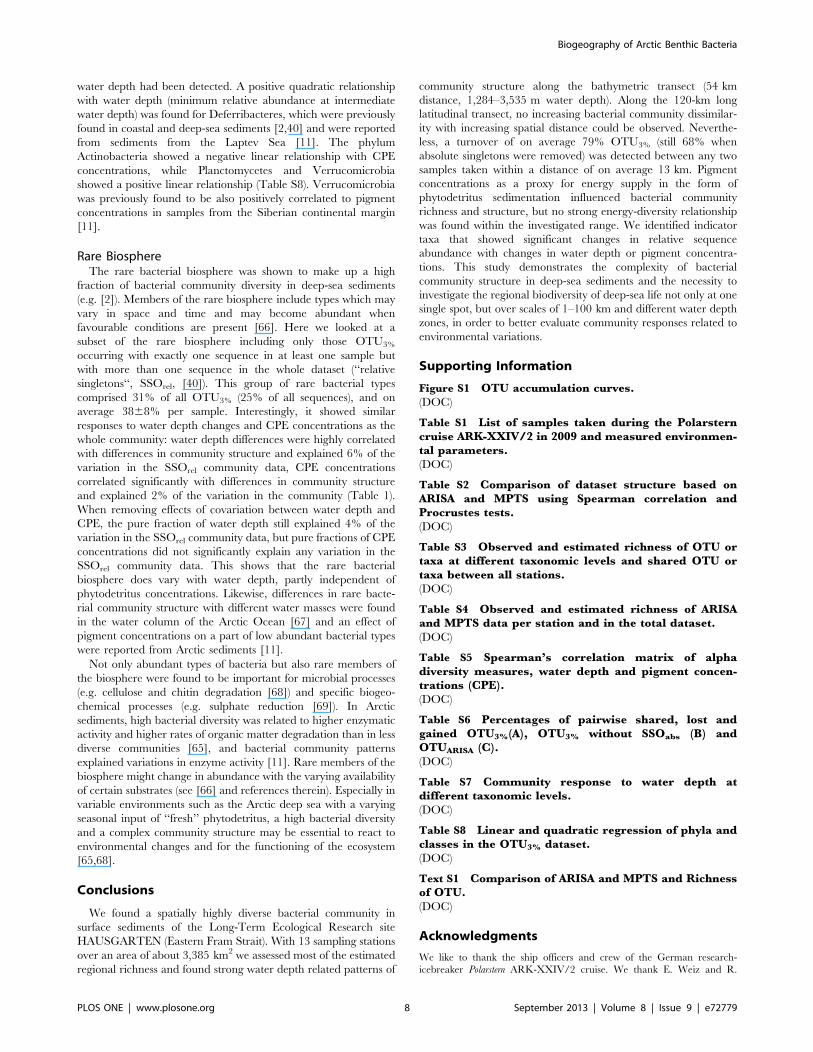
gradually decreased from 25% to 19% (34%–27% when removing
SSOabs) from samples from the shallowest HAUSGARTEN
station HG-I to station HG-V (1,821 m total depth difference;
Table S6). The same trend was observed for bacterial community
structure (similarities in the relative abundance of OTU3%) with a
gradual increase in dissimilarities of community structure with
increasing water depth differences (Figure 4C). For the latitudinal
transect, no significant correlation of community composition or
structure with spatial distance was found (Figure 4D, Table S6).
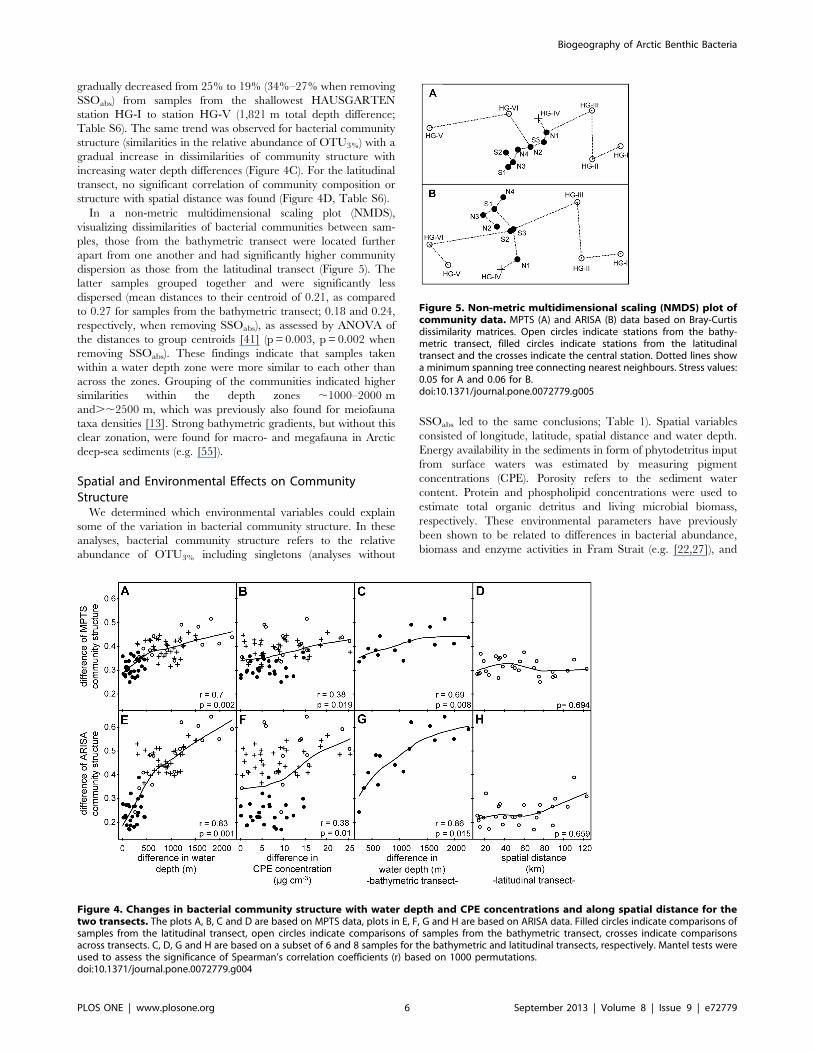
In a non-metric multidimensional scaling plot (NMDS),
visualizing dissimilarities of bacterial communities between sam-
ples, those from the bathymetric transect were located further
apart from one another and had significantly higher community
dispersion as those from the latitudinal transect (Figure 5). The
latter samples grouped together and were significantly less
dispersed (mean distances to their centroid of 0.21, as compared
to 0.27 for samples from the bathymetric transect; 0.18 and 0.24,
respectively, when removing SSOabs), as assessed by ANOVA of
the distances to group centroids [41] (p = 0.003, p = 0.002 when
removing SSOabs). These findings indicate that samples taken
within a water depth zone were more similar to each other than
across the zones. Grouping of the communities indicated higher
similarities within the depth zones ,1000–2000 m
and.,2500 m, which was previously also found for meiofauna
taxa densities [13]. Strong bathymetric gradients, but without this
clear zonation, were found for macro- and megafauna in Arctic
deep-sea sediments (e.g. [55]).
Spatial and Environmental Effects on CommunityStructure
We determined which environmental variables could explain
some of the variation in bacterial community structure. In these
analyses, bacterial community structure refers to the relative
abundance of OTU3% including singletons (analyses without
SSOabs led to the same conclusions; Table 1). Spatial variables
consisted of longitude, latitude, spatial distance and water depth.
Energy availability in the sediments in form of phytodetritus input
from surface waters was estimated by measuring pigment
concentrations (CPE). Porosity refers to the sediment water
content. Protein and phospholipid concentrations were used to
estimate total organic detritus and living microbial biomass,
respectively. These environmental parameters have previously
been shown to be related to differences in bacterial abundance,
biomass and enzyme activities in Fram Strait (e.g. [22,27]), and
Figure 4. Changes in bacterial community structure with water depth and CPE concentrations and along spatial distance for thetwo transects. The plots A, B, C and D are based on MPTS data, plots in E, F, G and H are based on ARISA data. Filled circles indicate comparisons ofsamples from the latitudinal transect, open circles indicate comparisons of samples from the bathymetric transect, crosses indicate comparisonsacross transects. C, D, G and H are based on a subset of 6 and 8 samples for the bathymetric and latitudinal transects, respectively. Mantel tests wereused to assess the significance of Spearman’s correlation coefficients (r) based on 1000 permutations.doi:10.1371/journal.pone.0072779.g004
Figure 5. Non-metric multidimensional scaling (NMDS) plot ofcommunity data. MPTS (A) and ARISA (B) data based on Bray-Curtisdissimilarity matrices. Open circles indicate stations from the bathy-metric transect, filled circles indicate stations from the latitudinaltransect and the crosses indicate the central station. Dotted lines showa minimum spanning tree connecting nearest neighbours. Stress values:0.05 for A and 0.06 for B.doi:10.1371/journal.pone.0072779.g005
Biogeography of Arctic Benthic Bacteria
PLOS ONE | www.plosone.org 6 September 2013 | Volume 8 | Issue 9 | e72779

were hence chosen as proxies to represent some of the complex
factors that may impact the variation in community structure at
the LTER site HAUSGARTEN.
Dissimilarities in bacterial community structure significantly
increased with increasing differences in water depth (r = 0.70,
p = 0.002) and longitude (r = 0.38, p = 0.017); Table 1), but not
with latitude or spatial distance (p = 0.971 and p = 0.342,
respectively). Water depth differences and bacterial community
dissimilarity followed a continuous linear relationship within the
investigated range of 1,284–3,535 m water depth (Figure 4).
Redundancy analyses (RDA) revealed that water depth and
longitude significantly explained 7% and 3% of variation in the
OTU3% dataset, respectively. Water depth was shown to correlate
with bulk enzymatic activity, bacterial abundance and bacterial
viability [13,31]. A number of environmental factors vary with
water depth and may include additional controlling factors, e.g.
food quality or presence of larger organisms (e.g. nematodes [56]).
In addition, adaptation to pressure differences might influence the
bacterial community structure (e.g. [57]).
Particle flux of organic matter to the deep sea generally
decreases with increasing water depth (e.g. [58,59]). We observed
that differences in CPE concentrations correlated positively with
changes in bacterial community structure: stations with high
differences in CPE concentrations showed more dissimilar
community structures (r = 0.38, p = 0.019; Table 1, Figure 4) than
those with similar CPE concentrations. A significant amount of
3% of the variation in bacterial community structure was
explained by CPE concentrations (Table 1). Of course, CPE is
just one proxy for phytodetritus input and does not necessarily
reflect the complexity of food quantity and quality.
Although we did not find a significant correlation between water
depth and CPE concentrations (p = 0.112; Table S5), they
covaried and explained together with porosity 2% of the variation
in community structure. Pure fractions of CPE concentrations
(when the effect of covariation with water depth was removed) did
not significantly explain variation in the community structure
while pure fractions of water depth (when the effect of covariation
with CPE was removed) still specifically explained 5% of the
community variation. Porosity, proteins and phospholipids did not
significantly explain variation in bacterial community structure
(p = 0.313, p = 0.845 and p = 0.149, respectively) although differ-
ences in phospholipid concentrations significantly correlated with
dissimilarities in community structure (r = 0.31, p = 0.04; Table 1).
At the Siberian continental margin a relationship of bacterial
community structure and phaeopigment concentration was found
and a pure effect of phaeopigment concentrations (when the effect
of water depth, spatial distance and protein concentrations was
removed) could explain 5% of variation in community structure
[11]. The reason why we did not find such a relationship could be
explained by the smaller water depth range of this study (1284–
3535 m water depth here, versus 37–3,427 m water depth at the
Siberian continental margin), and the higher supply with
phytodetritus at HAUSGARTEN.
Finally, we also tested the effect of grouping OTU3% at coarser
taxonomic resolution. In this case, community structure at every
taxonomic level significantly correlated with differences in water
depth and a high percentage (12% to 24%) of variation in
community structure could be significantly explained (Table S7).
This means that although most of the phyla and classes were
common to all stations, their members significantly varied in
relative abundances between different water depths. In contrast,
no significant relationship between bacterial community structures
at different taxonomic levels with CPE concentrations was found.
Response of Individual Bacterial TaxaPrevious studies have shown that the abundance of Arctic deep-
sea fauna either linearly decreased with decreasing water depth
and food availability or peaked at intermediate water depth and
thus phytodetritus input [60]. Therefore we used both linear and
quadratic regression to test how individual bacterial taxa
correspond to changes in water depth and CPE concentrations.
Out of the 40 phyla identified in the dataset, 11 showed significant
positive or negative relationships with increasing water depth
(Table S8). Significant negative linear relationships with water
depth were found for Verrucomicrobia and Planctomycetes, two
related taxa which are ubiquitously found in soil and marine
sediments, e.g. [61,62,63]. Their relevant contribution to benthic
bacterial diversity was already reported from sediments in the
Pacific sector of the Arctic Ocean [9], the Siberian margin [11]
and coastal sites of Fram Strait [64,65], yet no relationship with
Table 1. Community response to spatial and environmental factors.
OTU3% OTUARISA
All SSOabs removed SSOrel only
ra R2 adjb. r R2 adj. r R2 adj. r R2 adj.
Spatial distance , , , , , , , ,
Latitude , , , , , , , ,
Longitude 0.38* 0.03* 0.42* 0.05* , 0.02* 0.47** 0.09*
Water depth 0.70** 0.07*** (0.05**) 0.71*** 0.09*** (0.07**) 0.68** 0.06*** (0.04**) 0.83*** 0.22*** (0.14**)
Phospholipids 0.31* , 0.36* , 0.49** , 0.45** ,
CPE 0.38* 0.03* (,) 0.36* 0.04*(,) 0.33* 0.02* (,) 0.38** 0.12** (,)
covariation (0.02) (0.03) (0.02) (0.08)
OTU3%: Clustered sequences from MPTS at 97% sequence identity; OTUARISA: OTU derived from ARISA fingerprinting; SSOabs: OTU3% with only one sequence in thewhole dataset (absolute singletons); SSOrel: OTU3% with only one sequence in at least one sample but more than one sequence in the whole dataset (relativesingletons). aThe significance of Spearman’s correlation coefficients (r) between relative OTU abundance tables and environmental parameter was determined byMantel tests. bRedundancy analysis (RDA) and partial RDA (pRDA; in brackets; to evaluate factor effect while taking the effects of other parameters into account) wereused to determine the amount of variation (R2 adjusted) in the community data in a variation partitioning approach. For pRDA, the used parameters were water depthand CPE concentrations. Note that covariation effects cannot be tested for significance in the variation partitioning context (e.g. [71]). Significance levels are indicated as***: p#0.001, **: p#0.01, *: p#0.05, ,: not significant, p.0.05.doi:10.1371/journal.pone.0072779.t001
Biogeography of Arctic Benthic Bacteria
PLOS ONE | www.plosone.org 7 September 2013 | Volume 8 | Issue 9 | e72779
water depth had been detected. A positive quadratic relationship
with water depth (minimum relative abundance at intermediate
water depth) was found for Deferribacteres, which were previously
found in coastal and deep-sea sediments [2,40] and were reported
from sediments from the Laptev Sea [11]. The phylum
Actinobacteria showed a negative linear relationship with CPE
concentrations, while Planctomycetes and Verrucomicrobia
showed a positive linear relationship (Table S8). Verrucomicrobia
was previously found to be also positively correlated to pigment
concentrations in samples from the Siberian continental margin
[11].
Rare BiosphereThe rare bacterial biosphere was shown to make up a high
fraction of bacterial community diversity in deep-sea sediments
(e.g. [2]). Members of the rare biosphere include types which may
vary in space and time and may become abundant when
favourable conditions are present [66]. Here we looked at a
subset of the rare biosphere including only those OTU3%
occurring with exactly one sequence in at least one sample but
with more than one sequence in the whole dataset (‘‘relative
singletons‘‘, SSOrel, [40]). This group of rare bacterial types
comprised 31% of all OTU3% (25% of all sequences), and on
average 3868% per sample. Interestingly, it showed similar
responses to water depth changes and CPE concentrations as the
whole community: water depth differences were highly correlated
with differences in community structure and explained 6% of the
variation in the SSOrel community data, CPE concentrations
correlated significantly with differences in community structure
and explained 2% of the variation in the community (Table 1).
When removing effects of covariation between water depth and
CPE, the pure fraction of water depth still explained 4% of the
variation in the SSOrel community data, but pure fractions of CPE
concentrations did not significantly explain any variation in the
SSOrel community data. This shows that the rare bacterial
biosphere does vary with water depth, partly independent of
phytodetritus concentrations. Likewise, differences in rare bacte-
rial community structure with different water masses were found
in the water column of the Arctic Ocean [67] and an effect of
pigment concentrations on a part of low abundant bacterial types
were reported from Arctic sediments [11].
Not only abundant types of bacteria but also rare members of
the biosphere were found to be important for microbial processes
(e.g. cellulose and chitin degradation [68]) and specific biogeo-
chemical processes (e.g. sulphate reduction [69]). In Arctic
sediments, high bacterial diversity was related to higher enzymatic
activity and higher rates of organic matter degradation than in less
diverse communities [65], and bacterial community patterns
explained variations in enzyme activity [11]. Rare members of the
biosphere might change in abundance with the varying availability
of certain substrates (see [66] and references therein). Especially in
variable environments such as the Arctic deep sea with a varying
seasonal input of ‘‘fresh’’ phytodetritus, a high bacterial diversity
and a complex community structure may be essential to react to
environmental changes and for the functioning of the ecosystem
[65,68].
Conclusions
We found a spatially highly diverse bacterial community in
surface sediments of the Long-Term Ecological Research site
HAUSGARTEN (Eastern Fram Strait). With 13 sampling stations
over an area of about 3,385 km2 we assessed most of the estimated
regional richness and found strong water depth related patterns of
community structure along the bathymetric transect (54 km
distance, 1,284–3,535 m water depth). Along the 120-km long
latitudinal transect, no increasing bacterial community dissimilar-
ity with increasing spatial distance could be observed. Neverthe-
less, a turnover of on average 79% OTU3% (still 68% when
absolute singletons were removed) was detected between any two
samples taken within a distance of on average 13 km. Pigment
concentrations as a proxy for energy supply in the form of
phytodetritus sedimentation influenced bacterial community
richness and structure, but no strong energy-diversity relationship
was found within the investigated range. We identified indicator
taxa that showed significant changes in relative sequence
abundance with changes in water depth or pigment concentra-
tions. This study demonstrates the complexity of bacterial
community structure in deep-sea sediments and the necessity to
investigate the regional biodiversity of deep-sea life not only at one
single spot, but over scales of 1–100 km and different water depth
zones, in order to better evaluate community responses related to
environmental variations.
Supporting Information
Figure S1 OTU accumulation curves.(DOC)
Table S1 List of samples taken during the Polarsterncruise ARK-XXIV/2 in 2009 and measured environmen-tal parameters.(DOC)
Table S2 Comparison of dataset structure based onARISA and MPTS using Spearman correlation andProcrustes tests.(DOC)
Table S3 Observed and estimated richness of OTU ortaxa at different taxonomic levels and shared OTU ortaxa between all stations.(DOC)
Table S4 Observed and estimated richness of ARISAand MPTS data per station and in the total dataset.(DOC)
Table S5 Spearman’s correlation matrix of alphadiversity measures, water depth and pigment concen-trations (CPE).(DOC)
Table S6 Percentages of pairwise shared, lost andgained OTU3%(A), OTU3% without SSOabs (B) andOTUARISA (C).(DOC)
Table S7 Community response to water depth atdifferent taxonomic levels.(DOC)
Table S8 Linear and quadratic regression of phyla andclasses in the OTU3% dataset.(DOC)
Text S1 Comparison of ARISA and MPTS and Richnessof OTU.(DOC)
Acknowledgments
We like to thank the ship officers and crew of the German research-
icebreaker Polarstern ARK-XXIV/2 cruise. We thank E. Weiz and R.
Biogeography of Arctic Benthic Bacteria
PLOS ONE | www.plosone.org 8 September 2013 | Volume 8 | Issue 9 | e72779
Stiens for assistance during sampling, A. Pappert and C. Hasemann for
biochemical analyses and I. Schewe for providing environmental data. We
thank the Editor and reviewer for useful comments on this manuscript.
This work contributes to LTER research and the Helmholtz PACES
program. This publication is Eprint ID 32826 of the Alfred-Wegener-
Institut Helmholtz-Zentrum fur Polar- und Meeresforschung, Bremerha-
ven, Germany.
Author Contributions
Conceived and designed the experiments: MJ AR TS AB. Performed the
experiments: MJ. Analyzed the data: MJ AR. Wrote the paper: MJ TS AB
AR. Provided environmental data: TS.
References
1. Schauer R, Bienhold C, Ramette A, Harder J (2010) Bacterial diversity andbiogeography in deep-sea surface sediments of the South Atlantic Ocean. ISME
Journal 4: 159–170.
2. Zinger L, Amaral-Zettler LA, Fuhrman JA, Horner-Devine MC, Huse SM, et
al. (2011) Global patterns of bacterial beta-diversity in seafloor and seawaterecosystems. PLoS ONE 6: e24570.
3. Hanson CA, Fuhrman JA, Horner-Devine MC, Martiny JBH (2012) Beyond
biogeographic patterns: processes shaping the microbial landscape. NatureReviews: Microbiology 10: 497–506.
4. Green J, Bohannan BJM (2006) Spatial scaling of microbial biodiversity. Trendsin Ecology & Evolution 21: 501–507.
5. Slatkin M (1993) Isolation by Distance in Equilibrium and Nonequilibrium
Populations. Evolution 47: 264–279.
6. Ramette A, Tiedje JM (2007) Multiscale responses of microbial life to spatial
distance and environmental heterogeneity in a patchy ecosystem. Proceedings ofthe National Academy of Sciences, USA 104: 2761–2766.
7. Redmond MC, Valentine DL (2012) Natural gas and temperature structured a
microbial community response to the Deepwater Horizon oil spill. Proceedings
of the National Academy of Sciences, USA 109: 20292–20297.
8. Levin LA, Sibuet M (2012) Understanding Continental Margin Biodiversity: ANew Imperative. Annual Review of Marine Science 4: 79.
9. Li HR, Yu Y, Luo W, Zeng YX, Chen B (2009) Bacterial diversity in surface
sediments from the Pacific Arctic Ocean. Extremophiles 13: 233–246.
10. Queric NV, Soltwedel T (2012) Benthic prokaryotic community dynamics along
the Ardencaple Canyon, Western Greenland Sea. Sedimentary Geology 263–264: 36–44.
11. Bienhold C, Boetius A, Ramette A (2012) The energy-diversity relationship of
complex bacterial communities in Arctic deep-sea sediments. ISME Journal 6:
724–732.
12. Soltwedel T, Bauerfeind E, Bergmann M, Budaeva N, Hoste E, et al. (2005)HAUSGARTEN: Multidisciplinary investigations at a deep-sea, long-term
observatory in the Arctic Ocean. Oceanography 18: 46–61.
13. Hoste E, Vanhovea S, Schewe I, Soltwedel T, Vanreusel A (2007) Spatial and
temporal variations in deep-sea meiofauna assemblages in the Marginal IceZone of the Arctic Ocean. Deep Sea Research (Part I, Oceanographic Research
Papers) 54: 109–129.
14. Hop H, Falk-Petersen S, Svendsen H, Kwasniewski S, Pavlov V, et al. (2006)Physical and biological characteristics of the pelagic system across Fram Strait to
Kongsfjorden. Progress In Oceanography 71: 182–231.
15. Manley TO (1995) Branching of Atlantic Water within the Greenland-
Spitsbergen Passage - an Estimate of Recirculation. Journal of GeophysicalResearch C Oceans 100: 20627–20634.
16. Piechura J, Walczowski W (2009) Warming of the West Spitsbergen Current andsea ice north of Svalbard. Oceanologia 51: 147–164.
17. Bauerfeind E, Nothig EM, Beszczynska A, Fahl K, Kaleschke L, et al. (2009)
Particle sedimentation patterns in the eastern Fram Strait during 2000–2005:Results from the Arctic long-term observatory HAUSGARTEN. Deep Sea
Research (Part I, Oceanographic Research Papers) 56: 1471–1487.
18. Kraft A, Bauerfeind E, Nothig E-M (2010) Amphipod abundance in sediment
trap samples at the long-term observatory HAUSGARTEN (Fram Strait, 79uN/4uE). Variability in species community patterns. Marine Biodiversity: 1–12.
19. Lalande C, Bauerfeind E, Nothig E-M, Beszczynska-Moller A (2013) Impact of a
warm anomaly on export fluxes of biogenic matter in the eastern Fram Strait.
Progress in Oceanography 109: 70–77.
20. Ambrose WG, Renaud PE (1995) Benthic response to water column productivitypatterns - Evidence for benthic-pelagic coupling in the Northeast Water Polynya.
Journal of Geophysical Research C Oceans 100: 4411–4421.
21. Schewe I, Soltwedel T (2003) Benthic response to ice-edge-induced particle flux
in the Arctic Ocean. Polar Biology 26: 610–620.
22. Soltwedel T, Hasemann C, Queric NV, von Juterzenka K (2005) Gradients inactivity and biomass of the small benthic biota along a channel system in the
deep Western Greenland Sea. Deep Sea Research (Part I, Oceanographic
Research Papers) 52: 815–835.
23. Klages M, Boetius A, Christensen JP, Deubel H, Piepenburg D, et al. (2003) Thebenthos of Arctic seas and its role for the organic carbon cycle at the seafloor. In:
Stein R, Macdonald RW, editors. The Arctic Organic Carbon Cycle.Heidelberg: Springer Verlag.
24. Grebmeier JM, Overland JE, Moore SE, Farley EV, Carmack EC, et al. (2006)A major ecosystem shift in the northern Bering Sea. Science 311: 1461–1464.
25. Smith CR, De Leo FC, Bernardino AF, Sweetman AK, Arbizu PM (2008)
Abyssal food limitation, ecosystem structure and climate change. Trends inEcology & Evolution 23: 518–528.
26. van Oevelen D, Bergmann M, Soetaert K, Bauerfeind E, Hasemann C, et al.
(2011) Carbon flows in the benthic food web at the deep-sea observatory
HAUSGARTEN (Fram Strait). Deep Sea Research (Part I, Oceanographic
Research Papers) 58: 1069–1083.
27. Soltwedel T, Mokievsky V, Schewe I (2000) Benthic activity and biomass on the
Yermak Plateau and in adjacent deep-sea regions northwest of Svalbard. Deep
Sea Research (Part I, Oceanographic Research Papers) 47: 1761–1785.
28. Kanzog C, Ramette A (2009) Microbial colonisation of artificial and deep-sea
sediments in the Arctic Ocean. Marine Ecology 30: 391–404.
29. Kanzog C, Ramette A, Queric NV, Klages M (2009) Response of benthic
microbial communities to chitin enrichment: an in situ study in the deep Arctic
Ocean. Polar Biology 32: 105–112.
30. Queric NV, Arrieta JM, Soltwedel T, Arntz WE (2008) Prokaryotic community
dynamics in the sedimentary microenvironment of the demosponge Tentorium
semisuberites from deep Arctic waters. Marine Ecology Progress Series 370: 87–
95.
31. Queric NV, Soltwedel T, Arntz WE (2004) Application of a rapid direct viable
count method to deep-sea sediment bacteria. Journal of Microbiological
Methods 57: 351–367.
32. Thiel H (1978) Benthos in upwelling regions. In: Boje R, Tomczak M, editors.
Upwelling Ecosystems. Berlin: Springer. 124–138.
33. Boetius A, Damm E (1998) Benthic oxygen uptake, hydrolytic potentials and
microbial biomass at the Arctic continental slope. Deep Sea Research (Part I,
Oceanographic Research Papers) 45: 239–275.
34. Meyer-Reil LA (1983) Benthic response to sedimentation events during autumn
to spring at a shallow water station in the Western Kiel Bight. Marine Biology
77: 247–256.
35. Ramette A (2009) Quantitative community fingerprinting methods for
estimating the abundance of operational taxonomic units in natural microbial
communities. Applied and Environmental Microbiology 75: 2495–2505.
36. Schloss PD, Westcott SL, Ryabin T, Hall JR, Hartmann M, et al. (2009)
Introducing mothur: Open-Source, Platform-Independent, Community-Sup-
ported Software for Describing and Comparing Microbial Communities.
Applied and Environmental Microbiology 75: 7537–7541.
37. Schloss PD, Gevers D, Westcott SL (2011) Reducing the Effects of PCR
Amplification and Sequencing Artifacts on 16 S rRNA-Based Studies. PLoS
ONE 6: e27310.
38. Pruesse E, Quast C, Knittel K, Fuchs BM, Ludwig WG, et al. (2007) SILVA: a
comprehensive online resource for quality checked and aligned ribosomal RNA
sequence data compatible with ARB. Nucleic Acids Research 35: 7188–7196.
39. Sogin ML, Morrison HG, Huber JA, Welch DM, Huse SM, et al. (2006)
Microbial diversity in the deep sea and the underexplored ‘‘rare biosphere’’.
Proceedings of the National Academy of Sciences, USA 103: 12115–12120.
40. Gobet A, Boer SI, Huse SM, van Beusekom JEE, Quince C, et al. (2012)
Diversity and dynamics of rare and of resident bacterial populations in coastal
sands. ISME Journal 6: 542–553.
41. Anderson MJ (2006) Distance-based tests for homogeneity of multivariate
dispersions. Biometrics 62: 245–253.
42. Legendre P, Legendre L, editors (1998) Numerical Ecology. 2nd English ed:
Elsevier Science, Amsterdam.
43. Gobet A, Quince C, Ramette A (2010) Multivariate Cutoff Level Analysis
(MultiCoLA) of large community data sets. Nucleic Acids Research 38: 155.
44. R Development Core Team (2008) R: A language and environment for
statistical computing. R Foundation for Statistical Computing. Retrieved from
http://www.R-project.org ed. Vienna, Austria.: R Foundation for Statistical
Computing.
45. Oksanen J, Blanchet FG, Kindt R, Legendre P, Minchin PR, et al. (2012) vegan:
Community Ecology Package. R package version 2.0–4 ed.
46. Simpson GL (2012) permute: Functions for generating restricted permutations of
data. R package version 0.7–0 ed.
47. Venables WN, Ripley BD (2002) Modern Applied Statistics with S. New York:
Springer.
48. Tian F, Yu Y, Chen B, Li HR, Yao YF, et al. (2009) Bacterial, archaeal and
eukaryotic diversity in Arctic sediment as revealed by 16 S rRNA and 18 S
rRNA gene clone libraries analysis. Polar Biology 32: 93–103.
49. Galand PE, Potvin M, Casamayor EO, Lovejoy C (2010) Hydrography shapes
bacterial biogeography of the deep Arctic Ocean. ISME Journal 4: 564–576.
50. Wlodarska-Kowalczuk M, Kendall MA, Weslawski JM, Klages M, Soltwedel T
(2004) Depth gradients of benthic standing stock and diversity on the continental
margin at a high-latitude ice-free site (off Spitsbergen, 79uN). Deep Sea Research
(Part I, Oceanographic Research Papers) 51: 1903–1914.
Biogeography of Arctic Benthic Bacteria
PLOS ONE | www.plosone.org 9 September 2013 | Volume 8 | Issue 9 | e72779

51. Soltwedel T, Mokievsky V, Schewe I, Hasemann C (2009) Yermak Plateau
revisited: spatial and temporal patterns of meiofaunal assemblages underpermanent ice-coverage. Polar Biology 32: 1159–1176.
52. Ingels J, Van den Driessche P, De Mesel I, Vanhove S, Moens T, et al. (2010)
Preferred use of bacteria over phytoplankton by deep-sea nematodes in polarregions. Marine Ecology Progress Series 406: 121–133.
53. Soltwedel T, Vopel K (2001) Bacterial abundance and biomass in response toorganism-generated habitat heterogeneity in deep-sea sediments. Marine
Ecology Progress Series 219: 291–298.
54. Fisher MM, Triplett EW (1999) Automated Approach for Ribosomal IntergenicSpacer Analysis of Microbial Diversity and Its Application to Freshwater
Bacterial Communities. Applied and Environmental Microbiology 65: 4630–4636.
55. MacDonald IR, Bluhm BA, Iken K, Gagaev S, Strong S (2010) Benthicmacrofauna and megafauna assemblages in the Arctic deep-sea Canada Basin.
Deep Sea Research (Part II, Topical Studies in Oceanography) 57: 136–152.
56. De Mesel I, Derycke S, Moens T, Van der Gucht K, Vincx M, et al. (2004) Top-down impact of bacterivorous nematodes on the bacterial community structure:
a microcosm study. Environmental Microbiology 6: 733–744.57. Bartlett DH, Kato C, Horikoshi K (1995) High pressure influences on gene and
protein expression. Research in Microbiology 146: 697–706.
58. Billett DSM, Lampitt RS, Rice AL, Mantoura RFC (1983) SeasonalSedimentation of Phytoplankton to the Deep-Sea Benthos. Nature 302: 520–
522.59. Buesseler KO, Lamborg CH, Boyd PW, Lam PJ, Trull TW, et al. (2007)
Revisiting carbon flux through the ocean’s twilight zone. Science 316: 567–570.60. Bodil B, Ambrose W, Bergmann M, Clough L, Gebruk A, et al. (2011) Diversity
of the arctic deep-sea benthos. Marine Biodiversity 41: 87–107.
61. Freitas S, Hatosy S, Fuhrman JA, Huse SM, Welch DBM, et al. (2012) Globaldistribution and diversity of marine Verrucomicrobia. ISME Journal 6: 1499–
1505.
62. Fuerst JA, Sagulenko E (2011) Beyond the bacterium: Planctomycetes challenge
our concepts of microbial structure and function. Nature Reviews: Microbiology
9: 403–413.
63. Lee KC, Webb RI, Janssen PH, Sangwan P, Romeo T, et al. (2009) Phylum
Verrucomicrobia representatives share a compartmentalized cell plan with
members of bacterial phylum Planctomycetes. Bmc Microbiology 9.
64. Ravenschlag K, Sahm K, Pernthaler J, Amann R (1999) High bacterial diversity
in permanently cold marine sediments. Applied and Environmental Microbi-
ology 65: 3982–3989.
65. Teske A, Durbin A, Ziervogel K, Cox C, Arnosti C (2011) Microbial community
composition and function in permanently cold seawater and sediments from an
Arctic fjord of Svalbard. Applied and Environmental Microbiology 77: 2008–
2018.
66. Pedros-Alio C (2012) The rare bacterial biosphere. Annual Review of Marine
Science 4: 449–466.
67. Galand PE, Casamayor EO, Kirchman DL, Lovejoy C (2009) Ecology of the
rare microbial biosphere of the Arctic Ocean. Proceedings of the National
Academy of Sciences, USA 106: 22427–22432.
68. Peter H, Beier S, Bertilsson S, Lindstrom ES, Langenheder S, et al. (2011)
Function-specific response to depletion of microbial diversity. ISME Journal 5:
351–361.
69. Pester M, Bittner N, Deevong P, Wagner M, Loy A (2010) A ‘rare biosphere’
microorganism contributes to sulfate reduction in a peatland. ISME Journal 4:
1591–1602.
70. GeoMapApp website. Available: http://www.geomapapp.org/. Version 3.3.0
Accessed 2013 Jan 29.
71. Borcard D, Legendre P, Drapeau P (1992) Partialling out the spatial component
of ecological variation. Ecology 73: 1045–1055.
Biogeography of Arctic Benthic Bacteria
PLOS ONE | www.plosone.org 10 September 2013 | Volume 8 | Issue 9 | e72779