Pyrenean meadows in Natura 2000 network: grass production and plant biodiversity conservation
Upload
khangminh22Category
view
0download
0
ISSN: 1321-6619
Working Paper No. 20
The Environment, Biodiversity and Asian Development
by
Clem Tisdell
September 1995
BIODIVERSITY CONSERVATION: STUDIES IN ITS ECONOMICS AND
MANAGEMENT, MAINLY IN YUNNAN, CHINA
THE UNIVERSITY OF QUEENSLAND
ISSN 1321-6619
WORKING PAPERS ON BIODIVERSITY CONSERVATION: STUDIES IN ITS ECONOMICS AND MANAGEMENT, MAINLY IN YUNNAN CHINA
Working Paper No. 20
The Environment, Biodiversity and Asian Development1
by
Clem Tisdell2
September 1995
© All rights reserved
1 This is a revised version of a paper prepared for an Economics of Trade and Development Seminar, Economic
Discipline, RSPAS, the Australian National University. This seminar was given on Tuesday 25 July 1995. I wish to thank participants for their useful comments. The usual caveat applies. A small amount of financial assistance for preparation of this paper was obtained from ACIAR Project No. 40
2 School of Economics, The University of Queensland, St. Lucia Campus, Brisbane QLD 4072, Australia
Email: [email protected]
WORKING PAPERS IN THE SERIES, BIODIVERSITY CONSERVATION: STUDIES IN ECONOMICS AND MANAGEMENT, MAINLY IN YUNNAN, CHINA are published by the Department of Economics, University of Queensland, 4072, Australia, as part of Australian Centre for International Agricultural Research Project 40 of which Professor Clem Tisdell is the Project Leader. Views expressed in these working papers are those of their authors and not necessarily of any of the organisations associated with the Project. They should not be reproduced in whole or in part without the written permission of the Project Leader. It is planned to publish contributions to this series· over the next 4 years.
Research for ACIAR project 40, Economic impact and rural adjustments to nature conservation (biodiversity) programmes: A case study of Xishuangbanna Dai Autonomous Prefecture, Yunnan, China is sponsored by -the Australian Centre for Internat ional Agricultural Research (ACIAR), GPO Box 1571, Canberra, ACT, 2601, Australia. The following is a brief outline of the Project
Rural nature reserves can have negative as well as positive spillovers to the local region and policies need to be implemented to maximise t h e net economic b e n e f i t s obtained locally. Thus an 'open' approach to the management and development of nature conservation ( biodiversity) programmes is needed. The purpose of this study is to concentrate o n these economic interconnections for Xishuangbanna National Nature Reserve and their implications for its management, and for rural economic development in the Xishuangbanna Dai Prefecture but with some comparative analysis for other parts of Yunnan
The Project will involve the following:
1. A relevant review relating to China and developing countries generally. 2. Cost-benefit evaluation o f protection o f the Reserve and/or assessment by other social
eva lua t ion techniques. 3. An examination of the growth and characteristics of tourism in and nearby the R e s e r v e a n d
economic oppor tun i t ies g e n e r a t e d by this will be examined. 4. The economics o f pest control involving the Reserve will be considered. This involves the
problem of pests straying from and into the Reserve, e.g., elephants. 5. The possibilities f o r limited commercial o r subsistence use of the Reserve will be
researched. 6. Financing the management o f the Reserve will be examined. This will involve considering
c u r r e n t sources o f finance a n d patterns of outlays, by management ·of the Reserve, economic methods for increasing income from the Reserve and financial ·problems and issues such as degree of dependence on central funding.
7. Pressure to use the resources of the Reserve comes from nearby populations, a n d from v i l l ag e rs settled in the Reserve. Ways of coping with this problem will be considered.
8. The political econom y of decision-making affecting the Reserve will be outlined.
Commissioned Organizat ion : University of Queensland
Collaborator: Southwest Forestry College, Kunming, Yunnan, China
For more information write to Professor Clem Tisdell, School of Economics, University of Queensland, St. Lucia Campus, Brisbane 4072, Australia or email [email protected] or in China to Associate Professor Zhu Xiang, World Bank Loan Project Management Centre, Ministry of Forestry, Hepingli, Beijing 100714, People’s Republic of China.
1
The Environment, Biodiversity and Asian Development in South
Asia
1. Introduction
Growth of production in the major South Asian economies has been relatively rapid since
1980 and has accelerated compared to the 1970s. While this growth has been less rapid than
that of major low-income East Asian economies, the difference in growth rates between these
areas may have been exaggerated in popular discussions describing the East Asian ‘economic
miracle’ (Chakravarty, 1990). However, faster population growth in most South Asian
economies than in most East Asian economies has meant that per capita incomes in the
former have grown at a much slower rate than in the latter. Some East Asian economies have
completed demographic transition or are well on the way to doing so, even though there are
notable exceptions such as the Philippines (Ogawa and Tsuya, 1993). Table 1 provides some
supporting comparative data on growth of production and population in selected South and
East Asian economies.

2
Table 1: Rates of Growth of Production and Population in Selected South and East
Asian Economies
GDP
Annual percentage increase
Population
Annual percentage increase
1970-80 1980-92 1970-80 1980-92
South Asia
Bangladesh 2.3 4.2 2.6 2.3
India 3.4 5.2 2.3 2.1
Pakistan 4.9 6.1 3.1 3.1
Sri Lanka 4.1 4.0 1.6 1.2
East Asia
China – 9.1 1.8 1.4
Indonesia 7.2 5.7 2.3 1.8
The Philippines 6.0 1.2 2.5 2.4
Thailand 7.1 8.2 2.7 1.8
Based on World Bank (1994), Tables 2 and 25.
Table 1does not, of course, portray fully the diversity of economic experiences in both
regions. If all countries in East Asia are considered, economic performances vary
considerably, e.g. if Laos or Myanmar are included, and the economic experience of the
Philippines has been less satisfactory than that of most South Asian economies. Differences
in growth rates of economic production have sometimes been attributed to whether individual
economies are inward or outward-looking in their economic policies. Given the preference of
the IMF and the World Bank for structural adjustment and free trade policies, there may have
been a tendency to exaggerate any signs supporting this position and underplay other factors;
e.g. the role of 'fortuitous' natural resource exports in the growth of some South East Asian
economies, e.g. oil in the case of Indonesia, also timber exports in Indonesia's case and a
number of other cases.
Both in South and East Asia economic growth is proceeding at a sufficient pace to have
substantial impacts on natural environments. Since the 1970s considerable loss has occurred
of forested and woodland areas in Asia, and use of agricultural land has intensified
3
principally as a consequence of the green revolution (Alauddin and Tisdell, 1991), water
utilisation and scarcity of 'water has increased, pollution of water and air has risen in many
Asian areas and biological diversity has fallen. Economic production is starting to dominate
most Asian economies as they increasingly become interdependent market economies (Roy et
al., 1992). This is reflected in the pace of investment in infrastructure in Asia for such items
as roads, communication systems, electricity supply, water supplies and irrigation, safe water
and sanitation (World Bank, 1994). While such developments often improve human welfare
and man-made environments, they alter natural environments considerably and contribute to
loss of biodiversity.
Asia's environmental problem is not just a matter of the volume of its wastes, but also their
concentration. With rising urbanisation in Asia, concentration of wastes in metropolitan areas
is rising, e.g., problems of disposal of sewage. While it is true that concentration of
population may improve economies of treatment of wastes, the effect of 'treatment' may be
localized. For example, more households may be connected to sewers but less nightsoil may
be recycled in agriculture and aquaculture. This recycling as has been the past Chinese
practice. Thus the organic load of large water bodies such as rivers is increased and spillovers
from cities may occur even at distant points from the urban areas. For example, the increasing
incidence of red tides in the China Sea (which make fish poisonous to humans) is attributed
by some to such factors. Furthermore, this type of organic pollution as well as industrial
pollution, threaten China's very large aquaculture industry as China's economic growth
proceeds.
2. Digression on the Importance of Natural Environmental, Resource Stock and
Sustainable Development
Classical economists emphasized the importance of capital accumulation (man-made as a
vehicle of economic growth and development. For example, Marx (1956) stressed its
importance and this led Paul Samuelson to suggest that for Marx capital accumulation as a
means to economic growth was equivalent to most of the wisdom bequeathed by Moses and
all the prophets. In addition, Engels (1957) stressed the significance of scientific and
technological progress for economic growth in a trenchant attach on Malthusian economic
theory.

4
Most economic growth and development models favoured in the mid-20th century saw
capital and labour (population) as the main determinants of production, e.g., the Solow-Swan
model (Solow, 1956; Swan, 1956). Solow (1957) subsequently extended the model to include
technological change as an autonomous or exogenous variable in the economy's production
function. This growth model was nevertheless not constrained by environmental· or natural
resource factors (Tisdell, 1990, Ch. 3). It seemed that capital accumulation via savings and
continued technological progress held the key to long-term sustainable growth and economic
development. In relation to economic development, approaches such as those of Meier (1976)
stressed physical capital accumulation essential and gave little or no attention to the role of
natural resources and the environment in economic development.
It is true that in the 1970s neoclassical economic growth gave increasing attention to natural
resources, especially depletable non-renewable resources. In general, it was believed that
such resources were unlikely to pose limits or significant barriers to economic growth
(Solow, 1974, 1986). Neoclassical economists generally remained optimistic about the
prospects for economic growth and for continuing economic development and rejected views
unfavourable to this outlook such as those associated with the Club of Rome (Meadows, et
al.,1972, 1992)
The empirical studies of Denison (1962) pointed strongly (at least, in developed countries) to
the significance of qualitative factors, such as education and technological progress, as
sources of economic growth and suggested that they might be an even more important source
of economic growth than increases in the quantity of physical capital and of labour.
Furthermore, it was recognized that economies of scale in use of infrastructure could be
important.
'New' endogenous economic growth theories, e.g., Romer (1986, 1994) have incorporated
human capital (e.g., the production and transmission of knowledge) into their models and
have allowed for possible external economies in economic growth. However, these theories,
like their predecessors, have tended to ignore possible environmental and natural resource
constraints on economic growth. In its respect, they contrast with those of writers such as
Mäler (1974), Pearce and others (1990, 1993), Perrings (1987) and Turner and others (1993).
These writers stress the importance of conserving natural environmental capital stock in order
to achieve sustainable development. Diminution or destruction of this stock either by its
depletion for its economic use or by pollution (the environment is used as a sink for wastes
5
from human activity including economic activity) can threaten sustainable development.
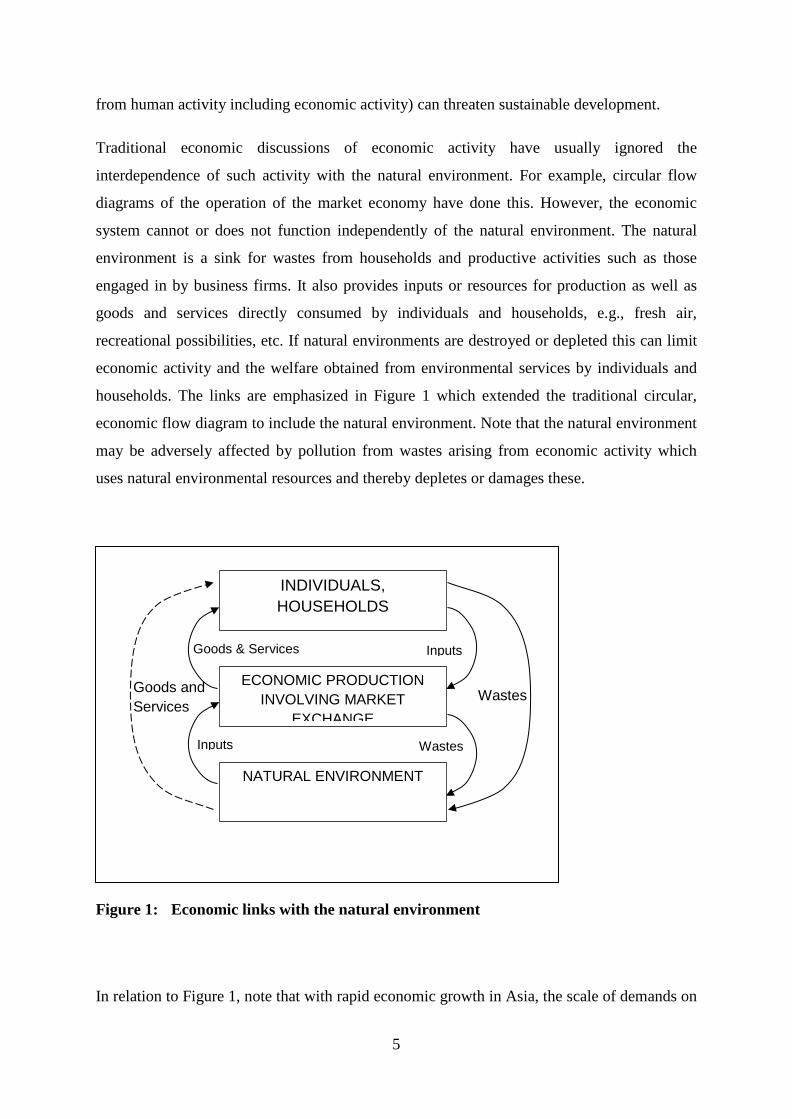
Traditional economic discussions of economic activity have usually ignored the
interdependence of such activity with the natural environment. For example, circular flow
diagrams of the operation of the market economy have done this. However, the economic
system cannot or does not function independently of the natural environment. The natural
environment is a sink for wastes from households and productive activities such as those
engaged in by business firms. It also provides inputs or resources for production as well as
goods and services directly consumed by individuals and households, e.g., fresh air,
recreational possibilities, etc. If natural environments are destroyed or depleted this can limit
economic activity and the welfare obtained from environmental services by individuals and
households. The links are emphasized in Figure 1 which extended the traditional circular,
economic flow diagram to include the natural environment. Note that the natural environment
may be adversely affected by pollution from wastes arising from economic activity which
uses natural environmental resources and thereby depletes or damages these.
Figure 1: Economic links with the natural environment
In relation to Figure 1, note that with rapid economic growth in Asia, the scale of demands on
INDIVIDUALS, HOUSEHOLDS
ECONOMIC PRODUCTION INVOLVING MARKET
EXCHANGE
NATURAL ENVIRONMENT
Goods & Services Inputs
Goods and Services
Inputs Wastes
Wastes
6
0 the natural environment in Asia are increasing rapidly. Consequently, both the demand to use
natural resources for economic production is rising and so too is the demand to use the natural
environment as a sink for pollution and wastes from human activity. Thus, concern has arisen
about the sustainability of Asia's projected economic growth.
Most environmental economists (Pearce, 1993, Ch. 2) stress that in considering economic
growth and development, particularly its sustainability, three types of capital stock play a
significant role.
(1) Man-made capital, mostly physical capital.
(2) Human capital, including technical and scientific knowledge and education.
(3) Natural environmental capital.
Possible relationships between these forms of capital and labour as an input into the
production of man-made capital are indicated in Figure 2. Social and cultural capital might, in
addition, be considered as a part of human capital and includes the stock and nature of
institutions in-society. Production of physical capital (and in some cases, human capital) is
often at the expense of the natural environmental capital.

7
Figure 2: Production of man-made capital usually draws on natural capital and makes
use of human capital and labour. Man-made capital is subject to
depreciation but natural capital is not usually and the same is true for
human capital.
The question has arisen of the extent to which it is possible to safely substitute other forms of
capital for the stock of natural environmental resources and still sustain economic
development. Two different standpoints have been identified in the literature (Pearce, 1993,
Ch. 2): (1) substitution of physical and human capital for natural environmental capital is
likely to be compatible with sustainable development (this is identified as weak sustainability
since it proposes conditions weak conditions for sustainable development) and (2) the view
that such substitution is incompatible with sustainable development. This is described as
strong sustainability since it proposes a strong condition for sustainable development, namely
that the stock of natural environmental resources be fully preserved.
The conditions for sustainable development as classified by Pearce (1993) apply to
sustainable development in the sense commonly used by economists, namely that the incomes
of future generations be no less than those of present generations. There are a spectrum of
views about the extent to which natural environmental resources can be forgone and
development can be sustained in the above sense. These are summarised in Figure 3 along the
TOTAL CAPITAL STOCK =
MAN-MADE CAPITAL
Physical or
Embodied Capital
HUMAN CAPITAL
Knowledge, Education
NATURAL CAPITAL
Environmental
Resources, Land
Labour
+ +

8
lines suggested by Pearce (1993). In Asia, it appears that weak conditions for sustainability
been accepted, at least in the past and that growth optimism is the dominant political force.
Figure 3: Weak and strong conditions for sustainable development and spectrum of
views about those conditions according to Pearce ( 1993, Ch 2.)
Note that Pearce's classification, given his accepted definition of sustainable development,
WEAK CONDITIONS FOR SUSTAINABILITY
- Man made capital is a suitable bequest for future generations.
- Acceptable to substitute man-made capital for natural resources.
- Desirable, however, to develop energy supplies from sustainable sources, such as solar, as non-renewable energy resources are depleted.
STRONG CONDITIONS FOR SUSTAINABILITY
- stress is on trying to hold the natural resource stock constant. Only limited substitutability of man-made capital for natural resources is allowed. This is said to be necessary to take care of future generations
A SPECTRUM OF VIEWS ABOUT CONDITIONS FOR SUSTAINABILITY
Very weak ◈ Weak ◈ Intermediate ◈ Strong ◈ Very Strong ◈
Growth optimists 'Dark Green' Conservationists

9
anthropocentric. However, ecocentric values should also be considered. Some individuals
argue that positive weight should be put on preserving or not extinguishing other species
independently of the wishes of individual humans. Given this point of view, some 'dark green'
conservationists may in fact favour conserving natural environments even when this is at the
expense the income of present future generations. Whether or not Asian countries are likely
to put much weight on ecocentism or the preservation of other species for their own sake can
be debated. However, features of Buddhism and Hinduism support such ethics and the
Chinese traditional view of the importance of balance of mankind with nature can also
support wider conservation ethics than purely man-centred ones.
An intermediate position on conservation (not captured in Figure 3) has been proposed by
Turner and Pearce (Pearce, 1994, Ch. 2) namely that substitution of other forms of capital for
natural environmental capital is consistent with sustainability except for substitution from a
core of the natural resource stock. Once the stock of natural environmental capital is reduced
to the core, strong sustainability conditions apply. Note that as a result of global economic
growth we may be rapidly approaching the core of the natural environmental stock for the
world as a whole or possibly could have reached it. It is even possible that some individual
Asian countries are already approaching a similar situation, e.g., Bangladesh and China. If so,
they would need to be wary of increasing their physical capital stocks at the expense of their
natural environmental stocks. In any case, all countries, including those in Asia should
attempt to preserve their environmental core if they want to achieve sustainable development.
Unfortunately, however Turner and Pearce have not provided us with a simple means to
identify the core of the natural environmental resource stock.
The above may indicate that while the early economic ascent of mankind obtained by
substituting other forms of capital for natural capital was appropriate, this process is less
appropriate now because natural resource stocks have become reduced This constraint (if it is
a real one) may be especially unfortunate for less developed countries, such as those in Asia,
much of the reduction of the globe's natural resources has not been of their own making but
brought about by more developed countries. Nevertheless, despite this, it would be pointless
the question of whether economic growth in Asian countries is sustainable in view of its
likely impacts on their natural environments.
10
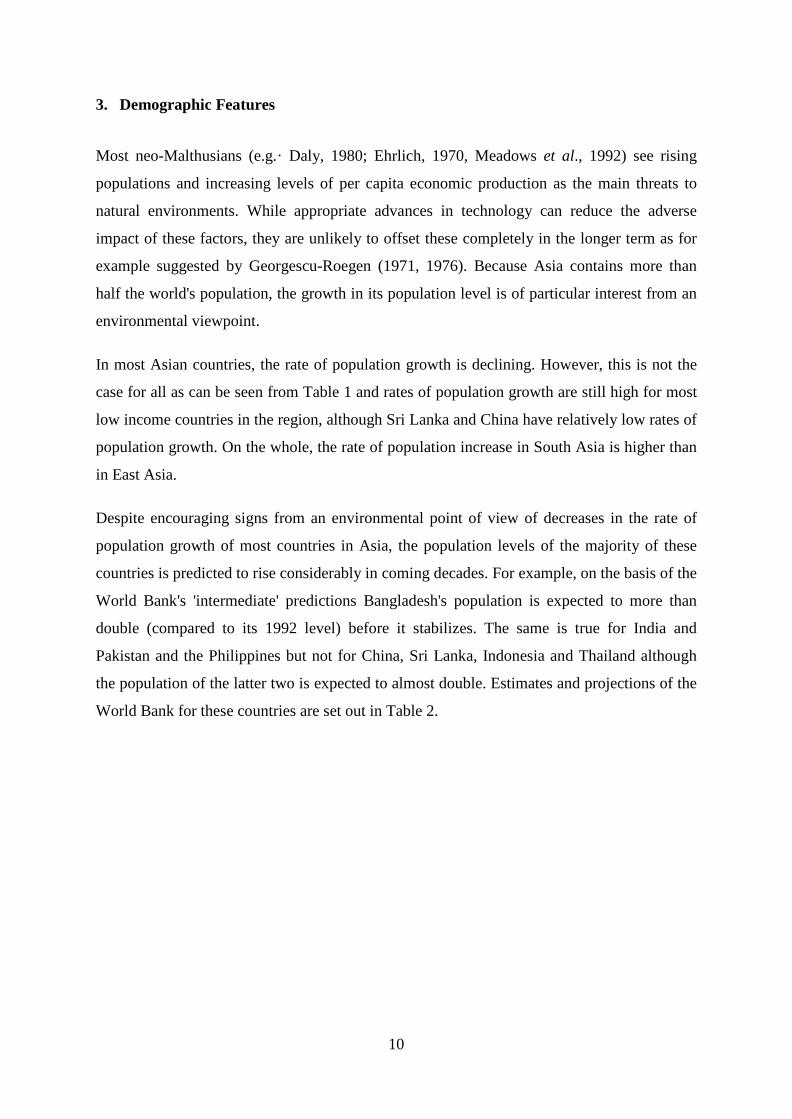
3. Demographic Features
Most neo-Malthusians (e.g.· Daly, 1980; Ehrlich, 1970, Meadows et al., 1992) see rising
populations and increasing levels of per capita economic production as the main threats to
natural environments. While appropriate advances in technology can reduce the adverse
impact of these factors, they are unlikely to offset these completely in the longer term as for
example suggested by Georgescu-Roegen (1971, 1976). Because Asia contains more than
half the world's population, the growth in its population level is of particular interest from an
environmental viewpoint.
In most Asian countries, the rate of population growth is declining. However, this is not the
case for all as can be seen from Table 1 and rates of population growth are still high for most
low income countries in the region, although Sri Lanka and China have relatively low rates of
population growth. On the whole, the rate of population increase in South Asia is higher than
in East Asia.
Despite encouraging signs from an environmental point of view of decreases in the rate of
population growth of most countries in Asia, the population levels of the majority of these
countries is predicted to rise considerably in coming decades. For example, on the basis of the
World Bank's 'intermediate' predictions Bangladesh's population is expected to more than
double (compared to its 1992 level) before it stabilizes. The same is true for India and
Pakistan and the Philippines but not for China, Sri Lanka, Indonesia and Thailand although
the population of the latter two is expected to almost double. Estimates and projections of the
World Bank for these countries are set out in Table 2.

11
Table 2: Estimates and Predictions of Population Levels for Selected Asian Countries:
Totals in Millions.
1992 2000 2025 Hypothetical stationary level
South Asia
Bangladesh 114 132 182 263
India 884 1,016 1,370 1,888
Pakistan 119. 148 243 400
Sri Lanka 17 19 24 29
East Asia
China 1,162 1,255 1,471 1,680
Indonesia 184 206 265 355
The Philippines 64 77 115 172
Thailand 58 65 81 104
Source: Based on World Bank (1994), Table 25.
Given- these estimates and given the plans of Asian countries to increase their levels of per
capita income, it is apparent that natural environments in Asia will remain under continuing
and increasing threat for several decades. In addition, growth in these countries can be
expected to have significant global environmental impacts, for example in adding to
greenhouse gas emissions (Tisdell, 1995).
As can be seen from Table 3, the major South Asian economies have recorded a positive
average annual growth rate in per capita GNP since 1982, but their rates of growth have not
been as high as in China and Thailand nor that in most East Asian countries. Nevertheless, all
East Asian countries have not been high economic performers. For example, in the case of the
Philippines, per capita GNP has actually declined.
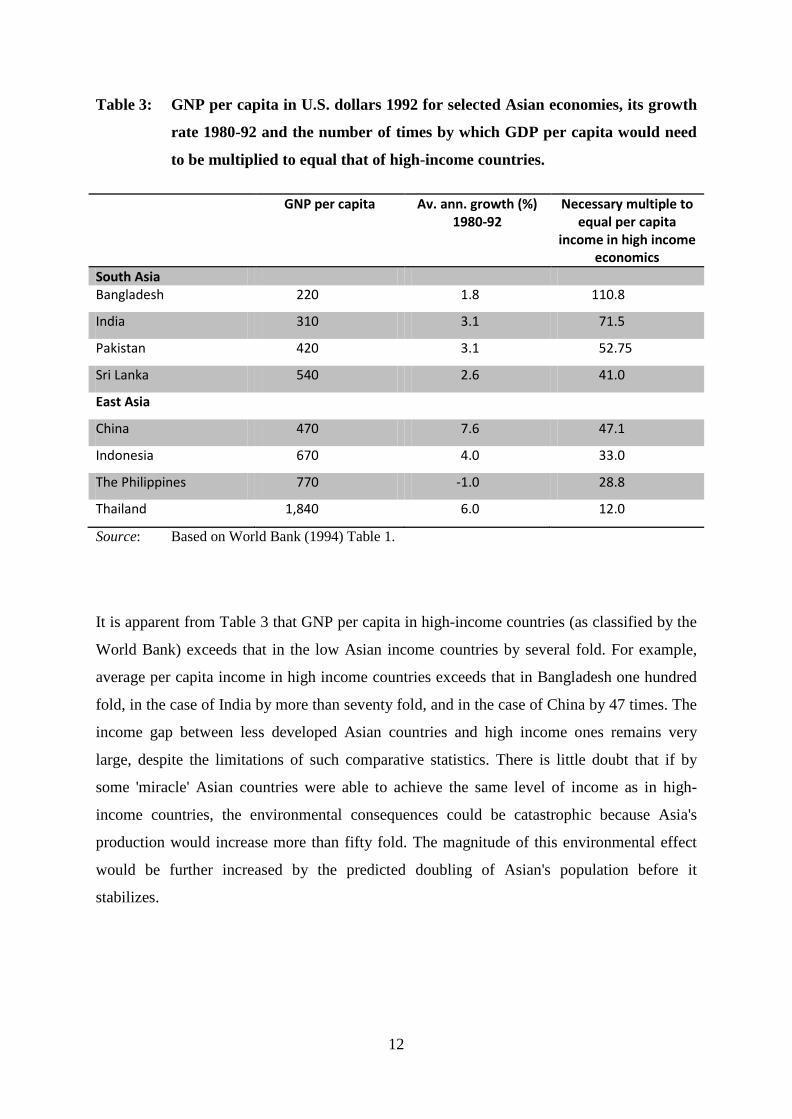
12
Table 3: GNP per capita in U.S. dollars 1992 for selected Asian economies, its growth
rate 1980-92 and the number of times by which GDP per capita would need
to be multiplied to equal that of high-income countries.
GNP per capita Av. ann. growth (%) 1980-92
Necessary multiple to equal per capita
income in high income economics
South Asia Bangladesh 220 1.8 110.8
India 310 3.1 71.5
Pakistan 420 3.1 52.75
Sri Lanka 540 2.6 41.0
East Asia
China 470 7.6 47.1
Indonesia 670 4.0 33.0
The Philippines 770 -1.0 28.8
Thailand 1,840 6.0 12.0
Source: Based on World Bank (1994) Table 1.
It is apparent from Table 3 that GNP per capita in high-income countries (as classified by the
World Bank) exceeds that in the low Asian income countries by several fold. For example,
average per capita income in high income countries exceeds that in Bangladesh one hundred
fold, in the case of India by more than seventy fold, and in the case of China by 47 times. The
income gap between less developed Asian countries and high income ones remains very
large, despite the limitations of such comparative statistics. There is little doubt that if by
some 'miracle' Asian countries were able to achieve the same level of income as in high-
income countries, the environmental consequences could be catastrophic because Asia's
production would increase more than fifty fold. The magnitude of this environmental effect
would be further increased by the predicted doubling of Asian's population before it
stabilizes.
13
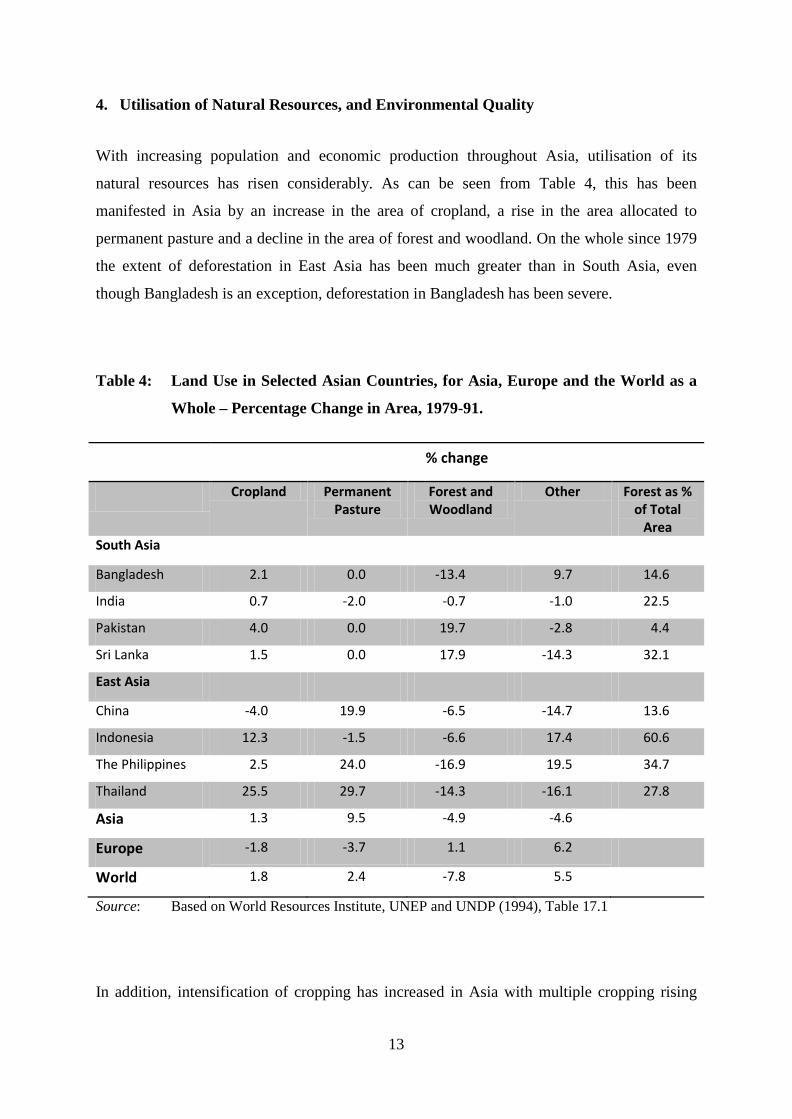
4. Utilisation of Natural Resources, and Environmental Quality
With increasing population and economic production throughout Asia, utilisation of its
natural resources has risen considerably. As can be seen from Table 4, this has been
manifested in Asia by an increase in the area of cropland, a rise in the area allocated to
permanent pasture and a decline in the area of forest and woodland. On the whole since 1979
the extent of deforestation in East Asia has been much greater than in South Asia, even
though Bangladesh is an exception, deforestation in Bangladesh has been severe.
Table 4: Land Use in Selected Asian Countries, for Asia, Europe and the World as a
Whole – Percentage Change in Area, 1979-91.
% change
Cropland Permanent Pasture
Forest and Woodland
Other Forest as % of Total
Area South Asia
Bangladesh 2.1 0.0 -13.4 9.7 14.6
India 0.7 -2.0 -0.7 -1.0 22.5
Pakistan 4.0 0.0 19.7 -2.8 4.4
Sri Lanka 1.5 0.0 17.9 -14.3 32.1
East Asia
China -4.0 19.9 -6.5 -14.7 13.6
Indonesia 12.3 -1.5 -6.6 17.4 60.6
The Philippines 2.5 24.0 -16.9 19.5 34.7
Thailand 25.5 29.7 -14.3 -16.1 27.8
Asia 1.3 9.5 -4.9 -4.6
Europe -1.8 -3.7 1.1 6.2
World 1.8 2.4 -7.8 5.5
Source: Based on World Resources Institute, UNEP and UNDP (1994), Table 17.1
In addition, intensification of cropping has increased in Asia with multiple cropping rising

14
substantially. Areas irrigated have expanded rapidly and so too has the use of artificial
fertilizers and pesticides. This intensification process has had adverse impacts on natural
environments.
Freshwater utilisation has risen with economic growth in Asia. It is estimated that in 1987
annual withdrawals of freshwater in Asia amounted to 15% of available resources, the same
percentage as for Europe (World Resources Institute et al., 1994, Table 2.1). However, the
percentage withdrawal differs considerably between countries. In the case of Pakistan it
exceeds 33%. Furthermore, these annual figures disguise the fact that in many Asian
countries freshwater is in especially short supply during the dry season. Most of Asia, in
contrast to Europe, is subject to monsoonal influences. The extension of green revolution
agricultural technologies (combined with population and income growth) have added
markedly to the demand for water throughout the dry season in Asia. In some cases, this
demand has been compounded by subsidisation of reticulated water supplies and open-access
to water supplies.
Furthermore, water bodies have had to carry increasing loads of wastes and emissions from
rising economic production and population growth. Consequently the quality of many water
bodies in Asia, especially in the dry season, is well below internationally accepted standards.
For example, their oxygen content is low and E. coli counts for example, are high.
Air quality has declined in many parts· of Asia and is well below world standards in several
major cities. This is mainly a consequence of increased use of fossil fuels for energy
production but petrochemical and industrial plants contribute as does the increasing use of
vehicles. Further economic growth combined with increased urbanisation can be expected to
compound these problems.
5. Urbanisation, Wastes and Environmental Problems
Urbanisation is proceeding at a rapid pace in Asia as can be seen from Table 5. Between 1965
and 1995 the average annual percentage increase in urban population in Asia was 3.5%. From
Table 5, it can be been that Bangladesh has experienced a particularly rapid rate of
urbanisation but most Asian countries have experienced high rates. This has created a need to
expand economic infrastructure greatly and has added to environmental problems.
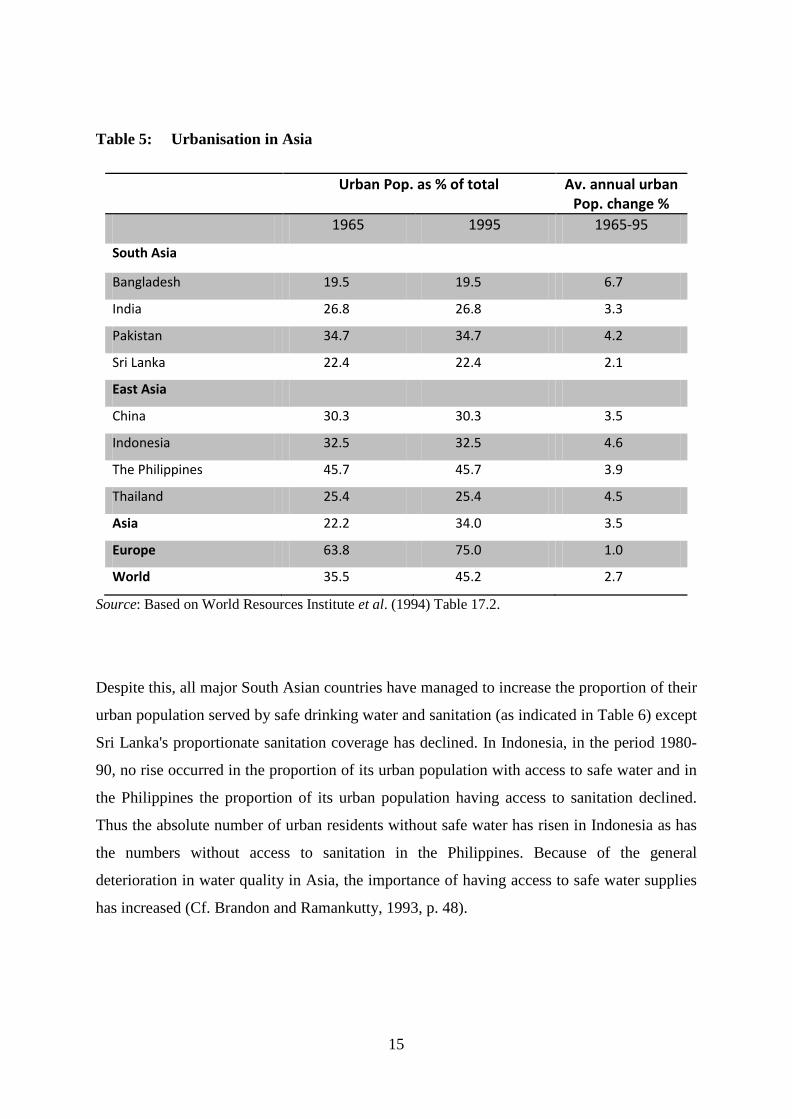
15
Table 5: Urbanisation in Asia
Urban Pop. as % of total Av. annual urban Pop. change %
1965 1995 1965-95
South Asia
Bangladesh 19.5 19.5 6.7
India 26.8 26.8 3.3
Pakistan 34.7 34.7 4.2
Sri Lanka 22.4 22.4 2.1
East Asia
China 30.3 30.3 3.5
Indonesia 32.5 32.5 4.6
The Philippines 45.7 45.7 3.9
Thailand 25.4 25.4 4.5
Asia 22.2 34.0 3.5
Europe 63.8 75.0 1.0
World 35.5 45.2 2.7
Source: Based on World Resources Institute et al. (1994) Table 17.2.
Despite this, all major South Asian countries have managed to increase the proportion of their
urban population served by safe drinking water and sanitation (as indicated in Table 6) except
Sri Lanka's proportionate sanitation coverage has declined. In Indonesia, in the period 1980-
90, no rise occurred in the proportion of its urban population with access to safe water and in
the Philippines the proportion of its urban population having access to sanitation declined.
Thus the absolute number of urban residents without safe water has risen in Indonesia as has
the numbers without access to sanitation in the Philippines. Because of the general
deterioration in water quality in Asia, the importance of having access to safe water supplies
has increased (Cf. Brandon and Ramankutty, 1993, p. 48).

16
Table 6: Access of urban population to safe drinking water and sanitation in Asia,
1980 and 1990. Percentage of urban population.
Safe drinking water Sanitation
1980 1990 1980 1990
South Asia
Bangladesh 26 39 21 40
India 73 77 27 44
Pakistan 72 82 42 53
Sri Lanka 65 80 80 68
East Asia
China 72 100
Indonesia 35 35 29 79
The Philippines 65 93 81 79
Source: Based on World Bank (1994) Table A.2.
In general, air quality has deteriorated to unacceptable levels in many Asian cities and
disposal of wastes has become a major problem (see for example Brandon and Ramankutty
1993, Ch. 3).
While urbanisation in Asia is growing rapidly and urban areas account for 34 per cent of
Asia's population, Asia still has a considerable way to go to reach Europe's 75 per cent
urbanisation figure. Further urbanisation can be expected in Asia as its economic growth
proceeds. Already Asia contains more than half of the world's 21 megacities.
6. Protection of Biodiversity
Biological diversity continues to decline throughout the world as economic growth occurs,
and this is apparent in Asia. In most of South Asia the percentage of land area in which nature
is protected is low compared to that in Europe and the USA (see Table 7). As can be seen
from Table 7, only a very small proportion of Bangladesh is protected and then only partially.
Most of the protected areas in India and Pakistan are only partially protected. The situation in

17
Sri Lanka, as far as the area afforded nature protection is concerned, is the most favourable
for all of the major South Asian economies.
In the case of China, a smaller proportion of its land area than in India is protected and nearly
all of its protected area is only partially protected. The situation in the Philippines while not
as unfavourable to nature conservation as in Bangladesh is nevertheless dismal. In relative
terms the position in Indonesia and Thailand is much better. Nevertheless, some caution is
needed in drawing conclusions from this data because the legal and de facto position as far as
nature protection is concerned can differ significantly between countries and these data are
based on official figures of the countries concerned.
Table 7: Protected areas as a percentage of total land area and a percentage of
protected area totally and partially protected, 1993, for selected Asian
countries.
All Protected Areas IUCN Categories
I-V
Totally Protected IUCN Categories I- III
Partially Protected IUCN Categories IV-V
South Asia
Bangladesh 0.7 0 100
India 4.0 28.3 71.7
Pakistan 4.6 24.1 75.9
Sri Lanka 11.9 62.8 37.2
East Asia
China 3.2 0.3 99.7
Indonesia 10.2 71.9 28-.1
The Philippines 1.9 39.4 60.6
Thailand 12.6 52.9 47.1
Asia 4.4 29.1 70.1
Europe 9.3 18.8 81.2
USA 10.5 39.3 60.7
Source: Based on World Resources Institute et al. (1994) Table 20.1.

18
Many mammals, birds and higher plants are threatened with extinction in Asian countries.
The numbers threatened in selected Asian countries are shown in Table 8. The number of
plants threatened is very large. Indonesia has the greatest number of threatened species in all
categories but the numbers are substantial in all countries being high for China, Thailand,
India and the Philippines. In relation to its land use, however, the nature conservation
situation for Bangladesh is particularly adverse. It will be a major challenge to save Asia's
threatened species in the face of economic growth in Asia.
Note that the number of species threatened by extinction in Asia is large compared to the
number in developed countries. However, comparison of absolute numbers may overstate the
comparative position for Asia, particularly for Asian countries located in areas. This is
because tropical countries usually have a greater number of species per unit area than
temperate countries, and most high-income countries are located in temperate areas.
Table 8: Number of species of threatened mammals, birds and higher plants in the
1990s in selected Asian countries.
Mammals Birds Plants
South Asia
Bangladesh 15 27 2,074
India 39 72 2,363
Pakistan 15 25 1,168
Sri Lanka 7 8 1,781
East Asia
China 40 83 3,340
Indonesia 49 135 4,311
The Philippines 12 39 2,907
Thailand 26 34 3,442
Source: Based on World Resources Institute et al. (1994), Table 20.4.
19
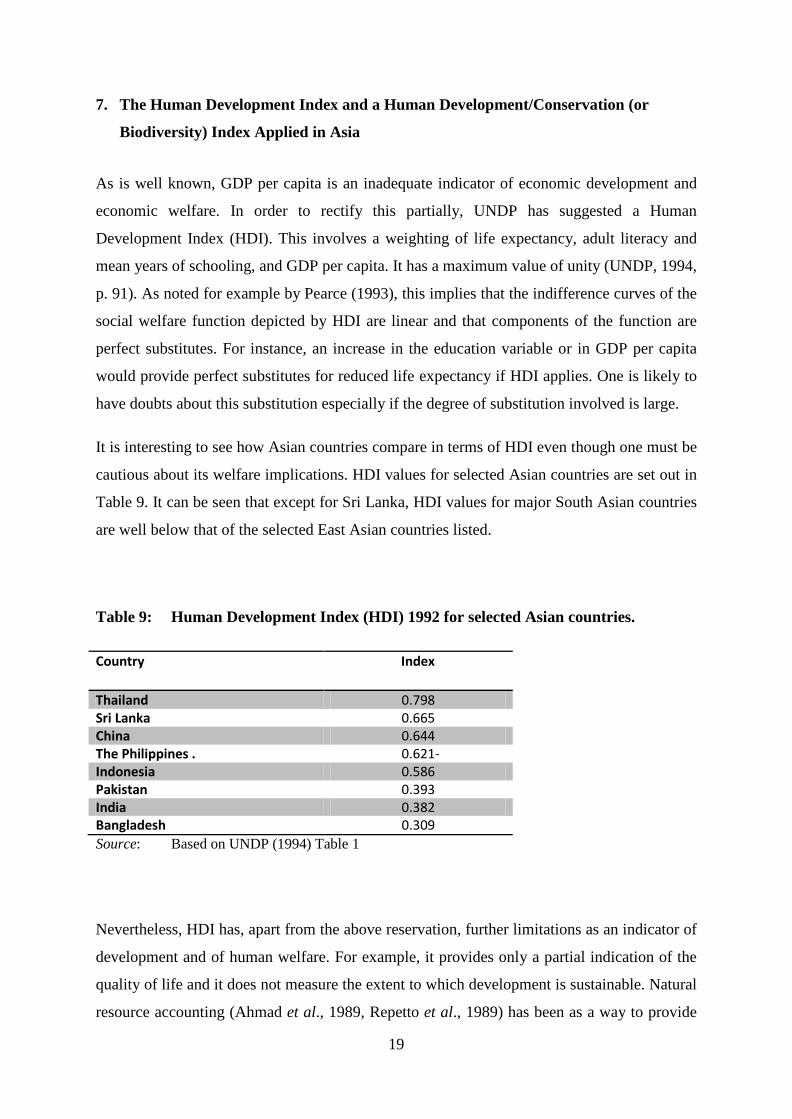
7. The Human Development Index and a Human Development/Conservation (or
Biodiversity) Index Applied in Asia
As is well known, GDP per capita is an inadequate indicator of economic development and
economic welfare. In order to rectify this partially, UNDP has suggested a Human
Development Index (HDI). This involves a weighting of life expectancy, adult literacy and
mean years of schooling, and GDP per capita. It has a maximum value of unity (UNDP, 1994,
p. 91). As noted for example by Pearce (1993), this implies that the indifference curves of the
social welfare function depicted by HDI are linear and that components of the function are
perfect substitutes. For instance, an increase in the education variable or in GDP per capita
would provide perfect substitutes for reduced life expectancy if HDI applies. One is likely to
have doubts about this substitution especially if the degree of substitution involved is large.
It is interesting to see how Asian countries compare in terms of HDI even though one must be
cautious about its welfare implications. HDI values for selected Asian countries are set out in
Table 9. It can be seen that except for Sri Lanka, HDI values for major South Asian countries
are well below that of the selected East Asian countries listed.
Table 9: Human Development Index (HDI) 1992 for selected Asian countries.
Country Index
Thailand 0.798 Sri Lanka 0.665 China 0.644 The Philippines . 0.621- Indonesia 0.586 Pakistan 0.393 India 0.382 Bangladesh 0.309 Source: Based on UNDP (1994) Table 1
Nevertheless, HDI has, apart from the above reservation, further limitations as an indicator of
development and of human welfare. For example, it provides only a partial indication of the
quality of life and it does not measure the extent to which development is sustainable. Natural
resource accounting (Ahmad et al., 1989, Repetto et al., 1989) has been as a way to provide

20
more information about the sustainability of development. While this, it still has a number of
limitations.
Natural resource accounting provides an anthropocentric assessment of sustainability but is ill
equipped to take account of the value of preserving biodiversity even from a man-centred
viewpoint because its valuations are based on relatively simple natural resource asset models
covering such resource categories as forests, fisheries and minerals. No allowance as such is
made for valuing biodiversity as an asset in itself or for the preservation of biodiversity as an
ethically desirable goal in itself. The latter goal reflects the growing belief that social value
orderings should not be solely dependent on the utilities of individual human beings, but
should be based on wider ethical perspectives. Examples of such an approach include
Blackorby and Donaldson (1992) and Ng (1986) who take into account animal welfare by
means of extended utility approaches. The desirability of preserving biodiversity is, however,
not necessarily based on the principle of extended utility maximisation, although
'justifications' are possible on this basis. For many, it is based upon mankind's stewardship or
moral responsibility role for the preservation of nature (Leopold, 1966; Passmore, 1974;
Tisdell, 1991, Ch. 1). If this point of view is accepted, it is unsatisfactory to have a valuation
index for development, such as HDI, which is solely man-centred and ignores the biodiversity
element.
One way to allow for this shortcoming is to construct a value of development index which
combines anthropocentric and non-anthropocentric elements, for example, one that combines
HDI and a conservation of nature index (CI) or a biodiversity index (BI). This development
valuation function, V, might be similar in nature to the Bergson (1938) social welfare
function.
There are basically two problems to be solved: (1) how to estimate CI or BI and (2) how to
combine this index with HDI. Available information limits approaches to estimating CI.
A simple way to estimate CI is to take a similar approach to that for estimating HDI. For most
countries, data is available on the percentage of their land area afforded nature protection.
Few countries have more than 20 per cent of their land area protected in this way so this may
be used to provide the upper value of CI and is set equal to unity for scaling purposes. Any
country with 20 per cent or more of its area protected would have a CI of unity and any
country with no protected area a CI of zero, with those in-between having a CI in proportion
21
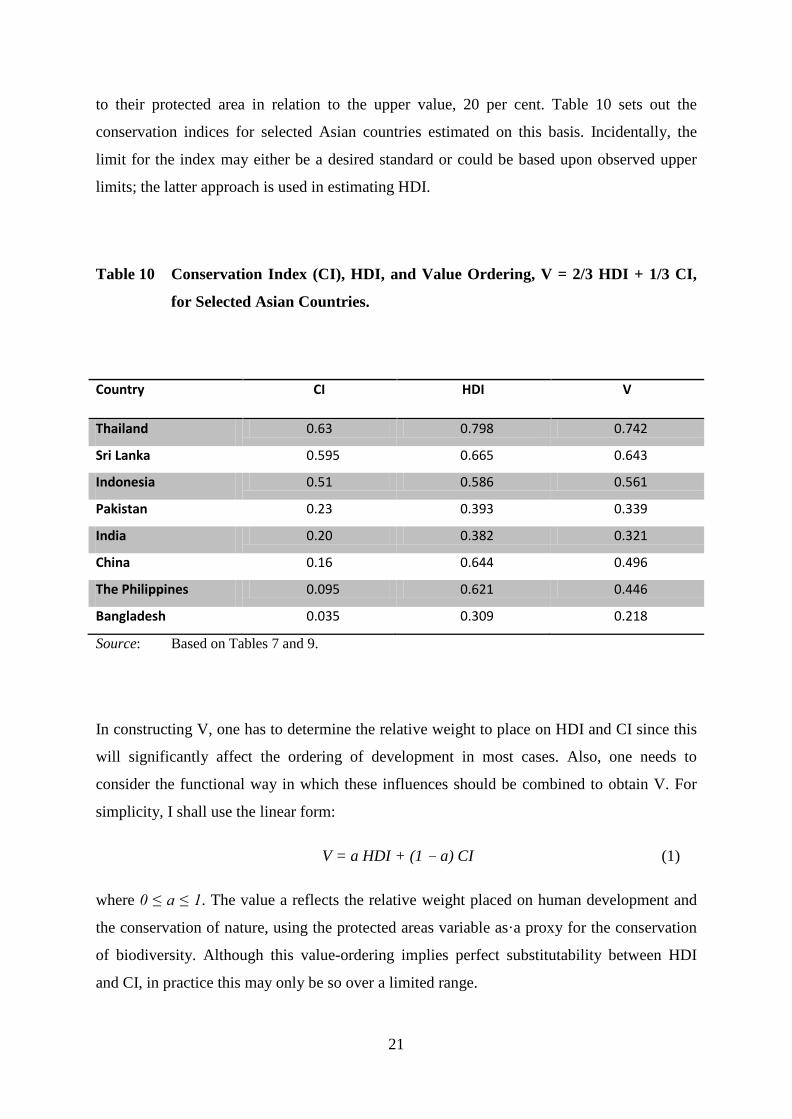
to their protected area in relation to the upper value, 20 per cent. Table 10 sets out the
conservation indices for selected Asian countries estimated on this basis. Incidentally, the
limit for the index may either be a desired standard or could be based upon observed upper
limits; the latter approach is used in estimating HDI.
Table 10 Conservation Index (CI), HDI, and Value Ordering, V = 2/3 HDI + 1/3 CI,
for Selected Asian Countries.
Country CI HDI V
Thailand 0.63 0.798 0.742
Sri Lanka 0.595 0.665 0.643
Indonesia 0.51 0.586 0.561
Pakistan 0.23 0.393 0.339
India 0.20 0.382 0.321
China 0.16 0.644 0.496
The Philippines 0.095 0.621 0.446
Bangladesh 0.035 0.309 0.218
Source: Based on Tables 7 and 9.
In constructing V, one has to determine the relative weight to place on HDI and CI since this
will significantly affect the ordering of development in most cases. Also, one needs to
consider the functional way in which these influences should be combined to obtain V. For
simplicity, I shall use the linear form:
V = a HDI + (1 - a) CI (1)
where 0 ≤ a ≤ 1. The value a reflects the relative weight placed on human development and
the conservation of nature, using the protected areas variable as·a proxy for the conservation
of biodiversity. Although this value-ordering implies perfect substitutability between HDI
and CI, in practice this may only be so over a limited range.

22
The 'social' preference or valuation function V can be represented by a series of parallel
straight-line indifference curves (iso-value lines) like those shown in Figure 4. Rearranging
equation (1), it can be seen that these lines canoe specified using the relationship·.
𝐻𝐷𝐼 = 1𝑎
𝑉 − �1−𝑎𝑎� 𝐶𝐼 (2)
If for example, a = ⅓,
HDI = 1.5V - 0.5CI (3)
Figure 4: Representation of valuation frontier incorporating human welfare and
biodiversity conservation as considerations, trade-off possibilities and
optimisation.
Iso-value line
O
Trade-off possibility frontier
HDI
Index of human welfare
Index of biological conservation CI

23
Suppose that there happens to be a trade-off possibility frontier between the human welfare
element of development as measured by HDI and biodiversity conservation as indicated by
the conservation index, CI. Then given the relevant value ordering function based on (1), an
optimal combination could be determined in principle. For example, if the trade-off
possibility frontier happened to be as indicated by curve ABCD in Figure 4, the optimal
combination would correspond to point C.
Note that if only human welfare were to count, the optimal combination would correspond to
point B. In this case, the valuation indifference curves are horizontal straight-lines. In the
illustration (Figure 4) observe that some nature conservation is necessary to maximise HID.
On the other hand, extreme ecocentrism would result in combination D as optimal because
the valuation indifference curves would be vertical lines. Other forms of the trade-off frontier
can also be considered.
For the purpose of this exercise, suppose that a = ⅔. This means that more weight given to
human welfare than to species conservation using this crude approach, but that the
preservation of biodiversity·is also ethically important. The values of V for selected Asian
countries using this weighting are shown in the last column of Table 10. Different weightings
on HDI and CI will of ·course give different results.
It can be seen from Table 10 that the conservation indices for these countries are substantially
below unity. A very unsatisfactory situation from this perspective exists in Bangladesh, The
Philippines, China, India and Pakistan with a much better situation prevailing in Indonesia,
Sri Lanka and the Philippines. Nevertheless, all countries fall considerably below per cent
protected area standard.
The main consequence of taking into account CI is that Indonesia rises in the valuation rank
order of Asian countries considered and China and the Philippines slide down the scale.
Furthermore, the degree of disparity between CI and the estimated V-values is considerably
higher than for the disparity in HDI-values. A positive association or correlation between
HDI and CI values can also be observed. This might suggest a positive causal relationship
between HDI and CI and appears to give credence to the Brundtland Committee's view
(WCED, 1987) that human poverty is the main source of environmental degradation.
However, it would be unwise to draw this conclusion. The situation is much more
complicated (Tisdell, 1992) and evidence insufficient to reject neo-Malthusian concerns and
24
the worries of some conservationists about the likely threat to biodiversity (Wilson, 1992) of
rising human populations and of substantial economic growth.
Note that the method used above to estimate the nature conservation index CI is subject to
limitations. It takes no account of whether the natural areas involved are totally or partially
protected. In principle, account could be taken of such variations in the degree of protection
by using information of the type given in Table 7 even though the appropriate relative weight
to place on the different categories of protection would remain contentious. In addition, these
categories are based upon the legal rather than the actual situation. It is well known that in
some less developed countries areas that are legally totally protected are not so in practice
e.g. illegal human settlement ad improper use of protected areas occurs. A further problem in
that no account is taken of the quality or productivity of the protected areas in relation to
conservation of biodiversity. While these are serious limitations, they are less serious than
failing to take any account of nature conservation in the evaluation of alternative states of the
world.
One might imagine that indicators of the number of species saved from extinction by
protective measures might provide an improved measure of biodiversity conservation. The
other side of the coin here is the number of species lost as a result of not taking 'adequate'
defensive action to save them. A problem, however, of concentrating on the latter is that most
developing countries will appear to be 'especially bad' when it comes to nature conservation.
This is because most developing countries are located in the tropics or the sub-tropics where
biodiversity in relation to land area tends to be much higher than elsewhere on the globe
(Wilson, 1992). The same absolute loss of protected land area in these less developed
countries can be expected to lead to loss of more numerous species than in countries located
in temperate zones, mostly the more developed countries. Given that humankind's
stewardship of nature is a global responsibility, this is one reason why protection of
biodiversity in less developed countries requires aid from more developed countries, namely
more species tend naturally to occur in developing countries.

25
8. Concluding Comments
Economic development appears to have been mostly defined in relation to man-centred
attributes as is for example apparent from the components of HDI. Conservation of natural
environments and of biological diversity have no weight per se in most indicators of
economic development. In practice, measures of the sustainability of economic development
are not widely used.
Considerable economic growth has occurred in Asia, both in South Asia and East Asia with
substantial loss of natural environments. Given strong aspirations for higher incomes in and
unavoidable further rises in Asia's population, further loss and damage of natural is
inevitable. Therefore, there is a need for realistic well thought out environmental policies
throughout Asia. This is particularly so in the Indian subcontinent still continues to
experience a high rate of population growth. A danger exists in some less developed Asian
countries, e.g. Bangladesh, of unsustainable development (Cf. Barbier and Markandya, 1993;
Tisdell, 1994b) due to the gradual depletion of their natural resource-base and a reduction in
the quality of their natural resource-stock. This process may also exact a considerable toll in
terms of further losses of biological diversity.
9. References
Ahmad, Y.J., El Serafy, S. and Lutz, E. (eds) (1989) Environmental Accounting for
Sustainable Development, A UNEP-World Bank Symposium, The World Bank,
Washington, D.C.
Alauddin, M. and Tisdell, C. (1991) The 'Green' Revolution and Economic Development,
Macmillan, London.
Barbier E.B. and Markandya, A. (1993) Environmentally sustainable development: optimal
economic conditions. Pp. 11-28, in E.B. Barbier (ed) Economics and Ecology,
Chapman and Hall, London. ·
Bergson, A. (1938) A reformulation of certain aspects of welfare economics, Quarterly
Journal of Economics, Vol 52, pp. 310-314.
26
Blackorby, C. and Donaldson, D. (1992) Pigs and guinea pigs: a note on the ethics of animal
exploitation. The Economic Journal, Vol. 102, pp. 1345-1369.
Brandon , C. and Ramankutty, R. (1993) Toward an Environmental Strategy for Asia, World .
Bank Discussion Paper No. 224, World Bank, Washington.
Chakravaty, S. (1990) Development·strategies for growth with equity: the South Asian
experience. Asian Development Review, Vol. 8, No.1, pp. 133-159.
Daly. H. (1980) Economics, Ecology and Ethics: Essays towards a Steady-state Economy,
Freeman, San Francisco.
Denison, E.F. (1962) Sources of Economic Growth and the Alternatives Before Us,
Committee for Economic Development, New York.
Ehrlich. P.R. (1970) The Population Bomb. Ballantine Books, New York.
Engels, F. (1959) Outlines of a critique of political economy. K. Marx, Economic and
Philosophic Manuscripts of 1844, Foreign Languages Publishing House, Moscow.
Georgescu-Roegen, N. (1971) The Entropy Law and the Economic Process, Harvard
University Press, Cambridge, Mass.
Georgescu-Roegen, N. (1976) Energy and Economic Myths: Institutional and Analytical
Economic Essays, Pergamon Press, New York.
Leopold, A. (1966) A Land Country Almanac: with Other Essays on Conservation from
Round River, Oxford University Press; New York
Mäler, K.G. (1974) Environmental Economics: A Theoretical Inquiry, Johns Hopkins
University Press, Baltimore.
Marx, K. (1956) Capital. Progress Publishers, Moscow.
Meadows, D.L. Randers, J. and Beherens, W. (1972) The Limits of Growth: A Report of the
Club of Rome's Projection on the Predicament of Mankind, Universe Books, New
York.
Meadows, D.H., Meadows, D.L. and Randers, J. (1992) Beyond the Limits: Global Collapse

27
or a Sustainable Future, Earthscan, London.
Meir, G.M. (1976) Leading Issues in Economic Development, 3rd Edition, Oxford University
Press, New York.
Ng, Y.K. (1986) Social criteria for evaluating population change: an alternative to the
Blackorby-Donaldson criteria. Journal of Public Economics, Vol. 29, pp.375-381.
Ogawa, N. and Tsuya, N.O. (1993) Demographic change and human resource development in
the Asia-Pacific region: trends of the 1960s to 1980s and future prospects. Pp. 21-65 in
N. Ogawa, G.W. Jones and J.G. Williamson, Human Resources in Development Along
the Asia-Pacific Rim, Oxford University Press, Singapore.
Passmore, J.A. (1974) Man's Responsibility for Nature: Ecological Problems and Western
Traditions, Duckworth, London.
Pearce, D. (1993) Blueprint 3: Measuring Sustainable Development. Earthscan Publications,
London.
Pearce, D., Barbier, E. and Markandya, A. (199) Sustainable Development: Economics and
Environment in the Third World, Earthscan Publications, London.
Perrings, A.C. (1987) Economy and Environment: A Theoretical Essay on the
Interdependence of Economic and Environmental Systems, Cambridge University
Press, New York.
Repetto, R., Magrath, W., Wells, M., Beer, C. and Rossini, F.(1989) Wasting Assets: National
Resources in the National Income Accounts, World Resources Institute, Washington,
D.C.
Romer, P.M.. (1986) Increasing returns and long-run growth. Journal of Political Economy,
Vol. 94, No. 5, pp. 1002-1,037.
Romer, P.M. (1994) The origins of endogenous growth. Journal of Economic Perspectives,
Vol. 8, No. 1, pp. 3-24.
Roy, K;C., Tisdell, C.A. and Sen, R.I. (1992) Economic Development and Environment: A
Case Study of India, Oxford University Press, Calcutta.
28
Solow, R.M. (1956) A contribution to the theory of economic growth. Quarterly Journal of
Economics, Vol. 70, pp. 65-94.
Solow, R.M. (1957) Traditional change and the aggregate production function. Review of
Economics and Statistics, Vol. 39, pp. 312-3.20.
Solow, R.M. (1974) Intergenerational equity and exhaustible resources. Review of Economic
Studies, pp. 29-46.
Solow, R.M. (19.86) On the intertemporal allocation of natural resources. Scandinavian
Journal of Economics, Vol. 88, No. 1, pp. 141-149.
Swan, T. (1956) Economic growth and capital accumulation. The Economic Record, Vol. 32,
pp.334-361.
Tisdell, C.A. (1991) Economics of Environmental Conservation, Elsevier, Amsterdam.
Tisdell, C.A. (1994a) Conservation, protected areas and the global economic system: how
debt, trade, exchange rates, inflation and macroeconomic policy affect biological
diversity. Biodiversity and Conservation, Vol. 3, pp. 419-436.
Tisdell, C.A. (1994b) Population, economics, development and environmental security. Pp.
63-84 in N. Polunin and M. Nazim, Population and Global Security, The Foundation
for Environmental Conservation, Geneva.
Tisdell, C.A. (1995) Asian development and environmental dilemmas. Contemporary
Economic Policy, Vol.13, No. 1, pp.38-49.
Turner, R.K. Pearce, D. And Bateman, I. (1993) Environmental Economics, Johns Hopkins
University Press, Baltimore. ·
UNDP (1994) Human Development Report 1994, Oxford University Press, New York.
Wilson, E.O. (1992) The Diversity of Life, Harvard University Press, Cambridge, Mass.
World Bank (1994) World Development Report 1994, Oxford University Press, New York.
WCED (World Commission on the Environment and Development) (1987) Our Common
Future, Oxford University Press, New York.

29
World Resources Institute, United Nations Environment Programme and United Nations
Environment Programme and United Nations Development Programme (1994) World
Resources 1994-95, Oxford University Press, New York.

30
BIODIVERSITY CONSERVATION
WORKING PAPERS IN THIS SERIES
1. Biodiversity Conservation: Economics, Gains and Costs in China Illustrated by Xishuangbanna Nature Reserve, Yunnan by Clem Tisdell and Xiang Zhu, February 1994.
2. Does the Economic Use of Wildlife Favour Conservation and Sustainability by Clem Tisdell, March 1994.
3. The Environment and Asian-Pacific, Particularly East Asian, Economic Development by Clem Tisdell, March 1994.
4. Presenting Requests for Financial Support for Protected Areas: The Role for Environmental Economics and Commonsense by Clem Tisdell, March 1994.
5. Ranking Inter-Country and Inter-Regional Requests for Financial Support for Protected Areas: Environmental Economic Guidelines by Clem Tisdell, March 1994.
6. Conservation, Protected Areas and the Global Economic System: How Debt, Trade, Exchange Rates, Inflation and Macroeconomic Policy Affect Biological Diversity by Clem Tisdell, March 1994.
7. Environmental and Resource Economics: Its Role in Planning Sustainable Development by Clem Tisdell, April 1994.
8. Conservation of Biodiversity is the Most Important Aspect of Ecologically Sustainable Development: An Economic Perspective by Clem Tisdell, April 1994.
9. Ecotourism, Economics and the Environment by Clem Tisdell, October 1994. 10. Socio-Economic Issues and Strategies for Biodiversity Conservation in China with
Observation from Xishuangbanna by Clem Tisdell, November 1994. 11. Ecotourism – Its Boundaries and its Economics with Examples from China by Jie Wen and
Clem Tisdell, February 1995. 12. Reconciling Economic Development, Nature Conservation and Local Communities: Strategies
for Biodiversity Conservation in Xishuangbanna, China by Clem Tisdell and Xiang Zhu, February 1995.
13. Tourism Development in India and Bangladesh: General Issues and Ecotourism in the Sunderbans by Clem Tisdell, March 1995.
14. Trends in Tourism Development in China: Issues and Opportunities by Clem Tisdell, March 1995.
15. Tourism Development and Conservation of Nature and Cultures in Xishuangbanna, Yunnan by Clem Tisdell and Xiang Zhu, May 1995.
16. Protected Areas, Agricultural Pests and Economic Damage: A Study of Elephants and other pests from Xishuangbanna State Nature Reserve by Clem Tisdell and Xiang Zhu, May 1995.
17. Financing Nature Reserves in China – The Case of the State Nature Reserve of Xishuangbanna, Yunnan: Financial Issues, Political Economy and Conservation by Clem Tisdell and Xiang Zhu, August 1995.
18. Investment in Ecotourism: Assessing its Economics by Clem Tisdell, May 1995. 19. Rapid Rural Appraisal (RRA), Participatory Rural Appraisal (PRA) and their Application in the
Global Environmental Facility (GEF-B) Programme in China by Xiang Zhu, August 1995. 20. The Environment, Biodiversity and Asian Development by Clem Tisdell, September 1995. 21. Biodiversity, Conservation and Sustainable Development: Challenges for North-East India in
Context by Clem Tisdell, September 1995. 22. Economic and Environmental Perspectives on Sustainable Agricultural Developments by
Clem Tisdell, September 1995.
31
23. India’s Economic Development and Its Environment: General Patterns, Issues and Implications by Kartik Roy and Clem Tisdell, September 1995.
24. Sustainability of Land-Use in North-East India: Issues Involving Economics, the Environment and Biodiversity by Clem Tisdell and Kartik Roy, December 1995
25. Criteria for Sustainable Tourism: Why a Cautious Attitude is Needed by Clem Tisdell, January 1996.
26. Protected Areas, Agricultural Pests and Economic Damage: Conflicts with Elephants and Pests in Yunnan by Clem Tisdell and Xiang Zhu, January 1996.
27. Alternative Economic Instruments for Regulating Environmental Spillovers from Aquaculture: An Assessment by Clem Tisdell, January 1996.
28. Economics as a Basis for Conserving Nature by Clem Tisdell, February 1996. 29. Final Report on ACIAR Small Project: Economic Impact and Rural Adjustment to Nature
Conservation (Biodiversity) Programmes: A Case Study of Xishuangbanna Dai Autonomous Prefecture, Yunnan, China by Clem Tisdell, March 1996.
30. Tourism in Yunnan Province and the Xishuangbanna Prefecture of China: Achievements and Prospects by Jie Wen, March 1996.
31. Developing Community-Based Forestry in the Uplands of Yunnan: Dictates of the Environment and Socio-Economics by Zhuge Ren and Clem Tisdell, April 1996.
32. China’s Environmental Problems: Selected Issued and Solution in Context by Clem Tisdell, May 1996.
33. Agricultural Sustainability and Conservation of Biodiversity: Competing Policies and Paradigms by Clem Tisdell, May 1996.
Copyright © 2022 FDOKUMEN