Forest biodiversity assessment for reporting conservation performance
49
Forest biodiversity assessment for reporting conservation performance SCIENCE FOR CONSERVATION 216 Robert B. Allen, Peter J. Bellingham and Susan K. Wiser Published by Department of Conservation P.O. Box 10-420 Wellington, New Zealand
-
Upload
independent -
Category
Documents
-
view
0 -
download
0
Transcript of Forest biodiversity assessment for reporting conservation performance
Forest biodiversity assessmentfor reporting conservationperformance
SCIENCE FOR CONSERVATION 216
Robert B. Allen, Peter J. Bellingham and Susan K. Wiser
Published by
Department of Conservation
P.O. Box 10-420
Wellington, New Zealand
Science for Conservation is a scientific monograph series presenting research funded by New Zealand
Department of Conservation (DOC). Manuscripts are internally and externally peer-reviewed; resulting
publications are considered part of the formal international scientific literature.
Titles are listed in the DOC Science Publishing catalogue on the departmental website http://
www.doc.govt.nz and printed copies can be purchased from [email protected]
© Copyright February 2003, New Zealand Department of Conservation
ISSN 1173�2946
ISBN 0�478�22363�3
In the interest of forest conservation, DOC Science Publishing supports paperless electronic
publishing. When printing, recycled paper is used wherever possible.
This report was prepared for publication by DOC Science Publishing, Science & Research Unit; editing
and layout by Lynette Clelland. Publication was approved by the Manager, Science & Research Unit,
Science Technology and Information Services, Department of Conservation, Wellington.

CONTENTS
Abstract 5
1. Introduction 6
2. Background and objectives 7
3. Lessons from past experience 8
3.1 What does experience tell us about selecting methods and
indicators? 8
3.1.1 Build on the past while accommodating new
developments 8
3.1.2 Sampling design 9
3.1.3 Selected indicator must achieve goals 12
3.1.4 What is a suitable indicator? 13
3.1.5 What does change in an indicator mean? 14
3.1.6 What is the resilience of forest ecosystems? 15
3.2 What types of indicators are being used in other countries? 18
4. Proposed methods and indicators 19
4.1 Forest area 20
4.2 Tree mortality and recruitment 22
4.3 Community composition 25
4.4 Exotic weeds 26
4.5 Impacts of introduced animals 28
4.6 Quantity of dead wood 29
4.7 Potential indicators 30
4.7.1 Phylogenetic diversity measures of biodiversity 30
4.7.2 Litter quality 31
4.7.3 Forest vigour 32
4.7.4 Phenological events 33
4.8 Indicators and conservation performance 33
5. Links with other initiatives 34
5.1 Nationally 34
5.1.1 Environmental Performance Indicators 34
5.1.2 Conservation Achievement 34
5.1.3 Carbon Monitoring System 34
5.1.4 Biodiversity Strategy 36
5.2 Internationally 36
5.2.1 Convention on Biological Diversity (CBD)�indicators
of forest biodiversity 37
5.2.2 Forest Resource Assessment 2000 (FRA 2000) 37
5.2.3 Montreal Process 37
5.2.4 Land use and forest changes under the
Intergovernmental Panel on Climate Change (IPCC) 38
5.2.5 Summary 38

4 Allen et al.�Forest biodiversity assessment
6. Conclusion 38
7. Acknowledgements 39
8. References 40
Appendix 1
Convention on Biological Diversity (CBD)�indicators of forest
biodiversity 45
Appendix 2
Forest Resource Assessment 2000 (FRA 2000) 46
Appendix 3
Montreal Process 47
Appendix 4
Land use and forest changes under the Intergovernmental Panel on
Climate Change (IPCC) 49

5Science for Conservation 216
© February 2003, Department of Conservation. This paper may be cited as:
Allen, R.B.; Bellingham, P.J.; Wiser, S.K. 2003: Forest biodiversity assessment for reporting
conservation performance. Science for Conservation 216. 49 p.
Forest biodiversity assessmentfor reporting conservationperformance
Robert B. Allen, Peter J. Bellingham and Susan K. Wiser
Landcare Research, PO Box 69, Lincoln 8152, New Zealand
A B S T R A C T
There is a need to upgrade the quality of information about the status of
indigenous biodiversity so that agencies (e.g. Department of Conservation) can
make appropriate conservation management decisions. Methods and indicators
for determining changes in indigenous forest biodiversity are developed.
Because indicators, and the way they are derived, will change over time, it is
most essential that any biodiversity assessment system is based on an enduring
set of compositional, structural and functional characteristics. Experience in
indigenous forests suggests the following are required for monitoring systems:
build on past information while accommodating new developments; pay more
attention to sampling design; select indicators that achieve goals; do not focus
too much attention on today�s specific views and concerns; allow for
interpretation of indicators in monitoring designs; and, do not expect an
indicator will necessarily return to some pre-disturbance value or trajectory. Six
indicators are proposed: forest area and fragmentation as a habitat indicator;
tree mortality and recruitment rates for maintenance of structural dominants;
community composition as an indicator of species assemblages; exotic weeds as
a measure of intactness; indices for introduced animal impact; and, quantity and
characteristics of dead wood as a habitat diversity indicator. Many of these
indicators are currently best assessed through a network of permanent plots.
There is also considerable merit in having indicators which can be used in
predictive models to develop time-frames for management intervention. These
indicators are assessed in relation to other national and international initiatives,
including the Biodiversity Strategy. Although this report was specifically
commissioned for forests, such a system should eventually be established to
cover the full range of ecosystems.
Keywords: Forest, biodiversity monitoring, conservation performance,
achievement reporting, forest health, indicators.

6 Allen et al.�Forest biodiversity assessment
1. Introduction
There is widespread concern that New Zealand�s indigenous biodiversity
continues to deteriorate because of anthropogenic influences such as the
introduction of weeds and pests. The need to protect and report on the status of
indigenous biodiversity, both nationally and internationally, is encompassed in
legislation (Conservation Act 1986) and international obligations (e.g.
Convention on Biological Diversity). Landcare Research, Lincoln, investigated
methods and indicators of indigenous forest biodiversity for the Department of
Conservation (DOC).
It was agreed that the investigation would result in a discussion paper (this
report) on methods and indicators for assessing the need for conservation
management intervention in indigenous forests at national and regional scales.
(Indicators are parameters based on changes in the composition, structure and
functioning of natural systems). These methods and indicators should take
account of other research funded by DOC, other national initiatives such as the
Ministry for the Environment green package carbon project, and international
reporting requirements (see Bellingham et al. 2000). The paper will
recommend to DOC a system or systems it may establish to address its needs for
planning, decision making, and reporting on the status of indigenous forests,
and contribute to quality conservation management. The approach will
optimally integrate existing information to provide maximum continuity of
biodiversity information. The result will be a clearer understanding of the status
of indigenous forests for assessing the national priority conservation outcomes
(Department of Conservation 2002) such as:
� No avoidable human-induced extinctions; indigenous populations have long-
term security within their natural range.
� Appropriate monitoring systems are designed and implemented.
� A comprehensive and representative range of natural habitats and ecosystems
important for indigenous biodiversity is protected.
� Unwanted organisms which pose significant risks to indigenous biodiversity
that are newly established or not yet widespread, are eradicated or contained.
These are rather challenging outcomes for DOC. A comprehensive method of
assessing biodiversity changes, with a wider focus than simply gains from
targeted expenditure, is the only way of truly judging whether such outcomes
are achieved. Although this report specifically addresses forests, the monitoring
principles discussed can be applied to a wide range of ecosystems.

7Science for Conservation 216
2. Background and objectives
The Department of Conservation recognises the need to upgrade the quality of
its information about biodiversity for appropriate conservation management
(Department of Conservation 2002). This need is also recognised in New
Zealand�s recently published biodiversity strategy (The New Zealand
Biodiversity Strategy, Department of Conservation & Ministry for the
Environment 2000) which calls for consistent monitoring methods to provide
information on key changes in extent and condition of biodiversity. This need is
also expressed in paragraphs (a) and (b) of Article 7 of the Convention on
Biological Diversity (CBD), which calls for identification and monitoring of
biodiversity important to conservation and sustainable use.
Reasons why DOC must collect information about indigenous forests include:
� To evaluate the effectiveness of management. The need to manage forests
for the protection of biodiversity is enshrined in legislation (e.g. Forests Act
1949, Conservation Act 1987, Resource Management Act 191). Public and
private forest managers require information to evaluate the effectiveness of
management decisions and expenditure intended to protect or enhance
indigenous biodiversity.
� To report on biodiversity. International, national, and regional reporting
requirements broaden the scope of information required by DOC and other
agencies (e.g. Bellingham et al. 2000). New Zealand is a signatory to several
international agreements with specific reporting commitments for forests
(e.g. Forest Resource Assessment 2000).
� To increase the knowledge base. Changes occur in the composition,
structure, and functioning of forest ecosystems at a range of time scales.
Quantifying and understanding changes driven by human-related impacts,
within a context of natural processes, requires improved data on patterns and
rates of change. Increased knowledge is also an important by-product of
information-gathering for other purposes, such as those just described above.
This report discusses how past monitoring activities provide principles for
designing new monitoring systems, as well as describing methods and
indicators that would satisfy a range of needs into the future. The challenge is to
design, where possible, a system flexible enough to satisfy multiple needs from
monitoring, at a range of spatial and temporal scales. An earlier draft of this
report was presented to, and received comments from, a number of DOC staff
members (e.g. Frimmel & Turner 1999).
Methods and indicators are proposed that should be useful, from DOC�s
perspective, for assessing changes in the composition, structure, and
functioning of indigenous forest biodiversity at regional and national scales.

8 Allen et al.�Forest biodiversity assessment
3. Lessons from past experience
There has been a long history of methods and systems being developed for
measuring biodiversity in New Zealand�s indigenous forests (e.g. McKelvey et
al. 1958; Wardle et al. 1971; Stewart et al. 1989; Meurk & Buxton 1991; Hall et
al. 1991; Wiser et al. 2001). The following examples indicate some of the
diversity in approaches that have been taken. Specific manipulations of
introduced animal populations, and related vegetation assessment, have often
been used to assess the benefits from conservation expenditure at a local scale
(e.g. Stewart Island coastal forests, Stewart & Burrows 1989). The status of
indigenous biodiversity has been assessed in various ways at local and regional
scales, e.g. aerial imagery and permanent plots to assess the extent of forest
dieback, and its relationship to possum impacts (Pekelharing & Reynolds 1983;
Rose et al. 1992; Rogers & Leathwick 1997; Bellingham et al. 1999a). Forest
plots have been used at a national scale to report on tree species composition
and structure of forests (Nichols 1976; McKelvey 1984), as well as biomass
carbon storage (Hall et al. 2001). It can be seen from these examples that
methods and systems useful at a range of scales has been a requirement from
conservation managers for a long time.
3 . 1 W H A T D O E S E X P E R I E N C E T E L L U S A B O U TS E L E C T I N G M E T H O D S A N D I N D I C A T O R S ?
3.1.1 Build on the past while accommodating newdevelopments
The recording, measurement, and interpretation of human-related changes in
New Zealand�s indigenous forests has been characterised by a plethora of
techniques. The merits and limitations of each are, to some degree, based on
the individual preferences of different researchers, what spatial and temporal
scales are relevant, and what interpretations are possible. In some extreme
cases, persuasive individuals have caused resources (including large
investments of money) to be focussed on specific techniques, which may or
may not have been effective. Often such techniques were attractive because of
their claims of efficiency and simplicity. Use of a number of these techniques
stopped when the individual (or group) ceased to be directly involved with
forest monitoring or lost their former influence. What can seem, at times, as
�apparent anarchy� in techniques does not help the long-term need for
understanding the changes in our indigenous forests. This is particularly so
when the debate about techniques becomes a distraction from achieving a
broad consensus on the type of characteristics to measure in forests.
Any change from one technique to another is likely to limit the usefulness of
data because of the long time frames associated with data collection for
monitoring (see comments in Hutcheson et al. 1999). Our aim must be to assure
comparability of data over decades, perhaps centuries: this provides a challenge
in many respects. One overriding principle to achieve compatibility and, hence,

9Science for Conservation 216
long-term records, is to always build on the past. This does not necessarily mean
we must continue to use the same techniques, but at least the succession of
techniques must be explicitly comparable so that we are not always starting at
time zero. Another issue is quality assurance over time, and comparability of
data. Achieving this requires standardised techniques that are carefully
described in field manuals linked to a data management system that stores the
raw data in a specified and well-documented way. A system providing such a
structured approach to measuring changes in indigenous forests nationally is
included in the field methods described by Allen (1992, 1993) that are linked to
the NVS (National Vegetation Survey) databank (e.g. Hall et al. 1991; Wiser
et al. 2001). These methods have underpinned the measurement of biodiversity
patterns and dynamics in many localities throughout New Zealand over recent
decades (e.g. Stewart & Burrows 1989; Smale et al. 1995; Burrows et al. 1999).
3.1.2 Sampling design
For evaluating conservation performance and national-level reporting it is
important to select a system that records indicators in an unbiased way.
Although some methods can provide complete coverage of the whole country
(e.g. satellite imagery), others require an approach that samples forests in a
representative way. For plot systems, the options are random or systematic
location of plots throughout the forests nationally or within pre-determined
strata. It is worth including here some details on the design of the Forest Health
Monitoring Program used in the USA, which samples that country�s forests in an
unbiased way (summarised from Stapanian et al. 1998; USDA Forest Service
1998). The design permits the estimation of indicators at state, regional and
national levels with known levels of confidence. It has been determined that
combining site-specific studies in particular environments is not appropriate for
rigorous testing at these levels (Stapanian et al. 1998). The design chosen for
the monitoring system uses an equal-area triangular grid with points
approximately 27 km apart. The country was tessellated in this manner with
hexagons. Within each hexagon, a plot is located at the hexagon centre. The
design is sufficiently flexible to accommodate post-stratification and
aggregation into, for example, eco-regions (Rogers et al. 1998).
Taxa that occupy only a limited geographical range, few types of habitats, or are
rare as individuals, will not be covered cost-effectively by a national- or regional-
scale design. Threatened species, for example, along with local conservation
issues (e.g. sika deer in the Kaweka Range) or intensive management (e.g.
mainland islands), require intensive local-scale monitoring beyond that
provided for by a national or regional system (e.g. Stanley et al. 1998). The
contribution a national or regional system may make to such issues is in
exposing new locations for some rare species, and signalling, over time, when
some declining species become rare and require more intensive assessments.
There will always be a need for local-scale assessments. Bellingham et al. (2000)
present a three-tier option for a network of permanent plots in New Zealand:
� Tier one�spatially extensive, non-stratified, representative national network
using some existing plots.
� Tier two�local networks using some existing plots, but expanded to address
geographic deficiencies in tier one sampling schemes (suitable for
Conservancies).

10 Allen et al.�Forest biodiversity assessment
� Tier three�detailed, multidisciplinary, long-term ecological research sites
(e.g. some mainland islands).
Although this report focuses on the national scale, these three tiers need to be
designed in concert and integrated across the three scales for all types of land
cover.
New Zealand is well endowed with permanent monitoring plots in indigenous
forests, and one indicator for which there has been a rigorous testing for bias is
a NVS plot-based national estimate of carbon storage (Allen et al. 1998). That
project, funded by the Ministry for the Environment, developed a set of criteria
for selecting an existing plot nearest a systematic set of sampling points located
throughout the country�s indigenous forests. The sampling points for a 1990
estimate were on a 9 km × 9 km grid and resulted in a live biomass carbon
estimate that was unbiased in terms of elevation, climate, forest, and soil types
as well as plot density (Hall et al. 2001). There was some geographic bias,
however, because there were few permanent plots in some extensive areas of
forest (e.g. inland Taranaki).
It is important to sample the geographic distribution of forests because of, for
example, regional differences in disturbance regimes, which may or may not
relate to environment. It was for such reasons that the Ministry for the
Environment project decided for subsequent carbon estimates to use a
systematic grid system of plots rather than any form of stratification (Fig. 1;
Allen et al. 1998; Coomes et al. 2002). Grid systems are often desirable over
random locations because they give better spatial coverage. As Bellingham et al.
(2000) have stressed, it is important to incorporate existing plots with long-
term data in the evolution of any design; some researchers give this a higher
priority than particular statistical considerations. So, some of the grid points in
Fig. 1 have an existing forest plot that can be used to represent the point, while
others require that the carbon monitoring system establish a new plot. Any
interpretation related to specific factors influencing composition, structure,
and function of forest ecosystems would then be made subsequently.
Some authors consider that any form of forest stratification is inappropriate
where the goals are long-term assessments of forest at national and regional
scales (e.g. Overton & Stehman 1996; Bellingham et al. 2000). It is unlikely that
any particular form of pre-stratification (e.g. administrative boundaries, forest
types, environment types, catchments, disturbance levels) will adequately meet
a wide range of purposes and therefore endure in the long term (e.g. decades
and beyond). It is better for a monitoring system to be implemented with few
such constraints. Overton & Stehman (1996) considered that the statistical
advantages from a simple design will, over time, compensate for possible
precision or efficiency lost by not using more complex designs. It is for such
reasons that many countries (e.g. USA, Finland, Switzerland, Canada and
Austria) employ grid-based systematic designs.
So far this section has considered the location of sampling points to give an
unbiased estimate of an indicator nationally. The second aspect to be
considered is how many points are required for a given level of precision.
There have been few attempts to generate the sampling intensity required to
achieve a given level of precision for indicators in New Zealand indigenous
forests, either locally or nationally (but see Bachelor & Craib 1985; Bellingham

11Science for Conservation 216
Figure 1. An 8 km × 8 km grid giving carbon monitoring system plot-sampling pointssuperimposed on North Island forest and shrubland areas from the Land Cover Data Base of NewZealand. Whether an existing plot appropriate for monitoring carbon is associated with a gridpoint is also indicated (map adapted from Allen et al. 1998).

12 Allen et al.�Forest biodiversity assessment
et al. 2000). For example, Hall et al. (2001) showed that approximately 570
plots throughout the country are required to calculate a plot-level mean
biomass carbon estimate to within 5% (at a 95% probability level). The
relationship between the mean plot biomass (and associated standard error)
versus number of plots is given in Fig. 2. Coomes et al. (2002) have shown that
re-measurement of plots would allow analyses with repeated measures, and
reduce the number of plots required to detect a 5% change in carbon storage to
about 200 nationally. This sampling intensity indicates what is required
nationally; any reporting from smaller spatial scales would require a similar set
of analyses. Clearly, any reporting of conservation performance will require
that sampling intensities be determined for the range of selected indicators at a
specified level of precision, for the range of spatial scales for which they are
used. We must also establish how often sampling points should be remeasured.
The existing NVS database could provide much of the data necessary to test
such sampling design issues at a range of spatial scales.
3.1.3 Selected indicator must achieve goals
In the past, it has often been the case that conservation goals were not
sufficiently defined to enable performance evaluation in relation to those goals.
DOC�s guidelines for measuring conservation projects address this issue, and
should lead to an improved outcome for quality conservation management and
acceptance by conservation managers (Department of Conservation 1998).
Within this report, the characteristics of interest are changes in forest
composition, structure, and function, and how these are affected by human-
related impacts. At any point in time these characteristics can be used to derive
indicators of biodiversity status. Because indicators, and the way they are
derived, will change over time, it is most essential that any biodiversity
assessment system measures an enduring set of characteristics. An indicator is
derived from measurements showing changes in forest composition, structure,
Figure 2. Mean plot stembiomass, and associated
standard error, for variousplot densities nationally(after Hall et al. 2001).

13Science for Conservation 216
and function. This would focus the selection of such indicators away from
human-related pressures such as atmospheric pollutants in wet deposition, the
number of tourists walking the Lake Waikaremoana track, the extent of stoats in
forests, or the number of introduced herbivores, such as deer. It must be
remembered, however (as discussed in 3.1.5), that it will sometimes be
necessary to quantify the level of these pressures, to correctly interpret human-
related impacts.
There is an inherent tendency to view an increase in a particular indicator as a
desirable outcome for conservation performance. However, this is a naive
approach. For example, in a study of ecosystem properties in forests inside and
outside deer exclosures, values of humic carbon and nitrogen were sometimes
greater in the presence of deer (Wardle et al. 2001). Similarly, surveillance
monitoring that shows no change in an indicator is, in itself, a useful result.
Reporting data that only show change biases the representation of processes
that are occurring. This assumes, of course, that there is an adequate statistical
design.
3.1.4 What is a suitable indicator?
It is very desirable to have specific indicators that can be clearly interpreted. It
is also desirable that each indicator can be used for, and partitioned in terms of,
more than one human-related impact. In reality, our knowledge about what
controls the composition, structure, and functioning of forest ecosystems is at a
stage where the indicators we can select today fall well short of these
expectations. Taking this into account, are there some principles that can be
followed when selecting indicators? The following general criteria have been
suggested for the selection of biodiversity indicators (Pearson 1996):
� Species selected must be taxonomically well known and stable
� Their biology and life history must be well understood
� They should be taxa that occupy a breadth of habitats and geographical range
� They should also be taxa where there is specialisation of populations within a
narrow habitat
� The temporal patterns reflected in the indicator taxon should be reflected in
other taxa
� They should have potential economic importance
These criteria do not emphasise taxa that are of specific concern now; current
concerns should be encompassed within the criteria (see Hutcheson et al.
1999). This approach should apply to the full range of biodiversity indicators.
New Zealand�s indigenous forests have been quantitatively classified based on
composition at various spatial scales, including nationally. One national
indicator may be the area of each forest type; however, at another point in time
it may be more useful for some purposes to classify the forests by level of
disturbance. Taking a specific example: DOC is, at a regional scale, most
interested in classifying Kaweka and Kaimanawa forests by natural canopy
disturbance so that monitoring activities can be focused on whether tree
species are regenerating in open-canopy areas with or without deer control.
The advantages of establishing a comprehensive monitoring system that does
not focus solely on a current issue can be shown by the following example. In
the 1970s there was concern about the impacts of red deer (Cervus elaphus
scoticus) on regeneration of eastern South Island beech forests. A quantitative

14 Allen et al.�Forest biodiversity assessment
study involving permanent plots was set up in the Harper-Avoca catchment to
investigate deer impacts (see Section 3.1.5). At the same time, ecologists and
land managers were becoming concerned about the invasion of eastern South
Island tussock grasslands by exotic Hieracium species (Rose et al. 1995). Many
consider this invasion to be a consequence of land degradation brought about
by repeated burning and sheep grazing. Fortunately, the permanent plots set up
in the Harper-Avoca forest to monitor deer impacts on tree regeneration also
recorded exotic plant species. This dataset shows a marked invasion of beech
forests by Hieracium, which calls into question the land degradation paradigm
(Wiser et al. 1998). The message here is: if characteristics are selected that are
too specific, and focussed on today�s concerns, we will be constrained in the
future. We also do not want �time zero� for the indicators derived to always be
the date at which an issue they reflect became a major concern. An indicator
system that provides most options for the future is one that has clear links to
issues of concern but which is also is explicit about, and minimises, today�s
prejudgements.
3.1.5 What does change in an indicator mean?
The structure, composition, and functioning of forest ecosystems correlate
with many factors (Table 1); some of which are relatively easy to determine
(e.g. precipitation) and others that we know little about (e.g. impact of
infrequent disturbance impacts). Additionally, because many of these factors
can be inter-correlated, at any particular scale, it is difficult to separate the
impact of any individual factor and define causal relationships. This results in
limitations to the interpretation of spatial and temporal variation in indicators.
The following example highlights spatial limitations. Mortality of some tree
species has commonly been used as an indicator of brushtail possum
(Trichosurus vulpecula) impacts. A previous study in south Westland evaluated
tree mortality in three localities stratified along a possum invasion front; it was
only in the write-up stage of the study that the invasion front was shown to also
coincide with a soil fertility gradient related to plant composition (Stewart 1992).
Because we know that the frequency of dead trees in such forests apparently
TABLE 1 . FACTORS COMMONLY INFLUENCING THE DISTRIBUTION, STRUCTURE,
COMPOSITION, AND FUNCTIONING OF FORESTS. SOME OF THE VARIABLES
COMMONLY MEASURED TO REPRESENT THESE FACTORS, AS WELL AS SOME OF
THE MECHANISMS THROUGH WHICH THESE FACTORS MAY OPERATE, ARE GIVEN.
FACTORS VARIABLES MECHANISMS
Disturbance changes in biomass or number of trees individuals killed of one or more species
Herbivory level of defoliation, individual height growth reduced photosynthetic ability
Species traits
litter quality and mix modifies the ability of seeds of other species to
germinate
Climate temperature, precipitation changes physiological processes
Soil
texture, N availability influences resources essential for growth and
development
Dispersal seed dispersal, available regeneration niches seeds do not arrive at an otherwise suitable site
Time tree age, relative biomass species differential longevity

15Science for Conservation 216
relates to a soil fertility gradient (see Allen et al. 2002), it was difficult to partition
the effects of a possum density gradient along the Westland invasion front from
those driven by soil fertility. This study demonstrates how the interpretation of
indicators can be compromised by pre-stratification: in this instance, because of
unknown correlations of variables at the time the study was set up. Overcoming
such limitations will be enhanced over time by the increasing amount, and spatial
resolution, of complementary information (the factors shown in Table 1).
It is easy to put forward a set of indicators, but experience tells us that it is
usually rather more difficult to interpret any changes in a particular indicator
unambiguously and, therefore, what is indicated. The ideal solution would be to
select indicators for which there is only one explanation for any changes. Such
indicators appear to be the basis of simple relationships between introduced
animal densities and their impact. For example, a deer impact model has been
proposed, which relates deer density to seedling growth for plant species
varying in palatability (e.g. Department of Conservation 1997). Although such
models accept that variability in the relationship may be explained by other
factors, they do not account for the fact that other parameters co-vary with
animal density. Figure 3 presents a series of graphs useful for clarifying this
point. The data comes from the Harper-Avoca catchment where deer density
(frequency of defecations), tree regeneration (mountain beech seedling
density), and overstorey stocking (basal area) were monitored in mountain
beech (Nothofagus solandri var. cliffortoides) forest (Hickling 1986;
Harcombe et al. 1998; Allen unpubl. data).
If we first consider the relationship between deer density and regeneration
between 1978 and 1984, we might conclude that seedling density increased in
response to a decline in deer density. On the other hand, between 1973 and
1978, we might conclude the converse, that seedling density increased as deer
density increased! Only with the additional measurement of tree basal area is it
clear that seedling density more than likely bears no relationship to deer density
but is, instead, responding to declining tree basal area. Elsewhere, deer
apparently do effect regeneration of mountain beech (e.g. Allen & Allan 1997).
The point being made here is that for strong interpretation of changes in
indicators, it is important to also collect carefully selected complementary data
over the same period, rather than to assume that simple cause-effect
relationships exist.
3.1.6 What is the resilience of forest ecosystems?
A common expectation is that reducing human-related impacts will result in an
indicator based on forest composition, structure or function returning to some
pre-impact or baseline level. This expectation has often influenced the
selection of indicators. It is a challenging exercise to reconstruct a baseline,
unmeasured in any detail before human-related impacts. A more realistic view is
that forests will continue along a dynamic trajectory reflecting history�and
conservation management needs to decide if that is a desirable trajectory.
An example can be used to explain this issue. Extensive synchronous mortality
of southern rata (Metrosideros umbellata) and Hall�s totara (Podocarpus hallii)
has arguably been attributed to browsing by brushtail possums in Westland
conifer broadleaved-hardwood forests (Rose et al. 1992; cf. Veblen & Stewart

16 Allen et al.�Forest biodiversity assessment
1982). Although there has been a decline in the stem biomass of these two
species over the period of quantitative measurement, it is unclear what the
initial levels of dominance in these forests were (Fig. 4). It is also likely that
there has been considerable variability over recent centuries in the importance
of southern rata and Hall�s totara in these forests. This variability would have
been related to disturbance events such as earthquakes (Wells et al. 1998).
Therefore, a baseline selected from the past will not reflect the background
dynamic state of these forests and where they would be in terms of species
dominance today, without the impacts of introduced herbivores.
To further develop this Westland example, in some places where there has been
complete loss of southern rata and Hall�s totara from the forest canopy, there is
a paucity of regeneration by these species (Allen & Rose 1983). Regeneration
may be viewed as an early indicator of forest recovery. Allen & Rose (1983)
suggested regeneration limitation was a consequence of the lack of seed input
to large dieback areas. There are alternative explanations. In Hawaii it has been
shown that certain litter types can inhibit Metrosideros seed germination
(Walker & Vitousek 1991). Increasingly, studies are showing that effects related
to individual plant species are important determinants of ecosystem properties,
Figure 3. Relationshipsbetween deer density, tree
basal area, and seedlingdensity between 1970 and1985 in the Harper-Avoca
catchment, Canterbury.
����
���� ��� ��� �� ����
���
� ��
����
��� �
���
�
�
��
��
�
���
����
����
�����
���
!���
��"
�
�
��
��
��
��
�
#��
� !�
$���
��! �
��%
���
� �
�
�
�
�
�
&

17Science for Conservation 216
and that these effects may over-ride the importance of abiotic factors (e.g.
Wardle et al. 1998). In addition, these effects on ecosystem properties (e.g. soil
biota and nutrient mineralisation) will likely have important consequences on
the nature of trajectories following human-related disturbance. Because of the
long-lived nature of many tree species in Westland forests (e.g. 800 years for
southern rata), a return to the pre-disturbance forest structure is at least a
millennium away�assuming such a trajectory is actually possible.
There is no reason to expect more stable, or known, baselines at longer time
scales. Figure 5 shows the relative abundance of tree species, based on pollen
abundance, at two locations over several millennia, prior to human-induced
deforestation. What should we select as the baseline? Immediately prior to
deforestation or 2000 years before present? Both would give very different
baselines. Because of the natural variations in forests over time, there is no
reason to expect that an indicator of ecosystem properties will necessarily
return to some pre-disturbed state. The essential point here is that forest
managers will need to decide on what are desirable services and features of
forests�which may not reflect historical conditions�and manage to achieve
these against a background of change.
In summary, lessons from the long history of monitoring New Zealand forests
include:
� Data must remain explicitly comparable over time as techniques evolve
� Data collection must not focus only on contemporary perceptions and needs
� Complementary interpretive data must be collected
� Establishing baselines is difficult
Figure 4. Mean live stembiomass of all species(mean), Hall�s totara,
southern rata, and others,for the Kokatahi catchment
(from Bellingham et al.1999a). The relationshipsare based on permanent-plot measurements (over
census period) andsubjective reconstruction.

18 Allen et al.�Forest biodiversity assessment
3 . 2 W H A T T Y P E S O F I N D I C A T O R S A R E B E I N GU S E D I N O T H E R C O U N T R I E S ?
It would be a large exercise to review comprehensively the forest monitoring
work being done in other countries. For example, Finland alone has undertaken
nine national forest inventories since the 1920s and currently uses satellite
imagery, digital map data, and systematically located ground-based plots to
provide information on timber stocks and growth, forest health, understorey
composition, and bryophyte chemistry for pollution monitoring (Tomppo 1998).
The USA has a programme specifically focussed on forest health monitoring with
a goal of developing and implementing a co-operative multi-agency programme
to monitor, assess, and report on the status, changes, and trends in forest
ecosystem health and sustainability (Stolte 1997). In the USA system, satellite
monitoring provides evaluations of forest fragmentation and use, aerial
monitoring is used to detect local problems, such as pest outbreaks, and ground-
based plots provide data on forest structure, diversity, and other site-specific
indicators. Indicators of forest ecosystem components and processes relevant to
forest health used or tested in the USA are listed in Table 2.
Data from the USA forest health monitoring system now allow, for example, the
large-scale quantitative evaluation of exotic plant invasions in forests and its
relationship to human disturbance (Stapanian et al. 1998). Such indicators can
be used in comparisons to determine the influence of timber harvesting on
forest ecosystem components and processes (Keddy & Drummond 1996). It is
useful to review lists of indicators used elsewhere because they may contribute
to the breadth and type of indicators that could be used in New Zealand. The
USA forest health monitoring system was developed to address national
concerns as well as meeting international requirements such as the Montreal
Process (see Appendix 3). The specific national concerns reflect, in particular,
the ongoing impacts of atmospheric pollution which, at least so far, is not of
wide-scale concern in New Zealand�s indigenous forests. New Zealand has its
Figure 5. Changes in foreststructural dominants overrecent millennia based onpollen abundance prior to
deforestation at twolocalities in the South
Island: (A) Mount Horrible,inland Canterbury (Moar1971) and (B) Merrivale,
coastal Southland(McGlone & Bathgate
1983).
A.
B.

19Science for Conservation 216
own set of specific concerns, which are reflected in DOC�s goals of retaining
natural heritage values. Currently, these concerns are dominated by the impacts
of introduced herbivores, predators and weeds, but also include some global
issues such as the potential impacts of climate change.
IN USE TESTED BUT NOT YET IN USE
tree species diversity understorey species
tree regeneration lichen communities
tree mortality foliar chemistry
tree growth dendrochemistry
tree damage woody debris
tree crown condition soil carbon
pollution indicator plants
soils
TABLE 2 . FOREST HEALTH MONITORING INDICATORS CURRENTLY IN USE, OR
THAT HAVE BEEN TESTED, WITHIN THE UNITED STATES AT NATIONAL AND
REGIONAL LEVELS (STOLTE 1997) .
4. Proposed methods andindicators
As part of a project assessing DOC�s requirements for a national network of
permanent forest plots, Peter Bellingham asked DOC Conservancy, Regional,
and Head Office staff for their views on attributes that need to be measured.
Attributes to be measured in any forest monitoring system were considered by
some to �depend on the specific questions being asked�. There was no clear
pattern among those canvassed as to what are desired attributes to be measured
in a forest monitoring programme. Opinions ranged from advocating
comprehensive monitoring, to targeted monitoring (e.g. presence or absence of
certain forest species; implicit in this is that a causal mechanism is known that
explains presence or absence). Variations and inconsistencies in approach were
obvious, even within individual responses. For example, one respondent
considered that complete measurements of existing permanent forest plots
(that sample several stages of tree life histories) may not be necessary, while at
the same time advocating the need to additionally measure, at each plot, leaf
litter, invertebrates, soils, epiphytes, herbivory effects (by both native and
introduced animals), weed invasion, and environmental variables including
rainfall, temperature, and UV light. Another respondent considered there would
be merit in establishing a nationwide monitoring of forest phenology, while
accepting that such a programme would be time-consuming because of the
need to conduct monthly observations. Some respondents considered a forest
monitoring system should be designed principally to assess effects of vertebrate
pests (mainly herbivores), and one advocated a factorial design with various
treatments of vertebrate herbivores, while another thought a comprehensive
range of attributes measured widely in space and time should enable one to
partition the effects of herbivores from natural processes.

20 Allen et al.�Forest biodiversity assessment
From DOC�s perspective, useful indicators are those which are relevant
primarily to evaluating conservation performance and those which are key to
indicating fundamental shifts in the composition, structure, and functioning of
forest ecosystems, particularly where these are a consequence of human-related
activities. We need to understand why an indicator measured in a certain way is
a useful, repeatable approach, and what needs to be measured to help interpret
an indicator. The following indicators are considered from these perspectives
to meet regional, national, and international requirements.
4 . 1 F O R E S T A R E A
We must go back approximately 15 000 years to find a time when the New
Zealand landscape was as deforested as it is today. A climatic warming saw the
dramatic recovery of forests from 15% of the land surface 18 000 years ago to
80% of the land surface 10 000 years ago (Fig. 6). Although natural disturbances
(e.g. volcanic eruptions) have periodically removed forests over extensive
areas, the forests have usually recovered rapidly. Over the last millennium,
human impacts, largely brought about by the extensive and repeated use of fire,
have eclipsed the extent and rate of change in forest cover over the previous
20 000 years (McGlone 1989). There has been some recovery of forested area
over the past century in areas with a moist, mild climate. The apparent low
resilience of New Zealand forest species today is partly a consequence of
ongoing disturbance requiring energy input by humans, such as scrub
Figure 6. Forested area (percentage of New Zealand) over the last 25 000 years (logarithmicscale). The percentage of New Zealand�s area is broken down to beech forest, pine forest, andothers. Compiled in consultation with M. McGlone.
21Science for Conservation 216
clearance. Some losses of indigenous forest area are still occurring. However,
with the increasingly marginal economics of extensive, low-intensity
agriculture, there is the potential for an expansion of indigenous woody
communities; and because New Zealand is naturally a forested landscape, much
of this land will eventually develop towards forest. McGlone (1999) argues that,
correctly managed, this potential expansion is a major opportunity for the
conservation of biological diversity in New Zealand at a landscape scale.
The low resilience of New Zealand�s indigenous forests is also a result of
modification of fundamental forest processes that has occurred since humans
arrived in New Zealand. In the past, indigenous conifer species have rapidly
invaded deforested areas, including those dominated by grasses. It appears that
establishment by some indigenous conifers (e.g. Phyllocladus) is now limited
by seed dispersal in some areas. Fragmentation of forests has restricted the
migrational opportunities of some species. Disturbance regimes have also been
modified, e.g. hydro-electricity development in major river systems has
modified flooding regimes and their impacts, for example, on regeneration
dynamics of tree species. As a result of such changes, the compositional,
structural, and functional characteristics of �new� indigenous forests may not be
the same as those that would have occurred on the same sites without human-
related removal of forest.
It will become important to quantify the changes in area, and spatial
distribution, as well as the biodiversity within these �new� indigenous forests as
they develop. There has been a history of mapping the spatial distribution of
land cover types in New Zealand with complete national coverage being given
by the Vegetation Cover Map (VCM) of New Zealand (Newsome 1987). The
Land Cover Database (LCDB), based on satellite imagery, gives a greater, and
better defined, spatial resolution of forests than the VCM. The LCDB maps
indigenous forest (woody vegetation greater than 6 m tall, and greater than 20%
cover) distribution at a 1-ha scale. In undertaking the MfE carbon project,
Coomes & Beets (1999) have shown that the LCDB misclassifies what is forest
about 10% of the time, based on field assessments in the central South Island.
The 1-ha resolution of the LCDB allows indices of forest fragmentation, such as
size, isolation, shape, and edge:area ratio (e.g. see Norton 2000) to be
determined in a way that has not been possible to date, and it can be done at a
range of spatial scales. No doubt our abilities to derive landscape-level dynamics
will improve with time, but we must ensure compatibility with past techniques,
so that trends can be determined. Field data will be required to quantify the
compositional, structural, and functional characteristics of �new� forest
communities, as outlined in the following subsections. The distribution of
forest with these characteristics may then be generalised by using other types
of data at national or regional scales, such as environmental domains or
community functional types derived from current and future versions of the
LCDB.

22 Allen et al.�Forest biodiversity assessment
4 . 2 T R E E M O R T A L I T Y A N D R E C R U I T M E N T
Extensive death of canopy trees is a prominent feature in many forest areas (e.g.
Ogden et al. 1996). While some canopy disturbance events, such as
earthquakes, are unrelated to human impacts, others (such as fire) may be a
direct consequence of human activity. However, the separation of human-
related canopy disturbance can be problematic because:
� Sometimes the disturbance agent is just not known. For example, there has
been a long debate in New Zealand over the level to which possums defoliate
and kill trees versus other factors driving the same mortality (e.g. Veblen &
Stewart 1982; Bellingham et al. 1999a); or,
� The degree to which some known disturbance agents are a consequence of
human activity is unclear. For example, the level to which storminess is a
consequence of human-induced atmospheric changes is not known.
The significance of this point is that it identifies a difficulty for forest
management focussed on human-related impacts. Extensive animal control
operations have often been mounted over the last 40 years where tree mortality
is considered to be a consequence of browsing by brushtail possums. This has
focussed monitoring for conservation performance on tree mortality. From a
wider perspective, because trees are the dominant biotic structural component
in forests and drive many of the compositional and functional changes in
forests, it is important to measure and understand patterns of tree mortality at a
range of spatial scales.
Early accounts describing the existence of extensive tree mortality were based
on anecdotal and photographic records (e.g. Grant 1984). Ground-based and
aerial surveys have been used to describe and quantify the intensity and spatial
distribution of mortality (e.g. Bachelor 1983; Pekelharing & Reynolds 1983;
Rose et al. 1992; Rogers & Leathwick 1997). Recognising that forest structural
attributes themselves may be important in explaining the intensity and nature
of tree mortality, ground-based dead tree measurements have been used to
characterise the size-structure of trees that die (e.g. Allen & Rose 1983).
However, any point-in-time measurement of dead individuals, irrespective of
the method used, will miss an important component of the mortality dynamics:
the rate of tree death. Some tree species, e.g. southern rata, likely remain as
dead standing spars for more than half a century, while others, such as kamahi
(Weinmannia racemosa) may decay and disappear within a decade or two
(Bellingham et al. 1999a). Ideally, an indicator of tree mortality should be
expressed as a rate based on measurements of individuals, and the
interpretation of tree death would be aided by a knowledge of the size of
individuals and overall stand structure (Hutcheson et al. 1999). In the longer
term, an expectation may be that we can model spatial and temporal variability
in tree mortality, rather than measure it. However, some of the drivers of tree
mortality, e.g. earthquakes (Allen et al. 1999), are so poorly understood in terms
of the intensity and spatial distribution of their impact that we will be faced
with actual measurement for some time yet.
The maintenance of tree species can also be assessed through regeneration.
Tree regeneration is a complex process, as it is influenced by flowering,
seeding, dispersal of propagules, seed predation, the availability of suitable

23Science for Conservation 216
regeneration sites, competitive interactions as juveniles develop, as well as the
impacts of introduced browsing animals. Veblen & Stewart (1982) argued that
New Zealand ecologists and land managers have a preoccupation with
explaining regeneration patterns in terms of browsing animal impacts.
Counting seedlings, within size classes, over a fixed area is a useful way of
measuring regeneration potential, but any interpretation is dependent on
accounting for, at the very least, overstorey conditions and levels of browsing
pressure (e.g. Allen & Allan 1997). Seedling counts offer a static view of
dynamic situations, and a more useful indicator is one that describes the
dynamic nature of the regeneration process.
The maintenance of tree species as components of forest biodiversity is
essentially a population process and can be described by, and modelled from,
whether tree mortality rates exceed recruitment rates (Bellingham et al.
1999b). Bellingham et al. (1999b) have examined the imbalance of mortality
and recruitment of dominant tree species in 14 localities around New Zealand
using tagged individuals on permanent plots. Mortality rates of kamahi
exceeded recruitment rates by 3.2% per year in Pureora, but elsewhere
recruitment rates were generally low and were either similar to mortality rates
or slightly exceeded them (Table 3). Mortality and recruitment rates of silver
beech (Nothofagus menziesii) were generally similar at most localities, with
the greatest discrepancy at Mt Arthur where recruitment rates exceeded
mortality rates by 0.8% per year (Table 3). While recruitment rates of mountain
beech were similar to, or slightly exceeded, its mortality rates in most sites,
mortality rates of this species greatly exceeded recruitment rates in two
montane forests where it was mono-dominant (by 0.9% per year in Craigieburn
and 1.1% per year in Kaweka). Mortality rates of Hall�s totara, a minor
component of six forests, were higher than recruitment rates in four localities
(Table 3). Most notably, 3.0% per year mortality of this conifer at Kokatahi over
23 years contrasts with nil recruitment over the same period, with a less
extreme contrast between 0.4% per year mortality and nil recruitment over 21
years in the Caples Valley, and a disparity between 1.4% per year mortality and
0.2% recruitment over 27 years in the Whitcombe Forest. For such monitoring
purposes, permanent plots must be of sufficient size to adequately sample the
tree populations of various species. Sweetapple & Burns (2002) recently
advocated plots as small as 5 m × 5 m for monitoring forests, even though
research in most forest types would suggest this size is too small to adequately
characterise tree dynamics.
There is accumulating evidence of the highly variable nature, both spatially and
temporally, of tree mortality and recruitment. The species of most concern
should be those with high mortality and low recruitment at most localities, and
these should be the focus of research to explain the paucity of regeneration and
for restorative actions. Such demographic data can then, in part, be used by
DOC to prioritise tree species in terms of risk. Internationally, there is
considerable interest in the maintenance of tree species populations, with 10%
of all the world�s tree species considered to be under threat (Williams 1998).

24 Allen et al.�Forest biodiversity assessment
TA
BL
E 3
.
DE
MO
GR
AP
HIC
RA
TE
S O
F F
OU
R T
RE
E S
PE
CIE
S F
OR
ST
EM
S >
10
cm
db
h I
N F
OR
ES
TS
AT
VA
RIO
US
LO
CA
LIT
IES
IN
NE
W Z
EA
LA
ND
.
P =
me
an
pe
rce
nta
ge
ea
ch
sp
ec
ies
form
s o
f to
tal
ste
ms
pe
r p
lot;
M =
mo
rta
lity
ra
te (
%/y
r);
R =
re
cru
itm
en
t ra
te (
%/y
r);
T =
tu
rno
ve
r ra
te (
me
an
of
mo
rta
lity
an
d r
ec
ruit
me
nt
rate
, %
/ye
ar)
. A
fte
r B
ell
ing
ha
m e
t a
l. (
19
99
b).
LO
CA
LIT
YF
OR
ES
T T
YP
ES
ILV
ER
BE
EC
HM
OU
NT
AIN
BE
EC
HH
AL
L�S
TO
TA
RA
KA
MA
HI
PM
RT
PM
RT
PM
RT
PM
RT
Pir
on
gia
Har
dw
oo
d3
8.2
2.4
3.1
2.8
Oka
tain
aH
ard
wo
od
-co
nif
er3
2.0
0.8
0.3
0.6
Pu
reo
raH
ard
wo
od
-co
nif
er6
.54
.91
.73
.3
Kai
man
awa
Mix
ed N
oth
ofa
gus-
har
dw
oo
d5
5.7
2.6
2.5
2.6
10
.13
.63
.53
.6
Kaw
eka
Noth
ofa
gus
(mo
no
-do
min
ant)
79
.52
.41
.31
.94
.61
.92
.02
.0
Tar
aru
aM
ixed
Noth
ofa
gus-
har
dw
oo
d2
7.8
0.3
0.6
0.5
2.0
0.2
0.3
0.3
52
.80
.40
.70
.6
Mt A
rth
ur
Mix
ed N
oth
ofa
gus
46
.80
.31
.10
.75
1.4
1.0
1.2
1.1
Ko
kata
hi
Har
dw
oo
d-c
on
ifer
2.8
3.0
0.0
1.5
24
.20
.80
.80
.8
Wh
itco
mb
eH
ard
wo
od
-co
nif
er9
.21
.40
.20
.82
7.9
0.5
0.6
0.6
Cra
igie
bu
rnN
oth
ofa
gus
(mo
no
-do
min
ant)
99
.91
.30
.40
.9
Cap
les
Mix
ed N
oth
ofa
gus-
con
ifer
39
.30
.90
.60
.82
7.1
0.5
0.7
0.6
5.5
0.4
0.0
0.2
Gre
enst
on
eM
ixed
Noth
ofa
gus
47
.11
.01
.01
.03
3.8
1.2
1.1
1.2
Mu
rch
iso
nM
ixed
Noth
ofa
gus-
har
dw
oo
d2
7.6
1.1
0.9
1.0
44
.70
.90
.70
.89
.20
.91
.01
.0
Wai
tutu
Mix
ed N
oth
ofa
gus-
22
.10
.80
.70
.81
4.8
1.2
0.7
1.0
3.4
0.7
0.6
0.7
35
.80
.60
.80
.7
har
dw
oo
d-c
on
ifer

25Science for Conservation 216
4 . 3 C O M M U N I T Y C O M P O S I T I O N
Most approaches to species monitoring deal with a scalar quantity such as the
abundance of an individual species. Species composition at monitored sites is a
multivariate quantity, which may be analysed in terms of presence or absence,
abundance, or proportional abundance of each species simultaneously (Philippi
et al. 1998). Such multivariate data are commonly analysed using widely
available classification and ordination programs (e.g. CANOCO). The CANOCO
algorithm has the option of partitioning compositional variation into
components explained by various explanatory variables (e.g. Økland &
Eilertsen 1994). These explanatory variables could represent the pressure
exerted by a specific human-related impact, such as deer density or amount of
deer browse. Thus, in establishing the status of indigenous forests, it could be
asked: to what degree does overall compositional variation in indigenous
forests relate to levels of deer browse in a way that is unrelated to other factors
(e.g. canopy density or climate) influencing composition? A logical extension of
this approach is to introduce time as another factor. Wiser et al. (1997) used
permanent plots to examine how the compositional recovery of mountain
beech forest following fire is influenced by distance from the unburnt forest
margin alone, time since the fire alone, and the interplay between time and
distance. To use the deer browse analogy, we could ask: to what degree are
temporal changes in indigenous forest composition related to deer browse
intensity alone, deer browse intensity that is at the same time related to other
factors, or to other factors alone? The challenge is to collect the long-term data
on species composition, and other variables, that will allow testing of such
explicit questions. Species composition can be recorded on permanent plots re-
measured over time to provide the time-series data, but it must be appreciated
that compositional patterns at a point in time, and compositional dynamics over
time, relate to the spatial scale of sampling (e.g. Reed et al. 1993). The
compositional time-series data can readily be collected for vascular plants,
possibly for birds and, with more difficulty, for bryophytes, lichens, and
invertebrates. There is the opportunity for further work on the extent to which
one guild of organisms can represent another guild, and what would be the
appropriate guild to select for monitoring (e.g. Crisp et al. 1998). Another
possibility is that, within sampling design constraints, groups like bryophytes
and invertebrates could be sampled on a subset of plots. To have confidence
that changes in composition over time are meaningful, it is essential that
consistent standards are maintained in field identification skills.
Compositional data are also needed to update the characterisation of biotic
assemblages, e.g. forest types. There is a tendency to believe that forest types
are fixed over time. This is clearly not the case, with some species being lost
over extensive areas, for example as a result of dieback, and new mixtures being
formed with exotic species. An updated classification of forest types could be
the basis for subsequent subdividing of the LCDB area (see Section 4.1).
The need to measure changes in species composition also arises because some
authors argue that overall composition may be the best indicator of human-
related changes in vegetation. In this way, Stephens et al. (2002) used the
proportion of indigenous species remaining as an index of biota removal for
assessing conservation achievement. Compositional data also allows taxa to be

26 Allen et al.�Forest biodiversity assessment
combined into groups that reflect specific modifying forces on indigenous
biodiversity. For example, what would be the implications of a decline in the
density of birds feeding on the fruits of indigenous plants? A reduction in
frugivorous birds may lead to a reduction in the distribution of bird-dispersed
plants. It may be appropriate to group those plant species of which the fruits
are eaten by birds (e.g. Cameron et al. 1987), for such analyses. That is, the
patterns may be more clearly expressed when the data are analysed at higher
levels than species.
4 . 4 E X O T I C W E E D S
Plant communities worldwide are becoming progressively homogenised by the
success of exotic species in new regions, and New Zealand is no exception to
this trend. Traditionally, there has been a focus on evaluating the susceptibility
and consequences of exotic weed invasions in managed or disturbed habitats.
The 15% of New Zealand�s original lowland forest that remains is often
fragmented and is considered vulnerable to weed invasions, particularly along
edges and in small remnants (Owen 1997). Naturally disturbed sites within the
indigenous forest matrix are also invaded by many exotic species. Although this
is commonly by herbaceous species, it is increasingly apparent that exotic
woody species are playing an early successional role. For example, radiata pine
(Pinus radiata) widely establishes on landslide surfaces in Urewera National
Park, where it will remain a structural dominant for many decades, and
sycamore (Acer pseudoplatanus) invades natural canopy gaps in some South
Island forests. Exotic tree species are not confined to invading disturbed forest,
Douglas fir (Pseudotsuga menziesii), for example, can establish under open,
natural beech forest canopies in some areas (Ledgard 2002). Relatively
undisturbed forests are also being invaded by plant species such as old man�s
beard (Clematis vitalba) and wild ginger (Hedychium gardnerianum), as well
as exotic herbaceous species (Wiser 2000). The number of naturalised plant
species that have become weeds in New Zealand has been steadily growing
since the 1860s and, with the large pool of introduced species in the country,
this trend is unlikely to slow down. A response to this by DOC is to maintain a
database of weeds on conservation lands (Owen 1997).
Key issues with invading species are how widely distributed will they become,
and how will they influence the status of conservation assets over time. Wiser
et al. (1998) have shown for Hieracium lepidulum invading Canterbury
mountain beech forests that our ability to predict the weed�s distribution
increases during the invasion, but also that the site variables that relate to a
weed�s distribution change over time. There is also no reason to expect that the
distribution of a species in its original habitat will necessarily be strongly
related to its distribution elsewhere (e.g. Panetta & Mitchell 1991). For
example, radiata pine grows in New Zealand in conditions very different from
its native Mediterranean climate, rocky headland environment in California. It
would seem plausible that species with limited distributions in their natural
range may expand their habitat range in new locations when there is
competitive release. A limitation of a national or regional monitoring system is
that it is only likely to evaluate the more common species. More restricted

27Science for Conservation 216
species, perhaps those species in the early stages of invasion, will need to be
evaluated by other means. There has been little work done on the impacts of
weed invasions in indigenous forests, yet weeds can potentially alter tree
regeneration, understorey composition, litter fall, and decomposition
processes.
Most early accounts of indigenous forest weed invasions are anecdotal,
although herbarium records provide a means of assessing presences at some
locations in the past. Weed distributions can also be assessed using plot data.
Although plot-based analyses are possible for some species, e.g. Mycelis
muralis, for many exotic herbaceous species (e.g. graminoids) the taxonomic
abilities of field parties have been inadequate to confidently identify sites where
exotic species are present or, just as importantly, where they are absent. This
highlights the need for DOC staff to have good taxonomic skills. The network of
permanent plots being established by the USA forest health assessment is using
the percentage of species exotic as its indicator of exotic invasion (Stapanian et
al. 1998). It would be useful to add to this the percentage cover of exotic
species. Such analyses will clearly result from collecting the type of
compositional data outlined in the previous subsection.
Permanent plots can certainly provide a reliable means of assessing how the
distribution and abundance, as well as some impacts, of weed species change
over time. For Mycelis muralis, we can show that time-series data from re-
measured plots in South Island survey areas generally show a trend of increasing
frequency of this species, although there is variability in the rate of increase
(Fig. 7). The impact of such weed invasions can be assessed on permanent plots
through related changes in seedling numbers or other herbaceous species.
��&� ���� ���� ����
��
�
��
��
��
���
����
����
"�
'����������
���
Figure 7. Changes in thepercentage frequency of
Mycelis muralis on re-measured plots in 12 South
Island survey areas(S. Wiser unpubl. data).

28 Allen et al.�Forest biodiversity assessment
4 . 5 I M P A C T S O F I N T R O D U C E D A N I M A L S
There has been pervasive modification of New Zealand�s indigenous forest
understoreys by introduced browsing animals. In some instances, where
animals remain in high numbers, the consequence is an open forest understorey
with the few remaining plants heavily browsed. Elsewhere, a dense understorey
has developed of species unpalatable to the browsing animals. It is now
becoming apparent that this browsing has consequences for a much wider
spectrum of indigenous biodiversity and ecosystem properties than has usually
been considered (Wardle et al. 2001). Some of these compositional changes will
remain as a legacy of former times for well into the future. An early approach to
assessing browsing impacts was repeat photo points in the forest understorey.
Although this approach requires little effort, the photographs cannot provide
detail on compositional changes or clearly define the level of browse. To some
degree all browse assessments are found lacking in that they have not been
clearly linked to the conservation benefits gained from management
intervention. For biota, we need to ask: what is the significance, in
demographic terms, of a certain level of browse? As can be seen in other parts
of this report, the demographic information, and a measure of browse, could
serve as a way of linking demographic performance to animal impacts.
Several browse indices have been extensively tested and used over the last 30
years (Wardle et al. 1971; Rose & Burrows 1985; Payton et al. 1997). Some of
the common plot-based forest understorey indices useful for ungulates are:
� Browse index An estimate of the total amount of
browsing on a species over a group of plots
� Percentage total browse The amount of browsing on a species as a
proportion of total browsing on all species
over a group of plots
� Browse pressure index A measure of the amount of browse on a
species relative to its availability
� Mean browse index A measure of the browsing intensity on all
species over a group of plots
These browse indices are simply derived from quick-to-make observations made
of plant species browsed on plots. Comparisons over time can be used to
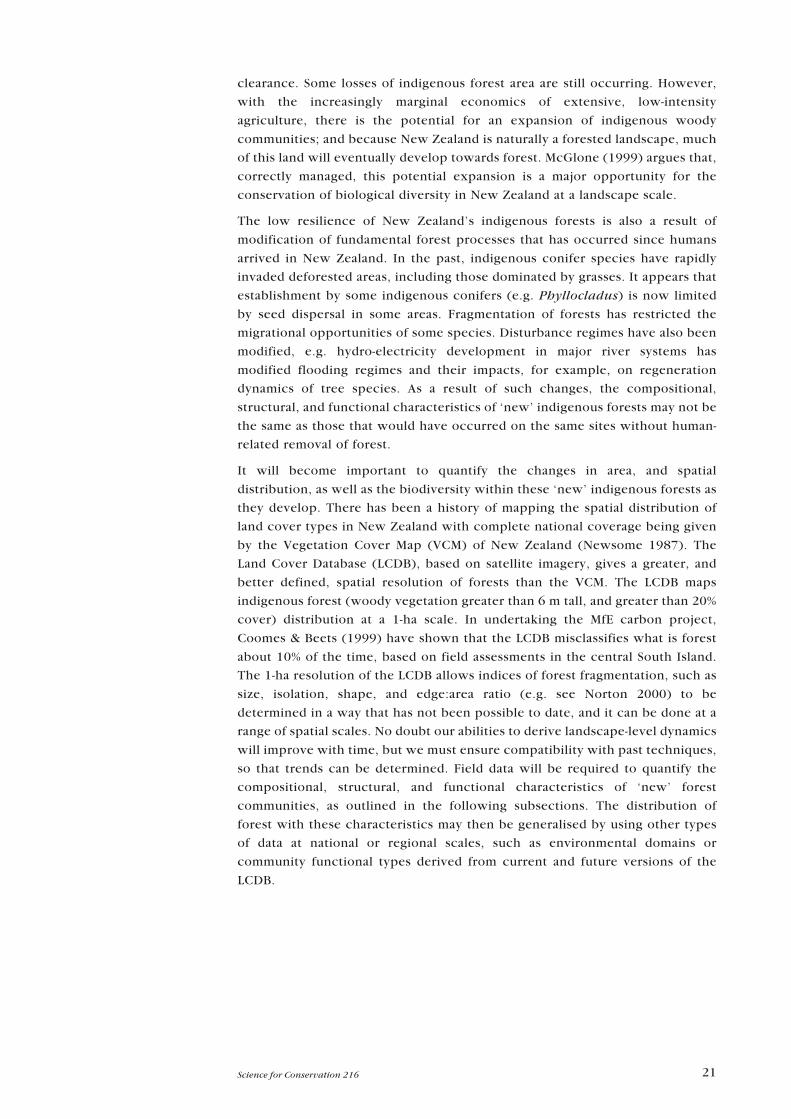
indicate changes in the impact of browsing animals (Fig. 8). Because of the
observational nature of this monitoring, there needs to be careful
standardisation of procedures, e.g. search effort, among observers over time. In
addition, it can be difficult to distinguish the damage caused by various animals,
e.g. goats versus deer, if this is required. Because the observations are made on
foliage, any browse observed is also a short-term impact, relative to the
periodicity of plot remeasurement, and can be confounded with periodicity in
leaf production.
There has been a history of canopy assessment techniques being developed in
New Zealand, mainly because of defoliation brought about by browsing by
brushtail possums. Payton et al. (1999) list techniques including descriptive
accounts, photo points, hemispherical photography, canopy scoring, aerial
photography, airborne video, and satellite imagery. The advantage of direct
observations of tree canopies, and associated canopy scoring, is that the link to
29Science for Conservation 216
possum browsing is clearer than for other methods. The Foliar Browse Index
(Payton et al. 1999) is a widely used method that combines a canopy-scoring
approach with the use of indicator species to provide an assessment of damage.
With appropriate statistical considerations, this index can be estimated on
tagged individuals, and make a long-term contribution to linking defoliation (or
browsing) to impacts on demographic parameters.
A wide array of methods is used for assessing the abundance of animal pests in
New Zealand (e.g. trap catch for possums, tunnel track indices for rodents and
mustelids). Although animal pest abundance is somewhat distant from actual
impacts, it has been used as an index of a particular pest�s impact on a range of
organisms. This is a pragmatic solution to the more complex monitoring of the
range of impacts, but does require validation at a subset of sites of assumed
relationships. Rose & Burrows (1985) have shown a strong relationship
between deer density estimates and browse indices for localities around the
country. One area that needs further attention is matching the spatial pattern in
pest abundance within a locality to site-specific impacts. Field-based
measurements for animal abundance indices therefore need to be designed in
concert with their impact assessment.
4 . 6 Q U A N T I T Y O F D E A D W O O D
Dead wood, as standing dead trees, fallen logs, or large branches, is a major
structural component of natural forest systems (Harmon & Hua 1991). In their
natural state, New Zealand�s indigenous forests have large volumes of dead
wood relative to temperate forests elsewhere (Stewart & Allen 1998). Dead
wood performs many important ecological functions: providing habitat for
organisms, playing a part in energy flow and carbon and nutrient storage, and
Figure 8. Mean browseindex on plots in the
Murchison Mountains overthe last 30 years (Burrows
et al. 1999).
Year

30 Allen et al.�Forest biodiversity assessment
influencing sediment transport and storage. Woody debris at various stages of
decay contributes to high levels of habitat heterogeneity. For example, the
threatened long-tailed bat (Chalinolobus tuberculatus) selects roost sites in
standing dead trees based on number of cavities, trunk surface area, and canopy
cover (Sedgeley & O�Donnell 1999). Saprophytic fungal communities are
diverse in logs on the forest floor, even in simple mountain beech forest, and
play a role in nutrient transport from logs to the soil (Clinton et al. 1999). Many
studies have shown the importance of logs on the ground for the establishment,
growth and survival of tree seedlings. The contribution of dead wood to forest-
stand biomass carbon can be considerable and exceed that of live biomass
(Stewart & Allen 1998).
Measurements that have been made of dead wood volume, mass or production
in indigenous forests have been based on permanent plots where the diameters
and lengths of individual pieces of dead wood have been measured (Stewart &
Allen 1998). Usually the material is classified into decay classes representing a
decay sequence that influences the ecological functions of dead wood. We
know little about the rates at which dead wood decays, or is lost from the dead-
wood pool, although Stewart & Burrows (1994) have shown that red beech
(N. fusca) logs that are decayed by lignifying brown rot fungi take centuries to
decay, whereas adjacent silver beech logs decayed by white rot fungi disappear
in a few decades. Such relationships mean there is, at best, only a weak
relationship between live and dead tree biomass in forests. Because of this,
modeling the amounts of dead wood in forests (for example, as a reciprocal
oscillation between live and dead mass) will be complex, and it will be more
accurate to directly quantify the amounts of dead wood. The only available
method for determining the volume of dead wood in forests, and its
characteristics, is direct measurement in the field. This approach has been
implemented in the carbon inventory system for indigenous forests funded by
the Ministry for the Environment (Coomes et al. 2002).
4 . 7 P O T E N T I A L I N D I C A T O R S
There is a wide range of compositional, structural or functional indicators that
could be used in forests that have not so far been discussed. With time, these
can be tested, added to and, maybe in a few instances, replace those described
so far. Some of the indicators currently being tested are briefly considered
below, to show the breadth of possibilities.
4.7.1 Phylogenetic diversity measures of biodiversity
(prepared by Gary Barker, Landcare Research, Hamilton)
The IUCN (1980) interpreted the primary reason for preserving biodiversity as
being the maintenance of options for the future: the greater the complement of
contemporary biodiversity we are able to conserve today, the greater the
possibilities for biodiversity in the future because of the diverse genetic
resource needed to ensure continued evolution. From this perspective,
biodiversity option value can be equated with species richness, plus the
richness of activities each species undergoes during its existence through
events in the life of its members, plus the non-phenotypic expression of its

31Science for Conservation 216
genome. Resource managers needing to estimate richness of features are usually
unable to measure this directly or, at best, are only able to do so for a small
sample of genes or characters. However, because genes and characters are
inherited, the relative feature richness and, thus, biodiversity value of different
communities can be estimated using knowledge of genealogical relationships
among the species that make up those communities. Phylogenetic Diversity
(PD; or Feature Diversity) was first proposed by Faith (1992) as a measure of
biodiversity option value. This measures how much of the pattern of feature
diversity, i.e. how much of the branching pattern in the phylogenetic tree, is
represented in a sample of species (see Barker 2002).
At the basic level, PD calculated from lists of species at particular sites, or
regions, enables reporting on contributions to biodiversity at larger spatial
scales. For example, from a list of birds found in the region, we can express the
contribution of Canterbury to national and global bird diversity. When we have
species inventories at different points in time, we are able to monitor trend in
contribution. At this basic level, changes in contribution are brought about by
extinctions, either at the population or species level (depending on the scale of
observation). Appropriate software can utilise abundance data in the derivation
of PD scores, thus enabling the detection and monitoring of changes in
community structure in the absence of population/species extinctions. Thus,
PD scores can be derived for communities that are sampled repeatedly over
time. Such an index therefore can make use of the community composition data
described in Section 4.3.
4.7.2 Litter quality
(prepared by David Wardle, Landcare Research, Lincoln)
Generally, our studies on human-related changes in indigenous forests have
focussed on above-ground components. This would seem appropriate given, for
example, the pervasive changes in forest understoreys caused by deer browsing
(e.g. Ogden et al. 1996). However, the impacts are more complex�plant
material enters the decomposer subsystem as litter where its breakdown is
partially controlled by substrate quality (Wardle et al. 1997). Browsing animals
are expected to preferentially eat foliage of species whose litter decomposes
most rapidly, since the controls on palatability and decomposition of foliage are
similar (Wardle et al. 2002). The subsequent increase in species with
unpalatable foliage will have important consequences for below-ground
processes. In a more general sense, any human-related changes in litter type and
composition (e.g. exotic plant species) will have flow-on effects for how forest
ecosystems function. These flow-on effects drive the vigour of forests and
successional change. Slow decomposition can be linked to carbon
accumulation in soils and low fertility with, as a consequence, plants growing
more slowly and considerable change in forest composition. The leaves of
plants that store nitrogen in secondary metabolites will not readily decompose
and nitrogen will be unavailable and will accumulate in litter and soils, rather
than being taken up by plants. Current research is identifying how human-
related impacts modify litter quantity and quality in indigenous forests as well
as the consequences of these changes. It is expected that indicators for
assessing such changes in forest litter quality will become available and provide
an important link between above- and below-ground impacts.

32 Allen et al.�Forest biodiversity assessment
4.7.3 Forest vigour
(Prepared by Neal Scott, Landcare Research, Palmerston North)
Measurements of forest productivity (and changes through time) represent an
integrated measure of forest vigour. Net primary production (NPP) is a measure
of the net growth of a forest over some period of time and, in its simplest form,
is represented by the equation:
NPP = GPP � RESP � MORTALITY
where GPP is gross primary production (the amount of carbon dioxide
absorbed by the canopy), RESP is stand-level respiration from all vegetative
components, and mortality is death of part or all of a tree. Stand-level NPP
follows a general pattern during stand development for even-aged stands: it
increases rapidly during the early stages of stand development, and peaks
during the early to middle stage of stand development, after which it declines in
older stands (Landsberg & Gower 1997). The cause of this decline is not clear,
but current evidence suggests that hydraulic limitation of photosynthesis is one
mechanism (Murty et al. 1996). In mixed-age-class forests, a quasi-steady-state
NPP may be achieved as small gaps arising from tree mortality or other
disturbances (e.g. herbivory) are filled with smaller, more rapidly growing
younger trees. As forests are disturbed, their NPP may change as the stand is
�reset� from a mature, low-productivity forest to an actively growing younger
stand. Information on NPP can indicate just where on the continuum of
productivity, or vigour, a forest resides and how resistant it will be to certain
stresses.
Several factors interact to regulate NPP, including the amount of leaf area and its
chemical composition, species composition (which influences foliar and
physiological characteristics), nutrient availability, water availability, humidity,
and solar radiation. A forest may be viewed as a large green sponge that absorbs
light (energy), and uses water and nutrients to produce biomass. Given
information on the quantity and quality of canopy leaf area (that influences light
absorption and utilisation), and general information on soil fertility and climate
(rainfall and temperature), forest NPP can be estimated with reasonable (and
verifiable) accuracy. Climate and soils data, plus forest physiological data, can be
used to predict the maximum achievable NPP for a given site. If measurements
indicate significant deviations from the predicted values, then we have an
indication of sub-optimal vigour related to (non-climatic) disturbance. Given that
climate and soil fertility do not change rapidly, it is information on canopy
condition that determines variation in NPP over shorter time scales.
How can information on forest canopies be obtained? At small spatial scales, the
amount and �quality� of leaf area can be measured directly. At larger spatial
scales, remote-sensing techniques can provide measures of leaf area and
chemical composition that are sufficiently accurate to predict NPP over large
areas (e.g. all of New Zealand). This information can then be used in
conjunction with climate and soils information to assess NPP for all New
Zealand�s indigenous forests. What this provides is a broad-scale, spatially
integrated estimate of forest vigour that can be updated frequently. Future
satellite-based sensors are likely to improve our ability to monitor forest NPP
(and other properties), as new sensors are being designed specifically to
measure critical forest and forest canopy parameters.

33Science for Conservation 216
4.7.4 Phenological events
A feature of the New Zealand flora is periodic heavy flowering and fruiting in
plants. There are well-established links between phenological events and
predator populations, which can have important conservation implications for
invertebrate and threatened bird populations. The long-term studies in the
Orongorongo Valley, near Wellington, and at other localities, bear testament to
these links. The breeding success of threatened bird species may also be linked
to phenological events, so that periodic breeding in kakapo appears to have
been associated with heavy flowering and fruiting in native plant species,
especially podocarps (Lee et al. 1997). If such relationships do exist, then
determining which factors are correlated with the initiation and development
of flowering and seeding events in indigenous plants may provide early
indications of a need for conservation management intervention. Higher seed
production in many indigenous species exhibiting periodic heavy seeding has
been correlated with higher summer temperatures at the time of floral
primordia initiation, approximately 1 year before flowering. This climatic
relationship has been quantitatively shown for the Nothofagus species, at a
range of localities, and hinau (Elaeocarpus dentatus) (Lee et al. 1997);
indicating that there can be high levels of intra- and inter-generic synchrony
over large spatial scales (Schauber et al. 2002). Rimu (Dacrydium
cupressinum) is an exception to these relationships; its seeds fall 2 years after
floral initiation and the amount of seed produced is negatively correlated with
summer temperatures at this time. Because temperatures in New Zealand may
vary with the El Niño-Southern Oscillation, it may be that subsequent seeding
periodicity across genera is controlled by these climatic events. Schauber et al.
(2002) have shown that the intra- and inter-generic synchrony of seeding events
throughout a large part of New Zealand partly result from a shared climatic
response linked to the Southern Oscillation.
As our ability to predict the occurrence of periodic heavy seeding improves, so
too will our ability to initiate a timely intervention response to minimise
repercussions for conservation assets. In this instance, the indicator may well
not be the status of human-related impacts (e.g. levels of predation by stoats),
nor the pressure on the assets (e.g. the number of stoats), but an indicator that
will subsequently determine the pressure and state. Ultimately, it may mean
linking ocean temperatures and stoat impacts. This is a desirable state because it
will allow DOC to be predictive and, hence, through appropriate resource
allocation, increase conservation performance.
4 . 8 I N D I C A T O R S A N D C O N S E R V A T I O NP E R F O R M A N C E
The indicators outlined in this report are relevant to assessing conservation
management. Certain indicators can stand alone. For example, increasing cover
or proportion of exotic species reflects the status of the conservation asset
base, and both are ordinal and reflect a decline in status. Certainly, quantitative
data on such indicators over time are considerably more robust than anecdotal
impressions. Various indicators can also be combined that reflect status of
indigenous biodiversity with and without management. Tree species that may

34 Allen et al.�Forest biodiversity assessment
be of most concern would be those that have mortality exceeding recruitment
rates over a large proportion, rather than just a small part, of their distributional
range. Such demographic data can be used not only to assess the status of tree
species, but to also make predictions about, for example, future extinction
dates. The imbalance between tree mortality and recruitment rates could then
be combined with the levels of exotic weeds to provide a more integrative
index of the status of conservation assets. The reasons, approaches and merits
for combining indicators into other �synthetic� indicators still require a
considerable amount of work.
5. Links with other initiatives
5 . 1 N A T I O N A L L Y
There is a large degree of commonality among indicators proposed in this
report for forests and those proposed for or used in various other initiatives for
assessing a wider range of ecosystems (Table 4). The terminology used does
vary and there may be gains from using a common terminology, where this is
possible. The level of commonality is not surprising when one considers the
limited range of attributes that can be measured in these ecosystems that reflect
our concerns. That each, in part, uses the LCDB highlights the importance of
this land use/cover map being robustly designed. Below we briefly describe any
differences between indicators proposed in this report and those used in
various other initiatives (detail shown in Table 4). The indicators and methods
proposed in this report are the most detailed for forests.
5.1.1 Environmental Performance Indicators
The Environmental Performance Indicators (Ministry for the Environment
1998) require cadastral information not described in this report and also
include a range of indicators beyond the scope of this report (e.g. Bio9, Bio10,
Bio13; Table 4).
5.1.2 Conservation Achievement
The indicators proposed for Conservation Achievement (Stephens et al. 2002)
have been designed for all conservation lands. It is not surprising that they are
very similar to those proposed in this report for assessing the status of forest
conservation assets. The only real difference is in the indicator of resource
modification proposed by Stephens et al. (2002). This is potentially very useful
but has not been included in this report as further research is needed to define
appropriate indicators for its use in forests�some options were addressed in
Section 4.7.
5.1.3 Carbon Monitoring System
The data required for the Carbon Monitoring System (Coomes et al. 2002) can
be obtained from a subset of the indicators proposed in this report.

35Science for Conservation 216
TH
IS R
EP
OR
TE
NV
IRO
NM
EN
TA
L P
ER
FO
RM
AN
CE
CO
NS
ER
VA
TIO
N A
CH
IEV
EM
EN
TC
AR
BO
N M
ON
ITO
RIN
G S
YS
TE
M
IND
ICA
TO
RS
(u
pd
ate
of
Min
istr
y f
or
(Ste
ph
en
s e
t a
l. 2
00
2)
(Co
om
es
et
al.
20
02
)
the
En
vir
on
me
nt
19
98
)
1. F
ore
st a
rea:
LC
DB
wo
uld
be
use
d t
o d
eriv
eB
io1
an
d B
io2
(an
d B
io4
): la
nd
use
an
d c
ove
rFr
agm
enta
tio
n: s
pat
ial r
elat
ion
ship
sT
ota
l fo
rest
are
a fr
om
the
LCD
B is
req
uir
ed
chan
ges
in in
dig
eno
us
fore
st c
ove
r an
dal
so d
eriv
ed fr
om
LC
DB
. Fu
rth
er r
efin
emen
tal
so d
eriv
ed fr
om
LC
DB
an
d e
xp
ress
ed fo
r es
tim
atin
g b
iom
ass
carb
on
sto
rage
.
geo
met
ry o
ver
tim
e. P
lot d
ata
wo
uld
all
ow
of
lan
d c
ove
r co
uld
co
me
fro
mas
a fr
agm
enta
tio
n in
dex
. Mea
sure
s in
clu
de
def
init
ion
of f
urt
her
fore
st c
ove
r ty
pes
, an
dge
o-r
efer
ence
d p
lot d
ata.
iso
lati
on
, ed
ge e
xp
osu
re, a
nd
siz
e.
thei
r ch
ange
s, b
ased
on
up
dat
ed a
ctu
al d
ata.
Bio
3: p
lot
dat
a w
ou
ld c
har
acte
rise
are
as
(eco
syst
ems,
hab
itat
s)
Bio
5: f
ore
st fr
agm
enta
tio
n in
dic
es w
ou
ld a
lso
com
e fr
om
ch
ange
s in
geo
met
ry o
ver
tim
e.
2. T
ree
mo
rtal
ity
and
rec
ruit
men
t:B
io6
: plo
t d
ata
pro
vid
es a
co
nd
itio
n m
easu
reB
ioti
c re
mo
val:
plo
t-b
ased
dat
a w
ou
ldIn
div
idu
al ta
gged
tre
e d
ata
is u
sed
to
cal
cula
te
the
mai
nte
nan
ce o
f st
ruct
ura
l do
min
ance
bas
ed o
n th
e m
ain
ten
ance
of c
om
mu
nit
yp
rovi
de
a st
ruct
ure
d fi
eld
mea
sure
men
t tr
ee- a
nd
sta
nd
-leve
l bio
mas
s ca
rbo
n s
tora
ge.
wil
l be
det
erm
ined
fro
m p
lot-
bas
ed d
ata.
str
uct
ure
.o
f rem
ova
l of
stru
ctu
ral d
om
inan
ts.
3. C
om
mu
nit
y co
mp
osi
tio
n:
Bio
6: p
lot d
ata
pro
vid
es c
on
dit
ion
mea
sure
sB
ioti
c re
mo
val:
the
plo
t-b
ased
mea
sure
men
tsV
ascu
lar
and
no
n-v
ascu
lar
pla
nt c
om
po
siti
on
the
mai
nte
nan
ce o
f co
mm
un
ity
asse
mb
lage
sb
ased
on
ab
un
dan
ce, c
om
mu
nit
yco
uld
pro
vid
e co
mp
reh
ensi
ve m
easu
rem
ents
reco
rded
on
plo
ts f
or
carb
on
pro
ject
�co
uld
be
wo
uld
be
bas
ed u
po
n p
lot
dat
aco
mp
osi
tio
n/p
rop
erti
es.
of h
um
an-in
du
ced
rem
ova
ls o
f th
e n
ativ
eex
pan
ded
to o
ther
typ
es o
f org
anis
ms.
Bio
12
: plo
t dat
a co
uld
pro
vid
e m
easu
res
bio
ta a
t geo
-ref
eren
ced
po
ints
on
the
of e
volu
tio
nar
y d
iver
sity
in s
om
e ta
xo
no
mic
lan
dsc
ape.
gro
up
s (c
ou
ld in
clu
de
bir
ds)
.
4. E
xo
tic
wee
ds:
plo
t d
ata
wo
uld
pro
vid
eB
io8
: co
ver
and
ab
un
dan
ce o
f co
mm
on
Co
mp
etit
ion
pre
ssu
re: p
lot-
bas
ed d
ata
Plo
t dat
a p
rovi
des
ex
oti
c w
eed
s d
ata
use
d in
dat
a o
n t
he
dis
trib
uti
on
, co
ver
an
dw
eed
s w
ou
ld b
e d
eter
min
ed o
ver
tim
e o
np
rovi
des
co
ver
of v
ario
us
com
mo
n w
eed
carb
on
pro
ject
.
abu
nd
ance
of m
ore
co
mm
on
wee
ds.
plo
ts.
spec
ies
and
, im
po
rtan
tly,
wit
h
re-m
easu
rem
ent,
the
dis
pla
cem
ent
of n
ativ
e b
iota
.
5. B
row
sin
g im
pac
ts o
f in
tro
du
ced
an
imal
s:B
io6
: plo
t-b
ased
bro
wse
rec
ord
ing
give
s an
Co
nsu
mp
tio
n p
ress
ure
: th
e p
lot d
ata
coll
ects
Bro
wse
ind
ices
der
ived
fro
m p
lot-
leve
l
actu
al im
pac
ts o
f sel
ecte
d p
ests
rec
ord
edin
dex
of m
od
ific
atio
n b
y h
erb
ivo
re p
ests
.in
form
atio
n o
n th
e im
pac
t of v
erte
bra
tes
ob
serv
atio
ns
are
inco
rpo
rate
d in
car
bo
n
and
ab
un
dan
ce o
f pes
ts.
Bio
7: b
row
se in
dic
es b
ased
on
plo
t d
ata
can
on
pla
nts
an
d in
dic
es o
f pes
t ab
un
dan
cem
on
ito
rin
g sy
stem
.
be
stro
ngl
y re
late
d to
her
biv
ore
ab
un
dan
ce.
(e.g
. pre
dat
ors
).
6. Q
uan
tity
of d
ead
wo
od
: am
ou
nt,
an
d s
tage
Bio
6: p
lot-
bas
ed m
easu
rem
ents
giv
e an
ind
exB
ioti
c re
mo
val:
mo
dif
icat
ion
of w
oo
dy
deb
ris
Dea
d w
oo
d b
iom
ass
carb
on
sto
rage
is b
ased
of d
ecay
, mea
sure
d o
n p
lots
an
d u
sed
as
ao
f wo
od
y d
ebri
s as
a c
om
mu
nit
y st
ruct
ure
regi
mes
can
ind
icat
e h
um
an-in
du
ced
on
plo
t-le
vel m
easu
rem
ents
of d
ead
wo
od
mea
sure
of c
om
mu
nit
y st
ruct
ure
.m
easu
re o
f hab
itat
.m
od
ific
atio
n o
f nat
ive
bio
ta.
volu
me,
dec
ay s
tage
an
d m
ass.
TA
BL
E 4
. C
OM
PA
RIS
ON
OF
FO
RE
ST
BIO
DIV
ER
SIT
Y I
ND
ICA
TO
RS
PR
OP
OS
ED
IN
TH
IS R
EP
OR
T W
ITH
TH
OS
E C
ON
TA
INE
D I
N O
TH
ER
RE
LE
VA
NT
NA
TIO
NW
IDE
INIT
IAT
IVE
S.
Th
e l
ev
el
to w
hic
h d
ata
re
qu
ire
d f
or
ind
ica
tors
in
th
is r
ep
ort
co
ntr
ibu
tes
to i
nd
ica
tors
in
oth
er
init
iati
ve
s is
de
scri
be
d.

36 Allen et al.�Forest biodiversity assessment
5.1.4 Biodiversity Strategy
The common set of indicators among the initiatives outlined in this report have
the potential to contribute to many of the Action Plan objectives listed in theme
9 of the New Zealand Biodiversity Strategy (Department of Conservation and
Ministry for the Environment 2000). Although the types of information required
for the Action Plan objectives are not very explicit, they illustrate the links
between these objectives and this report:
� Objective 9.2�develop and implement effective approaches to map
indigenous biodiversity at ecosystem scales and inform management actions
and research.
� Objective 9.3�use consistent measures and methods to monitor and provide
information on key changes in the extent and condition of indigenous
biodiversity.
� Objective 9.4�ensure that local, regional and national reporting on the state
of indigenous biodiversity informs ongoing priority setting for biodiversity
management and research as a key part of an adaptive management approach.
As a consequence, the methods and indicators proposed in this report for
forests, and shared with other initiatives, would contribute in a major way to
the Biodiversity Strategy. This would mean that there would not be a need to
redesign methods and indicators for the Biodiversity Strategy.
5 . 2 I N T E R N A T I O N A L L Y
A variety of international environmental conventions and agreements require
New Zealand to report on key environmental criteria and indicators. Bellingham
et al. (2000) list initiatives with reporting requirements�although few of these
have, as yet, defined criteria and indicators. New Zealand has already reported
under the Montreal Process (Ministry of Forestry 1997) and several issues were
outlined that constrain New Zealand�s ability to adequately report on its forests.
These were:
� Information not being available
� Information being available but considerable work required to collate it
� Custodians charging for access to information
There is a need for a consortium approach to reporting on forests, and other
ecosystems, and this approach needs to be predicated on an understanding of
the full range of needs both nationally and internationally. International
agreements for which there are developed criteria and indicators, as well as an
agency responsible for administering the agreement, include:
� Convention on Biological Diversity�Department of Conservation and the
Ministry for the Environment (MfE)
� Forest Resource Assessment 2000�Ministry of Agriculture and Forestry
(MAF)
� Montreal Process�MAF
� Land use and forest changes under the Intergovernmental Panel on Climate
Change�MfE
In the following subsections the extent to which the indicators described in
this report for national reporting satisfy these international agreements is
briefly considered.

37Science for Conservation 216
5.2.1 Convention on Biological Diversity (CBD)�indicators offorest biodiversity
The CBD focuses on the conservation of biological diversity and its sustainable
use�this is reflected in the indicators proposed by a CBD liaison group on
forest biological diversity (see Appendix 1). The International and Core Sets of
indicators proposed for forests are usually met by the indicators described in
this report. In fact, this report develops�much more than the CBD
documentation�what can be measured for the �forest condition� indicator.
Additional mapping information (that is largely available e.g. �protected areas by
ecoregions�), in combination with indicators in this report, would allow
virtually all of the International and Core Set indicators to be reported on. When
the indicators proposed in this report are combined with (generally available)
mapped information as well as classifications of species (e.g. levels of threat),
virtually all of the CBD Detailed National indicators (Appendix 1) can be
reported on. The remaining indicators not covered largely relate to sustainable
use�information that should be available from MAF.
5.2.2 Forest Resource Assessment 2000 (FRA 2000)
The FRA 2000 indicators focus on forest area, biomass and carbon stocks. As a
consequence these indicators consistently use the forest area and tree
information indicators in this report (see Appendix 2). Again, by adding
available mapped (e.g. cadastral) and other (e.g. soil carbon from Carbon
Monitoring System) information in combination with the indicators in this
report, most of the core indicators are available. Some of the indicators that
should be �attempted� have been used in New Zealand (forests managed
primarily for soil protection) and could be obtained from mapped information.
5.2.3 Montreal Process
The indicators proposed in this report address at least some of the indicators in
Criteria 1�5, but not Criteria 6 and 7, of the Montreal Process (see Appendix 3).
For Criterion 1 (Conservation of Biological Diversity), all the indicators are met
when the indicators in this report are combined with available mapped
information and a classification of species (e.g. level of threat). Criterion 2 is
about production from forests, and the background resource information is
provided by the indicators in this report but not the information on levels of
production (this is mostly available from MAF). The indicators in this report
cover Criterion 3 (Forest Health and Vitality)�except for those indicators
related to pollution. In New Zealand, pollution assessment in trees is currently
restricted to the immediate vicinity of major processing plants. Criterion 4 is
concerned with soils and water resources; these are not covered in this report
except to the extent that forest area data provide some basis for erosion
assessment. The indicators in this report largely meet the carbon reporting
requirements of the Montreal Process (Criterion 5), but not the indicators on
forest products and carbon. Criteria 6 and 7 deal with socio-economic and legal
issues not covered in this report.
38 Allen et al.�Forest biodiversity assessment
5.2.4 Land use and forest changes under the IntergovernmentalPanel on Climate Change (IPCC)
The first three IPCC indicators on land use and forest changes are covered by
the indicators in this report as they relate to forest biomass and area changes
(Appendix 4). The other two indicators on CO2 emissions are covered by the
Carbon Monitoring System and other emissions work.
5.2.5 Summary
Those agencies responsible for reporting under these international agreements
need to carry out a similar exercise to that which is shown in the appendices of
this report�comparing what is required by the convention with what
monitoring data is already available in New Zealand. Only then can we
comprehend how completely New Zealand can report on these agreements.
One issue which makes uniformity of approach between New Zealand and
international agreements difficult is the type of information commonly
collected in New Zealand. At present there is much emphasis on biodiversity,
and how pests and weeds affect this, and little emphasis on soil and water
values. Ironically, 50 years ago abiotic values (such as soil and water) were the
principal values for which much of New Zealand�s indigenous forests were
managed. This change illustrates that values we monitor for today may not be
those of the future. It is interesting to note that the significance of soils is again
being recognised in some recent work (e.g. Wardle et al. 2002).
6. Conclusion
The following indicators could be used to monitor forests in a systematic
fashion over all land in New Zealand:
� Forest area as a habitat indicator
� Mortality and recruitment rates of trees for maintenance of structural
dominants
� Community composition as an indicator of species assemblages
� Exotic weeds as a measure of intactness of indigenous biodiversity
� Indices for introduced animal impacts
� Quantity and characteristics of dead wood as one indicator of habitat diversity
Many of these indicators are currently best assessed through a network of
permanent plots, but this could change with the development and testing of
new technologies (e.g. satellite-based observations). Long-term observations on
permanent sample plots is, however, the only approach that provides real data
on patterns and rates of change in forest ecosystems, and is the ultimate test of
other approaches (Acker et al. 1998). There is also considerable merit in having
indicators which can be used in predictive models to develop time-frames for
management intervention.
This report complements Bellingham et al. (2000) who review plots as long-term
monitoring sites and Allen et al. (2002) who discuss how to use such data to
prioritise concerns about the maintenance of tree species in indigenous forests.

39Science for Conservation 216
With these reports as a basis, and in combination with the other national
initiatives previously discussed, the following issues need to be addressed:
� A consortium of interested agencies and users should be established to ensure
that the set of indicators chosen, in combination with other available
information, forms a system that meets as many monitoring needs as possible.
� The support of senior managers from the range of agencies involved must be
obtained and appropriate resources made available.
� the indicators chosen must gain wide acceptance from people involved on the
operational side of forest management and must also meet international
standards and expectations.
With respect to actually implementing a forest biodiversity monitoring system,
the following aspects still need to be addressed:
� Certain design features of the system must be refined
� A funding stream and infrastructure for the system must be developed
� The monitoring system must then be planned and implemented
� Once implemented, the system must be reviewed and further refined
according to the outcome of the reviews
Although this report was commissioned for forests, such a system should be
established to cover the full range of ecosystems. Without spatially extensive
and robustly designed monitoring systems, New Zealand will remain in a weak
position to report on the effectiveness of biodiversity management.
7. Acknowledgements
Many Landcare Research and Department of Conservation staff have
contributed to the ideas in this report. Specifically, we acknowledge input from
David Wardle, Bill Lee, Jake Overton, David Coomes, Larry Burrows, Ian Payton,
Matt McGlone, Gary Barker, Elaine Wright, James Goff, Rob McColl, Neal Scott,
Theo Stephens, and Joseph Arand. Data from the NVS database was an
important component needed for some of the specific points made in the text.
Contents of the draft discussion paper were commented upon by Paula Warren,
Theo Stephens, Rob McColl, Cathy Allan, and Phil Knightbridge.

40 Allen et al.�Forest biodiversity assessment
8. References
Acker, S.A.; McKee, W.A.; Harmon, M.E.; Franklin, J.F. 1998: Long-term research on forest dynamics
in the Pacific Northwest: a network of permanent forest plots. Pp. 93�106 in Dallmeier, F.;
Comiskey, J.A. (Eds): Forest biodiversity in North, Central, and South America, and the
Caribbean: research and monitoring. Man and the Biosphere Press, Washington.
Allen, R.B.; Rose, A.B. 1983: Regeneration of southern rata (Metrosideros umbellata) and kamahi
(Weinmannia racemosa) in areas of dieback. Pacific Science 37: 433�442.
Allen, R.B. 1992: RECCE�An inventory method for describing New Zealand vegetation. Forest
Research Institute Bulletin No. 181, Ministry of Forestry. 25 p.
Allen, R.B. 1993: A permanent plot method for monitoring changes in indigenous forests. Manaaki
Whenua - Landcare Research New Zealand Ltd, Christchurch, New Zealand.
Allen, R.B; Allan, C. 1997: Mountain beech forest dynamics in the Kaweka Range and the influence of
browsing animals. Science for Conservation 44. Department of Conservation, Wellington,
New Zealand.
Allen, R.B.; Wiser, S.; Hall, G.; Moore, T.; Goulding, C.; Beets, P.; Nordmeyer, A.H. 1998: Carbon in
indigenous forest and scrublands: a national system for monitoring carbon storage in
indigenous forests and scrub: testing plot locations on South Island transect. Landcare
Research/New Zealand Forest Research Institute Contract Report JNT 9798/166
(unpublished). 17 p.
Allen, R.B.; Bellingham, P.J.; Wiser S.K. 1999: Immediate damage by an earthquake to a temperate
montane forest. Ecology 80: 708�714.
Allen, R.B.; Stewart, G.H.; Rogers, G. 2002: Maintenance of key tree species. Science for
Conservation 190. Department of Conservation, Wellington, New Zealand.
Bachelor, C.L. 1983: The possum and rata-kamahi dieback in New Zealand: a review. Pacific Science
37: 415�426.
Bachelor, C.L.; Craib, D.G. 1985: A variable area plot method of assessment of forest condition and
trend. New Zealand Journal of Ecology 8: 83�95.
Barker, G.M. 2002. Phylogenetic diversity: a quantitative framework for measurement of priority and
achievement in biodiversity conservation. Biological Journal of the Linnean Society 76:
165�194.
Bellingham, P.J.; Wiser, S.K.; Hall, G.M.J.; Alley, J.C.; Allen, R.B.; Suisted, P.A. 1999a: Impacts of
possum browsing on the long-term maintenance of forest biodiversity. Science for
Conservation 103. Department of Conservation, Wellington, New Zealand.
Bellingham, P.J.; Stewart, G.H.; Allen, R.B. 1999b: Patterns of turnover in New Zealand forests.
Journal of Vegetation Science 10: 825�832.
Bellingham, P.J.; Wiser, S.K.; Coomes, D.; Dunningham, A. 2000: Review of permanent plots for
long-term monitoring of New Zealand�s forests. Science for Conservation 151. Department
of Conservation, Wellington, New Zealand.
Burrows, L.; Coomes, D.; Newell, C.; Allan 1999: Forest vegetation changes in the Murchison
Mountains, Fiordland National Park, with special emphasis on takahe management.
Landcare Research Contract Report LC9899/112 (unpublished). 29 p.
Cameron, E.K.; Baylis, G.T.S.; Wright, A.E. 1987: Vegetation quadrats 1982�83 and broad
regeneration patterns on Great Island, Three Kings Islands, northern New Zealand. Records
of the Auckland Institute and Museum 24: 163�185.
Clinton, P.W.; Buchanan, P.; Allen, R.B. 1999: Nutrient composition of epigeous fungal sporocarps
growing on different substrates in a New Zealand mountain beech forest. New Zealand
Journal of Botany 37: 149�153.

41Science for Conservation 216
Coomes, D.A.; Allen, R.B.; Scott, N.A. Goulding, C.; Beets, P. 2002: Designing systems to monitor
carbon stocks in forests and shrublands. Forest Ecology and Management 164: 89�108.
Crisp, P.N.; Dickinson, K.J.M.; Gibbs, G.W. 1998: Does native invertebrate diversity reflect native
plant diversity? A case study from New Zealand and implications for conservation.
Biological Conservation 83: 209�220.
Department of Conservation 1997: Issues and options for managing the impacts of deer on native
forest and other ecosystems. Department of Conservation, Wellington. 56 p.
Department of Conservation 1998: Measuring conservation management projects. Department of
Conservation, Wellington. 8 p.
Department of Conservation 2002: Restoring the dawn chorus 2002�2005. Department of
Conservation, Wellington. 54 p.
Department of Conservation and Ministry for the Environment 2000: The New Zealand biodiversity
strategy: our chance to turn the tide. Department of Conservation and Ministry for the
Environment, Wellington. 146 p.
Faith, D. 1992: Conservation value and phylogenetic diversity. Biological Conservation 61: 1�10.
Frimmel, S.M.; Turner, S.J. 1999: Outcome monitoring�animal pests. Science & Research Internal
Report 170, Department of Conservation.
Grant, P.J. 1984: Drought effects on high altitude forests, Ruahine Range, North Island, New
Zealand. New Zealand Journal of Botany 22: 15�27.
Hall, G.M.J.; Payton, L.; Burrows, L.; Fastier, M.; Andreasand, S. 1991: National Indigenous
Vegetation Survey database: Database directories. Forest Research Institute contract report
FWE 91/16 (unpublished).
Hall, G.M.J.; Wiser, S.K.; Allen, R.B.; Beets, P.; Goulding, C. 2001: Strategies to estimate national
forest carbon stocks from inventory data: the 1990 New Zealand baseline. Global Change
Biology 7: 389�403.
Harcombe, P.; Allen, R.B.; Wardle, J.A.; Platt, K.H. 1998: Spatial and temporal patterns in structure,
biomass, growth, and mortality in a monospecific Nothofagus solandri var. cliffortioides
forest in New Zealand. Journal of Sustainable Forestry 6: 313�345.
Harmon, M.E.; Hua, C. 1991: Coarse woody debris dynamics in two old-growth ecosystems.
Bioscience 41: 604�610.
Hickling, G.J. 1986: Red deer population surveys in the Harper-Avoca catchment (1956�1983).
Forest Research Institute Bulletin 107. Forest Research Institute, Christchurch, New
Zealand
Hutcheson, J.; Walsh, P.; Given, D. 1999: Potential value of indicator species for conservation and
management of New Zealand terrestrial communities. Science for Conservation 109.
Department of Conservation, Wellington, New Zealand.
IUCN. 1980: World conservation strategy: Living resource conservation for sustainable
development. Gland, IUCN-UNEP-WWF.
Keddy, P.A.; Drummond, C.G. 1996: Ecological properties for the evaluation, management, and
restoration of temperate deciduous forest ecosystems. Ecological Applications 6: 748�762.
Landsberg, J.J.; Gower, S.T. 1997: Applications of physiological ecology to forest management.
Academic Press, San Diego, California, USA. 354 p.
Ledgard, N. 2002: The spread of Douglas fir into native forests. New Zealand Journal of Forestry 47:
36�38.
Lee, W.G.; Dijkgraaf, A.; Kelly, D. 1997: Monitoring key food species of kakapo and predicting mast
seed years. Landcare Research Contract Report LC9798/028 (unpublished). 38 p.
McGlone, M.S. 1989: The Polynesian settlement of New Zealand in relation to environmental and
biotic changes. New Zealand Journal of Ecology 12: 115�129.

42 Allen et al.�Forest biodiversity assessment
McGlone, M.S. 1999: The role of history in the creation of a vision of future landscapes. Pp. 15�24 in
Visions of future landscapes. Proceedings of the Fenner conference on the environment,
May 1999, Canberra.
McGlone, M.S.; Bathgate, J.L. 1983: Vegetation and climate history of the Longwood Range, South
Island, New Zealand, 12 000 BP to the present. New Zealand Journal of Botany 21: 293�
315.
McKelvey, P.J. 1984: Provisional classification of South Island virgin indigenous forests. New
Zealand Journal of Forestry Science 14: 151�178.
McKelvey, P.J.; Cameron, R.J.; Warren, A.D. 1958: Design for a forest study. New Zealand Journal of
Forestry 7: 116�122.
Meurk, C.D.; Buxton, R.P. 1991: A New Zealand register of permanent vegetation plots. Department
of Scientific and Industrial Research Contract Report 91/35 (unpublished).
Ministry of Forestry 1997: New Zealand Country Report�Montreal Process Criteria and indicators
for the conservation and sustainable management of temperate and boreal forests.
Ministry for the Environment 1998: Environmental performance indicators: summary of proposed
indicators for terrestrial and freshwater biodiversity. Ministry for the Environment.
Moar, N.T. 1971: Contributions to the Quarternary history of the New Zealand flora. 6. Aranuian
pollen diagrams from Canterbury, Nelson, and north Westland, South Island. New Zealand
Journal of Botany 9: 80�145.
Murty, D.; McMurtrie, R.D.; Ryan, M.G. 1996: Declining forest productivity in ageing forest stands B
a modeling analysis of alternative hypotheses. Tree Physiology 16: 187�200.
Newsome, P.F.J. 1987: The vegetative cover of New Zealand. Water and Soil Miscellaneous
Publication 112. National Water and Soil Conservation Authority, Wellington, New
Zealand.
Nicholls, J.L. 1976: A revised classification of the North Island indigenous forests. New Zealand
Journal of Forestry 21: 105�132.
Norton, D.A. 2000: Sand plain forest fragmentation and residential development, Invercargill City,
New Zealand. Pp. 157�165 in Craig, J.L.; Mitchell, N.D.; Saunders, D.A. (Eds.): Nature
conservation 5: Nature conservation in production environments: Managing the matrix.
Surrey Beatty & Sons, Chipping Norton, N.S.W.
Ogden, J.; Stewart, G.H.; Allen, R.B. 1996: Ecology of New Zealand Nothofagus forests. Pp. 25�82 in
Veblen, T.T.; Hill, R.S.; Reid, J. (Eds): The ecology and biogeography of Nothofagus forests.
Yale University Press, New Haven, Connecticut.
Økland, R.H.; Eilertsen, O. 1994: Canonical correspondence analysis with variation partitioning:
some comments and an application. Journal of Vegetation Science 5: 117�126.
Overton, W.S.; Stehman, S,V. 1996: Desirable design characteristic for long-term monitoring of
ecological variables. Environmental and Ecological Statistics 3: 349�361.
Owen, S.J. 1997: Ecological weeds on conservation land in New Zealand: a database. Department of
Conservation, Wellington, New Zealand.
Panetta, F.D.; Mitchell, N.D. 1991: Bioclimatic predictions of the potential distributions of some
species prohibited entry to New Zealand. New Zealand Journal of Agricultural Research
34: 341�350.
Payton, I.J.; Forester, L.; Frampton, C.M.; Thomas, M.D. 1997: Response of selected tree species to
culling of introduced Australian brush-tail possums Trichosurus vulpecula at Waipoua
forest, Northland, New Zealand. Biological Conservation 81: 247�255.
Payton, I.J.; Pekelharing, C.J.; Frampton, C.M. 1999: Foliar browse index: a method for monitoring
possum (Trichosurus vulpecula) damage to plant species and forest communities. Landcare
Research, Lincoln. 62 p.
Pearson, D.L. 1996: Selecting indicator taxa for the quantitative assessment of biodiversity. Pp. 75�
79 in Hawksworth, D.L. (Ed.): Biodiversity: measurement and estimation. Chapman and Hall.

43Science for Conservation 216
Pekelharing, C.J.; Reynolds, R.N. 1983: Distribution and abundance of browsing mammals in
Westland National Park in 1978, and some observations on their impacts on the vegetation.
New Zealand Journal of Forestry Science 13: 247�265.
Philippi, T.E.; Dixon, P.M.; Taylor, B.A. 1998: Detecting trends in species composition. Ecological
Applications 8: 300�308.
Reed, R.A.; Peet, R.K.; Palmer, M.W.; White, P.S. 1993: Scale dependence of vegetation-environment
correlations: a case study of a North Carolina piedmont woodland. Journal of Vegetation
Science 4: 329�340.
Rogers, G.M.; Leathwick, J.R. 1997: Factors predisposing forests to canopy collapse in the southern
Ruahine Range, New Zealand. Biological Conservation 80: 325�338.
Rogers, P.; Schomaker, M.; McLain, W.; Johnson, S. 1998: Colorado forest health report 1992�95: A
baseline assessment. USDA Forest Service, Rocky Mountain Research Station, Ogden, Utah.
44 p.
Rose, A.B.; Burrows, L.E. 1985: The impacts of ungulates on the vegetation. Pp. 210�234 in Davis,
M.R.; Orwin, J. (Eds): Report on a survey of the proposed Wapiti area, West Nelson. Forest
Research Bulletin 84.
Rose, A.B.; Pekelharing, C.J.; Platt, K.H. 1992: Magnitude of canopy dieback and implications for
conservation of southern rata-kamahi (Metrosideros umbellata - Weinmannia racemosa)
forests, Central Westland, New Zealand. New Zealand Journal of Ecology 16: 23�32.
Rose, A.B.; Platt, K.H.; Frampton, C.M. 1995: Vegetation changes over 25 years in a New Zealand
short-tussock grassland: Effects of sheep grazing and exotic invasions. New Zealand Journal
of Ecology 19: 163�174.
Schauber, E.M.; Kelly, D.; Turchin, P.; Simon, C.; Lee, W.G.; Allen, R.B.; Payton, I.J.; Wilson, P.R.;
Cowan, P.E.; Brockie, R.E. 2002: Masting by eighteen New Zealand plant species: the role of
temperature as a synchronizing cue. Ecology 83: 1214�1225.
Sedgeley, J.A.; O�Donnell, C.F.J. 1999: Roost site selection by the long-tailed bat, Chalinolobus
tuberculatus in a temperate New Zealand rainforest and its implications for the
conservation of bats in managed forests. Biological Conservation 88: 261�276.
Smale, M.C.; Hall, G.M.J.; Gardner, R.O. 1995: Dynamics of kanuka (Kunzea ericoides) forest on
south Kaipara spit, New Zealand, and the impact of fallow deer (Dama dama). New
Zealand Journal of Ecology 19: 131�141.
Stanley, R.J.; Dickinson, K.J.M.; Mark, A.F. 1998: Demography of a rare endemic Myosotis: boom and
bust in the high-alpine zone of southern New Zealand. Arctic and Alpine Research 30: 227�
240.
Stapanian, M.A.; Sundberg, S.D.; Baumgardner, G.A.; Liston, A. 1998: Alien plant species
composition and associations with anthropogenic disturbance in North American forests.
Plant Ecology 139: 49�62.
Stephens, T. 1998: Measurement of conservation achievement. Department of Conservation. 27 p.
Stephens, T.; Brown, D.; Thornley, N. 2002: Measuring Conservation achievement: concepts and
their application over the Twizel area. Science for Conservation 200.
Stewart, G.H. 1992: Forest structure and regeneration of conifer-broadleaved hardwood forests,
Westland. B�monitoring rata-kamahi forest canopy condition and stand dynamics, Copland
Valley. Forest Research Institute Contract Report FWE 92/31 (unpublished), 17 p.
Stewart, G.H.; Allen, R.B. 1998: The importance of woody debris in New Zealand indigenous forests.
New Zealand Forestry 43: 31�33.
Stewart, G.H.; Burrows, L. 1989: The impact of white-tailed deer Odocoileus virginianus on
regeneration in the coastal forests of Stewart Island, New Zealand. Biological Conservation
49: 275�293.
Stewart, G.H.; Burrows, L.E. 1994: Coarse woody debris in old-growth temperate beech
(Nothofagus) forests of New Zealand. Canadian Journal of Forest Research 24: 1989�
1996.

44 Allen et al.�Forest biodiversity assessment
Stewart, G.H; Johnson, P.N.; Mark, A.F. 1989: Monitoring terrestrial vegetation for biological
conservation. Pp. 199�208 in Craig, B. (Ed.): Proceedings of a symposium on environmental
monitoring in New Zealand with emphasis on Protected Natural Areas. Department of
Conservation, Wellington.
Stolte, K.W. 1997: 1996 National technical report on forest health. Forest Service, United States
Department of Agriculture, Washington, DC.
Sweetapple, P.J.; Burns, B.R.; 2002: Assessing the response of forest understoreys to feral goat
control with and without possum control. Science for Conservation 201.
Tomppo, E. 1998: Recent status and further development of the Finnish multi-source forest
inventory. Pp. 53�69 in Managing the resources of the world�s forests. The Marcus
Wallenberg Foundation Symposia Proceedings: 11. Stockholm, Sweden. 96 p.
USDA Forest Service. 1998: Forest health monitoring 1998. Field methods guide. USDA Forest
Service, National Health Monitoring Program, Research Triangle Park, NC 27709.
Veblen, T.T.; Stewart, G.H. 1982: The effects of introduced wild animals on New Zealand forests.
Annals of the Association of American Geographers 72: 372�397.
Walker, L.R.; Vitousek, P.M. 1991: An invader alters germination and growth of a native dominant
tree in Hawai�i. Ecology 72: 1449�1455.
Wardle, D.A.; Zackrisson, O.; Hörnberg, G.; Gallet, C. 1997: The influence of island area on
ecosystem properties. Science 277: 1296�1299.
Wardle, D.A.; Barker, G.M.; Bonner, K.I.; Nicholson, K.S. 1998: Can comparative approaches based
on plant ecophysiological traits predict the nature of biotic interactions and individual plant
species effects in ecosystems. Journal of Ecology 86: 405�420.
Wardle, D.A.; Barker, G.M.; Yeates, G.W.; Bonner, KI.; Ghani, I. 2001: Introduced browsing
mammals in New Zealand natural forests: aboveground and belowground consequences.
Ecological Monographs 71: 587�614.
Wardle, D.A.; Bonner, K.I.; Barker, G.M. 2002: Linkages between plant litter decomposition, litter
quality, and vegetation responses to herbivores. Function Ecology 16: 585�595.
Wardle, J.A.; Hayward, J.; Herbert, J. 1971: Forest and scrublands of northern Fiordland. New
Zealand Journal of Forestry Science 1: 80�115.
Wells, A.; Stewart, G.H.; Duncan, R.P. 1998: Evidence of widespread, synchronous. disturbance-
initiated forest establishment in Westland, New Zealand. Journal of the Royal Society of
New Zealand 28: 333�345.
Williams, N. 1998: Study finds 10% of tree species under threat. Science 281: 1426.
Wiser, S.K. 2001: Exotic plants in Nothofagus forests managed sustainably for timber production in
New Zealand. Pp. 88�95 in Stewart, G.H.; Benecke, U.; Hickey, J. (Eds): Sustainable
management of indigenous forests. Wickliffe Press Ltd, Christchurch, New Zealand.
Wiser, S.K.; Allen, R.B.; Platt, K.H. 1997: Mountain beech forest succession after a fire at Mount
Thomas Forest, Canterbury, New Zealand. New Zealand Journal of Botany 35: 505�515.
Wiser, S.K.; Allen, R.B.; Clinton, P.W.; Platt, K.H. 1998: Community structure and forest invasion by
an exotic herb over 23 years. Ecology 79: 2071�2081.
Wiser, S.K.; Bellingham, P.J.; Burrows, L.E. 2001: Managing biodiversity information: development
of New Zealand�s National Vegetation Survey databank. New Zealand Journal of Ecology
25: 1�17.

45Science for Conservation 216
A P P E N D I X 1
Convention on Biological Diversity (CBD)�Indicators offorest biodiversity
CBD Indicators�International Current report*Forest cover 1
Forest condition 2,3,4,5,6
Protected areas 1�Partial
CBD Indicators�core setArea of natural forest 1
Area of natural forest as a proportional of total forest 1
Change in natural forest over 10 years 1
Forests protected areas by IUCN classes I�VI 1�Partial
Forest protected areas by eco-region 1,3�Partial
Number of forest-dependent species 3�Partial
Proportion of forest-dependent species at risk 2,3
Areas of forest managed to prioritise biodiversity conservation 1�Partial
Air pollution levels exceeding forest critical loads Not covered
Existence of legislation to protect biodiversity Not covered
CBD Indicators�detailed national informationMapped details of forest types 1,2,3�Partial
Mapped details of old-growth/natural forests by types 1,2�Partial
Mapped details of forest protected areas 1�Partial
Mapped details of forest under special management regime 1�Partial
Percentage and extent in area of forest types relative to historical condition
and to total forest cover 1,2,3�Partial
Percentage and extent in area of forest types by age class N/A
Levels of fragmentation and connectiveness 1
Percentage of mixed stands 1,2
Area and representativeness of forest protected areas 1,2,3�Partial
Number of forest-dependent species, categorised as (i) indigenous
(ii) non-indigenous (iii) endemic 3�Partial
Number of forest-dependent species, categorised as (i) threatened
(ii) endangered (iii) rare (iv) vulnerable 3�Partial
Population levels and changes over time of selected indicator species 2,3
Number of forest-dependent species, occupying a small proportion of their
former range 3�Partial
Areas of forest cleared annually containing endemic species 1,3�Partial
Percentage of annual natural regeneration 2
Natural regeneration as a percentage of total regeneration N/A
Percentage of stands managed for genetic resource conservation Not covered
Amount of ex situ genetic resource conservation Not covered
Proportion of trees suffering damage 2,5
Area of land set aside into special management regimes Not covered
Area of land independently certified as being managed sustainably Not covered
Human disturbance index 1,2
Main threats to forest biodiversity 2,3,4,5
Area of forest annually affected by major threats 1,2,3,4,5
*Indicators in this report cover:1 = Forest area 2 = Tree mortality and recruitment
3 = Community composition 4 = Exotic weeds
5 = Browsing impacts of introduced animals 6 = Quantity of dead wood
Partial = Indicators in this report only partially cover CBD 2000 indicator
Not covered = CBD indicator not covered in this report
N/A = Not relevant to indigenous forests

46 Allen et al.�Forest biodiversity assessment
A P P E N D I X 2
Forest Resource Assessment 2000 (FRA 2000)
FRA 2000�Core indicators Current report*Area of forest 1
Areas of other wooded land 1
Area of forest by naturalness 1,2,3,4,5,6
Area of forest plantations by categories of species N/A
Forest areas converted to other uses 1
Total forest biomass above ground 1,2,6
Total carbon stock in forests 1,2,6
Total volume of growing stock 1,2
Changes over time of total volume of growing stock 1,2
Changes over time of total forest biomass 1,2
Changes over time of total carbon stock 1,2�Partial
Area of forest and other wooded land available for wood production 1�Partial
Area of forest by ownership 1�Partial
Area of forest in protected areas 1�Partial
Area of forest and other wood land burned annually Not covered
Biomass of forest types (broadleaf and coniferous) 1,2,6
Quantity and/or total value of harvested non-wood goods and services Not covered
FRA 2000�Indicators for which assessmentshould be �attempted� or partially madeFragmentation of forests 1
Area of forest and other wooded lands managed primarily for soil protection 1�Partial
Change in defoliation over past 5 years (if not FRA 2000, then later) 1,5
Area of forest and other wooded lands managed primarily for tourism and amenity 1�Partial
Area of forest and other wooded lands managed primarily for water protection 1�Partial
Maintenance of cultural, social and spiritual values 1�Partial
*Indicators in this report cover:1 = Forest area 2 = Tree mortality and recruitment
3 = Community composition 4 = Exotic weeds
5 = Browsing impacts of introduced animals 6 = Quantity of dead wood
Partial = Indicators in this report only partially cover FRA 2000 indicator
Not covered = FRA 2000 indicator not covered in this report
N/A = Not relevant to indigenous forests

47Science for Conservation 216
*Indicators in this report cover:1 = Forest area 2 = Tree mortality and recruitment
3 = Community composition 4 = Exotic weeds
5 = Browsing impacts of introduced animals 6 = Quantity of dead wood
Partial = Indicators in this report only partially cover Montreal Process indicator
Not covered = Montreal Process indicator not covered in this report
N/A = Not relevant to indigenous forests
A P P E N D I X 3
Montreal Process
Criterion 1: Conservation of biological Current report*diversityEcosystem diversityExtent of area by forest type relative to total forest area 1,2,3
Extent of area by forest type and by age class or successional stage 1,2,3
Extent of area by forest type in protected area categories as defined by IUCN or
other classification systems 1,2,3�Partial
Extent of areas by forest type in protected areas defined by age class or
successional stage 1,2,3
Fragmentation of forest types 1
Species diversityThe number of forest-dependent species 2,3�Partial
The status (rare, threatened, endangered, or extinct) of forest-dependent species
at risk of not maintaining viable breeding populations, as determined by
legislation or scientific assessment 2,3�Partial
Genetic DiversityNumber of forest-dependent species that occupy a small portion of
their former range 2,3
Population levels of representative species from diverse habitats monitored
across their range 2,3
Criterion 2: Maintenance of productive capacityof forest ecosystemArea of forest land and net area of forest land available for timber production 1�Partial
Total growing stock of both merchantable and non-merchantable tree species on
forest land available for timber production 1,2
The area and growing stock of plantations of native and exotic species Not covered
Annual removal of wood products compared to the volume determined
to be sustainable Not covered
Annual removal of non-timber forest products (e.g. fur bearers, berries,
mushrooms, game), compared with the level determined to be sustainable Not covered
Criterion 3: Maintenance of forest ecosystemhealth and vitalityArea and percent of forest affected by processes or agents beyond the range
of historical variation, e.g. by insects, disease, competition from exotic species,
fire, storm, land clearance, permanent flooding, salinisation, and
domestic animals 1,2,3,4,5,6
Area and percent of forest land subjected to levels of specific air pollutants
(e.g. sulphates, nitrate, ozone) or ultraviolet B that may cause negative
impacts on the forest ecosystem Not covered

48 Allen et al.�Forest biodiversity assessment
*Indicators in this report cover:1 = Forest area 2 = Tree mortality and recruitment
3 = Community composition 4 = Exotic weeds
5 = Browsing impacts of introduced animals 6 = Quantity of dead wood
Partial = Indicators in this report only partially cover Montreal Process indicator
Not covered = Montreal Process indicator not covered in this report
N/A = Not relevant to indigenous forests
Criterion 3 (continued) current report*
Area and percent of forest land with diminished biological components indicative
of changes in fundamental ecological processes (e.g. soil, nutrient cycling,
seed dispersion, pollination) and/or ecological continuity (monitoring of
functionally important species such as nematodes, arboreal epiphytes, beetles,
fungi, wasps, etc.) 1,2,3,4,5,6
Criterion 4: Conservation and maintenanceof soil and water resourcesArea and percent of forest land with significant soil erosion 1
Area and percent of forest land managed primarily for protective functions.
e.g. watersheds, flood protection, avalanche protection, riparian zones Not covered
Percent of stream kilometres in forested catchments in which stream flow
and timing has significantly deviated from the historical range of variation Not covered
Area and percent of forest land with significantly diminished soil organic matter
and/or changes in other soil chemical properties Not covered
Area and percent of forest land with significant compaction or change in soil
physical properties resulting from human activities Not covered
Percent of water bodies in forest areas (e.g. stream kilometres, lake hectares) with
significant variance of biological diversity from the historical range of variability Not covered
Percent of water bodies in forest areas (e.g. stream kilometres, lake hectares) with
significant variation from the historical range of variability in pH, dissolved oxygen,
levels of chemicals (electrical conductivity), sedimentation or
temperature change Not covered
Area and percent of forest land experiencing an accumulation of
persistent toxic substances Not covered
Criterion 5: Maintenance of forest contributionto global carbon cyclesTotal forest ecosystem biomass and carbon pool, and if appropriate, by forest
type, age class, and successional stages 1,2,6
Contribution of forest ecosystems to the total global carbon budget, including
absorption and release of carbon (standing biomass, coarse woody debris,
peat and soil carbon); 1,2,6
Contribution of forest products to the global carbon budget. Not covered
Criterion 6: Maintenance and enhancement oflong-term multiple socio-economic benefits tomeet the needs of societies
Not covered
Criterion 7: Legal, institutional and economicframework for forest conservation andsustainable management
Not covered

49Science for Conservation 216
A P P E N D I X 4
Land use and forest changes under the IntergovernmentalPanel on Climate Change (IPCC)
IPCC land use and forest changes Current report*Changes in forest and other woody biomass stocks 1,2,6
Forest and grassland conversion 1,2,3
Abandonment of managed lands 1,2,3
CO2 emissions and removal from soil Not covered
Other�emissions and removals Not covered
*Indicators in this report cover:1 = Forest area 2 = Tree mortality and recruitment
4 = Exotic weeds 3 = Community composition
5 = Browsing impacts of introduced animals 6 = Quantity of dead wood
Partial = Indicators in this report only partially cover IPCC indicator
Not covered = IPCC indicator not covered in this report
N/A = Not relevant to indigenous forests