Bilingual Hispanic children's performance on the English and Spanish versions of the Cognitive...
17
Bilingual Hispanic Children’s Performance on the English and Spanish Versions of the Cognitive Assessment System Jack A. Naglieri George Mason University Tulio Otero Columbia College, Elgin Campus Brianna DeLauder George Mason University Holly Matto Virginia Commonwealth University This study compared the performance of referred bilingual Hispanic children on the Planning, Attention, Simultaneous, Successive (PASS) theory as mea- sured by English and Spanish versions of the Cognitive Assessment System (CAS; Naglieri & Das, 1997a). The results suggest that students scored similarly on both English and Spanish versions of the CAS. Within each version of the CAS, the bilingual children earned their lowest scores in Successive processing regardless of the language used during test administration. Small mean differ- ences were noted between the means of the English and Spanish versions for the Simultaneous and Successive processing scales; however, mean Full Scale scores were similar. Specific subtests within the Simultaneous and Successive scales were found to contribute to the differences between the English and Spanish versions of the CAS. Comparisons of the children’s profiles of cognitive weak- ness on both versions of the CAS showed that these children performed con- sistently despite the language difference. Keywords: bilingual assessment, intelligence, PASS Theory, Cognitive Assessment Sys- tem, non-biased assessment Action Editor: Cecil R. Reynolds. Jack A. Naglieri and Brianna DeLauder, Department of Psychology, George Mason University; Tulio Otero, Department of Psychology, Columbia College, Elgin Campus; Holly Matto, School of Social Work, Virginia Commonwealth Unversity. We recognize and thank Wanda C. Rodrı ´guez at the University Center for Psychological Services and Research at the University of Puerto Rico and her team of psychologists at the University of Puerto Rico for their production of the Spanish adaptation of the Cognitive Assessment System. Correspondence concerning this article should be addressed to Jack A. Naglieri, 4400 Uni- versity Drive, MSN 2C6, George Mason University, Fairfax, VA 22030. E-mail: [email protected] School Psychology Quarterly Copyright 2007 by the American Psychological Association 2007, Vol. 22, No. 3, 432– 448 1045-3830/07/$12.00 DOI: 10.1037/1045-3830.22.3.432 432
-
Upload
thechicagoschool -
Category
Documents
-
view
0 -
download
0
Transcript of Bilingual Hispanic children's performance on the English and Spanish versions of the Cognitive...

Bilingual Hispanic Children’s Performance on theEnglish and Spanish Versions of the CognitiveAssessment System
Jack A. NaglieriGeorge Mason University
Tulio OteroColumbia College, Elgin Campus
Brianna DeLauderGeorge Mason University
Holly MattoVirginia Commonwealth University
This study compared the performance of referred bilingual Hispanic childrenon the Planning, Attention, Simultaneous, Successive (PASS) theory as mea-sured by English and Spanish versions of the Cognitive Assessment System(CAS; Naglieri & Das, 1997a). The results suggest that students scored similarlyon both English and Spanish versions of the CAS. Within each version of theCAS, the bilingual children earned their lowest scores in Successive processingregardless of the language used during test administration. Small mean differ-ences were noted between the means of the English and Spanish versions for theSimultaneous and Successive processing scales; however, mean Full Scale scoreswere similar. Specific subtests within the Simultaneous and Successive scaleswere found to contribute to the differences between the English and Spanishversions of the CAS. Comparisons of the children’s profiles of cognitive weak-ness on both versions of the CAS showed that these children performed con-sistently despite the language difference.
Keywords: bilingual assessment, intelligence, PASS Theory, Cognitive Assessment Sys-tem, non-biased assessment
Action Editor: Cecil R. Reynolds.Jack A. Naglieri and Brianna DeLauder, Department of Psychology, George Mason
University; Tulio Otero, Department of Psychology, Columbia College, Elgin Campus; HollyMatto, School of Social Work, Virginia Commonwealth Unversity.
We recognize and thank Wanda C. Rodrı́guez at the University Center for PsychologicalServices and Research at the University of Puerto Rico and her team of psychologists at theUniversity of Puerto Rico for their production of the Spanish adaptation of the CognitiveAssessment System.
Correspondence concerning this article should be addressed to Jack A. Naglieri, 4400 Uni-versity Drive, MSN 2C6, George Mason University, Fairfax, VA 22030. E-mail: [email protected]
School Psychology Quarterly Copyright 2007 by the American Psychological Association2007, Vol. 22, No. 3, 432–448 1045-3830/07/$12.00 DOI: 10.1037/1045-3830.22.3.432
432
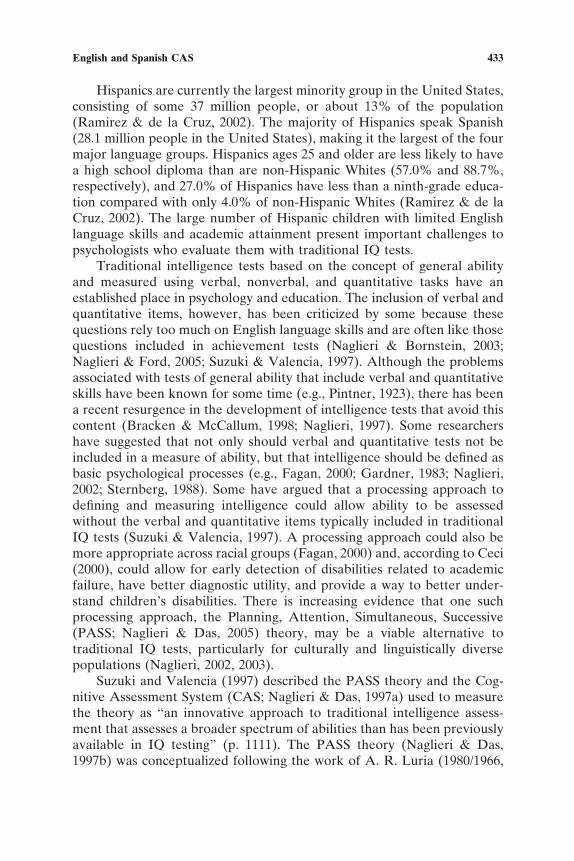
Hispanics are currently the largest minority group in the United States,consisting of some 37 million people, or about 13% of the population(Ramirez & de la Cruz, 2002). The majority of Hispanics speak Spanish(28.1 million people in the United States), making it the largest of the fourmajor language groups. Hispanics ages 25 and older are less likely to havea high school diploma than are non-Hispanic Whites (57.0% and 88.7%,respectively), and 27.0% of Hispanics have less than a ninth-grade educa-tion compared with only 4.0% of non-Hispanic Whites (Ramirez & de laCruz, 2002). The large number of Hispanic children with limited Englishlanguage skills and academic attainment present important challenges topsychologists who evaluate them with traditional IQ tests.
Traditional intelligence tests based on the concept of general abilityand measured using verbal, nonverbal, and quantitative tasks have anestablished place in psychology and education. The inclusion of verbal andquantitative items, however, has been criticized by some because thesequestions rely too much on English language skills and are often like thosequestions included in achievement tests (Naglieri & Bornstein, 2003;Naglieri & Ford, 2005; Suzuki & Valencia, 1997). Although the problemsassociated with tests of general ability that include verbal and quantitativeskills have been known for some time (e.g., Pintner, 1923), there has beena recent resurgence in the development of intelligence tests that avoid thiscontent (Bracken & McCallum, 1998; Naglieri, 1997). Some researchershave suggested that not only should verbal and quantitative tests not beincluded in a measure of ability, but that intelligence should be defined asbasic psychological processes (e.g., Fagan, 2000; Gardner, 1983; Naglieri,2002; Sternberg, 1988). Some have argued that a processing approach todefining and measuring intelligence could allow ability to be assessedwithout the verbal and quantitative items typically included in traditionalIQ tests (Suzuki & Valencia, 1997). A processing approach could also bemore appropriate across racial groups (Fagan, 2000) and, according to Ceci(2000), could allow for early detection of disabilities related to academicfailure, have better diagnostic utility, and provide a way to better under-stand children’s disabilities. There is increasing evidence that one suchprocessing approach, the Planning, Attention, Simultaneous, Successive(PASS; Naglieri & Das, 2005) theory, may be a viable alternative totraditional IQ tests, particularly for culturally and linguistically diversepopulations (Naglieri, 2002, 2003).
Suzuki and Valencia (1997) described the PASS theory and the Cog-nitive Assessment System (CAS; Naglieri & Das, 1997a) used to measurethe theory as “an innovative approach to traditional intelligence assess-ment that assesses a broader spectrum of abilities than has been previouslyavailable in IQ testing” (p. 1111). The PASS theory (Naglieri & Das,1997b) was conceptualized following the work of A. R. Luria (1980/1966,
433English and Spanish CAS

1973); therefore, verbal and quantitative tests were not considered appro-priate for inclusion (Naglieri & Das, 2005). Instead, four PASS constructsformed the basis of the theory and were used to define basic psychologicalprocesses (Naglieri & Das, 1997b) as follows:
1. Planning is a mental activity that provides cognitive control, use ofprocesses, knowledge and skills, intentionality, and self-regulation.This includes self-monitoring and impulse control as well as gener-ation, evaluation, and execution of a plan. This process provides themeans to solve problems and may involve control of attention,simultaneous, and successive processes, as well as acquisition ofknowledge and skills.
2. Attention is a mental activity that provides focused, selective cog-nitive activity and resistance to distraction. Attention is involvedwhen a person must demonstrate focused, selective, sustained, andeffortful activity.
3. Simultaneous processing is a mental activity by which a personintegrates stimuli into interrelated groups or a whole. Simultaneousprocessing tests typically have strong spatial aspects but can involveboth nonverbal and verbal content as long as the cognitive demandof the task requires the integration of information.
4. Successive processing is a mental activity by which the person workswith stimuli in a specific serial order. Successive processing involvesboth the perception of stimuli in sequence and the formation ofsounds and movements in order. For this reason, successive pro-cessing is involved with activities such as phonological skills (Das,Naglieri, & Kirby, 1994) and the syntax of language.
Fagan (2000), as well as Suzuki and Valencia (1997), suggested thatusing a test of basic psychological processes would allow for more efficientand accurate evaluation of children from diverse populations. Suzuki andValencia noted the potential of PASS and CAS for this use and called forresearch involving minority populations “given concerns confronting prac-titioners in assessing a growing diversity in clientele” (p. 1111).
There have been three research reports on the utility of the PASStheory with diverse populations. Naglieri, Rojahn, and Matto (2005) stud-ied matched samples of Black (N � 298) and White (N � 1,691) childrenon the CAS. Regression analyses, controlling for key demographic vari-ables, showed an estimated CAS Full Scale mean score difference of 4.8.Correlations between the PASS scores and achievement were similar forBlacks (Mdn � .70) and Whites (Mdn � .64). Rojahn, Naglieri, andAquilino (2005) studied samples of Hispanic (N � 115) and White (N �115) children matched on key demographic variables and found a 4.8
434 Naglieri, Otero, DeLauder, and Matto

difference between CAS Full Scale standard scores. Finally, Van Luit,Kroesbergen, and Naglieri (2005) found that children in regular educationin the Netherlands earned scores on the CAS administered in Dutch thatwere not significantly different from the normative values obtained for theU.S. standardization sample. These studies suggest that the PASS con-structs yield smaller differences between racial and ethnic groups than dotraditional measures of general ability and that the exclusion of verbal andquantitative tests did not lead to a reduction in the extent to which thescores related to achievement (Naglieri, 2003).
Although there is an emerging body of literature supporting the va-lidity of the PASS theory as measured by the CAS for assessment ofminority students (Naglieri, 2000, 2003), to date no studies involving bilin-gual children have been reported. Therefore, this study examined bilingualchildren’s performance on the English and Spanish versions of the CAS totest Fagan’s (2000) suggestion that measuring intelligence as processingcould provide a viable way to assess ethnic groups. More specifically, wecompared the scores bilingual children earned on the English and Spanishversions of the CAS. We also examined the profiles of PASS scores thechildren earned on each version of the test. Finally, we looked at theconsistency of cognitive processing weaknesses found using the two ver-sions of the CAS.
METHOD
Participants
The sample consisted of 55 children and adolescents ages 5 to 17 years(36 boys and 19 girls) who were referred for reading and other academiclearning problems. The children and adolescents included in this study allattended a midwestern public school district of approximately 40,000 stu-dents in one of Chicago’s northwest suburbs. The overall school districtpopulation is 52% Caucasian, 33% Hispanic, 7% African American, 7%Asian, and less than 1% Native American. The district serves communitieson a 90-square-mile boundary extending into three counties. The Hispanicchildren in this study came from homes with low parental education levels.Only about 15% of the parents of the children in this sample attendedcollege (see Table 1). Table 1 also provides the participants’ proficiencylevels in Spanish and English, based on the Woodcock Munoz LanguageSurvey (Woodcock & Munoz-Sandoval, 2001). Most of the children earneda Spanish proficiency score of 2 (40%) or 3 (56.4%), which means that asa whole, the group had “limited” or “very limited” Spanish languageproficiency. Similarly, most of children earned a score of 2 (21.8%) or 3
435English and Spanish CAS

(54.5%) on the English portion of the fluency test. Only 1.9% and 3.6% ofthe sample was fluent in Spanish or English, respectively.
Procedures and Data Analysis
Each participant was administered both the Spanish and English ver-sions of the CAS by a school psychologist fluent in both Spanish andEnglish. Administration order of the CAS was nearly equally counterbal-anced, with 45.5% of the participants receiving the Spanish version firstand 54.5% of the participants receiving the English version first. The twoversions of the CAS were administered as part of a multifactored assess-ment in response to a referral because of academic difficulties. Participantswere also administered the Spanish and English versions of the WoodcockMunoz Language Survey (Woodcock & Munoz-Sandoval, 2001).
All CAS test protocols were scored using the CAS Rapid Scorecomputer-scoring program (Naglieri, 2003), and standard scores were usedin all analyses. Pearson correlations were calculated and corrected forrestriction in range where appropriate, using the formula provided by
Table 1. Demographic Characteristics of the Sample of Hispanic Children (N � 55)
Demographic characteristic Percentage
Age in years5–7 20.08–10 50.911–13 16.314–16 7.217 5.5
Male Female
Gender 65.5 34.5
Spanish English
Fluency rating1—Negligible 1.8 20.02—Very limited 40.0 54.53—Limited 56.4 21.84—Fluent 1.8 3.65—Advanced 0.0 0.0Total 100.0 99.9
Mothers Fathers
Parents’ education level�12 years 39.6 37.4High school graduate 52.8 37.3�12 years 7.6 23.5Total 100.0 98.2
Note. Percentages do not sum to 100.0 due to rounding or missing data.
436 Naglieri, Otero, DeLauder, and Matto

Guilford and Fruchter (1978). When scores obtained from both versions ofthe CAS were restricted, the Guilford and Fruchter formula was appliedsequentially to correct for restriction in the two distributions. Both ob-tained and corrected correlations are reported.
Repeated measures analysis of variance (ANOVA) was used to exam-ine differences across the CAS Spanish and English versions for the fourPASS scales and also for the specific subtests within the scales. Differencesbetween the mean scores earned using the English and Spanish versions ofthe CAS were also compared by computing d ratios, using Cohen’s (1988)formula: (X1 - X2)/SQRT [(n1 * SD1
2 � n2 * SD22)/(n1 � n2)]. The d ratio
is an expression of the difference between the means in standard deviationunits based on the average standard deviations. The values proposed byCohen (1988) for small, medium, and large effects are, respectively, .20, .50,and .80. The differences between the standard scores obtained by eachchild for each individual subtest and the four separate PASS scales werecalculated. The scores obtained by the sample on the English version of theCAS were subtracted from those earned using the Spanish version of the CAS.Cumulative frequency distributions of these differences were obtained tobetter examine the range of disparity between the two versions of the CAS.
Finally, the consistency between the profile of PASS scores on theSpanish and English versions of CAS was examined for each child. First,each child’s PASS scores were compared with that child’s average PASSscore, using the method described by Naglieri (1999) to determine thesignificance of the intraindividual differences. This approach is typicallydescribed as ipsative comparison methodology, originally proposed byDavis (1959) and Silverstein (1982, 1993). We first identified children whohad a significant ipsative or relative weakness. Of that group of children,we then examined whether they had a corresponding standard score thatwas less than 90. The selection of children on the basis of (a) significantintraindividual variation in PASS scores and (b) a PASS standard score ofless than 90 meets Naglieri’s (1999, 2000) definition of a cognitive weak-ness. Finally, we calculated the percentage of children who had a cognitiveweakness on both the English and the Spanish versions of the CAS and thepercentages of children who had a weakness on the same PASS scale whengiven in English or Spanish.
Cognitive Assessment System
The CAS (Naglieri & Das, 1997a) is an individually administered testfor children ages 5–17 years designed to evaluate cognitive processes. TheCAS is derived from the PASS theory and consists of four scales: Planning,
437English and Spanish CAS

Attention, Simultaneous, and Successive. Each scale has a mean of 100 anda standard deviation of 15. All but 2 children were administered the12-subtest Standard Battery. The test was standardized on a sample of2,200 children who were selected to reflect the demographics of the UnitedStates in terms of race, gender, parental education, geographic location,community setting, and educational placement. The average StandardBattery Full Scale reliability coefficients are as follows: Full Scale, .88;Planning, .88; Attention, .84; Simultaneous, .93; and Successive, .93. Thefour PASS scales are described below.
Planning Scale
The Planning subtests require children to determine how to solve eachitem, develop a plan of action, apply the plan, modify the plan as needed,and control their impulses, acting with careful consideration. In addition,planning subtests require the use of strategies for efficient performance(Naglieri & Das, 1997b). Matching Numbers requires children to underlinetwo of the same numbers out of six that appear in a row. Children who usestrategies such as scanning the row and examining the numbers carefully insequence to find a match earn higher scores on this test than those who donot use a strategy (Naglieri & Das, 1997b). The Planned Codes subtestrequires the child to complete a page of codes (e.g., XX, OX) that corre-spond to letters (e.g., A, B) that are provided in a legend at the top of thepage. The child is required to fill in the appropriate codes that go in theempty boxes beneath each letter. Children are allowed to complete eachpage in the order they choose to allow for application of strategies such asfilling in all the As, then Bs, and so on (Naglieri & Das, 1997b). ThePlanned Connections subtest requires children to connect numbers in aserial order, and the last two items require children to connect numbersand letters in an alternating sequential order (e.g., 1-A-2-B-3-C).
Attention Scale
The Attention subtests require children to selectively focus their cog-nitive activity to detect particular stimuli, inhibiting responses to competingstimuli. The Expressive Attention task includes an interference conditionafter administration of items without interference. Children ages 5 to 7years are administered pictures of common animals depicted as big orsmall. Children are required to determine whether the animal is big orsmall in real life when its relative size on the page conflicts with its actual
438 Naglieri, Otero, DeLauder, and Matto

size. Children ages 8 years and older are administered color words (i.e.,blue, yellow, green, and red) that are printed in a color different than thatof the color name. The child is required to name the color the word isprinted in, rather than read the word. Number Detection consists of pagesof numbers printed in different type fonts. For each page, children arerequired to underline a particular stimulus (e.g., the numbers 1, 2, and 3 inan open font) among distracter items (e.g., the same numbers printed in adifferent font). In the Receptive Attention subtest, children are presentedwith two conditions, with both age groups (5–7 and 8–17) receiving theconditions of first physical comparisons, in which they have to identifyitems that are the same in appearance, and then lexical comparisons, inwhich they have to identify items with the same name.
Simultaneous Scale
The Simultaneous processing subtests require children to integrateseparate stimuli into an interrelated group. Simultaneous processing in-volves spatial and logical dimensions for verbal and nonverbal content.Nonverbal Matrices consists of geometric designs and shapes that areinterrelated through spatial or logical organization. Children are requiredto decipher the relationships among parts of the shape or geometric designand choose the best of six options that fits a missing space in the grid.Verbal-Spatial Relations requires children to match the verbal descriptionof an item to objects and shapes arranged in a specific spatial configuration.Figure Memory requires children to examine a two- or three-dimensionalfigure for 5 s, then the figure is removed and the child must reproducethat original figure on a larger, more complex geometric design that ispresented.
Successive Scale
Successive processing involves the integration of material into a spe-cific sequential order in which each element is related to those that precedeit. The Successive processing subtests involve the perceiving stimuli in astrictly defined serial order. Word Series requires children to repeat a seriesof high-frequency words in the correct order. Sentence Repetition requireschildren to repeat a sentence using color words in the correct order. SpeechRate (ages 5–7) requires children to repeat a three-word series until theexaminer tells them to stop, then to repeat single- and double-syllable wordseries in order 10 times. Sentence Questions (ages 8–17) consists of the
439English and Spanish CAS
same questions as in sentence repetition, but children are asked to answera question about the sentence.
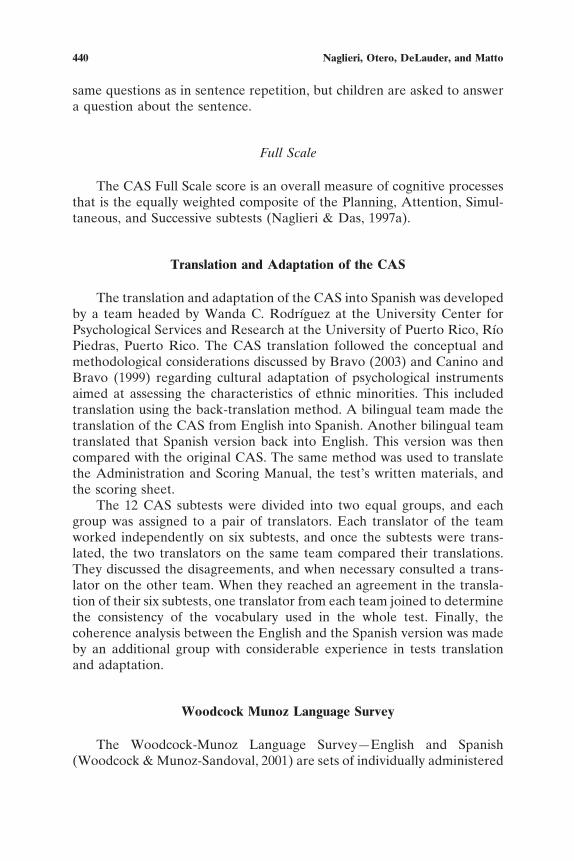
Full Scale
The CAS Full Scale score is an overall measure of cognitive processesthat is the equally weighted composite of the Planning, Attention, Simul-taneous, and Successive subtests (Naglieri & Das, 1997a).
Translation and Adaptation of the CAS
The translation and adaptation of the CAS into Spanish was developedby a team headed by Wanda C. Rodrı́guez at the University Center forPsychological Services and Research at the University of Puerto Rico, Rı́oPiedras, Puerto Rico. The CAS translation followed the conceptual andmethodological considerations discussed by Bravo (2003) and Canino andBravo (1999) regarding cultural adaptation of psychological instrumentsaimed at assessing the characteristics of ethnic minorities. This includedtranslation using the back-translation method. A bilingual team made thetranslation of the CAS from English into Spanish. Another bilingual teamtranslated that Spanish version back into English. This version was thencompared with the original CAS. The same method was used to translatethe Administration and Scoring Manual, the test’s written materials, andthe scoring sheet.
The 12 CAS subtests were divided into two equal groups, and eachgroup was assigned to a pair of translators. Each translator of the teamworked independently on six subtests, and once the subtests were trans-lated, the two translators on the same team compared their translations.They discussed the disagreements, and when necessary consulted a trans-lator on the other team. When they reached an agreement in the transla-tion of their six subtests, one translator from each team joined to determinethe consistency of the vocabulary used in the whole test. Finally, thecoherence analysis between the English and the Spanish version was madeby an additional group with considerable experience in tests translationand adaptation.
Woodcock Munoz Language Survey
The Woodcock-Munoz Language Survey—English and Spanish(Woodcock & Munoz-Sandoval, 2001) are sets of individually administered
440 Naglieri, Otero, DeLauder, and Matto

tests designed to measure a broad sampling of proficiency in four criticalareas of oral language, listening, reading, and writing. The instrumentsprovide an overall measure of language competence as well as cognitive–academic language proficiency in both English and Spanish. The Englishversion was standardized on approximately 6,300 participants in the UnitedStates and the Spanish version on approximately 2,000 participants inArgentina, Costa Rica, Mexico, Peru, Puerto Rico, Spain, and the UnitedStates. The tests rate language proficiency on the following 5-point scale.
Level 1: Negligible. When compared with others of the same age orgrade, the individual demonstrates negligible cognitive–academic lan-guage proficiency. If provided with monolingual instruction, it is ex-pected that a student with a score of 1 will find the language demandsof the learning task impossible to manage.
Level 2: Very Limited. When compared with others of the same age orgrade, a Level 2 individual demonstrates very limited cognitive–aca-demic language proficiency. If provided with monolingual instruction,it is expected that a Level 2 student will find the language demands ofthe learning task extremely difficult.
Level 3: Limited. When compared with others of the same age orgrade, a Level 3 individual demonstrates limited cognitive–academiclanguage proficiency. If provided with monolingual instruction, it isexpected that a Level 3 student will find the language demands of thelearning task difficult.
Level 4: Fluent. When compared with others of the same age or grade,a Level 4 individual demonstrates fluent cognitive–academic languageproficiency. If provided with monolingual instruction, it is expectedthat a Level 4 student will find the language demands of the learningtask manageable.
Level 5: Advanced. When compared with others of the same age orgrade, a Level 5 individual demonstrates advanced cognitive–academiclanguage proficiency. If provided with monolingual instruction, it isexpected that a Level 5 student will find the language demands of thelearning task very easy.
RESULTS
Examination of the means for this sample of bilingual Hispanic chil-dren indicates that the group earned Full Scale scores that fell in the Low
441English and Spanish CAS

Average classification on both the Spanish (M � 87.6) and English (M �84.6) versions of the CAS. The separate PASS scale means ranged from78.0 (Successive mean from the English version of the CAS) to 95.1(Attention mean from the Spanish version of the CAS). Within eachversion, the bilingual children earned their lowest scores on the Successivescale. These findings indicate that the children were experiencing consid-erable deficits in most of the four basic psychological processes, particularlyin Successive processing regardless of in which language the test wasadministered.
PASS standard score means and standard deviations (provided inTable 2) using the Spanish and English versions of the CAS were, ingeneral, similar. These bilingual Hispanic children earned identical meanscores on the Planning scale (92.65) given in English and Spanish and verysimilar scores on the Attention scale (Ms � 94.84 and 95.11, for Englishand Spanish, respectively). Larger differences were found between themeans obtained using the English and Spanish versions of the CAS for theSimultaneous (Ms � 89.05 and 93.05, respectively) and Successive scales(Ms � 78.04 and 83.15, respectively). Despite these differences, the FullScale means were similar (Ms � 84.64 and 87.64 for the English and
Table 2. Means, Standard Deviations, d Ratios, and Obtained and Correction CorrelationsBetween the English and Spanish Versions of the Cognitive Assessment System
(CAS; N � 55)
CAS Subtests andScales
CASEnglish
CASSpanish
d
Correlations
M SD M SD Obtained Corrected
SubtestsMatching Numbers 8.64 2.70 8.65 2.88 �.01 .90 .92Planned Codes 9.16 2.33 9.11 2.35 .02 .98 .99Planned Connections 8.70 2.66 8.70 2.45 .00 .93 .96Nonverbal Matrices 8.93 2.93 9.00 2.86 �.02 .97 .98Verbal Spatial
Relations 6.71 3.01 8.44 3.02 �.57 .62 .62Figure Memory 9.34 1.86 9.36 1.73 �.01 .91 .99Expressive Attention 8.87 2.63 9.15 2.66 �.11 .95 .97Number Detection 9.11 2.38 9.00 2.35 .05 .96 .98Receptive Attention 9.43 2.49 9.34 2.61 .04 .96 .98Word Series 6.15 2.85 6.91 2.66 �.28 .85 .89Sentence Repetition 6.22 2.54 7.22 2.56 �.39 .65 .76Speech
Rate/SentenceQuestions 6.98 2.37 7.66 2.20 �.30 .80 .92
ScalesPlanning 92.65 13.19 92.65 13.48 .00 .96 .97Simultaneous 89.05 12.81 93.05 13.76 �.30 .90 .93Attention 94.84 13.96 95.11 13.94 �.02 .98 .98Successive 78.04 13.17 83.15 12.69 �.40 .82 .89Full Scale 84.64 13.66 87.64 13.85 �.22 .96 .97
442 Naglieri, Otero, DeLauder, and Matto

Spanish versions, respectively). All these differences were no greater than.4, which is considered small using Cohen’s (1988) description (�.5 is small;.5–.7 is medium, and .8 and higher is large).
Repeated measures ANOVAs showed statistically significant differ-ences across the CAS Spanish and English versions for the Simultaneousand Successive scales, F(7, 47) � 10.472, p � .0001. The Spanish versionmeans were higher for each scale, with a 4-point difference for the Simul-taneous scale and a 5-point difference for the Successive scale. Resultsshowed no ordering effect for Spanish and English test administration, F(1,53) � 1.304, p � .259, indicating that administering the Spanish or Englishversion first did not influence test scores. Repeated measures ANOVAswere conducted to identify the specific subtests within the Simultaneousand Successive scales that contributed to the differences between theEnglish and Spanish versions. These analyses showed that one subtest,Verbal Spatial Relations, multivariate F(5, 47) � 10.696, p � .0001, ac-counted for the overall difference in Simultaneous English–Spanish versionmean scores, showing a higher Spanish mean. All three subtests were signif-icantly different across Spanish and English versions on the Successive scale,with Sentence Repetition showing the largest difference, followed by WordSeries and then Speech Rate/Sentence Questions, all showing higher meanscores on the Spanish test version, multivariate F(5, 47) � 6.490, p � .0001.
Table 2 shows subtest d ratios that range from .00 to .57. Closerexamination of the values presented in Table 2 suggests that variableperformance at the subtest level had influence on the respective CASscales. The largest d ratios were found for Verbal Spatial Relations (.57),Sentence Repetition (.39), Speech Rate/Sentence Questions (.30), andWord Series (.28). These four subtests had the most effect on the size of theSimultaneous and Successive scale comparisons. The remaining subtest dratios ranged from .00 to .11.
Table 2 also presents both the obtained Pearson and corrected corre-lations for the Spanish version of the CAS with the English version of theCAS for each subtest and PASS scale. These correlations were correctedfor restriction in range as evidenced by standard deviations that were lessthan the normative value of 15 (PASS scales) and 3 (CAS subtests).Restriction in range has the effect of reducing the magnitude of theobtained Pearson correlation coefficient, and therefore obtained correla-tions as well as corrected correlations (Guilford & Fruchter, 1978) arereported. The obtained and corrected correlations, respectively, for thePASS scales are as follows: Planning, .96 and .97; Simultaneous, .90 and .93;Attention, .98 and .98; Successive, .82 and .89; and Full Scale, .96 and .97.The obtained CAS subtest correlations ranged from .62 to .98, and thecorrected correlations ranged from .62 to .99. These results suggest that
443English and Spanish CAS

there was a strong relationship between the standard scores obtained fromthe Spanish version and the English version of the CAS.
Table 3 provides the percentages of students who earned differencesbetween the English and Spanish versions of the CAS of varying magni-tudes. The values presented in Table 3 indicate that, for example, 49.1% ofthe sample earned a CAS Full Scale score on the Spanish version that was1 standard score point higher than the score these children earned on theEnglish version. The vast majority of the sample (75.4%) earned Full Scalescores on both versions of the CAS that differed by 5 points or less. (Note,Naglieri & Das [1997b] reported that the average standard error of mea-surement of the CAS Full Scale across all ages is 3.1.) Results indicate thatfor the majority of the CAS subtests, the difference between children’sscores on the Spanish version of the CAS and the English version was lessthan one confidence interval (6.1). Similar results were found for the PASS
Table 3. Frequency Distribution of the Percentages of Students With Differences BetweenSubtest Scales and PASS and Full Scale Standard Scores of Varying Magnitudes Obtained
Using the English and Spanish Versions of the Cognitive Assessment Survey (CAS)
CAS Subtests andScales
English scores higherthan Spanish Spanish scores higher than English
Subtest differences �5 �4 �3 �2 �1 0 1 2 3 4 5 6 7 8Matching Numbers 1.8 1.8 5.5 5.5 70.9 3.6 9.1 1.8Planned Codes 12.7 81.8 3.6 1.8Planned
Connections 1.8 3.6 14.5 54.5 21.8 3.6Nonverbal
Matrices 10.9 76.4 9.1 1.8 1.8Verbal Spatial
Relations 3.6 3.6 3.6 7.3 14.5 9.1 21.8 10.9 10.9 7.3 5.5 1.8Figure Memory 3.6 10.9 70.9 9.1 5.5Expressive
Attention 10.9 60.0 23.6 3.6 1.8Number Detection 27.3 58.2 12.7 1.8Receptive
Attention 3.6 18.2 65.5 9.1 3.6Word Series 1.8 3.6 5.5 43.6 16.4 14.5 9.1 5.5Sentence
Repetition 1.8 1.8 1.8 3.6 9.1 25.5 10.9 27.3 9.1 3.6 1.8 3.6Speech
Rate/SentenceQuestions 7.3 10.9 30.9 23.6 16.4 9.1 1.8
Scale differences �25 �20 �15 �10 �5 0 5 10 15 20 25 30 35 40Planning 5.4 27.2 38.2 20.0 9.0Simultaneous 7.2 10.9 16.4 21.8 30.9 7.3 5.4Attention 1.8 29.0 30.9 34.5 3.6Successive 3.6 5.4 14.6 1.8 16.3 32.6 16.4 7.3 1.8Full Scale 5.5 12.7 3.6 49.1 27.3 1.8
Note. Differences were calculated by subtracting the standard scores obtained using theEnglish from the Spanish CAS versions. Negative scores indicate that the child earned ahigher score on the English than Spanish versions.
444 Naglieri, Otero, DeLauder, and Matto
scales. Differences among PASS scales indicate that a large percentage ofPlanning, Simultaneous, Attention, Successive, and Full Scale scores differby �5 points.
Like the d ratios, the most noteworthy frequency differences were forthe Verbal Spatial Relations and Sentence Repetition subtests. Both ofthese subtests involve the use of language skills and showed importantdifferences between the CAS given in English and the CAS given inSpanish. It is important to consider that these children were limited inEnglish and Spanish language skills. These results indicate that with thisgroup of bilingual children, the more the subtest involved language, thelower the score. The subtest score differences were, of course, reflected inthe PASS scales. The Simultaneous and Successive PASS scales evidencedthe larger distribution of CAS Spanish standard scores that were higherthan English standard scores.
Comparisons of the children’s PASS cognitive weakness profiles onboth the Spanish and English versions of the CAS demonstrated thatdespite the influence of language skills, these children perform consistently.There was an average overall agreement between all PASS scales of about90%. On the Planning scale, 92.7% of the children who had a cognitiveweakness on the English version of the CAS had a cognitive weakness onthe Spanish version. The Simultaneous (89.1%) and Attention (100%)scales were also generally consistent between the English and Spanishversions of the CAS for cognitive weakness. The Successive (78.2%) scaleshowed considerable similarity, but it was the lowest of the scales. Most ofthe time, children who had a cognitive weakness on the Spanish version ofthe CAS also had a cognitive weakness on the English version.
DISCUSSION
The purpose of this study was to meet the need expressed by Fagan(2000) and Suzuki and Valencia (1997) for research on basic psychologicalprocesses for children from diverse populations. The current findings, likepast research that has found small PASS score differences between Blacksand Whites (Naglieri, Rojahn, Matto, & Aquilino, 2005) as well as betweenHispanics and Whites (Rojahn et al., 2005), suggest that the CAS may haveutility for assessment of bilingual students because of the consistencybetween the results when administered in English or Spanish. The childrenin this study earned similar Full Scale scores, deficits in Successive process-ing were found on both versions of the test, and more important, 90% ofchildren who had a cognitive weakness on one version of the CAS also hadthe same cognitive weakness on the other version of the CAS. These results
445English and Spanish CAS

suggest that PASS scores could be used as part of a comprehensive eval-uation to identify a disorder in one or more of the basic psychologicalprocesses as described by current Individuals With Disabilities EducationAct legislation for a specific learning disability (see Hale, Naglieri, Kauf-man, & Kavale, 2004) and that the results would be the same regardless ofin which language the CAS was administered.
Differences between the performance of these children on the twoversions of the CAS were minimal for the Full Scale, but some noteworthyvariations were found for the separate PASS scales. Although these bilin-gual Hispanic children earned identical mean scores on the Planning andAttention scales, the Simultaneous and Successive score differences foundreflected important subtest variation. The lower Verbal Spatial Relationssubtest scores obtained when administered in English suggest that thesechildren’s language limitations adversely influenced their performance.Practitioners can reduce the influence of this subtest (a) by administeringthe scale in Spanish; (b) when giving the test in English, by replacingVerbal Spatial Relations with Figure Memory and using the eight subtestCAS Basic Battery; or (c) by excluding Verbal Spatial Relations andprorating the Simultaneous score as described by Naglieri (1999). Theeffect of language skills on the Successive scale was more pervasive. Eventhough the Sentence Repetition subtest had the largest difference betweenEnglish and Spanish CAS versions, all three Successive scale subtests werelower when given in English. Administration in Spanish is, therefore,recommended for bilingual children who have poor English language skills.More important, regardless of the language used, these children’s lowerscores on the Successive scale are consistent with past research summarizedby Das et al. (1994) and Naglieri (1999, 2003) for children with readingproblems.
This study has limitations that should be considered. First, there wasrestriction in the variation of English and Spanish proficiency levels. Thisdid not allow for the examination of the differences between English andSpanish versions at various levels of language proficiency in each languageand the corresponding pattern of CAS standard scores. This is particularlyimportant given the increasing number of Hispanic and bilingual childrenin the U.S. population (Bracken & Naglieri, 2003). A second possiblelimitation is that the sample, although adequate, was restricted to oneschool district in the Midwest. Future research should be conducted withchildren from different regions of the country who have different Spanishlanguage backgrounds and varying levels of proficiency in both Spanishand English. These limitations suggest that additional research is needed toreplicate this study, using more diverse populations of Hispanic childrenwith and without learning problems from a variety of locations. Careful
446 Naglieri, Otero, DeLauder, and Matto

examination of the level of skills in each language and the correspondingeffects on the processing scores should also be examined.
REFERENCES
Bracken, B. A., & McCallum, R. S. (1998). Universal Nonverbal Intelligence Test. Itasca, IL:Riverside.
Bracken, B. A., & Naglieri, J. A. (2003). Assessing diverse populations with nonverbal testsof general intelligence. In C. R. Reynolds & R. W. Kamphaus (Eds.), Handbook ofpsychological and educational assessment of children (2nd ed., pp. 243–273). New York:Guilford Press.
Bravo, M. (2003). Instrument development: Cultural adaptations for ethnic minority research.In G. Bernal, J. E. Trimble, A. K. Burlew, & F. T. L. Leong (Ed.), Handbook of racial& ethnic minority psychology (pp. 220–236). Thousand Oaks, CA: Sage.
Canino, G., & Bravo, M. (1999). The translation and adaptation of diagnostic instruments forcross-cultural use. In D. Shaffer, C. P. Lucas, & J. Richters (Eds.), Diagnostic assessmentand child and adolescent psychopathology (pp. 285–298). New York: Guilford Press.
Ceci, S. J. (2000). So near and yet so far: Lingering questions about the use of measures ofgeneral intelligence for college admission and employment screening. Psychology, Pub-lic Policy, and Law, 6, 233–252.
Cohen, J. (1988). Statistical power analysis for the behavioral sciences (2nd ed.). San Diego,CA: Academic Press.
Das, J. P., Naglieri, J. A., & Kirby, J. R. (1994). The assessment of cognitive processes: ThePASS theory of intelligence. Boston: Allyn & Bacon.
Davis, F. B. (1959). Interpretation of differences among averages and individual test scores.Journal of Educational Psychology, 50, 162–170.
Fagan, J. R. (2000). A theory of intelligence as processing: Implications for society. Psychol-ogy, Public Policy, and Law, 6, 168–179.
Gardner, H. (1983). Frames of mind: The theory of multiple intelligences. New York: BasicBooks.
Guilford, J. P., & Fruchter, B. (1978). Fundamental statistics in psychology and education. NewYork: McGraw-Hill.
Hale, J. B., Naglieri, J. A., Kaufman, A. S., & Kavale, K. A. (2006) Implementation of IDEA:Using RTI and Cognitive Assessment Methods. Psychology in the Schools, 753–770.
Luria, A. R. (1973). The working brain: An introduction to neuropsychology. New York: BasicBooks.
Luria, A. R. (1980). Higher cortical functions in man (2nd ed., Rev. and exp. ed.). New York:Basic Books. (Original work published 1966)
Naglieri, J. A. (1997). Naglieri Nonverbal Ability Test. San Antonio, TX: PsychologicalCorporation
Naglieri, J. A. (1999). Essentials of CAS assessment. New York: Wiley.Naglieri, J. A. (2000). Can profile analysis of ability test scores work? An illustration using the
PASS theory and CAS with an unselected cohort. School Psychology Quarterly, 15,419–433.
Naglieri, J. A. (2002). Best practices in interventions for school psychologists: A cognitiveapproach to problem solving. In A. Thomas & J. Grimmes (Eds.), Best practices in schoolpsychology (4th ed., pp. 1373–1392). Bethesda, MD: National Association of SchoolPsychologists.
Naglieri, J. A. (2003). Current advances in assessment and intervention for children withlearning disabilities. In T. E. Scruggs & M. A. Mastropieri (Eds.), Advances in learningand behavioral disabilities: Vol. 16. Identification and assessment (pp. 163–190). NewYork: JAI Press.
447English and Spanish CAS

Naglieri, J. A., & Bornstein, B. T. (2003). Intelligence and achievement: Just how correlatedare they? Journal of Psychoeducational Assessment, 21, 244–260.
Naglieri, J. A., & Das, J. P. (1997a). Cognitive Assessment System. Itasca, IL: Riverside.Naglieri, J. A., & Das, J. P. (1997b). Cognitive Assessment System: Interpretive handbook.
Chicago: Riverside.Naglieri, J. A., & Das, J. P. (2005). Planning, attention, simultaneous, successive (PASS)
theory: A revision of the concept of intelligence. In D. P. Flanagan & P. L. Harrison(Eds.), Contemporary intellectual assessment (2nd ed., pp. 136–182). New York: GuilfordPress.
Naglieri, J. A., & Ford, D. Y. (2005). Increasing minority children’s participation in giftedclasses using the NNAT: A response to Lohman. Gifted Child Quarterly, 49(1), 29–36.
Naglieri, J. A., Rojahn, J., & Matto, H. C. (2005). Black-White differences in cognitiveprocessing: A study of the planning, attention, simultaneous, and successive theory ofintelligence. Journal of Psychoeducational Assessment, 23, 146–160.
Naglieri, J. A., Rojahn, J. R., Matto H. C., & Aquilino, S. A. (2005). Black white differencesin the intelligence: A study of the PASS theory and Cognitive Assessment System.Journal of Psychoeducational Assessment, 23, 146–160.
Pintner, R. (1923). Intelligence testing. New York: Henry Holt.Ramirez, R. R. & de la Cruz, G. P. (2002). The Hispanic Population in the United States:
March, 2002, Current Population Reports, P20–545, U.S. Census Bureau, Washington,DC.
Rojahn, J. R., Naglieri, J. A., & Aquilino, S. A. (2005). Hispanic and non-Hispanic children’sperformance on PASS cognitive processes and achievement. Manuscript submitted forpublication.
Silverstein, A. B. (1982). Pattern analysis as simultaneous statistical inference. Journal ofConsulting and Clinical Psychology, 50, 234–240.
Silverstein, A. B. (1993). Type I, Type II, and other types of errors in pattern analysis.Psychological Assessment, 5, 72–74.
Sternberg, R. J. (1988). The triarchic mind: A new theory of human intelligence. New York:Viking.
Suzuki, L. A., & Valencia, R. R. (1997). Race–ethnicity and measured intelligence. AmericanPsychologist, 52, 1103–1114.
Van Luit, J. E. H., Kroesbergen, E. H., & Naglieri, J. A. (2005). Utility of the PASS theoryand cognitive assessment system for Dutch children with and without ADHD. Journal ofLearning Disabilities, 38, 434–439.
Woodcock, R. W., & Munoz-Sandoval, F. (2001). Woodcock Munoz Language Survey. Itasca,IL: Riverside.
448 Naglieri, Otero, DeLauder, and Matto